Spatiotemporal Analysis of Land Use and Land Cover (LULC ...
21
applied sciences Article Spatiotemporal Analysis of Land Use and Land Cover (LULC) Changes and Precipitation Trends in Shanghai Qin Jiang 1,2 , Xiaogang He 3 , Jun Wang 1,2, * , Jiahong Wen 4, *, Haizhen Mu 5 and Ming Xu 6 1 Key Laboratory of Geographic Information Science (Ministry of Education), East China Normal University, Shanghai 200241, China; [email protected] 2 School of Geographic Sciences, East China Normal University, Shanghai 200241, China 3 Water in the West, Woods Institute for the Environment, Stanford University, Stanford, CA 94305, USA; [email protected] 4 School of Environmental and Geographical Sciences, Shanghai Normal University, Shanghai 200234, China 5 Shanghai Climate Centre, Shanghai Meteorological Bureau Service, Shanghai 200030, China; [email protected] 6 Shanghai Meteorological Society, Shanghai Meteorological Bureau Service, Shanghai 200030, China; [email protected] * Correspondence: [email protected] (J.W.); [email protected] (J.W.) Received: 25 September 2020; Accepted: 5 November 2020; Published: 7 November 2020 Abstract: The impacts of anthropogenic land use and land cover (LULC) changes on the spatiotemporal distribution of precipitation in megacities have been highlighted in studies on urban climate change. In this study, we conducted a quantitative analysis of urban growth on the impact on precipitation in Shanghai, China. We considered four periods of LULC data in 1979, 1990, 2000 and 2010, in addition to the long-term (1979–2010) trend of daily precipitation. The results indicate that the trend in precipitation exhibit different characteristics for urban (Ur), outskirt of urban (OUr) and outer suburb (OS) regions. Most Ur regions had an upward trend in annual and extreme precipitation during 1979–2010, while annual precipitation for the OUr and OS regions exhibited a decreasing trend. From 1979 to 2010, the areas of fastest expansion were located in the OUr region. The OS region, far away from the central area, had a relatively lower rate of change. In addition, OUr regions with rapid LULC changes exhibited higher increasing trends in annual and daily extreme precipitation, which is critical for the identification of frequent precipitation areas and the reliable projection of further changes. Keywords: land use and land cover; precipitation trends; precipitation extremes; built-up area; Shanghai 1. Introduction It was reported in the World Urbanization Prospects that more than 54% of the global population currently lives in cities, and this percentage is projected to reach 66% by 2050 [1]. The 2014 Intergovernmental Panel on Climate Change (IPCC) predicted that several large metropolitan areas around the world may experience a temperature rise of greater than 1.5 °C under the Representative Concentration Pathway (RCP) 2.6 scenario, which introduces additional challenges for cities with respect to coping with climate change and its impact [2,3]. Under the influence of anthropogenic factors, cities are very sensitive and vulnerable to heavy rainstorms [4,5], floods [6,7], heat waves [8] and other weather-related hazards that are likely to be exacerbated by climate change [9,10]. In particular, changes in “urban heat island (UHIs)” associated with anthropogenic land use and land cover (LULC) in megacities have raised great concerns with regard to their impact on urban precipitation [11–13]. Appl. Sci. 2020, 10, 7897; doi:10.3390/app10217897 www.mdpi.com/journal/applsci
-
Upload
khangminh22 -
Category
Documents
-
view
0 -
download
0
Transcript of Spatiotemporal Analysis of Land Use and Land Cover (LULC ...

applied sciences
Article
Spatiotemporal Analysis of Land Use and Land Cover(LULC) Changes and Precipitation Trends in Shanghai
Qin Jiang 1,2 , Xiaogang He 3, Jun Wang 1,2,* , Jiahong Wen 4,*, Haizhen Mu 5 and Ming Xu 6
1 Key Laboratory of Geographic Information Science (Ministry of Education), East China Normal University,Shanghai 200241, China; [email protected]
2 School of Geographic Sciences, East China Normal University, Shanghai 200241, China3 Water in the West, Woods Institute for the Environment, Stanford University, Stanford, CA 94305, USA;
[email protected] School of Environmental and Geographical Sciences, Shanghai Normal University, Shanghai 200234, China5 Shanghai Climate Centre, Shanghai Meteorological Bureau Service, Shanghai 200030, China;
[email protected] Shanghai Meteorological Society, Shanghai Meteorological Bureau Service, Shanghai 200030, China;
[email protected]* Correspondence: [email protected] (J.W.); [email protected] (J.W.)
Received: 25 September 2020; Accepted: 5 November 2020; Published: 7 November 2020 �����������������
Abstract: The impacts of anthropogenic land use and land cover (LULC) changes on the spatiotemporaldistribution of precipitation in megacities have been highlighted in studies on urban climate change.In this study, we conducted a quantitative analysis of urban growth on the impact on precipitationin Shanghai, China. We considered four periods of LULC data in 1979, 1990, 2000 and 2010, inaddition to the long-term (1979–2010) trend of daily precipitation. The results indicate that the trendin precipitation exhibit different characteristics for urban (Ur), outskirt of urban (OUr) and outersuburb (OS) regions. Most Ur regions had an upward trend in annual and extreme precipitationduring 1979–2010, while annual precipitation for the OUr and OS regions exhibited a decreasing trend.From 1979 to 2010, the areas of fastest expansion were located in the OUr region. The OS region, faraway from the central area, had a relatively lower rate of change. In addition, OUr regions withrapid LULC changes exhibited higher increasing trends in annual and daily extreme precipitation,which is critical for the identification of frequent precipitation areas and the reliable projection offurther changes.
Keywords: land use and land cover; precipitation trends; precipitation extremes; built-uparea; Shanghai
1. Introduction
It was reported in the World Urbanization Prospects that more than 54% of the global populationcurrently lives in cities, and this percentage is projected to reach 66% by 2050 [1]. The 2014Intergovernmental Panel on Climate Change (IPCC) predicted that several large metropolitan areasaround the world may experience a temperature rise of greater than 1.5 °C under the RepresentativeConcentration Pathway (RCP) 2.6 scenario, which introduces additional challenges for cities withrespect to coping with climate change and its impact [2,3]. Under the influence of anthropogenic factors,cities are very sensitive and vulnerable to heavy rainstorms [4,5], floods [6,7], heat waves [8] andother weather-related hazards that are likely to be exacerbated by climate change [9,10]. In particular,changes in “urban heat island (UHIs)” associated with anthropogenic land use and land cover (LULC)in megacities have raised great concerns with regard to their impact on urban precipitation [11–13].
Appl. Sci. 2020, 10, 7897; doi:10.3390/app10217897 www.mdpi.com/journal/applsci

Appl. Sci. 2020, 10, 7897 2 of 21
By 2030, the urban land cover will increase by 1.2 million km2, which is nearly triple the situationin 2000 [14,15]. More densely built impervious underlying surface, such as road, building andconcrete, have replaced the natural vegetation during rapid urbanization [16,17], which leads tochanges in precipitation due to changes in the urban thermal environment, e.g., albedo effects [18,19],anthropogenic heat [20–22] and the increase in emission of artificial aerosols [23–26]. These changesin the underlying urban surface have exacerbated the destabilization of the boundary layer, therebyaltering local precipitation processes [27,28]. For instance, Holst et al. [29] used cloud-resolvingmodels (CRMs) and found that an increase in convective precipitation depends on the amount ofheat energy released at the surface. Moreover, it was demonstrated that high precipitation ratesare sensitive to the amount of surface heat that is released [30]. Currently, high accuracy LULCdata are an important parameter in the precise simulation of precipitation processes in most climatemodels [31–33], such as the Weather Research and Forecasting (WRF) model [34]. Specifically, theWRF model incorporates the urban canopy model (UCM) parameterization scheme option with Noahland surface beginning from WRF-UCM version 2.2 [35]. However, it has been demonstrated in someinstances that simulated precipitation does not accurately represent the actual precipitation process dueto the coarser spatial [36–39] and temporal [40] resolution of the LULC data. In particular, Xie et al. [41]simulated a precipitation process in 2012 that occurred during a heavy rainstorm in Beijing based onthe WRF model, and they concluded that the simulated results could be sensitive to the accuracies ofLULC data.
Over the past decades, China has experienced rapid urbanization [42]. The unprecedentedLULC changes across urban areas of China have exerted substantial impacts on regional climateand precipitation [43–46]. Previous studies in some urban agglomerations such as the Yangtze RiverDelta [47], Pearl River Delta [48,49] and Beijing-Tianjin-Hebei [50] have revealed that rapid urbanexpansion may cause significant increases in the amount of total precipitation in urban areas. Moreover,extreme precipitation may be intensified in the center of metropolitan areas [51], especially in the citiesof Beijing, Guangzhou and Shanghai. In addition, precipitation intensity [52] and frequency [53] aremore likely to increase in the metropolitan areas of these cities during the phase of rapid urbanization.
Since the 1980s, Shanghai’s built-up area has ranked second in China under the rapid urbanizationprocess. Liang et al. [54] found that the speed of urbanization exerts significant influences on thespatial distribution of annual and extreme precipitation. In addition, further results show that changesin the frequency and total amount of hourly heavy precipitation indicate an obvious increasing trendin urban and suburban areas during the rapid urbanization phase (1981–2014) in Shanghai [55]. Basedon these studies, Shanghai was selected as a case study region not only because of its complicatedunderlying urban surfaces but also due to the changing pattern of its regional precipitation extremes.Therefore, it is necessary for us to explore the relationship between different LULCs and precipitationin Shanghai. Two aspects could be emphasized: precipitation patterns in different LULC types andimpacts of LULC variations on precipitation trends. In this study, we quantitatively compared thedifferences of gridded precipitation trends among urban, outskirt of urban and outer suburbs areasduring the rapid urbanization phase (1979–2010), particularly in the case of extreme events. In addition,the potential changes in precipitation trends with variations in LULC were further analyzed. Therest of this paper is organized into several sections. Section 2 introduces the study area, datasets andmethods. Section 3 presents the main results on the influence of built-up area changes on precipitation.Finally, the discussion and conclusions are summarized in Sections 4 and 5, respectively.
2. Materials and Methods
2.1. Study Area
Shanghai, on the coast of the East China Sea, is a well-known megacity of more than 24.28 millionresidents as of 2019 and a total area of 6340.5 km2 [56]. The entire city is situated on the eastern fringeof the Yangtze River Delta (Figure 1), and the average elevation is approximately 4.0 m (above sea

Appl. Sci. 2020, 10, 7897 3 of 21
level, measured at the Wusong Datum). Shanghai has a humid subtropical climate with four distinctseasons. The average annual precipitation is approximately 1123 mm/year [57]. This city typicallyfaces threats from typhoon-triggered rainstorms from June to September [58]. Covering an area of314.96 km2, more than 30% of Shanghai’s population lives in the central area, which includes the mostdensely populated commercial regions in Shanghai.
Appl. Sci. 2020, 10, x FOR PEER REVIEW 3 of 20
Shanghai, on the coast of the East China Sea, is a well-known megacity of more than 24.28 million
residents as of 2019 and a total area of 6340.5 km2 [56]. The entire city is situated on the eastern fringe
of the Yangtze River Delta (Figure 1), and the average elevation is approximately 4.0 m (above sea
level, measured at the Wusong Datum). Shanghai has a humid subtropical climate with four distinct
seasons. The average annual precipitation is approximately 1123 mm/year [57]. This city typically
faces threats from typhoon-triggered rainstorms from June to September [58]. Covering an area of
314.96 km2, more than 30% of Shanghai’s population lives in the central area, which includes the most
densely populated commercial regions in Shanghai.
Figure 1. LULC types of Shanghai in 2010.
2.2. Datasets
Table 1 shows all the data used in this study, including 30 m-resolution LULC data available for
1979, 1990, 2000 and 2010 and daily precipitation data from 10 rain gauges during 1979–2010.
Table 1. Datasets used in this study.
Data type Period Temporal
resolution
Spatial
scale Purpose Source
LULC data 1979, 1990,
2000, 2010 Yearly Areas
Built-up area
detection
United States Geological
Survey (USGS)
Daily
precipitation
data
1979–2010 Daily Point
Precipitation
trend
analysis
Shanghai Meteorological
Bureau (SMB)
2.2.1. LULC Data
Figure 1. LULC types of Shanghai in 2010.
2.2. Datasets
Table 1 shows all the data used in this study, including 30 m-resolution LULC data available for1979, 1990, 2000 and 2010 and daily precipitation data from 10 rain gauges during 1979–2010.
Table 1. Datasets used in this study.
Data Type Period TemporalResolution Spatial Scale Purpose Source
LULC data 1979, 1990,2000, 2010 Yearly Areas Built-up area
detection
United StatesGeological Survey
(USGS)
Dailyprecipitation data 1979–2010 Daily Point Precipitation
trend analysis
ShanghaiMeteorologicalBureau (SMB)
2.2.1. LULC Data
LULC data were obtained from Landsat satellite images for four periods (i.e., 1979, 1990, 2000 and2010) from the USGS (https://earthexplorer.usgs.gov/). Table 2 shows the image details for the four
Appl. Sci. 2020, 10, 7897 4 of 21
periods. After atmospheric and geometric correction, these images were further classified into built-upand non-built-up areas based on a supervised classification method. The non-built-up area includedfour land use types: farmland, green land, bare land and water (Table 3). The classification resultsshow that the total accuracy is higher than 85% and the values of the Kappa coefficient (a measure ofagreement between the two individuals, see Yin et al. [59]) are between 0.79 and 0.89. Figure 2 showsthe spatiotemporal distribution of the built-up and non-built-up areas. In this period (1979–2010),Shanghai experienced rapid urbanization and the extent of built-up area in 2010 reached 2350.05 km2,which is nearly 10 times than that in 1979.
Table 2. Description of the four-periods for the Landsat satellite images.
Period Date Sensors
1979 4 August Landsat Multispectral Scanner (MSS)1990 4 December Landsat-5 Thematic Mapper (TM)2000 29 June Landsat-7 Enhanced TM (ETM+)2010 22 May Landsat-7 Enhanced TM (ETM+)
Table 3. Description of each land use type.
Categories Types of Land Use LULC Descriptions
Built-up area /Urban land, settlements, other construction land (industrial
land, transportation land, airport, special land, etc.)
Non-built-up area
Farmland Crop fields, vegetable field, fallow and alternate land, etc.)
Green land Land used for growing forest, arbors, shrubs, bamboos, coastalmangroves, etc.
Bare land Land to be built on, unused land, rock, beaches, etc.Waters Rivers, lakes, reservoirs, ponds, mud flat, etc.
Appl. Sci. 2020, 10, x FOR PEER REVIEW 4 of 20
LULC data were obtained from Landsat satellite images for four periods (i.e., 1979, 1990, 2000
and 2010) from the USGS (https://earthexplorer.usgs.gov/). Table 2 shows the image details for the
four periods. After atmospheric and geometric correction, these images were further classified into
built-up and non-built-up areas based on a supervised classification method. The non-built-up area
included four land use types: farmland, green land, bare land and water (Table 3). The classification
results show that the total accuracy is higher than 85% and the values of the Kappa coefficient (a
measure of agreement between the two individuals, see Yin et al. [59]) are between 0.79 and 0.89.
Figure 2 shows the spatiotemporal distribution of the built-up and non-built-up areas. In this period
(1979–2010), Shanghai experienced rapid urbanization and the extent of built-up area in 2010 reached
2350.05 km², which is nearly 10 times than that in 1979.
Table 2. Description of the four-periods for the Landsat satellite images.
Period Date Sensors
1979 4 August Landsat Multispectral Scanner (MSS)
1990 4 December Landsat-5 Thematic Mapper (TM)
2000 29 June Landsat-7 Enhanced TM (ETM+)
2010 22 May Landsat-7 Enhanced TM (ETM+)
Table 3. Description of each land use type.
Categories Types of
land use LULC descriptions
Built-up area /
Urban land, settlements, other construction land
(industrial land, transportation land, airport, special
land, etc.)
Non-built-up
area
Farmland Crop fields, vegetable field, fallow and alternate land,
etc.)
Green land Land used for growing forest, arbors, shrubs,
bamboos, coastal mangroves, etc.
Bare land Land to be built on, unused land, rock, beaches, etc.
Waters Rivers, lakes, reservoirs, ponds, mud flat, etc.
Figure 2. Spatiotemporal distributions of built-up and non-built up areas in Shanghai.
2.2.2. Rain Gauge Data
Based on the 25-km distance of the barycenter of the central area, the investigated area could be
classified into three categories: urban area (Ur), outskirt of urban area (OUr) and outer suburb area
(OS) (see Figure 3). Daily rain gauge-based precipitation observations from January 1979 to December
2010 were obtained from the Shanghai Meteorological Bureau (http://sh.cma.gov.cn/). As shown in
Figure 3, Xujiahui gauge (red dot) is located in the Ur region. Minhang, Baoshan, Jiading and
Songjiang gauges (orange dots) are distributed in the OUr region (the distance of the barycenter of
the central area is less than 25 km). In addition, other gauges (e.g., Qingpu, Jinshan, Nanhui and
Figure 2. Spatiotemporal distributions of built-up and non-built up areas in Shanghai.
2.2.2. Rain Gauge Data
Based on the 25-km distance of the barycenter of the central area, the investigated area could beclassified into three categories: urban area (Ur), outskirt of urban area (OUr) and outer suburb area(OS) (see Figure 3). Daily rain gauge-based precipitation observations from January 1979 to December2010 were obtained from the Shanghai Meteorological Bureau (http://sh.cma.gov.cn/). As shown inFigure 3, Xujiahui gauge (red dot) is located in the Ur region. Minhang, Baoshan, Jiading and Songjianggauges (orange dots) are distributed in the OUr region (the distance of the barycenter of the centralarea is less than 25 km). In addition, other gauges (e.g., Qingpu, Jinshan, Nanhui and Chongminggauges) are positioned in the OS region, which are far from the city center (distance of the barycenterof central area is more than 25 km).

Appl. Sci. 2020, 10, 7897 5 of 21
Appl. Sci. 2020, 10, x FOR PEER REVIEW 5 of 20
Chongming gauges) are positioned in the OS region, which are far from the city center (distance of
the barycenter of central area is more than 25 km).
Figure 3. Location of the selected 10 rain gauges in Shanghai and the two surrounding rain gauges.
In addition, we selected five rain stations located in coastal areas around Shanghai including one
in Jiangsu province (Lvsi site) and four in Zhejiang province (Pinghu, Cixi, Dinghai and Shengsi sites)
(see Figure 4). Given that these stations are mainly distributed on islands and in coastal regions, their
precipitation trend changes are strongly affected by climatic factors, especially for the oceans.
Figure 4. Locations of Xujiahui and five coastal stations.
Figure 3. Location of the selected 10 rain gauges in Shanghai and the two surrounding rain gauges.
In addition, we selected five rain stations located in coastal areas around Shanghai including onein Jiangsu province (Lvsi site) and four in Zhejiang province (Pinghu, Cixi, Dinghai and Shengsi sites)(see Figure 4). Given that these stations are mainly distributed on islands and in coastal regions, theirprecipitation trend changes are strongly affected by climatic factors, especially for the oceans.
Appl. Sci. 2020, 10, x FOR PEER REVIEW 5 of 20
Chongming gauges) are positioned in the OS region, which are far from the city center (distance of
the barycenter of central area is more than 25 km).
Figure 3. Location of the selected 10 rain gauges in Shanghai and the two surrounding rain gauges.
In addition, we selected five rain stations located in coastal areas around Shanghai including one
in Jiangsu province (Lvsi site) and four in Zhejiang province (Pinghu, Cixi, Dinghai and Shengsi sites)
(see Figure 4). Given that these stations are mainly distributed on islands and in coastal regions, their
precipitation trend changes are strongly affected by climatic factors, especially for the oceans.
Figure 4. Locations of Xujiahui and five coastal stations. Figure 4. Locations of Xujiahui and five coastal stations.

Appl. Sci. 2020, 10, 7897 6 of 21
2.3. Methods
2.3.1. Precipitation Trend Modeling
We used the nonparametric Theil–Sen estimator [60] to calculate the trend of precipitation (i.e.,annual extreme amount, extreme precipitation amount and frequency of extreme precipitation). Thismethod is insensitive to outliers and suitable for skewed data. In addition, the nonparametricMann–Kendall test [61] at a significance level α = 0.05 was applied to examine the statistical significanceof the detected precipitation trends.
Usually, a daily precipitation event is defined with the condition that the daily precipitationis larger than 0.1 mm [62]. In addition, the daily precipitation that exceeded the 95th percentilethreshold [63] (calculated based on the period 1979–2010) was considered as an extreme precipitationevent. The yearly number of extreme precipitation events that exceeded this threshold was used as thefrequency of occurrence of extreme precipitation.
In this study, the three-year moving-average method was used to smooth the short-term datafluctuations and to address the precipitation trend in the long-term series [64].
2.3.2. Gridded Precipitation Trends
To quantify the precipitation trends of the entire study area, the inverse distance weighted(IDW) interpolation method was employed to generate the spatially distributed precipitation from thepoint-scale to the gridded scale [65]. To prevent the “extrapolation” in the gridding process, two raingauges that located in the surrounding area of Shanghai (Figure 1) were included in interpolation. Fiveautomatic weather stations daily records provided by Shanghai Climate Centre were used to verifythe daily precipitation interpolation results in 2008. The 10 rain gauges used in this paper and theautomatic weather stations are belonging to the same dataset, but the historical period of the automaticweather stations observation is shorter than rain gauges. The results show that IDW interpolation hashigh accuracy with an averaged correlation coefficient of 0.78 and root mean square error is less than10 mm.
2.3.3. Built-Up area Changes
To quantify the spatiotemporal changes of the built-up area, we created a vector layer with a 5 kmresolution covering the study area, the four periods of the built-up layers were assigned to the vectorlayer. The percentage of the built-up area in each block was calculated, based on Equation (1).
Pi, j =Gi, j
Si× 100% (1)
where Pi, j is the percentage of the built-up area, i is block number and j represents the year. Theparameter Gi, j is the extent of the block for period j and Si is the total area of block i.
In addition, the change rate of the built-up area percentage from 1979 to 2010 was calculatedbased on the linear regression model (see Equation (2)).
y = ax + b (2)
where a is the regression coefficient that represents the change rate of the built-up area percentage andx and b represent the time series variables and constant, respectively.
3. Results
3.1. Spatiotemporal Changes in Precipitation Trends
Spatial distribution of the gridded mean annual precipitation in Shanghai during the period1979–2010 is shown in Figure 5. The precipitation in the Ur and southern OUr is higher than in

Appl. Sci. 2020, 10, 7897 7 of 21
other areas, with an average annual precipitation of over 1700 mm/year. The relatively low averageannual precipitation is located on Chongming Island and the western areas. Figure 6 shows the spatialdistributions of the trend for annual precipitation amount, extreme precipitation amount and frequencyof extreme precipitation. It is evident that most of the Ur region had an upward trend with respect tothe annual and extreme precipitation from 1979 to 2010. The annual precipitation amount exhibited adecreasing trend for most of the OUr and OS regions. We found that regions with an upward trend forextreme precipitation amount and its frequency are mainly distributed over the eastern region of thestudy area (Figure 6b,c).
Appl. Sci. 2020, 10, x FOR PEER REVIEW 7 of 20
frequency of extreme precipitation. It is evident that most of the Ur region had an upward trend with
respect to the annual and extreme precipitation from 1979 to 2010. The annual precipitation amount
exhibited a decreasing trend for most of the OUr and OS regions. We found that regions with an
upward trend for extreme precipitation amount and its frequency are mainly distributed over the
eastern region of the study area (Figure 6b,c).
Box plots of the precipitation trends during 1979–2010 for the Ur, OUr and OS regions are shown
in Figure 7. Based on a thorough analysis of Figure 7, the median rise of the annual and extreme
precipitation in Ur is higher compared to OUr and OS, which indicates that some areas in Ur exhibit
an increasing trend in precipitation. It is noted that the maximum trends of extreme precipitation for
the OUr region is nearly 2.0 mm/year.
Figure 5. Spatial distribution of the mean annual precipitation from 1979 to 2010 in Shanghai.
Figure 6. Spatial distribution of the trends for: (a) annual precipitation amount; (b) extreme
precipitation amount; and (c) frequency of extreme precipitation.
Figure 5. Spatial distribution of the mean annual precipitation from 1979 to 2010 in Shanghai.
Appl. Sci. 2020, 10, x FOR PEER REVIEW 7 of 20
frequency of extreme precipitation. It is evident that most of the Ur region had an upward trend with
respect to the annual and extreme precipitation from 1979 to 2010. The annual precipitation amount
exhibited a decreasing trend for most of the OUr and OS regions. We found that regions with an
upward trend for extreme precipitation amount and its frequency are mainly distributed over the
eastern region of the study area (Figure 6b,c).
Box plots of the precipitation trends during 1979–2010 for the Ur, OUr and OS regions are shown
in Figure 7. Based on a thorough analysis of Figure 7, the median rise of the annual and extreme
precipitation in Ur is higher compared to OUr and OS, which indicates that some areas in Ur exhibit
an increasing trend in precipitation. It is noted that the maximum trends of extreme precipitation for
the OUr region is nearly 2.0 mm/year.
Figure 5. Spatial distribution of the mean annual precipitation from 1979 to 2010 in Shanghai.
Figure 6. Spatial distribution of the trends for: (a) annual precipitation amount; (b) extreme
precipitation amount; and (c) frequency of extreme precipitation.
Figure 6. Spatial distribution of the trends for: (a) annual precipitation amount; (b) extreme precipitationamount; and (c) frequency of extreme precipitation.
Box plots of the precipitation trends during 1979–2010 for the Ur, OUr and OS regions are shownin Figure 7. Based on a thorough analysis of Figure 7, the median rise of the annual and extreme

Appl. Sci. 2020, 10, 7897 8 of 21
precipitation in Ur is higher compared to OUr and OS, which indicates that some areas in Ur exhibit anincreasing trend in precipitation. It is noted that the maximum trends of extreme precipitation for theOUr region is nearly 2.0 mm/year.Appl. Sci. 2020, 10, x FOR PEER REVIEW 8 of 20
Figure 7. Box plots of the precipitation trends during 1979–2010 for Ur, OUr and OS. The rectangular
box plot shows three horizontal lines that represent the median (intermediate line), the 25th percentile
(low line) and the 75th percentile values (upper line), while the top and bottom three vertical lines
represent the maximum and minimum of the precipitation changes during 1979–2010 for Ur, OUr
and OS, respectively. (a) annual precipitation amount; (b) extreme precipitation amount; and (c)
frequency of extreme precipitation.
3.2. Spatiotemporal Changes of Built-Up Areas
Based on Equations (1) and (2), we calculated the percentage changes of the built-up areas given
the selected four periods. As shown in Figure 8, in 1979, most of the built-up areas were primarily
located in the central area of Shanghai. From 1990, the built-up areas have expanded throughout the
Ur region of Shanghai, and some new built-up areas have been established around the OUr region.
Since 2000, there has been an expansion of the built-up areas to the OS region. In 2010, the percentage
of built-up areas in OS region exceeded 20%. Overall, from 1979 to 2010, it is noted that the fastest
areas of expansion are located in the OUr region (Figure 9). The grids with higher change rates of the
built-up area are mainly distributed in the OUr region, e.g., within the 25 km distance of the
barycenter of the central area. The OS region, far away from the central area, has a relatively lower
changing rate.
To further investigate the potential changes of the trend in precipitation and the variation of the
built-up area, a quantitative analysis of the relationship between changes in the built-up area and the
distribution of precipitation is presented in Section 3.3.
Figure 8. The percentage of the built-up areas in: (a) 1979; (b) 1990; (c) 2000; and (d) 2010.
Figure 7. Box plots of the precipitation trends during 1979–2010 for Ur, OUr and OS. The rectangularbox plot shows three horizontal lines that represent the median (intermediate line), the 25th percentile(low line) and the 75th percentile values (upper line), while the top and bottom three vertical linesrepresent the maximum and minimum of the precipitation changes during 1979–2010 for Ur, OUr andOS, respectively. (a) annual precipitation amount; (b) extreme precipitation amount; and (c) frequencyof extreme precipitation.
3.2. Spatiotemporal Changes of Built-Up Areas
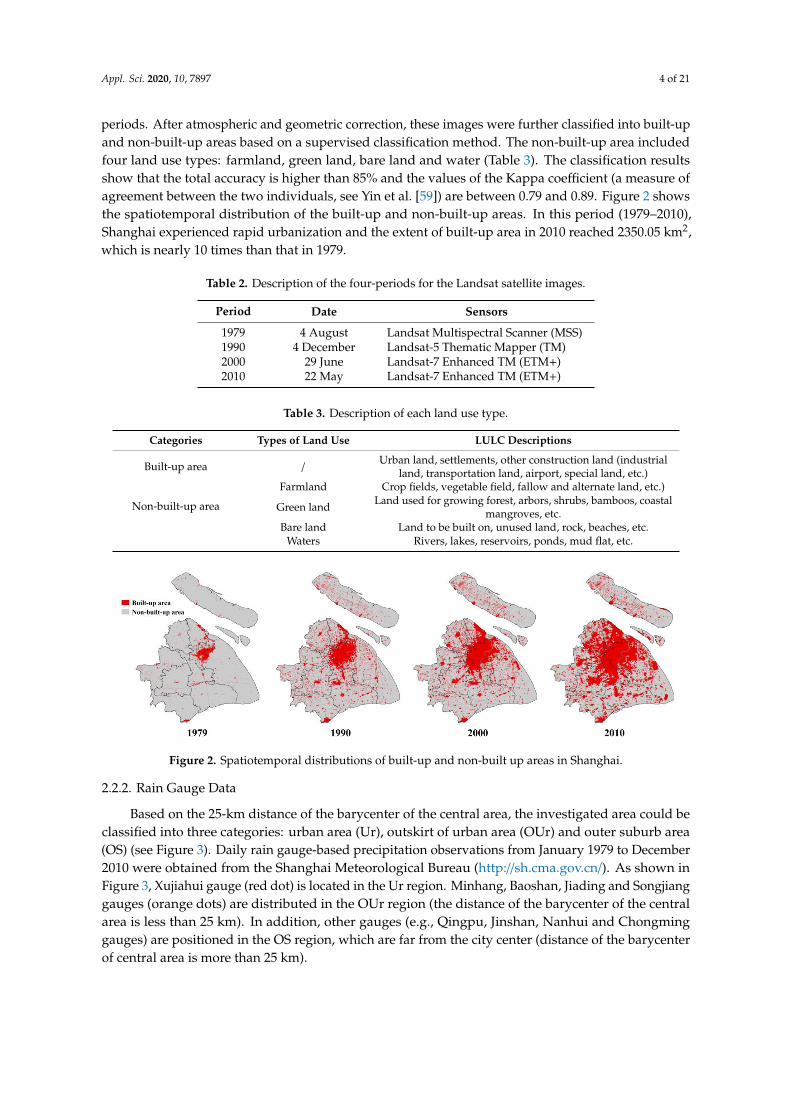
Based on Equations (1) and (2), we calculated the percentage changes of the built-up areas giventhe selected four periods. As shown in Figure 8, in 1979, most of the built-up areas were primarilylocated in the central area of Shanghai. From 1990, the built-up areas have expanded throughout theUr region of Shanghai, and some new built-up areas have been established around the OUr region.Since 2000, there has been an expansion of the built-up areas to the OS region. In 2010, the percentageof built-up areas in OS region exceeded 20%. Overall, from 1979 to 2010, it is noted that the fastestareas of expansion are located in the OUr region (Figure 9). The grids with higher change rates of thebuilt-up area are mainly distributed in the OUr region, e.g., within the 25 km distance of the barycenterof the central area. The OS region, far away from the central area, has a relatively lower changing rate.
Appl. Sci. 2020, 10, x FOR PEER REVIEW 8 of 20
Figure 7. Box plots of the precipitation trends during 1979–2010 for Ur, OUr and OS. The rectangular
box plot shows three horizontal lines that represent the median (intermediate line), the 25th percentile
(low line) and the 75th percentile values (upper line), while the top and bottom three vertical lines
represent the maximum and minimum of the precipitation changes during 1979–2010 for Ur, OUr
and OS, respectively. (a) annual precipitation amount; (b) extreme precipitation amount; and (c)
frequency of extreme precipitation.
3.2. Spatiotemporal Changes of Built-Up Areas
Based on Equations (1) and (2), we calculated the percentage changes of the built-up areas given
the selected four periods. As shown in Figure 8, in 1979, most of the built-up areas were primarily
located in the central area of Shanghai. From 1990, the built-up areas have expanded throughout the
Ur region of Shanghai, and some new built-up areas have been established around the OUr region.
Since 2000, there has been an expansion of the built-up areas to the OS region. In 2010, the percentage
of built-up areas in OS region exceeded 20%. Overall, from 1979 to 2010, it is noted that the fastest
areas of expansion are located in the OUr region (Figure 9). The grids with higher change rates of the
built-up area are mainly distributed in the OUr region, e.g., within the 25 km distance of the
barycenter of the central area. The OS region, far away from the central area, has a relatively lower
changing rate.
To further investigate the potential changes of the trend in precipitation and the variation of the
built-up area, a quantitative analysis of the relationship between changes in the built-up area and the
distribution of precipitation is presented in Section 3.3.
Figure 8. The percentage of the built-up areas in: (a) 1979; (b) 1990; (c) 2000; and (d) 2010. Figure 8. The percentage of the built-up areas in: (a) 1979; (b) 1990; (c) 2000; and (d) 2010.
Appl. Sci. 2020, 10, 7897 9 of 21Appl. Sci. 2020, 10, x FOR PEER REVIEW 9 of 20
Figure 9. The percentage change rate of the built-up area from 1979 to 2010.
3.3. The Relationship between Precipitation Trends and Built-Up Changes
Scatter plots for the precipitation trend and changes of the built-up in the Ur, OUr and OS
regions are shown in Figure 10. Overall, the linear-fitting mode of the precipitation trends and built-
up area change rates of the three regions are different. The rapid growth in the percentage of built-
up area in the OUr is positively correlated with the increase in the precipitation trend (correlation
coefficient >0.4). As such, higher changing rates of the built-up area is associated with a larger
increase in precipitation over time. In contrast, although the Ur experienced relatively rapid growth
of the built-up area percentage, there is a strong negative correlation between the precipitation trend
and the changes in the built-up area percentage. In addition, the precipitation trend for the OS is
smaller than that of the Ur and OUr regions, and a negative correlation is observed between the
precipitation trend and changes in the built-up area percentage.
Spatial distributions of the blocks that exhibit an upward precipitation trend and the rapid built-
up area changes (the change rate of built-up area percentage exceeds 0.2, red filled) are shown in
Figure 11. These blocks are mainly distributed in the OUr region. In contrast to the circular
distribution surrounding the Ur region for the frequency of extreme precipitation, annual
precipitation amount and extreme precipitation amount are concentrated in the south of the Ur and
OUr regions.
Figure 9. The percentage change rate of the built-up area from 1979 to 2010.
To further investigate the potential changes of the trend in precipitation and the variation of thebuilt-up area, a quantitative analysis of the relationship between changes in the built-up area and thedistribution of precipitation is presented in Section 3.3.
3.3. The Relationship between Precipitation Trends and Built-Up Changes
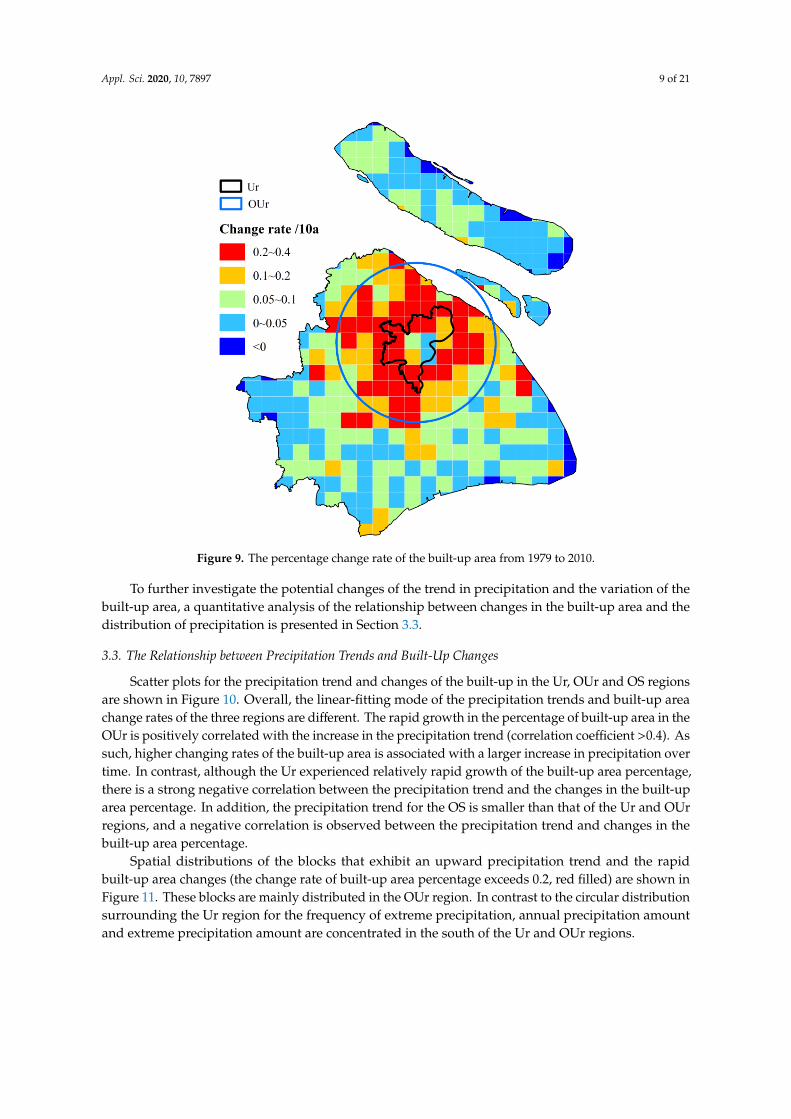
Scatter plots for the precipitation trend and changes of the built-up in the Ur, OUr and OS regionsare shown in Figure 10. Overall, the linear-fitting mode of the precipitation trends and built-up areachange rates of the three regions are different. The rapid growth in the percentage of built-up area in theOUr is positively correlated with the increase in the precipitation trend (correlation coefficient >0.4). Assuch, higher changing rates of the built-up area is associated with a larger increase in precipitation overtime. In contrast, although the Ur experienced relatively rapid growth of the built-up area percentage,there is a strong negative correlation between the precipitation trend and the changes in the built-uparea percentage. In addition, the precipitation trend for the OS is smaller than that of the Ur and OUrregions, and a negative correlation is observed between the precipitation trend and changes in thebuilt-up area percentage.
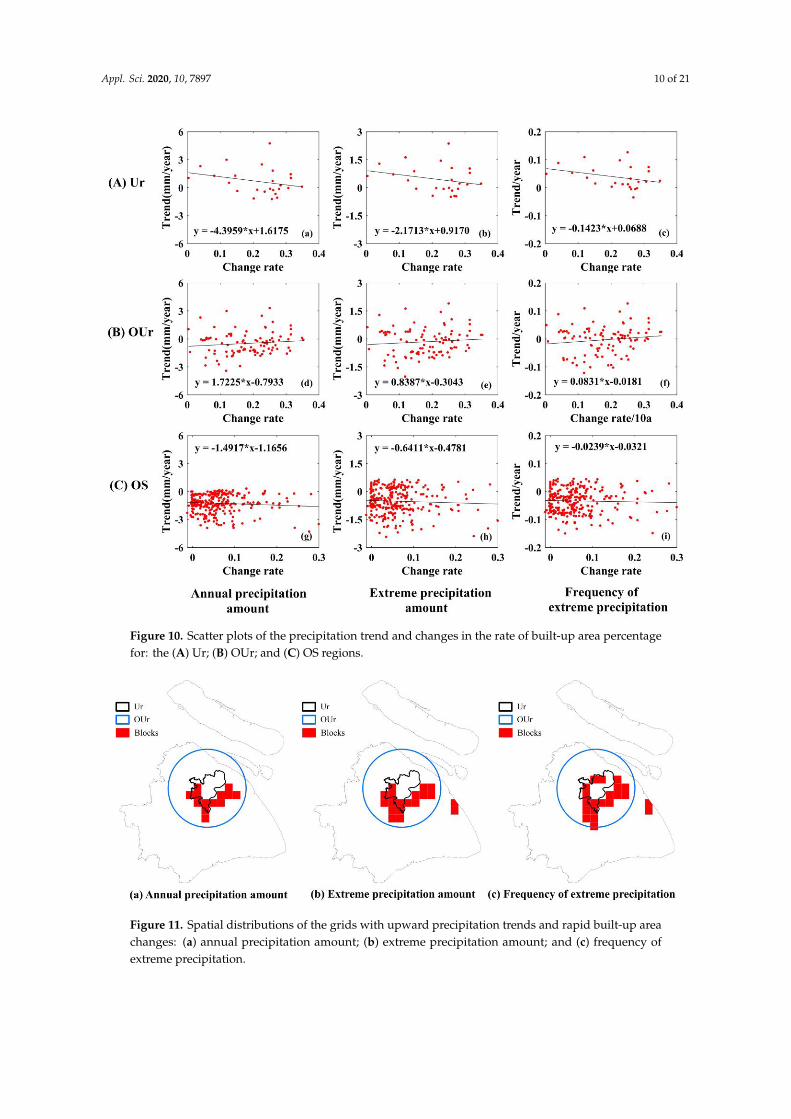
Spatial distributions of the blocks that exhibit an upward precipitation trend and the rapidbuilt-up area changes (the change rate of built-up area percentage exceeds 0.2, red filled) are shown inFigure 11. These blocks are mainly distributed in the OUr region. In contrast to the circular distributionsurrounding the Ur region for the frequency of extreme precipitation, annual precipitation amountand extreme precipitation amount are concentrated in the south of the Ur and OUr regions.
Appl. Sci. 2020, 10, 7897 10 of 21
Appl. Sci. 2020, 10, x FOR PEER REVIEW 10 of 20
Figure 10. Scatter plots of the precipitation trend and changes in the rate of built-up area percentage
for: the (A) Ur; (B) OUr; and (C) OS regions.
Figure 11. Spatial distributions of the grids with upward precipitation trends and rapid built-up area
changes: (a) annual precipitation amount; (b) extreme precipitation amount; and (c) frequency of
extreme precipitation.
4. Discussion
The urbanization process is complex and includes continuous population concentration,
industrialization and commercialization that trigger the conversion of underlying surface types, as
Figure 10. Scatter plots of the precipitation trend and changes in the rate of built-up area percentagefor: the (A) Ur; (B) OUr; and (C) OS regions.
Appl. Sci. 2020, 10, x FOR PEER REVIEW 10 of 20
Figure 10. Scatter plots of the precipitation trend and changes in the rate of built-up area percentage
for: the (A) Ur; (B) OUr; and (C) OS regions.
Figure 11. Spatial distributions of the grids with upward precipitation trends and rapid built-up area
changes: (a) annual precipitation amount; (b) extreme precipitation amount; and (c) frequency of
extreme precipitation.
4. Discussion
The urbanization process is complex and includes continuous population concentration,
industrialization and commercialization that trigger the conversion of underlying surface types, as
Figure 11. Spatial distributions of the grids with upward precipitation trends and rapid built-up areachanges: (a) annual precipitation amount; (b) extreme precipitation amount; and (c) frequency ofextreme precipitation.

Appl. Sci. 2020, 10, 7897 11 of 21
4. Discussion
The urbanization process is complex and includes continuous population concentration,industrialization and commercialization that trigger the conversion of underlying surface types,as well as changes in urban geometry. Changes involving wider impervious surface areas consisting ofcement and asphalt dramatically alter the environment factors of urban boundary layer, includingland surface albedo, roughness, surface latent fluxes, etc. [66–68]. In this process, decreases in albedoincrease the radiative energy absorption by urban land surface [69,70]; higher and denser urbanbuildings increase the roughness length, which exerts a stronger drag on the wind [71–74]. Moreover,a lower canopy fraction results in reduced ground moisture content and surface latent fluxes [75,76].Urbanization is often associated with high emissions of artificial aerosols, which reflects and scattersolar radiation, thereby altering the energy budget and acting as cloud condensation nuclei [77]. Inaddition, anthropogenic heat production enhances sensible heat flux from the land surface to theatmosphere near cities [78–80]. The urban boundary layer is described as being unstable whenever thesurface is warmer than the air and in a state of free convection in the case of vigorous thermal updraftsand downdrafts [81].
The changes of the urban boundary layer thermodynamic stability induced by increasedurbanization processes can affect the local microclimate [82–84]. In addition, enhanced convectionover a city can cause a measurable increase in convective clouds and thunderstorms, and it mayalso produce modification of precipitation patterns [85]. It has been shown in previous studies thatthermally induced changes in circulation play an important role in the simulated precipitation increasein the central urban domain [13,29]. For instance, Souma, Sunada, Suetsugi and Tanaka [21] confirmedthat the increase in the amount of precipitation over the Tokyo urban area was caused by anthropogenicheat and artificial land cover.
In the current study, we considered changes in built-up area as one of the most important factorsthat influence the occurrence and intensity of urban precipitation [86,87]. We also demonstrated thatprecipitation trends show different characteristics in the Ur, OUr and OS regions in Shanghai, duringthe period of rapid urbanization. However, further efforts are still needed to determine changes inother factors interlinked with urbanization in Shanghai, for example, the impact of urban heat island(UHI) effects on precipitation. In addition, apart from LULC changes, influences of natural externalvariability including extreme precipitation is also very important and is often assumed to scale withchanges in atmospheric moisture and content [88] and large-scale circulation patterns [89]. As a coastalcity, precipitation in Shanghai is not only influenced by anthropogenic activities but is also affected byadjacent oceans. Therefore, detailed analyses of observed trends in temperature change in Shanghaiduring urbanization and the effects of regional and nearby oceanic influences on precipitation, shouldbe thoroughly investigated.
4.1. The Spatiotemporal Changes of Temperature Trends
Due to the physical mechanism and thermal modifications of the urban boundary layer, thiscauses the city center to be warmer than the surrounding rural areas. This phenomenon as termedthe UHI effect [90–92]. Figure 12 shows the time series of temperature in Shanghai from 1960 to 2010based on in situ observations. It is evident that mean annual temperature, mean summer temperature,and mean winter temperature recorded at stations located in the Ur, OUr and OS regions generallyexhibit an upward trend from 1960 to 2010. From the 1960s to the early 1980s, the temperature andchange trends among those three regions are relatively synchronized. However, from the mid-1980s,the observed annual average temperature differences gradually become more prominent due to rapidurbanization. The temperature of Ur becomes gradually higher than measurements from the gaugesdistributed in OUr and OS. As previously indicated, associated with the expansion of the built-up area,the central area has a relatively high degree of built-up area percentage, which inevitably increases theimpervious surface cover with its high heat capacity. Therefore, the quantitative relationship between

Appl. Sci. 2020, 10, 7897 12 of 21
the temperature and the changing rate of the built-up in the Ur, OUr and OS regions during 1979–2010is further discussed.Appl. Sci. 2020, 10, x FOR PEER REVIEW 12 of 20
Figure 12. Time series of temperature in Shanghai from 1960 to 2010: (a) mean annual temperature;
(b) mean summer temperature; and (c) mean winter temperature.
The spatial pattern of mean annual temperature indicates that areas with an upward change
trend are mainly distributed over the Ur and OUr regions (Figure 13a). Urbanization and LULC
changes may contribute to the spatial distribution difference of the evolution trends of temperature
in Shanghai. The largest rise in mean annual temperature occurs in the southwest of OUr, where the
change rate of built-up area percentage is the highest. However, it is noted that most of the
Chongming Island and northern OUr region had an upward trend with respect to the extreme high
temperature and days of extreme high temperature from 1979 to 2010 (Figure 13b,c).
Figure 13. Spatial distribution of the trends for: (a) mean annual temperature; (b) extreme high
temperature; and (c) days of extreme high temperature from 1979 to 2010.
Figure 14 shows the relationship between temperature and the change rate of the built-up area
in the Ur, OUr and OS regions. Although the warming trend for mean annual temperature was
observed in Ur, the increase in the built-up area percentage has a poor linear fit for a change in
temperature. In contrast, the temperature warming trends for OUr and OS are positively related to
the growth of the built-up area (correlation coefficient >0.5). Many previous studies have concluded
that land use change caused by urbanization is the primary driving factor for the increase in
temperature. Kalnay and Cai [87] estimated that there was a 0.27 °C mean surface warming per
century due to land-use changes, which is at least twice as high as previous estimates based only on
urbanization. However, the days of extreme temperature only show lightly positive relationship with
the growth of the built-up area in OS (correlation coefficient >0.3).
Figure 12. Time series of temperature in Shanghai from 1960 to 2010: (a) mean annual temperature; (b)mean summer temperature; and (c) mean winter temperature.
The spatial pattern of mean annual temperature indicates that areas with an upward change trendare mainly distributed over the Ur and OUr regions (Figure 13a). Urbanization and LULC changesmay contribute to the spatial distribution difference of the evolution trends of temperature in Shanghai.The largest rise in mean annual temperature occurs in the southwest of OUr, where the change rate ofbuilt-up area percentage is the highest. However, it is noted that most of the Chongming Island andnorthern OUr region had an upward trend with respect to the extreme high temperature and days ofextreme high temperature from 1979 to 2010 (Figure 13b,c).
Appl. Sci. 2020, 10, x FOR PEER REVIEW 12 of 20
Figure 12. Time series of temperature in Shanghai from 1960 to 2010: (a) mean annual temperature;
(b) mean summer temperature; and (c) mean winter temperature.
The spatial pattern of mean annual temperature indicates that areas with an upward change
trend are mainly distributed over the Ur and OUr regions (Figure 13a). Urbanization and LULC
changes may contribute to the spatial distribution difference of the evolution trends of temperature
in Shanghai. The largest rise in mean annual temperature occurs in the southwest of OUr, where the
change rate of built-up area percentage is the highest. However, it is noted that most of the
Chongming Island and northern OUr region had an upward trend with respect to the extreme high
temperature and days of extreme high temperature from 1979 to 2010 (Figure 13b,c).
Figure 13. Spatial distribution of the trends for: (a) mean annual temperature; (b) extreme high
temperature; and (c) days of extreme high temperature from 1979 to 2010.
Figure 14 shows the relationship between temperature and the change rate of the built-up area
in the Ur, OUr and OS regions. Although the warming trend for mean annual temperature was
observed in Ur, the increase in the built-up area percentage has a poor linear fit for a change in
temperature. In contrast, the temperature warming trends for OUr and OS are positively related to
the growth of the built-up area (correlation coefficient >0.5). Many previous studies have concluded
that land use change caused by urbanization is the primary driving factor for the increase in
temperature. Kalnay and Cai [87] estimated that there was a 0.27 °C mean surface warming per
century due to land-use changes, which is at least twice as high as previous estimates based only on
urbanization. However, the days of extreme temperature only show lightly positive relationship with
the growth of the built-up area in OS (correlation coefficient >0.3).
Figure 13. Spatial distribution of the trends for: (a) mean annual temperature; (b) extreme hightemperature; and (c) days of extreme high temperature from 1979 to 2010.
Figure 14 shows the relationship between temperature and the change rate of the built-up area inthe Ur, OUr and OS regions. Although the warming trend for mean annual temperature was observedin Ur, the increase in the built-up area percentage has a poor linear fit for a change in temperature.In contrast, the temperature warming trends for OUr and OS are positively related to the growth ofthe built-up area (correlation coefficient >0.5). Many previous studies have concluded that land usechange caused by urbanization is the primary driving factor for the increase in temperature. Kalnayand Cai [87] estimated that there was a 0.27 ◦C mean surface warming per century due to land-usechanges, which is at least twice as high as previous estimates based only on urbanization. However,the days of extreme temperature only show lightly positive relationship with the growth of the built-uparea in OS (correlation coefficient >0.3).

Appl. Sci. 2020, 10, 7897 13 of 21Appl. Sci. 2020, 10, x FOR PEER REVIEW 13 of 20
Figure 14. Scatter plots of temperature and change rates of built-up area percentage for: the (a) Ur; (b)
OUr; and (c) OS regions.
4.2. Analysis of the Possible Influence of Urbanization on Precipitation
The time series of the annual precipitation amount from 1979 to 2010 and the percentage of the
built-up area from 1990 to 2010 for Xujiahui and five coastal sites are shown in Figure 15. The results
show that there are remarkably different patterns for the percentage of built-up area. For Xujiahui
station, the percentage of built-up area in the surrounding 5 km buffer zones exceeded 90% in the
period from 1990 to 2010, and an obvious increasing trend at a rate of 4.75 mm/year was observed at
this station from 1979 to 2010 (statistically significant at the α = 0.05 level). Among coastal stations,
Cixi station also exhibits an increasing trend at a rate of 1.30 mm/year. However, a decreasing trend
in annual precipitation amount was observed for the Pinghu and Dinghai stations, and a relatively
weak increasing trend was observed for the Lvsi and Shengsi stations (not statistically significant at
the α = 0.05 level). We found that the amount of precipitation increased significantly in the Shanghai
urban areas and suggest that urbanization has a profound impact on precipitation at a regional level.
Moreover, the effects of regional and nearby oceanic influences on precipitation trends in
Shanghai should be considered in detail. Firstly, a brief statement of sea–land breezes is appropriate
because rain in coastal regions is usually initiated by the convergence associated with land–sea
breezes [93]. The different thermal conductivity of the land surface and sea surface results in the land–
sea temperature difference and causes horizontal pressure gradients which can drive mesoscale
circulations, daytime sea breeze and nighttime land breeze [81]. The subsequent sea breeze may affect
the diurnal cycle and intensity of local precipitation by modifying low-level convergence [94,95].
However, urban-induced circulation changes can cause enhanced convergence leading to moisture
transport from the ocean [96,97]. Lei et al. [98] found that even with the active-phase monsoon
urbanization also contributes to local heavy precipitation and mesoscale precipitation distribution,
Figure 14. Scatter plots of temperature and change rates of built-up area percentage for: the (a) Ur; (b)OUr; and (c) OS regions.
4.2. Analysis of the Possible Influence of Urbanization on Precipitation
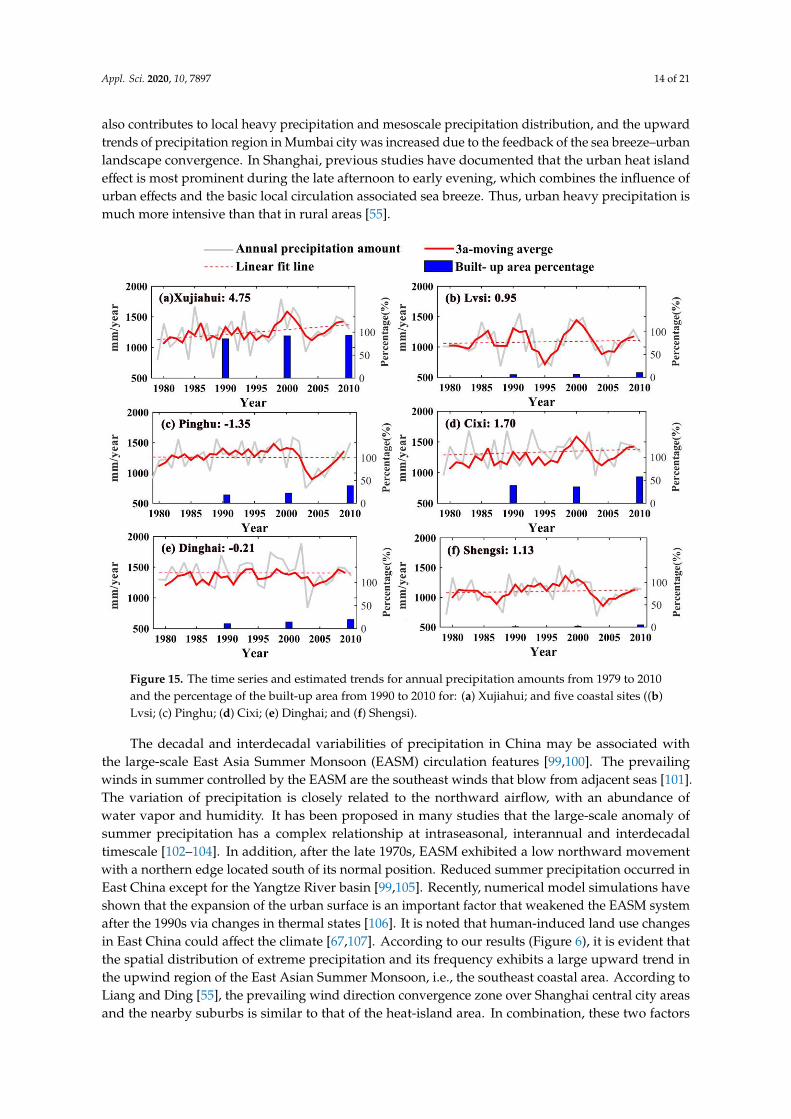
The time series of the annual precipitation amount from 1979 to 2010 and the percentage of thebuilt-up area from 1990 to 2010 for Xujiahui and five coastal sites are shown in Figure 15. The resultsshow that there are remarkably different patterns for the percentage of built-up area. For Xujiahuistation, the percentage of built-up area in the surrounding 5 km buffer zones exceeded 90% in theperiod from 1990 to 2010, and an obvious increasing trend at a rate of 4.75 mm/year was observed atthis station from 1979 to 2010 (statistically significant at the α = 0.05 level). Among coastal stations,Cixi station also exhibits an increasing trend at a rate of 1.30 mm/year. However, a decreasing trend inannual precipitation amount was observed for the Pinghu and Dinghai stations, and a relatively weakincreasing trend was observed for the Lvsi and Shengsi stations (not statistically significant at the α =
0.05 level). We found that the amount of precipitation increased significantly in the Shanghai urbanareas and suggest that urbanization has a profound impact on precipitation at a regional level.
Moreover, the effects of regional and nearby oceanic influences on precipitation trends in Shanghaishould be considered in detail. Firstly, a brief statement of sea–land breezes is appropriate because rainin coastal regions is usually initiated by the convergence associated with land–sea breezes [93]. Thedifferent thermal conductivity of the land surface and sea surface results in the land–sea temperaturedifference and causes horizontal pressure gradients which can drive mesoscale circulations, daytimesea breeze and nighttime land breeze [81]. The subsequent sea breeze may affect the diurnalcycle and intensity of local precipitation by modifying low-level convergence [94,95]. However,urban-induced circulation changes can cause enhanced convergence leading to moisture transportfrom the ocean [96,97]. Lei et al. [98] found that even with the active-phase monsoon urbanization
Appl. Sci. 2020, 10, 7897 14 of 21
also contributes to local heavy precipitation and mesoscale precipitation distribution, and the upwardtrends of precipitation region in Mumbai city was increased due to the feedback of the sea breeze–urbanlandscape convergence. In Shanghai, previous studies have documented that the urban heat islandeffect is most prominent during the late afternoon to early evening, which combines the influence ofurban effects and the basic local circulation associated sea breeze. Thus, urban heavy precipitation ismuch more intensive than that in rural areas [55].
Appl. Sci. 2020, 10, x FOR PEER REVIEW 14 of 20
and the upward trends of precipitation region in Mumbai city was increased due to the feedback of
the sea breeze–urban landscape convergence. In Shanghai, previous studies have documented that
the urban heat island effect is most prominent during the late afternoon to early evening, which
combines the influence of urban effects and the basic local circulation associated sea breeze. Thus,
urban heavy precipitation is much more intensive than that in rural areas [55].
Figure 15. The time series and estimated trends for annual precipitation amounts from 1979 to 2010
and the percentage of the built-up area from 1990 to 2010 for: (a) Xujiahui; and five coastal sites ((b)
Lvsi; (c) Pinghu; (d) Cixi; (e) Dinghai; and (f) Shengsi).
The decadal and interdecadal variabilities of precipitation in China may be associated with the
large-scale East Asia Summer Monsoon (EASM) circulation features [99,100]. The prevailing winds
in summer controlled by the EASM are the southeast winds that blow from adjacent seas [101]. The
variation of precipitation is closely related to the northward airflow, with an abundance of water
vapor and humidity. It has been proposed in many studies that the large-scale anomaly of summer
precipitation has a complex relationship at intraseasonal, interannual and interdecadal timescale
[102–104]. In addition, after the late 1970s, EASM exhibited a low northward movement with a
northern edge located south of its normal position. Reduced summer precipitation occurred in East
China except for the Yangtze River basin [99,105]. Recently, numerical model simulations have
shown that the expansion of the urban surface is an important factor that weakened the EASM system
after the 1990s via changes in thermal states [106]. It is noted that human-induced land use changes
in East China could affect the climate [67,107]. According to our results (Figure 6), it is evident that
the spatial distribution of extreme precipitation and its frequency exhibits a large upward trend in
the upwind region of the East Asian Summer Monsoon, i.e., the southeast coastal area. According to
Liang and Ding [55], the prevailing wind direction convergence zone over Shanghai central city areas
and the nearby suburbs is similar to that of the heat-island area. In combination, these two factors
readily led to the occurrence of heavy precipitation events. However, we currently still do not have
an adequate understanding of the changes of EASM in terms of onset, intensity and the influence of
these changes on precipitation in Shanghai.
Figure 15. The time series and estimated trends for annual precipitation amounts from 1979 to 2010and the percentage of the built-up area from 1990 to 2010 for: (a) Xujiahui; and five coastal sites ((b)Lvsi; (c) Pinghu; (d) Cixi; (e) Dinghai; and (f) Shengsi).
The decadal and interdecadal variabilities of precipitation in China may be associated withthe large-scale East Asia Summer Monsoon (EASM) circulation features [99,100]. The prevailingwinds in summer controlled by the EASM are the southeast winds that blow from adjacent seas [101].The variation of precipitation is closely related to the northward airflow, with an abundance ofwater vapor and humidity. It has been proposed in many studies that the large-scale anomaly ofsummer precipitation has a complex relationship at intraseasonal, interannual and interdecadaltimescale [102–104]. In addition, after the late 1970s, EASM exhibited a low northward movementwith a northern edge located south of its normal position. Reduced summer precipitation occurred inEast China except for the Yangtze River basin [99,105]. Recently, numerical model simulations haveshown that the expansion of the urban surface is an important factor that weakened the EASM systemafter the 1990s via changes in thermal states [106]. It is noted that human-induced land use changesin East China could affect the climate [67,107]. According to our results (Figure 6), it is evident thatthe spatial distribution of extreme precipitation and its frequency exhibits a large upward trend inthe upwind region of the East Asian Summer Monsoon, i.e., the southeast coastal area. According toLiang and Ding [55], the prevailing wind direction convergence zone over Shanghai central city areasand the nearby suburbs is similar to that of the heat-island area. In combination, these two factors

Appl. Sci. 2020, 10, 7897 15 of 21
readily led to the occurrence of heavy precipitation events. However, we currently still do not have anadequate understanding of the changes of EASM in terms of onset, intensity and the influence of thesechanges on precipitation in Shanghai.
Additionally, some studies have revealed that the changes in annual and extreme precipitations inChina are also related to the large-scale circulation indexes [89,108,109], including the El Niño-SouthernOscillation (ENSO), the North Atlantic Oscillation (NAO), the Southern Oscillation Index (SOI) andthe Pacific Decadal Oscillation (PDO). For example, summer rainfall anomalies in China are differentbetween the developing and decaying phases of ENSO. In Shanghai, Liu et al. [110] performed thechi-square test on daily precipitation from 1951 to 2001, and the results indicate that the El Niño eventslead to more precipitation than normal year. Regional precipitation events may not only be related toENSO and monsoon variability but also to some local mechanisms (e.g., warming environment oraerosols) [111]. This means that the regional changes of precipitation are more complex, and furthercomprehensive analyses involving natural climatic factors combined with numerical modeling studieswill be beneficial.
5. Conclusions
We analyzed Landsat satellite images for 1979, 1990, 2000 and 2010, in addition to rain gauge-baseddaily precipitation observations from January 1979 to December 2010 in Shanghai to investigate theeffects of LULC changes on precipitation. The conclusions are summarized as follows.
(1) Precipitation trends show different characteristics in the Ur, OUr and OS region during a periodof rapid urbanization. Most Ur regions had an upward trend in terms of annual and extremeprecipitation from 1979 to 2010. In comparison, the trends in annual precipitation were downwardin most OUr and OS regions. Moreover, we found that the upward trends in extreme precipitationincluding extreme amount and frequency are distributed throughout the eastern region of thestudy area. From 1979 to 2010, the areas of most rapid expansion were in the OUr region. Thegrids with higher change rates of the built-up area are mainly distributed in the OUr region, e.g.,within 25 km of the barycenter of the central area. The OS region, far away from the central area,has a relatively lower changing rate.
(2) The rapid growth of the built-up area percentage in the OUr is positively correlated with theincrease of precipitation. The larger the change of the built-up area percentage, the morepronounced the increase in precipitation over time. In contrast, although the Ur experiencedrelatively rapid growth of built-up area percentage, there is a negative correlation betweenprecipitation and changes in the built-up area percentage.
(3) The quantitative relationship between temperature and the change rates of the built-up indicatesthat the warming trends in the Ur and OUr region are distinct. The largest increase in the annualmean temperature was observed in the southwest of OUr, where the change rate of the built-uparea percentage was highest, which is related to the growth of the built-up area.
(4) The data from five rain stations located in coastal areas around Shanghai that have hardlyexperienced obvious urbanization processes were used for precipitation trend analysis of climatebackgrounds. We found that the magnitude of precipitation increased significantly in the Shanghaiurban areas, which suggests that urbanization has a profound impact on precipitation at theregional level.
In summary, we investigated the statistical relationship between urban sprawl and precipitationchanges; however, the analysis of the influence mechanism of LULC changes on the regional climate stillneeds to be further studied. In the future, we will expand the study to include urban agglomerationsand attempt to combine climate simulations based on the Weather Research and Forecasting (WRF)model and high-resolution gridded satellite-based precipitation data for further urban agglomerationprecipitation analysis.

Appl. Sci. 2020, 10, 7897 16 of 21
Author Contributions: Q.J. carried out the data analysis and wrote the majority of the paper. X.H. supported thestructure of the paper and revised the paper. J.W. (Jun Wang) is the supervisor of Q.J. and designed the experiments.J.W. (Jiahong Wen) contributed many conceptual and practical ideas. H.M., M.X. and J.G. participated in thediscussion of the paper. All authors have read and agreed to the published version of the manuscript.
Funding: This research was funded by the Major Program of National Social Science Foundation of China(18ZDA105); the National Key Research and Development Program of China (2018YFC1508803); the NationalNatural Science Foundation of China (41671095 and 41971199); and Shanghai Science and Technology SupportProgram (19DZ1201505).
Conflicts of Interest: The authors declare no conflict of interest.
References
1. Gremm, J.; Barth, J.; Fietkiewicz, K.J.; Stock, W.G. Informational Cities in the GCC States. In TransitioningTowards a Knowledge Society: Qatar as a Case Study; Springer: Berlin/Heidelberg, Germany, 2018; pp. 3–36.
2. Abadie, L.M.; Galarraga, I.; Sainz de Murieta, E. Understanding risks in the light of uncertainty:Low-probability, high-impact coastal events in cities. Env. Res. Lett. 2017, 12, 014017. [CrossRef]
3. IPCC. Integrated Risk and Uncertainty Assessment of Climate Change Response Policies. In ClimateChange 2014: Mitigation of Climate Change: Working Group III Contribution to the IPCC Fifth Assessment Report,Intergovernmental Panel on Climate, C.; Cambridge University Press: Cambridge, UK, 2015; pp. 151–206.
4. Shen, M.X.; Chen, J.; Zhuan, M.J.; Chen, H.; Xu, C.Y.; Xiong, L.H. Estimating uncertainty and its temporalvariation related to global climate models in quantifying climate change impacts on hydrology. J. Hydrol.2018, 556, 10–24. [CrossRef]
5. Kim, S.; Shin, Y.; Kim, H.; Pak, H.; Ha, J. Impacts of typhoon and heavy rain disasters on mortality andinfectious diarrhea hospitalization in South Korea. Int. J. Environ. Health Res. 2012, 23, 365–376. [CrossRef][PubMed]
6. Wang, J.; Yi, S.; Li, M.Y.; Wang, L.; Song, C.C. Effects of sea level rise, land subsidence, bathymetric changeand typhoon tracks on storm flooding in the coastal areas of Shanghai. Sci. Total. Env. 2017, 621, 228–234.[CrossRef]
7. Löwe, R.; Urich, C.; Sto Domingo, N.; Mark, O.; Deletic, A.; Arnbjerg-Nielsen, K. Assessment of UrbanPluvial Flood Risk and Efficiency of Adaptation Options Through Simulations-A New Generation of UrbanPlanning Tools. J. Hydrol. 2017, 550, 355–367. [CrossRef]
8. Russo, S.; Dosio, A.; Graversen, R.; Sillmann, J.; Carrao, H.; Dunbar, M.; Singleton, A.; Montagna, P.;Barbosa, P.; Vogt, J. Magnitude of extreme heat waves in present climate and their projection in a warmingworld. J. Geophys. Res.-Atmos. 2014, 119, 12500–12512. [CrossRef]
9. Binita, K.; Shepherd, J.M.; Johnson, G.C. Climate change vulnerability assessment in Georgia. Appl. Geogr.2015, 62, 62–74.
10. Carter, J.G.; Cavan, G.; Connelly, A.; Guy, S.; Handley, J.; Kazmierczak, A. Climate change and the city:Building capacity for urban adaptation. Prog. Plann. 2015, 95, 1–66. [CrossRef]
11. Fan, F.L.; Weng, Q.H.; Wang, Y.P. Land Use and Land Cover Change in Guangzhou, China, from 1998 to2003, Based on Landsat TM /ETM+ Imagery. Sensors 2007, 7, 1323–1342. [CrossRef]
12. Bornstein, R.; Lin, Q.L. Urban heat islands and summertime convective thunderstorms in Atlanta: Threecase studies. Atmos Env. 2000, 34, 507–516. [CrossRef]
13. Seino, N.; Aoyagi, T.; Tsuguti, H. Numerical simulation of urban impact on precipitation in Tokyo: Howdoes urban temperature rise affect precipitation? Urban. Clim. 2018, 23, 8–35. [CrossRef]
14. Seto, K.C.; Fragkias, M.; Güneralp, B.; Reilly, M.K. A Meta-Analysis of Global Urban Land Expansion. PLoSONE 2011, 6, e23777. [CrossRef]
15. Seto, K.C.; Güneralp, B.; Hutyra, L. Global Forecasts of Urban Expansion to 2030 and Direct Impacts onBiodiversity and Carbon Pools. PLoS ONE 2012, 109, 16083–16088. [CrossRef] [PubMed]
16. Kusaka, H.; Nawata, K.; Suzuki-Parker, A.; Takane, Y.; Furuhashi, N. Mechanism of Precipitation Increasewith Urbanization in Tokyo as Revealed by Ensemble Climate Simulations. J. Appl. Meteorol. Clim. 2014, 53,824–839. [CrossRef]
17. Sharma, R.; Joshi, P.K. Mapping environmental impacts of rapid urbanization in the National Capital Regionof India using remote sensing inputs. Urban. Clim. 2016, 15, 70–82. [CrossRef]

Appl. Sci. 2020, 10, 7897 17 of 21
18. Bae, S.Y.; Jeong, J.I.; Park, R.J.; Lim, K.S.S.; Hong, S.Y. Weekly variability of precipitation induced byanthropogenic aerosols: A case study in Korea in summer 2004. Sci. Total. Env. 2016, 541, 1531–1539.[CrossRef]
19. Lee, S.S.; Tao, W.K.; Jung, C.-H. Aerosol Effects on Instability, Circulations, Clouds, and Precipitation. Adv.Meteorol. 2014, 2014, 1–8. [CrossRef]
20. Yan, H.; Fan, S.X.; Guo, C.X.; Hu, J.; Dong, l. Quantifying the Impact of Land Cover Composition onIntra-Urban Air Temperature Variations at a Mid-Latitude City. PLoS ONE 2014, 9, e102124. [CrossRef]
21. Souma, K.; Sunada, K.; Suetsugi, T.; Tanaka, K. Use of ensemble simulations to evaluate the urban effect on alocalized heavy rainfall event in Tokyo, Japan. J. Hydro-Environ. Res. 2013, 7, 228–235. [CrossRef]
22. Smith, C.; Lindley, S.; Levermore, G. Estimating spatial and temporal patterns of urban anthropogenic heatfluxes for UK cities: The case of Manchester. Appl. Clim. 2009, 98, 19–35. [CrossRef]
23. Zhong, S.; Qian, Y.; Zhao, C.; Leung, L.; Yang, X.Q. A Case Study of Urbanization Impact on SummerPrecipitation in the Greater Beijing Metropolitan Area: Urban Heat Island Versus Aerosol Effects. J. Geophys.Res.-Atmos. 2015, 120, 10903–10914. [CrossRef]
24. Zhu, K.G.; Xie, M.; Wang, T.J.; Cai, J.X.; Li, S.B.; Feng, W. A modeling study on the effect of urban landsurface forcing to regional meteorology and air quality over South China. Atmos. Environ. 2017, 152, 389–404.[CrossRef]
25. Jin, M.L.; Marshall Shepherd, J.; King, M.D. Urban aerosols and their variations with clouds and rainfall: Acase study for New York and Houston. J. Geophys. Res.-Atmos. 2005, 110, D10S20. [CrossRef]
26. Lin, L.; Wang, Z.L.; Xu, Y.Y.; Fu, Q. Sensitivity of precipitation extremes to radiative forcing of greenhousegases and aerosols. Geophys. Res. Lett. 2016, 43, 9860–9868. [CrossRef]
27. Yang, B.; Zhang, Y.C.; Qian, Y. Simulation of urban climate with high-resolution WRF model: A case study inNanjing, China. Asia-Pac. J. Atmos. Sci. 2012, 48, 227–241. [CrossRef]
28. Pathirana, A.; Denekew, H.B.; Veerbeek, W.; Zevenbergen, C.; Banda, A.T. Impact of urban growth-drivenlanduse change on microclimate and extreme precipitation-A sensitivity study. Atmos. Res. 2014, 138, 59–72.[CrossRef]
29. Holst, C.C.; Tam, C.-Y.; Chan, J.C.L. Sensitivity of urban rainfall to anthropogenic heat flux: A numericalexperiment. Geophys. Res. Lett. 2016, 43, 2240–2248. [CrossRef]
30. Souma, K.; Tanaka, K.; Suetsugi, T.; Sunada, K.; Tsuboki, K.; Shinoda, T.; Wang, Y.Q.; Sakakibara, A.;Hasegawa, K.; Moteki, Q.; et al. A comparison between the effects of artificial land cover and anthropogenicheat on a localized heavy rain event in 2008 in Zoshigaya, Tokyo, Japan. J. Geophys. Res.-Atmos. 2013, 118,11600–11610. [CrossRef]
31. Solecki, W.D.; Oliveri, C. Downscaling climate change scenarios in an urban land use change model. J. Env.Manag. 2004, 72, 105–115. [CrossRef] [PubMed]
32. Shem, W.; Shepherd, M. On the impact of urbanization on summertime thunderstorms in Atlanta: Twonumerical model case studies. Atmos. Res. 2009, 92, 172–189. [CrossRef]
33. Cunha, A.P.M.A.; Alvalá, R.C.S.; Kubota, P.Y.; Vieira, R.M.S.P. Impacts of land use and land cover changes onthe climate over Northeast Brazil. Atmos. Sci. Lett. 2015, 16, 219–227. [CrossRef]
34. Bhati, S.; Mohan, M. WRF model evaluation for the urban heat island assessment under varying landuse/land cover and reference site conditions. Appl. Clim. 2016, 126, 385–400. [CrossRef]
35. Vahmani, P.; Ban-Weiss, G.A. Impact of remotely sensed albedo and vegetation fraction on simulation ofurban climate in WRF-urban canopy model: A case study of the urban heat island in Los Angeles. J. Geophys.Res.-Atmos. 2016, 121, 1511–1531. [CrossRef]
36. Salathé, E.; Leung, L.; Qian, Y.; Zhang, Y.X. Regional Climate Models Regional Climate Model Projections forthe State of Washington. Clim. Chang. 2010, 102, 51–75. [CrossRef]
37. Wehner, M.F.; Smith, R.L.; Bala, G.; Duffy, P. The effect of horizontal resolution on simulation of very extremeUS precipitation events in a global atmosphere model. Clim. Dynam. 2010, 34, 241–247. [CrossRef]
38. Mishra, V.; Dominguez, F.; Lettenmaier, D.P. Urban precipitation extremes: How reliable are regional climatemodels? Geophys. Res. Lett. 2012, 39, 419–420. [CrossRef]
39. Bolgiani, P.; Fernández-González, S.; Valero, F.; Merino, A.; García-Ortega, E.; Sánchez, J.L.; Martín, M.L.Numerical Simulation of a Heavy Precipitation Event in the Vicinity of Madrid-Barajas International Airport:Sensitivity to Initial Conditions, Domain Resolution, and Microphysics Parameterizations. Atmosphere 2018,9, 329. [CrossRef]

Appl. Sci. 2020, 10, 7897 18 of 21
40. Sertel, E.; Robock, A.; Ormeci, C. Impacts of land cover data quality on regional climate simulations. Int. J.Clim. 2010, 30, 1942–1953. [CrossRef]
41. Xie, Y.H.; Shi, J.C.; Lei, Y.H.; Xing, J.Y.; Yang, A.Q. Impacts of land cover change on simulating precipitationin Beijing area of China. Int. Geosci. Remote Sens. Symp. (Igarss) 2014, 4145–4148. [CrossRef]
42. Zhang, K.H.L.; Song, S.F. Rural–urban migration and urbanization in China: Evidence from time-series andcross-section analyses. China Econ. Rev. 2003, 14, 386–400. [CrossRef]
43. Zhao, D.M.; Wu, J. Regional warming induced by urban surface expansion in Shanghai. Atmos. Ocean. Sci.Lett. 2018. 11, 228–235. [CrossRef]
44. Wang, Y.L.; Feng, J.M.; Gao, H. Numerical simulation of the impact of land cover change on regional climatein China. Appl. Clim. 2013, 115, 141–152. [CrossRef]
45. Zhao, D.M.; Wu, J. Changes in urban-related precipitation in the summer over three city clusters in China.Appl. Clim. 2018, 134, 83–93. [CrossRef]
46. Hu, Y.H.; Jia, G.S. Influence of land use change on urban heat island derived from multi-sensor data. Int. J.Clim. 2010, 30, 1382–1395. [CrossRef]
47. Sang, Y.F.; Wang, Z.G.; Li, Z.; Liu, C.M.; Liu, X.J. Investigation into the daily precipitation variability in theYangtze River Delta, China. Hydrol. Process. 2013, 27, 175–185. [CrossRef]
48. Chen, S.; Li, W.B.; Du, Y.D.; Mao, C.Y.; Zhang, L. Urbanization effect on precipitation over the Pearl RiverDelta based on CMORPH data. Adv. Clim. Chang. Res. 2015, 6, 16–22. [CrossRef]
49. Wang, D.G.; Jiang, P.; Wang, G.L.; Wang, D.S. Urban extent enhances extreme precipitation over the PearlRiver Delta, China. Atmos. Sci. Lett. 2015, 16, 310–317. [CrossRef]
50. Su, Y.X.; Chen, X.Z.; Wang, C.Y.; Zhang, H.O.; Liao, J.S.; Ye, Y.Y.; Wang, C.J. A new method for extractingbuilt-up urban areas using DMSP-OLS nighttime stable lights: A case study in the Pearl River Delta, southernChina. Gisci. Remote Sens. 2015, 52, 218–238. [CrossRef]
51. Li, W.Y.; He, X.G.; Scaioni, M.; Yao, D.J.; Mi, C.R.; Zhao, J.; Chen, Y.; Zhang, K.H.; Gao, J.; Li, X. Annualprecipitation and daily extreme precipitation distribution: Possible trends from 1960 to 2010 in urban areasof China. Geomat. Nat. Haz. Risk 2019, 10, 1694–1711. [CrossRef]
52. Song, X.M.; Zhang, J.Y.; Aghakouchak, A.; Shouraseni, S.R.; Xuan, Y.Q.; Wang, G.Q.; He, R.M.; Wang, X.J.;Liu, C.S. Rapid urbanization and changes in spatiotemporal characteristics of precipitation in Beijingmetropolitan area. J. Geophys. Res.-Atmos. 2014, 119, 11250–11271. [CrossRef]
53. Chen, X.H.; Liu, B.J.; Chen, G. Effects of Urbanization on Precipitation Characteristics. J. Nat. Resour. (Chin.)2017, 32, 1591–1601.
54. Liang, P.; Ding, Y.H.; He, J.M.; Tang, X. Study of relationship between urbanization speed and change ofspatial distribution of rainfall over Shanghai. J. Trop. Meteorol. (Chin.) 2011, 27, 475–483.
55. Liang, P.; Ding, Y.H. The Long-term Variation of Extreme Heavy Precipitation and Its Link to UrbanizationEffects in Shanghai during 1916–2014. Adv. Atmos. Sci. 2017, 34, 321–334. [CrossRef]
56. Shanghai Statistical YearBook 2019. Shanghai Municipal Statistics Bureau. Available online: http://tjj.sh.gov.cn/ (accessed on 1 August 2020).
57. Du, S.Q.; Gu, H.H.; Wen, J.H.; Chen, K.; Van Rompaey, A. Detecting Flood Variations in Shanghai over1949–2009 with Mann-Kendall Tests and a Newspaper-Based Database. Water 2015, 7, 1808–1824. [CrossRef]
58. Meng, F.; Kang, J.; Li, W.; Wu, T.; Wang, T.; An, Y. Analysis and evaluation of typhoon disasters in Shanghaiin past 50 years. J. Catastrophology (Chin.) 2007, 22, 71–76.
59. Yin, J.; Yin, Z.E.; Zhong, H.D.; Xu, S.Y.; Hu, X.M.; Wang, J.; Wu, J.P. Monitoring urban expansion and landuse/land cover changes of Shanghai metropolitan area during the transitional economy (1979–2009) in China.Env. Monit Assess. 2011, 177, 609–621. [CrossRef]
60. Wilcox, R.R. A note on the Theil-Sen regression estimator when the regressor is random and the error term isheteroscedastic. Biom. J. 1998, 40, 261–268. [CrossRef]
61. Hamed, K.H.; Rao, A.R. A modified Mann-Kendall trend test for autocorrelated data. J. Hydrol. 1998, 204,182–196. [CrossRef]
62. Ma, S.M.; Zhou, T.J.; Dai, A.G.; Han, Z.Y. Observed Changes in the Distributions of Daily PrecipitationFrequency and Amount over China from 1960 to 2013. J. Clim. 2015, 28, 6960–6978. [CrossRef]
63. Pfeifer, S.; Bülow, K.; Gobiet, A.; Hänsler, A.; Mudelsee, M.; Otto, J.; Rechid, D.; Teichmann, C.; Jacob, D.Robustness of Ensemble Climate Projections Analyzed with Climate Signal Maps: Seasonal and ExtremePrecipitation for Germany. Atmosphere 2015, 6, 677–698. [CrossRef]

Appl. Sci. 2020, 10, 7897 19 of 21
64. Sonesson, C. Evaluations of some Exponentially Weighted Moving Average methods. J. Appl. Stat. 2003, 30,1115–1133. [CrossRef]
65. Lu, G.Y.; Wong, D.W. An adaptive inverse-distance weighting spatial interpolation technique. Comput.Geosci. 2008, 34, 1044–1055. [CrossRef]
66. Li, X.; Mitra, C.; Dong, L.; Yang, Q.C. Understanding land use change impacts on microclimate using WeatherResearch and Forecasting (WRF) model. Phys. Chem. Earth 2018, 103, 115–126. [CrossRef]
67. Kamal, S.; Huang, H.P.; Myint, S.W. The Influence of Urbanization on the Climate of the Las VegasMetropolitan Area: A Numerical Study. J. Appl. Meteorol. Clim. 2015, 54, 2157–2177. [CrossRef]
68. de Souza, D.O.; dos Santos Alvala, R.C.; do Nascimento, M.G. Urbanization effects on the microclimate ofManaus: A modeling study. Atmos. Res. 2016, 167, 237–248. [CrossRef]
69. Akbari, H.; Matthews, H.D.; Seto, D. The long-term effect of increasing the albedo of urban areas. Env. Res.Lett. 2012, 7, 024004. [CrossRef]
70. Trlica, A.; Hutyra, L.R.; Schaaf, C.L.; Erb, A.; Wang, J.A. Albedo, Land Cover, and Daytime SurfaceTemperature Variation Across an Urbanized Landscape. Earth’s Future 2017, 5, 1084–1101. [CrossRef]
71. Yuan, C.; Ng, E. Building Porosity for Better Urban Ventilation in High-Density Cities-A computationalparametric study. Build. Env. 2012, 50, 176–189. [CrossRef] [PubMed]
72. Klipp, C. Wind Direction Dependence of Atmospheric Boundary Layer Turbulence Parameters in the UrbanRoughness Sublayer. J. Appl. Meteorol. Clim. 2007, 46, 2086–2097. [CrossRef]
73. Crago, R.D.; Okello, W.; Jasinski, M.F. Equations for the Drag Force and Aerodynamic Roughness Length ofUrban Areas with Random Building Heights. Bound.-Lay Meteorol. 2012, 145, 423–437. [CrossRef]
74. Liu, G.; Sun, J.N.; Jiang, W.M. Observational verification of urban surface roughness parameters derivedfrom morphological models. Meteorol. Appl. 2009, 16, 205–213. [CrossRef]
75. Padmakumari, B.; Jaswal, A.K.; Goswami, B.N. Decrease in evaporation over the Indian monsoon region:Implication on regional hydrological cycle. Clim. Chang. 2013, 121, 787–799. [CrossRef]
76. Guo, X.L.; Fu, D.H.; Wang, J. Mesoscale convective precipitation system modified by urbanization in BeijingCity. Atmos. Res. 2006, 82, 112–126. [CrossRef]
77. Pozo, D.; Marín, J.C.; Raga, G.B.; Baumgardner, D. Aerosol particles in the Mexican East Pacific. Part II:Numerical simulations of the impact of enhanced CCN on precipitation development. Atmosfera 2013, 26,221–241. [CrossRef]
78. Kato, S.; Yamaguchi, Y. Analysis of urban heat-island effect using ASTER and ETM+ Data: Separation ofanthropogenic heat discharge and natural heat radiation from sensible heat flux. Remote Sens. Env. 2005, 99,44–54. [CrossRef]
79. Sailor, D.J. A review of methods for estimating anthropogenic heat and moisture emissions in the urbanenvironment. Int. J. Clim. 2011, 31, 189–199. [CrossRef]
80. Allen, L.; Lindberg, F.; Grimmond, C.S.B. Global to city scale urban anthropogenic heat flux: Model andvariability. Int. J. Clim. 2011, 31, 1990–2005. [CrossRef]
81. Wallace, J.M.; Hobbs, P.V. Atmospheric Science-An Introductory Survey, 2nd ed.; Academic Press: Cambridge,MA, USA, 2006; pp. 375–412.
82. Wong, P.; Lai, P.C.; Hart, M. Temporal statistical analysis of urban heat islands at the microclimate level.Procedia Env. Sci. 2015, 26, 91–94.
83. González-Aparicio, I.; Baklanov, A.; Hidalgo, J.; Korsholm, U.; Mahura, A. Impact of city expansion andincreased heat fluxes scenarios on the urban boundary layer of Bilbao using Enviro-HIRLAM. Urban. Clim.2014, 10, 831–845. [CrossRef]
84. Sharma, A.; Fernando, H.J.S.; Hamlet, A.F.; Hellmann, J.J.; Barlage, M.; Chen, F. Urban meteorologicalmodeling using WRF: A sensitivity study. Int. J. Clim. 2017, 37, 1885–1900. [CrossRef]
85. Ganeshan, M.; Murtugudde, R.; Imhoff, M.L. A multi-city analysis of the UHI-influence on warm seasonrainfall. Urban. Clim. 2013, 6, 1–23. [CrossRef]
86. Kaufmann, R.K.; Seto, K.C.; Schneider, A.; Liu, Z.T.; Zhou, L.M.; Wang, W.L. Climate Response to RapidUrban Growth: Evidence of a Human-Induced Precipitation Deficit. J. Clim. 2007, 20, 2299–2306. [CrossRef]
87. Kalnay, E.; Cai, M. Impact of urbanization and land-use change on climate. Nature 2003, 423, 528–531.[CrossRef]
88. Sugiyama, M.; Shiogama, H.; Emori, S. Precipitation extreme changes exceeding moisture content increasesin MIROC and IPCC climate models. PNAS 2009, 107, 571–575. [CrossRef]

Appl. Sci. 2020, 10, 7897 20 of 21
89. Deng, Y.; Jiang, W.G.; He, B.; Chen, Z.; Jia, K. Change in Intensity and Frequency of Extreme Precipitationand its Possible Teleconnection With Large-Scale Climate Index Over the China From 1960 to 2015. J. Geophys.Res.-Atmos. 2018, 123, 1–14. [CrossRef]
90. Menberg, K.; Blum, P.; Schaffitel, A.; Bayer, P. Long-Term Evolution of Anthropogenic Heat Fluxes into aSubsurface Urban Heat Island. Env. Sci. Technol. 2013, 47, 9747–9755. [CrossRef]
91. Mallick, J.; Rahman, A.; Singh, C.K. Modeling urban heat islands in heterogeneous land surface and itscorrelation with impervious surface area by using night-time ASTER satellite data in highly urbanizing city,Delhi-India. Adv. Space Res. 2013, 52, 639–655. [CrossRef]
92. Deilami, K.; Kamruzzaman, M.; Liu, Y. Urban heat island effect: A systematic review of spatio-temporalfactors, data, methods, and mitigation measures. Int. J. Appl. Earth Obs. 2018, 67, 30–42. [CrossRef]
93. Simpson, M.; Raman, S.; Suresh, R.; Mohanty, U.C. Urban effects of Chennai on sea breeze induced convectionand precipitation. J. Earth Syst. Sci. 2008, 117, 897–909. [CrossRef]
94. Zhu, L.; Meng, Z.Y.; Zhang, F.Q.; Markowski, P.M. The influence of sea- and land-breeze circulations onthe diurnal variability in precipitation over a tropical island. Atmos. Chem. Phys. 2017, 17, 13213–13232.[CrossRef]
95. Baker, R.D.; Lynn, B.H.; Boone, A.; Tao, W.K.; Simpson, J. The Influence of Soil Moisture, Coastline Curvature,and Land-Breeze Circulations on Sea-Breeze-Initiated Precipitation. J. Hydrometeorol. 2001, 2, 193–211.[CrossRef]
96. Huang, W.R.; Chan, J.C.L.; Wang, S.-Y. A planetary-scale land-sea breeze circulation in East Asia and thewestern North Pacific. Q. J. R. Meteorol. Soc. 2010, 136, 1543–1553. [CrossRef]
97. Lu, X.; Chow, K.C.; Yao, T.; Lau, A.K.H.; Fung, J.C.H. Effects of urbanization on the land sea breeze circulationover the Pearl River Delta region in winter. Int. J. Clim. 2010, 30, 1089–1104. [CrossRef]
98. Lei, M.; Niyogi, D.; Kishtawal, C.; Sr-Pielke, R.A.; Beltrán-Przekurat, A.; Nobis, T.E.; Vaidya, S.S. Effectof explicit urban land surface representation on the simulation of the 26 July 2005 heavy rain event overMumbai, India. Atmos. Chem. Phys. 2008, 8, 5975–5995. [CrossRef]
99. Ding, Y.H.; Wang, Z.Y.; Sun, Y. Inter-decadal variation of the summer precipitation in East China and itsassociation with decreasing Asian summer monsoon Part I: Observed evidences. Int. J. Clim. 2008, 28,1139–1161. [CrossRef]
100. Lu, D.R.; Yang, Y.J.; Fu, Y.F. Interannual variability of summer monsoon convective and stratiformprecipitations in East Asia during 1998–2013. Int. J. Clim. 2016, 36, 3507–3520. [CrossRef]
101. Hu, Y.J.; Zhong, Z.; Liu, X.Y.; Zhu, Y.M. Influence of air–sea interaction on the simulation of East Asiansummer monsoon: A case study. Dynam. Atmos. Ocean. 2012, 53–54, 1–16. [CrossRef]
102. Chen, H.P.; Sun, J.Q. Projected change in East Asian summer monsoon precipitation under RCP scenario.Meteorol. Atmos. Phys. 2013, 121, 55–77. [CrossRef]
103. Jiang, Z.; Yang, S.; He, J.; Li, J.; Liang, J. Interdecadal variations of East Asian summer monsoon northwardpropagation and influences on summer precipitation over East China. Meteorol. Atmos. Phys. 2008, 100,101–119. [CrossRef]
104. Ding, A.J.; Wang, T.; Zhao, M.; Wang, T.J.; Li, Z.K. Simulation of sea-land breezes and a discussion of theirimplications on the transport of air pollution during a multi-day ozone episode in the Pearl River Delta ofChina. Atmos Env. 2004, 38, 6737–6750. [CrossRef]
105. Zhang, Z.Q.; Sun, X.G.; Yang, X.-Q. Understanding the interdecadal variability of East Asian summermonsoon precipitation: Joint influence of three oceanic signals. J. Clim. 2018, 31, 5485–5505. [CrossRef]
106. Ma, H.Y.; Jiang, Z.H.; Jie, S.; Dai, A.G.; Fei, H. Effects of urban land-use change in East China on the EastAsian summer monsoon based on the CAM5.1 model. Clim. Dynam. 2015, 46, 2977–2989. [CrossRef]
107. Wu, J.; Zha, J.l.; Zhao, D.M. Estimating the impact of the changes in land use and cover on the surface windspeed over the East China Plain during the period 1980–2011. Clim. Dynam. 2016, 46, 847–863. [CrossRef]
108. Chen, J.P.; Wen, Z.P.; Wu, R.G.; Chen, Z.S.; Zhao, P. Interdecadal changes in the relationship between SouthernChina winter-spring precipitation and ENSO. Clim. Dynam. 2014, 43, 1327–1338. [CrossRef]
109. Gao, T.; Wang, H.J.; Zhou, T.J. Changes of extreme precipitation and nonlinear influence of climate variablesover monsoon region in China. Atmos. Res. 2017, 197, 379–389. [CrossRef]

Appl. Sci. 2020, 10, 7897 21 of 21
110. Liu, C.L.; Zhang, Q.; Xu, Y.P.; Jiang, T. Impacts of ENSO Events on Climate Changes during Last 50 Years inthe Yangtze Delta. Meteorological (Chin.) 2005, 31, 12–16.
111. Agilan, V.; Umamahesh, N.V. Detection and attribution of non-stationarity in intensity and frequency ofdaily and 4-h extreme rainfall of Hyderabad, India. J. Hydrol. 2015, 530, 677–697. [CrossRef]
Publisher’s Note: MDPI stays neutral with regard to jurisdictional claims in published maps and institutionalaffiliations.
© 2020 by the authors. Licensee MDPI, Basel, Switzerland. This article is an open accessarticle distributed under the terms and conditions of the Creative Commons Attribution(CC BY) license (http://creativecommons.org/licenses/by/4.0/).