Spatiotemporal Analysis of Land Use and Land Cover (LULC ...
Upload
khangminh22Category
view
0download
0
International Journal of Scientific Research and Innovative Technology ISSN: 2313-3759 Vol. 4 No. 5; May 2017
59
LAND USE AND LAND COVER CHANGE AND ITS IMPLICATIONS ON
GULLY EROSION IN SUSWA CATCHMENT, NAROK COUNTY
Charity Konana1, Charles Gachene
1, David Mburu
2, Stephen Mureithi
1, Patrick Gicheru
3, Zeinabu Khalif
4
1University of Nairobi, P.O. Box 30197, Nairobi, Kenya
2Jomo Kenyatta University of Agriculture and Technology (JKUAT), P.O. Box 6200, Nairobi, Kenya
3Kenya Agricultural and Livestock Research Organization (KALRO), P.O. Box 57811, Nairobi, Kenya
4United Nations Development Programme (UNDP), P.O. Box 30218, Nairobi, Kenya
Corresponding author:
Charity Konana
Address: University of Nairobi, P.O. Box 30197, Nairobi, Kenya
Email:
Abstract
This study investigated land use and land cover change for the last 26 years in Suswa Catchment,
Narok County using satellite imageries. Changes in land use and land cover (built up areas, agricultural land,
grassland, bareland and shrubland) for 1985-2000, 2000-2011 and 1985-2011 were determined using Chi-
square test. Results showed no significant changes in built up areas, agricultural land, bareland, grassland
and shrubland during the period. Overall change of built up area, shrubland, bareland, agriculture increased
in 26 years, while grassland decreased. Grasslands were therefore converted to build up areas, shrubland,
bareland and agricultural areas during this period. An increase in built up area, bareland and agricultural
land and a decrease in grassland are therefore drivers of gully erosion. A decrease in grassland results in an
increase in soil erosion. Projections (2020) indicate a significant increase in built up area, agricultural land
and bareland and a decrease of grassland.
Key words: Land use and cover change, Soil Erosion, Remote Sensing, GIS, Narok County
International Journal of Scientific Research and Innovative Technology ISSN: 2313-3759 Vol. 4 No. 5; May 2017
60
1. Introduction
Land use and land cover change has become a central component in managing natural resources and
monitoring environmental changes. Land use and land cover is dynamic in nature and provides an
understanding of the relationship of human activities with the environment, which is important in the Suswa
Catchment. Socio-economic processes for example agricultural, urban land, forestry, a shape land cover and
land use, and therefore need to be understood in order to mitigate human impacts on the environment
(Nagendraet al., 2004).
According to Teferiet al., (2013) transitions in land use and land cover can be caused by negative socio-
ecological feedbacks that arise from a severe degradation in ecosystem services or from socio-economic
changes and innovations. Transitions can be random or systematic, with random transitions being
characterized by abrupt changes, whereas systematic transitions evolve steadily or gradually. Information on
land use/cover change and possibilities of their optimal use is essential for the selection, planning and
implementation of land use strategies to meet increasing human needs and welfare.
Land use and land cover change involves the modification, either direct or indirect, of natural habitats
and their impact on the ecology of the area (Garedeet al., 2014). Land use and land cover change is often used
to assess the impact on climate variability, land degradation, ecosystem stability and diversity. Land use and
land cover addresses where changes are likely to take place and at what rate are changes likely to progress
(Veldkampet al., 2001). Change detection using remote sensing and geographic information systems helps to
assess landscape changes caused due to human activities. According to Lambinet al., (2003) cropland as
derived from remote sensing, has increased globally from 300–400 million ha in 1700 to 1500–1800 million
ha in 1990, a 4.5 to fivefold increase and a 50% net increase just in the twentieth century. The area under
pasture increased from around 500 million ha in 1700 to around 3100 million ha in 1990. These increases led
to the clearing of forests and the transformation of natural grasslands. Forest area decreased from 5000–6200
million ha in 1700 to 4300–5300 million ha in 1990. Grasslands also declined from 3200 million ha in 1700
to 1800–2700 million ha in 1990. Pasture land has decreased in Eastern Africa and is attributed to an increase
of cattle over this period, with an additional 872,000 head of cattle per year between 1992 and 1999,
Results by Brinketal., (2009) in sub-Saharan Africa reveal that over the 25 year period (1975 and
2000) agricultural land has increased by 57% from just over 200 million hectares to nearly 340 million
hectares. This increase has taken place at the expense of forests and natural non-forest vegetation, which have
diminished respectively by 16 and 5%. The area of these classes lost equates to 71 million hectares (Mha) and
nearly 60 Mha respectively. Barren areas have increased by 15% which amounts to 6.5 Mha. The annual
change results show that on average sub-Saharan Africa has been gaining almost 5 Mha agricultural land
every year, which means an average annual change rate of 2.3%. The yearly deforestation rate has been 0.7%,
which means that the whole region has been losing nearly 3 million hectares of forests every year. The yearly
deficit in non-forest natural vegetation has been 0.2%, which equates to more than 2 Mha lost every year.
Barren areas are estimated to have increased by a yearly rate of 0.6%, which means over 0.26 Mha every year.
Land use and land cover change (LULCC) are important factors that can affect gully formation and
development. Causes of gully formation are overgrazing due to high cattle population, expansion of
cultivation in steeper or marginal land, cultivation without taking care of surplus runoff water and
deforestation due to clearing of vegetation (Pathak et al., 2006). Gullies are very destructive and cannot be
eliminated by tilling or ploughing because of their depth. Damages due to gully erosion include disconnection
of roads and bridge breakage, recession of water table, immigration of people and movement of the location of

International Journal of Scientific Research and Innovative Technology ISSN: 2313-3759 Vol. 4 No. 5; May 2017
61
villages (Shahrivar et al., 2012). Livestock and community members are falling inside the gully (Plate 1),
flooding is affecting homes and the gully is cutting through homesteads making movement difficult in the
Suswa catchment.
Studies have looked at the impact of gradual or sudden changes in land use and exploitation systems on
the initiation and development of gullies. According to Murillo et al., (2011)changes in land use can modify
gully development leading to an increase in soil erosion or the reduction of the presence of gullies due to
either their suppression by machinery or their colonization by vegetation. In a study by Wan et al., (2007) in
China, results showed that the ascending order of the runoff of five land use and land cover types was
woodland, shrub, grassland, arable land and built-up land. The influence of land use and land cover change on
runoff was therefore transforming other land use types into built-up areas. Hence, there is a correlation
between different land covers and runoff. A study by Farhanet al., (2014)in Jordan also showed that the
average soil loss from mixed rainfed cultivation across the watershed is much higher when compared with
forest area, and open rangeland, and bare soils. This study investigated land use and land cover change for the
last 26 years in Suswa Catchment, Narok County using satellite images and implications for gully erosion.
2. Materials and Methods
The study was conducted in Suswa in Narok County (Fig 1) which lies between latitudes 00
50’ and 20
05’ South; and longitudes 350 58’ and 36
0 0’ East and covers an area of 15,087.8 km
2 (NEMA,
2009).Narokcounty has five agro-climatic zones namely humid, sub-humid, semi-humid to arid and semi-arid
(NEMA, 2009). Two-thirds of the county is classified as semi-arid. The agro-ecological zones found in the
sub-county include: Tropical Alpine (TA), Upper Highland zones (UH) Lower Highland zones (LH) and
upper-midland zones (UM). According to NEMA (2009) the county has a population of about 460,793, with
only about 11% residing in the urban areas. The population in the county ranges from 12 to 119 persons per
km2
(NEMA 2009). The county has diversified topography which ranges from a plateau with altitudes ranging
from 1000 m-2350 m.a.s.l at the southern parts to mountainous landscape which is about 3098 m.a.s.l at the
highest peak of Mau escarpment in the North (NEMA, 2009). According to NEMA (2009), the sub-county
experiences bi-modal pattern of rainfall with long rains (mid March-June) and short rains (September-
November). Rainfall distribution is uneven with high potential areas receiving the highest amount of rainfall
ranging from 1200 mm-1800 mm p.a while the lower drier areas classified as semi-arid receiving 500 mm or
less p.a. (NEMA, 2009).
The county serves an important ecological and economic role and supports wildlife, tourism, livestock,
farming activities and human settlements (NEMA, 2009). The main soil types in the county include Andosols,
Luvisols, Phaeozems, Vertisols and Acrisols. Areas with deep and well-drained soils include hilly and
mountainous areas of Mau escarpment, Ngorengore, Shatuka, Suswa and Loita hills (NEMA, 2009).
The Suswa Catchment was chosen as the study site due to the impact of gully erosion on livelihoods. In
addition, there is an on going collaborative project being carried out by KARI, Sustainable Land Management,
GEF/UNDP, KEFRI, UON and JKUAT to rehabilitate the gully. The community requested that gully
rehabilitation be a priority because it is threatening their livelihood. Furthermore, the road leading to Narok
town is being affected by soil deposition from the gully.

International Journal of Scientific Research and Innovative Technology ISSN: 2313-3759 Vol. 4 No. 5; May 2017
62
2.1 Land use and land cover change analysis
Landsat images were used to classify land use and land cover changes for 1985, 2000 and 2011 and
were classified using ENVI 4.7 software. The gully in the study area was not observed in the landsat imageries
because of the scale. Images were classified into land use and land cover change using supervised
classification and ground- truthing of the major land uses done within the study area. Land use and land cover
change were analyzed on grasslands, forests, settlements, agricultural land and water bodies. Image selection
was based on their availability and clarity with no cloud cover. Images were within the same season of the
year, that is, January for 1985, 2000 and 2011. The interval for the selected images was 15 years where
possible. Thematic change detection was established using ENVI Ex software. This was done by comparing 3
images of different times (1985-2000, 2000-2011 and 1985-2011) to show possible causes of gully
development.
ENVI Ex software identified differences between images of different times (1985-2000, 2000-2011
and 1985-2011) with a resultant classification image and statistics. The area of land under different land uses
and cover were used to calculate percentage changes in land use and land cover change using Excel software.
The results were then analyzed using Chi-square test in order to determine if there were significant changes in
land use and land cover changes (shrubland, grassland, bareland, agricultural land and settlement). Future
projections of land use and cover change were established through linear regression analysis. The analysis was
conducted using Microsoft excel. The three data points were plotted on a xy scatter plot. A trend line was then
fitted displaying both the equation and R2. Using this equation, estimates for 2021, 2031 and 2041 were
conducted. These periods are ten year projections of land use and land cover change in Suswa Catchment from
2011 (the year of focus of this current study).These points were then plotted on the final graph. This resulted
in a new equation and R2.
3. Results
3.1 Land use and land cover changes between 1985 and 2011
Land use and land cover changes were observed on grasslands, shrubland, settlements, agricultural
land and bareland as shown in the classified land use and land cover maps (Figures 2- 4). Land use and land
cover change for 1985, 2000 and 2011 for Suswa Catchment were analyzed as shown in Table 1. Major
changes in land use were observed in shrubland, settlements, bareland, grassland and agricultural land. Built
up area (settlements) increased by 18.18% by 2000, and further increased by 42.86% by 2011. Built up area
change (1985-2011) however increased by 68.83%. Shrubland decreased by 26.18% in 2000 and increased by
39.39% in 2011. Shrubland change (1985-2011) increased by 2.90%. Bareland increased by 928.10% in 2000
and increased by 405.69% in 2011. Bareland change (1985-2011) increased by 103.31%. Grassland increased
by 13.32% by 2000 and decreased by 27.12% by 2011. Grassland change (1985-2011) decreased by 17.41%.
Agricultural land increased by 1433% by the year 2000 and further increased by 51.08 % by the year 2011.
Agricultural change (1985-2011) increased by 2216%. To determine whether the observed land use/land cover
changes were significant, results of chi square goodness of fit test are shown in Table 2. There were no
significant (p < 0.05) changes in built up areas, agricultural land, grassland, bareland and shrubland.
Future projections (2020) of land use and land cover change in Suswa Catchment are shown in Figure
5-9. Projections for land use and land cover trends were based on the assumption that there were no
interventions and the status quo remained the same.From the projections (Figure 5), a significant increase in
built up area will characterize the land use in the coming ten year period in the Suswa Catchment possibly due

International Journal of Scientific Research and Innovative Technology ISSN: 2313-3759 Vol. 4 No. 5; May 2017
63
to increased settlement. Therefore there is a high association (97.3%) between built up areas and gully
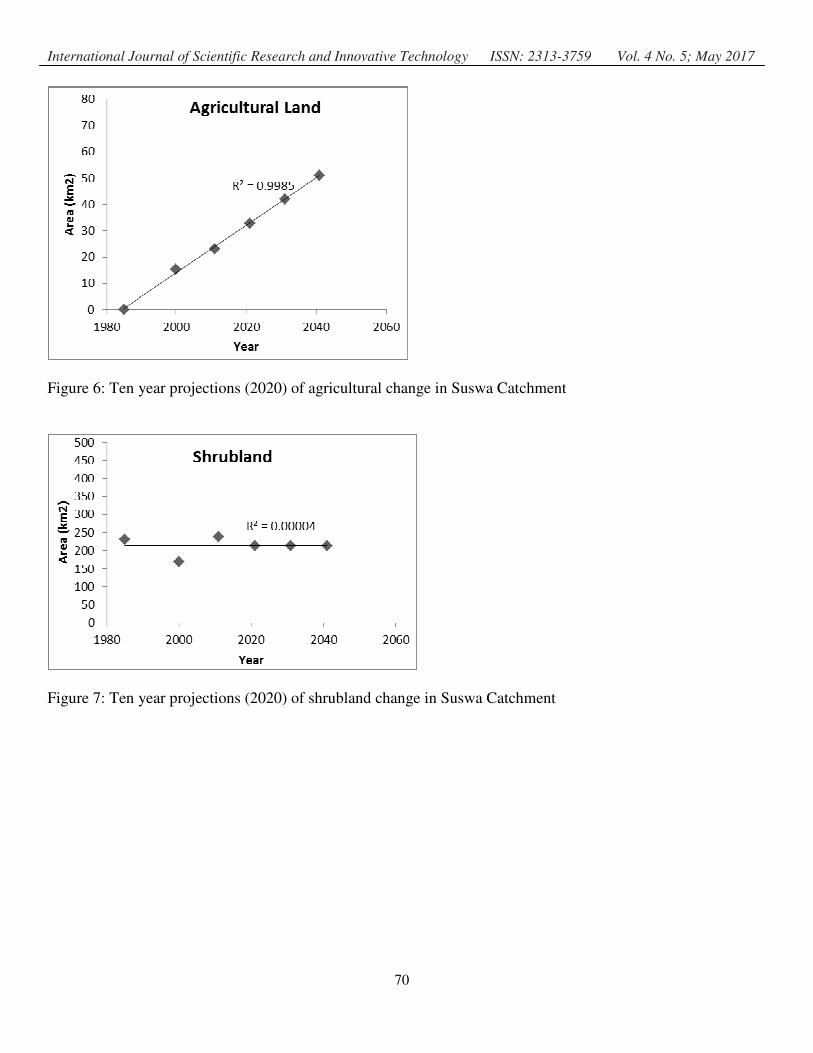
formation and development in the coming ten year period.Future projections (Figure 6), indicate that an
increase in the area under agricultural land will occur in ten years in the Suswa Catchment probably due to
increased cultivation. Therefore there is a high relationship (99.85%) between agriculture and gully formation
in the next ten year period.From the projections (Figure 7), indicates no significant changes in shrubland in the
coming ten year period in the Suswa Catchment, which probably indicates that exploitation may be minimal.
Therefore there is a minimal association (0.004%) between shrubland and gully erosion risk in the coming ten
year period. Future projections (Figure 8), indicate a significant increase in bareland which will be
characterized in the coming ten year period in the study area probably due to increased soil erosion due to lack
of vegetation cover. Therefore there is a minimal association (18.89%) between bareland and gully
development in the next ten year period. From the projections (Figure 9) a significant decrease of grassland
will characterize the land use in the coming ten year period in the Suswa Catchment possibly due to
overgrazing. Therefore there is a high relationship (66.19%) between grassland and gully formation in the
coming ten year period.
4. Discussion
Satellite image analysis showed that land use and land cover changes have occurred in the area
between 1985 and 2011. Between 1985 and 2000, built up area, bareland, grassland and agricultural land
continued to expand, while shrubland decreased. Shrubland was therefore converted to built up area, bareland,
grassland and agricultural land. Between 2000 and 2011, built up area, shrubland, bareland continued to
expand, while grassland decreased. Grassland was therefore converted to built up area, bareland and
agricultural land. Although built up areas, agricultural land, bareland, grassland and shrubland did not change
significantly for the period under investigation, it was observed that the overall change of built up area,
shrubland, bareland, agricultural land expanded between 1985 and 2011, while grassland decreased during
this period. Grassland was therefore converted to built up area, shrubland, bareland and agricultural land
during this period. An increase in built up area, bareland and agricultural land and a decrease in grassland are
probable drivers of gully erosion. An increase in built up area results in a decrease in grassland. In a
Participatory Geographic Information Systems (PGIS) study in the area (by this author) it was observed that
between 1985 and 2011 (26 years), there was an overall increase in built up area and bareland and decrease in
shrubland and grassland in the 4 villages (Olepolos, Enkiloriti, Eluai and Olesharo). Therefore remote sensing
and PGIS analysis both showed that a decrease in grassland was a driver of gully erosion in the study area.
Although there was an overall increase in shrubland (an increase by 39.39% in 2011), due to invasion by
invasive species due to soil deposition as was observed in the field. Invasive species were observed in areas of
soil deposition which had very little grass and shrubs. Checheet al., (2015) in Narok observed similar results
to this study in that, about 30% of the encountered species were exotic species that might have been
introduced in the rangelands by human activities. Exotic species were common in degraded areas with less
than 40% vegetation cover.Invasive alien plant species affect grasslands by lowering yield and quality of
forage, further leading to soil degradation.
Literature reveals increases in gully erosion as a consequence of land use and land cover changes.
Agricultural practices can accelerate erosion through soil compaction, reducing water holding capacity and
increasing soil erodibility (Van-Camp et al., 2004). Agricultural practices without adequate conservation
measures such as in the case of Suswa area can be directly linked to greater water erosion. Cultivation exposes

International Journal of Scientific Research and Innovative Technology ISSN: 2313-3759 Vol. 4 No. 5; May 2017
64
bare soil to rain, which could be the case in the study area. Overgrazing is one of the main drivers of gully
erosion in rangelands, such as the Suswa Catchment. According to Veblenet al., (2014) livestock grazing
reduces pasture and shrubs hence, affecting rangeland health. Poor rangeland health could be due to historic
grazing intensity which is the case in the Suswa area. In the study area grassland decreased by 17.41%
between 1985 and 2011 indicating poor rangeland health. Land-use and land cover change is associated with a
series of transitions, which reinforce each other. According to Lambin et al., (2003) transitions in land
use/cover must be viewed as multiple and reversible dynamics. Transitions can also be viewed as possible
development paths where the direction, size, and speed can be influenced. Historical land use and land cover
changes therefore may have significant impact on erosion, which could be the case in the study area.
Similar results to this study were observed by Duvertet al., (2010) in the Mexican Central Highlands,
indicating that traditional cropping practices with cattle grazing leads to severe soil degradation in the Cointzio
basin. Therefore the formation of gullies in Huertitas and Potrerillos was triggered by these practices, which
could be the case in Suswa Catchment. Okotiet al, (2006) observed a similar relationship in Marsabit district,
where there is an increase in gully erosion, especially near settlement areas due to animal trampling and
cutting of vegetation. As a result eroded places hardly support any vegetation. Observations by Yannelliet al.,
(2013) in Argentina showed that grazed fields and abandoned crop fields were much more susceptible to
potential gully erosion. Results by Wesselset al., (2007) in South Africa showed that long-term heavy grazing
was the cause of range degradation. Vagenet al., (2013) in Ethiopia observed that soil erosion was due to
overgrazing further exposing the soils. Lehet al., (2011) in Arkansas showed that increased erosion risk in
barren areas was not surprising because larger barren coverage meant larger areas without protective soil cover
and therefore increased the risk of soil erosion. Results by Tesfahunegnet al., (2014) observed similar
relationships in the Northern Ethiopia catchment, indicating that the highest rates of soil detachment occurred
in marginal lands, and subsoil exposed soils having low soil resistance to detaching forces.
Sakthivelet al., (2011) in India observed high soil erosion hazard zones being found in areas with
human habitation where agricultural activities are practiced. Also, high soil erosion prone areas were found at
Pattimedu, Jadayagaundan (Southern portion), Kanai and Puttai reserved forests (Eastern portion) and this was
attributed to deforestation and human interferences. In the study area built up area 1985-2011) increased by
68.83% between1985-2011 indicating human interferences. Observations by Suliemanet al., (2013) in Eastern
Sudan, showed that natural vegetation has been reduced from 26.1% in 1979 to 12.6% in 1999 and further to
9.4% in 2007. The majority of this reduction went into agricultural land. This reduction has exposed the soil
surface to accelerated water erosion. The decrease or disappearance of certain plant species and reduced
vegetation cover has increased the exposure of soil surfaces to wind and water erosion, which is the case in the
study area.
Klaus et al., (2014) in Morocco reported that agricultural practice influenced runoff within the
catchment. Agricultural practices therefore lead to accumulation and concentration of runoff which is the case
in the study area. Agriculture increased by 2216% between 1985 and 2011 in Suswa. Casasnovaset al., (2009)
in Spain showed that agriculture caused an increase in soil loss. Casasnovas et al., (2000) in Spain also
showed that the main cause of soil erosion is the uncontrolled transformation of old vineyard plantations
through mechanisation. The resulting soils from land transformation are therefore highly susceptible to
erosion, which reduces the possibilities of water intake and most of the rain is lost as runoff. Land
transformations through the use of farm machines in Suswa catchment could therefore be a probable cause of
gully erosion. Xiubinet al., (2004) in the Chinese Loess Plateau also observed that deforestation and
International Journal of Scientific Research and Innovative Technology ISSN: 2313-3759 Vol. 4 No. 5; May 2017
65
cultivation exposed the fragile soil to water erosion. Xinet al., (2010) in the Chinese Loess Plateau indicated
that there was a critical threshold in the relationship among sediment yield and vegetation cover. Therefore
vegetation cover may provide the thresholds required for runoff and soil erosion, which is the case in the
Suswa Catchment.Katsurada (2007) in Kendu escarpment, Nyanza province observed a similar relationship
with areas with scarce vegetation and steep slope and sedimentation causing rapid runoff and severe gully
erosion.
Results Omutoet al., (2011) in Somalia, showed that about one-third of the country was degraded
because of the loss of vegetation cover, topsoil loss and decline of soil moisture. Overgrazing, excessive
cutting of trees, and poor agronomic practices in agricultural areas were the primary drivers of land
degradation. Maeda et al., (2010) in Taita Hills indicated that if current trends persist, it is expected that
agricultural areas will occupy 60% of the study area by 2030, similar to Suswa. These changes will result in
accelerated soil erosion. In addition, agricultural expansion will inevitably result in increased soil erosion due
to changes in vegetation cover which is the case in the study area. From the projections a significant increase
in built up area, agriculture and bareland and a decrease of grassland will characterize the coming ten year
period (2020) in the Suswa Catchment.
Liavogaet al., (2014) Yattasub county observed that there was a decline in the area under traditional
crops and an increase in introduced crops mainly maize and beans. Results also showed an increase in bare
land and a decrease in shrubland. In the study area, bareland increased by 103.31% between 1985 and 2011
also. According to Liavoga et al (2014), the observed trends have implications for food security and dwindling
land resources, which could be the case in the study area. Campbell et al., (2005) in Loitokitok, Kajiado
District, observed that rain fed agriculture and livestock herding were the main causes of land use and land
cover change in the area. As a result the ability of the Maasai herders to maintain their long-established
livestock system has been curtailed and many now combine livestock and cropping. Ayuyoet al., (2014)
showed that changes in land use and land cover had occurred in the Mau forest complex, resulting in the
reduction of forest cover. This is because the local community depend on forest products for farming,
building materials, wood fuel, and charcoal burning which could be the case in the study area. Njokaet al.,
(2003) in Lambwe Valley, southwestern Kenya observed that human settlement caused land-use and cover
changes, resulting in a scramble for the remaining high potential land, which could be the case in the study
area. Mundiaet al., (2009) in the Masai Mara Ecosystem, showed that agricultural expansion and an increase
in cattle and sheep lead to diminishing pastures.
Similar observations to this study were made by Nyarikiet al., (2009) in the Masai-Mara Ecosystem, in
which patterns of land-use have changed from nomadic pastoralism to sedentary pastoralism, agropastoralism,
and in some cases pure cultivation. These trends have adversely affected livestock production and diminished
grazing areas. According to Maitimaet al., (2009) land use changes in East Africa have transformed land cover
to farmlands, grazing lands, human settlements and urban centres at the expense of natural vegetation. These
changes are associated with deforestation and land degradation. Similar results to this study were observed by
Gachene, et al., (2015) in Lower Tana River Forest Complex in which forest cover decreased from about
7185.52 km2 in 1995 to 1852.6 km
2 in 2004, a 74.2 per cent loss. The area under agriculture increased
considerably by almost ten times, from 243.87 km2 in 1995 to 2346.65 km
2 ha in 2004, a 862.25% gain. This
means that most of the area previously under forest was lost to cultivation. Opening the forest for cultivation
and degradation is still continuing at an alarming rate, which is also the case in the study area. In Suswa,
shrubland decreased by 26.18% in 2000 indicating a change to other land uses.

International Journal of Scientific Research and Innovative Technology ISSN: 2313-3759 Vol. 4 No. 5; May 2017
66
From the projections a significant increase in built up area, agriculture and bareland and a decrease of
grassland will characterize the coming ten year period in the Suswa Catchment. This scenario is likely to lead
to further gully erosion activity as more areas will be opened up for agriculture and settlement. With no
interventions, gully erosion activity will continue resulting in a threat to livelihoods in terms of agriculture and
livestock grazing. Scenarios of land-use and land cover change therefore help to explore possible futures and
can generate indicators of ecological sustainability or of vulnerability of ecosystems and people. Projections
can be used as an early warning system for the effects of future land use changes and pin-point hot-spots that
are priority areas for in depth analysis (Verburg, 2006).
5. Conclusions and Recommendations
From this study it was observed that the overall change of built up area, shrubland, bareland,
agriculture expanded in 26 years (1985-2011), while grassland decreased during this time period. Grassland
was converted to built up area, shrubland, bareland and agriculture during this time period. An increase in
built up area, bareland and agriculture and a decrease in grassland are therefore likely to be driversof gully
erosion which is affecting the area. From the projections, a significant increase in built up area, agriculture and
bareland and a decrease of grassland will characterize the coming ten year period (2020) in the Suswa
Catchment. If the present scenario continues, then gully erosion activity will continue. Therefore there is a
need for comprehensive land use planning in Suswa Catchment for effective rehabilitation of the gully and
also reduce threats to livelihoods. Monitoring of actual soil erosion should be done under different land uses
systems in the study area in order to determine hot spots for effective land use strategies. An assessment of
invasive alien plant species and their impacts on soil degradation should also be done.

International Journal of Scientific Research and Innovative Technology ISSN: 2313-3759 Vol. 4 No. 5; May 2017
67
Plate 1: Gully in Suswa Catchment

International Journal of Scientific Research and Innovative Technology ISSN: 2313-3759 Vol. 4 No. 5; May 2017
68
Fig 1: Map showing Suswa, Narok County
Fig 2: Land use and land Fig 3: Land use and land Fig 4: Land use and land
cover change (1985) cover change (2000) cover change (2011)

International Journal of Scientific Research and Innovative Technology ISSN: 2313-3759 Vol. 4 No. 5; May 2017
69
Table 1:Land use/cover change in Suswa Catchment (1985-2011)
Landuse
/cover
1985
Area
(km2)
% 2000 %
Area
(km2)
2011 %
Area
(km2)
Change
1985-2000
Built up
Area
0.77 0.19 0.91 0.24 1.30 0.32 +18.1
Agricultural 1.00 0.24 15.33 3.81 23.16 5.67 +1433
Shrubland 231.11 57.43 170.61 42.42 237.8 59.12 -26.18
BarelandGrassland
1.21
166.71
0.30
41.45
12.44
188.92
3.11
46.97
2.46
137.6
0.61
34.23
+928
+13.3
Table 2:Chi-Square goodness of fit test for land use/cover changes in Suswa Catchment between 1985 and
2011
Landuse
/cover
1985
%
2000
%
2011
%
Chi-square test
x2
df
p
Built up
Area
0.19 0.24 0.32 0.0 2 1.0
Agricultural 0.24 3.81 5.76 3.455 2 0.178
Shrubland 57.43 42.42 59.12 3.278 2 0.194
BarelandGrassland
0.30
41.45
3.11
46.97
0.61
34.23
3.0
2.082
2
2
0.223
0.353
Fig 5: Ten year projections (2020) of built up area change in Suswa Catchment
International Journal of Scientific Research and Innovative Technology ISSN: 2313-3759 Vol. 4 No. 5; May 2017
70
Figure 6: Ten year projections (2020) of agricultural change in Suswa Catchment
Figure 7: Ten year projections (2020) of shrubland change in Suswa Catchment

International Journal of Scientific Research and Innovative Technology ISSN: 2313-3759 Vol. 4 No. 5; May 2017
71
Figure 8: Ten year projections (2020) of bareland change in Suswa Catchment
Figure 9: Ten year projections (2020) of grassland change in Suswa Catchment
Reference
Ayuyo I.O &Sweta L. (2014).Land Cover and Land Use Mapping and Change Detection of Mau Complex in
Kenya Using Geospatial Technology. International Journal of Science and Research (IJSR), 3, 2319-7064.
Brink A.B & Eva H. Douglas. (2009). Monitoring 25 years of land cover change dynamics in Africa: A
sample based remote sensing approach. Applied Geography, 29, 501–512.
Campbell D. J., LuschD.P., SmuckerT. A., &Wangui E. E. (2005). Multiple Methods in the Study of Driving
Forces of Land Use and Land Cover Change: A Case Study of SE Kajiado District, Kenya. Human Ecology,
33, DOI : 10.1007/s10745-005-8210-y
Casasnovas J. A., Ramos Martínez., Concepción M & Hernández D.García. (2009).Effects of land-use
changes in vegetation cover and sidewall erosion in a gully head of the Penedès region (northeast Spain).
Earth Surface Processes and Landforms, 34, 1927–1937.
International Journal of Scientific Research and Innovative Technology ISSN: 2313-3759 Vol. 4 No. 5; May 2017
72
Casasnovas Jose A A., Marto A. & Bosch I.S. (2000). Impact assessment of changes in land use/conservation
practices on soil erosion in the PenedeAsAnoia vineyard region (NE Spain). Soil & Tillage Research, 57, 101-
106.
ChecheW., Githae E.W., Omondi S.F. & Magana A.M. (2015).An inventory and assessment of exotic and
native plant species diversity in the Kenyan rangelands: Case study of Narok North Sub-County. Journal of
Ecology and the Natural Environment, Vol. 7, 238-246.
Duvert C., Gratiot N., Evrard O., Navratil O., Némery J., Prat C. &Esteves Michel (2010). Drivers of erosion
and suspended sediment transport in three headwater catchments of the Mexican Central Highlands.
Geomorphology,123, 243–256.
Farhan Y., Zregat D. &Nawaiseh S. (2014). Assessing the Influence of Physical Factors on Spatial Soil
Erosion Risk in Northern Jordan.Journal of American Science, 10. 29-39
Gachene C.K.K., Kathumo V.M., Okello J.J., Ngige M &Miruka M. (2015). The Disappearing Forest: A Case
Study of Trends in Land Use and Land Cover Changes of the Threatened Lower Tana River Forest Complex,
Coastal Kenya. In Z. Khalif.CKKGachene. P. Gicheru. D.M Mburu& C.G. Gakahu, (Eds).Sustainable
LandManagement in Drylands of Kenya (pp.1-12).Nairobi, Kenya, United Nations Development
Programme.
Garede N.M. &Minale A.S. (2014).Land Use/Cover Dynamics in Ribb Watershed, North Western
Ethiopia.Journal of Natural Sciences Research, 4, 9-16.
Katsurada Y. (2007). Regional scaled mapping of gully erosion sensitivity in WesternKenya. African Journal
of Environmental Science and Technology, 1, 049-052.
Klaus D.P., Sebastian O.,Johannes B. R., Irene M. & Ali A.H. (2014). Soil erosion in gully catchments
affected by land-levelling measures in the Souss Basin, Morocco, analysed by rainfall simulation and UAV
remote sensing data. Catena,113, 24–40.
Lambin E.F., Geist H. & Lepers E. (2003). Dynamics of Land –Use and Land-Cover Change in Tropical
Regions. Annu. Rev. Environ. Resour, 28, 205–41.
Leh M., Bajwa S and Chaubey I ( 2011). Impact of Land Use Change on Erosion Risk: AnIntegrated Remote
Sensing, Geographic Information System and Modeling Methodology. Land degradation & development,DOI:
10.1002/ldr.1137.
Liavoga B. A., Kathumo V.M., Onwonga R.N, Karuku G.N. &Onyango C.M. (2014). Assessment of Trends
in Land Cover and Crop Type Change Over Two Decades in Yatta Sub County, Kenya.International Journal
of Agriculture, Forestry and Fisheries, 2, 46-52.
MaedaEiji., Petri K.E. P., Mika S. & Barnaby J.F. Clark. (2010). Potential impacts of agricultural expansion
and climate change on soil erosion in the Eastern Arc Mountains of Kenya.Geomorphology, 123, 279–289.
Maitima J.M., Mugatha S.M., Reid R.S., Gachimbi L.N., Majule A., Lyaruu H., Pomery D., Mathai S.
&Mugisha S.(2009). The linkages between land use change, land degradation and biodiversity across East
Africa. African Journal of Environmental Science and Technology, 3, 310-325.
Murillo J. F. M., Vicente M.L., Poesen J. &Sinoga D.R. (2011).Modelling the effects of land use changes on
runoff and soil erosion in two Mediterranean catchments with active gullies (South of Spain).Landform
Analysis, 17, 99–104.
Mundia C.N. & Murayama Y. (2009). Analysis of Land Use/Cover Changes and Animal Population
Dynamics in a Wildlife Sanctuary in East Africa. Remote Sens,1, 952-970.

International Journal of Scientific Research and Innovative Technology ISSN: 2313-3759 Vol. 4 No. 5; May 2017
73
National Environment Management Authority-NEMA.(2011). KENYA State of theEnvironment and Outlook
2010.Nairobi.
National Environment Management Authority-NEMA. (2009). Narok District Environment Action Plan 2009-
2013. Nairobi.
Nagendra H., Munroe D.K. &Southworth J. (2004). From pattern to process: landscape fragmentation and the
analysis of land use/land cover change. Agriculture, Ecosystems and Environment,101,111–115.
Njoka T.J., Muriuki G.W., Reid R.S. &Nyariki D.M. (2003). The Use of SociologicalMethods to Assess
Land-use Change: A Case Study of Lambwe Valley, Kenya. J. Soc. Sci,7, 181-185.
Nyariki D. M., Mwang’ombe A.W.& Thompson D.M. (2009). Land-Use Change and Livestock Production
Challenges in an Integrated System: The Masai-Mara Ecosystem, Kenya. J Hum Ecol, 26, 163-173.
Okoti M., Keya G. A., Esilaba A. O. &Cheruiyot H. (2006). Indigenous Technical Knowledge for Resource
Monitoring in Northern Kenya. J. Hum. Ecol, 20,183-189.
Omuto C.T., Z. Balint Z. &Alim M. S. (2011). A framework for National Assessment of Land Degradation in
the Drylands: A Case Study of Somalia. Land degradation & development,DOI: 10.1002/ldr.1151.
PathakP., Wani S.P &Sudi R. (2006).Gully Control in SAT Watersheds.SAT eJournal, 2, 1-23.
Sakthivel R., Jawahar Raj N., Pugazhendi., Rajendran S. &Alagappamoses A (2011).Remote Sensing and
GIS for Soil Erosion Prone areas Assessment: A case study from Kalrayan hills, Part of Eastern Ghats, Tamil
Nadu, India. Archives of Applied Science Research,3,369-376 .
Shahrivar& Christopher, T.B.S. (2012). The effects of soil physical characteristics ongully erosion
development in Kohgiloyeh& Boyer Ahmad Province, Iran. Advances in Environmental Biology,6, 367-405.
Sulieman H. M. & Ahmed A.G. M(2013). Monitoring changes in pastoral resources in eastern Sudan: A
synthesis of remote sensing and local knowledge.Pastoralism: Research, Policy and Practice, 3:22.
Tesfahunegn G.B., Tamene L. &Vlek P. L. G. (2014).Soil Erosion Prediction Using Morgan-Morgan-Finney
Model in a GIS Environment in Northern Ethiopia Catchment.Applied and Environmental Soil Science,
doi.org/10.1155/2014/468751.
Teferi E., Bewket W., Uhlenbrook S. &Wenninger J. (2013).Understanding recent land use and land cover
dynamics in the source region of the Upper Blue Nile, Ethiopia: Spatially explicit statistical modeling of
systematic transitions. Agriculture, Ecosystems and Environment, 165, 98– 117.
Vagen T.G., Winowiecki L. A., Abegaz A. &Hadgu K. M (2013). Landsat-based approaches for mapping of
land degradation prevalence and soil functional properties in Ethiopia.Remote Sensing of Environment, 134,
266–275.
Van-Camp.L., Bujarrabal, B., Gentile, A-R., Jones, R.J.A., Montanarella, L., Olazabal, C.&Selvaradjou, S-
K.(2004). Reports of the Technical Working Groups Establishedunder the Thematic Strategy for Soil
Protection.EUR 21319 EN/2, 872 pp. Office forOfficial Publications of the European Communities,
Luxembourg.
Veblen K. E., Pyke D.A., Aldrige C. L., Casazza M.L., Assal T.J. &Farinha M. A. (2014).Monitoring of
Livestock Grazing Effects on Bureau of Land Management Land.Rangeland Ecology & Management, 67, 68-
77.
Veldkamp A.&Lambin E.F. (2001). Predicting land-use change.Agriculture, Ecosystemsand Environment, 85,
1–6.
Verburg P. H. (2006). Simulating feedbacks in land use and land cover change Models.Landscape
Ecol,21,1171–1183.

International Journal of Scientific Research and Innovative Technology ISSN: 2313-3759 Vol. 4 No. 5; May 2017
74
Wan R. & Yang G. (2007).Influence of Land Use/Cover Change on Storm Runoff —A Case Study of
Xitiaoxi River Basin in Upstream of Taihu Lake Watershed. Chinese Geographical Science,17, 349-356.
Wessels K. J., Prince S. D., Carroll M. & Malherbe Johan (2007). Relevance of Rangeland Degradation in
Semiarid Northeastern South Africa to the Nonequilibrium Theory.Ecological Applications, 17, 815–827.
Xin Z., Yu X. & Lu X. X. (2010). Factors controlling sediment yield in China’s Loess Plateau. Earth Surface
Processes and Landforms,DOI: 10.1002/esp.2109
Xiubin H., Tang K. &Zhang X. (2004). Soil Erosion Dynamics on the ChineseLoess Plateau in the Last
10,000 Years.Mountain Research and Development, 24, 342–347.
Yadav P. K., Kapoor M. &Sarma K. (2012). Land Use Land Cover Mapping, Change Detection and Conflict
Analysis of Nagzira-Navegaon Corridor, Central India Using Geospatial Technology.International Journal of
Remote Sensing and GIS, 1, 90-98.
Yannelli F.A., Tabeni S., Mastrantonio L. E &Vezzani N. (2013). Assessing Degradation of Abandoned
Farmlands for Conservation of the Monte Desert Biome in Argentina, Environmental Management,DOI
10.1007/s00267-013-0176-8.
Copyright © 2022 FDOKUMEN