Land Use and Land Cover Change Detection Study at Pennar River Estuary, Nellore District, Andhra...
9
JoGE (2014) 1-9 © STM Journals 2014. All Rights Reserved Page 1 Journal of Geotechnical Engineering Volume 1 Issue 1 www.stmjournals.com Land Use and Land Cover Change Detection Study at Pennar River Estuary, Nellore District, Andhra Pradesh, Southeast Coast of India G. Sreenivasulu*, N. Jayaraju, T. Lakshmi Prasad Yogi Vemana University, Kadapa-516003, AP, India Abstract Coastal zones are the most valuable and dynamic places on Earth. A large portion of the world’s population has habitat coastal areas. Fertile coastal low lands, abundant marine resources, water transportation, aesthetic beauty and intrinsic values have long motivated coastal habitation. Two-thirds of the world’s fish catch, and many marine species, depend on coastal wetlands for their survival. The process of coastal morpho- dynamics has resulted in environmental problems such as coastal wetland loss, habitat degradation, water pollution and destruction of forest vegetation as well as host of other issues. In the study, remote sensing (RS) and geographic information system (GIS) were used in order to study land use/land cover changes by using three years (2005, 2007 and 2012) satellite images IRS-P6, LISS-III data of Pennar river estuary in Nellore District, Andhra Pradesh, India. Land use/land cover maps for three years (2005, 2007 and 2012) were prepared. It is observed that the important land use features like coastal wetlands, agricultural crop and plantation lands, waste lands or uncultivated lands, swamps and water bodies and its changes. The result shows a rapid growth in agricultural lands from 44.20 (2005) to 57.45% (2012) due to the annual rainfall. The water bodies and wetlands decreased from 34.53 (2005) to 21.10% (2012). Built-up lands increased 0.17% between 2005 and 2012. Uncultivated or waste lands and swamps got decreased. The reason for these changes can be attributed to urbanization, industrialization and modern civilization. Keywords: Change detection study, coastal zones, remote sensing, GIS *Author for Correspondence E-mail: [email protected] INTRODUCTION Periodic and precise change detection of Earth’s surface features is extremely important for understanding relationships and interactions between human and natural phenomena in order to promote better decision making. Remote sensing data are primary source extensively used for change detection in recent decades on meso scales. Many change detection techniques have been developed. Geographic information system (GIS) and remote sensing can play an important role in the management of coastal resources [1]. Remote sensing data represent a powerful tool to understand the dynamics of the coastal processes where the images allow a synoptic view of the area and establish relationship between coastal environment and vegetation on a multi temporal basis [2, 3]. In addition to an integrated data base, a geographic information system (GIS) combines different data sets and simultaneously facilities spatial and temporal analysis [4]. It also permits the establishment of relationship between various coastal environments that all allow for a more comprehensive, accurate and easier interpretation of coastal environmental features. Change detection is the process of identifying differences in the state of an object or phenomenon by observing it at different times [5, 6]. Information about land use change is necessary to update land cover maps and for effective management and planning of the resources for sustainable development [7]. The basic premise in using remote sensing data for
-
Upload
yogivemanauniversity -
Category
Documents
-
view
3 -
download
0
Transcript of Land Use and Land Cover Change Detection Study at Pennar River Estuary, Nellore District, Andhra...
JoGE (2014) 1-9 © STM Journals 2014. All Rights Reserved Page 1
Journal of Geotechnical Engineering
Volume 1 Issue 1
www.stmjournals.com
Land Use and Land Cover Change Detection Study at
Pennar River Estuary, Nellore District, Andhra Pradesh,
Southeast Coast of India
G. Sreenivasulu*, N. Jayaraju, T. Lakshmi Prasad
Yogi Vemana University, Kadapa-516003, AP, India
Abstract Coastal zones are the most valuable and dynamic places on Earth. A large portion of the
world’s population has habitat coastal areas. Fertile coastal low lands, abundant marine
resources, water transportation, aesthetic beauty and intrinsic values have long
motivated coastal habitation. Two-thirds of the world’s fish catch, and many marine
species, depend on coastal wetlands for their survival. The process of coastal morpho-dynamics has resulted in environmental problems such as coastal wetland loss, habitat
degradation, water pollution and destruction of forest vegetation as well as host of other
issues. In the study, remote sensing (RS) and geographic information system (GIS) were used in order to study land use/land cover changes by using three years (2005, 2007 and
2012) satellite images IRS-P6, LISS-III data of Pennar river estuary in Nellore District, Andhra Pradesh, India. Land use/land cover maps for three years (2005, 2007 and 2012)
were prepared. It is observed that the important land use features like coastal wetlands,
agricultural crop and plantation lands, waste lands or uncultivated lands, swamps and water bodies and its changes. The result shows a rapid growth in agricultural lands from
44.20 (2005) to 57.45% (2012) due to the annual rainfall. The water bodies and wetlands
decreased from 34.53 (2005) to 21.10% (2012). Built-up lands increased 0.17% between
2005 and 2012. Uncultivated or waste lands and swamps got decreased. The reason for
these changes can be attributed to urbanization, industrialization and modern civilization.
Keywords: Change detection study, coastal zones, remote sensing, GIS
*Author for Correspondence E-mail: [email protected]
INTRODUCTION Periodic and precise change detection of
Earth’s surface features is extremely important
for understanding relationships and interactions
between human and natural phenomena in
order to promote better decision making.
Remote sensing data are primary source
extensively used for change detection in recent
decades on meso scales. Many change
detection techniques have been developed.
Geographic information system (GIS) and
remote sensing can play an important role in
the management of coastal resources [1].
Remote sensing data represent a powerful tool
to understand the dynamics of the coastal
processes where the images allow a synoptic
view of the area and establish relationship
between coastal environment and vegetation on
a multi temporal basis [2, 3]. In addition to an
integrated data base, a geographic information
system (GIS) combines different data sets and
simultaneously facilities spatial and temporal
analysis [4]. It also permits the establishment of
relationship between various coastal
environments that all allow for a more
comprehensive, accurate and easier
interpretation of coastal environmental features.
Change detection is the process of identifying
differences in the state of an object or
phenomenon by observing it at different times
[5, 6]. Information about land use change is
necessary to update land cover maps and for
effective management and planning of the
resources for sustainable development [7]. The
basic premise in using remote sensing data for
Land Use and Land Cover Change Detection Study Sreenivasulu et al. __________________________________________________________________________________________
JoGE(2014) 1-9 © STM Journals 2014. All Rights Reserved Page 2
change detection is that the process can identify
change between two or more dates that is
uncharacteristic of normal variation [8].
Preparing landscape characteristics maps can
help in change detection. Understanding
landscape patterns, changes and interactions
between human activities and natural
phenomenon are essential for proper land
management and decision improvement [9].
Today, Earth resources satellites data are very
applicable and useful for land use/cover change
detection studies.
In this paper, an attempt is made to know the
changes like increasing and decreasing of land
use and land cover feature classes of Pennar
river estuary by using remote sensing and GIS
techniques. Pennar river estuary has attracted
people from other places of Nellore coast over
the past years due to its abundant marine
resources, water transportation, aesthetic beauty
and intrinsic values have long motivated coastal
habitation. Aquaculture has mostly been carried
out at a few places by making ponds. The area
is spread along the east coast of Nellore district
and is densely populated. As a result, the
population growth and the process of coastal
morpho-dynamics have resulted in
environmental problems such as coastal
wetland loss, habitat degradation, water
pollution and destruction of forest vegetation as
well as host of other issues. The objective of
the study is to know the changing pattern of
land use and land cover of Pennar river estuary,
Nellore coast, Andhra Pradesh, southeast coast
of India by using remote sensing satellite data
and GIS, as a tool is the main objective of this
paper and to identify the governing factors
behind these changes.
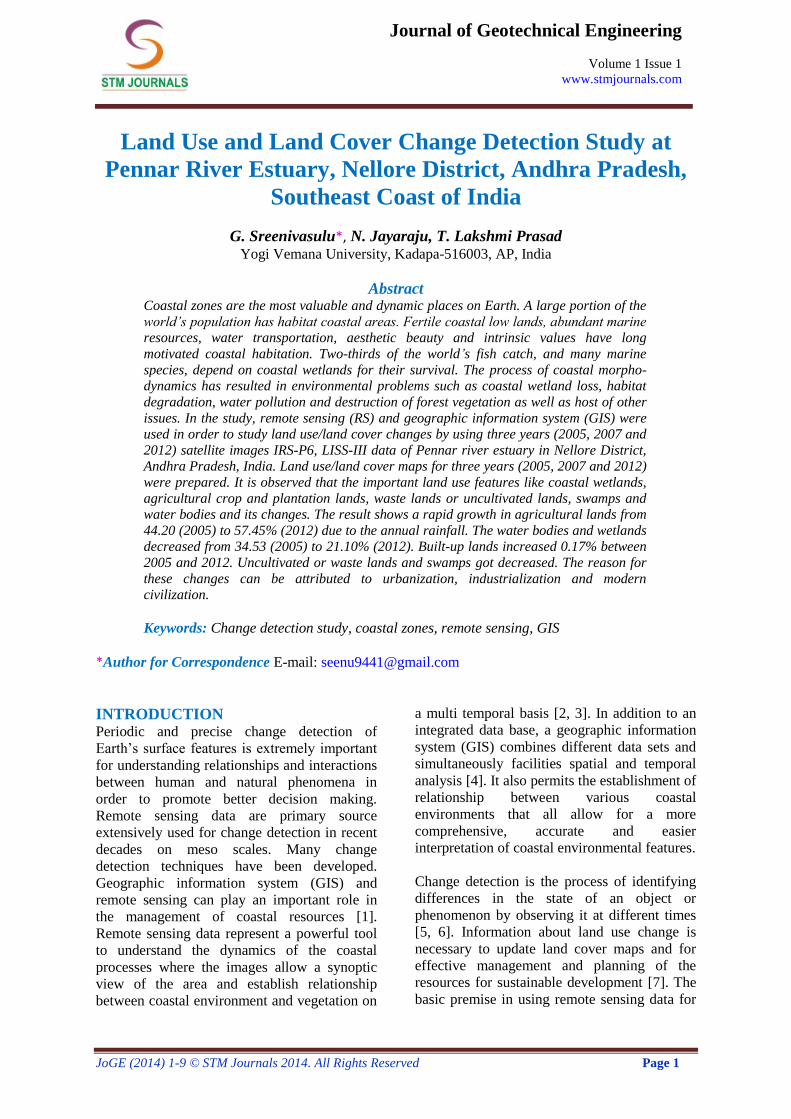
STUDY AREA The study area is geographically located in
eastern part of Nellore district, lying between
latitude 14°30’24” – 14°38’38” N and
longitude 80°04’18”– 80°13’08”E in Andhra
Pradesh, falling in Survey of India toposheet
No: 66B02 (Figure 1). The total area covered is
approximately 177.54 km2. The study area
comprises the entire area sprawling of river
Pennar. The density of population is 182 km2.
The eastern portion of the study area is fairly
fertile and prosperous. The sandy coastal belt
extends from the sea for 5 to 6 km into the
interior. Average annual rainfall in the study
area is 1041 mm and the average maximum and
minimum temperatures are 39.6 and 20 °C
respectively.
Fig. 1: Location Map of Study Area.

Journal of Geotechnical Engineering
Volume 1, Issue 1
__________________________________________________________________________________________
JoGE (2014) 1-9 © STM Journals 2014. All Rights Reserved Page 3
Data Used
Geocoded false color composite scene of IRS-
P6 LISS III data on 1:50,000 scale (year 2005,
2007 and 2012 respectively) coinciding with
Survey of India (SOI) toposheet No. 66B02 is
used in the present study. Annual rainfall data
for the period of 2005–2012 has been used.
METHODOLOGY The work is done by visual image
interpretation. The following steps are involved
in the classification procedure. Preprocessing
has involved scanning and digitization of
Survey of India toposheets at 1:50000 scale to
serve as the base map [10]. Scanned maps do
not usually contain information as to where the
area represented on the map fits on the surface
of the Earth, for these images have to register
coordinates. To establish the relationship
between an image (row, column) coordinate
system and a map (x, y) coordinate system we
need to align or geo-reference the raster data
(image). Processing has involved application of
various GIS functions and advanced digital
image processing technique including contrast
manipulation, edge enhancement, and image
registered. The images were geometrically
rectified and registered to the same projection
namely, Transverse Mercator WGS 1984 to lay
them over each other [11, 12].
The initial LandSat 2005, 2007 and final 2012
IRS P6 LISS III imageries were subjected to
classification zones. Visual image
interpretation was utilized to classify the
images to different land use categories. In order
to classify the rectified images, six classes were
delineated in the images namely,
cultivated/agricultural lands, built-up lands,
wetlands/water bodies, uncultivated lands,
rivers and swamps. The land use/land cover
maps prepared for the year 2005, 2007 and
2012 are given in Figures 2, 4 and 6,
respectively [13].
Change detection analysis encompasses a broad
range of methods used to identify, describe and
quantity differences between images of the
some scene at different times or under different
conditions many of the tools can be used
independently or in combination or in
combination as part of a change detection
analysis. Change detection menu after a straight
forward approach to measuring changes
between a pair of images that represent a pair
of images that represent on initial stage and
final stage. The change detection statistics for
classification images averages are used for
computing difference map for images [14].
RESULTS AND DISCUSSIONS The objective of this study forms the basis of
all the analysis carried out. The results are
presented in the form of maps, charts and
statistical tables. They include the static,
change and projected land use land cover of
each class. The static land use/land cover
distribution for each study year as derived from
the maps is presented in Table 1.
Table 1: Land Use/Land Cover Distribution (2005, 2007, 2012).
Feature class 2005 2007 2012
Area
(Km2)
% Area
(Km2)
% Area
(Km2)
%
Water bodies 61.30 34.53 51.71 29.13 37.46 21.10
Cultivated/Agricultural land 78.49 44.20 92.56 52.13 102 57.45
Built-up land 5.41 3.05 5.46 3.08 5.71 3.22
Uncultivated land 6.42 3.62 5.39 3.04 3.21 1.81
Rivers 22.68 12.78 19.26 10.85 21.67 12.21
Swamps 3.24 1.83 2.29 1.29 1.93 1.09
Land Use and Land Cover Change Detection Study Sreenivasulu et al. __________________________________________________________________________________________
JoGE(2014) 1-9 © STM Journals 2014. All Rights Reserved Page 4
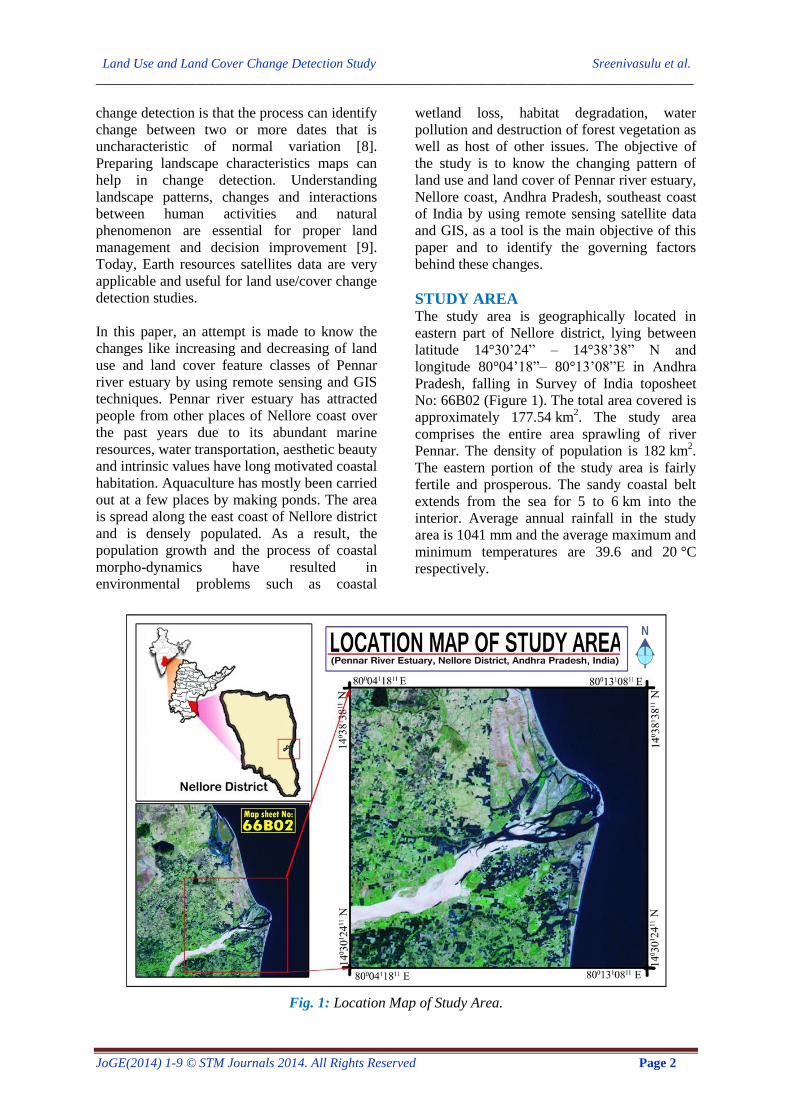
Fig. 2: Land Use/Land Cover Map of Study Area-2005.
The land use/land cover categories and change
detection study of the study area were mapped
using IRS P6 LISS-III data of 1:50,000 scale.
The satellite data was visually interpreted and
after making thorough field checks, the maps
were finalized. The various land use and land
cover classes are interpreted in the study area in
three years, i.e., 2005, 2007 and 2012
respectively. The fallowing features were
interpreted in the study area: they are water
bodies, cultivated/agricultural lands, built-up
land, uncultivated land, rivers and swamps
(Figure 3).
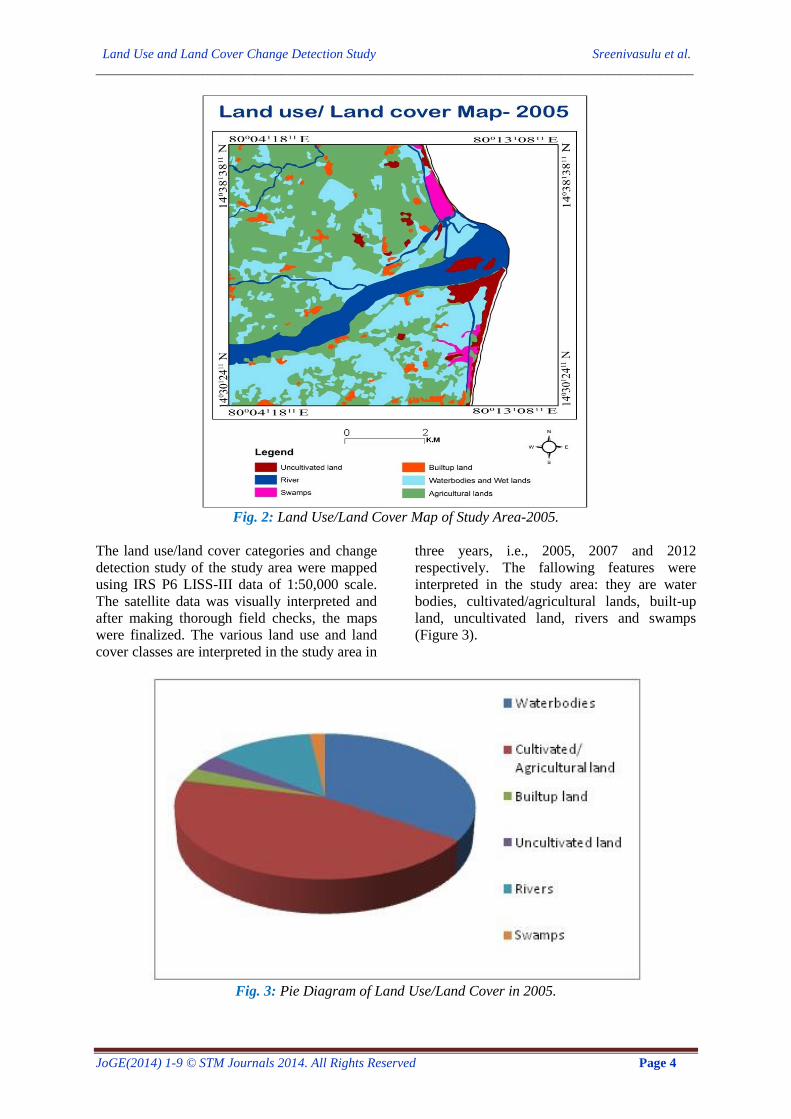
Fig. 3: Pie Diagram of Land Use/Land Cover in 2005.
Journal of Geotechnical Engineering
Volume 1, Issue 1
__________________________________________________________________________________________
JoGE (2014) 1-9 © STM Journals 2014. All Rights Reserved Page 5
In 2005, agricultural lands/cultivated lands are
crop lands under crop. In the study area, crop
lands have wet cultivation and dry cultivation.
It occupies the highest class with 44.20%
(78.49 km2) of the total class, taking up more
than half of the total area. The water bodies
include both natural and man-made water
features namely lakes/tanks and reservoirs
occupy 34.53% (61.30 km2) of total area. Built-
up land occupied 3.05% (5.41 km2). It
composed of areas of intensive with much of
the land covered by structures. Included in this
category are cities, towns, villages, industrial
and commercial complexes and institutions.
Lands, which do not support any vegetation are
known as uncultivated lands or waste lands.
Barren rocky, salt-affected land, land with and
without scrub, sandy area, sheet rocks and
stony regions are included in this category.
Uncultivated land occupies 3.62% (6.42 km2).
Pennar river and its streams occupy 12.78%
(22.68 km2) of total area. Swamps are tract of
wet, spongy land, often having a growth of
certain types of trees and other vegetation, but
unfit for cultivation. It occupies 1.83%
(3.24 km2) of the area.
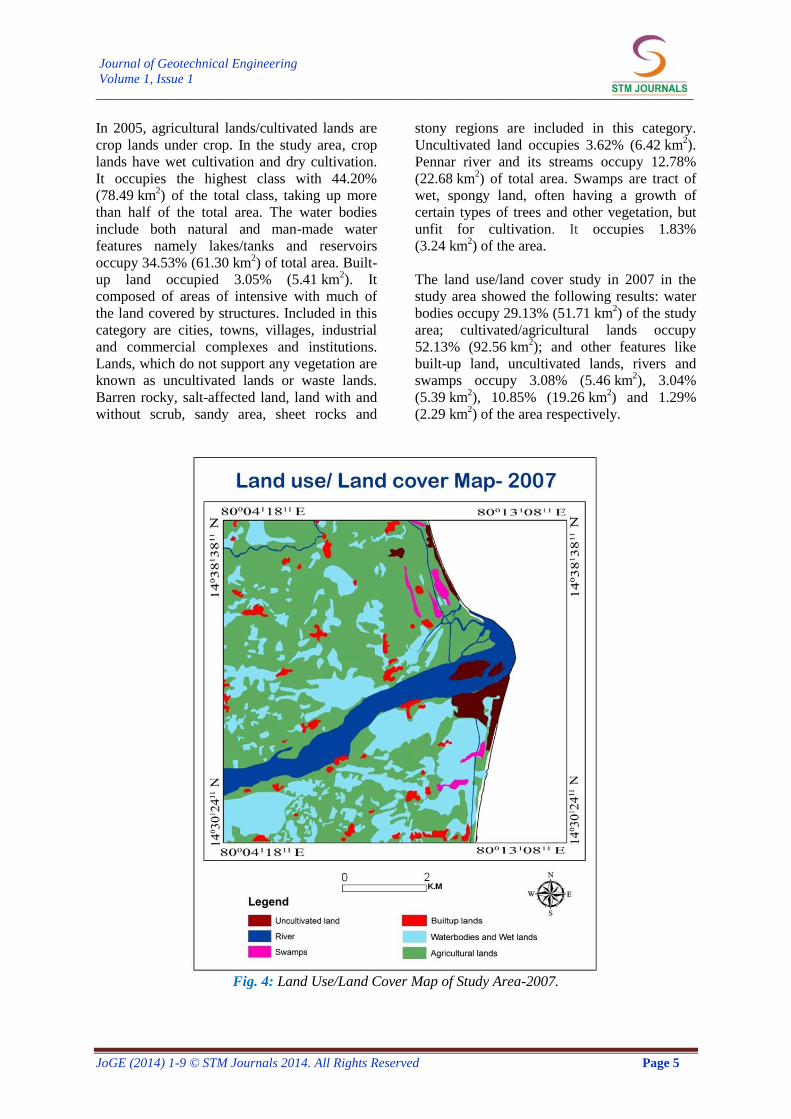
The land use/land cover study in 2007 in the
study area showed the following results: water
bodies occupy 29.13% (51.71 km2) of the study
area; cultivated/agricultural lands occupy
52.13% (92.56 km2); and other features like
built-up land, uncultivated lands, rivers and
swamps occupy 3.08% (5.46 km2), 3.04%
(5.39 km2), 10.85% (19.26 km
2) and 1.29%
(2.29 km2) of the area respectively.
Fig. 4: Land Use/Land Cover Map of Study Area-2007.
Land Use and Land Cover Change Detection Study Sreenivasulu et al. __________________________________________________________________________________________
JoGE(2014) 1-9 © STM Journals 2014. All Rights Reserved Page 6
Fig. 5: Pie Diagram of Land Use/Land Cover in 2007.
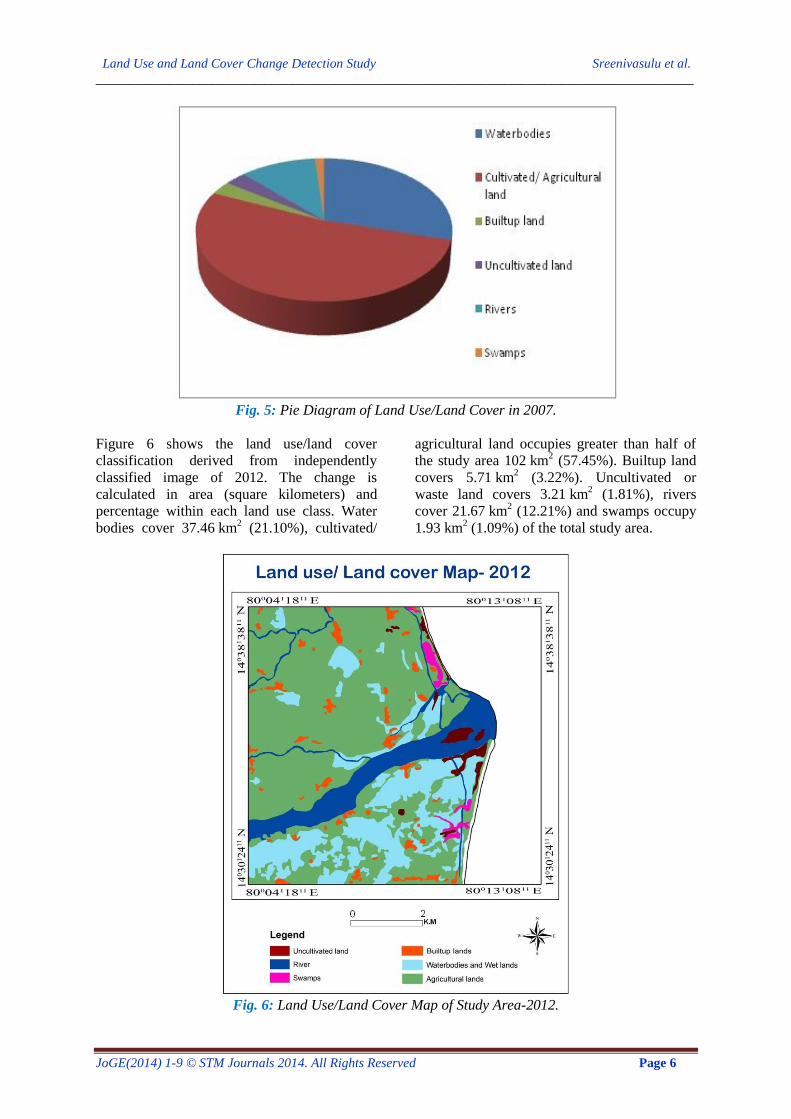
Figure 6 shows the land use/land cover
classification derived from independently
classified image of 2012. The change is
calculated in area (square kilometers) and
percentage within each land use class. Water
bodies cover 37.46 km2 (21.10%), cultivated/
agricultural land occupies greater than half of
the study area 102 km2 (57.45%). Builtup land
covers 5.71 km2 (3.22%). Uncultivated or
waste land covers 3.21 km2 (1.81%), rivers
cover 21.67 km2 (12.21%) and swamps occupy
1.93 km2 (1.09%) of the total study area.
Fig. 6: Land Use/Land Cover Map of Study Area-2012.
Journal of Geotechnical Engineering
Volume 1, Issue 1
__________________________________________________________________________________________
JoGE (2014) 1-9 © STM Journals 2014. All Rights Reserved Page 7
Fig. 7: Pie Diagram of Land Use/Land Cover in 2012.
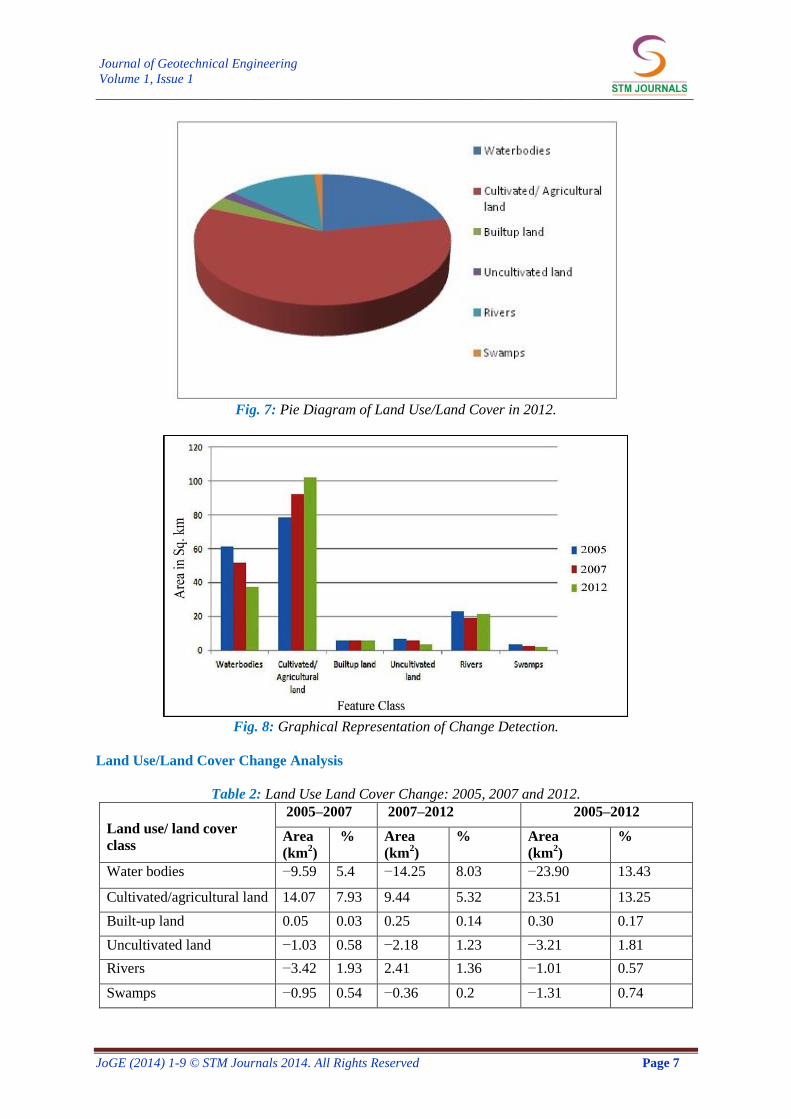
Fig. 8: Graphical Representation of Change Detection.
Land Use/Land Cover Change Analysis
Table 2: Land Use Land Cover Change: 2005, 2007 and 2012.
Land use/ land cover
class
2005–2007 2007–2012 2005–2012
Area
(km2)
% Area
(km2)
% Area
(km2)
%
Water bodies −9.59 5.4 −14.25 8.03 −23.90 13.43
Cultivated/agricultural land 14.07 7.93 9.44 5.32 23.51 13.25
Built-up land 0.05 0.03 0.25 0.14 0.30 0.17
Uncultivated land −1.03 0.58 −2.18 1.23 −3.21 1.81
Rivers −3.42 1.93 2.41 1.36 −1.01 0.57
Swamps −0.95 0.54 −0.36 0.2 −1.31 0.74
Land Use and Land Cover Change Detection Study Sreenivasulu et al. __________________________________________________________________________________________
JoGE (2014) 1-9 © STM Journals 2014. All Rights Reserved Page 8
From Table 2, there seems to be a negative
change in the feature class. The reduction in
water bodies 5.4% (9.57 km2), uncultivated
land 0.58% (1.03 km2), rivers 1.93% (3.42 km
2)
and swamps between 2005 and 2007.
Subsequently, cultivated/agricultural land and
built-up land both increased by 7.93%
(14.07 km2) and 0.03% (0.05 km
2) respectively.
Between the years 2007 and 2012, there was a
reduction in water bodies 8.03% (14.25 km2),
uncultivated land 1.23% (2.18 km2) and
swamps 0.2% (0.36 km2) of the area. The
features of cultivated/agricultural lands, built-
up land and rivers were increased 5.32%
(9.44 km2), 0.14% (0.25 km
2) and 1.36%
(2.41 km2) of the area respectively.
The reduction in water bodies 13.43%
(23.90 km2), at the same cultivated/agricultural
lands increased 13.25% (23.51 km2) from the
year 2005 to 2012, were also seen the rainfall
data (Table 3) which is the main source for
decreasing of wet land/water bodies. It was
seen that decreasing trends of rainfall is directly
useful for increasing the crop area by the
decreasing of water bodies and wet lands.
Width of river also decreased 0.57%
(1.01 km2). Cultivated lands increased, swamp
and uncultivated lands decreased 0.74 and
1.81% respectively. Built-up land increased
0.17% due to its abundant marine resources,
water transportation, aesthetic beauty and
intrinsic values have long motivated coastal
habitation.
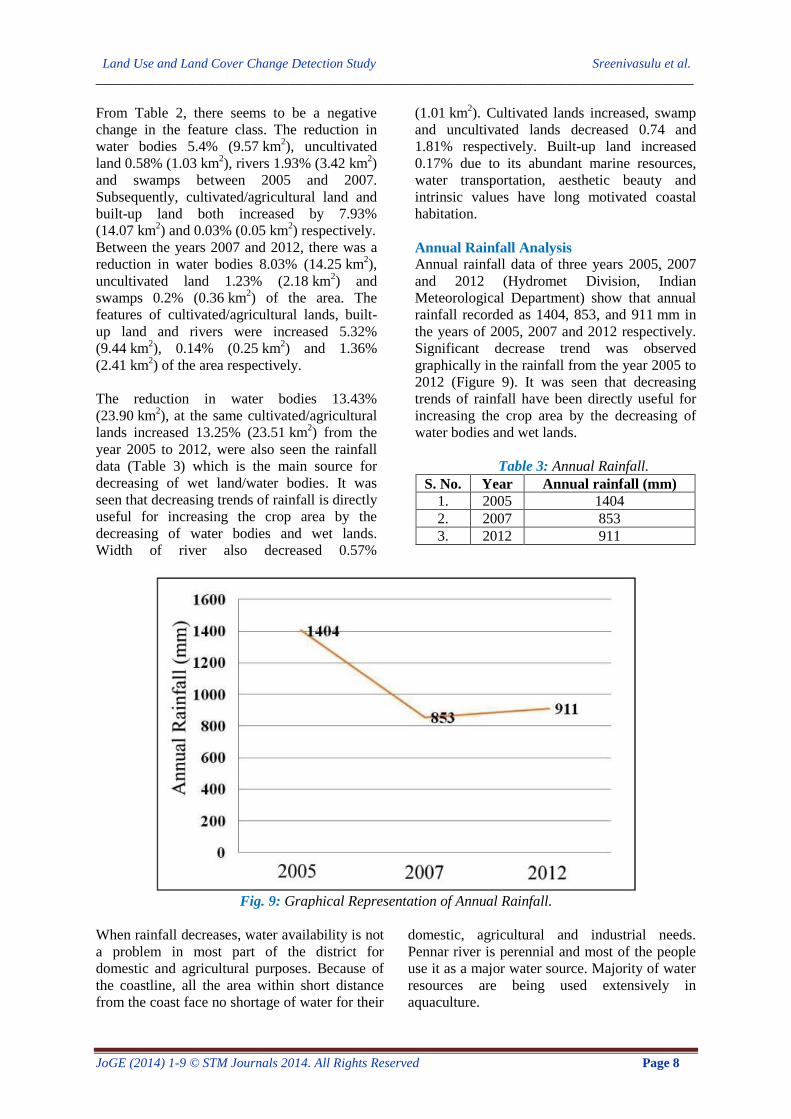
Annual Rainfall Analysis
Annual rainfall data of three years 2005, 2007
and 2012 (Hydromet Division, Indian
Meteorological Department) show that annual
rainfall recorded as 1404, 853, and 911 mm in
the years of 2005, 2007 and 2012 respectively.
Significant decrease trend was observed
graphically in the rainfall from the year 2005 to
2012 (Figure 9). It was seen that decreasing
trends of rainfall have been directly useful for
increasing the crop area by the decreasing of
water bodies and wet lands.
Table 3: Annual Rainfall.
S. No. Year Annual rainfall (mm)
1. 2005 1404
2. 2007 853
3. 2012 911
Fig. 9: Graphical Representation of Annual Rainfall.
When rainfall decreases, water availability is not
a problem in most part of the district for
domestic and agricultural purposes. Because of
the coastline, all the area within short distance
from the coast face no shortage of water for their
domestic, agricultural and industrial needs.
Pennar river is perennial and most of the people
use it as a major water source. Majority of water
resources are being used extensively in
aquaculture.
Journal of Geotechnical Engineering
Volume 1, Issue 1
__________________________________________________________________________________________
JoGE (2014) 1-9 © STM Journals 2014. All Rights Reserved Page 9
CONCLUSIONS Looking at the results of this study, change
detection techniques using temporal remote
sensing data provide detailed information for
detecting and assessing land cover and land use
dynamics. Different change detection techniques
were applied to monitor the changes. The change
analysis was based on three years data (2005,
2007 and 2012). The reduction in water bodies
13.43% (23.90 km2), at the same time cultivated/
agricultural lands increased 13.25% (23.51 km2)
from the year 2005 to 2012, were also seen the
rainfall data (Table 3) which is the main source
for decreasing of wet land/water bodies, It was
seen that decreasing trend of rainfall has been
directly useful for increasing the crop area by the
decreasing of water bodies and wet lands. Width
of river also decreased 0.57% (1.01 km2).
Cultivated lands increased, swamp and
uncultivated lands decreased 0.74 and 1.81%
respectively. Built-up land increased 0.17% due
to its abundant marine resources, water
transportation, aesthetic beauty and intrinsic
values have long motivated coastal habitation.
ACKNOWLEDGMENTS G. Sreenivasulu thanks the Department of
Science and Technology, Government of India,
for the financial assistance through INSPIRE
Fellowship. The authors thank Hydromet
Division, Indian Meteorological Department, for
providing the rainfall data required for the
analyses.
REFERENCES 1. Twamasi Yaw, Coleman Tommy. Remote
sensing and GIS in coastal zone management.
Surveying Technical. 2006.
2. Yagoub MM, Giridhar Reddy K. Monitoring
coastal zone land use and land cover changes
of Abhu Dhabi using remote sensing. Journal
of Indian Society of Remote Sensing. 2006; 34:
57–68p.
3. Shalaby A, Tateishi R. Remote sensing and
GIS for mapping and monitoring land cover
and land-use changes in the Northwestern
coastal zone of Egypt. Appl Geogr. 2007; 27:
28–41p.
4. Kurt Fedra, Enrico Fedi. GIS technology and
spatial analysis in coastal zone management.
EEZ Technology. 1998; 3: 171–9p.
5. Bruzzone L, Fernandez Prieto. An adaptive
parcel-based technique for unsupervised
change detection. Int. J. Remote Sensing.
2000; 21: 817–22p.
6. Yadava PK, Monish K, Kiranmay S. Land use
land cover mapping, change detection and
conflict analysis of Nagira-Navegaon corridor,
Central India, using geospatial technology, Int.
J. Remote Sensing GIS. 2012; 1: 90–8p.
7. Alphan H. Land use changes and urbanization
in Adana, Turkey. Land Degradation and
Development. 2003; 14: 575–86p.
8. Shalaby A, Gad A. Urban sprawl impact
assessment on the fertile agricultural land of
Egypt using Remote Sensing and Digital soil
database, case study: Qalibiya Governorate.
US- Egypt, Workshop on Space Technology
and Geoinformation for Sustainable Development, Cairo, Egypt. 2010; 14–7p.
9. Prakasam C. Land use and land cover change
detection through remote sensing approach: A
case study of Kodaikanal taluk, Tamilnadu.
Int. J. of Geomatics and Geosciences. 2010; 1:
150–8p.
10. Kotoky P, Dutta MK, Borath GC. Changes in
landuse landcover along the Dhansiri river
channel, Assam – A remote sensing and GIS
approach. Journal Geological Society of India. 2012; 79: 61–8p.
11. Ruchar J, Mangesh V, Sharad D, et al.
Monitoring changes in land use land cover of
Yamuna riverbed in Delhi: A multi temporal
analysis. Int. J. Remote Sensing. 2011; 32:
1947–9558p.
12. Prabaharan S, Srinivasa Raju K, Lakshumanan
C, et al. Remote sensing and GIS application
on change detection study in coastal zone
using multi temporal satellite data. Int. J.
Geomatics Geosciences. 2010; 1: 159–66p.
13. Jayaraju N, Abduallah Kahan J. Land use
planning from parts of south India using
remote sensing and GIS: Implications to
natural resources assessment. Advances in Soil
Classification. 2011; 371–2p.
14. Rahdary V, Soffianian A, Moleki Naifasdai S,
et al. Land use and land cover change
detection of Moutehi wildlife refuge using
remotely sensed data and geographical
information system, World Applied Science Journal. 2008; 3: 113–8p.