Understanding the role of land cover / land use nexus in ...
45
Understanding the role of land cover / land use nexus in malaria transmission under changing socio - economic climate in Myanmar Tatiana Loboda, Kathleen Stewart, Julie Silva (UMD) Mark Carroll (SSAI/GSFC) Myaing Nyunt, Chris Plowe, Poe Poe Aung (DGHI)
-
Upload
khangminh22 -
Category
Documents
-
view
1 -
download
0
Transcript of Understanding the role of land cover / land use nexus in ...

Understanding the role of land cover / land use nexus in malaria transmission
under changing socio-economic climate in Myanmar
Tatiana Loboda, Kathleen Stewart, Julie Silva (UMD)Mark Carroll (SSAI/GSFC)
Myaing Nyunt, Chris Plowe, Poe Poe Aung (DGHI)


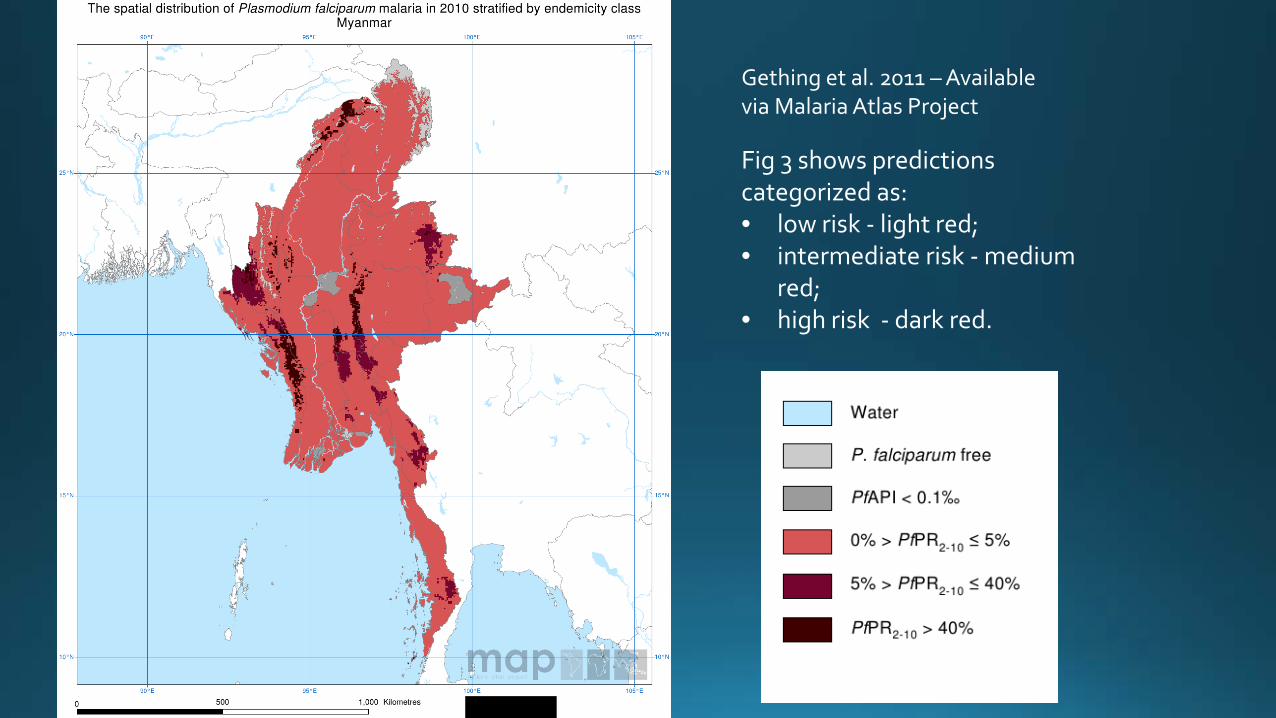
Gething et al. 2011 – Available via Malaria Atlas Project
Fig 3 shows predictions categorized as: • low risk - light red; • intermediate risk - medium
red;• high risk - dark red.


P. falciparum
Source: pixnio.com Source: http://www.saburchill.com/ans02/chapters/chap013.html
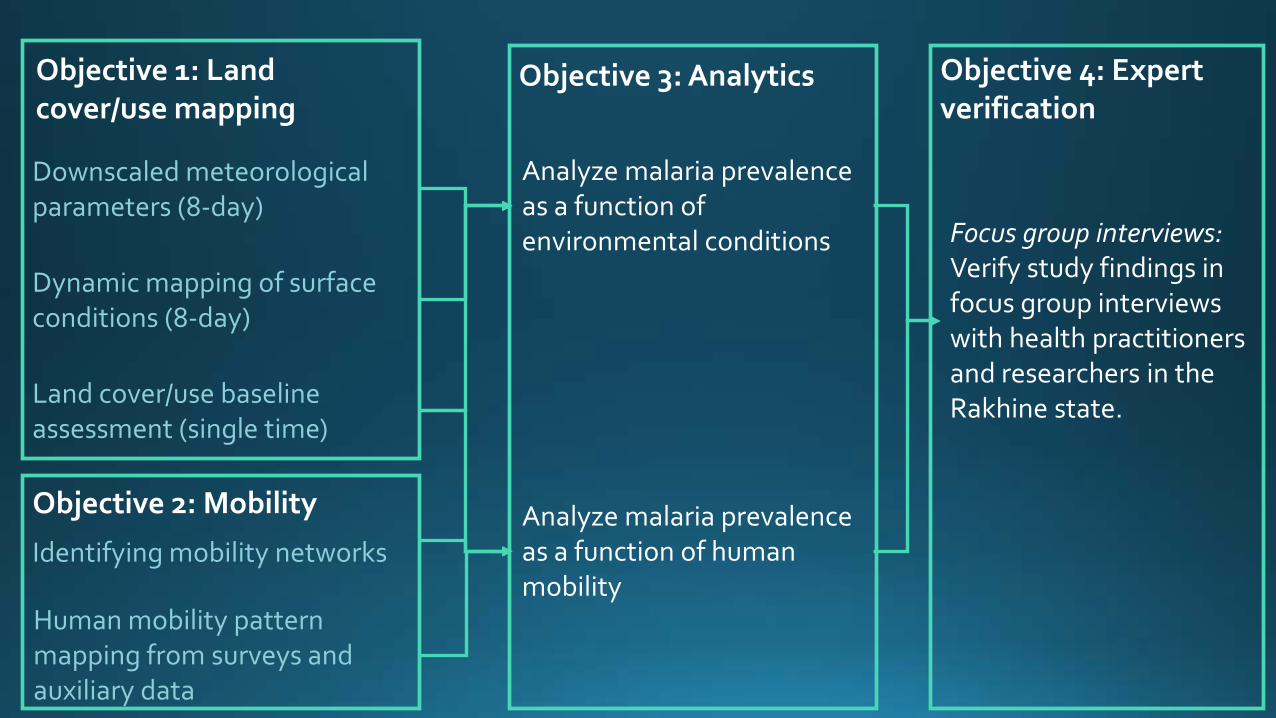
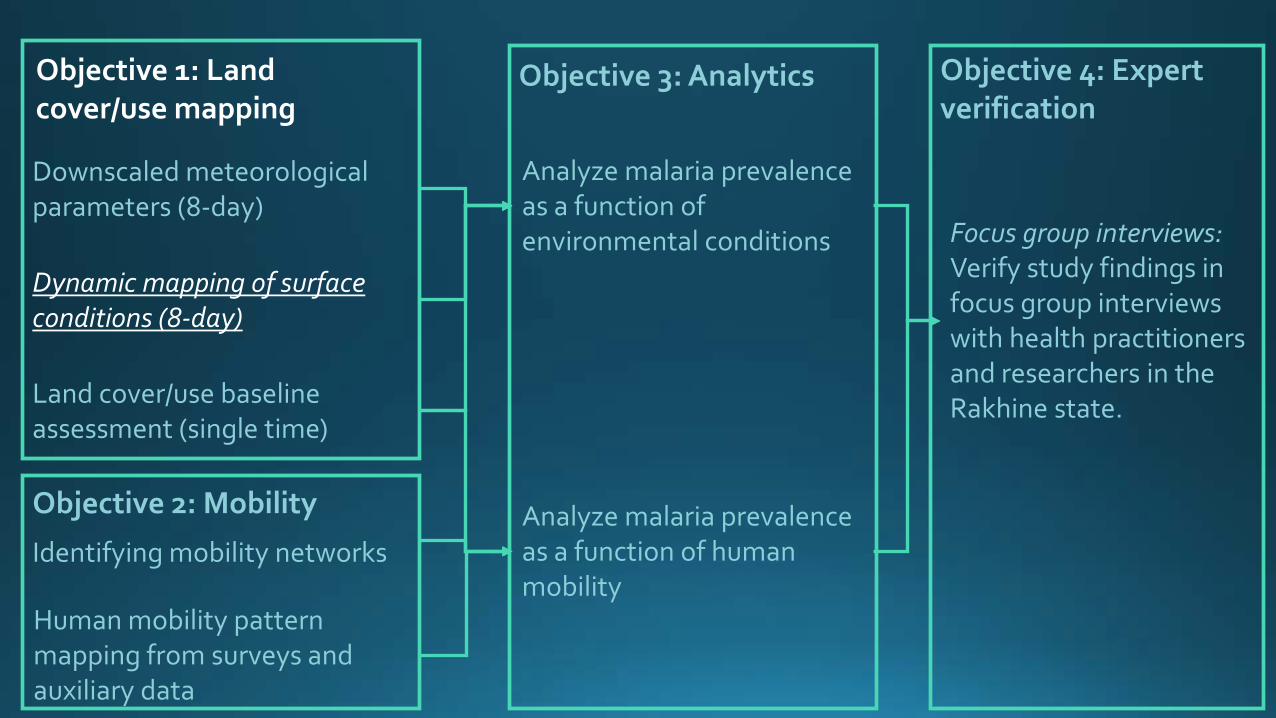
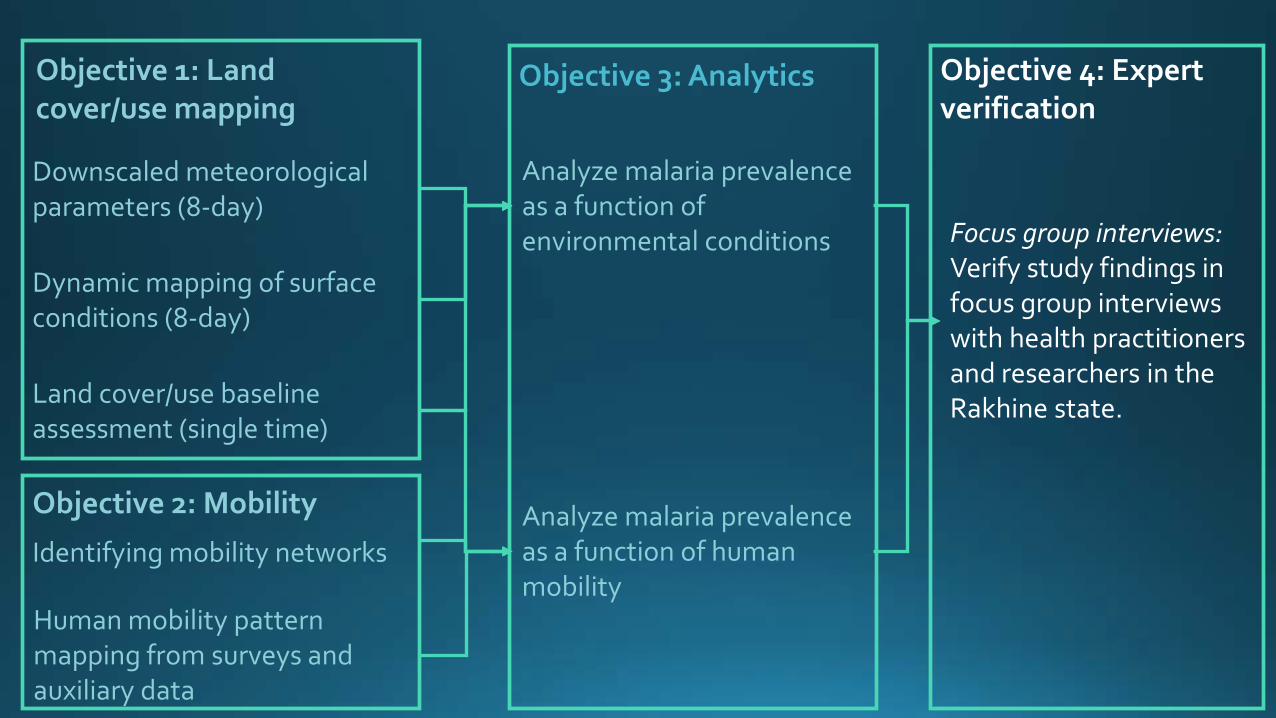
Land cover/use baseline assessment (single time)
Human mobility pattern mapping from surveys and auxiliary data
Downscaled meteorological parameters (8-day)
Analyze malaria prevalence as a function of environmental conditions
Analyze malaria prevalence as a function of human mobility
Focus group interviews:Verify study findings in focus group interviews with health practitioners and researchers in the Rakhine state.
Dynamic mapping of surface conditions (8-day)
Identifying mobility networks
Objective 1: Land cover/use mapping
Objective 2: Mobility
Objective 3: Analytics Objective 4: Expert verification
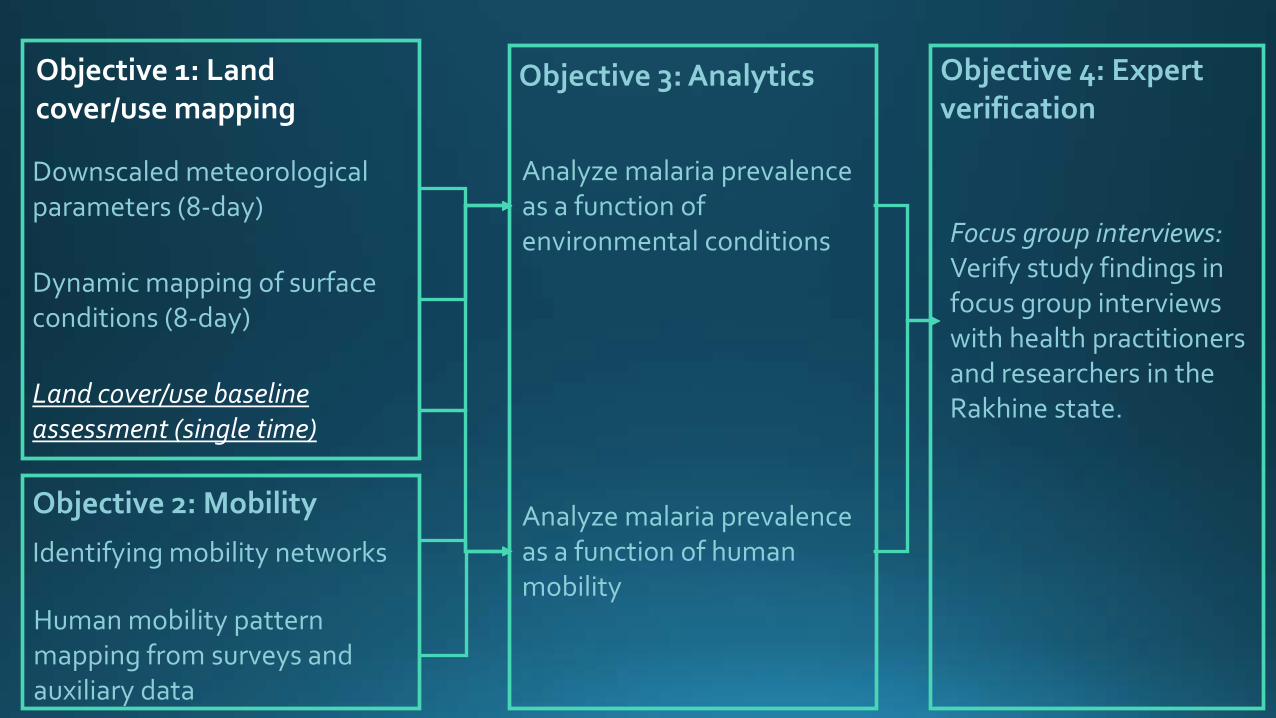

Processing and analysis grid• Common grid: ½˚ longitude x
½˚ latitude projected into UTM zone 46
• Optimizes raster images at fine resolution (1 – 2 m) and moderate resolution (30 m)

VHR Panchromatic (left) and Multispectral (right) data for Rakhine
587 Multispec scenes557 Pan scenes
• Very High Resolution (VHR): WorldView @ 1 – 2 m pixel
• > 1,100 scenes over 2010 –2017
• Able to ortho-rectify and convert to TOA reflectance all images in ~12 hours on 10 virtual machines

Sample mosaic in Rakhine before (left) and after (right) adjustment
• A geolocation problem (a mismatch in the geoid)• TOA reflectance (right) normalization of sensor /solar geometry effects

Prod Acc% User Acc%Water 71.79 100Crop 79.17 79.17Trees 100 88.14Non-tree&bare 63.95 98.21Built 9.09 3.85Cloud&shadow 100 58.62Overall Acc = 79.7Kappa Coefficient = 0.73


Random Forests for classifying water in Rakhine near Ann:
Classification results of model with number of trees = 200, and max features = log2(n features)
Pixels incorrectly classified as water are scattered throughout the image in yellow, west of the identified river
Heavy growth and shadows from riparian vegetation hinder the model’s ability to identify some portions of small streams
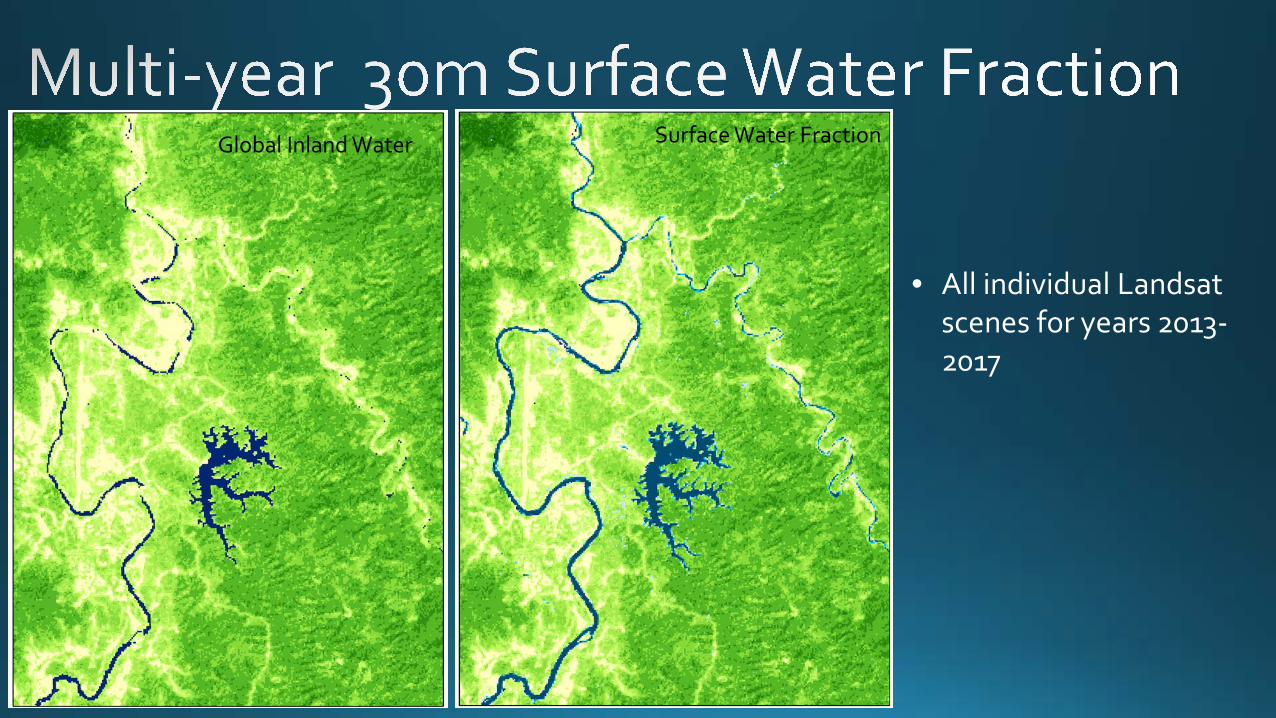
• All individual Landsat scenes for years 2013-2017
Global Inland Water Surface Water Fraction


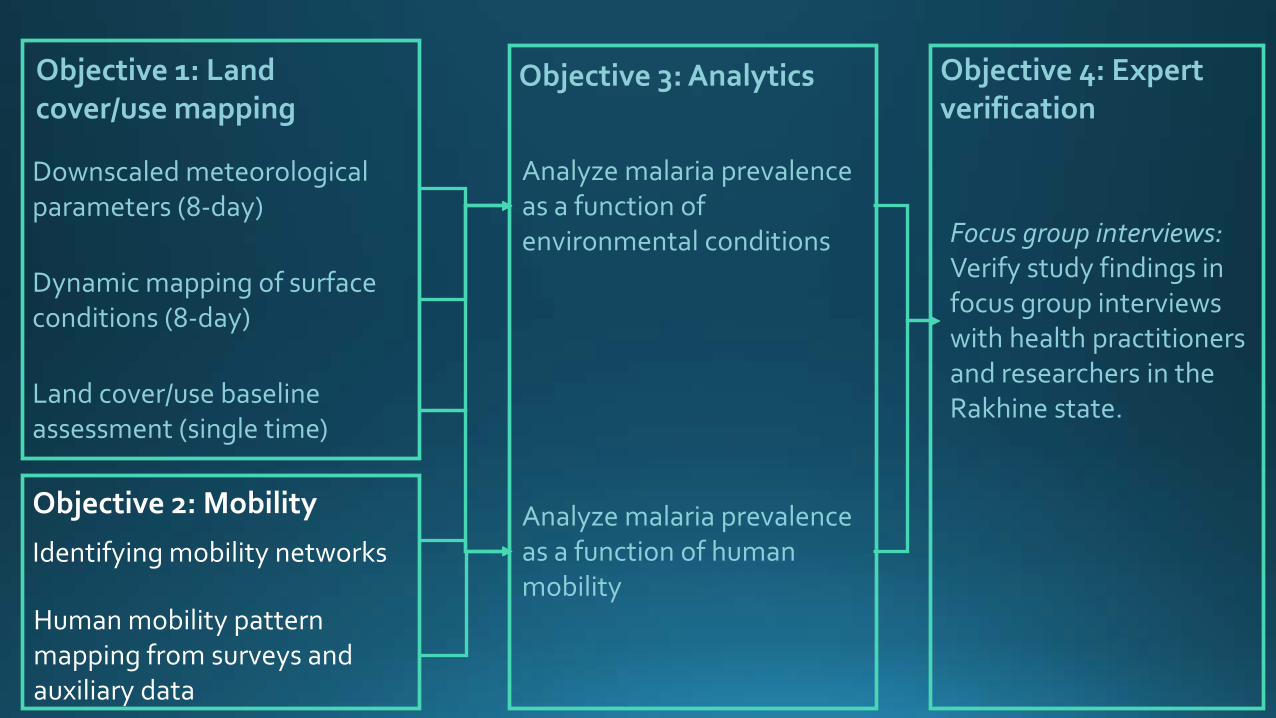
Land cover/use baseline assessment (single time)
Human mobility pattern mapping from surveys and auxiliary data
Downscaled meteorological parameters (8-day)
Analyze malaria prevalence as a function of environmental conditions
Analyze malaria prevalence as a function of human mobility
Focus group interviews:Verify study findings in focus group interviews with health practitioners and researchers in the Rakhine state.
Dynamic mapping of surface conditions (8-day)
Identifying mobility networks
Objective 1: Land cover/use mapping
Objective 2: Mobility
Objective 3: Analytics Objective 4: Expert verification

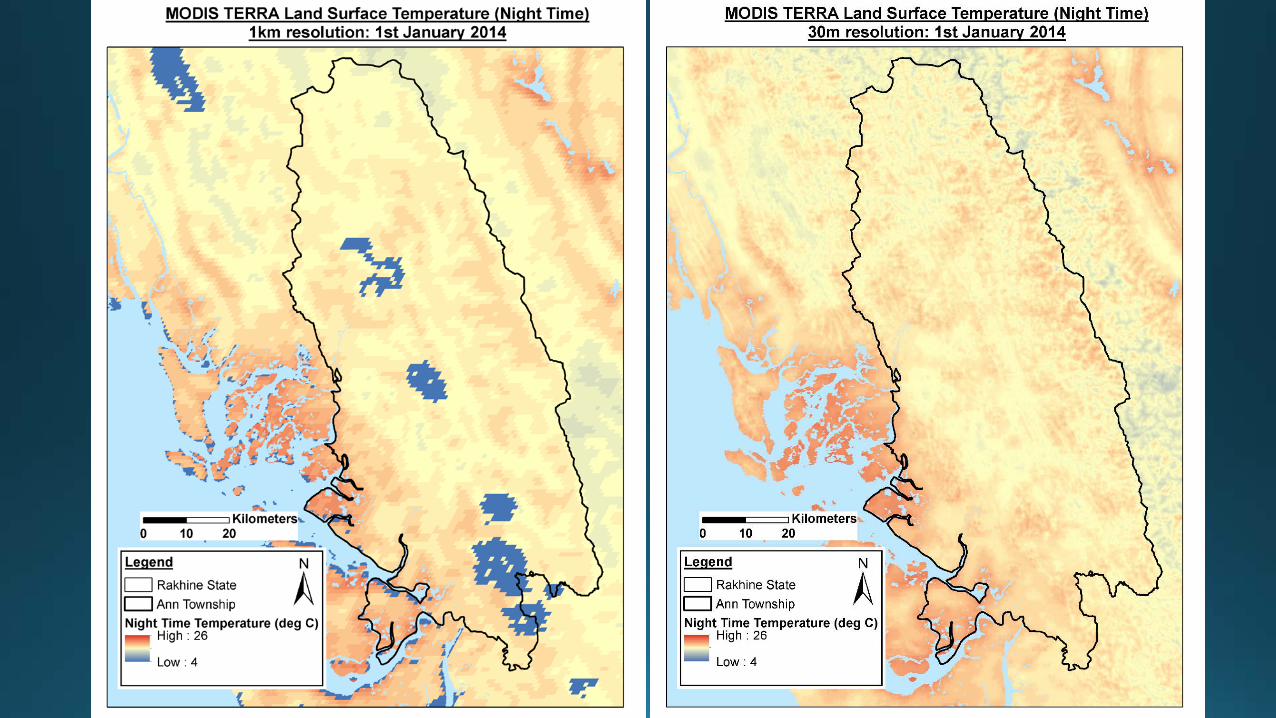
Average day and nighttime temperature of February 7 – 11, 2016
Land cover/use baseline assessment (single time)
Human mobility pattern mapping from surveys and auxiliary data
Downscaled meteorological parameters (8-day)
Analyze malaria prevalence as a function of environmental conditions
Analyze malaria prevalence as a function of human mobility
Focus group interviews:Verify study findings in focus group interviews with health practitioners and researchers in the Rakhine state.
Dynamic mapping of surface conditions (8-day)
Identifying mobility networks
Objective 1: Land cover/use mapping
Objective 2: Mobility
Objective 3: Analytics Objective 4: Expert verification

2013/12/192014/2/52014/2/212014/5/282014/10/32014/11/202015/1/232015/2/242015/10/222015/11/232016/2/112016/3/30
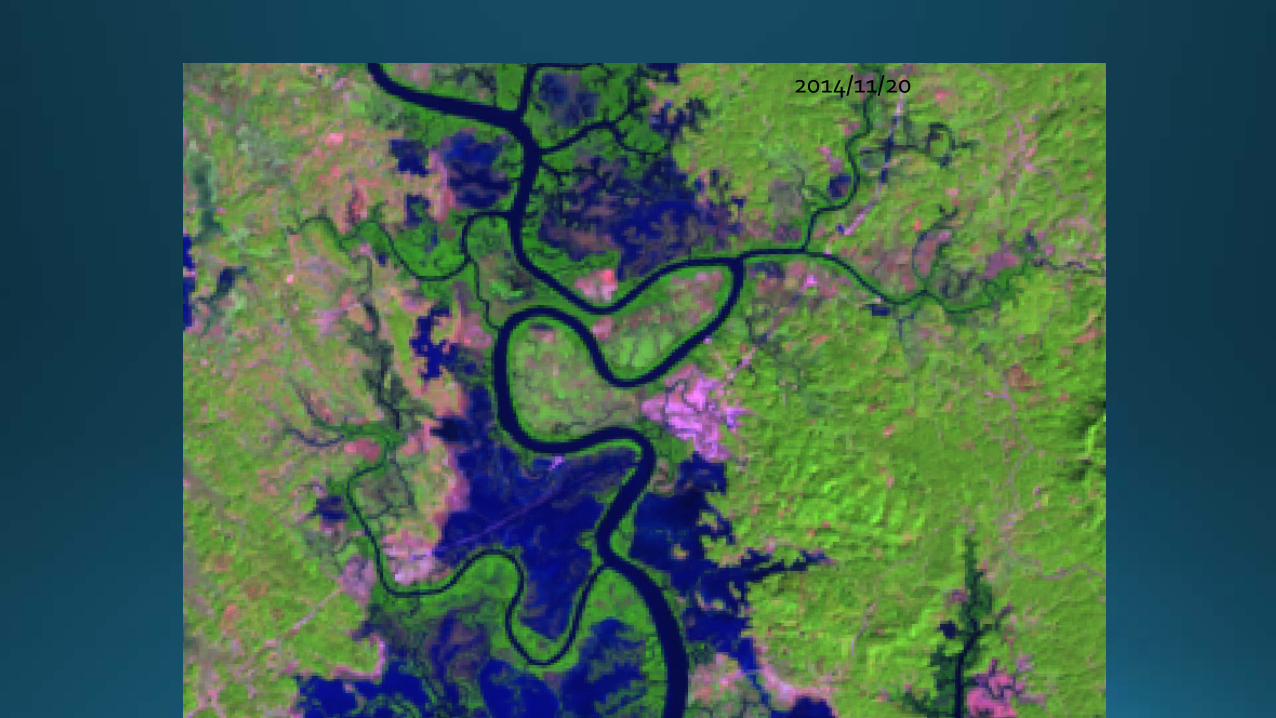
2013/4/232013/11/172014/2/52014/11/20

LCLU class Change components
surface water loss/gain (flooding*)
cropped areas flooding*built-up and impervioussurfaces flooding*
forest & forest patchflooding*, tree loss, vegetation condition (NDVI/EVI)
forest clearanceflooding*, tree gain, vegetation condition (NDVI/EVI)
short vegetation vegetation condition (NDVI/EVI)
bare and sparsely vegetated flooding*
Land cover/use baseline assessment (single time)
Human mobility pattern mapping from surveys and auxiliary data
Downscaled meteorological parameters (8-day)
Analyze malaria prevalence as a function of environmental conditions
Analyze malaria prevalence as a function of human mobility
Focus group interviews:Verify study findings in focus group interviews with health practitioners and researchers in the Rakhine state.
Dynamic mapping of surface conditions (8-day)
Identifying mobility networks
Objective 1: Land cover/use mapping
Objective 2: Mobility
Objective 3: Analytics Objective 4: Expert verification
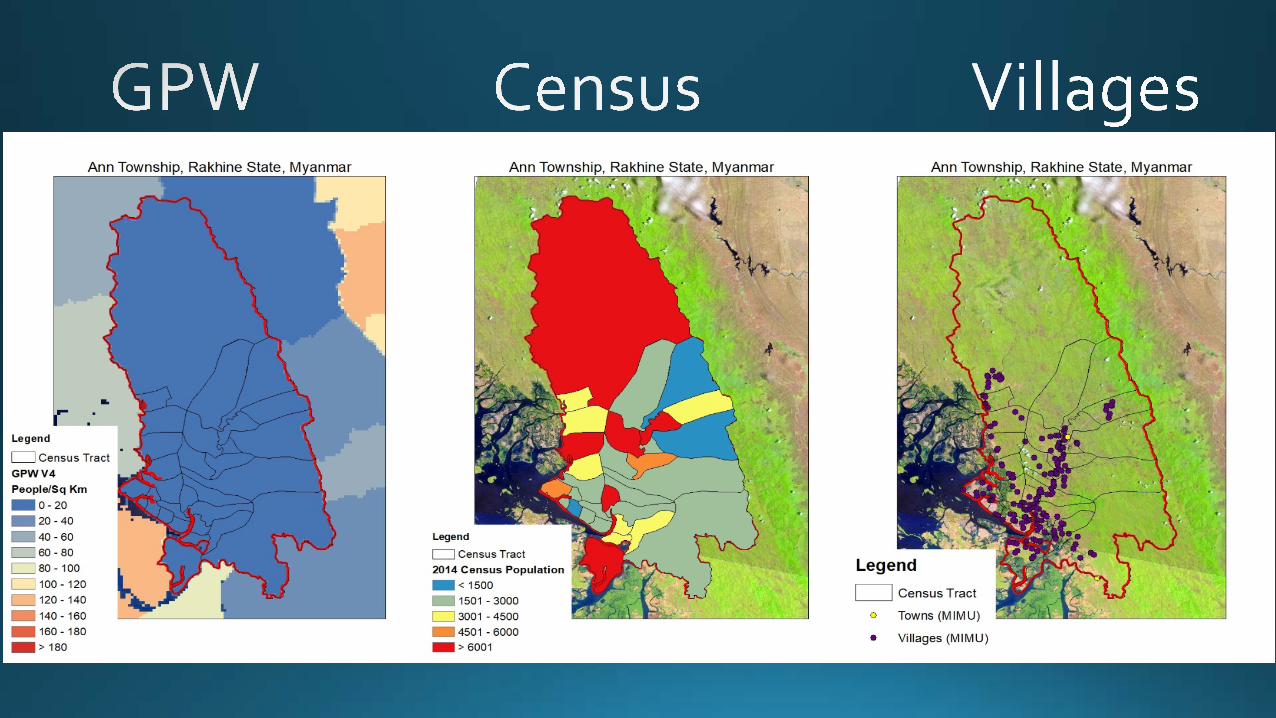

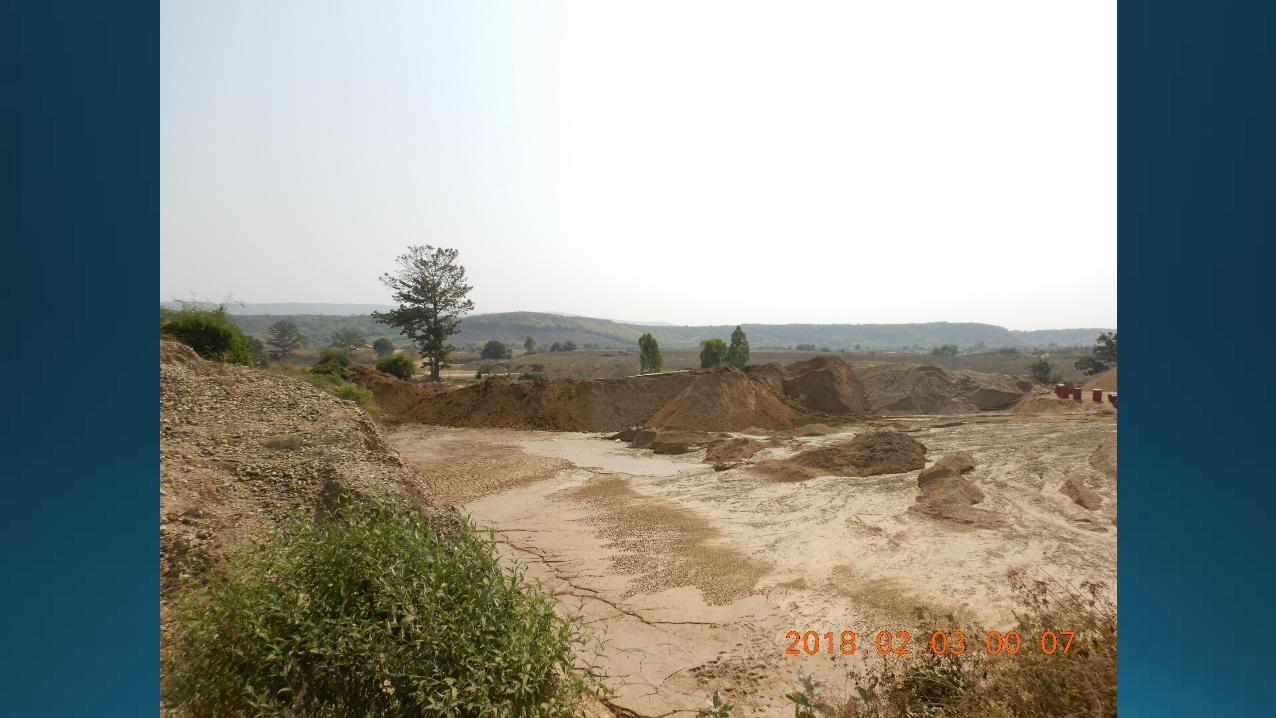
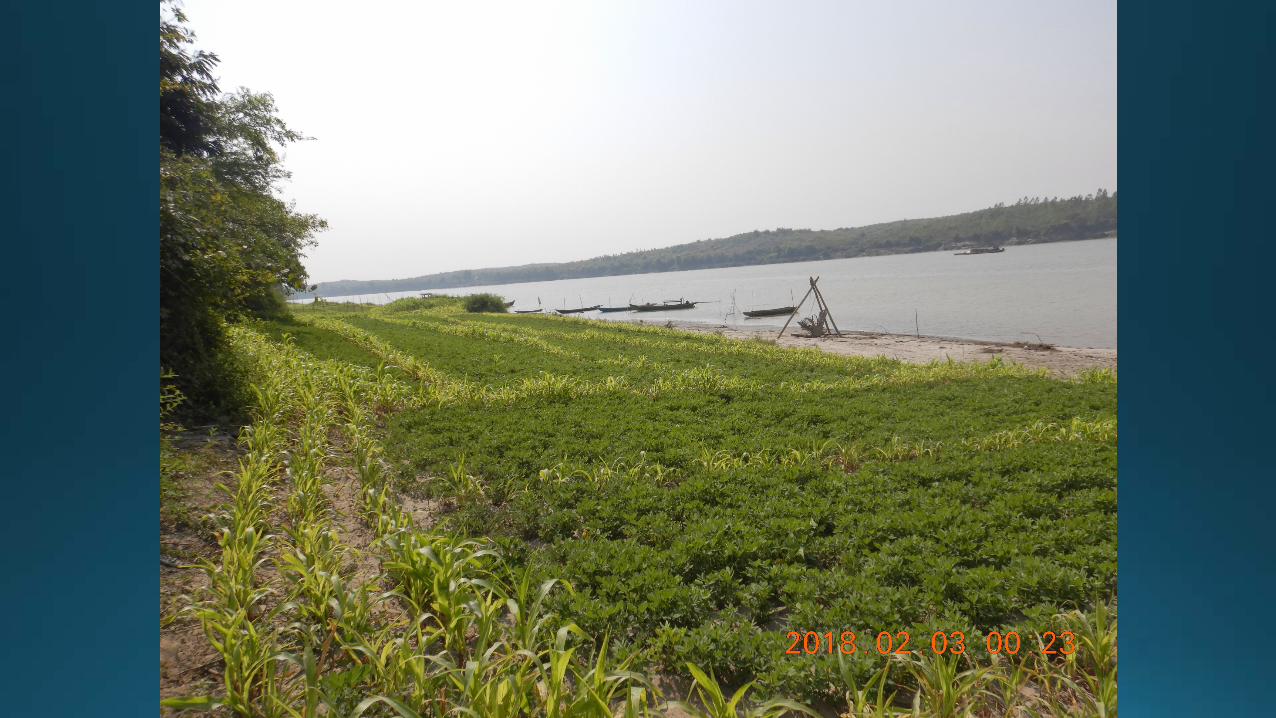
Residential areas in Ann Township

Land cover/use baseline assessment (single time)
Human mobility pattern mapping from surveys and auxiliary data
Downscaled meteorological parameters (8-day)
Analyze malaria prevalence as a function of environmental conditions
Analyze malaria prevalence as a function of human mobility
Focus group interviews:Verify study findings in focus group interviews with health practitioners and researchers in the Rakhine state.
Dynamic mapping of surface conditions (8-day)
Identifying mobility networks
Objective 1: Land cover/use mapping
Objective 2: Mobility
Objective 3: Analytics Objective 4: Expert verification

P. falciparum
Source: pixnio.com Source: http://www.saburchill.com/ans02/chapters/chap013.html
Satellite data+
spatial data+
CRF surveys
Satellite data+
entomological surveys
usPCR testing


0%
2%
4%
6%
8%
10%
12%
14%
16%
18%
20%
1 2 3 4 5
Malaria prevalence (all population)
P. falciparum P. vivax P. mixed (F&V)

0%
2%
4%
6%
8%
10%
12%
14%
16%
18%
20%
1 2 3 4 5
Malaria prevalence (men)
PF prevalence total PV prevalence total
Pmixed (F&V)
0%
2%
4%
6%
8%
10%
12%
14%
16%
18%
20%
1 2 3 4 5
Malaria prevalence (women)
PF prevalence total PV prevalence total
Pmixed (F&V)

0%
5%
10%
15%
20%
25%
30%
35%
40%
1 2 3 4 5
All malaria prevalence by age group (women)
2-10 years 11-17 years 18-40 years >40 years
0%
5%
10%
15%
20%
25%
30%
35%
40%
1 2 3 4 5
All malaria prevalence by age group (men)
2-10 years 11-17 years 18-40 years >40 years
Land cover/use baseline assessment (single time)
Human mobility pattern mapping from surveys and auxiliary data
Downscaled meteorological parameters (8-day)
Analyze malaria prevalence as a function of environmental conditions
Analyze malaria prevalence as a function of human mobility
Focus group interviews:Verify study findings in focus group interviews with health practitioners and researchers in the Rakhine state.
Dynamic mapping of surface conditions (8-day)
Identifying mobility networks
Objective 1: Land cover/use mapping
Objective 2: Mobility
Objective 3: Analytics Objective 4: Expert verification


Questions?