Antarctic dehydration 1998–2003: Polar Ozone and Aerosol Measurement III (POAM) measurements and...
9
Antarctic dehydration 1998–2003: Polar Ozone and Aerosol Measurement III (POAM) measurements and Integrated Microphysics and Aerosol Chemistry on Trajectories (IMPACT) results with four meteorological models Gerald E. Nedoluha, 1 Craig M. Benson, 1,2 Karl W. Hoppel, 1 Jerome Alfred, 3 Richard M. Bevilacqua, 1 and Katja Drdla 4 Received 17 April 2006; revised 4 December 2006; accepted 20 December 2006; published 7 April 2007. [1] We present Polar Ozone and Aerosol Measurement III (POAM) measurements of Antarctic dehydration from 1998 to 2003 and compare these measurements with calculations performed with the Integrated Microphysics and Aerosol Chemistry on Trajectories (IMPACT) microphysical model. Previous work has shown that while dehydration is not very sensitive to reasonable changes of microphysical parameters, it is very sensitive to changes in temperature. We shall therefore compare dehydration as measured by POAM with IMPACT model runs based on four meteorological analyses: United Kingdom Meteorological Office (UKMO), European Centre for Medium-Range Weather Forecasts (ECMWF), National Centers for Environmental Prediction Climate Prediction Center (NCEP-CPC), and NCEP reanalysis. For the years 1998–2000, the agreement between the minimum water vapor found in the POAM measurements and that from all of the model runs is always within 0.5 ppmv. The disagreement between POAM and some of the models is larger in the years 2001–2003, growing as large as 1 ppmv, but the agreement between the minimum POAM water vapor and the water vapor calculated using the NCEP reanalysis is always within 0.2 ppmv. If we infer a temperature bias from the difference between the NCEP reanalysis model runs and the POAM minimum water vapor measurements, we find that this temperature bias is <0.5 K for each of the 6 years from 1998 to 2003, but it is often larger for the other meteorological analyses. Citation: Nedoluha, G. E., C. M. Benson, K. W. Hoppel, J. Alfred, R. M. Bevilacqua, and K. Drdla (2007), Antarctic dehydration 1998 – 2003: Polar Ozone and Aerosol Measurement III (POAM) measurements and Integrated Microphysics and Aerosol Chemistry on Trajectories (IMPACT) results with four meteorological models, J. Geophys. Res., 112, D07305, doi:10.1029/2006JD007414. 1. Introduction [2] During cold polar winters, rapid changes in strato- spheric water vapor mixing can sometimes occur as water freezes and sometimes sediments out of the stratosphere altogether [Kelly et al., 1989]. This polar dehydration has a large effect on the water vapor budget of the Antarctic vortex lower stratosphere. At some altitudes, where water vapor mixing ratios 6–7 ppmv would be expected in the absence of dehydration, multiple dehydration episodes occur [Nedoluha et al., 2002], reducing measured mixing ratios to as low as 1 ppmv over monthly timescales [Nedoluha et al., 2000]. [3] In this paper, we will show Polar Ozone and Aerosol Measurement III (POAM) water vapor data taken in the Antarctic from 1998 to 2003, and we will compare these measurements to model calculations using the Inte- grated Microphysics and Aerosol Chemistry on Trajectories (IMPACT) model [Drdla, 1996]. As was shown by Benson et al. [2006a], calculated dehydration did not vary greatly given reasonable changes in the IMPACT model micro- physical parameters, but dehydration was very sensitive to changes in the temperature. We will show that the POAM dehydration measurements generally fall within the range of dehydrations calculated using the IMPACT model with different meteorological analyses. One of the goals of this study is to quantify the extent to which interannual variations in the dehydration as measured by POAM are reproduced by the IMPACT model with these different meteorological analyses. As we will show, in recent years, the calculated dehydration has become increasingly sensitive to the choice of meteorological analysis. [4] Clearly, dehydration is not the only polar process that is sensitive to changes in temperature. As was shown by JOURNAL OF GEOPHYSICAL RESEARCH, VOL. 112, D07305, doi:10.1029/2006JD007414, 2007 1 Naval Research Laboratory, Washington, DC, USA. 2 Now at Global Modeling and Assimilation Office, NASA Goddard Space Flight Center, Greenbelt, Maryland and Goddard Earth Sciences and Technology Center, Baltimore, Maryland, USA. 3 Computational Physics Inc., Springfield, Virginia, USA. 4 NASA Ames Research Center, Moffet Field, California, USA. Copyright 2007 by the American Geophysical Union. 0148-0227/07/2006JD007414 D07305 1 of 9
-
Upload
independent -
Category
Documents
-
view
1 -
download
0
Transcript of Antarctic dehydration 1998–2003: Polar Ozone and Aerosol Measurement III (POAM) measurements and...
Antarctic dehydration 1998–2003: Polar Ozone and Aerosol
Measurement III (POAM) measurements and Integrated
Microphysics and Aerosol Chemistry on Trajectories (IMPACT)
results with four meteorological models
Gerald E. Nedoluha,1 Craig M. Benson,1,2 Karl W. Hoppel,1 Jerome Alfred,3
Richard M. Bevilacqua,1 and Katja Drdla4
Received 17 April 2006; revised 4 December 2006; accepted 20 December 2006; published 7 April 2007.
[1] We present Polar Ozone and Aerosol Measurement III (POAM) measurements ofAntarctic dehydration from 1998 to 2003 and compare these measurements withcalculations performed with the Integrated Microphysics and Aerosol Chemistry onTrajectories (IMPACT) microphysical model. Previous work has shown that whiledehydration is not very sensitive to reasonable changes of microphysical parameters, it isvery sensitive to changes in temperature. We shall therefore compare dehydration asmeasured by POAM with IMPACT model runs based on four meteorological analyses:United Kingdom Meteorological Office (UKMO), European Centre for Medium-RangeWeather Forecasts (ECMWF), National Centers for Environmental Prediction ClimatePrediction Center (NCEP-CPC), and NCEP reanalysis. For the years 1998–2000, theagreement between the minimum water vapor found in the POAM measurementsand that from all of the model runs is always within 0.5 ppmv. The disagreement betweenPOAM and some of the models is larger in the years 2001–2003, growing as large as�1 ppmv, but the agreement between the minimum POAM water vapor and the watervapor calculated using the NCEP reanalysis is always within 0.2 ppmv. If we infer atemperature bias from the difference between the NCEP reanalysis model runs and thePOAM minimum water vapor measurements, we find that this temperature bias is <0.5 Kfor each of the 6 years from 1998 to 2003, but it is often larger for the other meteorologicalanalyses.
Citation: Nedoluha, G. E., C. M. Benson, K. W. Hoppel, J. Alfred, R. M. Bevilacqua, and K. Drdla (2007), Antarctic dehydration
1998–2003: Polar Ozone and Aerosol Measurement III (POAM) measurements and Integrated Microphysics and Aerosol Chemistry
on Trajectories (IMPACT) results with four meteorological models, J. Geophys. Res., 112, D07305, doi:10.1029/2006JD007414.
1. Introduction
[2] During cold polar winters, rapid changes in strato-spheric water vapor mixing can sometimes occur as waterfreezes and sometimes sediments out of the stratospherealtogether [Kelly et al., 1989]. This polar dehydration has alarge effect on the water vapor budget of the Antarcticvortex lower stratosphere. At some altitudes, where watervapor mixing ratios �6–7 ppmv would be expected in theabsence of dehydration, multiple dehydration episodesoccur [Nedoluha et al., 2002], reducing measured mixingratios to as low as �1 ppmv over monthly timescales[Nedoluha et al., 2000].
[3] In this paper, we will show Polar Ozone andAerosol Measurement III (POAM) water vapor data takenin the Antarctic from 1998 to 2003, and we will comparethese measurements to model calculations using the Inte-grated Microphysics and Aerosol Chemistry on Trajectories(IMPACT) model [Drdla, 1996]. As was shown by Bensonet al. [2006a], calculated dehydration did not vary greatlygiven reasonable changes in the IMPACT model micro-physical parameters, but dehydration was very sensitive tochanges in the temperature. We will show that the POAMdehydration measurements generally fall within the rangeof dehydrations calculated using the IMPACT model withdifferent meteorological analyses. One of the goals of thisstudy is to quantify the extent to which interannual variationsin the dehydration as measured by POAM are reproduced bythe IMPACT model with these different meteorologicalanalyses. As we will show, in recent years, the calculateddehydration has become increasingly sensitive to the choiceof meteorological analysis.[4] Clearly, dehydration is not the only polar process that
is sensitive to changes in temperature. As was shown by
JOURNAL OF GEOPHYSICAL RESEARCH, VOL. 112, D07305, doi:10.1029/2006JD007414, 2007
1Naval Research Laboratory, Washington, DC, USA.2Now at Global Modeling and Assimilation Office, NASA Goddard
Space Flight Center, Greenbelt, Maryland and Goddard Earth Sciences andTechnology Center, Baltimore, Maryland, USA.
3Computational Physics Inc., Springfield, Virginia, USA.4NASA Ames Research Center, Moffet Field, California, USA.
Copyright 2007 by the American Geophysical Union.0148-0227/07/2006JD007414
D07305 1 of 9

Manney et al. [2003] for the Arctic winters of 1999/2000and 1995/1996, the choice of meteorological analyses canstrongly influence the results of polar processing studies. Inparticular, in order to understand to what extent observedinterannual changes in the chemical composition of thevortices are meteorologically driven, one must first under-stand to what extent the reported interannual changes arecaused by changes in the meteorological models, theirassimilation schemes, and the data available for assimi-lation. Without such an understanding, it is impossible todifferentiate observed interannual changes in the chemicalcomposition of the vortices which are meteorologicallydriven from those which are caused by changes in long-lived species in atmosphere. In a recent paper by Hoppelet al. [2005], it was shown that, during the Antarctic wintersof 2001–2004, the amount of ozone at the top edge of theozone hole (�20–22 km) was unusually high. It wasconcluded that this was probably a result of unusualmeteorology, which affected both photochemical ozone loss(2001, 2003, and 2004) and caused enhanced descent of theozone profile (2002). The POAM aerosol measurementsshowed a reduction in the frequency of polar stratosphericclouds (PSCs) which would have been consistent with anincrease in temperature, yet none of the three meteorologicalanalyses used in that study (National Centers for Envi-ronmental Prediction (NCEP) reanalysis, NCEP-ClimatePrediction Center (CPC), and United Kingdom Meteoro-logical Office (UKMO)) showed unusually high tempe-ratures for all four of those years. This study thereforeserves in part to test the accuracy of the dehydrationcalculated from the IMPACT model and in part providesa useful independent check on meteorological temperatureanalyses in the Antarctic vortex from 1998 to 2003, atleast within a limited altitude range and for the coldesttemperatures where dehydration takes place.
2. POAM Measurements of AntarcticDehydration
[5] The POAM solar occultation instrument, which ope-rated from April 1998 until December 2005, was able toprovide 14 profiles in each hemisphere each day. After thefirst year of operation, POAM measurements were onlymade in one hemisphere each day in order to reduce wearon the azimuth motor. The POAM water vapor data shownhere are from the version 4 POAM retrievals which havebeen validated by Lumpe et al. [2006]. The version 4algorithm changes were implemented to the completePOAM data set to compensate for degradation of thePOAM elevation tracking and include some additionalsmoothing (the vertical resolution remains �1 km) and achange in the aerosol optical depth parameterization. ThePOAM measurements shown here are taken in instrumentsunset mode, for which Lumpe et al. [2006] found that,based on comparisons available in November–February, thePOAM water vapor at 15–20 km was �20% higher thanHalogen Occultation Experiment (HALOE).[6] The latitudes of the POAMmeasurements are identical
in all years, and during this period, the measurements cover arange of �65�S on 21 June to �88�S on 21 September.Figure 1 shows the vortex edge and equivalent latitudes of thePOAMmeasurements from 1 June through 30 September for
1998–2005. With the exception of late September 2002,when POAMmeasurements taken very close to the pole wereactually outside the vortex, the equivalent latitudes coveredare similar from year to year.[7] In Figure 2 we show time series for POAM inside the
vortex water vapor measurements from 1 June to 30September for the years 1998–2003. We have smoothedall of the POAM measurements of this plot using 2-weekaverages. Throughout this paper, we will use POAMmeasurements interpolated to the average altitude of dia-batical parcels, whose descent is calculated using theradiative transfer model of Rosenfield and Schoeberl[2001]. The parcels begin at a potential temperature of500 K on 1 June and typically descend to �450 ± 10 Kby the end of September. The precise altitude of the POAMmeasurements shown here is determined by the averagealtitude of the parcels to which they will be compared inSection 3 (parcels inside the vortex and within ±2� latitudeof POAM measurements).[8] POAM water vapor retrievals are particularly difficult
in regions of high aerosol optical depth and are thereforeaffected by the presence of polar stratospheric clouds(PSCs) during this period. The data shown here have beenscreened for high aerosol optical depth as in the study ofBenson et al. [2006a] using the criteria of Lumpe et al.[2006]. This screening can result in the loss of more than50% of the data in late July. A 2-week POAM averagetherefore can represent �200 points for clear air periods in1998 when POAM is measuring in each hemisphere everyday, but only 30–40 in later years during the height of thePSC season. During the height of the PSC season, thestandard deviation of the POAM water vapor measurements(s) is �1–2 ppmv, hence given a number of measurements(n) of �30–40 over a 2-week period, the maximum randomuncertainty (s/n1/2) for the POAM data shown in Figure 2 is�0.3 ppmv.[9] The timing and magnitude of the dehydration for all
of these years is at least qualitatively similar. There is a
Figure 1. The POAM measurement latitude (blue line),the equivalent latitudes of the POAM measurements at500 K from 1 June to 30 September of each year (blackcrosses), and the equivalent latitude of the vortex edge[Nash et al., 1996] at 500 K (red line).
D07305 NEDOLUHA ET AL.: ANTARCTIC DEHYDRATION: POAM AND IMPACT
2 of 9
D07305

small amount of dehydration in June followed by a largedecrease in July. In mid-August there is a spread of�1 ppmv in the water vapor values. All of the years beginto show an increase from their minima by the end ofSeptember. As was pointed out by Voemel et al. [1995]and Stone et al. [2001], measurements from instrumentscovering different ranges of latitudes, even if all are takeninside the vortex, may show differences in the timing of theonset of dehydration.[10] Throughout the period shown, increases in water
vapor can be caused by variations in the sampling ofunevenly dehydrated parcels within the vortex or perhapsfrom the return of previously sequestered water to the vaporphase. Because POAM measurements are not possible inregions with high aerosol optical depths, they are, however,unlikely to include regions with significant amounts ofsequestered water. The gradual increase which begins tooccur in August or September indicates that POAM isbeginning to measure the effects of rehydration due tomixing with air from higher altitudes where less dehydra-tion may have occurred and/or mixing with air from outsidethe vortex. In this study, our model calculations do notinclude the effects of these mixing processes, hence in ourcomparison studies we will focus solely on the periodbefore this gradual rehydration begins.[11] We have not included the POAM data for 2004 in this
study. In September 2004, the POAM-measured water vapormixing ratios became unphysically large. The POAMmeasurements in August 2004 show unusually earlyrehydration, which may or may not be indicative of aninstrumental problem, but because this study relies to suchan extent upon the absolute calibration of the POAM watervapor measurements, we felt it prudent to exclude themeasurements for that year. We do note that the 2004 datafrom the Microwave Limb Sounder instrument on Aurashown in the work of Santee et al. [2005] indicate rehy-dration between 13 August and 6 September on the slightlyhigher (520 K) potential temperature surface, so it is certainly
not clear that the early POAM rehydration in 2004 isindicative of an instrumental problem in August.
3. POAM-IMPACT Comparisons
[12] In this section, we will show comparisons betweenPOAM water vapor data and water vapor derived fromIMPACT model calculations. The IMPACT model calcu-lates the microphysics (including freezing, melting, evapo-ration, condensation, and sedimentation), chemistry, andphotochemistry of gas-phase chemicals and various aerosolsin individual air parcels, for which the temperature andpressure history is provided by a meteorological model.Information on the microphysics module of the IMPACTmodel is given by Drdla et al. [2003].[13] The model scenario used for all simulations shown
here is the HetFrzB scenario described by Drdla et al.[2003] and Benson et al. [2006a, 2006b]. In this scenario,sulfate aerosols freeze to ice particles homogeneously belowthe frost point, and in addition, a small fraction (0.02%) ofsulfate aerosols freezes to NAT via a heterogeneous pathway.The ice nucleation process characterized by Tabazadeh et al.[2000] is used in all computations, with an ice accommoda-tion coefficient of 1.0. Size-dependent particle fall velocitiesare calculated according to the standard Stokes-Cunninghamatmospheric drag equations [Pruppacher and Klett, 1997].The parameters used in this study adequately reproduce den-itrification in the Northern Hemisphere [Drdla et al., 2003]and temperature-dependent aerosol extinction, including thenucleation and growth of ice clouds, in the Southern Hemi-sphere [Benson et al., 2006b]. Reasonable changes in themicrophysical parameters lead to small changes in thedehydration profile [Benson et al., 2006a].
3.1. Sensitivity of Dehydration to Temperature
[14] As was shown by Benson et al. [2006a], dehydrationis very sensitive to changes in temperature. Interannualvariations in the amount of dehydration measured shouldtherefore be a good indication of changes in temperature inthe coldest regions of the Antarctic vortex. Depending uponthe precise time of year and the level of dehydration, modelruns in the study of Benson et al. show that a constant 1Kdecrease in the temperature will decrease the water vapor atthe POAM latitudes from June to September by �1/3–1/2 ppmv. Because of this strong temperature dependence ofthe dehydration, IMPACT model dehydration results arelikely to be more dependent upon the precise choice ofmeteorological model than on reasonable variations ofmicrophysical parameters used in the calculation.
3.2. UKMO, NCEP Reanalysis, NCEP-CPC, andECMWF Data Sets
[15] Four meteorological data sets have been used in theanalysis: the United Kingdom Meteorological Office(UKMO) analysis [Swinbank and O’Neill, 1994], theEuropean Centre for Medium-Range Weather Forecasts(ECMWF) analysis (provided by the Norwegian Institutefor Air Research (NILU)), and both the National Centers forEnvironmental Prediction Climate Prediction Center (NCEP-CPC) analysis and the NCEP-National Center for Atmo-spheric Research (NCAR) Reanalysis (hereafter referred to asREAN) [Kistler et al., 2001]. For the IMPACT model
Figure 2. The POAM water vapor measurement for1998–2003. The inside-the-vortex measurements have beensmoothed to show a 2-week average. Measurements areinterpolated to a diabatically descending surface whichbegins at a potential temperature of 500 K on 1 June.
D07305 NEDOLUHA ET AL.: ANTARCTIC DEHYDRATION: POAM AND IMPACT
3 of 9
D07305
calculations, winds were required, and these were obtaineddirectly from the meteorological analyses, except in the caseof NCEP-CPC, where the balanced winds are derived fromthe temperature and geopotential height analysis [Newmanet al., 1998]. For all model calculations except the ECMWF,we used temperatures and wind analyses from 12 UT eachday. For the model calculations using ECMWF data, weused 6-hour analyses.[16] As previously noted, the model air parcels are
initialized at the 500K potential temperature surface andthen descend as determined by the three-dimensional heatingrate fields. For the UKMO and NCEP-CPC model runs,the heating rate calculations were performed using thetemperatures from the corresponding analysis. For theECMWF and REAN runs, the heating rates correspondingto the UKMO temperature analysis were used rather thanrepeating the radiative transfer calculations for the corre-sponding analysis. The mean theta surface for parcels within±2� latitude of POAM measurements on 30 September can,depending upon the year, differ by as much as 10 K for theUKMO and NCEP-CPC model runs.[17] Excellent descriptions of these data sets and some of
the changes which they have undergone are given byRandel et al. [2004] and Manney et al. [2003]. Below, wediscuss only those changes which occurred over the period1998–2003. As is clear from the discussion below, impor-tant changes have been made to the meteorological modelsduring these years, and these changes may affect theIMPACT model runs and hence any POAM-IMPACTcomparisons.[18] In the case of the UKMO analysis, in November
2000, a new stratospheric data assimilation system wasimplemented, based on the three-dimensional variational(3DVAR) data assimilation system used for the standardglobal forecast suite. The 3DVAR stratospheric systemincludes the assimilation of radiances (rather than tempe-rature retrievals) from the operational polar orbiter satellites[www.met-office.gov.uk/research/stratosphere/modeling/analysis.html]. In October 2003, the dynamical core of thismodel was changed from spectral to semi-Lagrangian. Inaddition, the number of levels in the stratosphere wasincreased, changing the total number of levels from 40to 50.[19] In October 2003, ECMWF began assimilating
Advanced Infrared Sounder (AIRS) radiances [EuropeanCentre for Medium-Range Weather Forecasts (ECMWF),2003], and, as is shown in the study of Gobiet et al.[2005], this significantly changed the wintertime polartemperature biases. The wave pattern that had been pre-viously apparent above 20 km was significantly reduced,with only a small positive bias remaining in the 20- to22-km layers at latitudes near the edge of the vortex.There remains a wave pattern in the stratosphere below20 km in the Antarctic vortex. A list of ECMWF modeldevelopments is available at www.ecmwf.int/products/data/operational_ system/evolution.[20] The NCEP-CPC analysis is obtained by combining
primarily satellite data at stratospheric pressure levels withthe NCEP operational analysis [e.g., Trenberth and Olsen,1988]. Until May 2001, the levels above 100 hPa camesolely from analyses of Television Infrared ObservationSatellite Program (TIROS) Operational Vertical Sounder
(TOVS) and Revised TIROS Operational Vertical Sounder(RTOVS) data. In May 2001, the operational analysis wasextended from 100 hPa up to 10 hPa.[21] The NCEP-NCAR reanalysis (REAN) project main-
tains a constant assimilation scheme, but unavoidablechanges in available data sets do occur. Of particular interestto this study is the change in stratospheric temperatureswhich occurred in July 2001 when the model began toassimilate data from the Advanced TIROS OperationalVertical Sounder (ATOVS) and stopped assimilating TOVS[Randel et al., 2004].
3.3. POAM-IMPACT Comparisons With DifferentMeteorological Analyses
[22] In order provide the temperature and pressure infor-mation needed to run the IMPACT model, we use isentropictrajectory analyses [Bowman, 1996] driven by winds fromeach meteorological analysis. The simulation is initiatedeach year on 1 June for a set of �2000 uniformly spaced airparcels starting poleward of 50�S and is run until the end ofSeptember with an IMPACT model time step of 1 hour. Forall of the results shown here, the model is initialized at the500-K potential temperature surface and each descendsaccording to the local diabatic heating rate calculatedusing the temperatures from the meteorological analyses[Rosenfield et al., 1994]. Typically, by the end of September,a parcel will have descended to �450 K.[23] IMPACT results from inside the vortex and within
±2� latitude of POAM measurements are used in the compa-risons. This latitude range is comparable to the effectivePOAM horizontal resolution along the line of sight, whichis �200 km. The number of parcels satisfying these require-ments varies from �200/day in July to �30/day in lateSeptember, with the decreasing number due to the smallerarea encompassed by the POAM latitude band in September[Benson et al., 2006a]. The water vapor in the modelsimulations is initialized to the average POAM measure-ment value inside the vortex for 1–4 June. The POAMmeasurement profile is interpolated to the trajectory meanaltitude for all model-measurement comparisons, as inFigure 2.[24] In both the POAM measurements and the coincident
IMPACT model calculations, we show only water vapor;hence some of the water in the region being sampled may betemporarily sequestered as ice. IMPACT model calculationsshow that, at least for parcels at the altitudes shown here,such sequestration tends to be brief (at most a few days).After this period, the ice clouds have disappeared and thewater has either sedimented or returned to the vapor phase.[25] In Figure 3 we show the POAM data from Figure 2
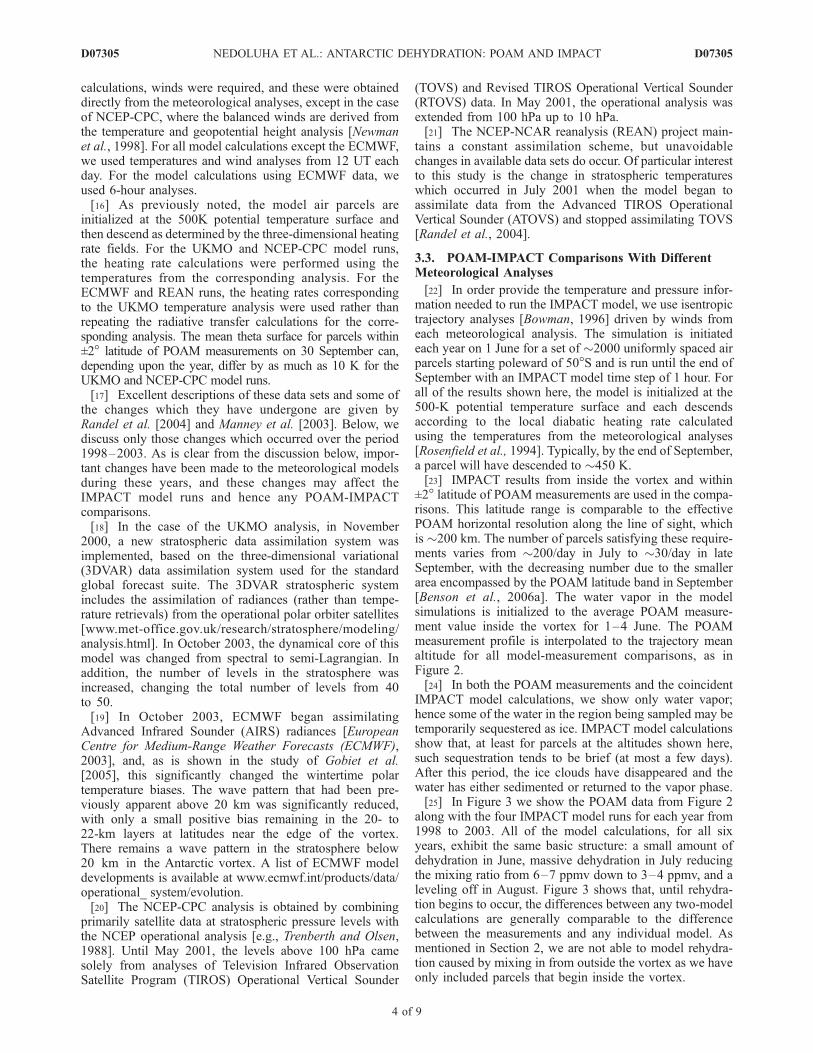
along with the four IMPACT model runs for each year from1998 to 2003. All of the model calculations, for all sixyears, exhibit the same basic structure: a small amount ofdehydration in June, massive dehydration in July reducingthe mixing ratio from 6–7 ppmv down to 3–4 ppmv, and aleveling off in August. Figure 3 shows that, until rehydra-tion begins to occur, the differences between any two-modelcalculations are generally comparable to the differencebetween the measurements and any individual model. Asmentioned in Section 2, we are not able to model rehydra-tion caused by mixing in from outside the vortex as we haveonly included parcels that begin inside the vortex.
D07305 NEDOLUHA ET AL.: ANTARCTIC DEHYDRATION: POAM AND IMPACT
4 of 9
D07305
[26] Only in 2000 are the POAM dehydration measure-ments outside the envelope of the four model calculationsfor an extended period of time for the period beforerehydration. During the period when dehydration is activelyoccurring (June–July), there are large variations in watervapor within the vortex, hence trajectory differences mayaccount for the difference between the measured andmodeled water vapor, especially since the POAM latitudestend to be near the edge of the vortex (see Figure 3 inBenson et al., 2006a). In August, POAM measurements are
made more deeply in the vortex, and temperatures begin toincrease, causing the rate of dehydration to slow down atthis point in the season. We therefore expect that the effectsof sampling and of model trajectory differences should beminimized. In mid-August of every year, the POAM dehy-dration measurements are always in good agreement with atleast one model.[27] There are numerous instances where the water vapor
at the POAM measurement latitudes shows large drops insome models, but not in others. An interesting case occurs
Figure 3. The POAM water vapor measurement for 1998–2003, along with IMPACT model runs withwinds and temperatures from the respective models. The IMPACT results are daily averages, while thePOAM water vapor measurements have been smoothed to show a 2-week average. Model andmeasurements are shown on a diabatically descending surface which begins at a potential temperature of500 K on 1 June.
D07305 NEDOLUHA ET AL.: ANTARCTIC DEHYDRATION: POAM AND IMPACT
5 of 9
D07305

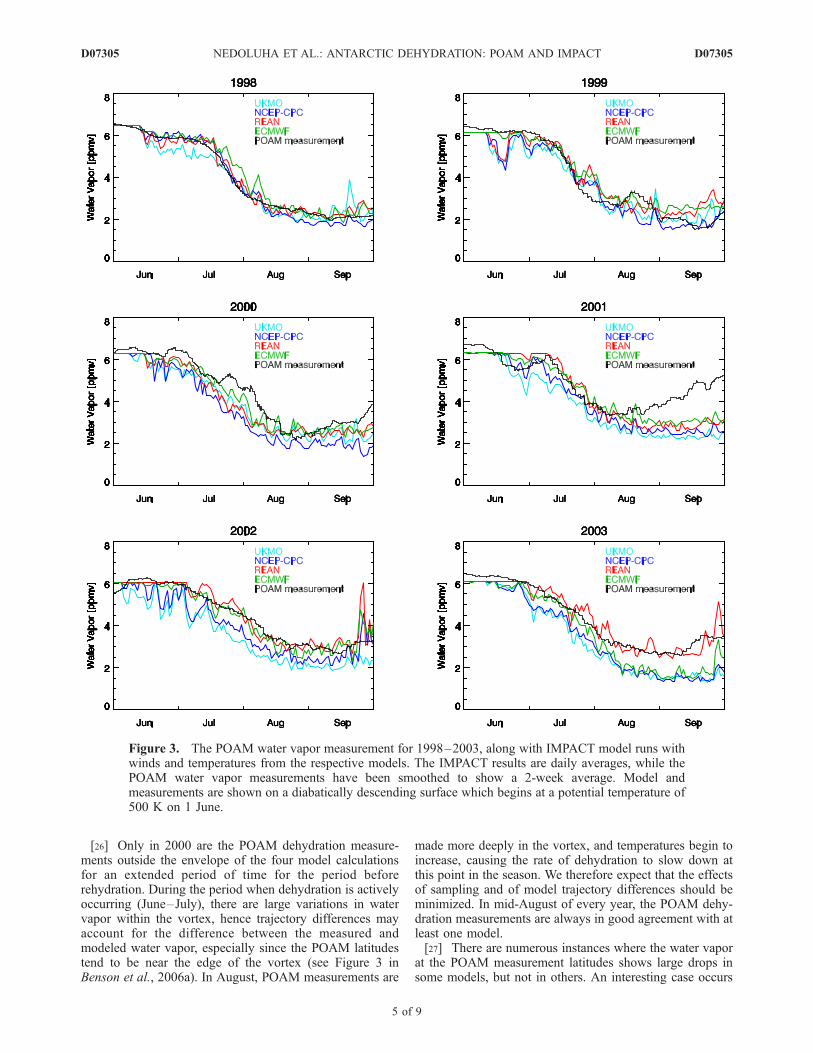
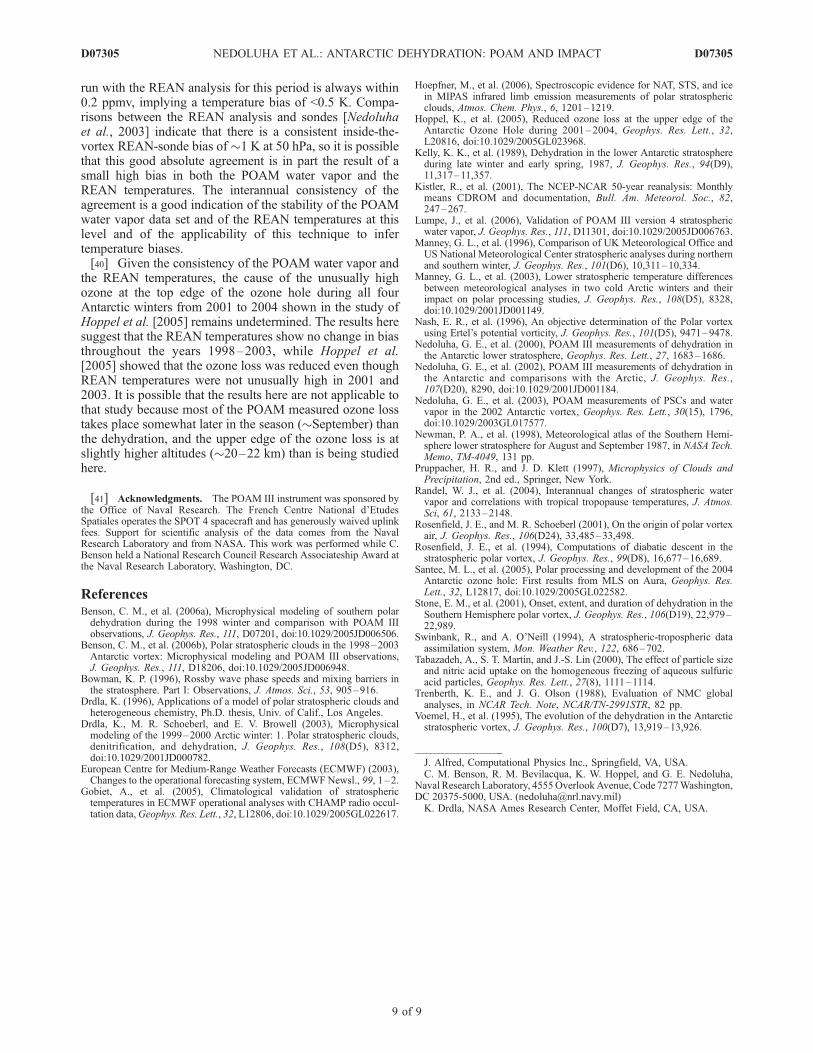
in 1998, when a cold pool develops near the PalmerPeninsula in all of the models in mid-June. In Figure 4,we show plots of the temperatures of the four weatheranalyses at 490 K for 15 June 1998 (the average potentialtemperature of the descending parcels initialized at 500 Kon 1 June 1998). All of the models show temperatures nearthe POAM latitudes at which we would expect somedehydration to occur, and all show some dehydration atthis time in Figure 3. On this and on subsequent days theUKMO temperatures tend to be among the coldest, but withother models sometimes having larger areas below specifictemperatures at which some dehydration can occur. Theamount of dehydration at the POAM latitudes is sensitiveboth to the size and temperature of the regions cold enoughto cause dehydration and to whether the trajectories for thatparticular meteorological model take parcels from thesevery cold regions to the POAM latitudes.[28] Figure 3 also shows that, in mid-June 1999, there is a
clear drop in the REAN, CPC, and UKMO water vaporwhich was not seen in the POAM data or the ECMWFmodel run. In late June 2001, a drop occurs in the POAMmeasurements and in all of the models. In this case the bestagreement with POAM comes from the CPC model calcu-lation, with the UKMO model showing much more dehy-dration than the measurements, the REAN model showingmuch less. In late June 2002, the UKMO and CPC tempe-ratures are lower than the REAN and ECMWF temperatures.These temporary decreases in water vapor are caused byuneven dehydration within the vortex, with the subsequentincreases due to both changes in the POAM measurementlatitude and the motion of the parcels to different latitudes.Given the 2-week sampling period used for the POAM data,
some of the very short timescale events cannot be observedin the measurements. It is certainly not clear from suchsmall-scale events that any model consistently bettermatches the POAM data.[29] On longer timescales, however, the REAN model
clearly shows the best overall agreement with the POAMdata. With the exception of late July to early August 2000(during which period none of the models matches thePOAM data), there is very good agreement between thePOAM data and the REAN model for the entire dehydrationperiod for all 6 years. Even when there are large interannualvariations in the amount of dehydration, the POAM andREAN data give consistent results.[30] It is interesting to note how the range of dehydration
values calculated using different meteorological analysesand measured by POAM is particularly large during themost recent years. In 2000 all models show more dehydra-tion than POAM in late June and July, but by mid-August,the POAM dehydration falls within the range of the models.In late June and early July of 2001, the UKMO modelshows more dehydration than either the POAM measure-ments or than of the other three models. In late July of 2001,the CPC model dehydration slowly approaches the UKMOmodel. As was discussed in Section 3.2, there were impor-tant changes to the UKMO and CPC analyses between theAntarctic winters of 2000 and 2001, so it is perhaps notsurprising that the agreement between these models and thePOAM measurements changes between 2000 and 2001. In2002, both the UKMO and CPC models show moredehydration throughout the season than the POAM data,but the REAN and ECMWF models continue to match thePOAM data reasonably well. In 2003, the same split persistsuntil the end of July, at which point the ECMWF modelshifts from agreeing with the REAN model and the POAMdata to agreeing with the UKMO and CPC models. We notethat this shift in the ECMWF data occurs well before theaddition of AIRS radiances in October 2003 and does notseem to be correlated with any other change in the analysis.This shift does occur as POAM moves toward the pole, so itmay be related to a change in temperature bias with latitude(which is apparent in the plots of Gobiet et al. [2005]), butwhy this shift should occur in 2003 and not in other years isnot clear.[31] Figure 5a serves as a summary plot of Figure 3
which helps to emphasize the interannual variations in themodels and the POAM measurements. In Figure 5a, weshow the maximum dehydration for each year as calculatedfrom the four models and from the POAM data. The valueof maximum dehydration is established by first finding thedate corresponding to the minimum water vapor in a 2-weekmoving average and then calculating a 1-week averageabout that date. This value is then compared with the same1-week average of the IMPACT simulation. Although thewater vapor minimum may fall anywhere between lateAugust and the end of September, we consider only timesbefore September 16th. This cut-off is imposed since in lateSeptember the POAM measurements are taken at very highlatitudes and therefore sample only a relatively small regionnear the pole. Because the geographical region is small, itseverely limits not only the sampling of the POAMmeasurements, but also the number of parcels availablefrom the IMPACT model for comparison near POAM
Figure 4. Temperatures contours at 490 K on 15 June1998. The pressure at 490 K is near 50 hPa, where atemperature of 188 K corresponds to a saturation mixingratio of �4.5 ppmv. The POAM measurement locations forthis day are indicated by asterisks.
D07305 NEDOLUHA ET AL.: ANTARCTIC DEHYDRATION: POAM AND IMPACT
6 of 9
D07305
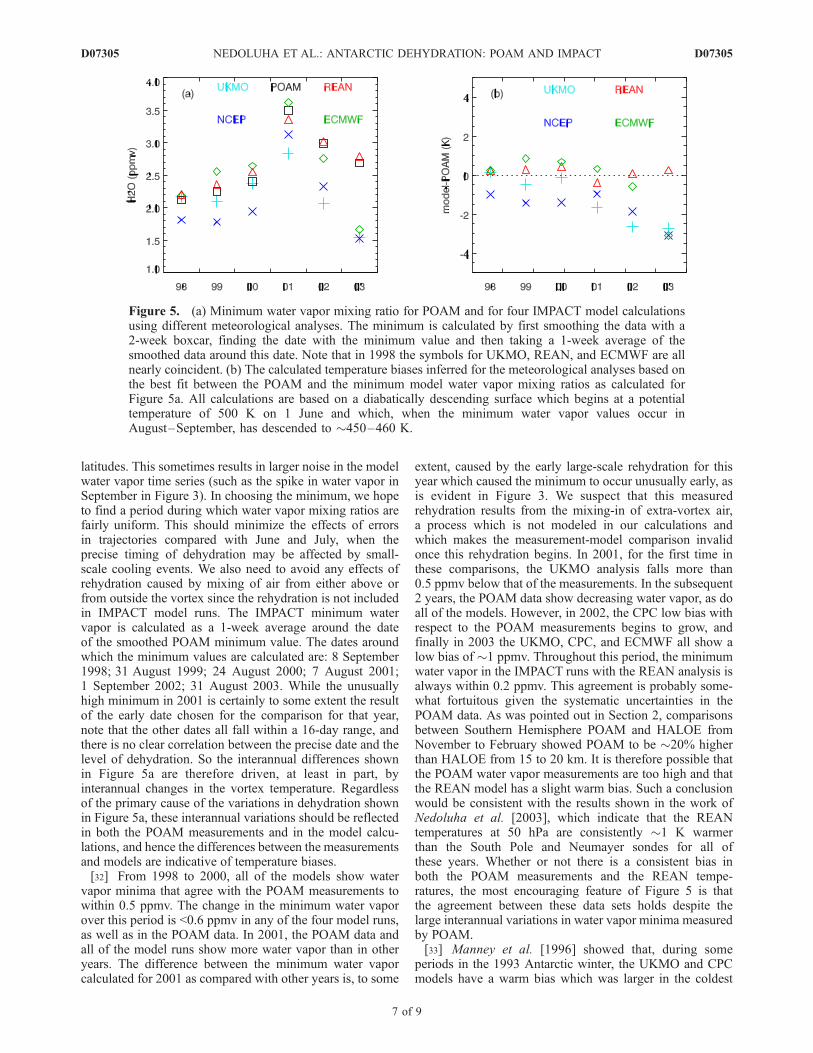
latitudes. This sometimes results in larger noise in the modelwater vapor time series (such as the spike in water vapor inSeptember in Figure 3). In choosing the minimum, we hopeto find a period during which water vapor mixing ratios arefairly uniform. This should minimize the effects of errorsin trajectories compared with June and July, when theprecise timing of dehydration may be affected by small-scale cooling events. We also need to avoid any effects ofrehydration caused by mixing of air from either above orfrom outside the vortex since the rehydration is not includedin IMPACT model runs. The IMPACT minimum watervapor is calculated as a 1-week average around the dateof the smoothed POAM minimum value. The dates aroundwhich the minimum values are calculated are: 8 September1998; 31 August 1999; 24 August 2000; 7 August 2001;1 September 2002; 31 August 2003. While the unusuallyhigh minimum in 2001 is certainly to some extent the resultof the early date chosen for the comparison for that year,note that the other dates all fall within a 16-day range, andthere is no clear correlation between the precise date and thelevel of dehydration. So the interannual differences shownin Figure 5a are therefore driven, at least in part, byinterannual changes in the vortex temperature. Regardlessof the primary cause of the variations in dehydration shownin Figure 5a, these interannual variations should be reflectedin both the POAM measurements and in the model calcu-lations, and hence the differences between the measurementsand models are indicative of temperature biases.[32] From 1998 to 2000, all of the models show water
vapor minima that agree with the POAM measurements towithin 0.5 ppmv. The change in the minimum water vaporover this period is <0.6 ppmv in any of the four model runs,as well as in the POAM data. In 2001, the POAM data andall of the model runs show more water vapor than in otheryears. The difference between the minimum water vaporcalculated for 2001 as compared with other years is, to some
extent, caused by the early large-scale rehydration for thisyear which caused the minimum to occur unusually early, asis evident in Figure 3. We suspect that this measuredrehydration results from the mixing-in of extra-vortex air,a process which is not modeled in our calculations andwhich makes the measurement-model comparison invalidonce this rehydration begins. In 2001, for the first time inthese comparisons, the UKMO analysis falls more than0.5 ppmv below that of the measurements. In the subsequent2 years, the POAM data show decreasing water vapor, as doall of the models. However, in 2002, the CPC low bias withrespect to the POAM measurements begins to grow, andfinally in 2003 the UKMO, CPC, and ECMWF all show alow bias of �1 ppmv. Throughout this period, the minimumwater vapor in the IMPACT runs with the REAN analysis isalways within 0.2 ppmv. This agreement is probably some-what fortuitous given the systematic uncertainties in thePOAM data. As was pointed out in Section 2, comparisonsbetween Southern Hemisphere POAM and HALOE fromNovember to February showed POAM to be �20% higherthan HALOE from 15 to 20 km. It is therefore possible thatthe POAM water vapor measurements are too high and thatthe REAN model has a slight warm bias. Such a conclusionwould be consistent with the results shown in the work ofNedoluha et al. [2003], which indicate that the REANtemperatures at 50 hPa are consistently �1 K warmerthan the South Pole and Neumayer sondes for all ofthese years. Whether or not there is a consistent bias inboth the POAM measurements and the REAN tempe-ratures, the most encouraging feature of Figure 5 is thatthe agreement between these data sets holds despite thelarge interannual variations in water vapor minima measuredby POAM.[33] Manney et al. [1996] showed that, during some
periods in the 1993 Antarctic winter, the UKMO and CPCmodels have a warm bias which was larger in the coldest
Figure 5. (a) Minimum water vapor mixing ratio for POAM and for four IMPACT model calculationsusing different meteorological analyses. The minimum is calculated by first smoothing the data with a2-week boxcar, finding the date with the minimum value and then taking a 1-week average of thesmoothed data around this date. Note that in 1998 the symbols for UKMO, REAN, and ECMWF are allnearly coincident. (b) The calculated temperature biases inferred for the meteorological analyses based onthe best fit between the POAM and the minimum model water vapor mixing ratios as calculated forFigure 5a. All calculations are based on a diabatically descending surface which begins at a potentialtemperature of 500 K on 1 June and which, when the minimum water vapor values occur inAugust–September, has descended to �450–460 K.
D07305 NEDOLUHA ET AL.: ANTARCTIC DEHYDRATION: POAM AND IMPACT
7 of 9
D07305
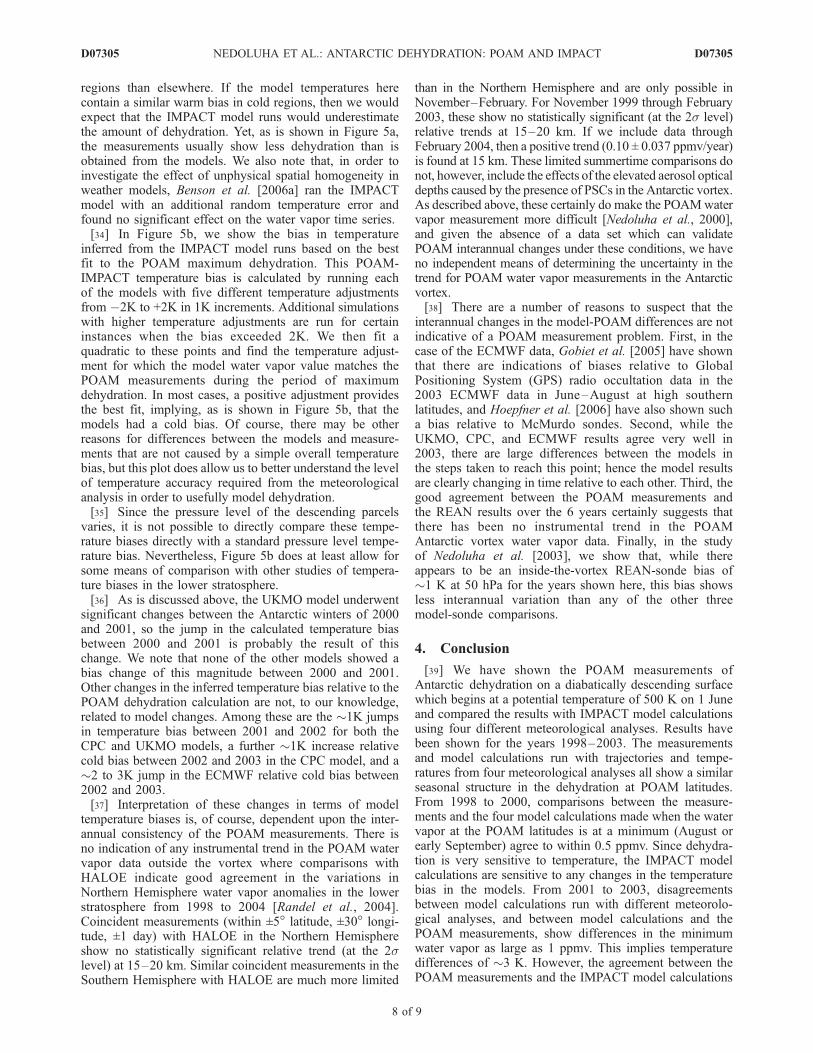
regions than elsewhere. If the model temperatures herecontain a similar warm bias in cold regions, then we wouldexpect that the IMPACT model runs would underestimatethe amount of dehydration. Yet, as is shown in Figure 5a,the measurements usually show less dehydration than isobtained from the models. We also note that, in order toinvestigate the effect of unphysical spatial homogeneity inweather models, Benson et al. [2006a] ran the IMPACTmodel with an additional random temperature error andfound no significant effect on the water vapor time series.[34] In Figure 5b, we show the bias in temperature
inferred from the IMPACT model runs based on the bestfit to the POAM maximum dehydration. This POAM-IMPACT temperature bias is calculated by running eachof the models with five different temperature adjustmentsfrom �2K to +2K in 1K increments. Additional simulationswith higher temperature adjustments are run for certaininstances when the bias exceeded 2K. We then fit aquadratic to these points and find the temperature adjust-ment for which the model water vapor value matches thePOAM measurements during the period of maximumdehydration. In most cases, a positive adjustment providesthe best fit, implying, as is shown in Figure 5b, that themodels had a cold bias. Of course, there may be otherreasons for differences between the models and measure-ments that are not caused by a simple overall temperaturebias, but this plot does allow us to better understand the levelof temperature accuracy required from the meteorologicalanalysis in order to usefully model dehydration.[35] Since the pressure level of the descending parcels
varies, it is not possible to directly compare these tempe-rature biases directly with a standard pressure level tempe-rature bias. Nevertheless, Figure 5b does at least allow forsome means of comparison with other studies of tempera-ture biases in the lower stratosphere.[36] As is discussed above, the UKMO model underwent
significant changes between the Antarctic winters of 2000and 2001, so the jump in the calculated temperature biasbetween 2000 and 2001 is probably the result of thischange. We note that none of the other models showed abias change of this magnitude between 2000 and 2001.Other changes in the inferred temperature bias relative to thePOAM dehydration calculation are not, to our knowledge,related to model changes. Among these are the �1K jumpsin temperature bias between 2001 and 2002 for both theCPC and UKMO models, a further �1K increase relativecold bias between 2002 and 2003 in the CPC model, and a�2 to 3K jump in the ECMWF relative cold bias between2002 and 2003.[37] Interpretation of these changes in terms of model
temperature biases is, of course, dependent upon the inter-annual consistency of the POAM measurements. There isno indication of any instrumental trend in the POAM watervapor data outside the vortex where comparisons withHALOE indicate good agreement in the variations inNorthern Hemisphere water vapor anomalies in the lowerstratosphere from 1998 to 2004 [Randel et al., 2004].Coincident measurements (within ±5� latitude, ±30� longi-tude, ±1 day) with HALOE in the Northern Hemisphereshow no statistically significant relative trend (at the 2slevel) at 15–20 km. Similar coincident measurements in theSouthern Hemisphere with HALOE are much more limited
than in the Northern Hemisphere and are only possible inNovember–February. For November 1999 through February2003, these show no statistically significant (at the 2s level)relative trends at 15–20 km. If we include data throughFebruary 2004, then a positive trend (0.10 ± 0.037 ppmv/year)is found at 15 km. These limited summertime comparisons donot, however, include the effects of the elevated aerosol opticaldepths caused by the presence of PSCs in the Antarctic vortex.As described above, these certainly do make the POAMwatervapor measurement more difficult [Nedoluha et al., 2000],and given the absence of a data set which can validatePOAM interannual changes under these conditions, we haveno independent means of determining the uncertainty in thetrend for POAM water vapor measurements in the Antarcticvortex.[38] There are a number of reasons to suspect that the
interannual changes in the model-POAM differences are notindicative of a POAM measurement problem. First, in thecase of the ECMWF data, Gobiet et al. [2005] have shownthat there are indications of biases relative to GlobalPositioning System (GPS) radio occultation data in the2003 ECMWF data in June–August at high southernlatitudes, and Hoepfner et al. [2006] have also shown sucha bias relative to McMurdo sondes. Second, while theUKMO, CPC, and ECMWF results agree very well in2003, there are large differences between the models inthe steps taken to reach this point; hence the model resultsare clearly changing in time relative to each other. Third, thegood agreement between the POAM measurements andthe REAN results over the 6 years certainly suggests thatthere has been no instrumental trend in the POAMAntarctic vortex water vapor data. Finally, in the studyof Nedoluha et al. [2003], we show that, while thereappears to be an inside-the-vortex REAN-sonde bias of�1 K at 50 hPa for the years shown here, this bias showsless interannual variation than any of the other threemodel-sonde comparisons.
4. Conclusion
[39] We have shown the POAM measurements ofAntarctic dehydration on a diabatically descending surfacewhich begins at a potential temperature of 500 K on 1 Juneand compared the results with IMPACT model calculationsusing four different meteorological analyses. Results havebeen shown for the years 1998–2003. The measurementsand model calculations run with trajectories and tempe-ratures from four meteorological analyses all show a similarseasonal structure in the dehydration at POAM latitudes.From 1998 to 2000, comparisons between the measure-ments and the four model calculations made when the watervapor at the POAM latitudes is at a minimum (August orearly September) agree to within 0.5 ppmv. Since dehydra-tion is very sensitive to temperature, the IMPACT modelcalculations are sensitive to any changes in the temperaturebias in the models. From 2001 to 2003, disagreementsbetween model calculations run with different meteorolo-gical analyses, and between model calculations and thePOAM measurements, show differences in the minimumwater vapor as large as 1 ppmv. This implies temperaturedifferences of �3 K. However, the agreement between thePOAM measurements and the IMPACT model calculations
D07305 NEDOLUHA ET AL.: ANTARCTIC DEHYDRATION: POAM AND IMPACT
8 of 9
D07305
run with the REAN analysis for this period is always within0.2 ppmv, implying a temperature bias of <0.5 K. Compa-risons between the REAN analysis and sondes [Nedoluhaet al., 2003] indicate that there is a consistent inside-the-vortex REAN-sonde bias of �1 K at 50 hPa, so it is possiblethat this good absolute agreement is in part the result of asmall high bias in both the POAM water vapor and theREAN temperatures. The interannual consistency of theagreement is a good indication of the stability of the POAMwater vapor data set and of the REAN temperatures at thislevel and of the applicability of this technique to infertemperature biases.[40] Given the consistency of the POAM water vapor and
the REAN temperatures, the cause of the unusually highozone at the top edge of the ozone hole during all fourAntarctic winters from 2001 to 2004 shown in the study ofHoppel et al. [2005] remains undetermined. The results heresuggest that the REAN temperatures show no change in biasthroughout the years 1998–2003, while Hoppel et al.[2005] showed that the ozone loss was reduced even thoughREAN temperatures were not unusually high in 2001 and2003. It is possible that the results here are not applicable tothat study because most of the POAM measured ozone losstakes place somewhat later in the season (�September) thanthe dehydration, and the upper edge of the ozone loss is atslightly higher altitudes (�20–22 km) than is being studiedhere.
[41] Acknowledgments. The POAM III instrument was sponsored bythe Office of Naval Research. The French Centre National d’EtudesSpatiales operates the SPOT 4 spacecraft and has generously waived uplinkfees. Support for scientific analysis of the data comes from the NavalResearch Laboratory and from NASA. This work was performed while C.Benson held a National Research Council Research Associateship Award atthe Naval Research Laboratory, Washington, DC.
ReferencesBenson, C. M., et al. (2006a), Microphysical modeling of southern polardehydration during the 1998 winter and comparison with POAM IIIobservations, J. Geophys. Res., 111, D07201, doi:10.1029/2005JD006506.
Benson, C. M., et al. (2006b), Polar stratospheric clouds in the 1998–2003Antarctic vortex: Microphysical modeling and POAM III observations,J. Geophys. Res., 111, D18206, doi:10.1029/2005JD006948.
Bowman, K. P. (1996), Rossby wave phase speeds and mixing barriers inthe stratosphere. Part I: Observations, J. Atmos. Sci., 53, 905–916.
Drdla, K. (1996), Applications of a model of polar stratospheric clouds andheterogeneous chemistry, Ph.D. thesis, Univ. of Calif., Los Angeles.
Drdla, K., M. R. Schoeberl, and E. V. Browell (2003), Microphysicalmodeling of the 1999–2000 Arctic winter: 1. Polar stratospheric clouds,denitrification, and dehydration, J. Geophys. Res., 108(D5), 8312,doi:10.1029/2001JD000782.
European Centre for Medium-Range Weather Forecasts (ECMWF) (2003),Changes to the operational forecasting system, ECMWF Newsl., 99, 1–2.
Gobiet, A., et al. (2005), Climatological validation of stratospherictemperatures in ECMWF operational analyses with CHAMP radio occul-tation data,Geophys. Res. Lett., 32, L12806, doi:10.1029/2005GL022617.
Hoepfner, M., et al. (2006), Spectroscopic evidence for NAT, STS, and icein MIPAS infrared limb emission measurements of polar stratosphericclouds, Atmos. Chem. Phys., 6, 1201–1219.
Hoppel, K., et al. (2005), Reduced ozone loss at the upper edge of theAntarctic Ozone Hole during 2001–2004, Geophys. Res. Lett., 32,L20816, doi:10.1029/2005GL023968.
Kelly, K. K., et al. (1989), Dehydration in the lower Antarctic stratosphereduring late winter and early spring, 1987, J. Geophys. Res., 94(D9),11,317–11,357.
Kistler, R., et al. (2001), The NCEP-NCAR 50-year reanalysis: Monthlymeans CDROM and documentation, Bull. Am. Meteorol. Soc., 82,247–267.
Lumpe, J., et al. (2006), Validation of POAM III version 4 stratosphericwater vapor, J. Geophys. Res., 111, D11301, doi:10.1029/2005JD006763.
Manney, G. L., et al. (1996), Comparison of UK Meteorological Office andUS National Meteorological Center stratospheric analyses during northernand southern winter, J. Geophys. Res., 101(D6), 10,311–10,334.
Manney, G. L., et al. (2003), Lower stratospheric temperature differencesbetween meteorological analyses in two cold Arctic winters and theirimpact on polar processing studies, J. Geophys. Res., 108(D5), 8328,doi:10.1029/2001JD001149.
Nash, E. R., et al. (1996), An objective determination of the Polar vortexusing Ertel’s potential vorticity, J. Geophys. Res., 101(D5), 9471–9478.
Nedoluha, G. E., et al. (2000), POAM III measurements of dehydration inthe Antarctic lower stratosphere, Geophys. Res. Lett., 27, 1683–1686.
Nedoluha, G. E., et al. (2002), POAM III measurements of dehydration inthe Antarctic and comparisons with the Arctic, J. Geophys. Res.,107(D20), 8290, doi:10.1029/2001JD001184.
Nedoluha, G. E., et al. (2003), POAM measurements of PSCs and watervapor in the 2002 Antarctic vortex, Geophys. Res. Lett., 30(15), 1796,doi:10.1029/2003GL017577.
Newman, P. A., et al. (1998), Meteorological atlas of the Southern Hemi-sphere lower stratosphere for August and September 1987, in NASA Tech.Memo, TM-4049, 131 pp.
Pruppacher, H. R., and J. D. Klett (1997), Microphysics of Clouds andPrecipitation, 2nd ed., Springer, New York.
Randel, W. J., et al. (2004), Interannual changes of stratospheric watervapor and correlations with tropical tropopause temperatures, J. Atmos.Sci, 61, 2133–2148.
Rosenfield, J. E., and M. R. Schoeberl (2001), On the origin of polar vortexair, J. Geophys. Res., 106(D24), 33,485–33,498.
Rosenfield, J. E., et al. (1994), Computations of diabatic descent in thestratospheric polar vortex, J. Geophys. Res., 99(D8), 16,677–16,689.
Santee, M. L., et al. (2005), Polar processing and development of the 2004Antarctic ozone hole: First results from MLS on Aura, Geophys. Res.Lett., 32, L12817, doi:10.1029/2005GL022582.
Stone, E. M., et al. (2001), Onset, extent, and duration of dehydration in theSouthern Hemisphere polar vortex, J. Geophys. Res., 106(D19), 22,979–22,989.
Swinbank, R., and A. O’Neill (1994), A stratospheric-tropospheric dataassimilation system, Mon. Weather Rev., 122, 686–702.
Tabazadeh, A., S. T. Martin, and J.-S. Lin (2000), The effect of particle sizeand nitric acid uptake on the homogeneous freezing of aqueous sulfuricacid particles, Geophys. Res. Lett., 27(8), 1111–1114.
Trenberth, K. E., and J. G. Olson (1988), Evaluation of NMC globalanalyses, in NCAR Tech. Note, NCAR/TN-2991STR, 82 pp.
Voemel, H., et al. (1995), The evolution of the dehydration in the Antarcticstratospheric vortex, J. Geophys. Res., 100(D7), 13,919–13,926.
�����������������������J. Alfred, Computational Physics Inc., Springfield, VA, USA.C. M. Benson, R. M. Bevilacqua, K. W. Hoppel, and G. E. Nedoluha,
Naval Research Laboratory, 4555OverlookAvenue, Code 7277Washington,DC 20375-5000, USA. ([email protected])K. Drdla, NASA Ames Research Center, Moffet Field, CA, USA.
D07305 NEDOLUHA ET AL.: ANTARCTIC DEHYDRATION: POAM AND IMPACT
9 of 9
D07305