Seismic axial collapse of shear damaged heavily reinforced ...
Upload
khangminh22Category
view
0download
0
ANALYSIS OF SHEAR STRENGTH FOR REINFORCED CONCRETE BLOCKWORK BEAMS
Songbo Li 1, Dr. A.N. Fried2 and Prof. J.J. Roberts3
1. ABSTRACT
The shear strength of a series of experimentally tested reinforced concrete blockwork beams is examined. Most of the beams had enough flexural strength and failed by shear. This is because, when compared with reinforced concrete beams, it is often not possible to have anti-shear measures such as link bars or bent up bars in reinforced masonry structural members. This investigation evaluates the shear capacity of blockwork beams and other kinds of masonry structures within these constrains.
2. INTRODUCTION
A series of tests on reinforced concrete blockwork (RCB) beams were carried out at the British Cement Association[lJ. The programme included 38 specimens tested to failure using a two point loading system. Single, double and soldier course beams were used to investigate the effect of the amount of tension reinforcement, block and mortar strength and shear spanjeffective depth ratio on the shear strength of these beams.
Prior to these tests, an extensive programme of work [3.4J on RCB members subjected to flexure had been carried out but limited data on the shear behaviour of these beams was available hence the further testing of 38 beams.
Keywords: Blockwork; Beams; Shear; Reinforcement.
lResearcher, School of Civil Engineering, Kingston University, Kingston upon Thames, Surrey KT1 2EE, UK
2Senior Lecturer of Civil Engineering, Kingston University
3Dean of the Faculty of Technology, Kingston University
1021

The analytical work indicated that the equation used to determine shear strength in BS 5628: Par 2 [5], did not consider how changes in material properties affect the shear resistance. A theoretical statistical analysis using masonry properties obtained from previous shear tests [1 ] was utilised to enable comparisons with the test results to be made and from which recommendations on how to determine the shear strength of RCB beams are made.
3. MATERIAL PROPERTIES
A U shaped dense aggregate concrete block was used in al l the beams. The blocks were 190x190x390 mm in length. Beams were constructed as single, double or soldier course beams. High yield reinforcement was placed in the bottom of the U shaped cores. A two point loading system was adopted with a f i xed constant moment region 900 mm long between the two load points. The shear span was varied to give a number of different shear span/effective depth ratios, thus resulting in beams of various lengths. A typical beam is shown in Fig.1.
L
Fig.1 Typical Two Course Beam Configuration
The concrete blocks were obtained from one manufacturer only and were of two different strengths designated 1 and 2 (Table 1). The mean net compressi ve strength of ten blocks of each strength grade was obtained by testing to BS 6073: 1981: Precast Concrete Masonry Units[6]. The mean net compressive strength for block type 1 was 15.4 N/mm2 with a standard deviation of 0.9 N/mm2 and coefficient of variation of 5.8%; for block type 2 the mean net compressive strength was 44.6 N/mm2 with a standard deviation of 2.6 N/mm2 and a coefficient of variation of 5.8%. These results are given in Table 2.
Mortar designation [i) [7] was used throughout the programme and consisted of ordinary Portland cement, lime and building sand in the proportions 1 1/4 3 by volume. Three 100 mm cubes were made from each batch of mortar and subsequently cured. They were tested at 28 days in accordance with BS 1881: 1970: Methods of Testing Concrete: Part 4: Methods of Testing Concrete for Strength[8]. The mean compressive strength of mortar used with type 1 blocks was 17.8 N/mm2 with a standard deviation of 3.6 N/mm2 and coefficient of variation 20%. The mortar used with type 2 blocks had a mean compressive strength of 19.8 N/mm2 with a standard deviation of 3.0 N/mm2 and coefficient of variation of 15% (Table 2) .
1022

Table 1. Beam Details
Beam Beam No. Type
76 77 78 79 80 81 82 83 84 85 86 87 88 89 90 91 92 93 94 95 96 97 98 99
100 101 102 103 104 105 106 107 108 109 110 111 112 113
Two
801-dier
8ingle
Block Type
1 1 1 1 1 1 1 1 1 1 1 1 1 1 1 1 1 1 1 1 1 1 1 1 1 2 2 2 2 2 2 2 2 2 2 2 2 2
No, Type & Diameter of Reinft.
2T20
2T12
2T25
2T20 2T25 2T12 2T20 2T25 2T16 3T25 2T20
2T12
Effective Depth, d (mm)
320
125
8hear 8pan/Eff Depth Ratio av/d
1.0 1.5 2.0 2.5 3.0 4.0 1.0 1.5 2.0 2.5 3.0 4 . 0 1.0 1.5 2.0 2.5 3.0 4.0 3.5 3 . 5 5.0 5.0 5.0 5.0 5.0 1.5 2.5 3.5 4.5 1.5 2.5 3.5 4.5 1.7 2.5 3.5 4.5 5.5
Total 8pan (mm)
1540 1860 2180 2500 2820 3460 1540 1860 2180 2500 2820 3460 1540 1860 2180 2500 2820 3460 3140 3140 4100 4100 4100 4100 4100 1860 2500 3140 3750 1860 2500 3140 3750 1320 1525 1775 2025 2275
Two different concrete mixes were used to fill the cores of the beams, each of which was designed to have a mean strength equal to the mean net strength of the block. Three 100 mm cubes were made from each batch of concrete and subsequently cured and tested at 28 days in accordance with BS 1881: 1970: Part 4 [8J . For the lower strength infill used with beams 76 - 100, the mean compressive strength was found to be 16.8 N/ mm2 with a standard deviation of 2 . O
1023

N/mm2 and coefficient of variation of 12%. The corresponding figures for the higher strength infill (beams 101 - 113) were 54.1 N/mm2, 3.2 N/mm2 and 5.9% respectively. The mean compressive strengths are given in Table 2.
Table 2. Summary of Strength of Beam Components (N/mm2)
Beam No.
76 77 78 79 80 81 82 83 84 85 86 87 88 89 90 91 92 93 94 95 96 97 98 99
100 101 102 103 104 105 106 107 108 109 110 111 112 113
High
Nett Comp Str of Block
15.4
44.6
yield deformed test programme. The in each beam are
Mean Comp Str of Infill
21.3 19.2 18.9 13. O 18.9 17.6 16.1 17.5 15.7 17.1 15.7 14.1 15.7 15.3 15.2 17.6 16.3 13.7 19.5 16.1 18.2 19.1 16 .1 14.8 17.1 57.1 55.9 57.1 53.3 57.3 56.5 53.5 49.4 54.8 53.3 53.5 46.4 54.8
steel bars
Overall Mean
16.8
54.1
were used
Mean Comp Str of Mortar
16.3 11. 8 17.8 20.1 12.5 12.8 16.1 17.4 19.2 19.9 13.3 15.3 14.7 21. 9 25.8 16.5 18.0 19.1 19.8 19.5 17.8 19.9 19.0 19.3 20.5 21.1 23.5 21.1 18.4 21. O 25.3 17.1 15.4 19.7 23.0 16.2 17.7 17.8
throughout the number, type and diameter of bars used shown in Table 1. Specimens of
reinforcement were tested in tension for most of the beams
1024
to obtain the ultimate strength.
4. TESTING PROCEDURE
All beams were tested approximately 28 days after placing the concrete infill. The test cycle was as follow:
The beams were lifted onto bearings in the test rig which gave simple support conditions. The span varied depending upon the shear spanjeffective depth ratio of the beam (see Fig .1) .
Load was applied 450 mm either side of the beam centre line and, for the two course beams, care was taken to ensure the same configuration of blocks in the constant moment region in all cases.
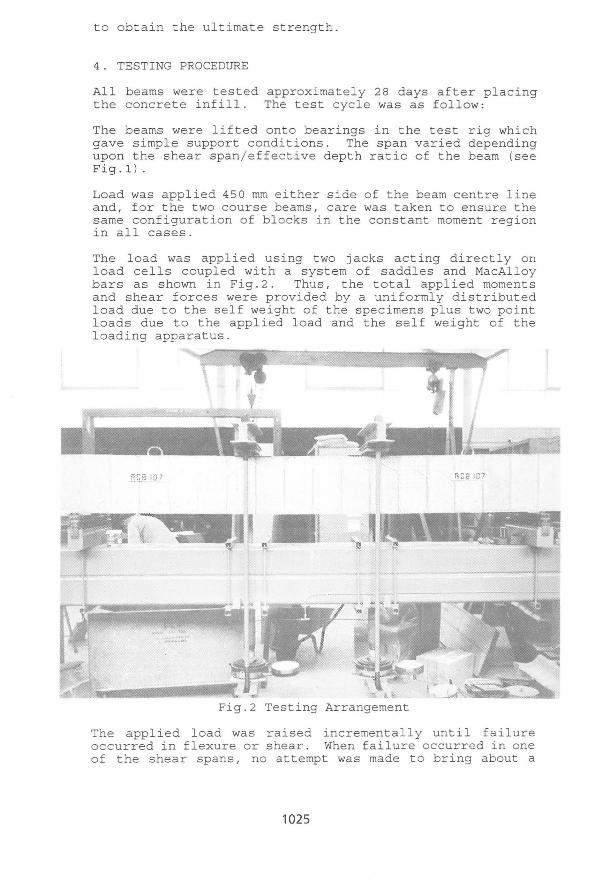
The load was applied using two jacks acting directly on load cells coupled with a system of saddles and MacAlloy bars as shown in Fig.2. Thus, the total applied moments and shear forces were provided by a uniformly distributed load due to the self weight of the specimens plus two point loads due to the applied load and the self weight of the loading apparatus.
RCBIO;
t.
Fig.2 Testing Arrangement
The applied load was raised incrementally until failure occurred in flexure or shear. When failure occurred in one of the shear spans, no attempt was made to bring about a
1025

second failure in the other shear span.
5 . TEST RESULTS AND ANALYSIS
5.1 Description and Discussion of Test Results
In general, alI beams were broken apart after the test in order to examine the bond between the concrete infill and block. In the beam tests the bond between block and infill only rarely failed and then only in the most highly stressed region of the beam at the moment of failure. This failure was evidenced by cracking in the top surface of the beam and not by delamination of the block shell .
A typical failure pattern of the beams is shown in Fig.2 and the ultimate load obtained from alI the tests are shown in Table 3. Most of the tested beams failed in shear. Of the 38 beams tested, two (Nos. 96 and 113) failed in flexure and three (Nos. 99, 108 and 112) showed partial flexural failure. Table 1 and 3 indicate that beams No.96 and 113 have the largest shear span/effective depth ratios and the least amounts of reinforcement . Similarly, beams 99, 108 and 112 also have larger shear span/effective depth ratios and smaller amounts of reinforcement when compared with others. Clearly, this series of infilled reinforced concrete hollow blockwork beams usually had enough flexural strength in the usual load ranges unless there were extremely large ratios of shear span/effective depth and extremely small amount of reinforcement. In general, however, the shear resistance of RCB beams is worse than the flexural.
The brittle nature of a shear failure as opposed to the ductile flexural failure of an under-reinforced beam has resulted in engineers generally designing for flexural rather than shear failure. However, it is not easy to put anti-shear measures into reinforced blockwork beams as is the case with reinforced concrete ones . Reinforcement in blockwork beams can only be placed in the cores parallel to the length of the beam. This will not constitute its most effective use and further highlights the need to examine shear behaviour in these elements.
5 . 2 The Shear Strength of Masonry Beams
5.2.1 Consideration for the Calculation of Shear Strength
Determining brick/block important. masonry is
the shear strength in the design of any masonry flexural structural members is clearly In BS 5628: Part 2 [51 , the shear strength of
determined using:
(BS)
where f v As
is the design shear strength of the masonry; is the cross sectional area of the tensile
1026

reinforcement; b is the breadth of the blockwork beam; d is the effective depth of the blockwork beam; a is the shear span of the beam.
Table 3. Shear Forces from Tests and Calculations (kN)
Beam Vt from VBS
No. Tests BS 5628
76 77 78 79 80 81 82 83 84 85 86 87 88 89 90 91 92 93 94 95 96 97 98 99
100 101 102 103 104 105 106 107 108 109 110 111 112 113
152.4 147.6 108.7 86.8 62.0 58.2
123.4 77.6 62 . 7 47.8 40.0 30.2
202.4 186.6 147.2 103.8
70.5 60.2 61.1 65.6 23.7 48.7 52.2 36.2 53.2
176.1 102 .8 76.1 63.9
197.6 96.8 93.1 68.9 76.8 47.9 35.4 27.0 22 .0
72.62 68.59 64.55 60.52 56.48 48.41 56.79 53.63 50.48 47.32 44.17 37.86 86.54 81.73 76.92 72 .11 67.31 57.69 52.45 62.50 31.55 40.34 48.08 35.40 58.81 68.59 60.52 52.45 44.38 68.59 60.52 52.45 44.38 25 . 46 23.01 19.94 16.87 13.81
175.66 108.38
84.14 52.29 56.22 40.67
107.78 79.14 56.19 48.79 37.33 26.62
190.84 132.74 102.63
89.32 71.54 48.39 51.53 61.80 26.54 36.36 44.19 25.14 74.19
307.29 188.25 139.27 103.28 329.52 203.48 139.63 102.65
93. 79 64.49 46.39 32.83 31.17
184.64 113.92
88.44 54.97 59.09 42.75 91.34 67.07 47.62 41.35 31.64 22.56
192.98 134.22 103.78 90.32 72.34 48.93 54.17 62.49 22.50 38.21 44.69 24.66 63.55
323.01 197.88 146.39 108.57 346.37 213.89 146.77 107.90 97.94 67.34 48.45 34.28 32.55
189.25 143.08 118.37
84.73 80.81 53.63 91.87 74.15 60.12 50.47 41.33 27.81
198.43 159.93 132.17 114.60
92.45 58 . 48 69 . 16 76.66 18.52 36 .2 0 40.40 26.22 48.16
207.49 141.19
97.79 64.79
208.26 141.86
97 . 81 64.74 68.82 50.78 35 . 08 23.01 14.12
187.23 142.13 117.49
84.84 80.27 53.36 90.75 73.82 59.34 50 .19 40.68 27.24
199.55 160.82 132.90 115.20
92.93 58.72 68.53 77.05 18.49 35.86 40.57 25.72 48.07
208.65 141.64
98.28 64.45
212.30 144.42
98.34 64.34 69.17 50.88 35.05 22.68 14.14
V s Eq.5
177.39 135.23 111.74
82.48 76.48 51.07 90.94 74.86 59 .47 50 .87 40.60 26.94
204.22 164.13 135.37 115.92
94.41 61.19 65.15 78.35 18.93 34.20 41.37 24.45 53.09
214.13 145.10 101.00
65.57 220.83 150.17 101.12
65.39 70.87 52.05 35.79 22.76 14.56
In this equation, no variation in shear resistance is attributed to any of the masonry material properties. Shear resistance due to all material properties is assumed to be a constant value . The load bearing capacity of any member depends on the material strength, member shape and size and the support conditions so a specific term which
1027

includes the effects of material strength is appropriate.
Table 4. Ratios Between Test and Calculation
Beam No.
76 77 78 79 80 81 82 83 84 85 86 87 88 89 90 91 92 93 94 95 96 97 98 99
100 101 102 10 3 104 105 106 107 108 109 110 111 112 113
2.099 2.152 1.684 1.434 1.098+ 1.202 2.173 1.447 1.242 1.010+ 0.906+ 0 . 798 2.339 2.283 1.914 1. 439 1 .04 7 + 1.043+ 1.165 1.050+ 0.751 1.207 1. 086 + 1.023+ 0.905+ 2.568 1.699 1.451 1.440 2.881 1.600 1.775 1.553 3.016 2.082 1.775 1.600 1.594
Average= 1.567
S'= 0.821
0.868 1. 362 1.292 1. 660 1.103 1.431 1.145 0.981 1.116 0.980 1.072 1.134 1.061 1.406 1. 434 1.162 0.985 1.244 1.186 1.061 0.893 1.340 1.181 1.440 0.717 0.573 0.546 0.546 0.619 0.600 0.476 0.667 0.671 0.819 0.743 0.763 0.823 0.706
0.995 0.312
0.825 1.296 1. 229 1 .579 1.049 1. 361 1.351 1.157 1.317 1.156 1.264 1.338 1.049 1. 390 1.418 1.149 0.975 1. 230 1.128 1.050 1.054 1.274 1.168 1. 468 0.837 0.545 0.519 0.520 0.589 0.570 0.453 0.634 0.639 0.784 0.711 0.731 0.788 0.676
1.007 0.325
0.805 1.032 0.918 1.024 0.767 1.085 1.343 1 .0 47 1.043 0.947 0.968 1 .086 1.020 1.167 1.114 0.906 0.763 1 .029 0.884 0.856 1. 280 1.345 1.292 1.380 1.105 0.849 0.728 0.778 0.986 0.949 0.682 0.952 1.064 1 .116 0.943 1. 009 1.173 1.558
1.026 0.200
0.814 1.039 0.925 1.023 0.772 1.091 1.360 1.051 1.057 0.952 0.983 1.109 1 .014 1.160 1.108 0.901 0.759 1.025 0.892 0.851 1.282 1. 358 1.287 1. 408 1.107 0.844 0.726 0.774 0.991 0.931 0.670 0.947 1.071 1 .111 0.941 1.010 1.191 1.556
1.029 0.204
*S is the standard deviation for above ratios.
0.859 1.091 0.973 1.052 0.811 1.140 1.357 1.037 1.054 0.940 0.985 1.121 0.991 1.137 1.087 0.895 0.747 0.984 0.938 0.837 1. 252 1.424 1. 262 1.481 1.002 0.822 0.708 0.753 0.975 0.895 0.645 0.921 1.054 1.084 0.920 0.989 1.187 1.511
1.024 0.207
Table 3 and 4 show the total load to fail each beam, the shear resistance of the beams is accordance with BS 5628:
1028

Part 2 [ 5 ] and ratios of these values. The average of the ratio of Vt/VSS is 1.567, significantly greater than 1. O, and the standard deviation of this ratio is 0.821 as noted in Table 4. Fig.3 is a comparison between the test results and those predicted using BS 5628: Part 2 [5] • The figure indicates that above a test load of 75.0 kN, the estimated values drop below the unity line indicating an over conservative prediction from the code.
200
3: 150
"" ~ '" N
..\' '" V') " CIl ~" a:l E 100 o
<!:i
<: .~ õ 'ô e p..
50 .
o 50 100 150 200
Test Results (VI, kN)
Fig.3 Comparison of Predictions According to the BS 5628: Part 1 and Test
In Table 4, the ratios marked "+" are within an acceptable range of 1.0. A close examination of these beams indicates they nearly all have both reinforcement are as and shear span values intermediate between the maximum and minimum values. They could be considered to be balanced beams. This implies the BS 5628: Part 2 [5] equation is only appropriate for this type of beam.
Structural behaviour is usually determined theoretically using linear or nonlinear analytical techniques and this behaviour is then compared with test results. To model the nonlinear behaviour of masonry would require extensive theoretical analyses and sophisticated testing procedures would then be required to verify this. The resources
1029
available for this project have necessitated a more pragmatic approach. Two basic assumptions on the shear behaviour of RCB beams have been made. These are explained in further detail in the following.
5.2.2 The Calculation of Shear Force for RCB Beams
Based on the analysis of the test results which included the data obtained and observation made during the tests, two sets of assumptions about the calculation of shear force for RCB beams have been made.
Firstly, the masonry is coherent whole. In this considered . These are
considered to be acting as a case two expressions have been
(1)
(2)
where, V, and V2 are the total load capacity of the beam.
a =1 583(~)-O.934 ,. d
where, a is the shear span and d the effective depth of the beam.
A ~ 1 = O . 097 + 3 3 6 . 8 84 ( b~) 2
where, As is the cross sectional area of the tensile reinforcement in the beam and b is the breadth of the beam.
where,
(GBJ)
In which, the coefficients m and c depend on the ratio of the cross sectional areas between concrete infill and blocks. R, is the block strength, R2 is the mortar strength and Rc is the strength of concrete infill. Here, R", in Eq.GBJ is from China's National Standard GBJ 3-73 [2J where it is the equation used to determine masonry compressive strength. Fig.4[2J taken from the Chinese code of practice is based on 103 groups of specimens, in which, each group usually included 3 - 5 specimens. Based on this figure the equation for Ris:
1030

R=0.131Rl +0.277JRl R2 (GBJ1)
0.5
+ I I • I o
I I + +1 1--04
T
~ + ~ .--.. ;-~ ~ I
1-+ o .B. '4,jltD.Z 77~ o OI R, ', ' R ,
/' ,/ c. O
I I O +aI' ~
O O O
".{~ O "
~
I 0/
~: O'
O I I ,,'" I i
0.5
0·2
D·
:;<IcP'ô I + O
! '" I
I I I R,> 15 6
I I R, < 7:5 +
I P; ~ 7.5-:5 O o Q.l lil 05 O.:' 05 0·6 0-7 .,e ~ ; ~o a
R}-í?,
Fig.4
In Fig.4, most of the tested masonry compressive strengths are lower than the one obtained from Eq.GBJ1 when the unit strength RI is higher than 15 N/ mm2. The situation is reversed when Rl is lower than 7.5 N/ mm2. If we allow R in Eq.GBJ1 to be multiplied an adjusting coefficient ~,
cp=
then the calculated strength will be increased when Rl is lower than 8 N/ mm2 and decreased when RI is higher than 8 N/ mm2. This will give a f i nal equation of
which is Eq.GBJ above.
Rl +6 -~- = (O . lJR; +0. 2..(R; ) J RI +6 1.75R1
In the second case, poor bond between reinforcement and concrete, mortar and unit and the infill concrete and the block, is assumed t o result in the composite not behaving as a coherent who le . The expression for the shear capacity in these cases is assumed to comprise two parts, one representing the masonry and one the reinforcement in the beam. Three expressions have been considered ror the situation as shown below.
1031

where,
A f V3 =IX 3Rbd[0.173+0.0561n( ~:;) 1
.J:..=IX .( 5.196 + 2 .058) V 4 4 Rbd A Sfy
a IX 3 =1. 996-0.994ln(j
1 IX4=--------~--------
2.499-1.245 ln ~
a IX s=O. 217 -O .108ln(j
(3 )
(4)
(5)
where, V3 , V4 and V5 are the total load capacity of the beam and f y is the yield stress of the reinforcement.
Equations 3, 4 and 5 are broadly similar to the equation used in BS 5628: Part 2 [5) to predict shear strength but include specific terms which represent the masonry material properties. This group of equations can be represented as
where, V is the shear capacity of the beami Vrn is the shear capacity of the masonry part of the
beam; Vs is the shear capacity of the reinforcement in the
beam.
Tables 3 and 4 indicate the ultimate load capacity of the beams determined by test, the predicted load capacity of the beams in accordance with the above methods and ratios of the test result to predicted resulto
The averages of the ratio of the strength of the tested beams to their predicted strengths are near unity for all five methods. The standard deviation of all the sets of ratios are also much less than when the BS 5628: Part 2 [5]
prediction is used . Figures 5 and 9 illustrate clearly the close predictions when any of the five techniques are used to predict beam shear strength. The larger scatter of resul t in Fig. 3 indicates the inaccuracy of the ini tial assumption. In predicted situations the second assumption gives more consistent.
1032

300
$ 200 S o ~ ti)
~ o .... ... ()
:a 11) \.o
P. 100
o
• • • • • •
li
•
100 200
Trst Rrsults (Vt, kN)
Fig.5 Comparison of Predictions Using Eq.l with Test
6. CONCLUSIONS
The equation given to predict the shear strength of RCB beams in BS 5628: Part 2 [5J is only accurate up to total loads on the beams of about 60.0 kN.
Reasonably accurate predictions are obtained using BS 5628: Part 2 [ 5 J when beams with both moderate amounts of reinforcement and moderate span to depth ratios are used .
RCB beams behave in shear not as a coherent material but with significant desponding between the concrete block,
1033

mortar, concrete infill and reinforcement forming the beam.
No significant difference in shear behaviour was noted when single course or soldier course beams were tested and analyzed.
200
~ 150
~ .. ' .., q
a- ~ (I.l
E o
<I:: 100 "' " o
·C u '6 ~
c..
50 / V
o 50 100 150 200 Test Results 011, kN)
Fig.6 Comparison of Predictions Using Eq.3 with Test
7. RECOMMENDATIONS
Using equation 3 as a method of predicting the shear capacity of RCB beams is recommended.
8. REFERENCES
1. Roberts, J. J., "The Shear Behaviour of Reinforced Concrete Blockwork Beams", proceedings of the 3rd International Masonry Conference, the British Masonry Society, London, UK, 1992.10.
2. National Standard of China, "Design Code for Masonry Structures" , GBJ 3-73, Beijing, China, 1973.
3. Roberts, J . J . , "Further Work Reinforced Concrete Blockwork Loading" , Technical Report 531, Association, UK, 1980.5.
on the Behaviour of Subject to Lateral Cement and Concrete
4. Rathbone, A.J., "The Behaviour of Reinforced Concrete Blockwork Beams" , Technical Report 54 O, Cement and Concrete Association, UK, 198 0. 10.
1034

5. British Standard 1nstitution, "BS 5628: 1985: British Standard Code of Practice for Use of Masonry: Part 2: Structural Use of Reinforced and Prestressed Masonry" , BS1, London, UK.
6. British Standard Institution, "BS 6073: 1981: Precast Concrete Masonry Unit" , BS1, London, UK.
7. British Standard 1nstitution, Practice for the Structural London, UK.
"CP 121: 1973: Co de of Use of Masonry" , BS1,
8. British Standard 1nstitution, "BS 1881: 1970: Methods of Testing Concrete: Part 4: Methods of Testing Concrete for Strength" , BS1, London, UK.
1035

1036
Copyright © 2022 FDOKUMEN