Comparison of Shear Values of Concrete Beams by Different Codes ...
Upload
khangminh22Category
view
3download
0
Title Shear capacity of high-strength concrete beams with their pointof inflection within the shear span
Author(s) Islam, MS; Pam, HJ; Kwan, AKH
Citation Proceedings Of The Institution Of Civil Engineers: StructuresAnd Buildings, 1998, v. 128 n. 1, p. 91-99
Issued Date 1998
URL http://hdl.handle.net/10722/150318
Rights Creative Commons: Attribution 3.0 Hong Kong License
brought to you by COREView metadata, citation and similar papers at core.ac.uk
provided by HKU Scholars Hub

Shear capacity of high-strengthconcrete beams with their point ofinflection within the shear spanM. S. Islam, BSc(Eng), MEng, MPhil, MIEB, H. J. Pam, ME, PhD, MIEAust, CPEng,and A. K. H. Kwan, BSc(Eng), PhD, CEng, MICE
j The shear strength of concrete does notincrease in proportion with the concretegrade. Thus, when high-strength concrete isused in place of normal-strength concrete, theshear capacity of the structure could becomecritical. In the study presented, the effect ofconcrete strength on the shear capacity ofconcrete beams was investigated. As previousresearch on normal-strength concrete beamshas shown that the presence of an inflectionpoint within the shear span can significantlyinfluence the shear capacity, particular effortwas made to study this influence in the case ofhigh-strength concrete beams. The resultsindicate that, as the concrete strengthincreases, the shear capacity of the beam alsoincreases, but the shear capacity isproportional to the cube-root rather than thesquare-root of the concrete compressivestrength. It is also revealed that the presenceof an inflection point can increase the shearcapacity by as much as 100%, regardless ofwhether normal-strength or high-strengthconcrete is used. Finally, the test results wereanalysed by comparing them with thepredicted strength values calculated using theformulae given in the various codes andAoyagi’s equation.
Keywords: beams & girders; concretestructures; strength & testing of materials
IntroductionWith the rapid advancement of concretetechnology, high-strength concrete is becomingincreasingly widely used in the construction ofhigh-rise buildings and other reinforced-concrete structures. However, the tensile andshear strengths of high-strength concrete donot increase in proportion with the compressivestrength, and hence they could become morecritical. Of the two strength properties, theshear strength is of particular importancebecause the tensile strength is not normallyrelied on for carrying loads but shear isunavoidable in beam–column frame structures.
2. Although there has been a rapid growth ofinterest in high-strength concrete, currentspecifications for the shear strength ofreinforced concrete beams in the American
Concrete Institute (ACI) Building Code,1 BritishStandard2 and New Zealand Standard3 are basedon results of beam tests done using concreteswith relatively low compressive strengths. Acharacteristic of high-strength concrete loadedto failure under compression is that it fracturesvery suddenly, and in doing so forms failuresurfaces that are typically smooth planes.4
These smooth failure surfaces contrast greatlywith the rough surfaces typical of normal-strength concrete, which comprise irregularcracks that generally follow the aggregate–mortar interfaces. It could be expected that thesurface of a diagonal shear crack in a high-strength concrete beam would also be relativelysmooth and that the smooth surface might bedeficient in aggregate interlock (an importantcomponent of shear carried by concrete). Forthis reason, many codes have set the limit that,above a certain compressive strength, nofurther increase in shear strength should beallowed. The ACI Building Code and NewZealand Standard set this compressive strengthlevel at cylinder strengths of 68·9 and 70·0 MPa,respectively. However, the British Standard setsa much lower limit of 40·0 MPa cube strength(equivalent to approximately 30 MPa cylinderstrength) above which no further increase inshear strength can be allowed. In view of such adifference, it is considered necessary to checkwhether the present shear strength predictionequations are reasonable, overly conservative orunsafe when applied to high-strength concrete.
3. With regard to the way in which the shearstrength of concrete increases with thecompressive strength, the ACI Building Code1
and New Zealand Standard3 assume that thenominal shear capacity (the shear capacity ofthe beam section without shear reinforcement)is essentially a function of the square-root of thecompressive strength, while the BritishStandard2 and some other investigators5,6 take itas being proportional to the cube-root of thecompressive strength. It is thus apparent that,even for normal-strength concrete, there is nouniversally accepted relationship between theshear strength and compressive strength. Moreresearch on the shear of both normal-strengthand high-strength concrete structures isneeded.
4. In most of the design codes, the shear
Proc. Instn Civ.Engrs Structs &Bldgs, 1998, 128,Feb., 91–99
Paper 11509
Written discussioncloses 29 May1998
91
A. K. H. Kwan,Senior Lecturer,Department ofCivil andStructuralEngineering,The University ofHong Kong
H. J. Pam,Lecturer,Department ofCivil andStructuralEngineering,The University ofHong Kong
M. S. Islam,PostgraduateStudent,Department ofCivil andStructuralEngineering,The University ofHong Kong
capacity of a reinforced-concrete memberwithout web reinforcement is calculated byusing empirical formulae which are basedprincipally on experimental results obtainedusing simply supported beams. However, incontinuous beams or frame structures, thestress conditions are not quite the same as thosein a simply supported beam. The majordifference is that, in a continuous beam or abeam that forms part of a frame structure, thebending moment within the shear span can varyfrom sagging to hogging, or vice versa, asevidenced by the presence of an inflection pointwithin the shear span. In 1993, Aoyagi andEndo7 conducted an experimental study on theeffect of the presence of an inflection pointwithin the shear span by testing simplysupported reinforced concrete beams withoverhangs at both ends. The beams were eachsubjected to a distributed load applied within thetwo supports, and two point loads applied oneeach at the end of each overhang. Thedistributed load induced sagging moments overthe central portion of the beam, while the pointloads acting on the overhangs induced hoggingmoments at the supports; therefore, aninflection point was formed within each shearspan. Aoyagi and Endo found that the presenceof an inflection point within the shear span couldincrease the shear capacity of the beam by asmuch as 40% compared to that of the controlbeam which was subjected only to distributedload within the two supports. Subsequently,Aoyagi and Islam8,9 conducted a similarexperiment with the distributed load replacedby two point loads applied symmetrically withinthe span length (i.e. each beam was subjected tofour point loads, two within the span length andone each at the end of each overhang). It wasfound from the test results that the presence ofan inflection point within the shear span couldincrease the shear capacity by up to 70% comparedto that of the control beam which was subjected toonly two point loads within the span. Hence, theeffect of the presence of an inflection point withinthe shear span is even more pronounced in beamssubjected to concentrated loads. Both theaforementioned experimental investigations wereconducted on normal-strength concrete beams. Tothe best of the authors’ knowledge, no similar studyon high-strength concrete beams has ever beenconducted.
5. In the present study, an investigation wasmade of the effects of concrete strength (cubestrength of 25–100 MPa) and the location ofthe inflection point within the shear span onthe shear capacity of a concrete beam. Theresearch programme consisted of testing atotal of 25 reinforced-concrete beams underfour-point loading and analysis of the test resultsby comparing them with existing codeprovisions.
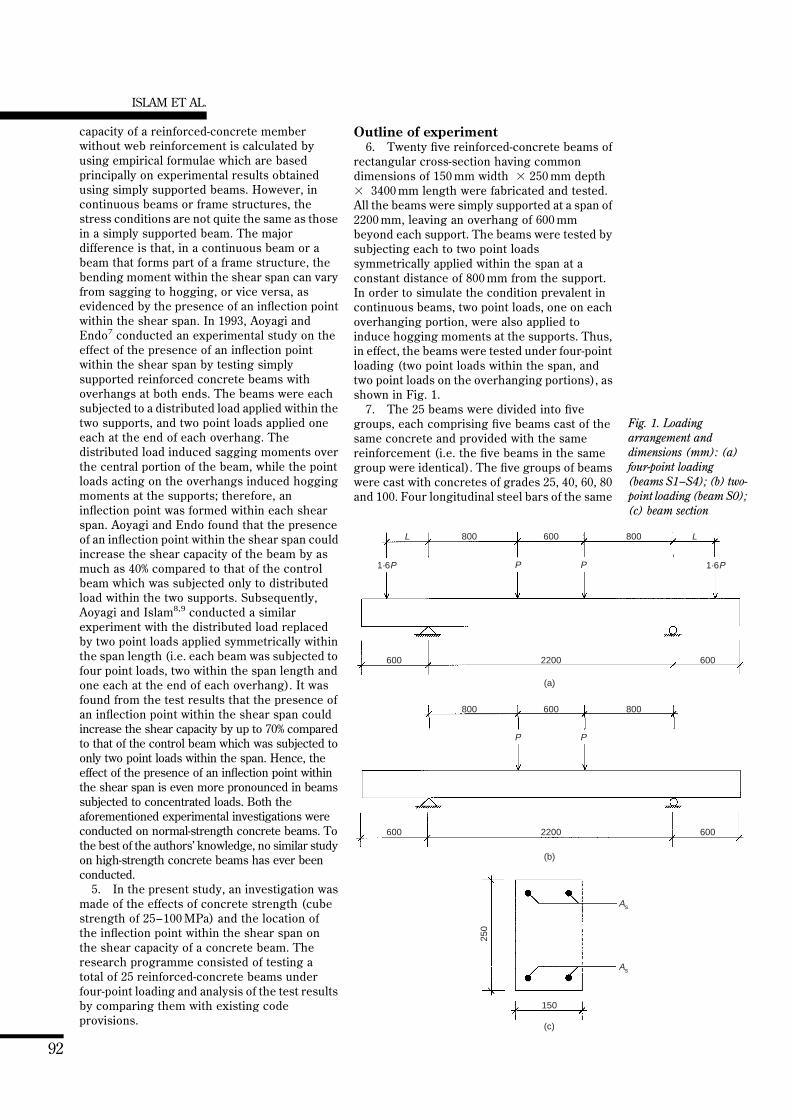
Outline of experiment6. Twenty five reinforced-concrete beams of
rectangular cross-section having commondimensions of 150 mm width 3 250 mm depth3 3400 mm length were fabricated and tested.All the beams were simply supported at a span of2200 mm, leaving an overhang of 600 mmbeyond each support. The beams were tested bysubjecting each to two point loadssymmetrically applied within the span at aconstant distance of 800 mm from the support.In order to simulate the condition prevalent incontinuous beams, two point loads, one on eachoverhanging portion, were also applied toinduce hogging moments at the supports. Thus,in effect, the beams were tested under four-pointloading (two point loads within the span, andtwo point loads on the overhanging portions), asshown in Fig. 1.
7. The 25 beams were divided into fivegroups, each comprising five beams cast of thesame concrete and provided with the samereinforcement (i.e. the five beams in the samegroup were identical). The five groups of beamswere cast with concretes of grades 25, 40, 60, 80and 100. Four longitudinal steel bars of the same
ISLAM ET AL.
92
800 800600
800 800600
600 2200 600
600 2200 600
L L
P P
P P
1·6P 1·6P
250
150
As
As
(c)
(b)
(a)
Fig. 1. Loadingarrangement anddimensions (mm): (a)four-point loading(beams S1–S4); (b) two-point loading (beam S0);(c) beam section

size were placed in each beam. Two of thelongitudinal bars were placed near the top of thebeam section and the other two near the bottom(see Fig. 1). Deformed mild steel bars were usedin the beams containing normal-strengthconcrete (grades 25 and 40), whereas deformedhigh-yield steel bars were used for theremainder of the beams which contained high-strength concrete (grade 60 and higher). Theleft-hand shear span (the shear span being thatpart of the beam from the support to the nearestpoint load applied within the main span)contained no shear reinforcement, but theremaining parts of the beam were provided withmore than sufficient shear reinforcement so thatany shear failure would be localized within theleft-hand shear span. The properties of thematerials used and the amount of reinforcementprovided in each group of beam specimens aregiven in Table 1.
8. The five identical beams in each groupwere designated by beam numbers S0–S4.Beams numbered S1, S2, S3 and S4 weresubjected to four-point loading, which inducedhogging moments at the supports and saggingmoments at the mid span of the beam. Due tothe changeover of hogging moments at thesupports to sagging moments at the mid span, apoint of inflection was formed within each shearspan (Fig. 2). As previous research had revealedthat the location of the inflection point couldsignificantly influence the shear capacity of thebeam, the distance a1 of the inflection point fromthe support was taken as a major parameter tobe studied. The location of the inflection pointcan be controlled either by adjusting the relativemagnitudes of the point loads applied at theoverhangs to those applied within the mainspan, or adjusting the positions of the pointloads applied on the overhangs. In the presentstudy the magnitude of the point loads appliedon the overhangs was controlled at all times tobe equal to 1·6 times the magnitude of the twopoint loads applied within the main span, whilethe distance L of the point loads applied on theoverhangs from the supports was varied to yielddifferent locations of the inflection points. Thevalues of L for the beams S1, S2, S3 and S4 aregiven in Table 2. The corresponding distances ofthe inflection point from the support, expressedin non-dimensional form as the ratio a1/d, whered is the effective depth of the beam, are alsogiven in Table 2. The remaining beam, S0, wasthe control. It was subjected only to two pointloads within the main span, and thus thesections at the supports may be taken asinflection points and the value of a1/d as zero.The test results for the control beams were usedfor comparison purposes to single out the effectof the presence of an inflection point within theshear span. Overall, the testing programme wasso designed that the ratio a1/d varied from 0 to4.
9. The mix designs of the different grades ofconcrete used are given in Table 3. Crushedvolcanic rock (maximum size of 10 mm) wasused as coarse aggregate and crushed volcanicfine passing through a 5-mm sieve was used asfine aggregate. The binders used consisted ofordinary Portland cement (OPC) only forconcrete grades 25 and 40, OPC plus pulverizedfuel ash (PFA) for concrete grades 60 and 80,and OPC, PFA and condensed silica fume (CSF)for concrete grade 100. A naphthalene-basedsuperplasticizer was added to each concrete mixuntil a slump of 75 mm was achieved. Six cubesand three cylinders were cast from each batch ofconcrete for quality control. Three of the cubeswere tested at the age of 7 days, while the otherthree cubes and the three cylinders were tested
SHEAR CAPACITY OF HIGH-STRENGTH CONCRETE
93
Table 1. Material properties of the beam specimens
Beam Concrete strength: MPa Top/bottom reinforcement Effectivegroup depth, d:
Cube Cylinder Bar fy: r: mmarrangement* MPa %
M100 104·2 83·3 2 B 25 mm (HS) 532 3·2 203M80 91·3 72·2 2 B 25 mm (HS) 532 3·2 203M60 65·4 50·8 2 B 20 mm (HS) 554 2·0 207M40 48·2 34·4 2 B 25 mm (MS) 320 3·2 205M25 33·9 26·6 2 B 20 mm (MS) 350 2·0 207
* MS, mild steel; HS, high-yield steel.
L LS S
P P1·6P 1·6P
600
M1
M 2
a1 a 2
Inflection point
Fig. 2. Diagrams of thebending moment and thepoint of inflection(dimensions in mm)
Table 2. Position of the point loads applied on the over-hangs and values of the a1/d ratio
Beam
S0 S1 S2 S3 S4
L: mm –* 125 250 375 500a1/d 0 1 2 3 4
* No load applied on overhanging portion.

at the age of 28 days. The concrete-strengthvalues given in Table 1 are the mean values ofthe cubes and cylinders tested at 28 days.
10. The beams were tested using a 1000-kNcapacity servo-hydraulic jack controlled by afully computerized MTS Teststar system(Fig. 3). The load was applied monotonicallyunder load control until the beam failedcompletely. During the test, vertical deflectionswere monitored using linear variabledisplacement transducers at the beam ends,quarter-span points and midspan of the beam.The strains in the longitudinal steel bars at thelocation where the bending moment wasmaximum were measured using electricalresistance strain gauges. Visual observations ofthe cracks were made during the tests. Theloads that caused the first flexural crack, themajor shear crack and failure of the specimenwere recorded.
Experimental results
Failure behaviour of the beams11. In general, all the beams behaved
similarly during the tests, except that they failedat different loads and the crack pattern variedfrom beam to beam, depending mainly on thelocation of the inflection point. As the appliedload was increased from the preload level (asmall load was applied to ensure tight fitting ofthe loading points before the test started), thevertical deflections and the strains in the steelincreased in a more or less linear manner untilthe beam cracked. The first flexural cracksappeared at the points of maximum moment.For S0 and S1 beams, the maximum momentwas sagging and occurred at midspan; for S3 andS4 beams, the maximum moment was hoggingand occurred at the supports; and for S2 beams,the maximum sagging and hogging momentsoccurred at midspan and the supports,respectively, and were of the same magnitude.As the applied load continued to increase, theflexural cracks gradually increased in number aswell as in length, and propagated verticallytowards the centroidal axis of the beam(Fig. 4(a)), except for the S2 beams where at alater stage the flexural cracks gradually turnedto an inclined direction (Fig. 4(b)).
12. Eventually, the flexural cracksdeveloped into a stable pattern and stoppedpropagating. Then, suddenly, diagonal shearcracks inclined at about 458 to the beam axisappeared within the left-hand shear span nearthe centroidal axis. However, the beams did notfail immediately. In fact, they were able to carryadditional loads after the formation of thediagonal shear cracks. As the load wasincreased further, the diagonal shear crackspropagated simultaneously towards the loadingpoint on the right and the support on the left. Asthe diagonal crack extended at both ends, the
angle of inclination of the crack extensiongradually decreased and, as a result, the shearcracks developed into the shape shown in Fig. 4.Finally, the width of the diagonal shear cracksincreased rapidly and the beams failed in shearin a brittle manner. Extensive splitting of theconcrete cover along the main steelreinforcement accompanied the shear failure.
13. After the tests had been completed it wasnoted that the surfaces of the diagonal shearcracks of the high-strength concrete beams
ISLAM ET AL.
94
Solid steel pins 1000 kNhydraulic jack
C L
Rigid steelI–beams
RC beam to be tested
LL
600 600 800800 600
Table 3. Mix proportions of the different grades of concrete
Concrete grade: MPa
25 40 60 80 100
Cement: kg/m3 272 308 324 395 400Water: kg/m3 204 185 180 172 170Fine aggregate: kg/m3 762 770 751 698 698Coarse aggregate: kg/m3 1142 1155 1127 1046 1046Pulverized fuel ash: kg/m3 – – 36 111 107Condensed silica fume: kg/m3 – – – – 26Superplasticizer: l/100 kg binder – 1.3 2.2 2.2 2.2
Fig. 3. Application ofload through a 1000-kNjack. RC, reinforcedconcrete (dimensions inmm)
(a)
(b)
Fig. 4. Typical crackpatterns for S0, S1, S3and S4 beams (a) andS2 beams (b)
were distinctly smoother than those of thenormal-strength concrete beams. This indicatedthat the high-strength concrete beams weredeficient in aggregate-interlocking action.Throughout the tests, the strain gaugemeasurements showed that none of thelongitudinal reinforcement in any of the beamshad yielded.
Effect of concrete strength14. The shear strengths of the 25 beams
tested are given in Table 4. It can be seen thatboth the concrete grade and the location of theinflection point have a significant effect on theshear strength of the concrete beams. In orderto isolate the effect of the concrete grade, themean shear strength of the five beams in eachbeam group was calculated. The mean valuesclearly indicate that the shear strengthincreases with the concrete grade, but the rateof increase in shear strength graduallydecreases until the shear strength stopsincreasing at a concrete grade of 80. This isprobably due to the lower effectiveness of theaggregate interlock in higher strength concrete.
15. It is also noted that the mean shearstrength of beam group M60 is lower than thatof beam group M40. This is because the amountof longitudinal reinforcement in beam groupM60 is smaller. As none of the reinforcementhad yielded, the actual yield strength of the steelwas of no significance and thus it did not matterwhether mild steel or high-yield steel was usedas reinforcement. As mild steel and high-yieldsteel have the same Young’s modulus, the onlyparameter that mattered was the amount oflongitudinal reinforcement provided or, to bemore precise, the area ratio r of the main steel.Two reinforcement-area ratios were used in thestudy. Beam groups M25 and M60 had the samesteel area ratio of 2·0%, and thus their meanshear strengths may be compared directly(Table 5). Likewise, beam groups M40, M80 andM100 had the same steel area ratio (3·2%): theirmean shear strengths are compared in Table 6.In Tables 5 and 6 the ratios of the mean shearstrength of the beam groups to that of the beamgroup having the lowest concrete strength aretabulated alongside the square-root and cube-root of the corresponding ratios of concretecompressive strength. From these results it canbe seen that the shear strength ratios are closerto the cube-root rather than the square-root ofthe concrete compressive strength ratios.Assuming that the shear strength isproportional to the square-root of the concretestrength would tend to overestimate theshear strength of high-strength concretebeams.
16. Overall, it may be concluded that theeffect of concrete strength may be best takeninto account by assuming that the sectionalshear strength varies as the cube-root of the
SHEAR CAPACITY OF HIGH-STRENGTH CONCRETE
95
Table 4. Shear strength of the beams tested
Beam Shear strength: MPagroup
S0 S1 S2 S3 S4 Mean ofbeam group
M100 2·14 3·55 4·32 3·19 2·66 3·17M80 1·91 3·86 4·05 3·80 2·37 3·20M60 1·47 2·97 3·34 2·91 1·67 2·47M40 1·79 2·76 3·13 2·63 2·51 2·56M25 1·53 2·17 3·03 1·82 2·11 2·13
Table 5. Comparison of shear strengths of beams with r ¼ 2·0%
Beam Ratio of mean Ratio of mean Square-root of Cube-root ofgroup shear strength to cube strength to cube strength cube strength
that of M25 beams that of M25 beams ratio ratio
M60 1·16 1·93 1·39 1·25M25 1·00 1·00 1·00 1·00
Table 6. Comparison of shear strengths of beams with r ¼ 3·2%
Beam Ratio of mean Ratio of mean Square-root of Cube-root ofgroup shear strength to cube strength to cube strength cube strength
that of M40 beams that of M40 beams ratio ratio
M100 1·24 2·16 1·47 1·29M80 1·25 1·89 1·37 1·24M40 1·00 1·00 1·00 1·00
3·0
2·5
2·0
1·5
1·0
0·5
0
She
ar s
tren
gth/
cont
rol b
eam
str
engt
h
0S0
1S1
2S2
3S3
4S4
a1/dBeam No.
M100M80M60M40M25
Fig. 5. Effect of inflectionpoint on shear strength
Table 7. Values of a1, a2, a and a/d
Beam number
S0 S1 S2 S3 S4
a1: mm 0 200 400 600 800a2: mm 800 600 400 200 0a: mm 800 600 400 600 800a/d 4 3 2 3 4
concrete strength up to a concrete grade of 80,beyond which no further increase in shearstrength should be allowed. There is still anincrease in shear strength of about 25% when theconcrete grade is raised from 40 to 80, and thusit would be overly conservative if no furtherincrease in shear strength beyond a concretegrade of 40 is allowed.
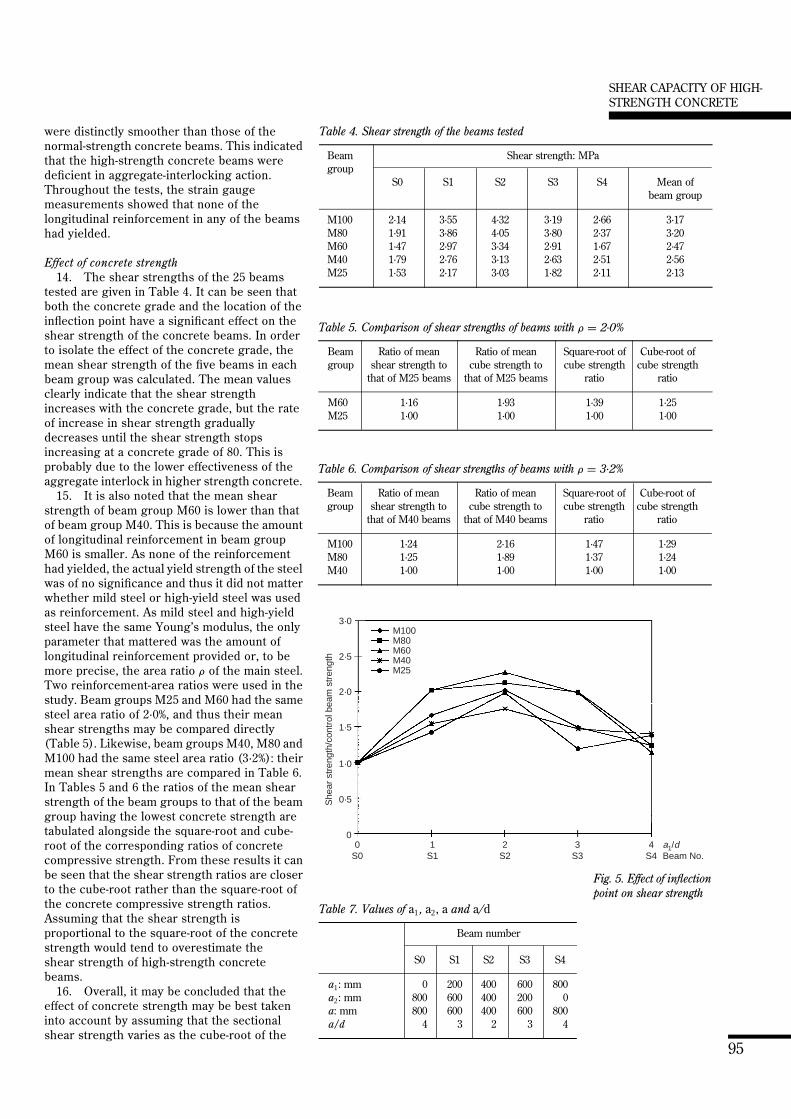
Influence of the location of the inflection point17. In order to visualize the effect of the
inflection point, the ratios of the sectional shearcapacities of the S1, S2, S3 and S4 beams to thatof the control beam (S0) are plotted against thecorresponding values of the ratio a1/d in Fig. 5.It is seen that the presence of an inflection pointwithin the shear span can increase the shearcapacity of a beam by as much as 100%. Themaximum increase in shear capacity occurswhen a1/d ¼ 2; that is, when the inflection pointis at the middle of the shear span. The generaltrend in the variation of the shear capacity withthe a1/d ratio is similar in the different beam
groups of different concrete strengths. Thus theeffect of the inflection point in high-strengthconcrete is similar to that in normal-strengthconcrete.
ISLAM ET AL.
96
3·0
2·5
2·0
1·5
1·0
0·5
0
She
ar s
tren
gth/
cont
rol b
eam
str
engt
h
0 1 2 3 4a/d
M100M80M60M40M25
βa = 0·75 + 1·4 /(a /d )
Fig. 6. Variation of shearstrength with the a/dratio
Table 8. Comparison of the test results with existing code provisions and Aoyagi’s equation
Beam Shear capacity of beam: kN
Test ACI BS 8110: NZS 3101: Japanese Aoyagi’sresult 318-89 1985 1995 JSCE equation
M100S0 65.0 44.6 48.0 50.8 61.8 61.8S1 107.7 46.0 48.0 50.8 61.8 68.4S2 131.1 48.9 48.0 50.8 61.8 117.1S3 96.9 46.0 48.0 50.8 61.8 68.4S4 80.7 44.6 48.0 50.8 61.8 61.8
M80S0 58.0 44.6 48.0 50.8 58.9 58.9S1 117.3 46.0 48.0 50.8 58.9 65.2S2 123.0 48.9 48.0 50.8 58.9 109.0S3 115.4 46.0 48.0 50.8 58.9 65.2S4 72.1 44.6 48.0 50.8 58.9 58.9
M60S0 45.5 38.2 42.8 44.3 45.9 45.9S1 92.3 39.1 42.8 44.3 45.9 50.9S2 103.8 41.0 42.8 44.3 45.9 82.4S3 90.4 39.1 42.8 44.3 45.9 50.9S4 51.9 38.2 42.8 44.3 45.9 45.9
M40S0 55.0 33.1 48.3 36.0 46.4 46.4S1 84.6 34.6 48.3 36.0 46.4 51.4S2 96.1 37.5 48.3 36.0 46.4 76.8S3 80.7 34.6 48.3 36.0 46.4 51.4S4 76.9 33.1 48.3 36.0 46.4 46.4
M25S0 47.5 28.4 40.5 32.0 37.0 37.0S1 67.3 29.3 40.5 32.0 37.0 41.0S2 94.2 31.2 40.5 32.0 37.0 59.6S3 56.5 29.3 40.5 32.0 37.0 41.0S4 65.4 28.4 40.5 32.0 37.0 37.0

18. As suggested by Aoyagi and Endo,7 theeffect of the inflection point may be explained byconsidering a fictitious support at the inflectionpoint that divides the shear span into twoshorter shear spans, one of length a1 and theother of length a2 (see Fig. 2). Hence, the lengthof the shear span is reduced from S to either a1
or a2, and since a beam with shorter shear spancan generally resist higher shear load, the shearcapacity is increased. As the longer shear spanhas lower shear strength, it is the larger of a1 ora2 that determines the shear capacity of thebeam. Denoting the larger value of a1 and a2 bya, it is postulated that the effect of the inflectionpoint is mainly a function of a/d, and that thesectional shear capacity of the beam varies witha/d as in the case of a deep beam or a beam withvery short shear span. The values of a1, a2, a anda/d for the beams tested are listed in Table 7,from which it can be seen that the beam S2 hasthe smallest value of a/d. This is why the S2beams have the highest shear capacities withinthe beam groups.
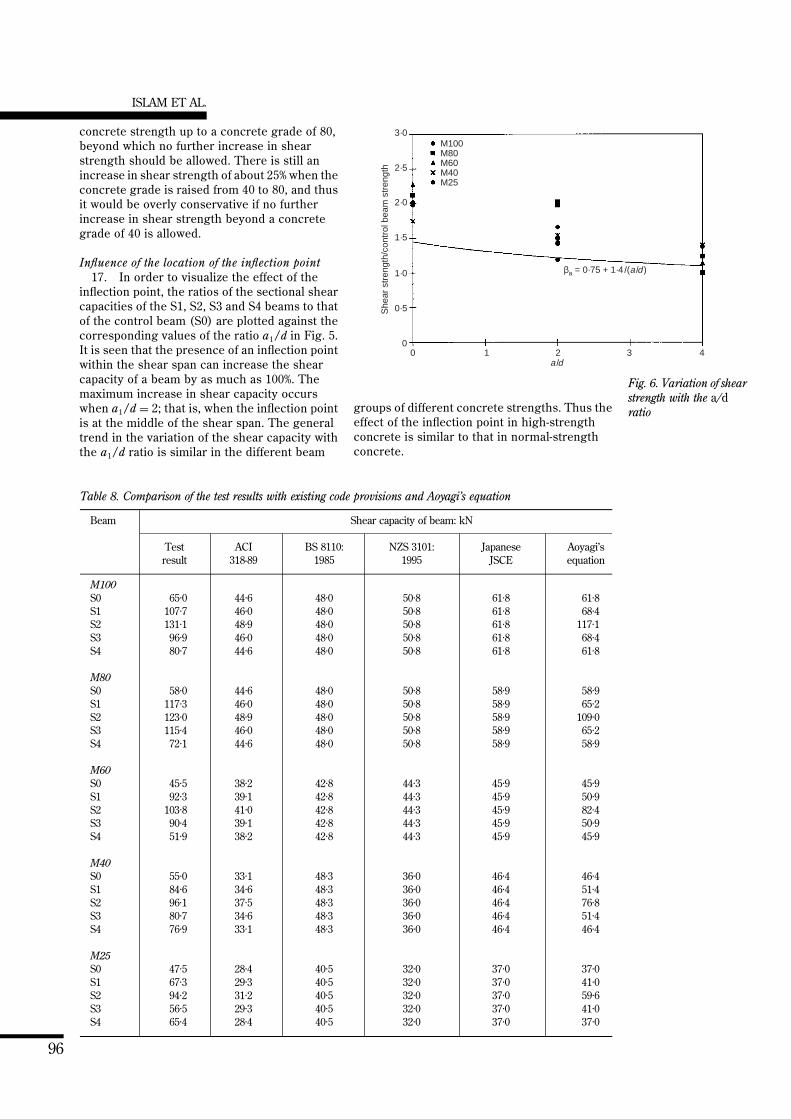
19. In order to study how the sectional shearcapacity varies with the a/d ratio, Fig. 5 wasreplotted with the quantity on the abscissa beinga/d, rather than a1/d (Fig. 6). The results showvery clearly that the section shear capacitydecreases as a/d increases, or vice versa.Aoyagi and Endo have proposed the use of thefollowing factor, which is being used in theJapanese JSCE Code10 to allow for the effect ofthe shear span, for estimating the effect of theinflection point:
ba ¼ 0·75 þ1·4a=d
ð1Þ
This factor is also plotted in Fig. 6 forcomparison with the test results. Thecomparison reveals that the above equation isgenerally a reasonably accurate andconservative estimate of the effect of theinflection point.
Comparison with existing codeprovisions and Aoyagi’s equation
20. In Table 8 the test results are comparedwith the predicted strengths calculated usingthe corresponding equations given in the ACIBuilding Code,1 British Standard,2 New ZealandStandard,3 Japanese JSCE Code10 and Aoyagi’sequation.7 The equations used in the calcul-ations are given in the Appendix. In order tovisualize the comparison better, the test resultsand the predicted strength values of the M40and M100 beams are plotted in Figs 7 and 8,respectively.
21. The comparison in Table 8 shows thatfor the control beams (S0) and the beams desig-nated S4 the existing codes predict reasonablywell the shear capacities of the beams and arebasically on the safe side. The ACI Building
Code is consistently the most conservative ofthe codes studied. On the other hand, theBritish Standard yields the highest shearstrength values when applied to normal-strength concrete but becomes relativelyconservative when applied to high-strengthconcrete because it does not allow for anincrease in shear strength above a concretegrade of 40.
22. The comparisons in Table 8 and inFigs 7 and 8 show that for the beams designatedS1, S2 and S3, which have substantially highershear strength than the control beams in thesame beam group, all the existing codessignificantly underestimate their shearstrength. This is because the effect of theinflection point has not been properly allowedfor in these codes. However, Aoyagi’s equation,which is modified from the Japanese JSCE Codeto allow for the effect of the inflection point(equation (1)), yields predicted shear strengthvalues that are in closest agreement with thetest results, and still remain generally on thesafe side.
SHEAR CAPACITY OF HIGH-STRENGTH CONCRETE
97
160
140
120
100
60
80
20
40
0
She
ar c
apac
ity o
f bea
m: k
N
Test resultACIBSNZSJSCEAoyagi
0S0
1S1
2S2
3S3
4S4
a1/dBeam No.
Fig. 8. Test results andpredicted strength valuesfor the M100 beams
140
120
100
60
80
20
40
0S
hear
cap
acity
of b
eam
: kN
Test resultACIBSNZSJSCEAoyagi
0S0
1S1
2S2
3S3
4S4
a1/dBeam No.
Fig. 7. Test results andpredicted strength valuesfor the M40 beams

Conclusions23. A number of beams cast of normal-
strength and high-strength concretes weretested under four-point loading to study theeffects of the concrete strength and theinflection points within the shear spans on theshear strength of the beams. The test resultsand their comparison with the existing codeprovisions and Aoyagi’s equation revealed thefollowing.
(a) The shear strength of a reinforced-concretebeam without stirrups increases withincreasing concrete compressive strength,but the rate of increase in shear strengthgradually decreases as the concretestrength increases until the shear strengthstops increasing at a concrete cube strengthof about 80 MPa. Below this concretestrength level the shear strength of a con-crete beam varies more or less as a cube-root function of the concrete compressivestrength.
(b) The presence of an inflection point withinthe shear span can increase the shearcapacity of the concrete beam by as muchas 100%, regardless of whether the beam iscast of normal-strength or high-strengthconcrete. Generally speaking, the effect ofthe inflection point in high-strength con-crete is similar to that in normal-strengthconcrete. As suggested by Aoyagi andEndo, the effect of the inflection point maybe allowed for by assuming that there is afictitious support at the inflection pointthat divides the shear span into twoshorter shear spans. It is this shortening ofthe shear span that leads to the increase inshear strength. The factor given in equation(1) may be used to estimate the effect of theinflection point in both normal-strength andhigh-strength concretes.
(c) For beams with no inflection points withintheir shear span the existing codes predictthe shear capacities of the beams reason-ably well. However, for beams with inflec-tion points within their shear span, theexisting codes significantly underestimatethe shear strength of the beams becausethe effect of the inflection points has notbeen properly allowed for in these codes.
(d) Aoyagi’s equation, which is modified fromthat used in the Japanese JSCE Code bychanging the value of the shear span lengtha to the larger of a1 and a2, as defined inFig. 2, predicts fairly accurately the shearstrength of all the beams tested, includingthose cast of high-strength concrete.Hence, Aoyagi’s equation is also applicableto high-strength concrete beams.
Acknowledgement24. The financial support of the Research
Grants Council of Hong Kong for the researchwork presented herein is gratefullyacknowledged.
Appendix
ACI Building Code ACI 318-891
V c ¼ 0·16 Î f c þ 17·2 rwV udMu
� �bwd ð2Þ
where Vc is the nominal shear strength of thesection provided by the concrete (N), fc is thecompressive cylinder strength of the concrete(MPa), rw is the area ratio of tensionreinforcement, Vu is the factored shear force atthe section (N), Mu is the factored momentoccurring simultaneously with Vu (N mm), bw isthe web width of the beam (mm) and d is theeffective depth of the beam (mm).
25. Note: fc should not be taken as greaterthan 68·9 MPa; Vud/Mu should not be taken asgreater than 1.
British Standard BS 8110 2
V c ¼ 0·79 100As
bvd
� �13 400
d
� �14 f cu
25
� �13
" #bvd ð3Þ
where Vc is the shear strength of the section(N), fcu is the compressive cube strength ofconcrete (MPa), As is the area of tensionreinforcement, bv is the width of the beam (mm)and d is the effective depth of the beam (mm).
26. Note: fcu should not be taken as greaterthan 40 MPa; 100 As/(bvd) should not be takenas greater than 3; 400/d should not be taken asless than 1.
New Zealand Standard NZS 31013
V c ¼ ð0·07 þ 10 rwÞÎ f c
� �bwd ð4Þ
where Vc is the shear strength of the section(N), fc is the compressive cylinder strength ofthe concrete (MPa), rw is the area ratio oftension reinforcement, bw is the web width of thebeam (mm) and d is the effective depth of thebeam (mm).
27. Note: fc should not be taken as greaterthan 70 MPa; 0·07 þ 10 rw should not be taken asgreater than 0·20 or less than 0·08.
Japanese JSCE Code10
28. For a shallow beam (a/d > 2):
V c ¼ 0·9 bdbpba f13
cd bwd ð5Þ
where Vc is the shear strength of the section(kgf), bd ¼ (100/d)
14 (if bd > 1·5, then bd ¼ 1·5), bp
¼ (100 rw)13 (if bp > 1·5, then bp ¼ 1·5), ba ¼ 0·75
þ [1·4/(a/d)] (where a is the shear span length(cm), fcd is the compressive cylinder strengthof concrete (kgf cm ¹ 2), d is the effective depthof the beam (cm), bw is the web width of the
ISLAM ET AL.
98

beam (cm) and rw is the area ratio of tensionreinforcement.
29. Note: The shear span length is taken asthe distance from the support to the nearestconcentrated load. In other words, in theevaluation of the value of a, the presence of theinflection point is ignored.
30. For a deep beam (a/d , 2):
V c ¼ 0·6 bdbpba f12cdbwd ð6Þ
where ba ¼ 5/[1þ(a/d)2], and all otherparameters are the same as in equation (5).
Aoyagi’s equation7
31. This is the same as the equations givenin the JSCE Code (equations (5) and (6) forshallow and deep beams, respectively), exceptthat the value of a is taken as the larger value ofa1 and a2 (i.e. the presence of the inflection pointis allowed for).
References1. AMERICAN CONCRETE INSTITUTE. Building Code
Requirements for Reinforced Concrete (ACI 318-89)and Commentary (ACI 318R-89) (Revised 1992),American Concrete Institute, Detroit, 1992,revised.
2. BRITISH STANDARDS INSTITUTION. Structural Use ofConcrete. BSI, Milton Keynes, 1985, BS8110:Part 1.
3. NEW ZEALAND STANDARDS. The Design of ConcreteStructures. New Zealand Standards, Wellington,1995, NZS 3101: Part 1.
4. CARRASQUILLO R. L., NILSON A. H. and SLATE F. O.Properties of high-strength concrete subject toshort-term loads. ACI Journal, 1981, 78, No. 3,171–178.
5. AHMAD S. H., KHALOO A. R. and POVEDA A. Shearcapacity of reinforced high-strength concretebeams. ACI Journal, 1986, 83, No. 2, 297–305.
6. ZSUTTY T. C. Beam shear strength prediction byanalysis of existing data. ACI Journal, 1968, 65,No. 11, 943–951.
7. AOYAGI Y. and ENDO T. Ultimate shear capacity ofcontinuous RC beams subjected to distributedloading. Proceedings, Fourth East Asia–PacificConference on Structural Engineering and Con-struction, Seoul, 1993, pp. 727–732.
8. AOYAGI Y., TAWEEP C. and ISLAM M. S. Effects of theposition of inflection points on the ultimate shearcapacity of reinforced concrete beams.Transactions of the Japan Concrete Institute, 1994,16, No. 2, 593–598.
9. ISLAM M. S. Effects of the Position of Inflection Pointson the Ultimate Shear Capacity of Reinforced Con-crete Beams. AIT Thesis No. ST-93-12, AsianInstitute of Technology, Bangkok, Thailand, 1993.
10. JAPAN SOCIETY OF CIVIL ENGINEERS. Specification forDesign and Construction of Concrete Structures:Design, Japan Society of Civil Engineers, Tokyo,1986, JSCE Standard, Part 1.
SHEAR CAPACITY OF HIGH-STRENGTH CONCRETE
99
Copyright © 2022 FDOKUMEN