Shear Strength Model for Reinforced Concrete Columns with Low Transverse Reinforcement Ratios
14
1. INTRODUCTION The strut-and-tie analogy is a discrete modeling of actual stress fields in reinforced concrete members. The complex stress fields within structural components resulting from applied external forces are simplified into discrete compressive and tensile force paths. The analogy utilizes the general idea of concrete in compression and steel reinforcement in tension. The longitudinal reinforcement in a beam or column represents the tensile chord of a truss while the concrete in the flexural compression zone is considered as part of the longitudinal compressive chord. The transverse reinforcement serves as ties holding the longitudinal chords together. The diagonal concrete compression struts, which discretely simulate the concrete compressive stress field, are connected to the ties and longitudinal chords at rigid nodes to attain static equilibrium within the truss. This truss model provides Advances in Structural Engineering Vol. 17 No. 10 2014 1373 Shear Strength Model for Reinforced Concrete Columns with Low Transverse Reinforcement Ratios Cao Thanh Ngoc Tran 1,* and Bing Li 2 1 Department of Civil Engineering, International University, Vietnam National University, Ho Chi Minh City, Vietnam 2 School of Civil and Environment Engineering, Nanyang Technological University, Singapore (Received: 10 April 2012; Received revised form: 5 May 2014; Accepted: 16 May 2014) Abstract: This paper introduces an equation developed based on the strut-and-tie analogy to predict the shear strength of reinforced concrete columns with low transverse reinforcement ratios. The validity and applicability of the proposed equation are evaluated by comparison with available experimental data. The proposed equation includes the contributions from concrete and transverse reinforcement through the truss action, and axial load through the strut action. A reinforced concrete column with a low transverse reinforcement ratio, commonly found in existing structures in Singapore and other parts of the world was tested to validate the assumptions made during the development of the proposed equation. The column specimen was tested to failure under the combination of a constant axial load of 0.30 f ′ c A g and quasi-static cyclic loadings to simulate earthquake actions. The analytical results revealed that the proposed equation is capable of predicting the shear strength of reinforced concrete columns with low transverse reinforcement ratios subjected to reversed cyclic loadings to a satisfactory level of accuracy Key words: reinforced concrete columns, strut-and-tie, seismic, shear strength. a convenient means of analyzing the strength of reinforced concrete because it provides a visible representation of the failure mechanism. Many researchers have made significant contributions into the development of truss models of reinforced concrete beams subjected to shear and flexure. However, there is limited effort focused on the utilization of truss models to capture the shear strength of columns with low transverse reinforcement ratios. The objective of this paper is to propose a strut-and-tie model which is capable of predicting the shear strength of columns with low transverse reinforcement ratios. The paper reported herein comprises two parts. The first part presents the derivation of the equation used to estimate the shear strength of reinforced concrete columns with low transverse reinforcement ratios. The validity and applicability of the proposed equation are evaluated by comparison with available experimental *Corresponding author. Email address: [email protected]; Tel: +848-946464649.
Transcript of Shear Strength Model for Reinforced Concrete Columns with Low Transverse Reinforcement Ratios

1. INTRODUCTIONThe strut-and-tie analogy is a discrete modeling ofactual stress fields in reinforced concrete members. Thecomplex stress fields within structural componentsresulting from applied external forces are simplifiedinto discrete compressive and tensile force paths. Theanalogy utilizes the general idea of concrete incompression and steel reinforcement in tension. Thelongitudinal reinforcement in a beam or columnrepresents the tensile chord of a truss while the concretein the flexural compression zone is considered as part ofthe longitudinal compressive chord. The transversereinforcement serves as ties holding the longitudinalchords together. The diagonal concrete compressionstruts, which discretely simulate the concretecompressive stress field, are connected to the ties andlongitudinal chords at rigid nodes to attain staticequilibrium within the truss. This truss model provides
Advances in Structural Engineering Vol. 17 No. 10 2014 1373
Shear Strength Model for Reinforced Concrete
Columns with Low Transverse Reinforcement Ratios
Cao Thanh Ngoc Tran1,* and Bing Li2
1Department of Civil Engineering, International University, Vietnam National University, Ho Chi Minh City, Vietnam2School of Civil and Environment Engineering, Nanyang Technological University, Singapore
(Received: 10 April 2012; Received revised form: 5 May 2014; Accepted: 16 May 2014)
Abstract: This paper introduces an equation developed based on the strut-and-tieanalogy to predict the shear strength of reinforced concrete columns with lowtransverse reinforcement ratios. The validity and applicability of the proposedequation are evaluated by comparison with available experimental data. The proposedequation includes the contributions from concrete and transverse reinforcementthrough the truss action, and axial load through the strut action. A reinforced concretecolumn with a low transverse reinforcement ratio, commonly found in existingstructures in Singapore and other parts of the world was tested to validate theassumptions made during the development of the proposed equation. The columnspecimen was tested to failure under the combination of a constant axial load of0.30 f ′c Ag and quasi-static cyclic loadings to simulate earthquake actions. Theanalytical results revealed that the proposed equation is capable of predicting the shearstrength of reinforced concrete columns with low transverse reinforcement ratiossubjected to reversed cyclic loadings to a satisfactory level of accuracy
Key words: reinforced concrete columns, strut-and-tie, seismic, shear strength.
a convenient means of analyzing the strength ofreinforced concrete because it provides a visiblerepresentation of the failure mechanism. Manyresearchers have made significant contributions into thedevelopment of truss models of reinforced concretebeams subjected to shear and flexure. However, there islimited effort focused on the utilization of truss modelsto capture the shear strength of columns with lowtransverse reinforcement ratios. The objective of thispaper is to propose a strut-and-tie model which iscapable of predicting the shear strength of columns withlow transverse reinforcement ratios.
The paper reported herein comprises two parts. Thefirst part presents the derivation of the equation used toestimate the shear strength of reinforced concretecolumns with low transverse reinforcement ratios. Thevalidity and applicability of the proposed equation areevaluated by comparison with available experimental
*Corresponding author. Email address: [email protected]; Tel: +848-946464649.

where the parameter k is taken as 1 for displacementductility less than 2, as 0.7 for displacement ductilitymore than 6 and varies linearly for intermediatedisplacement ductility.
2.3. Priestley et al. (1994)’s Equation
Priestley et al. (1994) proposed an additive shearstrength equation:
(6)
where
(7)
k depends on the displacement ductility factor µ∆, whichreduces from 0.29 (3.49) in MPa (psi) units for µ∆ ≤ 2.0to 0.1 (1.2) in MPa (psi) units for µ∆ 4.0; and Ae istaken as 0.8 Ag. The shear strength contribution by trussmechanism is given by:
(8)
where hc = the core dimension measured center-to-center of the peripheral transverse reinforcements; and θ = the angle of truss mechanism, taken as 30 degrees.
The shear strength enhancement by axial load isgiven by:
(9)
where L = column height; h = section height; x = compression zone depth, determined from flexuralanalysis; and k1 = 1.0 and 0.5 for double and singlecolumn curvature respectively.
3. PROPOSED SHEAR STRENGTH MODELThe concept of superposition of both truss and strutactions in developing the shear strength model forreinforced concrete columns has been previouslyproposed by Watanabe and Ichinose (1991); andPriestley et al. (1994). The truss action transfers shearforces through the transverse reinforcement which act astension members and concrete struts running parallel tothe diagonal cracks act as compression members. Thestrut action, on the other hand, transfers shear forcesdirectly through struts forming between centers offlexural compression at the top and bottom of thecolumn. This shear force transfer mechanism concept isapplied herein to develop the new shear strengthequation.
V Pk P h x
La = =−( )
tanα 1
VA f h
ssv y c= cotθ
V k f Ac c e= '
V V V Vc s a= + +
1374 Advances in Structural Engineering Vol. 17 No. 10 2014
Shear Strength Model for Reinforced Concrete Columns with Low Transverse Reinforcement Ratios
data. The second part examines the assumptions madeduring the development of the proposed equation bychecking the capability of the model to predict theexperimental results obtained from the test of areinforced concrete column with low transversereinforcement ratio.
2. PREVIOUS DESIGN EQUATIONS FORSHEAR STRENGTH OF COLUMNS
2.1. ACI 318 (2008) Code Provisions
According to ACI 318 (2008), the shear strength ofreinforced concrete columns are calculated as:
(1)
where
(MPa)
(psi) (2)
The contribution of truss mechanism is taken as:
(3)
2.2. Sezen and Moehle (2004)’s Equation
Sezen and Moehle (2004) developed a shear strengthmodel, which applies to columns with light transversereinforcement accounting for apparent strengthdegradation associated with flexural yielding. The shearstrength based on Sezen and Moehle (2004)’s model isdefined as:
(psi) (5)
V V V kA f d
s
kf
a d
P
f A
n c sv y
c
c g
= + =
+ +
61
60
'
'/..8Ag
(MPa) (4)
V V V kA f d
s
kf
a d
P
f A
n c sv y
c
c g
= + =
+ +
0 5
10 5
.
/ .
'
'
0 8. Ag
VA f d
ssv yt=
V fP
Abdc c
g
= +
2 1
2000'
V fP
Abdc c
g
= +
0 166 1
13 8.
.'
V V Vn c s= +

3.1. Truss Mechanism
Dissimilar to Priestley et al. (1994)’s shear strengthmodel, in which the concrete contribution wasconsidered independently based on the tensile stress andstrain within transverse reinforcement, this paperemploys the tensile strain of transverse reinforcement asan indirect parameter which incorporates the concretecontribution into the shear strength of reinforcedconcrete columns.
3.1.1. Concrete contribution
Shear carried by concrete has long been recognized asan important portion of the shear strength of areinforced concrete member. Some research has tried touse other parameters to represent this concretecontribution. But amongst all these parameters,transverse tensile stress and strain have prevailed(Vecchio 1986). In this paper, the concrete contributionis assumed as the amount of force transferred acrosscracks, as shown in Figure 1. Transverse tensile stressand strain were used to indirectly incorporate thisamount of force transferred across cracks into the shearstrength of reinforced concrete columns through thecompatibility conditions. By assuming a uniformdistribution of transverse reinforcement along cracksand that the tensile strain in the transverse direction isequal to the strain in the transverse reinforcement, thetensile strain in the transverse direction can becalculated as:
(10)
The principal stress directions are the direction ofinclined strut, the angle θ measured from its longitudinaldirection to the direction perpendicular to it. At this stage,the element has a compressive stress along the strutdirection and a tensile stress perpendicular to it. However,the directions of the principal strains deviate from theprincipal stress directions. Vecchio and Collins (1986)have summarized a number of experimental data and foundthat the direction of the principal strains only differed fromthe principal stresses by ± 10°. Therefore, it is reasonableto assume that the principal stress and strain directions foran infinitesimal element of concrete coincide with eachother. The principal strain in the compressive direction isreadily determined by the stress and geometrical conditionof a strut as illustrated in Figure 2, thus,
(11)
with the known values of θ, εx, and ε1, a Mohr’s circlecan then be constructed as shown in Figure 3 tocalculate the tensile strain ε2, given below:
εθ θ
θ1 = −( )
( ) = −( )V
E c b
V
E jds
c strut
s
c
/sin /sin
cos bb
V
jdbEs
c
( )= −
sin cosθ θ
εθ θx
s
s v
s
v s
V
E Ajd
s
V s
A E jd=
=cot cot
Advances in Structural Engineering Vol. 17 No. 10 2014 1375
Cao Thanh Ngoc Tran and Bing Li
θ
y
vc
ε
xε2ε
1ε
Figure 1. Local stresses and strains at a crack Figure 2. Truss mechanism
jd
c
Vs
sinVs
CStrut
θ
θ
θ
θ
jd c
ot

(12)
This equation takes into consideration that θ may bemore than 45°.
Many researchers including Walraven (1981) haveconcentrated on the experimental relationships betweenthe shear carried by concrete vc and the tensile strain ε2.Vecchio and Collins (1986) derived the equation for thelimiting value of shear stress transferred across thecrack; the equation further used by Walraven (1981) inhis study is given below:
(MPa)
(psi) (13)
The average crack width w can be taken as:
(14)
where
(15)
and where smx and smy are the indicators of the crackcontrol characteristics of the transverse and longitudinalshear reinforcement, respectively. According to theprovision of the CEB-FIP Code (1978):
(16)s cs
kd
mx xbx
v
= +
+210
0 25 1.ρ
s
s smx my
θ θ θ=
+
1sin cos
w s= ε θ2
vf
w
a
cc=
++
2 16
0 3124
0 63
.
..
'
'
vf
w
a
cc=
++
0 18
0 3124
16
.
.
'
'
εε ε
θε2
11
2
2 1=
−( )+
−x
cos
(17)
where k1 is taken as 0.4 for deformed reinforced barsand 0.8 for plain reinforcing bars.
The calculated vc from Eqn 13 is the shear stresstransferred at the crack surface. Hence, the shearstrength contributed from concrete is:
(18)
3.1.2. Transverse reinforcement contribution
Additional contribution to the truss mechanism fromtransverse reinforcement can be defined as (ACI 2008):
(19)
The shear force carried by the truss mechanism isassumed to reach its maximum value when thetransverse reinforcement yields. The yield strain oftransverse reinforcement can be reasonably taken as0.002. Hence, the maximum shear force carried by thetruss mechanism is given by:
(20)
If the inclination of compression strut θ and flexurallever arm jd are assumed as 45° and 0.8d respectively,Eqn 20 becomes:
(21)
3.2. Strut Mechanism
There are similarities to the strut action of Priestley et al.(1994)’s shear strength model, in which the beneficialeffects of axial load on shear strength were considered inthe proposed model through the strut action; although inthis model, ultimate compressive stress of the direct strutwas limited to cater for skew cracks along the columns.The maximum shear force applied to the strutmechanism is given as (Priestley 1994):
(22)
As shown in Figure 4, the shear strength of the directstrut is calculated as:
(23)V Ca u2 = sinα
V Pa1 = tanα
V V db v A fd
sc s c v ytx
+ = ( ) +
=0 8
0 002.
.ε
V V V jdb v A fd
sT c s c v ytx
= + = ( ) +
=ε θ
.cot
0 002
V A fd
ss v yt= cotθ
Vjdb
v jdbvc c c= =sin
sinθ
θ
s cs
kd
my yy by
s
= +
+2
100 25 1.
ρ
1376 Advances in Structural Engineering Vol. 17 No. 10 2014
Shear Strength Model for Reinforced Concrete Columns with Low Transverse Reinforcement Ratios
yε
yεεε ε ε
ε
x
x
1 12ε2
2θ θ2
θ(a) _< 45° θ(b) > 45°
Figure 3. Compatible strain conditions in a reinforced
concrete element
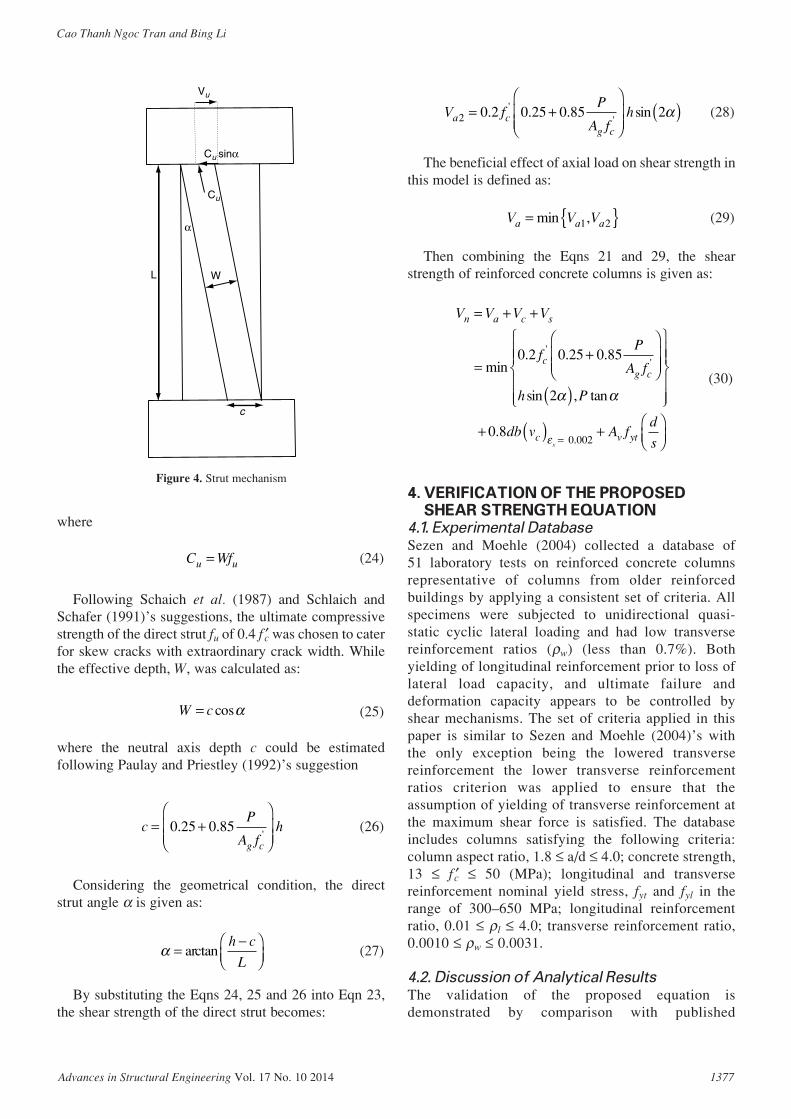
where
(24)
Following Schaich et al. (1987) and Schlaich andSchafer (1991)’s suggestions, the ultimate compressivestrength of the direct strut fu of 0.4 f ′c was chosen to caterfor skew cracks with extraordinary crack width. Whilethe effective depth, W, was calculated as:
(25)
where the neutral axis depth c could be estimatedfollowing Paulay and Priestley (1992)’s suggestion
(26)
Considering the geometrical condition, the directstrut angle α is given as:
(27)
By substituting the Eqns 24, 25 and 26 into Eqn 23,the shear strength of the direct strut becomes:
α =−
arctanh c
L
cP
A fh
g c
= +
0 25 0 85. .'
W c= cosα
C Wfu u=
(28)
The beneficial effect of axial load on shear strength inthis model is defined as:
(29)
Then combining the Eqns 21 and 29, the shearstrength of reinforced concrete columns is given as:
4. VERIFICATION OF THE PROPOSEDSHEAR STRENGTH EQUATION
4.1. Experimental Database
Sezen and Moehle (2004) collected a database of51 laboratory tests on reinforced concrete columnsrepresentative of columns from older reinforcedbuildings by applying a consistent set of criteria. Allspecimens were subjected to unidirectional quasi-static cyclic lateral loading and had low transversereinforcement ratios (ρw) (less than 0.7%). Bothyielding of longitudinal reinforcement prior to loss oflateral load capacity, and ultimate failure anddeformation capacity appears to be controlled byshear mechanisms. The set of criteria applied in thispaper is similar to Sezen and Moehle (2004)’s withthe only exception being the lowered transversereinforcement the lower transverse reinforcementratios criterion was applied to ensure that theassumption of yielding of transverse reinforcement atthe maximum shear force is satisfied. The databaseincludes columns satisfying the following criteria:column aspect ratio, 1.8 ≤ a/d ≤ 4.0; concrete strength,13 ≤ f ′c ≤ 50 (MPa); longitudinal and transversereinforcement nominal yield stress, fyt and fyl in therange of 300–650 MPa; longitudinal reinforcementratio, 0.01 ≤ ρl ≤ 4.0; transverse reinforcement ratio,0.0010 ≤ ρw ≤ 0.0031.
4.2. Discussion of Analytical Results
The validation of the proposed equation isdemonstrated by comparison with published
(30)
V V V V
fP
A f
n a c s
cg c
= + +
=+
min. . .'
'0 2 0 25 0 85
( )
+ ( ) =
h P
db vcx
sin , tan
.
2
0 8
α α
ε .0 002+
A fd
sv yt
V V Va a a= { }min ,1 2
V fP
A fha c
g c2 0 2 0 25 0 85 2= +
( ). . . sin''
α
Advances in Structural Engineering Vol. 17 No. 10 2014 1377
Cao Thanh Ngoc Tran and Bing Li
Figure 4. Strut mechanism
α
Cu
L W
c
Vu
Cu sinα

experimental results with respect to the maximum shearforce obtained from the test results. Details of thereinforced concrete columns are shown in Table 1.These columns encompass a wide range of crosssectional sizes, material properties, and axial loads. Itwas found that the average ratio of the experimental topredicted shear strength by the proposed equation is1.033 as shown in Figure 5 and Table 1, showing agood correlation between the proposed equation andexperimental data. The shear strengths of columns inthe database calculated based on ACI 318 (2008),Sezen and Moehle (2004), and Priestley et al. (1994)are also showed in Table 1. The mean ratio of theexperimental to predicted strength and its coefficient ofvariation are 1.108 and 0.204, 1.022 and 0.171, and0.740 and 0.128 for ACI 318 (2008), Sezen and Moehle(2004), and Priestley et al. (1994), respectively.Comparison of available models with experimental dataindicates that Sezen and Moehle (2004) model and theproposed model produce better mean ratio of theexperimental to predicted strength and its coefficient ofvariation than ACI 318 (2008), Sezen and Moehle(2004), and Priestley et al. (1994) model. Both Sezenand Moehle (2004) model and the proposed model maybe suitable as an assessment tool to calculate the shearstrength of reinforced concrete columns with lowtransverse reinforcement ratios which have similardetailing in the database.
To investigate the validity and applicability of theproposed equation across the range of several keyparameters including axial load, aspect ratio,compressive strength of concrete and transversereinforcement ratio, the ratio of experimental shearstrength, Vu to shear strength calculated from theproposed Eqn 30 versus axial load [P/(Ag f ′c )], aspectratio (a/d), transverse reinforcement index (ρw fyt / f ′c ) isplot in Figure 6. The good correlation between theexperimental and predicted strengths across the range ofaxial load, aspect ratio, transverse reinforcement indexindicates that the proposed model well represents theeffects of these key parameters.
The effect of displacement ductility demand on theshear strength of reinforced concrete columns hasbeen recognized and incorporated into the shearstrength equations previously by some researchers[e.g., Priestley et al. (1994); Sezen and Moehle(2004)]. Priestley et al. (1994) proposed the model inwhich concrete contribution to shear strength reduceswith increasing displacement ductility demand,whereas Sezen and Moehle (2004) suggested bothconcrete and steel contributions are reduced withincreasing displacement ductility demand. Theproposed model propounds that when the tensile strain
of transverse reinforcement increases, the concretecontribution to the shear strength decreases. Once thetransverse reinforcement reaches its yield strength, theincrease of displacement ductility will lead to areduction of VT in Eqn 20 due to constant value of Vs
and reduction of Vc in Eqn 20. Hence, the proposedmodel could be used to qualitatively explain the effectof displacement ductility demand on the shearstrength of reinforced concrete columns. In order toquantitatively investigate the effect of displacementductility demand on the shear strength of reinforcedconcrete columns by the proposed model, therelationship between tensile strain of transversereinforcement versus displacement ductility is needed.The difficulty in establishing this relationshipprevents the proposed model from being able toquantitatively incorporate the effect of displacementductility.
4.3. Uncertainties of the Proposed Model
In the proposed model, the complicated shearresisting mechanisms in reinforced concrete columnswith low transverse reinforcement ratios aresimplified into truss and strut mechanisms; hence,several uncertainties in the proposed model can beexpected. The direct strut forming between thecenters of flexural compression at the top and bottomof the columns is an imaginary stress field whichhelps to explain certain experimental observations.Currently, there are no physical evidences which helpto explain the existence of this direct strut. In theproposed model, the effect of column axial load isincorporated through the use of the direct strut whichcould be one of the uncertainties. Furthermore, theassumptions of a 45° crack angle and yielding oftransverse reinforcements are not always true for allcases of the specimens in the database. Forsimplicity, ACI 318 code (2008)’s 45° crack angleassumption is adopted in the proposed model.However, this assumption may lead to anunderestimation of the contribution from the shearreinforcement. All empirical results indicate thatcrack angle is not a constant value. The effects ofseveral parameters such as transverse reinforcementratio, axial load, longitudinal reinforcement andcompressive concrete strength on the crack angle areinconclusive. Further study is required tomathematically calculate the crack angle to enhancethe accuracy of the proposed model. In addition, thevalidity of the assumption of uniform distribution oftransverse reinforcements along the crack relies onthe position of crack along the column. This could bean additional uncertainty in the proposed model.
1378 Advances in Structural Engineering Vol. 17 No. 10 2014
Shear Strength Model for Reinforced Concrete Columns with Low Transverse Reinforcement Ratios

Advances in Structural Engineering Vol. 17 No. 10 2014 1379
Cao Thanh Ngoc Tran and Bing Li
Ta
ble
1.
Ex
pe
rim
en
ta
l v
eri
fic
at
ion
Tra
ns
ve
rse
Lo
ng
itu
din
al
rein
forc
ere
info
rce
Co
lum
n s
ec
tio
nm
en
tm
en
t
f′ ch
bd
aρ w
sf y
tρ l
f yl
Vu
VA
CI
VS
ezen
Vp
ries
tley
Vp
rop
ose
dS
pe
cim
en
(MP
a)
(mm
)(m
m)
(mm
)(m
m)
(%)
(mm
)(M
Pa
)(%
)(M
Pa
)(k
N)
(kN
)(k
N)
(kN
)(k
N)
Lyn
n (2
001)
3CL
H18
25.6
0.09
457
457
381
1473
3.87
0.07
457
400
3.0
331
271.
022
5.4
206.
435
3.6
223.
81.
202
1.31
20.
766
1.21
13S
LH
1825
.60.
0945
745
738
114
733.
870.
0745
740
03.
033
126
7.0
225.
420
6.4
353.
622
3.8
1.18
51.
294
0.75
61.
193
2CL
H18
33.1
0.07
457
457
381
1473
3.87
0.07
457
400
2.0
331
240.
025
2.9
224.
938
9.3
246.
70.
949
1.06
70.
617
0.97
32S
LH
1833
.10.
0745
745
738
114
733.
870.
0745
740
02.
033
123
1.0
252.
922
4.9
389.
324
6.7
0.91
31.
027
0.59
40.
936
2CM
H18
25.7
0.28
457
457
381
1473
3.87
0.07
457
400
2.0
331
316.
028
2.1
273.
542
8.7
226.
81.
120
1.15
50.
737
1.39
33C
MH
1827
.60.
2645
745
738
114
733.
870.
0745
740
03.
033
133
8.0
287.
627
5.8
448.
124
4.9
1.17
51.
225
0.73
71.
383C
MD
1227
.60.
2645
745
738
114
733.
870.
1730
540
03.
033
135
6.0
351.
835
2.3
554.
833
3.1
1.01
21.
010.
642
1.06
93S
MD
1225
.70.
2845
745
738
114
733.
870.
1730
540
03.
033
137
8.0
342.
034
6.4
510.
132
31.
105
1.09
20.
741
1.17
Seze
n (2
002)
; Sez
en a
nd M
oehl
e (2
006)
2CL
D12
21.1
0.15
457
457
394
1473
3.74
0.17
305
476
2.5
438
315.
031
7.0
285.
046
6.9
313.
70.
994
1.10
50.
675
1.00
42C
HD
1221
.10.
6145
745
739
414
733.
740.
1730
547
62.
543
835
9.0
410.
040
9.0
551.
329
9.8
0.87
60.
878
0.65
11.
197
2CL
D12
M21
.80.
1545
745
739
414
733.
740.
1730
547
62.
543
829
4.0
317.
028
5.0
456.
931
7.6
0.92
81.
032
0.64
30.
926
Lee
(20
06)
S1-0
.0-N
27.0
0.10
300
300
251
450
1.79
0.26
180
400
2.4
400
216
156.
822
7.6
271.
321
8.3
1.37
70.
949
0.79
60.
989
S2-0
.0-N
27.0
0.10
300
300
251
450
1.79
0.21
225
400
2.4
400
200
140.
921
1.9
249.
620
0.2
1.41
80.
943
0.80
10.
999
Yal
cin
(Sez
en 2
004)
BR
-S1
45.0
0.13
550
550
482
1485
3.08
0.10
300
425
2.0
445
578
535.
154
6.1
757.
651
4.3
1.08
1.05
80.
763
1.12
4
Um
emur
a an
d E
ndo
(Sez
en 2
004)
205
17.7
0.22
200
200
180
600
3.33
0.28
100
324
2.0
462
7164
.966
.896
.474
.71.
094
1.06
30.
737
0.95
207
17.7
0.22
200
200
180
400
2.22
0.28
100
324
2.0
462
106
64.9
83.8
107.
483
.21.
634
1.26
40.
987
1.27
421
417
.70.
5520
020
018
060
03.
330.
1420
032
42.
046
283
59.3
64.4
76.1
54.6
1.40
11.
289
1.09
11.
441
200
32.9
0.12
200
200
180
400
2.22
0.11
120
648
1.0
379
7869
.689
.211
0.1
87.4
1.12
10.
874
0.70
80.
892
231
14.8
0.26
200
200
180
400
2.22
0.13
100
524
1.0
324
5154
.573
.285
.859
.50.
935
0.69
70.
600
0.85
723
213
.10.
2320
020
018
040
02.
220.
1310
052
41.
032
458
52.7
71.3
84.6
57.3
1.10
00.
814
0.68
61.
012
233
13.9
0.24
200
200
180
400
2.22
0.13
100
524
1.0
372
6953
.572
.290
.460
.81.
290
0.95
60.
763
1.13
523
413
.10.
2420
020
018
040
02.
220.
1310
052
41.
037
267
52.7
71.3
89.4
59.5
1.27
10.
940.
750
1.12
6
VV
u
prop
osed
VV
u
prie
stle
y
VV
u
Sez
en
V Vu AC
I
a d
PA
f gc'
(Con
tinue
d)

1380 Advances in Structural Engineering Vol. 17 No. 10 2014
Shear Strength Model for Reinforced Concrete Columns with Low Transverse Reinforcement Ratios
Ta
ble
1.
Ex
pe
rim
en
ta
l v
eri
fic
at
ion
Tra
ns
ve
rse
Lo
ng
itu
din
al
rein
forc
ere
info
rce
Co
lum
n s
ec
tio
nm
en
tm
en
t
f′ ch
bd
aρ w
sf y
tρ l
f yl
Vu
VA
CI
VS
ezen
Vp
ries
tley
Vp
rop
ose
dS
pe
cim
en
(MP
a)
(mm
)(m
m)
(mm
)(m
m)
(%)
(mm
)(M
Pa
)(%
)(M
Pa
)(k
N)
(kN
)(k
N)
(kN
)(k
N)
Kok
usho
(Se
zen
2004
)37
219
.90.
2020
020
017
050
02.
940.
3110
035
21.
052
474
69.3
77.4
107.
778
.51.
068
0.95
60.
687
0.94
337
220
.40.
2020
020
017
050
02.
940.
3110
035
22.
052
488
69.8
77.8
108.
284
1.26
11.
131
0.81
31.
048
Kok
usho
and
Fuk
uhar
o (S
ezen
200
4)45
221
.90.
4520
020
017
050
02.
940.
3110
031
73.
039
511
078
.691
.410
9.9
88.3
1.39
91.
203
1.00
11.
246
452
21.9
0.45
200
200
170
500
2.94
0.31
100
317
4.0
395
110
78.6
91.4
109.
989
.31.
399
1.20
31.
001
1.23
2
Iked
a (S
ezen
200
4)43
19.6
0.10
200
200
173
500
2.89
0.28
100
558
2.0
434
7483
.087
.711
8.4
97.1
0.89
10.
844
0.62
50.
762
4419
.60.
1020
020
017
350
02.
890.
2810
055
82.
043
477
83.0
87.7
118.
497
.10.
928
0.87
80.
650
0.79
345
19.6
0.20
200
200
173
500
2.89
0.28
100
558
2.0
434
8286
.794
.812
5.0
98.5
0.94
60.
865
0.65
60.
832
4619
.60.
2020
020
017
350
02.
890.
2810
055
82.
043
481
86.7
94.8
125.
098
.50.
935
0.85
50.
648
0.82
262
19.6
0.10
200
200
173
500
2.89
0.28
100
476
2.0
348
5875
.279
.810
6.8
88.8
0.77
10.
727
0.57
00.
653
6319
.60.
2020
020
017
350
02.
890.
2810
047
62.
034
869
78.7
86.8
110.
483
.10.
876
0.79
50.
625
0.83
6419
.60.
2020
020
017
350
02.
890.
2810
047
62.
034
869
78.7
86.8
110.
483
.10.
876
0.79
50.
625
0.83
Cur
rent
Exp
erim
ent
SC01
49.3
0.30
350
350
301
850
2.82
0.13
125
393
3.2
409
357.
132
0.5
309.
540
8.9
300.
11.
149
1.15
30.
873
1.19
0A
vera
ge1.
108
1.02
20.
740
1.03
3C
oeff
icie
nt o
f va
riat
ion
0.20
40.
171
0.12
80.
194
VV
u
prop
osed
VV
u
prie
stle
y
VV
u
Sez
en
V Vu AC
I
a d
PA
f gc'

Advances in Structural Engineering Vol. 17 No. 10 2014 1381
Cao Thanh Ngoc Tran and Bing Li
5. EXPERIMENTAL STUDY5.1. Specimen and Test Procedure
To investigate several assumptions made within thedevelopment of the shear strength model, a large-scalereinforced concrete column with a low transversereinforcement ratio, which satisfies the set of criteriaused to establish the database, was constructed andtested. Figure 7 illustrates the schematic dimensions anddetailing of the specimen. A schematic of the loadingapparatus is shown in Figure 8. A reversible horizontalload was applied to the top of the column using a double-acting 1000 kN capacity long-stroke dynamic actuatorwhich was mounted onto a reaction wall. The actuatorwas pinned at both ends to allow rotation during the test.The base of the column was fixed to a strong floor withfour post-tensioned bolts. The axial load was applied to
0
0.5
1
1.5
2
0
0.5
1
1.5
2
0
0.5
1
1.5
2
0 0.1 0.2 0.3 0.4 0.5 0.6 0.7P/ (Agf'c)
Vu
/ Vpr
opos
edV
u/ V
prop
osed
Vu/
Vpr
opos
ed
(a)
1.5 2 2.5 3 3.5 4
Aspect ratio (a/d)
(b)
0 0.02 0.04 0.06 0.08 0.1
(c)
ρwfyt/f'c
Figure 6. Variation of experimental to predicted strength ratio as a function of key parameters
Figure 5. Correlation of experimental and predicted shear strength
based on the proposed equation
0
100
200
300
400
500
600
700
0 100 200 300 400 500 600 7000.0
22.5
45.0
67.5
89.9
112.4
134.9
157.40.0 22.5 45.0 67.5 89.9 112.4 134.9 157.4
Vproposed (kN)
Vu
(kN
)
1.0
2.0
0.5 Vu
(kip
)
Vproposedv (kip)

1382 Advances in Structural Engineering Vol. 17 No. 10 2014
Shear Strength Model for Reinforced Concrete Columns with Low Transverse Reinforcement Ratios
at a drift ratio of 2%, the column failed catastrophicallydue to the failure of its transverse reinforcements. At thisstage, the applied axial load dropped suddenly from1804 kN to 400 kN showing the brittle behavior of thespecimen caused by its low transverse reinforcementratio. The maximum shear strength obtained from thespecimen was 357.1 kN, whereas the value obtained bythe proposed equation was 300.5 kN.
Figure 11 illustrates the formation of the crackingpatterns of the specimen. At a drift ratio of 0.25%,flexural cracks were found at the bottom and top of thecolumn. The inclined bending-shear cracks at thebottom and top of the column, which were formed at adrift ratio of 0.67%, were believed to be the extension ofthese flexural cracks. Shear cracks occurred at a driftratio of 0.67% and started to develop rapidly at driftratio of 1.0% which continued to expand as the loadingprogressed. Limited new flexural cracks along thespecimen were observed when a drift ratio wasincreased to 1.0%. Failure accompanied by gradualstiffness degradation of the column occurred due toextensive opening of the shear cracks. In developmentof the proposed model, the crack angle is assumed as45°, whereas the measured crack angle at the maximumshear force state is 35°. Using the experimental crackangle, 35° to predict the shear strength based on theproposed model obtains 354.6 kN. The ratio ofexperimental shear strength to predicted shear strengthbased on experimental crack angle is 1.007. Theimprovement in predicting the shear strength based onexperimental crack angle is obtained. This indicates theuncertainty of the proposed model when the crack angle
Figure 8. Test setup (in mm)
Figure 7. Reinforcement details of test specimen (in mm)
135 degree hook
30 mm clear cover
350
350
350
350
350
400
350 T10T20
800900
1700
500 mm R6 – 125 mm spacing
600 mm R6 – 200 mm spacing
500 mm R6 – 125 mm spacing
R6
8-T25
Reaction wall
100 ton actuator
100 ton actuator 100 ton actuator
26501700
L-shaped steel frame
Strong floor
the column using two double-acting 1000 kN capacitydynamic actuators through a transfer beam. The typicalloading procedure is illustrated in Figure 9.
5.2. Experimental Results and Discussions
Figure 10 shows the load-displacement hysteresis loopsof the specimen. The hysteresis loops show thedegradation of stiffness and load-carrying capacity duringrepeated cycles due to the cracking of the concrete andyielding of the steel reinforcement. The low attainment ofstiffness and strength were attributed to the shear cracksalong the specimens. Pinching was seen in the hysteresisloops of the specimen when a drift ratio of 1.0% wasapplied, leading to limited energy dissipation as shown inFigure 10. The specimen reached its maximum horizontalstrength in the first cycle at a drift ratio of 1.0%. At thenext drift ratio of 1.33%, the peak lateral load attainedwas only 82.3% of the maximum recorded value of thespecimen. Continuous cycles caused additional damageand loss of lateral resistance. During the first push cycle

Advances in Structural Engineering Vol. 17 No. 10 2014 1383
Cao Thanh Ngoc Tran and Bing Li
is assumed to be 45°. Further study is required to refinethe proposed model to take into account varied crackangles, to enhance the accuracy of the proposed model.
Figure 12 shows the measured strain distribution ofthe longitudinal reinforcements along the height of thecolumn of the specimen. It was observed that thedistribution of strain along the longitudinalreinforcements varied considerably with an increase inlateral load. With reference to this strain profile, notensile yielding of the longitudinal bars was observedduring the tests, thus indicating the dominance of shearfailure behavior of the specimen. The largest tensilestrain of the specimen was detected at 250 mm awayfrom the fixed-end. The tensile strains withinlongitudinal bars initially increased with increasing driftratio, apparently owing to the growth of flexural cracksat top and bottom of the column but eventually thesestrains began to reduce as shown in Figure 12.
Figure 10. Hysteresis loops of specimen SC01
Figure 11. Cracking patterns of specimen SC01 Figure 12. Local strains in longitudinal bars of specimen SC01
−600
−400
−200
0
200
400
600
−40 −30 −20 −10 0 10 20 30 40
Displacement (mm)
Late
ral l
oad
(kN
)
−134.9
−89.9
−45.0
0.0
44.9
89.9
134.9−1.57−1.18−0.79−0.39 0.00 0.39 0.79 1.18 1.57
Displacement (in)
Late
ral l
oad
(kip
)
Drift ratio
Drift ratio
0.5%
0.5%
1.0%
1.0%1.5%
1.5%
2.0%
2.0%
−900
−600
−300
0
300
600
900
−3000 −2000 −1000 0 1000 2000 3000
Str
ain
gaug
e po
sitio
n (m
m)
−35.4
−23.6
−11.8
0
11.8
23.6
35.4
Str
ain
gaug
e po
sitio
n (in
)
Strain (x10−6)
εy εy
DR = 0.50% (1)DR = 0.67% (1)DR = 1.00% (1)DR = 1.33% (1)DR = 1.82% (1)
Column mid-height
(a) At the maximum shear force (b) At axial failure
Figure 9. Loading procedure
−40
−30
−20
−10
0
10
20
30
40
0 1 2 3 4 5 6 7 8 9 10 11 12 13 14 15 16 17 18 19 20
Cycle number
Dis
plac
emen
t (m
m)
−1.57
−1.18
−0.78
−0.39
0.00
0.40
0.79
1.18
Dis
plac
emen
t (in
)
DR = 1/2000
DR = 1/100DR = 1/150
DR = 1/200DR = 1/300
DR = 1/400DR = 1/600
DR = 1/1000
DR = 1/55DR = 1/75
1.57

Figure 13 shows the measured strain distribution ofthe transverse reinforcement in the direction parallelto the lateral load direction along the height of thecolumn of the specimen. It was observed thatthe distributions of strains along the transversereinforcement varied considerably with the increaseof lateral load and increased with increasing driftratio. With reference to this strain profile, yielding ofthe transverse steel bars was observed at a drift ratioof 1.33%. The largest tensile strain was detected at240 mm away from the fixed-end. It was observedthat the transverse strain suddenly increased at a driftratio of 1.33% owing to the growth and opening ofshear cracks along the column. The yielding oftransverse reinforcement is assumed in thedevelopment of the proposed model. However, asshown in Figure 13, when the specimen reached itsmaximum shear force, no yielding of transversereinforcement was observed. It is also noticeable thatthe measured strains are localized strains alongtransverse steel bars. Yielding of transverse steel barsmay occur elsewhere, such as at the shear cracklocations. The measured strain distribution of thetransverse reinforcement in the directionperpendicular to the lateral load direction is shown inFigure 14. It was observed that there was a suddenincrease in the strain distribution within thetransverse reinforcement in the directionperpendicular to the lateral load direction, at a driftratio of 1.82%. With reference to this strain profile,yielding of the transverse steel bars in the directionperpendicular to the lateral load direction wasobserved only at a drift ratio of 1.82%.
5. CONCLUSIONSBased on the results of this study, the followingconclusions can be drawn:
The complicated shear resisting mechanism inreinforced concrete columns with low transversereinforcement ratios can be analyzed by the proposedequation, which was derived from the strut-and-tiemodel and incorporated concrete contribution. Theproposed equation provides a good estimate of theshear strength of reinforced concrete columns with lowtransverse reinforcement ratios in the database with theaverage ratio of experimental to predicted shearstrength of the 34 shear-critical reinforced concretecolumns being 1.033. The proposed equation can beutilized to determine shear strength of reinforcedconcrete columns with low reinforcement ratios thatexhibit shear failure behaviors.
A full-scale reinforced concrete column with a lowtransverse reinforcement ratio, which is commonlyfound in existing structures in Singapore and other partsof the world, was tested under a constant axial load,0.30 f ′c Ag and quasi-static cyclic loadings simulatingearthquake actions to further validate the proposedmodel. The experimental results show improvement inpredicting the shear strength of the test column basedon the experimental crack angle; the ratio ofexperimental shear strength to predicted shear strengthbased on the experimental crack angle is 1.007.
ACKNOWLEDGEMENTSThis research is funded by Vietnam NationalFoundation for Science and Technology Development(NAFOSTED) under grant number 107.01-2013.12.
1384 Advances in Structural Engineering Vol. 17 No. 10 2014
Shear Strength Model for Reinforced Concrete Columns with Low Transverse Reinforcement Ratios
−900
−600
−300
0
300
600
900
−1000 0 1000 2000 3000 4000 5000
Hoo
p po
sitio
n (m
m)
−35.4
−23.6
−11.8
0.0
11.8
23.6
35.4
Hoo
p po
sitio
n (in
)
εy
Column mid-height
Strain (x10−6)
DR = 0.50%(1)DR = 0.67%(1)DR = 1.00%(1)DR = 1.33%(1)DR = 1.82%(1)
Figure 13. Local strains in steel links of specimen SC01 in the
direction parallel to the lateral load direction
Figure 14. Local strains in steel links of specimen SC01 in the
direction perpendicular to the lateral load direction
−900
−600
−300
0
300
600
900
−1000 0 1000 2000 3000
Hoo
p po
sitio
n (m
m)
−35.4
−23.6
−11.8
0.0
11.8
23.6
35.4
Hoo
p po
sitio
n (in
)
Strain (x10−6)
εy
DR = 0.50% (1)DR = 0.67% (1)DR = 1.00% (1)DR = 1.33% (1)DR = 1.82% (1)
Column mid-height

REFERENCESACI 318 (2008). Building Code Requirements for Structural
Concrete and Commentary, American Concrete Institute,
Michigan, USA.
CEB-FIP (1978). Model Code for Concrete Structures, Comite-
Euro-International du Beton/Federation Internationale de la
Precontrainte, Paris, France.
Lee, H.H. (2006). “Shear strength and behavior of steel fiber
reinforced concrete columns under seismic loading”, Engineering
Structures, Vol. 29, No. 7, pp. 1253–1262.
Lynn, A.C. (2001). Seismic Evaluation of Existing Reinforced
Concrete Building Columns, PhD Thesis, Department of Civil
and Environmental Engineering, University of California,
Berkeley, California, USA.
Paulay, T. and Priestley, M.J.N. (1992). Seismic Design of
Reinforced Concrete Masonry Buildings, John Willey & Sons,
New York, USA.
Priestley, M.J.N., Verma, R. and Xiao, Y. (1994). “Seismic shear
strength of reinforced concrete columns”, Journal of Structural
Engineering, ASCE, Vol. 120, No. 7, pp. 2310–2329.
Schlaich, J. and Schafer, K. (1991). “Designs and detailing of
structural concrete using strut-and-tie models”, The Structural
Engineer, Vol. 69, No. 6, pp. 113–125.
Schlaich, J., Schafer, K. and Jennewein, M. (1987). “Toward a
consistent design of structural concrete”, PCI Journal, Vol. 32,
No. 3, pp. 74–150.
Sezen, H. (2002). Seismic Response and Modeling of Reinforced
Concrete Building Columns, PhD Thesis, Department of Civil
and Environmental Engineering, University of California,
Berkeley, California, USA.
Sezen, H. and Moehle, J. (2004). “Shear strength model for lightly
reinforced concrete columns”, Journal of Structural Engineering,
ASCE, Vol. 130, No. 11, pp. 1692–1703.
Advances in Structural Engineering Vol. 17 No. 10 2014 1385
Cao Thanh Ngoc Tran and Bing Li
Sezen, H. and Moehle, J. (2006). “Seismic tests of concrete columns
with light transverse reinforcement”, ACI Structural Journal,
Vol. 103, No. 6, pp. 842–849.
Vecchio, F.J. and Collins, M.P. (1986). “The modified compression-
field theory for reinforced concrete elements subjected to shear”,
ACI Journal Proceedings, Vol. 83, No. 2, pp. 219–231.
Walraven, J.C. (1981). “Foundamental analysis of aggregate
interlock”, Journal of the Structural Division, ASCE, Vol. 107,
pp. 2245–2270.
Watanabe, F. and Ichinose, T. (1991). “Strength and ductility design
of RC members subjected to combined bending and shear”,
Proceedings of Workshop on Concrete in Earthquake, University
of Houston, Texas, USA, pp. 429–438.
NOTATIONf ′c compressive strength of concreteVn nominal shear strength of columnsP applied axial loadb width of columnsh depth of columnsfyt yield strength of transverse reinforcementd distance from the extreme compression fiber to
centroid of tension reinforcements spacing of transverse reinforcementAv total transverse reinforcement area within spacing sθ the inclination of compression strutsVc shear force carried by concreteVs shear force carried by transverse reinforcementVa shear force carried by strut mechanismAg cross sectional areak parameter depends on the displacement ductility
demanda/d aspect ratio