Shear Strength and Stiffness of Silty Sand
12
JOURNAL OF GEOTECHNICAL AND GEOENVIRONMENTAL ENGINEERING / MAY 2000 / 451 SHEAR STRENGTH AND STIFFNESS OF SILTY SAND By R. Salgado, 1 Member, ASCE, P. Bandini, 2 Student Member, ASCE, and A. Karim 3 ABSTRACT: The properties of clean sands pertaining to shear strength and stiffness have been studied exten- sively. However, natural sands generally contain significant amounts of silt and/or clay. The mechanical response of such soils is different from that of clean sands. This paper addresses the effects of nonplastic fines on the small-strain stiffness and shear strength of sands. A series of laboratory tests was performed on samples of Ottawa sand with fines content in the range of 5–20% by weight. The samples were prepared at different relative densities and were subjected to various levels of mean effective consolidation stress. Most of the triaxial tests were conducted to axial strains in excess of 30%. The stress-strain responses were recorded, and the shear strength and dilatancy parameters were obtained for each fines percentage. Bender element tests performed in triaxial test samples allowed assessment of the effect of fines content on small-strain mechanical stiffness. INTRODUCTION It is well established that soils behave as linear elastic ma- terials at shear strains smaller than about 10 24 –10 23 %. For larger shear strains, the stress-strain relationship is nonlinear. Peak shear strength develops at relatively large strains (cor- responding typically to axial strains in the range of 1–4%), and critical-state shear strength (corresponding to no volume change during shearing) develops for axial strains in excess of 25%. As the Mohr-Coulomb failure criterion is commonly used to describe shear failure in soils, friction angles deter- mined at the peak and critical states can be defined. Knowledge of the values of small-strain stiffness and criti- cal-state and peak friction angles is very useful for applications based on constitutive models or analyses that attempt to cap- ture material response from the initial stages of loading up to shear failure. More immediate application of such knowledge can be made in analyses that rely predominantly on small- strain stiffness (such as the design of machine foundations), or on friction angles only (such as stability analyses of various forms, where deformations prior to collapse are not consid- ered). The stress-strain response of sand at small-, intermediate-, and large-strain levels depends upon soil state variables (the relative density D R of the sand, the effective stress state, and fabric) and other factors related to the nature of the sand (par- ticle shape, particle size distribution, particle surface charac- teristics, and mineralogy). The factors related to the constitu- tion and general nature of the sand particles are referred to as intrinsic variables (Been et al. 1991; Salgado et al. 1997a,b). Examples of intrinsic variables are the critical-state friction angle f c , the maximum and minimum void ratios e max and e min , and the dilatancy parameters Q and R of the peak friction angle correlation of Bolton (1986). The properties of clean sands have been extensively studied under laboratory and field conditions. These include Ottawa, Ticino, and Monterey #0 sands (Hardin and Richart 1963; Chung et al. 1984; Bolton 1986; Lo Presti 1987; Lo Presti et al. 1992). However, in situ soils often contain significant amounts of fines. If realistic analyses are to be done of soil 1 Assoc. Prof., School of Civ. Engrg., Purdue Univ., West Lafayette, IN 47907. E-mail: [email protected] 2 PhD Candidate, School of Civ. Engrg., Purdue Univ., West Lafayette, IN. 3 Formerly, Postdoctoral Fellow, School of Civ. Engrg., Purdue Univ., West Lafayette, IN. Note. Discussion open until October 1, 2000. To extend the closing date one month, a written request must be filed with the ASCE Manager of Journals. The manuscript for this paper was submitted for review and possible publication on December 10, 1997. This paper is part of the Journal of Geotechnical and Geoenvironmental Engineering, Vol. 126, No. 5, May, 2000. qASCE, ISSN 1090-0241/00/0005-0451–0462/$8.00 1 $.50 per page. Paper No. 17169. mechanics problems involving these materials, information is needed on their mechanical properties. The same framework used to describe the small-strain stiffness and the shear strength of clean sands may be used for silty sands, provided that the fines content remains below some limit, usually taken to be in the range of 15–20%. In this paper, we evaluate how the intrinsic variables that appear in correlations for the small- strain stiffness and the shear strength of sands vary with the content of nonplastic fines. SHEAR STRENGTH Critical-State Friction Angle The shear strength of a cohesionless soil can be defined by the Mohr-Coulomb failure criterion with zero cohesive inter- cept s = s tan f (1) where s = shear strength; s = normal stress on the plane of shearing; and f = friction angle. For a triaxial test, it is prac- tical to write f in terms of the principal effective stresses s9 1 2 1 s9 3 sin f = (2) s9 1 1 1 s9 3 where = effective principal stress ratio or stress obliq- s9/s9 1 3 uity. In general, a loose sand contracts and a dense sand expands as it approaches the critical state, usually defined as the state at which the sand is sheared without changes in either shear strength or volume. However, whether a sample of sand is contractive or dilatant depends not only on density but also on effective confining stress. According to the critical-state model, when a loose sample is sheared under high effective confining stress, the shear stress increases monotonically until it reaches a plateau, after which the sample continues to un- dergo shear straining without any change in shear stress or sample volume. The sample is then said to have reached the critical state, and the corresponding friction angle is known as the critical-state friction angle f c . During the shearing of a dense sand, the sample contracts initially and then dilates. The effective principal stress ratio reaches a peak, associated with a peak friction angle, at which the dilation rate is maximum. Further loading causes the shear stress to drop until it reaches the critical state. For practical purposes, the critical-state friction angle obtained from triaxial tests is commonly taken as a unique value for a given granular soil, regardless of the initial relative density and initial confin- ing stress. Such an approach is well justified by results found in the literature (Rowe 1962, 1971; Bolton 1986; Negussey et
Transcript of Shear Strength and Stiffness of Silty Sand

SHEAR STRENGTH AND STIFFNESS OF SILTY SAND
By R. Salgado,1 Member, ASCE, P. Bandini,2 Student Member, ASCE, and A. Karim3
ABSTRACT: The properties of clean sands pertaining to shear strength and stiffness have been studied exten-sively. However, natural sands generally contain significant amounts of silt and/or clay. The mechanical responseof such soils is different from that of clean sands. This paper addresses the effects of nonplastic fines on thesmall-strain stiffness and shear strength of sands. A series of laboratory tests was performed on samples ofOttawa sand with fines content in the range of 5–20% by weight. The samples were prepared at different relativedensities and were subjected to various levels of mean effective consolidation stress. Most of the triaxial testswere conducted to axial strains in excess of 30%. The stress-strain responses were recorded, and the shearstrength and dilatancy parameters were obtained for each fines percentage. Bender element tests performed intriaxial test samples allowed assessment of the effect of fines content on small-strain mechanical stiffness.
INTRODUCTION
It is well established that soils behave as linear elastic ma-terials at shear strains smaller than about 1024–1023%. Forlarger shear strains, the stress-strain relationship is nonlinear.Peak shear strength develops at relatively large strains (cor-responding typically to axial strains in the range of 1–4%),and critical-state shear strength (corresponding to no volumechange during shearing) develops for axial strains in excess of25%. As the Mohr-Coulomb failure criterion is commonlyused to describe shear failure in soils, friction angles deter-mined at the peak and critical states can be defined.
Knowledge of the values of small-strain stiffness and criti-cal-state and peak friction angles is very useful for applicationsbased on constitutive models or analyses that attempt to cap-ture material response from the initial stages of loading up toshear failure. More immediate application of such knowledgecan be made in analyses that rely predominantly on small-strain stiffness (such as the design of machine foundations),or on friction angles only (such as stability analyses of variousforms, where deformations prior to collapse are not consid-ered).
The stress-strain response of sand at small-, intermediate-,and large-strain levels depends upon soil state variables (therelative density DR of the sand, the effective stress state, andfabric) and other factors related to the nature of the sand (par-ticle shape, particle size distribution, particle surface charac-teristics, and mineralogy). The factors related to the constitu-tion and general nature of the sand particles are referred to asintrinsic variables (Been et al. 1991; Salgado et al. 1997a,b).Examples of intrinsic variables are the critical-state frictionangle fc, the maximum and minimum void ratios emax and emin,and the dilatancy parameters Q and R of the peak friction anglecorrelation of Bolton (1986).
The properties of clean sands have been extensively studiedunder laboratory and field conditions. These include Ottawa,Ticino, and Monterey #0 sands (Hardin and Richart 1963;Chung et al. 1984; Bolton 1986; Lo Presti 1987; Lo Presti etal. 1992). However, in situ soils often contain significantamounts of fines. If realistic analyses are to be done of soil
1Assoc. Prof., School of Civ. Engrg., Purdue Univ., West Lafayette, IN47907. E-mail: [email protected]
2PhD Candidate, School of Civ. Engrg., Purdue Univ., West Lafayette,IN.
3Formerly, Postdoctoral Fellow, School of Civ. Engrg., Purdue Univ.,West Lafayette, IN.
Note. Discussion open until October 1, 2000. To extend the closingdate one month, a written request must be filed with the ASCE Managerof Journals. The manuscript for this paper was submitted for review andpossible publication on December 10, 1997. This paper is part of theJournal of Geotechnical and Geoenvironmental Engineering, Vol. 126,No. 5, May, 2000. qASCE, ISSN 1090-0241/00/0005-0451–0462/$8.001 $.50 per page. Paper No. 17169.
JOURNAL OF GEOTEC
mechanics problems involving these materials, information isneeded on their mechanical properties. The same frameworkused to describe the small-strain stiffness and the shearstrength of clean sands may be used for silty sands, providedthat the fines content remains below some limit, usually takento be in the range of 15–20%. In this paper, we evaluate howthe intrinsic variables that appear in correlations for the small-strain stiffness and the shear strength of sands vary with thecontent of nonplastic fines.
SHEAR STRENGTH
Critical-State Friction Angle
The shear strength of a cohesionless soil can be defined bythe Mohr-Coulomb failure criterion with zero cohesive inter-cept
s = s tan f (1)
where s = shear strength; s = normal stress on the plane ofshearing; and f = friction angle. For a triaxial test, it is prac-tical to write f in terms of the principal effective stresses
s912 1
s93sin f = (2)s91
1 1s93
where = effective principal stress ratio or stress obliq-s9/s91 3
uity.In general, a loose sand contracts and a dense sand expands
as it approaches the critical state, usually defined as the stateat which the sand is sheared without changes in either shearstrength or volume. However, whether a sample of sand iscontractive or dilatant depends not only on density but alsoon effective confining stress. According to the critical-statemodel, when a loose sample is sheared under high effectiveconfining stress, the shear stress increases monotonically untilit reaches a plateau, after which the sample continues to un-dergo shear straining without any change in shear stress orsample volume. The sample is then said to have reached thecritical state, and the corresponding friction angle is known asthe critical-state friction angle fc.
During the shearing of a dense sand, the sample contractsinitially and then dilates. The effective principal stress ratioreaches a peak, associated with a peak friction angle, at whichthe dilation rate is maximum. Further loading causes the shearstress to drop until it reaches the critical state. For practicalpurposes, the critical-state friction angle obtained from triaxialtests is commonly taken as a unique value for a given granularsoil, regardless of the initial relative density and initial confin-ing stress. Such an approach is well justified by results foundin the literature (Rowe 1962, 1971; Bolton 1986; Negussey et
HNICAL AND GEOENVIRONMENTAL ENGINEERING / MAY 2000 / 451
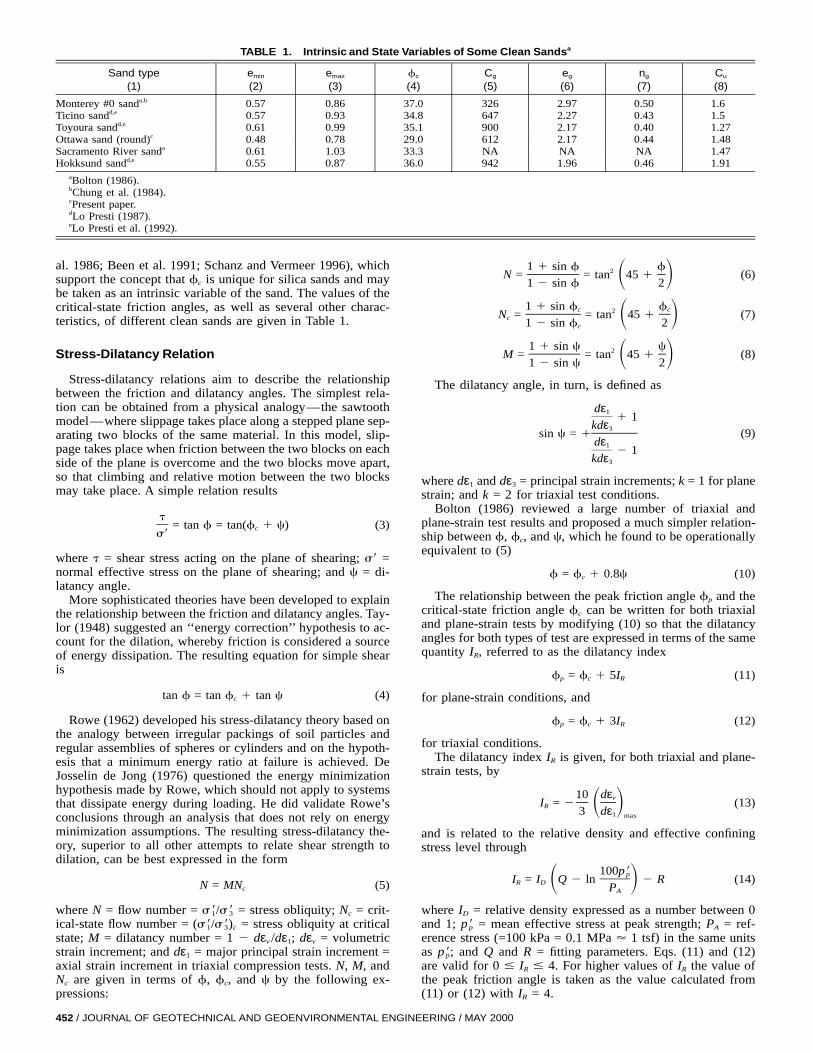
TABLE 1. Intrinsic and State Variables of Some Clean Sandsa
Sand type(1)
emin
(2)emax
(3)fc
(4)Cg
(5)eg
(6)ng
(7)Cu
(8)
Monterey #0 sanda,b 0.57 0.86 37.0 326 2.97 0.50 1.6Ticino sandd,e 0.57 0.93 34.8 647 2.27 0.43 1.5Toyoura sandd,e 0.61 0.99 35.1 900 2.17 0.40 1.27Ottawa sand (round)c 0.48 0.78 29.0 612 2.17 0.44 1.48Sacramento River sanda 0.61 1.03 33.3 NA NA NA 1.47Hokksund sandd,e 0.55 0.87 36.0 942 1.96 0.46 1.91
aBolton (1986).bChung et al. (1984).cPresent paper.dLo Presti (1987).eLo Presti et al. (1992).
al. 1986; Been et al. 1991; Schanz and Vermeer 1996), whichsupport the concept that fc is unique for silica sands and maybe taken as an intrinsic variable of the sand. The values of thecritical-state friction angles, as well as several other charac-teristics, of different clean sands are given in Table 1.
Stress-Dilatancy Relation
Stress-dilatancy relations aim to describe the relationshipbetween the friction and dilatancy angles. The simplest rela-tion can be obtained from a physical analogy—the sawtoothmodel—where slippage takes place along a stepped plane sep-arating two blocks of the same material. In this model, slip-page takes place when friction between the two blocks on eachside of the plane is overcome and the two blocks move apart,so that climbing and relative motion between the two blocksmay take place. A simple relation results
t= tan f = tan(f 1 c) (3)c
s9
where t = shear stress acting on the plane of shearing; s9 =normal effective stress on the plane of shearing; and c = di-latancy angle.
More sophisticated theories have been developed to explainthe relationship between the friction and dilatancy angles. Tay-lor (1948) suggested an ‘‘energy correction’’ hypothesis to ac-count for the dilation, whereby friction is considered a sourceof energy dissipation. The resulting equation for simple shearis
tan f = tan f 1 tan c (4)c
Rowe (1962) developed his stress-dilatancy theory based onthe analogy between irregular packings of soil particles andregular assemblies of spheres or cylinders and on the hypoth-esis that a minimum energy ratio at failure is achieved. DeJosselin de Jong (1976) questioned the energy minimizationhypothesis made by Rowe, which should not apply to systemsthat dissipate energy during loading. He did validate Rowe’sconclusions through an analysis that does not rely on energyminimization assumptions. The resulting stress-dilatancy the-ory, superior to all other attempts to relate shear strength todilation, can be best expressed in the form
N = MN (5)c
where N = flow number = = stress obliquity; Nc = crit-s9/s91 3
ical-state flow number = = stress obliquity at critical(s9/s9)1 3 c
state; M = dilatancy number = 1 2 dεv /dε1; dεv = volumetricstrain increment; and dε1 = major principal strain increment =axial strain increment in triaxial compression tests. N, M, andNc are given in terms of f, fc, and c by the following ex-pressions:
452 / JOURNAL OF GEOTECHNICAL AND GEOENVIRONMENTAL ENGI
1 1 sin f f2N = = tan 45 1 (6)S D1 2 sin f 2
1 1 sin f fc c2N = = tan 45 1 (7)c S D1 2 sin f 2c
1 1 sin c c2M = = tan 45 1 (8)S D1 2 sin c 2
The dilatancy angle, in turn, is defined as
dε11 1
kdε3sin c = 1 (9)dε1
2 1kdε3
where dε1 and dε3 = principal strain increments; k = 1 for planestrain; and k = 2 for triaxial test conditions.
Bolton (1986) reviewed a large number of triaxial andplane-strain test results and proposed a much simpler relation-ship between f, fc, and c, which he found to be operationallyequivalent to (5)
f = f 1 0.8c (10)c
The relationship between the peak friction angle fp and thecritical-state friction angle fc can be written for both triaxialand plane-strain tests by modifying (10) so that the dilatancyangles for both types of test are expressed in terms of the samequantity IR, referred to as the dilatancy index
f = f 1 5I (11)p c R
for plane-strain conditions, and
f = f 1 3I (12)p c R
for triaxial conditions.The dilatancy index IR is given, for both triaxial and plane-
strain tests, by
10 dεvI = 2 (13)R S D3 dε1 max
and is related to the relative density and effective confiningstress level through
100p 9pI = I Q 2 ln 2 R (14)R D S DPA
where ID = relative density expressed as a number between 0and 1; = mean effective stress at peak strength; PA = ref-p 9perence stress (=100 kPa = 0.1 MPa ' 1 tsf) in the same unitsas and Q and R = fitting parameters. Eqs. (11) and (12)p 9;p
are valid for 0 # IR # 4. For higher values of IR the value ofthe peak friction angle is taken as the value calculated from(11) or (12) with IR = 4.
NEERING / MAY 2000

Small-Strain Shear Modulus
There are two general forms of empirical equations used toestimate the shear modulus of sands: one was proposed byHardin (1978) and Hardin and Richart (1963) and another byRoesler (1979). A series of resonant column tests were per-formed by Hardin and Richart (1963) to obtain the small-strainshear modulus for round and angular Ottawa sands. They es-tablished empirical relations for G0 at a shear strain of g =1024 or less as
2(e 2 e)g12n ng gG = C P s9 (15)0 g A m1 1 e
where Cg, eg, and ng = regression constants that depend solelyon the soil (and are therefore intrinsic soil variables); =s9mmean effective stress; PA = reference stress in the same unitsas and e = void ratio.s9 ;m
Roesler (1979) developed his correlation from shear-wavevelocity measurements. The equation has the following form:
(12n2m) n mG = CP s s (16)0 A a p
where sa = normal effective stress acting along the directionof wave propagation; sp = normal effective stress perpendic-ular to the wave-propagation direction; and m, n, and C =fitting parameters.
A different form of the Hardin G0 equation, accounting forthe void ratio through a different function, has been proposedby, among others, Jamiolkowski et al. (1991)
12n a ng g gG = C P e s9 (17)0 g A m
where ag = regression constant (an intrinsic variable of the soil,if this correlation is used to model soil loading response).
Most recent correlations [e.g., Iwasaki and Tatsuoka (1977)and Yu and Richart (1984)] were developed based on the formproposed by Hardin (1978) and Hardin and Richart (1963).Values of the curve-fitting parameters required to calculate G0
for different sands from previous studies are listed in Table 1.Iwasaki and Tatsuoka (1977) studied G0 of clean sands, naturalsands with fines, and artificially graded sand with fines. Theyproposed a correlation for G0 with the form
2(2.17 2 e) 12m(g) m(g)G = C(g)B P (s9) (18)0 A m11 e
where C(g) and m(g) = fitting parameters depending on thestrain level of the test; and B = fitting parameter that is inde-pendent of shear strain g, void ratio e, and confining stress
The results of Iwasaki and Tatsuoka (1977) indicate thats9 .m
G0 decreases with increasing fines content. Results of resonantcolumn tests on Ticino sand by D. C. F. Lo Presti (personalcommunication, 1996) showed that the coefficient Cg of (15)is reduced by about 50% when the fines content increases from0 to 25%, while ng increases slightly. Randolph et al. (1994)also recognized a significant reduction in the small-strain stiff-ness of sand with addition of silt. According to these authors,the small-strain stiffness of silty sand with 5–10, 10–15, and15–20% silt content ranges might be reduced to about 50, 25,and 19% of the G0 value of clean sand, respectively.
Another nondestructive laboratory testing method used tomeasure the small-strain stiffness of soils is the bender elementtest. In this test, a shear wave is generated at one end of thesample and its arrival detected at the other end. The shear-wave velocity is calculated from the sample length and traveltime. The small-strain shear modulus G0 of sands is calculatedfrom the velocity of the shear wave as it travels through thesample
2G = rV (19)0 s
JOURNAL OF GEOT
FIG. 1. Grain Size Distribution of Ottawa Sand and Sil-Co-Sil
where r = total mass density of the soil, and Vs = shear-wavevelocity.
Because a triaxial test can be performed on the same samplewhere Vs was measured using bender elements, bender elementtesting has been increasingly used for measuring G0 (Shirleyand Hampton 1977; Dyvik and Madshus 1985; Viggiani andAtkinson 1995a,b). It is used in this paper to study the small-strain stiffness of clean Ottawa sand and Ottawa sand with 5,10, 15, and 20% added silt.
EXPERIMENTAL PROGRAM AND PROCEDURES
As discussed in the preceding sections, the small-strain stiff-ness and the shear strength of sand may be expressed in termsof a number of intrinsic variables (fc, Q, R, Cg, eg, ng). Theintrinsic variables are a function of the nature of the sand andthus change with fines content. For a given soil density, thisis a valid approach as long as the fines content remains belowa limit beyond which the fines may dominate over the sandmatrix, changing the mechanical response of the soil in a morefundamental way. This paper focuses on sand and silty sandwhere sand-to-sand particle contact prevails; the ranges of den-sity and fines content for which this assumption holds will bediscussed later.
A series of triaxial and bender element tests was performedto assess how the shear strength and small-strain stiffness ofOttawa sand change as an increasing percentage of nonplasticfines is added to it. Ottawa sand, designated as ASTM C 778,is a standard, clean quartz sand with the grain size distributionshown in Fig. 1. The diameters of the sand particles rangefrom 0.1 to 0.6 mm. Ottawa sand is defined as SP accordingto the Unified Soil Classification System. The coefficient ofuniformity Cu is 1.48, and the mean grain size D50 is 0.39 mm.The maximum and minimum void ratios emax and emin are 0.78and 0.48, respectively. Its specific gravity GS is 2.65. Ottawasand particles are round to subround.
The nonplastic fines are #106 Sil-Co-Sil ground silica fromU.S. Silica Co., Ottawa, Ill., which passes the #200 sieve andis composed of SiO2 (99.8%), with Al2O3( 0.05%) and Fe2O3
(0.035%) as secondary components. Its specific gravity is 2.65,with the grain size distribution shown, together with the grainsize distribution of pure Ottawa sand, in Fig. 1.
Static, drained triaxial compression tests were conducted onisotropically consolidated sand samples with 0, 5, 10, 15, and20% nonplastic fines. To obtain homogeneous samples, theslurry deposition method of Kuerbis and Vaid (1988) wasused. According to Kuerbis and Vaid (1988), the slurry-dep-osition method has the following advantages:
1. The method produces loose to dense samples in the com-monly observed density range of in situ soils.
ECHNICAL AND GEOENVIRONMENTAL ENGINEERING / MAY 2000 / 453

2. The samples are easy to saturate.3. The samples have a homogeneous fabric and fairly uni-
form void ratio throughout.4. There is no particle segregation, regardless of gradation
or fines content.5. The method simulates the natural soil deposition mode
and is easy to duplicate.
With respect to Item 5, it is important to point out, as doesVaid (1994), that a triaxial sample is intended to represent anelement within a soil profile and, as such, must be homoge-neous. Particle segregation is possible during deposition of soilthrough water in natural settings or in the construction of hy-draulic fills, which may cause the fines contents to vary withdepth within the soil deposits resulting from such processes.However, the fines content at any given point within such de-posits is unique, and it is the element or ‘‘point’’ within thesoil profile (not the entire deposit) that the laboratory sampleis intended to represent. Thus the slurry deposition methodsimulates the process of soil formation while preserving oneof the requirements of a laboratory sample: that it be reason-ably uniform.
Samples were prepared by first estimating the weights ofsand and silt needed for a desired fines content. These amountsof silt and sand were then mixed in a cylindrical plexiglasstube completely filled with deaired water. A vacuum is appliedfor at least 6 h to the mix of sand, silt, and water through avalve contained in the rubber cap used to seal the tube tominimize entrapped air bubbles. The silt and sand are thor-oughly mixed by vigorous shaking of the plexiglass tube forapproximately 20 min to achieve sample uniformity. After-ward, the rubber cap is removed, a very small amount of de-aired water is added to raise the water level back to the topof the tube, and the tube is topped with a 0.12 3 0.50 m2
piece of 0.43-mil high-density polyethylene film. The tubecontaining the slurry is quickly inverted and positioned insidethe triaxial sample split mold, where a stretched, thin mem-brane, completely filled with deaired water, is already in place.The contents of the tube are released into the membrane byraising the tube. Densification of the sample is accomplishedby carefully and symmetrically tapping the sides of the samplemold immediately after slurry deposition. Because the mass ofsand and silt used in sample preparation can be accuratelyestimated, it is possible to obtain a relative density that isreasonably close to a target value by measuring the height ofthe sample as it densifies. Samples had heights of the order of165 mm and diameters of the order of 70 mm. Backpressuresup to 500 kPa were applied to the samples to ensure that Bvalues in excess of 0.96 were obtained for all samples (mostB values were in excess of 0.98). More details on the samplepreparation and testing procedures can be found in Bandini(1999).
The testing apparatus used to perform the tests is a CKCautomatic triaxial testing system (Soil Engineering EquipmentCo., San Francisco) (Chan 1981). Consolidation of the sampleis accomplished by applying the desired effective consolida-tion stress to the sample in the course of a time ranging from30 min (for dense silty sand and low confining stress) to 180min (for loose silty sand and moderately high confining stress).Consolidation to moderately high confining stresses was some-times done in stages to allow bender element testing betweenstages. The volume change of the sample was measured usinga sensitive differential pressure transducer. The testing appa-ratus uses a pneumatic pressure loading system, and the axialloading is applied through a double-acting oil piston. The testis computer-controlled, and the stress-strain data are recordedautomatically. All triaxial tests for this study were performedat axial strain rates that were slow enough to allow full dis-
454 / JOURNAL OF GEOTECHNICAL AND GEOENVIRONMENTAL ENGI
FIG. 2. Bender Element Test on Dense (e = 0.577) Ottawa SandSample with 5% Silt under Effective Confining Stress of 80 kPa
sipation of pore-water pressures during loading, and the testswere discontinued at 20–33% axial strain.
The bender element tests were performed after consolidationto a given confining stress was completed. Two piezoceramicplates or bender elements are used in the test: one embeddedin the base pedestal and the other at the top platen of thetriaxial apparatus. These elements have the property that theybend when subjected to a voltage, and, in turn, produce avoltage when bent. A rectangular voltage pulse is applied tothe transmitter element, causing it to produce a shear wave.This rectangular pulse is typically on the order of 10 V inorder to generate a shear disturbance that is sufficiently largeto reach the other end of the sample and distort the receiverelement, producing another voltage pulse on the order ofabout 1–2 mV. The signal is recorded and analyzed using anHP3566A/67A digital analyzer (Hewlett-Packard Co., PaloAlto, Calif.). The velocity of the shear wave transmittedthrough the soil is calculated as the ratio of the effective lengthof the test sample to the shear-wave travel time. The effectivelength of the sample is taken as the length between the tips ofthe bender elements, and this value is used along with traveltime to calculate the velocity of the shear wave. FollowingViggiani and Atkinson (1995a), the arrival of the shear wavecorresponds to the first significant inversion of the receivedsignal, determining the travel time of the shear wave. Fig. 2illustrates a bender element test on a sample of sand with 5%silt, void ratio of 0.577, and effective confining stress of 80kPa. The arrival signal was magnified 5,000 times so that itcould be plotted on the same graph as the originating pulse.Points A and B illustrate the starting and ending points for thecalculation of the travel time.
The small-strain shear modulus G0 is computed for a benderelement test using (19). It is important to stress that the ac-curacy of G0 values obtained using bender element tests is notperfect; the errors in G0 values may, in extreme cases, be onthe order of 15%, as discussed by Viggiani and Atkinson(1995a,b). Arulnathan et al. (1998) reached similar conclu-sions, although they focused on originating pulses of a sinu-soidal shape. According to Arulnathan et al. (1998), errors inG0 values exist mainly due to (1) deviations from 1D wavepropagation, which is assumed in the calculations; (2) waveinterference at the caps; (3) the different time delays betweenthe generation of the electrical signal and its transformationinto a mechanical impulse at the source bender element andthe reverse process at the receiving bender element; and (4)near field effects. Near field effects may be significant onlywhen shear-wave arrival is identified with first motion at thereceiving bender element, which is not how wave arrival isdefined in this paper; however, the other factors are reflected
NEERING / MAY 2000

TABLE 2. Minimum and Maximum Void Ratios for Clean andSilty Ottawa Sands
Silt(%)(1)
emin
(2)emax
(3)
0 0.48 0.785 0.42 0.70
10 0.36 0.6515 0.32 0.6320 0.29 0.62
in the results. As pointed out by Arulnathan et al. (1998), suchfactors sometimes balance each other out, but sometimes donot. Thus, in the context of the current state of knowledge ofbender element testing, it may be stated that the actual G0
values may differ from those measured in the present testingprogram by as much as 15%, although the actual difference isprobably smaller due to self-compensating effects. It is im-portant to stress, however, that one of the main goals of thetesting program is to assess the extent to which the presenceof nonplastic fines changes the stiffness of silica sand. Forsuch comparisons, where the focus is on the ratios of stiffnessof silty and clean sands measured in the same way, errors areexpected to be quite small.
ANALYSIS OF RESULTS
Minimum and Maximum Void Ratios
The concept of relative density is used in this paper despitehaving been subjected to some criticism. The criticism hasfocused on difficulties in obtaining emax and emin, particularlyfor sands with more than 15% fines content (Burmister 1948;Tavenas and La Rochelle 1972; Selig and Ladd 1973). How-ever, careful execution of a specific procedure to determineemax and emin does lead to reasonably reproducible numbers(and a relative density reproducible to 65%). Additionally,important advantages are offered by the use of relative density,notably that relative density allows unification of the descrip-tion of the density or degree of compaction of granular soilswith fines content ranging from 0 to 20% with respect to thedensest and loosest possible states for these soils.
In their study of the undrained properties of Brenda tailingssand, Kuerbis et al. (1988) found that the maximum and min-imum void ratios of silty sand decreased as silt content in-creased from 0 to 20%. Similar results were observed by Ladeand Yamamuro (1997) for Nevada and Ottawa sands mixedwith nonplastic fines and, in the present study, for Ottawa sandmixed with Sil-Co-Sil. Minimum and maximum void ratioswere determined in this study according to ASTM D 4253 andASTM D 4254. Minimum density was obtained by pouringsand into a standard compaction mold with a volume of 2,830cm3 using a thin-wall cylindrical tube. Maximum density wasachieved by densifying dry sand in a compaction mold of2,830 cm3 using an electromagnetic, vertically vibrating tablewith a frequency of 60 Hz. A double amplitude of verticalvibration of 0.379 mm was found to be optimum for all gra-dations. Even though the ASTM recommended procedure isapplicable for fines contents up to 15%, no difficulties werefound when using it for 20% silt content. Table 2 gives max-imum and minimum void ratios of clean and silty Ottawasands as a function of silt content; it is clear that emax and emin
of silty sands decrease as the fines content increases from 0to 20%. The rate of decrease drops as the fines content ap-proaches 20%, and Kuerbis et al. (1988) and Lade and Ya-mamuro (1997) observed in their studies that emax and emin in-crease after the fines content exceeds about 25%.
This pattern of decreasing emax and emin with increasing fines
JOURNAL OF GEOTEC
FIG. 4. Determination of Critical-State Friction Angle fc fromDrained Triaxial Compression Test on Loose Clean Sand Sam-ple (DR = 27.1%) under Effective Confining Stress of 400 kPa
FIG. 3. Limit Void Ratio for 5, 10, 15, and 20% Silt Content
content is well explained by Lade and Yamamuro (1997). Asfines are added to either a dense or loose sand matrix, mostparticles initially occupy the voids between sand particles.This represents a reduction in void ratio with increasing theamount of fines. Some particles, however, end up between thesurface of adjacent sand particles. Such particles would tendto cause an increase in void ratio, as they do not occupy the
HNICAL AND GEOENVIRONMENTAL ENGINEERING / MAY 2000 / 455

FIG. 5. Drained Triaxial Compression Tests on Loose Samplesof Ottawa Sand with Various Silt Contents under ModeratelyHigh Effective Confining Stress
natural void space left by the sand matrix, and to push sandparticles apart. Due to the methods of preparation of loose anddense samples, more particles are found between the surfacesof adjacent sand particles in loose than in dense sands, hencethe larger drops in emin than in emax for a given increase in finescontent observed in Table 2.
For a given overall void ratio, there is a fines content forwhich the fines completely (or almost completely) separateadjacent sand particles. An easy way to determine the finescontent for which this happens is based on the concept of theskeleton void ratio esk (Kuerbis et al. 1988), which is the voidratio of the silty sand calculated as if the fines were voids
1 1 ee = 2 1 (20)sk 1 2 f
where e = overall void ratio of soil; and f = ratio of weight offines to total weight of solids. Whenever esk is greater than themaximum void ratio (emax)f=0 of clean sand, the sand matrixexists with a void ratio higher than it could achieve in theabsence of fines, which means that the sand particles are, onaverage, not in contact, and mechanical behavior is no longercontrolled by the sand matrix. Fig. 3 shows the skeleton voidratio as a function of void ratio for 5, 10, 15, and 20% fines.
456 / JOURNAL OF GEOTECHNICAL AND GEOENVIRONMENTAL ENG
FIG. 6. Drained Triaxial Compression Tests on Dense Sam-ples of Ottawa Sand with Various Silt Contents under Low Effec-tive Confining Stress
For each gradation, a limit void ratio (and a correspondinglimit relative density) can be defined. For Ottawa sand, withemax = 0.78, these relative densities are 3% for 5% fines, 17%for 10% fines, 38% for 15% fines, and 59% for 20% fines.For relative densities lower than the limit relative density, thefines control and the behavior becomes that of a sandy silt orsandy clay, depending on the nature of the fines. For soilsdenser than the limit relative density, the behavior is that ofsand, modified by the presence of fines.
Peak and Critical-State Shear Strength
The peak and critical-state friction angles are obtained ac-cording to (1) at the points of peak strength and critical state,respectively. Critical state is identified as constant shear stress
INEERING / MAY 2000
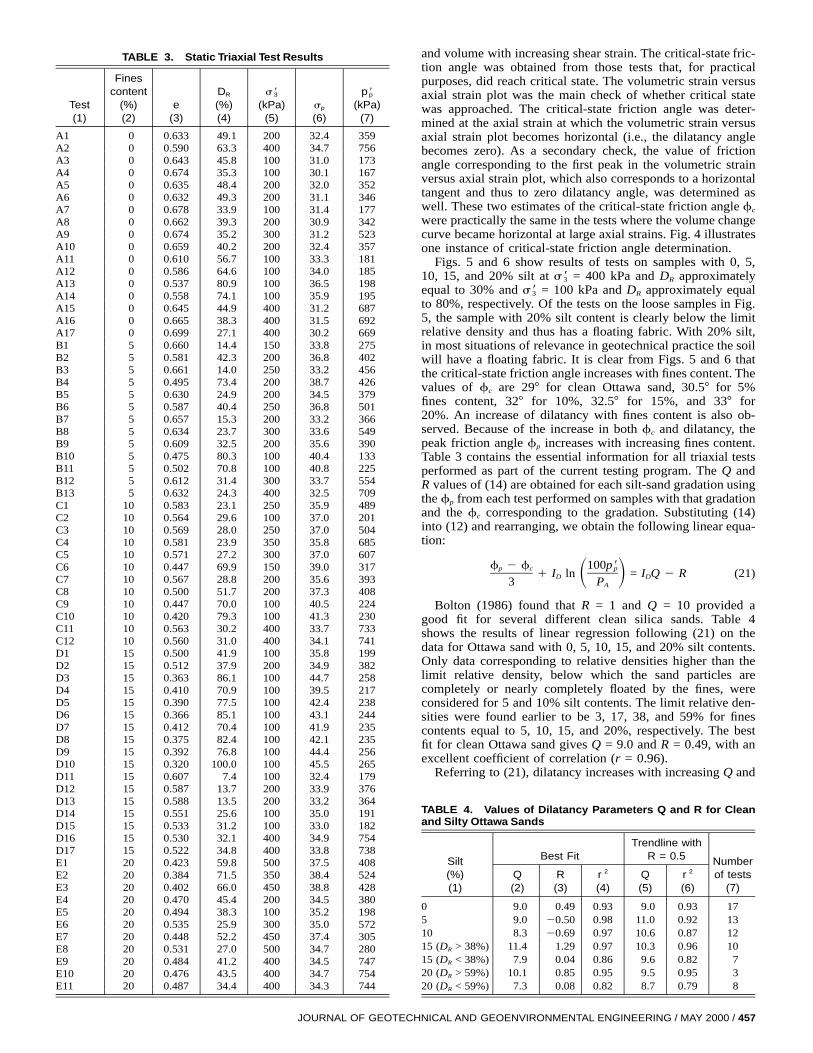
TABLE 3. Static Triaxial Test Results
Test(1)
Finescontent
(%)(2)
e(3)
DR
(%)(4)
s93(kPa)
(5)sp
(6)
p 9p(kPa)
(7)
A1 0 0.633 49.1 200 32.4 359A2 0 0.590 63.3 400 34.7 756A3 0 0.643 45.8 100 31.0 173A4 0 0.674 35.3 100 30.1 167A5 0 0.635 48.4 200 32.0 352A6 0 0.632 49.3 200 31.1 346A7 0 0.678 33.9 100 31.4 177A8 0 0.662 39.3 200 30.9 342A9 0 0.674 35.2 300 31.2 523A10 0 0.659 40.2 200 32.4 357A11 0 0.610 56.7 100 33.3 181A12 0 0.586 64.6 100 34.0 185A13 0 0.537 80.9 100 36.5 198A14 0 0.558 74.1 100 35.9 195A15 0 0.645 44.9 400 31.2 687A16 0 0.665 38.3 400 31.5 692A17 0 0.699 27.1 400 30.2 669B1 5 0.660 14.4 150 33.8 275B2 5 0.581 42.3 200 36.8 402B3 5 0.661 14.0 250 33.2 456B4 5 0.495 73.4 200 38.7 426B5 5 0.630 24.9 200 34.5 379B6 5 0.587 40.4 250 36.8 501B7 5 0.657 15.3 200 33.2 366B8 5 0.634 23.7 300 33.6 549B9 5 0.609 32.5 200 35.6 390B10 5 0.475 80.3 100 40.4 133B11 5 0.502 70.8 100 40.8 225B12 5 0.612 31.4 300 33.7 554B13 5 0.632 24.3 400 32.5 709C1 10 0.583 23.1 250 35.9 489C2 10 0.564 29.6 100 37.0 201C3 10 0.569 28.0 250 37.0 504C4 10 0.581 23.9 350 35.8 685C5 10 0.571 27.2 300 37.0 607C6 10 0.447 69.9 150 39.0 317C7 10 0.567 28.8 200 35.6 393C8 10 0.500 51.7 200 37.3 408C9 10 0.447 70.0 100 40.5 224C10 10 0.420 79.3 100 41.3 230C11 10 0.563 30.2 400 33.7 733C12 10 0.560 31.0 400 34.1 741D1 15 0.500 41.9 100 35.8 199D2 15 0.512 37.9 200 34.9 382D3 15 0.363 86.1 100 44.7 258D4 15 0.410 70.9 100 39.5 217D5 15 0.390 77.5 100 42.4 238D6 15 0.366 85.1 100 43.1 244D7 15 0.412 70.4 100 41.9 235D8 15 0.375 82.4 100 42.1 235D9 15 0.392 76.8 100 44.4 256D10 15 0.320 100.0 100 45.5 265D11 15 0.607 7.4 100 32.4 179D12 15 0.587 13.7 200 33.9 376D13 15 0.588 13.5 200 33.2 364D14 15 0.551 25.6 100 35.0 191D15 15 0.533 31.2 100 33.0 182D16 15 0.530 32.1 400 34.9 754D17 15 0.522 34.8 400 33.8 738E1 20 0.423 59.8 500 37.5 408E2 20 0.384 71.5 350 38.4 524E3 20 0.402 66.0 450 38.8 428E4 20 0.470 45.4 200 34.5 380E5 20 0.494 38.3 100 35.2 198E6 20 0.535 25.9 300 35.0 572E7 20 0.448 52.2 450 37.4 305E8 20 0.531 27.0 500 34.7 280E9 20 0.484 41.2 400 34.5 747E10 20 0.476 43.5 400 34.7 754E11 20 0.487 34.4 400 34.3 744
JOURNAL OF GEOTE
TABLE 4. Values of Dilatancy Parameters Q and R for Cleanand Silty Ottawa Sands
Silt(%)(1)
Best Fit
Q(2)
R(3)
r 2
(4)
Trendline withR = 0.5
Q(5)
r 2
(6)
Numberof tests
(7)
0 9.0 0.49 0.93 9.0 0.93 175 9.0 20.50 0.98 11.0 0.92 1310 8.3 20.69 0.97 10.6 0.87 1215 (DR > 38%) 11.4 1.29 0.97 10.3 0.96 1015 (DR < 38%) 7.9 0.04 0.86 9.6 0.82 720 (DR > 59%) 10.1 0.85 0.95 9.5 0.95 320 (DR < 59%) 7.3 0.08 0.82 8.7 0.79 8
and volume with increasing shear strain. The critical-state fric-tion angle was obtained from those tests that, for practicalpurposes, did reach critical state. The volumetric strain versusaxial strain plot was the main check of whether critical statewas approached. The critical-state friction angle was deter-mined at the axial strain at which the volumetric strain versusaxial strain plot becomes horizontal (i.e., the dilatancy anglebecomes zero). As a secondary check, the value of frictionangle corresponding to the first peak in the volumetric strainversus axial strain plot, which also corresponds to a horizontaltangent and thus to zero dilatancy angle, was determined aswell. These two estimates of the critical-state friction angle fc
were practically the same in the tests where the volume changecurve became horizontal at large axial strains. Fig. 4 illustratesone instance of critical-state friction angle determination.
Figs. 5 and 6 show results of tests on samples with 0, 5,10, 15, and 20% silt at = 400 kPa and DR approximatelys93equal to 30% and = 100 kPa and DR approximately equals93to 80%, respectively. Of the tests on the loose samples in Fig.5, the sample with 20% silt content is clearly below the limitrelative density and thus has a floating fabric. With 20% silt,in most situations of relevance in geotechnical practice the soilwill have a floating fabric. It is clear from Figs. 5 and 6 thatthe critical-state friction angle increases with fines content. Thevalues of fc are 297 for clean Ottawa sand, 30.57 for 5%fines content, 327 for 10%, 32.57 for 15%, and 337 for20%. An increase of dilatancy with fines content is also ob-served. Because of the increase in both fc and dilatancy, thepeak friction angle fp increases with increasing fines content.Table 3 contains the essential information for all triaxial testsperformed as part of the current testing program. The Q andR values of (14) are obtained for each silt-sand gradation usingthe fp from each test performed on samples with that gradationand the fc corresponding to the gradation. Substituting (14)into (12) and rearranging, we obtain the following linear equa-tion:
f 2 f 100p 9p c p1 I ln = I Q 2 R (21)D DS D3 PA
Bolton (1986) found that R = 1 and Q = 10 provided agood fit for several different clean silica sands. Table 4shows the results of linear regression following (21) on thedata for Ottawa sand with 0, 5, 10, 15, and 20% silt contents.Only data corresponding to relative densities higher than thelimit relative density, below which the sand particles arecompletely or nearly completely floated by the fines, wereconsidered for 5 and 10% silt contents. The limit relative den-sities were found earlier to be 3, 17, 38, and 59% for finescontents equal to 5, 10, 15, and 20%, respectively. The bestfit for clean Ottawa sand gives Q = 9.0 and R = 0.49, with anexcellent coefficient of correlation (r = 0.96).
Referring to (21), dilatancy increases with increasing Q and
CHNICAL AND GEOENVIRONMENTAL ENGINEERING / MAY 2000 / 457
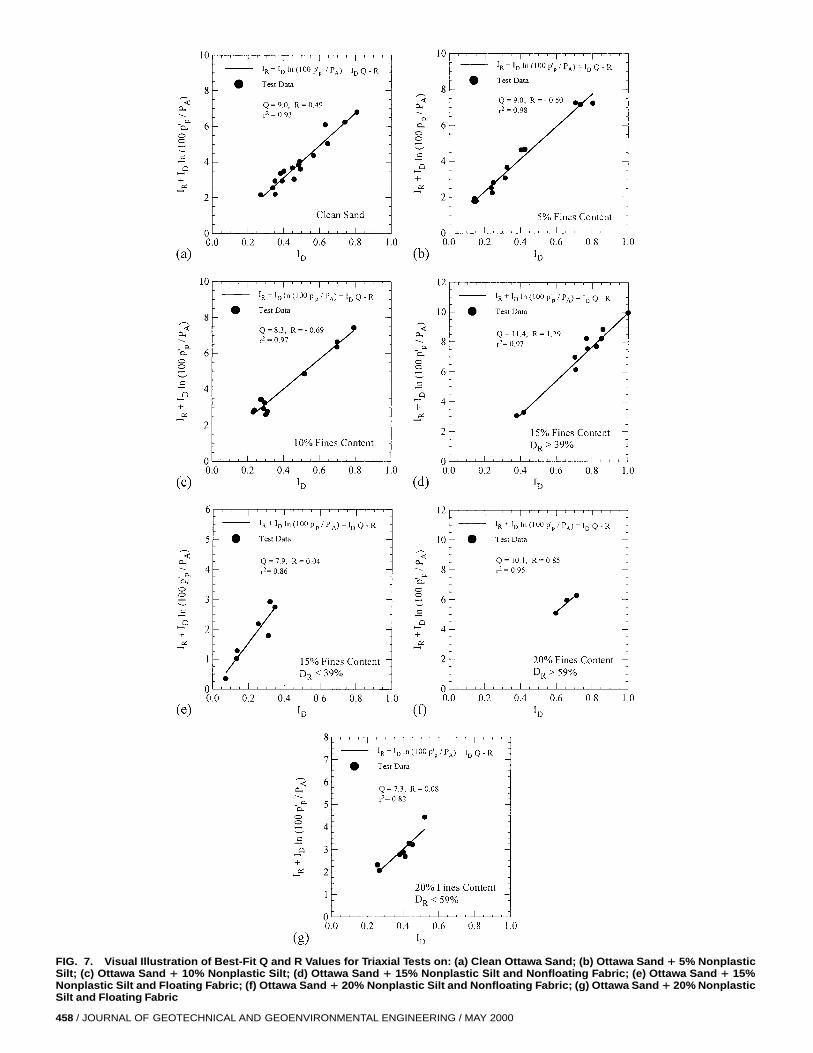
FIG. 7. Visual Illustration of Best-Fit Q and R Values for Triaxial Tests on: (a) Clean Ottawa Sand; (b) Ottawa Sand 1 5% NonplasticSilt; (c) Ottawa Sand 1 10% Nonplastic Silt; (d) Ottawa Sand 1 15% Nonplastic Silt and Nonfloating Fabric; (e) Ottawa Sand 1 15%Nonplastic Silt and Floating Fabric; (f) Ottawa Sand 1 20% Nonplastic Silt and Nonfloating Fabric; (g) Ottawa Sand 1 20% NonplasticSilt and Floating Fabric
458 / JOURNAL OF GEOTECHNICAL AND GEOENVIRONMENTAL ENGINEERING / MAY 2000

FIG. 8. Results of Bender Element Tests for Samples of CleanSand at Various Initial Void Ratios: (a) and (b) Low EffectiveConfining Stresses; (c) Higher Effective Confining Stresses
decreases with increasing R. Bolton (1986) discussed the casein which the calculated peak friction angle results less thanthe critical-state friction angle. This would be seen when thestrains necessary to reach critical-state shear strength are solarge that fp is selected at an earlier, lower value of shearstrength. A positive value of R would suggest this type ofscenario for very low relative densities. A negative value ofR, on the other hand, would imply that the fp of very loosesand would still be higher than fc. An implication of the roleof Q and R in (21) is that, for a set of triaxial tests performedon a given material, the value of R would be affected by theselected value of fc, but Q would remain unchanged. Ulti-mately, however, both Q and R are fitting parameters, andinterpretations of their physical meaning should be used withinbounds. The values of Q and R in Table 4 are strictly appli-
JOURNAL OF GEOTE
FIG. 9. Results of Bender Element Tests for Samples of Sandwith 5% Nonplastic Silt at Various Initial Void Ratios: (a) Low Ef-fective Confining Stresses; (b) Higher Effective ConfiningStresses
cable only within the range of realtive densities for which testdata are available, and use of (21) outside such ranges shouldbe made with caution.
A direct comparison of the dilatancy of the sand-siltmixtures is possible through examination of the values of bothQ and R for each silt content. It is easier, although not entirelycorrect from a fundamental point of view, to compare the di-latancies of sand with 0, 5, 10, 15, and 20% silt by comparingthe values of Q obtained if a single R value is used, for whichthe coefficient of correlation is satisfactory for all gradations.A value of R = 0.5 works relatively well for all gradations (r= 0.96, 0.96, 0.93, 0.98, and 0.97), producing Q values equalto 9, 11, 10.6, 10.3, and 9.5 for 0, 5, 10, 15, and 20% siltcontents, respectively, and relative densities higher than thelimit relative density. Fig. 7 illustrates graphically the best fitfor all gradations. It is observed that Q for samples with non-floating fabric increases with the addition of 5% silt and thendrops as the silt content is increased further, but never returnsto the value for clean sand. These results indicate that the peakfriction angle of sands increases with fines content not onlybecause the critical-state friction angle fc increases, but alsobecause dilatancy increases. In contrast with fc, which in-creases throughout the range from 0 to 20% silt content, di-latancy increases initially, as the fines content is raised to 5%,and then drops with further addition of fines, remaining how-ever higher than that of clean sand. The test results suggestthat, for low silt contents (about 20% or less) and a fabricmostly or completely associated with sand-to-sand particlecontact, the silt particles occupy spaces adjacent to neighbor-ing sand particles, increasing particle interlocking and causingthe soil to become more dilative.
CHNICAL AND GEOENVIRONMENTAL ENGINEERING / MAY 2000 / 459

FIG. 10. Results of Bender Element Tests for Samples of Sandwith 10% Nonplastic Silt at Various Initial Void Ratios: (a) LowEffective Confining Stresses; (b) Higher Effective ConfiningStresses
While not apparent in dense samples under low confiningstresses, the stiffness of loose samples at 400-kPa confinementat moderately small strains decreases noticeably as the silt con-tent is increased from 0 to 15% silt but then appears to sta-bilize as the silt content is increased further (Fig. 5). The deg-radation and then recovery of shear stiffness can be understoodby referring again to the concept of the limit relative density.All of the samples have approximately the same relative den-sity (DR = 25–40%), but different fines content. If the ap-proximate relative density of the samples is compared with thelimit relative density for each fines content, it is observed thatit nearly matches the limit relative density for 15% fines, butthen falls definitely below the limit relative density for 20%fines. From 0 to 15% fines content, the fabric gets progres-sively weaker, as the fines separate the sand particles moreand more. It is noted that the lower stiffness resulting fromthe addition of fines to the sand is a phenomenon observed atrelatively small strain; as shearing takes place, the sample con-tracts and the sand particles come in closer contact, with the
460 / JOURNAL OF GEOTECHNICAL AND GEOENVIRONMENTAL ENG
FIG. 11. Results of Bender Element Tests for Samples ofSand with: (a) 15% Nonplastic Silt; (b) 20% Nonplastic Siltat Low Effective Confining Stresses; (c) 20% Nonplastic Siltat Higher Effective Confining Stresses, at Various Initial VoidRatios
TABLE 5. Regression Parameters Cg , eg , ag , and ng for Calculation of G0 Using (15) and (17)
Silt(%)(1)
Using Eq. (15)
Cg
(2)eg
(3)ng
(4)r 2
(5)
Using Eq. (17)
Cg
(6)ag
(7)ng
(8)r 2
(9)
0 612 2.17 0.439 0.96 547 21.051 0.443 0.975 454 2.17 0.459 0.94 410 21.044 0.458 0.9510 357 2.17 0.592 0.91 135 22.376 0.557 0.9615 238 2.17 0.745 0.85 101 22.069 0.715 0.9420 (DR > 59%) 270 2.17 0.686 1.00 — — — —20 (DR < 59%) 207 2.17 0.809 0.98 — — — —
INEERING / MAY 2000

fines actually helping to enhance dilatancy and shear strength.At 15% silt content, the fines start controlling, and at 20% siltcontent, they fully control soil response, with the soil fabricbecoming more stable and the stiffness stabilizing with in-creasing fines content.
Small-Strain Shear Modulus G0
Figs. 8–11 contain the essential information from thebender element tests performed for this study. Eqs. (15) and(17) were used to fit the data from the bender element testson Ottawa sand with 0, 5, 10, 15, and 20% silt. Research byIwasaki and Tatsuoka (1977) indicated that eg = 2.17 can beused in (15) with satisfactory results for sand particles rangingfrom round to angular in shape. Thus eg was assumed equalto 2.17, and the values of Cg and ng in (15), found throughregression analysis, are listed in Table 5. It was found that (15)works very well for both clean and silty sand (with coefficientsof correlation r = 0.98, 0.97, 0.95, 0.92, and 0.99 for 0, 5, 10,15, and 20% silt content, respectively).
The values of Cg, ag, and ng in (17) are found by findingthe best fit through the data points. The correlation in (17)worked better than (15) for all stress levels and silt contentsup to 15%. For the available data, a reasonable correlation wasnot found in (17) for 20% silt content. The correlation param-eters are listed in Table 5 for different fines contents. Basedon the values of Cg, ag, and ng from Table 5, it is clear thatthe shear modulus of sand decreases dramatically with finescontent. For instance, at a confining pressure of 100 kPa andDR = 50%, the value of G0 is 89 MPa for clean sands, but itdrops to 75, 66, 46, and 42 MPa for sands with 5, 10, 15, and20% fines, respectively. The stiffness reduction with fines con-tent may be partially explained by the way in which the finesinteract with the sand matrix. If the fines are positioned withinthe sand matrix in such a way that they do not have well-developed contacts with the sand particles, shear waves (orstatic stresses) are not effectively transferred through the fineparticles. Thus lower void ratios due to the addition of finesdo not lead to increases in G0; accordingly, a silty sand at thesame void ratio as a clean sand has a lower G0. Even whensilt particles have better developed contacts with the sand par-ticles, the silt particles may more easily move sideways undershear stress application or shear-wave propagation, leading tolower shear stiffness. These two effects, related to the fabricof silty sands, lead to the lower Cg values measured in benderelement testing.
These observations that lower stiffness results from the ad-dition of fines indicate that analyses of granular soil masseswhere clean sand G0 values are used can be in significant errorif the soil has even a small amount of fines.
SUMMARY AND CONCLUSIONS
At small shear strains (typically <1024–1023%) the shearstress versus shear strain relationship of sand is linear, but forlarger shear strains it becomes strongly nonlinear. If the sandis dilative, a peak shear strength is reached at axial strains ofthe order of 2–3%. At large strains (of the order of 25–40%),the sand reaches its critical state. In the analysis of soil prob-lems, it becomes important to describe the loading responseof sands. In this paper, we studied the effects of various levelsof silt content on the stress-strain properties of sand at smalland large shear strains.
The small-strain shear modulus G0 describes soil responsein the initial, elastic stress-strain range and is a function of thestress state and degree of compactness of the sand. The small-strain shear modulus G0 increases with a power ng (usually inthe range of 0.4–0.8, depending on the silt content) of themean effective stress. The stiffness is further assumed to vary
JOURNAL OF GEOTE
with a prescribed function of the void ratio, either (1) a powerag of the void ratio; or (2) according to (eg 2 e)2/(1 1 e).Another constant, Cg, also appears in the correlations. Thesetwo sets of constants—(Cg, eg, ng) and (Cg, ag, ng)—were de-termined for clean Ottawa sand and Ottawa sand with 5, 10,15, and 20% silt contents. It was observed that the small-strainstiffness at a given relative density and confining stress leveldecreases dramatically with the addition of even small per-centages of silt. This is an important result, as analyses ofproblems involving silty sand using stiffness properties ofclean sand can be in serious error.
Results of triaxial tests were analyzed to assess both thepeak and the critical-state friction angles of clean and siltyOttawa sands. It was observed that the addition of even smallpercentages of silt to clean sand considerably increases boththe peak friction angle at a given initial relative density andthe critical-state friction angle. This study suggests that siltysands with nonfloating fabric in the 5–20% silt content rangeare more dilatant than clean sands; dilatancy appears to peakat around 5% silt content, but even at 20% silt content it re-mains above that of clean sand.
It is interesting to note that, although small-strain stiffnessdrops, peak and critical-state strengths increase with increasingfines content. This may be interpreted as follows: initially thefine particles are not positioned in a way to provide optimuminterlocking and small shear strains are imposed on the soilwith greater ease than if the fines were not present. As shearingprogresses, the fines reach more stable arrangements and ul-timately increase interlocking, dilatancy, and shear strength.
The soil response observed in this study is strictly applicableonly to the silt and sand gradations used in the testing. Furtherstudy is needed to assess the effects of different gradations onthe behavior of silty sand.
ACKNOWLEDGMENTS
This material is based upon work supported by the National ScienceFoundation, Washington, D.C., Earthquake Hazards Mitigation Program,under grant No. CMS-9410361. However, any opinions, findings, andconclusions or recommendations expressed in this material are those ofthe writers and do not necessarily reflect the views of the National Sci-ence Foundation. The support of Dr. Michael F. Riemer and his usefulinsights into bender element testing are greatly appreciated. The assis-tance of Bryan Scott and Yongdong Zeng with some of the tests is alsoappreciated. Dr. Vincent P. Drnevich assisted with the data acquisitionsoftware for the bender element tests.
APPENDIX I. REFERENCESArulnathan, R., Boulanger, R. W., and Riemer, M. F. (1998). ‘‘Analysis
of bender element tests.’’ Geotech. Testing J., 21(2), 120–131.Bandini, P. (1999). ‘‘Static response and liquefaction of silty sands,’’ Mas-
ter thesis, Purdue University, West Lafayette, Ind.Been, K., Jefferies, M. G., and Hachey, J. (1991). ‘‘The critical state of
sands.’’ Geotechnique, London, 41(3), 365–381.Bolton, M. D. (1986). ‘‘The strength and dilatancy of sands.’’ Geotech-
nique, London, 36(1), 65–78.Burmister, D. (1948). The importance and practical use of relative density
in soil mechanics, Spec. Publ. No. 48, ASTM, West Conshohocken,Pa., 1–20.
Chan, C. K. (1981). ‘‘An electropneumatic cyclic loading system.’’ Geo-tech. Testing J., 4(4), 183–187.
Chung, R. M., Yo Kel, F. Y., and Drenevich, V. P. (1984). ‘‘Evaluationof dynamic properties of sands by resonant column testing.’’ Geotech.Testing J., 7(2), 60–69.
De Josselin de Jong, G. (1976). ‘‘Rowe’s stress-dilatancy relation basedon friction.’’ Geotechnique, London, 26(3), 527–534.
Dyvik, R., and Madshus, C. (1985). ‘‘Laboratory measurement of Gmax
using bender elements.’’ Advances in the art of testing soils undercyclic conditions, ASCE, New York, 186–196.
Hardin, B. O. (1978). ‘‘The nature of stress-strain behavior of soils.’’Proc., ASCE Geotech. Engrg. Div.., Spec. Conf., Vol. 1, ASCE, NewYork, 3–90.
Hardin, B. O., and Richart, F. E., Jr. (1963). ‘‘Elastic wave velocities ingranular soils.’’ J. Soil Mech. Found. Div., ASCE, 89(1), 33–65.
CHNICAL AND GEOENVIRONMENTAL ENGINEERING / MAY 2000 / 461
Iwasaki, T., and Tatsuoka, F. (1977). ‘‘Effect of grain size and gradingon dynamic shear moduli of sands.’’ Soils and Found., Tokyo, 17(3),19–35.
Jamiolkowski, M., Leroueil, S., and Lo Presti, D. C. F. (1991). ‘‘Themelecture: Design parameters from theory to practice.’’ Proc., Geo-Coast’91, 1–41.
Kuerbis, R., Negussey, D., and Vaid, Y. P. (1988). ‘‘Effect of gradationand fines content on the undrained response of sand.’’ Hydraulic fillstructures, Geotech. Spec. Publ. No. 21, ASCE, New York, 330–345.
Kuerbis, R., and Vaid, Y. P. (1988). ‘‘Sand sample preparation—Theslurry deposition method.’’ Soil and Found., Tokyo, 28(4), 107–118.
Lade, P., and Yamamuro, J. (1997). ‘‘Effects of non-plastic fines on staticliquefaction of sands.’’ Can. Geotech. J., Ottawa, 34(6), 918–928.
Lo Presti, D. C. F. (1987). ‘‘Mechanical behavior of Ticino sand fromresonant column tests,’’ PhD thesis, Politecnico di Torino, Turin, Italy.
Lo Presti, D. C. F., Pedroni, S., and Crippa, V. (1992). ‘‘Maximum drydensity of cohesionless soil by pluviation and by ASTM D 4253-83: acomparative study.’’ Geotech. Testing J., 15(2), 180–189.
Negussey, D., Wijewickreme, W. K. D., and Vaid, Y. P. (1986). Constantvolume friction angle of granular materials, Soil Mech. Ser. No. 94,Dept. of Civ. Engrg., University of British Columbia, Vancouver.
Randolph, M. F., Dolwin, J., and Beck, R. (1994). ‘‘Design of drivenpiles in sand.’’ Geotechnique, London, 44(3), 427–448.
Roesler, S. K. (1979). ‘‘Anisotropic shear modulus due to stress anisot-ropy.’’ J. Geotech. Engrg. Div., ASCE, 105(7), 871–880.
Rowe, P. W. (1962). ‘‘The stress-dilatancy relation for static equilibriumof an assembly of particles in contact.’’ Proc., Royal Soc., London,A269, 500–527.
Rowe, P. W. (1971). ‘‘Theoretical meaning and observed values of de-
462 / JOURNAL OF GEOTECHNICAL AND GEOENVIRONMENTAL ENG
formation parameters for soil.’’ Proc., Roscoe Memorial Symp., Stress-Strain Behavior of Soils, R. H. G. Parry, ed., Foulis, Henley on Thames,U.K., 143–194.
Salgado, R., Boulanger, R. W., and Mitchell, J. K. (1997a). ‘‘Lateral stresseffects on CPT liquefaction resistance correlations.’’ J. Geotech. andGeoenvir. Engrg., ASCE, 123(8), 726–735.
Salgado, R., Mitchell, J. K., and Jamiolkowski, M. (1997b). ‘‘Cavity ex-pansion and penetration resistance in sand.’’ J. Geotech. and Geoenvir.Engrg., ASCE, 123(4), 344–354.
Schanz, T., and Vermeer, P. A. (1996). ‘‘Angles of friction and dilatancyof sand.’’ Geotechnique, London, 46(1), 145–151.
Selig, E. T., and Ladd, R. S. (1973). ‘‘Evaluation of relative density mea-surement and applications.’’ Evaluation of relative density and its rolein geotechnical projects involving cohesionless soils, ASTM STP 523,ASTM, West Conshohocken, Pa., 487–504.
Shirley, D. J., and Hampton, L. D. (1977). ‘‘Shear-wave measure-ments in laboratory sediments.’’ J. Acoust. Soc. Am., 63(2), 607–613.
Tavenas, F., and La Rochelle, P. (1972). ‘‘Accuracy of relative densitymeasurements.’’ Geotechnique, London, 22(4), 549–562.
Taylor, D. W. (1948). Fundamentals of soil mechanics. Wiley, New York.Vaid, Y. P. (1994). ‘‘Liquefaction of silty soils.’’ Ground failures under
seismic conditions, Geotech. Spec. Publ. No. 44, Shamsher Prakash andPanos Dakoulas, eds., ASCE, New York, 1–16.
Viggiani, G., and Atkinson, J. H. (1995a). ‘‘Interpretation of bender ele-ment tests.’’ Geotechnique, London, 45(1), 149–154.
Viggiani, G., and Atkinson, J. H. (1995b). ‘‘Stiffness of fine-grained soilat very small strains.’’ Geotechnique, London, 42(2), 249–265.
Yu, P., and Richart, F. E., Jr. (1984). ‘‘Stress ratio effect on shear modulusof dry sands.’’ J. Geotech. Engrg., ASCE, 110(3), 331–345.
INEERING / MAY 2000