Determination of Shear Strength Parameters of Rock Mass ...
8
EJERS, European Journal of Engineering Research and Science Vol. 2, No. 11, November 2017 DOI: http://dx.doi.org/10.24018/ejers.2017.2.11.518 35 Abstract—In this study, using the collected data from 4 slope failures in one of the central mines of Iran, the shear strength parameters of jointed and crushed rock masses using back analysis method are calculated and its results are compared with the values obtained from the empirical methods. In this regard, firstly, the identification of failures is investigated and then geometrical and geological engineering parameters of slopes are collected and recorded by field survey. At this stage, using the Hoek-Brown criterion, shear strength parameters of the rock mass are estimated. Then, using appropriate software for slope stability analysis (limit equilibrium method software: SLIDE and numerical method software: FLAC), and assuming that safety factor is one, the shear strength parameters for sliding surfaces are determined. Finally, the results obtained from this analysis are compared with the results of the empirical methods and then suggestions are made to modify the input data of empirical method. Index Terms—Back Analysis; Limit Equilibrium; Numerical Analysis; Hoek-Brown Criterion. I. INTRODUCTION Determining the appropriate values with a certain level of confidence for the shear strength parameters of rock mass is very important in the design and sustainability of structures constructed in rocks such as tunnels, mines, etc. Intact rock parameters and joint properties, control the response of the rock mass. The behavior of rock mass with a few joints and fractures is anisotropic, in which the rock mass strength depends on the number, direction, spacing and shear strength of discontinuities [1]. The direct measurement of the mechanical properties of jointed rock masses using laboratory experiments are far from precise due to the effect of sample dimensions, discontinuities, unknown geometry of the fracture system before testing and the inherent complexity of geometric parameters [2]. Laboratory tests carried out on a rock mass cannot cover all unknown parameters in site and requires several methods for reliable estimates [3]-[6]. Many researchers have studied the strength of jointed rock mass. Today, there are many methods for estimating the shear strength of rock mass. One of these methods is back analysis. In this method, geomechanical parameters of rock Published on November 30, 2017. Ehsan Bakhtiyari is with the School of Geology, College of Sciences, University of Tehran, Tehran, Iran (e-mail: [email protected]). Ali Almasi is with the School of Geology, College of Sciences, University of Tehran, Tehran, Iran (e-mail: [email protected]). Akbar Cheshomi is the corresponding writer and he is assistant professor وSchool of Geology, College of Sciences, University of Tehran, Tehran, Iran (e-mail: [email protected]). Jafar Hassanpour is assistant professor وSchool of Geology, College of Sciences, University of Tehran, Tehran, Iran (e-mail: [email protected]). mass can be obtained by knowing the failure mechanism and collecting the required information from the unstable slope [7]. This method is one of the most reliable methods in determining shear strength parameters in soil and rock slopes because it is a large-scale shear test and the values obtained from this method are more accurate than those obtained in the laboratory or in-situ test [8], [9]. Researchers often use numerical and limit equilibrium methods for back analysis. In selection of an appropriate method for back analysis, the process and mechanism of instability must be well understood [10]-[14]. According to the characteristics of the rocks, the stability analysis methods of rock slopes are classified into two general categories. The first category is used for hard jointed rocks and the second category is used for heavily jointed rocks or weak rock masses [15]. The limit equilibrium method is suitable for both categories. In the first group, with the limit equilibrium method, the shear strength parameters can be calculated form back analysis along the instability. But in the second category, the shear strength parameters are obtained by the methods which are developed for measuring stability of soil slopes [10], [16]. In limit equilibrium method, there is no possibility of examining internal deformities and progressive failures. For solving this problem, continuous and discontinuous numerical methods are commonly used [17]. In numerical modeling, it is possible to make an accurate prediction of deformation, the stability of slope, and load values; also, the model can have a broad insight into the responses of a system for parametric studies [18]. In numerical methods, shear strength reduction technique is usually used to slope stability analysis. In shear strength reduction technique, the shear strength parameters of soil, including cohesion and angle of internal friction are gradually reduced with a decreasing coefficient, until the slope becomes unstable. Finite Difference Method (FDM) is one of the most widely used numerical methods that can provide the necessary view needed for engineering judgment by reducing the remaining shear strength, changing the failure criterion for rock, calculating the stress-strain of slopes and evaluating displacement of sliding [19]. Another method used to determine the shear strength parameters is the empirical method of Hoek-Brown criterion. The Hook-Brown criterion is one of the most important criteria in rock mechanics, and this criterion can be used to determine the shear strength parameters. In this method, first, we should estimate the normal stresses on the failure plan with available methods of slope stability; then, calculate the shear strength parameters based on Hoek- Determination of Shear Strength Parameters of Rock Mass using Back Analysis Methods and Comparison of Results with Empirical Methods Ehsan Bakhtiyari, Ali Almasi, Akbar Cheshomi, Jafar Hassanpour
-
Upload
khangminh22 -
Category
Documents
-
view
4 -
download
0
Transcript of Determination of Shear Strength Parameters of Rock Mass ...

EJERS, European Journal of Engineering Research and Science Vol. 2, No. 11, November 2017
DOI: http://dx.doi.org/10.24018/ejers.2017.2.11.518 35
Abstract—In this study, using the collected data from 4 slope
failures in one of the central mines of Iran, the shear strength
parameters of jointed and crushed rock masses using back
analysis method are calculated and its results are compared
with the values obtained from the empirical methods. In this
regard, firstly, the identification of failures is investigated and
then geometrical and geological engineering parameters of
slopes are collected and recorded by field survey. At this stage,
using the Hoek-Brown criterion, shear strength parameters of
the rock mass are estimated. Then, using appropriate software
for slope stability analysis (limit equilibrium method software:
SLIDE and numerical method software: FLAC), and assuming
that safety factor is one, the shear strength parameters for
sliding surfaces are determined. Finally, the results obtained
from this analysis are compared with the results of the
empirical methods and then suggestions are made to modify
the input data of empirical method.
Index Terms—Back Analysis; Limit Equilibrium; Numerical
Analysis; Hoek-Brown Criterion.
I. INTRODUCTION
Determining the appropriate values with a certain level of
confidence for the shear strength parameters of rock mass is
very important in the design and sustainability of structures
constructed in rocks such as tunnels, mines, etc. Intact rock
parameters and joint properties, control the response of the
rock mass. The behavior of rock mass with a few joints and
fractures is anisotropic, in which the rock mass strength
depends on the number, direction, spacing and shear
strength of discontinuities [1].
The direct measurement of the mechanical properties of
jointed rock masses using laboratory experiments are far
from precise due to the effect of sample dimensions,
discontinuities, unknown geometry of the fracture system
before testing and the inherent complexity of geometric
parameters [2]. Laboratory tests carried out on a rock mass
cannot cover all unknown parameters in site and requires
several methods for reliable estimates [3]-[6]. Many
researchers have studied the strength of jointed rock mass.
Today, there are many methods for estimating the shear
strength of rock mass. One of these methods is back
analysis. In this method, geomechanical parameters of rock
Published on November 30, 2017.
Ehsan Bakhtiyari is with the School of Geology, College of Sciences,
University of Tehran, Tehran, Iran (e-mail: [email protected]). Ali Almasi is with the School of Geology, College of Sciences,
University of Tehran, Tehran, Iran (e-mail: [email protected]).
Akbar Cheshomi is the corresponding writer and he is assistant professorو School of Geology, College of Sciences, University of Tehran,
Tehran, Iran (e-mail: [email protected]).
Jafar Hassanpour is assistant professorو School of Geology, College of Sciences, University of Tehran, Tehran, Iran (e-mail: [email protected]).
mass can be obtained by knowing the failure mechanism and
collecting the required information from the unstable slope
[7]. This method is one of the most reliable methods in
determining shear strength parameters in soil and rock
slopes because it is a large-scale shear test and the values
obtained from this method are more accurate than those
obtained in the laboratory or in-situ test [8], [9].
Researchers often use numerical and limit equilibrium
methods for back analysis. In selection of an appropriate
method for back analysis, the process and mechanism of
instability must be well understood [10]-[14]. According to
the characteristics of the rocks, the stability analysis
methods of rock slopes are classified into two general
categories. The first category is used for hard jointed rocks
and the second category is used for heavily jointed rocks or
weak rock masses [15]. The limit equilibrium method is
suitable for both categories. In the first group, with the limit
equilibrium method, the shear strength parameters can be
calculated form back analysis along the instability. But in
the second category, the shear strength parameters are
obtained by the methods which are developed for measuring
stability of soil slopes [10], [16]. In limit equilibrium
method, there is no possibility of examining internal
deformities and progressive failures. For solving this
problem, continuous and discontinuous numerical methods
are commonly used [17].
In numerical modeling, it is possible to make an accurate
prediction of deformation, the stability of slope, and load
values; also, the model can have a broad insight into the
responses of a system for parametric studies [18]. In
numerical methods, shear strength reduction technique is
usually used to slope stability analysis. In shear strength
reduction technique, the shear strength parameters of soil,
including cohesion and angle of internal friction are
gradually reduced with a decreasing coefficient, until the
slope becomes unstable. Finite Difference Method (FDM) is
one of the most widely used numerical methods that can
provide the necessary view needed for engineering judgment
by reducing the remaining shear strength, changing the
failure criterion for rock, calculating the stress-strain of
slopes and evaluating displacement of sliding [19].
Another method used to determine the shear strength
parameters is the empirical method of Hoek-Brown
criterion. The Hook-Brown criterion is one of the most
important criteria in rock mechanics, and this criterion can
be used to determine the shear strength parameters. In this
method, first, we should estimate the normal stresses on the
failure plan with available methods of slope stability; then,
calculate the shear strength parameters based on Hoek-
Determination of Shear Strength Parameters of Rock
Mass using Back Analysis Methods and Comparison of
Results with Empirical Methods
Ehsan Bakhtiyari, Ali Almasi, Akbar Cheshomi, Jafar Hassanpour

EJERS, European Journal of Engineering Research and Science Vol. 2, No. 11, November 2017
DOI: http://dx.doi.org/10.24018/ejers.2017.2.11.518 36
Brown criterion and normal stresses [20]-[22].
In this paper, four slope failures in one of the central
mines of Iran are identified. During field survey of the study
area, using the field observations and laboratory studies,
physical and mechanical properties of the rock masses in the
mine area were determined. Then the shear strength
parameters of the unstable rock masses are estimated using
the back analysis method (limit equilibrium and numerical
method) and their results are compared with values obtained
from the empirical method.
II. MATERIALS AND METHODS
The research was carried out in one of the central mines
of Iran. This mineral area is located in longitude between 55
° 20 'and 55 ° 24' eastern, and latitude between 29 ° 2 'to 29
° 5' north. Based on field studies in the studied area, four
unstable slopes are identified, as described in Table I.
The mechanism of four identified instabilities is circular
and characteristics of each failure including lithology of
materials, height, gradient, mechanism of instability, and
geomechanical condition of rock masses are provided in
Table I. In Fig. 1 and 2, the location of 4 unstable rock
masses is shown on a satellite image and Pitt plan. In Fig. 3
images of unstable slopes are shown.
TABLE I: LIST OF IDENTIFIED 4 UNSTABLE SLOPES
No. of
Failure
Geologi
cal
Enginee
ring
Units
Litholo
gy
He
igh
t
(m
)
Gradi
ent
(degr
ee)
Mechan
ism of
instabili
ty
Geomechani
cal condition
No.1 CS-I Chlorit
e schist 18 49
circula
r
Severely crushed
and
weathered
No.2 CS-I Chlorit
e schist 15 49
circula
r
Severely
crushed
and weathered
No. 3
CS-I,
M-I (II)
Magne
tite schist
15 50 circula
r
Jointed-
Blocked
No. 4 O-I (II) Hemati
te 17 51
circular
Severely
crushed and
weathered
Fig.1. Location of unstable rock masses on satellite image (Google Earth
2016).
In Fig. 4, the flow diagram of study methods is shown. In
the beginning, through the field survey, the failure slopes are
identified and then the sliding surface properties are
determined. Estimation of the shear strength parameters of
the sliding surface is performed by back analysis method
respectively by limit equilibrium method (Slide software)
[23], numerical method (Flac software) [24], and empirical
method of Hoek-Brown (RocLab software) [25], and results
are compared.
Fig.2. Location of unstable rock masses (circles with intersecting lines) on
Pitt plan.
I
II
III
IV
Fig.3. Images of unstable slopes: I- Failure No. 1 in engineering geology unit CS-I with lithology of chlorite schist to a height of 18 meters, II-
Failure No. 2 in engineering geology unit CS-I with lithology of chlorite
schist severely crushed and weathered to a height of 15 meters, III- Failure No. 3, the upper section in engineering geology units M-I (II) with
magnetite lithology and lower section in CS-I engineering geology unit
with chlorite schist lithology, IV- Failure No. 4 is mainly in engineering geology units O-I (II) with hematite lithology heavily crushed and 17
meters high.
Fig.4. The flow diagram of study methods
Field survey from the study area and identification failure slopes in mine
Determining the characteristics of identified sliding surfaces and
engineering parameters of failure slopes.
Estimation of shear
strength parameters
by back analysis
method using limit equilibrium method
(Slide software)
Estimation of shear
strength parameters
by back analysis
method using numerical method
(Flac software)
Estimation of shear
strength parameters by
back analysis method
using empirical method (Hoek- Brown
criterion)
Compare the results obtained from back analysis
with the results of experimental methods

EJERS, European Journal of Engineering Research and Science Vol. 2, No. 11, November 2017
DOI: http://dx.doi.org/10.24018/ejers.2017.2.11.518 37
III. GEOLOGICAL ENGINEERING PROPERTY OF UNSTABLE
UNITS
In the study area, 5 engineering geology units are
identified and separated. In Table II, in addition to
specifying each unit of rock, also structural features, values
of RQD, basic RMR, GSI, strength properties including
modulus of elasticity and Hoek-Brown constants are
provided. The lithology of the studied rocks is determined
by field surveys, sample preparation, and laboratory tests.
Uniaxial compressive strength and deformation properties
are determined by uniaxial compression tests in the
laboratory. The RQD values for each unit are obtained with
respect to the amount of recycled cores on the site; then,
using the values of uniaxial compressive strength, RQD,
condition, and distance between joints, RMR values are
calculated for each unit. GSI values are estimated from field
observations based on the structure of rock masses and
surface conditions of joints on the GSI chart and finally, the
Hook-Brown criterion constants are obtained using
empirical equations and GSI values.
TABLE II: GEOMECHANICAL PROPERTIES OF ENGINEERING GEOLOGY UNITS
No. Rock
Type Lithology Structure
Rock
Strength
(Mpa) RQD (%) RMR basic GSI
Em
(Gpa) Hoek_Brown
(mb)
Hoek_Brown
(s)
Hoek_Brown
(a)
Fracture
Interpret
1 CS-I Chlorite
schist
very
blocky &
disturbed 30 12 32 30 0.6 6.74E-02 8.57E-06 5.22E-01 F4
2 O-I Oxide
(Hematite)
very
blocky &
blocky 35 65 45 50 1.0 5.62E-01 2.40E-04 5.06E-01 F3
3 O-II Oxide
(Hematite)
very
blocky 40 35 45 45 0.8 3.93E-01 1.04E-04 5.08E-01 F3&F4
4 M-I Bottom
Magnetite Blocky 75 70 50 57 4.3 1.15E+00 1.27E-03 5.03E-01 F3
5 M-II Bottom
Magnetite Blocky 100 70 55 60 4.9 1.15E+00 1.27E-03 5.03E-01 F3
IV. INPUT PARAMETERS
The input parameters of Slide software are presented in
Table III. Input values of the Slide software include
geometry of slope and unit weight of rock mass, which
physical and mechanical properties of rock masses are
obtained through laboratory experiments.
TABLE III: INPUT PARAMETERS OF SLIDE
No. of slide Unsaturated Unit
Weight (kN/m3) Saturated Unit
Weight (kN/m3) Water Surface
No.1 CS-I 25 - None No.2 CS-I - 25 Hu value 1
No. 3 CS-I, 25 27 Hu value 1
M-I (II) - 40 Hu value 1 No. 4 O-I (II) 38 - None
The input parameters of the Flac software are presented in
Table IV. Density, bulk module, shear module, tension
strength and elastic module are calculated in the laboratory.
The permeability of rock masses is determined by in situ
tests. The difference between back analysis method in the
numerical software of Flac and limit equilibrium software of
Slide is that in the numerical method, unlike the equilibrium
method, there is no possibility of imposing a precise failure
plane in software. Therefore, it is necessary to carefully
determine the values of cohesion and angle of internal
friction until the failure plane has the maximum geometric
similarity to the actual failure plane in the safety factor
equal to one.
TABLE IV: INPUT PARAMETERS OF FLAC
No. of
slide Rock type
Density
(Kg/m3) Bulk Module (Pa)
Shear Module
(Pa) Tension (Pa) Poision Ratio K (σh/σn)
Permeabil
ity (m/s) Erm (Pa)
No.1 CS-I 2500 1.835e8 3.976e8 2e3 0.3 1.1 - 477.01e6
No.2 CS-I 2500 2.792e8 1.288e8 1e3 0.3 1.1 2e-5 335.08e6
No. 3
CS-I 2500 1.01863e9 4.70138e8 8e3 0.3 1.1 2e-5 1125.65e6
M-I (II) 4000 1.01863e9 4.70138e8 8e3 0.3 1.1 2e-5 1125.65e6
No. 4 O-I (II) 3800 3.6237e8 1.6728e8 1e3 0.3 1.1 - 434.85e6
Input parameters for RocLab software are provided in
Table V. The values of the Hoek-Brown constants were
calculated from field observations and using existing
empirical equations.
TABLE V: INPUT PARAMETERS OF ROCLAB
No. of slide
Hoek-Brown Classification Hoek-Brown Criterion Failure Envelope Range
Sig
ci(Mpa) GSI mi D mb S A Unit Weight
(MN/m3) Slope Height
(m)
No.1 20 15-25 8 0.8 0.0683945 2.44 e -6 0.543721 0.025 18.7
No.2 15 10-20 8 0.7 0.0749534 4.46679e-006 0.561101 0.025 14.5
No. 3 30 25-35 8 0.7 0.170894 3.92748e-005 0.522344 0.032 14.6
No. 4 25 10-20 8 0.7 0.0749534 4.46679e-006 0.561101 0.038 15.1

EJERS, European Journal of Engineering Research and Science Vol. 2, No. 11, November 2017
DOI: http://dx.doi.org/10.24018/ejers.2017.2.11.518 38
V. ESTIMATION THE SHEAR STRENGTH PARAMETERS OF
FAILURES
A. Limit equilibrium method
In the limit equilibrium method, the profile of slopes is
drawn in the Slide software with respect to the geometric
characteristics of slope and sliding surface, and input
parameters entered into Slide software according to Table
III. By putting the geological engineering parameters in the
corresponding software, the values of shear stress and
effective stress at the moment of siding are calculated,
considering safety factor equal to 1 for all failures. In Fig. 5,
the profile of unstable slopes with the values of shear stress
and effective stress is shown. In all profiles, 25 pieces was
considered to be analyzed in Slide software. In the failure
No. 1, height of bench is more than 18 meters and it is
executed with a gradient of 49 degrees. Tension cracks are
formed and developed at the upper surface of bench and
effects of initial movement are evident. In failure No. 2,
depth of the tension cracks was about 1 meter which these
cracks were saturated with water, and it seems that water
plays very important role in instability of this slope. The
gradient angle of failure No. 2 is approximately at the same
with failure No. 1; besides, failure No. 2 is saturated and
failure No. 1 is dry and the material involved in both failures
are similar (engineering geology unit CS-I), so it is expected
that the shear strength parameters in failure No. 2 would be
much higher than shear strength parameters failure No. 1 in
order to stay stable. In failure No. 3, sliding surface is
started from a depth of about 3 meters from a tension crack
and after the occurrence of sliding; a steep to a height of
about 3 meters is created. These tension cracks partially are
filled with water. It should be noted that the sliding surface
has not passed through the magnetite unit; therefore, only
weight of this layer has been affected by the sliding mass
and its weight is included in the calculations. The sliding
surface failure No. 4 is passed from a height of about 3
meters to the heel of the bench and the slope height is about
12 meters.
I
II
III
IV
Fig. 5. Profile of failures with normal stress and shear stress: I- failure No.1, II- failure No. 2, III- failure No. 3, IV- failure No. 4.
The results of back analysis on the profile of failures
using SLIDE software are shown in Fig. 6. In this figure, all
possible values for parameters of C (cohesion) and φ (angle
of internal friction) for rock mass with a plus symbol (blue
points) are shown and values of parameters C and φ for
safety factor equal to one (limit equilibrium) with square
symbols (red points) are shown for any failure. According to
the output diagram of Slide software, the values of cohesion
and angle of internal friction at the moment of failure are
obtained. The values of parameters C and φ for failure No. 1
is estimated between 9-16 KN/m2 and 31-36 degrees, for
failure No. 2 between 26-32 KN/m2 and 37-49 degrees, for
failure No. 3 between 41-51KN/m2 and 13-18 degrees, for
failure No. 4 between 16-26 KN/m2 and 28-34 degrees,
respectively.
I
II
EJERS, European Journal of Engineering Research and Science Vol. 2, No. 11, November 2017
DOI: http://dx.doi.org/10.24018/ejers.2017.2.11.518 39
III
IV
Fig. 6. Distribution of all values of C and φ for rock mass by plus symbols
(blue points) and C and φ values for safety factor equal to one by square symbols (red points): I- failure No.1, II- failure No. 2, III- failure No. 3, IV-
failure No. 4.
B. Numerical method
In this method, at first, according to the height and
gradient of slopes, models are made; then, according to
Table IV, the input parameters are entered into Flac
software and back analysis numerically is performed for all
failures. In the Flac software, with the change of cohesion
and angle of internal friction, the best sliding surface, which
its distance from the edge of bench is equal to distance of
tension crack from the edge of bench and also its safety
factor is equal to 1, is obtained and the values of cohesion
and angle of internal friction in this case is for failure mode.
The values obtained for cohesion and angle of internal
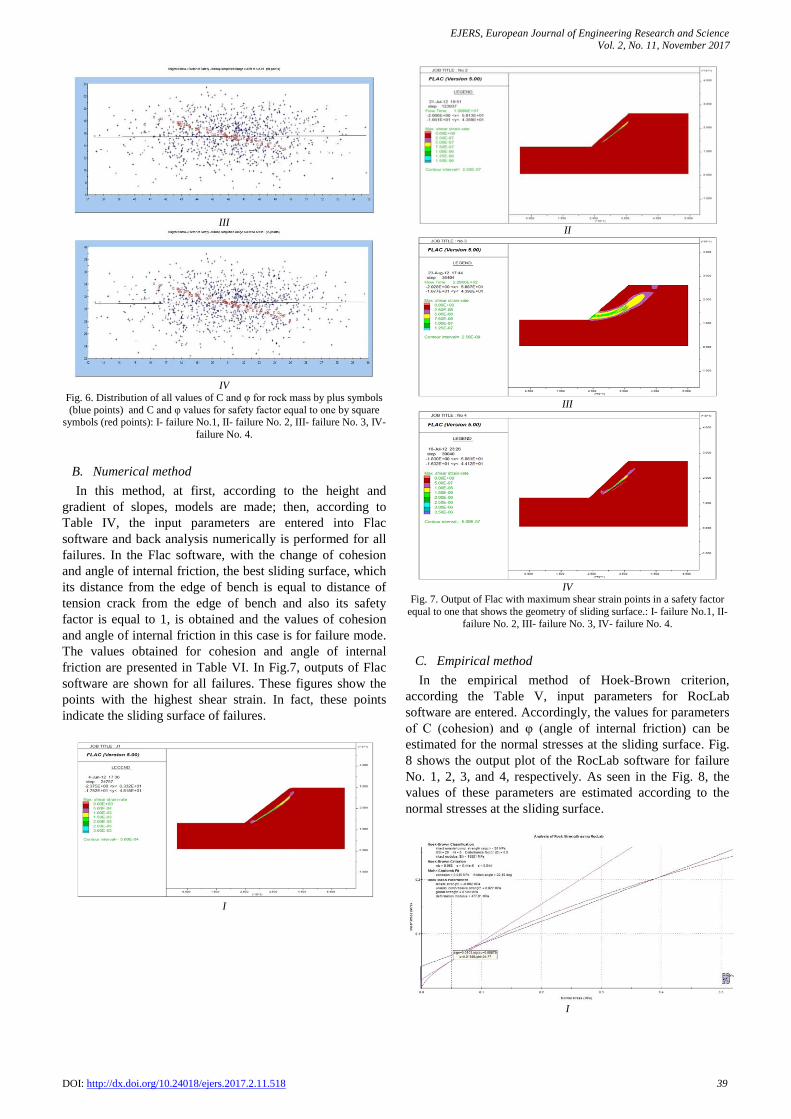
friction are presented in Table VI. In Fig.7, outputs of Flac
software are shown for all failures. These figures show the
points with the highest shear strain. In fact, these points
indicate the sliding surface of failures.
I
II
III
IV
Fig. 7. Output of Flac with maximum shear strain points in a safety factor
equal to one that shows the geometry of sliding surface.: I- failure No.1, II-
failure No. 2, III- failure No. 3, IV- failure No. 4.
C. Empirical method
In the empirical method of Hoek-Brown criterion,
according the Table V, input parameters for RocLab
software are entered. Accordingly, the values for parameters
of C (cohesion) and φ (angle of internal friction) can be
estimated for the normal stresses at the sliding surface. Fig.
8 shows the output plot of the RocLab software for failure
No. 1, 2, 3, and 4, respectively. As seen in the Fig. 8, the
values of these parameters are estimated according to the
normal stresses at the sliding surface.
I

EJERS, European Journal of Engineering Research and Science Vol. 2, No. 11, November 2017
DOI: http://dx.doi.org/10.24018/ejers.2017.2.11.518 40
II
III
IV
Fig. 8. The values for parameters of C (cohesion) and φ (angle of internal
friction) obtained by the Hoek-Brown method.: I- failure No.1, II- failure No. 2, III- failure No. 3, IV- failure No. 4.
Estimation of shear strength parameters by Hoek-Brown's
empirical method for failures No. 1, 2, 3, and 4 is similarly
done, with the results of all of them shown in Table VI.
TABLE VI: THE VALUES OF THE SHEAR STRENGTH PARAMETERS OBTAINED
BY BACK ANALYSIS METHOD AND EMPIRICAL METHOD FOR FAILURES NO. 1,
2, 3, AND 4
No
. o
f fa
ilu
re
Shear Strength Parameters Of The Rock Mass.
Cohesion (kPa) Angle of Friction (degree)
Bac
k A
nal
ysi
s
Met
hod
(S
lide)
Bac
k A
nal
ysi
s
Met
hod
(F
lac)
Em
pir
ical
Met
hod
(Ho
ek-B
row
n)
Bac
k A
nal
ysi
s
Met
hod
(S
lide)
Bac
k A
nal
ysi
s
Met
hod
(F
lac)
Em
pir
ical
Met
hod
(Ho
ek-B
row
n)
No.1 9-16 10-17 16 31-36 31-38 34
No.2 26-32 27-34 6 37-49 36-48 40
No. 3 41-51 43-52 46 13-18 13-19 44.5
No. 4 16-26 16-26 18 28-34 30-36 32
VI. COMPARISON OF THE VALUES OBTAINED FROM THREE
METHODS
According to Fig. 9, there is a good agreement between
results obtained from the three methods. It is safe to say that
reason for relative increase in values of these parameters in
the numerical method (FLAC software) in comparison with
limit equilibrium method (SLIDE software) is mainly due to
the difference in analysis method in which the FLAC
software uses the strength reduction method to estimate the
shear strength parameters; while the SLIDE software uses
limit equilibrium method to estimate these values [26].
Therefore, numerical methods give values of shear strength
parameters more conservatively, yet more realistic. Also,
amounts of parameters of cohesion and angle of internal
friction obtained from the Hoek-Brown method are found
within the defined range for both methods (numerical and
limit equilibrium method) which this factor, not only
verifies calculation of the Hoek-Brown criterion in this
failure, but also confirms accuracy of input parameters in
this criterion.
In failure No. 2, the values of shear strength parameters
obtained by back analysis method (both limit equilibrium
and numerical method) have a fairly good agreement and
overlap. However, the values of cohesion and angle of
internal friction obtained from the Hoek-Brown criterion is
very different from two other methods for failure No. 2. The
reason for this difference is that underground water has
reduced effective stress and this reduction changed these
values in the Hoek-Brown criterion. However, consequence
of effective stress reduction is increasing values of shear
strength parameters at the moment of instability. In other
words, in order to start a sliding in a saturation slope, values
of the shear strength parameters are much higher than those
of a slope in the dry area. This factor is taken into account
in both limit equilibrium and numerical analyzes, while it is
not taken into account in Hoek-Brown criterion.
I

EJERS, European Journal of Engineering Research and Science Vol. 2, No. 11, November 2017
DOI: http://dx.doi.org/10.24018/ejers.2017.2.11.518 41
II
Fig. 9. Comparison of the values of I- the angle of internal friction; II- the
cohesion obtained by back analysis and empirical method.
In failure No. 3, like failure No. 2, values of shear
strength parameters obtained by back analysis method (both
limit equilibrium and numerical method) have a fairly good
agreement and overlap. Also, in this failure, considering that
groundwater is considered as an effective parameter in
sliding, the Hoek-Brown criterion is ineffective because it
cannot properly consider role of water. In this failure,
groundwater has significantly increased the amount of angle
of internal friction in the Hoek-Brown criterion at the
moment of sliding.
In failure No. 4, comparison of the shear strength
parameters obtained from the three methods has shown a
relatively good correlation between these values. Also, in
this failure, like failure No. 1, 2, and 3 the shear strength
parameters in the numerical method are determined slightly
higher than limit equilibrium method, which is due to the
difference in analysis method.
VII. CONCLUSION
In this study, by studying 4 unstable slopes in one of the
central mines of Iran, 5 geological engineering units
including of Chlorite-Schist (CS-I), lower Magnetite (M-I
(II)) and Hematite (O-I (II)) are identified. Field surveys
showed that in all 4 failures, sliding surface is circular and
materials are severely weathered and they have a lot of
discontinuities. This weathering and discontinuity has
caused rock masses to be similar to soil materials.
By combining the results from field observations and
laboratory tests, engineering properties of materials for
failures are determined. Then, shear strength parameters of
the sliding surface using back analysis method by three
methods of limit equilibrium, numerical and empirical are
obtained. The range of shear strength parameters in four
failures is compared. There are fairly good agreement and
overlap between the results of limit equilibrium, numerical
and empirical methods in failures which occurred on dry
slopes. This confirms accuracy of the input parameters in
the Hoek-Brown method. Therefore, it can be said that due
to the simplicity of the Hoek-Brown method in dry slopes,
using this method can provide acceptable results.
In failures occurred in saturation slopes, although there is
good agreement between the results obtained from limit
equilibrium and numerical methods, there is a significant
difference between the results of these two methods and
those of empirical method. The reason is that presence of
water reduces the effective stress and increases the shear
strength parameters at the moment of the sliding, and the
Hoek-Brown criterion does not consider this increase in the
shear strength parameters during the sliding in its
calculations. Therefore, using Hoek-Brown criterion in
saturation slopes should be carried out with caution and
accompanied by limit equilibrium and numerical analysis.
Anyway, in both failure No. 2 and 3, the Hoek-Brown
criterion did not provide appropriate values for shear
strength parameters and usage of this criterion is not
recommended for obtaining shear strength parameters in
similar hydrogeological conditions.
REFERENCES
[1] E. Hoek, “Strength of jointed rock masses,” Geotechnique, vol. 33,
no. 3, pp. 187-223, 1983.
[2] M. N. Bidgoli, Z. Zhao, & L. Jing, Numerical evaluation of strength
and deformability of fractured rocks, Journal of Rock Mechanics and
Geotechnical Engineering, vol. 5, no. 6, pp. 419-430, 2013.
[3] M. Singh, K. S. Rao, and T. Ramamurthy, “Strength and deformational behaviour of a jointed rock mass,” Rock Mechanics and
Rock Engineering, vol. 35, no. 1, pp. 45-64, 2002. [4] M. Singh, and K. S. Rao, “Bearing capacity of shallow foundations in
anisotropic non-Hoek–Brown rock masses,” Journal of geotechnical
and geoenvironmental engineering, vol. 131, no. 8, pp.1014-1023, 2005.
[5] M. Singh, and K. S. Rao, “Empirical methods to estimate the strength
of jointed rock masses,” Engineering Geology, vol. 77, no. 1, pp.127-137, 2005.
[6] M. Singh, and B. Singh, “High lateral strain ratio in jointed rock
masses,” Engineering Geology, vol. 98, no. 3, pp.75-85, 2008. [7] S. Sakurai, S. Akutagawa, K. Takeuchi, M. Shinji, and N. Shimizu,
“Back analysis for tunnel engineering as a modern observational
method,” Tunnelling and Underground Space Technology, vol. 18, no. 2, pp.185-196, 2003.
[8] M. Cai, H. Morioka, P. K. Kaiser, Y. Tasaka, H. Kurose, M. Minami,
and T. Maejima, “Back-analysis of rock mass strength parameters
using AE monitoring data,” International Journal of Rock Mechanics
and Mining Sciences, vol. 44, no. 4, pp.538-549, 2007.
[9] A. Saeidi, V. Maazallahi, and A. Rouleau, “Assessment of slide surface and pre-slide topography using site investigation data in back
analysis,” International Journal of Rock Mechanics and Mining
Sciences, vol. 88, p. 29-33, 2016. [10] M. Sharifzadeh, M. Sharifi, and S. M. Delbari, “Back analysis of an
excavated slope failure in highly fractured rock mass: the case study
of Kargar slope failure (Iran),” Environmental Earth Sciences, vol. 60, no. 1, pp.183-192, 2010.
[11] S. J. Harris, R. P. Orense, and K. Itoh, “Back analyses of rainfall-
induced slope failure in Northland Allochthon formation,” Landslides, vol. 9, no. 3, pp.349-356, 2012.
[12] L. L. Zhang, J. Zhang, L. M. Zhang, and W. H. Tang, “Back analysis
of slope failure with Markov chain Monte Carlo simulation,” Computers and Geotechnics, vol. 37, no. 7, pp.905-912, 2010.
[13] J. C. Jiang, and T. Yamagami, “A new back analysis of strength
parameters from single slips,” Computers and Geotechnics, vol. 35, no. 2, pp.286-291, 2008.
[14] S. M. Ng, M. A. M. Ismail, and I. Abustan, “Back analysis of slope
failure using finite element with point estimate method (FEM-PEM),” Journal of Civil Engineering Research, vol. 4, no. 3A, pp.31-35,
2014.
[15] H. Sonmez, R. Ulusay, and C. Gokceoglu, “A practical procedure for the back analysis of slope failures in closely jointed rock masses,”
International Journal of Rock Mechanics and Mining Sciences, vol.
35, no. 2, pp.219-233, 1998. [16] D. Stead, E. Eberhardt, and J. S. Coggan, “Developments in the
characterization of complex rock slope deformation and failure using
numerical modeling techniques,” Engineering Geology, vol. 83, no. 1, pp.217-235, 2006.
[17] Itasca Consulting Group. FLAC 3D-Fast Lagrangian Analysis of
Continua in 3 Dimensions, User’s manual, Minneapolis, 2005. [18] W. K. Song, and K. C. Han, “Optimal design of highway slopes in a
highly weathered rock,” In 9th ISRM Congress. International Society for Rock Mechanics, 1999.
EJERS, European Journal of Engineering Research and Science Vol. 2, No. 11, November 2017
DOI: http://dx.doi.org/10.24018/ejers.2017.2.11.518 42
[19] W. Ming, F. Xundong and L. Huan, “Reducing method for intensity
of slope stability analysis,” Civil Engineering, vol. 20, no. 1, pp. 49-
52, 2006 (in Chinese). [20] X. L. Yang, and J. H. Yin, “Slope equivalent Mohr–Coulomb strength
parameters for rock masses satisfying the Hoek–Brown criterion,”
Rock Mechanics and Rock Engineering, vol. 43, no. 4, pp.505-511, 2010.
[21] J. Shen, S. D. Priest, and M. Karakus, “Determination of Mohr–
Coulomb shear strength parameters from generalized Hoek–Brown criterion for slope stability analysis, Rock mechanics and rock
engineering, vol. 45, no. 1, pp.123-129, 2012.
[22] J. Shen, M. Karakus, and C. Xu, “Direct expressions for linearization of shear strength envelopes given by the Generalized Hoek–Brown
criterion using genetic programming,” Computers and Geotechnics,
vol. 44, pp.139-146, 2012. [23] Rocscience Ltd. (2002) SLIDE—2D Slope Stability Analysis for
Rock and Soil Slopes. Toronto, Ontario, www.rocscience.com
[24] Itasca Consulting Group Inc. FLAC (FastLagrangian Analysis of Continua), Version 5.0, Minneapolis, MN.
[25] Rocscience Ltd. (2002) ROCLAB Software for Calculating Hoek–
Brown Rock Mass Strength. Toronto, Ontario, www.rocscience.com [26] L. R. Alejano, A. M. Ferrero, P. Ramírez-Oyanguren, and M. A.
Fernández, “Comparison of limit-equilibrium, numerical and physical
models of wall slope stability,” International Journal of Rock
Mechanics and Mining Sciences, vol. 48, no. 1, pp.16-26, 2011.
Ehsan Bakhtiyari was born in 1987, Iran. He has graduated with a M.Sc. in Engineering Geology in
the field of slope stability from University of Tehran
in 2013. Also, he has B.Sc. degree in Geology from Shahid Beheshti University.
He has been an instructor at the University of
Applied Science and Technology since 2014. He has experience working in the field of geotechnical
engineering for 2 years. His main research interest is
slope stability analysis in soil and rock. He developed a geological classification for parts of Tehran’s alluvium with respect to
excavation using numerical and limit equilibrium method in 2013.
Moreover, he used back analysis method for estimating the shear strength parameter of jointed rock mass.
Ali Almasi was born in 1987, Iran. He has
graduated with a M.Sc. in Engineering Geology
from University of Tehran in 2012. Also, he has a B.Sc. degree in Geology from Shahid Beheshti
University.
He has been working in National Iranian Drilling Company (NIDC) since 2012. He has experience
working in fields of Geomechanics, Geological
Forecasting Programmer, Well site Geologist in NIDC. His main research interest is wellbore
instability problems, well site geology, log analysis, geological forecast
program and slope stability in rock and soil. Currently, he is studying and working on geomechanics of petroleum reservoirs.
Akbar Cheshomi was born in Iran. He has graduated with a Ph.D. degree in Engineering
Geology from Tarbiat Modares University in
2006. Also, he has graduated with a M.Sc. in Engineering Geology from Tarbiat Modares
University in 1997. He has been working as an
assistant professor at University of Tehran from 2010.
He has more than 20 years' experience in
engineering geology and geotechnical engineering
activities in various fields. His research interests include slope stability,
classification of soils based on engineering geology parameters, soil
improvement, site investigation, Laboratory and in-situ tests. Also, he has more than 30 articles in international journals.
Jafar Hassanpour was born in Iran. He has graduated with a Ph.D. degree in Engineering
Geology from Tarbiat Modares University in
2009. Also, he has graduated with a M.Sc. in Engineering Geology from Tarbiat Modares
University in 1997. He has been working as an
assistant professor at University of Tehran from 2013.
He has experience over 18 years of combined
study, research, management, and teaching in the fields of engineering geology, rock and soil engineering. His main
research interest are execution and post construction analysis in the tunneling for urban and highway transportation, water conveyance
tunnels, dams, power plant stations, open pit mines, slopes and
landslides and generally, infrastructures.