Influence of shear velocity on frictional characteristics of rock surface
9
Influence of shear velocity on frictional characteristics of rock surface TNSingh 1 ,AKVerma 2,∗ ,Tanmay Kumar 3 and Avi Dutt 3 1 Department of Earth Sciences, Indian Institute of Technology, Powai, Mumbai 400 056, India. 2 CeRES, The Energy and Resources Institute, Darbari Seth Block, IHC Complex, Lodhi Road, New Delhi 110 003, India. 3 Institute of Technology, Banaras Hindu University, Varanasi 221 005, India. ∗ e-mail: [email protected] Understanding the fundamental issues related with the effect of shear velocity on frictional charac- teristics at the interface of rock surfaces is an important issue. In this paper, strain-rate dependence on friction is investigated in relation to sliding behaviour under normal load. The phenomenon of stick-slip of granite and shaly sandstone with a tribometer at constant rate of strain under normal loads was observed. Friction at the interface of the rock samples was developed by increasing shear strain at a con- stant rate by applying constant velocity using the tribometer. For shaly sandstone, state para- meters (a and b ) played a major role in determining the friction values and roughness of the contact surfaces as well. Higher values of b for shaly sandstone may be attributed to the fact that its surface had a greater number of pronounced asperities. Rubbing between the surfaces does not mean that surface becomes smoother. This is because of variation of friction between surfaces. 1. Introduction A sliding system shows two kinds of motion namely stick-slip (jerky or unsteady) motion and steady (smooth) motion (Blanpied et al 1987; Persson 2000; Mohan et al 2009; Goohpattader and Chaudhury 2010). Steady sliding, as is evident from its name, sliding velocity as well as friction force of the sliding mass does not change with time. Stick-slip motion, on the other hand, involves fluctuating or jerky motion. Unlike steady motion, in stick-slip motion, friction force and velocity of the mass vary peri- odically during the motion. Stick-slip is generally observed if the mass slips slowly when in contact with the other surface. Chattering of machines, cutting tools, squeaking of doors, melodious sound from stringed instruments such as violin, etc., are results of the stick-slip process. Stick-slip motion occurs because of the interaction between the elas- tic force and the friction force of the sliding system (Urbakh et al 2004; Rice et al 2009). Slip movement represents a fairly abrupt increase in the velocity following a measurable slower motion. Stick is the interlocking of asperi- ties present in the rock surface, due to which the motion is prevented (Yamashita and Ohnaka 1991; Matsukawa and Saito 2007). During stick there is an increase in the elastic energy of the system. Stick-slip depends on a number of factors. The most important factors are: the shear velocity and the quantity and nature of the gouge present at the contact surface (Baumberger and Caroli 2006; Dunham and Rice 2008). This phenomenon is best understood by an elas- tic spring and a rigid mass friction model as shown in figure 1. Keywords. Tribometer; granite; shaly sandstone; state variable; stick-slip friction. J. Earth Syst. Sci. 120, No. 1, February 2011, pp. 183–191 © Indian Academy of Sciences 183
-
Upload
independent -
Category
Documents
-
view
0 -
download
0
Transcript of Influence of shear velocity on frictional characteristics of rock surface
Influence of shear velocity on frictionalcharacteristics of rock surface
T N Singh1, A K Verma
2,∗, Tanmay Kumar3 and Avi Dutt
3
1Department of Earth Sciences, Indian Institute of Technology, Powai, Mumbai 400 056, India.2CeRES, The Energy and Resources Institute, Darbari Seth Block, IHC Complex, Lodhi Road,
New Delhi 110 003, India.3Institute of Technology, Banaras Hindu University, Varanasi 221 005, India.
∗e-mail: [email protected]
Understanding the fundamental issues related with the effect of shear velocity on frictional charac-teristics at the interface of rock surfaces is an important issue. In this paper, strain-rate dependenceon friction is investigated in relation to sliding behaviour under normal load. The phenomenon ofstick-slip of granite and shaly sandstone with a tribometer at constant rate of strain under normalloads was observed.
Friction at the interface of the rock samples was developed by increasing shear strain at a con-stant rate by applying constant velocity using the tribometer. For shaly sandstone, state para-meters (a and b) played a major role in determining the friction values and roughness of thecontact surfaces as well. Higher values of b for shaly sandstone may be attributed to the factthat its surface had a greater number of pronounced asperities. Rubbing between the surfacesdoes not mean that surface becomes smoother. This is because of variation of friction betweensurfaces.
1. Introduction
A sliding system shows two kinds of motion namelystick-slip (jerky or unsteady) motion and steady(smooth) motion (Blanpied et al 1987; Persson 2000;Mohan et al 2009; Goohpattader and Chaudhury2010). Steady sliding, as is evident from its name,sliding velocity as well as friction force of the slidingmass does not change with time. Stick-slip motion,on the other hand, involves fluctuating or jerkymotion. Unlike steady motion, in stick-slip motion,friction force and velocity of the mass vary peri-odically during the motion. Stick-slip is generallyobserved if the mass slips slowly when in contactwith the other surface. Chattering of machines,cutting tools, squeaking of doors, melodious soundfrom stringed instruments such as violin, etc., areresults of the stick-slip process. Stick-slip motion
occurs because of the interaction between the elas-tic force and the friction force of the sliding system(Urbakh et al 2004; Rice et al 2009).
Slip movement represents a fairly abruptincrease in the velocity following a measurableslower motion. Stick is the interlocking of asperi-ties present in the rock surface, due to which themotion is prevented (Yamashita and Ohnaka 1991;Matsukawa and Saito 2007). During stick there isan increase in the elastic energy of the system.
Stick-slip depends on a number of factors. Themost important factors are: the shear velocity andthe quantity and nature of the gouge present atthe contact surface (Baumberger and Caroli 2006;Dunham and Rice 2008).
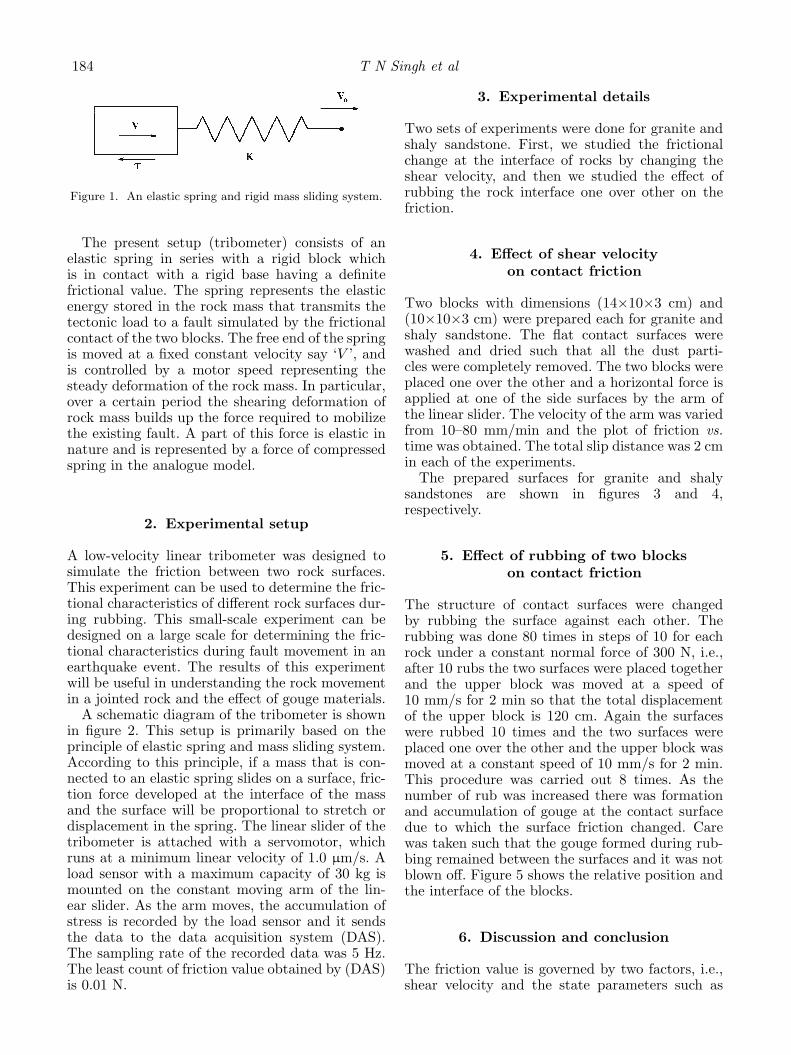
This phenomenon is best understood by an elas-tic spring and a rigid mass friction model as shownin figure 1.
Keywords. Tribometer; granite; shaly sandstone; state variable; stick-slip friction.
J. Earth Syst. Sci. 120, No. 1, February 2011, pp. 183–191© Indian Academy of Sciences 183
184 T N Singh et al
Figure 1. An elastic spring and rigid mass sliding system.
The present setup (tribometer) consists of anelastic spring in series with a rigid block whichis in contact with a rigid base having a definitefrictional value. The spring represents the elasticenergy stored in the rock mass that transmits thetectonic load to a fault simulated by the frictionalcontact of the two blocks. The free end of the springis moved at a fixed constant velocity say ‘V ’, andis controlled by a motor speed representing thesteady deformation of the rock mass. In particular,over a certain period the shearing deformation ofrock mass builds up the force required to mobilizethe existing fault. A part of this force is elastic innature and is represented by a force of compressedspring in the analogue model.
2. Experimental setup
A low-velocity linear tribometer was designed tosimulate the friction between two rock surfaces.This experiment can be used to determine the fric-tional characteristics of different rock surfaces dur-ing rubbing. This small-scale experiment can bedesigned on a large scale for determining the fric-tional characteristics during fault movement in anearthquake event. The results of this experimentwill be useful in understanding the rock movementin a jointed rock and the effect of gouge materials.
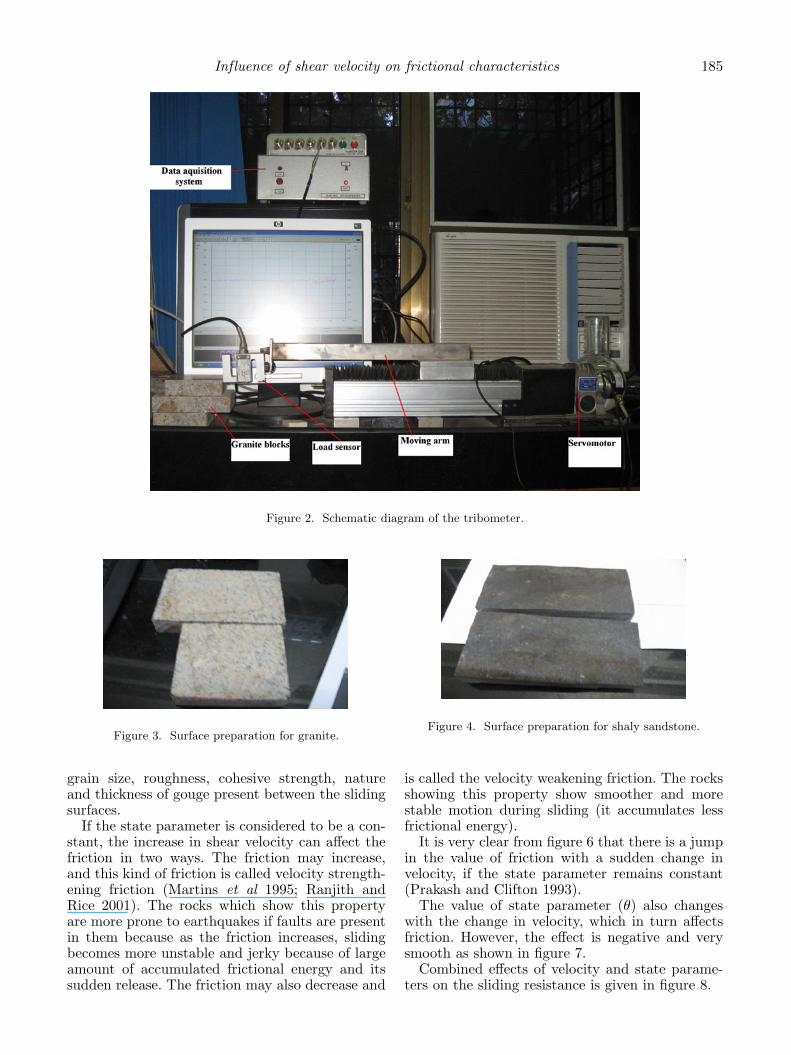
A schematic diagram of the tribometer is shownin figure 2. This setup is primarily based on theprinciple of elastic spring and mass sliding system.According to this principle, if a mass that is con-nected to an elastic spring slides on a surface, fric-tion force developed at the interface of the massand the surface will be proportional to stretch ordisplacement in the spring. The linear slider of thetribometer is attached with a servomotor, whichruns at a minimum linear velocity of 1.0 μm/s. Aload sensor with a maximum capacity of 30 kg ismounted on the constant moving arm of the lin-ear slider. As the arm moves, the accumulation ofstress is recorded by the load sensor and it sendsthe data to the data acquisition system (DAS).The sampling rate of the recorded data was 5 Hz.The least count of friction value obtained by (DAS)is 0.01 N.
3. Experimental details
Two sets of experiments were done for granite andshaly sandstone. First, we studied the frictionalchange at the interface of rocks by changing theshear velocity, and then we studied the effect ofrubbing the rock interface one over other on thefriction.
4. Effect of shear velocityon contact friction
Two blocks with dimensions (14×10×3 cm) and(10×10×3 cm) were prepared each for granite andshaly sandstone. The flat contact surfaces werewashed and dried such that all the dust parti-cles were completely removed. The two blocks wereplaced one over the other and a horizontal force isapplied at one of the side surfaces by the arm ofthe linear slider. The velocity of the arm was variedfrom 10–80 mm/min and the plot of friction vs.time was obtained. The total slip distance was 2 cmin each of the experiments.
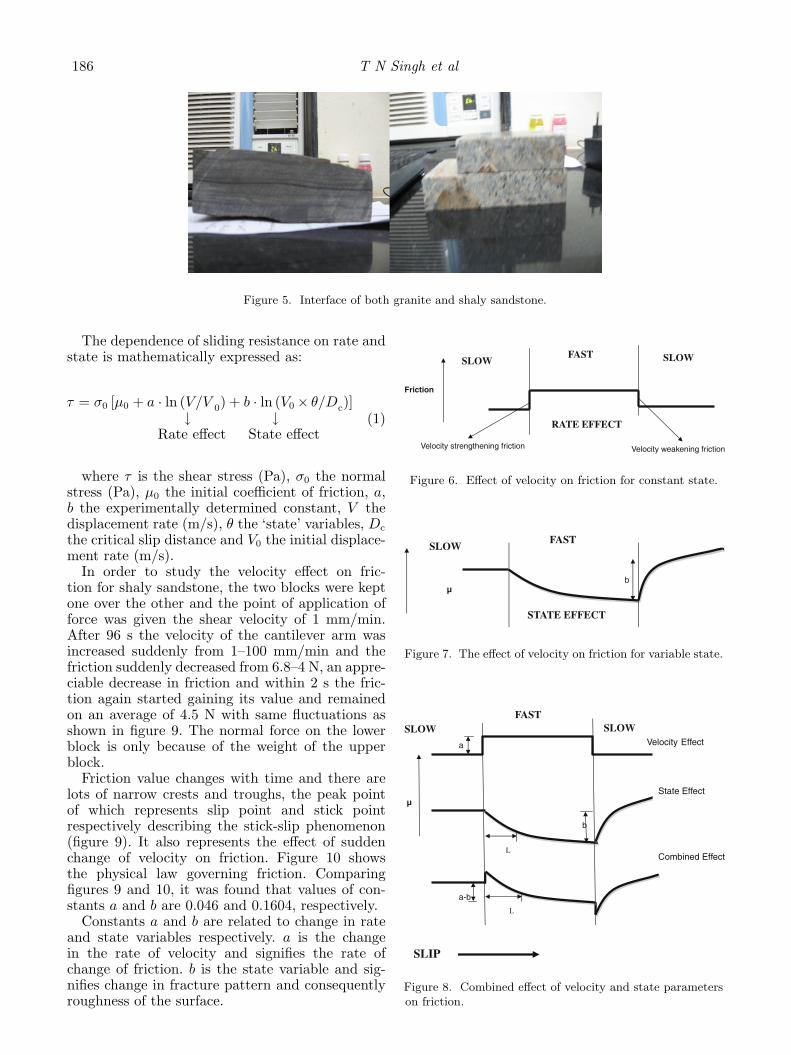
The prepared surfaces for granite and shalysandstones are shown in figures 3 and 4,respectively.
5. Effect of rubbing of two blockson contact friction
The structure of contact surfaces were changedby rubbing the surface against each other. Therubbing was done 80 times in steps of 10 for eachrock under a constant normal force of 300 N, i.e.,after 10 rubs the two surfaces were placed togetherand the upper block was moved at a speed of10 mm/s for 2 min so that the total displacementof the upper block is 120 cm. Again the surfaceswere rubbed 10 times and the two surfaces wereplaced one over the other and the upper block wasmoved at a constant speed of 10 mm/s for 2 min.This procedure was carried out 8 times. As thenumber of rub was increased there was formationand accumulation of gouge at the contact surfacedue to which the surface friction changed. Carewas taken such that the gouge formed during rub-bing remained between the surfaces and it was notblown off. Figure 5 shows the relative position andthe interface of the blocks.
6. Discussion and conclusion
The friction value is governed by two factors, i.e.,shear velocity and the state parameters such as
Influence of shear velocity on frictional characteristics 185
Figure 2. Schematic diagram of the tribometer.
Figure 3. Surface preparation for granite.
grain size, roughness, cohesive strength, natureand thickness of gouge present between the slidingsurfaces.
If the state parameter is considered to be a con-stant, the increase in shear velocity can affect thefriction in two ways. The friction may increase,and this kind of friction is called velocity strength-ening friction (Martins et al 1995; Ranjith andRice 2001). The rocks which show this propertyare more prone to earthquakes if faults are presentin them because as the friction increases, slidingbecomes more unstable and jerky because of largeamount of accumulated frictional energy and itssudden release. The friction may also decrease and
Figure 4. Surface preparation for shaly sandstone.
is called the velocity weakening friction. The rocksshowing this property show smoother and morestable motion during sliding (it accumulates lessfrictional energy).
It is very clear from figure 6 that there is a jumpin the value of friction with a sudden change invelocity, if the state parameter remains constant(Prakash and Clifton 1993).
The value of state parameter (θ) also changeswith the change in velocity, which in turn affectsfriction. However, the effect is negative and verysmooth as shown in figure 7.
Combined effects of velocity and state parame-ters on the sliding resistance is given in figure 8.
186 T N Singh et al
Figure 5. Interface of both granite and shaly sandstone.
The dependence of sliding resistance on rate andstate is mathematically expressed as:
τ = σ0 [μ0 + a · ln (V/V 0) + b · ln (V0 × θ/Dc)]↓ ↓
Rate effect State effect(1)
where τ is the shear stress (Pa), σ0 the normalstress (Pa), μ0 the initial coefficient of friction, a,b the experimentally determined constant, V thedisplacement rate (m/s), θ the ‘state’ variables, Dc
the critical slip distance and V0 the initial displace-ment rate (m/s).
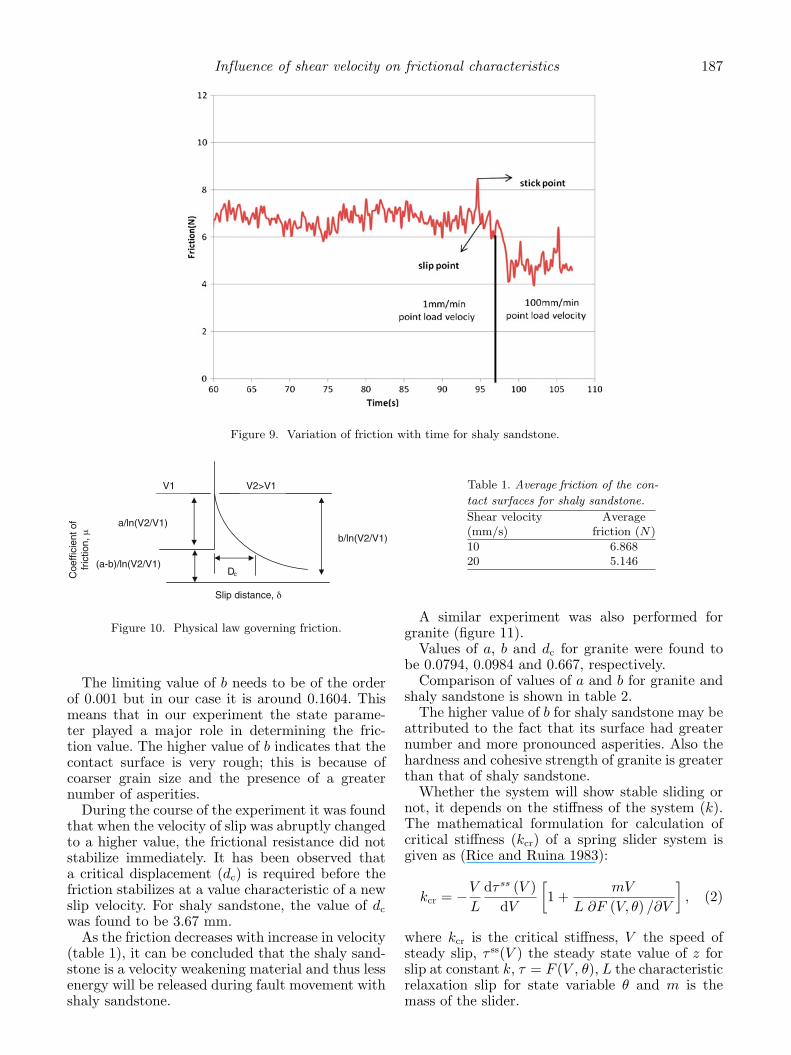
In order to study the velocity effect on fric-tion for shaly sandstone, the two blocks were keptone over the other and the point of application offorce was given the shear velocity of 1 mm/min.After 96 s the velocity of the cantilever arm wasincreased suddenly from 1–100 mm/min and thefriction suddenly decreased from 6.8–4 N, an appre-ciable decrease in friction and within 2 s the fric-tion again started gaining its value and remainedon an average of 4.5 N with same fluctuations asshown in figure 9. The normal force on the lowerblock is only because of the weight of the upperblock.
Friction value changes with time and there arelots of narrow crests and troughs, the peak pointof which represents slip point and stick pointrespectively describing the stick-slip phenomenon(figure 9). It also represents the effect of suddenchange of velocity on friction. Figure 10 showsthe physical law governing friction. Comparingfigures 9 and 10, it was found that values of con-stants a and b are 0.046 and 0.1604, respectively.
Constants a and b are related to change in rateand state variables respectively. a is the changein the rate of velocity and signifies the rate ofchange of friction. b is the state variable and sig-nifies change in fracture pattern and consequentlyroughness of the surface.
SLOW
RATE EFFECT
FAST SLOW
Friction
Velocity strengthening friction Velocity weakening friction
Figure 6. Effect of velocity on friction for constant state.
SLOW FAST
STATE EFFECT
bµ
Figure 7. The effect of velocity on friction for variable state.
SLIP
L
b
L
a-b
a
SLOW
µ
SLOW Velocity Effect
Combined Effect
FAST
State Effect
Figure 8. Combined effect of velocity and state parameterson friction.
Influence of shear velocity on frictional characteristics 187
Figure 9. Variation of friction with time for shaly sandstone.
Dc
a/ln(V2/V1)
(a-b)/ln(V2/V1)
b/ln(V2/V1)
V2>V1
Slip distance, δ
Coe
ffici
ent o
ffr
ictio
n, μ
V1
Figure 10. Physical law governing friction.
The limiting value of b needs to be of the orderof 0.001 but in our case it is around 0.1604. Thismeans that in our experiment the state parame-ter played a major role in determining the fric-tion value. The higher value of b indicates that thecontact surface is very rough; this is because ofcoarser grain size and the presence of a greaternumber of asperities.
During the course of the experiment it was foundthat when the velocity of slip was abruptly changedto a higher value, the frictional resistance did notstabilize immediately. It has been observed thata critical displacement (dc) is required before thefriction stabilizes at a value characteristic of a newslip velocity. For shaly sandstone, the value of dc
was found to be 3.67 mm.As the friction decreases with increase in velocity
(table 1), it can be concluded that the shaly sand-stone is a velocity weakening material and thus lessenergy will be released during fault movement withshaly sandstone.
Table 1. Average friction of the con-
tact surfaces for shaly sandstone.
Shear velocity Average(mm/s) friction (N)
10 6.86820 5.146
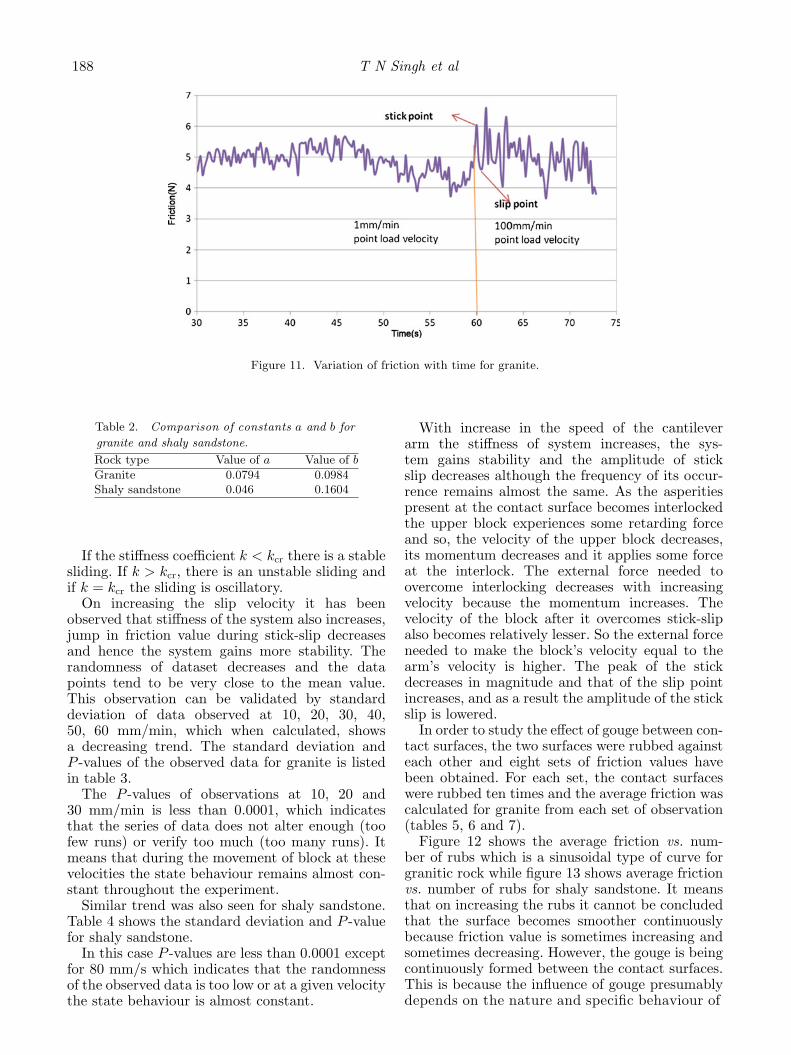
A similar experiment was also performed forgranite (figure 11).
Values of a, b and dc for granite were found tobe 0.0794, 0.0984 and 0.667, respectively.
Comparison of values of a and b for granite andshaly sandstone is shown in table 2.
The higher value of b for shaly sandstone may beattributed to the fact that its surface had greaternumber and more pronounced asperities. Also thehardness and cohesive strength of granite is greaterthan that of shaly sandstone.
Whether the system will show stable sliding ornot, it depends on the stiffness of the system (k).The mathematical formulation for calculation ofcritical stiffness (kcr) of a spring slider system isgiven as (Rice and Ruina 1983):
kcr = −V
L
dτ ss (V )dV
[1 +
mV
L ∂F (V, θ) /∂V
], (2)
where kcr is the critical stiffness, V the speed ofsteady slip, τ ss(V ) the steady state value of z forslip at constant k, τ = F (V , θ), L the characteristicrelaxation slip for state variable θ and m is themass of the slider.
188 T N Singh et al
Figure 11. Variation of friction with time for granite.
Table 2. Comparison of constants a and b for
granite and shaly sandstone.
Rock type Value of a Value of b
Granite 0.0794 0.0984Shaly sandstone 0.046 0.1604
If the stiffness coefficient k < kcr there is a stablesliding. If k > kcr, there is an unstable sliding andif k = kcr the sliding is oscillatory.
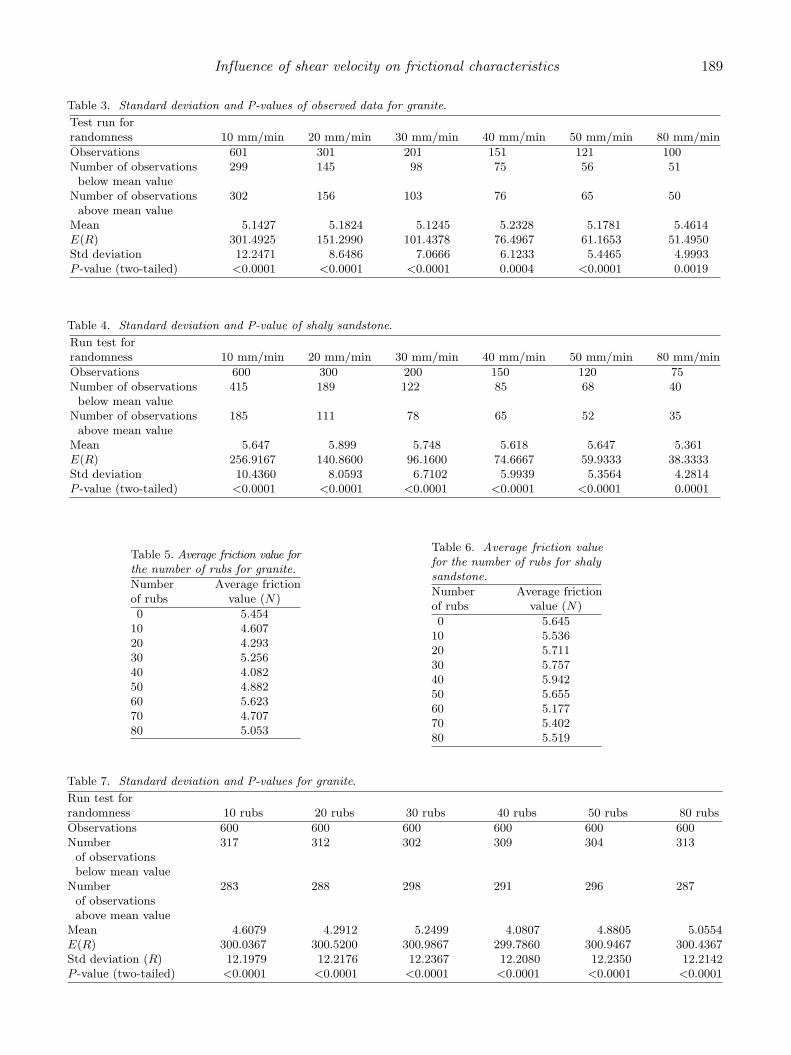
On increasing the slip velocity it has beenobserved that stiffness of the system also increases,jump in friction value during stick-slip decreasesand hence the system gains more stability. Therandomness of dataset decreases and the datapoints tend to be very close to the mean value.This observation can be validated by standarddeviation of data observed at 10, 20, 30, 40,50, 60 mm/min, which when calculated, showsa decreasing trend. The standard deviation andP -values of the observed data for granite is listedin table 3.
The P -values of observations at 10, 20 and30 mm/min is less than 0.0001, which indicatesthat the series of data does not alter enough (toofew runs) or verify too much (too many runs). Itmeans that during the movement of block at thesevelocities the state behaviour remains almost con-stant throughout the experiment.
Similar trend was also seen for shaly sandstone.Table 4 shows the standard deviation and P -valuefor shaly sandstone.
In this case P -values are less than 0.0001 exceptfor 80 mm/s which indicates that the randomnessof the observed data is too low or at a given velocitythe state behaviour is almost constant.
With increase in the speed of the cantileverarm the stiffness of system increases, the sys-tem gains stability and the amplitude of stickslip decreases although the frequency of its occur-rence remains almost the same. As the asperitiespresent at the contact surface becomes interlockedthe upper block experiences some retarding forceand so, the velocity of the upper block decreases,its momentum decreases and it applies some forceat the interlock. The external force needed toovercome interlocking decreases with increasingvelocity because the momentum increases. Thevelocity of the block after it overcomes stick-slipalso becomes relatively lesser. So the external forceneeded to make the block’s velocity equal to thearm’s velocity is higher. The peak of the stickdecreases in magnitude and that of the slip pointincreases, and as a result the amplitude of the stickslip is lowered.
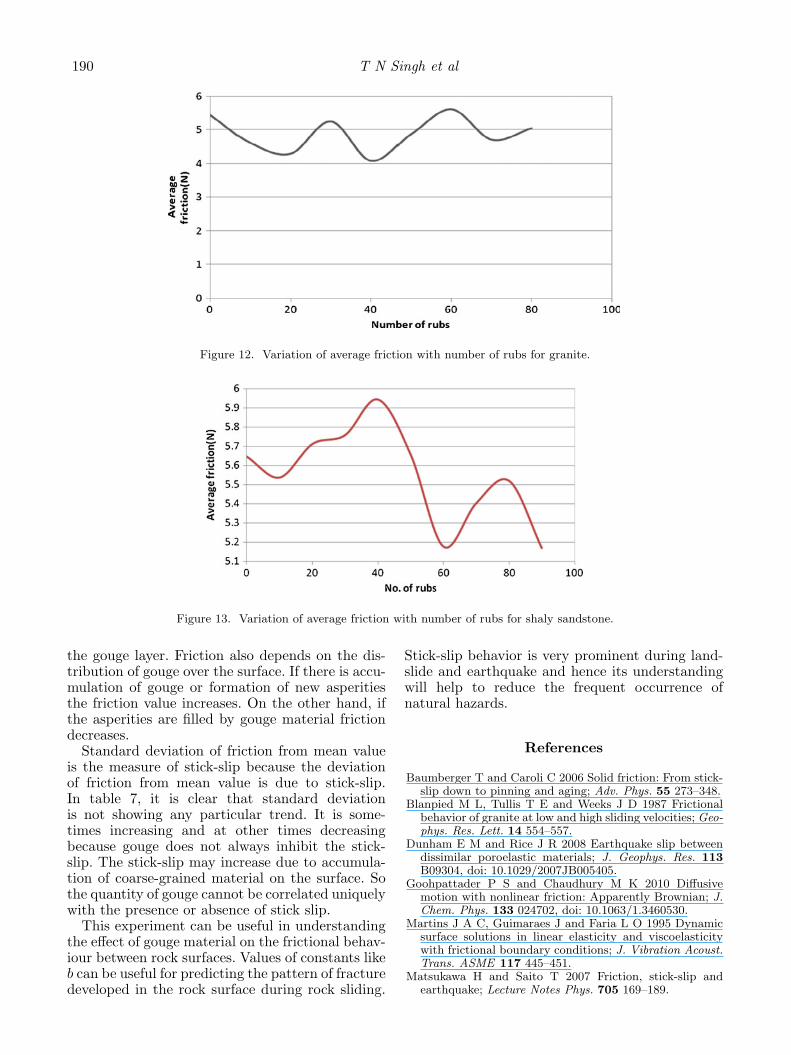
In order to study the effect of gouge between con-tact surfaces, the two surfaces were rubbed againsteach other and eight sets of friction values havebeen obtained. For each set, the contact surfaceswere rubbed ten times and the average friction wascalculated for granite from each set of observation(tables 5, 6 and 7).
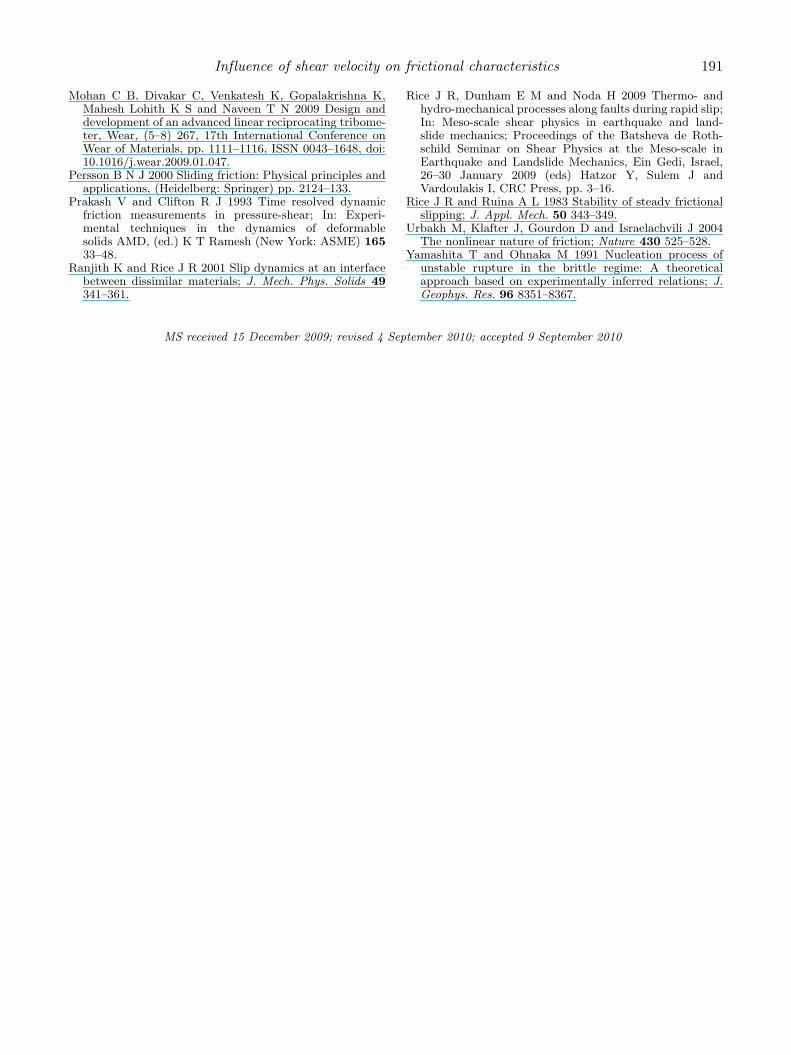
Figure 12 shows the average friction vs. num-ber of rubs which is a sinusoidal type of curve forgranitic rock while figure 13 shows average frictionvs. number of rubs for shaly sandstone. It meansthat on increasing the rubs it cannot be concludedthat the surface becomes smoother continuouslybecause friction value is sometimes increasing andsometimes decreasing. However, the gouge is beingcontinuously formed between the contact surfaces.This is because the influence of gouge presumablydepends on the nature and specific behaviour of
Influence of shear velocity on frictional characteristics 189
Table 3. Standard deviation and P-values of observed data for granite.
Test run forrandomness 10 mm/min 20 mm/min 30 mm/min 40 mm/min 50 mm/min 80 mm/min
Observations 601 301 201 151 121 100Number of observations 299 145 98 75 56 51below mean value
Number of observations 302 156 103 76 65 50above mean value
Mean 5.1427 5.1824 5.1245 5.2328 5.1781 5.4614E(R) 301.4925 151.2990 101.4378 76.4967 61.1653 51.4950Std deviation 12.2471 8.6486 7.0666 6.1233 5.4465 4.9993P -value (two-tailed) <0.0001 <0.0001 <0.0001 0.0004 <0.0001 0.0019
Table 4. Standard deviation and P-value of shaly sandstone.
Run test forrandomness 10 mm/min 20 mm/min 30 mm/min 40 mm/min 50 mm/min 80 mm/min
Observations 600 300 200 150 120 75Number of observations 415 189 122 85 68 40below mean value
Number of observations 185 111 78 65 52 35above mean value
Mean 5.647 5.899 5.748 5.618 5.647 5.361E(R) 256.9167 140.8600 96.1600 74.6667 59.9333 38.3333Std deviation 10.4360 8.0593 6.7102 5.9939 5.3564 4.2814P -value (two-tailed) <0.0001 <0.0001 <0.0001 <0.0001 <0.0001 0.0001
Table 5. Average friction value forthe number of rubs for granite.
Number Average frictionof rubs value (N)
0 5.45410 4.60720 4.29330 5.25640 4.08250 4.88260 5.62370 4.70780 5.053
Table 6. Average friction valuefor the number of rubs for shalysandstone.
Number Average frictionof rubs value (N)
0 5.64510 5.53620 5.71130 5.75740 5.94250 5.65560 5.17770 5.40280 5.519
Table 7. Standard deviation and P-values for granite.
Run test forrandomness 10 rubs 20 rubs 30 rubs 40 rubs 50 rubs 80 rubs
Observations 600 600 600 600 600 600Number 317 312 302 309 304 313of observationsbelow mean value
Number 283 288 298 291 296 287of observationsabove mean value
Mean 4.6079 4.2912 5.2499 4.0807 4.8805 5.0554E(R) 300.0367 300.5200 300.9867 299.7860 300.9467 300.4367Std deviation (R) 12.1979 12.2176 12.2367 12.2080 12.2350 12.2142P -value (two-tailed) <0.0001 <0.0001 <0.0001 <0.0001 <0.0001 <0.0001
190 T N Singh et al
Figure 12. Variation of average friction with number of rubs for granite.
Figure 13. Variation of average friction with number of rubs for shaly sandstone.
the gouge layer. Friction also depends on the dis-tribution of gouge over the surface. If there is accu-mulation of gouge or formation of new asperitiesthe friction value increases. On the other hand, ifthe asperities are filled by gouge material frictiondecreases.
Standard deviation of friction from mean valueis the measure of stick-slip because the deviationof friction from mean value is due to stick-slip.In table 7, it is clear that standard deviationis not showing any particular trend. It is some-times increasing and at other times decreasingbecause gouge does not always inhibit the stick-slip. The stick-slip may increase due to accumula-tion of coarse-grained material on the surface. Sothe quantity of gouge cannot be correlated uniquelywith the presence or absence of stick slip.
This experiment can be useful in understandingthe effect of gouge material on the frictional behav-iour between rock surfaces. Values of constants likeb can be useful for predicting the pattern of fracturedeveloped in the rock surface during rock sliding.
Stick-slip behavior is very prominent during land-slide and earthquake and hence its understandingwill help to reduce the frequent occurrence ofnatural hazards.
References
Baumberger T and Caroli C 2006 Solid friction: From stick-slip down to pinning and aging; Adv. Phys. 55 273–348.
Blanpied M L, Tullis T E and Weeks J D 1987 Frictionalbehavior of granite at low and high sliding velocities; Geo-phys. Res. Lett. 14 554–557.
Dunham E M and Rice J R 2008 Earthquake slip betweendissimilar poroelastic materials; J. Geophys. Res. 113B09304, doi: 10.1029/2007JB005405.
Goohpattader P S and Chaudhury M K 2010 Diffusivemotion with nonlinear friction: Apparently Brownian; J.Chem. Phys. 133 024702, doi: 10.1063/1.3460530.
Martins J A C, Guimaraes J and Faria L O 1995 Dynamicsurface solutions in linear elasticity and viscoelasticitywith frictional boundary conditions; J. Vibration Acoust.Trans. ASME 117 445–451.
Matsukawa H and Saito T 2007 Friction, stick-slip andearthquake; Lecture Notes Phys. 705 169–189.
Influence of shear velocity on frictional characteristics 191
Mohan C B, Divakar C, Venkatesh K, Gopalakrishna K,Mahesh Lohith K S and Naveen T N 2009 Design anddevelopment of an advanced linear reciprocating tribome-ter, Wear, (5–8) 267, 17th International Conference onWear of Materials, pp. 1111–1116, ISSN 0043–1648, doi:10.1016/j.wear.2009.01.047.
Persson B N J 2000 Sliding friction: Physical principles andapplications, (Heidelberg: Springer) pp. 2124–133.
Prakash V and Clifton R J 1993 Time resolved dynamicfriction measurements in pressure-shear; In: Experi-mental techniques in the dynamics of deformablesolids AMD, (ed.) K T Ramesh (New York: ASME) 16533–48.
Ranjith K and Rice J R 2001 Slip dynamics at an interfacebetween dissimilar materials; J. Mech. Phys. Solids 49341–361.
Rice J R, Dunham E M and Noda H 2009 Thermo- andhydro-mechanical processes along faults during rapid slip;In: Meso-scale shear physics in earthquake and land-slide mechanics; Proceedings of the Batsheva de Roth-schild Seminar on Shear Physics at the Meso-scale inEarthquake and Landslide Mechanics, Ein Gedi, Israel,26–30 January 2009 (eds) Hatzor Y, Sulem J andVardoulakis I, CRC Press, pp. 3–16.
Rice J R and Ruina A L 1983 Stability of steady frictionalslipping; J. Appl. Mech. 50 343–349.
Urbakh M, Klafter J, Gourdon D and Israelachvili J 2004The nonlinear nature of friction; Nature 430 525–528.
Yamashita T and Ohnaka M 1991 Nucleation process ofunstable rupture in the brittle regime: A theoreticalapproach based on experimentally inferred relations; J.Geophys. Res. 96 8351–8367.
MS received 15 December 2009; revised 4 September 2010; accepted 9 September 2010