Measurement and mechanical aspects of the microbond pull-out technique for obtaining fiber/resin...
13
Composites Science and Technology 42 (1991) 207-219 Measurement and Mechanical Aspects of the Microbond Pull-Out Technique for Obtaining Fiber/Resin Interfacial Shear Strength Bernard Miller, Umesh Gaur & Douglas E. Hirt* TRI/Princeton, PO Box 625, Princeton, New Jersey 08542, USA (Received 11 September 1990; revised version received 11 January 1991; accepted 25 January 1991) A BSTRA CT Measurement and mechanical aspects of the microbond pull-out technique for measuring fiber/resin interfacial shear strength have been examined to determine the origins of the consistent variability in bond strength results. Improved instrumentation for measuringfiber diameters and debonding loads make it possible to rule out these measurements as a significant cause of bond strength variability. Bond failure under the microbond shearing conditions is catastrophic. Variations in droplet contour near its intersection with the fiber are a consequence of the variations of contact angle between the two surfaces. Since the contact angle is less than 90 °, a compressiveforce which acts against the shearing process must be generated, but the variability of bond strength values cannot be accounted for by this contact angle-dependent compressive loading. Shear stress distributions along the fiber/droplet interface and contact angle variations make it vital that the shearing plates be as close as possible to the intersection of the fiber and resin surfaces. The results presented in this paper reinforce the idea that the principal cause of bond strength measurement variability lies in the inherent nonuniformity of fiber surfaces. INTRODUCTION In order to determine the shear strength of the interface between a fiber and an encapsulating resin, it is necessary to exert a controlled shearing force to * Present address: Department of Chemical Engineering, Clemson University, Clemson, South Carolina 29631, USA. 207 Composites Science and Technology 0266-3538/91/$03.50 © 1991 Elsevier Science Publishers Ltd, England. Printed in Great Britain
-
Upload
independent -
Category
Documents
-
view
4 -
download
0
Transcript of Measurement and mechanical aspects of the microbond pull-out technique for obtaining fiber/resin...

Composites Science and Technology 42 (1991) 207-219
Measurement and Mechanical Aspects of the Microbond Pull-Out Technique for Obtaining Fiber/Resin
Interfacial Shear Strength
Bernard Miller, Umesh Gaur & Douglas E. Hirt*
TRI/Princeton, PO Box 625, Princeton, New Jersey 08542, USA
(Received 11 September 1990; revised version received 11 January 1991; accepted 25 January 1991)
A BSTRA CT
Measurement and mechanical aspects of the microbond pull-out technique for measuring fiber/resin interfacial shear strength have been examined to determine the origins of the consistent variability in bond strength results. Improved instrumentation for measuringfiber diameters and debonding loads make it possible to rule out these measurements as a significant cause of bond strength variability. Bond failure under the microbond shearing conditions is catastrophic. Variations in droplet contour near its intersection with the fiber are a consequence of the variations of contact angle between the two surfaces. Since the contact angle is less than 90 °, a compressive force which acts against the shearing process must be generated, but the variability of bond strength values cannot be accounted for by this contact angle-dependent compressive loading. Shear stress distributions along the fiber/droplet interface and contact angle variations make it vital that the shearing plates be as close as possible to the intersection of the fiber and resin surfaces. The results presented in this paper reinforce the idea that the principal cause of bond strength measurement variability lies in the inherent nonuniformity of fiber surfaces.
INTRODUCTION
In order to determine the shear strength of the interface between a fiber and an encapsulating resin, it is necessary to exert a controlled shearing force to
* Present address: Department of Chemical Engineering, Clemson University, Clemson, South Carolina 29631, USA.
207 Composites Science and Technology 0266-3538/91/$03.50 © 1991 Elsevier Science Publishers Ltd, England. Printed in Great Britain

208 Bernard Miller, Umesh Gaur, Douglas E. Hirt
displace one phase relative to the other. The most common means of doing this is to hold the resin and place the fiber in tension (a pull-out test). When the fiber is of small diameter (e.g. carbon), it is likely to have a low breaking strength and, if the force required to shear the interracial bond is greater than that which the fiber can sustain in tension, the fiber will rupture first and abort the bond strength measurement. The microbond pull-out technique was developed by TRI/Princeton t so that, because the interfaciat contact area is kept at a small value, there is a high probability that debonding will occur before fiber rupture (and before matrix deformation).
The microbond procedure starts with the deposition of a small amount of liquid resin onto a horizontally suspended fiber in such a way that the resin forms a concentric droplet around the fiber (Fig. 1). Procedures for accomplishing this with thermosetting t and thermoplastic 2 resins have been described. Once the resin has hardened or been cured, the fiber diameter and the droplet dimensions are measured and used to determine the interfacial contact area and the fiber embedment length. The latter is usually kept between 50 and 150 F~m, depending on the anticipated breaking strength of the fiber.
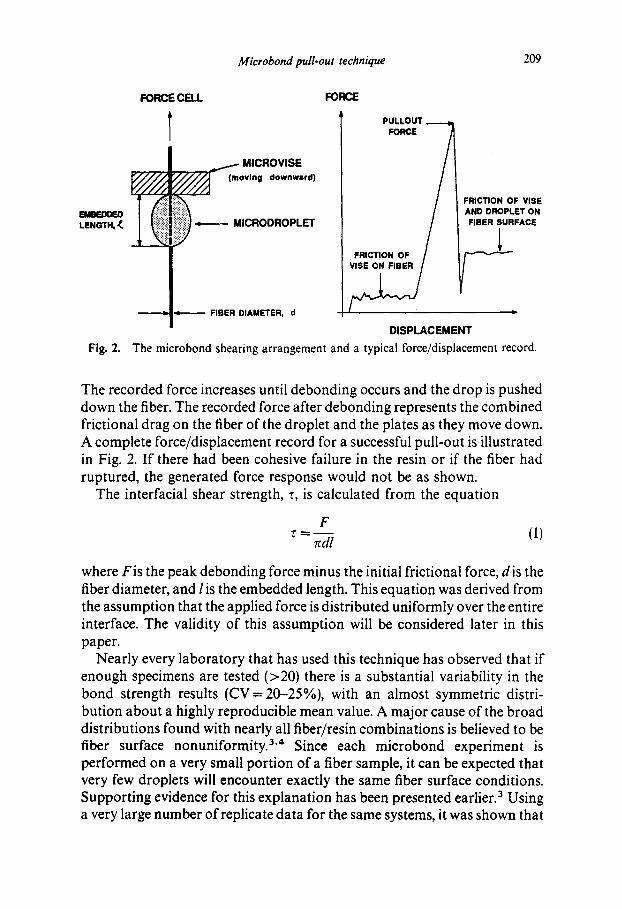
One end of the fiber is attached to a recording force gauge, and a microvise grips the resin droplet and moves downward, shearing the droplet off the fiber (Fig. 2). This device consists of two horizontal plates that form a slit with parallel walls than can be adjusted for width, attached to a vertical drive. The plates are positioned above the droplet and the slit is narrowed until the plates just make contact with the fiber. When the downward vertical drive is activated, confirmation that the plates are in contact can be seen by the generation of a frictional force. Eventually, as the plates continue to move, they encounter the droplet and exert a shearing force on the interface.
Fig. 1. Example of a cured resin droplet on a single fiber.
Microbond pull-out technique 209
B LENGTH,,~
Fig. 2.
FORCE CELL FORCE
l MICROVlSE
~ (moving downward)
MICRODROPLET
FIBER DIAMETER, d
PULLOUT FORCE
FRICTION OF /
FRICTION OF VISE AND DROPLET ON FIBER SURFACE
DISPLACEMENT
The microbond shearing arrangement and a typical force/displacement record.
The recorded force increases until debonding occurs and the drop is pushed down the fiber. The recorded force after debonding represents the combined frictional drag on the fiber of the droplet and the plates as they move down. A complete force/displacement record for a successful pull-out is illustrated in Fig. 2. If there had been cohesive failure in the resin or if the fiber had ruptured, the generated force response would not be as shown.
The interfacial shear strength, r, is calculated from the equation
F "c = (I)
~dl
where Fis the peak debonding force minus the initial frictional force, dis the fiber diameter, and lis the embedded length. This equation was derived from the assumption that the applied force is distributed uniformly over the entire interface. The validity of this assumption will be considered later in this paper.
Nearly every laboratory that has used this technique has observed that if enough specimens are tested (>20) there is a substantial variability in the bond strength results (CV=20-25%), with an almost symmetric distri- bution about a highly reproducible mean value. A major cause of the broad distributions found with nearly all fiber/resin combinations is believed to be fiber surface nonuniformity. 3'4 Since each microbond experiment is performed on a very small portion of a fiber sample, it can be expected that very few droplets will encounter exactly the same fiber surface conditions. Supporting evidence for this explanation has been presented earlier) Using a very large number of replicate data for the same systems, it was shown that

210 Bernard Miller, Umesh Gaur, Douglas E. Hirt
(1) pairs of near-neighbor microbonds (no more than a few millimeters apart) show smaller differences than pairs selected randomly from a complete data pool, and (2) variability is reduced when the droplets are larger, apparently because localized surface differences are more likely to be averaged out with greater contact areas. This paper presents some recent studies dealing with possible influences of measurement and mechanical factors, some of which are a consequence of fiber nonuniformity.
M E A S U R E M E N T FACTORS
Fiber d iameter m e a s u r e m e n t s
A possible source of uncertainty in the determination of bond strength could be the measurement of fiber diameter that is used to obtain the embedment area. Until recently, this measurement could be made at best to _+0.5 #m. and, since most fibers had diameters in the range of 10/xm, this represented a significant potential for inaccuracy. The diameter of each fiber specimen is now measured at TRI by means of a video micrometer (Model 305, Colorado Video, Inc., Boulder, CO), diagrammed in Fig. 3. The video micrometer accepts standard composite signals from a video camera (NEC TI23, approximate magnification 2-5 x) attached to a microscope (Zeiss Axioskop 20, magnification 500 × ). It superimposes two movable vertical white lines (cursors) on the image reproduced on a TV monitor. The displacement of the two marker lines generates a linear DC voltage change, which is displayed on a digital voltmeter. This displacement is calibrated and used to measure the fiber diameter. To minimize the uncertainty of subjective location of fiber boundaries, the device superimposes a video wave form on the monitor screen, which displays the gray level of the image at the cursor. This allows more objective and repeatable determination of dimensions on the basis of a predefined gray level for the fiber boundary.
Microscope ~ I
SpeCimen ~ U
Fig. 3.
Wave form display
/ / ~ monitor
• • ,el_ video "micrometer
Instrumentation for measurement of fiber diameters.
--Fiber image
~ Cursor lines

Microbond pull-out technique 211
Image enhancement circuitry is available that can be used to provide more contrast to expand the gray level scale.
Reproducibility to +0-05/~m can be achieved routinely with this instrumentation, and there is no doubt that the accuracy and precision of fiber diameter measurements have been improved. However, this has not caused any noticeable decrease in the variability of bond strength measurements for any particular fiber/resin system.
For a fiber with a cross-section that is not perfectly circular, any unidirectional transverse diameter measurement may lead to error in calculated bond strength because of an inaccurate perimeter value. To investigate this potential problem, fiber diameter measurements for several
TABLE 1 Comparison of Fiber Perimeters Derived from Video Microscope Measurements with Those
Based on Wettability Measurements
Fiber Specimen Microscopic Wettability Ratio of measurements measuremen ts perimeters:
wettability/ Measured Computed Measured microscopy diameter perimeter perimeter
AS4 1 7"00 22"4 23'7 1"06 2 7-20 23"0 24"2 1"05 3 6"80 21"7 23"2 1'07 4 7'30 23'3 23"8 1"02 5 7"20 23'0 22"9 1"00 6 6"85 21"9 21'9 1'00
Dialead l 8.40 26.8 28.3 1.05 2 9.50 30.4 33.1 1.09
HMS-4 1 7.10 22.7 23.3 1-03 2 6.90 22.0 24.2 1.I0
IM-6 1 5.50 17.6 18.2 1-04 2 5.10 16-3 17.9 1.10
IM-7 I 5' 15 16"5 16.0 0-97 2 5.45 17.4 19.5 1-12
Pitch 1 10-25 32.7 31.4 0.96 2 8"60 27.5 28.5 1.04 3 9.90 31.6 30.4 0-96 4 10.60 33.9 32.7 0-97
T-300 1 6.55 20-9 22-4 1.07
Glass 1 19-05 60.9 60-4 0-99 2 19.20 61.3 61.6 1-00 3 13.80 44.1 44.9 1.02

212 Bernard Miller, Umesh Gaur, Douglas E. Hirt
carbon fibers and a glass fiber were compared with perimeter measurements obtained from wettability data. By measuring the wetting force, E exerted on the fiber in a low energy liquid of known surface tension, a, that makes a zero degree contact angle with the fiber, the perimeter, P, is computed from the Wilhelmy equation, P = Fla. This comparison is shown in Table 1. It is evident that for glass fibers the microscopic and wettability measurements yield the same value for the perimeter. However, for all the carbon fibers except pitch fiber, the perimeter values from wettability are somewhat higher. This observation is consistent with the general belief that most carbon fibers are shaped more like a twisted ribbon than a cylinder with a circular cross-section. Consequently, a routine was established for fibers with non-circular cross-sections: a sampling of perimeter values was obtained from both wettability and microscopy, and the average ratio used to correct subsequent fiber diameter determinations.
Peak force readings
As a possible explanation for some of the bond strength variability, we have considered that there might be significant uncertainty in the measurement of the peak debonding force. The original force detector was an electronic balance, reading to one milligram and feeding an analog signal to a strip chart recorder. Considering that modern electronic balances have circuitry
(a ) =o (b) 2o
18 18
16 16
14 14
12 12
LOAD LOAD (grams) I i (grams) lO68
2
0 I " I I ~,1 ' :1 0 2 4 6 8 10 12 14 16 13.2 13.4 13.6 13,8 14 14.2 14.4
TIME (seconds) TIME (seconds)
Fig. 4. (a) Computer-generated force/time plot during microbond pull-out; (b) expanded time-scale during debonding~

Microbond pull-out technique 213
designed to ignore or damp out short-period transient signals and that a strip chart recorder pen has a 0.25-s response time, the question arises as to whether or not such a combination could supply a reproducible record of the actual debonding force. Therefore the balance was replaced with a rapid response force gauge producing a continuous analog signal that was fed to a laboratory computer capable of sampling every millisecond.
Figure 4 shows force readings obtained during a debonding experiment by a computer collecting signals from the force gauge every 20 ms. What happens just before and just after debonding is shown clearly in Fig. 4(b). The force reading increases steadily and then drops abruptly. The readout is fast enough to detect the instant immediately after debonding when there is zero tension on the fiber (i.e. it springs back), before the post-debonding friction starts to build up. The steady increase in force during the period just before debonding indicates that the peak value obtained from a chart recorder trace is likely to be good enough for nearly all purposes and should not be a serious source of uncertainty in the bond strength measurement, unless the rate of loading is extremely high. For the example shown in Fig. 4, the loading rate of ~2 g/s would, with a recorder response time of 0-25 s, result in no more than 0.5 g underestimation of the debonding force for the worst case.
MECHANICAL FACTORS
Drop profiles
When the two parallel shearing plates of the microvise come into contact with the resin ellipsoid, the shearing force is applied at two points (assuming that the resin is hard enough to resist distortion); the location of these two contact points depending on the width of the slit. The distribution of stresses resulting from the applied force will depend not only on the contact point locations but also on the orientation of the resin surface at the points of contact.
The contour of the droplet surface near its intersection with the fiber is a consequence of the contact angle between the two surfaces, which is a resultant of the competitive attractions of the liquid to itself and to the fiber. Two separate analyses have been reported for using drop dimensions to determine such contact angles, s'6 The approach used by Carroll s was chosen for the present study. The expression for the Laplace excess pressure across the surface of an axially symmetric drop is applied to a drop with a varying radius of curvature and then used in conjunction with measurable drop dimensions to derive an expression that relates drop radius, r, to the

214 Bernard Miller, (,'mesh Gaur, Douglas E. Hirt
/ Z
I, ID r
Fig. 5. Typical d rop profile showing parameters describing d rop conformat ion .
axial distance along the length of the drop, z. The resulting differential equation is
d r [ ( r2 2 _ r Z ) ( r 2 _ a2r~ ) ] 1/2 (2a)
d z - r 2 + a r t r 2
where r 2 c o s 0 - - r t
a - (2b) r 2 - - rt cos 0
In eqn (2a), q is the fiber radius, r 2 is the maximum drop radius, and 0 is the contact angle (see Fig. 5). Carroll 5'7'8 reported data obtained with various oils applied to several types of fibers; measured values of q, r z, and drop length L were used with eqn (2a) to obtain the contact angle for each drop/ fiber system. The authors used this same approach to determine the contact angles ofmicrobond/res in droplets and also to determine the complete drop profile (that is, r as a function of z). For example, a drop ofcured epoxy resin (Epon 828) on a Kevlar-29 fiber, which had q = 5.7 #m, rz = 33-6 #m and L = 100/am, produced a contact angle of 0 = 16"2 °. The contact angle value was then used to obtain full drop profiles (extremes illustrated in Fig. 6). To accomplish this, eqn (2) was solved numerically using a Runge-Kut t a scheme with the initial condition that r = r z when z = 0.
This type of contact angle calculation was performed for 18 Kevlar-29/ Epon 828 specimens. The results are shown in Table 2 in order of increasing contact angle. Note that there is no systematic correlation of the contact angle with any of the three drop dimensions, but there is a significant

Microbond pull-out technique 215
Fig. 6.
. . . . - , - , , . . ,
. . - . , . ,
• , . , , . , , . .
, . , , , , , . . , .
, : : , , . , . , ,
, : + : , : . : * :
:!:i?!:i:i
40.3"
Variation in drop profiles for the lowest and highest contact angles found for a set of 18 Kevlar-29/Epon 828 droplets.
TABLE 2 Contact Angles Calculated for Epon 828 Droplets of Different Dimensions on
Kevlar-29 Fibers
Maximum Drop length Drop Contact angle IFSS drop radius (#m) volume x 103 (deg) (MPa)
(l~m) (ltm3) =
29-7 98"0 135"6 2'3 22'2 20-5 71"8 47"4 8"6 24"2 21'7 74"I 55'4 9"8 34"2 29"1 91'2 128"6 11"1 24"6 31'9 98'0 168-0 11"6 33-7 30-8 94'6 t51'9 13"7 44-0 33"6 100"0 194"6 16"2 30"7 37"6 109"0 268'6 16-4 37.7 26"2 82"0 95"4 17"I 32"7 39"9 114'0 318"3 17'1 28"2 24'5 77'5 78"6 17"7 32"3 38"9 1 lifO 288"5 20" 1 42'5 44.5 123"0 434"7 20"1 30-2 26"2 79"8 94"7 21"5 33"9 31"9 93'0 166"9 21'8 26-6 54"5 144'0 778"6 22"8 29-6 34"8 95"7 210"9 30-3 25"6 34-2 89"0 197' 1 40"3 32"8
= Computed from maximum drop radii and drop length.

216 Bernard Miller, Umesh Gaur, Douglas E. Hirt
variation of 0, f rom 2'3: to 40.3 ~. This variation may reflect fiber surface heterogeneities, but it is not significant in terms of fiber surface energetics which are propor t ional to cos 0, since the cosine function does not change very much until 0 gets above 40 ~. Also, note that cos 0 does not correlate with measured bond strength. However, the differences in contact angle have a significant influence on the drop profile, as seen in Fig. 6. The profites for the two extreme values are markedly different, especially near the top of the droplet where the microvise shearing plates contact the drop surt:ace.
F r o m drop profiles such as those shown in Fig. 6, one can predict that whenever the contact angle is less than 90 ~, there will be a force that compresses the resin against the fiber and, therefore, acts against the shearing process. The equil ibrium force balance shown in Fig. 7 indicates this compressive force, F c, should be equal to Fco t 0.
This addi t ional compressive force would introduce an addit ional frictional drag that must be overcome to bring about debonding. That is
F = Fad + [ rE c (3)
where F = force required for debonding Fad = inherent debonding force F~ = addit ional compressing force ~t = coefficient of friction
Since
and
then
J~ad = TA (r = intrinsic bond strength)
F¢ = Fcos 0
F = rA + p F c o t 0
FI2
y = (F/2) cot 0
Fig. 7. Force balance at shear plate contact points . . . . .

Microbond pull-out technique 217
1 IFSS
0 .045 -
0.040
0.035
0.030
0.025-
( I / M P a )
0.020 . . . . . - - 0 1 2 3 4 5 6 7
cot 0 Fig. 8. Reciprocal of IFSS as a function of cot 0.
which reduces to
A = I _ / ~ c o s O (4) F z z
Since A/F is the reciprocal of IFSS (the apparent bond strength for each specimen), the data from the last two columns in Table 2 could be plotted as shown in Fig. 8. There does not appear to be any significant correlation, which suggests that other factors responsible for variability outweigh the consequences of the additional compression.
Stress distributions
Stress distribution may depend strongly on the position of load application, that is the position at which the microvise contacts the drop surface. It is postulated that when the load is applied close to the fiber, the shear stress is more concentrated near the top of the droplet, and interfacial shear stress in the lower portion of the droplet is small; that is, the lower portion supports a small fraction of the load. As the load is applied further from the fiber, the point of maximum stress should move down the fiber, and the maximum stress should decrease. Thus, assuming that the interface fails when the stress at a point at the interface exceeds a critical stress, it is likely that a droplet under load at points close to the fiber would debond at a lower force than the same droplet under load at points away from the fiber, because the stress is

218 Bernard Miller, Urnesh Gaur, Douglas E. Hirt
more concentrated for the former case; the calculated bond strength would therefore also be lower.
To analyze the stress distributions during microbond shearing, the method of virtual displacement was used in conjunction with triangular finite elements on the two-dimensional analog of the microbond geometry. A more rigorous finite element analysis is in progress, but preliminary results show that, in addition to the compression (squeeze) factor, the positioning of the plates can have a strong influence on the stress distribution along the length of the interface. Overestimation of bond strength will very likely result if the shearing slit is too wide. However, if the plates are in contact with the fiber surface, the bond strength measurement should be quite accurate,
In a previous publication, 9 the authors presented bond strength measurements for pairs of droplets on the same fiber; the upper droplet was sheared by the microvise plate and allowed to continue moving until it came in contact with the lower droplet. The latter was then debonded by force transmitted from the microvise through the upper droplet. Thus the force for the second debonding was applied uniformly around the top of the interfacial region and as close as possible to the intersection of the two surfaces. Comparison of the results over a wide range ofembedment lengths showed no significant differences between upper and lower droplet bond strength measurements, indicating that the parallel plates were doing just as good a job as the droplet/droplet shearing process and therefore were not a major cause of shear strength distributions.
CONCLUSIONS
Improved instrumentation for measuring fiber diameters makes it possible to rule out this measurement as a significant cause of bond strength variability. However, for any fiber with a cross-section that is not absolutely round, the calculated perimeter may be incorrect, leading to an incorrect value for bond strength.
Measurement of the peak debonding force should not require ultra-fast force measurements, unless the rate of loading is extremely high. The results obtained with the rapid response data collection instrumentation show q uite clearly that, for all systems tested, bond failure under the microbond shearing conditions is catastrophic; that is, the entire interface releases at the same instant.
Analysis of drop configurations has shown that contact angle vanations can be expected within any collection of fiber/resin specimens and that such variations make it critical that the shearing plates be as close as possible to the intersection of the fiber and resin surfaces. Preliminary finite element

Microbond pull-out technique 219
analysis shows that the positioning of the plates can have a strong influence on the stress distribution along the length of the interface. Bond strength is likely to be overestimated if the shearing slit is too wide.
Everything discussed in this paper reinforces the idea that the principal cause of bond strength measurement variability lies in the inherent nonuniformity of fiber surfaces. This nonuniformity may cause variations in observed bond strength in one or more ways: it may affect the contact angle of the droplet on the fiber surface, which controls the amount of additional compressive force that acts against debonding, though this effect may be trivial compared to compressive forces that are produced during the bonding process; it may alter the magnitudes of the dispersive and non- dispersive attractive forces between the two phases; and it may produce surface geometry variations that result in different degrees of mechanical interlocking.
A C K N O W L E D G E M E N T S
These studies comprise one area of work on the TRI project 'Adhesion and Fiber Composites', supported by a group of corporate TRI participants. The authors would like to thank Dr Chia-Te Chou for his assistance with some of the experiments.
REFERENCES
1. Miller, B., Muri, P. & Rebenfeld, L., Comp. Sci. Tech., 28 (1987) 17. 2. Gaur, U., Desio, G. & Miller, B., Plastics Eng., 45 (October 1989) 43. 3. Gaur, U. & Miller, B., Controlled Interphases in Composite Materials, ed. H.
Ishida. Elsevier, New York, 1990, pp. 723-30. 4. Penn, L. S. & Lee, S. M., J. Composites Technology & Research, 1 i(1) (Spring 1989)
23-30. 5. Carroll, B. J., J. Coll. Interface Sci., 57 (1976) 488. 6. Yamaki, J. I. & Katayama, Y., J. Appl. Polym. Sci., 19 (1975) 2897. 7. Carroll, B. J., J. Coll. Interface Sci., 97 (1984) 195. 8. Carroll, B. J., Langmuir, 2 (1986) 248. 9. Gaur, U. & Miller, B., Comp. Sci. Tech., 34 (1989) 35.