(1) Habte, Ambrosis, Mostyn (2010) A Simplifi ed Creep Analysis for Low Strength Seams in Rock...
8
14TH AUSTRALASIAN TUNNELLING CONFERENCE / AUCKLAND, NEW ZEALAND, 8 - 10 MARCH 2011 389 INTRODUCTION Creep displacements form one of a number of the potential sources of loading on a permanent tunnel lining. As noted by Chen and Small, 2008, the creep performance of a structure is complex and determined by many factors. In order to fully assess creep induced liner loads it is necessary to consider the interaction between various coupled mechanisms. Such mechanisms include; the creep behaviour of the rock, the creep behaviour of the liner material and the resulting stress changes in the whole tunnel/rock mass system. The work described in this paper does not aim to provide a full, coupled analysis of these mechanisms. Instead, it is aimed at providing an indicator as to the potential for creep movements. The outcomes of this work, are guidelines which can be used as a ‘ready reckoner’ for site personnel to assess the encountered rock conditions and ultimately compare these against design assumptions. As used in this paper, the term ‘creep’ has been limited to the time dependent deformation of soils and rocks under a constant stress state in either drained or undrained loading. Whilst not an exhaustive definition, it is considered reasonable for the consideration of creep displacements in rock pillars. According to the literature creep movements in soils and weathered rocks can result from a number of mechanisms including; secondary consolidation in clay bands, viscous characteristics of the soil or rock skeleton, slow propagation of micro-cracks and faults and/or ‘squeezing’ due to progressive development of plastic strains (Mesri et al, 1981; Aydal, Akagi and Kawamoto, 1993; Phinewej, Thakur and Cording, 2007). Particular factors which contribute to creep deformation are identified as; the presence of clays or highly weathered micaceous, argillaceous and phyllitic schistose particles, high overburden to strength ratio, high water content and high porosity. This work considers the situation where tunnel excavation in a rock mass which includes distinct bands of clay or low strength rock results in the formation of a rock pillar. The presence of zones of clay bands and poor quality rocks, coupled with an increased stress level result in the potential for creep deformations in the pillar. 1. Associate, PSM Consult Pty Ltd, 35 Jeays Street, Bowen Hiills Qld 4006. Email: [email protected] 2. Principal, PSM Consult Pty Ltd, G3 - 56 Delhi Road, North Ryde NSW 2113. Email: [email protected] 3. Principal, PSM Consult Pty Ltd, G3 - 56 Delhi Road, North Ryde NSW 2113. Email: [email protected] A Simplified Creep Analysis for Low Strength Seams in Rock Pillars M Habte 1 , A de Ambrosis 2 and G Mostyn 3 ABSTRACT This paper presents a simplified method for the assessment of creep deformations in rock masses containing bands of low strength or soil strength rock. The main impetus for this work was the need to assess the impact of distinct bands of clay and/or low strength rock on the long term deformation behaviour of a rock pillar formed as part of a series of proposed tunnelling works. In particular, the authors were interested in being able to provide criterion which could be used by site personnel to assess the encountered rock conditions against design assumptions. Creep deformation versus time plots are presented for a range of material consistencies. These plots were produced using the hyperbolic creep equation proposed by Mesri et al (1981). This empirically based equation was chosen for its simplicity and practicality. Discussion is included regarding typical input parameter values and the sensitivity of the results to these values is explored. Finally, in the soil strength materials, the secondary consolidation equation is used to check the veracity of the results calculated using the hyperbolic creep equation.
-
Upload
independent -
Category
Documents
-
view
3 -
download
0
Transcript of (1) Habte, Ambrosis, Mostyn (2010) A Simplifi ed Creep Analysis for Low Strength Seams in Rock...

14TH AUSTRALASIAN TUNNELLING CONFERENCE / AUCKLAND, NEW ZEALAND, 8 - 10 MARCH 2011 389
INTRODUCTION
Creep displacements form one of a number of the potential sources of loading on a permanent tunnel lining. As noted by Chen and Small, 2008, the creep performance of a structure is complex and determined by many factors. In order to fully assess creep induced liner loads it is necessary to consider the interaction between various coupled mechanisms. Such mechanisms include; the creep behaviour of the rock, the creep behaviour of the liner material and the resulting stress changes in the whole tunnel/rock mass system.
The work described in this paper does not aim to provide a full, coupled analysis of these mechanisms. Instead, it is aimed at providing an indicator as to the potential for creep movements. The outcomes of this work, are guidelines which can be used as a ‘ready reckoner’ for site personnel to assess the encountered rock conditions and ultimately compare these against design assumptions. As used in this paper, the term ‘creep’ has been limited to the time dependent deformation of soils and rocks under a constant stress state in either drained or undrained loading. Whilst not an exhaustive defi nition, it is considered reasonable for the consideration of creep displacements in rock pillars.
According to the literature creep movements in soils and weathered rocks can result from a number of mechanisms including; secondary consolidation in clay bands, viscous characteristics of the soil or rock skeleton, slow propagation of micro-cracks and faults and/or ‘squeezing’ due to progressive development of plastic strains (Mesri et al, 1981; Aydal, Akagi and Kawamoto, 1993; Phinewej, Thakur and Cording, 2007). Particular factors which contribute to creep deformation are identifi ed as; the presence of clays or highly weathered micaceous, argillaceous and phyllitic schistose particles, high overburden to strength ratio, high water content and high porosity.
This work considers the situation where tunnel excavation in a rock mass which includes distinct bands of clay or low strength rock results in the formation of a rock pillar. The presence of zones of clay bands and poor quality rocks, coupled with an increased stress level result in the potential for creep deformations in the pillar.
1. Associate, PSM Consult Pty Ltd, 35 Jeays Street, Bowen Hiills Qld 4006. Email: [email protected]
2. Principal, PSM Consult Pty Ltd, G3 - 56 Delhi Road, North Ryde NSW 2113. Email: [email protected]
3. Principal, PSM Consult Pty Ltd, G3 - 56 Delhi Road, North Ryde NSW 2113. Email: [email protected]
A Simplifi ed Creep Analysis for Low Strength Seams in Rock Pillars
M Habte1, A de Ambrosis2 and G Mostyn3
ABSTRACT
This paper presents a simplifi ed method for the assessment of creep deformations in rock masses containing bands of low strength or soil strength rock. The main impetus for this work was the need to assess the impact of distinct bands of clay and/or low strength rock on the long term deformation behaviour of a rock pillar formed as part of a series of proposed tunnelling works. In particular, the authors were interested in being able to provide criterion which could be used by site personnel to assess the encountered rock conditions against design assumptions.
Creep deformation versus time plots are presented for a range of material consistencies. These plots were produced using the hyperbolic creep equation proposed by Mesri et al (1981). This empirically based equation was chosen for its simplicity and practicality. Discussion is included regarding typical input parameter values and the sensitivity of the results to these values is explored. Finally, in the soil strength materials, the secondary consolidation equation is used to check the veracity of the results calculated using the hyperbolic creep equation.

14TH AUSTRALASIAN TUNNELLING CONFERENCE / AUCKLAND, NEW ZEALAND, 8 - 10 MARCH 2011
M HABTE, A DE AMBROSIS AND G MOSTYN
390
CREEP EQUATIONS
Various models are available for the assessment of creep deformations (eg Singh, 1975; Mesri et al, 1981; Goodman, 1998). This paper has predominately used the hyperbolic creep equation proposed by Mesri et al (1981). This empirically based equation was chosen for its simplicity and practicality. Notwithstanding this, in the soil strength materials, the secondary consolidation equation has been used to sense check the results calculated using the hyperbolic creep equation.
HYPERBOLIC CREEP EQUATION (MESRI ET AL, 1981)
Equation 1 details the hyperbolic creep equation proposed by Mesri et al (1981). According to Phinewej, Thakur and Cording, 2007, this equation is mostly used to describe the creep deformation in clayey soils and soft rocks. This empirically based equation is appealing for this application because the parameters have physical meaning and are related to mechanical properties of the materials that are relatively easy to assess.
(1)
where:
ε is the strain at time t
Eu
is the undrained modulus,
Su
is the undrained shear strength,
D = (σ1- σ
3)/(σ
1- σ
3)
f is the stress level with (σ
1-σ
3)
f being the peak deviatoric stress at which
failure is initiated
λ is the creep parameter and is the slope of strain versus time plot in log-log scaleR
f = (σ
1- σ
3)
ult /(σ
1- σ
3)
f = 1-2/[(E
u / S
u) ε
f ] is the fi tting ratio which controls the nonlinearity of
the stress-strain relationship, (σ1 - σ
3)
ult is the ultimate stress state at which the material deforms
continuously without change in deviatoric stress, εf the strain at failure and t
1 is the reference time at
which a reference strain ε1 is computed.
ε1 is given by
(2)
SECONDARY CONSOLIDATION EQUATION
Equation 3 details the secondary consolidation equation. This equation assumes one-dimensional consolidation in fully saturated clays.
(3)
where:
ss
is secondary consolidation
Ho
is the initial thickness of the clay layer
eo
is the initial void ratio
tp
is the time to the end of primary consolidation
cα is the secondary compression indexcα
is commonly obtained from a constant ratio of cα/c
c (c
c is the compression index) with typical
values of cα/c
c = 0.04±0.01 for most inorganic clays and silt (Mesri et al, 1981)
Whilst widely used for the estimation of creep deformations in clay deposits, it was felt that the assumption of one-dimensional consolidation meant that this method was less applicable for the case of a rock pillar, where full confi nement was unlikely. Additionally, there were some reservations as to the applicability of this equation in weathered rocks. In this paper, the secondary consolidation equation is used as an alternative to compare with the results of the hyperbolic creep equation.
/E S R DD
tt2
1u u f 1
=f-
m
c m
/E S R DD2
1u u f
1 = =f-
logHS
eC
tt
1so
s
o p
= =+
f ac m
14TH AUSTRALASIAN TUNNELLING CONFERENCE / AUCKLAND, NEW ZEALAND, 8 - 10 MARCH 2011
A SIMPLIFIED CREEP ANALYSIS FOR LOW STRENGTH SEAMS IN ROCK PILLARS
391
INPUT PARAMETERS
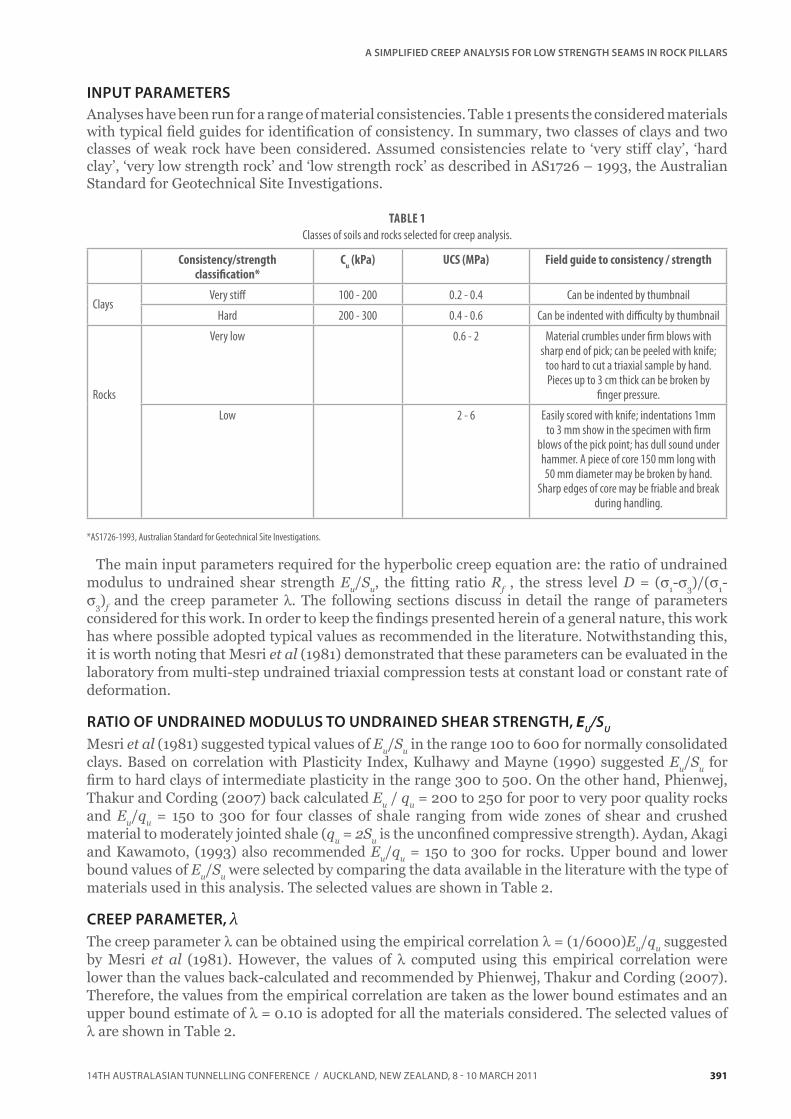
Analyses have been run for a range of material consistencies. Table 1 presents the considered materials with typical fi eld guides for identifi cation of consistency. In summary, two classes of clays and two classes of weak rock have been considered. Assumed consistencies relate to ‘very stiff clay’, ‘hard clay’, ‘very low strength rock’ and ‘low strength rock’ as described in AS1726 – 1993, the Australian Standard for Geotechnical Site Investigations.
The main input parameters required for the hyperbolic creep equation are: the ratio of undrained modulus to undrained shear strength E
u/S
u, the fi tting ratio R
f , the stress level D = (σ
1-σ
3)/(σ
1-
σ3)
f and the creep parameter λ. The following sections discuss in detail the range of parameters
considered for this work. In order to keep the fi ndings presented herein of a general nature, this work has where possible adopted typical values as recommended in the literature. Notwithstanding this, it is worth noting that Mesri et al (1981) demonstrated that these parameters can be evaluated in the laboratory from multi-step undrained triaxial compression tests at constant load or constant rate of deformation.
RATIO OF UNDRAINED MODULUS TO UNDRAINED SHEAR STRENGTH, EU/SU
Mesri et al (1981) suggested typical values of Eu/S
u in the range 100 to 600 for normally consolidated clays. Based on correlation with Plasticity Index, Kulhawy and Mayne (1990) suggested E
u/S
u for
fi rm to hard clays of intermediate plasticity in the range 300 to 500. On the other hand, Phienwej, Thakur and Cording (2007) back calculated E
u / q
u = 200 to 250 for poor to very poor quality rocks
and Eu/q
u = 150 to 300 for four classes of shale ranging from wide zones of shear and crushed material to moderately jointed shale (q
u = 2Su is the unconfi ned compressive strength). Aydan, Akagi
and Kawamoto, (1993) also recommended Eu/q
u = 150 to 300 for rocks. Upper bound and lower bound values of E
u/S
u were selected by comparing the data available in the literature with the type of materials used in this analysis. The selected values are shown in Table 2.
CREEP PARAMETER, λThe creep parameter λ can be obtained using the empirical correlation λ = (1/6000)E
u/q
u suggested
by Mesri et al (1981). However, the values of λ computed using this empirical correlation were lower than the values back-calculated and recommended by Phienwej, Thakur and Cording (2007). Therefore, the values from the empirical correlation are taken as the lower bound estimates and an upper bound estimate of λ = 0.10 is adopted for all the materials considered. The selected values of λ are shown in Table 2.
Consistency/strength classifi cation*
Cu (kPa) UCS (MPa) Field guide to consistency / strength
ClaysVery stiff 100 - 200 0.2 - 0.4 Can be indented by thumbnail
Hard 200 - 300 0.4 - 0.6 Can be indented with diffi culty by thumbnail
Rocks
Very low 0.6 - 2 Material crumbles under fi rm blows with sharp end of pick; can be peeled with knife;
too hard to cut a triaxial sample by hand. Pieces up to 3 cm thick can be broken by
fi nger pressure.
Low 2 - 6 Easily scored with knife; indentations 1mm to 3 mm show in the specimen with fi rm
blows of the pick point; has dull sound under hammer. A piece of core 150 mm long with 50 mm diameter may be broken by hand.
Sharp edges of core may be friable and break during handling.
*AS1726-1993, Australian Standard for Geotechnical Site Investigations.
TABLE 1
Classes of soils and rocks selected for creep analysis.

14TH AUSTRALASIAN TUNNELLING CONFERENCE / AUCKLAND, NEW ZEALAND, 8 - 10 MARCH 2011
M HABTE, A DE AMBROSIS AND G MOSTYN
392
Ratio of failure strength to ultimate strength, Rf
Rf = 1-2/[(E
u/S
u)ε
f ] is computed using the selected values E
u/S
u and assuming failure strains of εf = 5
to 10 per cent for very stiff clays and εf = 2 to 5 per cent for the hard clay and very low to low strength
rocks. The adopted values of Rf are in the range 0.90 to 0.95 for the clays and 0.80 to 0.90 for the
poor quality rocks.
Stress level, DWhen used for a specifi c problem, the stress level D = (σ
1 - σ
3)/(σ
1- σ
3)
f can be easily obtained by
computing the deviator stress (σ1 - σ
3) from simplifi ed numerical analysis of a typical tunnel cross-
section. The effect of tunnel lining can be considered, which is considered an advantage of the methodology. D can then be computed for the undrained case using the unconfi ned compressive strength of the material under consideration.
RESULTS
Creep deformation
The creep strains have been calculated by substituting the above suggested ranges of input parameters into the hyperbolic creep Equation 2. First, upper bound and lower bound estimates of the reference strain ε
1 at time t
1 are calculated using the limit values of E
u / S
u, R
f and λ from Table 2.
The reference time is taken as t1= t
p for the clays (where t
p is the duration of primary consolidation,
ie 95 per cent consolidation) whereas the reference time t1 for the rocks can be determined from the
rate of excavation and the type of rock. Lower bound and upper bound estimates of the reference strains have been computed for four values of D ranging from 0.7 to 0.98. The computed reference strains ε
1 are shown in Table 3. The predicted upper bound and lower bound estimates of the creep
strain are shown in Figures 1 to 4.
Comparison with secondary consolidation equation
The primary and secondary consolidation of the clays has been calculated and compared with the creep deformations obtained from the hyperbolic creep Equation 2 in the soil strength materials. Comparisons of the secondary consolidation from Equation 1 with the creep deformation from Equation 2 for very stiff and hard clays at D = 0.98 are shown in Figures 5 and 6. These fi gures indicate comparable estimates of creep deformation between the secondary consolidation equation and the hyperbolic creep equation.
CONCLUSIONS
This paper discusses the use of the hyperbolic creep Equation 1 for the estimation of creep displacements due to low strength seams in rock pillars. Typical input parameters (as presented in
Symbol Classifi cation Eu/Su λ Rf
VST Very stiff 300 - 400 0.07 - 0.1 0.9 - 0.95
H Hard 400 - 500 0.08 - 0.1 0.9 - 0.95
VL Very low 400 - 500 0.08 - 0.1 0.8 - 0.9
L Low 500 - 600 0.09 - 0.1 0.8 - 0.9
TABLE 2
Material parameters for creep analysis.
Symbol Classifi cation ε1
(%)
D = 0.7 D = 0.8 D = 0.9 D = 0.98
VST Very stiff 0.5 - 0.7 0.7 - 1.1 1.2 - 2.1 2.1 - 4.7
H Hard 0.4 - 0.5 0.6 - 0.8 0.95 - 1.6 1.7 - 3.6
VL Very low 0.3 - 0.5 0.4 - 0.7 0.6 - 1.2 0.9 - 2.1
L Low 0.3 - 0.4 0.4 - 0.6 0.5 - 0.95 0.8 - 1.7
TABLE 3
Upper bound and lower bound estimates of ε1.

14TH AUSTRALASIAN TUNNELLING CONFERENCE / AUCKLAND, NEW ZEALAND, 8 - 10 MARCH 2011
A SIMPLIFIED CREEP ANALYSIS FOR LOW STRENGTH SEAMS IN ROCK PILLARS
393
the literature) for a range of clays and low strength rocks are considered and a series of plots have been developed showing the calculated creep strains for a given time and material consistency. Whilst a number of the aspects of the results presented herein are necessarily general in nature, for a specifi c
0.0
2.0
4.0
6.0
8.0
10.0
12.0
14.0
16.0
1 10 100 1000 10000 100000
Cre
ep S
train
(%)
Normalised time (t/t1)
D=0.98 (Lower Bound Estimate) D=0.98 (Upper Bound Estimate)
D=0.9 (Lower Bound Estimate) D=0.9 (Upper Bound Estimate)
D=0.8 (Lower Bound Estimate) D=0.8 (Upper Bound Estimate)
D=0.7 (Lower Bound Estimate) D=0.7 (Upper Bound Estimate)
FIG 1 - Predicted creep strains for very stiff clay.
0.0
2.0
4.0
6.0
8.0
10.0
12.0
1 10 100 1000 10000 100000
Cre
ep S
train
(%)
Normalised time (t/t1)
D=0.98 (Lower Bound Estimate) D=0.98 (Upper Bound Estimate)
D=0.9 (Lower Bound Estimate) D=0.9 (Upper Bound Estimate)
D=0.8 (Lower Bound Estimate) D=0.8 (Upper Bound Estimate)
D=0.7 (Lower Bound Estimate) D=0.7 (Upper Bound Estimate)
FIG 2 - Predicted creep strains for hard clay.

14TH AUSTRALASIAN TUNNELLING CONFERENCE / AUCKLAND, NEW ZEALAND, 8 - 10 MARCH 2011
M HABTE, A DE AMBROSIS AND G MOSTYN
394
case, the same methodology can be easily used to relate the expected creep movements to a specifi c material consistency and band thickness. Such a relationship represents a practical tool whereby site personnel can relate observed conditions to design assumptions. In simple terms, it provides a
0.0
1.0
2.0
3.0
4.0
5.0
6.0
7.0
1 10 100 1000 10000 100000
Cre
ep S
train
(%)
Normalised time (t/t1)
D=0.98 (Lower Bound Estimate) D=0.98 (Upper Bound Estimate)
D=0.9 (Lower Bound Estimate) D=0.9 (Upper Bound Estimate)
D=0.8 (Lower Bound Estimate) D=0.8 (Upper Bound Estimate)
D=0.7 (Lower Bound Estimate) D=0.7 (Upper Bound Estimate)
FIG 3 - Predicted creep strains for very low strength rock.
0.0
1.0
2.0
3.0
4.0
5.0
6.0
1 10 100 1000 10000 100000
Cre
ep S
train
(%)
Normalised time (t/t1)
D=0.98 (Lower Bound Estimate) D=0.98 (Upper Bound Estimate)
D=0.9 (Lower Bound Estimate) D=0.9 (Upper Bound Estimate)
D=0.8 (Lower Bound Estimate) D=0.8 (Upper Bound Estimate)
D=0.7 (Lower Bound Estimate) D=0.7 (Upper Bound Estimate)
FIG 4 - Predicted creep strains for low strength rock.

14TH AUSTRALASIAN TUNNELLING CONFERENCE / AUCKLAND, NEW ZEALAND, 8 - 10 MARCH 2011
A SIMPLIFIED CREEP ANALYSIS FOR LOW STRENGTH SEAMS IN ROCK PILLARS
395
methodology whereby a specifi c design creep allowance (say × per cent creep strain) can be easily related to a specifi c material consistency and band thickness. Whilst the presented methodology is not exclusive in its ability to relate these factors, the authors believe that as a result of the practical
0.0
2.0
4.0
6.0
8.0
10.0
0 100 200 300 400 500 600 700 800 900 1000
Cre
ep S
train
(%)
Normalised time (t/t1)
Hyperbolic Creep Eqn (Lower Bound Estimate)
Hyperbolic Creep Eqn (Upper Bound Estimate)
Secondary Consolidation Eqn(Lower Bound Estimate)
Secondary Consolidation(Upper Bound Estimate)
FIG 5 - Estimates of creep strain using secondary consolidation and hyperbolic creep equations for very stiff clay.
0.0
2.0
4.0
6.0
8.0
10.0
0 100 200 300 400 500 600 700 800 900 1000
Cre
ep S
train
(%)
Normalised time (t/t1)
Hyperbolic Creep Eqn (Lower Bound Estimate)
Hyperbolic Creep Eqn (Upper Bound Estimate)
Secondary Consolidation Eqn(Lower Bound Estimate)
Secondary Consolidation(Upper Bound Estimate)
FIG 6 - Estimates of creep strain using secondary consolidation and hyperbolic creep equations for hard clay.

14TH AUSTRALASIAN TUNNELLING CONFERENCE / AUCKLAND, NEW ZEALAND, 8 - 10 MARCH 2011
M HABTE, A DE AMBROSIS AND G MOSTYN
396
nature of the input parameters and the methods ability to easily consider confi nement stresses, it does provide a convenient method of analysis for the problem at hand.
REFERENCES
AS1726, 1993. The Australian Standard for Geotechnical Site Investigations (Standards Association of Australia).
Aydan, O, Akagi, T and Kawamoto, T, 1993. The squeezing potential of rocks around tunnels; theory and prediction, Rock Mechanics and Rock Engineering, 26(2):137-163.
Chen, R and Small, J C, 2008. Analysis of the creep behaviour of tunnels in Sandstone/Shale, in Proceedings 13th Australian Tunnelling Conference, pp 197-202 (The Australasian Institute of Mining and Metallurgy: Melbourne).
Goodman, R E, 1989. Introduction to Rock Mechanics, second edition (Wiley: New York).
Kulhawy, F H and Mayne, P W, 1990. Manual on estimating soil properties for foundation design, EL-6800 Research Project 1493-6, Electric Power Research Institute (Cornell University: New York).
Mesri, G, Febres-Cordero, E, Shield, D R and Castro, A, 1981. Shear-stress-strain-time behavior of clays, Geotechnique: 31(4), 537-552.
Phienwej, N, Thakur, P K and Cording, E J, 2007. Time-dependent response of tunnels considering creep effect, International Journal of Geomechanics, 7(4),296-306.
Singh, D P, 1975. A study of creep of rocks, Int J Rock Mech. Min.Sci. Geomech. Abstr, 12(9), 271–276.