Shear strength properties of Hong Kong soils for slope stability
7
48 © 2020 The Hong Kong Institution of Engineers HKIE Transactions | Volume 27, Number 1, pp.48–54 • https://doi.org/10.33430/V27N1THIE-2017-0052 TECHNICAL NOTE Shear strength properties of Hong Kong soils for slope stability ABSTRACT With the recent advancement in technology, the method, accuracy and speed of slope stability analysis have been vastly improved. Nevertheless, the reliability and appropriateness of such analysis can be very much in doubt if the soil behaviour, in particular the shear strength behaviour, is not fully understood. The objective of this paper is therefore to evaluate the shear strength behaviour of various soil types in Hong Kong. This comprises the collection, processing and analysis of the laboratory and field works carried out in the past few decades, in particular the triaxial compression testing in the laboratory and standard penetration test (SPT) in the field. For correlating SPT with soil shear strength, a fairly large number of carefully controlled site investigation works with SPT are carried out both above and below any Mazier sampling. Laboratory triaxial tests are then carried out in these Mazier samples. Finally, it is hoped that a basically quantitative relationship between soil shear strength and SPT can be obtained as this would enable a soil shear strength profile to be established once the corresponding SPT profile has been determined on site by carrying out SPT in adequate number of drill holes. KEYWORDS Slope stability; soil shear strength; triaxial testing; standard penetration test (SPT); dry soil density Hong Yau Wong Geotech Engineering Limited, Hong Kong, People’s Republic of China CONTACT Hong Yau Wong Received 17 November 2017 [email protected] 1. Introduction With the recent advancement in technology, the method, accuracy and speed of slope stability analysis have been advanced quite tremendously. Whilst the method and speed can be vastly improved with the development of various softwares, the improvement of accuracy is limited by the necessity of a thorough understanding of the soil behaviour, in particular the soil shear strength properties. With calculation technique available nowadays, it is entirely possible to divide any slope area into very small meshes (usually in the form of vertical slices) and calculate the slope stability quickly. However, this type of calculation is useful provided the soil shear strength properties (typically φ' and c') are either uniform throughout the whole slope area or the variation from mesh to mesh can be evaluated. Most of the soils in Hong Kong are either weathered soils or products of erosion from these soils. Because of differential weathering, soil shear strength properties can vary quite considerably even within the same location and definitely much more from location to location and from soil to soil. In order to obtain a complete soil shear strength profile in any slope, it is necessary to obtain adequate undisturbed soil samples for laboratory triaxial compression testing to determine φ' and c'. However, taking undisturbed soil samples in the field and carrying out triaxial testing in the laboratory are time consuming and expensive. The only alternative is to carry out standard penetration test (SPT) in the field and correlate these values with the soil shear strength, as SPT test is simple to operate in practically all soil types both above and below groundwater table. Moreover, the equipment required is relatively simple, rugged and permits frequent testing. It is therefore the purpose of this paper to firstly classify the major soil types in Hong Kong involved in slope stability calculations. This is followed by a further classification of each soil type into various in-situ dry density sub-groups. For each sub-group, all the triaxial testing results are summarised in the form of a deviator stress (q) versus mean effective normal stress (p') plot to obtain the most appropriate soil shear strength parameters ( φ' and c'). To correlate the soil shear strength parameters thus obtained with the SPT values, a large number of controlled tests have been carried out firstly in the field by performing SPT at both above and below any Mazier sample. This undisturbed Mazier sample will then be taken to the laboratory for determining the in-situ dry soil density and the soil shear strength. Starting from the early 1980s, a lot of high quality triaxial compression tests have had been carrying out in Hong Kong, in particular in the Public Works Central Laboratory (PWCL). With such a huge database, several thousands of these test results have been collected by the author from early 1980s to early 2000s, following the grouping and analysing procedures as mentioned above. In the meantime, the corresponding data correlating SPT with in-situ dry density and hence the soil shear strength parameters are also processed in the corresponding soil groups.
-
Upload
khangminh22 -
Category
Documents
-
view
0 -
download
0
Transcript of Shear strength properties of Hong Kong soils for slope stability

48© 2020 The Hong Kong Institution of Engineers HKIE Transactions | Volume 27, Number 1, pp.48–54 • https://doi.org/10.33430/V27N1THIE-2017-0052
TECHNICAL NOTEShear strength properties of Hong Kong soils for slope stability
ABSTRACT
With the recent advancement in technology, the method, accuracy and speed of slope stability analysis have been vastly improved. Nevertheless, the reliability and appropriateness of such analysis can be very much in doubt if the soil behaviour, in particular the shear strength behaviour, is not fully understood.The objective of this paper is therefore to evaluate the shear strength behaviour of various soil types in Hong Kong. This comprises the collection, processing and analysis of the laboratory and field works carried out in the past few decades, in particular the triaxial compression testing in the laboratory and standard penetration test (SPT) in the field. For correlating SPT with soil shear strength, a fairly large number of carefully controlled site investigation works with SPT are carried out both above and below any Mazier sampling. Laboratory triaxial tests are then carried out in these Mazier samples.Finally, it is hoped that a basically quantitative relationship between soil shear strength and SPT can be obtained as this would enable a soil shear strength profile to be established once the corresponding SPT profile has been determined on site by carrying out SPT in adequate number of drill holes.
KEYWORDS Slope stability; soil shear strength; triaxial testing; standard penetration test (SPT); dry soil density
Hong Yau WongGeotech Engineering Limited, Hong Kong, People’s Republic of China
CONTACT Hong Yau WongReceived 17 November 2017
1. Introduction
With the recent advancement in technology, the method, accuracy and speed of slope stability analysis have been advanced quite tremendously. Whilst the method and speed can be vastly improved with the development of various softwares, the improvement of accuracy is limited by the necessity of a thorough understanding of the soil behaviour, in particular the soil shear strength properties.
With calculation technique available nowadays, it is entirely possible to divide any slope area into very small meshes (usually in the form of vertical slices) and calculate the slope stability quickly. However, this type of calculation is useful provided the soil shear strength properties (typically φ' and c') are either uniform throughout the whole slope area or the variation from mesh to mesh can be evaluated. Most of the soils in Hong Kong are either weathered soils or products of erosion from these soils. Because of differential weathering, soil shear strength properties can vary quite considerably even within the same location and definitely much more from location to location and from soil to soil.
In order to obtain a complete soil shear strength profile in any slope, it is necessary to obtain adequate undisturbed soil samples for laboratory triaxial compression testing to determine φ' and c'. However, taking undisturbed soil samples in the field and carrying out triaxial testing in the laboratory are time consuming and expensive. The only alternative is to carry out standard penetration test (SPT) in the field and correlate these values with the soil shear
strength, as SPT test is simple to operate in practically all soil types both above and below groundwater table. Moreover, the equipment required is relatively simple, rugged and permits frequent testing.
It is therefore the purpose of this paper to firstly classify the major soil types in Hong Kong involved in slope stability calculations. This is followed by a further classification of each soil type into various in-situ dry density sub-groups. For each sub-group, all the triaxial testing results are summarised in the form of a deviator stress (q) versus mean effective normal stress (p') plot to obtain the most appropriate soil shear strength parameters (φ' and c').
To correlate the soil shear strength parameters thus obtained with the SPT values, a large number of controlled tests have been carried out firstly in the field by performing SPT at both above and below any Mazier sample. This undisturbed Mazier sample will then be taken to the laboratory for determining the in-situ dry soil density and the soil shear strength.
Starting from the early 1980s, a lot of high quality triaxial compression tests have had been carrying out in Hong Kong, in particular in the Public Works Central Laboratory (PWCL). With such a huge database, several thousands of these test results have been collected by the author from early 1980s to early 2000s, following the grouping and analysing procedures as mentioned above. In the meantime, the corresponding data correlating SPT with in-situ dry density and hence the soil shear strength parameters are also processed in the corresponding soil groups.

HKIE Transactions | Volume 27, Number 1, pp.48–5449
The final aim of this paper is therefore to obtain a basically quantitative relationship between soil shear strength and SPT as this would enable a soil shear strength profile to be established once the corresponding SPT profile has been determined on site.
2. Soil types in Hong Kong
The typical details of the major soil types in Hong Kong have been summarised by Wong (2013) based on Geotechnical Engineering Office (GEO) Publication No. 1/2007 (2007). The two major soil types are weathered soils and transported soils. Weathered soils are formed as a result of weathering of the parent rocks and transported soil as a result of erosion of the weathered soils (or rocks) or other transported soils. The two major rock types are granite and volcanic. In Hong Kong, these soils as mentioned above can be further classified into the following six major soil types:
Weathered soils(1) Completely/highly decomposed granite (C/HDG)(2) Completely/highly decomposed volcanic (C/HDV)
Transported soils(3) Fill/colluvium in granitic areas(4) Fill/colluvium in volcanic areas(5) Marine deposit (MD)(6) Alluvial deposit (ALL)
In any soil layer, fill/colluvium materials normally cover the thin surface layer. As for MD and ALL materials, these are only present in reclaimed areas where sea wall will be present and slope stability problem will therefore be involved. ALL will also be present in large flat alluvial plane usually with very gentle slope. Accordingly, in any major slopes, C/HDG and C/HDV materials would be mostly involved. However, for MD and ALL, the short-term slope stability is normally more critical than the long term one and therefore the short-term shear strength parameters (φu, cu) have to be determined.
3. Soil shear strength determination
The soil shear strength properties in general can be determined in both the laboratory as well as in-situ as summarised in Table 1. The following points are to be noted from this table:
Table 1. Laboratory and in-situ testing methods for determining soil shear strength parameters.
13
Table 1. Laboratory and in-situ testing methods for determining soil shear strength parameters.
Testing method commonly adopted Soil parameter determined
LaboratoryTriaxialTest
(1) CQPM CQPS CDS ' angle of internal frictionc' cohesion
(2) UU UC u undrained friction anglecu undrained cohesion
Vane shear cu undrained cohesion
Shear boxfriction angle along joint surface
separating 2 soil/ rock blocks
friction angle of rockfillIn-situ SPT Correlating with dry density and hence '
GCO probe test Similar to SPT but limited to fill/colluvium for only a few metres.
Vane shear test cu undrained cohesionCPT Theoretically ' and c' can be determined,
but accurate measurement & interpretationbeing difficult in practice
Plate loading testPressuremeter testIn-situ dry density Correlating with ' and c'
Notes:
(1) CQP = Consolidated undrained with pore pressure measurement, CD = Consolidated drained, M = Multi-stage, S = Single stage.
RobertsonGolderSimple shear box Large shear box
and c'
(2) UU = Unconsolidated undrained, UC = Unconfined compression.
UU UC
CAPM CQPS CDS φ'
φ
φu
φ
φ'
φ'
φ'
(1) Shear box tests are mainly for estimating the friction angle along the joint plane separating two soil/rock blocks. Because of the scale effect, the following precautionary measures are taken in carrying out the tests and the final processing of the test results:
(a) Low normal stress to be avoided. (b) The cohesion intercept to be set equal to zero in
calculating the friction angle, even if very high apparent cohesion being obtained from the test results.
(c) The joint surface for testing to be as planar as possible.
(2) Shear box tests are not suitable for determining the shear strength parameters (φ') in the undisturbed soil materials obtained in-situ. This is mainly due to the fact that the thickness of a normal shear box testing specimen is too small (in the order of 20 mm - 30 mm only) and most of the weathered soils (which are the major soil types in Hong Kong) is fairly granular in nature. As a result, the specimen can be disturbed very extensively during sampling. Accordingly, shear box tests are only suitable for remoulded soft clay or uniform sand.
(3) Ideally, large shear box is quite suitable for the undisturbed soil materials obtained in-situ. However, the cost for taking such large samples (in the order of 300 mm square/diameter or larger) is very high, and therefore not too many of these soil test data are available in Hong Kong.
(4) In view of the considerations in (1), (2) and (3) above, the soil shear strength parameters for most Hong Kong soils are determined by triaxial compression test. For weathered soils, fill/colluvium and granular
H Y WONG
50HKIE Transactions | Volume 27, Number 1, pp.48–54
marine/alluvial deposits, the most commonly adopted test is the multi-stage consolidated undrained with pore pressure measurement (CQP) and occasionally single stage consolidated drained (CD) or CQP test. The exceptional cases are marine clay and alluvial clay, in which the unconsolidated undrained (UU) or unconfined compression (UC) or vane shear test have to be adopted to determine the short-term shear strength and the CQP (multi or single) for the long term shear strength. An evaluation of various methods of triaxial testing and analysis for soils in Hong Kong has been given by Wong (1982).
(5) To determine the soil shear strength in-situ will be much more involved. In theory, cone penetration test (CPT), plate loading and pressuremeter can yield φ' and c' values. However, in practice, measurement and interpretation of in-situ results will be extremely difficult, if not impossible. Moreover, some of these tests have high operating cost (e.g. plate loading), some are difficult to mobilise to site (e.g. CPT) and some are difficult to perform (e.g. pressuremeter).
(6) An obvious choice is the SPT as this test is simple to operate in practically all soil types both above and below groundwater table. Moreover, the equipment required is relatively simple, rugged and permits frequent testing. Last but not least, SPT can be correlated to the majority of the engineering properties, including shear strength and deformation characteristics.
4. Grouping of soil materials
For the two major soil groups (weathered and transported soils) in Hong Kong, it should be noted that the shear strength of weathered soils depends on its degree of weathering rather than the particle size. On the other hand, the transported soils are dominated by the particle size as well as the previous degree of compaction.
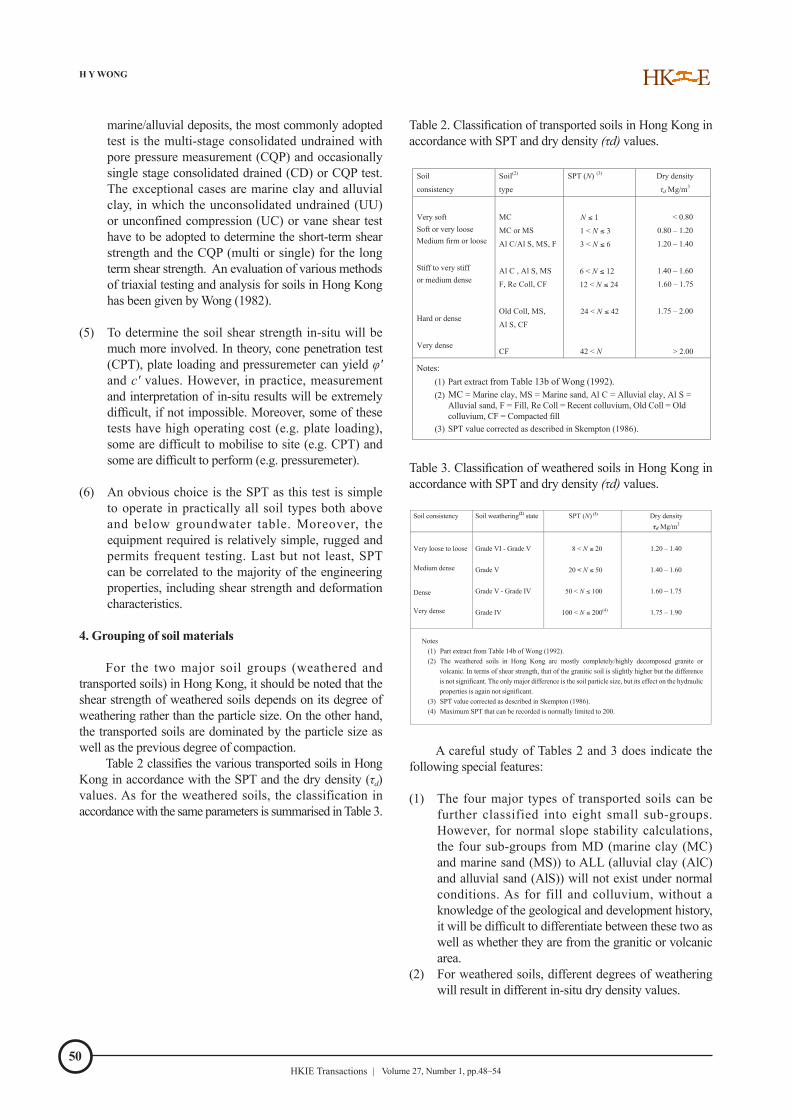
Table 2 classifies the various transported soils in Hong Kong in accordance with the SPT and the dry density (τd) values. As for the weathered soils, the classification in accordance with the same parameters is summarised in Table 3.
Table 2. Classification of transported soils in Hong Kong in accordance with SPT and dry density (τd) values.
14
Table 2. Classification of transported soils in Hong Kong in accordance with SPT and dry density ( d) values.
Soil
consistency
Soil(2)
type
SPT (N) (3) Dry density
d Mg/m3
Very softSoft or very looseMedium firm or loose
Stiff to very stiff or medium dense
Hard or dense
Very dense
MC
MC or MS
Al C/Al S, MS, F
Al C , Al S, MS
F, Re Coll, CF
Old Coll, MS,
Al S, CF
CF
< 0.80
0.80 – 1.20
1.20 – 1.40
1.40 – 1.60
1.60 – 1.75
1.75 – 2.00
> 2.00
Notes:(1) Part extract from Table 13b of Wong (1992).(2)
MC = Marine clay, MS = Marine sand, Al C = Alluvial clay, Al S = Alluvial sand, F = Fill, Re Coll = Recent colluvium, Old Coll = Old colluvium, CF = Compacted fill
(3)
SPT value corrected as described in Skempton (1986).
MC = Marine clay, MS = Marine sand, Al C = Alluvial clay, Al S = Alluvial sand, F = Fill, Re Coll = Recent colluvium, Old Coll = Old colluvium, CF = Compacted fill SPT value corrected as described in Skempton (1986).
N 1
1 < N 3
3 < N 6
6 < N 12
12 < N 24
24 < N 42
42 < N
Table 3. Classification of weathered soils in Hong Kong in accordance with SPT and dry density (τd) values.
15
Table 3. Classification of weathered soils in Hong Kong in accordance with SPT and dry density ( d) values.
Soil consistency Soil weathering(2) state SPT (N) (3) Dry densityd Mg/m3
Very loose to loose
Medium dense
Dense
Very dense
Grade VI - Grade V
Grade V
Grade V - Grade IV
Grade IV
8 < N 20
20 < N 50
50 < N 100
100 < N 200(4)
1.20 – 1.40
1.40 – 1.60
1.60 – 1.75
1.75 – 1.90
Notes(1) Part extract from Table 14b of Wong (1992).(2) The weathered soils in Hong Kong are mostly completely/highly decomposed granite or
volcanic. In terms of shear strength, that of the granitic soil is slightly higher but the difference is not significant. The only major difference is the soil particle size, but its effect on the hydraulic properties is again not significant.
(3) SPT value corrected as described in Skempton (1986).(4) Maximum SPT that can be recorded is normally limited to 200.
A careful study of Tables 2 and 3 does indicate the following special features:
(1) The four major types of transported soils can be further classified into eight small sub-groups. However, for normal slope stability calculations, the four sub-groups from MD (marine clay (MC) and marine sand (MS)) to ALL (alluvial clay (AlC) and alluvial sand (AlS)) will not exist under normal conditions. As for fill and colluvium, without a knowledge of the geological and development history, it will be difficult to differentiate between these two as well as whether they are from the granitic or volcanic area.
(2) For weathered soils, different degrees of weathering will result in different in-situ dry density values.

HKIE Transactions | Volume 27, Number 1, pp.48–5451
(3) For the same dry bulk density range, weathered soils have considerably higher SPT and most probably higher soil shear strength. Based on the above reasoning and observations from
Tables 2 and 3, it would be most convenient to classify the soils in question into the following major soil groups in accordance with the dry bulk density values as in Table 4 in order to simplify the slope stability problems. It can be seen from this simplified Table 4 that for the same dry bulk density range, a weathered soil has a considerably higher shear strength than a transported soil, as evidenced by the higher SPT.
Table 4. Soil classification in accordance with in-situ dry density. 16
Table 4. Soil classification in accordance with in-situ dry density.
Fill/Colluvium(1)
Dry density( d Mg/m3)
Soil type Soil consistency
SPT
1.20 – 1.40 F Loose 3 < N 6 174 (81/93)
1.40 – 1.60 F, Re Coll Medium dense 6 < N 12 478 (211/267)
1.60 – 1.75 Old Coll, CF Dense 12 < N 24 405 (156/249)
1.75 – 2.00 CF Very dnse 24 < N 42 123 (70/53)
C/HDG/C/HDV(1)
Dry density ( d Mg/m3)
Soil weatheringstate
Soil consistency
SPT No. of test results(2)
(1st stage / 2nd and 3rd
stages)
1.20 – 1.40 Grade VI - Grade V Loose 8 < N 20 236 (134/102)
1.40 – 1.60 Grade V Medium dense 20 < N 50 400 (164/236)
1.60 – 1.75 Grade V - Grade IV Dense 50 < N 100 273 (131/142)
1.75 – 1.90 Grade IV Very dense 100 < N 200(3) 207 (137/70)
Notes:
(1) MD and ALL are not included in fill/colluvium. Weathered volcanic, granodiorite, metamorphic and
sedimentary rocks are also not included in C/HDG.
(2) Each test result represents either one 1st stage test or one 2nd/3rd stage test. The p' range within which the
test results are falling is 700 kPa. Some of the 2nd and 3rd stage results might not be included.
(3) The maximum SPT that can be recorded is normally limited to 200.
No. of test results(2)
(1st stage / 2nd and 3rd
stages)
5. Analysis of soil shear strength data
In considering the soil shear strength, it should be noted that this must be represented by two soil parameters (φ', c') and a ground condition term p′ (mean effective normal stress). It is only under the special case of a purely frictional material (e.g. sandy soil) that only the soil friction term (φ') and the testing condition term (p′) are required. In the very special case of a purely cohesive material, only the soil cohesion (c') term is necessary.
As practically all tests for determining the shear strength are from triaxial compression test, a lot being CQPM test, a plotting of the deviator stress (q) versus the mean effective normal stress (p') can be carried out for each sample. For illustration purpose, such a plot for typical fill/colluvium samples in the dry density range 1.60 Mg/m3 – 1.75 Mg/m3 is as shown in Figure 1 and for C/HDG samples of the same dry density range in Figure 2.
10
Figure 1. Typical triaxial test results in the form of q versus p' plot for fill/colluvium with dry density range of 1.60 Mg/m3 - 1.75 Mg/m3.
11
Figure 2. Typical triaxial test results in the form of q versus p' plot for C/HDG with dry density range of 1.60 Mg/m3 - 1.75 Mg/m3.
The following features can be observed:
(1) For each multi-stage test, both the second and third stage results will be included except for those results which are outside the range of presentation.
(2) As the soil shear strength will decrease with each stage of shearing (Wong, 1982), it follows that the inclusion of the second and third stage results will only result in a more conservative soil shear strength envelop.
(3) However, from the q versus p' plot as presented in Figures 1 and 2, there is no significant difference between the first and later stage test results.
(4) Within the range of p′ values considered, some second, third and even some first stage test results might have too high p′ values so that they cannot be included in the plot. As a result some of the test results (especially the third stage) might be missing.
H Y WONG
52HKIE Transactions | Volume 27, Number 1, pp.48–54
To evaluate the most appropriate soil shear strength parameters (φ', c') for design, a new method other than those discussed has been introduced (Wong, 1982). In contrast to most previous methods of analysis, it is the median (φ', c') values instead of the mean (φ', c') values that will be adopted. By definition, any design line with design parameters (φ', c') will have these (φ', c') values as the median values if, within the range of p′, the number of test points above the design line is equal (or nearly equal) to the number of test points below it.
In Hong Kong, the (φ', c') values mostly adopted are the following typical sets. For fill/colluvium, with φ' in degree and c' in kPa, the likely sets are: (30, 0), (33, 0), (35, 0), (35, 2), (37, 5), (39, 5), (40, 0) and (42, 0). As for C/HDG, these are (35, 2), (35, 5), (36, 6), (37, 7), (38, 8), (40, 10), (42, 12), and (45, 15). An important point to note is that the median values will change with the range of p′ values. In the present study with a lot of multi-stage tests, the median values within the higher range of p′ values will be somewhat lower. This is because the soil shear strength tends to decrease with each stage of shearing.
There are in general two approaches of determining these median (φ', c') values. The first is to use the computer to input the co-ordinates of the test results and the probable design median (φ', c') lines into the computer. Then devises a computer programme to compare the test results above the specific design line with those below it. By trial and error, the true median (φ', c') values can be determined with successive trial of different specific design lines. This will be suitable when a lot of data is involved. The second approach is a manual one and is suitable when only a limited amount of data is involved. By plotting the probable design sets onto a transparent paper and overlaying this paper on the test results, the most probable design (φ', c') values can be estimated.
For a more conservative design, the number of test points above the proposed design set can be increased to 60% (or even 70%) of the total number of test points. In this case, these (φ', c') values in the proposed design set are no longer the median values. In the present study, it will be the median values that will be adopted for the design.
The advantage of this method over the previous ones is that this can avoid the effect of the presence of a few extraordinarily high or low results. In previous methods using the “Method of Least Squares”, the (φ', c') values thus calculated will be affected very considerably by a few extraordinarily high or low results.
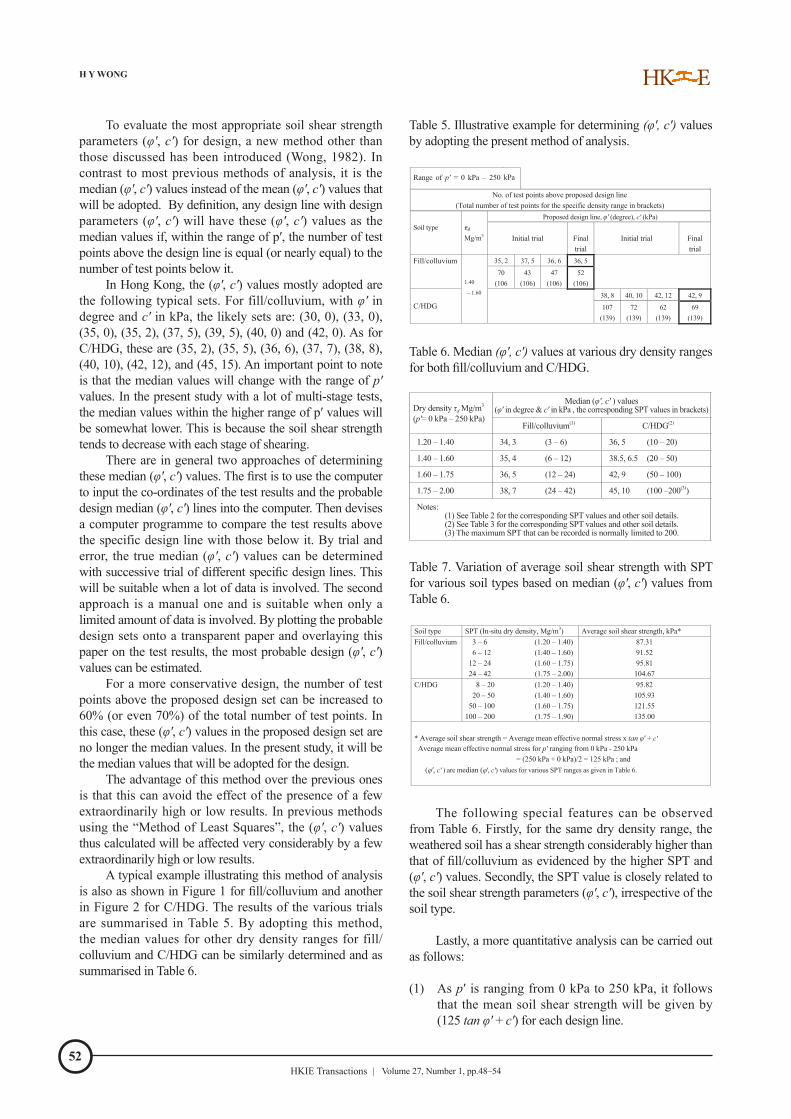
A typical example illustrating this method of analysis is also as shown in Figure 1 for fill/colluvium and another in Figure 2 for C/HDG. The results of the various trials are summarised in Table 5. By adopting this method, the median values for other dry density ranges for fill/colluvium and C/HDG can be similarly determined and as summarised in Table 6.
Table 5. Illustrative example for determining (φ', c') values by adopting the present method of analysis.
17
Table 5. Illustrative example for determining ( ', c') values by adopting the present method of analysis.
Range of p = 0 kPa – 250 kPa
No. of test points above proposed design line (Total number of test points for the specific density range in brackets)
Soil type
d
Mg/m3
Proposed design line, ' (degree), c' (kPa)
Initial trial
Final trial
Initial trial
Final trial
Fill/colluvium
1.40
– 1.60
35, 2 37, 5 36, 6 36, 5
70 (106
43 (106)
47 (106)
52 (106)
C/HDG
38, 8 40, 10 42, 12 42, 9
107 (139)
72 (139)
62 (139)
69 (139)
Table 6. Median ( ', c') values at various dry density ranges for both fill/colluvium and C/HDG. Dry density
d Mg/m3
(p = 0 kPa – 250 kPa)
Median ( , c' ) values ( ' in degree & c' in kPa , the corresponding SPT values in brackets)
Fill/colluvium(1) C/HDG(2)
1.20 – 1.40 34, 3 (3 – 6) 36, 5 (10 – 20) 1.40 – 1.60 35, 4 (6 – 12) 38.5, 6.5 (20 – 50) 1.60 – 1.75 36, 5 (12 – 24) 42, 9 (50 – 100) 1.75 – 2.00 38, 7 (24 – 42) 45, 10 (100 –200(3)) Notes:
(1) See Table 2 for the corresponding SPT values and other soil details. (2) See Table 3 for the corresponding SPT values and other soil details. (3) The maximum SPT that can be recorded is normally limited to 200.
Table 6. Median (φ', c') values at various dry density ranges for both fill/colluvium and C/HDG.
Dry density τd Mg/m3 (p′= 0 kPa – 250 kPa)
Median (φ′, c' ) values (φ' in degree & c' in kPa , the corresponding SPT values in brackets)
Fill/colluvium(1) C/HDG(2)
1.20 – 1.40 34, 3 (3 – 6) 36, 5 (10 – 20)
1.40 – 1.60 35, 4 (6 – 12) 38.5, 6.5 (20 – 50)
1.60 – 1.75 36, 5 (12 – 24) 42, 9 (50 – 100)
1.75 – 2.00 38, 7 (24 – 42) 45, 10 (100 –200(3))
Notes: (1) See Table 2 for the corresponding SPT values and other soil details. (2) See Table 3 for the corresponding SPT values and other soil details. (3) The maximum SPT that can be recorded is normally limited to 200.
Table 7. Variation of average soil shear strength with SPT for various soil types based on median (φ', c') values from Table 6.
18
Table 7. Variation of average soil shear strength with SPT for various soil types based on median ( ', c') values from Table 6.
Soil type SPT (In-situ dry density, Mg/m3) Average soil shear strength, kPa*Fill/colluvium 3 – 6 (1.20 – 1.40)
6 – 12 (1.40 – 1.60)12 – 24 (1.60 – 1.75)24 – 42 (1.75 – 2.00)
87.3191.5295.81104.67
C/HDG 8 – 20 (1.20 – 1.40)20 – 50 (1.40 – 1.60)
50 – 100 (1.60 – 1.75)100 – 200 (1.75 – 1.90)
95.82105.93121.55135.00
* Average soil shear strength = Average mean effective normal stress x tan φ + c'Average mean effective normal stress for p ranging from 0 kPa - 250 kPa
= (250 kPa + 0 kPa)/2 = 125 kPa ; and( , c' ) are median ( ', c') values for various SPT ranges as given in Table 6. φ φ
The following special features can be observed from Table 6. Firstly, for the same dry density range, the weathered soil has a shear strength considerably higher than that of fill/colluvium as evidenced by the higher SPT and (φ', c') values. Secondly, the SPT value is closely related to the soil shear strength parameters (φ', c'), irrespective of the soil type.
Lastly, a more quantitative analysis can be carried out as follows:
(1) As p′ is ranging from 0 kPa to 250 kPa, it follows that the mean soil shear strength will be given by (125 tan φ' + c') for each design line.

HKIE Transactions | Volume 27, Number 1, pp.48–5453
(2) Each dry density range for a given soil type has a certain design line and a certain range of N values.
(3) For example, from Table 6 for fill/colluvium, with a SPT ranging from 3 to 6 the corresponding median (φ', c') values are (34, 3). These will yield an average soil shear strength equal to (125 tan 34 + 3) = 87.3 MPa.
(4) Combining (1) , (2) and (3) , a plot t ing of (125 tan φ' + c') versus N can be carried out as shown in Figure 3 for each SPT range.
(5) By assuming the average shear strength to remain the same throughout the same SPT range considered, a block diagram can be obtained for both fill/colluvium and C/HDG as shown in Figure 3.
(6) By joining the mid-point of each block, it can be seen that a basically smooth curve can be obtained for both fill/colluvium and C/HDG. Moreover, the lower part of the C/HDG curve tends to coincide with the upper part of the fill/colluvium one. All these do indicate that the soil shear strength can be correlated quantitatively to the SPT.
12
Figure 3. Variation of average soil shear strength with SPT for p' = 0 kPa - 250 kPa for both fill/colluvium and C/HDG.
The results in Figure 3 do suggest that a single curve relating soil shear strength to SPT can be established for each p′ value. It can be expected that with a set of p′ values, a set of such curves can be obtained.
6. Conclusions
Based on the huge database developed in PWCL for collecting and processing a sufficiently large number of both in-situ and laboratory testing data, it is possible to classify the various soil types in Hong Kong into various soil groups, each with a certain range of dry density and SPT values. By plotting the triaxial test results in each dry density sub-group in the form of deviator stress (q) versus effective mean normal stress (p′), the average (φ', c') values for this specific sub-group can be estimated.
In order to obtain a more realistic average soil shear strength for each dry density range, a new method of analysis has been introduced in the present paper by adopting the median (φ', c') values instead of the mean values. In each plot, any design parameters (φ', c') will have these values as
the median values if, within the range of p′, the number of test points above the design line is equal (or nearly equal) to the number of points below it.
The processing of the dry density, SPT and shear strength data for various soil types as summarised in Tables 2 - 6 does indicate that these parameters are closely related. In general, with the increase in dry density, both the SPT and shear strength will be increased. However, the rate of increase is not the same. The preliminary analysis carried out so far does indicate one special feature that for the same dry density range, both the SPT and shear strength will be different for different types of soil. However, for the same SPT range, the shear strength for different soil types will be of the same order and these can be correlated quantitatively with SPT as indicated in Figure 3. Bearing in mind that SPT is a simple site operation for practically all soil types, the above special feature will be of particular importance for slope stability analysis as the soil shear strength profile can then be easily established irrespective of the soil type and dry density.
7. Recommendations for future works
The preliminary analysis in the present investigation indicates that future slope works can be considerably simplified. However, before such implementation, further works are certainly necessary. These comprise firstly a more detailed analysis of the numerous data collected so far, including:
(1) For each soil type and each sub-density group, carry out the q versus p′ plot at closer p′ intervals of the following order say: (a) 0 kPa - 50 kPa; (b) 50 kPa - 125 kPa; (c) 125 kPa - 250 kPa; (d) 250 kPa - 450 kPa; and (e) 450 kPa - 700 kPa.
(2) In each plot, determine the median (φ', c') values by the method as proposed in the present paper. For example, for p′ range from 50 kPa - 125 kPa, the average p′ within any dry density interval is equal to (50 kPa + 125 kPa)/2 = 87.5 kPa. The average soil shear strength is (87.5 tan φ' + c').
(3) As each dry density range for a given soil type is equivalent to a certain SPT range as shown in Tables 4 and 6, it follows that a plotting of (87.5 tan φ' + c') versus SPT can be carried out as shown in Figure 3. By varying the average p′ values, a set of design curves each with a different p′ value can be obtained similar to that in Figure 3.
Secondly, the above analysis can be applied to actual slope stability work as follows:
(1) Carry out a sufficient number of SPT operations in the slope area under consideration to obtain the SPT profile.
(2) Estimate a probable slip surface and divide the area

H Y WONG
54HKIE Transactions | Volume 27, Number 1, pp.48–54
enclosed into a number of vertical slices. To estimate the mean effective normal stress (p′) in each slice, assume
p′ = ⅓ (σz + σx + σy); σz = effective overburden stress = τ′ z; τ′ = effective soil bulk density; and z = overburden depth. As a first approximation, assume the horizontal
stresses along the x and y directions are σx = σy = 0.5 σz , thus yielding p′ = ⅔ σz = ⅔ effective overburden stress (3) With a knowledge of p′ and SPT, the average mean
shear strength of the slice under consideration can be estimated from a figure similar to Figure 3 in which a set of average shear strength versus SPT curves are present, each with a different p′ value.
(4) By increasing the number of SPTs, the number of slices in any slip can be increased, thus resulting in a refinement of the slope stability analysis.
Last but not least, in order to ultilise fully the numerous data so far collected and processed, the following analysing works should also be carried out in addition to the q versus p′ plot at closer p′ intervals:
(1) Repeat the present analysis also on volcanic soils as these cover 50% of the total areas in Hong Kong.
(2) To be complete for Hong Kong soils, the other less abundant soil types such as granodiorite, metamorphic and sedimentary rocks should also be analysed. However, for a comprehensive analysis to be carried out, existing data such as SPT and triaxial testing are certainly inadequate for such soils and further site investigation and laboratory testing works are required.
(3) Fill/colluvium test results in the present preliminary analysis can only include those more granular MD and ALL. For the more clayey parts, it is the short-term shear strength that has to be considered. A quick way of determining the short-term shear strength (cu) is by the Torvane method, the detailed operation is as described in Head (Head, 1986).
Notes on contributors
Dr Wong Hong Yau received his B.Sc. (Eng) and M.Sc. (Eng) degrees in the University of Hong Kong and his Ph.D. degree from McGill University in Canada. He worked in the UK in the early 1970s as a research and development engineer in various engineering fields such as piling, foundation, tunnelling,
ground improvement and instrumentation. Since the late 1970s, he has been working in Hong Kong in the field of civil engineering involving piling, foundation, geotechnical engineering and laboratory testing. Moreover, he has been engaged in various disciplines such as consultant, specialist contractor, checking authority and part time lecturer in university. He is currently a Consulting Civil Engineer at Geotech Engineering Limited.
References
[1] Geotechnical Engineering Office (2007). Engineering Geological Practice in Hong Kong. Hong Kong: Civil Engineering and Development Department (CEDD), the HKSAR Government, pp. 278.
[2] Head KH (1986). Manual of Soil Laboratory Testing Volume 3 effective stress tests. New York: Halsted Press. pp. 743-1238.
[3] Skempton AW (1986). Standard penetration test procedures and the effects in sands of overburden pressure, relative density, particle size, ageing and over consolidation. Geotechnique, 36(3), pp. 425-447.
[4] Wong HY (1982). An evaluation of various methods of triaxial testing and analysis for residual soils in Hong Kong. In: Proceedings of the Seventh Southeast Asian Geotechnical Conference. Hong Kong: Southeast Asian Geotechnical Society, pp. 901-913.
[5] Wong HY (2013). Particle density of Hong Kong soils: A theoretical and experimental study. HKIE Transactions, 20(2), pp. 79-91.
[6] Wong HY (2015). Site investigation: Its practices in Hong Kong and applications to foundation design. Operation Manual (Technical) No. : ASD 9/92000/GEN/G/TOM/3.
19
Notes on Contributor
Dr Wong Hong Yau received his B.Sc. (Eng) and M.Sc. (Eng) degrees in the University of Hong Kong and his Ph.D. degree from McGill University in Canada. He worked in the UK in the early 1970s as a research and development engineer in various engineering fields such as piling, foundation, tunnelling, ground improvement and instrumentation. Since the late 1970s, he has been working in Hong Kong in the field of civil engineering involving piling, foundation, geotechnical engineering and laboratory testing. Moreover, he has engaged in various disciplines such as consultant, specialist contractor, checking authority and part time lecturer in university. He is currently a Consulting Civil Engineer at Geotech Engineering Limited.