An Investigation of Interrater Reliability in Oral Testing
8
Res. Rep. Nagaoka National Coll. Tech. Vol.35, No.2 (1999) An Investigation of Interrater Reliability in Oral Testing Gregory Hadley and Jerry M ort 平 成 11 年 10 月
Transcript of An Investigation of Interrater Reliability in Oral Testing

Res. Rep. Nagaoka National Coll. Tech. Vol.35, No.2 (1999)
An Investigation of Interrater Reliability in Oral Testing
G regory H a d le y and Jerry M o r t
平 成 1 1 年 1 0 月

Res. Rep. Nagaoka National Coll. Tech. Vol.35,No.2(1999)
Paper
An Investigation of Interrater Reliability in Oral Testing
G regory H adley and Jerry M ort
N agaoka N ational College of T echnology Septem ber 6 ,1999
Abstract
This report examines the interrater reliability of oral communication tests at Nagaoka National College of Technology. The procedure, research instrument, analysis, results and the measures that need to be taken in order to bolster reliability will be discussed. The findings of this report suggest that considerable negotiation between examiners is necessary before highly significant levels of interrater reliability can be reached.
Introduction
An emphasis upon the testing of spoken English as a foreign language has steadily increased over the past several years in Japanese Colleges and Universities.1 Because of this trend, a number of methods for testing students in their oral communicative ability have been included in the classroom. One important issue which needs consideration when creating oral tests is that of interrater reliability. Interrater reliability, as defined by Weir, measures the consistency of scoring between different raters.2 As it relates to this study, interrater reliability is the degree of correlation between two or more examiners, with the goal of determining whether they are using the same set of criteria when testing the oral proficiency of their learners. If the level of reliability between two or more examiners reaches the level of significance, this may indicate that students in different classes are receiving fair treatment in terms of testing. This paper, which
should be considered a “work-in-progress”,
examines the interrater reliability of the oral communication tests at Nagaoka National College of Technology. The procedure, analysis, results and the measures that need to be taken in order to bolster reliability and validity will also be discussed.
Method
In this section, we will discuss the subjects, materials used in the testing of the subjects, and the procedures taken to insure interrater reliability* *. This study was conducted by correlating and comparing the scoring of the two authors, who are presently engaged in the administration of oral tests at Nagaoka National College of Technology. The class chosen to participate in this research was a high school level Oral Communication course designed to encourage fluency in the target language. The subjects were also chosen because their class has
Received September • 3 •丄999.*Department of Generai Education Nagaoka National College of Technology)
— 45 —

Gregory HADLEY and Jerry MORT
been split into two equal groups (Groups A and B) due to the large number of students in the class this year. This is not a normal occurrence at this school, and there has concern among teachers about how to assure that both groups of students are receiving the same level of instruction in all their classes. The authors are presently the only members of the teaching staff engaged in oral testing, and represented the total population of examiners for this study.
Subjects
The subjects chosen to participate in the oral testing segment of this study were Group A of the
second year Japanese students (n = 28) in the Materials Engineering Department at Nagaoka National College of Technology. Most of the subjects were raised and educated in cities and villages within Niigata Prefecture. This group was considered homogenous in terms of age, mother tongue, academic status and cultural background. Most of the learners appear to be false beginners in terms of oral proficiency. The two examiners themselves formed a small but a very homogenous group in terms of age, educational level, language, social upbringing, race, and sex.
Figure 1
Speaking Test Evaluation SheetName___
Student Number
Class
3 Communicative Ability Includes length of utterances, Flexibility to speakers of differing levels. Complexity of responses, (x 6)
Scale0 - 1 - 2 - 3 - 4 - 5
I) Fluency
q Vocabulary:
(J Nonverbal Strategies:
Pronunciation
Appropriate Speed, Pauses, and Discourse Stategies. (x 4)
Did the student use a wide variety of words and phrases, or use new vocabulary learned in class? (x 3)
Did the student supplement oral communication with appropriate gestures, eye contact and body language?
How accurate and appropriate was the student's grammar (x2)
Was effort made to use correct intonation, or was the accent a
0 - 1 * 2 - 3 - 4 - 5
0 » 1 » 2 » 3 # 4«5
0 # 1 « 2 « 3 * 4*5
0 • ! « 2 - 3 - 4 - 5
0 - 1 - 2 * 3 - 4*5( x 2 )
Scoring Guid
0 - 1 5 : R e p e a t e d l y c o m m u n ic a t e s in f i r s t la n g u a g e o r u s e s
f i r s t l a n g u a g e s t r a t e g i e s
6 0 - 6 9 % : L e a r n e r e m a k in g a s i n c e r e a t t e m p t to
c o m m u n ic a l c . A lth o u g h d i s c o u r s e c a u s e s c o g n i t iv e s tr a in
f o r a n a tiv e s p e a k e r , h e / s h e c a n u n d e r s t a n d m o s t o f w h a t is
s a id .
1 6 % - 2 9 % : U n in t e l l i g b l c a n d in c o h e r e n t . 7 0 - 7 9 % : G o o d c o m m u n ic a t i v e a b il i ty . F a ir ly f lu e n t , u s e s
n e w v o c a b u la r y , g r a m m a r & p r o n u n ic a t io n a re a d e q u a te .
3 0 % - 4 9 % : M o s t l y u n in t c l l i g b l c . H o w e v e r , a n a t iv e
s p e a k e r m i g h t u n d e r s t a n d s o m e c f w h a t l e a r n e r is s a y in g ,
b u t o n ly a f te r c o n s i d e r a b l e c fF orL
8 0 - 8 9 % : S u p e r io r c o m m u n ic a t i v e a b i l i y a n d f lu e n c y .
U s e s n e w v o c a b u la r y , m o s t l y a c c u r a t e g r a m m a r &
p r o n u m c i a t i o n , g o o d u s e o f n o n - v e r b a l s t r a te g ic s .
5 0 % • 5 9 % : S o m e w h a t u n d e r s t a n d a b le . D i s c o u r s e s e e m s
n o n - c o m m u n ic a l iv c a n d m e m o r i z e d o n ly f o r t h e
e x a m in a t io n .
9 0 • 1 0 0 % : E x c e l le n t c o m m u n ic a t i v e a b i l i y . L a n g u a g e
s k il ls a re n o lo n g e r a b a r r i e r t o c o m m u n ic a t i o n .
— 46 —

An Investigation of Interrater Reliability in Oral Testing
Materials
The text used for this course was Communicate.3 From our experience with the learners at this school, this text is well matched to their level of oral communicative ability.
Test questions were taken directly from the textbook, and were made in the form of cue cards that students would draw at random and ask others in their group. The tool used for measuring the students’ oral proficiency was developed in-house by the first author. It represents a composite of elements from the Cambridge PET and KET testing tools, testing instruments used at the Kanda University of International Studies, and the suggestions for speaking tests in the book by Cohen.4 An example of the testing sheet can be seen in Figure 1.
The internal reliability of the testing instrument was investigated using the split-half method. The odd rating bands were divided from the even-numbered rating bands, and then correlated using the Pearson r correlation coefficient. The reliability for this test came to +0.54. This would be an unacceptable level of internal reliability for an objective test such as a multipie-choice test. However, Heaton explains that lower levels of internal reliability in instruments that measure oral communicative ability are not only inevitable (due to the numerous uncontrolled variables in both the students and the environment), but a moderate level of internal reliability is actually preferable.5 For an oral test to have a high level of internal reliability, it would need discreet, direct and objective questions that would require equally discreet answers, which then could be determined to be either 100% correct or incorrect. Questions such as these would likely disrupt opportunities for authentic communication on a speaking test and thus destroy the test’s validity. Therefore, with Heaton, we feel that a superior instrument that measures oral proficiency should be moderately reliable and highly valid.6 Dependent on whether one accepts the split-half method as a truly valid method for determining the reliability of this test, we believe that the materials used in
this study may be sufficiently reliable for our purposes at Nagaoka National College of Technology. An internal reliability measure of +0.54 suggests that the test may be flexible enough to allow true communicative expression to take place. We also feel the test contains a level of face validity, mainly because it was designed and weighted to measure aspects of oral communicative ability regularly encouraged in class. To strengthen the claim for content validity, all of the questions were taken from textbook activities that the students participated in while in class, and represented a fair sample of what was presented and taught in the course.
Procedures
Before the beginning of the first semester in s p r in g ,1999, the second author was trained in the procedure for administering this speaking test. Three fourth year students at the Nagaoka National College of Technology posed as practice subjects. The procedure was taught as follows*• Groups of three students enter the room and
take their seats.• The examiner asks the students to choose two
cue cards, which contain discussion questions from the textbook.
• Each student asks one of the other people a question from the two question cards that he or she has chosen. The student who is questioned then reflects the same question back (“how about you?” or “What do you think?”) .
• After answering, the student then asks the second question card to the other person in the group, who answers and again reflects the question back.
• This process is continued by the two other students, so that each person has the possibility of up to six different opportunities to speak and respond to another in English.
• However, the time limit is normally limited to five minutes a group, so depending upon the fluency of the members, often less than six verbal exchanges take place.The second author went through this process
— 47
Gregory HADLEY and Jerry MORT
two times with the practice subjects, and graded them using the evaluation instrument in Figure 1. The first author also graded the practice subjects. Differing scores were then discussed, as well as possible ways to make our rating more consistent with each other.
During the first semester, in preparation for the speaking test, the second author (who was the classroom teacher for Group A) prepared the students by verbally explaining to them in English about the requirements of the test. He also led the entire class to form groups and participate in a series of practice tests the week before. On the day of the actual test, the second author conducted the tests and rated the learners. The
first author sat off at a distance and rated the learners as well. Testing the entire group of learners took approximately 50 minutes. To avoid contaminating the data, the scores of the students were not discussed between us until after all the students had taken the test and the grades of each student had been individually determined.
Results
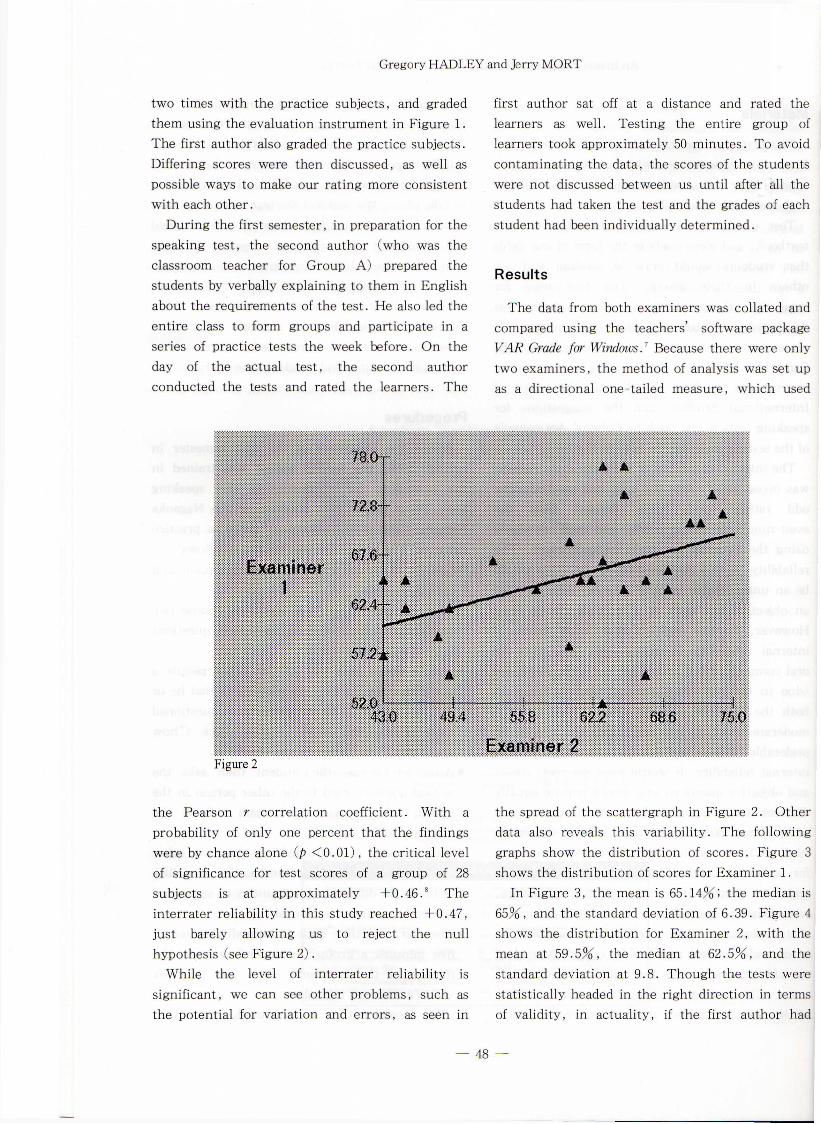
The data from both examiners was collated and compared using the teachers’ software package VAR Grade for Windows.7 Because there were only two examiners, the method of analysis was set up as a directional one-tailed measure, which used
Examiner
Figure 2
the Pearson r correlation coefficient. With a probability of only one percent that the findings were by chance alone (p < 0 .0 1 ) ,the critical level of significance for test scores of a group of 28 subjects is at approximately +0.46.8 The interrater reliability in this study reached +0.47, just barely allowing us to reject the null hypothesis (see Figure 2).
While the level of interrater reliability is significant, we can see other problems, such as the potential for variation and errors, as seen in
the spread of the scattergraph in Figure 2. Other data also reveals this variability. The following graphs show the distribution of scores. Figure 3 shows the distribution of scores for Examiner 1.
In Figure 3, the mean is 65.14% ; the median is 65% f and the standard deviation of 6.39. Figure 4 shows the distribution for Examiner 2, with the mean at 59.5%, the median at 62.5%, and the standard deviation at 9.8. Though the tests were statistically headed in the right direction in terms of validity, in actuality, if the first author had
— 48 —

An Investigation of Interrater Reliability in Oral Testing
Numberof
students
ExarBiner 1 Modian
Figure 3
Numberof
students
Figure 4
been the classroom teacher, a greater number of students would not have passed the test. These findings also beg the question of whether or not the other group of second year students taught by the first author, Group B, might be measured by a stricter standard. It is likely that their grades would be higher, were they in Group A.
Discussion
We were surprised and quietly disappointed with these uninspiring findings. All of the data suggested that we still had a lot to talk about and negotiate before being able to increase the level of reliability in our grading. In discussing the possible causes for these results, we came to the following conclusions*
— 49 —

Gregory HADLEY and Jerry MORT
• Despite earlier practice, the first time nature of the actual testing session caused the second author to experience a slight lack of confidence and feelings of distraction.
• The subjective nature of an oral communication test may have had a part in the wide variance of scores. The scoring bands and their meaning need to be made more explicit.
• Related to this point, it was discovered that the first author used a basic criterion of “would a Native Speaker, (such as the type living in the Midwestern part of the United States), who is unaccustomed with Japanese speech patterns and mannerisms, be able to understand this student?” The second author’s approach was more akin to, “Based upon my experience of living in Japan for eight years, can I understand what this student is trying to say?”We concluded that, despite the attempt at
training in the procedure of testing and discussing ways to make the test scores similar, we were not explicit in our basic pedagogic criteria for rating students. After some debate on the pros and cons of both criteria, we worked out a middle ground between the two, which was stated as, “will a native speaker of English, who is sincerely open to communicating with Japanese, be able to understand what the student is trying to say, even though he or she is mostly unaccustomed with Japanese mannerisms and speech patterns?”
As stated earlier, it was discovered that the scoring bands are not as explicit as previously thought. In the past, this testing instrument was used only by its creator, who clearly understood the meaning of the scoring bands. As more people begin to use this instrument, the difference between a student who makes a “5” as opposed to a “3” will need to made clearer. With relation to the use of the scoring bands, we learned that at the beginning of the test, one examiner began rating all of the learners automatically at 60%, (usually “3” on the scale, see again Figure 1), and then moving either up or down the scale based upon their performance in the test. The other examiner went on first impressions, whether high or low, and moved up or down
according to the student’s overall test performance. It was decided that on future tests, we would both start at 60%, and adjust the grade accordingly.
We also identified a number of weaknesses in the study itself. One was the method of determining the test’s internal reliability.Although the split-half method is used with success with many more objective test designs, it is not certain if our test instrument can be measured objectively. We suspect that this instrument is more organic in nature, and cannot be easily separated into different parts. If time allows, test-retest will be used to determine the internal reliability of this test. This may provide a clearer and fairer measure of the test’ s internal reliability as a means of measuring oral communicative ability.
Yet, even if these conditions are satisfied, there is also the problem of only having two examiners for testing interrater reliability. It would be better if we could have had more examiners involved in this study. More examiners would likely increase the validity of this research.
Nevertheless, rather than seeing this study as a failure, we are encouraged that the preliminary results of our research have helped us to come to some important decisions about what to do for the next battery of oral communication tests. We believe that these decisions, coupled with a better understanding of the other s pedagogical stance, will help to bolster the level of interrater reliability. Future research will seek to determine the reliability of the speaking test itself, and also seek to ascertain if the added insight gained from the discussions between the examiners actually has increased the level of interrater reliability. If so, as stated earlier in this paper, stronger claims to validity might then be made, and perhaps then this oral testing methodology can be confidently applied to other EFL classes within the school.
一 50 —

An Investigation of Interrater Reliability in Oral Testing
References
1 . Hadley, G . (1999). Innovative Curricula in Japanese ELT. ELT Journal 53/2- 92-99. Oishi, T ., M. Fukuda, T. Sasaki, T. Karibe, T. Aki, K. Sato, and S. Takahashi (1996). Activation of English courses in general education and promotion of a students’ positive attitude. Niigata University Annual Educational Research Bulletin 2- 49-67. Fukuda, K ., and M. Sasaki. (D ecem ber,1995). Task Group Report on Immersion Programmes. Paper presented at the Niigata University General Education and Language Research Group, Niigata City, Japan.Otsubo, H . (1995). Japan* s Higher Education
and Miyazaki International College: Problems and Solutions. Comparative Culture: The Journal of Miyazaki International College 1:1-10.
2. Weir, C . (1990). Communicative Language Testing. Hemel Hempstead^ Prentice H a ll,p . 32.
3. Paul, David (1995). Communicate Student Book. Oxford^ Heinemann.
4 . Delarche, M ., and N. Marshall (1996). Communicative Oral Testing. In On J A L T ,95: Curriculum and Evaluation. G. van Troyer, S. Cornwell, and H. Morikawa (Eds.) Tokyo: The Japan Association of Language Teaching. Cohen, A. (1994). Assessing Language Ability in the Classroom. Boston, MA* Heinle and Heinle Publishers, pp. 281-292. Fried-Booth, D ., and L. Hashemi (1992) PET Practice Tests 2. Cambridge- Cambridge University Press.
5. Heaton, J.B. (1997). Writing English Langmge Tests. New York^ Longman, pp. 164-165.
6 . Ibid., pp. 164-65.7. Revie, D . (1997). VAR Grade for Windows 2.0:
Grading Tools far Teachers. Thousand Oaks, CA* VARed Software.
8. Hatch, E. and A. Lazaraton (1 9 9 1 ).The Research Manual: Design and Statistics for Applied Linguistics • Boston • Heinle and Heinle, p. 604.14


![Testing Testing [Read-Only] - Czone - East Sussex](https://static.fdokumen.com/doc/165x107/6327b2a26d480576770d6757/testing-testing-read-only-czone-east-sussex.jpg)