Testing the reliability of the standard and complementary DNA ...
48
Testing the reliability of the standard and complementary DNA barcodes for the monocot subfamily Alooideae from South Africa Barnabas H. Daru 1,2, *, Michelle van der Bank 3 , Abubakar Bello 4 , and Kowiyou Yessoufou 5 1 Department of Organismic and Evolutionary Biology and Harvard University Herbaria, Harvard University, Cambridge, MA 02138, USA 2 Department of Plant Science, University of Pretoria, Private Bag X20, 0028 Hatfield, Pretoria, South Africa 3 African Centre for DNA Barcoding, University of Johannesburg, APK Campus, PO Box 524, Auckland Park 2006, Johannesburg, South Africa 4 Bolus Herbarium, Biological Sciences Department, University of Cape Town, Private Bag X3, Rondebosch 7700, South Africa 5 Department of Environmental Sciences, University of South Africa, Florida Campus, Florida 1710, South Africa *Corresponding author Corresponding author’s e-mail address: [email protected] Corresponding author’s mailing address: Department of Organismic and Evolutionary Biology and Harvard University Herbaria, Harvard University, Cambridge, MA 02138, USA 1
-
Upload
khangminh22 -
Category
Documents
-
view
0 -
download
0
Transcript of Testing the reliability of the standard and complementary DNA ...
Testing the reliability of the standard and complementary DNA barcodes for
the monocot subfamily Alooideae from South Africa
Barnabas H. Daru1,2,*, Michelle van der Bank3, Abubakar Bello4, and Kowiyou
Yessoufou5
1 Department of Organismic and Evolutionary Biology and Harvard University
Herbaria, Harvard University, Cambridge, MA 02138, USA
2 Department of Plant Science, University of Pretoria, Private Bag X20, 0028
Hatfield, Pretoria, South Africa
3 African Centre for DNA Barcoding, University of Johannesburg, APK Campus, PO
Box 524, Auckland Park 2006, Johannesburg, South Africa
4 Bolus Herbarium, Biological Sciences Department, University of Cape Town,
Private Bag X3, Rondebosch 7700, South Africa
5 Department of Environmental Sciences, University of South Africa, Florida
Campus, Florida 1710, South Africa
*Corresponding author
Corresponding author’s e-mail address: [email protected]
Corresponding author’s mailing address: Department of Organismic and
Evolutionary Biology and Harvard University Herbaria, Harvard University,
Cambridge, MA 02138, USA
1
ABSTRACT
Although a standard DNA barcode has been identified for plants, it does not always
provide species-level specimen identifications for investigating important ecological
questions. In this study, we assessed the species-level discriminatory power of the
standard (rbcLa + matK) and complementary barcodes ITS1 and trnH-psbA within
the subfamily Alooideae (Asphodelaceae), a large, recent plant radiation whose
species are important in horticulture yet are threatened. Alooideae has its centre of
endemism in southern Africa with some outlier species occurring elsewhere in Africa
and Madagascar. We sampled 360 specimens representing 235 species within all 11
genera of the subfamily. Applying three distance-based methods, all markers
perform poorly for our combined dataset with the highest proportion of correct
species-level specimen identifications of 30% found for ITS1. However, assessing
the performance across genera, the discriminatory power varies from 0% for all
single markers and combinations in Gasteria to 63% in Haworthiopsis, again for
ITS1, suggesting that DNA barcoding success may be related to the evolutionary
history of the lineage considered. Although ITS1 could be a good barcode for
Haworthiopsis, the generally poor performance of all markers suggests that the
Alooideae remains a challenge. As species boundaries within Alooideae remains
controversial, we therefore call for continued search of suitable markers, or the
usage of genomics approaches, that can enable species discrimination in the group.
KEYWORDS: Asphodelaceae, barcoding gap, barcode candidates, DNA barcoding,
specimen identification.
2

INTRODUCTION
The alooids subfamily Alooideae (Asphodelaceae) is a group of rosulate
succulents comprising 11 genera (Table 1). Early taxonomic studies of Alooideae are
based on morphological characters (e.g. floral traits, size, shape, arrangement, and
combination of leaves and markings; Smith and van Wyk 1991). Taxonomic
classification and the study of species boundaries have a long and illustrious history,
including taxon-based works by Linnaeus (1753), Duval (1809), Salm-Dyck (1836-
1863), Uitewaal (1947), and karyotype-based studies by Taylor (1925), among
others, as well as a number of more recent studies, such as those by Smith and van
Wyk (1991) and Klopper et al. (2010). These studies have led to taxonomic changes
on several occasions; even recent studies that combine morphology and DNA-based
phylogeny to reassess taxa delimitation within the subfamily (Daru 2012; Daru et al.
2013; Manning et al. 2014a) still found some pitfalls that led to taxonomic change
(Manning et al. 2014a). However, there is an increasing interest in the use of
phylogenetic data to disentangle the evolutionary relationships within the subfamily
in addition to, or in support of, the morphology-based observed patterns (Treutlein et
al. 2003a, b; Ramdhani et al. 2011). Although these studies provide useful insights
into our understanding of the taxonomy of the subfamily, they are often based on
sparse taxonomic sampling, and the phylogeny reconstructed is still unresolved. This
lack of resolution is problematic if we are to discriminate between the over 500
species described in the subfamily, but we note that a fully resolved phylogeny is not
necessarily needed for accurate specimen identification to species level.
In an attempt to provide a better understanding with regard to evolutionary
relationships within the group, a more recent study (Daru et al. 2013) combined
molecular and morphological data to raise some important pitfalls in the current
3
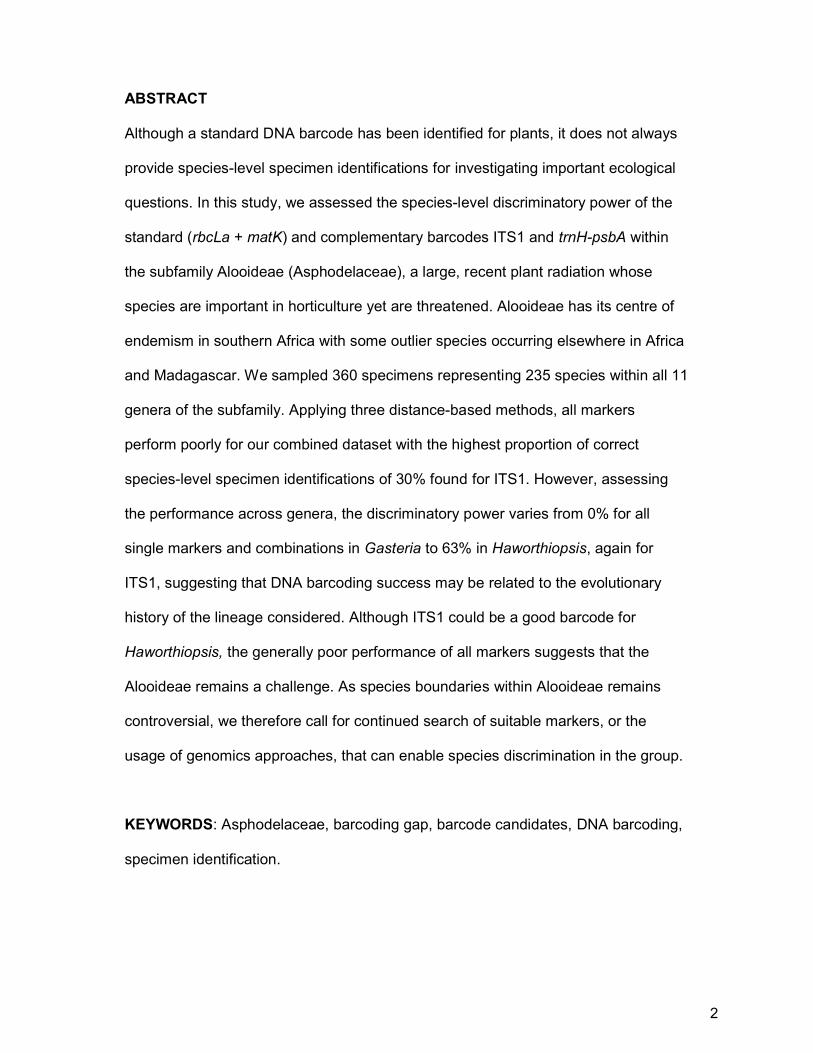
Table 1. Summary of global richness of species within Alooideae genera versus total
number of species sampled in this study (indicated in parenthesis).
Genus Number of
currently
known species
in the genus
Number of
species and
number of
samples
Percentage
of sampling
completeness
References
Aloe L. ca. 400 150 (214) 38% Reynolds (1966),
Viljoen (1999),
Glen and Hardy
(2000), Klopper
and Smith
(2007)
Aloiampelos
Klopper & Gideon
F.Sm.
7 5 (7) 71% Grace et al.
(2013)
Aloidendron
(A.Berger)
Klopper & Gideon
F.Sm.
7 5 (12) 71% Grace et al.
(2013)
Aristaloe Boatwr.
& J.C. Manning
1 1 (3) 100% Manning et al.
(2014a)
Astroloba
Uitewaal
6 6 (9) 100% Roberts
Reinecke (1965),
Groen (1987)
Gasteria Duval 23 18 (20) 78% Duval (1809);
Van Jaarsveld
(2007)
Gonialoe (Baker)
Boatwr. & J.C.
Manning
3 1 (2) 33% Manning et al.
(2014a)
Haworthia Duval 42 32 (52) 76% Bayer (1999)
Haworthiopsis
G.D. Rowley
18 12 (30) 67% Rowley (2013)
Kumara Medik. 2 1 (3) 50% Glen and Hardy
(2000)
Tulista Raf. 4 4 (8) 100% Rowley (2013)
4
classification (e.g. homoplasious characters, morphological traits not consistent
enough to distinguish species within the genera, etc.), prompting the need for a new
treatment of the subfamily (e.g. re-circumscribing the Alooideae genera into
monophyletic entities; see Grace et al. 2013; Manning et al. 2014a). Given these
pitfalls and this new treatment, identifying species within Alooideae becomes even
more problematic.
The subfamily Alooideae is widely distributed in Africa with its main centre of
diversity found in southern Africa and outliers in the Arabian Peninsula, Madagascar,
and other islands in the western Indian Ocean (Reynolds 1966; Viljoen 1999; Glen
and Hardy 2000; Klopper and Smith 2007). However, the horticultural appeal of the
members of the subfamily has motivated illegal collections in the wild, which has
been a major threat to the plants (Smith et al. 2000; Raimondo et al. 2009). There is
therefore a need for conservation actions which require an accurate assessment of
species diversity in the group, taking into account genetic-based species delineation
in addition to morphological data (Eaton et al. 2010; Lowe and Cross 2011).
There is an impressive body of literature devoted to morphology-based
species delimitation within the Alooideae subfamily (Reynolds 1966; Smith and van
Wyk 1991; Viljoen 1999; Glen and Hardy 2000; Klopper and Smith 2007) and a
comparatively poorer attention to genetic diversity. While DNA barcoding was
originally developed as an identification system for specimen identification based
solely on DNA sequences (Hebert et al. 2003), it is increasingly acknowledged as a
key tool to complement morphology-based specimen identification (Edwards et al.
2008; Sun et al. 2012; Gere et al. 2013). The performance of DNA barcoding has,
however, been mixed for various plant taxa: while some limitations have been
documented in some groups e.g. Viburnum (Adoxaceae; Clement and Donoghue
5
2012), Agalinis (Orobanchaceae; Pettengill and Neel 2010), Tetrastigma (Vitaceae;
Fu et al. 2011), Lemnaceae (Wang et al. 2010), Berberis (Berberidaceae; Roy et al.
2010), and Parnassia (Parnassiaceae; Yang et al. 2012), strong and reliable
performance of DNA barcodes has also been reported in many other studies of
specimen identification (Burgess et al. 2011; Gere et al. 2013; Mankga et al. 2013).
This mixed report discounts the generalization power of DNA barcoding across all
taxonomic groups but reinforces the need for a case-by-case study (e.g. Clement
and Donoghue 2012; Gere et al. 2013; Daru and Yessoufou 2016).
The use of a phylogenetic approach in ecology is now a common practice;
this requires a fully resolved phylogeny (Davies et al. 2012) that barcode-based
phylogenies do not always provide. Questions related to extinction risk, the origin of
diversification of a taxonomic group, the role of historical climate in triggering and
controlling the temporal dynamics of speciation, and phylogenetically informed
conservation decisions, etc. are key ecological questions that can be better
understood only with a species-level resolved phylogeny. Phylogenetic ethnobotany
is also gaining momentum (e.g. Salis-Lagoudakis et al. 2012; Yessoufou et al. 2015)
and requires fully resolved phylogenies to test whether closely related species share
similar bioactive compounds or bioactivity against a specific ailment. As the
phylogeny recovered for the subfamily Alooideae using the standard barcode does
not provide well resolved phylogenetic relationships among species (see Daru 2012),
there is a need for a continued commitment to searching for DNA markers that can
provide such resolved phylogenies to allow future detailed studies of the
phylogenetic ecology of Alooideae. In addition to exploring species-level
identification, our study also partially addresses this important issue of phylogenetics
by examining species-level resolution, i.e. the tips of the phylogeny.
6
The combination of matK and rbcLa has been proposed as the core barcodes
for land plants (CBOL 2009) that can be supplemented by trnH-psbA and ITS
(Hollingsworth et al. 2011; Liu et al. 2011; Gere et al. 2013). The performance of the
core barcodes has been shown to yield high levels of specimen identification to
species and sequence recoverability (Burgess et al. 2011; Mankga et al. 2013).
However, the taxonomic sampling in some studies is sparse. If few species are
included per genus, the performance of DNA barcoding in specimen identification
can be inflated. We only consider ITS1 here because of its higher performance than
ITS2 in disentangling phylogenetic relationships in Alooideae (Treutlein et al. 2003a,
b; Ramdhani et al. 2011) or in Eukaryotes in general (Wang et al. 2015). Additionally,
a preliminary PCR amplification of Alooideae using available ITS2 primers proved
unsuccessful (Daru et al. 2013).
Most available molecular studies of Alooideae examined chloroplast markers
(usually not more than six, including rbcLa, matK, trnH-psbA, trnL-F, rps16) and
sometimes nuclear regions (ITS). Since Chase et al. (2000) provided one of the first
molecular phylogenetic evaluations of the subfamily Alooideae based on rbcL and
demonstrated that Alooideae is monophyletic, other molecular studies focused on
different lineages within Alooideae using different markers. For instance, Treutlein et
al. (2003b) used chloroplast sequencing and genomic fingerprinting of Alooideae to
demonstrate that genera and species of Alooideae are polyphyletic. A noteworthy
contribution was made by Ramdhani et al. (2011) who also confirmed the polyphyly
of Haworthia using trnL-trnF, trnH-psbA, and ITS1. Recent phylogenetic studies of
Alooideae used more comprehensive taxon sampling to reveal rather the paraphyly
of Aloe and Haworthia, which have led to taxonomic revisions of the subfamily (Daru
et al. 2013; Grace et al. 2013; Manning et al. 2014a). Although these later studies
7

form the baseline upon which our study rests, they do not explicitly assess the
species-level discriminatory power of either the standard DNA barcode or that of the
additional markers they used.
In this study, we used the most comprehensive molecular data yet available
for the subfamily Alooideae, with about 50% sampling completeness of species
within the subfamily (Table 1), to test the DNA barcode potential of four DNA
markers (trnH-psbA, matK, rbcLa, and ITS1) abundantly used in phylogenetic
studies of the subfamily Alooideae (e.g. Daru et al. 2013).
MATERIAL AND METHODS
Data and taxonomic sampling
We used all available DNA sequences for Alooideae for four molecular markers:
trnH-psbA, matK, rbcLa, and ITS1, sequences that our group previously generated
comprehensively for the subfamily Alooideae (see Daru 2012; Daru et al. 2013;
Manning et al. 2014a). Additional sequences for ITS1 for 85 taxa were obtained from
Grace et al. (2015) (see Table S1). These previous studies (Daru 2012; Daru et al.
2013; Manning et al. 2014a; Grace et al. 2015) follow commonly used taxonomic
concepts in Alooideae (Roberts Reinecke 1965; Reynolds 1966; Groen 1987; Bayer
1999; Glen and Hardy 2000; Van Jaarsveld 2007). All other sequences were derived
from our group previously (Daru 2012; Daru et al. 2013; Manning et al. 2014a). DNA
sequences were aligned using default settings in SEAVIEW v.4 (Gouy et al. 2010)
setting the alignment options to ‘clustalo’ for the combined dataset, and also
separately for each genus and gene region. For data analysis purpose, gaps were
considered as missing data. The alignments were manually checked and adjusted in
MESQUITE v.2.5 (Maddison and Maddison 2008) in cases of misalignment, and for
8
ITS1 in particular, alignments were done for each genus separately. The final
sequences used for the analysis is a combination of data derived from our group
previously (Daru 2012; Daru et al. 2013; Manning et al. 2014a) and Grace et al.
(2015), and included 235 species (n = 360 samples) belonging to all 11 currently
known Alooideae genera, with more than 50% sampling completeness for the
subfamily (Table 1). The sampling covers the geographical ranges of the subfamily,
mainly in southern Africa but also from Madagascar (e.g. Aloe haworthioides) and
Somalia (e.g. Aloidendron eminens).
All GenBank/EBI accession numbers and aligned DNA matrices are provided
in supplementary information as Table S2 and Data S1 respectively. Additionally,
complete data including GPS coordinates, pictures, and DNA barcodes are available
on the Barcode of Life Data Systems (BOLD; http://www.boldsystems.org;
Ratnasingham and Hebert 2007) within the publicly available project ‘Alooideae of
Africa’ (ALOAF).
DNA barcoding analysis
We evaluated four single DNA markers including three chloroplast regions
(rbcLa, matK, and trnH-psbA) and one nuclear marker (ITS1). We also tested the
four genes in different combinations: (1) rbcLa + matK (i.e. the core barcodes, CBOL
Plant Working Group 2009); (2) rbcLa + matK + trnH-psbA; (3) rbcLa + matK + ITS1;
and (4) rbcLa + matK + trnH-psbA + ITS1. First, we subdivided the combined aligned
matrix into subsets of matrices of each gene as input files for further analysis.
Secondly, we used two criteria commonly used in DNA barcoding analyses, i.e.
barcode gap of Meyer and Paulay (2005) and discriminatory power, to assess the
performance of each and combined markers. The presence of a barcode gap for
each species was defined as the discontinuity between levels of minimum
9
interspecific pairwise Kimura’s 2-parameters (K2P) distances calculated by setting
the analysis parameters to remove missing data as implemented in the R package
ape (Paradis et al. 2004) and maximum intraspecific divergence by plotting a lineplot
for the four gene regions and combinations. We also calculated the distribution of
range, mean, and standard deviation of both intra- and interspecific distances. The
nearest neighbour distance method was used for the calculation of interspecific
distances.
All DNA sequences were labelled with the names of the species from which the
sequences were generated. Then each query is considered as an unknown, but all
other sequences in the dataset (i.e. the 360 specimens in this study) are considered
as the reference DNA barcode database. If the ID of the query corresponds to the
sequence label in the reference, the identification test is scored as “correct”, and the
overall proportion of correct identification corresponds to the discriminatory power of
the DNA marker tested. Three approaches were used for the test: the “best close
match” (Meier et al. 2006), the “near neighbour”, and the BOLD criteria using,
respectively, the functions bestCloseMatch, threshID, and nearNeighbour
implemented in the program Spider 1.1-1 (Brown et al. 2012). Prior to the tests, we
determined, for each dataset (marker including combinations and all genera), the
optimised genetic distance suitable as threshold for specimen identification. For this
purpose, we used the function localMinima also implemented in Spider (Brown et al.
2012).
The function bestCloseMatch conducts the “best close match” analysis of Meier
et al. (2006), searching for the closest individual in the reference dataset. If the
closest specimen is within the threshold, the identification is “correct”. If it is greater
than the threshold, the outcome is scored as “no id” (no identification). However,
10
when more than one species are tied for closest match, the identification result is
scored as “ambiguous”. When all matches within the threshold are different species
to the query, the result is scored as “incorrect”.
The function threshID conducts a threshold-based analysis using the threshold
distance of 1%. It is more inclusive than bestCloseMatch in that it considers all
sequences within the threshold of 1%. Four outcomes are also possible: “correct”,
“incorrect”, “ambiguous”, and “no id”.
The nearNeighbour function finds the closest specimens and returns the score
“true”, i.e. correct ID if their names are the same; however, when the names are
different, the outcome is scored as “false”, i.e. incorrect ID.
Two additional analyses were conducted. We assessed the PCR success rate
and sequence quality. The success rate for each marker was evaluated qualitatively
based on the proportion of PCR products with strong PCR bands as scored by BHD,
scaled arbitrarily as: < 50% = poor PCR success; 50–70% = moderate; and 71–
100% = high PCR success. As PCR bands are not good indicators of successful
sequencing, we then evaluated the quality of the final sequences of all extracted
specimens quantitatively as the percentage quality of all sequence trace files for
each marker that our group generated previously (Daru 2012; Daru et al. 2013;
Manning et al. 2014a) using Sequencher v.3.1 (Gene Codes, Ann Arbor, Michigan,
USA). The sequence trace file quality generates confidence scores as an integral
part of the chromatogram file that is obtainable directly for each specimen upon
sequencing as Phred files and can be viewed in Sequencher v.3.1 (Gene Codes,
Ann Arbor, Michigan, USA) or similar programs such as Applied Biosystems’s KB
base caller. The program generates a quality score for each sequence, defined as
the percentage of bases meeting or surpassing a Phred score of 20. We use the
11
quality percentages as our measure of sequence quality. For instance, a quality
score of 60% indicates that 40% of its bases are low quality and vice versa (Gene
Codes Corporation 2016). Percentage of sequence quality was calculated for each
sequence trace files for each sample and for each marker.
Lastly, given the possibility that the performance of markers could vary among
taxa (Gere et al. 2013), we further assessed the performance of the best barcode
within five genera having the largest sample sizes: Aloe, Astroloba, Gasteria,
Haworthia, and Haworthiopsis; the other Alooideae genera were not evaluated here
due to lack of sufficient DNA sequences.
Altogether, we identified the best barcode for the subfamily as the region or
the combined regions that exhibit simultaneously a barcode gap and the highest
score of correct identification at the species level. These results were summarized
for each genus separately.
RESULTS
Genetic variation within each DNA marker
We assessed and compared genetic variation between single loci using
multiple approaches. We found that ITS1 has the highest interspecific variation
between nearest neighbouring species (0.065±0.035, n = 248), with the remaining
markers possessing variability in the following order: ITS1>trnH-psbA>matK>rbcLa
(Table 2). The same holds for mean of the intraspecific distances for which we found
similar order, i.e. ITS1>trnH-psbA>matK>rbcLa. For combinations of DNA markers,
rbcLa+matK+ITS1 yielded the highest mean interspecific genetic distances for
Alooideae identification (0.048±0.045, n = 248).
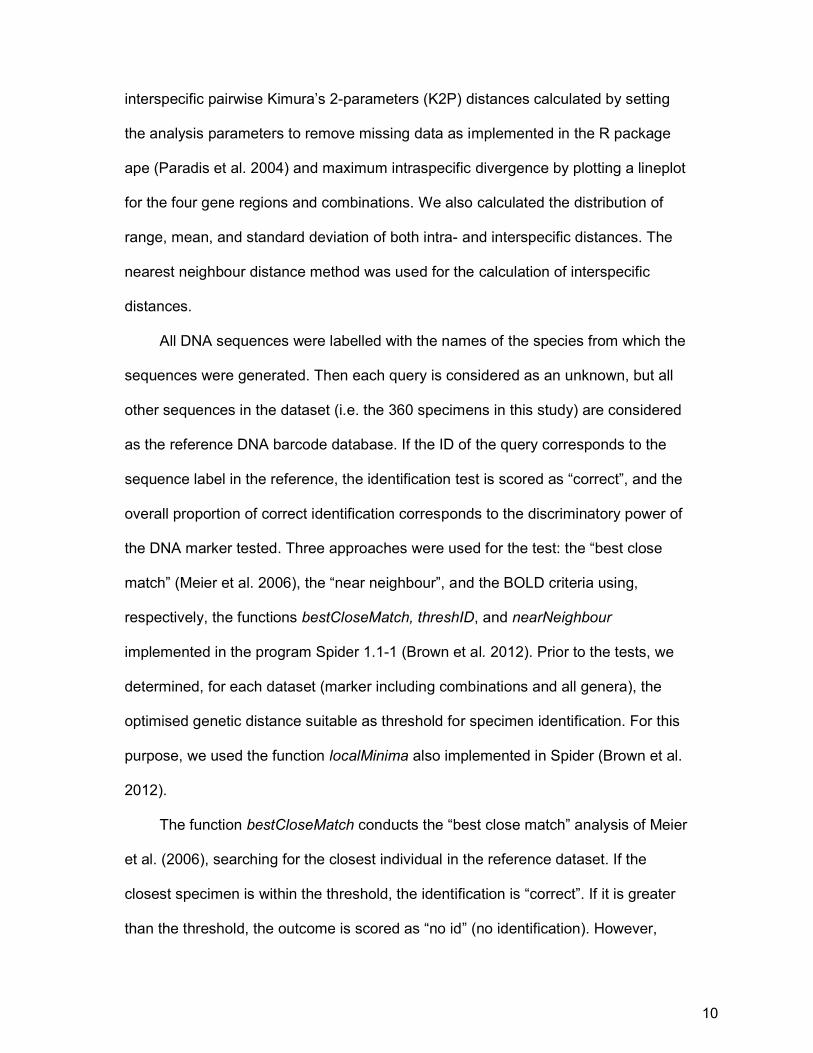
All DNA regions or combinations showed a low barcoding gap, i.e. the
discontinuity between intra- and inter-specific genetic divergences (Fig. 1), with the
12
Fig. 1.Line plots of DNA barcode gap for four gene regions and combinations for Alooideae specimen identification. For each marker a nd combination,
closed circles above the 1:1 line indicate the presence of a barcode gap, whereas open circles below the line indicate no barcode gap. Species included in
the barcode gap analysis are represented by at least two sequences.
13
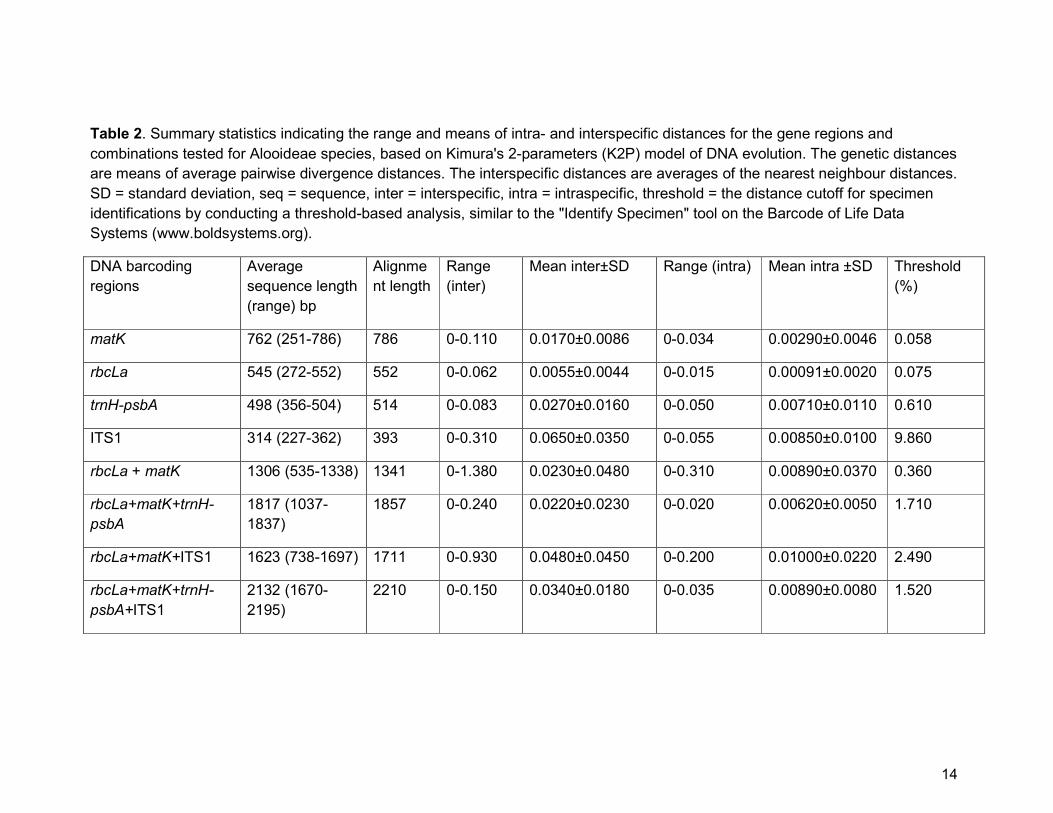
Table 2. Summary statistics indicating the range and means of intra- and interspecific distances for the gene regions and
combinations tested for Alooideae species, based on Kimura's 2-parameters (K2P) model of DNA evolution. The genetic distances
are means of average pairwise divergence distances. The interspecific distances are averages of the nearest neighbour distances.
SD = standard deviation, seq = sequence, inter = interspecific, intra = intraspecific, threshold = the distance cutoff for specimen
identifications by conducting a threshold-based analysis, similar to the "Identify Specimen" tool on the Barcode of Life Data
Systems (www.boldsystems.org).
DNA barcoding
regions
Average
sequence length
(range) bp
Alignme
nt length
Range
(inter)
Mean inter±SD Range (intra) Mean intra ±SD Threshold
(%)
matK 762 (251-786) 786 0-0.110 0.0170±0.0086 0-0.034 0.00290±0.0046 0.058
rbcLa 545 (272-552) 552 0-0.062 0.0055±0.0044 0-0.015 0.00091±0.0020 0.075
trnH-psbA 498 (356-504) 514 0-0.083 0.0270±0.0160 0-0.050 0.00710±0.0110 0.610
ITS1 314 (227-362) 393 0-0.310 0.0650±0.0350 0-0.055 0.00850±0.0100 9.860
rbcLa + matK 1306 (535-1338) 1341 0-1.380 0.0230±0.0480 0-0.310 0.00890±0.0370 0.360
rbcLa+matK+trnH-
psbA
1817 (1037-
1837)
1857 0-0.240 0.0220±0.0230 0-0.020 0.00620±0.0050 1.710
rbcLa+matK+ITS1 1623 (738-1697) 1711 0-0.930 0.0480±0.0450 0-0.200 0.01000±0.0220 2.490
rbcLa+matK+trnH-
psbA+ITS1
2132 (1670-
2195)
2210 0-0.150 0.0340±0.0180 0-0.035 0.00890±0.0080 1.520
14
percentages of species with gaps ranging from 5% in rbcLa to 40% in ITS1 (Table
3).
We calculated the optimized genetic distance (threshold distance) with which
to evaluate the discriminatory power of different gene regions and combinations.
Apart from ITS1, for which we found a threshold of 9.86%, all other single regions
have an optimized threshold of <1% (Table 2). The pattern increased slightly above
1% for all combinations except for the combination rbcLa+matK+ITS1, with a
threshold of 2.49%. Using these cut-offs, we evaluated the discriminatory power of
the different gene regions. For single regions based on the best close match method,
again ITS1 provides the highest rate (20%, n = 248) of discrimination followed by
matK and trnH-psbA (both 11%, n = 360 and 202 respectively), with rbcLa assigning
only 5% (n = 360) of the individuals to the correct species (Table 3). The same order
of performance was observed for the near neighbour method but with greater
identification success for ITS1 (30%, n = 248), matK (28%, n = 360), rbcLa (20%, n =
360), and trnH-psbA (19%, n = 202).
For the combined regions under both best close match and near neighbour
methods, inclusion of either ITS1 or trnH-psbA to the core barcodes (rbcLa+matK)
did not improve identification success rate (best close match: ITS1+matK+rbcLa =
20% and trnH-psbA+matK+rbcLa = 17%; near neighbour: ITS1+matK+rbcLa = 25%
and trnH-psbA+matK+rbcLa = 22%; Table 3).
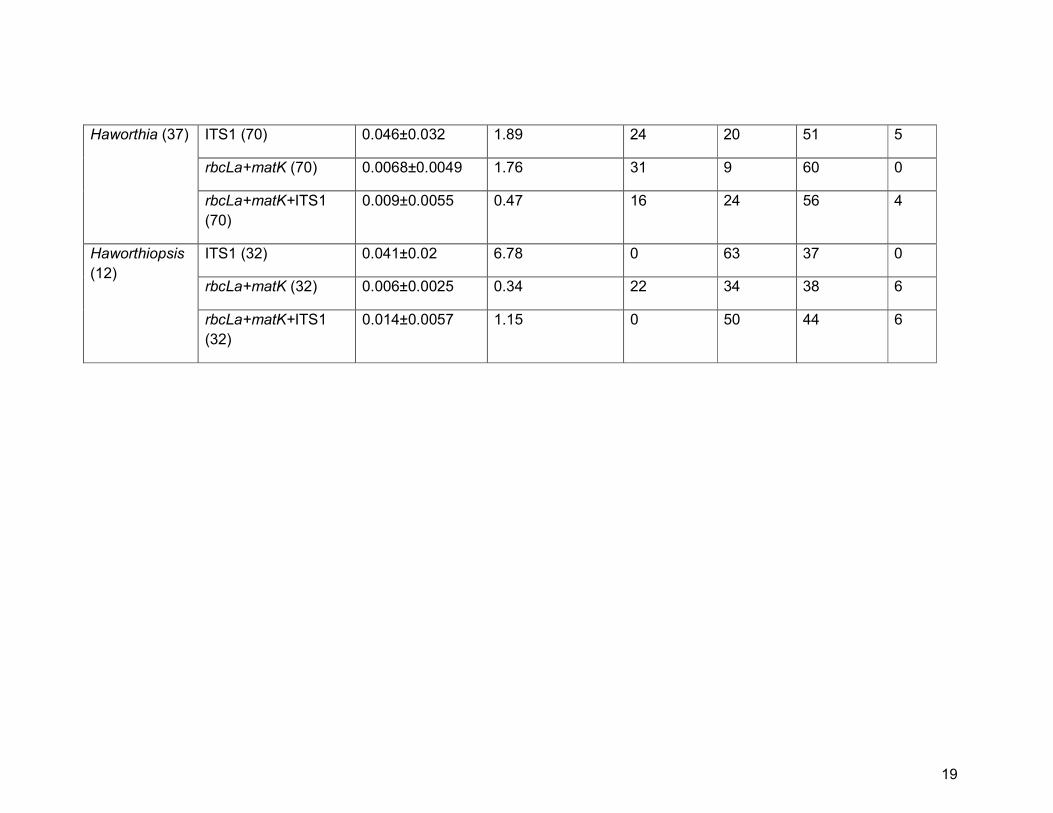
Within single genera, we found that the combination of ITS1 with the core
barcodes (matK+rbcLa) i.e. ITS1+matK+rbcLa, improved specimen identification in
Aloe from 7% (ITS1 alone) to 14% (for ITS1+matK+rbcLa) and from 20% to 24% in
Haworthia (ITS1 alone vs matK+rbcLa+ITS1, respectively; Table 4). For Astroloba,
there was no improvement in species discrimination (both 25% for ITS1 alone and
15
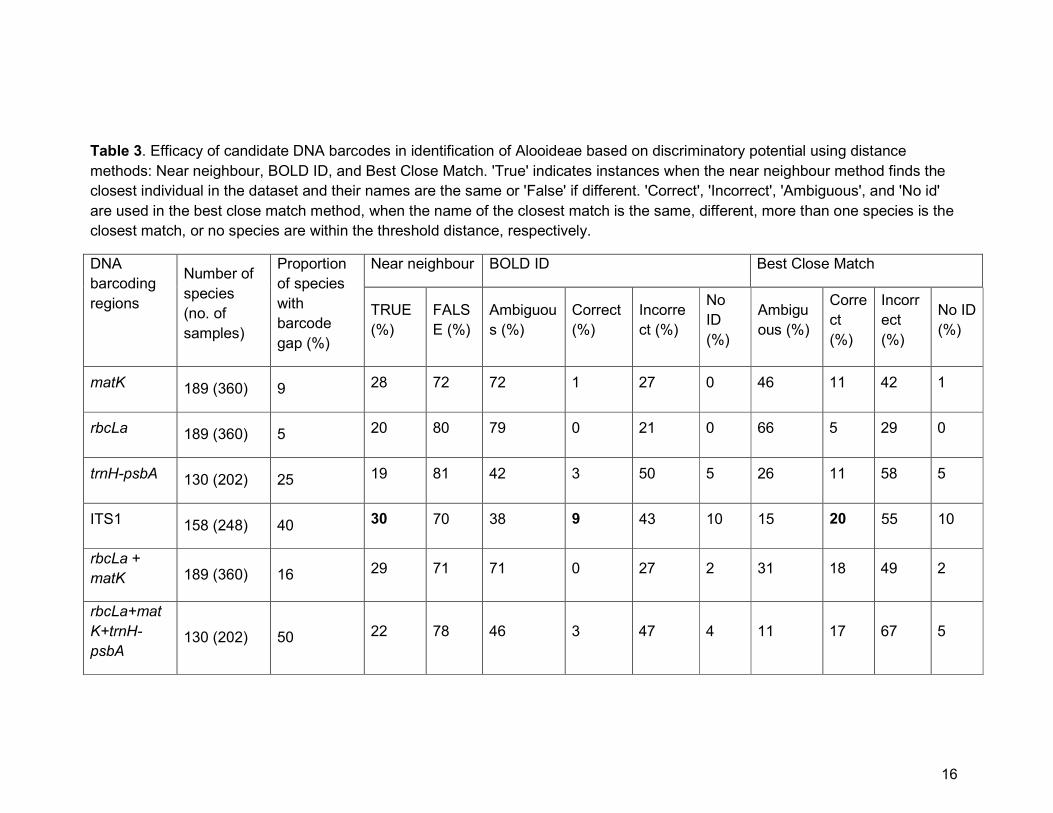
Table 3. Efficacy of candidate DNA barcodes in identification of Alooideae based on discriminatory potential using distance
methods: Near neighbour, BOLD ID, and Best Close Match. 'True' indicates instances when the near neighbour method finds the
closest individual in the dataset and their names are the same or 'False' if different. 'Correct', 'Incorrect', 'Ambiguous', and 'No id'
are used in the best close match method, when the name of the closest match is the same, different, more than one species is the
closest match, or no species are within the threshold distance, respectively.
DNA
barcoding
regions
Number of
species
(no. of
samples)
Proportion
of species
with
barcode
gap (%)
Near neighbour BOLD ID Best Close Match
TRUE
(%)
FALS
E (%)
Ambiguou
s (%)
Correct
(%)
Incorre
ct (%)
No
ID
(%)
Ambigu
ous (%)
Corre
ct
(%)
Incorr
ect
(%)
No ID
(%)
matK 189 (360) 9 28 72 72 1 27 0 46 11 42 1
rbcLa 189 (360) 5 20 80 79 0 21 0 66 5 29 0
trnH-psbA 130 (202) 25 19 81 42 3 50 5 26 11 58 5
ITS1 158 (248) 40 30 70 38 9 43 10 15 20 55 10
rbcLa +
matK 189 (360) 16 29 71 71 0 27 2 31 18 49 2
rbcLa+mat
K+trnH-
psbA 130 (202) 50 22 78 46 3 47 4 11 17 67 5
16

rbcLa+mat
K+ITS1 158 (248) 51 25 75 36 4 51 9 5 20 66 9
rbcLa+mat
K+trnH-
psbA+ITS1 122 (183) 62 26 74 29 7 50 14 0 23 63 14
17
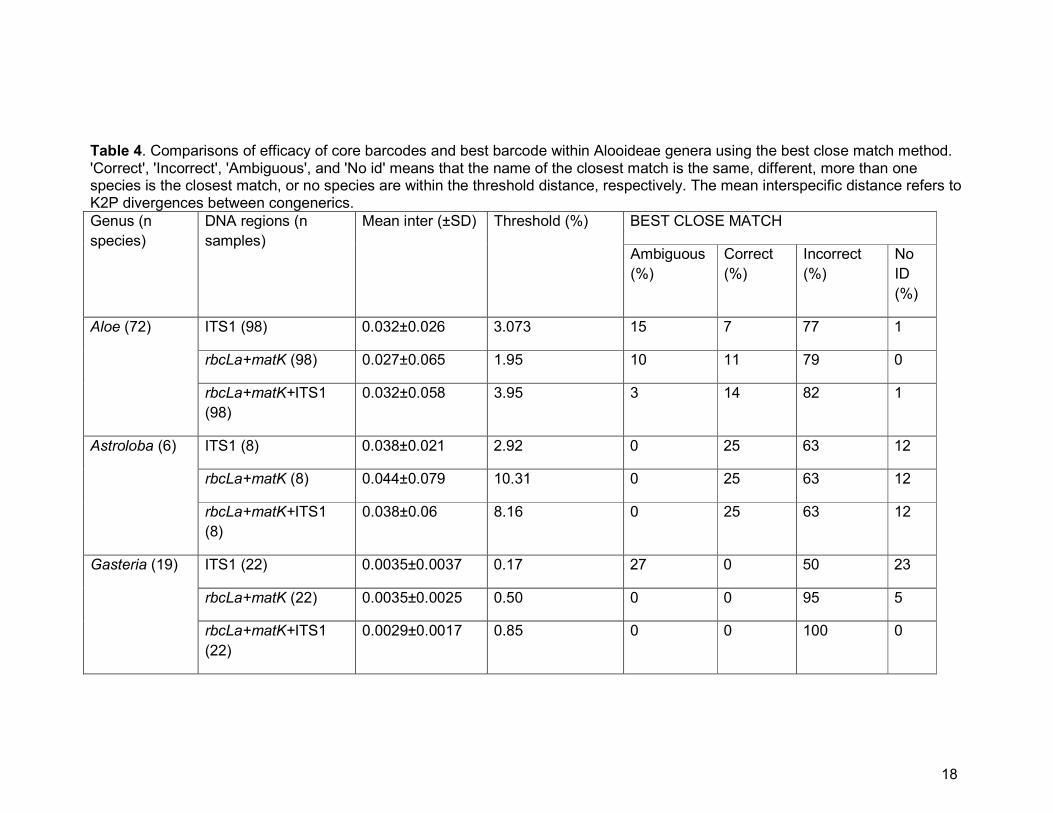
Table 4. Comparisons of efficacy of core barcodes and best barcode within Alooideae genera using the best close match method.
'Correct', 'Incorrect', 'Ambiguous', and 'No id' means that the name of the closest match is the same, different, more than one
species is the closest match, or no species are within the threshold distance, respectively. The mean interspecific distance refers to
K2P divergences between congenerics.
Genus (n
species)
DNA regions (n
samples)
Mean inter (±SD) Threshold (%) BEST CLOSE MATCH
Ambiguous
(%)
Correct
(%)
Incorrect
(%)
No
ID
(%)
Aloe (72) ITS1 (98) 0.032±0.026 3.073 15 7 77 1
rbcLa+matK (98) 0.027±0.065 1.95 10 11 79 0
rbcLa+matK+ITS1
(98)
0.032±0.058 3.95 3 14 82 1
Astroloba (6) ITS1 (8) 0.038±0.021 2.92 0 25 63 12
rbcLa+matK (8) 0.044±0.079 10.31 0 25 63 12
rbcLa+matK+ITS1
(8)
0.038±0.06 8.16 0 25 63 12
Gasteria (19) ITS1 (22) 0.0035±0.0037 0.17 27 0 50 23
rbcLa+matK (22) 0.0035±0.0025 0.50 0 0 95 5
rbcLa+matK+ITS1
(22)
0.0029±0.0017 0.85 0 0 100 0
18
Haworthia (37) ITS1 (70) 0.046±0.032 1.89 24 20 51 5
rbcLa+matK (70) 0.0068±0.0049 1.76 31 9 60 0
rbcLa+matK+ITS1
(70)
0.009±0.0055 0.47 16 24 56 4
Haworthiopsis
(12)
ITS1 (32) 0.041±0.02 6.78 0 63 37 0
rbcLa+matK (32) 0.006±0.0025 0.34 22 34 38 6
rbcLa+matK+ITS1
(32)
0.014±0.0057 1.15 0 50 44 6
19
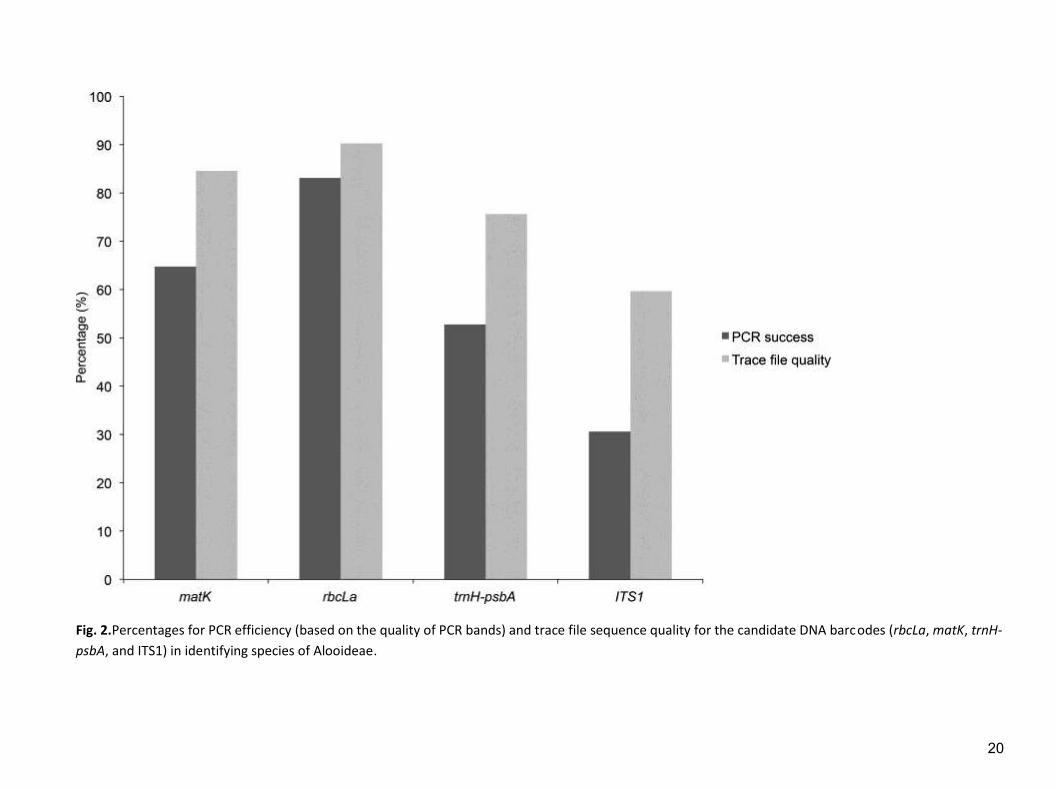
Fig. 2.Percentages for PCR efficiency (based on the quality of PCR bands) and trace file sequence quality for the candidate DNA barcodes (rbcLa, matK, trnH-
psbA, and ITS1) in identifying species of Alooideae.
20

matK+rbcLa+ITS1), whereas we found a reduction in species discrimination in
Haworthiopsis from 63% to 50% when ITS1 is combined with the core barcodes
(ITS1 alone vs matK+rbcLa+ITS1, respectively).
Amplification success and quality of sequence trace files
The amplification success varied from poor to high rates (Fig. 2). Poor PCR
success rate was found with ITS1 (30.6%); the rate was moderate with trnH-psbA
(52.8%) and matK (64.8%). The highest success rate was observed with rbcLa
(83.1%). The proposed primers recommended by the CBOL Plant Working Group
(2009) for rbcLa and matK (rbcL-barcode-F: rbcL-barcode-R and 3F_KIM: 1R_KIM,
respectively) as well as the other two tested in this study (trnH-psbA and ITS1) were
successful such that no internal priming was required for any of the DNA regions.
The quality of sequence trace files followed similar trend (rbcLa>matK>trnH-
psbA>ITS1); 90.25±13.21% of specimens yielded a readable trace file for rbcLa,
84.57±12.94% for matK followed by trnH-psbA (75.65±18.79%) for all species, with
often little or no editing. ITS1 recorded the lowest percentage of sequence quality of
59.71±20.10% and often with considerable editing of the chromatograms.
DISCUSSION
Several criteria have been defined for the identification of the best DNA
barcode candidate (Hebert et al. 2004; Kress and Erickson 2007; Lahaye et al. 2008;
CBOL Plant Working Group 2009). Firstly, it must provide maximal discrimination
among species. We measured the discriminatory power of four candidates using
‘barcode-gap’ (Meyer and Paulay 2005) and distance-based methods (Kress et al.
2005; Lahaye et al. 2008; Hollingsworth et al. 2009). Although the core barcodes
(matK and rbcLa) may not exhibit a barcode gap for several genera (e.g. Parnassia,
21

Yang et al. 2012), we also found that all our markers (including the core barcodes)
exhibit low prevalence of a gap for Alooideae. Misidentifications and phylogenetic
reticulation are commonplace in rapidly evolving lineages such as the Alooideae
(Viljoen 1999) e.g. Haworthia (Bayer 1999), Astroloba (Treutlein et al. 2003a), and
Aloineae (Riley and Majumdar 1979), which may have led to the low discrimination
rates of the DNA barcodes in this study. Such cases of reticulation have led to the
adoption of other PCR-based methods such as ISSR fingerprinting for detecting
hybrids (Wink et al. 2001; Treutlein et al. 2003b). Nonetheless, ITS1 shows relatively
high interspecific variation, irrespective of the metric used. These findings indicate
that ITS1, regardless of the generally low specimen identification rate of the markers
tested in this study, could be a more favourable barcode for the subfamily.
Secondly, a good DNA barcode should be easily amplified with universal
primers (CBOL Plant Working Group 2009). In our study the plastid genes matK,
rbcLa, and trnH-psbA were easily amplified by universal primers. Although ITS1 was
comparatively more difficult to amplify, leading to the poorest PCR success and
sequence quality we found, it is consistently retrieved as the best-performing locus in
the genetic variation analysis. The low sequence quality recorded in ITS1 could be
an artefact of errors in homopolymeric regions where sequences of identical bases
occur in tandem (Bizzaro and Marx 2003). This could be overcome through the use
of anchored primers (Thomas et al. 1993) or primers that anneal at a different
position. It could also be due to multiple variants within single individuals as is the
case in Alooideae, with high rates of hybridization (Ramdhani et al. 2011). Previous
molecular taxonomic studies in different Alooideae lineages (e.g. Treutlein et al.
2003a, b; Ramdhani et al. 2011; Daru et al. 2013; Manning et al. 2014a) have
consistently favourably appraised the utility of ITS1 in species discrimination and
22
disentangling phylogenetic relationships, as in many angiosperm families (Baldwin et
al. 1995). This relatively high resolution of ITS1, compared to other markers, is an
indication of better species discrimination, confirming ITS1 as a better barcode for
the subfamily. Given the high interspecific variation of ITS1, we argue that, if
universal primers that could boost its amplification success could be designed, this
marker could be a suitable barcode for Alooideae.
In general, the ITS region as potential barcode has been controversial (see
Kress et al. 2005), but recent studies have raised some potential pitfalls against its
suitability (e.g. incomplete lineage sorting, inhomogeneous concerted evolution,
divergent paralogous copies within individuals, and pseudogenes; Alvarez and
Wendel 2003; Chase et al. 2007; Starr et al. 2009; Hollingsworth et al. 2011).
However, a more recent test of ITS on a large dataset revealed that these
drawbacks are not sufficiently severe to preclude consideration of this marker (China
Plant BOL Group 2011), giving further support to our advocacy of ITS1 for the
monocot subfamily considered in this study (see also Liu et al. 2011 for the genus
Taxus and Yang et al. 2012 for the genus Parnassia).
Looking at other potential barcodes, we found that rbcLa has shown the
lowest intra- and interspecific distances (see also Lahaye et al. 2008; Clerc-Blain et
al. 2010; Zuo et al. 2011). Although it has not only high universality and sequence
quality (see also CBOL Plant Working Group 2009), rbcLa is also well known for its
high discrimination power at higher taxonomic levels, i.e. generic and familial levels
(Kress and Erickson 2007). However, in this study like in previous (e.g. Lahaye et al.
2008), it has relatively low discriminating power between species and could not
therefore be suggested as potential barcode for the subfamily at the species level.
23

The discriminatory power of the DNA regions for species-level resolution
yielded mixed results among genera, with fair performance in Haworthiopsis and
poor performance in Aloe and Haworthia. The poor performance is not surprising
due to the generally low genetic variation often found in Alooideae lineages
(Ramdhani et al. 2011; Daru et al. 2013; Grace et al. 2015). In addition, our study
indicates that species discrimination within a large taxonomic group with closely
related taxa should be tested within genera, with dense sampling of species (see
also Gere et al. 2013). With the growing availability of next-generation sequencing, a
more extensive approach, e.g. multi-marker analysis methods, chloroplast
sequencing or using more parts of the nuclear genome, could be required to yield
additional discriminating regions.
Going forward, we suggest a three-prong approach to reduce the high rate of
incorrect specimen identifications in Alooideae. First, including more replicates per
species would allow comparison of intra- and interspecific genetic divergence.
However, this option would not likely change our findings significantly as our
sampling included some replication within species (see Table 1), yet we found poor
discriminatory power as in previous studies (e.g. Clement and Donoghue 2012; Yang
et al. 2012). Second, more multi-gene methods in search of variable markers should
be developed. However, this option may be counter-intuitive given the purpose of
DNA barcoding is to ease specimen identification and to achieve universality in
specimen discrimination. Third, DNA barcoding could also be tested using a tree-
based method in a phylogenetic context (see Mankga et al. 2013). This is being
tested in some plant groups with good results e.g. Combretaceae (Gere et al. 2013)
and medicinal plants (Mankga et al. 2013).
24
Overall we suggest that the use of ITS1 alone or in combination with the core
barcodes (rbcLa+matK) has fair barcode potential for the subfamily Alooideae.
However, the barcode potential of these regions might vary across the different
Alooideae genera. The taxonomy of the alooids is still rife with uncertainty and
controversy, such that new classification systems are rapidly emerging (Grace et al.
2013; Rowley 2013; Manning et al. 2014a, b). We hope that our study will quickly be
followed by others where new and more universal ITS1 primers could be
investigated to boost amplification success.
Implications for conservation
Various Alooideae species have restricted populations and are also of high
horticultural appeal and therefore threatened by illegal and excessive collection in
the wild. For instance, Kumara disticha is listed in CITES Appendix II, implying that
the species is of conservation concern, and international trade should be limited.
Since DNA barcoding has been used to track down illegal trade in endangered
species, e.g. fin whale trade (Baker et al. 2010) and illegal logging of protected tree
species (Degen and Fladung 2007), it follows that DNA barcoding could also assist
conservationists in managing and tracking down Alooideae species that are highly
threatened, for example Aloidendron pillansii (critically endangered), Astroloba
rubriflora (vulnerable), Haworthia pubescens (critically endangered), Haworthiopsis
longiana (endangered), and Tulista kingiana (endangered) (www.redlist.sanbi.org).
Thus, an identification tool such as DNA barcoding that can reliably identify
Alooideae species will go a long way to help preserve these species along with their
horticultural appeal.
25

We would like to thank the following organisations for funding and logistic
support: the University of Johannesburg, the Royal Society of London, and the
National Research Foundation (NRF) of South Africa. Part of this project was also
funded by the Government of Canada through Genome Canada and the Ontario
Genomics Institute (2008-OGI-ICI-03). We thank the Associate Editor Sarah
Adamowicz and two anonymous referees for comments on an earlier draft of the
manuscript.
26
ACKNOWLEDGEMENTS
REFERENCES
Alvarez, I. and Wendel, J.F. 2003. Ribosomal ITS sequences and plant phylogenetic
inference. Mol. Phylogenet. Evol. 29(3): 417–434.
Baker, C.S., Steel, D., Choi, Y., Lee, H., Kim, K.S., Choi, S.K., Ma, Y.-U.,
Hambleton, C., Psihoyos, L. and Brownell, R. 2010. Genetic evidence of
illegal trade in protected whales links Japan with the US and South Korea.
Biol. Lett. 6: 647–650.
Baldwin, B.G., Sanderson, M.J., Porter, J.M., Wojciechowski, M.F., Campbell, S.G.
and Donoghue, M.J. 1995. The ITS region of nuclear ribosomal DNA: a
valuable source of evidence on angiosperm phylogeny. Ann. Mo. Bot. Gard.
82: 247–277.
Bayer, M.B. 1999. Haworthia Revisited. A revision of the genus. Umdaus Press,
Hatfield, South Africa.
Bizzaro, J.W. and Marx, K.A. 2003. Poly: a quantitative analysis tool for simple
sequence repeat (SSR) tracts in DNA. BMC Bioinformatics. 4: 22-27.
Brown, S.D., Collins, R.A., Boyer, S., Lefort, M.C., Malumbres-Olarte, J., Vink, C.J.
and Cruickshank, R.H. 2012. Spider: An R package for the analysis of
species identity and evolution, with particular reference to DNA barcoding.
Mol. Ecol. Resour. 12(3): 562–565.
Burgess, K.S., Fazekas, A.J., Kesanakurti, P.R., Graham, S.W., Husband, B.C.,
Newmaster, S.G., Percy, D.M., Hajibabaei, M. and Barrett, S.C.H. 2011.
Discriminating plant species in a local temperate flora using the rbcL plus
matK DNA barcode. Methods Ecol. Evol. 2(4): 333–340.
CBOL Plant Working Group 2009. A DNA barcode for land plants. Proc. Natl. Acad.
Sci. USA 106(31): 12794–12797.
27
Chase M.W., Cowan R.S., Hollingsworth P.M., van den Berg C., Madrinan S.,
Petersen G., Seberg O., Jorgsensen T., Cameron K.M., Carine M.,
Pedersen N., Hedderson T.A.J., Conrad F., Salazar G.A., Richardson J.E.,
Hollingsworth M.L., Barraclough T.G., Kelly L. and Wilkinson M. 2007. A
proposal for a standardised protocol to barcode all land plants. Taxon 56(2):
295–299.
Chase, M.W., De Bruijn, A.Y., Cox, A.V., Reeves, G., Rudall, P.J., Johnson, M.A.T.
and Eguiarte, L.E. 2000. Phylogenetics of Asphodelaceae (Asparagales): An
analysis of plastid rbcL and trnL-F DNA sequences. Ann. Bot. 86(5): 935–
951.
China Plant BOL Group 2011. Comparative analysis of a large dataset indicates that
ITS should be incorporated into the core barcode for seed plants. Proc. Natl.
Acad. Sci. USA 108(49): 19641–19646.
Clement, W.L. and Donoghue, M.J. 2012. Barcoding success as a function of
phylogenetic relatedness in Viburnum, a clade of woody angiosperms. BMC
Evol. Biol. 12: 73.
Clerc-Blain, J.L.E., Starr, J.R., Bull, R.D. and Saarela, J.M. 2010. A regional
approach to plant DNA barcoding provides high species resolution of sedges
(Carex and Kobresia, Cyperaceae) in the Canadian Arctic Archipelago. Mol.
Ecol. Resour. 10(1): 69–91.
Daru, B.H. 2012. Molecular phylogenetics of Alooideae (Asphodelaceae). MSc
thesis, University of Johannesburg, South Africa.
Daru, B.H. and Yessoufou, K. 2016. A search for a single DNA barcode for
seagrasses of the world. In: DNA Barcoding in Marine Perspectives (eds. S.
Trivedi, A.A. Ansari & S.K. Ghosh), pp. 313–330. Springer International
28
Publishing Switzerland. doi: 10.1007/978-3-319-41840-7_19
Daru, B.H., Manning, J.C., Boatwright, J.S., Maurin, O., Maclean, N., Schaefer, H.,
Kuzmina, M. and Van der Bank, M. 2013. Molecular and morphological
analysis of subfamily Alooideae (Asphodelaceae) and the inclusion of
Chortolirion in Aloe. Taxon 62(1): 62–76.
Davies, T.J., Kraft, N.J.B., Salamin, N. and Wolkovich, E.M. 2012. Incompletely
resolved phylogenetic trees inflate estimates of phylogenetic conservatism.
Ecology 93(2): 242–247.
Degen, B. and Fladung, M. 2007. Use of DNA-markers for tracing illegal logging,
Proceedings of the International Workshop “Fingerprinting Methods for the
Identification of Timber Origins,” Bonn Press, pp. 6–14.
Duval, H.A. 1809. Plantae succulentae, in Horto Alenconio. Parisiis apud Gabon et
Socios, Paris.
Eaton, M.J., Meyers, G.L., Kolokotronis, S.O., Leslie, M.S., Martin, A.P. and Amato
G. 2010. Barcoding bushmeat: molecular identification of Central and South
American harvested vertebrates. Conserv. Genet. 11(4): 1389–1404.
Edwards, D., Horn, A., Taylor, D., Savolainen, V. and Hawkins, J.A. 2008. DNA
barcoding of a large genus, Aspalathus L. (Fabaceae). Taxon 57(4): 1317–
1327.
Fu, Y.M., Jiang, W.M. and Fu, C.X. 2011. Identification of species within Tetrastigma
(Miq.) Planch. (Vitaceae) based on DNA barcoding techniques. J. Syst. Evol.
49(3): 237–245.
Gene Codes Corporation 2016. Quality Scores. Gene Codes Corporation, Ann
Arbor, MI 48108 USA.
Gere, J., Yessoufou, K., Daru, B.H., Maurin, O., Mankga, L.T. and Van der Bank, M.
29

2013. Incorporating trnH-psbA to core DNA barcodes improves
discrimination of species within southern African Combretaceae. ZooKeys
365: 127–147.
Glen, H.F. and Hardy, D.S. 2000. Aloaceae. Aloe. In: Flora of Southern Africa.
Fascicle 1: Aloaceae (First part): Aloe, vol. 5 (ed. G. Germishuizen), pp. 1–
167. National Botanical Institute, Pretoria, South Africa.
Gouy, M., Guindon, S. and Gascuel, O. 2010. SeaView Version 4: A multiplatform
graphical user interface for sequence alignment and phylogenetic tree
building. Mol. Biol. Evol. 27(2): 221–224.
Grace, O.M, Klopper, R.R., Smith, G.F., Crouch, N.R., Figueiredo, E., Rønsted, N.
and Van Wyk, A.E. 2013. A revised generic classification for Aloe
(Xanthorrhoeaceae subfam. Asphodelaceae). Phytotaxa 76(1): 7–14.
Grace, O.M., Buerki, S., Symonds, M.R., Forest, F., Van Wyk, A.E., Smith, G.F.,
Klopper, R.R., Bjorå, C.S., Neale, S., Demissew, S., Simmonds, M.S.J. and
Rønsted, N. 2015. Evolutionary history and leaf succulence as explanations
for medicinal use in aloes and the global popularity of Aloe vera. BMC Evol.
Biol. 15: 29.
Groen, L.E. 1987. Astroloba Uitew. (III). Succulenta 66: 82–87.
Hebert, P.D.N., Cywinska, A., Ball, S.L., and de Waard, J.R. 2003. Biological
identifications through DNA barcodes. Proc. R. Soc. Lond. B 270(1512):
313–321.
Hebert, P.D.N., Penton, E.H., Burns, J.M., Janzen, D.H. and Hallwachs, W. 2004.
Ten species in one: DNA barcoding reveals cryptic species in the neotropical
skipper butterfly Astraptes fulgerator. Proc. Natl. Acad. Sci. USA 101(41):
14812–14817.
30
Hollingsworth, M.L., Clark, A.A., Forrest, L.L., Richardson, J., Pennington, R.T.,
Long, D.G., Cowan, R., Chase, M.W., Gaudeul, M. and Hollingsworth, P.M.
2009. Selecting barcoding loci for plants: evaluation of seven candidate loci
with species level sampling in three divergent groups of land plants. Mol.
Ecol. Resour. 9(2): 439–457.
Hollingsworth, P.M., Graham, S.W. and Little, D.P. 2011. Choosing and using a plant
DNA barcode. PLoS ONE 6(5): e19254.
Klopper, R.R. and Smith, G.F. 2007. The genus Aloe L. (Apshodelaceae: Alooideae)
in Namqualand, South Africa. Haseltonia 13: 1–13.
Kress, W.J. and Erickson, D.L. 2007. A two-locus global DNA barcode for land
plants: The coding rbcL gene complements the non-coding trnH-psbA
spacer region. PLoS ONE 2(6): e508.
Kress, W.J., Wurdack, K.J., Zimmer, E.A., Weigt, L.E. and Janzen, D.H. 2005. Use
of DNA barcodes to identify flowering plants. Proc. Natl. Acad. Sci. USA
102(23): 8369–8374.
Lahaye, R., van der Bank, M., Bogarin, D., Warner, J., Pupulin, F., Gigot, G., Maurin,
O., Duthoit, S., Barraclough, T.G. and Savolainen, V. 2008. DNA barcoding
the floras of biodiversity hotspots. Proc. Natl. Acad. Sci. USA 105(8): 2923–
2928.
Liu, J., Moller, M., Gao, L.M., Zhang, D.Q. and Li, D.Z. 2011. DNA barcoding for the
discrimination of Eurasian yews (Taxus L., Taxaceae) and the discovery of
cryptic species. Mol. Ecol. Resour. 11(1): 89–100.
Lowe, A.J. and Cross, H.B. 2011. The application of DNA to timber tracking and
origin verification. IAWA J. 32(2): 251–262.
31
Maddison, W.P. and Maddison, D.R. 2008. Mesquite: a modular system for
evolutionary analysis. Version 2.5. Available from: http://mesquiteproject.org
Mankga, L.T., Yessoufou, K., Moteetee, A.M., Daru, B.H. and Van der Bank, M.
2013. Efficacy of the core DNA barcodes in identifying processed and poorly
conserved plant materials commonly used in South African traditional
medicine. ZooKeys 365: 215-233.
Manning, J.C., Boatwright, J.S. and Daru, B.H. 2014b. Aloe and goodbye: a new
evolutionary classification of the Alooids. Alsterworthia International 14: 7–
15.
Manning, J.C., Boatwright, J.S., Daru, B.H., Maurin, O. and Van der Bank, M. 2014a.
A molecular phylogeny and generic classification of Asphodelaceae
subfamily Alooideae: A final resolution of the prickly issue of polyphyly in the
Alooids? Syst. Bot. 39(1): 55–74.
Meier, R.S., Kwong, S., Vaidya, G. and Ng, P.K.L. 2006. DNA barcoding and
taxonomy in Diptera: a tale of high intraspecific variability and low
identification success. Syst. Biol. 55(5): 715–728.
Meyer, C.P. and Paulay, G. 2005. DNA Barcoding: error rates based on
comprehensive sampling. PLoS Biol. 3(12): 2229–2238.
Paradis E., Claude J. and Strimmer K. 2004. APE: analyses of phylogenetics and
evolution in R language. Bioinformatics 20(2): 289–290.
Pettengill, J.B. and Neel, M.C. 2010. An evaluation of candidate plant DNA barcodes
and assignment methods in diagnosing 29 species in the genus Agalinis
(Orobanchaceae). Am. J. Bot. 97(8): 1381–1406.
32
Raimondo, D., Von Staden, L., Foden, W., Victor, J.E., Helme, N.A., Turner, R.C.,
Kamundi, D.A. and Manyama, P.A. 2009. Red List of South African Plants.
Strelitzia 25. South African National Biodiversity Institute, Pretoria.
Ramdhani, S., Barker, N.P. and Cowling, R.M. 2011. Revisiting monophyly in
Haworthia Duval (Asphodelaceae): incongruence, hybridization and
contemporary speciation. Taxon 60(4): 1001–1014.
Ratnasingham, S. and Hebert, P.D.N. 2007. bold: The Barcode of Life Data System
(http://www.barcodinglife.org). Mol. Ecol. Notes 7(3): 355–364.
Reynolds, G.W. 1966. The aloes of tropical Africa and Madagascar. The Trustees:
The Aloes Book Fund, Mbabane, Swaziland.
Riley, H.P. and Majumdar, S.K. 1979. The Aloineae: A biosystematic survey.
Kentucky: The University Press of Kentucky.
Roberts Reinecke, P. 1965. A revision of the genus Astroloba. MSc thesis, University
of Cape Town, South Africa.
Rowley, G.D. 2013. Generic concepts in the Alooideae 3: The phylogenetic story.
Alsterworthia Internation Special Issue 10: 1–7.
Roy, S., Tyagi, A., Shulka, V., Kumar, A., Singh, U.M., Chaudhary, L.B., Datt, B.,
Bag, S.K., Singh, P.K., Nair, N.K., Husain, T. and Tuli, R. 2010. Universal
plant DNA barcode loci may not work in complex groups: a case study with
Indian Berberis species. PLoS ONE 5(10): e13674.
Saslis-Lagoudakis, C.H., Savolainen, V., Williamson, E.M., Forest, F., Wagstaff, S.J.,
Baral, S.R., Watson, M.F., Pendry, C.A. and Hawkins, J.A. 2012.
Phylogenies reveal predictive power of traditional medicine in
bioprospecting. Proc. Natl. Acad. Sci. USA 109(39): 15835–15840.
33
Smith, G.F. and van Wyk, B.E. 1991. Generic relationships in the Alooideae
(Asphodelaceae). Taxon 40(4): 557–581.
Smith, G.F., Steyn, E.M.A., Victor, J.E., Crouch, N.R., Golding, J. and Hilton-Taylor,
C. 2000. The conservation status of Aloe in South Africa: an updated
synopsis. Bothalia 30: 206-211.
Starr, J.R., Naczi, R.F.C. and Chouinard, B.N. 2009. Plant DNA barcodes and
species resolution in sedges (Carex, Cyperaceae). Mol. Ecol. Resour. 9(s1):
151–163.
Sun, X.Q., Zhu, Y.J., Guo, J.L., Peng, B., Bai, M.M. and Hang, Y.Y. 2012. DNA
barcoding the Dioscorea in China, a vital group in the evolution of
monocotyledon: Use of matK gene for species discrimination. PLoS ONE
7(2): e32057.
Thomas, M.G., Hesse, S.A., McKie, A.T. and Farzaneh, F. 1993. Sequencing of
cDNA using anchored oligo dT primers. Nucleic Acids Res. 21(16): 3915–
3916.
Treutlein, J., Smith, G.F., van Wyk, B.E. and Wink, M. 2003a. Evidence for the
polyphyly of Haworthia (Asphodelaceae subfamily Alooideae; Asparagales)
inferred from nucleotide sequences of rbcL, matK, ITS1 and genome
fingerprinting with ISSR-PCR. Plant Biol. 5(5): 513–521.
Treutlein, J., Smith, G.F., van Wyk, B.E. and Wink, M. 2003b. Phylogenetic
relationships in Asphodelaceae (subfamily Alooideae) inferred from
chloroplast DNA sequences (rbcL, matK) and from genomic finger-printing
(ISSR). Taxon 52(2): 193–207.
Van Jaarsveld, E.J. 2007. The genus Gasteria: A synoptic review (new taxa and
combinations). Aloe 44: 84–104.
34
Viljoen. A.M. 1999. A chemotaxonomic study of phenolic leaf compounds in the
genus Aloe. Ph.D. thesis, Rand Afrikaans University, Johannesburg, South
Africa.
Wang, W., Wu, Y., Yan, Y., Ermakova, M., Kerstetter, R. and Messing, J. 2010. DNA
barcoding of the Lemnaceae, a family of aquatic monocots. BMC Plant Biol.
10: 205.
Wang, X.-C., Liu, C., Huang, L., Bengtsson-Palme, J., Chen, H., Zhang, J.-H., Cai,
D. and Li, J.-Q. 2015. ITS1: A DNA barcode better than ITS2 in eukaryotes?.
Mol. Ecol. Resour. 15(3): 573–586.
Wink, M., Guicking, D. and Fritz, U. 2001. Molecular evidence for hybrid origin of
Mauremys iversoni Pritchard et McCord, 1991, and Mauremys pritchardi
McCord, 1997 (Reptilia: Testudines: Bataguridae). Zool. Abh. Staatl. Mus.
Tierkunde Dresden 51: 41–50.
Yang, J.B., Wang, Y.P., Moller, M., Gao, L.M. and Wu, D. 2012. Applying plant DNA
barcodes to identify species of Parnassia (Parnassiaceae). Mol. Ecol.
Resour. 12(2): 267–275.
Yessoufou, K., Daru, B.H. and Muasya, A.M. 2015. Phylogenetic exploration of
commonly used medicinal plants in South Africa. Mol. Ecol. Resour. 15(2):
405–413.
Zuo, Y.J., Chen, Z.J., Kondo, K., Funamoto, T., Wen, J. and Zhou, S.L. 2011. DNA
barcoding of Panax species. Planta Med. 77(2): 182–187.
35
0.0 0.5 1.0 1.5 2.0 2.5 3.00
5
10
15
ITS1 from Grace et al. (2015)
Maximum intraspecific divergence
Nea
rest
nei
ghbo
r dis
tanc
eSupplementary Figure S1
36
Table S1. GenBank/EBI accession numbers for ITS1 sequences of Alooideae from Grace et al. (2015).
Taxon ITS1 Aloe aculeata KJ557846 Aloe affinis KJ557847 Aloe ammophila KJ557928 Aloe ankoberensis KJ557848 Aloe arenicola KJ557849 Aloe benishangulana KJ557850 Aloe branddraaiensis KJ557851 Aloe brandhamii KJ557852 Aloe brevifolia KJ557853 Aloe bulbillifera KJ557854 Aloe burgersfortensis KJ557855 Aloe bussei KJ557856 Aloe camperi KJ557857 Aloe castanea KJ557858 Aloe claviflora KJ557859 Aloe comosa KJ557860 Aloe comptonii KJ557861 Aloe conifera KJ557862 Aloe dewetii KJ557864 Aloe dominella KJ557866 Aloe dorotheae KJ557867 Aloe ecklonis KJ557868 Aloe ellenbeckii KJ557869 Aloe falcata KJ557870 Aloe fibrosa KJ557871 Aloe fleurentinorum KJ557872 Aloe fosteri KJ557873 Aloe framesii KJ557874 Aloe gariepensis KJ557875 Aloe globuligemma KJ557876 Aloe graciliflora KJ557877 Aloe grandidentata KJ557878 Aloe greatheadii KJ557863 Aloe greatheadii KJ557879 Aloe greenii KJ557880 Aloe hereroensis KJ557881 Aloe khamiesensis KJ557884 Aloe knersvlakensis KJ557885 Aloe krapohliana KJ557887 Aloe lateritia KJ557888 Aloe leachii KJ557889 Aloe leptosiphon KJ557890 Aloe littoralis KJ557892
37

Aloe longibracteata KJ557893 Aloe macrocarpa KJ557894 Aloe maculata KJ557895 Aloe marlothii KJ557896 Aloe melanacantha KJ557897 Aloe microstigma KJ557898 Aloe minima KJ557469 Aloe mitriformis KJ557865 Aloe monotropa KJ557899 Aloe monticola KJ557900 Aloe mudenensis KJ557901 Aloe mzimbana KJ557902 Aloe parvula KJ557903 Aloe pearsonii KJ557904 Aloe peglerae KJ557905 Aloe petricola KJ557906 Aloe praetermissa KJ557907 Aloe prinslooi KJ557908 Aloe pruinosa KJ557909 Aloe reitzii KJ557910 Aloe retrospiciens KJ557911 Aloe schelpei KJ557912 Aloe secundiflora KJ557913 Aloe sinana KJ557914 Aloe speciosa KJ557915 Aloe spicata KJ557916 Aloe splendens KJ557917 Aloe striata KJ557883 Aloe striata KJ557886 Aloe succotrina KJ557918 Aloe suffulta KJ557919 Aloe suprafoliata KC893742 Aloe swynnertonii KJ557920 Aloe thraskii KJ557921 Aloe trichosantha KJ557922 Aloe umfoloziensis KJ557923 Aloe vanbalenii KJ557924 Aloe vanrooyenii KJ557925 Aloe viguieri KJ557926 Aloe vogtsii KJ557927 Aloe weloensis KJ557470 Astroloba rubriflora KJ557471
Reference for Table S1 Grace, O.M., Buerki, S., Symonds, M.R., Forest, F., Van Wyk, A.E., Smith, G.F., Klopper, R.R., Bjorå, C.S., Neale, S.,
Demissew, S., Simmonds, M.S.J. and Rønsted, N. 2015. Evolutionary history and leaf succulence as explanations for medicinal use in aloes and the global popularity of Aloe vera. BMC Evol. Biol. 15: 29.
38
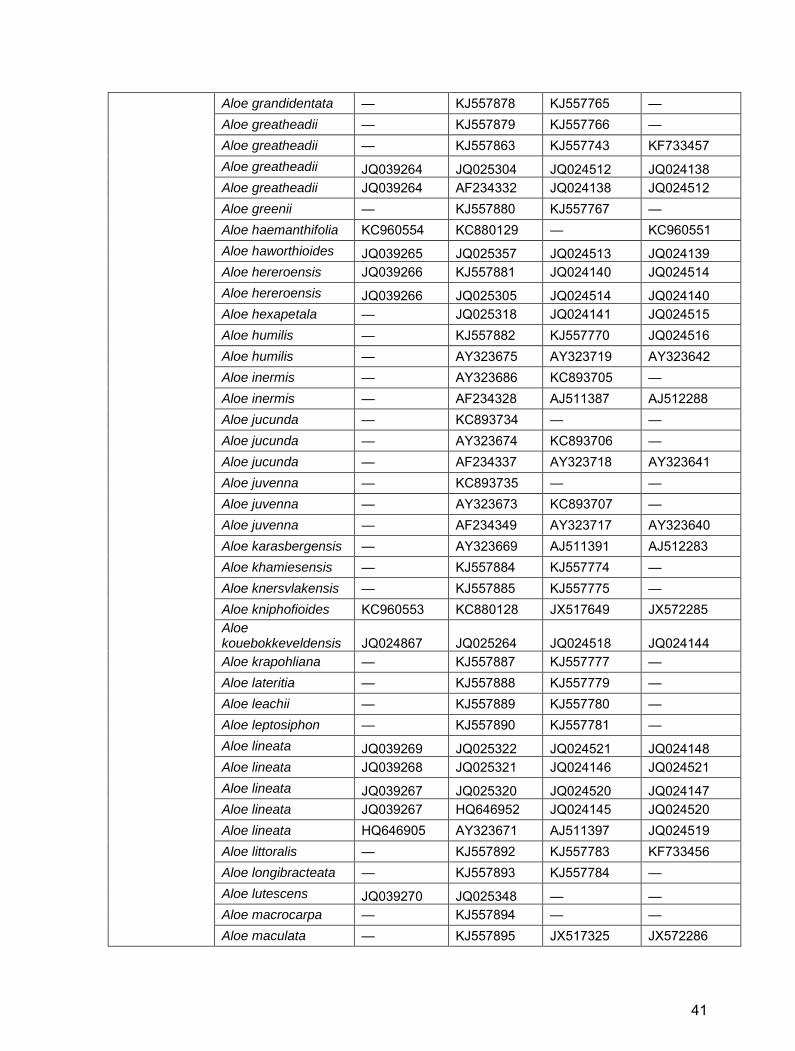
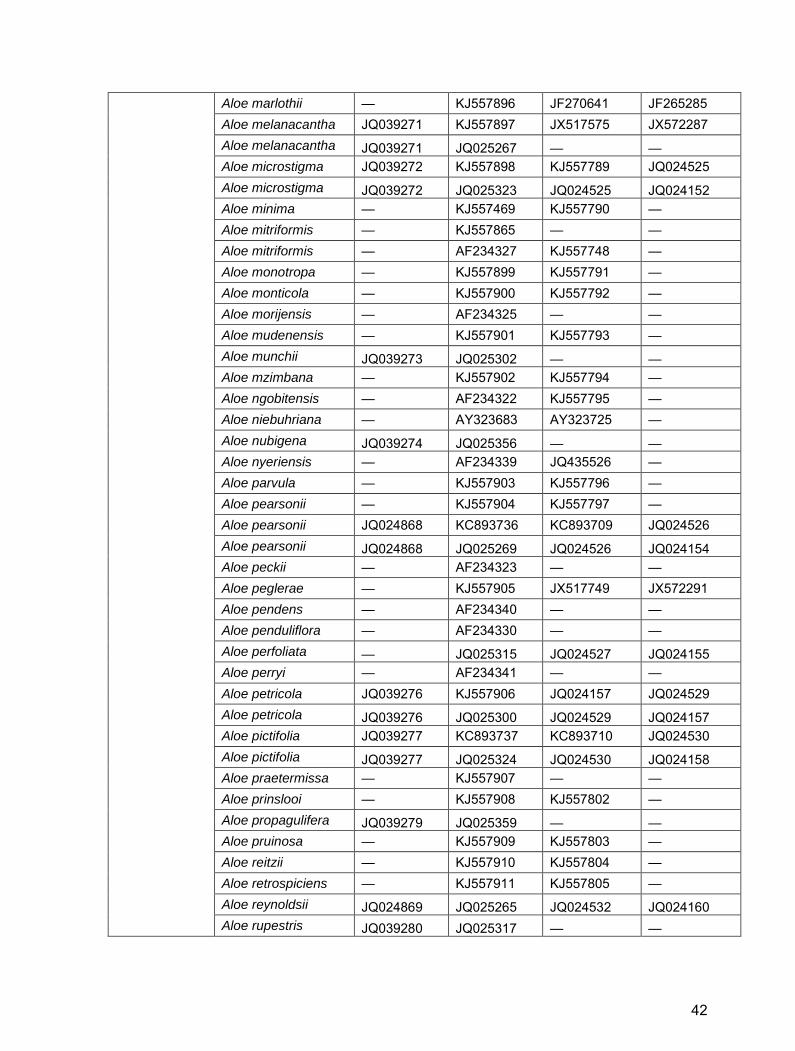
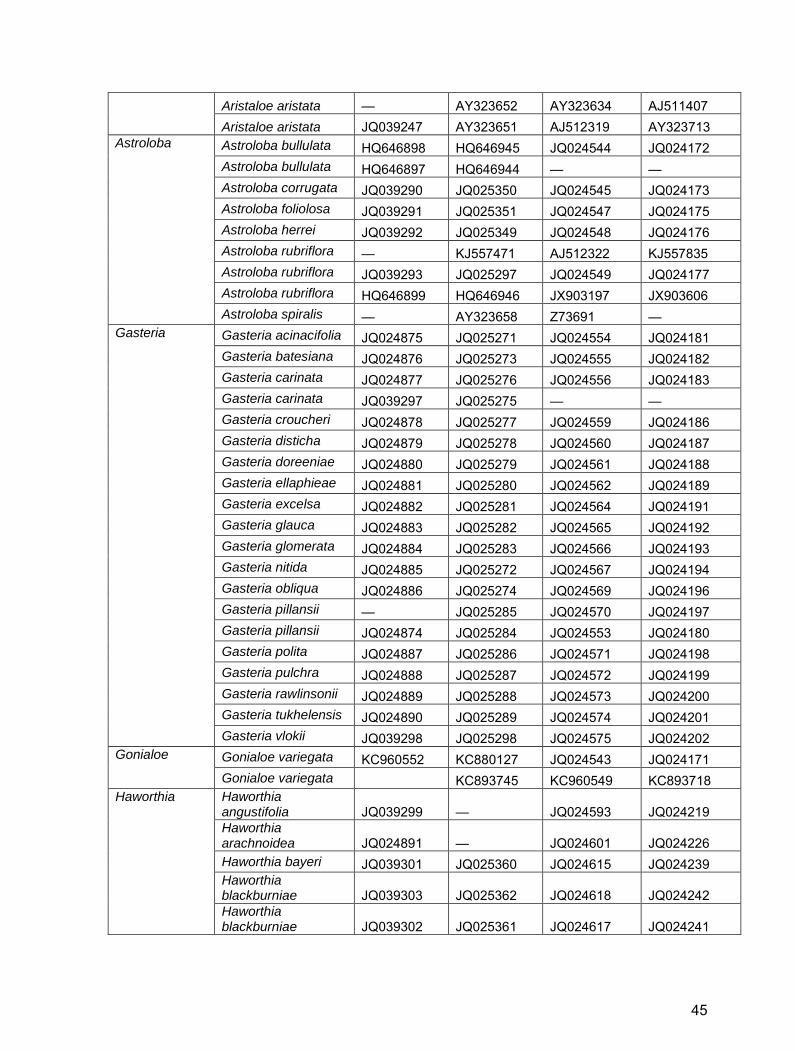
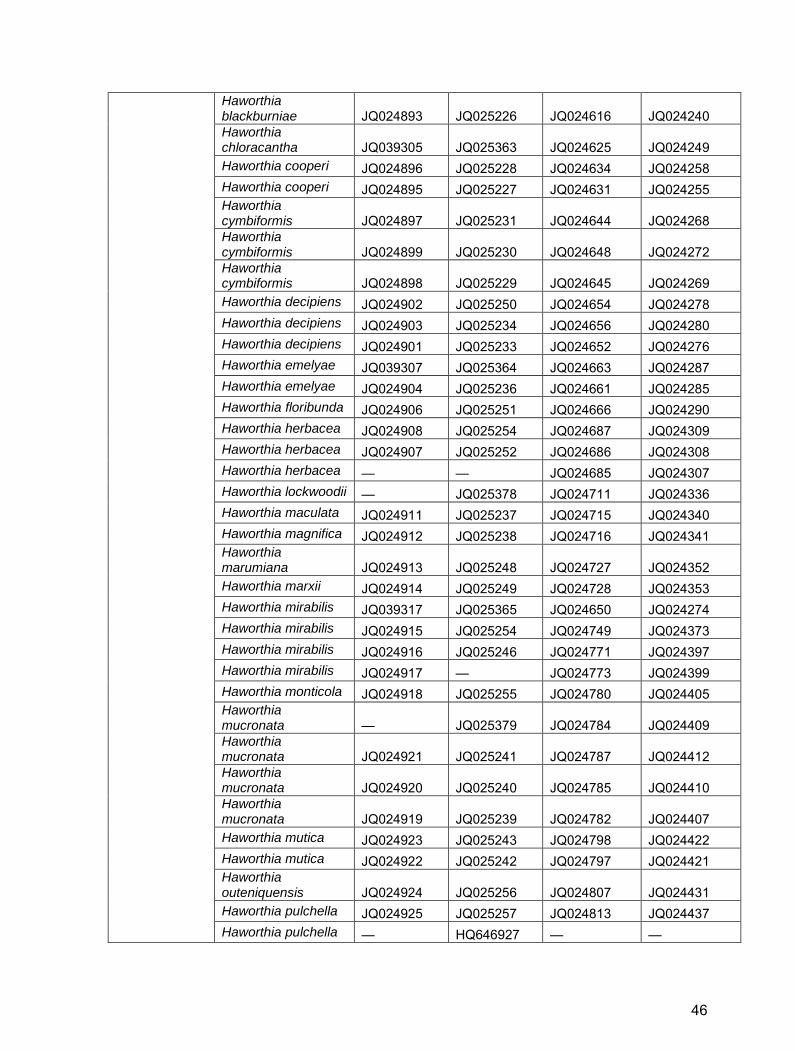
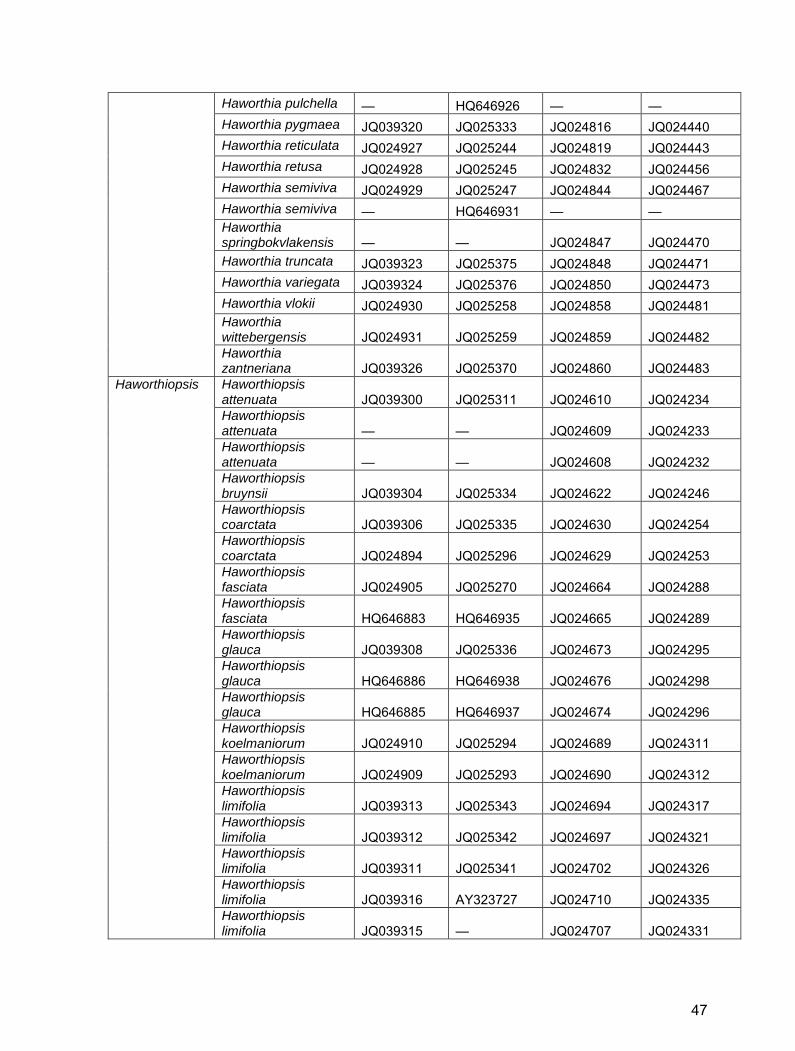
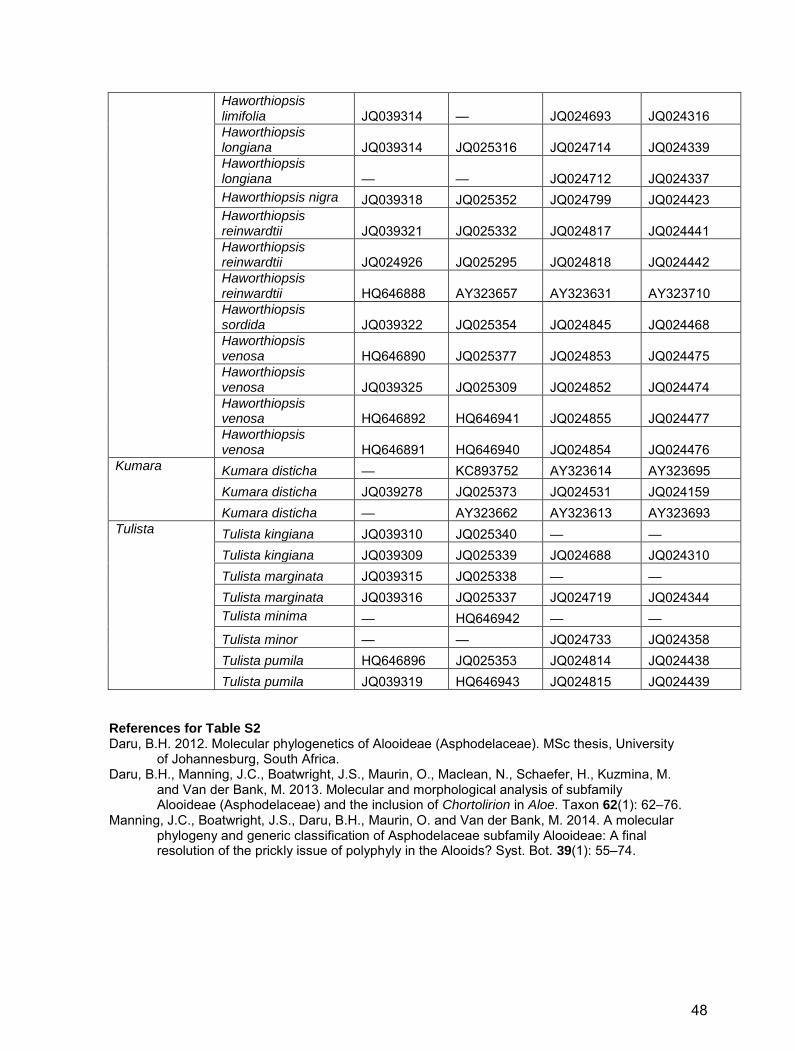
Table S2. GenBank/EBI accession numbers for Alooideae used in this study.
Genus Taxon trnH-psbA ITS1 rbcLa matK
Aloe Aloe aculeata — KJ557846 KJ557717 — Aloe acutissima — AF234348 — — Aloe affinis — KJ557847 KJ557718 — Aloe africana HQ646904 HQ646951 JX518056 JX572268 Aloe albida JQ039242 JQ025366 — — Aloe albiflora — KC893726 KC893697 — Aloe alooides JQ039243 JQ025325 — — Aloe ammophila — KJ557928 — — Aloe ammophila — AF234347 KJ557827 — Aloe angelica JQ039244 JQ025310 — JQ024109 Aloe anivoranoensis JQ039245 JQ025371 — — Aloe ankoberensis — KJ557848 KJ557719 — Aloe arborescens — KC893727 KC893698 JX572272 Aloe arborescens JQ039246 JQ025326 JQ024486 JQ024110 Aloe arborescens JQ279781 AY323681 JX518144 JQ412310 Aloe arborescens JQ039246 AY323680 AY323723 AY323646 Aloe arborescens GQ434898 AF234333 AY323722 AY323645 Aloe arenicola JQ024863 KJ557849 JQ024111 JQ024487 Aloe arenicola JQ024863 JQ025268 JQ024487 JQ024111 Aloe bainesii — U24002 — — Aloe bakeri — AF234346 — Z73680 Aloe benishangulana — KJ557850 KJ557725 — Aloe bowiea HQ646901 HQ646948 JQ024116 JQ024492 Aloe branddraaiensis — KJ557851 KJ557726 — Aloe brandhamii — KJ557852 KJ557727 — Aloe brevifolia JQ039248 KJ557853 JX517854 JX572275 Aloe brevifolia JQ039248 JQ025314 — — Aloe broomii — KC893728 KC893699 — Aloe buhrii JQ024865 JQ025263 JQ024494 JQ024118 Aloe bulbillifera — KJ557854 KJ557729 — Aloe bulbillifera — AF234335 AJ511385 AJ512305 Aloe burgersfortensis
— KJ557855 KJ557730 —
Aloe bussei — KJ557856 KJ557731 — Aloe cameronii — AF234343 KJ557732 — Aloe camperi — KJ557857 KJ557733 — Aloe capitata — AY323677 AY323720 AY323643 Aloe castanea — KJ557858 KC893700 — Aloe castanea — KC893729 JQ024120 —
39
Aloe chabaudii JQ039249 JQ025299 — — Aloe challisii JQ039250 JQ025355 — — Aloe chortolirioides JQ039251 JQ025374 — — Aloe claviflora — KJ557859 KJ557738 — Aloe comosa JQ039253 KJ557860 JQ024123 JQ024498 Aloe comosa JQ039253 JQ025328 JQ024499 JQ024124 Aloe compressa — AY323678 AY323721 AY323644 Aloe comptonii — KJ557861 KJ557740 — Aloe conifera — KJ557862 KJ557742 — Aloe conifera — AY323679 AJ511383 AJ512303 Aloe cremnophila — AF234336 — — Aloe dawei — KC893730 KC893701 — Aloe deltoideodonta — KC893731 AJ511384 AJ512304 Aloe dewetii — KJ557864 KJ557746 — Aloe dewinteri JQ039254 JQ025303 JQ024500 JQ024125 Aloe doei — AY323682 AY323724 AY323647 Aloe dominella — KJ557866 JX518154 JX572279 Aloe dorotheae — KJ557867 KJ557750 — Aloe ecklonis JQ039257 KJ557868 KJ557751 JX572280 Aloe ecklonis JQ039257 JQ025307 — — Aloe ellenbeckii — KJ557869 KJ557752 — Aloe excelsa JQ039259 KC893732 JF270640 JF265284 Aloe excelsa JQ039259 JQ025301 — — Aloe falcata — KJ557870 KJ557754 — Aloe ferox JQ279782 KC893733 KC893704 JX572282 Aloe ferox JQ039260 JQ025327 — — Aloe ferox JQ039260 AF234338 JX518209 JQ025022 Aloe fibrosa — KJ557871 KJ557755 — Aloe fleurentinorum — KJ557872 KJ557756 — Aloe forbesii — AY323688 KJ557758 — Aloe forbesii — AF234342 AJ511389 AJ512308 Aloe fosteri — KJ557873 KJ557759 JQ024506 Aloe fouriei JQ039261 JQ025358 — — Aloe framesii — KJ557874 KJ557760 — Aloe gariepensis — KJ557875 KJ557761 — Aloe glauca JQ039262 JQ025313 JQ024508 JQ024134 Aloe glauca — AY323670 KJ557762 JQ024507 Aloe glauca JQ039262 AF234344 JQ024134 AJ512313 Aloe globuligemma — KJ557876 KJ557763 JQ024509 Aloe graciliflora — KJ557877 KJ557764 —
40
Aloe grandidentata — KJ557878 KJ557765 — Aloe greatheadii — KJ557879 KJ557766 — Aloe greatheadii — KJ557863 KJ557743 KF733457 Aloe greatheadii JQ039264 JQ025304 JQ024512 JQ024138 Aloe greatheadii JQ039264 AF234332 JQ024138 JQ024512 Aloe greenii — KJ557880 KJ557767 — Aloe haemanthifolia KC960554 KC880129 — KC960551 Aloe haworthioides JQ039265 JQ025357 JQ024513 JQ024139 Aloe hereroensis JQ039266 KJ557881 JQ024140 JQ024514 Aloe hereroensis JQ039266 JQ025305 JQ024514 JQ024140 Aloe hexapetala — JQ025318 JQ024141 JQ024515 Aloe humilis — KJ557882 KJ557770 JQ024516 Aloe humilis — AY323675 AY323719 AY323642 Aloe inermis — AY323686 KC893705 — Aloe inermis — AF234328 AJ511387 AJ512288 Aloe jucunda — KC893734 — — Aloe jucunda — AY323674 KC893706 — Aloe jucunda — AF234337 AY323718 AY323641 Aloe juvenna — KC893735 — — Aloe juvenna — AY323673 KC893707 — Aloe juvenna — AF234349 AY323717 AY323640 Aloe karasbergensis — AY323669 AJ511391 AJ512283 Aloe khamiesensis — KJ557884 KJ557774 — Aloe knersvlakensis — KJ557885 KJ557775 — Aloe kniphofioides KC960553 KC880128 JX517649 JX572285 Aloe kouebokkeveldensis JQ024867 JQ025264 JQ024518 JQ024144 Aloe krapohliana — KJ557887 KJ557777 — Aloe lateritia — KJ557888 KJ557779 — Aloe leachii — KJ557889 KJ557780 — Aloe leptosiphon — KJ557890 KJ557781 — Aloe lineata JQ039269 JQ025322 JQ024521 JQ024148 Aloe lineata JQ039268 JQ025321 JQ024146 JQ024521 Aloe lineata JQ039267 JQ025320 JQ024520 JQ024147 Aloe lineata JQ039267 HQ646952 JQ024145 JQ024520 Aloe lineata HQ646905 AY323671 AJ511397 JQ024519 Aloe littoralis — KJ557892 KJ557783 KF733456 Aloe longibracteata — KJ557893 KJ557784 — Aloe lutescens JQ039270 JQ025348 — — Aloe macrocarpa — KJ557894 — — Aloe maculata — KJ557895 JX517325 JX572286
41
Aloe marlothii — KJ557896 JF270641 JF265285 Aloe melanacantha JQ039271 KJ557897 JX517575 JX572287 Aloe melanacantha JQ039271 JQ025267 — — Aloe microstigma JQ039272 KJ557898 KJ557789 JQ024525 Aloe microstigma JQ039272 JQ025323 JQ024525 JQ024152 Aloe minima — KJ557469 KJ557790 — Aloe mitriformis — KJ557865 — — Aloe mitriformis — AF234327 KJ557748 — Aloe monotropa — KJ557899 KJ557791 — Aloe monticola — KJ557900 KJ557792 — Aloe morijensis — AF234325 — — Aloe mudenensis — KJ557901 KJ557793 — Aloe munchii JQ039273 JQ025302 — — Aloe mzimbana — KJ557902 KJ557794 — Aloe ngobitensis — AF234322 KJ557795 — Aloe niebuhriana — AY323683 AY323725 — Aloe nubigena JQ039274 JQ025356 — — Aloe nyeriensis — AF234339 JQ435526 — Aloe parvula — KJ557903 KJ557796 — Aloe pearsonii — KJ557904 KJ557797 — Aloe pearsonii JQ024868 KC893736 KC893709 JQ024526 Aloe pearsonii JQ024868 JQ025269 JQ024526 JQ024154 Aloe peckii — AF234323 — — Aloe peglerae — KJ557905 JX517749 JX572291 Aloe pendens — AF234340 — — Aloe penduliflora — AF234330 — — Aloe perfoliata — JQ025315 JQ024527 JQ024155 Aloe perryi — AF234341 — — Aloe petricola JQ039276 KJ557906 JQ024157 JQ024529 Aloe petricola JQ039276 JQ025300 JQ024529 JQ024157 Aloe pictifolia JQ039277 KC893737 KC893710 JQ024530 Aloe pictifolia JQ039277 JQ025324 JQ024530 JQ024158 Aloe praetermissa — KJ557907 — — Aloe prinslooi — KJ557908 KJ557802 — Aloe propagulifera JQ039279 JQ025359 — — Aloe pruinosa — KJ557909 KJ557803 — Aloe reitzii — KJ557910 KJ557804 — Aloe retrospiciens — KJ557911 KJ557805 — Aloe reynoldsii JQ024869 JQ025265 JQ024532 JQ024160 Aloe rupestris JQ039280 JQ025317 — —
42
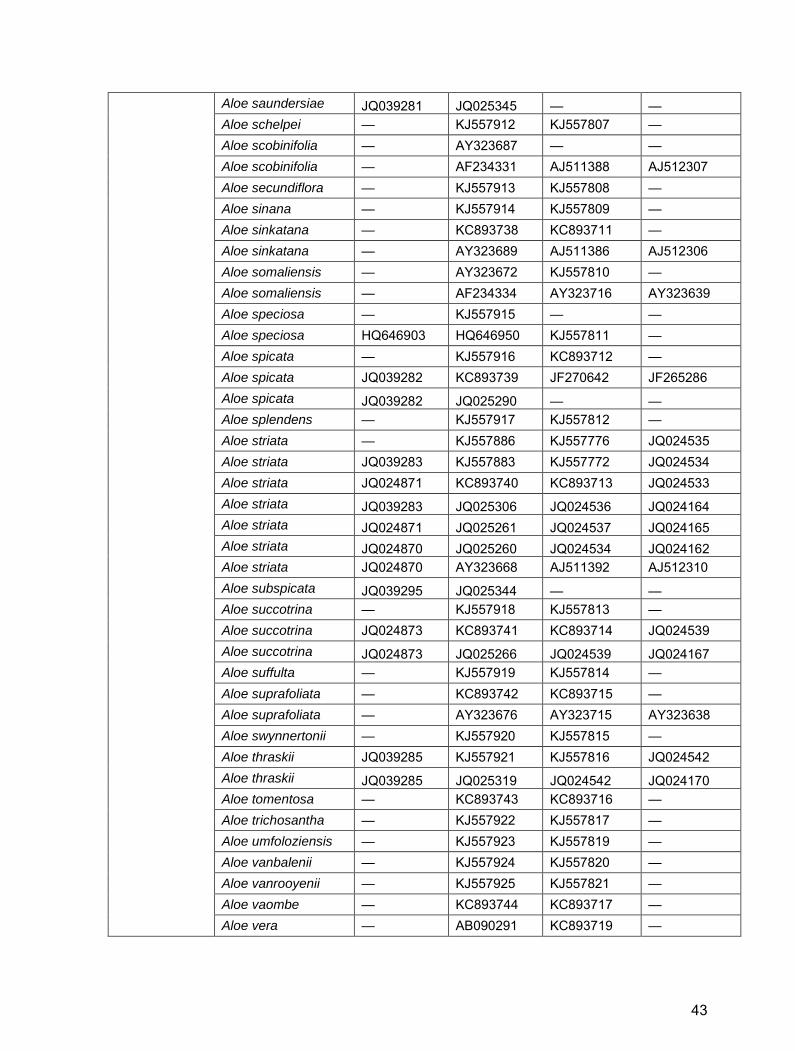
Aloe saundersiae JQ039281 JQ025345 — — Aloe schelpei — KJ557912 KJ557807 — Aloe scobinifolia — AY323687 — — Aloe scobinifolia — AF234331 AJ511388 AJ512307 Aloe secundiflora — KJ557913 KJ557808 — Aloe sinana — KJ557914 KJ557809 — Aloe sinkatana — KC893738 KC893711 — Aloe sinkatana — AY323689 AJ511386 AJ512306 Aloe somaliensis — AY323672 KJ557810 — Aloe somaliensis — AF234334 AY323716 AY323639 Aloe speciosa — KJ557915 — — Aloe speciosa HQ646903 HQ646950 KJ557811 — Aloe spicata — KJ557916 KC893712 — Aloe spicata JQ039282 KC893739 JF270642 JF265286 Aloe spicata JQ039282 JQ025290 — — Aloe splendens — KJ557917 KJ557812 — Aloe striata — KJ557886 KJ557776 JQ024535 Aloe striata JQ039283 KJ557883 KJ557772 JQ024534 Aloe striata JQ024871 KC893740 KC893713 JQ024533 Aloe striata JQ039283 JQ025306 JQ024536 JQ024164 Aloe striata JQ024871 JQ025261 JQ024537 JQ024165 Aloe striata JQ024870 JQ025260 JQ024534 JQ024162 Aloe striata JQ024870 AY323668 AJ511392 AJ512310 Aloe subspicata JQ039295 JQ025344 — — Aloe succotrina — KJ557918 KJ557813 — Aloe succotrina JQ024873 KC893741 KC893714 JQ024539 Aloe succotrina JQ024873 JQ025266 JQ024539 JQ024167 Aloe suffulta — KJ557919 KJ557814 — Aloe suprafoliata — KC893742 KC893715 — Aloe suprafoliata — AY323676 AY323715 AY323638 Aloe swynnertonii — KJ557920 KJ557815 — Aloe thraskii JQ039285 KJ557921 KJ557816 JQ024542 Aloe thraskii JQ039285 JQ025319 JQ024542 JQ024170 Aloe tomentosa — KC893743 KC893716 — Aloe trichosantha — KJ557922 KJ557817 — Aloe umfoloziensis — KJ557923 KJ557819 — Aloe vanbalenii — KJ557924 KJ557820 — Aloe vanrooyenii — KJ557925 KJ557821 — Aloe vaombe — KC893744 KC893717 — Aloe vera — AB090291 KC893719 —
43

Aloe vera — AB090290 JQ276402 — Aloe vera — AB090289 JN228939 — Aloe vera — AB090288 GQ434051 — Aloe vera JQ899438 AB090287 GQ434050 — Aloe vera GQ434899 AB090286 GQ434049 — Aloe vera GQ434897 AB090285 GQ434048 L05029 Aloe vera GQ434896 AB090284 GQ434047 JQ273907 Aloe vera GQ434895 AB090283 AY323726 AY323649 Aloe vera GQ434894 AB090282 AJ511390 AJ512309 Aloe verecunda JQ039286 JQ025346 — — Aloe viguieri — KJ557926 AJ511382 AJ512302 Aloe vogtsii — KJ557927 KJ557823 — Aloe vossii JQ039287 JQ025347 — — Aloe vryheidensis JQ039288 JQ025308 — — Aloe weloensis — KJ557470 KJ557825 — Aloe zebrina — KC893747 KC893720 —
Aloiampelos
Aloiampelos ciliaris JQ024866 JQ025292 JQ024496 JQ024121 Aloiampelos ciliaris — AY323663 JQ024496 AJ511379 Aloiampelos commixta JQ039252 JQ025329 JQ024497 JQ024122 Aloiampelos gracilis JQ039263 JQ025330 JQ024510 JQ024136 Aloiampelos striatula JQ024872 JQ025291 JQ024538 JQ024166 Aloiampelos tenuior JQ039284 JQ025331 JQ024541 JQ024169 Aloiampelos tenuior — HQ646949 — —
Aloidendron
Aloidendron barberae JQ024864 JQ025262 JQ024489 JQ024113 Aloidendron barberae — AY323661 JX572274 JX518237 Aloidendron dichotomum JQ039255 KC893748 — — Aloidendron dichotomum JQ039256 JQ025368 JQ024501 JQ024126 Aloidendron dichotomum HQ646906 HQ646953 — KC893721 Aloidendron eminens JQ039258 JQ025369 — — Aloidendron pillansii — KC893749 AJ512292 AJ511369 Aloidendron pillansii JQ039255 JQ025372 JQ024502 JQ024127 Aloidendron pillansii — AY323659 — KC893722 Aloidendron ramosissimum KC893723 KC893750 — — Aloidendron ramosissimum JQ039256 JQ025367 JQ024503 JQ024128 Aloidendron ramosissimum AJ511370 AY323660 AJ512293 —
Aristaloe Aristaloe aristata — JQ025312 JQ024488 JQ024112
44
Aristaloe aristata — AY323652 AY323634 AJ511407 Aristaloe aristata JQ039247 AY323651 AJ512319 AY323713
Astroloba
Astroloba bullulata HQ646898 HQ646945 JQ024544 JQ024172 Astroloba bullulata HQ646897 HQ646944 — — Astroloba corrugata JQ039290 JQ025350 JQ024545 JQ024173 Astroloba foliolosa JQ039291 JQ025351 JQ024547 JQ024175 Astroloba herrei JQ039292 JQ025349 JQ024548 JQ024176 Astroloba rubriflora — KJ557471 AJ512322 KJ557835 Astroloba rubriflora JQ039293 JQ025297 JQ024549 JQ024177 Astroloba rubriflora HQ646899 HQ646946 JX903197 JX903606 Astroloba spiralis — AY323658 Z73691 —
Gasteria
Gasteria acinacifolia JQ024875 JQ025271 JQ024554 JQ024181 Gasteria batesiana JQ024876 JQ025273 JQ024555 JQ024182 Gasteria carinata JQ024877 JQ025276 JQ024556 JQ024183 Gasteria carinata JQ039297 JQ025275 — — Gasteria croucheri JQ024878 JQ025277 JQ024559 JQ024186 Gasteria disticha JQ024879 JQ025278 JQ024560 JQ024187 Gasteria doreeniae JQ024880 JQ025279 JQ024561 JQ024188 Gasteria ellaphieae JQ024881 JQ025280 JQ024562 JQ024189 Gasteria excelsa JQ024882 JQ025281 JQ024564 JQ024191 Gasteria glauca JQ024883 JQ025282 JQ024565 JQ024192 Gasteria glomerata JQ024884 JQ025283 JQ024566 JQ024193 Gasteria nitida JQ024885 JQ025272 JQ024567 JQ024194 Gasteria obliqua JQ024886 JQ025274 JQ024569 JQ024196 Gasteria pillansii — JQ025285 JQ024570 JQ024197 Gasteria pillansii JQ024874 JQ025284 JQ024553 JQ024180 Gasteria polita JQ024887 JQ025286 JQ024571 JQ024198 Gasteria pulchra JQ024888 JQ025287 JQ024572 JQ024199 Gasteria rawlinsonii JQ024889 JQ025288 JQ024573 JQ024200 Gasteria tukhelensis JQ024890 JQ025289 JQ024574 JQ024201 Gasteria vlokii JQ039298 JQ025298 JQ024575 JQ024202
Gonialoe Gonialoe variegata KC960552 KC880127 JQ024543 JQ024171 Gonialoe variegata KC893745 KC960549 KC893718
Haworthia
Haworthia angustifolia JQ039299 — JQ024593 JQ024219 Haworthia arachnoidea JQ024891 — JQ024601 JQ024226 Haworthia bayeri JQ039301 JQ025360 JQ024615 JQ024239 Haworthia blackburniae JQ039303 JQ025362 JQ024618 JQ024242 Haworthia blackburniae JQ039302 JQ025361 JQ024617 JQ024241
45
Haworthia blackburniae JQ024893 JQ025226 JQ024616 JQ024240 Haworthia chloracantha JQ039305 JQ025363 JQ024625 JQ024249 Haworthia cooperi JQ024896 JQ025228 JQ024634 JQ024258 Haworthia cooperi JQ024895 JQ025227 JQ024631 JQ024255 Haworthia cymbiformis JQ024897 JQ025231 JQ024644 JQ024268 Haworthia cymbiformis JQ024899 JQ025230 JQ024648 JQ024272 Haworthia cymbiformis JQ024898 JQ025229 JQ024645 JQ024269 Haworthia decipiens JQ024902 JQ025250 JQ024654 JQ024278 Haworthia decipiens JQ024903 JQ025234 JQ024656 JQ024280 Haworthia decipiens JQ024901 JQ025233 JQ024652 JQ024276 Haworthia emelyae JQ039307 JQ025364 JQ024663 JQ024287 Haworthia emelyae JQ024904 JQ025236 JQ024661 JQ024285 Haworthia floribunda JQ024906 JQ025251 JQ024666 JQ024290 Haworthia herbacea JQ024908 JQ025254 JQ024687 JQ024309 Haworthia herbacea JQ024907 JQ025252 JQ024686 JQ024308 Haworthia herbacea — — JQ024685 JQ024307 Haworthia lockwoodii — JQ025378 JQ024711 JQ024336 Haworthia maculata JQ024911 JQ025237 JQ024715 JQ024340 Haworthia magnifica JQ024912 JQ025238 JQ024716 JQ024341 Haworthia marumiana JQ024913 JQ025248 JQ024727 JQ024352 Haworthia marxii JQ024914 JQ025249 JQ024728 JQ024353 Haworthia mirabilis JQ039317 JQ025365 JQ024650 JQ024274 Haworthia mirabilis JQ024915 JQ025254 JQ024749 JQ024373 Haworthia mirabilis JQ024916 JQ025246 JQ024771 JQ024397 Haworthia mirabilis JQ024917 — JQ024773 JQ024399 Haworthia monticola JQ024918 JQ025255 JQ024780 JQ024405 Haworthia mucronata — JQ025379 JQ024784 JQ024409 Haworthia mucronata JQ024921 JQ025241 JQ024787 JQ024412 Haworthia mucronata JQ024920 JQ025240 JQ024785 JQ024410 Haworthia mucronata JQ024919 JQ025239 JQ024782 JQ024407 Haworthia mutica JQ024923 JQ025243 JQ024798 JQ024422 Haworthia mutica JQ024922 JQ025242 JQ024797 JQ024421 Haworthia outeniquensis JQ024924 JQ025256 JQ024807 JQ024431 Haworthia pulchella JQ024925 JQ025257 JQ024813 JQ024437 Haworthia pulchella — HQ646927 — —
46
Haworthia pulchella — HQ646926 — — Haworthia pygmaea JQ039320 JQ025333 JQ024816 JQ024440 Haworthia reticulata JQ024927 JQ025244 JQ024819 JQ024443 Haworthia retusa JQ024928 JQ025245 JQ024832 JQ024456 Haworthia semiviva JQ024929 JQ025247 JQ024844 JQ024467 Haworthia semiviva — HQ646931 — — Haworthia springbokvlakensis — — JQ024847 JQ024470 Haworthia truncata JQ039323 JQ025375 JQ024848 JQ024471 Haworthia variegata JQ039324 JQ025376 JQ024850 JQ024473 Haworthia vlokii JQ024930 JQ025258 JQ024858 JQ024481 Haworthia wittebergensis JQ024931 JQ025259 JQ024859 JQ024482 Haworthia zantneriana JQ039326 JQ025370 JQ024860 JQ024483
Haworthiopsis
Haworthiopsis attenuata JQ039300 JQ025311 JQ024610 JQ024234 Haworthiopsis attenuata — — JQ024609 JQ024233 Haworthiopsis attenuata — — JQ024608 JQ024232 Haworthiopsis bruynsii JQ039304 JQ025334 JQ024622 JQ024246 Haworthiopsis coarctata JQ039306 JQ025335 JQ024630 JQ024254 Haworthiopsis coarctata JQ024894 JQ025296 JQ024629 JQ024253 Haworthiopsis fasciata JQ024905 JQ025270 JQ024664 JQ024288 Haworthiopsis fasciata HQ646883 HQ646935 JQ024665 JQ024289 Haworthiopsis glauca JQ039308 JQ025336 JQ024673 JQ024295 Haworthiopsis glauca HQ646886 HQ646938 JQ024676 JQ024298 Haworthiopsis glauca HQ646885 HQ646937 JQ024674 JQ024296 Haworthiopsis koelmaniorum JQ024910 JQ025294 JQ024689 JQ024311 Haworthiopsis koelmaniorum JQ024909 JQ025293 JQ024690 JQ024312 Haworthiopsis limifolia JQ039313 JQ025343 JQ024694 JQ024317 Haworthiopsis limifolia JQ039312 JQ025342 JQ024697 JQ024321 Haworthiopsis limifolia JQ039311 JQ025341 JQ024702 JQ024326 Haworthiopsis limifolia JQ039316 AY323727 JQ024710 JQ024335 Haworthiopsis limifolia JQ039315 — JQ024707 JQ024331
47
Haworthiopsis limifolia JQ039314 — JQ024693 JQ024316 Haworthiopsis longiana JQ039314 JQ025316 JQ024714 JQ024339 Haworthiopsis longiana — — JQ024712 JQ024337 Haworthiopsis nigra JQ039318 JQ025352 JQ024799 JQ024423 Haworthiopsis reinwardtii JQ039321 JQ025332 JQ024817 JQ024441 Haworthiopsis reinwardtii JQ024926 JQ025295 JQ024818 JQ024442 Haworthiopsis reinwardtii HQ646888 AY323657 AY323631 AY323710 Haworthiopsis sordida JQ039322 JQ025354 JQ024845 JQ024468 Haworthiopsis venosa HQ646890 JQ025377 JQ024853 JQ024475 Haworthiopsis venosa JQ039325 JQ025309 JQ024852 JQ024474 Haworthiopsis venosa HQ646892 HQ646941 JQ024855 JQ024477 Haworthiopsis venosa HQ646891 HQ646940 JQ024854 JQ024476
Kumara Kumara disticha — KC893752 AY323614 AY323695 Kumara disticha JQ039278 JQ025373 JQ024531 JQ024159 Kumara disticha — AY323662 AY323613 AY323693
Tulista Tulista kingiana JQ039310 JQ025340 — — Tulista kingiana JQ039309 JQ025339 JQ024688 JQ024310 Tulista marginata JQ039315 JQ025338 — — Tulista marginata JQ039316 JQ025337 JQ024719 JQ024344 Tulista minima — HQ646942 — — Tulista minor — — JQ024733 JQ024358 Tulista pumila HQ646896 JQ025353 JQ024814 JQ024438 Tulista pumila JQ039319 HQ646943 JQ024815 JQ024439
References for Table S2 Daru, B.H. 2012. Molecular phylogenetics of Alooideae (Asphodelaceae). MSc thesis, University
of Johannesburg, South Africa. Daru, B.H., Manning, J.C., Boatwright, J.S., Maurin, O., Maclean, N., Schaefer, H., Kuzmina, M.
and Van der Bank, M. 2013. Molecular and morphological analysis of subfamily Alooideae (Asphodelaceae) and the inclusion of Chortolirion in Aloe. Taxon 62(1): 62–76.
Manning, J.C., Boatwright, J.S., Daru, B.H., Maurin, O. and Van der Bank, M. 2014. A molecular phylogeny and generic classification of Asphodelaceae subfamily Alooideae: A final resolution of the prickly issue of polyphyly in the Alooids? Syst. Bot. 39(1): 55–74.
48