Structural reliability
15
1 Structural Reliability • Structural limit states are often defined as a difference between Strength (R) and Load (S): • Probability of failure can be defined as • Or, using reliability f R (r), f S (s) S, R Text PDF of Failure R - S F S (s) F R (r) f S (s*) F R (s*) Text
-
Upload
independent -
Category
Documents
-
view
9 -
download
0
Transcript of Structural reliability

1
Structural Reliability
• Structural limit states are often defined as a difference
between Strength (R) and Load (S):
• Probability of failure can be defined as
• Or, using reliabilityf R
(r),
fS(s
)
S, R
Te
xt
PD
F o
f F
ailu
re
R - S
Text
Text
Text
Text
Text
Text
T e x tT e x tT e x tT e x tT e x tT e x tT e x t
FS(s)FR(r)
fS(s*)FR(s*)
Te
xt
2
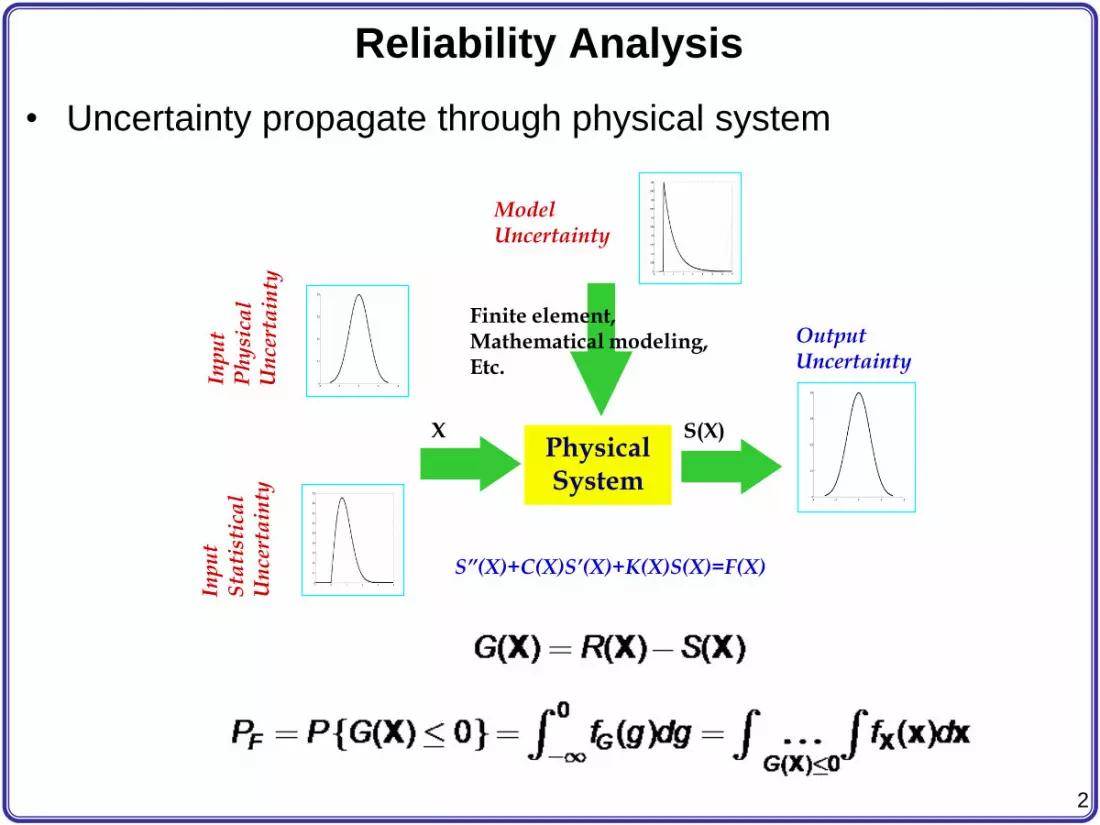
Reliability Analysis
• Uncertainty propagate through physical system
Physical System
Output Uncertainty
Inp
ut
Sta
tist
ica
l U
nce
rta
inty
Model Uncertainty
X S(X)
Finite element,Mathematical modeling,Etc.
S”(X)+C(X)S’(X)+K(X)S(X)=F(X)
3
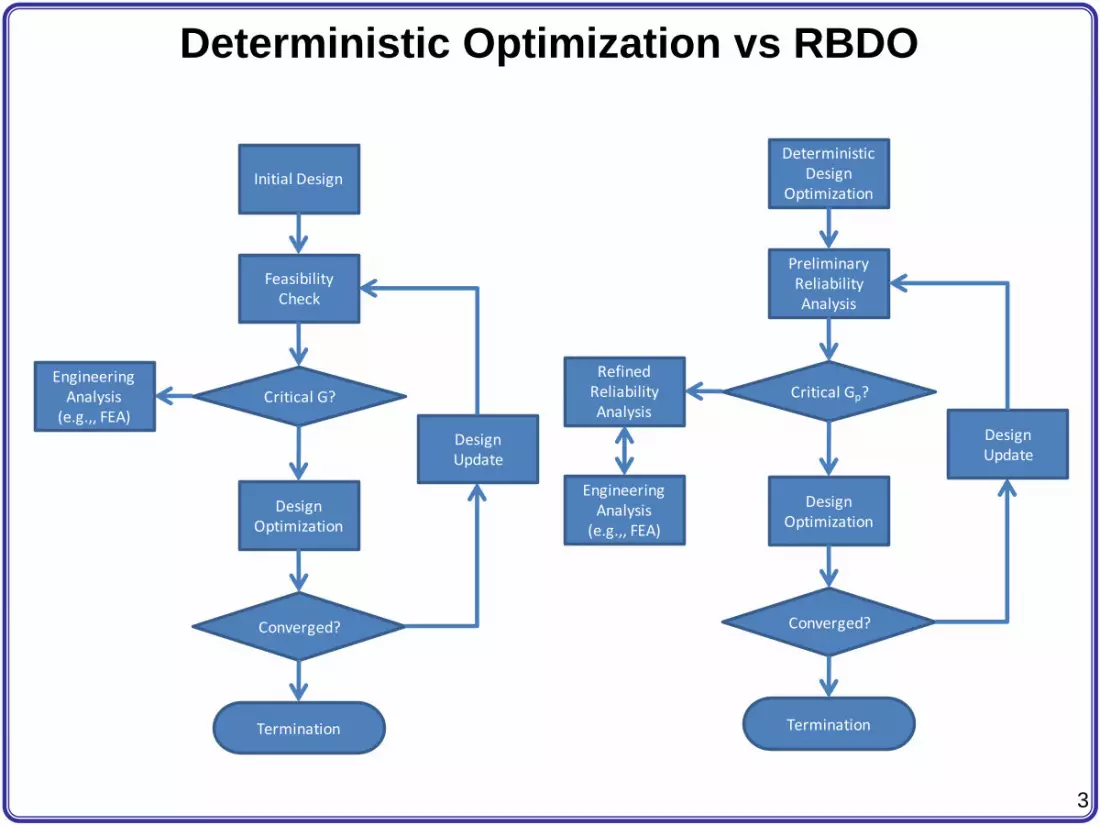
Deterministic Optimization vs RBDO
Initial Design
Feasibility Check
Design Optimization
Critical G?Engineering
Analysis(e.g.,, FEA)
Converged?
Termination
Design Update
Deterministic Design
Optimization
Preliminary Reliability Analysis
Design Optimization
Critical Gp?Refined
Reliability Analysis
Engineering Analysis
(e.g.,, FEA)
Converged?
Termination
Design Update

4
Reliability-Based Design Optimization (RBDO)
• Problem formulation
• Limit state:
• Design variable: d Random variable: X
• Target probability of failure:
• Target reliability index:
• Constraint is given in terms of probability of failure
– Need to evaluate PF at every design iteration
5
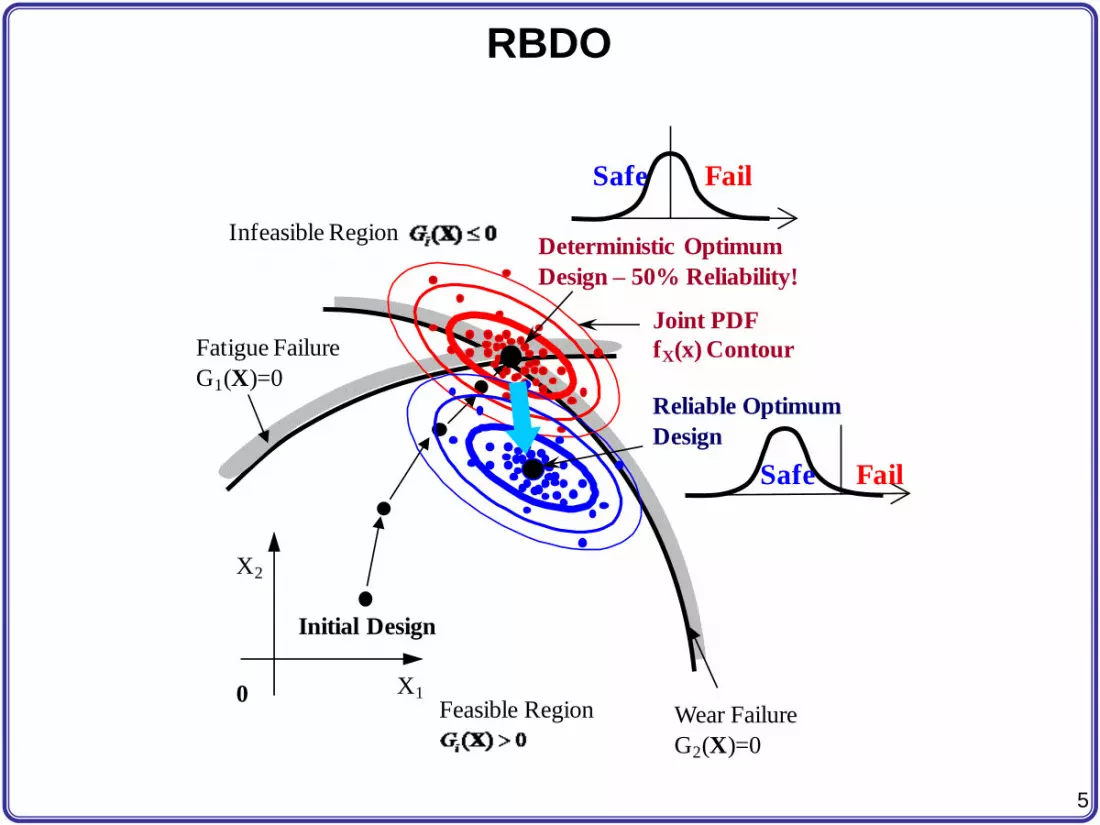
RBDO
X2
0
Fatigue Failure
G1(X)=0
Infeasible Region G i(X)>0
X1
Feasible Region
Gi(X)≤0
Initial Design
Wear Failure
G2(X)=0
Deterministic Optimum
Design – 50% Reliability!
Joint PDF
fX(x) Contour
FailSafe
Reliable Optimum
Design
FailSafe

6
Monte Carlo Simulation
• Probability of failure
0G
0G

7
Most Probable Point (MPP)-based Method
• Transform the limit state to the U-space
• Need to find MPP point
• Calculate reliability index
X2
0
Failure Surfaceg(X)=0
Failure Regiong(X)<0
X1
Safe Regiong(X)>0
Mean Value Design Point
Joint PDFfX(x) Contour
U2
U1
Pf
Failure Regiong(U)<0
Most Probable Region to Fail
FORM
Failure Surfaceg(U)=0
SORM
Safe Regiong(U)>0
0
Reliability
Index
Joint PDF fU(u)
Joint PDFfU(u) Contour
MPP u*
Mapping T

8
MPP Search Method
• Reliability appears as a constraint in optimization
• Reliability index approach vs Performance measure approach

9
Reliability Index Approach (RIA)
• Find S,FORM using FORM in U-space
• HL-RF Method
• Good for reliability analysis
• Expensive with MCS and MPP-based method when reliability
is high
• MPP-based method can be unstable when reliability if high or
the limit state is highly nonlinear

10
RIA-RBDO
• RIA-RBDO:
Feasible set
11
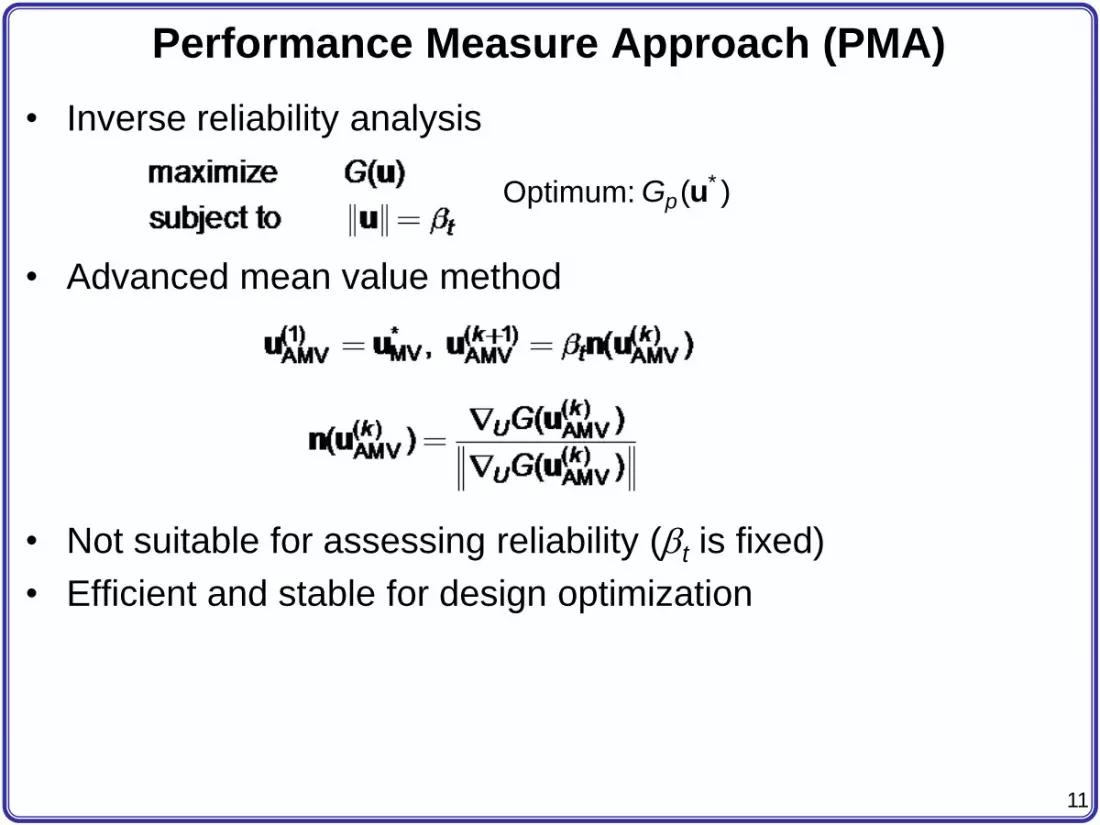
Performance Measure Approach (PMA)
• Inverse reliability analysis
• Advanced mean value method
• Not suitable for assessing reliability (t is fixed)
• Efficient and stable for design optimization
Optimum: *( )pG u

12
PMA-RBDO
• PMA-RBDO

13
Reliability-based Sensitivity Analysis
• During optimization, gradient (sensitivity) needs to be
calculated at each iteration
• For RIA, gradient of reliability index w.r.t. design variable (DV)
• For PMA, gradient of performance function w.r.t. DV
• RIA:
From U = T(X; d)

14
Reliability-based Sensitivity Analysis
• Example – Normal distribution
– Design variables are d = [m, s] of Normal distribution
– Thus,
• Example – Log-Normal distribution
15
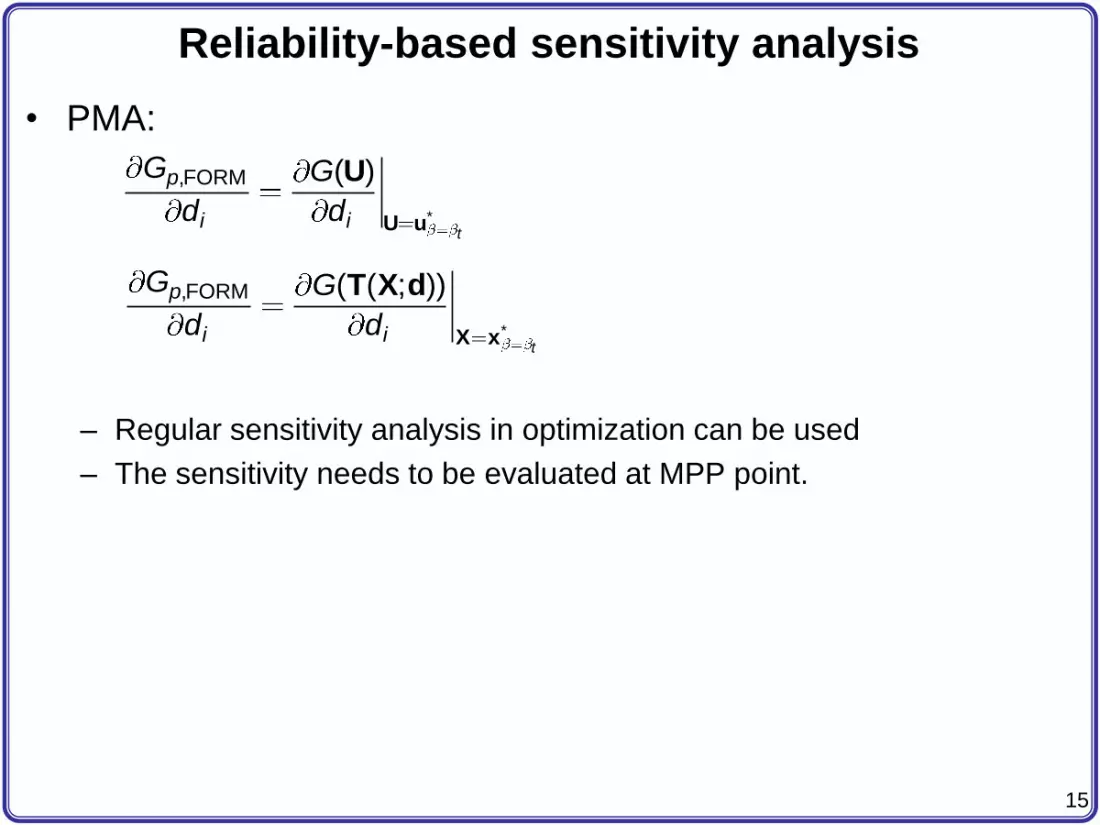
Reliability-based sensitivity analysis
• PMA:
– Regular sensitivity analysis in optimization can be used
– The sensitivity needs to be evaluated at MPP point.
*
,FORM ( )
t
p
i i
G G
d d U u
U
*
,FORM ( ( ; ))
t
p
i i
G G
d d X x
T X d