Recommended Reliability Levels for the Evaluation of Existing Bridges According to Eurocodes
Upload
independentCategory
view
3download
0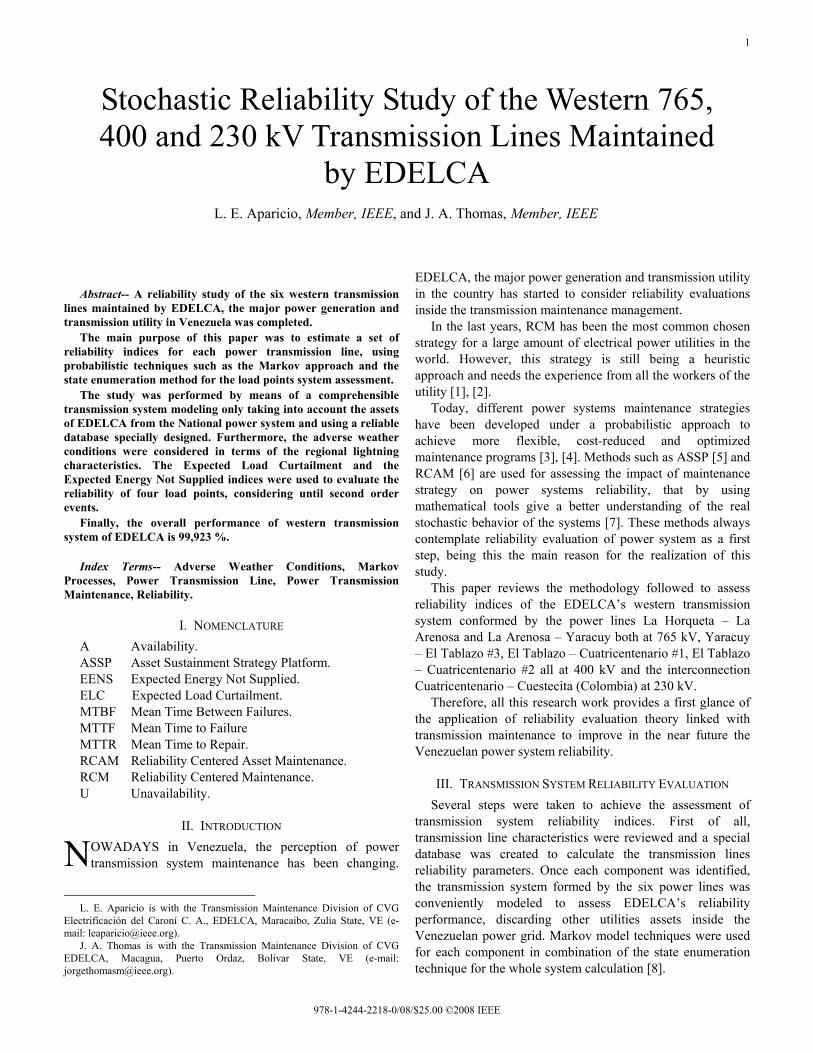
1
Abstract-- A reliability study of the six western transmission
lines maintained by EDELCA, the major power generation and transmission utility in Venezuela was completed.
The main purpose of this paper was to estimate a set of reliability indices for each power transmission line, using probabilistic techniques such as the Markov approach and the state enumeration method for the load points system assessment.
The study was performed by means of a comprehensible transmission system modeling only taking into account the assets of EDELCA from the National power system and using a reliable database specially designed. Furthermore, the adverse weather conditions were considered in terms of the regional lightning characteristics. The Expected Load Curtailment and the Expected Energy Not Supplied indices were used to evaluate the reliability of four load points, considering until second order events.
Finally, the overall performance of western transmission system of EDELCA is 99,923 %.
Index Terms-- Adverse Weather Conditions, Markov Processes, Power Transmission Line, Power Transmission Maintenance, Reliability.
I. NOMENCLATURE A Availability. ASSP Asset Sustainment Strategy Platform. EENS Expected Energy Not Supplied. ELC Expected Load Curtailment. MTBF Mean Time Between Failures. MTTF Mean Time to Failure MTTR Mean Time to Repair. RCAM Reliability Centered Asset Maintenance. RCM Reliability Centered Maintenance. U Unavailability.
II. INTRODUCTION OWADAYS in Venezuela, the perception of power transmission system maintenance has been changing.
L. E. Aparicio is with the Transmission Maintenance Division of CVG
Electrificación del Caroní C. A., EDELCA, Maracaibo, Zulia State, VE (e-mail: [email protected]).
J. A. Thomas is with the Transmission Maintenance Division of CVG EDELCA, Macagua, Puerto Ordaz, Bolívar State, VE (e-mail: [email protected]).
EDELCA, the major power generation and transmission utility in the country has started to consider reliability evaluations inside the transmission maintenance management.
In the last years, RCM has been the most common chosen strategy for a large amount of electrical power utilities in the world. However, this strategy is still being a heuristic approach and needs the experience from all the workers of the utility [1], [2].
Today, different power systems maintenance strategies have been developed under a probabilistic approach to achieve more flexible, cost-reduced and optimized maintenance programs [3], [4]. Methods such as ASSP [5] and RCAM [6] are used for assessing the impact of maintenance strategy on power systems reliability, that by using mathematical tools give a better understanding of the real stochastic behavior of the systems [7]. These methods always contemplate reliability evaluation of power system as a first step, being this the main reason for the realization of this study.
This paper reviews the methodology followed to assess reliability indices of the EDELCA’s western transmission system conformed by the power lines La Horqueta – La Arenosa and La Arenosa – Yaracuy both at 765 kV, Yaracuy – El Tablazo #3, El Tablazo – Cuatricentenario #1, El Tablazo – Cuatricentenario #2 all at 400 kV and the interconnection Cuatricentenario – Cuestecita (Colombia) at 230 kV.
Therefore, all this research work provides a first glance of the application of reliability evaluation theory linked with transmission maintenance to improve in the near future the Venezuelan power system reliability.
III. TRANSMISSION SYSTEM RELIABILITY EVALUATION Several steps were taken to achieve the assessment of
transmission system reliability indices. First of all, transmission line characteristics were reviewed and a special database was created to calculate the transmission lines reliability parameters. Once each component was identified, the transmission system formed by the six power lines was conveniently modeled to assess EDELCA’s reliability performance, discarding other utilities assets inside the Venezuelan power grid. Markov model techniques were used for each component in combination of the state enumeration technique for the whole system calculation [8].
Stochastic Reliability Study of the Western 765, 400 and 230 kV Transmission Lines Maintained
by EDELCA L. E. Aparicio, Member, IEEE, and J. A. Thomas, Member, IEEE
N
978-1-4244-2218-0/08/$25.00 ©2008 IEEE
2
The box diagram in Fig. 1 reviews the basic evaluation methodology.
Fig. 1. Basic proceeding methodology.
A. Forced Outages Database Transmission lines forced outage statistics were taken from
the Operations Engineering Department of EDELCA. A special database based on [9] was created in Microsoft Excel™ spreadsheets.
Scheduled outages as maintenance outages were not included in this evaluation [8]. The stored failures were classified in Terminal related forced outages and Line related forced outages [10].
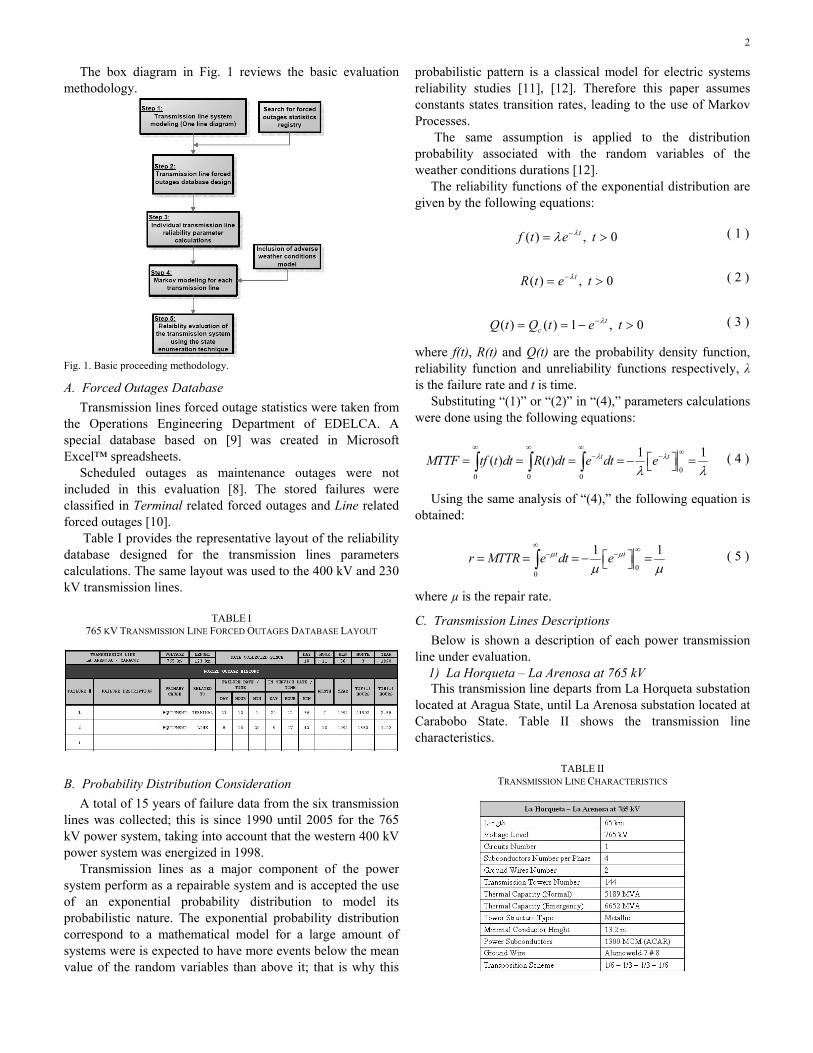
Table I provides the representative layout of the reliability database designed for the transmission lines parameters calculations. The same layout was used to the 400 kV and 230 kV transmission lines.
TABLE I
765 KV TRANSMISSION LINE FORCED OUTAGES DATABASE LAYOUT
B. Probability Distribution Consideration A total of 15 years of failure data from the six transmission
lines was collected; this is since 1990 until 2005 for the 765 kV power system, taking into account that the western 400 kV power system was energized in 1998.
Transmission lines as a major component of the power system perform as a repairable system and is accepted the use of an exponential probability distribution to model its probabilistic nature. The exponential probability distribution correspond to a mathematical model for a large amount of systems were is expected to have more events below the mean value of the random variables than above it; that is why this
probabilistic pattern is a classical model for electric systems reliability studies [11], [12]. Therefore this paper assumes constants states transition rates, leading to the use of Markov Processes.
The same assumption is applied to the distribution probability associated with the random variables of the weather conditions durations [12].
The reliability functions of the exponential distribution are given by the following equations:
( ) , 0tf t e tλλ −= > ( 1 )
( ) , 0tR t e tλ−= > ( 2 )
( ) ( ) 1 , 0tcQ t Q t e tλ−= = − > ( 3 )
where f(t), R(t) and Q(t) are the probability density function, reliability function and unreliability functions respectively, λ is the failure rate and t is time.
Substituting “(1)” or “(2)” in “(4),” parameters calculations were done using the following equations:
00 0 0
1 1( ) ( ) t tMTTF tf t dt R t dt e dt eλ λ
λ λ
∞ ∞ ∞ ∞− −⎡ ⎤= = = = − =⎣ ⎦∫ ∫ ∫ ( 4 )
Using the same analysis of “(4),” the following equation is obtained:
00
1 1t tr MTTR e dt eμ μ
μ μ
∞ ∞− −⎡ ⎤= = = − =⎣ ⎦∫ ( 5 )
where µ is the repair rate.
C. Transmission Lines Descriptions Below is shown a description of each power transmission
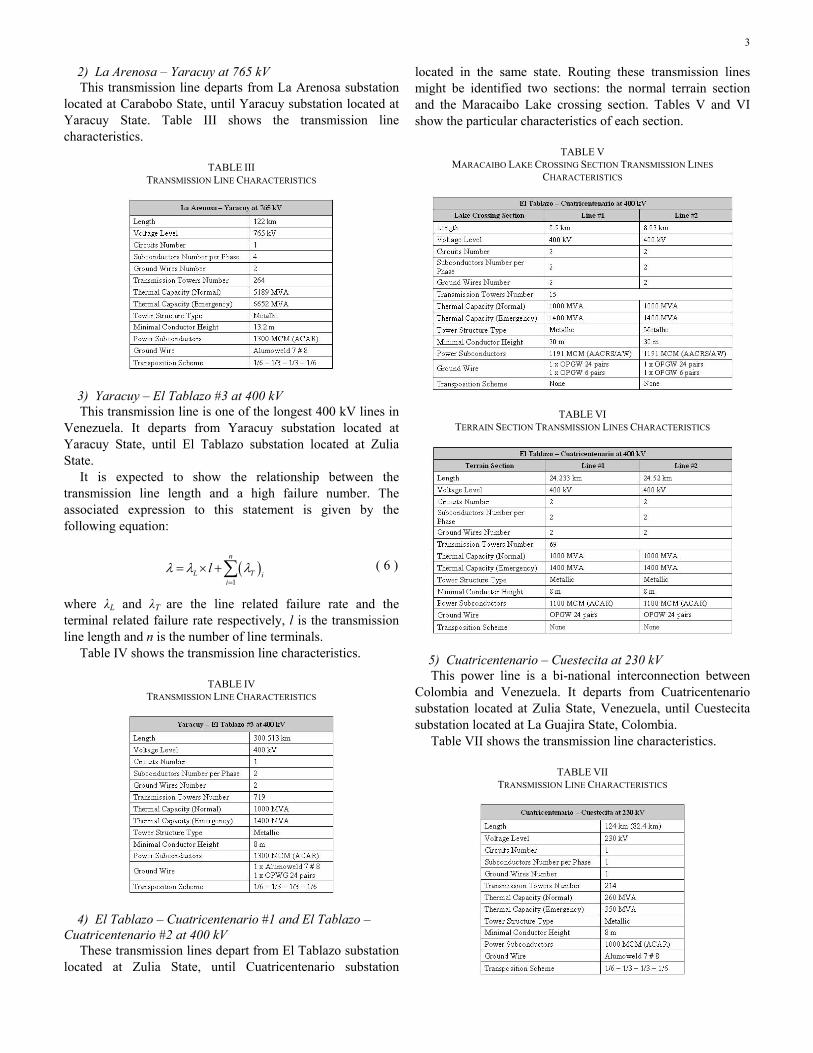
line under evaluation. 1) La Horqueta – La Arenosa at 765 kV
This transmission line departs from La Horqueta substation located at Aragua State, until La Arenosa substation located at Carabobo State. Table II shows the transmission line characteristics.
TABLE II
TRANSMISSION LINE CHARACTERISTICS
3
2) La Arenosa – Yaracuy at 765 kV This transmission line departs from La Arenosa substation
located at Carabobo State, until Yaracuy substation located at Yaracuy State. Table III shows the transmission line characteristics.
TABLE III
TRANSMISSION LINE CHARACTERISTICS
3) Yaracuy – El Tablazo #3 at 400 kV This transmission line is one of the longest 400 kV lines in
Venezuela. It departs from Yaracuy substation located at Yaracuy State, until El Tablazo substation located at Zulia State.
It is expected to show the relationship between the transmission line length and a high failure number. The associated expression to this statement is given by the following equation:
( )1
n
L T ii
lλ λ λ=
= × +∑ ( 6 )
where λL and λT are the line related failure rate and the terminal related failure rate respectively, l is the transmission line length and n is the number of line terminals.
Table IV shows the transmission line characteristics.
TABLE IV TRANSMISSION LINE CHARACTERISTICS
4) El Tablazo – Cuatricentenario #1 and El Tablazo – Cuatricentenario #2 at 400 kV
These transmission lines depart from El Tablazo substation located at Zulia State, until Cuatricentenario substation
located in the same state. Routing these transmission lines might be identified two sections: the normal terrain section and the Maracaibo Lake crossing section. Tables V and VI show the particular characteristics of each section.
TABLE V
MARACAIBO LAKE CROSSING SECTION TRANSMISSION LINES CHARACTERISTICS
TABLE VI TERRAIN SECTION TRANSMISSION LINES CHARACTERISTICS
5) Cuatricentenario – Cuestecita at 230 kV This power line is a bi-national interconnection between
Colombia and Venezuela. It departs from Cuatricentenario substation located at Zulia State, Venezuela, until Cuestecita substation located at La Guajira State, Colombia.
Table VII shows the transmission line characteristics.
TABLE VII TRANSMISSION LINE CHARACTERISTICS
4
It is important to note that EDELCA maintains the firsts 82.4 km of this power transmission line, being the next 41.5 km of line responsibility of the Colombian electric power utility ISA.
D. Transmission System Modeling The Venezuelan transmission system is formed by
thousands of kilometers of power lines at different voltage levels from 115 kV, 230 kV, 400 kV and 765 kV. These assets are spread nationwide and belong to different electric power utilities as EDELCA, CADAFE, ENELVEN and EDC. This reliability study only consider the assets of EDELCA located in the Venezuelan western, and each power transmission line is assumed as a major component that can fail with line related events and terminal related events.
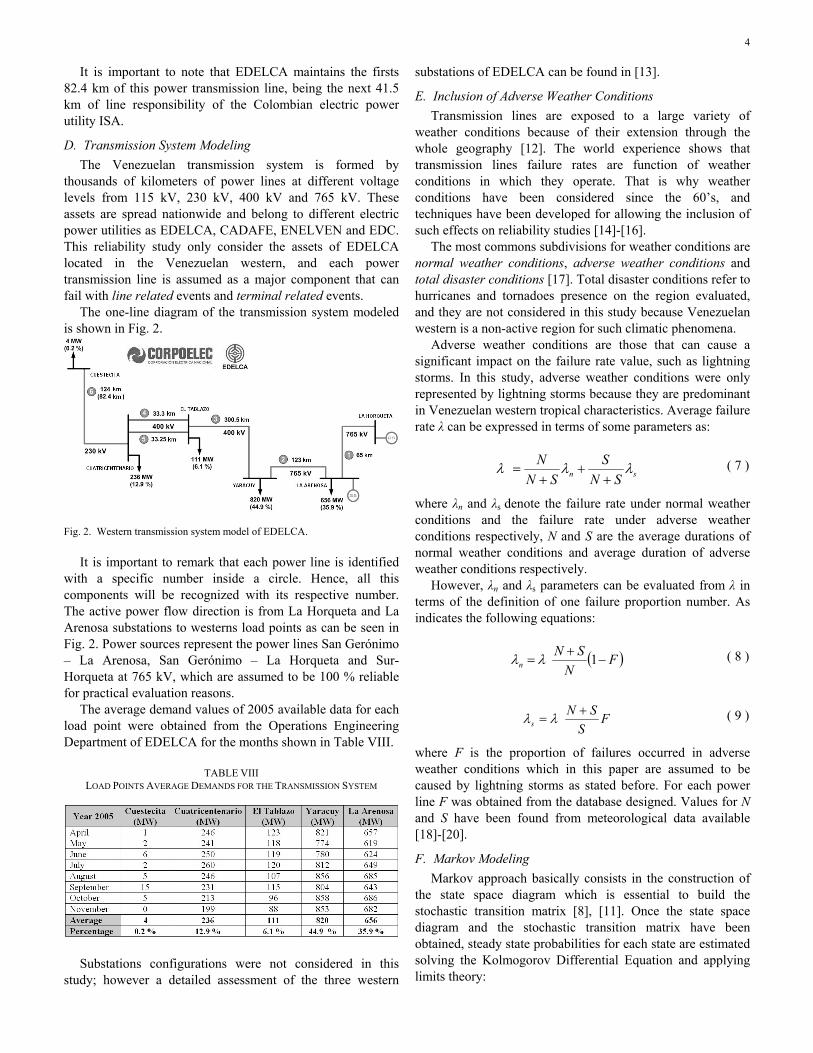
The one-line diagram of the transmission system modeled is shown in Fig. 2.
Fig. 2. Western transmission system model of EDELCA.
It is important to remark that each power line is identified
with a specific number inside a circle. Hence, all this components will be recognized with its respective number. The active power flow direction is from La Horqueta and La Arenosa substations to westerns load points as can be seen in Fig. 2. Power sources represent the power lines San Gerónimo – La Arenosa, San Gerónimo – La Horqueta and Sur- Horqueta at 765 kV, which are assumed to be 100 % reliable for practical evaluation reasons.
The average demand values of 2005 available data for each load point were obtained from the Operations Engineering Department of EDELCA for the months shown in Table VIII.
TABLE VIII
LOAD POINTS AVERAGE DEMANDS FOR THE TRANSMISSION SYSTEM
Substations configurations were not considered in this study; however a detailed assessment of the three western
substations of EDELCA can be found in [13].
E. Inclusion of Adverse Weather Conditions Transmission lines are exposed to a large variety of
weather conditions because of their extension through the whole geography [12]. The world experience shows that transmission lines failure rates are function of weather conditions in which they operate. That is why weather conditions have been considered since the 60’s, and techniques have been developed for allowing the inclusion of such effects on reliability studies [14]-[16].
The most commons subdivisions for weather conditions are normal weather conditions, adverse weather conditions and total disaster conditions [17]. Total disaster conditions refer to hurricanes and tornadoes presence on the region evaluated, and they are not considered in this study because Venezuelan western is a non-active region for such climatic phenomena.
Adverse weather conditions are those that can cause a significant impact on the failure rate value, such as lightning storms. In this study, adverse weather conditions were only represented by lightning storms because they are predominant in Venezuelan western tropical characteristics. Average failure rate λ can be expressed in terms of some parameters as:
sn SNS
SNN λλλ
++
+= ( 7 )
where λn and λs denote the failure rate under normal weather conditions and the failure rate under adverse weather conditions respectively, N and S are the average durations of normal weather conditions and average duration of adverse weather conditions respectively.
However, λn and λs parameters can be evaluated from λ in terms of the definition of one failure proportion number. As indicates the following equations:
( )FN
SNn −
+= 1λλ ( 8 )
FS
SNs
+= λλ ( 9 )
where F is the proportion of failures occurred in adverse weather conditions which in this paper are assumed to be caused by lightning storms as stated before. For each power line F was obtained from the database designed. Values for N and S have been found from meteorological data available [18]-[20].
F. Markov Modeling Markov approach basically consists in the construction of
the state space diagram which is essential to build the stochastic transition matrix [8], [11]. Once the state space diagram and the stochastic transition matrix have been obtained, steady state probabilities for each state are estimated solving the Kolmogorov Differential Equation and applying limits theory:
5
( ) . ( )d t tdt
=P M P (10 )
( )limt
t→∞
=P P ( 11 )
where M is the stochastic transition matrix and P is the steady state probabilities vector.
Markov approach was applied incorporating adverse weather conditions states for each reliability block, noting that for this study each block can be a single power transmission line or two-parallel configuration of power transmission lines. 1) Single Line Markov Model
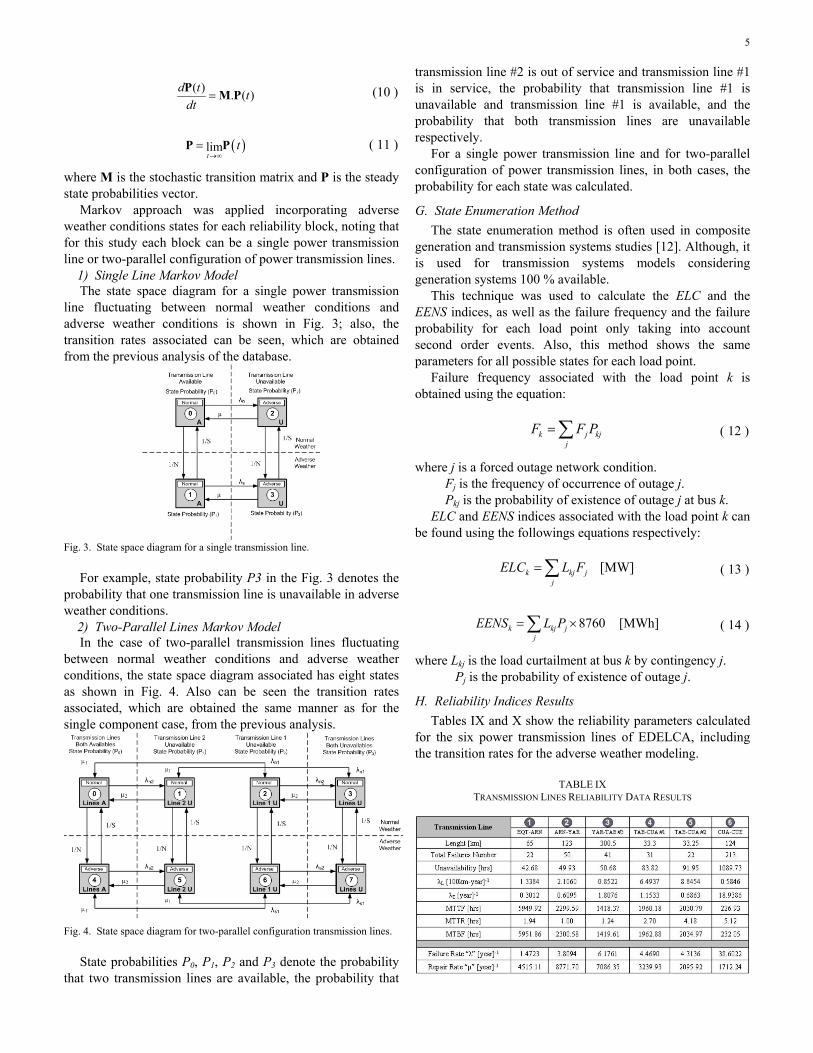
The state space diagram for a single power transmission line fluctuating between normal weather conditions and adverse weather conditions is shown in Fig. 3; also, the transition rates associated can be seen, which are obtained from the previous analysis of the database.
Fig. 3. State space diagram for a single transmission line.
For example, state probability P3 in the Fig. 3 denotes the
probability that one transmission line is unavailable in adverse weather conditions. 2) Two-Parallel Lines Markov Model
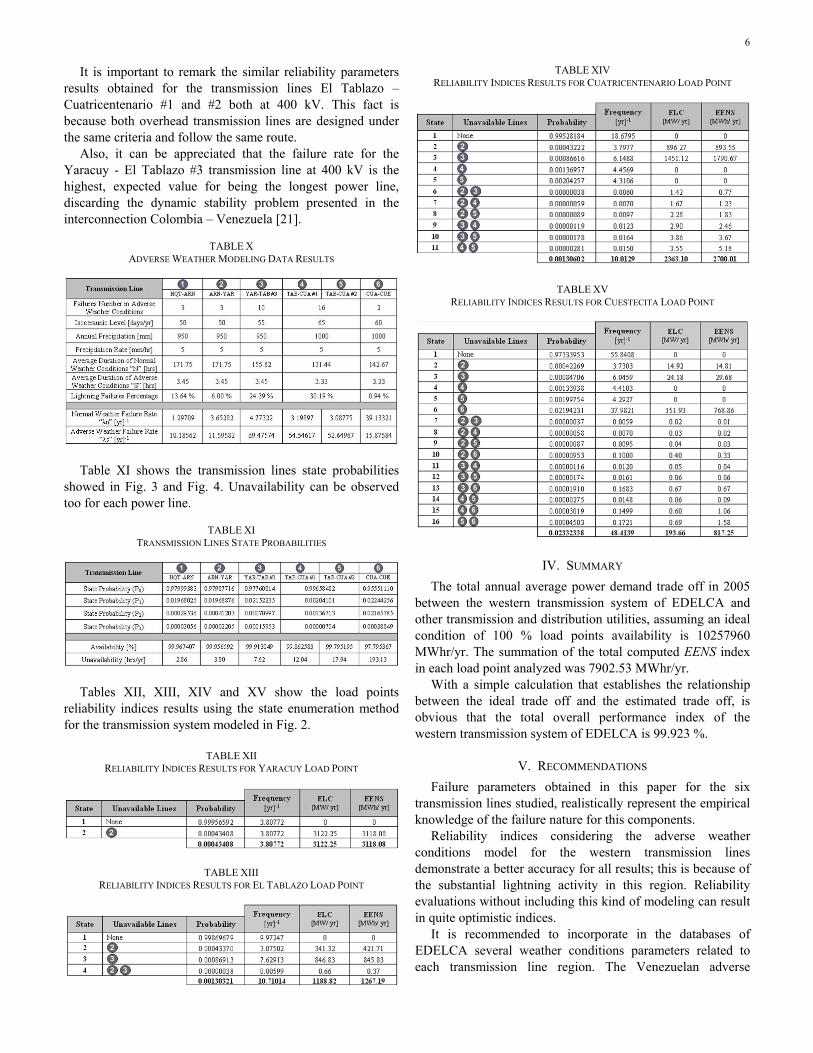
In the case of two-parallel transmission lines fluctuating between normal weather conditions and adverse weather conditions, the state space diagram associated has eight states as shown in Fig. 4. Also can be seen the transition rates associated, which are obtained the same manner as for the single component case, from the previous analysis.
Fig. 4. State space diagram for two-parallel configuration transmission lines.
State probabilities P0, P1, P2 and P3 denote the probability
that two transmission lines are available, the probability that
transmission line #2 is out of service and transmission line #1 is in service, the probability that transmission line #1 is unavailable and transmission line #1 is available, and the probability that both transmission lines are unavailable respectively.
For a single power transmission line and for two-parallel configuration of power transmission lines, in both cases, the probability for each state was calculated.
G. State Enumeration Method The state enumeration method is often used in composite
generation and transmission systems studies [12]. Although, it is used for transmission systems models considering generation systems 100 % available.
This technique was used to calculate the ELC and the EENS indices, as well as the failure frequency and the failure probability for each load point only taking into account second order events. Also, this method shows the same parameters for all possible states for each load point.
Failure frequency associated with the load point k is obtained using the equation:
k j kjj
F F P=∑ ( 12 )
where j is a forced outage network condition. Fj is the frequency of occurrence of outage j. Pkj is the probability of existence of outage j at bus k.
ELC and EENS indices associated with the load point k can be found using the followings equations respectively:
[MW]k kj jj
ELC L F=∑ ( 13 )
8760 [MWh]k kj jj
EENS L P= ×∑ ( 14 )
where Lkj is the load curtailment at bus k by contingency j. Pj is the probability of existence of outage j.
H. Reliability Indices Results Tables IX and X show the reliability parameters calculated
for the six power transmission lines of EDELCA, including the transition rates for the adverse weather modeling.
TABLE IX
TRANSMISSION LINES RELIABILITY DATA RESULTS
6
It is important to remark the similar reliability parameters results obtained for the transmission lines El Tablazo – Cuatricentenario #1 and #2 both at 400 kV. This fact is because both overhead transmission lines are designed under the same criteria and follow the same route.
Also, it can be appreciated that the failure rate for the Yaracuy - El Tablazo #3 transmission line at 400 kV is the highest, expected value for being the longest power line, discarding the dynamic stability problem presented in the interconnection Colombia – Venezuela [21].
TABLE X
ADVERSE WEATHER MODELING DATA RESULTS
Table XI shows the transmission lines state probabilities
showed in Fig. 3 and Fig. 4. Unavailability can be observed too for each power line.
TABLE XI
TRANSMISSION LINES STATE PROBABILITIES
Tables XII, XIII, XIV and XV show the load points
reliability indices results using the state enumeration method for the transmission system modeled in Fig. 2.
TABLE XII
RELIABILITY INDICES RESULTS FOR YARACUY LOAD POINT
TABLE XIII RELIABILITY INDICES RESULTS FOR EL TABLAZO LOAD POINT
TABLE XIV RELIABILITY INDICES RESULTS FOR CUATRICENTENARIO LOAD POINT
TABLE XV RELIABILITY INDICES RESULTS FOR CUESTECITA LOAD POINT
IV. SUMMARY The total annual average power demand trade off in 2005
between the western transmission system of EDELCA and other transmission and distribution utilities, assuming an ideal condition of 100 % load points availability is 10257960 MWhr/yr. The summation of the total computed EENS index in each load point analyzed was 7902.53 MWhr/yr.
With a simple calculation that establishes the relationship between the ideal trade off and the estimated trade off, is obvious that the total overall performance index of the western transmission system of EDELCA is 99.923 %.
V. RECOMMENDATIONS Failure parameters obtained in this paper for the six
transmission lines studied, realistically represent the empirical knowledge of the failure nature for this components.
Reliability indices considering the adverse weather conditions model for the western transmission lines demonstrate a better accuracy for all results; this is because of the substantial lightning activity in this region. Reliability evaluations without including this kind of modeling can result in quite optimistic indices.
It is recommended to incorporate in the databases of EDELCA several weather conditions parameters related to each transmission line region. The Venezuelan adverse
7
weather modeling for assessing accurately the transmission lines reliability can be enhanced with a future inclusion of the adverse dryness period, which dramatically increases the system failure rates because of the large number of fire caused outages.
From the design point of view, EDELCA has foreseen the construction of transmission infrastructure needed as the transmission line La Arenosa – Yaracuy #2 at 765 kV and the installation of submarine cables to replace the overhead Maracaibo Lake crossing section of transmission lines El Tablazo – Cuatricentenario #1 and #2 both at 400 kV, to increase western power system reliability.
Finally, all this methodology establishes a set of future potential developments that will be able to aid decision management sustained on probabilistic approaches to improve planning, operation and maintenance stages of the Venezuelan electric power system.
VI. ACKNOWLEDGMENT The authors gratefully acknowledge the contributions of
Ph.D. Roy Billinton for his encouragement submitting reference [9] before its publication date, M.Sc. José R. Espina for his academic guidance through the realizations of this study and M.Sc. Néstor A. Taborda, General Manager of the Transmission Maintenance Division of EDELCA, for searching the data needed for this study and his great interest on the subject.
VII. REFERENCES [1] A. Smith, “RCM: Gateway to World Class Maintenance.” Elsevier
Butterworth-Heinemann. USA, 2004. [2] M. E. Beehler, “Reliability Centered Maintenance for Transmission
Systems,” in IEEE Transactions on Power Delivery, Vol. 12, No. 2, April 1997.
[3] J. Endrenyi and the IEEE/PES Task Force on Impact of Maintenance Strategy on Reliability of the Reliability, Risk and Probability Applications Subcommittee, “Impact of Maintenance Strategy on Reliability.” July, 1999.
[4] J. Endrenyi (Chair) and IEEE Task Force, “The Present Status of Maintenance Strategies and the Impact of Maintenance on Reliability,” IEEE Trans. Power Systems, Vol. 16, No. 4, pp. 638-646, November 2001.
[5] J. Endrenyi, G. Anders and A. M. Da Silva, “Probabilistic Evaluation of the Effect of Maintenance on Reliability – An Application,” in IEEE Trans. Power Systems, Vol. 13, No. 2, pp. 576-583, May 1998.
[6] L. Bertling, R. N. Allan and R. Erikkson, “A Reliability-Centred Asset Maintenance Method for Assessing the Impact of Maintenance in Power Distribution Systems,” submitted to IEEE Trans. Power Systems, 2004.
[7] J. Endrenyi, G. J. Anders, L. Bertling and B. Kalinowski, “Comparison of Two Methods for Evaluating the Effects of Maintenance,” Submitted to PMAPS September 2004.
[8] R. Billinton and K. E. Bollinger, “Transmission System Reliability Evaluation Using Markov Processes,” in IEEE Trans. PAS-87, No.2, Feb 1968, pp 538-547.
[9] R. Billinton, “Reliability Data Requirements, Practices, Recommendations,” in IEEE Tutorial on Electric Delivery System Reliability Evaluation, 2005 IEEE Power Engineering Society General Meeting.
[10] D. Koval, “Frequency of Transmission Lines Outages in Canada.” IEEE Conference Record of the 1994 Industry Application’s Conference, Twenty Ninth Annual Meeting, Oct. 2-3, 1994, Denver, Colorado, Volume III, pp. 2201-2208.
[11] R. Billinton and R. Allan, “Reliability Evaluation of Engineering Systems,” 2nd ed., New York: Plenum Press, 1992.
[12] R. Billinton and R. Allan, “Reliability Evaluation of Power Systems,” 2nd ed., New York: Plenum Press, 1996.
[13] J. A. Thomas and L. E. Aparicio, “Stochastic Reliability Study of the Western Transmission Substations Maintained by EDELCA,” in Proc. 2008 Latin America IEEE Power Engineering Society Transmission and Distribution Conf. Bogotá, Colombia.
[14] R. Billinton and W. Li, “A Novel Method for Incorporating Weather Effects in Composite System Adequacy Evaluation,” in IEEE Transactions on Power Systems, Vol. 6, 1991, pp. 1154-1160.
[15] R. Billinton, C. Wu and G. Singh, “Extreme Adverse Weather Modeling in Transmission and Distribution System Reliability Evaluation.” 14th PSCC, Sevilla, 2002.
[16] R. Billinton and J. Acharya, “Consideration of Multi-state Weather Models in Reliability Evaluation of Transmission and Distribution Systems.” Power System Research Group. University of Saskatchewan, Canada 2005.
[17] IEEE Terms for Reporting and Analyzing Outages of Electrical Transmission and Distribution Facilities and Interruptions to Customer Service, IEEE Standard 346-1973.
[18] J. Ramírez and M. Martínez, “Influencia de las Sobretensiones por Descargas Atmosféricas y Comportamiento de los Sistemas de Puesta a Tierra en Líneas Aéreas de Transmisión y Distribución.” Simón Bolívar University, Caracas, Feb. 2004.
[19] Metodología para el Diseño Eléctrico de las Líneas de Transmisión de EDELCA, Electric Power Systems Division. Transmission Lines Engineering Department. EDELCA 1997.
[20] Estadísticas Climatológicas de Venezuela Período 1961 – 1990. Meteorological Services. Venezuelan Air Force. Special Publication No. 5. Venezuela 1993.
[21] F. Aboytes and F. Sánchez, “Dynamic Stability Analysis of the Interconnected Colombia-Venezuela Power System.” IEEE Transactions on Power Systems, Vol. 15, No. 1, February 2000.
VIII. BIOGRAPHIES
Luis E. Aparicio Vargas (S’06, M’08) was born in Cabimas, Venezuela, on March 1st, 1984. He received with honors his Dipl. degree in Electrical Engineering at Universidad del Zulia (LUZ), Maracaibo.
His employment experience includes transmission substations equipment tests, risk assessment of power systems, commercial and industrial electrical installations.
Jorge A. Thomas Meléndez (S’06, M’07) was born in Maracaibo, Venezuela, on June 16th, 1982. He received his Dipl. degree in Electrical Engineering at Universidad del Zulia (LUZ), Maracaibo.
His employment experience includes transmission system maintenance, maintenance engineering and risk assessment of power systems. Recently he participated as a presenter at the International Applied Reliability Symposium 2008 held in Frankfurt, Germany.
Copyright © 2022 FDOKUMEN