Developing integrated performance measurement system -using component based approach
Upload
khangminh22Category
view
1download
0
DOCTORA L T H E S I S
Department of Engineering Sciences and MathematicsDivision of Product and Production Development
An Integrated Development Approach for Monitoring and Simulation to Predict
Functional Product Availability
Björn Backe
ISSN 1402-1544ISBN 978-91-7583-920-2 (print)ISBN 978-91-7583-921-9 (pdf)
Luleå University of Technology 2017
Björn B
acke An Integrated D
evelopment A
pproach for Monitoring and Sim
ulation to Predict Functional Product Availability
Computer Aided Design


An Integrated Development Approach for Monitoring and Simulation to Predict Functional Product Availability
Björn Backe
Luleå University of Technology
Department of Engineering Sciences and Mathematics
Division of Product and Production Development

Printed by Luleå University of Technology, Graphic Production 2017
ISSN 1402-1544 ISBN 978-91-7583-920-2 (print)ISBN 978-91-7583-921-9 (pdf)
Luleå 2017
www.ltu.se

Preface
The research presented in this thesis has been conducted within the research subject Computer Aided Design at the Division of Product and Production Development at Luleå University of Technology. The research has been funded by the Faste Laboratory (the Faste Laboratory, accessed online: 2016-10-05), which is a VINNOVA Excellence Centre for Functional Product Innovation; SMART VORTEX, which is an EU FP 7 funded project (SMART VORTEX, accessed online: 2016-10-05) and by the Swedish Foundation for Strategic Research (SSF) within the research project Scalable Search of Product Lifecycle Information project (SSPI) (SSPI, accessed online: 2016-11-03)
I wish to thank my former supervisors, Professor Emeritus Lennart Karlsson and Professor Magnus Löfstrand, my current supervisors, Associate Professor Mats Näsström and Senior Lecturer Ove Isaksson. I thank all of my colleagues at the Division of Product and Production Development for their support, and especially Petter Kyösti for all the great collaboration and discussions, both within research and teaching, during these years.
Finally, I wish to thank some great industrial representatives with whom I have had the opportunity to collaborate: Bengt Liljedahl, Arne Byström, Michael Westman and Henrik Sundberg. Thank you for your support and invaluable discussions during the process of the research presented in this thesis. Your collaboration is truly appreciated.
Björn Backe
Luleå, December 2016

Abstract
For nearly two decades, business models such as Functional Products have been in focus within research and of interest in the manufacturing industry. Functional product offers consist of hardware, software, service -support systems and management of operation which, when developed in an integrated manner, together provide the customer with an agreed-upon function with a specified level of availability. Compared to product-oriented sales, this type of business model can provide added value to customers, usually through an increase in the service content. Due to the total care commitment, offering Functional Products requires management of reliability and maintainability in order to meet the availability requirement of the function provided. The development of the Functional Product must include holistic analysis and prediction of the functional product availability performance to reduce technical and economic risks and ensure that the function is delivered according to contract. The research performed in this thesis presents an integrated development approach for monitoring and simulation to predict functional product availability. It is shown how the constituents of a functional product can be modelled in an integrated manner in order to simulate and predict functional product availability. A part of this modelling strategy is demonstrated through a simulation case example to show that is possible through this approach to evaluate the availability of different functional product designs. To support the development of the monitoring capability needed for availability simulations it is shown how it is possible to develop fault detection and diagnosis methods for fault detection systems based on data stream management systems. It is also shown how data stream forecasting can be used to predict failures due to faults occurring at short notice. Different fault detection methods have been developed, tested and evaluated on real industrial applications to verify applicability as queries on data streams, managed by data stream management systems. The results from these tests have been evaluated for their predictive performance and detection accuracy. Finally, methodological and technological approaches to monitoring and analysis in functional product development and similar business models to functional products are reviewed. The results showed that few research contributions address the information perspective in functional product development and similar business models holistically. The integrated development approach presented is a pragmatic approach to functional product development which is based on the merged research results of the papers included and knowledge domain presented.


Appended papers
This thesis comprises a survey of following appended papers: A, B, C, D and E.
Paper A
Löfstrand, M, Backe, B, Kyösti, P, Lindström, J & Reed, S (2012), 'A model for predicting and monitoring industrial system availability' International Journal of Product Development, Vol. 16, No. 2, pp. 140-157.
Introduction and author contribution:
Paper A presents a model for predicting and monitoring industrial system availability. The model includes descriptions of necessary model constituents, data flows, implementation and integration of these constituents. The model constituents comprise hardware, support system and monitoring system based on data stream management system. Backe’s contribution consisted of collection of data, obtaining full systems descriptions and knowledge concerning the functionality of hydraulic drive systems. Several visits to a Swedish company which manufactures and sells hydraulic drive systems were made. Here, interviews were conducted with engineers and managers from different disciplines. Also, visits to customers have been made to collect data through interviews and studying installations. Workshops have been held, whereby the author has facilitated fault tree analysis performed in collaboration with employees from different engineering disciplines at the studied company. Backe, who initiated the model and in collaboration with the co-authors, further developed this integrated availability model, is mainly responsible for elaborating on the modeling approach and its interactions and relations between the DSMS model and the HW model. The author has also contributed to the literature review and has written significant parts of the paper.

Paper B
Löfstrand, M, Kyösti, P, Reed, S & Backe, B (2014), 'Evaluating availability of functional products through simulation' Simulation Modelling Practice and Theory, Vol. 47, pp. 196-209.
Introduction and author contribution:
In Paper B input data from a real industrial hydraulic drive system have been collected and applied in a software tool developed, influenced by the approach presented in Paper A. The tool is utilized to simulate and analyze the availability performance which is demonstrated in Paper B. The results from the simulation provided an indication of what percentage of availability may be guaranteed for the industrial system. It is shown that the approach can be used to compare the availability performance of different designs. Backe has been responsible for developing full systems descriptions and contributing own expertise concerning the functionality of the hydraulic drive systems. Backe also facilitated and contributed to the execution of fault tree analysis. Backe wrote parts of the paper and, in collaboration with the co-authors, also contributed to the identification and description of the industrial system example of the functional product presented.
Paper C
Alzghoul, A, Löfstrand, M & Backe, B (2012), 'Data stream forecasting for system fault prediction' Computers & Industrial Engineering, Vol. 62, No. 4, pp. 972–978.
Introduction and author contribution:
In Paper C a fault detection system proposed by Alzghoul and Löfstrand (2011) is modified and improved by the addition of a predictor. The purpose of the predictor is to predict the data stream e.g., from an industrial application, and by applying fault detection functions onto the data stream, an indication of imminent failures may be given earlier, thus improving the possibility of avoiding catastrophic failures. Different data-stream-based linear regression prediction methods were applied and tests showed good results in predicting the data stream.
In this paper Backe was responsible for the collection of data from industrial systems, gaining and contributing knowledge concerning the functionality of the hydraulic drive system. A study of a real industrial hydraulic drive system at a
Swedish manufacturing company was performed to identify system failures which occur within a short period of time. Previously, no such failure data had been recorded at the company regarding these types of system failures. Backe initiated cross-functional work with the manufacturing company engineers to artificially create the failure patterns needed to enable tests. Backe carried out several interviews with the company engineers and was responsible for collection of relevant monitored hardware data and for analysis and verification of system failure patterns created. Backe also developed descriptions of the relations between monitored parameters necessary; these where utilized to objectively visualize and understand failure causes and failure behavior over time. Backe’s work enabled the development and testing of the proposed fault detection system presented in this paper.
Paper D
Alzghoul, A, Backe, B, Löfstrand, M, Byström, A & Liljedahl, B 2014, 'Comparing a knowledge-based and a data-driven method in querying data streams for system fault detection: A hydraulic drive system application' Computers in Industry, vol 65, nr 8, s. 1126-1135.
Introduction and author contribution:
In Paper D two methods for system fault detection, implemented in a data stream management system, were developed and tested. The two methods were evaluated and showed good performance in detecting faults in an industrial shredder application. A process for developing the fault detection functions was proposed along with the architecture of the fault detection system. Backe was responsible for data collection from the industrial application and planning of tests. Backe further facilitated the fault tree analysis performed in collaboration with engineers at the manufacturing company that produced the industrial application. Backe was also responsible for setting up and carrying out the development and tests of the knowledge-based method, contributed to the analysis and evaluation of both methods and also wrote parts of the paper.
Paper E
Backe, B & Kyösti, P 2017 'The transition from component-based industry toward Functional Products: implications for the demands on the monitoring and information system', Submitted to International Journal of Product Development 2016-12-22.
Introduction and author contribution:
In Paper E a literature review was performed. The review was undertaken due to fact that existing methodologies for development of FP, PSS and IPS2 do not address monitoring aspects sufficiently. The review highlights methodologies, frameworks and technologies developed within research to enable improvement and development of monitoring capabilities needed within these business models. The result is a table of information categories which shows the range of areas addressed within research. The table also shows a holistic perspective of the information that is needed or supports FP business. The table may be used as a basis in the development of monitoring capabilities needed. Backe initiated the paper, performed the literature review, analyzed and compiled the results in collaboration with Kyösti, and wrote the major part of the paper.Related paper, not included in thesis
Paper F
Reed, S., Andrews, J., Dunnett, S., Backe,B., Kyösti, P., Löfstrand, M., Karlsson, L.(2012) ' A modelling Language for Maintenance Task Scheduling'.
PSAM 11 & ESREL 2012, International Probabilistic Safety Assessment and Management Conference & the Annual European Safety and Reliability Conference
Introduction and author contribution
Paper F presents a modeling language for representing the aspects necessary to model and analyze the implementation of maintenance strategies for hardware components. The maintenance strategy determines which, and when, repairs and inspections should occur, whilst the scheduling of maintenance tasks implements these goals. The methodology presented proposes how collected qualitative data should be interpreted to enable resource optimization of scheduled maintenance

through simulation. Backe contributed to this paper through review of methodology and proofreading work.

Abbreviations
B2B – Business -to –Business
CAD – Computer Aided Design
CBM - Condition Based Maintenance
CE – Concurrent Engineering
DES - Discrete Event Simulation
DFR – Design for Reliability
DRM - Design Research Methodology
DSMS – Data Stream Management System
EU – European Union
FDD – Fault Detection and Diagnosis
FMEA - Failure Mode and Effect Analysis
FMECA – Failure Mode Effect and Criticality Analysis
FP - Functional Product
FPD – Functional Product Development
FT – Fault Tree
FTA - Fault Tree Analysis
HW - Hardware
IPS2 - Integrated Product-Service System
MO- Management of operation
MTTR - Mean Time to Repair
PCA – Principal Component Analysis
PSS - Product-Service System
PMRM – Partitioned Multi-objective Risk Method
PHM- Prognostic Health Management

RAMS - Reliability, Availability, Maintainability and Safety
R&D – Research and Development
RPN - Risk Priority Number
RQ – Research Question
SE – Systems Engineering
SS - Support System
SSS - Service Support System
SW - Software
Table of Contents 1. Introduction ................................................................................................. 1
1.1 The research setting ................................................................................... 2
1.2 Industrial collaboration .............................................................................. 3
1.3 Aim and scope ........................................................................................... 4
1.4 Research Questions ................................................................................... 4
2. Knowledge domains ..................................................................................... 7
2.1 Design process improvement ..................................................................... 7
2.2 Product development ................................................................................ 7
2.3 Product-service development .................................................................... 9
2.4 Functional product development ............................................................. 11
2.5 System availability .................................................................................... 14
2.6 Reliability and Maintainability ................................................................. 15
2.7 Development of fault detection and diagnosis methods ............................ 17
2.8 Data stream management systems and data stream mining ........................ 19
3. Research methodology ............................................................................... 21
3.1 Design research methodology .................................................................. 21
3.2 The research approach ............................................................................. 21
3.2 Data collection at the studied company .................................................... 23
3.3 Participation observation ...................................................................... 24
3.4 Data evaluation and analysis ..................................................................... 24
4. Results ....................................................................................................... 25
4.1 Predicting industrial system availability .................................................... 25
4.2 Evaluating functional product availability through simulation .................. 26
4.3 System fault prediction ............................................................................ 27
4.4 Development and comparison of fault detection methods implemented in the data stream management system. .............................................................. 29
4.5 FP information perspective ...................................................................... 30
4.6 An integrated development approach for monitoring and simulation to predict Functional Product availability ........................................................... 30
5. Discussion................................................................................................... 37

5.1 Addressing the research questions ............................................................ 38
6. Conclusions ................................................................................................ 41
7. Future work ............................................................................................... 43
8. References .................................................................................................. 45
Appended Papers………………………………………………………………….
1
1. Introduction In the European manufacturing industry, development of integrated product and service offers plays an important role in helping companies to compete on a global level. Instead of choosing the strategy to compete on the basis of pricing of products, the trend in industry has for many years been to extend current product offerings and deliver integrated solutions which better fulfill customer needs and enhance the value of offerings. This type of strategy may be used to block out and avoid competing with low-cost economies (Tukker and Tischner 2006).
Already back in the late 1980s, the trend in industry of adding value to core product offerings through services was observed in research. Within academia, concepts describing and discussing this phenomenon, such as Servitization, (Vandermerve and Rada, 1988), started to emerge. During the late 1990s the European Union (EU) realized the importance of enhancing European competitiveness and made major investments under EU’s 5th Framework Programme between 1998-2002 (European Union, 2016) in the research theme of Product Service Systems (PSS)(Tukker and Tischner 2006). Since the late 1990s, research into these business strategies has increased considerably. Additional concepts, similar to PSS, such as integrated product service systems (IPS2)(Meier et al. 2010), Functional Sales, Total Care Offer and Functional Products(FP)(Alonso Rasgado et al. 2004, Brännström et al. 2001), have been developed and continue to develop, each with its own unique research focus.
Despite the vast amount of research invested in this topic, industrial manufacturers today still face many challenges. To expand businesses and differentiate on the market, manufacturers now also need to compete against others catching up on the trend of offering integrated solutions of products and services. Finding new ways of differentiating is a constant struggle and manufacturers constantly need to focus on developing more value-creating activities to stay ahead.
In this thesis the concept of Functional Products is addressed. When offering a Functional Product, the customer pays for the availability of the functionality provided. The ownership of the FP stays with the provider and much of the risks previously borne by the customer now lie within the responsibility of the provider. The transition to FPs hence requires the provider of FPs to develop the capability of managing these risks. When developing products to be offered as FPs, methods and tools for evaluating the availability of the function are needed.
2
The provider and customer need to predict and evaluate the availability of the function, both in early phases of the product development and continuously during operation throughout the contracted time. Even before initiating the development of the functional product, the availability of the function must be assessed. The FP provider, who is responsible for maintaining availability of the function throughout the contracted period, needs to perform the assessment to increase their knowledge about what availability levels are possible to offer. Factors such as the monitoring capabilities of the FP provider, capability to predict FP availability and geographical location of the customer may largely determine whether to engage in offering FPs or not (Lindström et al. 2012a).
Viewed from a holistic perspective, monitoring is needed to supply the provider enterprise with data and information, which analyzed and acted upon, may reduce the risks inherent in the offer. Monitoring and predicting the condition/health of system components is necessary to secure the reliability, and in the end, also availability. In addition, developing models for simulating and predicting availability is a crucial tool for both the provider and customer as decision support in early development phases. Performing such simulations would make it possible for both the customer and provider to more quickly analyze a variety of FP concepts, and evaluate the associated cost of different levels of reliability and availability that are possible to offer.
Integrating these two important aspects would provide an approach that FP providers can follow to manage, control and increase the availability of their FPs in a satisfactorily manner. Thus, the focus in this thesis is on exploring and proposing an integrated development approach to monitoring and simulation that can be used for developing the availability prediction capability needed in FP business. The thesis also treats areas such as integrated modeling and simulation to predict industrial system availability, the development approach to fault detection and diagnosis (FDD) methods for application in data stream management systems, and a review of the monitoring capabilities needed in FP business.
1.1 The research setting The research presented in this thesis has been carried out at the Faste Laboratory at Luleå University of Technology, Division of Product and Production Development. The Faste Laboratory is a VINNOVA Excellence center for Functional Product Innovation which has been funded by VINNOVA for ten years (2006-2017). The aim of VINNOVA, the Swedish Governmental Agency for Innovation Systems, is to develop Sweden’s innovation capacity for

3
sustainable growth in selected areas (VINNOVA website, acc. online 2016-12-20). The research has also been funded by SMART VORTEX, which is a research project and part of the 7th European Framework Programme (EU FP7). The goal of SMART VORTEX is to provide a technological infrastructure consisting of a comprehensive suite of interoperable tools, services and methods for intelligent management and analysis of massive data streams to achieve better collaboration and decision making in large-scale collaborative projects (SMART VORTEX website 2016). Both the Faste Laboratory and SMART VORTEX projects aim to enable functional product innovation and are thus represented as funders of this thesis. Parts of the research have also been funded by the Swedish foundation for strategic research (SSF) within research project SSPI (SSPI website accessed online 2016-11-03).
1.2 Industrial collaboration During the progress of the research presented in this thesis, industrial needs and interest have been reflected by the participation and collaboration of industrial manufacturing companies. A Swedish manufacturing company, in this thesis referred to as company A, has contributed to the research presented by offering access to their industrial systems, which have been utilized for the purpose of testing methods, studying, investigating and understanding the technical risks involved in offering their systems as FPs. Further, company A has also allowed insight into their organization and way of working, and has contributed input to research through their extensive knowledge of hydraulic drive systems.
Company A develops and sells complete hydraulic drive systems, suitable for low-speed and high-torque industrial applications demanding high reliability. Company A’s interest in this research is based on the competitive advantage they see gained by offering the function of their drive systems. Retained ownership of their products provides opportunities and possibilities. Engaging in offering FPs would provide the opportunity and possibility to optimize the total drive system efficiency and thereby contribute to a more sustainable operation of their current drive system in customer applications. Their products would also be better tailored and more reliable, since maintenance may be performed with greater accuracy and efficiency. When exemplifying the FP business situation, the functionality of the FP is usually used as the basis for discussion. In this thesis company A’s hydraulic drive systems have been studied and utilized to exemplify research challenges and demonstrate research results. In their case, an FP, based on their drive systems solution, could be quantified in terms of technical performance measures. The functionality of their drive system could be expressed

4
as turning the shaft of some application at 20 rpm while retaining a torque of 15 kNm at 95% availability during one year.
1.3 Aim and scope The aim in this thesis is to contribute to new scientific knowledge that can be applied in the development of functional products. Of specific interest are the investigation of how to develop the monitoring capabilities needed and the development of an approach that utilizes monitored and analyzed data in simulation to predict and achieve high availability of industrial systems to enable Functional Product offers. The scope of the thesis includes investigating the holistic information perspective needed for offering Functional Products, an approach to the development of the monitoring capability, e.g., the development of fault detection methods applied in data stream application, as well as development of conceptual simulation models for predicting industrial system availability. Offering high availability of industrial systems usually requires major investments to increase the reliability of hardware, monitoring equipment and costs for maintenance to support the functionality of the system. Thus, the development of high availability functional products will naturally be subject to trade-off to cost. While this issue is important, trade-off to cost is, however, not considered in this thesis. In this thesis the term monitoring is considered from a wide perspective; it does not only include collecting data from sensors origination from industrial system components, it also includes a range of other functions, such as supervision of business activities, maintenance procedures, resources such as spare parts, number of employees, etc. In addition to the reliability of hardware, maintainability is equally important to consider in functional product development. However, maintainability in functional product development is not addressed to a large extent in this thesis, but has previously been addressed by Kyösti (2015).
1.4 Research Questions The research questions formulated in this thesis have been influenced by industrial needs. Industrial companies generally emphasize the need to be better informed and need to gain additional knowledge to manage the challenges inherent in the transition to offering FPs. The research questions stated below have guided the work presented in this thesis.
RQ1: How should simulation models be developed and created to model product and service availability?

5
RQ2: How should HW and monitoring of HW status be interconnected and modeled to enable prediction of industrial system reliability through simulation during operation?
RQ3: What needs to be monitored when offering Functional Products?

6
7
2. Knowledge domains This chapter presents the main knowledge domains of the research conducted.
2.1 Design process improvement In this thesis, development processes in various levels of detail and corresponding to different disciplines are presented. Developing offers consisting of products and services requires an integrated way of working between disciplines of the providing organization. This means that for the providers, the overall planning and execution of the development includes merging these processes to enable an overall effective and efficient process. The aim of this section is to provide a holistic perspective and initial understanding of some of the challenges inherent in setting up managing a development scenario for complex offers consisting of integrated products and services. Design as a research subject has been addressed by many researchers in different fields; thus, many different models for designing exist. On a general level, Clarkson and Eckert (2005) present three different classifications of design processes. The first includes abstract approaches, which aim to describe the design process at a higher level of abstraction. At this level the process can be applied to a wide range of situations but gives little specific advice. The second level is procedural approaches, which offer more substantial advice in specific situations but have a less general character. The last level focuses on analytical approaches which do not try to include the whole design process but include specific tasks such as comparing effects of different designs. Since the settings where development is performed can vary, describing a general design process for an FP satisfactorily is a challenge. There are many different classification schemes within the product development domain. Many of the processes inherent in FP development are influenced by different factors such as discipline of origin (e.g., software, service, mechanical engineering, etc.), degree of integration between disciplines and nationality of origin. To FP providers, process development and improvements are of concern, since development structure is of importance to FP providers in order to manage the new complex development scenario the FP business brings. In this thesis, the journey between different approaches the FP provider needs to undertake, such as those described above, is explored.
2.2 Product development Designing products may require guidance by a structured approach or process. Utilizing a structured/systematic approach ensures that design progress is controlled and ultimately meets the needs and requirements of the customer. Archer (1965) proposes that systematic approaches are specifically useful in three

8
different design situations; when the outcome of being wrong is severe, when there is a high probability of being wrong i.e., in cases where there is little or no previous experience, and also in cases when the development situation is complex and influenced by a large variety of factors.
Ulrich and Eppinger (2012) defined product development as “the set of activities beginning with perception of a market opportunity and ending in the production, sale, and delivery of a product”. The development process thus aims to provide developers with guidelines i.e., steps and activities that in sequence enable the transformation of customer needs (input) into output (product launch). In Ulrich and Eppinger (2012), a generic product development process which contains six phases is presented in Figure 1. The activities in the process described by Ulrich and Eppinger (2012) are not strictly performed in sequence and may include iterations between preceding phases if needed. Figure 1 illustrates the converging and diverging nature of the design solution space throughout the different phases.
Figure 1. Generic product development process, inspired by Ulrich and Eppinger (2012).
Increasing competitiveness on the market today forces engineers to closely collaborate in cross-functional teams across engineering disciplines to deal with the complexity of new products and offers demanded. Development processes at companies need review and must be extended to include the whole business, which requires an integrated development approach. Setting up the new development organization may involve going from sequential schemes of design towards a parallel and concurrent approach in design. Thus, the design processes utilized by the different disciplines in the development of their current products needs to be coordinated to achieve an efficient process for the future generation of products or offers. In the field of Concurrent Engineering (CE), reengineering

9
of processes is considered central to the process of concurrent development. However, reengineering of processes is not an easy pursuit and calls for the need for proper management. Winner et al. (1988) defined CE as a “systematic approach to the integrated, concurrent design of products and their related processes, including manufacture and support. This approach is intended to cause the developers, from the outset, to consider all elements of the product life-cycle from conception through disposal, including quality, cost, schedule, and user requirements”. The effects of adopting a CE approach to the development of complex products have been proven in many cases to decrease cost and lead time of development. CE, as a concept, has evolved during the years to include a larger perspective which integrates product and process design over the enterprise (Prasad, 1996).
2.3 Product-service development One reason for a manufacturing company to innovate the business model is that the manufacturer’s offer is beginning to lose its uniqueness and is being outrivaled by competitors. In Europe, manufacturers who are competing with low-wage countries/low-cost economies are now increasingly looking at new ways of changing their offers to be more unique. Integrated bundles of product and services may provide the competitive advantage manufacturers need, and provide the customer with an added value. These product-service offers/solutions are more customized to better fulfill customer needs. The solution, which may be more optimized and more sustainable than their previous products, constitutes a more trouble-free ownership compared to buying the hardware and service separately. For the provider, revenue increases through increased service shares and the possibility to differentiate and lock out competitors through these new attractive offers. During the last 20 years, research into this topic has increased considerably. There are now a variety of concepts being developed within academia which aim to provide methodologies and tools to cope with the requirements the increased responsibility and complexity these concepts bring. One early concept which Vandermerve and Rada (1988) presented is “servitization of business”. The concept is described as a total market strategy in which product and services are offered as integrated “bundles”, or systems, and are offered to meet customer need as a whole. In addition to the business perspective of integrated product and services, there is also an inherent sustainability perspective which has been considered in these concepts. Stahel (1997) discusses the concept of functional economy (service economy) which is “one that optimizes the use (or function) of goods and services” and its aim is to create the highest possible use value over the long term while reducing the consumption of material resources and energy as much as possible. In the late

10
1990s the concept of PSS emerged(Beuren et al., 2013) and one of the earliest to define the PSS concept was Goedkoop et al. (1999), who stated that “A product service system is a system of products, services, network of players and supporting infrastructure that continuously strives to be competitive, satisfy customer needs and have lower environmental impact than traditional business models”. Other commonly referred to definitions of PSS have been proposed by Mont (2002), Manzini and Vezzoli (2003) Baines et al. (2007). During the last decade additional concepts have emerged, such as integrated product service (IPS), defined by Park and Lee 2009 as “anything into which products and services are integrated, regardless of its type, purpose and features.” In IPS2 (Meier et al., 2010) the development of services and products is integrated and thus there can be no exact separation in between the service and product; IPS2 is only used in business-to-business (B2B) applications. In addition to the concepts presented above the concept of FP also shares similarities with concepts such as functional sales (Sundin and Bras, 2005), total-care products (Alonso-Rasgado et al., 2004) and, according to Tan et al. (2010), also Servicing (White et al., 1999) and Service Engineering (Tomiyama, 2005). Lindström et al., (2014) further acknowledge the resemblance to extended products (Thoben et al., 2001) and through-life engineering services (TES)(Roy et al., 2013). According to Lindström et al.(2014), these concepts are similar in the sense that the focus is on including more soft parts in the offer, e.g., services, know-how and knowledge, etc.
To adapt to the holistic development of these integrated product-service concepts the manufacturer’s development perspective needs to change from a product-oriented to more solution-oriented perspective. The use of traditional tools and methodologies in product development needs to be reviewed and complemented where needed.
In PSS design, Ericsson and Larsson (2009) argue that a system theory view is a fundamental requirement for new development processes which need to include and consider interdisciplinary collaboration which lasts through the entire lifecycle and or contracted period. In PSS development, system design principles such as those described in the field of Systems Engineering (SE) may be adopted. INCOSE (the International Council of Systems Engineering) defines SE as:
“an interdisciplinary approach and means to enable the realization of successful systems. It focuses on defining customer needs and required functionality early in the development cycle, documenting requirements, then proceeding with design synthesis and system validation while considering the complete problem “.
11
Further, the definition by INCOSE states that “Systems Engineering integrates all the disciplines and specialty groups into a team effort forming a structured development process that proceeds from concept to production to operation. Systems Engineering considers both the business and the technical needs of all customers with the goal of providing a quality product that meets the user needs”.
In Vasantha et al. (2012), eight state-of-the-art PSS methodologies have been reviewed and evaluated through a maturity model. In their review, a maturity model points out that methodologies for PSS are still in the initial stages of development and are not yet sufficiently mature to be practical in PSS design. Some of the remaining challenges discussed by Vasantha et al. (2012) are that monitoring within these methodologies has not been properly addressed. Hence, there is a gap in research addressing the development of monitoring capabilities needed within these concepts. They also highlighted the need for sufficient system modeling techniques which should support the co-creation of conceptual system models. Vasantha et al., (2012) further found in their review that some authors criticize PSS design methodologies and emphasize that they are too general and lack specificity.
In Tukker and Tischner (2006), three different PSS classifications have been defined. The first type is the Product-oriented PSS, in which the ownership of the product is transferred to the customer and service is offered, which adds value and further aims to fulfill customer needs. In the Use-oriented PSS, which is still partly product-oriented, ownership of the product is not transferred but made available to the customer. In Result-oriented PSS, a result is agreed upon between customer and provider, in this case a physical product does not necessarily need to be involved for the realization of the result. As emphasized by Tukker and Tischner (2006) exact categorization into these three types of PSS may not always work well; for example, a product by definition does not always involve a physical character, such as software products. The FP concept resembles the use- oriented PSS classification, since ownership of the FP is retained by the FP provider who sells usage of FP, usually in a B2B setting.
2.4 Functional product development An early definition of FP is given by Brännström et al., (2001) who define an FP as a combination of Hardware (HW), Software (SW) and Services. Alsonso –Rasgado et al. (2004), and Alonso-Rasgado and Thompson (2006) further extended the definition of FP to comprise HW and Service Support System (SSS) with integrated SW. The SSS includes decision making, operations

12
planning, education, maintenance of the functional product and remanufacturing. Later, Lindström et al. (2012b) added to the FP definition by adding an additional constituent to be developed, Management of Operation (MO). The MO is crucial to create and maintain a win-win situation between the provider and the customer. The MO constitutes functions of managing the operation of the FP throughout its lifecycle, these functions include managing responsibilities such as risk management, transfer of intellectual property, building trust and relations, contracts, and financial issues such as financial planning (Lindström et al., 2012b) In Lindström et al. (2015a) the authors added further specificity to FP development by proposing a framework of how the four main FP constituents are integrated. They also presented the sub-constituents of HW, SW, SSS and MO and their relations to each other.
From a general perspective, the main objective of FP is to provide performance of agreed-upon functionality during a certain period of time and at a specified level of availability. There may be contractual issues connected to the provision of functionality, for example; if contractual agreements are not met by the provider, financial penalties may be incurred. In the customer perspective, the benefits of FPs as compared to traditional products are identified by Alonso-Rasgado and Thompson (2006) as smooth cash flow, guaranteed level of availability, continuously updated equipment and good equipment condition throughout the FP contract period. For the customer, purchasing FPs would ideally provide a less problematic ownership. Isaksson et al. (2009) further add that increased customer value, long-term return on investment (in B2B) and more stable cash flow are the main business arguments for both customers and providers. To realize the FP, it becomes necessary that a win-win situation is achieved, which includes all collaborating partners in the global FP value chain. This involves investigating the roles and responsibilities of the partners and how they need to collaborate (Parida et al., 2013).
As development support during initial development of FP, Lindström et al. (2012a, 2012b) presented a conceptual development process for FP. The process presented in Figure 2 shows the integrated development of the interdependent FP constituents until the launch of the FP. There is a great need for proper management and tight integration between the four constituents, so that none of the four constituents precedes the others, thereby narrowing down the design space for the other constituents in an unsatisfactorily manner.

13
Initi
al m
anag
emen
t pr
oces
s
”Go or no go” 1st FP decision gate 2nd FP decision gate ith FP decision gate Final FP decision
FP in operation
Conceptual functional product development process
HWSW
SSS
MO
Figure 2. The conceptual FPD process by Lindström et al. (2012b), as interpreted by the author.
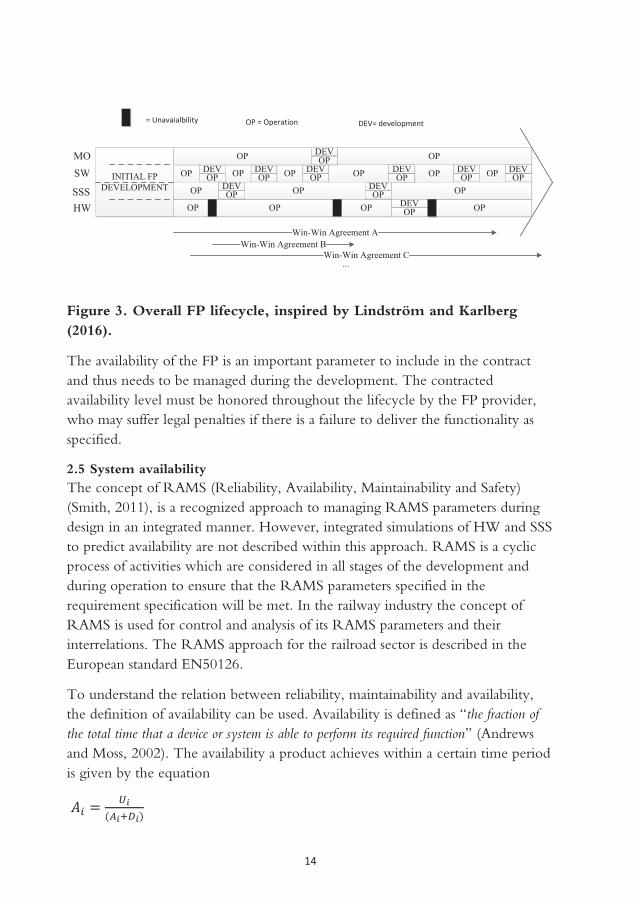
In Lindström et al. (2015b) an overall FP lifecycle is proposed based on technical and economic perspectives. They highlighted the duration of the technical and economic lifecycles of the FP and concluded that the overall lifecycle is governed by both. The technical supports the economic and if the economic lifecycle ends, i.e., a win-win situation cannot be sustained, the overall FP lifecycle may be terminated as well. Lindström and Karlberg (2016) further elaborated on the FP lifecycle and added specificity to details concerning the combination and coordination between, and within both perspectives, that is, the need for coordination between HW, SW, SSS and MO (technical perspective) and between the economic perspective sub-lifecycles. In Figure 3, the overall FP lifecycle is presented, showing examples of the duration of both technical lifecycles and economic agreements.
14
INITIAL FP DEVELOPMENT
OP
OP
HW
OP OPOPODEV OP OPOPO
DEV OPOP OPOPODEV OP OPOPO
DEV OP OPOPODEVSW
SSS
DDEV DEV DDEV DEVOP
OP
MO
OP
OP
OPODEV
OPOPODEVDEVDDEVD
OPODEV
OPOP
Win-Win Agreement AWin-Win Agreement B
Win-Win Agreement C...
OP OPOPODEV
OPOPODEV
= Unavaialbility OP = Operation DEV= development
Figure 3. Overall FP lifecycle, inspired by Lindström and Karlberg (2016).
The availability of the FP is an important parameter to include in the contract and thus needs to be managed during the development. The contracted availability level must be honored throughout the lifecycle by the FP provider, who may suffer legal penalties if there is a failure to deliver the functionality as specified.
2.5 System availability The concept of RAMS (Reliability, Availability, Maintainability and Safety) (Smith, 2011), is a recognized approach to managing RAMS parameters during design in an integrated manner. However, integrated simulations of HW and SSS to predict availability are not described within this approach. RAMS is a cyclic process of activities which are considered in all stages of the development and during operation to ensure that the RAMS parameters specified in the requirement specification will be met. In the railway industry the concept of RAMS is used for control and analysis of its RAMS parameters and their interrelations. The RAMS approach for the railroad sector is described in the European standard EN50126.
To understand the relation between reliability, maintainability and availability, the definition of availability can be used. Availability is defined as “the fraction of the total time that a device or system is able to perform its required function” (Andrews and Moss, 2002). The availability a product achieves within a certain time period is given by the equation
= ( )

15
Where A is the availability, U is the uptime and D is the unplanned downtime. Downtime is initiated by hardware failure and includes preparation time, active maintenance time and logistics time and ends when the restoration is completed and brought back into operation. Thus, predicting availability of industrial systems means predicting both the reliability and maintainability of the system.
In Lie et al. (1977) a state-of-the-art survey concerning availability of maintained systems is presented. They provide classification of availability into different categories depending on the time interval and type of downtime considered. According to Lie et al. (1977), the operational availability is one of the most realistic alternatives of availability, since it includes downtime which accounts for corrective and preventative maintenance, logistics time, ready time and administrative time. This classification represents the actual unavailability the customer perceives.
2.6 Reliability and Maintainability In Villemeur (1992) both reliability and maintainability are defined. Reliability is defined as “the ability of an entity to perform a required function under given conditions for a given time”. Maintainability can be expressed as “the ability to of an entity to be maintained in, or restored to, a state in which it can perform a required function, when maintenance is performed under given conditions and using stated procedures and resources”
To ensure that the reliability requirements are pursued during development of products reliability programs such as MIL-STD-785B (1980) may be implemented. According to Andrews and Moss (2002), experiences show that applying reliability programs throughout the development process of a product ensures that problems are minimized at installation, start-up and during operation. This reduces expensive warranty costs, reduces the need for maintenance and increases customer satisfaction. In reliability programs, design for reliability (DFR) is applied (O´Connor and Kleyner, 2012). It is a systematic process which should be integrated into the development process and be an integral part of the engineer’s way of working to design reliability into the product.
Reliability assessments of industrial systems are commonly performed through fault tree analysis (FTA) (NUREG- 0492, 1981) and Failure Mode, Effects and (Criticality) Analysis (FME(C)A) (MIL-STD-1629a, 1980).
FTA is a reliability/safety analysis technique, it is a deductive method to analyze and identify individual events or combinations of events that cause an unwanted

16
system failure (top event). FTA is a graphical method which builds upon a top-down approach which is initiated by the definition of an undesired top event. The system failure is systematically analyzed to identify necessary and immediate causes and the analysis progresses until the basic causes are identified.
FMEA is an inductive step-by-step method to systematically evaluate the severity of potential system failure modes. It analyses the effect each failure mode has on the system. There is an extension to FMEA called failure mode effect and criticality analysis (FMECA). FMECA further aims to rank each failure mode by including the probability of occurrence and, depending on the level of detai,l also the probability of detection of the failure mode, since early detection of failures may reduce the severity. There are two basic approaches to FMEA/FMECA; functional FMEA/FMECA and hardware FMEA/FMECA. Depending on the time of execution of the FMEA/FMECA, functional FMEA/FMECA is used in early design phases, where the product or system is not yet defined in detail. The FMEA/FMECA is performed based on treating sub-assemblies or components as “black boxes”. The analysis is focused on the system functioning, evaluating the effects when loss of input from these “boxes” occurs. When the design of product becomes more detailed and more information becomes available, hardware FMEA/FMECA can be performed.
A maintained system may be subject to corrective, preventive or condition-based maintenance (Jardine et al., 2006) Corrective maintenance refers to all actions included to restore an item or system from a failed state to a working or available state and can be quantified in terms of MTTR mean time to repair. Preventive maintenance refers to retaining the item or system in an available or operational state through preventing failures from occurring by planned service action such as cleaning, lubrication, etc. Condition-based maintenance (CBM), refers to using condition-based monitoring technologies to predict (prognostics) and diagnose failures occurring in system components. A CBM strategy is implemented to avoid unnecessary maintenance tasks by performing maintenance actions only when the need arises. Maintainability is influenced by the design of the product; the design determines factors such as ease of test, accessibility, repair and diagnosis, the need for calibration, etc. (O´Connor and Kleyner, 2012). In the context of FPD, maintenance activities contribute to the availability outcome of FP and are a part of the support system. An approach for support system modeling and simulation to predict availability of FPs has been researched in Kyösti (2015).
17
In the development of high-availability applications a maintainability program and a reliability program should be implemented to ensure that both become an integral part in the process of design.
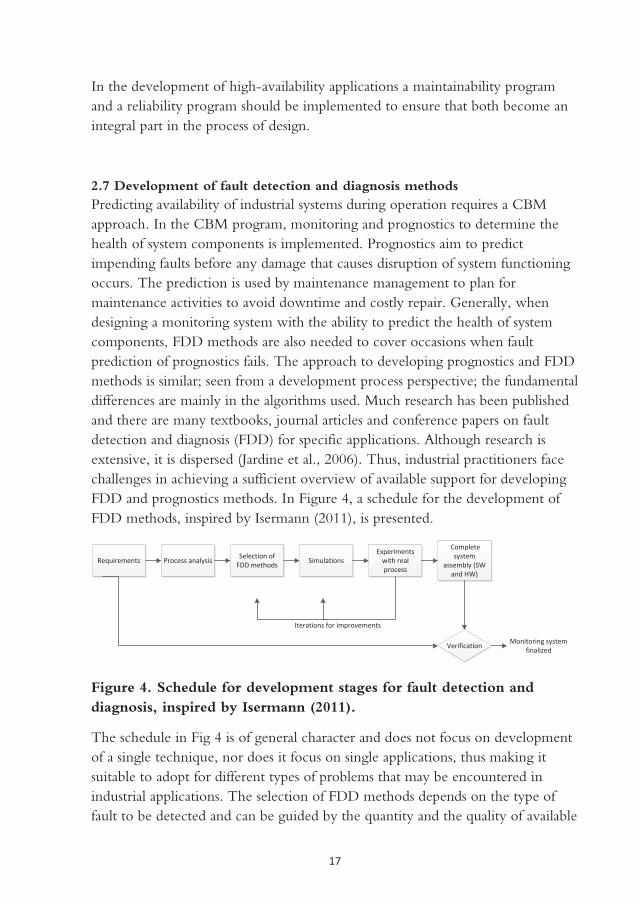
2.7 Development of fault detection and diagnosis methods Predicting availability of industrial systems during operation requires a CBM approach. In the CBM program, monitoring and prognostics to determine the health of system components is implemented. Prognostics aim to predict impending faults before any damage that causes disruption of system functioning occurs. The prediction is used by maintenance management to plan for maintenance activities to avoid downtime and costly repair. Generally, when designing a monitoring system with the ability to predict the health of system components, FDD methods are also needed to cover occasions when fault prediction of prognostics fails. The approach to developing prognostics and FDD methods is similar; seen from a development process perspective; the fundamental differences are mainly in the algorithms used. Much research has been published and there are many textbooks, journal articles and conference papers on fault detection and diagnosis (FDD) for specific applications. Although research is extensive, it is dispersed (Jardine et al., 2006). Thus, industrial practitioners face challenges in achieving a sufficient overview of available support for developing FDD and prognostics methods. In Figure 4, a schedule for the development of FDD methods, inspired by Isermann (2011), is presented.
Figure 4. Schedule for development stages for fault detection and diagnosis, inspired by Isermann (2011).
The schedule in Fig 4 is of general character and does not focus on development of a single technique, nor does it focus on single applications, thus making it suitable to adopt for different types of problems that may be encountered in industrial applications. The selection of FDD methods depends on the type of fault to be detected and can be guided by the quantity and the quality of available
Requirements Process analysis Selection of FDD methods Simulations
Experiments with real process
Complete system
assembly (SW and HW)
Verification Monitoring system finalized
Iterations for improvements

18
data describing the behavior of the fault and its fault mechanisms. A large quantity of data on failure characteristics but limited knowledge of the causes of failure may favor the use of data-based methods. However, good knowledge and available physical models favor model-based methods( Chiang et al., 2001). In Zhang and Jiang (2008) a classification of different fault detection methods is presented, the classification provides an overview of model-based methods and data-based methods (Fig 5).
Fault detection and diagnosis
Model-based methods Data-based methods
Quantitative methods Qualitative methods Quantitative methodsQualitative methods
State estimation
Parameter estimation
Parity space Statistical Non Statistical
Expert systems
Fuzzy LogicCausal Models
Abstraction Hierarchy
... ...
Fault trees Principal component analysis
Analytical methods Knowledge-based methods Data-driven methods
Figure 5. Classification of fault detection and diagnosis methods, inspired by Zhang and Jiang (2008).
Although there is support in terms of the design process for FDD development and guidance on how to develop specific FDD methods, the development of FDD methods and the infrastructure (i.e., sensors, databases, remote telecommunications technology, etc.) for retrieving data needed are often not an integrated process in the design and development of products. The development is usually performed as an add-on solution to the product or application in which the monitoring system operates. In the aircraft industry, the process of developing prognostic health management (PHM) systems has been addressed by Ma and Zhang (2013), who consider the integration of the PHM design process into the design process of the aircraft. They proposed that applying and integrating a structured process for the development of prognostic health management (PHM) system enhances the possibility to optimize the system in terms of both PHM system and aircraft design.

19
2.8 Data stream management systems and data stream mining Today, industry is data-intensive; companies need to manage the problem of exceeding available data storage capacity when monitoring products. Data storage is still relatively expensive and by utilizing techniques such as data stream management systems (DSMS), which process data only once, storage issues can be managed. DSMS enables fast and computation-intensive calculations to be performed on data streams in real time. In industrial applications, data stream management systems and data stream mining have been used for increasing availability (Alzghoul and Löfstrand, 2011). Data stream management systems can be described as an extension of a database management system which has the ability to deal with a data stream. A DSMS has similar structure as a DBMS, i.e., table in a relational database, although the data stream has no disk storage associated to it. The data stream arrives continuously and the arrival rate may vary from time to time, and missed data may be lost (Alzghoul and Löfstrand, 2011).

20

21
3. Research methodology This chapter describes the approach of the research conducted.
3.1 Design research methodology Design research involves the development of understanding and the development of support. Design research is generating knowledge about design and for design; in other words, the objective of design research is not only to understand design but also improve design. The research approach in this thesis has been inspired by the Design Research Methodology (DRM) presented by Blessing and Chakrabarti (2009). They proposed an iterative framework for design research which aims to provide guidelines and systematic planning of the research. In the first stage of the approach, research goals are clarified. In the second step, the descriptive phase, further studies are issued, with the aim to understand the current situation. The prescriptive phase follows, where the understanding of what factors influence the as-is situation is used to propose new tools and methods (support). In the next stage, the descriptive phase II, the support is investigated and evaluated for its ability to realize the desired, to-be situation. Iterations of this approach may be done several times, both between individual stages, and for the entire process. Parallel execution of these stages may also be done in order to reduce the number of iterations between stages. For instance, initiating planning of evaluation for Descriptive phase II may be done during the development of support (Prescriptive phase).
3.2 The research approach The research approach in this thesis has been guided by the overall research goals, e.g., research questions and high-level objectives stated within the Faste Laboratory. The Faste project research questions (Chapter 1.4) assigned to Backe concern how to secure the availability of the functional product. Predicting the availability has been considered important to enable FPs (Löfstrand et al., 2011), especially during early development phases of the offer. The challenge of developing functional products is multidimensional, meaning cooperation with researchers between different disciplines has been necessary in order to manage the technical challenges the FP offer brings. To investigate how the different constituents of such an approach should be modeled, Backe has collaborated with researchers, each representing different areas of expertise needed, to tie the constituents together into a comprehensive model. This collaboration resulted in the development Paper A. In Figure 6 a holistic overview of the author’s research process is presented.

22
PAPER A
PAPER B
PAPER CData Collection Drive System C
Data Collection Drive System B
Verification and validation of Paper A
Verification and validation of paper A
PAPER DFaste
LaboratoryRQ´s
RQ 2 and 3
PAPER E
RQ1
Literature review
Data Collection Drive System ADrive System B
Literature review
Data collectionDrive system A
An integrated development approach to monitoring and simulation for predicting
Functional Product availability
Synthesis
Emprical data and
understanding
input
Verification and validation of Paper A
Figure 6. The research process.
Based on initial understanding of the research challenges, a joint collaboration with researchers allowed for developing a model for simulating and predicting industrial availability, proposed in Paper A. As a strategy and to further enrich and partly verify the approach in Paper A, methods and tools for enabling the approach have subsequently been developed and evaluated in Papers B, C and D. For Paper B parts of the proposed simulation approach in Paper A were synthesized into a simulation model in which data from a hydraulic drive application were applied to evaluate its availability. In Paper C a method to predict system faults through data stream monitoring was developed and evaluated through the implementation of data from a real industrial application. In Paper D two different fault detection methods for searching high-volume data streams were developed and tested in a real industrial application. Both methods were evaluated and compared to each other to clarify applicability in the data

23
stream management system and performance in detecting faults. For Paper D the development situation at a research partner company (company A) to The Faste Laboratory was also studied through participant observation. Although not utilized in Paper D, results of the participant observation are reported in the results of this thesis to provide additional insights into challenges faced by company A. For Paper E a literature review was performed. Additional input to the development of Paper E has been provided through the empirical insights acquired from the work with Papers A, B, C and D. The thin dashed line around Papers A, B, C and D represents the overall experiences and empirical understanding of developing support needed for monitoring and simulation to predict industrial availability.
In the following section, the methodologies employed by the author during data collection are described.
3.2 Data collection at the studied company Each of Papers A, B, C and D has required extensive data collection and reliability assessment to be performed on hydraulic drive systems. Early on it was realized that there was a lack of quantitative data describing failures; hence, the option has therefore been to mainly use qualitative methods, techniques such as semi- structured interviews and participant observation and to enable collection of relevant data. The challenges for the reliability assessment have been to collect data which have been widely dispersed within the organization. Along with the dispersion of data, the quality of data has also been an issue; for example, failure reports have been incomplete, that is, not fully describing the causes of a fault or the context in which it has occurred. To complete this missing information, semi-structured interviews (Kvale and Brinkmann, 2009) with industrial personnel have been performed. The interview set-up has been prepared in advance by sending out information describing the background of the case to the participants. Prior to the interviews questionnaires were sent out. They were used for guidance purposes, and give the respondents the possibility to reflect upon the questions and the possibility to prepare themselves for the up-coming interview (Kvale and Brinkmann, 2009). Three different drive systems have been utilized for the purpose of studying, understanding and exploring and the technical risks involved in offering company A’s systems as functional products. Various types of data and information for system understanding have been collected, such as hydraulic schemes, technical specifications, CAD files, data from databases containing stored operational data, field failure reports and warranty claims. This information and an understanding of how these drive
24
systems are used and maintained has been fundamental for both the set-up of experiments and evaluation of methods. Overall, the data collection methodologies employed by the author for each of the papers has in each case been similar or the same. For the reliability assessment, generally, collection of quantitative data at company A has been a challenge.
3.3 Participation observation To observe company A’s current way of working in developing fault detection methods, participation observation was carried out. The participatory approach was chosen since it enables in-depth insight into the organization, thereby facilitating collection of relevant data that can be used to study the companies working method and development practice (Yin, 2009, Iacono, Brown and Holtham, 2009). The case study was conducted by using a hydraulic drive system as the basis for the development of fault detection methods. This specific drive was selected due to its close proximity to the production facilities of company A, so that experiments would be made possible and be controlled by personnel at the company. During the development of the fault detection methods, notes where made on decisions taken to follow up and analyze the work group setting and process performed at the studied company. Other issues such as the collaboration setting, use of technology and other methods or tools were also noted to gain a holistic understanding of the challenges and development situation at the studied company.
3.4 Data evaluation and analysis Overall, during the progress of each paper included in this thesis, data analysis has been performed by evaluating the data and information collected through triangulation (Yin, 2009). Triangulation has been a way to make up for the absence of qualitative data by using data from multiple data sources, as well as to improve the reliability of the research and the validity of the results. The authors of each paper have also iteratively analyzed data through interim analysis (Miles and Huberman, 1994). This has been a continuous process as new data have been added during the course of the research. Meetings have been held with the research team to discuss summarized results, for example, between interview sessions, to refine the focus and questions for additional data collection. Matrices (Miles and Huberman, 1994) have been used to display results, and analyses have been performed by screening these matrices and noting patterns, making comparisons and counting.
25
4. Results This section presents the results of the author’s research work.
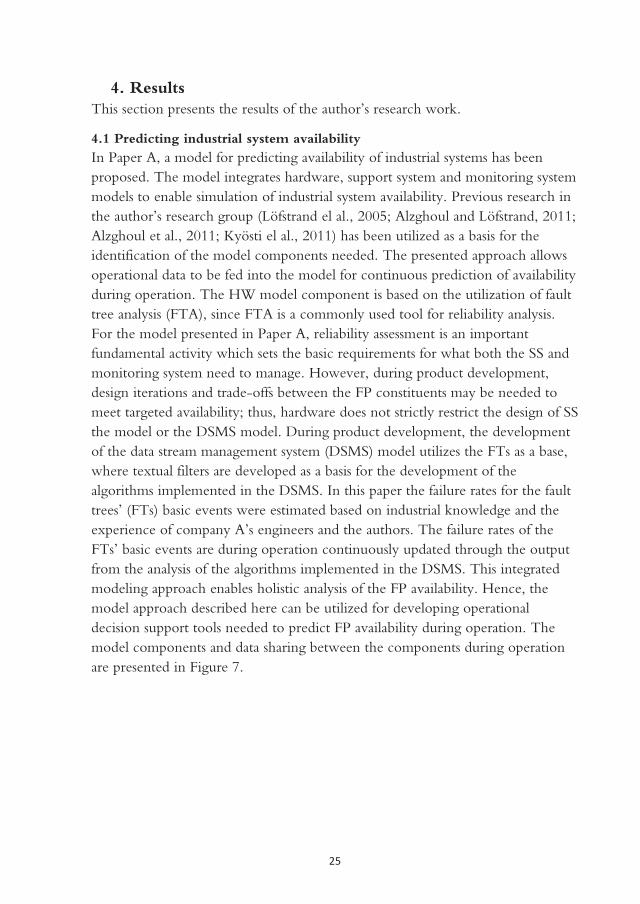
4.1 Predicting industrial system availability In Paper A, a model for predicting availability of industrial systems has been proposed. The model integrates hardware, support system and monitoring system models to enable simulation of industrial system availability. Previous research in the author’s research group (Löfstrand el al., 2005; Alzghoul and Löfstrand, 2011; Alzghoul et al., 2011; Kyösti el al., 2011) has been utilized as a basis for the identification of the model components needed. The presented approach allows operational data to be fed into the model for continuous prediction of availability during operation. The HW model component is based on the utilization of fault tree analysis (FTA), since FTA is a commonly used tool for reliability analysis. For the model presented in Paper A, reliability assessment is an important fundamental activity which sets the basic requirements for what both the SS and monitoring system need to manage. However, during product development, design iterations and trade-offs between the FP constituents may be needed to meet targeted availability; thus, hardware does not strictly restrict the design of SS the model or the DSMS model. During product development, the development of the data stream management system (DSMS) model utilizes the FTs as a base, where textual filters are developed as a basis for the development of the algorithms implemented in the DSMS. In this paper the failure rates for the fault trees’ (FTs) basic events were estimated based on industrial knowledge and the experience of company A’s engineers and the authors. The failure rates of the FTs’ basic events are during operation continuously updated through the output from the analysis of the algorithms implemented in the DSMS. This integrated modeling approach enables holistic analysis of the FP availability. Hence, the model approach described here can be utilized for developing operational decision support tools needed to predict FP availability during operation. The model components and data sharing between the components during operation are presented in Figure 7.
26
Actualcomponent
failure status(where revealed) HW model SS model CMMS
DSMS
Actual HW core product
Stream Data (Actual &
simulated)Bayesian Belief
Network
Failure signals(actual)
Updated component
failure models
Updated maintenanceschedules
Actual component
failure status(where revealed)
Actual status of maintenance &maintenance resources
Interaction between hardware and environmental conditions
Future component failure status(simulated)
& probabilities
Future component restorations
(simulated)
Output: System availability prediction & other HW performance metrics
Stream data from actual sensor readings
Component failure status (simulation)
Output: SS performance metrics
Future componentfailure status (simulation)
Output: Maintenance schedules
Data stream genarator
May store some data
1. 2. 2.
3.
Actual Sensor System (HW)
Failure signals(actual &
simulated)
Figure 7. Model components and data sharing during operation of FP (Paper A)
4.2 Evaluating functional product availability through simulation To support the decision of what availability guarantees a provider of functional products can offer, the ability to simulate and evaluate the availability performance of a functional product is crucial. In Paper B a software tool to model and predict the availability of a functional product (in this case consisting of hardware and support system) through its design details has been developed and demonstrated. As a part of the author’s verification and validation strategies, input data from a real industrial example at company A have been collected and applied in the software tool to simulate and analyze the availability performance. In the case of functional products, expected availability is not sufficient as an indicator alone in assessing the performance. The expected availability does not in itself account for the effects of rare adverse events, which result in availability falling short of the expected target value. To accommodate for such analysis within the model the partitioned multi- objective risk method (PMRM) was applied to account for the effect of these events. Through the application of PMRM in simulation using the real industrial system as an example provided an indication of suitable levels of availability which may be guaranteed for the system. Hence, it was concluded that by utilizing this approach it is possible to compare the availability performance of different designs. The model provides integration between hardware and service support system models that is needed in FP development.

27
4.3 System fault prediction Industrial system availability plays an important role for today’s industrial companies. Avoiding faults in a timely manner may reduce the downtime of manufacturing processes and reduce damage to system components. By having the capability to predict failures, maintenance support could be planned ahead and life extending activities (such as reducing power output to save critical components and reduce impact) may be activated and performed in time and thus increase availability through this faster response. In Paper C a fault detection system based on DSMS is proposed (Figure 8). The fault detection system presented builds upon previous work by Alzghoul and Löfstrand (2011) and has been modified to include different data-stream-based linear regression prediction methods. The included predictor’s task is to predict the data stream, to enable an earlier indication, or prediction, of impending failures compared to the fault detection system presented in Alzghoul and Löfstrand (2011). To test and verify the fault detection system, three algorithms for fault detection were applied on real data collected from a hydraulic drive system at company A. A comparison was made between the fault detection system proposed in Alzghoul and Löfstrand (2011) and the fault detection system proposed in Paper C to evaluate its ability to predict a short-term failure(less than 60 seconds), in this case, an artificially created failure: seizure of a hydraulic motor. The results showed around 89 percent classification accuracy of the failure using the predicted data stream, which was considered a good enough indicator to predict, and take actions to reduce, the impact or prevent the short-term failure.

28
Data Source
DSMS(SCSQ)
Fault detection function
Offline training
Failure
Alarm
Data stream
yes
No
Update
OnlineOffline
Data Stream Predictor
Fault detection function
Failure
Fault prediction Alarm
yes
Figure 8. The fault detection system architecture. The red dashed box indicates the modification introduced compared to the fault detection system presented in Alzghoul and Löfstrand (2011).
29
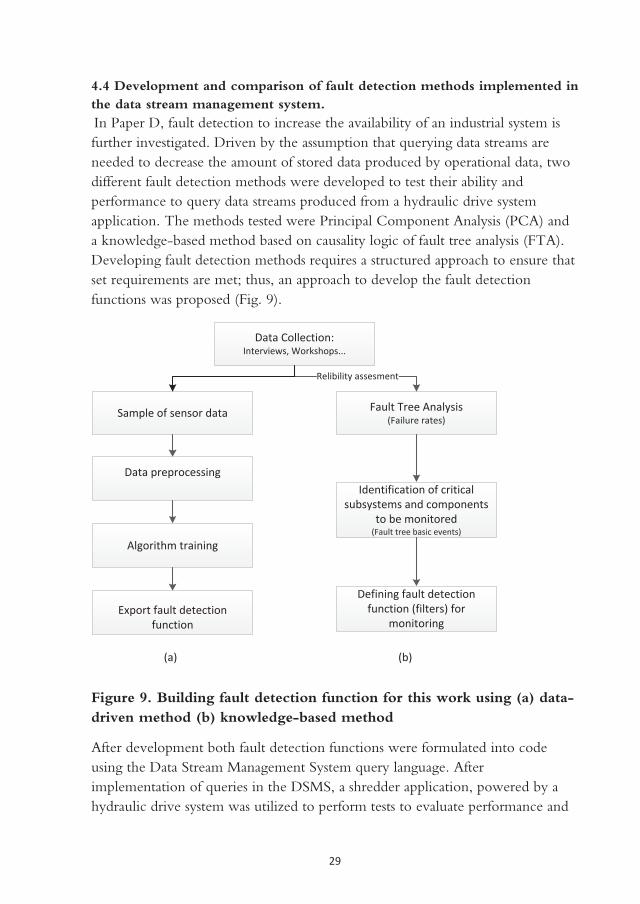
4.4 Development and comparison of fault detection methods implemented in the data stream management system. In Paper D, fault detection to increase the availability of an industrial system is further investigated. Driven by the assumption that querying data streams are needed to decrease the amount of stored data produced by operational data, two different fault detection methods were developed to test their ability and performance to query data streams produced from a hydraulic drive system application. The methods tested were Principal Component Analysis (PCA) and a knowledge-based method based on causality logic of fault tree analysis (FTA). Developing fault detection methods requires a structured approach to ensure that set requirements are met; thus, an approach to develop the fault detection functions was proposed (Fig. 9).
Fault Tree Analysis(Failure rates)
Relibility assesment
Identification of critical subsystems and components
to be monitored(Fault tree basic events)
Defining fault detection function (filters) for
monitoring
Data Collection:Interviews, Workshops...
Data preprocessing
Algorithm training
Export fault detection function
Sample of sensor data
(a) (b)
Figure 9. Building fault detection function for this work using (a) data-driven method (b) knowledge-based method
After development both fault detection functions were formulated into code using the Data Stream Management System query language. After implementation of queries in the DSMS, a shredder application, powered by a hydraulic drive system was utilized to perform tests to evaluate performance and
30
the method’s ability to detect faults occurring in the air-oil cooler of the drive system. Failure (covering the cooler cells) was gradually introduced during operation to simulate the clogging of the cooler element. Data were collected during normal operation and during the introduction of failure. Both methods were able to detect the failure without any false alert and both methods were adequate for online use in the DSMS, since they were faster than the arriving data stream. The accuracy of both methods showed good results; a classification accuracy of around 99% was achieved for the abnormal data. The result indicates that both methods are fast enough to be utilized for querying fast arriving data streams from industrial applications.
4.5 FP information perspective In Paper E a literature review concerning monitoring in relation to the FP business model is performed. The review aims to highlight frameworks, methodologies and technologies developed for the purpose to enable the development of the monitoring capabilities needed in the FP business model. In addition to reviewing contributions addressing the concept FP only, other concepts similar to FP were included, such as: product-service systems (PSS), industrial product service systems (IPS2) and Functional Sales. The review summarizes the methodologies addressing monitoring and analytics and the result of the paper is a table of information categories which shows a holistic perspective of the information addressed within research that may support or is considered necessary to FP business. The table of information categories also shows that recent contributions only emphasize parts of the multi-layered task of developing monitoring capabilities needed for FP business. It also shows that current methodologies do not, in themselves, cover all aspects of information. The table may be used as a basis for the development of the infrastructure and information system needed.
4.6 An integrated development approach for monitoring and simulation to predict Functional Product availability The challenge of managing the development of the overall monitoring capabilities needed in the FP business is complex; thus, there is a need for a structured approach. Based on aggregated research results and the knowledge domains presented in this thesis, the initiation of an ongoing approach can be identified. The approach presented here both visualizes and provides guidance for the development. It addresses the integration of processes and the application of the availability model from Paper A into the functional product development
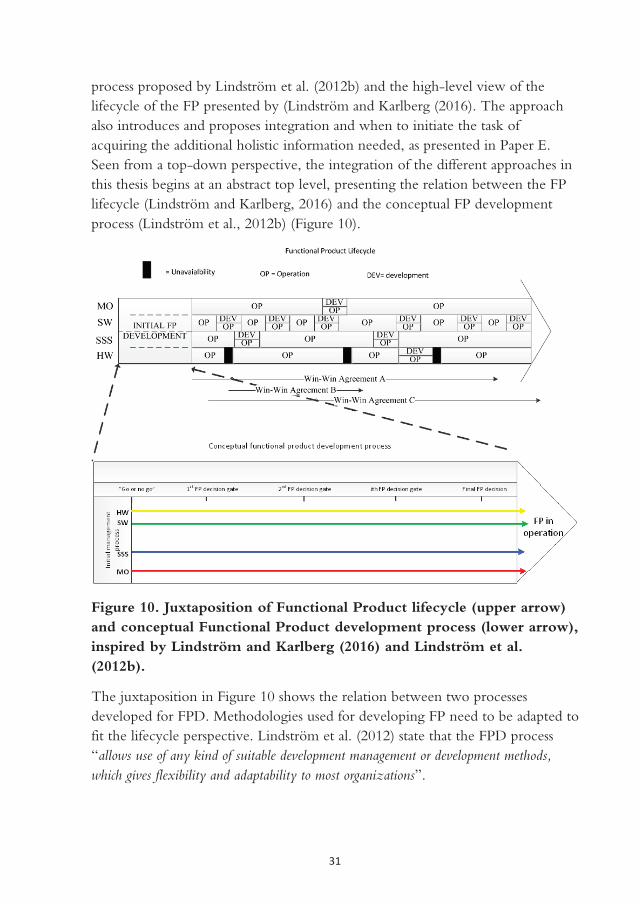
31
process proposed by Lindström et al. (2012b) and the high-level view of the lifecycle of the FP presented by (Lindström and Karlberg (2016). The approach also introduces and proposes integration and when to initiate the task of acquiring the additional holistic information needed, as presented in Paper E. Seen from a top-down perspective, the integration of the different approaches in this thesis begins at an abstract top level, presenting the relation between the FP lifecycle (Lindström and Karlberg, 2016) and the conceptual FP development process (Lindström et al., 2012b) (Figure 10).
Figure 10. Juxtaposition of Functional Product lifecycle (upper arrow) and conceptual Functional Product development process (lower arrow), inspired by Lindström and Karlberg (2016) and Lindström et al. (2012b).
The juxtaposition in Figure 10 shows the relation between two processes developed for FPD. Methodologies used for developing FP need to be adapted to fit the lifecycle perspective. Lindström et al. (2012) state that the FPD process “allows use of any kind of suitable development management or development methods, which gives flexibility and adaptability to most organizations”.

32
During the course of research performed in Paper D, where the participatory approach was applied in the development of FDD methods at company A, some empirical insights were noted. The motivation for the conceptual process integration made in this thesis originates partly from these insights, which reveals some of the challenges encountered at company A. A short summary of these notes is presented below:
Observed initial company settings:
At the time of initiation of development of FDD methods, company A’s current monitoring systems were sold as add-on services to their drive systems, where the monitoring tasks consisted mainly of condition monitoring and performance monitoring.
The development of the monitoring system at the company was not concurrently performed with the development of the system.
No formal procedural approach to the development of the condition monitoring system existed.
Observations made during development:
During development, collaboration between R&D divisions became necessary to accommodate knowledge leading to changed development team roles. This reduced the need for the development team to obtain the required in-depth knowledge about ways how to detect and predict the specific failure modes. The utilization of expertise was time-saving and allowed part of the development team to focus on the implementation of the FDD method into the DSMS.
The solution space of the development of FDD methods was narrowed down by restrictions to design changes, leading to an exclusion of an additional sensor which entailed impaired predictive capability of both FDD methods. However, this decision was taken after investigating effects on the results of doing this, and was considered to have a minor effect.
In Paper D, a first analysis of company A’s current situation, as observed in the above-presented bulleted list, led to review and the identification of methodologies for development of FDD methods. After the development, reflections on the process were made jointly by the research team and representatives from company A. These reflections where discussed and analyzed within the group, and both positive and negative aspects where highlighted. Among the positive aspects found, the change in team settings in the

33
development showed that parallelization of work had a positive outcome on the lead time and results; thus, it was realized that collaboration is important to accommodate knowledge and, in company A’s case, must be considered efficient in the development of FDD methods for various system components. Negative aspects found and discussed were the trade-off situation between changes in design, and whether or not to retro-fit an additional sensor. However, based on the knowledge and understanding of FPD, which suggests that the development of the FP constituents should be parallel and concurrent, it was realized that earlier implementation/integration would provide for greater design scope concerning placement of sensors, and thus improve the possibility to retrieve data needed for fault detection and diagnosis.
To conform to an integrated approach, which includes developing a simulation model for predicting availability and developing the monitoring capabilities needed to support availability prediction, three tracks need to be coordinated concurrently. In Figure 11 an integrated development approach for monitoring and simulation to predict Functional Product availability is presented.

34
Figure 11. An integrated development approach for monitoring and simulation to predict Functional Product availability

35
The upper arrow in Figure 11 represents the combination of the lifecycle process by Lindström and Karlberg (2016) and FPD process by Lindström et al. (2012b). The lower arrow represents the conceptual integrated development approach for monitoring and simulation to predict Functional Product availability. The three parallel tracks in the lower arrow each represent activities that should run in parallel, with tight interaction, for the realization of prediction of FP availability. Parallel execution and tight interaction of these tracks enables and allows for important exchange of reliability information between development activities needed. It also increases the possibility that further important dependencies between these tracks can be accounted for.
The middle green track represents a fundamental activity; it concerns the application and execution of a reliability program to ensure that reliability specifications in the FP are managed and pursued throughout the contracted period. To model and simulate to predict the availability of the FP requires that extensive reliability assessment need to be undertaken. In Papers A, B, C and D results from reliability assessments have served as input for the research done. For Papers A and B, reliability assessment results are used as input to the development of the simulation model which is partly modeled through fault trees. In Papers C and D, reliability assessment results are used for determining the requirements as to which faults need to be monitored, and fault trees are also used in the development of the FDD method.
The lower pink track represents the development of the simulation model for predicting availability. The progress of the development of the simulation model runs in parallel with the progress of the reliability program and information is constantly exchanged between them. In early design stages of the FP, simulation results are used for making decisions about design details as the FP gradually evolves. The simulation model also gradually evolves and the development of FDD methods, which may also have predictive capabilities, are translated into DSMS queries and integrated into the model. Before delivering the FP for operation, results from simulations using real system data are verified to determine its readiness for operation.
The upper white track represents the approach for developing FDD methods needed to support prediction of availability through simulation. Due to its general approach, the schedule by Isermann (2011) is here adopted to visualize the process of developing of the FDD methods.

36
The early integration of the development of the FDD methods provides a greater design space compared to add-on approaches in which design may be restricted due to trade-off situations. A greater efficiency may also be achieved by the integration and simultaneous development with the rest of the FP constituents. For example, the use of early results from calculations or simulations of the FP HW and SSS reduces duplication of work (work tasks being repeated twice) in the development of FDD methods, as would be the case with the add-on development approach. During development and operation, necessary iterations of the development stages in the process are conducted as required.
During the development and operation of the FP, continuous sharing of information in between these tracks needs to be managed and the information made available to involved stakeholders. Feedback from the monitoring system constantly updates failure rates in the fault tree structure in the simulation model. Any new upcoming faults not detected by the monitoring system need attention. Through the reliability program, interventions such as reengineering of components to increase reliability, or development of new FDD methods to include detection of the actual fault, are managed and decided upon. Simulation results of predicted FP availability are fed into the reliability program and service support system as a basis for decision support. New fault tree structure developed during the reliability program is continuously updated in the simulation model.
The description of this integrated development approach partly visualizes the way of predicting the availability of FPs and consolidates the individual results of Papers A, B, C and D to give a better holistic understanding. Through this integrated approach the availability of the FP may be controlled in a satisfactory manner, reducing the risks and uncertainties of the provider.
37
5. Discussion In the development of FPs, a high degree of integration and coordination is required to manage the complex development situation. The transition to offering business models such as FPs may be a great challenge for manufacturers, depending on their capability in managing such a development scenario. In research towards the development of new tools and methods to support FPD, integration of this support into FPD methodology must be considered. Addressing integration of these tools and methods enhances the understanding and implementation of the research results. So far, the guidance for FPD is still described on a relatively abstract level and more procedural approaches, which add specificity to the development approach to FP, are needed. The integrated approach proposed here shows, from a development process perspective, the implementation and use of the research results from the papers included in this thesis.
What can be emphasized from the research presented in this thesis is the importance of being able to manage system reliability in FPD and throughout the FP lifecycle. The ownership of the FP remains with the provider, who needs to control the risk of unavailability. A reliability program (and maintainability program as well) is a necessary means of upholding a good solid base for managing reliability issues throughout the lifecycle of the FP. It is not enough to rely on a point-effort in reliability assessment in early phases of development, and then leave the reliability commitment unsupervised. It is a continuously ongoing process throughout the FP lifecycle, in which reliability is targeted and serves as input for assessing the availability of the function delivered.
Although not addressed in this thesis, controlling costs in FPD and during operation is of main concern when delivering high-availability FPs. A reliability program should provide support for economic achievement of overall program objectives and hold down its own impact on cost; hence, this strengthens the need for a proper implementation and execution of an efficient reliability program within FPD. The FP enterprise may consist of several stakeholders, such as subcontractors and suppliers. The reliability of system components must therefore be controlled through the stakeholders, possibly by agreements between these parties. Proper reliability management is a core capability when offering FPs, and also a fundamental requirement for successful implementation of the research presented in this thesis. The simulation approach presented in Paper A can be used as basis for the development of decision support in FPD and during
38
operation of the FP, and aid planning and evaluation of reliability and maintainability actions to fulfill availability and cost goals.
Predicting the availability of the FP through the use of DSMS has been shown to be a possible approach. However, as data also need to be stored for other types of analysis, this approach is no cure-all and can be used for data-intensive applications in which it is not feasible or necessary to store all data. The development approach to FDD methods to monitor FP health is, however, in most cases the same, as the methodologies used are usually the same or similar.
The development of the monitoring capabilities needed in FP business may also be a capital-intensive investment for the FP provider. However, the initial costs for this development must be considered on a fleet level, and seen as a shared cost onto each FP offered. As found in the literature review of Paper E, being well-informed is considered to contribute to additional competitive advantage, and thus may be the main differentiator between others offering integrated product service solutions such as FP. In addition to achieving a better understanding and knowledge of its own offer, there is also a great business value in understanding customers better, which can only be done through monitoring and analytics. While retaining the ownership of the FP, the possibility of accessing data increases.
The use of methodologies and tools developed for supporting product development may need adaptation to fit the FP lifecycle commitment. Most development support used in traditional product development only provides support during the development phase and needs to be completed to support the continuous development inherent during the FP lifecycle.
5.1 Addressing the research questions
RQ1: How should simulation models be developed and created to model product and service availability?
In Paper A, a model to predict industrial system availability was proposed. In the paper it was shown how to model the constituents and the necessary data sharing between these entities to enable integrated simulation. In addition to Paper A, a software tool to predict system availability was synthesized in Paper B to verify parts of the model in Paper A. Simulation of HW and SSS with data from a real industrial system was performed to demonstrate, test and evaluate the feasibility of the integrated approach. The results from the simulation provided an

39
indication of what level of availability may be guaranteed for the FP, and utilizing discrete event simulation (DES) showed that this approach can be used to compare the availability performance of different designs. By the inclusion of the PMRM method to the analysis of availability, it was shown that this enables better decision making, and also improves and partly verifies the approach in Paper A.
RQ2: How should HW and monitoring of HW status be interconnected and modeled to enable prediction of industrial system reliability through simulation during operation?
An important result of the model in Paper A is the prediction of failures through the application of a DSMS to manage data arriving from sensors from the industrial system. The feasibility of performing predictive fault detection within the DSMS needed to be further tested and verified; hence, a newly developed fault detection system was proposed in Paper C. Tests of the fault detection system showed good performance in predicting failures of a short-term character, and this partly verifies the feasibility of using DSMS in the availability model. Predicting failure rates of individual components in the system is, however, a complex task which requires major development efforts. There is a need for a structured approach to successfully carry out this work and in Paper D an approach to how two different fault detection methods could be developed to be implemented in DSMS was shown. Furthermore, results of Paper D showed that the applicability of these fault detection methods showed good performance in terms of speed and accuracy in querying data streams for fault prediction. Thus, implementing and utilizing these fault detection methods in DSMS for availability prediction in the model proposed in Paper A seems to be a valid approach.
RQ3: What needs to be monitored when offering Functional Products?
In addition to the need for monitoring to enable prediction of FP availability as presented in this thesis, RQ3 has been formulated based on the realization that monitoring system development demands keeping a wide perspective on which data such a system should collect. The literature review in Paper E addressed this question from a holistic perspective. The result from the review was a compilation of information categories being considered within research on FP, and similar business models related to FP. Given the fact that these information categories have been raised within research it is reasonable to conclude that these areas are of importance to the provision of FP. The holistic perspective presented

40
may serve as a basis when developing the capabilities needed for information retrieval through monitoring.
To summarize, these research questions have been partly answered and verified. Both the DSMS approach, as a means to predict availability through monitoring, and the simulation approach, as a means to model and simulate HW and SS to predict availability in Paper A, have been partly verified through Papers B, C and D. However, combing DSMS and the simulation model have not yet tested. The review in Paper E showed the information perspective addressed within research of FP and other product service concepts similar to FP. What needs to be monitored is closely related to the risks and the business goals of each unique FP. To fully respond to RQ3 requires further research. The information perspective in Paper E provides an insight into the wide range of information that is considered necessary or supportive in the FP business situation.

41
6. Conclusions This thesis comprises a compilation of five publications. In the research presented in thesis it has been shown how predicting FP availability can be performed through integrated modeling of HW and SS and simulation performed by discrete event simulation. It has been shown that by using the addition of PMRM in simulation, indicators for evaluating the availability performance in events of rare adverse outcomes is provided, which provides additional insight into the risks of offering FPs. However, modeling and simulation to predict the availability of functional products is a complex and time-consuming task which, without the necessary tools, requires significant expertise. Through a case example it is shown that to aid product designers, the development of simulation models based on a structured foundation, enables simulations and analysis of availability to be performed in a more iterative nature by the product designers, who can then evaluate different designs during the development and thus reduce the time for assessment and need for expensive expertise. To monitor the health status of the FP, it has been shown that different fault detection algorithms applied in DSMS can be used for predicting faults in industrial systems and hence be used to provide information for the prediction of FP availability. Fault prediction through DSMS is one technique which can be used to reduce the amount of data stored; however, storage of data is still valuable and important, for example, in machine learning, analysis of customer behavior and product performance on a fleet level. Though the the integrated development approach for monitoring and simulation to predict Functional Product availability presented, it is clear that assessment of reliability is a core activity for developing successful simulation models and monitoring systems for availability prediction in FPD. These activities should be pursued throughout the FP lifecycle to ensure that the FP availability requirements are fulfilled. The development of the monitoring capabilities needed for fault detection, diagnosis and prognosis need to be guided by a formalized and structured approach to ensure that requirements of the monitoring capabilities needed are satisfied and that the monitoring system becomes an integrated part of the FP. The integrated development approach for monitoring and simulation to predict Functional Product availability provides a holistic perspective and specificity to the functional product development process and may be used by managers as guidance in setting up their development organization, its tools, competencies and methodologies needed. The information perspective in FPD and related business models has been reviewed. This review provides a holistic perspective of the information that is needed or supportive in FPD; it also shows that few research contributions address this topic from a

42
holistic perspective. Without a holistic perspective, the development of monitoring and information systems for FP will be restricted.

43
7. Future work When developing the monitoring capabilities needed to offer FPs, the requirement for information must be addressed from a holistic perspective. Very few approaches in research address the topic at this level, which affects the development of monitoring and information systems negatively. Condition monitoring is one necessary task which provides data and information about the health of the FP so that costly unplanned availability may be avoided. Although one of the most basic, this is no trivial task, and the monitoring and information system must perform it if the FP offer is to be fulfilled. However, offering competitive FPs requires more than merely a focus on availability. One of the main benefits of providing FP is the possibility to optimize the whole. This allows for developing offers that are more sustainable in terms of energy consumption, material resources, etc. Retaining the ownership of the FP increases the accessibility of data about the operation and usage. To succeed in developing and ensure safe and efficient operation of the FP a data and information culture must be established in which all instances of the value chain work with analyzing and optimizing their respective areas of responsibility. To ensure that data and information needed are made available to stakeholders within the value chain, including the customer; the information requirements across the value chain must be established and managed. This allows for early prototyping of the information system, information architecture, as well as monitoring system and information infrastructure which otherwise suffer restrictions in terms of the possibility to retrieve and make data available. This thesis contributes to the understanding of development of the monitoring and simulation capabilities useful for, and in, FP development. The thesis further presents an overview of the research addressing monitoring and provides an overview of the information perspective addressed in the research related to FP development. Further research should focus more on developing holistic information strategies and frameworks for information management specific to the business model, since access to data and information needed by the FP enterprise is decisive for engaging in FP business.

44
45
8. References Alonso-Rasgado, T., Thompson, G. and Elfström, B-O. (2004) ‘The design of functional (total care) products’, Journal of Engineering Design, Vol. 15 No. 6, pp.515-540.
Alonso-Rasgado, T. and Thompson, G. (2006) ‘A rapid design process for Total Care Product creation’, Journal of Engineering Design, Vol.17 No.6, pp.509-531.
Alzghoul, A., Löfstrand, M., Karlsson, L. and Karlberg, M. (2011), ‘Data stream mining for increased functional product availability awareness’, Proceedings of the 3rd CIRP International Conference on Industrial Product Service Systems, Technische Universität Braunschweig, Braunschweig, Germany, May 5th - 6th, 2011., Springer, Berlin, pp.237-241.
Archer, L.B. (1965) Systematic method for designers. Council of industrial design.
European Union [online]https://ec.europa.eu/research/fp5/fp5-intro_en.html (accessed 2016-11-01).
Alzghoul, A, and Löfstrand, M. (2011) ‘Increasing availability of industrial systems through data stream mining’, Computers & Industrial Engineering, Vol. 60 No. 2, pp.195-205.
Andrews, J.D. and Moss, T.R. (2002) Reliability and Risk Assessment, Professional Engineering Publishing Limited, Bury St Edmunds, ISBN: 86058-290-7.
Baines, T., Lightfoot, H.W., Evans, S., Neely, A., Greenough, R., Peppard, J., Roy, R., Shehab, E., Braganza, A., Tiwari, A., Alcock, J.R., Angus, J.P., Bastl, M., Cousens, A., Irving, P., Johnson, M., Kingston, J., Lockett, H., Martinez, V., Michele, P., Tranfield, D., Walton, I.M. and Wilson, H. (2007) 'State-of-the-art in product-service systems' Proceedings of the Institution of Mechanical Engineers, Part B: Journal of Engineering Manufacture, Vol 221 No. 10, pp.1543-1552.
Beuren F.H., Gomes Ferreira M.G. and Cauchick Miguel P.A. (2013)‘Product-service systems: a literature review on integrated products and services’, Journal of Cleaner Production, Vol 47, pp.222-231.

46
Blessing, L. T. M., Chakrabarti, A. and Wallace, K. M. (1998) An overview of descriptive studies in relation to a general design research methodology. In Designers - The Key to Successful Product Development, Springer London, pp.42-56.
Brännström, O., Elfström, B-O. and Thompson, G. (2001) ‘Functional Products create new demands on Product Development Organisations’, Proceedings of International Conference on Engineering Design, Glasgow, Scotland.
Chiang, L.H., Russell, E. and Braatz, R.D. (2001). Fault detection and diagnosis in industrial systems. Springer Verlag.
Clarkson, J. and Eckert, C. (2005) Design process improvement: a review of current practice, Springer-Verlag London Limited 2005.
Ericson, Å.M and Larsson, T.C (2009) ‘People, product and process perspectives on product/service-system development’, In: T. Sakao, M. Lindahl (Eds.), Introduction to Product/Service-system Design, Springer-Verlag, London (2009).
Goedkoop, M., Van Halen, C., Te Riele, H., Rommens, P. (1999). Product service systems, ecological and economic basics, Report for Dutch Ministries of Environment (VROM) and Economic Affairs (EZ).
Iacono, J., Brown, A. and Holtham, C. (2009) ‘Research methods - a case example of participant observation’, Electronic Journal of Business Research Methods Vol. 7 No.1, pp.39-46.
INCOSE (International Council on Systems Engineering) (2014) Website acc. online 2016-12-05, http://www.incose.org/.
Isaksson, O., Larsson, T. C., & Rönnbäck, A. Ö. (2009). ‘Development of product-service systems: challenges and opportunities for the manufacturing firm’ Journal of Engineering Design, Vol. 20 No.4, pp.329-348.
Isermann, R. (2011) Fault-Diagnosis Applications: Model-based condition monitoring: Actuators, drives, machinery, plants, sensors, and fault-tolerant systems. Berlin: Springer-Verlag.
Jardine, A.K.S., Lin, D. and Banjevic, D. (2006) ‘A review on machinery diagnostics and prognostics implementing condition-based maintenance’, Mechanical Systems and Signal Processing, Vol. 20 No. 7, pp. 1483-1510.
Kvale, S and Brinkmann, S (2009) Interviews: Learning the Craft of Qualitative Research Interviewing, Sage Publications, Los Angeles.
47
Kyösti, P. (2015) Predicting functional product availability and cost through a simulation driven approach . PhD thesis, Luleå University of Technology, Luleå, Sweden. Retrieved from http://urn.kb.se/resolve?urn=urn:nbn:se:ltu:diva-17931.
Kyösti, P., Reed, S., Löfstrand, M., Andrews, J., Karlsson, L., and Dunnett, S. (2011) ‘Simulation of Industrial Support Systems in the Context of Functional Products’, Advances in Risk, Reliability and Technology Symposium, 19th, Stratford-upon-Avon.
Lie, C.H., Hwang, C.L., Tillman, F.A., (1977) ‘Availability of maintained systems: A state-of-the-art survey ’, AIIE transactions. Vol. 9 No. 3, pp. 247-259.
Lindström, J., Löfstrand,M., Karlberg, M. and Karlsson, L. (2012a). ‘Functional product development: what information should be shared during the development process? ’ International Journal of Product Development, Vol. 16 No. 2, pp.95-111.
Lindström, J., Löfstrand, M., Karlberg, M. and Karlsson, L. (2012b) ‘A development process for Functional Products: hardware, software, service support system and management of operation. ’ International Journal of Product Development Vol. 16 No. ¾, pp. 284-303.
Lindström, J., Dagman, A. and Karlberg, M.(2014) ‘Functional Products Lifecycle: Governed by sustainable Win-Win Situations’, Procedia CIRP, Vol. 22, pp.163-168.
Lindström, J., Sas, D., Lideskog, H., Löfstrand, M., and Karlsson, L. (2015) ‘Defining 'Functional Products' through their constituents’, International Journal of Product Development, Vol. 20 No.1, pp.1-24.
Lindström, J., Dagman, A. and Karlberg, M. (2015) ‘The Functional Products Technical Lifecycle and its Four Sub-lifecycles’, Procedia CIRP, Vol. 38, pp.222-227.
Lindström, J. and Karlberg, M. (2016) ‘Outlining an overall Functional Product lifecycle – Combining and coordinating its economic and technical perspectives’, CIRP Journal of Manufacturing Science and Technology, Available online 9 September 2016.
Luleå University of Technology, Division of Product and Production Development Website acc. Online 2016-10-05

48
http://www.ltu.se/org/tvm/Avdelningar/Produkt-och produktionsutveckling?l=en.
Löfstrand, M., Larsson T. and Karlsson, L. (2005) ‘Demands on Engineering Design Culture for Implementing Functional Products’, International Conference on Engineering Design, Melbourne, Australia.
Löfstrand, M., Andrews, J., Karlberg, M. and Karlsson, L. (2011) ‘Functional product system availability: simulation driven design and operation through coupled multi-objective optimization’, International Journal of Product Development, Vol. 13, No. 2, pp.119-131.
Ma, Y. and Zhang, Y. (2013) ‘PHM design based on cooperative design’, Chemical Engineering Transactions, Vol. 33, pp.217-222
Manzini, E. and Vezzoli, C. (2003) ‘A strategic design approach to develop sustainable product service systems: examples taken from the ‘environmentally friendly innovation’, Journal of Cleaner Production, Vol. 11 No.8, pp. 851-857.
Miles, M.B., and A.M. Huberman. (1994) Qualitative Data Analysis: An Expanded Sourcebook. 2nd ed. SAGE publications.
MIL-STD-1629a (1980) Procedures for Performing a Failure Modes, Effects and Criticality Analysis, US Department of Defence, Rome Laboratories.
MIL-STD 785B (1980) Reliability Program for Systems and Equipment Development and Production, US Department of Defense.
Meier, H., Roy, R. and Seliger, G. (2010). ‘Industrial product-service systems – IPS2‘ CIRP Annals Manufacturing Technology, Vol. 59 No. 2, pp.607-627.
Mont O. (2002) ‘Clarifying the concept of product–service system’, Journal of Cleaner Production, Vol. 10 No. 3, pp.237-245.
NUREG- 0492 (1981) Fault Tree Handbook, Nuclear Regulatory Commission, Washington.
O'Connor, P. D. T. and Kleyner, A. (2012) Practical reliability engineering 5th ed. Wiley, Hoboken, NJ.
Parida, V., Rönnberg-Sjödin, D., Wincet, J. and Ylinenpää, H. (2013). ‘Win-win Collaboration, Functional Product Challenges and Value-chain Delivery: A Case Study Approach’ Procedia CIRP, Vol.11, pp.86-91.
49
Park, Y. and Lee, H. (2009) ‘Towards Integration of Products and Services: Literature Review and Phraseology’, International Conference on Management and Service Science, pp. 1-4.
Prasad, B. (1996) Concurrent engineering fundamentals: Integrated product and process organization, Prentice Hall PTR, Upper Saddle River, New Jersey.
Roy, R., Shaw, A., Erkoyuncu, J. A. and Redding, L. (2013) ‘Throughlife Engineering Services’, Measurement and Control, Vol.46 No.6, pp.172-175.
SSPI website acc. online 2016-11-03 http://www.it.uu.se/research/group/udbl/SSPI/.
SmartVortex Website acc. online 2016-10-05 http://www.smartvortex.eu/ .
Smith, D. J. (2011) Reliability, Maintainability and Risk : Practical Methods for Engineers Including Reliability Centred Maintenance and Safety-Related Systems. Butterworth-Heinemann, Amsterdam.
Stahel, W.R. (1997). ‘The functional economy: cultural and organizational change’, In: The Industrial Green Game: Implications for Environmental Design and Management, pp.91-100. The National Academies Press, Washington, DC.
Sundin, E. and Bras, B. (2005) ‘Making functional sales environmentally and economically beneficial through product remanufacturing’, Journal of Cleaner Production, Vol.13 No. 9, pp. 913-925.
Tan, A.R., Matzen, D., McAloone, T.C. and Evans, S. (2010) ‘Strategies for designing and developing services for manufacturing firms’, CIRP Journal of Manufacturing Science and Technology, Vol.3 No 2, pp.90-97.
The Faste Laboratory Website acc. online 2016-10-05 http://www.ltu.se/centres/Fastelaboratoriet-Vinnexc-Center?l=en.
Tomiyama, T. (2005) ‘A Design Methodology of Services’, International Conference on Engineering Design, Melbourne.
Tukker, A. and Tischner, U. (2006) New Business for old Europe Product service development, competitiveness and sustainability, Greenleaf publishing, Sheffield.
Thoben, K-D., Eschenbächer, J. and Jagdev, H. (2001) ‘Extended Products: Evolving Traditional Product Concepts’, Proceedings of 7th Int. Conf. on Concurrent Enterprising, Bremen, Germany.

50
Ulrich, K.T and Eppinger, S.D. (2012) Product Design and Development, 5th Ed., International Edition 2012, McGraw-Hill.
Vandermerwe, S. and Rada, J. (1988) ‘Servitization of business: adding value by adding services’, European Management Journal, Vol. 6 No.4, pp.314-324.
Vasantha, GVA., Roy, R., Lelah, A., Brissaud, D. (2012) ‘A review of product–service systems design methodologies’, Journal of Engineering Design, Vol. 23 No. 9, pp. 635-659.
Villemeur, A. (1992). Reliability, availability, maintainability and safety assessment. Vol.1, Methods and techniques. Wiley, Chichester.
VINNOVA website, acc. online 2016-12-20. http://www.vinnova.se/en/
Winner, R. I., Pennell, J. P., Bertrand, H. E., and Slusarczuk, M. M. (1988) The role of concurrent engineering in weapons system acquisition, IDA-Report-338. Institute for defense analyses Alexandria VA.
White, A.L., Sloughton, M. and Feng, L. (1999), Servicizing: The Quiet Transition to Extended Product Responsibility, Tellus Institute, Boston.
Yin R.K. 2009 Case study research, Applied Social Research Methods Series, Vol 5, 4th ed.
Zhang, Y. and Jiang, J. (2008). ‘Bibliographical review on reconfigurable fault-tolerant control systems. ’ Annual Reviews in Control ,Vol. 32 No. 2, pp.229-252.

Appended Papers


Paper A

140 Int. J. Product Development, Vol. 16, No. 2, 2012
Copyright © 2012 Inderscience Enterprises Ltd.
A model for predicting and monitoring industrial system availability
Magnus Löfstrand*, Björn Backe, Petter Kyösti and John Lindström Division of Computer Aided Design, Luleå University of Technology, SE-971 87 Luleå, Sweden Email: [email protected] Email: [email protected] Email: [email protected] Email: [email protected] *Corresponding author
Sean Reed Nottingham Transportation Engineering Centre NTEC, University of Nottingham, University Park, Nottingham, NG7 2RD, UK Email: [email protected]
Abstract: This paper describes the integration of a sensor data stream monitoring system into a proposed functional product model capable of predicting functional availability. Such monitoring systems enable predictive maintenance to be carried out – pre-emptive maintenance that is scheduled in response to imminent hardware failure – and are in widespread use in industry. The industrial motivation for this research is that agreed upon system availability is a critical element of any business-to-business agreement regarding functional sales. Such a model is important when making strategic choices regarding FPs and can be used to develop a high availability product design through simulation-driven development, as well as to provide operational decision support that reflects the current reality to enable optimal availability to be achieved in practice. The proposed model integrates hardware, support system and monitoring system models, and is able to incorporate actual operational data. It has been partly verified based on previous research.
Keywords: system availability; functional product; product service system.
Reference to this paper should be made as follows: Löfstrand, M., Backe, B., Kyösti, P., Lindström, J. and Reed, S. (2012) ‘A model for predicting and monitoring industrial system availability’, Int. J. Product Development, Vol. 16, No. 2, pp.140–157.
Biographical notes: Magnus Löfstrand is a Researcher at the Division of Computer Aided Design in Luleå University of Technology. He received his PhD in Computer Aided Design from Luleå University of Technology. His research interests include work process modelling and simulation as well as distributed collaborative work applied in industrial product development processes. One of his main research interests lies in the area of product
A model for predicting and monitoring 141
development for function provision i.e. functional product development. In such a setting other needs than the strictly hardware based ones are catered to, for example availability and productivity. He has published research papers in international journals and conference proceedings.
Björn Backe is a PhD Student at Computer Aided Design in Luleå University of Technology. His main research interests include hardware reliability supported by methods and tools for data stream monitoring.
Petter Kyösti is a PhD Student at Computer Aided Design in Luleå University of Technology His main research interests include support system reliability and availability supported by methods and tools for data stream monitoring.
John Lindström is a Researcher at the Division of Computer Aided Design in Luleå University of Technology. He received his PhD in Information Systems Science from Luleå University of Technology. Prior to joining academy, he worked for 15 years in different industries in both management and specialist positions with product, service, process and business development. His research interests include development processes, availability matters on system and organisational level, as well as modelling and simulation applied in industrial development processes. One of his main research interests lies in the area of product development for function provision i.e. functional product development. He has published research papers in international journals and conference proceedings.
Sean Reed is a Research fellow at the Nottingham Transportation Engineering Centre in the University of Nottingham. He received his PhD in Risk and Reliability from Loughborough University. His research interests include the development of binary decision diagram, Markov, Petri net and simulation based modelling techniques to investigate the reliability, availability and maintainability of complex hardware systems.
1 Challenges for simulating industrial system availability
High availability, achieved through reliability and maintenance is an important customer demand which is currently gaining industrial significance. In particular, when entering into a business-to-business agreement regarding functional sales, agreed upon availability is of the utmost importance, especially since a function’s availability directly influences customers’ productivity (Löfstrand et al., 2011). Functional Products (FP) may be seen as integrated offerings consisting of Hardware (HW) and Support Systems (SS) (Alonso-Rasgado et al., 2004) or HW, Software (SW) and services (Brännström et al., 2001). In addition, the area of Product Service System (PSS) (Morelli, 2002; Weber et al., 2004; Tukker and Tischer, 2005; Morelli, 2006; Baines et al., 2007) contributes research to the FP-related area of PSS offerings. In this paper, a functional product is considered as consisting of HW and SS, as described by Löfstrand et al. (2011). Löfstrand et al. (2011) presented an approach for how models of HW and SS can be integrated to derive and optimise the availability of functional products.
According to Alonso-Rasgado et al. (2004), a typical service support system can be divided into a distinct set of four sub-systems. Operations planning. HW maintenance (and remanufacture).
142 M. Löfstrand et al.
Data storage and decision-making.
Service processing.
According to Shostack (1982), a service support system can be visualised either by molecular modelling or by service blueprinting. Another approach for service support system modelling based on structure analysis design technique was presented by Ross (1988).
Alonso-Rasgado et al. (2004) stated that: Modelling of the proposed service system is a very important stage in service development that seems to have received little attention over the years. Reasons for this include the lack of an appropriate methodology for services, the volume of detail and complexity of the proposed service, time and resources required and fundamental differences between new product development and new service development, in particular the inability to accurately describe human behaviour.
The challenge identified by Alonso-Rasgado et al. (2004) concerning the problem of accurately modelling human behaviour is partly addressed by Löfstrand and Isaksson (2010), who present an approach for how to model a process including human behaviour. Some additional challenges regarding modelling of human behaviour are addressed in Sections 3.3 and 3.4.
Previously, there have been relatively few suggested simulation-based approaches to functional product development. Löfstrand et al. (2005) introduce a schematic representation of a simulation support tool for functional product development. Karlsson et al. (2005) present an information-driven approach for enabling functional product innovation based on modelling and simulation. In addition, Alonso-Rasgado and Thompson (2006) proposes a computational tool supporting a rapid design process for total-care product creation. They discuss combinations of service support system and hardware design. The functional product, called total-care product Alonso-Rasgado and Thompson, could consist of the following:
Functional product
o Hardware
- Mass
- Volume
- Cost
- Material selection
- Assembly structure
o Services
- Service planning
- Performing maintenance
- Record keeping
- Service processing
- Education
- Cost

A model for predicting and monitoring 143
A model for improved system availability prediction of a functional product that incorporates HW condition monitoring, and is based on discrete event simulation is presented in this paper based on the definition of availability by Andrews and Moss (2002) below.
, approximately in steady stateMTTFUA
U D MTTF MTTR (1)
Here, A refers to system availability, U to total system uptime, D to total system downtime, MTTF to mean time to failure, MTTR to mean time to repair, to mean failure rate and to mean repair rate. Both reducing the component failure rate and reducing MTTR through developing and using an optimal SS, increases availability. In addition to age, the probability of component failure also depends on its environmental conditions, system load related to the system duty cycle and its condition. Therefore, HW monitoring by, for example, Data Stream Mining (DSM) (Alzghoul et al., 2011) may be used as a way to determine the system status and update the component failure probabilities and thereby enable the conditional triggering of proactive or reactive maintenance activities (known as Predictive Maintenance or PdM). The objective here is to present a model for predicting system availability, where the model comprises HW modelling, SS modelling and HW monitoring modelling. The model is proposed to be utilised in the enhancement of HW availability during two main phases of the lifecycle of a functional product: during product development through simulation-driven design and during product operation through provision of operational decision support.
In order to apply the model to a real-world system, certain data for that system must be collected and analysed. In this paper, a description is given of how data for a system from an industrial partner have been collected through industrial archival records and interviews with industry personnel. The techniques for processing this data into a format suitable for the model, such as Fault Tree Analysis (FTA) and Block diagrams, so that it can predict system availability are also given. By monitoring an industrial HW system, faults and failures can sometimes be predicted and detected before any loss of function occurs, facilitating predictive maintenance and resulting in increased availability. One such proposed monitoring system utilises the system fault trees to develop textual filters implemented within a Data Stream Management System (DSMS) to provide this information to the model which can then update its availability prediction for the system and provide decision support by suggesting an appropriate maintenance response. How such a system would be integrated in the model, both in the product development and product operation phases are explained in this paper.
The paper is organised as follows: Section 2 presents the research approach, Section 3 presents suggested components needed to enable simulation of industrial system availability, Section 4 presents the proposed model and Section 5 includes discussions and conclusions.
2 Research approach
This research has been carried out in collaboration with the Swedish company Hägglunds Drives AB owned by the Bosch Rexroth group. Hägglunds Drives AB is a multinational industrial corporation that sells hydraulic drive systems with a high level of availability.
144 M. Löfstrand et al.
2.1 Industrial partner needs
An understanding of industrial partner needs is achieved by applying Hägglunds Drives AB’s knowledge and experience to identify critical hardware-related parameters that must be monitored in order to increase system availability. The needs of Hägglunds Drives AB related to this work have been identified as:
Increased understanding of system availability and associated costs.
DSMS monitoring is needed when running systems closer to peak operational efficiency, which increases system pressure and wear.
Decision Support System (DSS) (whereby it should be possible to simulate system fleet availability, incorporating hardware operational status by use of DSMS, to provide decision support).
Improving the possibility of providing customers with integrated product service offerings or FPs.
2.2 Data collection and analysis
By interpreting industrial partner needs and using the definition of availability by Andrews and Moss (2002), the necessary data to collect were identified. Subsequently, data regarding previous failures and failure rates were collected via:
Archival reports such as: lists of failures, previously monitored operation field data and system data (manuals, CAD models, calculations and technical specifications (Yin, 2006).
Elicitation of knowledge and experience by semi-structured interviews (questionnaire, iteration, complementary questionnaire and sequential analyses).
Also, literature and state of practice review were performed. The reliability of the research was increased by using multiple data sources (see above) and the validity of the result was increased by triangulation.
2.2.1 Hardware data collection and analysis Semi-structured interviews (Kvale and Brinkmann, 2006) regarding HW-related issues were carried out with nine professionals at the industrial partner company. Furthermore, four semi-structured interviews were held with four professionals representing a customer of the industrial partner company. In addition, two workshops, comprising one day and three days, were held with 15 people and seven people from the industrial partner company, respectively. The interviews lasted for approximately one hour and were documented through case notes and recordings. Representing the industrial partner company were:
Site manager
Design Manager
Development controls Manager
Design engineer and PhD student
Two service technicians

A model for predicting and monitoring 145
Two service engineers Aftermarket business development manager
Representing the customer company were: Research coordinator Maintenance technician Two maintenance engineers
Material describing the background of the case and a questionnaire were sent to the interviewees to prepare them prior to the interview (Kvale and Brinkmann, 2006). The questionnaire covered common system and component failures, root failure causes, failure rates and failure criticality. The collected data were categorised and analysed using sequential analysis (Miles and Huberman, 1994). After the HW-related data collection, the authors compiled a summary of the collected material. Case analysis meetings (Miles and Huberman, 1994) were held with the research team to discuss the summarised results and to refine the focus and questions for a second round of interviews. Based on categorising and analysis of the collected data, fault trees were developed with the aid of the engineering knowledge and experience of researchers and personnel at Hägglunds Drives AB. Textual filters for describing relations between various HW parameters were created and expressed as pseudo code. While the textual filters are important, they are not further described in this paper, since they are complex and specific to the industrial system hardware. In addition, various hydraulic schematics including mounting points for sensors were developed to aid researchers as well as industrial partner understanding.
2.2.2 Support system data collection and analysis Semi-structured interviews regarding SS-related issues were carried out with five employees at the industrial partner company. Furthermore, four semi-structured interviews were held with employees representing a customer of the industrial partner company. In addition, two workshops comprising one day and three days were held with 15 and seven professionals from the industrial partner company, respectively. Interviews lasted approximately one hour and were documented through case notes, recordings and by sketching up the maintenance procedures on location. Representing the industrial partner company were: Site manager Two service technicians Service engineer After-market business development manager
Representing the customer company were: Research coordinator Maintenance technician Two maintenance engineers
Material describing the background of the case and a questionnaire were sent to the interviewees to prepare them prior to the actual interviews (Kvale and Brinkmann, 2006). The aim of the questionnaire and the interviews was to determine what critical failures
146 M. Löfstrand et al.
might occur in the system. Also, the relevant failure rates and related activities required to remedy the failures were included. Finally, the necessary sequences and associated activity times were of interest, since this information was deemed essential for modelling the support system. The collected data were categorised and analysed using sequential analysis (Miles and Huberman, 1994). After the SS-related data collection, the authors compiled a summary of the collected material. Case analysis meetings (Miles and Huberman, 1994) were held with the research team to discuss the summarised results and to refine the focus and questions for a second round of interviews.
Based on categorising and analysis of the collected data, block diagrams representing maintenance procedures were developed with the aid of the engineering knowledge and experience of researchers and personnel at Hägglunds Drives AB.
3 Enabling availability simulations
The method for identifying the components needed for predicting industrial system availability is based on four cornerstones.
The definition of availability (Andrews and Moss, 2002).
The current research in the authors’ research group (Löfstrand et al., 2005, Alzghoul and Löfstrand, 2011; Alzghoul et al., 2011; Kyösti et al., 2011; Löfstrand et al., 2011).
Skills of the author’s national and international research partners.
Current literature on functional product design and PSS design. The four cornerstones listed above led to the identification of the following components to be included in the framework presented in this paper: Simulation-Driven Design (SDD), hardware component and system modelling through Fault Tree Analysis (FTA) and Failure Mode Effect (Criticality) Analysis (FME(C)A). Finally, support system modelling (Kyösti et al., 2011), comprising modelling maintenance procedures and sensor systems, the latter to enable data stream mining (Golab and Özsu, 2003; Golab and Özsu, 2010) are to be included as components of the suggested simulation framework.
3.1 Hardware component and system modelling
Models of HW can be developed in various different ways such as CAD models, FEM models and CFD models. For this particular paper, HW was modelled using fault trees, since failure analysis methods such as FME(C)A and FTA are commonly used in reliability and risk assessment (Andrews and Moss, 2002). Using FME(C)A the component failure modes can be explored, whilst using FTA the system failure modes can be explored. Human behaviour in the form of errors can be included in component failure rates according to Vesely et al. (2002). FTA is widely used in different industries (Ericson, 1999).
3.1.1 Fault tree analysis FTA is a tool for reliability analysis (NUREG-0492, 1981; Andrews and Moss, 2002; Smith, 2005) and fault diagnostics (Hu, 2003). FTA is a logical way of describing relations between an unwanted event in the system and the causes of this event (NUREG-0492, 1981). FTA has been employed in different methods for diagnosing failures

A model for predicting and monitoring 147
(thereby increasing availability) in manufacturing and industrial systems such as those described by Hu (2003) and Geymayr and Ebecken (1996). FTA has been identified by NASA (Vesely et al., 2002) as a suitable tool to provide information for supporting decision-making. Vesely et al. (2002) state that the use of FTA as a proactive tool to prevent the top event (failure) and for evaluating upgrades to the system has been shown to be most beneficial. Discrete event simulation is used to determine component failure times and, through the fault tree logic, the corresponding failure times of the product sub-systems.
3.1.2 FTA as a basis for hardware system monitoring In this research, FTA is used to identify needed parameters for monitoring Hägglunds Drives AB’s industrial system. The FTA is based on employees’ industrial knowledge, experience and previous FME(C)A (MIL-STD-1629a, 1980) performed at Hägglunds Drives AB. FME(C)A provides an initial evaluation tool and aids decisions as to whether to construct fault trees and what to detail. To develop the textual filters for monitoring purpose, the FTs’ basic events are analysed to determine what parameters (temperatures, pressures, angular speed, vibration, etc.) in the system influence the failure rate of the basic events and should therefore be monitored. For each basic event in the tree (representing component failure) unconditional (baseline), failure rates are estimated based on previous similar system data, industrial knowledge and experience. An example of a sub-tree from an FTA is presented in Figure 1. (Basic Event 2 and Basic Event … of Figure 1 are intended to signify that other possible events and basic events may also be possible.)
Figure 1 Sub-tree of a water-oil cooler
Event 2
Water – oil cooler, loss of cooling effect
Watervalvefails to open
1
Temperature sensor
malfunction
Fuse malfunctionDisrupted coil
Event ...
Basic event 2
Basic event...
Basic event 2
Basic event…
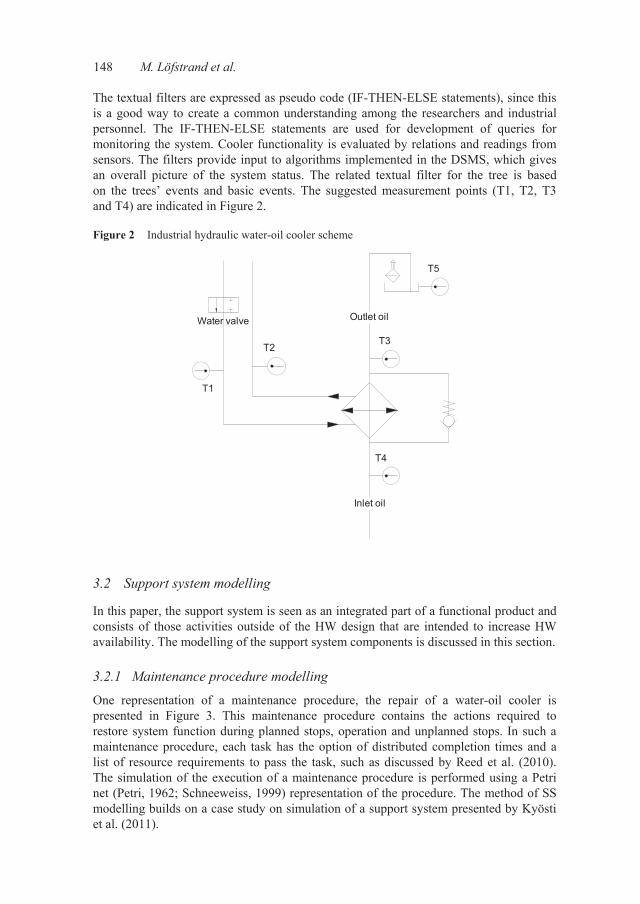
148 M. Löfstrand et al.
The textual filters are expressed as pseudo code (IF-THEN-ELSE statements), since this is a good way to create a common understanding among the researchers and industrial personnel. The IF-THEN-ELSE statements are used for development of queries for monitoring the system. Cooler functionality is evaluated by relations and readings from sensors. The filters provide input to algorithms implemented in the DSMS, which gives an overall picture of the system status. The related textual filter for the tree is based on the trees’ events and basic events. The suggested measurement points (T1, T2, T3 and T4) are indicated in Figure 2.
Figure 2 Industrial hydraulic water-oil cooler scheme
T1
T2T3
T4
Outlet oil
Inlet oil
Water valve
T5
3.2 Support system modelling
In this paper, the support system is seen as an integrated part of a functional product and consists of those activities outside of the HW design that are intended to increase HW availability. The modelling of the support system components is discussed in this section.
3.2.1 Maintenance procedure modelling
One representation of a maintenance procedure, the repair of a water-oil cooler is presented in Figure 3. This maintenance procedure contains the actions required to restore system function during planned stops, operation and unplanned stops. In such a maintenance procedure, each task has the option of distributed completion times and a list of resource requirements to pass the task, such as discussed by Reed et al. (2010). The simulation of the execution of a maintenance procedure is performed using a Petri net (Petri, 1962; Schneeweiss, 1999) representation of the procedure. The method of SS modelling builds on a case study on simulation of a support system presented by Kyösti et al. (2011).

A model for predicting and monitoring 149
Figure 3 Maintenance procedure for repair of water-oil cooler (see online version for colours)
Start /End
2. Travel
12. Remove interlockings and contact operation
control
No leakage
7. Move over adapters , connect
and fasten adapters , put in new cooler , connect hoses and
pipes
6. Remove old cooler
5. Carry in new cooler and tools
1. Pack Bus
13. Travel
8. Turn on water and start unit , check that
there are no leaks
Personnel requirement : 2 technicans
4. Report to guard,
disconnect and lock cooler
3. Shut down
function
Leakage
11. Carry old cooler and tools to car
10. Clean up
9. Repair, tighten
According to Alonso-Rasgado et al. (2004), an SS is suggested to include all actions required to ensure that a certain function is provided to the customer. This total support system includes:
Actions on hardware (remanufacture, spares provision and on-site work).
Decision-making and forecasting.
Operations planning and data collection storage.
Intellectual property (education of users and suppliers).
Since the objective of this paper is to be able to calculate and predict availability (Andrews and Moss, 2002), only actions on hardware and resource databases are included in the support system. Decision-making, forecasting and data collection storage (sensor readings/trend analysis) are included in the monitoring part of this system. This design enables the SS to be modelled with structures, such as: parallel tasks, failed tasks resulting in rework, concurrent usage of resources, topological/sequential changes, number and qualification of personnel, failure rate and degradation models for HW. Human errors are included in the model by distributed task completion times and through variable task sequences (e.g. additional corrective tasks if an error occurs). Differences between the herein proposed model and Alonso-Rasgado’s et al. (2004) are further discussed in Section 5.
3.2.2 Data stream management system and sensor modelling
The DSMS monitoring system performs queries on the data streams produced by the system sensors to detect conditions that indicate increased probabilities of a component failure. Based on previous research (Alzghoul and Löfstrand, 2011; Alzghoul et al.,
150 M. Löfstrand et al.
2011), developing queries for data stream mining for monitoring equipment can be a challenge. This is because the parameters’ relations as well as their cause and effect relations are often complex. Machine learning can therefore be a useful means for training the DSMS queries to determine which conditions represent the possibility of component failure. This training can take the form of unsupervised learning, where the DSMS looks for conditions that are different from the normal operating conditions or supervised where it is given feedback on the conditions that represent failures. In this way, the DSMS is able to predict failures before they occur and identify potentially harmful system trends. For example, queries performed by the DSMS on a data stream from an oil particle counting sensor on a pump lubrication line might detect an increased rate of particle growth in the oil, indicating imminent mechanical pump failure. Since the DSMS is a software tool, it can be incorporated into the functional product model explicitly without the need for development of a separate model.
The sensor systems within a functional product provide the input data streams for the DSMS and must therefore be modelled within the functional product model. Each sensor measures some specific variable within the HW environment, e.g. pump cooling oil temperature or bearing vibration level. These environmental variables will depend on HW states and product loading. The sensors map the states of these variables to a reading that is either binary or analogue within a given range. Sensor measurements may also contain noise, resulting in a difference between the measured and actual state of the variable, and may also fail resulting in an erroneous output. The modelling of the sensor system within a functional product will therefore be composed of two parts:
A model of the environmental variables that are indicators of HW reliability. These will be functions of the HW system states and product loading.
A model of the sensors which map these environmental variable states into the data streams that provides an input to the DSMS.
4 A model for predicting and monitoring industrial system availability
The model proposed builds on research concerning SDD by Lockwood (2009) and Jackson (2006). The HW structure modelling is based on Vesely et al. (2002), while the SS modelling is exemplified by Reed et al. (2010) and Alonso-Rasgado et al. (2004). Additionally, Löfstrand et al. (2011) and Karlsson et al. (2011) are part of the verification of the model proposed in this paper. DSM, as discussed by Alzghoul and Löfstrand (2011) and Alzghoul et al. (2011), also impacts on the model presented in this paper. In addition, further ongoing work includes abstractions and process level interactions on a less technical level, as exemplified by Lindström et al. (2012a, 2012b). Thus, the research and results presented in this paper are partly verified.
The model components discussed in the previous section must be integrated to form a functional product model for predicting system availability. The integrated HW, SS and monitoring systems are shown in Figure 4. The model components are implemented in the C# programming language (ECMA, 2006) and Super Computer Stream Queries (SCSQ) (Zeitler and Risch, 2010), as shown. Also, a graphical interface could be created for end users. This interface should ideally enable users to modify the architecture of the product design within the model and change both values of input parameters and desired output parameters. The output offers valuable data for evaluation of the industrial system

A model for predicting and monitoring 151
availability and resource utilisation and can be used for decision support. Figure 4 also shows some key outputs of the model components, namely The Mean Time to Failure (MTTF), Mean Time to Repair (MTTR) and predicted component failures.
Figure 4 Proposed model for simulating industrial system availability (see online version for colours)
The model can be used in two contexts, namely:
During the development of the product (SDD).
During the operation of the product (DSS).
During product development, the hardware, service support system and monitoring system do not yet to exist. The design is developed through SDD (e.g. identification of parameters, parameter relationships, cause and effect relationships in the industrial system, training DSMS algorithms, etc.), i.e. modelling and simulating the product at each design iteration to obtain a product design with the desired performance characteristics, e.g. expected availability. Figure 5 shows the components of the functional product model in more detail, along with the data sharing between them during the product development phase. The numbered outputs in the diagram correspond to those in Figure 4. As shown, the data stream generator is fed data from the hardware model, since the output of the sensors is in part a function of the hardware status. The DSMS then feeds its output data, the failure signals to the SS model. This allows the development of predictive
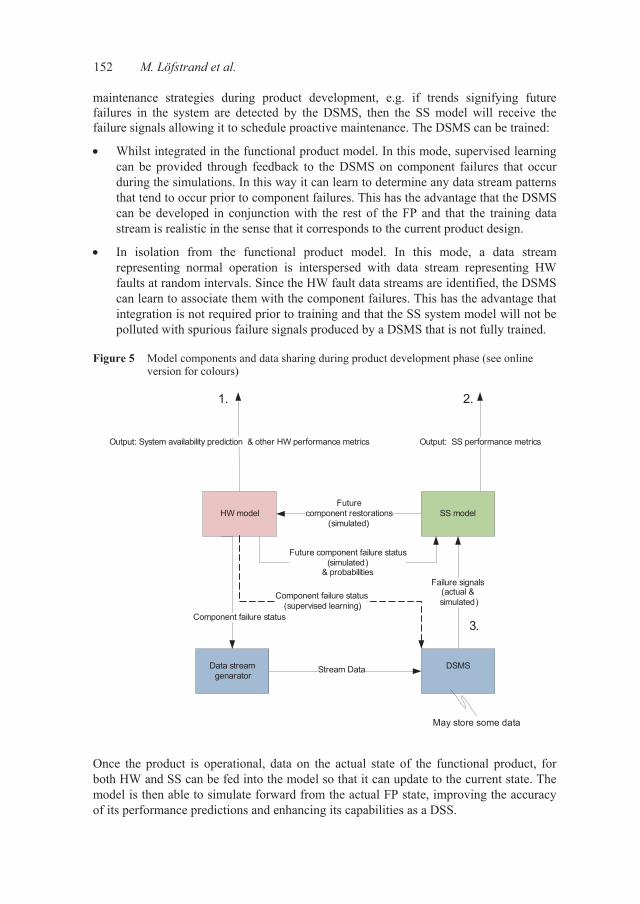
152 M. Löfstrand et al.
maintenance strategies during product development, e.g. if trends signifying future failures in the system are detected by the DSMS, then the SS model will receive the failure signals allowing it to schedule proactive maintenance. The DSMS can be trained:
Whilst integrated in the functional product model. In this mode, supervised learning can be provided through feedback to the DSMS on component failures that occur during the simulations. In this way it can learn to determine any data stream patterns that tend to occur prior to component failures. This has the advantage that the DSMS can be developed in conjunction with the rest of the FP and that the training data stream is realistic in the sense that it corresponds to the current product design.
In isolation from the functional product model. In this mode, a data stream representing normal operation is interspersed with data stream representing HW faults at random intervals. Since the HW fault data streams are identified, the DSMS can learn to associate them with the component failures. This has the advantage that integration is not required prior to training and that the SS system model will not be polluted with spurious failure signals produced by a DSMS that is not fully trained.
Figure 5 Model components and data sharing during product development phase (see online version for colours)
HW model SS model
DSMSStream Data
Future component failure status(simulated)
& probabilities
Future component restorations
(simulated)
Output: System availability prediction & other HW performance metrics
Component failure status
Output: SS performance metrics
Data stream genarator
May store some data
1. 2.
3.
Failure signals(actual &simulated)
Component failure status(supervised learning)
Once the product is operational, data on the actual state of the functional product, for both HW and SS can be fed into the model so that it can update to the current state. The model is then able to simulate forward from the actual FP state, improving the accuracy of its performance predictions and enhancing its capabilities as a DSS.
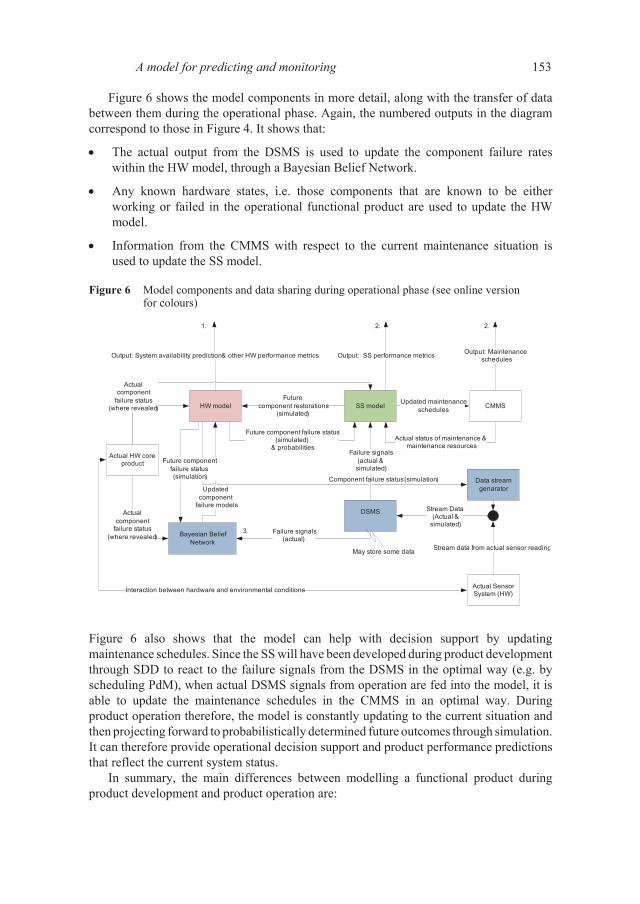
A model for predicting and monitoring 153
Figure 6 shows the model components in more detail, along with the transfer of data between them during the operational phase. Again, the numbered outputs in the diagram correspond to those in Figure 4. It shows that:
The actual output from the DSMS is used to update the component failure rates within the HW model, through a Bayesian Belief Network.
Any known hardware states, i.e. those components that are known to be either working or failed in the operational functional product are used to update the HW model.
Information from the CMMS with respect to the current maintenance situation is used to update the SS model.
Figure 6 Model components and data sharing during operational phase (see online version for colours)
Actualcomponent
failure status(where revealed) HW model SS model CMMS
DSMS
Actual HW core product
Stream Data(Actual &
simulated)Bayesian Belief
Network
Failure signals(actual)
Updated component
failure models
Updated maintenanceschedules
Actual component
failure status(where revealed)
Actual status of maintenance &maintenance resources
Interaction between hardware and environmental conditions
Future component failure status(simulated)
& probabilities
Future component restorations
(simulated)
Output: System availability prediction & other HW performance metrics
Stream data from actual sensor reading
Component failure status (simulation)
Output: SS performance metrics
Future componentfailure status(simulation)
Output: Maintenanceschedules
Data stream genarator
May store some data
1. 2. 2.
3.
Actual Sensor System (HW)
Failure signals(actual &simulated)
Figure 6 also shows that the model can help with decision support by updating maintenance schedules. Since the SS will have been developed during product development through SDD to react to the failure signals from the DSMS in the optimal way (e.g. by scheduling PdM), when actual DSMS signals from operation are fed into the model, it is able to update the maintenance schedules in the CMMS in an optimal way. During product operation therefore, the model is constantly updating to the current situation and then projecting forward to probabilistically determined future outcomes through simulation. It can therefore provide operational decision support and product performance predictions that reflect the current system status.
In summary, the main differences between modelling a functional product during product development and product operation are:

154 M. Löfstrand et al.
The primary way in which the model is used – during product development for SDD and during product operation as DSS.
That during product operation phases, the monitoring system model will incorporate live data related to the product status (both HW and SS).
5 Discussion and conclusions
One approach to address FPD is taking existing industrial HW as a starting point. Using knowledge and procedures from existing HW development, while having good system knowledge, adequate system descriptions, updated system simulation and optimisation procedures are the good base for increasing system availability. These points may then be used for predicting (functional) product availability by simulation and optimisation. Optimisation in turn decreases the risk of selling a function if the correct target function can be developed. Another approach to decrease the risk of selling a function is to monitor systems in use. By having better monitoring of critical systems and system parameters, failures can be predicted and maintenance carried out before failure or damage occurs, thus increasing system availability. Both approaches benefit from having a starting point consisting of an industrial case and a tentatively agreed upon system description on which to base discussions.
In this paper, a discrete event simulation-based model for predicting system availability, including suggested modelling and simulation techniques is proposed. It has been partly verified, as exemplified by Löfstrand et al. (2011), Alzghoul et al. (2011), Kyösti et al. (2011), Reed et al. (2010) and Alzghoul and Löfstrand (2011). Furthermore, the purpose of this paper is to show an integrated approach to simulate functional product availability that incorporates a DSMS-based HW condition monitoring system. The authors consider that cost and revenue should also be included in a complete model. However, these are not within the scope of this paper.
In comparing the proposed model to other simulation-based approaches for functional product development, some points can be identified.
While Alonso-Rasgado et al. (2004) have developed a computational tool concept of a functional product with the intention of creating a graphical representation of all of its constituents; the model presented here aims to give an overview of how the HW, SS and monitoring system should be connected to enable simulation of system availability and resource utilisation.
Shostack (1982) and Alonso-Rasgado et al. (2004) have the goal of developing valid and detailed descriptions of industrial systems. This paper presents an approach based on a specific set of cornerstones and is useful when it comes to simulating and optimising industrial system availability including functional product availability.
The monitoring part has been given greater scope and is presented as a separate entity as compared to Shostack (1982) and Alonso-Rasgado et al. (2004).
The model developed and discussed in this paper does not aim to do the same as Shostack (1982) and Alonso-Rasgado et al. (2004), but to present an approach for increasing industrial system availability by enabling simulation-driven product design during product development and by providing operational decision support during its operation. The components of the model and the integration of those components have
A model for predicting and monitoring 155
been shown in detail. The description shows how the inclusion of the DSMS within the model enables it to be used to develop high-availability functional products that utilise predictive maintenance. It also shows how the output from the DSMS during operation can be fed into the model, along with other data on the FP’s current status, to allow it to update its predictions and provide updated maintenance schedules through the CMMS. Additionally, a description is given of how the DSMS can be trained to detect imminent HW failure when integrated with or isolated from the FP model.
Acknowledgements
This work was partly conducted at the Faste Laboratory, Luleå University of Technology, a VINNOVA (The Swedish Governmental Agency for Innovation Systems) Excellence Center. The authors also wish to acknowledge the SSPI project (Scalable search of product lifecycle information) funded by the Swedish Foundation for Strategic Research.
References Alonso-Rasgado, T. and Thompson, G. (2006) ‘A rapid design process for total care product
creation’, Journal of Engineering Design, Vol. 18, No. 1, pp.509–531. Alonso-Rasgado, T., Thompson, G. and Elfstrom, B-O. (2004) ‘The design of functional
(total care) products’, Journal of Engineering Design, Vol. 15, No. 6, pp.515–540. Alzghoul, A, and Löfstrand, M. (2011) ‘Increasing availability of industrial systems through data
stream mining’, Computers & Industrial Engineering, Vol. 60, No. 2, pp.195–205. Alzghoul, A., Löfstrand, M., Karlsson, L. and Karlberg, M. (2011), ‘Data stream mining for
increased functional product availability awareness’, Proceedings of the 3rd CIRP International Conference on Industrial Product Service Systems, 5–6 May, Technische Universität Braunschweig, Braunschweig, Germany, pp.237–241.
Andrews, J.D. and Moss, T.R. (2002) Reliability and Risk Assessment, Professional Engineering Publishing Limited, Bury St Edmunds.
Baines, T.S., Lightfoot, H.W., Evans, S., Neely, A., Greenough, R., Peppard, J., Roy, R., Shebeb, E., Braganza, A., Tiwari, A., Alcock, J.R., Anqus, J.P., Bastl, M., Cousens, A., Irving, P., Johnson, M., Kingston, J., Lockett, H., Martinez, V. and Michele, P. (2007) ‘State-of-the-art in product-service systems’, Journal of Engineering Manufacture, Vol. 221, No. 10, pp.1543–1552.
Brännström, O., Elfström, B-O. and Thompson, G. (2001) ‘Functional products create new demands on product development organisations’, Proceedings of International Conference on Engineering Design, 21–23 August, Glasgow, Scotland.
ECMA (2006) C# Language Specification-334, 4th ed., ECMA International. Ericson, C.A. (1999) ‘Fault tree analysis – a history’, Proceedings of the 17th International System
Safety Conference, 16–21 August, Orlando. Geymayr, J.A.B. and Ebecken, N.F.F. (1996) ‘Fault-tree analysis: a knowledge-engineering
approach’, IEEE Transactions on Reliability, Vol. 44, No. 1, pp.538–539. Golab, L. and Özsu, T. (2003) ‘Issues in stream data management’, SIGMOD Records, Vol. 32,
No. 2, pp.5–14. Golab, L. and Özsu, T. (2010) ‘Synthesis lectures on data management’, Data Stream
Management, Morgan & Claypool Publishers. Hu, W. (2003) ‘Operational fault diagnosis of manufacturing systems’, Journal of Materials
Processing Technology, Vol. 133, Nos. 1/2, pp.108–117.
156 M. Löfstrand et al.
Jackson, C. (2006) The Simulation-Driven Design Benchmark Report: Getting it Right the First Time. Available online at: http://www.aberdeen.com/summary/report/benchmark/
Karlsson, L., Löfstrand, M., Larsson, A., Larsson, T., Törlind, P., Elfström, B.O. and Isaksson, O. (2005) ‘Information driven collaborative engineering: enabling functional product innovation’, The 3rd International Workshop on Challenges in Collaborative Engineering, CCE05, 13–15, April, Sopron, Hungary.
Karlsson, L., Pahkamaa, A., Karlberg, M., Löfstrand, M., Goldak, J. and Pavasson, J. (2011) ‘Mechanics of materials and structures: a simulation-driven design approach’, Journal of Mechanics of Materials and Structures, Vol. 6, Nos. 1–4, pp.277–301.
Kvale, S. and Brinkmann, S. (2006) InterViews Learning the Craft of Qualitative Research Interviewing, 2nd ed., SAGE Publications Inc.
Kyösti, P., Reed, S., Löfstrand, M., Andrews, J., Karlsson, L. and Dunnett, S. (2011) ‘Simulation of industrial support systems in the context of functional products’, Proceedings of 19th AR2TS Advances in Risk, Reliability and Technology Symposium, 12–14 April, Stratford-upon-Avon, UK.
Lindström, J., Löfstrand, M. and Karlberg, M. and Karlsson, L. (2012a) ‘Functional product development: what information should be shared during the development process?’, International Journal of Product Development, Vol. 16, No. 2, pp.95–111.
Lindström, J., Löfstrand, M. and Karlberg, M. and Karlsson, L. (2012b) ‘A development process for functional products: hardware, software, service support system and management of operation’, International Journal of Product Development (in press).
Lockwood, A.J. (2009) Simulation-Driven Product Development: Will Form Finally Follow Function?, Spaceclaim Corporation.
Löfstrand, M., Andrews, J., Karlberg, M. and Karlsson, L. (2011) ‘Functional product system availability: simulation driven design and operation through coupled multi-objective optimization’, International Journal of Product Development, Vol. 13, No. 2, pp.119–131.
Löfstrand, M. and Isaksson, O. (2010) ‘A process modelling and simulation approach for business decision support in pre-conceptual product design’, International Journal of Product Development, Vol. 12, No. 2, pp.158–175.
Löfstrand, M., Larsson T. and Karlsson, L. (2005) ‘Demands on engineering design culture for implementing functional products’, International Conference on Engineering Design, 15–18 August, Melbourne, Australia.
Miles, M.B. and Huberman A.M (1994) Qualitative Data Analysis: An Expanded Sourcebook, SAGE publications, 2nd ed.
MIL-STD-1629a (1980) Procedures for Performing a Failure Modes, Effects and Criticality Analysis, US Department of Defence, Rome Laboratories.
Morelli, N. (2002) ‘The design of product/service systems from a designer’s perspective’, Proceedings of the Common Ground Design Research Society International Conference, 5–7 September, London, UK.
Morelli, N. (2006) ‘Developing new product service systems (PSS): methodologies and operational tools’, Journal of Cleaner Production, Vol. 14, pp.1495–1501.
NUREG-0492 (1981) Fault Tree Handbook, Nuclear Regulatory Commission, Washington. Petri, C.A. (1962) Kommunikation mit Automaten, PhD Thesis, Institut für instrumentelle
Mathematik, Bonn. Reed, S., Andrews, J., Dunnett, S., Karlberg, M., Karlsson, L. and Löfstrand, M. (2010) ‘Modelling
service support system reliability’, 1st IFAC Workshop on Advanced Maintenance Engineering, Services and Technology, IFAC, International Federation of Automatic Control.
Ross, D.T. (1988) ‘Foreword’ in Marca, D.A and McGowan, C.L. (Eds): SADT; Structured Analysis and Design Technique, McGraw-Hill, Inc., New York, NY, pp.xi–xiv.
Schneeweiss, W.G. (1999) Petri Nets for Reliability Modeling, LiLoLe-Verlag GmbH.

A model for predicting and monitoring 157
Shostack, G.L. (1982) ‘How to design a service’, European Journal of Marketing, Vol. 16, No. 1, pp.49–63.
Smith, D.J. (2005) Reliability Maintainability and Risk, 7th ed., Elsevier Butterworth-Heinemann. Tukker, A. and Tischner, U. (2005) New Business for Old Europe – Product-Service Development,
Competitiveness and Sustainability, Greenleaf Publishing, Sheffield, UK. Vesely, W., Stamatelatos, M., Dugan, J., Fragola, J., Minarick III, J. and Railsback J. (2002) Fault
tree Handbook with Aerospace Applications, Systems and Reliability Research, Office of Nuclear Regulatory Research, U.S. Nuclear Regulatory Commission, 1981.
Weber, C., Steinbach, M., Botta, C. and Deubel, T. (2004) ‘Modelling of product-service systems (PSS) based on the PDD approach’, Proceedings of International Design Conference – Design 2004, 18–21 May, Dubrovnik.
Yin, R.K. (2006) Case Study Research: Applied Social Research Methods Series, 3rd ed., Vol. 5, Sage Publications.
Zeitler, E. and Risch, T. (2010) ‘Scalable splitting of massive data streams’, Proceedings of 15th Conference on Database Systems for Advanced Application, DASFAA, 1–4 April, Tsukuba, Japan.

Paper B

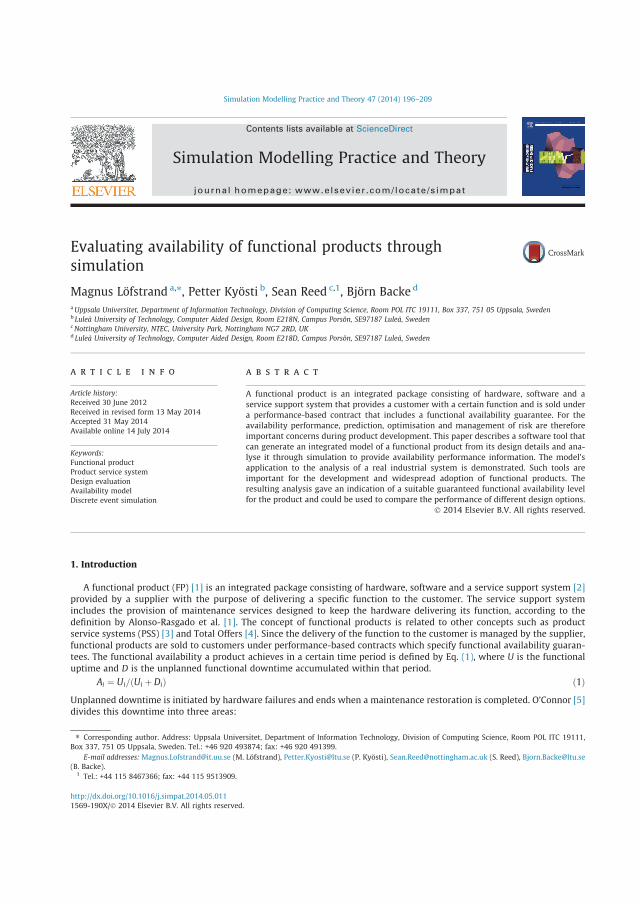
Evaluating availability of functional products throughsimulation
Magnus Löfstrand a,⇑, Petter Kyösti b, Sean Reed c,1, Björn Backe d
aUppsala Universitet, Department of Information Technology, Division of Computing Science, Room POL ITC 19111, Box 337, 751 05 Uppsala, Swedenb Luleå University of Technology, Computer Aided Design, Room E218N, Campus Porsön, SE97187 Luleå, SwedencNottingham University, NTEC, University Park, Nottingham NG7 2RD, UKd Luleå University of Technology, Computer Aided Design, Room E218D, Campus Porsön, SE97187 Luleå, Sweden
a r t i c l e i n f o
Article history:Received 30 June 2012Received in revised form 13 May 2014Accepted 31 May 2014Available online 14 July 2014
Keywords:Functional productProduct service systemDesign evaluationAvailability modelDiscrete event simulation
a b s t r a c t
A functional product is an integrated package consisting of hardware, software and aservice support system that provides a customer with a certain function and is sold undera performance-based contract that includes a functional availability guarantee. For theavailability performance, prediction, optimisation and management of risk are thereforeimportant concerns during product development. This paper describes a software tool thatcan generate an integrated model of a functional product from its design details and ana-lyse it through simulation to provide availability performance information. The model’sapplication to the analysis of a real industrial system is demonstrated. Such tools areimportant for the development and widespread adoption of functional products. Theresulting analysis gave an indication of a suitable guaranteed functional availability levelfor the product and could be used to compare the performance of different design options.
� 2014 Elsevier B.V. All rights reserved.
1. Introduction
A functional product (FP) [1] is an integrated package consisting of hardware, software and a service support system [2]provided by a supplier with the purpose of delivering a specific function to the customer. The service support systemincludes the provision of maintenance services designed to keep the hardware delivering its function, according to thedefinition by Alonso-Rasgado et al. [1]. The concept of functional products is related to other concepts such as productservice systems (PSS) [3] and Total Offers [4]. Since the delivery of the function to the customer is managed by the supplier,functional products are sold to customers under performance-based contracts which specify functional availability guaran-tees. The functional availability a product achieves in a certain time period is defined by Eq. (1), where U is the functionaluptime and D is the unplanned functional downtime accumulated within that period.
Ai ¼ Ui=ðUi þ DiÞ ð1ÞUnplanned downtime is initiated by hardware failures and ends when a maintenance restoration is completed. O’Connor [5]divides this downtime into three areas:
http://dx.doi.org/10.1016/j.simpat.2014.05.0111569-190X/� 2014 Elsevier B.V. All rights reserved.
⇑ Corresponding author. Address: Uppsala Universitet, Department of Information Technology, Division of Computing Science, Room POL ITC 19111,Box 337, 751 05 Uppsala, Sweden. Tel.: +46 920 493874; fax: +46 920 491399.
E-mail addresses: [email protected] (M. Löfstrand), [email protected] (P. Kyösti), [email protected] (S. Reed), [email protected](B. Backe).
1 Tel.: +44 115 8467366; fax: +44 115 9513909.
Simulation Modelling Practice and Theory 47 (2014) 196–209
Contents lists available at ScienceDirect
Simulation Modelling Practice and Theory
journal homepage: www.elsevier .com/locate /s impat

1. Preparation time: finding the person for the job, travel, obtaining tools and test equipment, etc.2. Active maintenance time: actually doing the job.3. Logistics time: waiting for spare parts, tools and facilities once the job has been started.
In hardware sales, customers bear uncertainty in the availability of the required function which may be critical to theirbusiness, yet many factors influencing it, such as the hardware design, are beyond their control or domain experience. Incontrast, a functional product offers customers some certainty in the functional availability achievable whilst the provider,who is best placed to do so, manages its provision, allowing the customer to concentrate on the core competencies of theirbusiness. Compared to material contracts, functional product contracts also expose the provider to increased financial andreputational risk. If the functional product fails to achieve the availability level guaranteed in the contract, then the providerwill incur financial penalties and a potential loss of reputation that may impact future sales. Any functional product issusceptible to a certain level of uncertainty in the functional availability actually achieved during operation, due to the manyrandom processes involved, e.g. hardware failure and repair rates. The provider must therefore consider the risk of under-performance, in addition to expected performance, when analysing a functional product design. Supporting this viewpointis the fact that interviewees have expressed the desire to understand and minimise the risk of rare but high adverse conse-quence outcomes.
The prediction and optimisation of functional product availability performance is an important part of the product devel-opment process and requires the construction and analysis of an appropriate model of the product design. Current researchpublications suggest a range of models which might be adaptable to support optimisation of separate elements of a func-tional product. For example, Johansson and Jägstam [6] suggest simulation-based optimisation of maintenance planningto reduce downtime, Öner et al. [7] present an analytical approach to the optimisation of component reliability to minimisedowntime and costs, and Li and Thompson [8,9] developed a modelling approach that utilised simulation to analyse the per-formance of maintenance services in support services. In addition, more general methodologies have been implementedwithin commercial tools that are in widespread use within industry. Examples include OPUS 10 [10], from Systecon AB,for the optimisation of spare-parts inventories and Availability Workbench [11], from Isograph Ltd., for the simulation ofhardware availability. These commercial tools have a practical advantage in that they only require the user to provide adescription of the system to be modelled, from which the generation and analysis of a system model is automated to derivethe desired performance metrics. Whilst these models can be useful, due to the integrated nature of a functional product, theperformance of each element is dependent on the performance of the other elements. Therefore, accurate prediction andoptimisation of a functional product design requires an integrated model of both the hardware and service support system.To do this, a customised computer code could be developed or a general purpose simulation modelling tool (such as SIMUL8[12] from Simul8 corporation) used. However, this would require substantial programming and modelling expertise, exten-sive investment of time and money, and require the code or model to be updated each time the design was modified or a newdesign considered. Re-use of the model would also be limited when a new, different functional product was considered foranalysis. There is therefore a real practical need for the development of a tool that can predict and support the optimisationof the performance of a functional product by generating an integrated model from a description of its design details. This issupported by a state-of-the-art review of PSS research from Baines et al. [13] which concluded that tools for obtaining quan-tified predictions of PSS performance are lacking and that their development is essential for the widespread adoption of PSSwithin industry.
The idea for an integrated model for the prediction and optimisation of functional product performance was first envis-aged by Löfstrand et al. [14], who presented a simulation-based framework for modelling and optimising functional productsin terms of availability and support costs. The subsequent development of an implementation of this framework includes aPetri net and simulation-based model for maintenance support services [15] which builds upon the work of Li and Thompson[8], and an integrated model of hardware and service support systems which includes modelling of hardware condition mon-itoring through a data stream management system (DSMS) [16].
The main contribution of this paper is the implementation of a simulation-based software tool that has been developed to modeland predict the availability performance of a functional product2 from a description of its design details, together with the applicationof the tool to a real industrial system example. This has been used to apply the Partitioned Multi-objective Risk Method (PMRM) tomeasure the availability performance of a functional product, accounting for risk, for the first time. In other words, Löfstrandet al. [14] is the initially proposed model and this paper is a simulation implementation based on actual industrial data, a partof the researchers verification and validation strategy. The rest of this paper is organised as follows. Section 2 presents an exam-ple of a real-world industrial functional product. Section 3 introduces some risk-based availability metrics that can be used toevaluate functional product availability performance. Section 4 describes the modelling tool and the design details it requires asinput data in order to analyse a functional product. Section 5 discusses the collection of the design data for the industrial systemexample. Section 6 presents the results of the analysis of the industrial system example obtained through the software tool.Finally, Section 7 includes an analysis of these results and concludes the paper.
2 The hydraulic system consists of the elements of a functional product, namely hardware and support system, although not initially designed as a functionalproduct.
M. Löfstrand et al. / Simulation Modelling Practice and Theory 47 (2014) 196–209 197

2. Industrial system example
An industrial example of a functional product produced by Bosch Rexroth Mellansel AB (formerly Hägglunds Drives AB) isdescribed in this section.
2.1. Hardware
The system is a closed loop hydraulic drive system, shown in Fig. 1, which is comprised of an electric motor, three hydrau-lic pumps, a hydraulic motor, a control system (not shown), cooling system, a filter and a tank. It provides torque and speedas its function and features high start-up torque, seamless continuous speed change, compact size and low maintenancerequirements (e.g. no clutch or gearbox to maintain) amongst other advantages over alternative, non-hydraulic solutions.It is suitable for powering a conveyor belt for bulk material transportation, as shown, as well as numerous other applications.Certain parts of the system, such as the sensor system and control system, are not included in the figure.
2.2. Support system
To enable the hardware to deliver its function throughout the whole lifecycle, a support system is needed to prevent fail-ures and to keep the downtime to a minimum.
Whilst routine maintenance can be carried out by onsite staff, specialist technicians are required in the case of failure.These failures are extremely rare but, due to the critical nature of the function provided by the hardware and support system,timely repair is essential when failure does occur. Due to the low rate of failure for an individual product, it is uneconomicalfor technicians to be based at each plant at which hardware is installed. Instead, they are based at product support centreswhich support a large number of products at several different plants across a wider geographical area. Due to the centralisednature of the workforce, a task common in all the repair activities is the transport of technicians to the repair site. The factorsinfluencing the length of downtime after a failure are given in Table 1.
The above points are all the identified support system activities that must be taken into account when simulating theprocess of restoring the system function in the event of failure. In accordance with Kyösti et al. [15], maintenance procedurescan include queries which will affect the repair time, such as diagnostics to determine what repairs have to be conducted orverification tasks to ensure hardware functionality after restorative tasks are complete. The flowchart in Fig. 2 represents thesupport system response to a hardware functional failure.
2.3. Functional product contract
It is assumed that the hardware and support system are to be sold as a functional product under a contract that guaran-tees a minimum specified functional availability level (not including expected planned downtime, e.g. due to scheduledmaintenance interventions) in each consecutive one-year period of the contract.
3. Application of the Partitioned Multi-objective Risk Method (PMRM) to the evaluation of functional productavailability performance
The actual availability that a functional product of a certain design will attain is a random variable. Assuming that its dis-tribution can be estimated (which is addressed by the modelling tool introduced in Section 4), a problem for the functionalproduct provider is to decide upon a metric, or set of metrics, that can be derived from its distribution and used to judge andcompare the availability performance of different designs objectively and to determine an appropriate availability guarantee.
Fig. 1. A closed loop hydraulic drive system produced by Bosch Rexroth Mellansel AB.
198 M. Löfstrand et al. / Simulation Modelling Practice and Theory 47 (2014) 196–209

The use of expected values as a decision-making criterion in problems involving the possibility of rare adverse outcomesis often inadequate [17]. In the case of functional products, the expected availability is inadequate as a sole indicator offunctional product performance, since it may not sufficiently account for the impact of rare adverse events that result inavailability falling far short of the expected value. The expected value would not be significantly influenced by these events,owing to the low probability of their occurrence, but they may be highly damaging to the FP provider when they do occur. Itis these events that decision makers at FP providers are likely to be most concerned about, since they determine the risk ofthe FP offer, where risk is defined as a measure of the probability and severity of adverse effects. Certain product designchoices may increase the cost and have little effect on the expected availability yet strongly reduce the severity or probabilityof these adverse outcomes and therefore remain desirable.
An alternative is the Partitioned Multi-objective Risk Method (PMRM) from Haimes [17] which involves generating anumber of conditional expected value functions, termed ‘‘risk functions’’, that represent the expected value within certainavailability value ranges that correspond to either extreme or non-extreme outcomes. These are then combined with twoadditional metrics, the expected value and the cost, to produce a multi-objective optimisation problem. The availabilityvalues that define the boundaries of a partition are determined through a mapping from corresponding partition boundariesthat are chosen on the probability axis of the cumulative availability distribution function. The choice of probability axis par-tition points for the risk functions is a subjective decision that depends on the risk partitions of interest to the functionalproduct provider. Since the cumulative availability distribution function, F(a), is non-decreasing (but may not be strictlyincreasing), the generalised inverse distribution function shown in Eq. (2) is used to define the unique availability level,bi, corresponding to the ith partitioning point, ai, on the probability axis.
bi ¼ F�1ðaiÞ ¼ inffbi : PXðbiÞ P aig ð2ÞRisk functions can then be defined as the conditional expectation of availability within partitions of the distribution that aredefined by these partition points. For example, consider the lower tail of an example cumulative availability distributionfunction that is plotted in Fig. 3.
Here, two partition points have been chosen, b1 and b2, corresponding to exceedance probabilities a1 and a2, from whichthe following risk functions might be defined (note that Haimes [17] reserves f1 to represent a cost function), where X is therandom variable representing availability:
Table 1Factors influencing length of downtime.
Downtime component Influencing factors Depends on
Preparation time Availability of technicians Completion time distribution for other jobs (includes time travellingback from job)Arrival rate of other jobsNumber of engineers at support station
Time travelling to installation site Travel time distribution
Active time Maintenance procedure completion time Task completion time distributionsTask sequencing constraints
Logistics Time obtaining maintenance resources Availability of maintenance resourcesDelay in obtaining maintenance resources that are required butcurrently unavailable
Start/End
Travel to site
Repair
Travel back
Verify function
Acquire resources
Spare part storage, personnel pool
Maintenance procedure
Delay
Post-Repair
activities
Fig. 2. Support system response to failures.
M. Löfstrand et al. / Simulation Modelling Practice and Theory 47 (2014) 196–209 199

f2 ¼ E½XjX 6 b1�f3 ¼ E½Xjb1 < X 6 b2�f4 ¼ E½XjX > b2�f5 ¼ E½X�
The availability a functional product achieves in an evaluation period may be correlated with previous evaluation periods.For example, if a failure results in the replacement of a part that has a high failure rate early in its lifetime (i.e. has a highinfant mortality probability), then the likelihood of it failing again in the near future is increased. This is an important con-sideration, since if availability in different evaluation periods is highly correlated, then it means that customers who expe-rience loss of availability in one period are more likely to experience it again in another, which could lead to possibledissatisfaction. The Pearson product-moment correlation coefficient (PPMCC), qX,Y, [18] defined in Eq. (3) gives a measureof the correlation between two random variables X and Y, where lX is the mean value of X and rX is its standard deviation.The value for this metric ranges from �1 to 1, where 0 indicates that there is no correlation, 1 indicates a perfect positivecorrelation and �1 indicates a perfect negative correlation.
qX;Y ¼ covðX;YÞrXrY
¼ EbðX � lXÞðX � lYÞcrXrY
ð3Þ
4. Functional product modelling and simulation
The authors have developed a tool for the modelling, simulation and analysis of functional product designs from areliability engineering viewpoint. The tool is capable of converting a description of a functional product in terms of its designdetails into a model, analysing the generated model through simulation and providing various predictions, such as thoserelated to functional availability, on its performance. This section gives an overview of this tool, including the functionalproduct design details which are required as inputs and the process it performs to generate a model from this description.Furthermore, this section explains the use of simulation to analyse the model and some of the methods used to produceperformance prediction metrics and output data from the model analysis.
4.1. Required functional product description details
The tool creates a model of a functional product from input data describing the functional product hardware and supportsystem.
4.1.1. HardwareA reliability model for each component type within the functional product hardware that is at the limit of resolution is
described by:
� A Petri net [19] representing the functional state space and the transitions between states in that space.� A distribution representing the delay for each of the transitions in the Petri net.� The state (in terms of the token distribution) that represents the ‘working’ condition.
Fig. 3. Partitioning of an example lower tail from a cumulative distribution function.
200 M. Löfstrand et al. / Simulation Modelling Practice and Theory 47 (2014) 196–209
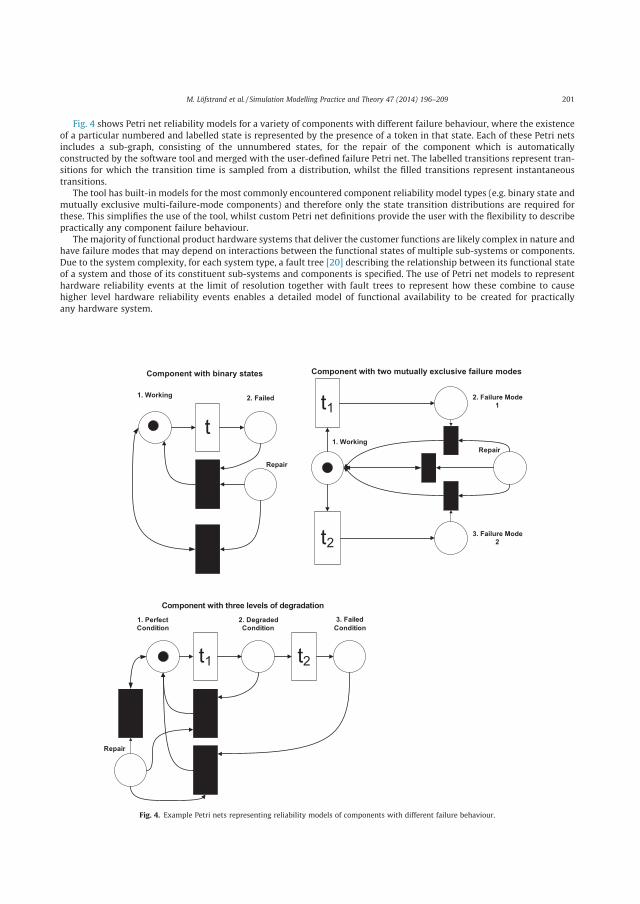
Fig. 4 shows Petri net reliability models for a variety of components with different failure behaviour, where the existenceof a particular numbered and labelled state is represented by the presence of a token in that state. Each of these Petri netsincludes a sub-graph, consisting of the unnumbered states, for the repair of the component which is automaticallyconstructed by the software tool and merged with the user-defined failure Petri net. The labelled transitions represent tran-sitions for which the transition time is sampled from a distribution, whilst the filled transitions represent instantaneoustransitions.
The tool has built-in models for the most commonly encountered component reliability model types (e.g. binary state andmutually exclusive multi-failure-mode components) and therefore only the state transition distributions are required forthese. This simplifies the use of the tool, whilst custom Petri net definitions provide the user with the flexibility to describepractically any component failure behaviour.
The majority of functional product hardware systems that deliver the customer functions are likely complex in nature andhave failure modes that may depend on interactions between the functional states of multiple sub-systems or components.Due to the system complexity, for each system type, a fault tree [20] describing the relationship between its functional stateof a system and those of its constituent sub-systems and components is specified. The use of Petri net models to representhardware reliability events at the limit of resolution together with fault trees to represent how these combine to causehigher level hardware reliability events enables a detailed model of functional availability to be created for practicallyany hardware system.
t
1. Working 2. Failed
Repair
t1
1. Perfect Condition
Repair
t2
2. Degraded Condition
3. Failed Condition
1. Working
t1
t2
Repair
3. Failure Mode 2
2. Failure Mode 1
Component with binary states
Component with three levels of degradation
Component with two mutually exclusive failure modes
Fig. 4. Example Petri nets representing reliability models of components with different failure behaviour.
M. Löfstrand et al. / Simulation Modelling Practice and Theory 47 (2014) 196–209 201

4.1.2. Service support systemEach maintenance task that is carried out as part of a procedure in the support of hardware is described by:
� The name of the task (that must be unique amongst maintenance tasks).� The completion time distribution for the task.� The maintenance resources consumed, utilised and produced.� The names of the possible, mutually-exclusive, outcomes for the task.� If the task outcomes are modelled as random: the probability associated with each outcome.� If the task outcomes depend on hardware states (e.g. inspection task): the predicate function of the hardware states thatevaluates to true, at the time of task completion, when the outcome occurs.
Each maintenance procedure is given a name (that must be unique amongst maintenance procedures) and is describedthrough an MP Graph that specifies the prerequisite constraints between the maintenance tasks within the process. AnMP Graph consists of a set of nodes (vertices), representing the maintenance tasks, and a set of edges that representthe precedence constraints. Each task node has an outgoing edge for each of its possible outcomes, where each is labelledwith the name of the corresponding outcome. Each task node also has one or more incoming edge sets, where each setconsists of one or more incoming edges. An incoming edge set for a task represents a set of prerequisite task outcomesthat trigger its initiation once they have all occurred. In addition, each MP Graph has two dummy task nodes, of duration0, that represent the start and end of the procedure, the former having no incoming edges and the latter having nooutgoing edges.
An example of an MP Graph is shown in Fig. 5. In this maintenance procedure, task 1 is performed first, followed by task 2if completed successfully (with a probability of 0.8) or by task 3 if it fails (with a probability of 0.2). On completion of task 2or task 3, an inspection occurs and the procedure ends if component A is not failed, otherwise task 4 is initiated and theprocedure ends on its completion.
The maintenance strategy for the functional product hardware is described through a set of policies. Each policy consistsof:
� A maintenance procedure.� A component or group of components (e.g. from a system or subsystem) that are restored to the ‘as-new’ condition oncompletion of that procedure.
� A trigger condition that defines when the maintenance procedure is initiated. The trigger condition can be set to respondto a component, subsystem or system entering a certain state (e.g. corrective maintenance initiated when an item fails), acertain time point or item age being reached (e.g. scheduled maintenance) or a positive inspection outcome (e.g.unrevealed item failures and condition-based maintenance).
The availability of resources is represented by selecting from one of several built-in logistics models and thenspecifying the parameters. The simplest of the logistics models assumes that the maintenance resource provisionremains fixed for the duration of the simulated time period and that there are no logistical delays in allocating availablemaintenance resources to maintenance tasks. The parameters which must be specified for the herein presented modelare as follows:
� The name of each maintenance resource.� The number of each maintenance resource initially available.
Task 1
Task 2
Task 3
Inspection: Component A
Failed?
SuccessP=0.8
FailsP=0.2
Start
End
No
Task 4 Yes
Fig. 5. Example of an MP graph.
202 M. Löfstrand et al. / Simulation Modelling Practice and Theory 47 (2014) 196–209
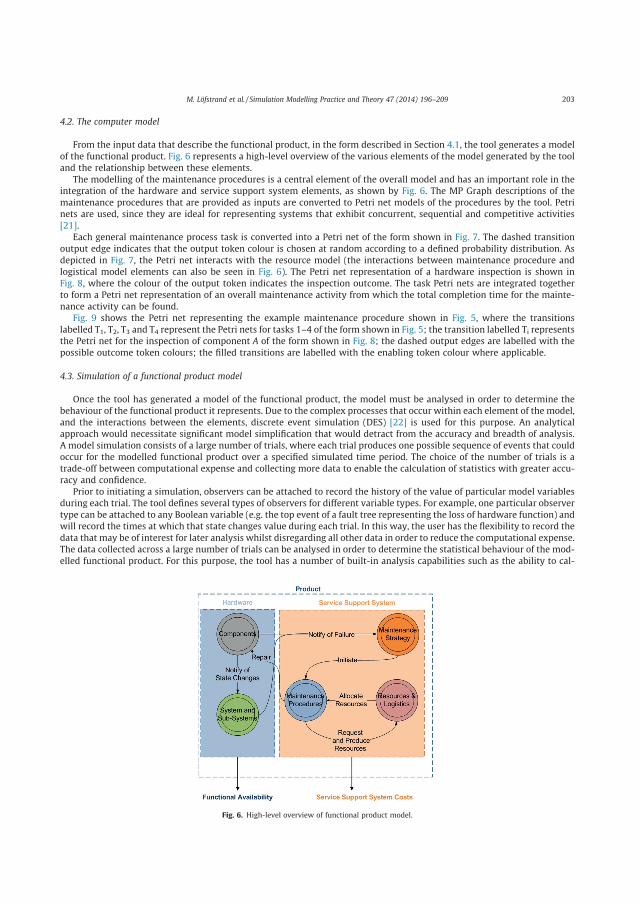
4.2. The computer model
From the input data that describe the functional product, in the form described in Section 4.1, the tool generates a modelof the functional product. Fig. 6 represents a high-level overview of the various elements of the model generated by the tooland the relationship between these elements.
The modelling of the maintenance procedures is a central element of the overall model and has an important role in theintegration of the hardware and service support system elements, as shown by Fig. 6. The MP Graph descriptions of themaintenance procedures that are provided as inputs are converted to Petri net models of the procedures by the tool. Petrinets are used, since they are ideal for representing systems that exhibit concurrent, sequential and competitive activities[21].
Each general maintenance process task is converted into a Petri net of the form shown in Fig. 7. The dashed transitionoutput edge indicates that the output token colour is chosen at random according to a defined probability distribution. Asdepicted in Fig. 7, the Petri net interacts with the resource model (the interactions between maintenance procedure andlogistical model elements can also be seen in Fig. 6). The Petri net representation of a hardware inspection is shown inFig. 8, where the colour of the output token indicates the inspection outcome. The task Petri nets are integrated togetherto form a Petri net representation of an overall maintenance activity from which the total completion time for the mainte-nance activity can be found.
Fig. 9 shows the Petri net representing the example maintenance procedure shown in Fig. 5, where the transitionslabelled T1, T2, T3 and T4 represent the Petri nets for tasks 1–4 of the form shown in Fig. 5; the transition labelled Ti representsthe Petri net for the inspection of component A of the form shown in Fig. 8; the dashed output edges are labelled with thepossible outcome token colours; the filled transitions are labelled with the enabling token colour where applicable.
4.3. Simulation of a functional product model
Once the tool has generated a model of the functional product, the model must be analysed in order to determine thebehaviour of the functional product it represents. Due to the complex processes that occur within each element of the model,and the interactions between the elements, discrete event simulation (DES) [22] is used for this purpose. An analyticalapproach would necessitate significant model simplification that would detract from the accuracy and breadth of analysis.A model simulation consists of a large number of trials, where each trial produces one possible sequence of events that couldoccur for the modelled functional product over a specified simulated time period. The choice of the number of trials is atrade-off between computational expense and collecting more data to enable the calculation of statistics with greater accu-racy and confidence.
Prior to initiating a simulation, observers can be attached to record the history of the value of particular model variablesduring each trial. The tool defines several types of observers for different variable types. For example, one particular observertype can be attached to any Boolean variable (e.g. the top event of a fault tree representing the loss of hardware function) andwill record the times at which that state changes value during each trial. In this way, the user has the flexibility to record thedata that may be of interest for later analysis whilst disregarding all other data in order to reduce the computational expense.The data collected across a large number of trials can be analysed in order to determine the statistical behaviour of the mod-elled functional product. For this purpose, the tool has a number of built-in analysis capabilities such as the ability to cal-
Fig. 6. High-level overview of functional product model.
M. Löfstrand et al. / Simulation Modelling Practice and Theory 47 (2014) 196–209 203

culate expected values, variance and mean times between variable state changes. Alternatively, the recorded data can beexported for external analysis. Additional data, e.g. maintenance resource costs, may also be combined with the datarecorded from the model simulations during this analysis stage.
4.4. Point estimates for metric values
From the functional state transition times that occur within each simulation trial, the availability in each evaluationperiod can be calculated. Thus, if a simulation consists of N trials, then N samples from the availability distribution in eachevaluation period are produced. Point estimates of each of the availability-based metrics given in Section 2 can be calculatedfrom these samples using numerical techniques that are discussed in this section.
To estimate the ith availability partitioning point, bi, corresponding to the ith probability partitioning point, ai, for aparticular evaluation period as defined by Eq. (2), the first step is to calculate the availability achieved in each simulationtrial using Eq. (1), using the uptime and downtime achieved in that period as the values for U and D, respectively. If the avail-ability values from N trials are then sorted into ascending order, bi can be estimated through the sample quantile estimator
Task Prerequisites
Complete
0Resources Allocated
Resource Allocation Requests
Resources Model
Resource Allocation Notifications
T
Resource
Output
Notifications
Task AwaitingResources
Task Outcome(Token colour represents outcome)
T = Task completion time
RequestResources
Returned Resources
Fig. 7. Petri net model of the performance of a maintenance task.
T
Inspection Outcome(Token colour represents outcome)
T = Inspection time
Task Prerequisites
Complete
Fig. 8. Petri net model of an inspection outcome.
T1
T2
T3Failure
Ti
T4
??
No
Yes
Start Maintenance
Procedure
Maintenance Procedure Complete
Success
Yes / NoSuccess / Failure
Fig. 9. Petri net model of the performance of the maintenance procedure shown in Fig. 5.
204 M. Löfstrand et al. / Simulation Modelling Practice and Theory 47 (2014) 196–209

[23] shown in Eq. (4), where xi is the availability achieved in the ith trial when sorted in ascending order and bhc is the largestinteger not greater than h. The expected availability within a partition can then be estimated as the mean availabilityamongst the trials where the availability was within the range defined by the partition.
bi ¼ xbhc þ ðh� bhcÞðxbhcþ1 � xbhcÞ where h ¼ N þ 13
� �ai þ 1
3ð4Þ
The PPMCC for measuring the correlation between two random variables X and Y, defined in Eq. (3), can be estimated fromthe sample Pearson correlation coefficient, rX,Y, given in Eq. (5) where N is the number of trials, X is the mean value for therandom variates of X from the N trials and Xi is the random variate for X from the ith trial.
rX;Y ¼PN
i¼1ðXi � XÞðYi � YÞffiffiffiffiffiffiffiffiffiffiffiffiffiffiffiffiffiffiffiffiffiffiffiffiffiffiffiffiffiffiPNi¼1ðXi � XÞ2
q ffiffiffiffiffiffiffiffiffiffiffiffiffiffiffiffiffiffiffiffiffiffiffiffiffiffiffiffiffiffiPNi¼1ðYi � YÞ2
q ð5Þ
4.4.1. Derivation of confidence intervalsConfidence intervals can be used to indicate the reliability of the point estimates. A brief description of the procedures
used for generating confidence intervals for these is discussed in this section.
4.4.1.1. Overall expected availability. Confidence intervals for the estimator of the overall expected availability are derivedfrom the assumption that it follows a Student’s t-distribution with N � 1 degrees of freedom [22].
4.4.1.2. Expected availability in partition. The theoretical distribution of the estimator of the expected value within a partition,as defined by the PMRM, is unknown; therefore, analytical derivation of the confidence interval is not possible. Instead, aconfidence interval with confidence coefficient a is derived through the following bootstrapping procedure:
1. L (e.g. chosen as N) samples are taken from the N trial availabilities with replacement.2. The risk function value is calculated from the sample generated in step 1.3. Steps 1 and 2 are repeated M (e.g. 5000) times to generate M estimates A�
1;A�2; . . . ;A
�M .
4. The M bootstrapped values from the previous steps are ordered to define the order statistics A�ð1Þ 6 A�
ð2Þ 6 . . . 6 A�ðMÞ.
5. The lower bound of the confidence interval is then chosen as A�OL
where OL ¼ a2 ðM þ 1Þ� �
.6. The upper bound of the confidence interval is then chosen as A�
OUwhere OU ¼ ðM þ 1Þ � OL.
4.4.1.3. Pearson correlation coefficient. Confidence intervals for the Pearson correlation coefficient are derived using the Fishertransformation [24].
5. Input data for industrial system example – hardware and support system descriptions
Section 4.1 outlined the input data describing a functional product that is required for it to be modelled and analysed bythe software tool. In this section, the methods used to obtain the data for the industrial system example that was introducedin Section 3 are described. Both a qualitative and a quantitative approach were used for the data collection. The majority ofthe data collection was performed qualitatively and the methods used consisted of:
� A questionnaire to prepare informants before interviews.� Semi structured interviews to elicit knowledge and experience [25].� Two separate workshops with 15 employees, a one-day workshop and one three-day workshop.� Collection of secondary industrial data such as previously monitored operation field data, system data (manuals and tech-nical specifications) [25].
Nine employees at the industrial partner company and four interviewees at one major customer were interviewedregarding the industrial system architecture. The interviews lasted about one hour each and were recorded and documentedby case notes. The interviewed employees from the industrial partner company were one site manager, two service techni-cians, two service engineers, one aftermarket business development manager, one design manager, one control developmentmanager and one design engineer who was also a PhD student. The employees of the customer company were one researchcoordinator, one maintenance technician, two maintenance engineers. The interviewees were chosen to ensure that nocauses of industrial system availability loss were unidentified. Before the interviews and workshops, background materialconcerning the case study and a questionnaire were sent to the interviewees. The questionnaire covered common systemand component failures, root failure causes, failure rates and failure criticality. The interviews and workshops aimed todetermine:
M. Löfstrand et al. / Simulation Modelling Practice and Theory 47 (2014) 196–209 205

� Which failures affect system availability?� At which rate have the components failed?� Which tasks are required to return the component to a working state?� In what sequence are tasks required to be performed?� What resources are needed?
Analyses of the initial interview results were used to iteratively improve the performance of the following interviews.Case Analysis meetings, as described by Miles and Huberman [25], were held by the research team to discuss and summarisethe results of the interviews. Continuous updating and complementary interviews were carried out throughout the workwith this paper. The collected data were validated by triangulation of statements from the interviewees. Thereafter, incollaboration with researchers and company representatives, the collected data were reduced [26] and formatted into theinput data format required by the software tool (see Section 4.1). Sections 5.1 and 5.2 describe some of the data collectedfor the hardware and service support system, respectively.
5.1. Hardware
The components in the system that were identified as critical to it functioning are as follows: the sensor, the electricmotor, the control systemmain board, the control system power supply, the hydraulic motor and the three hydraulic pumps.Each of these components, except for the hydraulic motor, was found to have a single failure mode and can therefore berepresented by the binary state component model shown in Fig. 4. The hydraulic motor has two mutually exclusive failuremodes, corresponding to failure with and without seizure of the shaft, and can therefore be represented by the multi failuremode component model shown in Fig. 4.
Based on discussions with employees and the analysis of a limited set of historical failure data, a distribution for eachcomponent failure transition for each component in the system has been derived. As is common in industrial systems, manyof the components in the system do not exhibit constant failure rates but failure rates which are higher initially (due toinfant mortality) and when the component reaches the end of its design life (due to wear out). However, failures due to wearout are negligible during the period studied in this paper, thus theWeibull distribution can be used for the component failuredistributions to enable the representation of infant mortality through a shape parameter that is less than one. The Weibullparameters used for the component working to failed transition distributions in the analysis in this paper are shown inTable 2. For reasons of confidentiality, these are dummy values and are not necessarily representative of the true values.
The combinations of component failures causing a loss of product functionality were investigated and are described bythe fault tree shown in Fig. 10. This shows that the system has redundancy only in the pumping sub-system and thereforerelies heavily on high component reliability to ensure high system reliability.
5.2. Support system
The input data describing the service support system from the industrial system example are given in this section accord-ing to the requirements that were outlined in Section 4.1.2. The maintenance strategy associates each component with arestorative maintenance procedure that is triggered upon its failure and is therefore entirely corrective. Fig. 11 shows themaintenance procedure for the restoration of a failed hydraulic motor. The completion time of the task ‘‘Mounting of torquearm’’ is represented by a triangle distribution with minimum, modal and maximum times of 30, 38 and 45 min, respectively.The data for the other tasks in the procedure are similarly defined.
A further part of the maintenance strategy for the real-world system includes the application of planned preventivemaintenance; however, this was not included directly in the modelling within this paper, as the focus was on analysingunexpected downtime caused by functional failure.
For the maintenance resources in this model, four repair technicians are available for performing the maintenanceprocedures, each of which requires the attendance of two repair technicians. The technicians must sometimes perform otherduties, including the support of other hardware systems and planned maintenance on the modelled system, and aretherefore not always available for restorative maintenance of the drive system. Other work arrives at a constant rate of0.1 jobs per hour and the length of time to perform these jobs, which each require two technicians, is represented by atriangle distribution with a minimum, mode and maximum of 2, 6 and 20 h, respectively. It is assumed that jobs are
Table 2Weibull parameters for component working to failed transition distributions.
Component type Failure mode Scale parameter Shape parameter
Sensor N/A 5.50E7 1.00Electric motor N/A 4.75E7 0.85Main board N/A 2.50E9 1.00Power supply N/A 7.00E7 0.90Hydraulic motor Seizure without shaft seizure 9.80E6 0.70
Seizure including shaft seizure 3.00E8 0.70Hydraulic pump N/A 1.80E7 0.70
206 M. Löfstrand et al. / Simulation Modelling Practice and Theory 47 (2014) 196–209

processed in the order in which they arrive and that a backlog of jobs can occur. Therefore, if maintenance of the drive sys-tem is required and the required technicians are unavailable, the job will be placed in the queue and its start delayed accord-ingly. The travel time from the support base to the customer site is represented by a normal distribution with a mean time of8 h and standard deviation of 1 h.
6. Analysis and results
The data from Section 5 describing the industrial system example functional product were used as input data to the soft-ware tool. The tool was used to generate a model of the functional product and analyse it over 10,000 simulation trials,where each trial consisted of a simulation time duration of 5 years. The functional state of the system was observed in eachtrial, such that the times at which functionality was lost and restored were recorded. The collected data were then processedusing the methods described in Section 4.4 and the results of the analysis are described in the remainder of this section.
6.1. Expected availability risk functions
The partition points on the probability axis for exceedance probabilities a1 and a2 were chosen as 0.5% and 1%, respec-tively, to generate the partition points on the availability axis b1 and b2 through Eq. (8). The risk functions f2 to f5, as measuresof expected availability in different partitions, were then calculated and follow the definitions given in Section 2.
Loss of torque(functional failure)
System Shut-Down (Technical)
Loss of Power to Electric Motor
Hydraulic Pressure not Converted to
Torque
Insufficient Hydraulic Pressure
Main Board Failure
Power Supply Failure
Loss of Torque to Pumps
Electric Motor Failure Motor Seizure
Pump Seizure
System Shut-Down (Safety)
Sensor Failure
Pump Seizure Pump Seizure
2/3
Fig. 10. Fault tree for hydraulic drive system showing top event of functional failure in terms of component failures.
Start/End
• Gather tools and clean up• Transportation back to HQ• Restore bus and do
paperwork
• Loading van• Travel to site• Report to control
room• Preparations
• Removal of motor• Removal of shaftcoupling and torque arm
• Mounting of motor• Mounting of torque arm• Prepare new motor
• Test run pump and check for leakage• Remove interlockings and report to operation control• Fill motor and tank with oil• Fasten shaft coupling and connect hoses
Waiting for overhead
craneNo
Inspection of shaft for seizure.
Seized?Yes
No
Removal of defect shaft
Isolate motor fromsystem, disconnecet hoses,
other connections. Flushing needed?
Yes
• Prepare flushing procedure• Mount extra filter• Flushing
Fig. 11. Maintenance procedure for restoration of a failed hydraulic motor.
M. Löfstrand et al. / Simulation Modelling Practice and Theory 47 (2014) 196–209 207
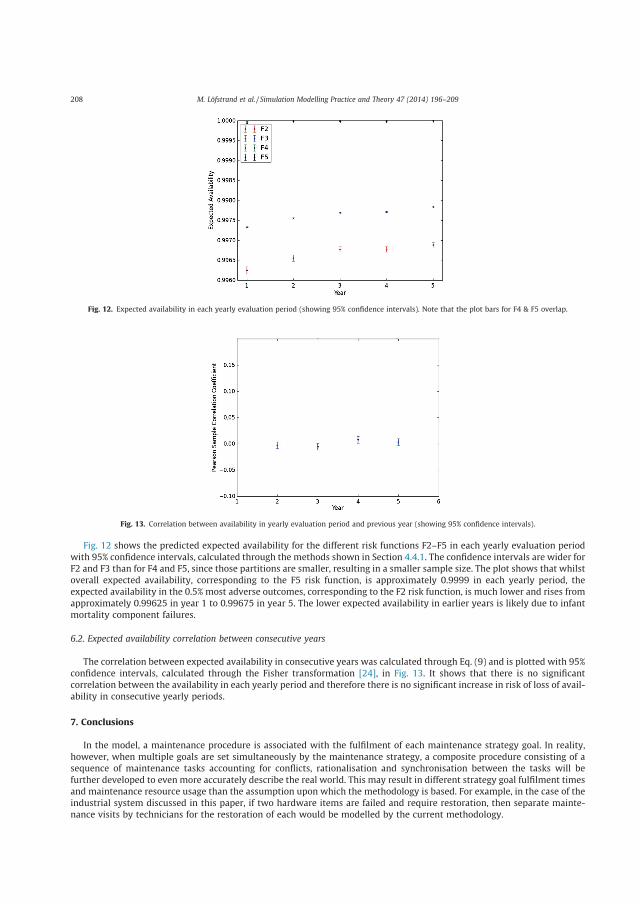
Fig. 12 shows the predicted expected availability for the different risk functions F2–F5 in each yearly evaluation periodwith 95% confidence intervals, calculated through the methods shown in Section 4.4.1. The confidence intervals are wider forF2 and F3 than for F4 and F5, since those partitions are smaller, resulting in a smaller sample size. The plot shows that whilstoverall expected availability, corresponding to the F5 risk function, is approximately 0.9999 in each yearly period, theexpected availability in the 0.5% most adverse outcomes, corresponding to the F2 risk function, is much lower and rises fromapproximately 0.99625 in year 1 to 0.99675 in year 5. The lower expected availability in earlier years is likely due to infantmortality component failures.
6.2. Expected availability correlation between consecutive years
The correlation between expected availability in consecutive years was calculated through Eq. (9) and is plotted with 95%confidence intervals, calculated through the Fisher transformation [24], in Fig. 13. It shows that there is no significantcorrelation between the availability in each yearly period and therefore there is no significant increase in risk of loss of avail-ability in consecutive yearly periods.
7. Conclusions
In the model, a maintenance procedure is associated with the fulfilment of each maintenance strategy goal. In reality,however, when multiple goals are set simultaneously by the maintenance strategy, a composite procedure consisting of asequence of maintenance tasks accounting for conflicts, rationalisation and synchronisation between the tasks will befurther developed to even more accurately describe the real world. This may result in different strategy goal fulfilment timesand maintenance resource usage than the assumption upon which the methodology is based. For example, in the case of theindustrial system discussed in this paper, if two hardware items are failed and require restoration, then separate mainte-nance visits by technicians for the restoration of each would be modelled by the current methodology.
Fig. 12. Expected availability in each yearly evaluation period (showing 95% confidence intervals). Note that the plot bars for F4 & F5 overlap.
Fig. 13. Correlation between availability in yearly evaluation period and previous year (showing 95% confidence intervals).
208 M. Löfstrand et al. / Simulation Modelling Practice and Theory 47 (2014) 196–209

Only the evaluation of functional availability performance was considered in this paper. Other metrics, in particular thecost of product development, manufacture and operation, are important in the evaluation of a particular product design. Theanalysis and consideration of these costs in design evaluation is partly supported by the model and is an area of further work.
Providers of functional products face the challenge of developing an integrated package consisting of hardware, softwareand a service support system to provide customers with the desired functionality at a guaranteed level of availability. Theability to predict the availability performance of such products during product development is crucial to understanding therisk involved, optimising the design and, ultimately, the widespread adoption of functional products. The risk-basedavailability metrics, based on the PMRM, were introduced as indicators of availability performance. These give not onlythe expected availability performance but also the availability performance when adverse outcomes occur. Existing methodsdeveloped by researchers for the analysis of availability do not offer the necessary integration of hardware and servicesupport system models to enable accurate prediction of these metrics for a functional product design. Additionally, the fea-sibility of availability performance modelling by industrial product developers is increased if such modelling and analysiscan be performed by a tool that is derived from the product design details. The major reasons for this are that custom modeldevelopment is time-consuming, requires significant expertise and is not suited to the iterative nature of product designdevelopment. Such tools are available commercially for the optimisation of hardware and logistical availability but arenot designed for the optimisation of functional products. A tool developed by the authors for this purpose was presented,including the functional product design details that it requires as inputs and the methods used to create and analyse anintegrated functional product model from them. The tool was applied to the analysis of an example industrial system, forwhich the collection and formatting of the design details as input data was shown along with the calculation of the avail-ability performance metrics. The resulting analysis gave an indication of a suitable guaranteed functional availability levelfor the product and could be used to compare the performance of different design options.
Acknowledgements
Dr. Magnus Löfstrand, Petter Kyösti and Björn Backe gratefully acknowledge the contribution from the Swedish Govern-mental Agency for Innovation Systems (VINNOVA) for funding The Faste Laboratory, Centre for Functional Product Innova-tion at Luleå University of Technology.
Furthermore, the authors also acknowledge The Swedish Foundation for Strategic Research for the SSPI project (ScalableSearch of Product Lifecycle Information). Finally, they acknowledge the EU FP7 project Smart Vortex for its support. All threeprojects have facilitated the herein reported research.
References
[1] T. Alonso-Rasgado, G. Thompson, B.-O. Elfström, The design of functional (total care) products, J. Eng. Des. 15 (6) (2004) 515–540.[2] O. Brännström, B.-O. Elfström, G. Thompson, Functional products create new demands on product development organisations. In: International
Conference on Engineering Design, 2001.[3] M. Goedkoop, C. van Haler, H. te Riele, P. Rommers, Product Service-Systems, ecological and economic basics, in: Dutch Ministries of Environment
(VROM) and Economic Affairs (EZ) [Report], 1999.[4] O. Brännström, Market offer Development: Industrial Experiences in a Business-to-Business Context, Luleå University of Technology, 2004.[5] P. O’Connor, Practical Reliability Engineering, Wiley Blackwell, 2002. 4th Revise.[6] E.C. Johansson, M. Jägstam, Maintenance planning using simulation-based optimization, in: Proceedings of the 2010 Spring Simulation
Multiconference, 2010.[7] K.B. Öner, G.P. Kiesmüller, G.J. van Houtum, Optimization of component reliability in the design phase of capital goods, Eur. J. Oper. Res. 205 (3) (2010)
615–624.[8] J.-P. Li, G. Thompson, The Use of Modelling and Simulation in the Design of a Service Support System for Aircraft Engines, Vivace Project [Report], 2006,
pp. 1–8.[9] J. Li, G. Thompson, Simulation-based Reliability Assessment of Services in the Context of Functional Products, Vivace Project [Report], 2007, pp. 1–20.[10] Systecon AB, Opus 10, 2012. <http://www.systecon.se/lang/en/> (accessed: 11.12.12).[11] Isograph Ltd, Availability Workbench, 2012. <http://www.isograph-software.com/awb-intro.htm> (accessed: 11.12.12).[12] SIMUL8 Corporation, SIMUL8, 2012. <http://www.simul8.com/> (accessed: 11.12.12).[13] T.S. Baines, H.W. Lightfoot, S. Evans, A. Neely, R. Greenough, J. Peppard, R. Roy, E. Shehab, A. Braganza, A. Tiwari, J.R. Alcock, J.P. Angus, M. Bastl, A.
Cousens, P. Irving, M. Johnson, J. Kingston, H. Lockett, V. Martinez, P. Michele, D. Tranfield, I.M. Walton, H. Wilson, State-of-the-art in product-servicesystems, Proc. Inst. Mech. Eng., Part B: J. Eng. Manuf. 221 (10) (2007) 1543–1552.
[14] M. Löfstrand, J. Andrews, M. Karlberg, L. Karlsson, Functional product system availability : simulation-driven design and operation through coupledmulti-objective optimisation, Int. J. Prod. Dev. 13 (2) (2011) 119–131.
[15] P. Kyösti, S. Reed, M. Löfstrand, J. Andrews, L. Karlsson, S. Dunnett, Simulation of industrial support systems in the context of functional products, in:19th Advances in Risk, Reliability and Technology Symposium, 2011, no. 2004.
[16] M. Löfstrand, B. Backe, P. Kyösti, J. Lindström, S. Reed, A model for predicting and monitoring industrial system availability, Int. J. Prod. Dev. (2012).http://inderscience.metapress.com/content/87503v12255132tn/.
[17] Y.Y. Haimes, Risk Modeling, Assessment, and Management, second ed., John Wiley & Sons, 2009.[18] R.J. Harris, A Primer of Multivariate Statistics, third ed., Psychology Press, 2001.[19] W.G. Schneeweiss, Petri Nets for Reliability Modeling, first ed., LiLoLe-Verlag, 1999.[20] J.D. Andrews, B. Moss, Reliability and Risk Assessment, second ed., Wiley Blackwell, 2002.[21] J. Wang, Timed Petri Nets: Theory and Application, first ed., Springer, 1998.[22] L. Leemis, S.K. Park, Discrete Event Simulation: A First Course, first ed., Prentice Hall, 2005, p. 624.[23] R.J. Hyndman, Y. Fan, Sample quantiles in statistical packages, Am. Stat. 50 (4) (1996) 361–365.[24] R.A. Johnson, D.W. Wichern, Applied Multivariate Statistical Analysis, sixth ed., Prentice Hall, 2007.[25] M. Miles, M.A. Huberman, Qualitative Data Analysis: An Expanded Sourcebook, second ed., Sage Publications, 1994.[26] R.K. Yin, Case Study Research: Design and Methods, fouth ed., Sage Publications, 2008.
M. Löfstrand et al. / Simulation Modelling Practice and Theory 47 (2014) 196–209 209

Paper C


Data stream forecasting for system fault prediction
Ahmad Alzghoul a,1, Magnus Löfstrand a,⇑, Björn Backe b,2
aDivision of Computer Aided Design, Luleå University of Technology, Room E218P, SE-97187 Luleå, SwedenbDivision of Computer Aided Design, Luleå University of Technology, Room E218D, SE-97187 Luleå, Sweden
a r t i c l e i n f o
Article history:Received 18 May 2011Received in revised form 15 December 2011Accepted 17 December 2011Available online 24 December 2011
Keywords:Data stream predictionAvailabilityData stream miningData stream management systemFault detection systemFault detection forecasting
a b s t r a c t
Competition among today’s industrial companies is very high. Therefore, system availability plays animportant role and is a critical point for most companies. Detecting failures at an early stage or foreseeingthem before they occur is crucial for machinery availability. Data analysis is the most common methodfor machine health condition monitoring. In this paper we propose a fault-detection system based ondata stream prediction, data stream mining, and data stream management system (DSMS). Companiesthat are able to predict and avoid the occurrence of failures have an advantage over their competitors.The literature has shown that data prediction can also reduce the consumption of communicationresources in distributed data stream processing.In this paper different data-stream-based linear regression prediction methods have been tested and
compared within a newly developed fault detection system. Based on the fault detection system, threeDSM algorithms outputs are compared to each other and to real data. The three applied and evaluateddata streammining algorithms were: Grid-based classifier, polygon-based method, and one-class supportvector machines (OCSVM).The results showed that the linear regression method generally achieved good performance in predict-
ing short-term data. (The best achieved performance was with a Mean Absolute Error (MAE) around 0.4,representing prediction accuracy of 87.5%). Not surprisingly, results showed that the classification accu-racy was reduced when using the predicted data. However, the fault-detection system was able to attainan acceptable performance of around 89% classification accuracy when using predicted data.
� 2011 Elsevier Ltd. All rights reserved.
1. Introduction
Understanding and improving the maintenance phase of thelifecycle of a product is crucial for achieving the goal of high reli-ability, maintainability and thus availability (Alzghoul & Lofstrand,2011). Analyzing the data, which are produced during the time ofoperation and maintenance phase of a product, is the most com-mon way to achieve the aims of maintenance tasks such as reduc-ing failures and their consequences.
Data analysis methods have passed through different stagesalong with the newly developed technologies and new require-ments. Statistical exploratory data analysis, machine learning algo-rithms, distributed and parallel data mining, and data streammining are examples of these stages (Gaber, Zaslavsky, &Krishnaswamy, 2005). Data stream mining, which can be definedas the extraction of patterns from continuous and rapidly arrivingstreams of data, has been applied in several monitoring and errordetection applications (Alzghoul & Lofstrand, 2011).
Alzghoul and Lofstrand (2011) proposed and verified a modelwhich can be used to increase the availability of industrial systemsthrough data stream mining. They found that the applied algo-rithms were able to achieve a high classification accuracy whichcan be utilized to detect failures at an early stage, thereby increas-ing the reliability and thus the availability of the product. Animprovement to this model is to have a predictor which can predicta failure beforehand. The main industrial motivation for the re-search presented here is that failure prediction can be helpful bytriggering preventive actions capable of avoiding the failures orreducing their consequences.
Data prediction can be applied for short-term prediction or forlong-term prediction. The short-term predictions refer to predic-tion up to a minute into the future while long-term predictions re-fer to prediction beyond a minute into the future. The importanceof short-term prediction is evident when we consider the failuresthat can occur suddenly. An example of hydraulic motor failurethat can be avoided by short-term prediction is seizure. Accordingto Dufrane and Kannel, seizure is predicted to occur in less than20 s under some conditions e.g., insufficient lubrication (Dufrane& Kannel, 1989). Therefore, the capability to predict the next10–20 s of data could enable the operator to prevent seizure ifresponses are sufficiently fast.
0360-8352/$ - see front matter � 2011 Elsevier Ltd. All rights reserved.doi:10.1016/j.cie.2011.12.023
⇑ Corresponding author. Tel.: + 46 (0)920 49 3874.E-mail address: [email protected] (M. Löfstrand).
1 Tel.: + 46 (0)920 49 2453.2 Tel.: + 46 (0)920 49 2439.
Computers & Industrial Engineering 62 (2012) 972–978
Contents lists available at SciVerse ScienceDirect
Computers & Industrial Engineering
journal homepage: www.elsevier .com/ locate/caie
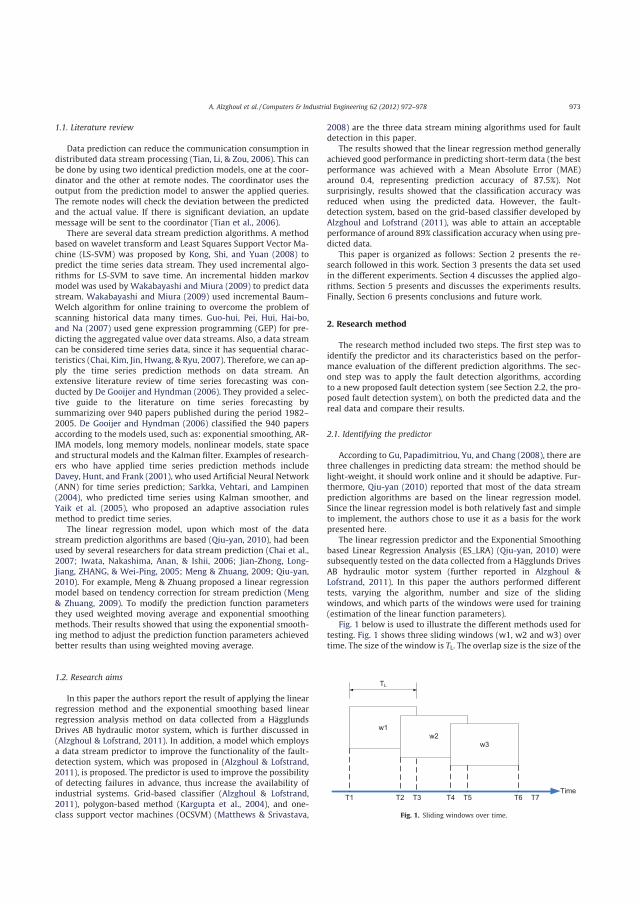
1.1. Literature review
Data prediction can reduce the communication consumption indistributed data stream processing (Tian, Li, & Zou, 2006). This canbe done by using two identical prediction models, one at the coor-dinator and the other at remote nodes. The coordinator uses theoutput from the prediction model to answer the applied queries.The remote nodes will check the deviation between the predictedand the actual value. If there is significant deviation, an updatemessage will be sent to the coordinator (Tian et al., 2006).
There are several data stream prediction algorithms. A methodbased on wavelet transform and Least Squares Support Vector Ma-chine (LS-SVM) was proposed by Kong, Shi, and Yuan (2008) topredict the time series data stream. They used incremental algo-rithms for LS-SVM to save time. An incremental hidden markovmodel was used by Wakabayashi and Miura (2009) to predict datastream. Wakabayashi and Miura (2009) used incremental Baum–Welch algorithm for online training to overcome the problem ofscanning historical data many times. Guo-hui, Pei, Hui, Hai-bo,and Na (2007) used gene expression programming (GEP) for pre-dicting the aggregated value over data streams. Also, a data streamcan be considered time series data, since it has sequential charac-teristics (Chai, Kim, Jin, Hwang, & Ryu, 2007). Therefore, we can ap-ply the time series prediction methods on data stream. Anextensive literature review of time series forecasting was con-ducted by De Gooijer and Hyndman (2006). They provided a selec-tive guide to the literature on time series forecasting bysummarizing over 940 papers published during the period 1982–2005. De Gooijer and Hyndman (2006) classified the 940 papersaccording to the models used, such as: exponential smoothing, AR-IMA models, long memory models, nonlinear models, state spaceand structural models and the Kalman filter. Examples of research-ers who have applied time series prediction methods includeDavey, Hunt, and Frank (2001), who used Artificial Neural Network(ANN) for time series prediction; Sarkka, Vehtari, and Lampinen(2004), who predicted time series using Kalman smoother, andYaik et al. (2005), who proposed an adaptive association rulesmethod to predict time series.
The linear regression model, upon which most of the datastream prediction algorithms are based (Qiu-yan, 2010), had beenused by several researchers for data stream prediction (Chai et al.,2007; Iwata, Nakashima, Anan, & Ishii, 2006; Jian-Zhong, Long-Jiang, ZHANG, & Wei-Ping, 2005; Meng & Zhuang, 2009; Qiu-yan,2010). For example, Meng & Zhuang proposed a linear regressionmodel based on tendency correction for stream prediction (Meng& Zhuang, 2009). To modify the prediction function parametersthey used weighted moving average and exponential smoothingmethods. Their results showed that using the exponential smooth-ing method to adjust the prediction function parameters achievedbetter results than using weighted moving average.
1.2. Research aims
In this paper the authors report the result of applying the linearregression method and the exponential smoothing based linearregression analysis method on data collected from a HägglundsDrives AB hydraulic motor system, which is further discussed in(Alzghoul & Lofstrand, 2011). In addition, a model which employsa data stream predictor to improve the functionality of the fault-detection system, which was proposed in (Alzghoul & Lofstrand,2011), is proposed. The predictor is used to improve the possibilityof detecting failures in advance, thus increase the availability ofindustrial systems. Grid-based classifier (Alzghoul & Lofstrand,2011), polygon-based method (Kargupta et al., 2004), and one-class support vector machines (OCSVM) (Matthews & Srivastava,
2008) are the three data stream mining algorithms used for faultdetection in this paper.
The results showed that the linear regression method generallyachieved good performance in predicting short-term data (the bestperformance was achieved with a Mean Absolute Error (MAE)around 0.4, representing prediction accuracy of 87.5%). Notsurprisingly, results showed that the classification accuracy wasreduced when using the predicted data. However, the fault-detection system, based on the grid-based classifier developed byAlzghoul and Lofstrand (2011), was able to attain an acceptableperformance of around 89% classification accuracy when using pre-dicted data.
This paper is organized as follows: Section 2 presents the re-search followed in this work. Section 3 presents the data set usedin the different experiments. Section 4 discusses the applied algo-rithms. Section 5 presents and discusses the experiments results.Finally, Section 6 presents conclusions and future work.
2. Research method
The research method included two steps. The first step was toidentify the predictor and its characteristics based on the perfor-mance evaluation of the different prediction algorithms. The sec-ond step was to apply the fault detection algorithms, accordingto a new proposed fault detection system (see Section 2.2, the pro-posed fault detection system), on both the predicted data and thereal data and compare their results.
2.1. Identifying the predictor
According to Gu, Papadimitriou, Yu, and Chang (2008), there arethree challenges in predicting data stream: the method should belight-weight, it should work online and it should be adaptive. Fur-thermore, Qiu-yan (2010) reported that most of the data streamprediction algorithms are based on the linear regression model.Since the linear regression model is both relatively fast and simpleto implement, the authors chose to use it as a basis for the workpresented here.
The linear regression predictor and the Exponential Smoothingbased Linear Regression Analysis (ES_LRA) (Qiu-yan, 2010) weresubsequently tested on the data collected from a Hägglunds DrivesAB hydraulic motor system (further reported in Alzghoul &Lofstrand, 2011). In this paper the authors performed differenttests, varying the algorithm, number and size of the slidingwindows, and which parts of the windows were used for training(estimation of the linear function parameters).
Fig. 1 below is used to illustrate the different methods used fortesting. Fig. 1 shows three sliding windows (w1, w2 and w3) overtime. The size of the window is TL. The overlap size is the size of the
w1w2
w3
TimeT1 2T 3T T4 T5 T6
TL
T7
Fig. 1. Sliding windows over time.
A. Alzghoul et al. / Computers & Industrial Engineering 62 (2012) 972–978 973
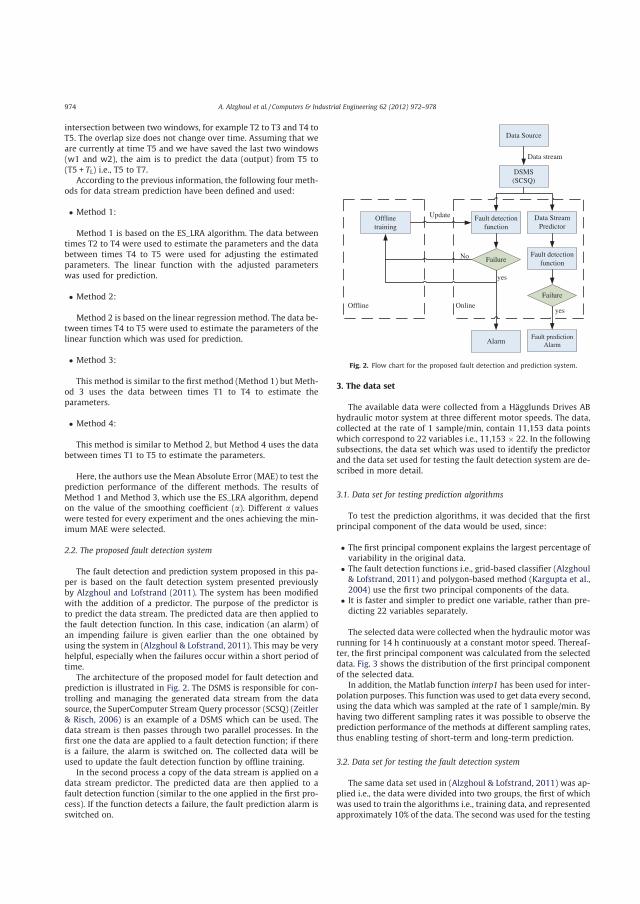
intersection between two windows, for example T2 to T3 and T4 toT5. The overlap size does not change over time. Assuming that weare currently at time T5 and we have saved the last two windows(w1 and w2), the aim is to predict the data (output) from T5 to(T5 + TL) i.e., T5 to T7.
According to the previous information, the following four meth-ods for data stream prediction have been defined and used:
� Method 1:
Method 1 is based on the ES_LRA algorithm. The data betweentimes T2 to T4 were used to estimate the parameters and the databetween times T4 to T5 were used for adjusting the estimatedparameters. The linear function with the adjusted parameterswas used for prediction.
� Method 2:
Method 2 is based on the linear regression method. The data be-tween times T4 to T5 were used to estimate the parameters of thelinear function which was used for prediction.
� Method 3:
This method is similar to the first method (Method 1) but Meth-od 3 uses the data between times T1 to T4 to estimate theparameters.
� Method 4:
This method is similar to Method 2, but Method 4 uses the databetween times T1 to T5 to estimate the parameters.
Here, the authors use the Mean Absolute Error (MAE) to test theprediction performance of the different methods. The results ofMethod 1 and Method 3, which use the ES_LRA algorithm, dependon the value of the smoothing coefficient (a). Different a valueswere tested for every experiment and the ones achieving the min-imum MAE were selected.
2.2. The proposed fault detection system
The fault detection and prediction system proposed in this pa-per is based on the fault detection system presented previouslyby Alzghoul and Lofstrand (2011). The system has been modifiedwith the addition of a predictor. The purpose of the predictor isto predict the data stream. The predicted data are then applied tothe fault detection function. In this case, indication (an alarm) ofan impending failure is given earlier than the one obtained byusing the system in (Alzghoul & Lofstrand, 2011). This may be veryhelpful, especially when the failures occur within a short period oftime.
The architecture of the proposed model for fault detection andprediction is illustrated in Fig. 2. The DSMS is responsible for con-trolling and managing the generated data stream from the datasource, the SuperComputer Stream Query processor (SCSQ) (Zeitler& Risch, 2006) is an example of a DSMS which can be used. Thedata stream is then passes through two parallel processes. In thefirst one the data are applied to a fault detection function; if thereis a failure, the alarm is switched on. The collected data will beused to update the fault detection function by offline training.
In the second process a copy of the data stream is applied on adata stream predictor. The predicted data are then applied to afault detection function (similar to the one applied in the first pro-cess). If the function detects a failure, the fault prediction alarm isswitched on.
3. The data set
The available data were collected from a Hägglunds Drives ABhydraulic motor system at three different motor speeds. The data,collected at the rate of 1 sample/min, contain 11,153 data pointswhich correspond to 22 variables i.e., 11,153 � 22. In the followingsubsections, the data set which was used to identify the predictorand the data set used for testing the fault detection system are de-scribed in more detail.
3.1. Data set for testing prediction algorithms
To test the prediction algorithms, it was decided that the firstprincipal component of the data would be used, since:
� The first principal component explains the largest percentage ofvariability in the original data.
� The fault detection functions i.e., grid-based classifier (Alzghoul& Lofstrand, 2011) and polygon-based method (Kargupta et al.,2004) use the first two principal components of the data.
� It is faster and simpler to predict one variable, rather than pre-dicting 22 variables separately.
The selected data were collected when the hydraulic motor wasrunning for 14 h continuously at a constant motor speed. Thereaf-ter, the first principal component was calculated from the selecteddata. Fig. 3 shows the distribution of the first principal componentof the selected data.
In addition, the Matlab function interp1 has been used for inter-polation purposes. This function was used to get data every second,using the data which was sampled at the rate of 1 sample/min. Byhaving two different sampling rates it was possible to observe theprediction performance of the methods at different sampling rates,thus enabling testing of short-term and long-term prediction.
3.2. Data set for testing the fault detection system
The same data set used in (Alzghoul & Lofstrand, 2011) was ap-plied i.e., the data were divided into two groups, the first of whichwas used to train the algorithms i.e., training data, and representedapproximately 10% of the data. The second was used for the testing
Data Source
DSMS(SCSQ)
Fault detection function
Offline training
Failure
Alarm
Data stream
yes
No
Update
OnlineOffline
Data Stream Predictor
Fault detection function
Failure
Fault prediction Alarm
yes
Fig. 2. Flow chart for the proposed fault detection and prediction system.
974 A. Alzghoul et al. / Computers & Industrial Engineering 62 (2012) 972–978
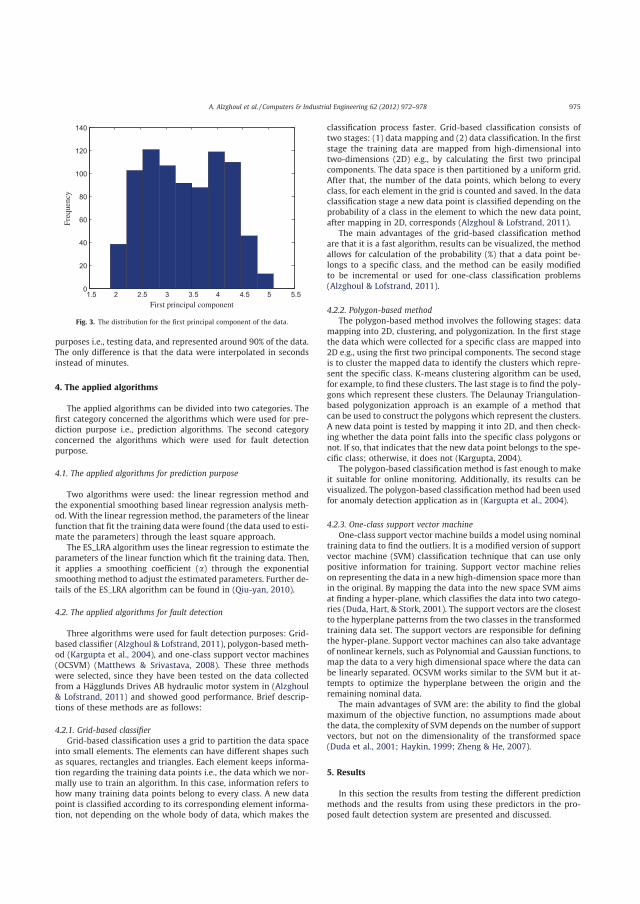
purposes i.e., testing data, and represented around 90% of the data.The only difference is that the data were interpolated in secondsinstead of minutes.
4. The applied algorithms
The applied algorithms can be divided into two categories. Thefirst category concerned the algorithms which were used for pre-diction purpose i.e., prediction algorithms. The second categoryconcerned the algorithms which were used for fault detectionpurpose.
4.1. The applied algorithms for prediction purpose
Two algorithms were used: the linear regression method andthe exponential smoothing based linear regression analysis meth-od. With the linear regression method, the parameters of the linearfunction that fit the training data were found (the data used to esti-mate the parameters) through the least square approach.
The ES_LRA algorithm uses the linear regression to estimate theparameters of the linear function which fit the training data. Then,it applies a smoothing coefficient (a) through the exponentialsmoothing method to adjust the estimated parameters. Further de-tails of the ES_LRA algorithm can be found in (Qiu-yan, 2010).
4.2. The applied algorithms for fault detection
Three algorithms were used for fault detection purposes: Grid-based classifier (Alzghoul & Lofstrand, 2011), polygon-based meth-od (Kargupta et al., 2004), and one-class support vector machines(OCSVM) (Matthews & Srivastava, 2008). These three methodswere selected, since they have been tested on the data collectedfrom a Hägglunds Drives AB hydraulic motor system in (Alzghoul& Lofstrand, 2011) and showed good performance. Brief descrip-tions of these methods are as follows:
4.2.1. Grid-based classifierGrid-based classification uses a grid to partition the data space
into small elements. The elements can have different shapes suchas squares, rectangles and triangles. Each element keeps informa-tion regarding the training data points i.e., the data which we nor-mally use to train an algorithm. In this case, information refers tohow many training data points belong to every class. A new datapoint is classified according to its corresponding element informa-tion, not depending on the whole body of data, which makes the
classification process faster. Grid-based classification consists oftwo stages: (1) data mapping and (2) data classification. In the firststage the training data are mapped from high-dimensional intotwo-dimensions (2D) e.g., by calculating the first two principalcomponents. The data space is then partitioned by a uniform grid.After that, the number of the data points, which belong to everyclass, for each element in the grid is counted and saved. In the dataclassification stage a new data point is classified depending on theprobability of a class in the element to which the new data point,after mapping in 2D, corresponds (Alzghoul & Lofstrand, 2011).
The main advantages of the grid-based classification methodare that it is a fast algorithm, results can be visualized, the methodallows for calculation of the probability (%) that a data point be-longs to a specific class, and the method can be easily modifiedto be incremental or used for one-class classification problems(Alzghoul & Lofstrand, 2011).
4.2.2. Polygon-based methodThe polygon-based method involves the following stages: data
mapping into 2D, clustering, and polygonization. In the first stagethe data which were collected for a specific class are mapped into2D e.g., using the first two principal components. The second stageis to cluster the mapped data to identify the clusters which repre-sent the specific class. K-means clustering algorithm can be used,for example, to find these clusters. The last stage is to find the poly-gons which represent these clusters. The Delaunay Triangulation-based polygonization approach is an example of a method thatcan be used to construct the polygons which represent the clusters.A new data point is tested by mapping it into 2D, and then check-ing whether the data point falls into the specific class polygons ornot. If so, that indicates that the new data point belongs to the spe-cific class; otherwise, it does not (Kargupta, 2004).
The polygon-based classification method is fast enough to makeit suitable for online monitoring. Additionally, its results can bevisualized. The polygon-based classification method had been usedfor anomaly detection application as in (Kargupta et al., 2004).
4.2.3. One-class support vector machineOne-class support vector machine builds a model using nominal
training data to find the outliers. It is a modified version of supportvector machine (SVM) classification technique that can use onlypositive information for training. Support vector machine relieson representing the data in a new high-dimension space more thanin the original. By mapping the data into the new space SVM aimsat finding a hyper-plane, which classifies the data into two catego-ries (Duda, Hart, & Stork, 2001). The support vectors are the closestto the hyperplane patterns from the two classes in the transformedtraining data set. The support vectors are responsible for definingthe hyper-plane. Support vector machines can also take advantageof nonlinear kernels, such as Polynomial and Gaussian functions, tomap the data to a very high dimensional space where the data canbe linearly separated. OCSVM works similar to the SVM but it at-tempts to optimize the hyperplane between the origin and theremaining nominal data.
The main advantages of SVM are: the ability to find the globalmaximum of the objective function, no assumptions made aboutthe data, the complexity of SVM depends on the number of supportvectors, but not on the dimensionality of the transformed space(Duda et al., 2001; Haykin, 1999; Zheng & He, 2007).
5. Results
In this section the results from testing the different predictionmethods and the results from using these predictors in the pro-posed fault detection system are presented and discussed.
1.5 2 2.5 3 3.5 4 4.5 5 5.50
20
40
60
80
100
120
140
First principal component
Freq
uenc
y
Fig. 3. The distribution for the first principal component of the data.
A. Alzghoul et al. / Computers & Industrial Engineering 62 (2012) 972–978 975
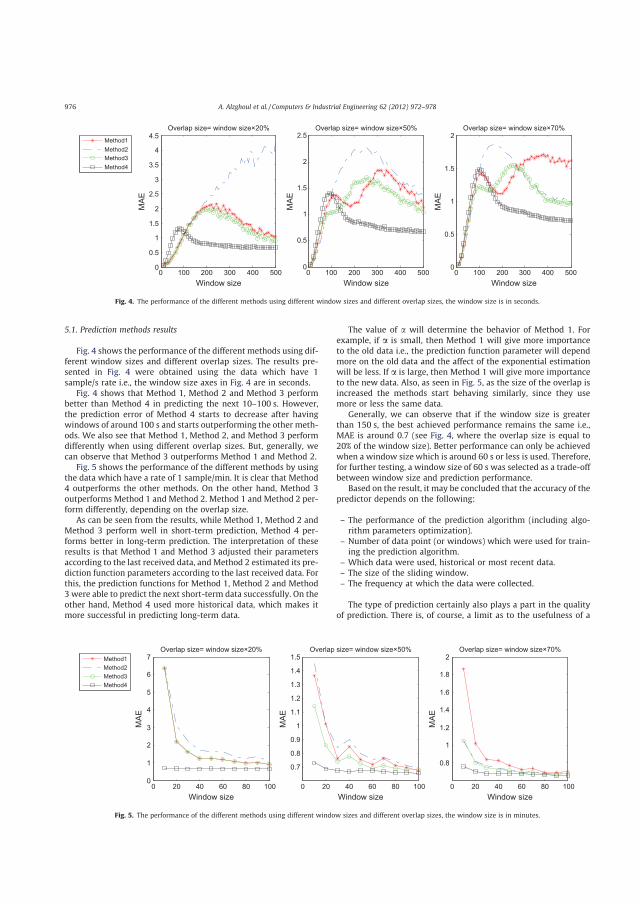
5.1. Prediction methods results
Fig. 4 shows the performance of the different methods using dif-ferent window sizes and different overlap sizes. The results pre-sented in Fig. 4 were obtained using the data which have 1sample/s rate i.e., the window size axes in Fig. 4 are in seconds.
Fig. 4 shows that Method 1, Method 2 and Method 3 performbetter than Method 4 in predicting the next 10–100 s. However,the prediction error of Method 4 starts to decrease after havingwindows of around 100 s and starts outperforming the other meth-ods. We also see that Method 1, Method 2, and Method 3 performdifferently when using different overlap sizes. But, generally, wecan observe that Method 3 outperforms Method 1 and Method 2.
Fig. 5 shows the performance of the different methods by usingthe data which have a rate of 1 sample/min. It is clear that Method4 outperforms the other methods. On the other hand, Method 3outperforms Method 1 and Method 2. Method 1 and Method 2 per-form differently, depending on the overlap size.
As can be seen from the results, while Method 1, Method 2 andMethod 3 perform well in short-term prediction, Method 4 per-forms better in long-term prediction. The interpretation of theseresults is that Method 1 and Method 3 adjusted their parametersaccording to the last received data, andMethod 2 estimated its pre-diction function parameters according to the last received data. Forthis, the prediction functions for Method 1, Method 2 and Method3 were able to predict the next short-term data successfully. On theother hand, Method 4 used more historical data, which makes itmore successful in predicting long-term data.
The value of a will determine the behavior of Method 1. Forexample, if a is small, then Method 1 will give more importanceto the old data i.e., the prediction function parameter will dependmore on the old data and the affect of the exponential estimationwill be less. If a is large, then Method 1 will give more importanceto the new data. Also, as seen in Fig. 5, as the size of the overlap isincreased the methods start behaving similarly, since they usemore or less the same data.
Generally, we can observe that if the window size is greaterthan 150 s, the best achieved performance remains the same i.e.,MAE is around 0.7 (see Fig. 4, where the overlap size is equal to20% of the window size). Better performance can only be achievedwhen a window size which is around 60 s or less is used. Therefore,for further testing, a window size of 60 s was selected as a trade-offbetween window size and prediction performance.
Based on the result, it may be concluded that the accuracy of thepredictor depends on the following:
– The performance of the prediction algorithm (including algo-rithm parameters optimization).
– Number of data point (or windows) which were used for train-ing the prediction algorithm.
– Which data were used, historical or most recent data.– The size of the sliding window.– The frequency at which the data were collected.
The type of prediction certainly also plays a part in the qualityof prediction. There is, of course, a limit as to the usefulness of a
0 100 200 300 400 5000
0.5
1
1.5
2
2.5
3
3.5
4
4.5
Window size
MAE
Overlap size= window size×20%
Method1Method2Method3Method4
0 100 200 300 400 5000
0.5
1
1.5
2
2.5
Window sizeM
AE
Overlap size= window size×50%
0 100 200 300 400 5000
0.5
1
1.5
2
Window size
MAE
Overlap size= window size×70%
Fig. 4. The performance of the different methods using different window sizes and different overlap sizes, the window size is in seconds.
0 20 40 60 80 1000
1
2
3
4
5
6
7
Window size
MAE
Overlap size= window size×20%Method1Method2Method3Method4
0 20 40 60 80 100
0.7
0.8
0.9
1
1.1
1.2
1.3
1.4
1.5
Window size
MAE
Overlap size= window size×50%
0 20 40 60 80 100
0.8
1
1.2
1.4
1.6
1.8
2
Window size
MAE
Overlap size= window size×70%
Fig. 5. The performance of the different methods using different window sizes and different overlap sizes, the window size is in minutes.
976 A. Alzghoul et al. / Computers & Industrial Engineering 62 (2012) 972–978

certain set of data for forecasting. The limits are defined by the use-fulness of the industrial application being studied. In addition,some prediction algorithms, such as ES_LRA, use different partsof the training data for different purposes. For example, ES_LRAuses part of the data to estimate the parameters of the linear func-tion and the other part to adjust the estimated parameters. There-fore, the division of the training data for the different algorithmoperations may affect the prediction accuracy.
5.2. Fault detection system results
The setup of the numerical experiments is similar to the oneused in (Alzghoul & Lofstrand, 2011). Three methods had beentested via polygon-based, OCSVM and grid-based classificationmethods. For the OCSVM the Radial Basis Function (RBF) was usedas a kernel. The OCSVM algorithm was trained offline, and then theresulting function was brought online. The polygon-based methodworks by mapping the training data, which represent the normalbehavior, into two-dimensions, then finding the clusters, and final-ly constructing the polygon for every cluster. For the grid-basedmethod, a triangle grid was used.
The prediction methods were used to predict the next 60 s i.e.,the window size is 60 s, using overlap size equal to 20% of the win-dow size (see Fig. 4). Then, the predicted data and the real datawere applied to the three fault detection algorithms. The resultsof the test are presented in Table 1. Table 1 shows the classificationaccuracy for the different types of data (real and predicted) whenapplied on the different fault detection algorithms. The resultsshow that the different prediction methods achieved different clas-sification accuracy depending on the fault detection algorithm. Thehighest classification accuracy for the prediction methods was ob-tained when using the Grid-based classifier. It was also noted thatthe performance changes according to the prediction method. Gen-erally, Method 2 and Method 3 outperform Method 1 and Method4. However, Method 1 achieved a very close performance to Meth-od 2 and Method 3 and outperforms Method 4.
Comparing Method 2 and Method 4 a significant difference inperformance is noted. The reason is that Method 2 depends onlyon the most recent data i.e., the overlap area, which will allowMethod 2 to perform well in short-term prediction. On the otherhand, Method 4 is based on more historical data, which will allowit to perform well for long-term prediction, as noted in the previ-ous section.
The results show that the classification accuracy is reducedwhen the predicted data are used. However, the classification accu-racy is still acceptable when the predicted data are used. For exam-ple, when Method 2 was used for prediction and Grid-based asclassifier, the classification accuracy was around 89%, which isgood enough.
6. Conclusions and future work
Data analysis can be used to detect and prevent failures inindustrial systems if the support system is managed accordingly.The capability to detect failures plays an important role in machinehealth monitoring. Therefore, data analysis is an important tool forincreasing availability of industrial products. The common way toperform data analysis is to use the current and the historical data.In this paper a new failure detection system which uses not onlythe current and the historical data but also the predicted data isproposed.
Different data prediction methods had been tested for bothshort-term and long-term prediction. It was found that the meth-ods which used more historical data perform better in long-termprediction. On the other hand, the methods which used the mostrecent data perform better in short-term prediction. Also, it wasnoted that the mean absolute error between the predicted andthe real data is smaller in the case of short-term prediction.
The result of using short-term prediction in the fault detectionsystem showed promising results. The fault detection system wasable to achieve a classification accuracy of around 89% using theshort-term predicted data. This result is good enough to be helpfulfor avoiding failures which occur within a short period of time, forexample, seizure of a hydraulic motor. Gaining a longer reactiontime for the support system to handle early warnings of impendingfailures may certainly be used to increase system availability.
A weakness of the performed experiments is that the data wereinterpolated to get a higher sampling rate and the data containedonly one class i.e., no failures. Future work involves testing datawhich contain failures and have a high sampling rate.
Acknowledgments
The authors would like to thank the Swedish Foundation forStrategic Research (SSF) through the SSPI project for support andfunding. Furthermore, the authors wish to thank the Swedish Gov-ernmental Agency for Innovation Systems (VINNOVA) through theFASTE Laboratory for Functional Product Innovation, Based at LuleåUniversity of Technology. The support of industrial partners andinformants is gratefully acknowledged.
References
Alzghoul, A., & Lofstrand, M. (2011). Increasing availability of industrial systemsthrough data stream mining. Computers & Industrial Engineering, 60(2),195–205.
Chai, D.J., Kim, E.H., Jin, L., Hwang, B. & Ryu, K.H. (2007). Prediction of FrequentItems to One Dimensional Stream Data.
Davey, N., Hunt, S., & Frank, R. (2001). Time series prediction and neural networks.Journal of Intelligent and Robotic Systems, 31, 91–103.
De Gooijer, J. G., & Hyndman, R. J. (2006). 25 years of time series forecasting.International Journal of Forecasting, 22(3), 443–473.
Duda, R. O., Hart, P. E., & Stork, D. G. (2001). Pattern classification (2nd ed.). JohnWiley & Sons.
Dufrane, K., & Kannel, J. (1989). Thermally induced seizures of journal bearings.Journal of Tribology, 111, 288.
Gaber, M. M., Zaslavsky, A., & Krishnaswamy, S. (2005). Mining data streams: areview. Sigmod Record, 34(2), 18–26.
Gu, X., Papadimitriou, S., Yu, P.S. & Chang, S.P. (2008). Online failure forecast forfault-tolerant data stream processing.
Guo-hui, L., Pei, F., Hui, C., Hai-bo, Z., & Na, C. (2007). Data stream prediction modelbased on GEP method. Computer Engineering, 33(18), 75–77.
Haykin, S. (1999). Neural networks: A comprehensive foundation (2nd ed.). PrenticeHall.
Iwata, K., Nakashima, T., Anan, Y. & Ishii, N. (2006). Improving accuracy of multipleregression analysis for effort prediction model.
Jian-Zhong, L., Long-Jiang, G., Zhang, D. D., & Wei-Ping, W. (2005). Processingalgorithms for predictive aggregate queries over data streams. Journal ofSoftware, 16(7), 1252–1261.
Kargupta, H., Bhargava, R., Liu, K., Powers, M., Blair, P. & Bushra, S. et al. (2004).Vedas: A mobile and distributed data stream mining system for real-time vehiclemonitoring (Vol. 334).
Table 1Classification accuracy for the different prediction methods.
Type of data Classificationaccuracy usingpolygons-based(%)
ClassificationaccuracyusingOCSVM (%)
Classificationaccuracyusing grid-based(%)
Real data 96.76 98.41 97.11Predicted data using
Method 177.29 86.02 86.25
Predicted data usingMethod 2
81.91 86.71 88.96
Predicted data usingMethod 3
79.27 87.57 87.52
Predicted data usingMethod 4
72.14 79.72 82.88
A. Alzghoul et al. / Computers & Industrial Engineering 62 (2012) 972–978 977

Kong, Y., Shi, Y., & Yuan, J. (2008). Prediction method of time series data stream basedon wavelet transform and least squares support vector machine. IEEE, pp. 120–124.
Matthews, B. & Srivastava, A.N. (2008). Comparative Analysis of Data-DrivenAnomaly Detection Methods. In Proceedings of the Joint Army Navy NASA AirForce Conference on Propulsion. Orlando, FL.
Meng, F., & Zhuang, P. (2009). Stream prediction model based on tendency correction.IEEE, pp. 189–193.
Qiu-yan, Y. (2010). A novel time streams prediction approach based on exponentialsmoothing. IEEE, pp. 20–23.
Sarkka, S., Vehtari, A. & Lampinen, J. (2004). Time series prediction by Kalmansmoother with cross-validated noise density. (Vol. 2, pp. 1653–1657 vol. 1652).IEEE.
Tian, L., Li, A. & Zou, P. (2006). Research on prediction models over distributed datastreams. In L. Feng, G. Wang, C. Zeng & R. Huang, Web Information Systems –WISE 2006 Workshops (Vol. 4256, pp. 25-36): Springer Berlin/Heidelberg.
Wakabayashi, K., & Miura, T. (2009). Data stream prediction using incrementalhidden markov models. Data Warehousing and Knowledge Discovery, 63, 74.
Yaik, O.B., Yong, C.H. & Haron, F. (2005). Time series prediction using adaptiveassociation rules.
Zeitler, E., Risch, T. (2006). Processing high-volume stream queries on asupercomputer. 9–10.
Zheng, L. & He, X. (2007). Classification techniques in pattern recognition. ISBN: 80-903100.
978 A. Alzghoul et al. / Computers & Industrial Engineering 62 (2012) 972–978


Paper D


Comparing a knowledge-based and a data-driven method in queryingdata streams for system fault detection: A hydraulic drive systemapplication
Ahmad Alzghoul a,*, Bjorn Backe b,1, Magnus Lofstrand c,2,Arne Bystrom d,3, Bengt Liljedahl d,4
aDepartment of Information Technology, Division of Computing Science, Room POL ITC 19134, Box 337, 751 05 Uppsala, SwedenbDivision of Computer Aided Design, Lulea University of Technology, Room E218D, SE-97187 Lulea, SwedencDepartment of Information Technology, Division of Computing Science, Room POL ITC 19111, Box 337, 751 05 Uppsala, SwedendBosch Rexroth Mellansel AB, SE-895 80 Mellansel, Sweden
1. Introduction
Industrial companies seek to increase the availability of theirproduct and, thereby, improve product quality. Product availabilitycan be improved in the design phase, in the testing and refinementphase, or in the operational phase, i.e. when the product is in use
[1,2]. Availability of industrial systems can be improved bydetecting and diagnosing the failures at an early stage [3].
Fault detection and diagnosis methods have been classified indifferent ways [4–6]. Zhang and Jiang [5], divided the faultdetection methods into model-based and data-based methods asillustrated in Fig. 1. Then, Zhang and Jiang [5] divided the model-based and the data-based methods into two groups: quantitativeand qualitative methods. On the other hand, Chiang et al. [6]classified fault detecting and diagnosing methods into threecategories: data-driven methods, analytical-based (model-based)methods, and knowledge-based methods. Fig. 1 shows that themodel-quantitative-based, data-quantitative-based, and the com-bination of model-qualitative-based and data-qualitative-basedmethods in the Zhang and Jiang [5] model can be seen asanalytically based, data-driven, and knowledge-based methods,respectively, in the Chiang et al. [6] model.
Computers in Industry 65 (2014) 1126–1135
A R T I C L E I N F O
Article history:
Received 9 January 2013
Received in revised form 18 April 2014
Accepted 19 June 2014
Available online 5 July 2014
Keywords:
Fault detection
Data-driven
Knowledge-based
Data stream mining
Data stream management system
Product development
A B S T R A C T
The field of fault detection and diagnosis has been the subject of considerable interest in industry. Fault
detection may increase the availability of products, thereby improving their quality. Fault detection and
diagnosis methods can be classified in three categories: data-driven, analytically based, and knowledge-
based methods.
In this work, we investigated the ability and the performance of applying two fault detection methods to
query data streams produced from hydraulic drive systems. A knowledge-based method was compared to a
data-driven method. A fault detection system based on a data stream management system (DSMS) was
developed in order to test and compare the two methods using data from real hydraulic drive systems.
The knowledge-based method was based on causal models (fault trees), and principal component
analysis (PCA) was used to build the data-driven model. The performance of the methods in terms of
accuracy and speed, was examined using normal and physically simulated fault data. The results show
that both methods generate queries fast enough to query the data streams online, with a similar level of
fault detection accuracy. The industrial applications of both methods include monitoring of individual
industrial mechanical systems as well as fleets of such systems. One can conclude that both methods
may be used to increase industrial system availability.
� 2014 Elsevier B.V. All rights reserved.
* Corresponding author. Tel.: +46 018 471 4026.
E-mail addresses: [email protected] (A. Alzghoul),
[email protected] (B. Backe), [email protected] (M. Lofstrand),
[email protected] (A. Bystrom), [email protected]
(B. Liljedahl).1 Tel.: +46 0920 49 2439.2 Tel.: +46 018 471 4020.3 Tel.: +46 660 87062.4 Tel.: +46 660 87123.
Contents lists available at ScienceDirect
Computers in Industry
jo ur n al ho m epag e: ww w.els evier . c om / lo cat e/co mp in d
http://dx.doi.org/10.1016/j.compind.2014.06.003
0166-3615/� 2014 Elsevier B.V. All rights reserved.

The analytical approach uses first principles to constructmathematical models of the system [6]. Therefore, the analyticallybased methods incorporate the physical understanding of thesystem into the fault detection and diagnosis process [6,7].According to Ref. [6] most of the analytically based methods arebased on parameter estimation, observer-based design and parityrelations. The analytical model is, according to Chiang et al. [6], notadequate for large-scale and complex systems. However, analyti-cally based methods, when applicable, outperform the data-drivenmethods, as the former incorporate the physical understanding [6].
Knowledge-based methods use qualitative models in faultdetection and the diagnosis process [6]. According to Ref. [8], mostof the knowledge-based methods are rule-based expert systems.As the inferred rules are based on the historical failure cases andengineers’ experience, it is difficult to search a wide range of yield-loss cases beyond the engineers’ current knowledge [8]. Theknowledge-based method is suitable when the detailed mathe-matical model is not available and when the number of inputs,outputs and states of a system is relatively small [6]. However, theknowledge-based method became more applicable to complexsystems with the help of software packages [6]. A survey ofknowledge-based fault diagnosis methods was performed by Zhuand Yu [9] and Venkatasubramanian et al. [10].
Fig. 1 shows that knowledge-based methods may be eitherqualitative or quantitative. It also shows that knowledge-basedmethods can be either qualitative, model-based (such as causalmodels) or qualitative, data-based (such as expert systems). In thispaper, we have used causal models since the industrial partners areexperts concerning the function of their hydraulic drive system,have a good historical knowledge, and are familiar with the faulttree analysis method (FTA) [11] used.
Data-driven methods use the product lifecycle data for faultdetection and do not require first-principles models. Therefore,data-driven methods can be applied to large-scale and complexsystems and save time and cost, which is required for thedevelopment of first-principles models [6]. Data-driven methodsare preferred when the product data is available while the systemmodel is not [7]. In addition; data-driven methods have the abilityto capture information and provide knowledge which is beyondthe engineers’ current knowledge [8]. However, the performance ofdata-driven methods is based on the quality and the quantity of thecollected data [6]. A survey of data-driven prognostics methods canbe found in Refs. [10,12]. Data-driven methods can, according toFig. 1, be divided into two groups: statistical and non-statisticalmethods. Principal component analysis (PCA) [13] and partial leastsquares (PLS) [14] are examples of statistical-based data-drivenmethods. On the other hand, artificial neural networks (ANN) [15],self-organized map (SOM) [16], and K-nearest neighbors [17] areexamples of non-statistical data-driven methods. In this work,
principal component analysis was selected as a data-drivenmethod because it has been successfully used to detect faults ingeneral, by researchers such as Villegas et al. [18], Tharrault et al.[19], Russell et al. [20], Kresta et al. [21], and Piovoso et al. [22].
Nowadays, the volume of the generated data is increasing. It isexpected that the volume of generated data will exceed theavailable storage [23,24]. Therefore, fault detection methods neednot only achieve high classification accuracy in detecting failures,but must also be fast enough to identify faults from continuous andfast-arriving data streams. A number of researchers have discussedthe issue of detecting failures in data streams. A review of suchapplication can be found in Alzghoul and Lofstrand [23]. Examplesof research concerning data stream mining include [3,23,25–27].Karcal [26], used a multivariate statistical process monitoringtechnique to detect change in the sensor data stream. Kargupta[25], developed the VEhicle DAta Stream mining (VEDAS) systemfor realtime vehicle-health monitoring. The proposed system wasbased on DSMS and a data stream mining (DSM) method.Matthews and Srivastava [27], applied different data-drivenmethods on continuous data stream from a solid rocket motorfor anomaly detection.
The authors of this paper have presented a number of relatedworks [3,23,28,29] and in this paper, we report some verificationand validation activities. In Alzghoul and Lofstrand [23], theauthors investigated the possibility of increasing availabilitythrough the use of data stream mining and DSMS technologies.The authors reviewed the DSM algorithms and their applications inmonitoring industrial systems. Also, they developed a faultdetection system based on the DSM and the DSMS technologies.The fault detection system was developed based on three differentDSM classification algorithms: One-class support vector machine(OCSVM), polygon-based classification algorithm and grid-basedclassification algorithm. The developed fault detection system wastested using data collected from hydraulic motors. The resultsshowed that the three algorithms achieved good performance indetecting faults from sensor data streams. In Alzghoul et al. [3], theauthors utilized data stream prediction methods to forecast thefuture data stream. In Ref. [3], they developed a fault detectionsystem based on data stream forecasting, data stream mining anddata stream management systems. The developed fault detectionsystem was able to predict system faults based on a forecasted datastream. Furthermore, in Ref. [28] Alzghoul et al., discussed thepotential industrial use of the proposed fault detection systemwhich, in turn, was presented. Lofstrand et al. [29], proposed amodel for predicting and monitoring industrial system availability[29]. They suggested using the IF-THEN-ELSE statements, whichare based on FTA, for development of queries for systemmonitoring. However, developing and testing such queries wasnot done in Ref. [29]. In this work, queries based on FTA and PCA
Fig. 1. Classification of fault detection and diagnosis methods (adapted from Zhang and Jiang [5]).
A. Alzghoul et al. / Computers in Industry 65 (2014) 1126–1135 1127

methods were implemented and tested. Thus, the model presentedin Ref. [29] is partly tested and verified which can be considered asa novelty of this work. Another novelty of this paper is testing andcomparing a data-driven method (PCA), which was not tested inRefs. [3,23], to a knowledge driven method (FTA) in querying datastreams for monitoring a hydraulic drive system application.
Several authors, as identified above, discuss various faultdetection methods, their advantages and disadvantages. However,few authors discuss applying specifically knowledge-based anddata-driven methods for searching high-volume data streams. Inaddition, to our knowledge, no authors have compared theperformance of different fault detection methods in searchinghigh-volume data streams.
The authors have worked closely with Bosch Rexroth MellanselAB [30] (BRMAB, formerly Hagglunds Drives AB), to such an extentthat their representatives are co-authors of this paper. BRMABmanufactures low-speed, high-torque hydraulic drive systems andare interested in improving the availability of their drive systemsthrough monitoring. In this industrial context we investigated thefunctionality and performance of two different fault detectionmethods, as reported in Section 6.
The first method, Principal Component Analysis is, in terms ofZhang and Jiang [5], a data-based quantitative method, whileChiang et al. [6], consider it a data-driven method. The secondmethod, Fault Tree Analysis (FTA) is, in terms of Zhang and Jiang[5], a model-based qualitative method, while Chiang et al. [6],consider it a knowledge-based method.
Using sensor data collected from a real BRMAB hydraulic drivesystem, the aim of this work is to partly validate the modelpresented by Lofstrand et al. [29]. The aim is also to test andcompare the functionality and performance when applying aknowledge-based method (FTA) and a data-driven method (PCA)to query data streams, with the purpose of fault detection.Therefore, we developed a fault detection system based on DSMStechnology to test the two fault detection methods. In Section 2(research method), Fig. 2 shows the process of developing the faultdetection functions, while Fig. 3 in Section 3 (fault detectionsystem architecture) shows the architecture of the developed faultdetection system. In addition, we discuss and summarize theadvantages and disadvantages of using the knowledge-based andthe data-driven methods (see Section 6).
Results suggested that both methods, when implemented in theDSMS, are sufficiently fast and can produce good classificationaccuracy. As reported in Section 5, it is clear that the two approachesproduce comparable and acceptable results in terms of accuracy andspeed. This is also evident from reviewing Tables 1–5; thus, thedeveloped models are verified and the model in Ref. [29] is partlyverified. Furthermore, PCA is shown in this paper to be a suitabledata-driven method for searching data streams from a hydraulicmotor. Comparing to previous work by the authors, in Refs. [3,23],the authors showed that three other data driven methods aresuitable. Furthermore, in Refs. [3,23], the data originated from alaboratory test (tank test hydraulic drive system) while in this paper,the data originate in a shredder application in use rather than from alab test. From these tests, it is indicated that data driven methods ingeneral, are suitable and generally successful for searching datastreams. In particular, the authors feel that the four data-drivenmethods tested (three in Ref. [3,23] and one in this paper) are nowvalidated when applied on data from hydraulic drive systems. Alsothe requirements for successful industrial implementation of thetwo methods were identified and described in Section 6. Further-more, it was found that the performance of the fault detectionmodels can be improved by investigating the misclassified data.Also, it was shown that sensor data can be used to improve theperformance of the knowledge-based method by tuning its modelparameters.
2. Research approach and case study
Bosch Rexroth Mellansel AB (BRMAB) is a Swedish companywhich manufactures low-speed, high-torque hydraulic drivesystems. BRMAB hydraulic drive systems are used in industriesincluding: mining, recycling, pulp and paper and construction.BRMAB are interested in improving the availability of their drivesystems through system monitoring. The work in this paper relatesto a full-scale BRMAB hydraulic drive system, a shredderapplication used to crush waste wood as shown in Fig. 2.
Qualitative data collection was done in collaboration with otherresearchers and BRMAB engineers. The data collection involvedsemi-structured and open-ended interviews [31] and data analysisinvolved using matrices [32]. BRMAB staff developed the baselineknowledge for the implementation of the applied fault detectionmethods, through an iterative process, together with the authors.The iterative process allowed for collaborative analysis throughoutthe process.
The initial specific data collection comprised about threemonths while the entire research process, which forms the basis ofthis paper, comprised ca. 24 months. The first three month, wereused for setting up the research team as well as the industrial team.The main research team consisted of the authors; one PhDresearcher and two PhD students, one of which has since beenawarded a PhD (i.e. Alzghoul). The industrial team consisted of twosenior development engineers from Bosch Rexroth Mellansel AB(Liljedahl and Bystrom), each of which with about 30 yearexperience at the company. Of the industrial representatives,one (Liljedahl) has been responsible for product development withrespect to the BRMAB hydraulic drive system while the other(Bystrom) has been responsible for systems and control develop-ment related to the hardware. Both industrial representativescurrently hold positions concerned with long-term development atBRMAB (see biographies).
Additional industrial representatives were brought in whenfurther specific knowledge was required and when verification ofpervious finings was carried out. Such instances occurred when:
� Fault trees were verified� Cause and effect relationships among monitored parameterswere decided
� After various calculations of importance had been carried out,including heat dissipation in a cooler for example.
Over the course of the herein reported study, about 10 face to facemeetings, meetings using video conference software (on average
Fig. 2. The shredder application.
A. Alzghoul et al. / Computers in Industry 65 (2014) 1126–11351128

every three weeks, www.alkit.se) and phone meetings (every twoweeks) were carried out.
2.1. Formulating the fault detection models
Sensor data was collected from the BRMAB shredder applica-tion to develop and test different fault detection methods beingused to monitor in air–oil cooler functionality in the hydraulicdrive system. Several variables which are associated with thecooler system functionality were considered.
The process of building data-driven models and knowledge-based models is illustrated in Fig. 3.
The data collection phase (as presented at the top of Fig. 3)was required to: enable a good understanding of the particularmonitored system, identify which faults are of interest tomonitor by the industrial partner, guide the choice ofparameters to monitor, and to obtain other information whichmay be required.
In the case of the data-driven method, if the requiredquantitative data is available for it to be used effectively, it likelydoes not require all the collected qualitative data. The next stepin the data-driven method was to train the data-drivenalgorithm offline using a sample of the collected sensor data.The training was done using Matlab. Next, the resultant functionwas exported and formulated in SCSQL query language [33]which was implemented in the SuperComputer Stream Queryprocessor (SCSQ) data stream management system [34]. In thecase of the knowledge-based method, fault tree analysis (FTA)was performed using the collected data and heuristic knowl-edge by industrial representatives and researchers in collabo-ration. Thereafter, the fault detection function was formulatedbased on the FTA results. Further descriptions of the appliedmethods, as presented in Fig. 2(a) and (b), are presented inSections 2.1.1 and 2.1.2.
2.1.1. Fault detection using the knowledge-based method
Before implementing the knowledge-based method (seeFig. 3b), based on [35], extensive data collection was performed.Interviews and workshops with a group of BRMAB representa-tives were conducted to elicit common faults affecting systemreliability [36]. Secondary industrial data, such as technicalspecifications and hydraulic schemes, was collected and analyzedfor system understanding [37]. Based on previous faults, foundthrough interviews, a fault tree analysis (FTA) [38,39] wasperformed. The FTA was used to determine elements of thesystem that need to be monitored. A list of identified measure-ment points was made, which was used to detect critical faultsthrough analyzing the FTA basic events. Thereafter, the structureand logic of the FTA was used to develop the relationshipsbetween the measurement points; that is, defining causalrelationships between various parameters and parameter sets.
Further information regarding the data collection and analysisfor the knowledge-based method discussed here can be found inRef. [29].
2.1.2. Fault detection using the data-driven method (PCA)
In this paper, principal component analysis (PCA) was used asthe data-driven method. PCA produces a lower dimension of thedata set and has the ability to increase the sensitivity of the processmonitoring by applying two different measures, one for monitor-ing systematic trends of the process subspace and one for randomnoise subspace [6]. Principal component analysis is an unsuper-vised linear dimensionality reduction technique. PCA projects thedata onto the orthogonal directions of maximal variance. Theprojection accounting for most of the data variance is called thefirst principal component [40]. PCA was used as a fault detectionmethod as follows:
Let X be data matrix of size n � m, where n is the number of datapoints and m stands for data dimensionality. X corresponds to data
Fig. 3. Building fault detection function for this work using (a) data-driven method (b) knowledge-based method.
A. Alzghoul et al. / Computers in Industry 65 (2014) 1126–1135 1129

which represent the normal behavior of a system, i.e. no faults.Then, to build a fault detection system using PCA, one can followthe steps in List 1 (adapted from [41]):
List 1
1. Calculate vectors for the mean (m) and the standard deviation(s) of X.
2. Normalize X to zero mean and unit variance using the calculated(m) and (s).
3. Calculate the PCA.4. Determine the required number of principal components.5. Calculate the control limits for T2 statistic and Q statistic.
More details for the calculation of PCA, T2 statistic limit, and Q
statistics limit can be found in Ref. [41] or [6]. T2 statistic and Q
statistic are the control limits which will be used for onlinemonitoring. List 2 shows the steps which can be used to testwhether a new observation x represents a normal or abnormal(fault) behavior of the monitored system:
List 2
1. Normalize x using the calculated mean (m) and variance (s)vectors in step (1) in List 1.
2. Calculate the T2 statistic and Q statistic for the normalizedobservation x using the obtained PCA model.
3. Check if the calculated T2 statistic and Q statistic are within theirlimits, i.e. the control limits calculated in step 5.
4. Consider observation x as fault data if it has T2 statistic violationor Q statistic violation.
Fault detection based on PCA can be used to search the datastream using data stream management systems. The five steps inList 1 can be done offline to obtain the control limits for T2 statisticand Q statistic. Thereafter, a data stream management system canbe used to do the calculations for testing new observations (interms of data stream) according to the steps in List 2.
The control limits T2 statistic and Q statistic can be updatedoffline. However, one could also use incremental principalcomponent analysis (IPCA) [42], so that the fault detection systemcan be updated online.
The following section presents the architecture of the faultdetection system which was used to test the knowledge-basedfault detection and the data-driven fault detection functions.
3. Fault detection system architecture
As previously mentioned, some authors have discussed theissue of detecting failures in high volume data streams fromequipment in use. Alzghoul and Lofstrand [23], Alzghoul et al. [3],and Kargupta [25], found that data stream management system(DSMS) technology has the potential to support scalability issues.DSMSs have the ability to manage data streams and applycontinuous queries over input data streams. DSMS technologycan be used to implement and test different fault detectionmethods in searching high-volume data streams. Therefore, thedeveloped fault detection system is based on the DSMS technology.In order to test the data-driven and knowledge-based models, weused the architecture of the fault detection system illustrated in
The two different fault detection functions (i.e. based on PCA andFTA) were developed as illustrated in Fig. 3. The fault detectionfunctions are formulated into code using the DSMS query language. TheDSMSisresponsible forcontrolling,managing,andapplyingcontinuousqueries over input data stream [25]. In this paper, the SuperComputerStream Query processor (SCSQ) [34] was used as the DSMS. If thefunction output indicates a fault occurrence, then an alert is activated.
Fig. 4 shows that there are two phases for the fault detectionsystem: the online and offline phases. Building the fault detectionfunction and formulating the mathematical functions as code are donein the offline phase, while receiving data stream from the monitoredsystem and applying the fault detection function on the incomingdata stream are done in the online phase using DSMS. However,updating the fault detection system can be done either offline or onlinebased on which fault detection methods and algorithm are used. Forinstance, PCA can be updated offline by rebuilding the PCA modelusing recent data. On the other hand, it can be updated online throughthe use of incremental PCA (IPCA) algorithm [42].
4. The data set
The example query developed and used in this paper concernedfault detection in air–oil cooler, part of a hydraulic drive system
Fig. 4. The architecture of the fault detection system.
A. Alzghoul et al. / Computers in Industry 65 (2014) 1126–11351130
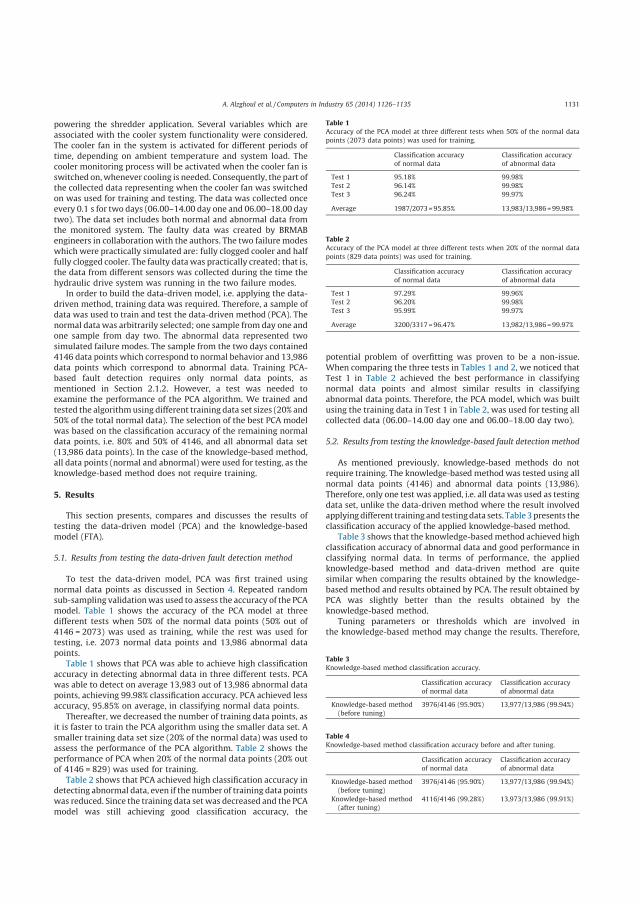
powering the shredder application. Several variables which areassociated with the cooler system functionality were considered.The cooler fan in the system is activated for different periods oftime, depending on ambient temperature and system load. Thecooler monitoring process will be activated when the cooler fan isswitched on, whenever cooling is needed. Consequently, the part ofthe collected data representing when the cooler fan was switchedon was used for training and testing. The data was collected onceevery 0.1 s for two days (06.00–14.00 day one and 06.00–18.00 daytwo). The data set includes both normal and abnormal data fromthe monitored system. The faulty data was created by BRMABengineers in collaboration with the authors. The two failure modeswhich were practically simulated are: fully clogged cooler and halffully clogged cooler. The faulty data was practically created; that is,the data from different sensors was collected during the time thehydraulic drive system was running in the two failure modes.
In order to build the data-driven model, i.e. applying the data-driven method, training data was required. Therefore, a sample ofdata was used to train and test the data-driven method (PCA). Thenormal data was arbitrarily selected; one sample from day one andone sample from day two. The abnormal data represented twosimulated failure modes. The sample from the two days contained4146 data points which correspond to normal behavior and 13,986data points which correspond to abnormal data. Training PCA-based fault detection requires only normal data points, asmentioned in Section 2.1.2. However, a test was needed toexamine the performance of the PCA algorithm. We trained andtested the algorithm using different training data set sizes (20% and50% of the total normal data). The selection of the best PCA modelwas based on the classification accuracy of the remaining normaldata points, i.e. 80% and 50% of 4146, and all abnormal data set(13,986 data points). In the case of the knowledge-based method,all data points (normal and abnormal) were used for testing, as theknowledge-based method does not require training.
5. Results
This section presents, compares and discusses the results oftesting the data-driven model (PCA) and the knowledge-basedmodel (FTA).
5.1. Results from testing the data-driven fault detection method
To test the data-driven model, PCA was first trained usingnormal data points as discussed in Section 4. Repeated randomsub-sampling validation was used to assess the accuracy of the PCAmodel. Table 1 shows the accuracy of the PCA model at threedifferent tests when 50% of the normal data points (50% out of4146 = 2073) was used as training, while the rest was used fortesting, i.e. 2073 normal data points and 13,986 abnormal datapoints.
Table 1 shows that PCA was able to achieve high classificationaccuracy in detecting abnormal data in three different tests. PCAwas able to detect on average 13,983 out of 13,986 abnormal datapoints, achieving 99.98% classification accuracy. PCA achieved lessaccuracy, 95.85% on average, in classifying normal data points.
Thereafter, we decreased the number of training data points, asit is faster to train the PCA algorithm using the smaller data set. Asmaller training data set size (20% of the normal data) was used toassess the performance of the PCA algorithm. Table 2 shows theperformance of PCA when 20% of the normal data points (20% outof 4146 = 829) was used for training.
Table 2 shows that PCA achieved high classification accuracy indetecting abnormal data, even if the number of training data pointswas reduced. Since the training data set was decreased and the PCAmodel was still achieving good classification accuracy, the
potential problem of overfitting was proven to be a non-issue.When comparing the three tests in Tables 1 and 2, we noticed thatTest 1 in Table 2 achieved the best performance in classifyingnormal data points and almost similar results in classifyingabnormal data points. Therefore, the PCA model, which was builtusing the training data in Test 1 in Table 2, was used for testing allcollected data (06.00–14.00 day one and 06.00–18.00 day two).
5.2. Results from testing the knowledge-based fault detection method
As mentioned previously, knowledge-based methods do notrequire training. The knowledge-based method was tested using allnormal data points (4146) and abnormal data points (13,986).Therefore, only one test was applied, i.e. all data was used as testingdata set, unlike the data-driven method where the result involvedapplying different training and testing data sets. Table 3 presents theclassification accuracy of the applied knowledge-based method.
Table 3 shows that the knowledge-based method achieved highclassification accuracy of abnormal data and good performance inclassifying normal data. In terms of performance, the appliedknowledge-based method and data-driven method are quitesimilar when comparing the results obtained by the knowledge-based method and results obtained by PCA. The result obtained byPCA was slightly better than the results obtained by theknowledge-based method.
Tuning parameters or thresholds which are involved inthe knowledge-based method may change the results. Therefore,
Table 1Accuracy of the PCA model at three different tests when 50% of the normal data
points (2073 data points) was used for training.
Classification accuracy
of normal data
Classification accuracy
of abnormal data
Test 1 95.18% 99.98%
Test 2 96.14% 99.98%
Test 3 96.24% 99.97%
Average 1987/2073 = 95.85% 13,983/13,986 = 99.98%
Table 2Accuracy of the PCA model at three different tests when 20% of the normal data
points (829 data points) was used for training.
Classification accuracy
of normal data
Classification accuracy
of abnormal data
Test 1 97.29% 99.96%
Test 2 96.20% 99.98%
Test 3 95.99% 99.97%
Average 3200/3317 = 96.47% 13,982/13,986 = 99.97%
Table 3Knowledge-based method classification accuracy.
Classification accuracy
of normal data
Classification accuracy
of abnormal data
Knowledge-based method
(before tuning)
3976/4146 (95.90%) 13,977/13,986 (99.94%)
Table 4Knowledge-based method classification accuracy before and after tuning.
Classification accuracy
of normal data
Classification accuracy
of abnormal data
Knowledge-based method
(before tuning)
3976/4146 (95.90%) 13,977/13,986 (99.94%)
Knowledge-based method
(after tuning)
4116/4146 (99.28%) 13,973/13,986 (99.91%)
A. Alzghoul et al. / Computers in Industry 65 (2014) 1126–1135 1131

the knowledge-based method was tested by trying differentthresholds. It was found that tuning the threshold increased theclassification accuracy of normal data points from 95.90% to 99.28%and slightly reduced the classification accuracy of abnormal datapoints from 99.94% to 99.91%, as shown in Table 4.
5.3. Investigating misclassified data
To improve the performance of both methods the misclassifieddata was investigated. It was found that the misclassified datacorresponded to the first few seconds after the cooler was switchedon. To overcome this problem, one can either skip the first fewseconds of data or make a condition that the system give an alertwhen faulty data is present for more than a specific period of time,e.g. faulty data occurring continuously for more than 60 s. Thesecond alternative was selected in this work where the timethreshold was 15 s. The second alternative is also useful foreliminating outliers, if they exist. A time threshold of 15 s will notaffect the system negatively, since it heats much slower than that,even during high power usage. Once the cooler fan switches on, thetemperature of the oil from the cooler reaches a steady-state valueafter some time. This time is dependent on the oil volume of thecooler and the oil flow passing through.
5.4. Results of testing all data
The final test was performed using the alert condition with timethreshold 15 s and using all collected data (data collected during twodays). Fault detection functions developed using knowledge-basedand data-driven methods were tested using the proposed faultdetection system illustrated in Fig. 4. It was found that both methodswere able to detect all faults without any false alert. Also, bothmethods were adequate to use online, i.e. they can be used to searchthe data stream, since they are faster than the arriving data stream.
6. Discussion
The developed models were tested using a data set containingboth faulty and non-faulty data points. The time when faultsappear as well as when faults disappear in the data set, are known(i.e. the data-label is known). Comparing the outputs from thedeveloped models with the pre-known data-label showedrelatively speaking, good accuracy, as shown in Section 5, thusverifying the developed models.
The results showed that both the knowledge-based and thedata-driven method achieved high classification accuracy andwere applicable for searching the data stream. However, throughliterature and based on development, testing and the results of
both methods, several differences were noticed. Table 5 shows asummary of these differences.
Rows 1–8 of Table 5 have been concluded (by the authors) to betrue. Whereas, row 9 i.e. Area of application, is based on theresearch by other researchers [6,7,44,45]. The results based on theBRMAB case, show the ability of both methods to query datastreams. Note that, the ability of the knowledge-based method to be
applied as queries, using a data stream management system to detect
faults in high volume data streams, has not been found extensively in
literature based on the authors review. Table 5 shows that buildingand updating data-driven models requires less time and cost thanbuilding and updating knowledge-based models, these findings arealso supported by other researchers in Refs. [6,43–45]. Forexample, Chiang et al. [6], Bratina et al. [45], and Das et al. [44]agree that data-driven methods are easy to develop and imple-ment. Data-driven methods have the ability to provide newinformation which may not be presented in knowledge-basedmethods, which are solely based on heuristic knowledge. Such newinformation may include new types of out-of-bounds data sets [8].Chih-Min and Yun-Pei [8] and Lou et al. [46] discussed that, insome situations, knowledge-based methods cannot find newfaults. The authors of this paper would agree with Chin-Min andYun-Pei that the cause and effect relations are of great importancefor creating the knowledge-based models. Data-driven methodscan be easily adapted to the changes in the monitored system, forexample, by using incremental principal component analysis(IPCA) instead of, or in conjunction with, PCA. According to Luoet al. [46], and supported by results as presented in this paper,incorporating a level of adaptiveness in a knowledge-basedmethod is harder to accomplish than in a data-driven method.
The accuracy of the data-driven methods (and the accuracy ofknowledge-based methods) depends on the applied algorithm;thus, the results may vary from one algorithm to another. Forexample, Alzghoul and Lofstrand [23] tested different datastream mining algorithms and the algorithms achieved differentresults. Building a data-driven model does not require specificengineering knowledge. However, data-driven models cannot bebuilt without data sets. According to Chiang et al. [6] and Chih-Min and Yun-Pei [8], and Das et al. [44], data-driven methodsneed only data and do not require deep knowledge about themonitored system.
On the other hand, knowledge-based methods achieved goodperformance in detecting pre-known faults as shown in this paperand discussed by Chiang et al. [6] and Chih-Min and Yun-Pei [8].Also, engineering knowledge can be used to build the faultdetection model without the need of a data set [8]. However, asshown in this work, sensor data can be used to improve theperformance of the fault detection model by, for example, tuningmodel parameters as it was shown in Section 5.2.
Table 5Comparison between knowledge-based and data-driven methods, results are based on literature and BRMAB case.
Knowledge-based method Data-driven method
Development cost High [43] Cheap [6,44,45]
Development time Long [43] Short [6,44,45]
Fault detection accuracy High [6,8] Based on the algorithm [23] and the quantity
and quality of data [6]
Adaptiveness Time and cost expensive
compared to the data-driven
method [46]
Based on [6,44,45], plausibly cheap and fast
Data set availability Not necessary [6,8] Necessary [6–8,44,47]
Speed and ability to query data streams High Generally high (depending on the algorithm) [23]
Ability to detect new information No [8,46] Yes [8]
Require deep system-specific knowledge Yes [6,8,47] No [6,8,44]
Area of application Can be used for both small
and large-scale systems using
software packages [6,7]
Can be used for both small and large-scale
systems [6,7,44,45]
A. Alzghoul et al. / Computers in Industry 65 (2014) 1126–11351132

Clearly, the quality of knowledge based methods in general isdependent on the validity and reliability on the informationfrom the industrial informants, which in these cases was verygood. One might conclude that any knowledge based methodwhen used is capable of correctly capturing the relevant
information from the informants, would likely generate compa-rable quality results. On the other hand, the performance of data-driven methods in general (in addition to the data-drivenmethods tested in Refs. [3,23] and in this paper), is based on thequality and the quantity of the collected data [6]. Also, theimpact of the input variables on the target affects theperformance of the data-driven methods. Furthermore, someof the data-driven methods such as support vector machine takethe advantage of using nonlinear kernels to map the data to avery high dimensional space. For example, it was shown in Ref.[23] that the one-class support vector machine outperformedthe polygon-based and grid-based methods because it maps thedata into a higher dimension.
Every fault detection technique has its own advantages anddisadvantages. Therefore, it could be beneficial to combinedifferent techniques to bring their advantages together. Forexample, one could achieve the advantages of knowledge-basedmethods in detecting known faults, and data-driven methodsfor detecting new faults, thereby achieving a better under-standing of the system by combining the two techniques. In anycase, we show that the accuracy of the knowledge-basedmethod is for all intents and purposes the same as that of thedata-driven method. This is likely because the interviewees andparticipating company partners have an exceptional systemunderstanding, and it may also be due to the chosen researchmethod. The high accuracy of the knowledge-based results islike due to:
� The hydraulic theory, on which the queries are based, was well-known for the authors.o However, to implement the theory correctly, good systemknowledge and experience are required
� BRMAB has exceptional system knowledge and experience, sincethe company has been in business over 100 years and theengineers in charge have worked over 30 years.
� The authors have some experience regarding hydraulictheory and furthermore, the research method was iterativein that many development and feedback loops were carriedout with researchers and industrial representatives collabo-ratively.
The data-driven accuracy is high since it is based on the PCAmodel which is sensitive to the abnormal behavior and had beensuccessfully applied in the monitoring of complex systems. Inaddition, the quality and quantity of the collected data was goodfor the authors to be able to produce a data-driven model with highperformance. (As previously stated, the performance of data-driven methods is based on the quality and the quantity of thecollected data [6].) In more detail, the data was ‘‘good’’ in the sensethat the authors were aware when, i.e. at what time stamp, thetechnical system was manipulated based on common faults like aclogged cooler, to create sensor data corresponding to such faults.Furthermore, the system manual from BRMAB states the permittedranges of oil temperatures for example, which is true for allrelevant variable ranges. In addition, the quantity of data used fortraining clearly was enough since the accuracy turned out to berelatively high (i.e. For example on average 99.97% for theabnormal data, see Table 2).
The results suggest that the developed models are applicable inmonitoring the cooler functionality of hydraulic drive systems. Theperformance of the developed models may also indicate a possible
success in monitoring other hydraulic drive functions and evenother product functions.
In general, it is plausible that the two compared approaches forfault detection can be used successfully in industry, when thefollowing conditions are met.
The knowledge-based method requires:
� sensor data to tune the knowledge-based model parameters� a known data-label for model verification (i.e. our knowledgeregarding when faults appear and disappear).
� good system knowledge (provided here by BRMAB personnel)� knowledge regarding normal and abnormal behavior among thevarious monitored system parameters
� that the technical system allow for formulating the continuousqueries (i.e. ‘‘rules’’); therefore, too complex systems may need tobe simplified
The data-driven method requires:
� a sample of sensor data (with a known data-label) for training� a sample of faulty data for verification and/or training� brief knowledge about the monitored system and most commonfaults that will give a good understanding of the achieved resultsand possibly increase the accuracy (for example, investigatingmisclassified data)
� a good implementation of the data-driven algorithm that mayaffect both speed and accuracy
The two verified models can be used to monitor industrialsystems online, thereby increasing availability and saving mainte-nance time and cost. The two verified models are useful formonitoring a fleet of units or a single high-value unit.
7. Conclusions
As discussed previously, increasing availability of products is ofgreat interest for industrial companies. Availability of industrialproducts can be improved by fault detection and diagnosis. Faultdetection and diagnosis methods can be divided into threecategories: data-driven, analytical-based, and knowledge-basedmethods.
In this work, monitoring cooler functionality of BRMABhydraulic drive systems was investigated. Two fault detectiontechniques, i.e. data-driven (PCA) and knowledge-based (FTA)methods, were designed, implemented and tested. The perfor-mance of the two methods and their ability to search the datastream were compared. Also, the advantages and disadvantages ofboth methods were discussed.
It was found that both methods achieved good performance indetecting faults (around 99% classification accuracy of abnormaldata) and both methods are fast enough to be used for querying thedata stream. The performance of the fault detection models wasimproved by investigating the misclassified data. Also, it wasshown that sensor data can be used to improve the performance ofthe knowledge-based method by tuning its model parameters.
The data-driven methods surpassed the knowledge-basedmethods in model development time and cost, they are easy toretrain and able to detect faults beyond the engineers’ knowledge.On the other hand, the knowledge-based models can be developedwithout sensor data and still achieve high accuracy in detectinghistorical faults, provided that they are based on accurate engineer(i.e. informant) knowledge. Hence, both approaches may, if theconditions discussed above are met, be used to predict and identifyfaults in hydraulic drive systems or comparable applications in use.In terms of the product development process, if the methods areused in the testing and refinement stage, their use may improve
A. Alzghoul et al. / Computers in Industry 65 (2014) 1126–1135 1133
the associated prototypes and may thereby improve the quality ofthe product at an earlier stage of development. Naturally, the twoapproaches may be used in the late stage of a product lifecycle toimprove the design of the next updated product version.
Acknowledgments
The authors wish to acknowledge the following three orga-nizations: The EU FP7 Project SmartVortex, The Faste Laboratory atLulea University of Technology funded by the Swedish Govern-mental Agency for Innovation Systems (VINNOVA: 2012-00705)and the SSPI project (Scalable search of product lifecycleinformation) funded by the Swedish Foundation for StrategicResearch (SSF: RIT08-0041).
References
[1] D.G. Ullman (Ed.), The Mechanical Design Process, 4th ed., McGraw-Hill Science,New York, 2010.
[2] I. Alsyouf, A. Alzghoul, Soft computing applications in wind power systems: areview and analysis, in: European Offshore Wind Conference and Exhibition,Stockholm, Sweden, 2009.
[3] A. Alzghoul, M. Lofstrand, B. Backe, Data stream forecasting for system faultprediction, Computers and Industrial Engineering 62 (4) (2012) 972–978.
[4] V. Venkatasubramanian, R. Rengaswamy, K. Yin, S.N. Kavuri, A review of processfault detection and diagnosis part I: quantitative model-based methods, Com-puters and Chemical Engineering 27 (3) (2003) 293–311.
[5] Y. Zhang, J. Jiang, Bibliographical review on reconfigurable fault-tolerant controlsystems, Annual Reviews in Control 32 (2) (2008) 229–252.
[6] L.H. Chiang, E. Russell, R.D. Braatz, Fault Detection and Diagnosis in IndustrialSystems, Springer Verlag, London, 2001.
[7] C. Sankavaram, B. Pattipati, A. Kodali, K. Pattipati, M. Azam, S. Kumar, M. Pecht,Model-based and data-driven prognosis of automotive and electronic systems, in:IEEE International Conference on Automation Science and Engineering, 2009.CASE 2009, 2009, 96–101.
[8] F. Chih-Min, L. Yun-Pei, A Bayesian framework to integrate knowledge-based anddata-driven inference tools for reliable yield diagnoses, in: Simulation Confer-ence, 2008. WSC 2008. Winter, 2008, 2323–2329.
[9] D. Zhu, S. Yu, Survey of knowledge-based fault diagnosis methods, Anhui GongyeDaxue Xuebao (Journal of Anhui University of Technology), 19 (3) (2002) 197–204.
[10] V. Venkatasubramanian, R. Rengaswamy, S.N. Kavuri, K. Yin, A review of processfault detection and diagnosis: part III: process history based methods, Computersand Chemical Engineering 27 (3) (2003) 327–346.
[11] J.B. Fussell, G.J. Powers, R.G. Bennetts, Fault trees – a state of the art discussion,IEEE Transactions on Reliability R-23 (1) (1974) 51–55.
[12] M.A. Schwabacher, A Survey of Data Driven Prognostics, AIAA Infotech@Aero-space, 2005.
[13] K. Pearson LIII, On lines and planes of closest fit to systems of points in space, TheLondon, Edinburgh, and Dublin Philosophical Magazine and Journal of Science 2(11) (1901) 559–572.
[14] S. Wold, C. Albano, W. Dunn III, U. Edlund, K. Esbensen, P. Geladi, S. Hellberg, E.Johansson, W. Lindberg, M. Sjostrom, Multivariate data analysis in chemistry, in:Chemometrics, Springer, 1984, pp. 17–95.
[15] W.S. McCulloch, W. Pitts, A logical calculus of the ideas immanent in nervousactivity, Bulletin of Mathematical Biophysics 5 (4) (1943) 115–133.
[16] T. Kohonen, Self-organized formation of topologically correct feature maps,Biological Cybernetics 43 (1) (1982) 59–69.
[17] B.V. Dasarathy, Nearest Neighbor ({NN}) Norms:{NN} Pattern ClassificationTechniques, 1991.
[18] T. Villegas, M.J. Fuente, M. Rodrıguez, Principal Component Analysis for FaultDetection and Diagnosis. Experience with a pilot plant, 2010, 147–152.
[19] Y. Tharrault, G. Mourot, J. Ragot, Fault Detection and Isolation with RobustPrincipal Component Analysis, 2008, 59–64.
[20] E.L. Russell, L.H. Chiang, R.D. Braatz, Fault detection in industrial processes usingcanonical variate analysis and dynamic principal component analysis, Chemo-metrics and Intelligent Laboratory Systems 51 (1) (2000) 81–93.
[21] J.V. Kresta, J.F. Macgregor, T.E. Marlin, Multivariate statistical monitoring ofprocess operating performance, The Canadian Journal of Chemical Engineering69 (1) (1991) 35–47.
[22] M. Piovoso, K. Kosanovich, R. Pearson, Monitoring process performance in real-time, IEEE (1992) 2359–2363.
[23] A. Alzghoul, M. Lofstrand, Increasing availability of industrial systems through datastream mining, Computers and Industrial Engineering 60 (2) (2011) 195–205.
[24] Data, data everywhere (a special report on managing information), The Economist2010.
[25] H. Kargupta, VEDAS: a mobile and distributed data stream mining system for real-time vehicle monitoring, in: SIAM Proceedings Series, 2004, pp. 300–311.
[26] S.C. Karacal, Mining machine data streams using statistical process monitoringtechniques, in: IIE Annual Conference and Expo, 2007, 1290–1297.
[27] B. Matthews, A.N. Srivastava, Comparative analysis of data-driven anomalydetection methods, in: JANNAF Conference on Propulsion Systems, Proceed-ings of the Joint Army Navy NASA Air Force Conference on Propulsion,Orlando, FL, 2008.
[28] A. Alzghoul, M. Lofstrand, L. Karlsson, M. Karlberg, Data stream mining forincreased functional product availability awareness, in: J. Hesselbach, C. Herr-mann (Eds.), Functional Thinking for Value Creation, Proceedings of the 3rd CIRPInternational Conference on Industrial Product Service Systems, TechnischeUniversitat Braunschweig, May 5th–6th, Springer Berlin Heidelberg, Braunsch-weig, Germany, 2011, pp.237–241.
[29] M. Lofstrand, B. Backe, P. Kyosti, J. Lindstrom, S. Reed, A model for predicting andmonitoring industrial system availability, International Journal of Product Devel-opment 16 (2) (2012) 140–157.
[30] Boschrexroth.com, (2014). Bosch Rexroth. The Drive & Control Company. - BoschRexroth AG. Available at: http://www.boschrexroth.com/ [Accessed Jun. 2014].
[31] M.Q. Patton, Qualitative Evaluation and Research Methods, Sage, London, UK,1990.
[32] M. Miles, M. Huberman, An Expanded Sourcebook – Qualitative Data Analysis,2nd ed., Sage, Thousand Oaks, CA, 1994.
[33] E. Zeitler, T. Risch, Using stream queries to measure communication performanceof a parallel computing environment, IEEE (2007) 65.
[34] E. Zeitler, T. Risch, Processing high-volume stream queries on a supercomputer,in: IEEE Proceedings of the 22nd International Conference on Data EngineeringWorkshops, 2006.
[35] R. Isermann, Fault-Diagnosis Applications Model-Based Condition Monitoring:Actuators, Drives, Machinery, Plants, Sensors, and Fault-tolerant Systems, Spring-er Berlin Heidelberg, Germany, 2011.
[36] R.K. Yin, Case Study Research, 4th ed., Sage publications, 2008.[37] M.B. Miles, A.M. Huberman, Qualitative Data Analysis: An Expanded Sourcebook,
2nd ed., SAGE Publications, Thousand Oaks, CA, 1994.[38] J.D. Andrews, T.R. Moss, Reliability and Risk Assessment, Professional Engineer-
ing Publishing Limited, Bury St Edmunds, 2002.[39] NUREG-0492, Fault Tree Handbook, Nuclear Regulatory Commission, Washing-
ton, 1981.[40] J. Hu, J. Si, B.P. Olson, J. He, Feature detection in motor cortical spikes by principal
component analysis, IEEE Transactions on Neural Systems and RehabilitationEngineering 13 (3) (2005) 256–262.
[41] D. Garcıa-Alvarez, Fault detection using Principal Component Analysis (PCA) in aWastewater Treatment Plant (WWTP), in: 62th Int. Student’s Scientific Conf.,Saint-Petersburg, 2009.
[42] H.V. Neto, U. Nehmzow, Incremental PCA: An Alternative Approach for NoveltyDetection, Towards Autonomous Robotic Systems, 2005.
[43] V. Uraikul, C.W. Chan, P. Tontiwachwuthikul, Artificial intelligence for monitoringand supervisory control of process systems, Engineering Applications of ArtificialIntelligence 20 (2) (2007) 115–131.
[44] A. Das, J. Maiti, R.N. Banerjee, Process monitoring and fault detection strategies: areview, International Journal of Quality and Reliability Management 29 (7) (2012)720–752.
[45] B. Bratina, N. Muskinja, B. Tovornik, Design of an Auto-associative Neural Networkby Using Design of Experiments Approach, Neural Computing and Applications 19(2) (2010) 207–218.
[46] J. Luo, S. Ghoshal, A. Mathur, K.R. Pattipati, Adaptive maintenance knowledgebases for field service, in: 2007 IEEE Aerospace Conference, Big Sky, MT, (2007),pp. 1–11.
[47] H. Wang, T.-Y. Chai, J.-L. Ding, M. Brown, Data driven fault diagnosis and faulttolerant control: some advances and possible new directions, Acta AutomaticaSinica 35 (6) (2009) 739–747.
Ahmad Alzghoul is currently a researcher at UppsalaUniversity, Department of Information Technology,Division of Computing Science. He has an educationalbackground in the field of computer science andengineering. He received a Ph.D. in Computer AidedDesign at Lulea University of Technology, Division ofProduct and Production Development, Sweden. Hereceived his M.Sc. degree in Computer Engineering(Intelligent Systems) from Halmstad University,Sweden, and his M.Sc. degree in Software Engineeringfrom Linnaeus University, Sweden. His main researchinterests include data mining and industrial datamining applications.
A. Alzghoul et al. / Computers in Industry 65 (2014) 1126–11351134
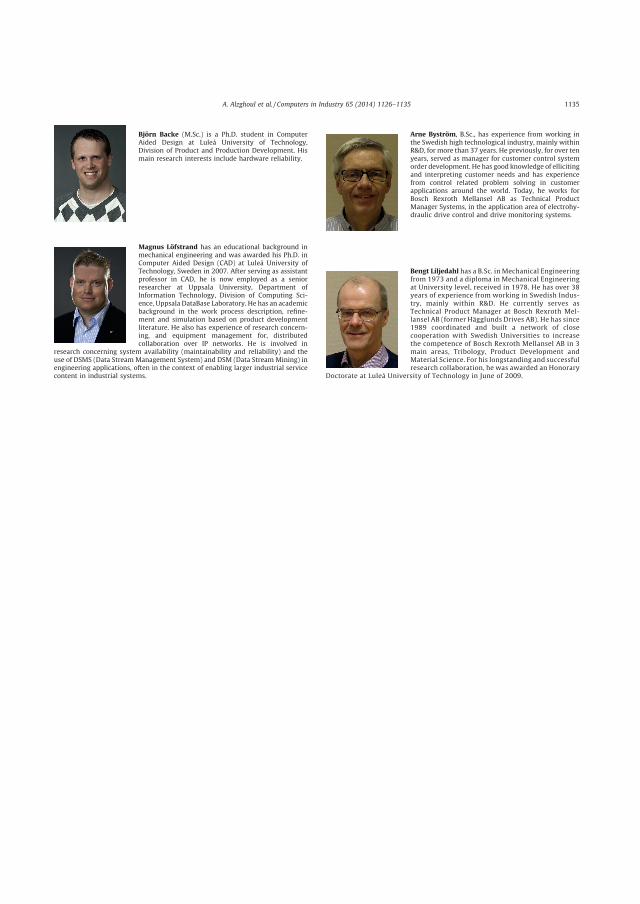
Bjorn Backe (M.Sc.) is a Ph.D. student in ComputerAided Design at Lulea University of Technology,Division of Product and Production Development. Hismain research interests include hardware reliability.
Magnus Lofstrand has an educational background inmechanical engineering and was awarded his Ph.D. inComputer Aided Design (CAD) at Lulea University ofTechnology, Sweden in 2007. After serving as assistantprofessor in CAD, he is now employed as a seniorresearcher at Uppsala University, Department ofInformation Technology, Division of Computing Sci-ence, Uppsala DataBase Laboratory. He has an academicbackground in the work process description, refine-ment and simulation based on product developmentliterature. He also has experience of research concern-ing, and equipment management for, distributedcollaboration over IP networks. He is involved in
research concerning system availability (maintainability and reliability) and theuse of DSMS (Data Stream Management System) and DSM (Data Stream Mining) inengineering applications, often in the context of enabling larger industrial servicecontent in industrial systems.
Arne Bystrom, B.Sc., has experience from working inthe Swedish high technological industry, mainly withinR&D, for more than 37 years. He previously, for over tenyears, served as manager for customer control systemorder development. He has good knowledge of ellicitingand interpreting customer needs and has experiencefrom control related problem solving in customerapplications around the world. Today, he works forBosch Rexroth Mellansel AB as Technical ProductManager Systems, in the application area of electrohy-draulic drive control and drive monitoring systems.
Bengt Liljedahl has a B.Sc. in Mechanical Engineeringfrom 1973 and a diploma in Mechanical Engineeringat University level, received in 1978. He has over 38years of experience from working in Swedish Indus-try, mainly within R&D. He currently serves asTechnical Product Manager at Bosch Rexroth Mel-lansel AB (former Hagglunds Drives AB). He has since1989 coordinated and built a network of closecooperation with Swedish Universities to increasethe competence of Bosch Rexroth Mellansel AB in 3main areas, Tribology, Product Development andMaterial Science. For his longstanding and successfulresearch collaboration, he was awarded an Honorary
Doctorate at Lulea University of Technology in June of 2009.
A. Alzghoul et al. / Computers in Industry 65 (2014) 1126–1135 1135

Paper E


The transition from component-based industry toward Functional
Products: implications for the demands on the monitoring and
information system.

Abstract
When transitioning to Functional Product (FP), which is a total care commitment,
the responsibilities for providing functionality shift to the provider, who must now
manage the risks within the enterprise. Retaining ownership of the functional product
entails a need for information, which includes applying an enterprise-wide perspective
and motivates the development of an information platform. No existing development
methodologies for FP and similar business concepts address monitoring and analytics
sufficiently. Therefore, literature relating to monitoring, functional products and similar
business models has been studied to conclude what current established methods suggest.
A table has been collocated, containing information categories relevant to the FP business
scenario. The table may be used as a basis to help providers of functional products to
more efficiently organize and develop the monitoring and analytical capabilities needed,
and as well as a basis for developing the information architecture and infrastructure
needed in the FP enterprise.
Keywords: monitoring; information; Functional Product Development; FP; Functional
Products; product development.
1. Introduction
1.1 Background
A trend among manufacturing companies in industry is to offer integrated
product-service solutions such as Functional Product (FP) (Alonso-Rasgado et al.,
2004). For the manufacturer, the reason to move toward product-service offers, such as
FP, is to stay competitive by diversifying their offers, adding uniqueness and thus
increasing the value of their offers. The advantages of FPs for the customer as compared
to traditional products are identified by Alonso-Rasgado and Thompson (2006) as
smooth cash flow, guaranteed level of availability, continuously updated equipment and
good equipment condition throughout the FP contract period. Isaksson et al., (2009)
argue that the main business arguments for both customers and providers of function
sales are: increased customer value, long-term return on investment and more stable

cash flow. FPs are integrated systems comprising Hardware (HW), Software (SW),
Service Support System (SSS) and Management of Operation (MO) (Lindström et al.,
2012b). In an FP business agreement, the function provider retains ownership of the
product and is fully responsible for providing the function according to agreed-upon
specifications (Alonso-Rasgado et al., 2004; Alonso-Rasgado and Thompson, 2006). An
offered function may be quantified in terms of technical performance measures for a
certain period of time and at a specified level of availability, e.g., turning a shaft at 20
rpm with a torque of 15 kNm at 95% availability annually. If the provider fails to
provide the function according to contractual agreements, financial penalties may be
incurred. This necessitates changes of current development practices to adapt to the new
business situation.
1.2 Functional Product Development
One of the earliest contributions to FP development is made by Alonso-Rasgado
et al., (2004), who state:
“In FP design, an integrated concept design process is required in which customer
aspirations, product potential and concept development should be explored
simultaneously.”
In Alonso –Rasgado and Thompson (2006) a novel design process for total-care
products that leads to the creation of the functional product has been proposed. In their
paper they assume that development of HW is already well documented and understood
in contrast to service design; therefor, they focus more on service development. In
Lindström et al., 2012b the definition of FP is extended to include MO.
The differences between a manufacturer´s traditional way of doing business
versus offering a business model such as FPs can be viewed from a lifecycle
perspective. Thereby it is possible to compare and identify and better understand what
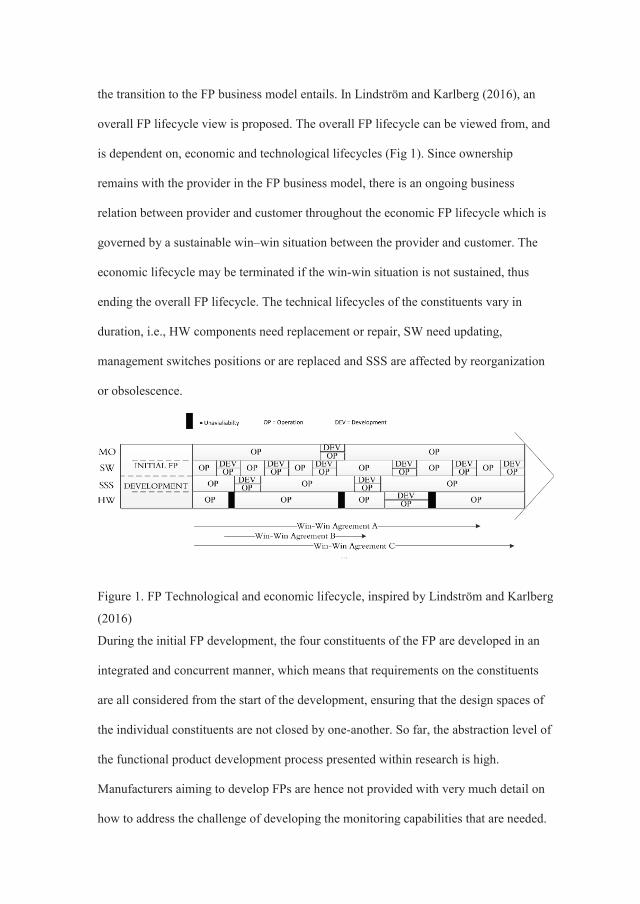
the transition to the FP business model entails. In Lindström and Karlberg (2016), an
overall FP lifecycle view is proposed. The overall FP lifecycle can be viewed from, and
is dependent on, economic and technological lifecycles (Fig 1). Since ownership
remains with the provider in the FP business model, there is an ongoing business
relation between provider and customer throughout the economic FP lifecycle which is
governed by a sustainable win–win situation between the provider and customer. The
economic lifecycle may be terminated if the win-win situation is not sustained, thus
ending the overall FP lifecycle. The technical lifecycles of the constituents vary in
duration, i.e., HW components need replacement or repair, SW need updating,
management switches positions or are replaced and SSS are affected by reorganization
or obsolescence.
Figure 1. FP Technological and economic lifecycle, inspired by Lindström and Karlberg
(2016)
During the initial FP development, the four constituents of the FP are developed in an
integrated and concurrent manner, which means that requirements on the constituents
are all considered from the start of the development, ensuring that the design spaces of
the individual constituents are not closed by one-another. So far, the abstraction level of
the functional product development process presented within research is high.
Manufacturers aiming to develop FPs are hence not provided with very much detail on
how to address the challenge of developing the monitoring capabilities that are needed.

1.3 Development challenges in Functional Product Development
In previous research related to FP development (FPD), several authors (Reim et al.,
2013; Löfstrand el al., 2011; 2012; Lindström et al., 2012a; 2012b) mention the need for
monitoring of the functional provision to mitigate risks. In Reim et al., (2013) risks for
functional products are assessed; they state that there is a behavioural risk that is related
to the fact that the customer no longer owns the HW, as they may be much more careful
when it is their own property. Predictable availability of function and associated cost are
also of key interest when providing FP (Löfstrand et al., 2011). In addition to securing
availability, the extended responsibility when offering FP requires further monitoring of
performance parameters to verify and record that the provision of function meets
specifications. As stated in Alonso-Rasgado et al., (2004); “Functional product
provision must include monitoring of quantitative performance measures that determine
whether the level of functional provision reaches, or exceeds, the levels specified in the
contractual agreement”. Clearly, monitoring capabilities can largely determine whether
a business case can be given a “go ahead”. As argued by Lindström et al., (2012a), this
is also one of the reasons why investigation of monitoring capabilities should be given
significant emphasis early in the FPD process. In Vasantha et al., (2012) a maturity
model is generated showing the relative maturity of various issues considered in eight
well-represented Product-Service System (PSS) design methodologies within literature.
One of their conclusions was that monitoring within these methodologies has not been
properly addressed. Thus, there is a gap in research concerning the development of
monitoring capabilities needed within these concepts. For companies increasing the
extent of services in their offerings, monitoring and analytics becomes an issue since, to
them, this is a completely new field of expertise that must be acquired in order to even
be able to realize more service-oriented offerings. Without support in terms of design
methodologies, or guidelines, it is difficult to envision the approach (process) and
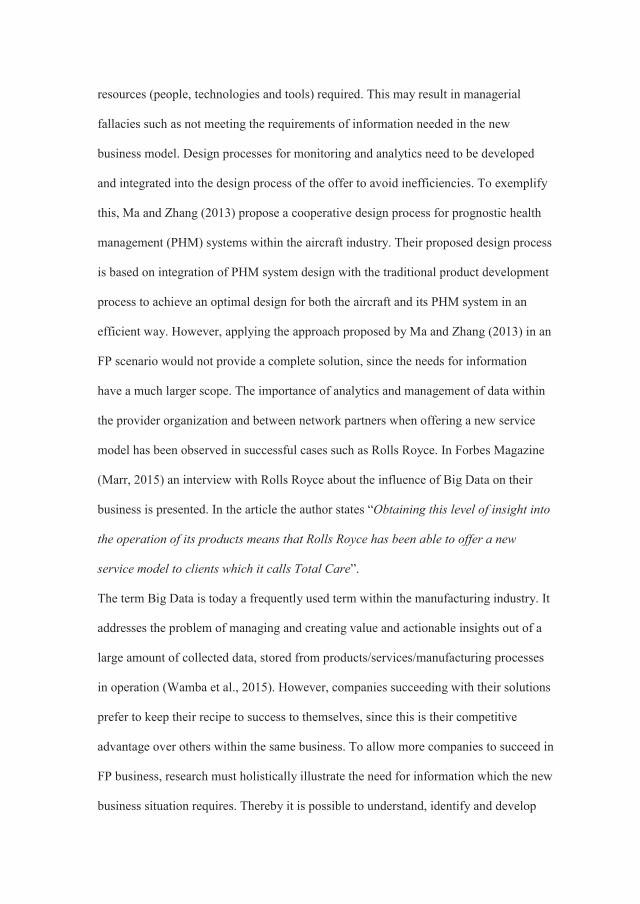
resources (people, technologies and tools) required. This may result in managerial
fallacies such as not meeting the requirements of information needed in the new
business model. Design processes for monitoring and analytics need to be developed
and integrated into the design process of the offer to avoid inefficiencies. To exemplify
this, Ma and Zhang (2013) propose a cooperative design process for prognostic health
management (PHM) systems within the aircraft industry. Their proposed design process
is based on integration of PHM system design with the traditional product development
process to achieve an optimal design for both the aircraft and its PHM system in an
efficient way. However, applying the approach proposed by Ma and Zhang (2013) in an
FP scenario would not provide a complete solution, since the needs for information
have a much larger scope. The importance of analytics and management of data within
the provider organization and between network partners when offering a new service
model has been observed in successful cases such as Rolls Royce. In Forbes Magazine
(Marr, 2015) an interview with Rolls Royce about the influence of Big Data on their
business is presented. In the article the author states “Obtaining this level of insight into
the operation of its products means that Rolls Royce has been able to offer a new
service model to clients which it calls Total Care”.
The term Big Data is today a frequently used term within the manufacturing industry. It
addresses the problem of managing and creating value and actionable insights out of a
large amount of collected data, stored from products/services/manufacturing processes
in operation (Wamba et al., 2015). However, companies succeeding with their solutions
prefer to keep their recipe to success to themselves, since this is their competitive
advantage over others within the same business. To allow more companies to succeed in
FP business, research must holistically illustrate the need for information which the new
business situation requires. Thereby it is possible to understand, identify and develop
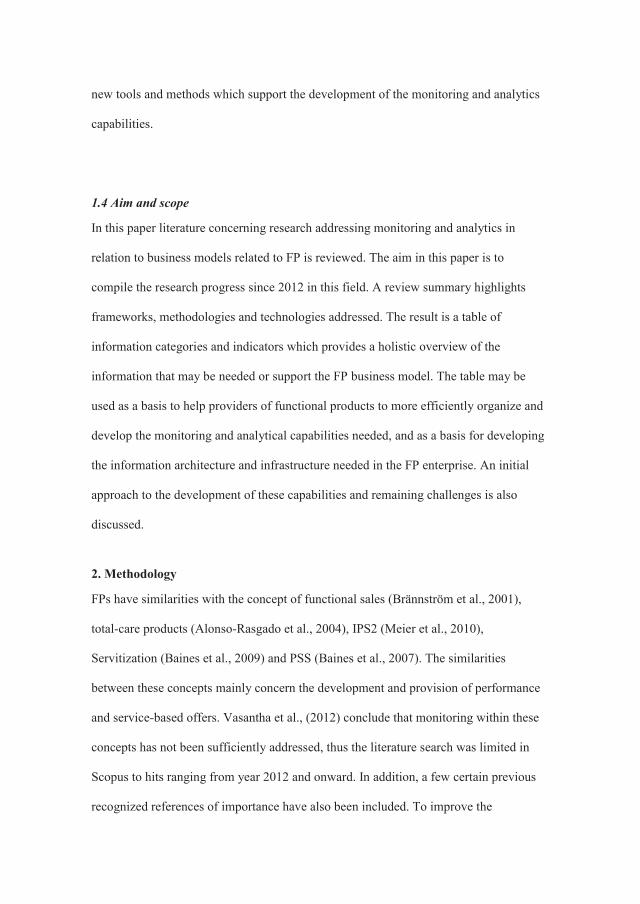
new tools and methods which support the development of the monitoring and analytics
capabilities.
1.4 Aim and scope
In this paper literature concerning research addressing monitoring and analytics in
relation to business models related to FP is reviewed. The aim in this paper is to
compile the research progress since 2012 in this field. A review summary highlights
frameworks, methodologies and technologies addressed. The result is a table of
information categories and indicators which provides a holistic overview of the
information that may be needed or support the FP business model. The table may be
used as a basis to help providers of functional products to more efficiently organize and
develop the monitoring and analytical capabilities needed, and as a basis for developing
the information architecture and infrastructure needed in the FP enterprise. An initial
approach to the development of these capabilities and remaining challenges is also
discussed.
2. Methodology
FPs have similarities with the concept of functional sales (Brännström et al., 2001),
total-care products (Alonso-Rasgado et al., 2004), IPS2 (Meier et al., 2010),
Servitization (Baines et al., 2009) and PSS (Baines et al., 2007). The similarities
between these concepts mainly concern the development and provision of performance
and service-based offers. Vasantha et al., (2012) conclude that monitoring within these
concepts has not been sufficiently addressed, thus the literature search was limited in
Scopus to hits ranging from year 2012 and onward. In addition, a few certain previous
recognized references of importance have also been included. To improve the
development situation for manufacturing companies aspiring to offer FP, the need for
information has to be clarified and understood. Understanding and clarifying the
development situation at the company is a basis for improving design process and final
design, as proposed in design research methodology (Blessing and Chakrabarti, 2009).
An improved monitoring and information perspective may serve as a basis for
companies in identifying and understanding the challenges inherent in transitioning
towards FP. To identify relevant contributions addressing monitoring and analytics, the
Scopus database has been searched using keywords such as the full name and
abbreviations of the above related concepts in combination with the keywords
Monitoring and Analytics. Initial searches identified a relatively large number of
publications which were narrowed down by screening their abstracts. Abstracts
mentioning or discussing monitoring and analytics were selected for further review. The
result of the literature search was sorted in a list and categorized under its related
keyword. To make the new information perspective comprehensible, matrices were
used to compile and categorize the findings according to different categories of
information.
3. Literature review
The following subchapters comprise a summary of the literature review performed.
Each subchapter contains a short summary of each contribution that has been registered
as a hit during searches that utilize keywords related to each subchapter area.
3.1 Servitization
In Grubic (2014), remote monitoring technology as support to enable the concept of
servitization is assessed. They reviewed literature addressing the intersection between
servitization and remote monitoring technology to identify the gaps in research

addressing this field. The author´s findings show that research addressing contribution
and role of remote monitoring technology within servitization strategies is limited and
only extends to a “handful of relevant contributions”. The application of remote
monitoring technologies addressed within servitization is mainly to assess the
performance and usage of a product. For the manufacturer, the key benefit of using
remote monitoring technology is that it enables improved performance, availability and
cost reductions. Monitoring technology also provides a basis for enabling further
learning and knowledge creation within R&D and gaining better insights into customer
behaviour. Further, they highlight challenges of using remote monitoring technology
which, they found, are related to cultural and business aspects rather than technology
issues. Another of their findings deals with the issue of diversity among terms used
when addressing remote monitoring technology applications within research.
In Aho and Uden (2014) a case company is studied and a model for developing
Big Data analytics to support improvement of services to their customers is proposed.
The model is based on the case-company business requirements, to align the
development of Big Data analytics. The case company cited in their paper intends to
offer performance monitoring in order to improve customer production. This service
requires analytics of customer usage and machine reliability, which are also the new
capabilities the case company needs to develop to offer the extended service. In Aho
(2015) a PDAS (product data analytics service) model is proposed. The model in Aho
(2015) is exemplified through a case study to show how the model can help companies
provide competitive services using Big Data. The contributions in Aho and Uden (2014)
and Aho(2015) are similar when comparing the descriptions of developing data
analytics. However, in Aho (2015) the approach to set up the new PSS organization,
including competencies and capabilities needed, is extended. Lee et al., (2014) present

challenges in the transformation towards more intelligent machines to enable companies
to provide more optimized product–services. They propose a cyber–physical framework
for self-aware and self-maintenance machines to predict machine health and improve
performance. By connecting a fleet of machines as a collaborative community, a
knowledge base can be built by collecting data from its peers. Thereby a Big Data
environment may be created which is otherwise missing in existing frameworks,
according to Lee et al., (2014). Furthermore, they propose that applying unsupervised
learning algorithms can create self-grown clusters that are utilized to determine the
health of the machine. The capability of the machine to self-maintain, i.e., assesses its
own degradation and adjust operational parameters to maximize productivity, reduces
cost, since the machine may avoid potential issues causing downtime. The self-
assessment information supports ERP systems to optimize maintenance scheduling,
manufacturing management and supply chain management. In Schuh et al., (2015) the
authors identified 10 success dimensions that may have impact on manufacturing firms’
degree of performance on either innovation capability or service excellence or both.
These dimensions concern the interaction (information exchange, data analytics,
training, etc.) between research and development departments and the service front-end.
Based on an empirical study through questionnaires, sent to service departments in the
German manufacturing industry, 5 of these dimensions indicated a strong positive
impact on service and innovation performance. These dimensions concern extent of
information quality, and involvement of integrated central product and service history
along with abilities such as the ability to generate product information for service
offerings based on engineering efforts, acquire information from service and ability to
integrate product and service information for training and qualification issues. They
suggest that their result could be used as guidance when developing the information
architecture appropriate for the PSS. In Opresnik and Taisch (2015) the authors argue
that the next step to further differentiate from competitors, but this time from servicing,
is to implement a Big Data strategy. In their paper they present a strategy framework for
Big Data within the context of servitization. Their framework consists of combined
strategies of both servitization and Big Data. One of their conclusions was that applying
their framework within servitization would generate new business opportunities such as
data reuse and data resell. Other value added by the Big Data strategy is the opportunity
for manufacturers to get insights into certain markets which, if reacted upon, may
provide competitive benefits compared to the offering of competitors.
3.2 Product-Service Systems – PSS
As support for offering PSS, Bindel et al., (2012) discuss lifecycle monitoring of
electronic products through embedded radio frequency identification devices (RFID) in
printed circuit boards (PCB). By embedding lifecycle-relevant information within the
PCB, access to information during the different stages of the lifecycle of the PSS is
enabled and could reduce and limit risks for the electronic manufacturers in PSS
businesses. Their approach concerns risk limitation within areas such as product quality,
reliability, logistics, recycling, secure product intelligence and monitoring usage
behaviour. Esperon-Miguez et al., (2012) present an approach to reduce uncertainty of
downtime and maintenance cost for components on a component, vehicle and fleet
level. Their approach builds upon cost benefit analysis (CBA) to evaluate what effects
different integrated vehicle health management (IVHM) tools have on the final
downtime and maintenance cost. The approach aims to assure a correct and cost-
effective implementation of IVHM tools into the PSS. A platform architecture for
supporting the provision of PSSs, which aim to monitor and manage biometric data
related to the health of the PSS users, is presented in Landolfi et al., (2014). In their
paper they emphasize the importance of provision of PSS in healthcare, as the PSS
concept may provide added value to the users which products, in and of themselves, do
not provide. The fields of application addressed in Landolfi et al., (2014) concern
offering PSSs within work-wear and sports-goods areas, in which the proposed platform
may increase the well-being of the users and thus increase their social sustainability.
Abdulkarim et al., (2015) and Abdulkarim and Ball (2015) present dynamic modelling
approaches using discrete event simulation to assess the impact of different levels of
asset monitoring on complex maintenance operations and availability. Instead of
promoting higher levels of asset monitoring as a means to achieve high availability
(which in their case study was not always the case), they show that through simulation it
is possible to assess the effect of higher levels of asset monitoring. The reasons for not
always achieving higher availability are due to different system constraints such as:
spares inventory, labour levels, travel time, etc. which impact maintenance operations.
Abramovici et al., (2014) propose a framework to assess and monitor sustainability
throughout the lifecycle of PSSs. Their approach takes into account the economic,
social and environmental aspects of sustainability and also the PSS specific
performance (for instance; availability, reuse of parts, service execution). They propose
a list of possible lifecycle indicators to be used within the framework to assess the
sustainability in different lifecycle phases. The lifecycle indicators are in every phase
calculated to have a quantified value to assess against. Some of the indicators defined
concern costs; development, implementation and operation. Other indicators mentioned
and quantified concern number of job opportunities, employee satisfaction, training of
personnel, CO2 emissions and energy consumption. To support the performance
assessment of PSSs during the use phase Wilberg et al., (2015) propose a generic
process for the implementation of performance measurement systems and also a process

for the development of key performance indicators to be able to manage the extended
responsibility and improve the performance in use and result-oriented PSSs. However,
they do not provide any specific insight or example into typical indicators needed in the
new business model compared to the company’s traditional business cases.
3.3 Industrial product service systems – IPS2
Monitoring is also highlighted in the related area IPS2. Meier et al., (2010) assert the
need for monitoring and its importance is noted in several roles, such as detecting and
verifying contract violations, and managing uncertainties of products, processes and
supply chains. A new method for monitoring IPS2 is proposed by Abramovici and Jin
(2011). The method includes the use of the balanced scorecard (BSC) method and
analytical hierarchical process (AHP) to ensure that the information needed by
executives to control and manage risks in IPS2 is provided. Utilization of the BSC
method provides a relatively wide perspective on different indicators that need to be
monitored. Selak et al., (2014) present a condition monitoring and fault diagnostics
system for hydropower plants. Their condition monitoring and fault detection system
(CMFD) aims to aid the service providers within an IPS2 with necessary input to enable
predictive and condition-based maintenance actions. Abramovici et al., (2011) present
an approach to lead feedback of product use information back to product development
to improve the design of follower product generations. In their papers their approach to
lead feedback back to product development is by means of a proposed feedback
assistant system that is based on two types of feedback: Subjective feedback, retrieved
through methods such as quality function deployment (QFD), Kano method or conjoint
analysis, and Objective feedback. The objective product use information that needs to
be generated, collected and analysed is of the type sensor, operation or service data. For
instance, data of the machine, sensor data of the environment, data generated by staff
and about the staff and, finally, quality parameters. Further, they discuss that when
going towards offering more service-oriented business models the feedback system may
be used to generate models such as availability-oriented business models. Abramovici et
al., (2013) proposed an indicator framework for decision-makers for monitoring of the
IPS2 use-oriented business model. In their paper three major aspects to be monitored
during the use phase are identified: IPS2 performance, IPS2 lifecycle cost and
influencing factors. These three aspects are further explained at a more detailed level in
the framework structure presented. In Schuh et al., (2011) a collaboration approach for
ISP2 is presented. Their web-based approach to collaboration includes services that
support the stakeholders within the value chain of the IPS2, primarily the tool owner,
toolmaker and part producer. Their collaboration platform includes features such as
providing processed performance information and cross-tool statistics. It also includes
maintenance and repair history and collaboration and communication support for the
toolmaker in order to manage sales of service and management of a global service
network. Their collaboration platform builds upon integration with sensor and database
technologies to enable the concept.
3.4 Functional Products and Functional Sales
In Löfstrand el al., 2012 a model for predicting and monitoring industrial system
availability was proposed. To enable simulation and prediction of system availability,
the integrated model constituents consist of HW structure modelling through FTA,
service support modelling through block diagram representation and Petri Net
modelling and monitoring through utilizing a data stream management system and data
stream mining on industrial HW sensor data during operation.
In Lindström et al. (2012a) a table of information that must be shared during the
development of the FP is presented. Lindström et al. (2012a) propose the table to be

used “to update existing development processes and methods used, adding missing
information to share while considering what needs to be changed when adapting to FP
development”. The table shows where in the development process of FPs information
items need to be shared. In Lindström et al., (2012a) it is stated:
“Thus, the cost and risk to use FPs at remote unconnected sites need to be
considered and if the cost and risk are too large, a lower availability level may need to
be offered at a higher price to compensate for an overall higher risk taken by the
provider”.
In Alonso-Rasgado et al., (2004) it is stated that:
“Condition monitoring should also include performance data, not just failure data.
Knowledge of equipment performance parameters (e.g., torques, pressure, flow rates,
etc.) is important intellectual property that will enable equipment to be designed and/or
selected economically in future applications”. Alonso- Rasgado et al., (2004) further
argue that monitoring the performance of services should be applied, that is, to
continuously monitoring “parameters to identify whether a performance is approaching
a limit of acceptability. The parameters monitored may not be actual ‘delivered
services’, but subtle condition monitors may be cost-effectively monitored to identify the
condition of the service. For example, the stress levels experienced by personnel or
absentee rates may be condition monitoring parameters for services”.
4. Information and monitoring perspective in IPS2, PSS, FP, Functional sales
and Servitization
The extended commitment which traditional product manufacturers face when
transitioning towards offering FPs, requires substantial changes and adaptation of their
own design processes, development of new processes, methodologies and techniques.
Generally, they emphasize the need to be better informed about details of the offer to

manage risk and uncertainty occurring, both during beginning of life (BOL), middle of
life (MOL) and end of life (EOL) in the new business scenario. Thus, offering
Functional Products likely requires setting up a new information strategy within the
enterprise to manage this need. The challenge of developing the capabilities needed
differs between manufacturers and the enterprise and mainly depends on the maturity
and previous monitoring and information strategy adopted by the company. During the
entire lifecycle of the functional product, monitoring and analytics plays an important
role in delivering data and information to various sources within the enterprise of the
functional product.
As mentioned in section 2, research in FP and areas related to FP, such as Servitization,
PSS, IPS2 and functional sales, has been reviewed to identify and provide, on a high
level, a comprehensive view of the information need when offering business models
similar to FPs. The result of this review is compiled in Table 1.
Table 1. Categories of information.
Information categories
Sub-categories Indicators References
{1} Hardware and Service quality
FP Contract
Availability
Performance of function
-Service performance
-Product performance
Service reliability
Service assurance
Hardware reliability
-failure management
-condition monitoring
-machine learning
Speed, torque, pressure, temperatures, Time for service completion compared to planned, employee stress levels, Failure rates, reaction/lead times,
Alonso-Rasgado et al., 2004 Abramovici et al., 2013
Abramovici and Jin, 2011
Löfstrand et al., 2012
Gunasekaran et al., 2001
Grubic 2014
Aho & Uden, 2014
Aho, 2015
Selak et al., 2014
Lee et al., 2014
Esperon-Miguez et al., 2012
Abdulkarim et al., 2015
Abdulkarim & Ball, 2015
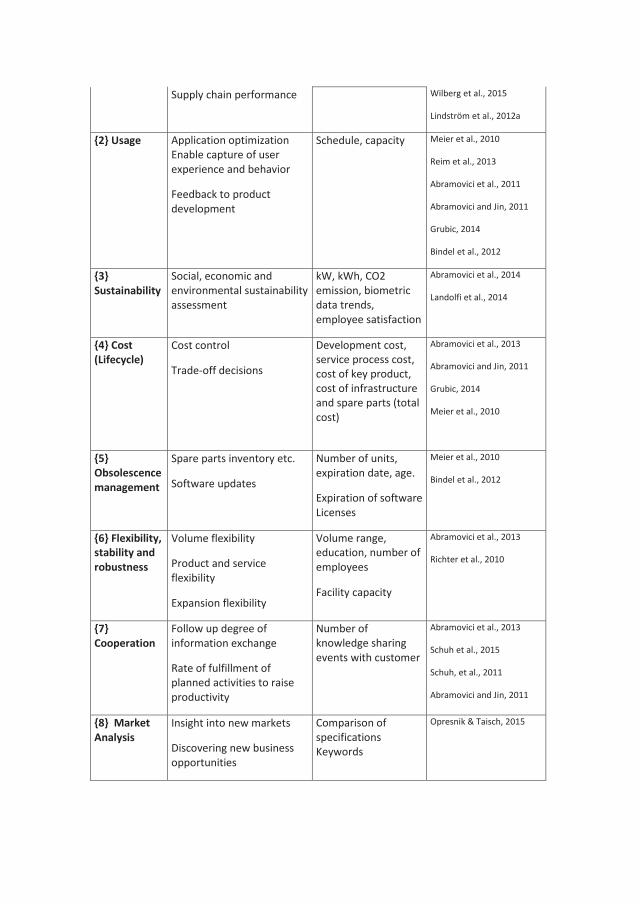
Supply chain performance Wilberg et al., 2015
Lindström et al., 2012a
{2} Usage Application optimization Enable capture of user experience and behavior
Feedback to product development
Schedule, capacity Meier et al., 2010
Reim et al., 2013
Abramovici et al., 2011
Abramovici and Jin, 2011
Grubic, 2014
Bindel et al., 2012
{3} Sustainability
Social, economic and environmental sustainability assessment
kW, kWh, CO2 emission, biometric data trends, employee satisfaction
Abramovici et al., 2014
Landolfi et al., 2014
{4} Cost (Lifecycle)
Cost control
Trade-off decisions
Development cost, service process cost, cost of key product, cost of infrastructure and spare parts (total cost)
Abramovici et al., 2013
Abramovici and Jin, 2011
Grubic, 2014
Meier et al., 2010
{5} Obsolescence management
Spare parts inventory etc.
Software updates
Number of units, expiration date, age.
Expiration of software Licenses
Meier et al., 2010
Bindel et al., 2012
{6} Flexibility, stability and robustness
Volume flexibility
Product and service flexibility
Expansion flexibility
Volume range, education, number of employees
Facility capacity
Abramovici et al., 2013
Richter et al., 2010
{7} Cooperation
Follow up degree of information exchange
Rate of fulfillment of planned activities to raise productivity
Number of knowledge sharing events with customer
Abramovici et al., 2013
Schuh et al., 2015
Schuh, et al., 2011
Abramovici and Jin, 2011
{8} Market Analysis
Insight into new markets
Discovering new business opportunities
Comparison of specifications Keywords
Opresnik & Taisch, 2015

Table 1 is the author´s interpretation and categorization of information and monitoring
aspects that have been highlighted in the literature reviewed. Dimensions of quality
(Bergman and Klefsjö, 2010) have been used to support the categorization of
information. Table 1 includes several examples of information categories and indicators
for monitoring considered necessary or supporting the success of business in concepts
similar to FP. The collocation in Table 1 is one way to visualize the information
perspective, showing a range of information categories that the FP provider
organization may need to manage. When addressing monitoring of FPs, the term
monitoring does not only include reading values from sensors on which required
analysis is performed. Data and information, usually manually stored within company
databases such as ERP, PLM or CMMS systems, also need to be collected. The data and
information required to offer FP may exist within the enterprise and must be
coordinated and managed by the provider properly to be efficiently utilized for analysis
together with sensor data.
5. Discussion
5.1 The FP information perspective
In this chapter we discuss in more detail the need and content of the different
information categories in FP business compiled in Table 1. In the FP business scenario,
the ownership is usually not transferred, this creates the incentive to monitor and
analyse the enterprise’s own processes of development, manufacturing and maintenance
in order to further optimize and increase the efficiency and maximize revenue of the
total offer. Hence, the new business situation pushes the enterprise to be information–
centric. For the provider the absence of transfer of ownership to the customer induces
greater responsibilities and guaranties compared to a sold HW component.

In the most traditional sense, HW and service quality {1} is utilized to verify whether an
offer is performing according to contractual specifications, i.e., reliability, availability
and performance measures such as speed, torque, pressure and so on. One of the topics,
closely related to better product performance through better maintenance, is condition
monitoring. Condition monitoring is used for keeping track of and predicting reliability
of HW, which in most cases will affect the availability of a component, system or
process. To manage technical performance risk in the offer, a predictive maintenance
strategy such as condition-based maintenance or Prognostic Health Management is
needed. The level of predictive maintenance which is possible to achieve depends on
the available information and on analysis methods, i.e., how well failures can be
predicted. When failures are more predictable, the efficiency and quality of the
maintenance of the FP can be improved, which may result in reduced maintenance costs
and increased availability. Along with condition monitoring, machine learning strategies
can be utilized. In this approach, machines are connected as a collaborative community
which can be systematically analysed to process data into information. This can increase
availability and decrease service cost on a fleet level. In the functional provision case,
the service commitments are evaluated, since service becomes a cost to the provider. In
the transition to FP the new incentives increase the motivation to optimize maintenance
for lower cost. Continuous monitoring e.g., service completion times, stress levels
experienced by personnel such as service occupancy and absentee rates, provides
performance measures for the service delivered. To increase service quality, gaps in the
alignment between customer expectation, management observation, service
specification document and service performance may be avoided by providing feedback
through monitoring that may be used to confirm the success of the service process.
Hence, the effective management of inventory in a supply chain becomes increasingly
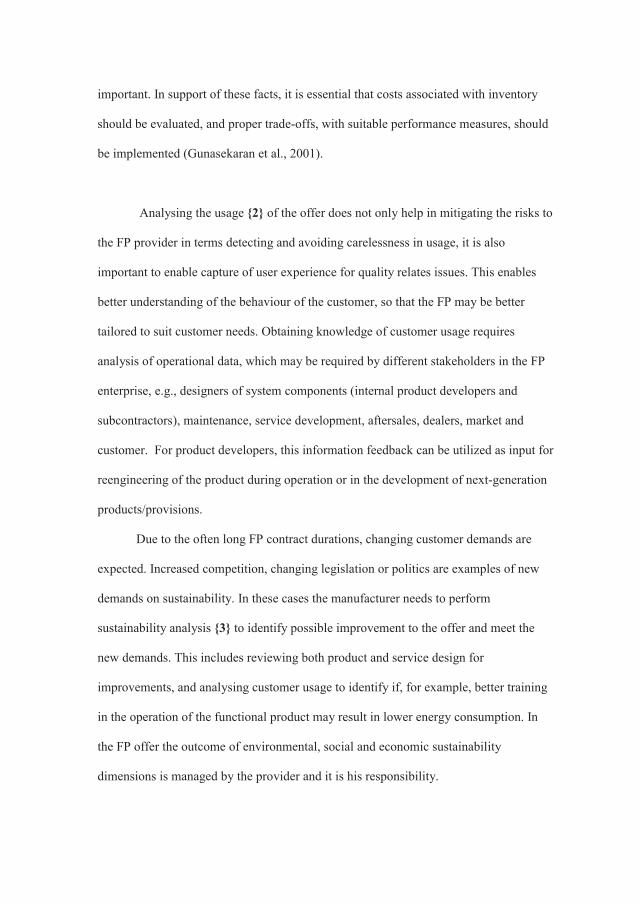
important. In support of these facts, it is essential that costs associated with inventory
should be evaluated, and proper trade-offs, with suitable performance measures, should
be implemented (Gunasekaran et al., 2001).
Analysing the usage {2} of the offer does not only help in mitigating the risks to
the FP provider in terms detecting and avoiding carelessness in usage, it is also
important to enable capture of user experience for quality relates issues. This enables
better understanding of the behaviour of the customer, so that the FP may be better
tailored to suit customer needs. Obtaining knowledge of customer usage requires
analysis of operational data, which may be required by different stakeholders in the FP
enterprise, e.g., designers of system components (internal product developers and
subcontractors), maintenance, service development, aftersales, dealers, market and
customer. For product developers, this information feedback can be utilized as input for
reengineering of the product during operation or in the development of next-generation
products/provisions.
Due to the often long FP contract durations, changing customer demands are
expected. Increased competition, changing legislation or politics are examples of new
demands on sustainability. In these cases the manufacturer needs to perform
sustainability analysis {3} to identify possible improvement to the offer and meet the
new demands. This includes reviewing both product and service design for
improvements, and analysing customer usage to identify if, for example, better training
in the operation of the functional product may result in lower energy consumption. In
the FP offer the outcome of environmental, social and economic sustainability
dimensions is managed by the provider and it is his responsibility.

The lifecycle cost {4} of an industrial system must be ascertained from systematic
modelling and simulation of the system through a concurrent engineering approach;
meaning that all constituents must be included, since the FP comprises HW, SW, SSS
and MO. Since the lifecycle cost of the FP offer is complex to estimate, a modelling and
simulation approach can be utilized to facilitate feasibility assessment when prototyping
complete offers. To approximate FP lifecycle cost the model needs to include costs for:
development, key product, service processes, infrastructure, spare parts and recycling.
When providing functional products, monitoring is critical to the measurement and
assessment of the effectiveness and efficiency of the provision i.e., the sustainability
and potential of the holistic provision of function. To avoid a win-lose relation, the
resulting lifecycle cost must be continuously monitored and evaluated to confirm that
the accumulated cost does not deviate excessively from the predicted cost. Proactive
monitoring for supporting obsolescence management {5} is required to timely identify
any obsolescence risks, such as checking for updated spare parts inventory, SW updates,
or competence levels (certificates, etc.) and knowledge possessed by employees.
In order to sustain the win-win relation between customer and provider in FP,
flexibility {6} needs to be considered and incorporated in early design. Modularization
and incomplete contracts are discussed by Richter et al., (2010) as enablers to flexibility
in terms of increasing possibilities to react to future changes. An incomplete contract
means that a certain leeway is allowed for the provider to optimize the delivery and will
do so given the right incentives. Measures of flexibility should be considered both in the
short and long term. Measures of short-term flexibility may be the degree of the
product’s ability to operate at higher or lower production levels when required. The
product’s long-term flexibility is the ability to adapt to changing customer requirements
during the whole use phase, which is partly dependent on the service performance.

When customer requirements change, service carries out the necessary modifications to
suit the new production requirements. Measuring and analysing the usage and behaviour
of the customer helps in understanding and determining what parts of the offer to
improve, and where future flexibility may be needed to be built into existing design, or
for the next product generation.
During operation the amount and quality of cooperation {7} between the customer and
the provider is important. The number of knowledge sharing events in terms of training
and education opportunities maybe monitored, evaluated and utilized as an indicator to
assess the quality of cooperation. In early phases of development quality of cooperation
is vital. Trust needs to be established between actors in the value chain and customer,
since trust may be a decisive factor determining whether to engage in FP business or
not. Thus, monitoring the level and quality of cooperation is both a quantitative and
qualitative (objective and subjective) measure in addition to counting the events of
cooperation, qualitative assessments, such as interviews and/or questionnaires, needed
to be performed to catch the customer’s subjective perception of the cooperation
quality. Market analysis {8} is important for competitive reasons. By being well
informed of competitors´ offers, identification of differentiating strengths, weaknesses
and finding areas of improvement are made possible. Market analysis can be performed
in a wider perspective by utilizing, for example, a Big Data approach. The stored and
analyzed data may provide new opportunities; data stored from customers regarding
behavior etc., becomes an asset to the provider and can be reused or even sold, thereby
creating a new revenue stream.
5.2 Development coordination
It is evident that a variety of different analysis methods may be required to develop the
capability needed to produce the information presented in Table 1. This creates a more

complex development situation. To properly develop the capabilities that are needed to
support management and development, within the enterprise of the FP, identification of
new skills, competencies, collaborations, work practices, technology and methodologies
is required. Each information category requires application of different techniques or
methodologies to guide the development. All of the reviewed publications partly
address the topic of monitoring and analytics and the value of doing this. However,
none of the papers reviewed address the development challenge holistically to suit the
FP business situation.
Considering the maturity of methodologies for developing PSS highlighted in Vasantha
et al., (2012), we see that there is still a lack of support within these methodologies in
terms of how to resolve the information need occurring in the transition to an FP or
similar business model. One big hurdle, confusing the discourse in this research area, is
the vast amount of diversity of terminologies. Grubic (2014) also highlighted this issue
when reviewing remote monitoring technologies in servitized strategies. Grubic (2014)
mention notions other than remote monitoring technologies such as: new digital
technology, remote diagnostics, tele services, diagnostics and prognostics and smart
services as related concepts but with a different terminology. In the review in this paper
a variety of concepts has also been encountered, such as: Big data, Internet of Things,
condition monitoring, cyber-physical systems, machine learning, prognostic health
management, etc. Thus, to facilitate development efforts, the understanding of these
terminologies addressing the information need in the FP business model needs to be
understood.
5.2.1 The need for an FP Information Architecture
To ensure that the monitoring capabilities and information needed are included in the
development of the functional product, it is important to compile the data and

information requirements as early as possible. In prognostic health management design,
Ma and Zhang (2013) argue that omitting the data and information requirements of the
monitoring system from the beginning of the development will produce a suboptimal
add-on design solution wherein the monitoring system suffers restrictions and will not
become properly integrated. Preconditions for monitoring should be investigated to
ascertain whether the requirements from different stakeholders can be fulfilled. As
Lindström et al. (2012b) assert, availability requirements, geographic situation,
telecommunications and logistic concerns need to be considered to clarify to what
extent a predictive maintenance strategy is possible to adopt. The preconditions,
requirements and predicted monitoring capabilities may be decisive factors determining
whether a FP business case can be given a “go ahead”. In IPS2, Abramovici et al.,
(2013) point out the importance of developing key performance indicators for
management in order to control the offer. Risks need to be uncovered, scrutinized and
quantified to secure those parts of the offer that may need special attention. The
responsibility of managing the risks inherent in the offer may be assigned to different
stakeholders within the enterprise, depending on the configuration of the value chain.
Information during the lifecycle of the FP needs to be made available in many parts of
the enterprise to manage and mitigate risks. The management, responsible for the
development of the FP, is required to coordinate and prioritize the development efforts
in developing the monitoring analytical capability. Management must perform need-
finding to reveal the information requirements within the enterprise and towards its
customers. To meet the information requirements, the approach in FP development
should involve holistically addressing the complete FP information architecture and
infrastructure.

7. Conclusion
The keywords utilized in this literature search provided a range of publications
which address monitoring and analytics in relation to FP and concepts similar to FP. As
pointed out by Grubic (2014), there is a great deal of diversity in terminology used
when addressing monitoring, which was also encountered in this study. The additional
terminologies found could be used as keywords to further extend the holistic view of
monitoring and information presented.
Development methodologies and frameworks found during the review in this
paper only emphasize parts of the multi-layered problem of securing the information
needed for provision of function. To enable a better basis for the strategic decision as to
how to manage the development of the monitoring and information system, Table 1 can
be utilized by the FP provider to identify the discrepancy between their current
monitoring and analysis capabilities and future need. The findings presented in this
paper may also provide an objective view when prioritizing what information is needed
to reduce risk and fulfil business goals. By involving the stakeholders of information in
early development phases, challenges such as integration issues may be avoided and a
more effective information platform may be created, which benefits and enables the
development of FP.


References
Alabdulkarim, A. A., Ball, P. and Tiwari, A. (2015) ‘Assessing asset monitoring levels
for maintenance operations: A simulation approach’, Journal of Manufacturing
Technology Management, Vol. 26 No.5, pp.632-659
Alabdulkarim, A. A. and Ball, P. D. (2015) ’Selecting the appropriate product
monitoring levels for maintenance operations: A simulation approach’, Paper
presented at the Proceedings - Winter Simulation Conference, Vol. 2015,
pp.1026 - 1037
Abramovici, M. and Jin, F. (2011) ‘A new method for monitoring industrial product-
service systems based on BSC and AHP’, ICEIS 2011 - Proceedings of the 13th
International Conference on Enterprise Information Systems, Vol. 1, pp.190-196
Abramovici, M., Lindner, A., Walde, F., Fathi, M. and Dienst, S. (2011) ‘Decision
support for improving the design of hydraulic systems by leading feedback into
product development’, Paper presented at the ICED 11 - 18th International
Conference on Engineering Design - Impacting Society through Engineering
Design, Vol. 9, No. 1, pp.1-10
Abramovici, M., Jin, F. and Dang, H. B. (2013) ‘An indicator framework for monitoring
IPS² in the use phase’, Product-Service Integration for Sustainable Solutions,
pp.311-322. Springer Berlin Heidelberg
Abramovici, M., Aidi, Y., Quczada, A. and Schindler, T. (2014) ‘PSS sustainability
assessment and monitoring framework (PSS-SAM) - case study of a multi-
module PSS solution’, Paper presented at the 6th CIRP Conference on Industrial
Product Service Systems, IPSS 2014, Vol. 16, pp.140-145
Aho, A. (2015) ‘Product data analytics service model for manufacturing company’,
Lecture Notes in Business Information Processing, Vol. 224, pp. 282-296

Aho, A. and Uden, L. (2014) ‘Developing data analytics to improve services in a
mechanical engineering company’, Lecture Notes in Business Information
Processing. 9th International Conference on Knowledge Management in
Organizations, KMO 2014, Vol. 185, pp.99-107
Alonso-Rasgado, T., Thompson, G. and. Elfström, B-O. (2004) ‘The design of
functional (total care) products’, Journal of Engineering Design, Vol. 15 No. 6,
pp. 515-540
Alonso-Rasgado, T. and Thompson, G. (2006) ‘A rapid design process for Total Care
Product creation’, Journal of Engineering Design, Vol.17 No.6, pp. 509-531
Baines, T. S., Lightfoot, H.W., Evans, S. Neely, A., Greenough, R., Peppard, J., Roy,
R., Shehab, E., Braganza, A., Tiwari, A., Alcock, J.R., Angus, J.P., Bastl, M.,
Cousens, A., Irving, P., Johnson, M., Kingston, J. Lockett, H., Martinez, V.,
Michele, P., Tranfield, D., Walton, I.M., Wilson, H. (2007) ‘State-of-the-art in
product-service systems’, Proceedings of the Institution of Mechanical
Engineers. Part B, Journal of engineering manufacture, Vol. 221 No. 10, pp.
1543-1552
Baines, T.S., Lightfoot, H.W., Benedettini, O. and Kay, J.M. (2009) ‘The servitization
of manufacturing’, Journal of Manufacturing Technology Management, Vol. 20,
No.5, pp. 547–567
Bergman, B. and Klefsjö, B. (2010) Quality from customer needs to customer
satisfaction, Studentlitteratur.
Bindel, A., Rosamond, E., Conway, P. and West, A. (2012) ‘Product life cycle
information management in the electronics supply chain’, Proceedings of the
Institution of Mechanical Engineers, Part B: Journal of Engineering
Manufacture, Vol. 226 No. 8, pp.1388-1400
Blessing, L.T., and Chakrabarti, A. (2009) DRM: A Design Research Methodology,
Springer London
Brännström, O., Elfström, B-O. and Thompson, G. (2001) ‘Functional Products create
new demands on Product Development Organisations’, Proceedings of
International Conference on Engineering Design, Glasgow, Scotland, Aug 21-
23
Esperon-Miguez, M., John, P. and Jennions, I. K. (2012) ‘Downtime uncertainty
reduction through the correct implementation of health monitoring tools’, Paper
presented at the IET Conference Publications, Vol. 2012 No. 609
Grubic, T. (2014) ‘Servitization and remote monitoring technology: A literature review
and research agenda’, Journal of Manufacturing Technology Management, Vol.
25 No.1, pp. 100-124
Gunasekaran, A., Patel, C. and Tirtiroglu, E. (2001)’Performance measures and metrics
in a supply chain environment’, International Journal of Operations &
Production Management, Vol. 21 No.1, pp. 71 – 87
Isaksson, O., Larsson, T. C., and Rönnbäck, A. Ö. (2009) ‘Development of product-
service systems: challenges and opportunities for the manufacturing firm’
Journal of Engineering Design, Vol. 20 No. 4, pp. 329-348
Landolfi, G., Alge, M., Bettoni, A., Canetta, L., Pedrazzoli, P. and Corti, D. (2014)
‘Platform architecture empowering health and safe product service systems for
specific target groups’, Paper presented at the 24th CIRP Design Conference
2014, Vol. 21, pp.117-122
Lee, J., Kao, H. and Yang, S. (2014) ‘Service innovation and smart analytics for
industry 4.0 and big data environment’, Paper presented at the 6th CIRP
Conference on Industrial Product Service Systems, IPSS 2014, Vol. 16, pp.3-8
Lindström, J. and Karlberg, M. (2016) ‘Outlining an overall Functional Product
lifecycle – Combining and coordinating its economic and technical
perspectives’, CIRP Journal of Manufacturing Science and Technology, [online]

http://www.sciencedirect.com/science/article/pii/S1755581710000611
(Accessed 8 december 2016)
Lindström, J., Löfstrand, M., Karlberg, M. and Karlsson, L. (2012a) ‘Functional
product development: what information should be shared during the
development process?’, International Journal of Product Development, Vol. 16
No. 2, pp.95-111
Lindström, J., Löfstrand, M., Karlberg, M. and Karlsson, L. (2012b) ‘A development
process for Functional Products: hardware, software, service support system and
management of operation’, International Journal of Product Development, Vol.
16 No. 3, pp.284-303
Löfstrand, M., Andrews, J., Karlberg, M. and Karlsson, L. (2011) ‘Functional product
system availability: simulation driven design and operation through coupled
multi-objective optimization’, International Journal of Product Development,
Vol. 13 No. 2, pp.119-131
Löfstrand, M., Backe, B., Kyösti,P., Lindström, J. and Reed, S. (2012) ‘A model for
predicting and monitoring industrial system availability’, International Journal
of Product Development ,Vol. 16 No. 2, pp.140-157
Ma, Y. and Zhang, Y. (2013) ‘PHM design based on cooperative design’, Chemical
Engineering Transactions, Vol. 33, pp.217-222
Marr, B. (2015) ‘How Big Data Drives Success At Rolls-Royce’, Forbes Magazine
[online] http://www.forbes.com/sites/bernardmarr/2015/06/01/how-big-data-
drives-success-at-rolls-royce/#13dcef193ac0 (Accessed online 9 december
2016).
Meier, H., R. Roy. and G. Seliger. (2008) ‘Industrial product-service systems – IPS2’
CIRP Annals Manufacturing Technology 2008, pp.1–24
Meier, H., Roy, R. Seliger, G. (2010) ‘Industrial Product-Service Systems-IPS2’, CIRP
Annals - Manufacturing Technology, Vol. 59 No. 2, pp.607–627
Opresnik, D. and Taisch, M. (2015) ‘The value of big data in servitization’,
International Journal of Production Economics, Vol. 165, pp.174-184
Reim, W., Parida, V. and Lindström, J. (2013) ‘Risks for Functional Products:
Empirical Insights from two Swedish Manufacturing Companies’, Procedia
CIRP 11, pp.340–345
Richter, A., Sadek, T. and Steven, M. (2010) ‘Flexibility in industrial product-service
systems and use-oriented business models’, CIRP Journal of Manufacturing
Science and Technology, Vol. 3 No. 2, pp.128-134
Selak, L., Butala, P. and Sluga, A. (2014) ‘Condition monitoring and fault diagnostics
for hydropower plants’, Computers in Industry, Vol. 65 No. 6, pp.924-936
Schuh, G., Boos, W. and Völker, M. (2011) ‘Collaboration platforms to enable global
service provision in the tooling industry’, Production Engineering, Vol. 5 No. 1,
pp.9-16
Schuh, G., Gudergan, G., Feige, B. A., Buschmeyer, A. and Krechting, D. (2015)
‘Business transformation in the manufacturing industry - how information
acquisition, analysis, usage and distribution affects the success of lifecycle-
product-service-systems’, Paper presented at the 7th CIRP Industrial Product-
Service Systems Conference, IPSS 2015, Vol. 30, pp.335-340
Vasantha, G.V.A., Roy, R., Lelah, A. and Brissaud, D. (2012) ‘A review of product–
service systems design methodologies’, Journal of Engineering Design, Vol. 23
No. 9, pp.635-659
Wamba, S.F., Akter, S., Edwards, A., Chopin, G. and Gnanzou, D. (2015) ‘How ‘big
data’ can make big impact: Findings from a systematic review and a longitudinal

case study’, International Journal of Production Economics, Vol. 165, pp.234-
246
Wilberg, J., Hollauer, C. and Omer, M. (2015) ‘Supporting the performance assessment
of product-service systems during the use phase’, Paper presented at the 7th
CIRP Industrial Product-Service Systems Conference, IPSS 2015, Vol. 30,
pp.203-208


Copyright © 2022 FDOKUMEN