An Interdisciplinary Approach to Project Monitoring and ...
122
Editors: K. Saterson, R. Margoluis, and N. Salafsky Proceedings from a BSP symposium held at the joint annual meetings of the Ecological Society of America and the Society for Conservation Biology in Providence, Rhode Island, August 1996 Measuring Conservation Impact An Interdisciplinary Approach to Project Monitoring and Evaluation
-
Upload
khangminh22 -
Category
Documents
-
view
0 -
download
0
Transcript of An Interdisciplinary Approach to Project Monitoring and ...

Editors: K. Saterson, R. Margoluis, and N. Salafsky
Proceedings from a BSPsymposium held at the joint annual meetingsof the Ecological Society of America and the
Society for Conservation Biology inProvidence, Rhode Island, August 1996
MeasuringConservation
ImpactAn Interdisciplinary Approach to
Project Monitoring and Evaluation

About BSP
The Biodiversity Support Program is a consortium of World Wildlife Fund, The Nature Conservancy, and WorldResources Institute, funded by the United States Agency for International Development (USAID). BSP's missionis to promote conservation of the world's biological diversity and to maximize the impact of U.S. governmentresources directed toward international biodiversity conservation. This publication was made possible through sup-port provided by the Global Bureau of USAID, under the terms of Cooperative Agreement Number DHR-5554-A-00-8044-00. The opinions expressed herein are those of the authors and editors and do not necessarily reflectthe views of USAID.
Graphics Design: Carol Levie, Grammarians, Inc.
Cover Design: Keith Dana, Design Consultants
Correct Citation: Saterson, K., Margoluis, R., and Salafsky, N. 1999. Measuring conservation impact: An interdisci-plinary approach to project monitoring and evaluation. Biodiversity Support Program, Washington, D.C.
ISBN 1-887531-32-7
© 1999 by World Wildlife Fund, Inc., Washington, D.C.All rights reserved. Reproduction of this publication for educational and other noncommercial purposes is autho-rized without prior permission of the copyright holder. However, WWF, Inc. does request advance written notifi-cation and appropriate acknowledgment. WWF, Inc. does not require payment for the noncommercial use of itspublished works and in no way intends to diminish use of WWF research and findings by means of copyright.

❖
Contents❖
Editors’ Preface . . . . . . . . . . . . . . . . . . . . . . . . . . . . . . . . . . . . . . . . . . . . . . . . . . . . . . . . . . . . . . . . .v
Acknowledgments . . . . . . . . . . . . . . . . . . . . . . . . . . . . . . . . . . . . . . . . . . . . . . . . . . . . . . . . . . . . . . . .vi
Acronyms . . . . . . . . . . . . . . . . . . . . . . . . . . . . . . . . . . . . . . . . . . . . . . . . . . . . . . . . . . . . . . . .vii
PART I INTRODUCTION
1 Why Is Monitoring of Conservation Projects Both Necessary and Challenging? . . . .3Kathryn A. Saterson
2 Overview of a Systematic Approach To Designing, Managing, andMonitoring Conservation and Development Projects . . . . . . . . . . . . . . . . . . . . . . . .7
Nick Salafsky and Richard Margoluis
PART II CONCEPTUALIZATION AND DEVELOPMENT OF PROJECT MODELS
Introduction . . . . . . . . . . . . . . . . . . . . . . . . . . . . . . . . . . . . . . . . . . . . . . . . . . . . . .19
3 Testing the Effectiveness of Using a Conceptual Model To Design Projects andMonitoring Plans for the Crater Mountain Wildlife Management Area,Papua New Guinea . . . . . . . . . . . . . . . . . . . . . . . . . . . . . . . . . . . . . . . . . . . . . . . . .21
John Ericho, Robert Bino, and Arlyne Johnson
4 Conceptual Modeling for Nature-based Tourism and Wildlife Microenterprises:Conservation Support for Lore Lindu National Park . . . . . . . . . . . . . . . . . . . . . . . .41
Nengah Wirawan, Duncan Neville, and Joanna Crocker
PART III INTERDISCIPLINARY AND PARTICIPATORY DATA COLLECTION METHODS
Introduction . . . . . . . . . . . . . . . . . . . . . . . . . . . . . . . . . . . . . . . . . . . . . . . . . . . . . .51
5 Local Participation in Protected Area Management: The PALOMAP Studyand Methodology . . . . . . . . . . . . . . . . . . . . . . . . . . . . . . . . . . . . . . . . . . . . . . . . . .53
William H. Ulfelder and Barbara L. Dugelby
6 Monitoring Natural Resource Use on the Masoala Peninsula, Madagascar:A Tool for Managing Integrated Conservation and Development Projects . . . . . . . .63
Claire Kremen, Isaia Raymond, Kate Lance, and Andrew Weiss

Measuring Conservation Impactiv
PART IV USE OF RESULTS
Introduction . . . . . . . . . . . . . . . . . . . . . . . . . . . . . . . . . . . . . . . . . . . . . . . . . . . . . .85
7 Extraction of Non-timber Forest Products in Biligiri Rangan Hills, India:Monitoring a Community-based Project . . . . . . . . . . . . . . . . . . . . . . . . . . . . . . . . .89
Kamal S. Bawa, S. Lele, K.S. Murali, and Balachander Ganesan
8 The Miner’s Canary: Applying Multidisciplinary Monitoring and Evaluationto Integrated Conservation and Development Programs . . . . . . . . . . . . . . . . . . . . .103
Mark Renzi
Appendix 1 Symposium Schedule . . . . . . . . . . . . . . . . . . . . . . . . . . . . . . . . . . . . . . . . . . . . . . .121
Appendix 2 Contributors . . . . . . . . . . . . . . . . . . . . . . . . . . . . . . . . . . . . . . . . . . . . . . . . . . . . .123

Conservation project managers need to measure project success for two reasons. They need to understand theimpacts of the activities they are carrying out in the field. They also need to obtain reliable and timely informationin order to make informed decisions. Reliable data help conservation practitioners determine the effects of theirprojects and why interventions succeed or fail. Perhaps most importantly, monitoring and evaluation (M&E) pro-vides the raw material to form a sound foundation of knowledge about a given project. Based on this knowledge,project managers can carry out adaptive management—the integration of program design, management, and mon-itoring to provide a framework for testing assumptions, adapting, and learning.
While the benefits of a functional M&E system are clear, it is surprising how few conservation projects haveone in place. Some of the barriers to doing M&E at the project level include insufficient capital and humanresources, lack of experience and expertise, and previous negative experiences with data collection. These obstacles,however, are not insurmountable.
In our work at the Biodiversity Support Program (BSP) and in collaboration with our conservation partners, wehave found that there are critical points in the M&E process at which project managers may need a little extra helpin maintaining their momentum. These critical points include the following:
1) Conceptualization of the project and the context in which it will be carried out;2) Selection and use of appropriate methods for data collection and analysis; and3) Use and application of the results of M&E to adapt and learn.
To this end, we organized the symposium Measuring Conservation Impact: An Interdisciplinary Approach toProject Monitoring and Evaluation at the 1996 joint annual meetings of the Ecological Society of America andthe Society for Conservation Biology. This publication contains a complete set of papers that were presented at thesymposium.
We organized the symposium so that two invited speakers would address each of the three critical points listedabove. Our team of six presenters was truly interdisciplinary and international. It included economists, ecologists,biologists, and anthropologists representing Africa and Madagascar, Asia and the Pacific, and Latin America andthe Caribbean. All of the invited speakers came from current or former BSP partner organizations that havedemonstrated a strong commitment to improving their M&E efforts.
We trust that you will agree that the papers presented in this proceedings contribute significantly to advancingour field's understanding of how to make effective M&E happen in the field. All of the authors stress the need totake an interdisciplinary and highly participatory approach to conservation project design, implementation, andmonitoring. All of the papers provide excellent examples of putting the theory of adaptive management into action,whereby project managers identify, collect, analyze, and use relevant data to test assumptions, adapt, and learn. Wehope you will find these papers as useful and relevant to your work as we have to ours.
—Kathy Saterson, Richard Margoluis, and Nick Salafsky
❖
Editors’ Preface❖

Many people contributed their knowledge and skills to produce this book. Our special thanks goes to Ilana Locker,who played an indispensable role in coordinating the symposium, including the travel and lodging arrangementsfor the participants. We would also like to recognize Jonathan Adams, who wrote initial drafts of introductory sec-tions, as well as the editorial support services provided by Grammarians, Inc. Finally, we would like to thankNorma Adams for serving as managing editor of this publication.
Acknowledgments❖
❖

ACRONYMS
AMP Activity Management ProfileBCN Biodiversity Conservation NetworkBKA Beekeeping Activities
BR Biligiri RanganBRT Biligiri Ranganswamy TempleBSP Biodiversity Support Program
CBNRM Community-based Natural Resource ManagementCBO Community-based Organization
CMBRS Crater Mountain Biological Research StaffCMCS Community Management Calculation Sheet
CMP Community Management ProfileCMT Community Management Toolkit
CMWMA Crater Mountain Wildlife Management AreaFLACSO Spanish acronym for Latin American Social Sciences Faculty
FRLHT Foundation for the Revitalization of Local Health TraditionsFPU Food Processing UnitGPS Global Positioning SystemHEP Human Ecological Profile
HMPU Herbal Medicinal Plant UnitHPU Honey Processing Unit
ICAD Integrated Conservation and DevelopmentICDP Integrated Conservation and Development ProjectIDCS Institutional Development Calculation Sheet
IDF Institutional Development FrameworkIDP Institutional Development ProfileIDT Institutional Development Toolkit
IRDNC Integrated Rural Development and Nature ConservationLACD Latin and Caribbean Division
LAMPS Large-scale Adivasi (tribal) Multipurpose SocietiesLIFE Living in a Finite Environment
LLNP Lore Lindu National ParkM&E Monitoring and Evaluation
MB Management BodyMC Management Committee
MET Ministry of Environment and TourismNGO Nongovernmental OrganizationNNF Namibian Nature Foundation
NNFC Nyae Nyae Farmers CooperativeNTFP Non-timber Forest Product
PALOMAP Local Participation in Protected Areas Management (Spanish acronym)PCI Participatory Conservation Initiatives
PHF Pacific Heritage FoundationPMV Program Monitoring VisitPNG Papua New GuineaRCF Research and Conservation Foundation
SPOT Earth Observation Satellite System (French acronym)
Acronyms vii
Measuring Conservation Impactviii
SWOT Strengths, Weaknesses, Opportunities, ThreatsTIAT Training Impact Assessment ToolTLO Trained Local ObserverTNC The Nature Conservancy
USAID United States Agency for International DevelopmentVGKK Vivekananda Girijana Kalyana Kendra (Hindi)
WCS Wildlife Conservation SocietyWMA Wildlife Management AreaWWF World Wildlife Fund

Part I
Introduction

WHY IS MONITORING NECESSARY?
Conservation projects worldwide have three majorneeds that make monitoring necessary:
• Determining whether the project is meeting its con-servation goals and whether it is achieving a positiveconservation impact.
• Deciding how project staff should adapt and modifytheir efforts through time to ensure that the projectcontinues to achieve positive impacts.
• Ensuring that all participants in the project, frominternational nongovernmental organizations (NGOs)to local communities, learn from the experience andcan improve their implementation of future conserva-tion interventions.
Continuous monitoring and assessment of projectprogress can ensure that all three of these needs are met.In recent years, there has been a growing call to improvethe monitoring of conservation projects. This call hascome from donors who seek to understand the impactsof their funds, from members of the international con-servation and development community who seek tounderstand which approaches to conservation haveworked and which have not, and most important, fromlocal stakeholders who seek to understand the best waysto manage the biological resources they control.
Monitoring is necessary in order to determine whatconditions lead to the success or failure of a specificconservation approach or strategy. Most conservation
projects involve a range of social, economic, or politicalinterventions that are expected (hypothesized) toimprove conservation by achieving specific biologicalresults or outcomes. Monitoring enables projects todemonstrate a clear linkage between the interventionsand the impacts.
WHY IS MONITORING OF CONSERVATION
PROJECTS SO CHALLENGING?
Assessing impact, managing adaptively, and learningfrom experience are critically important to the sustain-ability of biodiversity conservation. Nevertheless, pro-ject designers rarely pay appropriate attention tomonitoring and seldom include adequate funds formonitoring in program budgets. This is due, in part, toa lack of awareness about the importance of monitoringand, in part, to the challenges of monitoring. Thesechallenges make monitoring relatively costly, in bothtime and money, and therefore often easy to overlook inthe short term.
Five factors make monitoring of projects that seekto integrate conservation and development so chal-lenging:
1. Conservation is a multidisciplinary and interdiscipli-nary endeavor.
2. The natural world, from the species to the ecosystemlevel, is dynamic, not static.
3. Social, economic, and political worlds are alsodynamic.
❖
1Why Is Monitoring of Conservation Projects
Both Necessary and Challenging?❖
KATHRYN A. SATERSONExecutive Director, Biodiversity Support Program

4. Most impacts of human activities on biological diver-sity are unpredictable.
5. Identifying simple indicators of status and change forbiological resources is difficult.
The relationships between factors 1 through 4depend on the specific temporal and spatial scale mea-sured, further complicating the difficulty of developingindicators.
1. Conservation is a multidisciplinary and interdisci-plinary endeavor.Conservation is as much a social, political, and eco-nomic problem as it is a biological one. Successful con-servation programs must be interdisciplinary andmultidisciplinary, so monitoring and assessment mustaddress conditions that are biological, social, economic,and political.
The factors to be monitored, techniques used, and cri-teria for determining impact will vary depending on thespecific type of project. Projects that seek to integratebiodiversity conservation with development often needto monitor and assess a variety of baseline conditions andchanges. These may be biological (e.g., are they animaland plant species or communities being conserved?),ecological (e.g., is the project affecting ecosystemintegrity?), social (e.g., are the resource users changingtheir management of the biological resources?), and eco-nomic (e.g., is the project improving the livelihoods ofthe local community?).
2. The natural world, from the species to the ecosys-tem level, is dynamic, not static.Ecologists describe all ecosystems according to threecharacteristics: composition (such as the diversity ofplants and animals the system contains), structure(arrangement of natural elements), and function (naturalprocesses, such as water and nutrient cycling). Althougha great deal is still unknown, research over the past 30years has demonstrated that ecosystem attributes are notstatic, and do not change gradually and continuouslythrough time and space. Ecosystems change abruptly.The fact that ecosystems are dynamic and stochasticleads to great difficulty in determining a single equilib-rium point for many ecosystem characteristics.
Ecosystems also demonstrate spatial heterogeneityand discontinuity. The processes that influence ecosys-tem structure do so at different scales. In an analysis ofcross-scale dynamics of ecosystems in space and time,
C.S. Holling (1992) noted that three broad types ofprocesses determine ecosystem structure, and that thoseprocesses act at different scales. Vegetative processesthat determine plant structure and productivity creatediscontinuous textures at micro-scales that range fromcentimeters to tens of meters in space and days todecades in time. Geomorphological and evolutionaryprocesses are the primary determinants of topographicand edaphic structure at the macro-scale extreme, whichranges from hundreds to thousands of kilometers inspace and from centuries to millennia in time. Inbetween are meso-scales, where disturbance processes,such as plant disease, fires, insects, water, and humanactivities determine vegetation types at spatial scalesranging from tens of meters to hundreds of kilometers,on time scales from years to decades (Holling 1992).
Ecosystem structure and function reflect a number ofinteractive and cumulative effects that are often prod-ucts of feedback cycles. For example, coral reefs dependon cycling of nutrients within the reefs, unlike othermarine systems. The high number of symbiotic rela-tionships between plants and animals on coral reefs isthought to reflect the advantage obtained from efficientnutrient transfer. While traditional subsistence fishingon reefs is usually sustainable (particularly when fishscraps are returned to the reef and release nutrients), thelarge-scale, commercial export of fish is often not sus-tainable. The removal of many more fish and theirtransport completely out of the system can quicklyimpoverish a reef (Vitousek and Lubchenco 1995).
The unpredictable nature of the environment meansthat project teams must continually monitor the situa-tion to document the results of their interventions andadjust accordingly if a change in action is needed toreach project goals.
3. Social, economic, and political realms are alsodynamic.The variability of social, economic, and political condi-tions compounds the challenge of monitoring programsthat aim to integrate conservation of protected areaswith increased social and economic development foradjacent communities. For example, the relationshipbetween poverty and environmental degradation is nota simple one of cause and effect. Knowledge of localsocial, economic, cultural, biological, and institutionalissues is needed to determine the role of economic andsocial development in changing community behaviorsto be more supportive of sustainable conservation or toreinforce current sustainable practices.
Measuring Conservation Impact4

4. Most impacts of human activities on biologicaldiversity are unpredictable.The patchy and discontinuous nature of ecosystems andlandscapes makes it difficult to predict responses tohuman interventions. For example, grazing at a densityof one cow per hectare might have little impact in onesystem but might alter the composition of grasses inanother system.
Most ecosystems are nonlinear; that is, they are sta-ble or resist disturbance up to some threshold point,after which there is sudden change. Some studies sug-gest that the capacity of ecosystems to resist disturbanceassociated with changing environmental conditions ishigher in ecosystems with higher species diversity(Mooney et al. 1995). This diversity/stability hypothesissuggests that both human-induced or natural distur-bance might cause a larger change in ecosystem func-tion in simple systems than in diverse systems.
There are many examples of human activity causinga reduction in natural variability and a decrease in func-tional diversity of an ecosystem, resulting in greater sen-sitivity and decreased resilience. Such changes as speciesloss, desertification, loss of groundwater, and large-scalehabitat alteration are often irreversible because ofchanges in soils, hydrology, and so on. Whether an irre-versible change, such as the loss of a species, causes irre-versible changes in ecosystem function depends on thescale of the loss and the amount of “redundancy” interms of other species that have the same functional role(Norton and Toman 1994).
The principles governing ecosystem dynamics out-lined above indicate why it is so difficult to predict theimpacts of human activities on the natural world.Because ecosystems are dynamic, it is a challenge todetermine whether human activity is causing impactsthat are greater than would have occurred naturally.Ecologists are struggling to find ways to deal with suchquestions as: How much land cover change can a givenecosystem tolerate before biodiversity is lost and beforethe function of that system is altered? How many exoticspecies introductions can a system tolerate before diver-sity is lost?
5. Identifying simple indicators of status and changefor biological resources is difficult.Monitoring efforts must be able to determine whetherprojects are actually contributing to better conservation.The factors to be monitored are not exact, and all sug-gested monitoring criteria are open to criticism. Yet,project managers need relatively quick and cost-
effective methods of monitoring the status of biologicaldiversity in order to determine project impacts. It is rel-atively easier to monitor the social, economic, and insti-tutional conditions that influence conservation.
Biological indicators must reflect consideration ofchange at the appropriate scale for the project.Indicators should not just measure causes of change butshould also measure consequences of change. The link-ages and interactions between indicators are crucial, fora favorable change in one indicator could be counteredby an unfavorable change in another.
The challenge of developing monitoring indicators isdetermining what to measure in order to learn whetherhuman activity has created an unsustainable change insome aspect of biodiversity. The nonlinearities andthresholds mentioned above make monitoring all themore important.
The type, composition, and distribution of commu-nities, habitats, and ecosystems are important indicatorsof biodiversity status. Periodic sampling of transects andpermanent plots are often used to monitor such changesas population status of utilized species or changes in thenumber of exotic species that can threaten communitycomposition. While scientists do not yet fully under-stand the role of biodiversity in maintaining ecosystemstructure and function, it is important to monitorchanges in community productivity and, if possible,nutrient and water cycling in order to assess the ecolog-ical services that biodiversity may provide at the locallevel. Remote sensing techniques and ground surveyscan provide methods to monitor and assess changes incommunities, habitats, and ecosystems.
Successful monitoring programs must be able todetect changes in the status of and threats to biologicaldiversity, to use tools and techniques that are appropri-ate for the particular conservation problem, and assessthe results so as to determine whether the conservationhypotheses and objectives are being addressed, and whattypes of changes in the project activities are necessary.
OBJECTIVES OF THIS BOOK
Despite increasing national and international attentionto the need for improved monitoring of conservationprojects, there is often a great deal of confusion abouthow to do effective monitoring or even what monitor-ing actually is. The Biodiversity Support Program(BSP) has increasingly focused on helping project part-ners develop and implement effective approaches tomonitoring the conservation impacts of the projects we
Saterson 5

support. We have begun to accumulate some importantlessons about effective approaches to working with part-ner organizations to monitor conservation projects.
In 1996, BSP organized a symposium in order toshare some of the lessons that we and our partners inthe field were learning about project monitoring. Thisbook contains the proceedings from that symposium.The following paper presents an overview of theapproach that the staff of BSP have developed over thelast three years to project monitoring within the con-text of the project cycle. The papers in Parts II throughIV contain project experiences from six countries thatillustrate the steps in the process outlined in theoverview. The authors are field project managers whoare attempting to implement interdisciplinary moni-toring as a way to achieve and measure conservationimpact.
The questions that all of the papers address to somedegree include:
1. How can projects and monitoring plans be conceptu-alized and designed to achieve conservation impact?
2. What tools and techniques are most effective forinterdisciplinary monitoring?
3. How can the information collected from monitoringefforts be used to better manage projects?
The papers in Part II describe the importance ofintegrating project design with monitoring plans forprojects in Papua New Guinea and Indonesia. A discus-sion of effective techniques and tools for conductinginterdisciplinary monitoring in projects in Ecuador andMadagascar follows in Part III. Finally, the papers inPart IV describe how projects in India and Namibia
have used the information gained from monitoring toadapt and improve project management.
We hope that the experiences and approaches con-tained in this proceedings will contribute to and helpcatalyze improved monitoring and learning from con-servation projects. This book does not specificallyaddress the importance of monitoring outside the con-text of a specific project, such as national level biodiver-sity monitoring to assess threats and progress, but manyof the same challenges apply at national and interna-tional scales. We welcome and encourage your feedbackon the approaches presented here, as well as informationon your own experience with monitoring.
REFERENCES
Holling, C.S. 1992. Cross-scale morphology, geometryand dynamics of ecosystems. Ecological Monographs62(4): 447-502.
Mooney, H.A., J. Lubchenco, R. Dirzo, and O.E. Sala.1995. Biodiversity and ecosystem functioning: Basicprinciples. In Global biodiversity assessment, ed. V.H.Heywood, 275-325. New York: Cambridge Uni-versity Press and United Nations EnvironmentProgramme.
Norton, B.G., and M.A. Toman. 1994. Sustainability:Ecological and Economic Perspectives. Paper pre-sented at Colloquium on Sustainability in theUnited States, January 10, 1994.
Vitousek, P.M., and J. Lubchenco. 1995. Limits to sus-tainable use of resources: From local effects toglobal change. In Defining and measuring sustain-ability: The biogeophysical foundations, eds. M.Munasinghe and W. Shearer, 57-64. Washington,D.C.: The World Bank and United NationsUniversity.
Measuring Conservation Impact6

INTRODUCTION
What Is Monitoring and Why Is It Important?There is a growing movement to improve monitoring ofconservation and development projects. Monitoring canbe defined as “the periodic collection and evaluation ofdata relative to stated project goals, objectives, and activ-ities” (Margoluis and Salafsky 1998). Many people oftenrefer to this process as monitoring and evaluation(M&E).
Monitoring can potentially serve two importantfunctions within a project:
• Adaptive Management—Helping communities andproject implementers obtain the information theyneed to manage their local resources more effectively,and act on that information to improve resourcemanagement.
• Impact Assessment—Enabling project teams anddonors to learn from projects and to draw more gen-eralized lessons regarding effective conservationstrategies.
Constraints to Doing MonitoringDespite the near universal agreement on the importanceof monitoring, few community-based conservation anddevelopment projects have had much success in devel-oping and implementing monitoring systems. In manycases, as outlined in Figure 1, the question of monitor-ing causes a major “disconnect” between donors andgroups implementing projects. Donors demand thatproject teams design and implement monitoring sys-
tems. The teams typically agree in principle, but in prac-tice either do not implement monitoring systems orimplement systems that collect but do not use data.
At least five main constraints keep project teamsfrom developing and implementing monitoring systemsand using the data from them:
1. Lack of Time and Money
Most field-based project teams face enormous time andfinancial pressures. On any given day, the team mem-bers must juggle a host of tasks, such as developing andimplementing complex program activities, maintainingworking relationships with and among factions of local
❖
2Overview of a Systematic Approach To Designing, Managing,
and Monitoring Conservation and Development Projects❖
NICK SALAFSKY AND RICHARD MARGOLUISSenior Program Officer, Biodiversity Conservation Network and
Director, Analysis and Adaptive Management, Biodiversity Support Program; respectively
Figure 1
The “Disconnect” beween International and LocalPartners over Project Monitoring

community stakeholders (who often have been feudingfor generations), managing difficult logistical problemsin communicating and getting supplies, dealing withcomplex staffing problems, and complying withrequests from donors. Even if the team wants to domonitoring, it often ends up as a marginal activity thatbecomes a lower priority as more immediate crisesdemand action.
2. Perceived Lack of Qualified Staff
Project staff traditionally view monitoring as thedomain of scientists. Many practitioners believe thatrigorous monitoring work requires a team of Ph.D.scientists with white laboratory coats and elaborateequipment.
3. Little or No Connection between Project Interventions
and Monitoring
Senior members of the implementing group who live inthe country’s capital city, or in places like Washington,D.C., in many cases are responsible for designing pro-jects. The project team in the field thus often has littleor no idea about the project’s conceptual design—whatthe goals and objectives of the project are and how theinterventions are designed to achieve them. As a result,it is often difficult for the project staff to determinewhat they need to monitor in order to assess projectsuccess. Furthermore, project staff often treat monitor-ing as a separate set of activities instead of integrating itinto the overall project plan.
4. Difficulty in Determining What Specific Data Need
To Be Collected
Even if project teams can decide what information theyneed, they often have difficulty selecting the appropri-ate methods to use. In particular, since most “monitor-ing” staff come from specific disciplinary backgrounds,they tend to apply the methods particular to their disci-pline with little or no regard for necessity or appropri-ateness.
5. Difficulty in Analyzing and Using Data
Despite these constraints, many projects succeed in col-lecting data. Most of the time, however, the projectnever analyzes or uses the data. This problem occursbecause either the project collected the wrong data orbecause teams lack the experience and expertise to dothe analyses.
These constraints are real, but project teams musttry to overcome them. Over the past few years work-
ing for the Biodiversity Support Program (BSP), wehave developed a systematic approach to designing,managing, and monitoring conservation and develop-ment projects (Margoluis and Salafsky 1998). Wehope that, as shown in Figure 2, this approach canhelp bridge the “disconnect” and lead to more success-ful projects.
Objectives for this PaperOur objectives in this paper are to:
1. Describe the evolution of the BSP approach to mon-itoring in the context of the project cycle and
2. Provide an overview of the steps in the BSP approachto monitoring.
Margoluis and Salafsky (1998) describe the approachitself in greater detail. For reasons that will becomeapparent below, although the intent behind BSP’sapproach was to focus on monitoring, the approach nec-essarily involves integrating monitoring with projectdesign and management activities.
EVOLUTION OF THE BSP APPROACHTO MONITORING
As illustrated in Figure 3, there are a number of sourcesfor our approach. From a theoretical perspective, theapproach draws on techniques developed by business,development, and scientific research. From a practical
Measuring Conservation Impact8
Figure 2
Bridging the Gap with a Systematic Approachto Monitoring Projects

perspective, this approach draws on our field experienceworking with conservation and development projects.We have developed and field-tested our approach inconjunction with our colleagues from many BSP-supported projects in Latin America, Africa, and Asia.
One of the most important of these sources was theefforts of BSP’s Biodiversity Conservation Network(BCN). In order to illustrate our approach, we willbriefly discuss how it evolved in the context of theBCN program. First, however, we provide a briefoverview of BCN.
The BCN ExampleBCN seeks to fulfill the following goals (BCN 1996):
• Support enterprise-oriented approaches to biodiver-sity conservation at a number of sites across theAsia/Pacific region; and
• Evaluate the effectiveness of these enterprise-oriented approaches to community-based conserva-tion of biodiversity and provide lessons and results toBCN’s clients.
To achieve these goals, BCN brings together organi-zations in Asia, the Pacific, and the United States inactive partnerships with local and indigenous commu-nities. The Network provides grants for projects thatencourage the development of enterprises that dependon sustained conservation of local biodiversity.
BCN’s core hypothesis is that, if enterprise-orientedapproaches to community-based conservation aregoing to be effective, they must: (1) have a direct linkto biodiversity, (2) generate benefits, and (3) involve acommunity of stakeholders. In effect, the hypothesis isthat if local communities receive sufficient benefits
from an enterprise that depends on biodiversity, thenthey will act to counter internal and external threats tothat biodiversity.
History of BCN’s Efforts To Assist Its Partners withMonitoringBCN went through a number of phases in crafting waysto help its partner organizations develop and imple-ment monitoring plans.
Monitoring in the Initial Project Design
From its first development in the early 1990s, BCNunderstood the important role monitoring would playin fulfilling both of its goals—documenting project suc-cess and testing its core hypothesis. Initially, however,BCN thought that good-quality monitoring wouldresult if project partners developed detailed biological,social, and enterprise monitoring plans in their projectproposals.
The project teams did indeed develop lengthy planson paper. Ultimately, on average, BCN projects allo-cated over 30% of their budgets to monitoring activi-ties, a percentage far in excess of most conservationand development projects (BCN 1995a). Over the firsttwo years of the program, however, it became clearthat many of the projects were running into the con-straints outlined in the first section of this paper andthus having difficulties implementing their monitor-ing plans.
Matrixes of Different Methods
To solve these problems, BCN began in late 1993 towork more proactively with project teams on their mon-itoring efforts. This work was initially aimed at helpingproject teams determine which methods they could use tocollect relevant monitoring information in a cost-effec-tive fashion. This focus on methods was roughly orga-nized according to academic disciplines and involvedpreparing “matrixes” of biological, social, and enterprisemethods that project staff could potentially use to collectdata about the BCN-funded projects.
Within each set of methods, BCN attempted to rankcomparable techniques in terms of the trade-off betweencost and accuracy of results, trying to find the methodsthat would be most suitable for community-based moni-toring efforts. In addition, BCN also assembled panels ofdistinguished scientists to obtain their input on how bestto select techniques that communities and local projectteams could implement. Interestingly, however, althoughthe scientists knew many techniques for collecting data,
Salafsky and Margoluis 9
Figure 3
Sources behind the BSP Systematic Approach

for the most part they were at a loss to explain how to dolow-cost, community-based monitoring.
After distributing the matrixes of different methodsto the project teams, it soon became apparent that thesewere not sufficient to solve the problems the teams werehaving with monitoring. Instead, BCN began to realizethat the project teams were having difficulty determin-ing what information the project needed—the step thatcomes before selecting methods.
Comprehensive Guidelines for Monitoring Questions
To help its partners determine what information tocollect, BCN began in 1994 to develop lists of poten-tial monitoring questions the projects could ask aboutthe biological, social, and enterprise components oftheir efforts. These lists of questions initially focusedon the monitoring methods matrixes, but soonexpanded into a comprehensive listing of almost everyconceivable question relevant to a BCN-type project(BCN 1995b).
The idea behind these comprehensive guidelines wasnot to suggest that each project try to answer all of thequestions, but rather to provide a resource guide that thegroup could use to determine what specific questions itneeded to ask. When BCN sent this massive list of ques-tions to project teams, however, it generally over-whelmed them, leaving them more confused than everabout the questions they needed to address in their spe-cific projects.
Common Sets of Questions
In an attempt to give partners more guidance in select-ing specific questions, BCN next drew on experiencesof all its partners to select the most pertinent questionsin each of the three disciplinary areas. To this end,BCN convened a workshop in May 1995 among itssouth Asian grantees in order to review the compre-hensive list of questions in each discipline and boil itdown to a “common” or “minimum” set of critical infor-mation needs that all the projects could address (BCN1995c).
BCN made some progress toward this goal at theworkshop, but most groups still were having difficulty incoming up with specific questions that they needed toaddress at their sites. There was a growing realization thatultimately, conservation needs to be site specific and thatproject teams need to design monitoring not as a supple-mental package organized by various academic disci-plines, but instead as an integral part of the projectdesign.
Site-specific Monitoring Plans in the Context of the
Project Cycle
One useful technique is to view a project as goingthrough a series of steps in a cycle, as outlined in Figure4. Up until this point, BCN basically had been startingthe process of helping groups develop their monitoringefforts with Diamond C, assuming that the projects hadalready progressed through the previous diamonds.BCN soon realized, however, that it needed to help pro-ject teams complete the earlier steps before planningmonitoring efforts. Furthermore, project teams neededto design monitoring to meet the specific needs of eachproject site.
BCN convened two more workshops in September1995 for its southeast Asian and Pacific grantees inwhich the Network presented to grantees a newapproach to doing monitoring in the context of the pro-ject cycle (BCN 1995d). Participants quickly recognizedthat this approach had the potential to solve many ofthe earlier problems. BSP’s work with partners in otherparts of the world confirmed these findings. BCN hasrefined and adapted the approach since 1995, and itcontinues to evolve even today.
Measuring Conservation Impact10
Figure 4
Monitoring in the Context of the Project Cycle

STEPS IN THE BSP/BCN APPROACH TO
MONITORING
Having gone through some of the history of the BSPapproach to monitoring, we now would like to presentit in some detail using the BCN-funded project in EastNew Britain, Papua New Guinea, as an example.
The overall approach is based on the project cycleshown in Figure 4. In addition to the starting and end-ing boxes, the diagram contains five diamonds, each ofwhich represents a different stage in the overall cycle.These diamonds generally need to occur in order asrepresented by the letters A–E. The diamonds them-selves, however, are part of an iterative process thatinvolves going through the cycle numerous times, asoutlined in the sketch at the bottom of Figure 4.
The process is presented from the perspective of thegroup implementing the project. We define project,however, as any set of actions undertaken by any groupof managers, researchers, or local stakeholders inter-ested in achieving certain defined goals and objectives.For example, a project could be steps that communitymembers take to revive traditional resource harvestingcustoms. Furthermore, whether the implementinggroup is composed of outsiders or members of thecommunity, an important part of the process involvesconsulting with the local stakeholders at the projectsite in all stages of the project cycle.
Start: Clarify Your Group’s MissionBefore setting out to design a new project, you musthave a clear understanding of your group’s mission. Amission statement provides a vision for the future ofyour group—your long-term desired purpose, yourstrategies for achieving it, and the values that will guideyour work. Groups generally develop their missionstatements through a strategic planning process.
If you plan to work with other groups on the new pro-ject, it is also important to understand their missions andhow your mission relates to theirs. As outlined in Figure5, it is unlikely that any two groups participating in aproject will have exactly the same set of purposes, strate-gies, or values in their mission. These differences makesit all the more important that each group explicitly spell-out its mission so that it is possible to see where overlapexists (the shaded areas) and where the differences are(the unshaded areas). Without a clear sense of what youwant to accomplish and an understanding of what yourpartners are trying to do, you will find it difficult todesign, manage, and monitor effective projects.
Specific steps in this part of the process include:
1. Define your group’s mission.
2. Find common ground with your project partners.
Diamond A: Design a Conceptual Model Based onLocal Site ConditionsA conceptual model is the foundation of all projectdesign, management, and monitoring activities. Asillustrated in Figure 6, a conceptual model is basically adiagram of a set of relationships between certain factorsthat are believed to impact or lead to a target condition.In conservation and development projects, the targetcondition is generally related to biodiversity. As illus-trated in Figure 7 from the Pacific Heritage Foundation(PHF) project, the model is first built using existinginformation to present a picture of the project area priorto the start of the project.
In particular, your model should illustrate the keydirect and indirect threats to the target condition. In thePHF project, for example, major direct threats includelogging and mining operations conducted by large cor-porations, expansion of subsistence agriculture gar-dens, and hunting. Project staff next present the modelto local communities, revise it according to their input,and then use the model to identify and rank the keythreats to biodiversity that the project will address.
Salafsky and Margoluis 11
Figure 5
Overlapping Missions of Project Groups

Specific steps in this part of the process include:
1. Review and compile existing information aboutyour project site.
2. Develop an initial conceptual model of your pro-ject site.
3. Assess local site conditions to refine and improveyour model.
4. Identify and rank threats at your project site.
Diamond B: Develop a Management PlanA management plan describes the explicit goals, objec-tives, and activities designed to address the threats youidentified in the conceptual model. Goals, which arederived from the project’s target condition, are broadstatements of the desired state toward which the projectis directed. Objectives are more specific statements ofthe desired outcomes or accomplishments of the pro-ject. Activities are specific actions undertaken by projectparticipants designed to reach each of the project’sobjectives, which, in turn, should lead to realization ofthe project’s goal. All activities need to be linked to spe-cific objectives that target critical threat factors identi-fied in the conceptual model. These linked chains ofactivities and factors are the project’s assumptions. Oncethe management plan has been completed, the activitiesand objectives can be added to the project conceptualmodel.
Figure 8 illustrates part of a management plan for thePHF project. Figure 9 shows the PHF Project concep-tual model and depicts the expected impact of the man-agement plan.
Specific steps in this part of the process include:
1. Develop a goal for your project.
Measuring Conservation Impact12
Figure 6
Diagram of a “Generic” Conceptual Model
Figure 7
Initial Conceptual Model for the Pacific Heritage Foundation (PHF) Project

2. Develop objectives for your project.
3. Develop activities for your project.
Diamond C: Develop a Monitoring PlanA monitoring plan describes how you will assess the suc-cess of your project interventions. If you do not monitoryour project’s interventions, then you will have no wayof knowing whether you have achieved your goal andobjectives or what you will need to do to improve theproject. The plan starts by identifying your internal andexternal audiences, what information they need, whatmonitoring strategies you will use to get the data tomeet each of these needs, and the specific indicators youwill measure. The remainder of the plan lists how, when,by whom, and where data for these indicators will becollected.
The key here is to be as specific as possible in writingdown what data you will collect and how you will col-
Salafsky and Margoluis 13
GOAL: Conserve the forests, wildlife, and rivers of PNG
OBJECTIVE 1: Within 6 months from the start of each of5 small-scale logging projects in the Bainings area,income increases by 200 Kina per week
ACTIVITIES FOR OBJECTIVE 1:1) Enterprise loans2) Enterprise training3) Marketing assistance
OBJECTIVE 2: 80% of clan chiefs in the project siteknow about the importance of biodiversity after 1 year
ACTIVITIES FOR OBJECTIVE 2:1) Hold awareness workshops2) Take chiefs to logging sites
Figure 8
Excerpt from the Management Planfor the PHF Project
Figure 9
Project Conceptual Model for the PHF Project

lect them. An excerpt from the PHF Monitoring Planis shown in Figure 10.
Specific steps in this part of the process include:
1. Determine audiences, information needs, moni-toring strategies, and indicators (WHY andWHAT).
2. Select methods and determine tasks necessary tocollect data (HOW).
3. Determine when, by whom, and where data willbe collected (WHEN, WHO, and WHERE).
4. Develop a monitoring plan for project activities.
Diamond D: Implement Management andMonitoring PlanThe project conceptual model, management plan, andmonitoring plan taken together comprise a completeproject plan. This diamond involves implementing thisproject plan.
There is little we can say about this step in a generalcontext—it basically involves putting into action thework you have done in the previous steps. Unless youimplement your plan, you will have no hope of achiev-ing your project’s goals and objectives.
Specific steps in this part of the process include:
1. Implement your management plan.
2. Implement your monitoring plan.
Diamond E: Analyze Data and Communicate ResultsOnce you have data, you need to analyze them and com-municate the results to your internal and external audiences.Your challenge here is to take the data that you have col-lected and turn them into useful information that you canmake available to your project partners, other stakeholdersin and around the project site, and outside audiences.
Specific steps in this part of the process include:
1. Analyze data.
2. Communicate results to your internal and externalaudiences.
Iteration: Use Results To Adapt and LearnIteration means to repeat a process or sequence of stepsthat brings you successively closer to a desired result. Itis the key step in adaptive management, where the workinvested in monitoring can pay off by helping you incor-porate the information that you have obtained toimprove your project and move forward. In this step, youfirst complete the process of testing assumptions andadapt your project plan based on your monitoringresults. You then should also document and share theknowledge you have gained with others, so that they canimprove their conservation efforts.
Specific steps in this part of the process include:
1. Put your assumptions to the test.
2. Use monitoring results to adapt your project andrefine knowledge of conservation techniques.
Measuring Conservation Impact14
Goal, Objective, or Additional Information:
OBJECTIVE 1: Within 6 months from the start of each of 5 small-scale logging projects in the Bainings area, incomeincreases by 200 Kina per week
WHAT HOW WHEN WHO WHERE COMMENT
Household Inspect Every 6 Enterprise Enterprise Looks at income income project months managers offices from sawmills
records
Kg rice Household Every 6 Project 6 Project Proxy indicatorconsumed survey months social villages for wealthper month scientist
Figure 10
Excerpt from Monitoring Plan for the PHF Project

Salafsky and Margoluis 15
CONCLUSIONS
At the start of this paper, we stated that monitoring hastwo primary functions:
• Adaptive Management—Helping communities andproject implementers to obtain the informationthat they need to mange their local resources moreeffectively and act on that information to managebetter.
• Impact Assessment—Enabling project teams anddonors to learn from projects and to draw moregeneralized lessons regarding effective conservationstrategies.
BSP’s systematic approach to designing, managing,and monitoring conservation and development projectsprovides a useful framework for this complex andimportant process. We hope that this overview of BSP’sapproach demonstrates not only that monitoring isessential to project success, but that all conservation anddevelopment projects have the capacity to design andconduct effective monitoring efforts.
ACKNOWLEDGMENTS
We wish to thank the many people who have contributedto the development of the BSP approach to designing,managing, and monitoring conservation and developmentprojects including, in particular, the project partners whoworked with us to develop and refine these ideas. Thiswork was supported through the Global Bureau of the
United States Agency for International Development(USAID) under the terms of grant number DHR-5554-A-00-8044-00.
REFERENCES
BCN. 1995a. Biodiversity Conservation Network 1995annual report: Evaluating an enterprise-orientedapproach to community-based conservation in theAsia/Pacific Region. Washington, D.C.: BiodiversityConservation Network.
_______. 1995b. Guidelines for monitoring and evaluationof BCN-funded projects. Version 1.1. Washington,D.C.: Biodiversity Conservation Network.
_______. 1995c. Final report on the BCN monitoringworkshop, 22-26 May 1995, Bangalore, India.Washington, D.C.: Biodiversity ConservationNetwork.
_______. 1995d. Final report on the monitoring work-shops, Los Baños, Philippines. Results from twoworkshops held September 4-9 for Southeast Asianpartners and September 12-17 for Pacific partners.Washington, D.C.: Biodiversity ConservationNetwork.
_______. 1996. Biodiversity Conservation Network 1996annual report: Stories from the field and lessons learned.Washington, D.C.: Biodiversity ConservationNetwork.
Margoluis, R., and N. Salafsky. 1998. Measures of success:Designing, managing, and monitoring conservationand development projects. Washington, D.C.: IslandPress.

One of the first and most fundamental activities aproject team must undertake to measure conservationimpact is to gain a clear conceptual understanding ofthe site conditions in which the team is working andthe situation it is trying to address. Clear project con-ceptualization is also key to effective adaptive man-agement. BSP and its partners have found that one ofthe most effective ways to conceptualize a project isby using a conceptual model. Without a good concep-tual model, BSP's experience shows that projectteams run a high risk of not being able to communi-cate achievable goals and objectives, design effectiveand efficient interventions, or determine specificinformation they need to monitor in order to makesound management decisions and measure projectimpact. The cause of a fundamental flaw in a projectcan usually be traced back to an inadequately con-ceived or designed plan.
A conceptual model forms the foundation of projectdesign, management, and monitoring activities. A pro-ject team uses the conceptual model to clarify its goals;define, in clear operational terms, how it intends toachieve them; and determine what information isrequired to monitor and evaluate progress toward thesegoals. As Salafsky and Margoluis state in Part I(Chapter 2), a conceptual model is a diagram of a set ofrelationships between certain factors that are believed toimpact or lead to a target condition, which, in conserva-tion and development projects, is usually the status orhealth of some biodiversity-related condition or site. Agood conceptual model:
• Presents a picture of the situation at the project site.• Shows assumed linkages between factors affecting
the target condition.
• Shows major direct and indirect threats affecting thetarget condition.
• Presents only relevant factors.• Is based on sound information.• Results from a team effort.
Design of a conceptual model is not an abstract exer-cise. In fact, its success—and thus the ultimate successof the conservation project it is intended to benefit—depends on involving appropriate stakeholders, usingthe best available information, and revising the structureof the model as many times as needed. Developing afinal conceptual model occurs in two phases. The firstphase involves creating an initial conceptual model thatdescribes the situation at the project site before the pro-ject begins. In essence, it is a diagrammatic "snapshot"of the project site as it exists independent of the project.The second phase involves showing how project activi-ties, identified by developing goals and objectives basedon the initial conceptual model, enter into and influencethe initial model. This second phase results in the finalproject conceptual model.
Both papers in this section illustrate how the processof designing a conceptual model can enhance commu-nication between stakeholders, clarify what a project isintended to accomplish, and help map out how a pro-ject's goals will be achieved. In addition to describingthe particular conceptual model used for each project,the authors show how the model-building process cameabout through the use of reliable information and thepromotion of solid teamwork.
In Chapter 3, Ericho, Bino, and Johnson describetheir use of conceptual models in the Crater MountainWildlife Management Area (CMWMA) of PNG. TheCMWMA, an area of spectacular biodiversity, is home
❖
Introduction❖

to some 220 species of birds and 84 species of mam-mals. It is also home to two groups of people: the high-land Gimi, who live in relatively well-establishedstationary communities, and the lowland Pawaian, whomaintain a semi-nomadic existence. Because of legisla-tion passed by PNG's parliament in 1994, Gimi andPawaian landowner groups, in cooperation with theCMWMA project team, have jurisdiction over deci-sions affecting all aspects of land use in the area.
Ericho and his colleagues describe the establish-ment—with all of its potentials and challenges—of theCMWMA Integrated Conservation and DevelopmentProject (ICDP), which straddles three peripheralregions of three provinces. The project seeks to helplandowners develop eco-enterprise activities that linkincome-earning opportunities with conserving biodi-versity. The authors stress the particular relevance ofusing conceptual models to developing ICDPs, whichare inherently complex. For this project team, the con-ceptual model is an indispensable tool that helps toaccomplish the following:
• Identify and achieve project objectives.• Set project activity priorities and thus aid in person-
nel selection and budgeting.• Spend limited conservation financial resources more
efficiently.• Determine why certain interventions work and oth-
ers fail and discover alternative solutions.• Provide a useful tool for communicating about the
project with community and project team members.• Determine what the project team needs to monitor
and how information will be collected and used.
Ericho and his colleagues close by providing someexcellent recommendations for developing and usingconceptual models.
In Chapter 4, Wirawan, Neville, and Crocker applythe conceptual model approach in Lore Lindu NationalPark, located in Central Sulawesi, Indonesia. Wirawanand his colleagues are part of a team working to find sus-
tainable alternatives to overuse of natural resourcesthrough the promotion of nature-based tourism andsmall-scale, wildlife-based economic enterprises that linkeconomic well-being to sustainable use of park resources.Like the Crater Mountain example, Lore Lindu is hometo an amazing array of endemic biodiversity, including 88bird species and 79 mammal species. According to theauthors, the greatest threats to Lore Lindu are road con-struction, migration, agricultural encroachment, andoverharvesting of plant and animal species.
Wirawan and his team describe how they workedthrough various stages of developing the project con-ceptual model. It had to be revised to reflect changingperceptions about the project site and the efficacy ofdifferent interventions. Construction of the modelforced the team to address key assumptions they heldabout the root causes of biodiversity loss and thoseinterventions that were identified to offset this loss.
The experiences at Crater Mountain and Lore Lindudemonstrate that conceptual modeling is most usefulwhen it:
• Incorporates community participation into theprocess from the outset.
• Provides a starting point that can be continuouslyrevised and improved, based on feedback from mon-itoring activities.
• Focuses on key threats and their sources.• Is used as a management tool to inform key project
decisions.• Leads to integrated monitoring that provides the
feedback needed to carry out the project effectively.
The two papers presented in this section provide awealth of information on the importance of project con-ceptual models and how to develop them. They showhow conceptual models form the foundation of solidproject design, management, and monitoring. They alsoexplain how the use of conceptual models can lead to amore systematic and objective measurement of conser-vation impact.
Measuring Conservation Impact20

INTRODUCTION
Crater Mountain Wildlife Management Area(CMWMA) is an integrated conservation and develop-ment project that straddles three provinces of PapuaNew Guinea (PNG): Simbu, Gulf, and EasternHighlands. The project is a collaborative effort of theResearch and Conservation Foundation (RCF) ofPNG, Wildlife Conservation Society (WCS), and thepeoples of Crater Mountain. Field project staff main-tain a continuous presence in the villages of Haia,Herowana, and Maimafu (Figure 1).
The Crater Mountain Project began in 1984, underthe guidance of Karol Kisokau, Navu Kwapena, andDavid Gillison, along with local, national, and interna-tional partners (Pearl 1994). In October 1994, PNG’sparliament passed legislation gazetting CMWMA.Under this legislation, landowner committees com-posed of representatives from landowning groupswithin the wildlife management area, in cooperationwith the CMWMA project team, have jurisdiction overdecisions affecting land use, subsistence hunting, agri-cultural practices, natural resource extraction practices,cash crop plantations, and other human activities.
The people of the CMWMA belong to two distinctlanguage groups: Gimi and Pawaian. The Gimi speak-ers are highland people who dwell in static communi-ties; their activities center on food cultivation (Pearl1994) and occasional hunting on traditional grounds. Incontrast, the Pawaian speakers are lowland people who
maintain a semi-nomadic existence—a lifestyle thatmay have given them nearly 70% tenure of southernCMWMA holdings. Unconfirmed census reports esti-mate the Gimi population at approximately 2,000 andthe Pawaians at below 1,000.
The remote lands of the CMWMA (nearly 2,700 sq.km) range from rich lowland alluvial rain forests alongthe Purari River (150 m elevation) to the stunted sub-alpine forests and grasslands of Crater Mountain’s sum-mit (over 3,000 m). The area has been identified as apriority for conservation because of its diverse collectionof flora and fauna and healthy wildlife populations(Beehler 1993). The site is home to 220 bird species, 49of which are endemic, and 84 mammal species, 15 ofwhich are endemic. Included are several species of birdof paradise and two species of tree kangaroo.
The CMWMA project seeks to help landownersdevelop eco-enterprise activities that link income-earn-ing opportunities with biodiversity conservation.Current activities include ecotourism, research as anindustry, and the making and selling of artifacts. Futureenterprises could include raising poultry, butterfly farm-ing, and organic coffee export. Once the current exter-nal collaboration ends, local partners are expected tocontinue managing the wildlife management area sus-tainably.
What Is an ICAD?The term Integrated Conservation and Development(ICAD) has a common usage in the Asia and Pacific
❖
3Testing the Effectiveness of Using a Conceptual Model To DesignProjects and Monitoring Plans for the Crater Mountain Wildlife
Management Area, Papua New Guinea❖
JOHN ERICHO, ROBERT BINO, AND ARLYNE JOHNSONSenior Project Officer, Research and Conservation Foundation (RCF); Field Research Coordinator, RCF;
and Technical Advisor, Wildlife Conservation Society (WCS); respectivelyCrater Mountain Integrated Conservation and Development Project
Goroka, Papua New Guinea

Measuring Conservation Impact22

region (Brown and Wyckoff-Baird 1994); in other areasof the world, ICADs are referred to as IntegratedConservation and Development Projects (ICDPs).Such projects merge the conservation agenda withdevelopment in relation to cultural and economic aspi-rations of the local population. The success of conserva-tion projects may stem from adequately meeting thesocioeconomic interests and needs of local people(Brown and Wyckoff-Baird 1994).
The ICAD concept is rapidly gaining momentumdue to its credibility with financial institutions anddonor agencies (Wells and Brandon 1993). Althoughconservation organizations still lack hard data validatingthe success of ICADs, these efforts can, if executed well,lead to prosperity. Monitoring, an essential part ofICAD projects, gauges and documents their varyingdegrees of success.
Governments and conservationists increasingly rec-ognize that they cannot simply create protected areasand ignore the livelihoods of indigenous peoples or locallandowners (Brown and Wyckoff-Baird 1994). InPNG, local people own the land and rely heavily onusing their natural and biological resources for their sur-vival. To displace or exclude people from the use of nat-ural resources because their land or forest is of biologicalimportance may be unethical.
PNG rural communities, such as those in the CraterMountain area, view themselves as living in poverty orare envious of the more developed areas of theirprovinces or more affluent areas of the country.Acquisition of products and money is an importantmeasure of wealth and status in Highland Bigman soci-eties; therefore, the drive to make a “quick buck” canbecome an imperative for individuals seeking status orpower. Hence, the ICAD approach is geared towardachieving conservation and, at the same time, providingeconomic and social returns to local people.
Designing the ICADDesigning an ICAD project in PNG, where landown-ership is vested in local people, can be a complicatedprocess. The pressure from landowners, who, in mostcases, have misconceptions about the project, bombardits proponents from all angles with demands for con-sumer goods, cash, and infrastructure development.
Landowners may have a hidden agenda motivatingthem to participate in conservation, depending on howthey perceive and interpret the actions and initiatives ofthe external collaborators, particularly during the pro-ject’s formative stages. In the village of Maimafu, for
example, prior to establishing the Wildlife Manage-ment Area (WMA), conservationists paid a certainlandowner 100 Kina (K) annually to refrain from hunt-ing birds of paradise on his land. The landowners whosigned onto the WMA project thought they too wouldreceive K100 annually for taking care of the wildlife ontheir land. The project now faces a series of chronicimpediments because of dissatisfied landowners.
Managers of an ICAD project must not capitalize onlandowner expectations for an easy achievement of con-servation. Conservation for the PNG situationinevitably involves people and their emotions, desires,and changing attitudes. Therefore, evolution of theideals of conservation should be synchronized with peo-ples’ changing perceptions, especially with regard tohow they view modernization and development.
PROJECT CHALLENGES
The list of CMWMA project challenges is long. First,the key to the project’s success is a loyal and supportiveoffice staff, since field personnel are often handicappedby isolation.
Second, project managers need to assess the potentialeffect of unprecedented actions, such as making mone-tary payments and providing materials for infrastructureconstruction. Present actions will result in lasting lega-cies that may impede a harmonious flow in the future.Communities welcome handouts, which may give riseto endless cases of landowner insurgencies that mightbe impossible to contain.
Third, the CMWMA project is a partnership oflandowners and external project proponents that is stillin the primary stages of getting people motivated. InPNG, there is no filtering process by which to selectlandowner groups that sincerely desire to conserve theirnatural heritage (Orsak 1996). Like their counterpartselsewhere in the developing world, most PNGlandowners have not yet come to terms with the massiveenvironmental destruction that development and nat-ural resource extraction schemes can cause. Presently,landowners are more focused on money, products, andinfrastructure development, believing they can easilyachieve these objectives by selling their forests.
Fourth, the CMWMA project is sensitive to pro-gressing in tune with local peoples’ understanding andtechnical capabilities. Funding agencies set limits to thelife span of projects, yet the task of educating an almostilliterate society about the concepts pivotal to environ-mental stewardship, such as eco-enterprise management
Ericho, Bino, and Johnson 23

and community-based WMA law enforcement, is terri-bly difficult. Prime activities of the CMWMA projectinclude training workshops and adult literacy classes.
Fifth, landowners must be active participants in allaspects of the project. Effective local participationextends beyond merely sharing the project’s social andeconomic benefits. The project must also mobilizelandowners to manage their resources, make decisions,and control activities that affect their lives (Cernea1985). External project collaborators must continue tobe sensitive to the capacity of landowners during theproject’s start-up. For example, an eco-enterprise ven-ture in the CMWMA that centered on the Ubaigubilodge failed, in part, because the local community wasnot adequately prepared to understand or to run it(Pearl 1994).
Finally, PNG’s local people own 95% of the land in acorporate fashion by virtue of the clans. For the ICADconcept to be workable in Crater Mountain, it must beparticipatory. A broader distribution of money-earningand related opportunities for the community is a princi-pal challenge of the CMWMA project. Unless benefitsgenerated by the eco-enterprises reach the various levelsof the community, dissatisfied members will continue tobe antagonistic to the project.
THE CONCEPTUAL MODEL
Given the challenges discussed above, careful planningis required. The conceptual model becomes an indis-pensable tool for project planning.
What Is a Conceptual Model?An effective way to devise monitoring protocols andestablish institutional structures and administrative sys-tems to consolidate an ICAD project is to conceptual-ize it (BCN 1995). This process involves constructingmodules of the various project factors in sequence, witharrows indicating the flow and nature of these relation-ships. The result is a conceptual model—a diagram-matic representation of the overall plan of action,integrating all these linkages into a holistic picture thathelps clarify the goals and objectives of the project.
Usefulness of a Conceptual ModelIn the CMWMA project, field personnel are most sus-ceptible to committing impulsive errors when they arecontinuously pushed by the demands of landowners. Insuch circumstances, the conceptual model has provenuseful in providing guidance, such that each action
contributes to the ultimate goal of biodiversity conser-vation. The CMWMA project uses the conceptualmodel to set priorities for resource personnel selectionand budgeting. Project administrators use the concep-tual model to spend limited conservation dollars onspecified targets. Where a planned project activity hits adead end, the model provides a means for identifyingalternatives. At a field personnel level, staff can arrive at8:00 a.m. on Monday mornings knowing specificallywhat to do.
It is argued that the proponents of any project for-mulate a conceptual model in their minds before it isconstructed on paper. The physical formulation of aconceptual model, however, is a revelation of those ideasthat allows the effective dissemination and implementa-tion of the model.
The conceptual model delineates potential areas formonitoring, a crucial aspect of the CMWMA project.The impact of the project can be a chain reaction, andthe conceptual model helps reveal the links in the chain.Project successes and failures can be monitored at thesepoints. With the application of the conceptual model,this multidisciplinary approach can engage appropriateexpertise in the respective target areas of monitoring.
METHODS
Model DesignThe construction of the conceptual model for theCMWMA project followed instructions given during aBiodiversity Conservation Network (BCN) workshopin the Philippines. The first step was to state the ulti-mate goal of the project, biodiversity conservation. Thesecond step was to list the major factors, variables, andthreats that affect the target condition. These wereenclosed in boxes, which were then linked by arrows toindicate their respective causal relationships. For conve-nience, the factors and the final target condition werewritten on small paper boxes, which were then freelymoved, deleted, combined, or modified during theprocess of model construction. Then the workshop par-ticipants identified the factors and threats that can beinfluenced by some project activity or intervention asso-ciated with specific target points on the model.
The activity or intervention was encircled and super-imposed on the factors, variables, and threats on themodel. This presentation worked well using two sheetsof transparencies, the first containing the conceptualmodel and the second containing the interventions. Bysuperimposing the second transparency over the first,
Measuring Conservation Impact24

plans to influence trends toward the target conditioncan be clearly expressed.
FunctionsThe CMWMA conceptual model identifies projectobjectives and highlights opportunities for monitoring.Formulating a conceptual model is an evolutionaryprocess, however, and the current list will likely expandwhen new perspectives of the model are considered.
Events and ActivitiesEvents and activities bring the conceptual model to life.Events refer to the project planning phases, where pro-ject staff and consultants put the “nuts and bolts” of themachinery together, in a way that most closely repre-sents the site conditions. Activities refer to on-siteactions and involve both project staff and communitymembers working in partnership in response to com-munity needs. The project staff oversee the overall plan,but the community dictates the activities. The projectanticipates that, by being active participants, local peo-ple will appreciate the ownership issue and approach itconfidently.
Assessing the Model’s EffectivenessThe identified functions of the model were compared totheir respective utilities by listing a function and thenattaching a sample event or activity to it derived fromreal-life site experiences from the CMWMA project.The process was intended to address the usefulness andeffectiveness of the conceptual model.
RESULTS AND DISCUSSION
The results and discussion are combined, since theresults are ongoing and will be observed incrementallythroughout the project’s life. The results are only anec-dotal. The functions of the conceptual model are listedand compared with the events and activities.
Development of the Conceptual ModelThe conceptual model has evolved and may continue todo so. The initial model built in September 1995(Figure 2) was modified in May 1996 (Figure 3). Thesemodels are indicative of the changes a model canundergo. The model basically depicts the site situationsas accurately as possible. However, as the wholemachinery is put into operation, the weakness of themodel will become apparent, and then the reiterationprocess will come into play.
Project designers identified the interventions afterreviewing the initial site report and constructing theconceptual model. The objectives were then derivedfrom the interventions to meet the needs of thelandowners who will respond by managing theirresources in a sustainable manner. The interventions areshown in the four oval shapes on the conceptual model(model 1, Figure 2). The objectives listed below under-went rigorous scrutiny; thus, from the initial five objec-tives the final four listed below were identified. So theconceptual model not only changed itself but also iden-tified and changed the objectives.
• Objective 1. Increase the average annual per capitaincome of clans (landowning groups) over the nextthree years by establishing locally owned research andecotourism enterprises in the WMA.
• Objective 2. Over the next three years, increase thelevel and range of understanding and skills of com-munity residents who work in the research and eco-tourism enterprises in the WMA.
• Objective 3. Over the next three years, increase thenumber of decisions and actions that integrate theresults of enterprise, biological, and socioeconomicmonitoring programs into the working managementplan.
• Objective 4. Over the next three years, increasenational involvement and human resource exchangewithin the WMA as teachers, trainers, and consul-tants working towards conserving natural resourcesin the WMA.
Functions of the Conceptual ModelThe functions identified below have been divided intotwo categories. The first nine functions refer to theidentification of the objectives and their utility, whilethe tenth deals with monitoring.
1. Identify project interventions and objectives.
2. Catalyze project pieces to form cohesive picture.
3. Identify resource people and what they can con-tribute.
4. Identify overlaps with non-CMWMA-affiliatedinterests.
Ericho, Bino, and Johnson 25

5. Assist project staff to prioritize actions.
6. Assist project staff to respond to landowners.
7. Serve as a communication tool between projectplanners and implementers.
8. Guide community and local participation.
9. Identify financial needs for project implementation.
10. Pinpoint targeted areas for monitoring.
Events and ActivitiesThe events and activities identified during the modelconstruction process are listed below. By comparingthem to the functions, a holistic picture of the project’sevolution emerges, showing how the conceptual modelguided that evolution.
Events• Formulation of project proposal• Manila monitoring and evaluation workshop• Wara Sera monitoring and evaluation workshop• BCN meeting at Herowana• Quarterly project staff meetings in Port Moresby• Monthly field staff meetings in the WMA• Monthly and semi-annual reports by field staff
Activities• Nahinamo meeting• WMA annual meetings• Monthly management committee meetings• Site visit to impact areas• Artifact business committee meetings• Trained local observer (TLO) workshops• Research assistant training course• Guest house and research station management
training
Measuring Conservation Impact26
Figure 2
Initial Conceptual Model of the Crater Mountain Project—September 1995

Ericho, Bino, and Johnson 27

• Biological surveys• Setting aside land for conservation• Tourism guide training course• Adult literacy course• Population intervention• Community school instruction• Socioeconomic surveys• Land use surveys• Artifact buyers workshop• Money management course• Promoting the education of landowners• Using village agents to monitor the wildlife export• Establishing a new business structure development to
effect maximum cash needs• Interest by corporate bodies for resource extraction
ComparisonsBelow, the functions are compared with the events andactivities in order to highlight the usefulness of the con-ceptual model.
Function 1: The Conceptual Model Identifies ProjectInterventions and Objectives.The objectives of the project can almost be gauged fromthe conceptual model. The oval shapes in the conceptualmodel (model 1, Figure 2) represent interventions, and theobjectives are derived from them. The interventions thatare listed inside the oval shapes will be executed in the fieldfor the achievement of the objectives that they spell out.The following subfunctions list events and activities thatelaborate the process of project objective identification.
Function 2: The Model Catalyzes Project Pieces To Forma Cohesive Picture.The conceptual model must illustrate the overall pictureof what the project is doing and intends to achieve. Theobjectives must be built into the model framework sothat the actions leading to that objective are self evident.The pieces, at first glance, might be jumbled, but thearrows link the pieces to form a cohesive whole. Somearrows might confound the uninitiated, but carefulobservation complemented with the text will soon bringenlightenment. This should allow one to combine all ofthe pieces into a whole that is both meaningful andreachable. We will pursue the models development inthe rest of this section to bring this aspect into focus.
Activity 1: Nahinamo meetingIn early 1993, WCS engaged a lone and roving fieldcoordinator named Seldon James to conduct a massive
educational awareness campaign concerning environ-mental issues and biodiversity conservation. He com-municated to Crater Mountain communities many ofthe ideals and concepts of linking biodiversity conserva-tion to eco-enterprise prosperity, and created a follow-ing mainly because of his approach in dealing with thelocal people. Although he was alienated from the localsby his skin color and culture, he was able to merge wellwith the people by eating their food and sleeping intheir houses. Because of his success in getting them toregard him as one of their own and yet being different,people would listen attentively to his revelations. CraterMountain communities had sufficient time to properlyassimilate these new ideologies. Whether they fullyunderstood the content was a different matter.
A combined forum was organized in October 1993 toinvolve Crater Mountain communities at a place calledNahinamo. The ICAD concept appeared to have gainedpopularity because of the products and money associatedwith development. People complained of the lack of vitalgovernment services and economic opportunities. There-fore, their involvement and participation was mainly forthe material benefits they could reap from such a venture.They didn’t fully understand what they were bargaining forin regard to the conservation agenda because they were sofocused on the tangible benefits from the project.
During the Nahinamo meeting, all the external col-laborating parties in the CMWMA project had someclear indications of what their plans would be and ageneral sense of direction toward establishing a viableproject. The partners reached the following resolutions:
• Resolution 1. The project endorses the idea ofresearch as a development activity that can provide analternative form of income and, at the same time,help local communities look after their forest.
• Resolution 2. The Crater Mountain Village wildlifecommittees would function as leaders should the areareceive support for an ICAD project. Potential rev-enue earning would be distributed by rotating indi-viduals in each clan.
• Resolution 3. The participating clans would set asideland for total protection and any violators would befined ( James 1993).
Event 1: Formulation of the project proposalFollowing that meeting, in 1994 the project proponentsreceived a planning grant that enabled them to pool all
Measuring Conservation Impact28

their nebulous ideas into a document with coherenceand substance. The proposal enlarged the three resolu-tions above to include the whole repertoire of activities,monitoring protocols, workshops, meetings, infrastruc-ture establishment, equipment, expertise, and thefinances needed to implement the whole package inthree years. Although hidden, the goal and the objec-tives were present. A conceptual model was especiallyneeded to bring forth the related and interrelatedness ofthe whole document, particularly the interventions andobjectives.
Event 2: Manila monitoring and evaluation workshopThe physical formulation of a conceptual model did notoccur until after a BCN-sponsored meeting in Manila,Philippines, in September 1995. During this workshop,the usefulness of designing and utilizing a conceptualmodel became clear. The formation of a conceptualmodel for the CMWMA ICAD project crystallizedthese rather elusive structural and conceptual compo-nents of the project. The skeletal ideas in the resolutionslisted above were discussed and enhanced.
Event 3: Wara Sera monitoring plan workshop(Revisitation of the objectives)After the Manila workshop, the Crater Mountain pro-ject staff met at the Crater Mountain BiologicalResearch Station (CMBRS) in the heart of the WMAat Wara Sera in November 1995. The objectives of themodel were revisited at the Wara Sera workshop, inorder to make them more holistic and cohesive. At theManila workshop, the organizers emphasized that “reit-eration” is the key to success. The finished product inManila was never a “finished” product as it is as variableas the landscape, the people, and the natural systems thatoperate at these sites. The second model might have tobe revisited depending on the progressive circumstancesand situations. Workshop participants scrutinized themodel, revisited the objectives, weighed each wordagainst the evidence, deleted whole sentences, and addednew words and sentences. The original five objectivesunderwent such rigorous dissection that one was foundto be wanting and was incorporated into another to formfour final objectives. The outcome was a concise, mea-surable, time-bound, achievable set of objectives.
Event 4: BCN meeting at Herowana (Conceptual modelrevisitation)During this January 1996 meeting at Herowana, theconceptual model assembled in Manila came under
intense scrutiny. BCN’s critical analysis reassessed thepathways inherent in the conceptual model. Thisresulted in the derivation of the existing model, whichproposed to accommodate every objective of the projectby realigning activities to be more realistic and reach-able.
BCN thought the reiteration process was so impor-tant that it sent some of its officers to visit theCMWMA project team. It became evident that wewere limiting ourselves in our first model by affixingtopical headings (e.g., policies, services, human condi-tions) to the respective factors in model 1. BCN becameour “extra pairs of eyes” to make constructive criticisms.One can be so engrossed in what one thinks is the cor-rect model indicative of the real site conditions that theobvious is not always clear. After the BCN visit, theproject staff met again to derive the second model(Figure 3).
Function 3: The Conceptual Model Identifies ResourcePeople and What They Can Contribute.It appears that the success of the CMWMA projectdepends on a multidisciplinary approach. The immedi-ate project staff cannot accomplish a project of the sizeand nature of the CMWMA. Resource people with avariety of training and backgrounds are needed.Although the proposals would enlist the required per-sonnel, the conceptual model is a better and faster toolfor identifying needed expertise. The staff can interpretthe pathways and relationships of the conceptual modelto find the respective resource personnel to employ atspecific target intervention and action points.
Planning involves both field and office personnel. Atquarterly meetings for the scientific program staff inPort Moresby, for instance, the field staff report on fieldsituations and expertise requirements, and appropriateactions are taken or expertise is solicited from variousprofessionals and technical experts. In this section,events and activities that depict this function are high-lighted.
Activity 1: WMA annual meetingsThe conceptual model assists in identifying resourcepersonnel from the provincial and national govern-ments, corporate bodies, private sector, and other non-governmental organization (NGO) groups that canhelp distinguish land and management issues for projectstaff to incorporate into alternative plans. The purposeof the annual management committee meeting is for allplayers concerned with the project to identify problems
Ericho, Bino, and Johnson 29

and successes and develop alternative plans for the nextyear. In the 1995 annual meeting, for example, resourcepersonnel who were requested to participate included:(1) a representative from the Tourism PromotionAuthority, the national government statutory bodyresponsible for developing tourism; (2) the chairman ofthe RCF board, and; (3) a representative from theDepartment of Environment and Conservation arm ofthe national government.
Community representatives got together to formu-late the WMA laws and policies that will be recognizedby the government. They also deliberated on the servicecharges in various categories and agreed to charge a uni-form rate for all services provided to visitors to theWMA. They took a bold stand by disallowing resourceextractors to enter the WMA. This is bold in the sensethat the community does not like the legislation thatproclaims government ownership of everything twometers below the surface soil. It was a rewarding andenlightening exercise for all who participated. This hashappened at each of the annual meetings so far, and weplan to continue this rewarding practice.
Activity 2: Education and trainingObjective 2 of the conceptual model is to increase theknowledge and skill level of selected landowners. Wewill solicit outside personnel to accomplish this in theareas of business and financial management, hospitality,tour guiding, community-based WMA law enforce-ment, research assistantship, para-biological monitor-ing, and literacy and basic arithmetic courses. Field staffcomprised of volunteers who are usually highly trainedprofessionals will conduct some of the training, but theycannot hope to accomplish everything. We must solicitthe balance of the expertise from the outside to bringabout the desired change in the landowners.
Activity 3: Trained Local Observer (TLO) workshopThe conceptual model shows that training is requiredbut does not state the specific nature of the training.Monitoring is paramount and is one of the most signif-icant areas. Trained local observers are people electedand trained from the community who show promiseand who also have some rudimentary formal education.The project organized a TLO workshop to train localparticipants in biological monitoring using such basictools as a ruler, tape measure, and watch to assist theresearcher. Local participants were brought to a site, andresource people were shuttled in to do the training. Allthe research fellows, a scientist from CRC and
CMWMA’s scientific project staff assisted with thetraining. Now the project boasts of at least 12 suchtrained local people.
Activity 4: Research assistant training courseThis was the first training course implemented in theWMA. Some of the trainers were brought in from theoutside. One was a research fellow studying megapodes,and two of them were WCS field coordinators. Thiscourse and the TLO workshop revealed many inade-quacies in the content and methods. It reflected on themethods used by the instructors, which are not consis-tent with the learning experiences of the trainees.
Activity 5: Artifact buyers workshopThe conceptual model emphasizes that all CMWMAsites should develop the tourism industry. This includesinfrastructure, services, and artifacts. Artifact businesshas become popular and is flourishing. Because thebusiness is new and some of the artisans are inexperi-enced, the quality is sometimes low and the pricing isexorbitant. In order to prevent the business from failing,in September 1994, the project organized a buyersworkshop. Three buyers from artifact-buying firmscame to the workshop and discussed how quality influ-ences the buying power and the pricing of items. Theyhad examples and pointed out the difference betweenpoorly crafted and well-crafted artifacts. Participantsalso discussed overseas buyers and their preferences andfreighting plus other associated costs.
Activity 6: Market and socioeconomic surveysA multidisciplinary approach to accomplish what theconceptual model requires is a must. In February 1996,a British volunteer expert seconded by the BritishHigh Commission conducted a market survey ofCrater Mountain products in terms of potentialdomestic and international markets. The investigationfocused on the potential of tapping into the existingmainstream adventure tourist packages in operation inPNG. The survey also assessed the potential for sellingCrater Mountain products under a patented trade-mark.
In early 1996, a University of PNG social anthropol-ogy honors student conducted the first socioeconomicsurvey for the CMWMA. As part of his thesis, the stu-dent visited and surveyed the villages of Haia,Herowana, and Maimafu. The project’s field staff willcontinue socioeconomic surveys with occasional outsideexpertise. As expressed in the conceptual model, the
Measuring Conservation Impact30

interventions are designed to offset pressures on theenvironment caused by the socioeconomic needs of thelocal population. These surveys are to measure whetherthe interventions achieve this goal.
Activity 7: Land use surveysPopulation growth leads to destructive forestry prac-tices. The project must intervene in order to foster more“closed” forests or conservation areas. The projectrequires a land use survey to gauge the extent of forestclearing for crop cultivation, cash crop plantations, andnew settlements. Project staff will use the informationthus garnered for the realization of Objective 3, whereit will aid in the development of a working managementplan.
Foreign expertise in the form of doctoral candidatesin both anthropology and human geo-ecology wouldassist in this area in some parts of the CMWMA. Twostudents have expressed interest in doing their disserta-tion research in the Crater Mountains, working withthe local people on land use practices.
Activity 8: Empowering the landowners to enforce lawsmade by themselvesThe conceptual model envisions that local commuitieswill in the future enforce the laws and manage theWMA. This relates to another prime focus of the con-ceptual model, which is to empower the local lawenforcement agency at the village level. A community-based institution will enforce the WMA rules and lawsset by the Crater Mountain management committees,but that institution must overcome the hurdles of the“Wantok System” (nepotism). The collective commu-nity management structure has always been a loose one,and it did not anticipate the intricacies and the com-plexities of the Western economic management struc-ture. Illiteracy compounds the problem. How do weengineer a management body that has the capacity andthe modern economic sense to manage? At variousvenues we bring in resource people from the govern-ment departments to empower the communities toenforce laws and build the capacity of our field staff tomanage. We must provide this support for some timebefore the people can function independently. It is along, hard process.
Function 4: The Conceptual Model Identifies Overlapswith Non-CMWMA Project-Affiliated Interests.There are agencies within the WMA with their owninterests and purposes. The conceptual model has suffi-
ciently accounted for these interests. It is important tonote whether there are areas of overlap and convergenceof these interests with those of the project. Once theseare recognized, care should be taken in soliciting thecooperation, loyalty, and support of these interests. Inaddition, the activities and plans of the project shouldalso be sensitive to the well-being and prosperity ofthese institutions. By doing so, the project courts thecommunity at large to support the conservation effort.This is vital for Crater Mountain since a trace of dishar-mony or lack of consensus might result in unwarrantedimpediments. The competing agency may sabotage theefforts and potential achievements of the CMWMAproject. Some form of dialogue and understandingshould persist between these village-based agencies andthe CMWMA project. Some of these interests will belisted and discussed below.
Activity 1: Government servicesSchools. The conceptual model recognizes instruction,related to conservation, to enhance learning as an inte-gral part of the project’s objectives. Therefore, some ofour field staff intervene when requested or required. Atthe Maimafu community school, for instance, the head-master allocated one hour each week to the residentfield coordinator for specific instruction to his class onthe ideals of conservation. During these sessions, thefield coordinator gave short presentations and designed“fun” activities with a conservation theme for the stu-dents. The headmaster reserved a small section on thebulletin board dubbed the “environment corner” for thefield coordinator to display articles and pictures on envi-ronmental and wildlife issues. When U.S. Peace Corpsvolunteers come to Maimafu, it is believed that they willeffectively assume this responsibility.
At one community school, the teachers are at oddswith the project personnel, and thus this importantavenue for community outreach may be blocked. Avarying degree of style and taste in approaches will haveto be used in effectively disseminating the conservationmessage to different members of the community. Someof the approaches have been World Environment Day( June 6) celebrations at the schools with posters, videoshows, slides, and speeches. Others have been throughmonthly meetings, annual meetings, and other meetingsand workshops organized by the project.
Local and provincial government. The conceptual modelrecognizes the importance of government policies andalso highly regards community-level government par-
Ericho, Bino, and Johnson 31

ticipation. The village councilor and politicians havetheir political ambitions and prestige to maintain. Theseinterests may differ from the goals and objectives of theCMWMA project. In the village of Maimafu, projectstaff have made tireless efforts to consolidate the inter-ests and fidelity of these influential figures. Both politi-cal figures have been involved in programs and activitiesoutlined by the conceptual model, and it is hoped thatthis will nurture their interest and support in theCMWMA project. These two politicians have thus farpledged financial support for WMA activities, i.e.,money to pay labor for the construction of a “TumbunaHouse” and the Peace Corps volunteers’ house atMaimafu. The Tumbuna House will serve as a storageand display area for artifacts, as well as office space forthe project.
Community health (Aid Post). The project can use thevillage Aid Post Orderly to maximize the campaignagainst population expansion by implementing familyplanning workshops and programs. In villages whererural agricultural officers are based, the assistance ofthese resource personnel can be used in educating thecommunity in new agricultural practices conducive tothe WMA goals and objectives. The project must besensitive toward creating an atmosphere that fosters theinterest and involvement of these officers for the bene-fit of the project.
Churches and missions. The church is another importantvillage-based institution. The CMWMA communitieshave had missionary contacts for several decades. Inmany cases, the missionaries were responsible for break-ing the frontiers of cannibalism and witchcraft and forestablishing order and peace. These missions havereplaced the government in providing essential servicessuch as health, education, adult literacy, trade, andtransport. Therefore, apart from spreading the Christiangospel, these missions have been the “government” tothe people. These missions have formed an intricatepart of people’s lives and, in turn, cast a net of owner-ship over their converts. In order for the CMWMAproject to prosper, there is need for a high degree ofcooperation and partnership with these institutions.
Activity 2: Interest by corporate bodies for resourceextractionThe conceptual model, by implication, excludes alllarge-scale resource extraction, though the resourceowners can do so by choice. The boundaries of the
CMWMA project area encompass resource-richregions with high potential for logging and mining.Generally, the cash needs of Crater Mountain commu-nities appear to transcend all categories of rational deci-sion-making concerning environmental stewardship.This fact continues to threaten the integrity of theCMWMA project. In addition, the absence of a centralplanning agency in the PNG bureaucracy (Post-Courier1995) further complicates the situation. Ideal examplesof this situation are reflected in (1) the issuing of anexploration license to MacMin NL to do mineralprospecting within the CMWMA and (2) the inclusionof parts of the CMWMA near the Purari River to theTurama Forest Products Timber Rights Permit. In bothcircumstances, there was no central bureaucratic agencyto orchestrate the interests of the CMWMA as a rec-ognized wildlife management area. Political interfer-ence and bribery at the local level by resource developersare additional concerns. The project staff must serve asinformants and negotiators in the absence of an orga-nized and recognized legal body in the WMA.
Function 5: The Conceptual Model Assists Project StaffTo Prioritize Actions To Fulfill Project Objectives.An ICAD project implemented without a sound con-ceptual model can be synonymous with navigating with-out a map or a compass. The conceptual model maps thearray of mechanics of the project. This map enables pro-ject managers to plan detours and alternative routesapart from the terminal points for intervention and pro-ject activities. Each set of players at every phase in theproject must understand what it has to accomplish. Weat the Crater Mountain project are using the model atevery phase to plan and to prioritize our actions. Someof the activities that depict this are elaborated below.
Event 1: Monthly field staff meetings in the WMAField staff use the conceptual model to assess whethertheir individual and combined efforts are moving notonly in the right direction but also at the right pace andin concert with the fulfillment of the objectives. If allthe field staff working at a particular site focus on theirrespective “little worlds” without interfacing, they arelikely to fly off at various tangents. To avoid such cir-cumstances, the CMWMA field staff meet at regularintervals to refresh and reorient themselves. The variousfield personnel have their respective duties and interestareas. However, these should overlap for the smoothrunning of the project. They also set their priorities forthe month and scrutinize previous efforts.
Measuring Conservation Impact32

Event 2: Quarterly staff meetings in Port MoresbyThe field staff conduct their work at various locations tofulfill the requirements of the project objectives as spec-ified by the conceptual model, while the office staff arebased at the headquarters in Port Moresby. The differentsites present varying scenarios, hence each staff experi-ences varying degrees of successes, accomplishments,and failures. Thus, it is imperative that staff get togetherat a central location on a regular basis to exchange ideasand information. By doing this, the larger picture willremove any sense of gloom at respective sites, providehope, and invigorate staff to pursue purposeful activitiesin the future. Field staff gather every three months in theheadquarters in Port Moresby. In these meetings,accomplishments of the past three months are reviewed,and plans for the next quarter are made accordingly.Some actions might become redundant, while others areincluded in the coming quarter. Staff write and compilereports for the benefit of donor organizations, makeappointments with resource people, and set dates forfield meetings or workshops.
Event 3: Monthly and semi-annual reports by field staffThe project will obviously face difficulties if the fieldstaff are working together while the office staff are keptin suspense, and the latter has nothing to do with theformer. The two groups must be kept informed for theproject to have any sense of continuity, harmony, andaccomplishments. The Port Moresby headquarterssends bulletins of upcoming events, workshops, staffmovement itineraries, and a listing of visitors to theWMA so that the field staff are kept informed. Thefield staff submit monthly and semi-annual reports forthe benefit of the office staff and the board of directors.Donor agencies also require these reports so they knowhow the project is spending their funds. The projectuses these field reports to prioritize its actions. Withoutthis flow of information in both directions, the concep-tual model will have no strength, for information is themainstay of any venture.
Function 6: The Conceptual Model Helps Project StaffRespond to LandownersThe conceptual model was structured by looking at thevarious needs of and areas impacted by the landholdersand how project proponents can intervene to minimizedestructive use of delicate natural systems. Consider fora moment a situation in which two disparate groups ofpeople with distinct educational backgrounds, accom-panied by a varying array of cultural consciences, expec-
tations, hopes, and aspirations, pledge to work togetherfor a common goal. Both groups need to be sensitive toeach other’s interests and purposes. The objectives ofthe conceptual model are built into the structure so thatproject staff can easily point them out to the landhold-ers. The big question in the minds of the landholders inthe CMWMA is why are we there. They questionwhether we have a hidden agenda or will make a quickprofit at their expense. Landowners are overly suspi-cious, with the communities divided in their support ofthe project. Some are staying in the mainstream to seewhat will happen, while others look on from the periph-ery. A number of events that respond to the landownersquestions are discussed below.
Activity 1: Artifact business committee meetingsThe conceptual model demonstrated to landowners thatthe artifact business is not the only eco-enterprise activ-ity planned. The artifact business will help satisfy thegrowing cash needs of the community. It is already anestablished entity bringing in much needed cash. Thestaff are fighting for a managed approach to the extrac-tion of natural resources for use by the artisans; other-wise, these resources will be depleted and the projectwill have negated its original goal and objectives.
While the locals are already receiving money fromthese ventures, the taste of having some money drivesthe need to get more. As far as they are concerned, theenterprises are not big enough to meet their cash needs.The artifact business has already been successful butexerts pressure on the natural system, which may sabo-tage other eco-enterprise ventures within the WMA. Itis envisioned that the local artisans will recognize thatsustainable extraction practices of the natural resourcesand their associated linkages are indispensable for thesustainability of this enterprise. To maintain that sce-nario, the business committee meets once a month tostay on track. Here the business and monitoring regimeswill complement and make linkages to each other. Thebusiness enterprise must make sure, through monitor-ing, that conservation is achieved.
Activity 2: A new business developmental structure foralternative sources of incomeThe CMWMA conceptual model identifies opposingagencies and helps navigate potentially deviant businessventures onto a suitable track. The Crater Mountainproject’s field enterprise development officers havedesigned and will incorporate landowner companiesthat will be self-sustained and managed through profits
Ericho, Bino, and Johnson 33

earned from eco-enterprises. Clans will operate businessgroups as separate entities at respective CraterMountain communities, but they will amalgamate intoa parent company governed by a board of directors.Members of the board will be selected from core land-holding groups in the management committees in theCMWMA communities. The project envisions anumbrella company for the entire WMA. Landownerswill become shareholders of these companies, in whichall decision-making and purchasing of WMA supportservices will come directly under their control. Theirarticles of business will legally delineate environmen-tally friendly business ventures that these landownercompanies can operate.
A substitution strategy is necessary to compensate thelandowners for their denied access to resources. TheCMWMA conceptual model aims to design and tointroduce alternative, compatible, and compensatorymeans. For instance, the new business development pro-gram will attempt to establish poultry projects plus oth-ers with similar intentions to provide an alternative to theprotein that would otherwise be obtained from the forests(Figure 4). Since such projects cannot be directly linkedto biodiversity conservation, they are inclined to competewith the goals and objectives of the project. Care and sen-sitivity must be taken to avoid such conflicts.
Event 1: BCN meeting in Herowana and the communitiesagendaThe conceptual model was used to assist in bringinginsight to the landowners and making them aware that,if they want material things, they will have to earn
them. This meeting revisited the conceptual model, buta side issue stemmed from this meeting with thelandowners. The project staff were concerned about themodel and how all parts fit together, but the landown-ers were impatient about the expected results taking toolong. They wanted to know when the promised hydro-electric scheme was going to be set up, and whether theproject would build a green coffee factory for them. Thelandowners questioned why they were not getting paidfor the work they now did for the project as they hadbeen in the earlier stages.
Local landowners are people who plan to do thingsimmediately. They easily get impatient when things failto materialize sooner than expected. Their culturalmethod of planning does not require money or a hard-and-fast planning method. They plan as they work, withideas coming from everyone. How are we to tell themthat planning and organization take money, time, andenergy? We can only be patient, keep working withthem, and hope that they will soon see the light at theend of the tunnel.
Function 7: The Conceptual Model Serves As aCommunication Tool between Project Planners andImplementers.The conceptual model is clearly useful as a communica-tion tool. It helped project staff and planners alleviatethe cumbersome procedure of moving between the dif-ferent pieces of project documents. With the conceptualmodel, all the integral components of the project arepresented at a glance. In the Crater Mountain project,the staff at each village site used the conceptual modelto plan their monthly activities. All field and office staffuse it during their scheduled meetings and at the end ofthe year when the annual plan is being determined forthe new year. It is also used at meetings, workshops,and other training events related to the project so thateveryone involved stays tuned to the progress of theproject. With the conceptual model, intervention activ-ities can be effected uniformly across all of the CraterMountain communities.
Activity 1: WMA annual meetingsA pictorial or diagrammatic representation of the con-ceptual model’s individual pathways is presented atthese meetings, as the landowners may not be able todigest the whole model at once. During these meet-ings, the project attempts to convey to the landownersin simplistic terms various aspects of activities anddecision-making.
Measuring Conservation Impact34
Figure 4
Proposed Company Structure—GIMI Investment Pty Ltd.
Event 1: Monthly field staff meetings in the WMAProject staff consult the conceptual model at thesemeetings to avoid the danger of field staff acting tan-gentially to the goals and objectives of the project.Therefore, the conceptual model is vital in fosteringuniform field personnel duties, actions, and responsibil-ities.
Function 8: The Conceptual Model Guides Communityand Local Participation.The conceptual model indicates how we are attemptingto strengthen local institution managers by communityparticipation without providing money or products.Local participation and ownership are crucial for themaintenance and sustainability of the project. The pro-ject’s objective is to cultivate and to nurture local own-ership. Here we are emphasizing that the managementcommittee must make all decisions as to how thingsshould happen, where things should be, and how moneyshould be spent or divided. Then the local people willappreciate the ownership issue. The CMWMA projectplans to achieve this by encouraging the communities tocontribute their time, labor, materials, and land to pro-ject-related activities free of charge. However, this con-flicts with the cash economy ideals of the locals whoexpect products, cargo, and monetary rewards for theirtime and efforts in project-related activities. The propo-nents of the CMWMA avoid this expectation, as it willonly continue to alienate the sense of ownership of theWMA by the local population. But it is still a sensitiveissue.
So, are we to guide community participation in acohesive and forced manner? Are we to solicit a partic-ipatory approach by gentle persuasion? If we follow theformer course of action, will the landowners ever antic-ipate ownership status of the enterprises or theCMWMA project for that matter? If the latter courseof action is pursued, will the landowners ever partici-pate, and if they do, will they willingly contribute theirtime, effort, and resources free of charge? For instance,if the landowners are paid to build a house, they will doso in two weeks flat. If they are not paid for a job, suchas for the construction of the U.S. Peace Corps volun-teers’ house, it will take forever. In the CraterMountains, we are maintaining both methods. Attimes we pay the locals, and at others we do not,depending on how people will respond. We are usingthe gentle persuasion approach at most sites and hopethat this will ultimately succeed. We use persuasion inthe following ways:
Activity 1: Monthly management committee meetingsAt this venue, landowners may make decisions, rules,and sit as judges through the management committee.Community participation is difficult to attain wheneach household has its own agenda or schedule. If onewere to call a meeting, a few individuals might make anappearance and the most committed persons might. Toavoid such problems, in the Crater Mountains we haveorganized the landowners’ management committee, arepresentative committee that we use as a vehicle for thedispersal of information in both directions and formaintaining a discrete body to train as managers. Everymonth at a regularly appointed time, a meeting is calledfor all the members in which all matters relating to theproject are discussed or disseminated. This assembly isencouraged to educate their clan members to respond tothe project agenda and make appropriate contributionswhere necessary. They make decisions on the use ofland, building houses, and use of their money, producefinancial reports, and announce upcoming events. Themembers are expected to pass along information, butbecause this does not happen, some meetings are “open”so all can attend.
The field staff must look for avenues to connect witheveryone in the community. If the management com-mittee members are only elders, then the younger gen-eration is isolated. If the committee consists of onlymen, then it isolates the women. A committee thatreflects a balance of older and younger members andmen and women is a healthy compromise for the main-tenance of influence from age discrepancies and genderdisparities. In the Crater Mountain project, we areworking to achieve this committee composition.
Activity 2: Money management trainingThe conceptual model indicates that educating thecommunity in money management and budgets mayrelax the strain on the current trends pertaining to thecash needs of the community. They must be instructedon how to save and to make investments. Perhaps thisstrategy may aid in soothing the pressing levels of cashneeds for landowners simply by changing people’s cur-rent attitudes toward the use of money.
One of our objectives is to train people to managetheir resources, but more so their personal income gen-erated by the project. It appears, in most instances, thatthere is enough cash in circulation within the localeconomy which, if managed well, may cover the cashneeds of the local population. The bride price custom,particularly in the Gimi-speaking and highland com-
Ericho, Bino, and Johnson 35

munities of the Crater Mountains, tends to quicklydrain hard-earned cash. Bride prices are rising so fastthat they may drain all earnings from coffee for a par-ticular family. Even if a family did have money, it wouldnot want to use it on immediate needs. For instance,parents may be reluctant to use the cash they have tosend a sick child to a bigger hospital for medical treat-ment. All cash they earn is usually for cultural obliga-tions and commitments to perpetuate a display of theirstatus in the society.
Activity 3: Education of landowners for employment inresearch and ecotourism enterprisesEducating and training the local population in theideals of conservation and the expertise required to suc-cessfully manage their business ventures is a principalfocus of the CMWMA project. Training landowners asTLOs, research assistants, tour guides, and visitor ser-vice workers is an activity that will increase the self-esteem and well-being of landowners. This will beaccepted in the absence of literacy conducive foremployment in the community. It is apparent also thatthe employment of indigenous people as trainers andteachers will be more effective, as they will interfacewell with the locals, especially from the cultural per-spective. The transfer of knowledge and expertise canbe more effective and hassle-free with this approach.The CMWMA project is also planning to secure fundsto offer a high school scholarship for potential studentsfrom CMWMA community schools. It is hoped thatthis scheme will encourage the youths from these com-munities to pursue a high school education. After com-pletion of their education, these men and women willbe instrumental in educating their people, providingsound management of the eco-enterprises in their vil-lages, and making linkages with biodiversity conserva-tion.
Function 9: The Conceptual Model Identifies FinancialNeeds for Project Implementation.A project proposal is not written for its aesthetic beautyor psychological soundness, but to perpetuate funding.The proposal looks at the number and types of inter-ventions required and the inherent costs. Because con-servation dollars are limited and scarce, justification andcost saving are the rules of the game. Every action listedspells money, and if anything, these actions must besmart: sound, measurable, achievable, reliable, and timebound. If they are, then chances are high that a donororganization, such as BCN, will give the proposal favor-
able consideration. Funding is an integral part of anyproject activity, so all actions planned must not only beconvincing but also clear and concise.
Event 1: Quarterly staff meetings in Port MoresbyThe conceptual model becomes an effective planningdevice in these meetings to hone in on activities thatrequire money. Candid assessments by staff of theground situation, in addition to guidance from the con-ceptual model, will help identify which interventionsdeserve funding priority. Though there is a skeletalfinancial plan on the general expenditure covering thevarious intervention activities, the field staff will usuallyhave a good sense of the real situation. These meetingsshould also produce reports and results on the progres-sive successes and failures of current intervention activ-ities. Decisions can then be made on whether financialcommitment should be reinforced, eliminated,trimmed, or rechanneled into more worthwhile activi-ties.
Activity 1: WMA annual meetingsLandowner suggestions and decisions conducive to thegoals and objectives of the project as reflected in theconceptual model are carefully assessed. WMA annualmeetings focus on landowner queries and issues affect-ing the entire WMA. Those suggestions that are com-patible with the goals and objectives of the project andrequire financial assistance are given consideration. Thelandowners, for example, in one of these meetings sug-gested a countrywide landowner forum workshop. Thisis going to be staged in 1998, which certainly requiresmoney and planning.
Function 10: The Conceptual Model Pinpoints TargetedAreas for Monitoring.One objective in the conceptual model for theCMWMA project hinges on the fact that all actionscarried out within the WMA are result oriented, so thatall outcomes are recorded for future reference and mon-itoring purposes. The result is scrutinized to identify themechanisms that influence the outcome. Project staffthen take remedial measures to ensure that the objectiveis accomplished. In fact, all project activities require anoutcome, as they are a sequential series of events witheach resultant action being dependent on a precedingone.
The activities that are planned and implementedmust have a monitoring process to determine whetherthe actions have accomplished the objectives and to
Measuring Conservation Impact36

measure any form of success or change. Monitoring is atool to oversee the actions and fulfillment of the objec-tives. Monitoring presupposes initial surveys so thatconsequent changes will be recorded and analyzed todetermine whether positive or negative change hastaken place. In the Crater Mountain project, we heavilyemphasize monitoring, hence the placement of science-and business-oriented staff at the sites. This will ensurethat business-related actions are monitored while thenatural resources are accounted for by field-based biol-ogists. In both areas, trained TLOs from the communi-ties will be used to gather basic data. Outside people,such as researchers and students will also be used toassist in data gathering. The activities listed and dis-cussed below exemplify the process.
Activity 1: Biological surveysBiological monitoring is consistent, as indicated byObjective 3, with biodiversity conservation. Specifictarget indicator species of plants and animals can bemonitored as impact (direct) or proxy (indirect) indica-tors. A species inventory of the entire elevation range ofthe CMWMA is essential during the early stages of theproject, since nothing of this sort has ever been con-ducted for the area. This is important because, at theend, the project will possess the basis of knowingwhether biodiversity conservation has really beenachieved. Hence, the 1996 CMWMA Flora and FaunaSurvey will cover five taxa, including plants, mammals,birds, reptiles and amphibians, and insects. Five sites atdifferent elevations representing major habitat typeswill be surveyed. An extrapolation of the results willdelineate the flora and fauna spanning the entire eleva-tion range in the WMA land mass. The site biologist,supervised by the resident project biologist, will main-tain the ongoing monitoring.
Activity 2: Socioeconomic surveysThe conceptual model clearly expresses potentialpoints, such as land tenure systems, traditional tradingsystems, and the current monetary system, on thesocioeconomic front to embark on as monitoring sub-jects. The CMWMA project uses factors in the con-ceptual model that are influenced by the interventionsto be monitored. These factors are either impact orproxy indicators. The monitoring systems are alsodesigned to determine whether it is really money gen-erated from the interventions that is mitigating theneed for cash. These monitoring devices should alsoreveal whether money obtained through these inter-
ventions is used to purchase goods and services con-trary to the goals and objectives of the project, such asthe purchase of shotgun bullets or indulgence in gam-bling activities, because of the specific inflow of cashinto the community.
Activity 3: Using village agents to monitor the export ofwildlifeThe conceptual model has assisted the project team inidentifying an effective way to monitor the departure ofwildlife articles from the CMWMA. A local resident istrained to keep a record of wildlife articles leaving thevillage, whether they are sold, offered as gifts, orexchanged as bride price endowments. Their marketvalue is also to be determined.
Such a monitoring system will address three con-cerns. First, local persons have a better knowledge andsense of the exit points of wildlife from the CMWMA.They also tend to be better informed about the currentstate of affairs surrounding hunting, and therefore willadapt well in facilitating a legitimate collection of therequired data. With the CMWMA laws protecting thewildlife in exclusion zones of the CMWMA, peoplewill tend to be more secretive with activities of thisnature. Second, we will be fulfilling one of our funda-mental objectives, which is local participation in thedrive to impart the sense of local ownership of theCMWMA project by CMWMA residents. Third, it ishoped that this system will ease people’s suspicions sothat they can be more candid about their activities inthis regard. Although this system has its weak points, itis hoped that the community at large will see the impor-tance of cooperation and participation. Then, perhaps,people will begin to appreciate that these data collec-tions are essential to the sustainability of their eco-enterprises.
Event 1: Monitoring and evaluation workshopsAny action must be evaluated and checked against theexpected outcomes as perceived by the conceptualmodel. The Herowana and Wara Sera workshops wereimportant milestones for the project in that they noti-fied the participants to be results conscious. Theyalerted the CMWMA project team to establish specificmonitoring devices. During the construction of theconceptual model, project staff singled out areas to betargeted for monitoring. These included the biologicaland socioeconomic monitoring systems. These systemsmust complement each other so that we can see a link-age between them.
Ericho, Bino, and Johnson 37

Other Activities That Assist in Monitoring
Activity 1: Adult literacy coursesThe project will conduct adult literacy classes in all ofthe communities where field staff maintain residence.The purpose is to increase the knowledge and skill lev-els and, most importantly, self-esteem. Such classes arebeing conducted in at least one of these villages. Theresponse is high initially, but the attrition rateincreases as time goes on. Remedial restructuring hasbeen suggested, in which students enroll in a six-weekcourse on a certain topic and pay a fine if they miss aday. This may frighten the people and increase theattrition rate, but, if they really want to learn, theymust be committed. We have already trained two stu-dents as TLOs at one of the sites, an obvious result ofthat education.
Activity 2: Site visit to impact areasThe project hopes to discover more effective ways ofimpressing the values of conservation upon CMWMAlandowners. Those from outside bring all of our experi-ences, educational backgrounds, and know-how. But thepeople who have lived with nature all their lives have amore difficult time understanding what we are talkingabout. Theoretical instruction on environmental dam-age, loss of forest habitat and species extinction is diffi-cult enough since we have to understand how thesepeople think and appreciate the worth of new informa-tion and knowledge. Monitoring and management con-cepts will mean nothing to them without the visual,first-hand appreciation of the issue.
The CMWMA landowners’ excursion to the heavilylogged trans-Gogol area of the Madang Provinceproved to be a winner. Landowners in the south end ofthe WMA visited a site where a logging company hadbeen courting them to create a partnership for sometime. Upon return from the impact site visit, thelandowners turned down the offer. It demonstratedwhat a site visit and practicality can do in transformingpeople’s attitudes and approaches to new concepts orideas. What the CMWMA project tried to achieve forsome time was accomplished in less than a week. Thispossibly demonstrates, in a small way, what local man-agement and monitoring can do in the future.
Another trip is in the pipeline, this time to a miningsite, since mining companies are already prospecting forgold and, by all counts, seem to have “struck luck” rightin the WMA. We hope that this trip will help local peo-ple to present their case forcefully before the govern-
ment in order to disqualify the mining license and avertany further incursions.
Activity 3: Set aside land for conservationThe ultimate goal is to achieve a conservation corridorthroughout the elevational range of the WMA to coverall habitat and microhabitat types. The process of zon-ing the CMWMA into categories of exclusion zonesand low-impact zones is slowly making progress.During the first annual meeting at Nahinamo in 1993,the clans pledged to set aside forested areas as conserva-tion zones (Resolution 2). These may initially appear assmall pockets scattered throughout the WMA, how-ever, landowners’ decisions for further zones to beincluded will be influenced by appropriate bodies withinthe CMWMA project. The idea of using these forestreserves as recruitment and nursery sites for theimpacted areas appears to be accepted by the landown-ers. They also appreciate that hunting pressure isincreasingly depopulating their game animals. Fieldstaff are awaiting the delivery of a new global position-ing system (GPS) to begin a more serious land demar-cation exercise to map out those respective impactedand conserved zones. Following this, the challenge ofgetting a functional community-based agency toenforce WMA rules and policies will be anotherobstruction to overcome to make this scheme a reality.
Activity 4: Human population interventionThe project hopes to affect the human population byintervening at strategic points, such as the health ser-vices and land tenure system. The health personnel areadequately trained and placed. Peace Corps volunteersare components of our interventions placed in thesecommunities to assist the health workers. They arerequired to educate the community about family plan-ning methods and keep a tally of population migrationand emigration and land tenure systems. These activi-ties will assist us in monitoring. If this program becomessuccessful, it will help ease the human pressure on thenatural systems. Ironically, health services aid popula-tion increase, a move that the community welcomes. Inthe highland communities, the number of male childrenone has is significant on several counts as evident in thefollowing conversation between one of our staff and aman who already had six children, five of them boys:
Staff: Do you think you have enough children now?Man: Oh, no! That’s the last thing on my mind
right now.
Measuring Conservation Impact38

Staff: Why do you say that?Man: Because I have to have a few more before I
stop, or rather before my wife stops (laughs).Staff: Why do you really want a few more?Man: Because, first, our clan has only a few males
who will protect our land and properties, youknow that number is power here. Second,some of these children will most likely diedue to sorcery, so the more I have the greaterthe number left. So you see I must go on.
Staff: What do you think about the use of familyplanning methods?
Man: No, those are for others who are mentallyretarded.
Although this man’s clan already has the largestnumber of males in the community and the land avail-able for use is getting smaller for each male, this men-tality persists. Our field staff are working against suchodds, pure stubbornness against change. Our targetgroup will be the next generation, and we continue tohope that they will see the light soon.
SUMMARY
Building a conceptual model is an intensely focusedprocess. It requires the thinking of all involved at everystage of planning and implementation in order to reachthe desired goal in the set time frame and beyond. Themodel will have to be revisited to accommodate thechanging landscape. Once completed, the model is not astatic, finished product. The production of a model isimportant on several counts, which are depicted in thefunctions discussed above. The most inclusive function ofthe conceptual model is its use as a tool at each planningphase of the project. The events listed and compared areindicative of the model working for the time being.
RECOMMENDATIONS
Below, we offer some hard-earned advice to those whomay be in the business of formulating conceptual models.
Formulation of Conceptual ModelA conceptual model gives planners and implementers anindispensable tool. Field personnel must be located on-site for at least one year. They then submit reports ontheir assessments of site conditions. These reports and allindividuals involved in the project and project proposalshould be used to formulate the conceptual model.
Lessons for Project ImplementersIf possible, the person hired for the field positionshould be someone from the general area, know thelanguage, and be familiar with the culture. This willmake the project implementer’s work much easier.Because of the many cultural nuances and norms thatthis person will understand, his or her ability to trans-mit project goals and objectives to local people will gosmoother.
We recommend that the field person have excellentinterpersonal skills, as well as the necessary qualifica-tions in the biological sciences. Even though the work isscience oriented, the most important part is being ableto relate to people. Staff must deal with people’s aspira-tions, hopes, and desires at a human level.
Local ownership and participation must be encour-aged from the beginning, which will encourage thecommunity to make required contributions, such asland, materials, and labor. Without this approach at theoutset of the project, the question of ownership willloom large toward the end of the project. Because ofthe limited time remaining, the project will likelybecome more uncertain than when it started, and endin failure.
When field staff arrive in their communities, theyneed at least three months to find their niche. Duringthis time, they can identify key players in the communi-ties and learn about village politics and other factorsthat will help orient them.
All levels of government must be informed andbriefed at all times; otherwise, many unexpected prob-lems may result. Project implementers should interactwith the relevant government department, such as thedepartment of environment and conservation. Gettingthe appropriate department officials involved with anyactivity and keeping them abreast may mean the differ-ence between success and failure.
Other points might become transparent as time goeson. These recommendations may vary, depending onthe current landscape of the site and country. Those wehave presented here are based on our situation in theCrater Mountain Wildlife Management Area of PapuaNew Guinea.
REFERENCES
Beehler, B. 1993. Mapping PNG’s biodiversity. InPapua New Guinea conservation needs assessment, ed.Janis B. Alcorn, 1:193-209. Washington, D.C.:Biodiversity Support Program.
Ericho, Bino, and Johnson 39

Biodiversity Conservation Network. 1995. Evaluatingan enterprise-oriented approach to community-basedconservation in the Asia/Pacific region: 1995 AnnualReport. Washington, D.C.: Biodiversity SupportProgram.
Brown, M., and B. Wyckoff-Baird. 1994. Designing inte-grated conservation and development projects.Washington D.C.: Biodiversity Support Program.
Cernea, M. 1985. Putting people first: Sociological vari-ables in rural development. New York: OxfordUniversity Press.
James, J. 1993. Minutes from the First AnnualMeeting-Nahinamo. A field report to WildlifeConservation Society, October, New York.
Orsak, L. 1996. Changing people’s values in how naturalresources are used in rural Papua New Guinea: Anapproach. Madang: Christensen Research Institute.
Pearl, M. 1994. Local initiatives and the rewards forbiodiversity conservation: Crater Mountain Wild-life Management, Papua New Guinea. In Naturalconnections: Perspectives in community-based conser-vation, eds. D. Western and R. M. Wright, 193-214. Washington, D.C.: Island Press.
Post-Courier (Papua New Guinea). 1995. BHP to spendK2m for stake in Crater, 30 August.
Wells, M., and K. E. Brandon. 1993. The principles andpractice of buffer zones and local participation inbiodiversity conservation. Ambio 22(1-3):157-162.
Measuring Conservation Impact40

INTRODUCTION
Lore Lindu, located in Central Sulawesi, is one ofIndonesia’s most pristine national parks. Increasinghuman pressures around the park’s borders, however,are beginning to take their toll. In collaboration withthe Indonesian government and such partners as theCooperative for Assistance and Relief Everywhere(CARE) Indonesia and communities around thepark, The Nature Conservancy (TNC) has begun toplay an active role in the conservation of Lore Lindu.TNC has introduced a system of bioreserve strategicplanning that focuses on threats and their sources.Ensuing strategies emphasize informing policymak-ers; developing community education projects; fos-tering compatible economic development; anddesigning an integrated program of biological,socioeconomic, and enterprise monitoring to guideongoing management and to measure the impact ofthe strategies.
The Biodiversity Support Program’s (BSP’s)Biodiversity Conservation Network (BCN) hasintroduced a conceptual modeling process that hasbeen useful in redefining strategies and shapingmonitoring plans to reduce threats and sources ofthreats at Lore Lindu, as well as at other sites in theregion where TNC works. In this paper, we describeBCN’s conceptual modeling process and present theevolution in our use of conceptual modeling as astrategic planning tool aimed at securing LoreLindu’s future.
CONTEXT
The Government of Indonesia created Lore LinduNational Park (LLNP) in 1982 in a mountainousforested area south of Palu, the provincial capital ofCentral Sulawesi (see Figure 1). At approximately231,000 hectares, the park is almost twice the size of theHawaiian Island of Oahu. It is bounded on all sides byvalleys containing agrarian communities of traditionaland migrant people. The park contains no permanenthuman settlements, aside from two valleys that havebeen established as enclaves.
4Conceptual Modeling for Nature-based Tourism
and Wildlife Microenterprises: Conservation Supportfor Lore Lindu National Park
❖
NENGAH WIRAWAN, DUNCAN NEVILLE, AND JOANNA CROCKERDirector of Conservation Science, The Nature Conservancy (TNC), Indonesia;
Project Manager, TNC Butterfly Enterprise;and Compatible Enterprise Specialist and Socio-Economic Monitoring Advisor, TNC,
Asia and Pacific Region; respectively
❖
Figure 1
Lore Lindu National Park
Sulawesi’s biogeographical history has blessed theisland with numerous endemic plant and animalspecies. The island provides important habitats toapproximately 79 mammal, 88 bird, 29 amphibian, and11 swallowtail butterfly species that occur nowhere elsein the world. Important endemic species in LLNPinclude dwarf buffalo, pig-deer, wild boar, macaque,cuscus, tarsier, Sulawesi civet, male bird, and theSulawesi hornbill (TNC and Indonesian Ministry ofForestry 1992).
LLNP, located in a mountainous, heavily forestedprovince, is sparsely populated and has a poorly devel-oped land transport system. The province is home toapproximately 60 indigenous ethnic groups and largenumbers of migrants from South Sulawesi and else-where in the archipelago. Most of the people living inthe region are subsistence farmers who are only weaklyintegrated into the cash economy. While economic andhealth indicators are among the worst of Indonesia’sprovinces, absolute poverty is low because of the generalavailability of agricultural land.
People living near the park’s boundaries, for themost part, still continue traditional lifestyles. Theyproduce handicrafts, including bark cloth and weav-ings from rattan, pandanus, and grass, and they per-form a special type of bamboo music that has attractedthe attention of both domestic and internationalscholars. Researchers from around the world come toinvestigate the mysterious megalithic remains scat-tered throughout the Napu, Besoa, and Bada valleys.This cultural heritage, along with the natural beauty offorest, lake, river, wildlife, and park scenery, attractssmall numbers of tourists to the area, thus providingenvironmentally sound alternative sources of incometo some of the people living around the park.
Illegal encroachment and collection of park resources,however, yield greater incomes for ever greater numbersof people and are increasingly threatening the integrityof the LLNP. Although park managers are interested inbeginning community involvement and education activ-ities, to date, the resources for enforcement and commu-nity activities have been limited.
IMMEDIATE THREATS AND STRESSES
Until recently, LLNP and its surrounding areas werefairly isolated, despite their proximity to the provincialcapital of Palu. Isolation is now rapidly diminishingwith new road construction and improvement. To fur-ther develop agricultural potential in the province, the
Indonesian government is exploiting all fertile landaround LLNP boundary areas through resettlementand transmigration programs. The government consid-ers development of road networks an absolute necessityin marketing agricultural products from the communi-ties abutting LLNP. Most existing and future road net-works are located along the boundaries of the park.Better access to the valleys, formerly accessible only onfoot, has resulted in a great influx of outsiders to thepark and its immediate surroundings. Directly or indi-rectly, the growing population is forcing inhabitants tomove into LLNP for farming, hunting, and the gather-ing of wood and rattan. Thus, the most immediateobservable stresses on the park deriving from the com-munities are rattan collection, timber and fuelwoodharvesting, coffee and cocoa cultivation, and hunting.
LINKS TO MICROENTERPRISE AND MONITORING
The goal of the BSP- and TNC-supported projects inthe park is to link economic well-being to sustainable useof park resources by assisting communities in compatibleenterprise development. We believe this means thatpolicies governing the park and its management mustallow surrounding communities to have a major role inmaintaining the diversity and sustainability of parkresources. To achieve this goal, our planning processidentified four projects. As of this writing, these projectsinclude three focused on establishing self-sustainingenterprises (honey production, butterfly farming, andwhite-water rafting) and one research project centeredon rattan use, ecology, and management in preparationfor the establishment of a rattan-based enterprise.
The following three approaches guide the enterpriseand research projects:
1. Working with communities to ensure the sustainabil-ity of the resources that communities have been col-lecting from the park, such as butterflies and honey(Intervention 1).
2. Working with the park management to change someof its policies to permit communities to continue har-vesting some park resources legally and sustainably.Such policy changes includes the formation of a tra-ditional use zone (Intervention 2).
3. Facilitating development of community-basedmicroenterprises that will provide project participantssustainable incomes from the products they directly or
Measuring Conservation Impact42

indirectly harvest from the LLNP. Enterprise pro-jects, in turn, should serve as opportunities for involv-ing community members in monitoring andawareness-building activities (Intervention 3).
The success and sustainability of these efforts, in turn,depend on information generated by the monitoringprogram, based on the conceptual model presented inthis paper. Information must enable continuous adaptivemanagement. Thus, we expect the plan to change as welearn more about the system we are modeling.
DEVELOPING THE CONCEPTUAL MODEL
In September 1995, members of the TNC enterpriseand monitoring team working in LLNP attended aBCN-sponsored workshop in Manila, Philippines,where participants applied the conceptual modelingprocess to the wealth of information they had alreadygathered. Although introduced after enterprise projectshad begun, the modeling process was particularly usefulin planning monitoring activities for the three enter-prise projects and the integrated research project in theLLNP boundary communities. TNC has also adaptedthe modeling process to other conservation sites in theAsia and Pacific region.
In order to plan monitoring activities for the projects,the team first had to define the overall goal of the activ-ities: the target condition. The conceptual modeldefines the target condition as the integrity of LLNP,assuming that maintaining biodiversity depends on thecompleteness of the park. Team members then used themodeling process to define and demonstrate the inter-related factors that affect the target condition.Clarification of the relationships between these factorsaided the design of project activities. The clarificationprocess continues as project managers use monitoringinformation to adapt and manage the enterprises.
The four main factors that affect our target conditionare government policies, park management, economics,and human population (see Figure 2). Changes in anyof these factors affect the integrity of the park and thebiodiversity we are hoping to maintain. Some of thesefactors are interrelated; an increase in population size,for example, could result from an improved local econ-omy or from government policy, but it could also nega-tively affect the economy due to surplus of labor andlack of available land for cultivation.
Breaking the model down into more detail, the pro-ject team identified direct encroachment, either from
agriculture or plantations, and unsustainable forestresource extraction, including hunting and rattan collec-tion, as the major factors directly affecting the integrityof the park (see Figure 3). The major factor drivingdirect encroachment and unsustainable forest resourceextraction is the need of the local population for land,food, and basic cash income. If basic needs go unmet,direct encroachment and unsustainable resource use aremore likely.
A growing population obviously affects people’s abil-ity to meet basic needs. Population growth results fromsimple biological increase, immigration, and transmi-gration. Government policies and actions affect trans-migration; for example, efforts to control schisto-somiasis by cultivation of its snail host’s swamp habitatlead to increased transmigration.
Changes in national and provincial economies mayproduce increased rural employment opportunities; ifmore opportunities are available, basic needs can poten-tially be met outside park boundaries. In our originalmodel, the major areas of rural employment were agricul-ture (including plantations of coffee and cocoa), forestresources, and tourism. For simplicity, we omitted otherareas, such as trading and civil service employment, fromthe original diagram developed in the Philippines. In ret-rospect, however, we find that these areas are significant.For example, incoming traders from Palu who are willingto purchase certain commodities at relatively good ratescan pressure communities into exploiting a particularcommodity or resource quickly. Civil servants, owing totheir greater status and regular incomes, may play a sig-nificant role in contributing to new enterprises and influ-encing projects started in the communities. Asocioeconomic monitoring plan remedied these omis-sions. Government development programs have impor-tant influences on all of the above areas of employment.
Wirawan, Neville, and Crocker 43
Figure 2
Identification of Target Condition and Factors Affecting It

As elsewhere in the world, park management,through its enforcement role, mainly influences directencroachment and forest resource utilization to theextent that it can overcome the usual lack of facilities,staff, and funding. Again, national and provincial gov-ernment plans and policies shape the implementation ofpark management.
Additions to this basic model include the effects ofethnic background and origin on attitude towardencroachment and resource extraction. Some groups,such as the Da’a, have more experience with resourceextraction, while others, mainly newcomers, have lessrespect for the forest. Infrastructure development, suchas the building of roads or dams, can have a direct effecton the integrity of the park; the effect of new roads onincreasing the rate of encroachment and rattan extrac-tion is obvious at several sites.
Microenterprise development is planned to add torural employment opportunities through honey produc-tion, butterfly farming, rafting, and rattan enterprises,which should have a direct effect on unsustainable for-est resource extraction (see Figure 4). Ongoing conser-vation education and awareness-building activities arealso expected to improve attitudes toward the use ofpark resources. (BCN originally developed this figure
with BCN-funded interventions in mind. A more com-plete rendering would also include interventions byTNC’s partners, most notably CARE Indonesia.CARE is working in LLNP boundary communities toimprove dryland agriculture and introduce more sus-tainable farming methods.)
Figure 5 reorganizes the conceptual model to reflectthe influence of government policies on the integrity ofthe park. The main issue is human welfare, whichresults from the needs of an increasing population,caused by local population growth, transmigration, andimmigration. In dealing with this issue, theGovernment of Indonesia has developed programs tomeet short-term human needs. As in many parts of theworld, the main threat to the integrity of LLNP is theconflict between ensuring long-term conservationneeds for future generations and meeting people’sshort-term survival needs.
ASSUMPTIONS
One disadvantage of this conceptual model is that, forthe sake of clarity, it excludes several factors, includingthe impact of international, national, and provincialeconomics on resource extraction. The model neverthe-
Measuring Conservation Impact44
Figure 3
Conceptual Model, Including Factors That Directly Affect the Integrity of Lore Lindu National Park

Wirawan, Neville, and Crocker 45
Figure 4
Improved Conceptual Model, Showing Anticipated Impacts of Microenterprises
Figure 5
Reorganized Model, Showing Influence of Government Policies on Park Integrity

less generates assumptions for later testing. Keyassumptions are as follows:
• The poorest people cause the most damage to thepark, as they are least able to meet basic needs out-side the park.
• Enterprise projects will have measurable effects onrural employment; new income will replace that fromresource extraction, e.g., when the rafting enterpriseemploys people who once worked as rattan collectors.
Data from socioeconomic and enterprise monitoringwill help us test these assumptions.
LESSONS LEARNED
1. The modeling process functions best when commu-nity members are fully involved from the outset.
After applying BCN’s modeling process to ongoingBSP-funded projects in Indonesia and the SolomonIslands, TNC staff adapted the process for use in work-shops in the state of Pohnpei in the Federated States ofMicronesia. TNC simplified the process and used itduring workshops that introduced compatible economicdevelopment concepts. Even though many participantswere already deeply knowledgeable about their forestresources, diagramming the influences, threats, andsources of threats on a large chart led to rich discussionabout where education, enforcement, information pro-grams, and compatible development programs couldmake the most difference. Based on these experiences,we suggest that the following points are essential when-ever using the conceptual modeling process:
• Ensure proprietorship by community members:Representatives from the communities involvedshould be part of strategic planning, especially devel-opment of the conceptual model. Not only will theyhave valuable insights about the conservation areaunanticipated by outside scientists, but they are alsomore likely to become committed to subsequentthreat mitigation strategies if they have a sense ofownership of those strategies. It is particularly help-ful if the community members assisting in the mon-itoring are also involved with strategic planning.
• Relate the conceptual model to everyday life: Relativelysophisticated concepts can be communicated bydrawing pictures, telling stories, and discussing them.
This process may take several days to complete. Bygiving people time to think through, change, andmake the plan “theirs,” the conceptual modelingprocess serves the ultimate goal of putting the com-munity in charge of resource management.
2. The model is a starting point; we expect informationfrom monitoring to improve the model and subsequentmanagement as we progress.
In our discussion of Figure 3, for example, we citerural trading, markets, and civil service employment asimportant omissions from our original model. Duringrecent monitoring activities, staff observed teams ofsome of the poorer people from the communities clear-ing and planting land for plantations within the parkboundaries. Entrepreneurs outside the communities, oreven civil servants, may have organized and paid forthese teams. This raises the key question of whether wewere seeking the appropriate participants for our pro-jects. Testing the hypothesis that it is the poorest peoplewho extract most of the park resources then becomes anobjective of the baseline socioeconomic monitoringprogram and will probably change the monitoringworkplan.
3. The modeling process must focus on threats andsources of threats.
During development of the modeling process, BCNsuggested identifying all factors influencing the conser-vation area. While this part of the process is essential,TNC learned that the model must focus on threats andsources of threats. There is a moment of truth in themodeling and planning process in which conservationplanners should find themselves asking, “What is the‘killer’ threat? Do our staff, project, or partners reallyhave the means to address this threat? Can we make adifference? If not, what then is the best use of ourresources?”
The original LLNP model, however, begged thequestion of the killer threat, population increase.Indeed, we are not equipped to address this source ofall threats directly; however, where conservation andcompatible development work is relatively new, suc-cessful on-the-ground demonstrations of profitableand sustainable enterprises can provide the evidenceand legitimization for starting discussions and poten-tially changing policy at higher levels. Positive experi-ences with benefits from the projects should alsoenable government and nonprofit partners to influenceothers, acquire funding, and gain commitment. In
Measuring Conservation Impact46

Wirawan, Neville, and Crocker 47
short, once we recognize the killer threats, even if wecannot fully act on them immediately, we can setwheels in motion.
4. The modeling process is more useful when it is linkedto an overall management process.
Our experience thus far suggests that, for the model-ing process to be most useful, the ensuing managementobjectives, workplans, and monitoring must be inte-grated into an overall adaptive management process. Inthe course of ongoing work, team members found itconvenient to draw up the resulting monitoring planobjectives such that they would also become the objec-tives of enterprise workplans. This should start toensure that the projects are directly addressing the fac-tors we identified in the conceptual model.Furthermore, if project staff write reports linked to theobjectives, it will become clear when an objective isfalling out or needs to be changed. Subsequent manage-ment decisions should become obvious.
5. The conceptual modeling process should enableintegrated monitoring.
The process used to develop the conceptual modelshould lead to an integrated monitoring program. Thismeans people involved in the ecological and socioeco-nomic monitoring and enterprise development, com-munity members, and entrepreneurs are all commu-nicating with and learning from each other so thatinformation from each group can be used in decision-making. For example, in order to test the hypothesisthat it is the poorest people who engage in the mostharmful resource extraction, the socioeconomic moni-toring team will require information from ecologistsand enterprise managers. This is not easy to coordinatein a complex program. The simplest solution is toensure that all parties are brought in to work on the planduring the original planning process. The learning andplanning that result will outweigh any initial expense.
GOAL
Our ultimate goal is to maintain the integrity of theconservation area (see Figure 6). The conceptual mod-eling tool can be used to develop threat-based strate-gies and monitoring. Sustainable net profits from theenterprises help motivate communities, and monitor-ing information helps inform community-based
resource management decisions. Subsequent work willenable policymakers, communities, and entrepreneursto gather and use information to make their own sus-tainable resource management decisions long after weare gone.
ACKNOWLEDGMENTS
Many of TNC’s collaborators contributed to this paper.Key researchers included David Bynum (ecologicalmonitoring); Dr. Gard Otis, Dr. Gordon Allen-Wardell, Mappatoba Sila, and Ann-Marie Cooper(bee/honey project); Drs. Steven Siebert and Jill Belski(rattan research); and the many researchers who con-tributed to the Land Use and Socio-Economic Surveyand other studies that informed our work. We recog-nize the invaluable, ongoing information provided byour partners in Indonesia’s Forest Department andCARE Central Sulawesi, as well as many continuingconversations with BCN staff. Most importantly, werecognize the community members from the park’sboundary villages.
REFERENCES
TNC and Indonesian Ministry of Forestry. 1992. Landuse and socio-economic survey. Sulawesi ParksProgram. Lore Lindu National Park and MorowaliNature Reserve. Arlington, Virginia: The NatureConservancy.
Figure 6
Interrelated Factors Affecting the Integrityof the Conservtion Area

Part III
Interdisciplinary andParticipatory Data CollectionMethods

Measuring conservation success is impossible withoutreliable data. Project monitoring and evaluation(M&E), which is fundamental to adaptive managementand impact assessment, relies on collecting data acrosstime or sites; it is always based on making comparisons.While data collection may be viewed as necessary, theactivity is often perceived by project managers as anadditional responsibility on already overburdened staffand as diverting financial resources from program activ-ities. Also, many managers view data collection as a spe-cialized skill that only researchers can do. Finally, manyproject teams simply feel they do not know where tobegin to determine what data to collect and how to col-lect them. These perceptions and realities must beaddressed so that M&E is indeed valued as a tool forbetter decision-making and impact assessment.
To benefit project teams, M&E must be fully inte-grated into project design and management. It must bedone in a way that proves useful to project managers andstaff, while detracting as little as possible from programactivities. Selection of the appropriate methods for col-lecting data can be a challenging task since so manyoptions are available. Generally speaking, data collec-tion methods should be accurate and reliable, cost-effective, feasible, and appropriate.
For any type of M&E activity, the choice of methodsfor collecting data is determined by the informationneeds of the project team; availability of information;skill level of those who will be collecting and analyzingthe data; and the amount of time, money, and otherresources available. In conservation and developmentprojects, a spectrum of biological and socioeconomicdata are usually required to monitor project success.While these methods may have a dizzying assortmentof names, many are, in essence, the same. For instance,
wildlife census data collection can use virtually the samesampling and data collection techniques as a householdsurvey in a community adjacent to a protected area.
Data collection methods can be divided into twomain categories: those that produce quantitative dataand those that generate qualitative data. Quantitativemethods include tracking project records that containnumerical data and formal surveys. Qualitative methodsinclude key informant interviews, focus groups, directobservation, and mapping, among others.
The two papers presented in this section demonstratehow project teams can use specific methods or a combi-nation of methods to collect the data they need to assessimpact and better manage their projects. Both papersillustrate the importance of collecting a range of socialand biological data for conservation and developmentproject monitoring. These papers also stress the impor-tance of using participatory approaches to data collec-tion that involve stakeholders in M&E wheneverpossible.
In Chapter 5, Ulfelder and Dugelby focus on the keyelement of community participation when selectingappropriate methods to conduct project monitoring.Their work, carried out in collaboration with variousorganizations, led to the testing of an approach calledPALOMAP (Local Participation in Protected AreasManagement). This paper describes the results of theauthors' work in the Cayambe-Coca Ecological Reservein Ecuador. The Reserve includes about 400,000hectares (ha) of tropical lowland forest, cloud forest, andhigh Andean grasslands. For the purposes of this study,the PALOMAP team divided the human settlementsinto seven distinct socioecological zones.
Ulfelder and Dugelby define and describe two classi-fications of monitoring methods: macro-monitoring
❖
Introduction❖

and micro-monitoring. Macro-monitoring includesstakeholder analysis, involving key informant inter-views, mapping, and ethnographic interviews; threatsanalysis, involving a series of workshops of key stake-holders; and human ecological profiles. Micro-monitor-ing methods tested by the PALOMAP project includerapid vegetation assessment, involving transects primar-ily; formal interviews; focus groups and group inter-views; and community meetings.
The authors explain the importance of addressingthese two levels of monitoring in order to achieve con-servation objectives. They clearly demonstrate howthese approaches can be used as effective planning andadaptive management tools that allow project managersto evaluate strategic choices continuously and makeneeded corrections as a project unfolds.
In Chapter 6, Kremen, Raymond, Lance, and Weisspresent their work developing new methods in quanti-tative ethnobotany that were used to select and monitornatural resource indicator species and to design a bufferzone for the Masoala Integrated Conservation andDevelopment Project (ICDP) in northeasternMadagascar. This ICDP was designed to protect310,000 ha of rain forest by declaring 210,000 ha asnational park, and developing sustainable-use strategiesfor the remaining 100,000 ha that address the economicneeds of the surrounding communities.
Kremen and her colleagues explain how various sam-ples were selected and describe the team's use of a mul-
tidisciplinary approach to measure both ecological andsocioeconomic impacts of the ICDP. The methods pri-marily used by Kremen and her team were householdsurveys, direct observation, and harvest transects.
The authors used these methods in innovative andpractical ways to determine specific indicators to mea-sure and monitor various indicator species. This teampaid considerable attention to the use of information foradaptive management, whereby project managers canuse information from the monitoring of naturalresources to improve the implementation of resourcemanagement plans.
Both papers in this section present a wide variety ofquantitative and qualitative data collection methodsavailable to conservation practitioners for projectmonitoring and evaluation. They focus on collecting awide range of biological and socioeconomic data toaddress and monitor threats to biodiversity. Thesechapters also highlight the need to involve local com-munities in data collection and decision-making inICDP design and management. Finally, the twopapers demonstrate that, when determining whichmonitoring methods are appropriate for a given situa-tion, one should rely on tried-and-true data collectionmethods when possible, but adopt new approacheswhen needed. Creativity and innovation are requiredto discover the synergistic combinations of methodsthat will provide the greatest returns on investments oftime, effort, and funding.
Measuring Conservation Impact52

INTRODUCTION
It is now a widely accepted premise that the participa-tion of local communities in protected area manage-ment leads to greater probability of achievingconservation objectives. Acting on this premise, manyinternational and national conservation organizationshave invested heavily in participatory conservation ini-tiatives (PCIs) (Western and Wright 1994, Wells andBrandon 1992, West and Brechin 1990). Unfortunately,this assumption has yet to be formally tested, as thereare scant data regarding the impacts of PCIs on partic-ipating communities and the reserves, natural resources,and ecological systems they are designed to protect. Inshort, as of yet we have little evidence whether or notthis approach is effective in achieving conservation anddevelopment goals, and if so, under what conditions.Similarly, no standard or tested monitoring and evalua-tion methodologies exist for assessing the socioeco-nomic and biological impacts of these projects. Thispaper presents the results of an effort to develop amethodology, or set of tools, for assessing the impacts ofPCIs.
PALOMAP STUDY
Responding to the need for methodologies to monitorand evaluate the impacts of PCIs, in 1995 The NatureConservancy (TNC) and the Latin American SocialSciences Faculty, known by its Spanish acronym,FLACSO, launched a collaborative effort to developsuch a methodology, called PALOMAP (LocalParticipation in Protected Areas Management). Withfunding from the Ford Foundation, TNC andFLACSO carried out the study in the Cayambe-CocaEcological Reserve in Ecuador between November1995 and December 1996.
The objectives of the PALOMAP study were to:
• Develop a methodology to measure the impacts ofPCIs that could be applied to protected areasthroughout the Andean-Amazon region.
• Generate a series of “lessons learned” regardingPCIs that would provide suggestions and strategieson how these initiatives might be improved in thefuture.
❖
5Local Participation in Protected Area Management: The
PALOMAP Study and Methodology1
❖
WILLIAM H. ULFELDER AND BARBARA L. DUGELBY2
Community Conservation Program Coordinator, Andean/Southern Cone Region andHuman Ecologist, Latin America and Caribbean Division; respectively
The Nature Conservancy
1 A complete summary of the PALOMAP study is available in Ulfelder et al., 1998.2 Other principal PALOMAP researchers were Susan Poats (FLACSO), Jorge Recharte (currently with The Mountain Institute), and
Cecilia Scurrah.

The Cayambe-Coca Ecological Reserve spans nearly400,000 ha and three major ecosystem types: tropicallowland forest, cloud forest, and high Andean grasslands(paramo). To facilitate the study of this large reserve, thePALOMAP team divided it into seven socioecologicalzones (see Figure 1). These zones represent areas withrelatively homogenous ecological, socioeconomic, andhistorical characteristics. They also represent distinctspheres of interest among local villagers; that is, most vil-lagers in one zone typically are interested in the eventsthat occur within that zone but not outside it, as eventsoutside the zone do not often directly affect their day-to-day lives. The PALOMAP team identified and describedthe various PCIs within each zone. From a total of 24PCIs, investigators chose 7 as case studies (see Table 1).
MONITORING AND EVALUATION
Although the PALOMAP study was not designed tomonitor the impacts of the seven PCIs described above,many components of the study’s methodology serve asexcellent monitoring and evaluation tools. TNC widelyapplies some of the methods in other preserves and pro-
tected areas throughout the United States and LatinAmerica, although for use in PALOMAP these meth-ods have been expanded or refined. Other methods arenew and innovative, and TNC and its partners arebeginning to use them more widely in other communityconservation efforts.
The monitoring and evaluation methods presented inthis paper are those of the PALOMAP study, not thoseof the seven case studies analyzed. Of the seven casestudies examined, none had a monitoring and evaluationcomponent. The majority of the projects were imple-mented with money and faith, based on the assumptionthat, if executed as planned, they would provide conser-vation benefits to the protected area and socioeconomicbenefits to the participating communities. It thus appearsthat the question of whether those goals were achievedwould depend on the subjective judgment of implement-ing staff, rather than on measurable indicators.
The PALOMAP methods useful for project monitor-ing can be divided into two groups, macro- and micro-monitoring. We define macro-monitoring as a datacollection process carried out beyond the framework of asingle PCI. The information gathered may be commu-
Measuring Conservation Impact54
Figure 1
PALOMAP Study Zones in the Cayambe-Coca Ecological Reserve

nity-wide, regional, or even across an entire protectedarea, and seeks to capture the broader dynamics thataffect or are affected by the conservation initiative.Micro-monitoring, on the other hand, refers to data col-lection specific to a single initiative. In this type of mon-itoring, investigators ask questions to determine whetherinitiatives are making or losing money, how many com-munity members are participating in the project by gen-der, and what the community or project is doing with themoney earned (i.e., is it spent on school supplies, food,and medicine, or does it go toward the purchase of shot-gun shells, chainsaws, more cattle, etc.?).
In all, five elements used in PALOMAP provide anelementary framework for macro- and micro-monitoringand evaluation of PCIs. At the macro level, stakeholdersand threats analyses are important, along with the devel-opment of what TNC terms “Human EcologicalProfiles.” At the micro level, TNC suggests looking atthe type of participation used in a PCI and its biologicaland socioeconomic impacts. We believe that these fivecomponents provide a powerful, comprehensive monitor-ing methodology. In addition, all of these can be per-formed with the participation of government park agencystaff, NGO representatives, and community members. Infact, for the data to be complete and a collaborativeprocess to begin, a participatory approach is necessary.
Macro-monitoring Tools
Stakeholders Analysis
A stakeholders analysis defines the relationships andtypes of power that exist among the various actors in a
protected area, within a community, or among partici-pants in a specific PCI. It is inevitable that one will finddiffering interests, relationships, and levels of poweramong the institutions, communities, and individualsin and around protected areas. An understanding ofthese elements is critical to the success of conservationinitiatives.
There are many ways to perform stakeholders analy-ses. The PALOMAP team used three methods at dif-ferent sites around the Cayambe-Coca Reserve. Withseveral institutions, a variant of the analysis asked keyinformants from an institution or organization to locatetheir organization in relation to all the others withwhom they work. First, participants made a list of allthe organizations that have a relationship with theirown. Then, using paper circles of different sizes and col-ors, they created a diagram of the existing institutionalrelationships. Following this step, one can discuss thedesign features that participants chose for the circles(i.e., institutions), reasons why they made particularinstitutions larger or smaller, why they located someclose to each other while others remained distant, andwhy they used particular colors. This type of analysisallows an interpretation of the current nature of interin-stitutional relations, their historical nature (especially ifthe analysis is done periodically), and what the partici-pants wish those relations to become in the future. Thismethod proved extremely useful with several non-governmental organizations (NGOs) working inCayambe-Coca.
The PALOMAP study used another variation of thestakeholder analysis in the indigenous communities of
Ulfelder and Dugelby 55
Table 1. Participatory Conservation Initiatives Selected as PALOMAP Case Studies
PCI Location Objective
Thermal baths Oyacachi Income generation to reduce povertyThermals baths Papallacta Income generationTrout farming Oyacachi Income generation to offset cattle expansionEcocultural tourism Sinangüé Income generation/incentive to reduce hunting and
deforestation from subsistence agricultureLand-use zoning Sinangüé Improve resource management/control hunting/gain
territorial rightsParamo management Juan Montalvo Improve resource management/gain land rightsCommunity park guards Reserve-wide Patrol borders/build local awareness about the reserve/
(10 communities) improve park relations with communities

Sinangüé (Cofan) and Oyacachi (Quichua). Here, acommunity mapping activity identified organizationsand institutions. Key informants drew their communityand the different groups that affect it. These includedthe government park agency, neighboring communities,business interests, the local church, conservation anddevelopment NGOs, and such government institutionsas the Ministry of Public Works. Subsequently, a stake-holder analysis was performed with members of thecommunity to understand the different types of rela-tionships that exist among residents and institutions. Asimilar map was drawn and discussed with the directorof the Cayambe-Coca Reserve.
The PALOMAP team used a third stakeholderanalysis strategy in the area of Papallacta. Open-endedethnographic interviews with community membershelped identify more than 25 groups and institutionshaving an interest in a major water project being built bythe city of Quito. The interviews revealed that eachinterest group had a different type of relationship withthe project and thus would be affected differently.Investigators organized a community workshop toexplore these relationships. Workshop participants drewa map of the community on a large cotton sheet andlocated on the sheet the different organizations identi-fied during the interviews. The names of these organi-zations were drawn on large paper circles. If newinterest groups were identified, their names were placedon new circles. Remarkably, more than 32 interestgroups were identified for a community of less than 500inhabitants. The participants placed red stars betweenorganizations that suffered some type of conflict.Participants then described the conflict or potentialconflict among the different actors.
PCIs can perform these three stakeholder analysismethods periodically to assess how relationships, levelsof power, and conflicts change over time. The informa-tion gathered through these analyses is essential tounderstanding how such relationships influence projectimplementation and success, as well as how they areinfluenced by the same initiatives.
Threats Analysis
The second research method the PALOMAP teamused that has important monitoring implications is athreats analysis. Protected area threats are “those activi-ties of human or natural origin that cause significantdamage to the area or are in serious conflict with themanagement objectives of the area” (Machlis andTichnell 1985). The threats analysis thus allows for a
better vision of how the activities of local communitiesand other interests (large landowners, timber and min-ing companies, municipalities, etc.) affect the manage-ment of the protected area and which represent thehighest priority for management action (West 1995).The PALOMAP team used the methodology TNCdeveloped and applied in several protected areasthroughout the United States and Latin America. Themethodology consists of five parts, or what TNC callsthe “Five S’s”—systems, stresses, sources, strategies, andsuccess (Weeks 1996). The threats analysis methodol-ogy is often considered a planning tool. Successful pro-ject implementation, however, requires an iterativeprocess—one that begins with project planning andcomes back periodically to look at what conditions werelike when the project began.
“Systems” are the ecosystem components or naturalelements in a protected area. If the area is small or rela-tively homogeneous, it could be considered a single sys-tem, such as cloud forest or highland meadow. Larger,more complex areas must be divided into their variouselements. Certain species may also be considered if theyare “keystone species” or are especially important to suc-cessful management of the area (West 1995).
“Stresses” are the impacts that damage the ecosystemor its ecological processes. These include habitat frag-mentation, erosion, sedimentation, genetic drift, alter-ation of natural water courses, and changes in naturalwater levels. “Sources” are the threats. Deforestation forthe opening of cattle pastures may cause habitat frag-mentation, erosion, and sedimentation, while the hunt-ing of wildlife results in loss of genetic material and lossof keystone species critical to the natural regeneration ofthe native habitat. “Strategies” are those alternativesprotected area managers, conservationists, communities,and other actors identified to diminish threats. Thestrategies can be local, regional, or national. Finally,“success” refers to the measure of progress achievedthrough the implementation of the strategies.
The PALOMAP threats analysis workshop was thefirst of its kind in the 27-year history of the Cayambe-Coca Ecological Reserve. Representatives of theEcuadorian park agency, national and international con-servation organizations, donors, and grassroots organi-zations participated. The reserve was divided into fourprincipal systems—tropical zone (less than 1,000meters above sea level, or masl), semi-tropical zone(1,000-2,000 masl), mountainous zone (2,001-3,000masl) and the highlands (above 3,000 masl). The prin-cipal stresses are habitat fragmentation and destruction,
Measuring Conservation Impact56
species loss, loss of ecological functions, erosion, sedi-mentation, change in river and stream courses, and flowlevels. The primary sources, or threats, in Cayambe-Coca are as follows: infrastructure construction fromtwo water projects—one to supply the city of Quitowith potable water, the other to provide the arid high-lands with irrigation; colonization by people from theSierra who have moved to the Amazon in search ofmore available land; the opening of new areas for cattleand agriculture production that use inappropriate agri-cultural practices; overhunting and fishing of certainspecies, including fishing with dynamite; mining byartisans and potentially by multinational corporations;the burning of highlands’ natural vegetation and grassesto increase grazing lands; and uncontrolled solid wastedisposal by local communities and in areas frequentlyvisited by tourists. The PALOMAP study held a secondworkshop four months later to identify strategies forconfronting the threats listed above, as well as to deter-mine how to measure the success of those strategies.The results of this second workshop are being incorpo-rated into the new Cayambe-Coca management plan.
TNC recommends performing threats analyses everyfive years as part of a monitoring program for the pro-tected area. Periodic analysis provides a picture of howthe area is changing and what actions are necessary tokeep it intact. Based on the experience of thePALOMAP study, it would be preferable to repeat thethreats analysis using individual natural systems or thesocioecological zones described above. Most protectedareas in Latin America are too big to be treated or mon-itored all at once. Areas like Cayambe-Coca, whichcontain incredible diversity due to their altitudinal andprecipitation gradients, are especially challenging. Inaddition, management of such a large area is facilitatedby involving only those who have a direct interest in itsmanagement because the area influences their lives.
Local communities can and should participate in thethreats analysis. Although they do not need to beinvolved from the outset, they should understand howoutside interests and they themselves pose a threat tothe long-term management of the protected area. Thebelief that local communities cannot process this infor-mation is both naive and short-sighted, as most conser-vation organizations attempt to work with local peopleto minimize or eliminate threats and improve theirquality of life through improved income, wealth, andprovision of services, such as health and education. TheNature Conservancy’s Center for Compatible Eco-nomic Development has developed an excellent way of
involving local people in threats analyses. Rather thanjust considering protected area threats, the Centerdivides the threats analysis into three components: aprotected area threats analysis, an economic threatsanalysis, and a community threats analysis. By involvinglocal people in all three they develop an appreciation ofhow their lives, including their socioeconomic well-being, are tied to the protected area and the services itprovides. The Conservancy’s Latin America andCaribbean Division (LACD) has not yet used this exactmethodology, though experiments are now beginning.
Human Ecological Profiles (HEPs)
Up-to-date and accurate socioeconomic and socioeco-logical information on local communities is vital foreffective protected area assessment, planning, and man-agement. The third research tool applied in thePALOMAP study was the development of a HumanEcological Profile (HEP) of the protected area. AnHEP describes the relationships between local popula-tions and a protected area and its natural resources.HEPs can be general, painting an overall picture of howlocal communities interact with the protected area, ordetailed, including extensive information on specificactivities, such as hunting and their impacts on the siteand biological resources. An HEP generally includesinformation on the following:
• Size, location, ethnic composition, and basic historyof key communities and their interactions with out-side institutions;
• Socioeconomic status of residents;
• Importance and extent of local resource use, includ-ing, where possible, spatial and temporal distributionand rates of resource use;
• Local social and political structures, including cus-tomary institutions for resource management anddecision-making hierarchy in the community;
• Social conflicts, e.g., stemming from resource con-flict;
• Local awareness and attitudes toward the protectedarea;
• Level of local participation in protected area man-agement; and
Ulfelder and Dugelby 57
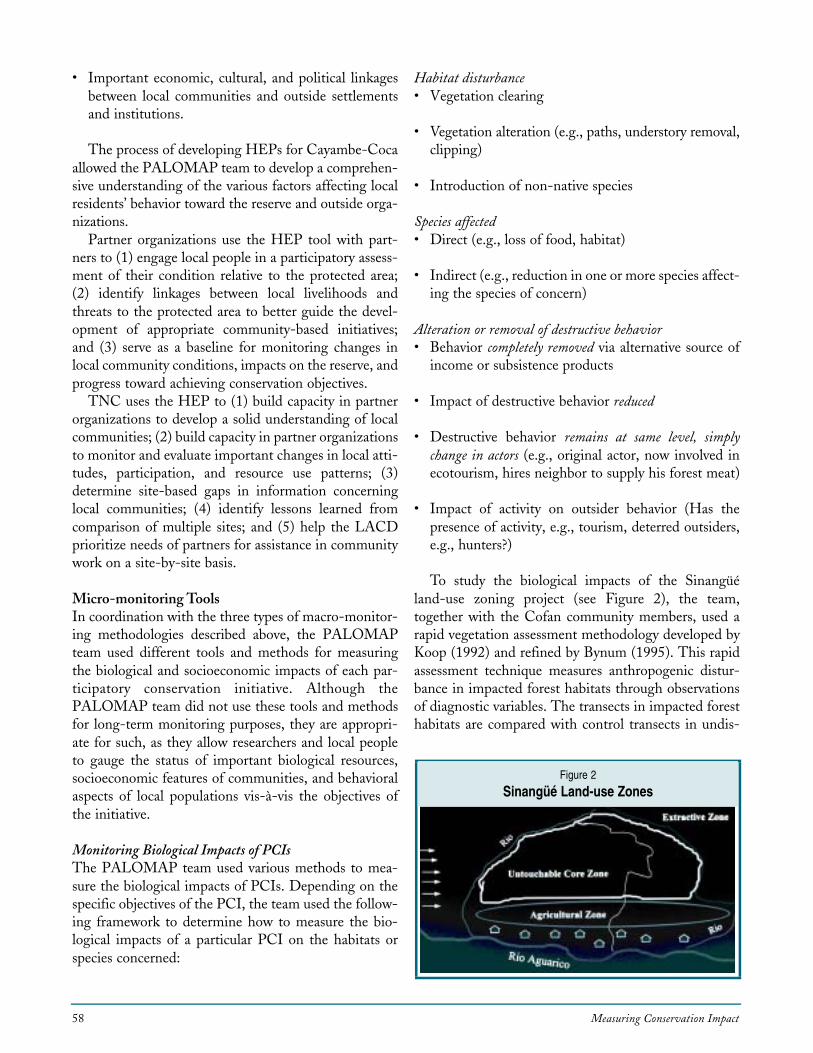
• Important economic, cultural, and political linkagesbetween local communities and outside settlementsand institutions.
The process of developing HEPs for Cayambe-Cocaallowed the PALOMAP team to develop a comprehen-sive understanding of the various factors affecting localresidents’ behavior toward the reserve and outside orga-nizations.
Partner organizations use the HEP tool with part-ners to (1) engage local people in a participatory assess-ment of their condition relative to the protected area;(2) identify linkages between local livelihoods andthreats to the protected area to better guide the devel-opment of appropriate community-based initiatives;and (3) serve as a baseline for monitoring changes inlocal community conditions, impacts on the reserve, andprogress toward achieving conservation objectives.
TNC uses the HEP to (1) build capacity in partnerorganizations to develop a solid understanding of localcommunities; (2) build capacity in partner organizationsto monitor and evaluate important changes in local atti-tudes, participation, and resource use patterns; (3)determine site-based gaps in information concerninglocal communities; (4) identify lessons learned fromcomparison of multiple sites; and (5) help the LACDprioritize needs of partners for assistance in communitywork on a site-by-site basis.
Micro-monitoring ToolsIn coordination with the three types of macro-monitor-ing methodologies described above, the PALOMAPteam used different tools and methods for measuringthe biological and socioeconomic impacts of each par-ticipatory conservation initiative. Although thePALOMAP team did not use these tools and methodsfor long-term monitoring purposes, they are appropri-ate for such, as they allow researchers and local peopleto gauge the status of important biological resources,socioeconomic features of communities, and behavioralaspects of local populations vis-à-vis the objectives ofthe initiative.
Monitoring Biological Impacts of PCIs
The PALOMAP team used various methods to mea-sure the biological impacts of PCIs. Depending on thespecific objectives of the PCI, the team used the follow-ing framework to determine how to measure the bio-logical impacts of a particular PCI on the habitats orspecies concerned:
Habitat disturbance• Vegetation clearing
• Vegetation alteration (e.g., paths, understory removal,clipping)
• Introduction of non-native species
Species affected• Direct (e.g., loss of food, habitat)
• Indirect (e.g., reduction in one or more species affect-ing the species of concern)
Alteration or removal of destructive behavior• Behavior completely removed via alternative source of
income or subsistence products
• Impact of destructive behavior reduced
• Destructive behavior remains at same level, simplychange in actors (e.g., original actor, now involved inecotourism, hires neighbor to supply his forest meat)
• Impact of activity on outsider behavior (Has thepresence of activity, e.g., tourism, deterred outsiders,e.g., hunters?)
To study the biological impacts of the Sinangüéland-use zoning project (see Figure 2), the team,together with the Cofan community members, used arapid vegetation assessment methodology developed byKoop (1992) and refined by Bynum (1995). This rapidassessment technique measures anthropogenic distur-bance in impacted forest habitats through observationsof diagnostic variables. The transects in impacted foresthabitats are compared with control transects in undis-
Measuring Conservation Impact58
Figure 2
Sinangüé Land-use Zones

turbed forest habitat. The use of this methodology isbased on the assumption that variables indicatinghuman disturbance vary among successional stateswithin a forest mosaic. A disturbed forest will have alarger proportion of younger states and therefore anassociated change in the diagnostic features associatedwith each successional stage (Bynum 1995).
In Sinangüé, investigators measured variables as-sumed to be indicators of forest integrity along transectsin 10 � 10 m plots in all three use zones (agriculture,hunting/extraction, and protected) as well as in a con-trol site of relatively undisturbed forest (key informantsreported that local people rarely enter the area to huntor engage in other destructive activities). Forestintegrity indicators were classified as follows: 1) directindicators of human disturbance, 2) indirect indicatorsof human disturbance, and 3) forest structure indicators.The direct indicators of human disturbance were num-ber of trails, number of stumps, number of agriculturalspecies (coffee, manioc, and natanjilla), number of treesgreater than 25 cm diameter at breast height (dbh), andthe number of pambil (Ireartea deltoidea) palms tallerthan 5 m. A greater number of trails, stumps, and agri-cultural species indicates a greater level of human dis-turbance, while a greater number of large-diameter treesand pambil palms (used for construction) would indicatea lower level of human disturbance.
Indirect indicators of human disturbance measuredalong the transects included the number of dondofa(Cercropia ficifolia) and pataga (C. sciadophylla) trees.Cercropia are pioneer species, emerging after distur-bances in the forest open gaps in the canopy. Localguides identified these two species as being common indisturbed areas. Finally, forest structure indicators mea-sured in transects included the number of trees greaterthan 50 cm dbh, the presence of a typical distribution oftree diameters (a healthy, undisturbed forest has manytrees with small diameters and a few trees with largerdiameters), and the number of layers in the forest (anundisturbed tropical lowland forest should have three-to-four layers, whereas a disturbed one will have one-to-two layers as trees regenerate).
The PALOMAP team also studied the impacts ofthe zoning on mammal and bird species. EcoCiencia,an Ecuadoran science organization, had sampled theSinangüé forests for mammal and bird diversity andabundance approximately three years prior to thePALOMAP study. The PALOMAP study usedEcoCiencia’s transects to determine how the zoninghad affected these same game and non-game forest
species. Transects were located in the protected andhunting/extraction zones. Each transect was 2 km longand was walked three times a day. The team traveledthe transect at 1 km per hour, identifying both birdsand mammals by sight and sound. At each siting, thespecies name, number of individuals, and, when possi-ble, sex were registered. Researchers throughout theworld use this well-established method (Mena andCueva 1995a and 1995b). The PALOMAP team com-pared the data collected along these transects across usezones, as well as across times of the day (Mena andCueva 1996).
In addition, the EcoCiencia team and communitycounterparts registered all mammals, fish, and birds thatvillagers caught or hunted during a 40-day period inJuly and August 1996. The animal’s size, weight, and sexwere registered, as were the location of the catch, its use(consumption, sale, hide, etc.) and the weapon used incapture.
All the results of the vegetation study, wildlife survey,and hunting census were analyzed and discussed withmembers of the Sinangüé community. This groupanalysis led to increased efforts to better protect the areathrough the establishment of a Cofan indigenous terri-tory. That agreement has now been signed with the gov-ernment, providing the Cofan with user rights and theobligation to protect the region, along with the parkagency, from colonization by outsiders.
Monitoring Socioeconomic Impacts of PCIs
This paper discusses only how the PALOMAP studydetermined the type of participation that occurred inthe implementation of each PCI, and how that partici-pation may have changed through the evolution of theinitiative. Many conservation practitioners recognizethe importance of local participation without under-standing that it can take many forms and that the formwill have a strong influence on the project’s success. It isimportant to monitor the form of participation of localpopulations throughout the life of a project.
Participation Type
Rather than create new typology of participation, thePALOMAP team, using previous work by Biggs (1989)and Pimbert and Pretty (1995), described six types oflocal participation in PCIs. They are as follows:
Passive participationThe community or group of persons participate byreceiving information about something that will happen
Ulfelder and Dugelby 59

or has already happened. The idea or need of commu-nity participation originates outside of the community,typically among the agents promoting conservation orcommunity development. The “participtory interaction”is one way (from those making certain decisions towardthose who should be listening). Responses of the com-munity are not taken into consideration and the “own-ers” of information are those professionals or personsexternal to the community. Sometimes, the participa-tion appears to be passive, but actually, it is coercive,given that there are regulations, rules, or policies thatrequire participation. One example is levying fines frompeople who do not attend meetings.
Contractual participationThe PCI formally solicits or invites community partici-pation. For example, certain required “services” for aproject may be contracted to members of the commu-nity. The most common type of contractual participa-tion is where an NGO provides the materials for aproject, and the community provides the labor. In thistype of participation, the idea of participation alsocomes from outside of the community, and the mannerin which local people participate is largely determinedby outside agents. Similarly, information typically flowsfrom the outside to the communities, with limited inputby local residents.
Consultative participationIn consultative participation, the initiative also comesfrom the outside, but it is based on the wishes, opinions,and needs of individuals or communities. Outsideagents define the problems and solutions, but they canbe modified in light of information obtained throughcommunity consultations. The information on the com-munity is normally obtained by the “extractive investi-gators,” and analyzed by experts who present onesolution to the community. In these situations, the rela-tionship between the community and the outside agentsis similar to that between a doctor and a patient.
Collaborative participationIn this case, both outsiders and community membersparticipate to diagnose a problem, analyze the facts,design the solution, and implement monitoring andevaluation efforts. This type of participation requiresgood relations and long-term commitment from thecommunity and the outside agents. It requires continu-ing interactions; this is not a fast process, and it is diffi-cult to establish this type of participation when there are
long distances between those involved. Even thoughproject managers try to establish equal and equitablerelations, there is always inequality between the out-siders and the community, at least during the firstphases of a project.
“Between Colleagues” participationThe fundamental objective of this type of participationis to strengthen the capacities of the community and/orlocal groups to carry out their own conservation anddevelopment projects. The incentive for this type ofparticipation comes from the outside, but the emphasisis on building the capacity of informal systems and localpeople. The outside agents who promote this type ofparticipation want to “level the playing field” of conser-vation and development, and look to empower theircommunity associates and strengthen their abilities tonegotiate with agencies and outside institutions.
Communitry self-mobilizationIn all the types of participation described above, thereare two sets of players, the local people or communityand the outside agents. In community self-mobiliza-tion, the community identifies a problem or solutionwithout the existence of outside initiatives. The localgroups look for their own resources and ways to solvetheir problems or implement conservation activities.They may seek outside technical assistance, but theycontrol the process. There are tendencies to classify thistype as the “ideal” form of community participation inthe conservation of natural resources. It is important torecognize, however, that community self-mobilizationcan reflect existing inequities in the community, and cangenerate conservation activities that fortify the localpower and damage socially disadvantaged groups, suchas the poor, the young, women, or local minorities.
The PALOMAP team agreed that, although NGOsshould work to develop a community’s capacity to thepoint that it can negotiate with outsiders on a more levelplaying field, projects do not necessarily have to startout with community self-mobilization. A project couldbegin as “consultative” participation and evolve overtime to “collegial” participation. The problem, however,is that project staff often do not monitor this changeeven though they talk about empowerment and thecommunity’s ability to continue the project on its own.Therefore, it is important that projects become moreconscious of the type of participation they are promot-ing and how that participation affects the project’simpacts and sustainability.
Measuring Conservation Impact60
First, it should be noted that, although local partic-ipation in conservation and development projects is ameans to an end, it can also be an end in itself. In“between colleagues” participation, the goal is toempower local people so that they can diagnose theirown problems, develop responses for solving them,and implement projects independently. As an anthro-pologist once told a group of Guaymi indigenous peo-ple, “We are trying to put ourselves out of business.We want to work with you in a way so that, in thefuture, you can do this work yourselves” (Stocks 1996).The “between colleagues” participation should be agoal of project staff and participating villagers. Onlywith this type of participation will villagers be trulyempowered.
Second, like any other area of project work, projectstaff and participating villagers should agree on a seriesof indicators of participation. These agreed upon indi-cators are what will be monitored throughout the life ofthe project. Indicator questions might include the fol-lowing: Are villagers treated as equals? Are villagers bet-ter equipped to negotiate with NGOs and govern-mental organizations?
Third, gender is an important consideration whenmeasuring participation. Who is participating? Arethey participating equally? This goes not just for thework on-the-ground, but also for decision-making,representation, etc.
Local participation can be monitored in several ways.Interviews and focus groups allow people to voice theiropinions. Investigators can ask questions relative to theindicators to determine the opinions of local people onthe participatory process.
An exercise can be performed in small groups withthe six types of participation laid out in front of thegroup and clearly explained. The villagers can then“place” the project they are working on in one of theparticipatory categories. The same can be asked of pro-ject staff. This can even be done by drawing the spec-trum of participation types on paper mounted on thewall. The group then places a sheet of colored paperwith the name of the project in one of the participation-type boxes. This can be done for the entire project orsubcomponents.
Similar to the institutional analysis done with thecolored circles of different sizes, one can ask villagers toplace circles of different colors and sizes depicting theirprojects on paper. The different colors, sizes, and dis-tances between the circles should initiate a discussionabout how villagers see themselves participating in a
project and the nature of their relationships with othervillagers, project staff, and technical experts.
CONCLUSIONS
It is important to monitor PCIs on several levels simul-taneously. Simply looking at a project’s economic im-pact, for example, will tell you little about whether it ismitigating or eliminating important threats to the pro-tected area that motivated the intervention. TNC andits Latin American and Caribbean partners, like mostother conservation organizations, are beginning todevelop an integrated model for monitoring and evalu-ation that will provide site managers and involvedNGOs and communities with a monitoring model forsuccessful adaptive management. Five elements of thatmodel are 1) stakeholder analysis, 2) threats analysis,3) development of HEPs, 4) participatory typology,and 5) development of enterprise monitoring pro-grams.
Many of these components are also planning instru-ments. Successful adaptive management implies revis-iting the planning procedures and informationperiodically to determine whether reasoning was cor-rect and the chosen data collection methods wereappropriate. Managers must be flexible in the imple-mentation of monitoring and evaluation methods.Many managers will not be able to do use all five com-ponents of the PALOMAP study at once—they mustchoose the components that are most effective and effi-cient for their information needs. Only through trialand error will they develop a better appreciation andunderstanding of how powerful monitoring is for suc-cessful management.
REFERENCES
Biggs, S. 1989. Resource-poor farmer participation inresearch: A synthesis of experiences in national agricul-tural research. OFCOR Comparative Study, No. 3.The Hague, The Netherlands: ISNAR.
Bynum, David Z. 1995. Assessment of AnthropogenicDisturbance in Lore Lindu National Park, CentralSulawesi, Indonesia. Master’s Project. DukeUniversity.
Koop, H. 1992. Tools To Diagnose Forest Integrity.National Park Development Project Buffer Zoneand Research Management. World Bank, Govern-ment of Japan, and Government of Indonesiareport. Institut voor Bos en Natuur Onderzoek.
Ulfelder and Dugelby 61

Measuring Conservation Impact62
Machlis, G.E., and D.L. Tichnell. 1985. The state of theworld’s parks: An international assessment for resourcemanagement, policy and research. Boulder, Colorado:Westview Press.
Mena, Patricio, and Ruben Cueva. 1995a. Diversidad yabundancia relativa de los mamíferos en Sinangüé,Sucumbíos, Ecuador. Quito: Ecociencia.
_______. 1995b. Diversidad y abundancia relativa de lasaves en Sinangüé, Sucumbíos, Ecuador. Quito:Ecociencia.
_______. 1996. Cacería y monitoreo de mamíferos y avesen Sinangüé, Sucumbíos, Ecuador. Quito: Ecociencia.
Pimbert, M., and J. Pretty. 1995. Parks, people and pro-fessionals: Putting “participation” into protected areamanagement. New York: UNRISD.
Stocks, Anthony. 1996. The BOSAWAS Natural Reserveand the Mayangna of Nicaragua. In Traditional peo-ples and biodiversity conservation in large tropical land-scapes, eds. K. Redford and J. Mansour. Arlington,Virginia: The Nature Conservancy.
Ulfelder, William H., Susan V. Poats, Jorge Recharte B.,and Barbara L. Dugelby. 1998. Participatory con-
servation: Lessons of the PALOMAP study inEcuador’s Cayambe-Coca Ecological Reserve. AméricaVerde, Working Paper No. 1b. Arlington, Virginia:The Nature Conservancy.
Weeks, William. 1996. Beyond the ark: Tools for an ecosys-tem approach to conservation. Washington, D.C.:Island Press.
Wells, M., and K. Brandon. 1992. People and parks:Linking protected area management with local commu-nities. Washington, D.C.: The World Bank.
West, L. 1995. Análisis de Amenazas a las AreasProtegidas. Report presented at the ConservationTraining Week of The Nature Conservancy, May1995, Quito, Ecuador.
West, P., and S. Brechin. 1990. Resident peoples andnational parks: Social dilemmas and strategies in inter-national conservation. Tucson: University Press ofArizona.
Western, D., and R.M. Wright, with Shirley C. Strum,eds. 1994. Natural connections: Perspectives in com-munity-based conservation. Washington, D.C.:Island Press.

INTRODUCTION
Designing monitoring programs that will assess theimpact of conservation efforts and provide useful feed-back for management requires a careful analysis of boththe predicted conservation impacts (the goals of theconservation program or the “final target condition”)and the management issues of concern in the area ofstudy (Walters and Holling 1990; Salafsky andMargoluis, this volume). The use of native species byhumans presents an important management issue insideand adjacent to many reserves (Robinson and Redford1991; Hall and Bawa 1993; Bodmer et al. 1994; Bodmer1995; Fa et al. 1995; Fitzgibbon, Hezron, and Fanshawe1995). When such useful species also represent key ele-ments in the local economy of the region, then moni-toring them provides the opportunity to link theecological and economic consequences of conservationaction. Researchers study many useful species eitherfrom a conservation perspective or from a sustainableuse perspective; with some additional effort, more ofthese species could be monitored from both perspec-tives, to permit critical assessment of the interrelation-ships between conservation action, development action,ecology, and economy. Thus, useful native plants andanimals often could serve as excellent choices for indi-cator species for monitoring parks (Kremen, Meren-lender, and Murphy 1994). Monitoring natural resourceuse is particularly appropriate for assessing IntegratedConservation and Development Projects (ICDPs),
whose primary mechanism for conserving natural areasis by providing economic alternatives to natural areadestruction for human populations living adjacent toreserves (Kremen, Raymond, and Lance 1998).
This paper describes new methods in quantitativeethnobotany (Prance et al. 1987, Phillips and Gentry1993a, Phillips et al. 1994), which we developed forselecting and following natural resource indicatorspecies, and for designing a buffer zone for the MasoalaICDP in northeastern Madagascar (Figure 1). This pro-ject’s goal is to protect a 310,000-ha block of rain forestby setting aside 210,000 ha as a national park and devel-oping sustainable-use forest management plans for thesurrounding forests of 100,000 ha. The goal of develop-ment activities in this “multiple-use zone” is to discour-age shifting agriculture by local inhabitants by increasingthe economic value of the forest through sustainableextraction of timber and non-timber products. Theproducts to be extracted include both species currentlyused by villagers (e.g., timber) and those for which nouse or market has yet been developed (e.g., palm seedsfor the ornamental palm market).
Local inhabitants already use more than 100 speciesof rain forest trees destructively (i.e., thereby killing theplant) for firewood, construction, handicrafts, food, anddug-out canoes (Raymond 1995). The collectors usemost of these species for their own subsistence. In gen-eral, the well-being of the society depends, to a largedegree, on the availability of forest products. Somespecies have already become rare due to over-exploita-
❖
6Monitoring Natural Resource Use on the Masoala Peninsula,Madagascar: A Tool for Managing Integrated Conservation
and Development Projects❖
CLAIRE KREMEN, ISAIA RAYMOND, KATE LANCE, AND ANDREW WEISSWildlife Conservation Society/Center for Conservation Biology, Stanford University;
Projêt Masoala, Cooperative for Assistance and Relief Everywhere (CARE) International Madagascar;University of Wisconsin; and Center for Conservation Biology, Stanford University; respectively

tion and are consequently highly prized. The key ques-tion is “How will the presence of the MasoalaIntegrated Conservation and Development Projectinfluence the availability and use of forest products, aswell as the abundance, distribution, and demography ofthe species concerned?”.
Evidently, the two prongs of the Masoala Project’sstrategy—absolute protection and development of newmarkets for forest products—will have important influ-ences on the way that local people use plant resources,with subsequent influences on rain forest ecology andthe local economy. By expanding access to existingdomestic markets and developing new internationalmarkets, people will begin to have access to cash, whichmay encourage them to substitute purchased items forproducts they formerly got from the forest (e.g., tinroofs instead of thatch). Extraction of some species willdiminish, but people will now collect for sale speciesthey once largely ignored. The restriction of collectinginside the park may lead to an intensification of collect-ing for certain species outside of the park. Thus, thetype, quantity, and location of forest products extractedwill change over time. In turn, the management pro-grams for different species will need to be adjustedaccording to these changing use patterns. Similarly, the
switch to a cash economy will significantly affect thestandard of living of people adjacent to the park and themultiple-use zone, as well as their attitudes and behav-ior toward conservation and natural resource manage-ment issues (Godoy and Bawa 1993).
We monitored people’s use of tree resources, using amultidisciplinary approach to look at both ecologicaland socioeconomic impacts. The monitoring of naturalresource use on the Masoala Peninsula is one compo-nent of a larger monitoring program established in1995, based on initial studies begun over the previousfour years. The broad goals of this monitoring programare to (1) assess the integrated conservation and devel-opment strategy as a mechanism for natural areas pro-tection and (2) provide feedback to guide the park andmultiple-use management plans. This paper describesthe monitoring of natural resource use within the con-text of the larger program, with special emphasis onselection of natural resource use indicator species andmonitoring methods.
CONTEXT
The Masoala Peninsula contains the last remaininglarge area of lowland tropical forest in Madagascar, inaddition to many other terrestrial and marine habitattypes, and has long been recognized as a conservationpriority by Madagascar’s Environmental Action Plan(World Bank et al. 1988). Home to countless Mada-gascar endemics, including species and sub-speciesknown only from Masoala (Rakotondraibe andRaharimalala 1994; Fisher, In press; Sterling, In press;Kremen, Raymond and Lance 1998), the area is acces-sible only by boat. Eleven major watersheds dissect thearea.
A consortium of international nongovernmental orga-nizations (NGOs), including Cooperative for Assistanceand Relief Everywhere (CARE), Wildlife ConservationSociety, and the Peregrine Fund, has run the MasoalaICDP since 1993, under the guidance of Madagascar’sDirection des Eaux et Forêts and Association Nationalepour la Gestion des Aires Protégées. The project con-ducts three principal groups of activities aimed at con-serving the biodiversity of the region:
• Conservation includes establishment of a newnational park of 210,000 ha, with three satellitemarine reserves, and development and implementa-tion of the park management plan, which includespatrolling, development of ecotourism, ecological
Measuring Conservation Impact64
Figure 1
Map of Madagascar, Showing Location of the MasoalaPeninsula

monitoring, environmental education, and habitatmanagement/restoration activities.
• Development emphasizes the organization of therural community into associations that work togetherto improve the social and economic development ofthe Masoala region in a sustainable fashion compati-ble with biodiversity conservation. Examples ofactivities undertaken by individual associationsinclude intensive rice cultivation, stabilization ofshifting cultivation through crop rotations, artisanalproduction, and sustainable eco-certified forestry. Asocioeconomic monitoring program provides feed-back on the impacts of these activities.
• Feasibility studies support the conservation anddevelopment units by assessing the viability of suchactivities as ecotourism and sustainable forestry.
While conservation activities currently occur aroundthe entire Peninsula, the development activities arerestricted to three pilot watersheds (Figure 2), since theavailable human and financial resources did not permitworking in all areas simultaneously.
Both the ecological and socioeconomic monitoringprograms therefore consider pilot watersheds as “exper-imental areas,” and non-pilot watersheds as “controlareas.” In fact, the latter areas are not strict controlsbecause the conservation team is carrying out activitiesthere, but this design allows a comparison between inte-grated conservation and development and traditionalconservation. This design also allows for a further com-parison between areas inside the park and areas in theperipheral zone around the park. The peripheral zoneconsists of a multiple-use forestry zone, areas where for-est management is unregulated, and agricultural lands(Figure 3).
METHODS
Site Description
Forests of the Masoala Peninsula
Primary vegetation still covers about 72% of the 4,200km2 Masoala Peninsula (15°22’ to 15°59’ S latitude).The vegetation consists primarily of lowland evergreen
Kremen, Raymond, Lance, and Weiss 65
Figure 2
Map of the Masoala Peninsula
Figure 3
Map of the Anaovandrano Pilot Watershed andMonitoring Zone

humid forest (less than 600 m, referred to in future as“lowland rain forest”), although isolated fragments oflittoral forest, a coastal evergreen forest growing onsandy soils, also occur along the coast. These two foresttypes are among the most threatened habitats found inMadagascar (Du Puy and Moat 1996). Both foresttypes occur in the Anaovandrano watershed in thesoutheastern part of the Peninsula where this study wascarried out (Figure 3), and harbor important useful treespecies. Littoral forests differ in species compositionand structure from rain forests (Dupuy and Moat 1996,Rahajasoa, unpublished data), and can be distinguishedfrom rain forests by texture and gray-scale intensity onSatellite Probatoire d’Observation de la Terre (SPOT)panchromatic satellite imagery (unpublished observa-tions).
A rainfall gradient occurs from the eastern oceanside to the western bay side of the Peninsula, with west-ern areas receiving on average 1,000 mm more rain peryear (Andriamampianina 1995). This rainfall gradientmay significantly affect the floristic composition anddiversity (Gentry 1993, Abraham et al. 1996); andindeed, both floristic and faunistic inventories on thePeninsula have demonstrated differences in species dis-tribution and community composition between theeastern and western rain and littoral forests (Kremen etal., In press; Andriamampianina 1995; G. Rahajasoa,Unpublished data). Household use surveys conductedin western (Raymond 1995) versus eastern villages (thispaper) confirm that use patterns also differ based onlocal preferences and plant abundances.
Human Population of MasoalaThe current population of the Peninsula is approxi-mately 44,500 (Banque de Données de l’Etat andMasoala Project, Unpublished data). The majority ofpeople belong to the Betsimisaraka tribe. TheBetsimisaraka people traditionally practice shifting cul-tivation to grow rainfed rice on slopes (jinja), but somepeople also grow rice in irrigated paddies in valley bot-toms (horaka). The Betsimisaraka people are nothunter-gatherers in the strict sense; nonetheless, manypeople have substantial knowledge of the forest, itsplants and animals, and their uses.
The bulk of the population lives in villages along ornear the coast, and subsists through a combination ofrice cultivation and fishing. The heavily settled area islargely deforested, with the majority of deforestationhaving occurred in the last 40 years, as in the rest of theeastern rain forest region (Green and Sussman 1990,
Nelson and Horning 1993). Typically, the only forestsremaining near coastal villages are small patches of lit-toral forest, in which villagers nonetheless gather mostof the forest resources they need.
New immigrants and the offspring of landed villagerscan no longer find land in the coastal or nearby inlandvillages, driving a wave of settlement up the water-courses, where settlers now cut primary forest to claimland and cultivate rice (Figure 3). People living in thesesettlements gather forest resources from the nearbyhumid evergreen forests.
Village and Household SelectionGiven that village types have different resource needsand utilize different forest types, we chose representa-tive villages along a coastal-inland transect to develop acomplete picture of watershed resource use. A similarpattern of village settlement and resource use is repeatedin each of the eastern watersheds of Masoala(Unpublished data). Figure 3 and Table 1 show the vil-lages occurring in the study area, their sizes, straight-line distance from the river’s mouth and from thenearest forest the villages use, forest type they primarilyuse, and the number of households sampled.
One hundred households distributed among 7 vil-lages were sampled from among the 288 households inthe watershed (35%). In general, all or most house-holds were sampled in villages with fewer than 25households, while 20–27% of the total householdswere sampled in villages with more than 50 house-holds. In these large villages, household selection wasstratified among four socioeconomic categories thattypify households of the Masoala Peninsula (R.Lemaraina, Unpublished data). The poorest house-holds are landless, and work as sharecroppers or fish-ermen. The next category owns jinja fields (shiftingcultivation), but no horaka (valley bottom land). Thenext category has both jinja and horaka lands. Thewealthiest category, in addition to jinja and horaka,also has some or all of the following: cattle, a tin roof,a wooden plank house rather than a traditional house(tranogasy), and a shop. Only the wealthiest category,usually not more than 5% of the village, has trulyentered into a cash economy.
Household Survey TechniquesWe always conducted interviews with the head of thehousehold (usually male). Prior to the interview, weexplained the purpose of the study by stating that theinformation to be collected would help design and
Measuring Conservation Impact66

Kremen, Raymond, Lance, and Weiss 67
monitor sustainable forest management plans. Theinterviewer collected the following basic information:village, date, name of informant, sex, and age. Thisinformation can be linked with existing demographicdata on each household (R. Lemaraina, Projet Masoala,Unpublished data). The interviewer then asked eachinformant to give the common names of the species ofwoody plants that s/he harvested for each of the follow-ing use categories (adapted from Phillips and Gentry[1993a]) : (1) food/beverage, (2) house construction, (3)firewood, (4) weaving, (5) dug-out canoes, (6) medicinaluse, (7) lumber, (8) fiber, and (9) household use (e.g.,broom, mortar and pestle).
For each tree species named by the informant, wecollected the following information: (1) vernacularname in greatest detail (see below), (2) minimum dis-tance traveled to obtain product, (3) maximum distancetraveled to obtain product, (4) forest type, (5) name offorest, (6) part taken (e.g., trunk, branch, leaf, or bark),(7) amount taken in stems per year, (8) stem diameterrequired, (9) specific use(s), (10) price obtained if sold,and (11) name of substitution products. In the case ofspecies for which collectors utilize only the leaves orbark, we collected additional information to determinewhether the harvest was destructive.
To determine preferences for individual species, wealso asked a smaller number of informants (N = 40) toname the five most preferred species in each use cate-gory, and whether they collected the plant in littoral for-est or rain forest.
Vernacular versus Scientific NamesMany vernacular names refer to a set of species, as inHazovola, which refers to Dalbergia species (Fabaceae).However, Hazovola mena is D. chapelieri and Hazovolafotsy is D. madagascariensis. During the survey, theinterviewer would ask for the most detailed level ofinformation that the informant could provide.
A certain number of the plant species referred to byvernacular name in the household survey have beenidentified from collections made from the MasoalaPeninsula (Raymond 1995; G. Rahajasoa, Unpublisheddata). We collected vouchers for the remaining uniden-tified species, and are in the process of identifying them.The scientific identification of tree species, however,requires access to specimen and literature resourcesoften not available within Madagascar, and depends foraccurate results on the availability of fertile specimens.In addition, many of the plants from Masoala are newto science (G. Schatz, Personal communication), andmay not be described until a botanist examines thegroup in question. The urgent need to select indicators,establish a monitoring program, and monitor resourcesannually required the use of vernacular names for datagathering.
A number of difficulties exist, however, in using ver-nacular names. First, the same common name mayrefer to different plants from locality to locality.Conversely, more than one name may exist for the sameplant. Prior to data analysis, we constructed a list ofequivalent names and standardized the data set. A sec-
Table 1. Village Characteristics and Number of Households Sampled
Number Popu- Distance Distance Forest typeof lation Households from river to forest primarily Major
Village households size sampled mouth (km) (km) used activities
Ifaho 22 94 21 0.0 1.3 Littoral forest Fishing,Farming
Sahamalaza 131 605 32 3.4 1.2 Littoral forest FarmingManarimbola 55 266 12 4.0 1.7 Littoral forest FarmingTanambao-Mahatsinjo 52 233 14 8.5 5.1 Rain forest FarmingAntsofitsoa 5 20 4 9.0 0.5 Rain forest FarmingManiry 10 44 10 10.9 1.2 Rain forest FarmingIketra 13 — 7 14.2 0.5 Rain forest Farming
Total 288 100

ond problem is that many folk names lump togetherseveral species (see Annex). These species generallybelong to the same genus, occasionally to different gen-era in the same family, or rarely, to species in more thanone family.
The use of vernacular names is not ideal. However,the fact remains that a villager recognizes “folkspecies” (Phillips and Gentry 1993a) and will thereforereport household use by this entity rather than by ascientific name. Even if the interview is conducted ina marked permanent plot in reference to an identifiedvoucher (Phillips and Gentry 1993a, b), the infor-mant’s concept of a species may be broader than thatrepresented by the specimen, and the uses reportedwill reflect his/her species concept. Therefore, moni-toring at the folk species level is unavoidable. Anadvantage is that such an approach will keep costsdown by reducing dependency on outside experts.Researchers must make an effort to describe each folkspecies and include it in a database, by collecting mul-tiple voucher specimens for all vernacular names andmapping the relationship between voucher name, sci-entific name, and locality.
Definition of Indices and CalculationsWe calculated the following indices for each folk speciesfrom the general survey: 1) average minimum and max-imum distances to obtain the product (Dmin, Dmax) and2) average quantity extracted per year in stems perhousehold (Q ave). We assumed that individuals did notuse the product if they did not report it. Note that Q aveincorporates data on extraction of the species over all itsuses (should it have more than one).
To determine the most preferred folk species in eachuse category, we calculated the choice value for eachspecies reported on the preferred species list. We definethe choice value (Cs) as the percentage of informantswho cited species s in category c (Pc,s), divided by thetotal number of species mentioned for category c (Sc) byall the informants.
Cs = Pc,sSc
The choice value varies between 0 and 100, withhigher values reflecting greater preference and/or feweralternatives. Comparison of choice values between usecategories emphasizes the number of available choices,while comparison of choice values within categoriesemphasizes the degree of preference for a given product.Because littoral and rain forests have different speciescomposition and therefore differ in availability of sub-
stitution products, we calculated choice values sepa-rately for littoral and rain forest.
Selection of Indicator SpeciesOnly species harvested destructively were considered inthe selection of indicator folk species for the monitoringof impacts of extraction. First, we redefined the originalbroad use categories to reflect groups of substitutionproducts. Categories based on groups of substitutionproducts represent economic categories, while thebroader categories used by many ethnobotanists can beartificial (Phillips and Gentry 1993b). For example, thebroad category “house construction” actually includedfour separate groups of substitution products: palms forroof-thatch, poles for house frames, palms for walls, andpalms for floor. These materials are used to build tradi-tional huts (tranogasy), while lumber is more often soldor used for furniture or boat-building. Once we definedthe sub-categories based on groups of substitutionproducts, we assigned each folk species to the one sub-category for which it was principally used (even if mul-tiple uses existed).
After structuring the total set of folk species useddestructively (N = 105) in this manner, we establishedthe number of indicator species to be chosen withineach use sub-category, based on the number of speciesprincipally used in that sub-category and the extractiveimportance of that sub-category (Table 2) . No medici-nal plants were to be selected because none were har-vested destructively.
To select indicator species for each sub-category. weconsidered the annual quantity extracted per house-hold (Q ave) and the choice values for littoral forestand rain forest (Cs), selecting, in general, those speciesthat were high-ranking in both of these characteristicswithin their sub-category. However, additional infor-mation was also considered in some cases, such as theaverage maximum distance traveled to obtain theproduct, the forest type, and the commercial potentialof the species.
Extractive Impact by CategoryTo assess the extractive impact of households by broaduse category, the average quantities extracted per house-hold for all species (Q ave) were summed over all speciesprincipally used in that use category. This summationprovides a rough estimate of extractive impact per use,because (1) Q ave values included extraction for all usescausing overestimation and (2) only species principallyused in the use category are included, causing underes-
Measuring Conservation Impact68

timation. These two errors should mitigate each otherto a certain extent.
RESULTS
Characterization of Extractive Patterns in theAnaovandrano Watershed
Species Diversity by Category
Figure 4 shows the number of folk species found to beused within each major use category. All known uses ofeach folk species were considered for each of the 105folk species found to be used destructively. House con-struction followed by firewood are the activities thatmake use of the greatest number of folk species; manyspecies (49% of the 61 species) are also shared betweenthese two categories. People use far fewer species (lessthan 20) for lumber or for building pirogues, and useonly a very small number of species for food or weaving.
Extractive Impact by Category
House construction and firewood are by far the greatestrelative consumers of stems annually (Figure 4). Ifextractive impact by category could be calculated moreprecisely, house construction and firewood categorieswould use more stems and less lumber, judging by thenumber of mis-classified responses due to the dual useof a given species (see “Methods”).
Interestingly, the distribution of extraction intensitiesamong categories closely mirrors the distribution of folkspecies among categories. Both relationships express theprincipal importance of resources for house construc-tion and for firewood in the daily lives of people of theMasoala Peninsula (similar results were also obtained inthe western portion of the Peninsula [Raymond 1995]).One interesting discrepancy, however, is that thepirogue use category, with the lowest overall extractionintensity per family (1.24 stems per family per year),nonetheless uses quite a few different folk species. Theuse of a large variety of species for pirogue-building maybe in response to the declining availability of suitablestems (stems must be of large diameter, straight, andgood-quality wood). People on Peninsula often com-plain about the difficulty of obtaining suitable pirogue-building material, and this may have intensified thetesting of alternate folk species.
Selection of Indicator Species by Sub-category
House Construction: House Frame
Local people use 27 folk species principally for con-structing house frames (see Annex). Nantonengrita(Sapotaceae: Faucherea thouvenoti) was ranked first choicefrom among trees obtained in littoral forest, and also hadthe highest extraction intensity per household (Q ave =5.77 stems per household per year) (Figure 5). Thisspecies was therefore an obvious candidate for an indica-tor species. This species occurs principally in the littoralforest. People collect Mantalanina (Com-bretaceae: Terminalia ombrophila) in both littoral and rainforest, an advantage for making forest type comparisons.While its choice value was relatively low (it was not evenrated as a choice for rain forest), its Q ave was high, indi-cating that its use is substantial. Amaninaombilahy(Sarcolenaceae) had high choice and use values but wascollected only in littoral forest, while Tsifo beravina(Rubiaceae: Canthium majas) was collected in both, andhad a high choice ranking in the rain forest type.
A not uncommon finding was that a less preferredspecies was more heavily used (e.g., Mantalanina) or
Kremen, Raymond, Lance, and Weiss 69
Table 2. Major Sub-categories of Use and theNumber of Indicator Species Selected per UseSub-category
No. of No. ofSub- substitution indicator speciescategory products to select
House Constructionhouse frame 24 4floorsa 3 1wallsa 3 1roof a 4 1
Lumber 15 4Firewood 30 4Canoe (Pirogue) 12 3Weavingb
hats 2 1mats 4 1
Foodheart of palma 6 1tubers 2 1alcoholc 2 1
Fiber 4 2Medicinal not applicable 0
a Ravenala madagascariensis is included in each of these cate-gories since it is the most important species for each category.b Includes two sedges collected in marshes outside of forests.c This sub-category was not included in the survey.

that a highly preferred species was rarely used (e.g.,Antohiravina [Bignoniaceae: Phyllarthron sp.] andHazonjahana). Frequently, this result can be explainedby the rarity of the preferred species.
Note also that the spread of choice values in rain for-est is narrow (the first four ranked values ranged onlyfrom 1.39 to 0.56), indicating that there are no strongpreferences within this set of substitution products. Incontrast, for littoral forest, the first four ranked choicevalues range from 5.71 to 0.82, showing a strong pref-erence for Nantonengrita among the available set ofsubstitution products. This species could becomedepleted in littoral forests due to this strong preference,and its depletion would undoubtedly be more importantto villagers living near littoral forest than would thedepletion of Antohiravina (Cs = 1.39, rank = 1) to vil-lagers living near rain forest, due to the availability ofmany suitable substitutes.
House Construction: Floor, Walls, and Roof
Ravinala (Strelitziaceae: Ravenala madagascariensis),also known as the Madagascar traveller’s palm, was byfar the most preferred species for floor and wall con-struction, and was also highly used. The same plant isalso most preferred for roof thatch and for food (heartof palm), although these data do not appear in theAnnex, which presents each folk species only oncewithin its principal use sub-category. Because Ravinalais such an important plant for so many uses, the break-down of its use by sub-category is presented in Table 3.Ninety-seven out of 100 informants reported using thisplant for one or more uses, resulting in 116 responses.
The next choice for wall construction, Sinkiara(Arecaceae: Dypsis sp.), is also extensively used (Annex),and was therefore also selected as an indicator. While
not yet extensively used for roof thatch, we selectedVontro (Arecaceae: Vonitra thouarsii) as an indicator,because villagers from western Masoala are now deplet-ing Vontro following resource-switching from Ravinala(Raymond 1995).
Firewood
We chose four of the six most heavily used species asindicators (see Figure 6 and Annex). All of these speciesalso have high choice rankings in one or both foresttypes, and are used in both. We did not selectHarongana (Clusiaceae: Harungana madagascariensis)despite its high use and choice values, because it is a col-onizer species typically occurring in gaps or as virtualmonocultures in abandoned fallows. Madagascar hassurprisingly few aggressive secondary forest species(Abraham et al. 1996), and we chose not to includethem so as to monitor the impacts of natural resourceuse on primary forest.
Lumber
People across Madagascar recognize the lumber speciesHintsy (Fabaceae: Intsia bijuga) for its fine timber prop-erties. Interestingly, its choice value was high among lit-toral forest users but not among rain forest users (Annex).It grows along watercourses and in the littoral forest, soits lower choice value in the rain forest probably reflectsthe difficulty of obtaining it (we found no stems ofHintsy greater than 10 cm in diameter at breast height(dbh) in three permanently marked 1-ha plots in rain for-est in the Anaovandrano Watershed, while abundances ofHintsy in two 1-ha littoral forest plots ranged between
Measuring Conservation Impact70
Figure 4Number of Folk Species per Use Category and Mean
Stems per Family per Year
Figure 5Indicator Species Selection for House
Frame Construction

17.8% and 25%). We chose this species as an indicator,and the remaining species, all with much lower extractionintensities (Q ave), were species with high choice valuesthat are harvested from both forest types. Since Q ave val-ues fell to about 0.2 to 0.3 stems per household per yearafter the second-ranking species, Nanto beravina(Sapotaceae: Labramia sp.), the selection of the last twospecies was primarily determined by choice values (firstand second ranked in rain forest) and to select speciesthat will also be managed sustainably as eco-certifiedtimber as one of the Masoala Project’s developmentactivities (Guillery, Personal communication).
Pirogue
We selected as indicators the three folk species showinghighest extraction intensities and choice values in bothforest types (Cs<4): Vintanona (Clusiaceae: Calophyllum
sp.), Mantady (Combretaceae), and Sary (Rhopa-locarpaceae: Rhopalocarpus macrorhamnifolius) (Annex).These three species also had high choice values ranked5 or higher in both forest types. Although littoral forestusers chose Hazinina (Clusiaceae) as their preferredpirogue tree, the survey data showed that this specieswas much more commonly used for lumber.
Note that Dmax, the average maximal distance peoplewill go to obtain the product, is greater than 5 km for allof the preferred species. Pirogue builders already havedifficulty finding trees of suitable size on the Peninsula(Unpublished observations).
Weaving: Hats and Mats
The palm species Manarana (Arecaceae: Ravanea lakatra)is highly prized for making hats, one of the few productsfrom the Peninsula regularly sold at the regional marketsin Antalaha or Maroantsetra. Local people already com-plain about the increased difficulty of finding this species.As can be seen in the Annex, people will travel as far as 16km on average in search of it. In contrast, Rambo(Pandanaceae: Pandanus odoratissimus), a species used formaking mats, can still be found relatively close at hand(Dmax = 1.64 ± 0.19). However, villagers living near littoralforests prefer to make mats and baskets out of Penja, anabundant marsh-growing Cyperaceae not readily availableto villagers upriver (Data not shown).
Food: Heart of Palm, Tubers, and Alcohol
The indicator species selected for the “heart of palm”category are not, in fact, palms. Ravenala madagas-cariensis (Streliztiaceae), already selected in the houseconstruction category, is also the preferred species forboth littoral and rain forest users (Table 3), followed byHasimbe (Liliaceae).
Kremen, Raymond, Lance, and Weiss 71
Table 3. Use of Ravenala madagascariensis, a Key Resource for House Construction, Food, and Household Use1
Number ofUse sub-category Parts used responses Qave Littoral forest Rain forest
Floor/wall Trunk 64 2.52 30.4 (1) 77.8 (1)Roof Leaf 30 13.74 56.5 (1) 72.2 (1)Fiber Fiber 2 0.1 – –Heart of palm Trunk 13 1.23 11.1 (1) 16.7 (1)Basketry Leaf 7 0.25 34.8 (1) 11.1 (1)No. informants (total)2 97 24.17 (all uses)1 Ravenala occurs both in primary forest, in marshes, and in regenerating slash-and-burn fields.2 Out of 100 people interviewed.
Figure 6Indicator Species Selection for Firewood

Oviala (Dioscoreaceae: Dioscorea sp.) is the onlytuber species local people use for food. Harvesting ofthis liane species results in large holes in the forest floorof up to 1 m deep. During the “famine period” inbetween rice harvests, the poorest people (those whowere not able to produce enough rice for the whole year)will collect both “heart of palm” and oviala (whosetranslation means “potato of the forest”) to stave offhunger. While the people who obtain food in this man-ner are relatively few, the monitoring of use of theseproducts adds to other socioeconomic indicators theMasoala Project is studying to assess the ICDP’s impacton poverty and quality of life.
People living on the Peninsula use the bark of Bilahy(Rutaceae: Evodia bilahe) to flavor an alcoholic sugarcane beverage. They collect the entire bark of the tree,thus killing it. People travel long distances to collect thisspecies, spending weeks in the forest solely for this pur-pose. Only a few people collect this species, and they sellthe bark in their village or at regional markets. The sur-vey did not specifically collect data on this sub-category;however we selected the species as an indicator becauseit is universally used, until recently had no substitutionproducts, and appears to be at risk of extinction due tooverharvesting.
Fiber
We chose the two most preferred and heavily usedspecies as indicators: Magna and Hafopotsy (Tiliaceae:Grewia apelata).
DISCUSSION
We selected 25 folk species as indicators of destructivehousehold use of primary forest plants on Masoala. Thesespecies collectively represent all of the major householduses of plants in the area, except for medicinal plants(none of which are harvested destructively). All of thespecies chosen had the highest extraction intensitiesand/or choice values within their sub-categories of use;we chose species with these characteristics because suchspecies are most likely to exhibit statistically observablechanges in the pattern or intensity of harvesting in thefuture. Not only are use patterns most likely to changewithin this highly preferred and utilized subset (due, forexample, to depletion of a preferred species), but also thevolume of data that can be obtained on these frequentlyused species will facilitate statistical comparisons.
This set of species includes examples of plants thatare rare, abundant, limited to littoral or to rain forest,
common to both forest types, economically valuable, ofsubsistence value only, and near or distant to villages. Inaddition, several species of diurnal lemurs found onMasoala (these species are among the largest wildlifepresent in these forests), use the species we selected asfood. Local people also use some of the indicator speciesas food during the famine period. By monitoring thefolk species in this collection, representing as it does agamut of socioeconomic and ecological characteristics,it will be possible to observe effects over time of theMasoala Integrated Conservation and Devel-opmentprogram on resource harvesting, biodiversity conserva-tion, and human socioeconomic well-being. The discus-sion section first outlines how this monitoring programis being carried out through a combined program ofhousehold surveys, direct observations of use and har-vest transects, and then shows how this information willbe used to guide management plans for conservationand sustainable use of biodiversity. Finally, we give anexample of using the “time-zero” data for buffer zonedesign.
Program for Monitoring Resource UseThe project conducts household surveys biennially asdescribed in the methods for this paper, but using thislist of 25 folk species only instead of an open-endedquestionnaire. The quantity extracted is being obtainedper use sub-category whenever possible so that Qave canbe calculated per species and per use. The survey datawill be complemented by directly observing use withinthe two highest impact categories, household construc-tion and firewood. For household construction, we con-ducted a one-time study of 156 households thatdocumented the vernacular names and numbers ofstems used in finished houses. This study provides base-line data, and it can be repeated if the style of traditionalhouse-building (tranogasy) changes in the future.Meanwhile, the survey data provide the information onthe amount of wood used in house construction annu-ally, given that most households conduct this activity torepair existing houses, and only build new houses forfamily expansions.
For firewood use, repeated biennial monitoring of useis important. Since we suspect that people tended tounderestimate the number of stems they used for fire-wood, verifying these results with direct observations iscrucial. Also, firewood use varies depending on people’sactivities; for example, fishermen use firewood to dryfish, while farmers use it to dry rice and/or coffee.Firewood use also changes with the season. In each vil-
Measuring Conservation Impact72

lage, we select 10-to-20 households by random stratifi-cation across wealth categories. In the morning, wemeasure wood volumes (length by diameter per stem)and identities of the logs to be used for firewood. Atnoon, we measure any additional logs brought in fromthe fields for firewood. In the evening, we measure theremnants of any of these logs and use the difference todetermine the amount of firewood consumed. We selectthe houses to be visited on a particular day at random,and visit each house three days in winter and three daysin summer. We also determine the number of meals pre-pared, the household size, and the amounts in dryweight of rice, fish, or coffee dried.
To obtain density data on useful species and toobserve directly the extraction intensities, vegetationtransects are established in littoral and rain forests usedby villagers to harvest wood products. Pre-existing trailsused for collecting wood products are marked at 100 mintervals, and perpendicular transects of 100 m each areextended into the forest from each of these points. Thisstudy includes approximately 2-to-3 km of pre-existingtrail, heading more or less directly away from the vil-lage/forest edge. Along the trail and its perpendiculartransects, all living trees and harvested stumps of the 25indicator folk species are censused if they occur within5 m of either side of the transect, recording, within each10 m interval of trail or perpendicular transect, thespecies name, dbh, height of trunk, height of canopy,and, for stumps, whether the trunk was collected in thelast year or in a previous year.
The density and harvest data can be sorted accordingto the distance along the principal trail and from this trailinto the forest. This will allow us to observe not only theoverall level of exploitation and changes in per speciesexploitations and densities with time, but also whetherspatial patterns of exploitation change over time (e.g.,expand along the trail further from the village or furtherfrom the trail into the forest). We hypothesize that non-sustainable resource extraction will lead to depletion, andeventual expansion of the harvesting zone to greater dis-tances from the village and from the trail into the forest.In contrast, if Masoala Project forest management activ-ities promote sustainable forestry practices, expansion ofthe harvest zone should not occur.
The project will require additional information tomanage species sustainably, including regeneration ratesand the impacts of harvesting upon regeneration.Certain heavily used species may fare better than lessused species, depending on their demography (Bodmer1995, Boot and Gullison 1995). Hall and Bawa (1993)
provide an excellent review of methods for monitoringharvest impacts on tropical plant populations.
Table 4 shows the parameters we will measure bien-nially for resource use. These parameters can be com-pared between forest types, between pilot and non-pilotwatersheds, between years, etc.
On Masoala, where resource use monitoring is beingcarried out in two pilot watersheds and one controlwatershed, this monitoring requires three person-months per year of a university-trained, local field biol-ogist for supervision, data entry, and analysis, and threeperson-months per year for each of two trained conser-vation agents (para-biologists) for data collection.Because the management of these resources is critical tohuman well-being, it should not be difficult to encour-age local participation in monitoring the community’suse of resources.
As noted earlier, the socioeconomic and ecologicalmonitoring programs, of which this is part, are con-ducted in three “experimental” pilot watersheds and in a“control” watershed (Figure 2). The difference betweenthe two designations is that development activitiesoccur only in the pilot watersheds, while conservationactivities take place in all watersheds.
The natural-resource use monitoring program oper-ates on the east coast in the pilot watershed ofAnaovandrano, with villages in the Ampanio andFampotakely watersheds as controls. On the east coast,most watersheds contain coastal villages using littoralforests, inland villages using littoral and/or rain forests,and upriver villages using rain forests. In both the pilotand control watersheds, we selected villages so as to rep-resent all types of use. For the control watershed, wechose villages to match as closely as possible those in thecurrent study in terms of total number of households,type of forest used, distance to forest, and major activi-ties of the village (fishing, farming, or both). Figure 7shows the villages where monitoring is occurring inpilot and control watersheds relative to forest type anddistribution. Harvest transects were established usingexisting paths in three littoral and two rain forest sites.
Monitoring and ManagementIn the Anaovandrano Pilot Watershed, the MasoalaProject is developing a forest management plan in col-laboration with the local community for a portion of theforests in the peripheral zone outside the park (1,200ha, see Figure 3). This plan will propose cutting of smallplots (5-to-20 ha) on a 60-year rotation for selectedtimber species. Certain species will be exported as “eco-
Kremen, Raymond, Lance, and Weiss 73

certified timber” while others will be sold locally (R. P.Guillery, Personal communication). Recommendationswill be developed concurrently for the management ofnon-timber forest products for subsistence use. Thisforest management activity will have numerous socioe-conomic and ecological impacts, which will, in turn,influence the patterns of resource harvesting. The mon-itoring of natural resource use will permit detailed eval-uation of this forest management scheme throughbefore-and-after comparisons and by comparison withthe unregulated use of forests in the control watershed.
This project provides an excellent opportunity foradaptive management (Walters and Holling 1990),whereby resource and conservation managers can useinformation from the monitoring of natural resources toimprove resource management plans. Table 5 traces therelationship between the project activity to anticipatedprimary and secondary impacts of this activity, to mon-itoring questions and tools required to assess the activ-ity, and to hypothetical outputs of monitoring
Measuring Conservation Impact74
Table 4. Methods, Desired Results, and Indicator Parameters To Be Followed for Monitoring Natural Resource Useon the Masoala Peninsula
Method Results obtained Indicator parametersHousehold surveyson use of 25 indica-tor species
Direct observationsof house construc-tion
Direct observationsof firewood use
Harvest transects
Harvesting patterns per folk species,overall harvesting patterns
Extraction intensities per folk speciesper year
Extraction volume for firewood peryear and extraction intensities per folkspecies per year
Population structure per folk species;extraction intensities per folk speciesper hectare; spatial patterns of extrac-tion
Q ave (stems/household) per species per useQ ave per species, summed over usesQ ave per use, summed over speciesDmin, DmaxAverage diameter of tree harvestedMarket valueSubstitution product(s)Q ave for constructionQ ave per species used for construction
Q ave for firewoodQ ave per species used for firewoodVolume of firewood used per householdper yearProducts produced per volume of firewoodPopulation densitiesSize class distributionsStanding volumeDmin, DmaxExtraction intensity/haExtraction intensity/km from villageExtraction intensity/m from trail
Figure 7Study Villages within the Pilot (Anaovandrano) and
Control (Fampotakely and Ampanio) Watersheds

Kremen, Raymond, Lance, and Weiss 75
(feedback). Other opportunities for assessing theimpacts of specific ICDP activities on natural resourceuse and feeding back the information to adapt manage-ment exist, and mechanisms for establishing feedbackloops can be developed by analogy (Table 5).Developing tables of this kind is a helpful procedure for(1) assessing the linkage between specific developmentactivities and conservation goals, (2) pre-assessing thepotential effectiveness of the action proposed through a“thought experiment,” and (3) determining whether themonitoring system will be adequate to meet the infor-mation needs to allow adaptive management; points (1)and (2) are aspects of the development of the conceptualmodel (Salafsky and Margoluis, this volume). The mon-itoring system itself may also need to be adapted(Ringold et al. 1996).
Buffer Zone DesignWhile the chief purpose of monitoring forest resourceuse is to assess changes in use patterns over space andtime, a great deal of useful information is also immedi-ately available from the analysis of the “time zero” base-line data. For example, we used average extractionquantities in combination with density data from three1-ha plots to estimate the forest area currently requiredper household for the harvest of key resources on thewestern side of the Peninsula (Figure 8). Because forestcomposition and resource use differ between westernand eastern forests of the Masoala Peninsula (Raymond1995 and Unpublished data), it was necessary to select anew set of indicators for the western forests. Again, weselected these indicator species from each use sub-cate-gory based on average extraction quantities and choicevalues. Figure 8 shows that areas required per householdwere less than 1 ha per household for most of the indi-cator species. However, two species, Vontro (Arecaceae:Vonitra thouarsii), a species used for thatch, andMoranga (Annonaceae: Xylopia sp.), a firewood species,had much larger harvest area requirements. We couldtherefore use these species as “umbrella indicators:” bybasing harvest areas on the species with the largest har-vest area requirements, we would then provide for theharvest area requirements for all species. Thus, we usedthe upper 95% confidence interval around Moranga of8.6 ha per household as a yardstick for designing bufferzones around villages.
The project designated buffer zones only around vil-lages that did not have access to forest resources outsideof the park (e.g., the village of Ambanizana). Althoughfree access forests exist to the north of the Ambanizana
River, local people do not collect resources there becauseit is too difficult to transport materials across the river.Virtually all of the forests to the south of the park wereincluded within the park for biological reasons. Usingthe 8 ha per household yardstick, the buffer zone arearequired for the Ambanizana village (N = 111) was 877ha. The buffer zone was designated in an area wherepeople traditionally collect forest products. Based on theaverage maximum distance of collection of all forestproducts studied (N = 129), most forest products arebeing collected either in the secondary forests outside ofthe park or close to the edge of the primary forest.
Of the two umbrella indicator species, Vontro isclearly the more meaningful indicator in socioeconomicterms for designing the buffer zone. Vontro is one ofonly two species used for thatching roofs, and the otherspecies is said to be already depleted in the westernregion. Each household must re-thatch their roof every5–7 years, so the availability of a suitable thatchingmaterial is evidently a critical need. People already travelup to 6 km from their village in search of Vontro. Incontrast, many substitution products exist for Moranga.People do not go far in search of Moranga, despite thehigh preference for this species, given the energetic costof transport and the availability of many other firewoodspecies in greater abundance close at hand. In fact, theaverage quantity extracted per household is low com-pared to the other firewood species, but the arearequired for harvest is high due to its low density. Ingeneral, it is important to consider such factors as theavailability of other substitution products in selection ofan umbrella indicator. However, in this case, we arbi-trarily selected the indicator species with the largest
Figure 8
Harvest Area Requirements for Indicator Species onthe West Coast of Masoala

Measuring Conservation Impact76

harvest area requirement as our yardstick because somany other factors that ought to be considered to deter-mine the sustainability of buffer zone use remainunknown. We therefore preferred to err on the size of alarger buffer zone.
In particular, the harvest areas and buffer zones donot take into account either plant or human demo-graphics, and thus would certainly prove too small ashuman populations increase. While we do not know therate of population growth on the Masoala Peninsula, inMadagascar as a whole it reaches 3% (PopulationReference Bureau 1995), which will double the popula-tion of Madagascar in only 22 years. Clearly this bufferzone could not withstand such a pressure; indeed, per-haps the entire park would have had to be declared a“buffer zone” had we considered future human genera-tions (depending on the number of future generationsto be considered). However, this buffer zone was notintended by itself to provide a solution to resource man-agement on the Peninsula; instead, it is part of a multi-ple strategy that will involve cultivating selectedresources that are becoming depleted, encouraging theuse of less popular substitution products, promotingcommercial sale of timber and non-timber forest prod-ucts in the multiple-use zones outside the park, andproviding health and family planning services.
CONCLUSIONS
Monitoring of natural resource use contributes to a bat-tery of monitoring themes and techniques necessary forevaluating the impacts of Integrated Conservation andDevelopment programs on economic development, nat-ural resource management, and biodiversity conserva-tion. Because of its inherent interest to local people, itshould be relatively easy to encourage participatoryapproaches toward monitoring natural resources.Following indicators of natural resource use will lead notonly toward improved management of specific resources,but also can provide significant insights into social, eco-nomic, and ecological issues, and can assist in evaluatingthe efficiency of conservation and development actions.
ACKNOWLEDGMENTS
We thank C. Galindo-Leal, H. Abel-Ratovo, and R.Margoluis for providing helpful feedback on an earlyversion of this manuscript, and D. Layton and the mem-bers of the Biodiversity Support Program MonitoringSymposium (1996) for interesting discussions. This
work was funded by a United States Agency forInternational Development (USAID) SAVEM grant toCARE International Madagascar and grew out of earlierwork supported by a grant from the Biodiversity SupportProgram to Claire Kremen. This work was carried outunder the auspices of the Projet Masoala consortium:Direction des Eaux et Forêts, the Association Nationalepour la Gestion des Aires Protégées, CAREInternational Madagascar, Wildlife ConservationSociety, and the Peregrine Fund. The Center forConservation Biology and the Projet Masoala developedthe Geographic Information System used to make themap figures accompanying this text.
REFERENCES
Abraham, J., R. Benja, M. Randrianasolo, J. U.Ganzhorn, V. Jeannoda, and E. G. Leigh. 1996.Tree diversity on small plots in Madagascar: Apreliminary review. Faune de Madagascar 51:93-116.
Andriamampianina, L. M. 1995. Contribution al’Etude de la Repartition et de la Structure desPeuplements des Insectes Scarabeidae (Coleo-ptères) de la Presqu’île de Masoala. Memoire deDiplome d’Etudes Approfondies des SciencesBiologiques Appliquées Departement d’Entomo-logie. Universite d’Antananarivo Faculté desSciences.
Bodmer, R. E. 1995. Managing Amazonian wildlife:Biological correlates of game choice by detribalizedhunters. Ecological Applications 5:872-877.
Bodmer, R. E., T. G. Fang, I. Moya, and R. Gill. 1994.Managing wildlife to conserve Amazonian forests:Population biology and economic considerationsof game hunting. Biological Conservation 67:29-35.
Boot, R. G. A., and R. E. Gullison. 1995. Approachesto developing sustainable extraction systems fortropical forest products. Ecological Applications5:896-903.
Du Puy, D. J., and J. Moat. 1996. A refined classifica-tion of the primary vegetation of Madagascar basedon the underlying geology: Using GIS to map itsdistribution and to assess its conservation status. InBiogeographie de Madagascar, ed. W.R. Lourenco,205-218. Paris: ORSTOM.
Fa, J. E., J. Juste, J. Perez del Val, and J. Castroviejo.1995. Impact of market hunting on mammalspecies in equatorial Guinea. Conservation Biology9:1107-1115.
Kremen, Raymond, Lance, and Weiss 77

Fisher, B. L. In press. Ant diversity patterns along anelevational gradient in the Réserve SpécialeD’Anjanaharibe-Sud and on the Western MasoalaPeninsula, Madagascar. Fieldiana.
Fitzgibbon, C. D., M. Hezron, and J. H. Fanshawe.1995. Subsistence hunting in Arabuko-Sokoke for-est, Kenya, and its effects on mammal populations.Conservation Biology 9:1116-1126.
Gentry, A. H. 1993. Diversity and floristic compositionof lowland tropical forest in Africa and SouthAmerica. In Biological relationships between Africaand South America, ed. P. Goldblatt, 500-547. NewHaven and London: Yale University Press.
Godoy, R. A., and K. S. Bawa. 1993. The economicvalue and sustainable harvest of plants and animalsfrom the tropical forest: Assumption, hypothesesand methods. Economic Botany 47: 215-219.
Green, G. M., and R. W. Sussman. 1990. Deforestationhistory of the eastern rain forests of Madagascarfrom satellite images. Science 248:212-215.
Hall, P., and K. Bawa. 1993. Methods to assess theimpact of extraction of non-timber tropical forestproducts on plant populations. Economic Botany47:234-247.
Kremen, C., A. M. Merenlender, and D. D. Murphy.1994. Ecological monitoring: A vital need for inte-grated conservation and development programs inthe tropics. Conservation Biology 8:388-397.
Kremen, C., I. Raymond, and K. Lance. 1998. An inter-disciplinary tool for monitoring conservation im-pacts in Madagascar. Conservation Biology 12:549-563.
Kremen, C., D. Lees, V. Razafimahatratra, and H.Raharitsimba. In press. Biodiversity surveys inMadagascar rain forest: Using butterfly indicatorsto evaluate the design of a new national park. InAfrican rain forest ecology and conservation, eds. W.Weber, A. Vedder, H. S. Morland, L. White, and T.Hart. New Haven: Yale University Press.
Nelson, R., and N. Horning. 1993. AVHRR-LAC esti-mates of forest area in Madagascar, 1990. Int JRemote Sens 14:1463-1475.
Phillips, O., and A. H. Gentry. 1993a. The useful plantsof Tambopata, Peru: I. Statistical hypotheses testswith a new quantitative technique. Economic Botany47:15-32.
_______. 1993b. The useful plants of Tambopata, Peru:II. Additional hypothesis testing in quantitativeethnobotany. Economic Botany 47:33-43.
Phillips, O., A. H. Gentry, C. Reynel, P. Wilkin, and C.Gálvez-Durand B. 1994. Quantitative ethnobotanyand Amazonian conservation. Conservation Biology8:225-248.
Population Reference Bureau. 1995. World populationdata sheet 1995. Washington, D.C.: PopulationReference Bureau, Inc.
Prance, G. T., W. Balée, B. M. Boom, and R. L.Carneiro. 1987. Quantitative ethnobotany and thecase for conservation in Amazonia. ConservationBiology 1:296-310.
Rakotondraibe, F., and F. Raharimalala. 1994. Contri-bution à l’étude de la flore des aires protégées de Mada-gascar: Les ptéridophytes de la presqu’île Masoala.Antananarivo: Revue du Centre National pour laRecherche sur l’Environnement.
Raymond, I. 1995. Approche Phytoecologique surl’Evaluation Qualitative et Quantitative desUtilisations Villageoises des RessourcesNaturelles en Forêt Dense HumideSempervierente. DEA Thesis, Universited’Antananarivo, Antananarivo.
Ringold, P. L., J. Alegria, R. L. Czaplewski, B. S.Mulder, T. Tolle, and K. Burnett. 1996. Adaptivemonitoring design for ecosystem management.Ecological Applications 6:745-747.
Robinson, J. G., and K. H. Redford, eds. 1991. Neo-tropical wildlife use and conservation. Chicago andLondon: University of Chicago Press.
Salafsky, N., and R. Margoluis. 1998. Overview of asystematic approach to designing, managing, andmonitoring conservation and development pro-jects. In Measuring conservation impact: An inter-disciplinary approach to monitoring and evaluation,eds. K. Satterson, R. Margoluis, and N. Salafsky.Wash-ington, D.C.: Biodiversity SupportProgram.
Sterling, E. In press. Rapid assessment of primatespecies richness and density on the MasoalaPeninsula, eastern Madagascar. Folia Primatologica.
Walters, C. J., and C. S. Holling. 1990. Large-scalemanagement experiments and learning by doing.Ecology 71(6):2060-2068.
World Bank, United States Agency for InternationalDevelopment, Cooperation Suisse, UNESCO,United Nations Development Program, andWorldwide Fund for Nature. 1988. MadagascarEnvironmental Action Plan. Volume 1. Washington,D.C.: World Bank.
Measuring Conservation Impact78

Kremen, Raymond, Lance, and Weiss 79
AnnexExtraction intensity, choice values, and ranks of folk species from littoral and rain forest habitats. Shaded linesare folk species that were selected as indicators. Each species is listed only once, under its principal use sub-cate-gory. Within sub-categories, folk species are listed in order of extraction intensity (Q ave).
Common nameHouse construction:
house frame
Nantonengitra
Mantalanina
Amaninaombilahy
Tsifo beravina
RahinyVahavohitraHazomamyTsifo madinidrav-
inaAntohiravina
HodipasoTambonanaTezantrasinaVahonaOmpagavoHazonjahanaMaroankoditra
MarodyTalanaombyTomenja
HazoamboHazombato
TandramiranoHasintohyTsiloparimbarikaJodinaMatrambodyVatsikomoto
Latin name
Faucherea thouvenoti orF. laciniata
Terminalia ombrophila
Leptolaena multiflora orEremolaena rotundifo-lia
Canthium majas orIxoro sp.
Cleistanthus capuronii
Anysophyllea fallaxCanthium medium or
Antirhoca sp.Phyllarthron sp.
Ficus soroceoidesStephanostegia capuronii
Eugenia pluricymosa
Homalium involucra-tum
Homalium micranthumCarissa septentrionalisMemecylon longipela-
tum
Homalium laxiflorum
Dillenia triquetra
Family
Sapotaceae
Combretaceae
Sarcolenaceae
Rubiaceae
EuphorbiaceaeClusiaceaeRhizophoraceaeRubiaceae
Bignoniaceae
MoraceaeApocynaceae
Myrtaceae
Flacourtiaceae
FlacourtiaceaeApocynaceaeMelastomaceae
Flacourtiaceae
MyrsinaceaeDilleniaceae
Otherusesa
fi, l
fi
fi
fi
fififi, mfi, m
fifific
fi
fi
c
Q ave
5.77
2.78
1.8
1.63
1.361.220.780.7
0.65
0.550.40.330.280.230.210.16
0.160.130.13
0.080.06
0.060.040.040.030.020.01
Cslittoral
5.71
0.27
2.17
0.822.17
1.09
0.270.270.540.270.27
Ranklittoral
1
6
2
42
3
66566
Csrain
0.83
1.11
1.39
1.39
0.830.83
0.28
1.11
0.56
Rankrain
3
2
3
1
33
5
2
4
Dmax(km)
1.85
0.94
1.75
1.19
2.442.491.211.05
1.83
2.152.652.50.63.1311.3
1.20.920.75
1.75
4641.541
SE(Dmax)
0.27
0.28
0.28
0.31
0.440.340.430.31
0.32
0.5300.350.081.200.49
0.570.840.18
0.920
0.0700000
Voucherspecimensb
RR280
RBE194,281RR2850,RBE372
RR2855,RBE165,277; GM257
RBE245
GM1053,1128RBE203
RBE225
RBE72, 261
RBE211,361; RR2888
continued on next page

Measuring Conservation Impact80
Common nameHouse construction:
floor
Ravinala
Rafia
LafazaHouse construction:
walls
SinkiaraTsirikyHouse construction:
roof
VontroKarakaHofaFirewood
Moranga
Harongana
Rotro
AntevaratraVahapaka
ValotraVarotroOmpaMankarananaVatsikodyMenavonyMampayTsikodizahanaTakodizahanaGavoJalahorakaMorangazahanaVaronaFlaoMaintimpototra
HazondamokanaTendrofony
Latin name
Ravenala madagas-cariensis
Rafia ruffia
Dypsis sp.
Vonitra thouarsii
Pandanus sp.
Xylopia sp.
Harungana madagas-cariensis
Eugenia or Syzygiumsp.
Potameia sp.Uapaca sp.
Breonia sp.Ambavia gerrardiiEugenia cloiseliiMacaranga sp.
Antidesma petiolare
Diospyros sp.
Rinorea sp.
Family
Strelitziaceae
Arecaceae
Arecaceae
Arecaceae
Arecaceae
Pandanaceae
Annonaceae
Clusiaceae
Myrtaceae
LauraceaeEuphorbiaceae
RubiaceaeAnnonaceaeMyrtaceaeEuphorbiaceae
Fabaceae
Myrtaceae
Euphorbiaceae
Ebenaceae
Violaceae
Otherusesa
fb, fo,hi, th,wafo, hi,wa, we
hi
fo
hf
hf
c, hf
hfhf, l
hf
hfhf
c
hfhf
hf
hfhf
Q ave
24.17
8.64
1.48
10.070.42
1.91.460.160.17
10.01
6.07
3.77
3.222.93
2.292.021.81.61.341.331.20.890.830.620.50.450.40.30.26
0.220.2
Cslittoral
30.4
2.17
10.1
1.98
0.79
2.24
0.921.98
0.130.260.260.531.450.79
0.79
0.79
Ranklittoral
1
2
2
2
5
1
42
988635
5
5
Csrain
77.8
11.1
1.855
1.94
1.11
2.50.56
0.831.391.390.56
1.940.56
0.28
0.560.56
Rankrain
1
2
21
3
5
27
6447
37
8
77
Dmax(km)
2.11
2.72
1.38
1.52.08
0.441.130.41.30.9
0.79
1.41
0.821.04
1.621.10.790.971.81.240.431.550.8810.42.50.40.331
0.91.25
SE(Dmax)
0.22
0.28
0.24
0.230.3
0.040.1100.490.09
0.13
0.23
0.150.11
0.260.170.20.270.270.180.020.580.11000.8500.050
0.320.53
Voucherspecimensb
JD6373
RBE375,RR2899,GM306, 978
GM1114;RR2911,2931;RBE75,JA229
RBE200,205, 268,275, 350,371; JA245;RR2865,2874RBE187RBE370
1061GM
RR2875,2879

Kremen, Raymond, Lance, and Weiss 81
Common nameFandriantontorokoBarabanja
KirandrambiavyFandifihinaMandravokina
MahitsianjahanaTsilaitry
madinidravinaRavintsara
Lumber
Hintsy
Nanto beravinaHazinina
Nanto menaNantotodingaHazovola menaNanto
madinidravinaHazovola maintyHazomainty
AndramenaHazovola fotsy
FahoHazomalagnyHazovola antanetyTsifontsoy
Pirogue
Vintanona
MantadyAmbora beravinaSary
Aramy beravinaLongotraTafononanaLalonaFanondambaTarantana
AramintsitsihaAlbizia
Latin name
Mascarenhasiaarborescens
Tinopsis phellocarpaAnthostema madagas-
cariensis
Noronhia sp.
Intsia bijuga
Labramia sp.Symphonia sp. or
Ochrocarpos madagas-cariensis
Sideroxylon sp.Faucherea glutinosaDalbergia chapelieriMimusops sp.
Dalbergia baroniDiospyros sp.
Dalbergia sp.Dalbergia madagas-
cariensisChloroxylon faho
Rhodocolea sp.
Calophyllum sp.
Tambourissa religiosaRhopalocarpus
macrorhamnifoliusCanarium sp.Aspidostemon scintillansOcotea sp.Weinmannia sp.Nesogordonia sp.Camnosperma sp.,
Protorhus sp., or Rhusthouarsii
Canarium boiviniiAlbizzia sp.
FamilySapindaceaeApocynaceae
FlacourtiaceaeSapindaceaeEuphorbiaceae
Oleaceae
Fabaceae
SapotaceaeClusiaceae
SapotaceaeSapotaceaeFabaceae
FabaceaeEbenaceae
FabaceaeFabaceae
Rutaceae
Bignoniaceae
Clusiaceae
CombretaceaeMonimiaceaeRhopalocarp-aceaeBurseraceaeLauraceaeLauraceaeCunoniaceaeSterculiaceaeAnacardiaceae
BurseraceaeFabaceae
Otherusesa
hf
hfhfhf
c, fi
c, fi
hf
ch, fi
hf
fi
fi, l
fi, lfi, ll
llll
Q ave0.170.11
0.080.060.04
0.030.03
0.01
5.64
0.670.34
0.260.250.230.22
0.210.14
0.10.06
0.050.030.020.01
0.81
0.210.190.06
0.030.030.030.030.010.01
0.010.01
Cs
littoral0.130.13
0.13
0.26
6.76
1.450.97
1.930.48
0.972.66
2.420.24
2.05
1.021.021.79
0.770.771.021.280.260.51
Ranklittoral99
9
7
1
56
48
62
39
2
453
665487
Cs
rain0.28
1.85
1.852.781.85
0.93
6.16
5.82.9
2.9
0.360.36
0.36
Rankrain8
2
212
3
1
23
3
55
5
Dmax(km)0.630.8
10.51
14
5
1.75
2.493.43
1.041.622.022
5.411.8
2.179
22.4322
5.71
5.97.5610.4
81031.450.915
251.5
SE(Dmax)0.150.14
000
00
0
0.17
0.891.15
0.350.320.480
1.720.54
0.494.24
01.4600
1.07
1.41.453.81
2.873.5400.3900
00
Voucherspecimensb
GM913
RR2849
JA197;RBE269,284; GM249GM301GM823,1140, 1147
GM339GM1127JA179JA199
JA182, GM263, 1142
GM268,RR2859,MZ288
GM306
continued on next page

Measuring Conservation Impact82
Common nameWeaving: hats
ManaranaWeaving: mats
Rambo
VorondiaFood: heart of
palm
Hasimbe
TsaravoasiraKonaMaladyBiresoFood: tubers
Oviala
Food: alcohol c
Fiber
MagnaHafopotsy
Hafotra
Hafomena
Latin name
Ravanea lakatra
Pandanus odoratissimus
Dioscorea sp.
Grewia apelata
Nesogordonia orDombeya sp.
Grewia sp.
Family
Arecaceae
Pandanaceae
Liliaceae
Arecaceae
Dioscoreaceae
Tiliaceae
Sterculiaceae
Tiliaceae
Otherusesa
hi
we
Q ave
2.38
4.06
0.16
0.52
0.160.130.10.02
1.58
2.881
.017
.01
Cs
littoral
1.09
19.6
2.9
2.42
2.422.9
0.48
30.4
2.172.17
Ranklittoral
4
2
4
5
54
7
1
11
Cs
rain
41.67
13.89
6.946.94
61.11
5.565.56
1.85
Rankrain
1
2
33
1
11
2
Dmax(km)
16.1
1.64
1.5
1.06
4.13.88515
2.16
1.610.81
1.3
0.6
SE(Dmax)
1.6
0.19
0.35
0.53
3.152.5300
0.41
0.290.15
0.49
0
Voucherspecimensb
JD7638
JA234
GM333;RBE160,166
a c = canoe, fb = fiber, fi = firewood, fl = floor, fo = food, hf = house frame, hi = household implements, l = lumber, m = mat, th = thatch, wa
= wall, we = weaving.b Voucher specimens are stored at Missouri Botanical Garden, Kew Gardens ( JD only), Parc Botanique et Zoologique de Tsimbazaza, and
FO.FI.FA. (RR only). Collectors: JA = Jao Aridy, JD = John Dransfield, GM = Grace Rahajasoa, RBE = Roget Bernard, RR = Raymond
Rabevohitra.c Bilahy (Rutaceae: Evodia bilahe) was selected as an indicator species, although no quantitative data was available.

Conservation and development practitioners carry outproject monitoring and evaluation (M&E) for one pri-mary reason—to take action. All of the steps discussedin previous chapters are designed to maximize thequality of the data upon which project managers andother stakeholders can make sound and appropriatedecisions. If this final step is not taken, if the data andinformation collected during M&E activities are notused, then all of the work invested in M&E by the pro-ject team up to this point is for naught. This is, unfor-tunately, an all too common final scenario: hugeinvestments of time, staff, and money in M&E datacollection and analysis, resulting in volumes of pub-lished results that end up on someone's bookshelf,never to be applied.
While most conservation and development practi-tioners agree that M&E is an essential component ofproject management, few conservation and develop-ment projects have effective M&E systems that permitproject managers to adapt and learn systematically. Inaddition to the many obstacles to carrying out M&Eactivities described throughout these chapters, othersare more specific to the use of results. These includenegative experiences, in which volumes of relativelyuseless data were collected; poor understanding ofwhat information is needed for monitoring; lack ofexperience using systematically collected data for deci-sion-making; and information analyzed and commu-nicated in ways that make interpretation and usedifficult.
To increase the likelihood that information gener-ated by M&E activities will be used, project managersand stakeholders must clearly envision direct utility ofthe information. Full understanding of the importanceof reliable data does not usually come to project deci-
sion-makers spontaneously. It happens only after theyhave had a positive experience, in which specific andreliable data were collected, analyzed, and used tomake decisions that were subsequently judged asappropriate. For decision-makers to use monitoringresults, they must be involved in the project's concep-tual design; formulation of project goals, objectives,and activities; development and design of a monitoringstrategy and approach; selection of the indicators thatwill be used to monitor progress; analysis and inter-pretation of data; and use of data and information tomake sound decisions.
Conservation and development project monitoringallows decision-makers to test assumptions they mayhold about conditions at the project site and the effec-tiveness of the interventions they are applying. Testingassumptions is fundamental to ensure that project activ-ities are designed and implemented in ways that mostefficiently lead to the achievement of the project goalsand objectives. Testing assumptions also forms the basisof adaptive management and learning.
The two papers presented in this section provide out-standing examples of how use of data can have profoundimpacts on project management and, ultimately, projectsuccess. Both papers stress the importance of preciseand reliable data for decision-making; formal mecha-nisms for collecting, analyzing, and using M&E data;and the willingness of project managers to adapt andchange project activities when M&E results indicate itis essential to do so. One of the strongest currents run-ning through both papers is the need to include deci-sion-makers in all phases of M&E so that they will bemore likely to use the results.
In Chapter 7, Bawa, Lele, Murali, and Ganesandescribe their work with the Soliga tribe in the Biligiri
❖
Introduction❖

Rangan (BR) Hills region of South India. The Soligacollect a wide variety of non-timber forest products(NTFPs) for subsistence and commercial use. Most col-lection occurs in the Biligiri Ranganswamy TempleWildlife Sanctuary, which covers an area of about 540km2. Previous studies showed that the Soliga rely onNTFP collection for more than half of their totalhousehold income, but that they have little control overresource management or processing.
The aim of the project described by Bawa and hiscolleagues was to increase the amount of economicreturns per unit of collected NTFP to provide Soligatribe members an incentive to sustain the naturalresources upon which their livelihoods depend. Theproject focused on four NTFP-related activities: bee-keeping and the processing of honey, food, and herbalmedicine. In order to measure progress toward goalsand obtain essential information for decision-making,the project team promoted enterprise, biological, andsocioeconomic monitoring.
To demonstrate how data were used, the authors pre-sent an insightful table that provides examples of spe-cific findings generated by the M&E systems and themanagement actions the team took in response to theinformation. For example, as a result of enterprise mon-itoring, the team discovered that procurement of rawmaterials, processing, and marketing activities were notwell coordinated. In response, the team developed andimplemented precise schedules for procurement, pro-cessing, and marketing for each product. As a result ofthe biological monitoring, the team discovered a reduc-tion in thai sac brood disease in bees. The teamresponded by developing enterprise plans for box bee-keeping. Finally, through socioeconomic monitoring,the project team learned that low interest in the enter-prises was caused by the community members' percep-tion that only a few households benefited. To rectify thisproblem, the project team worked to restructure localcooperatives in order to pass on the benefits of higherNTFP prices to collectors.
Bawa and his colleagues conclude with recommenda-tions for developing effective community-based enter-prises and the monitoring systems that are required toensure their success.
In Chapter 8, Renzi discusses his work with theLiving in a Finite Environment (LIFE) project inNamibia. According to Renzi, LIFE is simultaneouslyan empowerment, conservation, and economic develop-ment project. One of the underlying assumptions of theproject is that if Namibia's natural resources (primarily
wildlife) are managed sustainably, then these resourcescan serve as the foundation for continued economicdevelopment to meet the needs of some of the country'spoorest citizens.
Renzi writes that LIFE is implemented "using anadaptive management approach that recognizes it isimpossible to predict all of a project's requirements fromthe outset. Rather, M&E is intended to provide accu-rate and timely data on project progress and externalfactors so that the government, NGOs, and LIFE staffcan adapt their implementation plans to respond toemerging circumstances." LIFE M&E depends on theparticipation of a wide spectrum of stakeholders whoare involved in defining information needs, collectingand analyzing data, writing reports, and communicatingresults.
Renzi describes how some of the M&E tools devel-oped by the LIFE project team have been used.Application of the Institutional Development Toolkit(IDT) led a local partner cooperative to consider strate-gic options for its future. This exercise helped the coop-erative improve its financial and project managementsystems, as well as its client relations and project activi-ties. The Community Management Toolkit (CMT)helped community-based organizations manage theirresources more effectively. For example, use of theCMT led the Nyae Nyae Farmers Cooperative(NNFC) to conclude that the cooperative had becometoo far removed from the community it was designed torepresent. To remedy this, NNFC involved communitymembers in holding new cooperative elections, increas-ing the size of the management committee to make itmore representative, planning for future monitoring,and developing a program for monthly NNFC institu-tional strengthening workshops. These are but a few ofthe examples of the use of M&E results found inRenzi's paper.
Renzi focuses squarely on one of the major chal-lenges to using M&E data: the effective communicationof important and relevant results. Renzi argues that,unless project staff can package results so that decision-makers will pay attention to them, M&E activities arebound to fail. One approach the LIFE staff used tocommunicate lessons learned from project monitoringwas video. The project team interviewed ministers,chiefs, headmen, project staff, farmers, hunters and oth-ers to produce a video that would make the M&Eresults come alive. This medium proved extremely effec-tive in communicating findings at all levels of stake-holders-from Namibia's National Council to villagers.
Measuring Conservation Impact86

The project experiences reflected in these two papersclearly demonstrate how M&E data can be used tomake informed and sound management decisions.Both papers stress the importance of developing feed-back mechanisms that provide for data collection anduse that allow project activities to adapt to changing
realities. While use of M&E results usually occurs atthe end of monitoring activities, both papers addressthe importance of identifying and planning for the col-lection of specific data at the beginning of a project toensure that sufficient data will be available to manageadaptively.
Introduction 87

INTRODUCTION
Human societies throughout the world derive vastamounts of goods and services from their surroundingnatural ecosystems. The livelihoods of millions of peo-ple depend upon the continuous stream of materials andother benefits from their immediate surroundings.These livelihoods would not have been sustained formillennia without strategies designed to conserve theresource base. Indeed, most societies that rely on naturalresources have evolved cultural and social practices todiscourage their overexploitation.
In recent years, however, a number of forces have dis-rupted these traditional practices. Perhaps the mostimportant of these changes is a shift in economic con-trol of resources from indigenous groups to a loosealliance of outsiders, including traders, large landhold-ers, and government organizations and their bureau-crats. In some cases, this shift started long ago. Duringthe last century in British India, the colonial regimestarted to expropriate large tracts of forest for reservesthat were to be brought under scientific management tomeet the needs of the Raj and the empire (Gadgil andGuha 1993). Colonial authorities severely curtailed tra-ditional rights of forest dwellers or relegated them tocommunity forests; these forests, being too small tomeet the needs of local communities, were soondegraded.
It is now well recognized that, in much of the devel-oping world, progress toward conservation of biodiver-
sity in natural ecosystems requires returning tenuredcontrol over ecosystems to local people. Such a shift incontrol would have to be accompanied by economicincentives to conserve biodiversity. The BiodiversityConservation Network (BCN) project is designed totest the idea that economic benefits derived from localbiotic resources, combined with control over theseresources, can motivate local communities to conservebiodiversity.
Our project centers on extraction of non-timber forestproducts (NTFPs) by Soliga tribes, who have inhabitedthe Biligiri Rangan (BR) Hills region of South India formillennia. The Soligas traditionally engaged in shiftingagriculture and hunting. Soligas also collected a widerange of NTFPs, initially for their subsistence needs, butlater for forest contractors as well. Government has dis-couraged shifting agriculture since the late nineteenthcentury, and completely banned shifting agriculture andhunting with the declaration of much of the area as theBiligiri Ranganswamy Temple (BRT) Wildlife Sanctuaryin 1974. This legislation allocated the Soligas small piecesof land where they could practice settled agriculture.However, the extraction of NTFPs continued under theaegis of tribal cooperatives, or Large-scale Adivasi (tribal)Multipurpose Societies (LAMPS). The LAMPS serve asvehicles for tribal development, particularly to ensure fullreturn on the collection of NTFPs to which the tribalswere given sole rights.
The BRT Wildlife Sanctuary is approximately 540km2, and is under the jurisdiction of the Karnataka
❖
7Extraction of Non-timber Forest Products in Biligiri Rangan Hills,
India: Monitoring a Community-based Project❖
KAMAL S. BAWA, S. LELE, K. S. MURALI, AND BALACHANDER GANESANDepartment of Biology, University of Massachusetts, Boston; Tata Energy Research Institute,
Bangalore, India; Tata Energy Research Institute, Bangalore, India;Biodiversity Conservation Network, Philippines; respectively

State Forest Department. Approximately 4,500 Soligaslive in 25 podus, or settlements, scattered throughoutand on the fringes of the sanctuary. Soligas practicedsettled agriculture on the lands allotted to the house-holds. The average size of the landholding is 0.6 ha (1.5acres), but approximately 30% of the households lackaccess to cultivable land. Extraction of NTFPs is themajor source of income (Hedge et al. 1996). The exist-ing situation with respect to NTFP harvesting and mar-keting in BR Hills is shown in Figure 1a. The Soligasharvest NTFPs and sell them to the cooperative mar-keting society, the LAMPS, which holds the harvestingrights on lease from the Forest Department. TheLAMPS then auction the raw NTFPs to the highestbidder.
In terms of amounts extracted and revenue generated,the most significant NTFPs are nelli (Phyllanthusemblica), gallnut (Terminalia chebula), taarekai (Termi-nalia bellirica), soapnut (Sapindus emarginatus), shikekai(Acacia concinna), lichens, and wild honey. Our prelimi-nary studies (Hedge et al. 1996; Murali et al. 1996) indi-cate that the Soligas (1) rely heavily on NTFPs as asource of cash income (they earn more than 50% of totalincome from NTFPs); (2) derive inadequate returnsfrom the NTFPs due to a lack of value additions at thepoint of harvest (Uma Shankar et al. 1996); and (3) havelittle control over harvest with respect to amount, loca-tion, and timing of the collection. Preliminary findingsalso suggest that many species yielding NTFPs are inad-equately regenerating, possibly due to overharvesting.
The project described herein is designed to increasethe economic stake of the Soligas in conservation oftheir biotic resources and to increase their capacity toensure the ecological sustainability of these resources andthe larger ecosystem. The project seeks to enhance eco-nomic stakes by increasing Soliga income from NTFPsby processing several of the extracted products at the col-lection site and marketing them directly, in order to cap-ture a greater share of the final value. Sustainablility is tobe achieved by establishing a community-based biologi-cal monitoring and feedback system that will regulateNTFP extraction and ecosystem health and by strength-ening the local community’s access to and control overbiotic resources. Vivekananda Girijana Kalyana Kendra(VGKK), a nongovernmental organization (NGO) inthe BR Hills region devoted to Soliga welfare, collabo-rated in the design of the project.
The central aim of the project is to create an enter-prise the Soligas will operate. The Soligas will processsome of the NTFPs collected through the LAMPS and
sell the processed items in the market to generate prof-its for the local community, while simultaneouslyensuring sustainable NTFP extraction and broad-baseddevelopment. Thus, the enterprise will ultimatelyinclude a processing and marketing unit, a biologicalunit to ensure sustainable utilization of the bioticresources, and a community outreach unit to ensurebroad-based participation of the local communities andan equitable flow of benefits to the community. Figure1b depicts the desired situation schematically. Speci-fically, the processing and marketing unit will purchaseat least four NTFPs (honey, nelli, soapnut, andshikekai) in raw form from the LAMPS; it will thenprocess and market the products so as to capture thehighest possible fraction of the final consumer prices.
The objective of the biological unit of the enterpriseis to set up a system of resource monitoring to providecontinuous information on the extent to which theNTFPs are being sustainably harvested, and to identifythe modifications that might be needed in the harvestand management of forest resources. This involvesestablishing systems for information collection, analysis,and dissemination at two complementary levels: thecommunity level (necessarily simpler and by rule-of-thumb) and enterprise level (more sophisticated, by sci-entifically trained staff ).
The primary objectives of the community outreachunit of the enterprise are to ensure participation in,training for, and ultimate handover of the food process-ing unit (FPU) to the Soligas, and to facilitate theestablishment of a community-based biological moni-toring system. Another objective of this unit is toreform the functioning of the LAMPS, which is criticalto making project benefits broad-based and to strength-ening community control over forest resources.
In order to achieve these objectives, it was necessaryto initiate a monitoring program that would continu-ously evaluate our success in meeting project goals andwould provide ecological and socioeconomic inputs forthe project operation, as well as for the conservation ofbiodiversity.
In the following sections, we first describe the currentstatus of the enterprise and related biological and com-munity outreach units. We then describe the concepts,objectives, and results of the monitoring program. Wealso indicate how we modified the project activities inresponse to the findings of the research and monitoringprogram. We conclude by offering some comments onthe concept, methods, and usefulness of monitoring,and constraints in its implementation.
Measuring Conservation Impact90
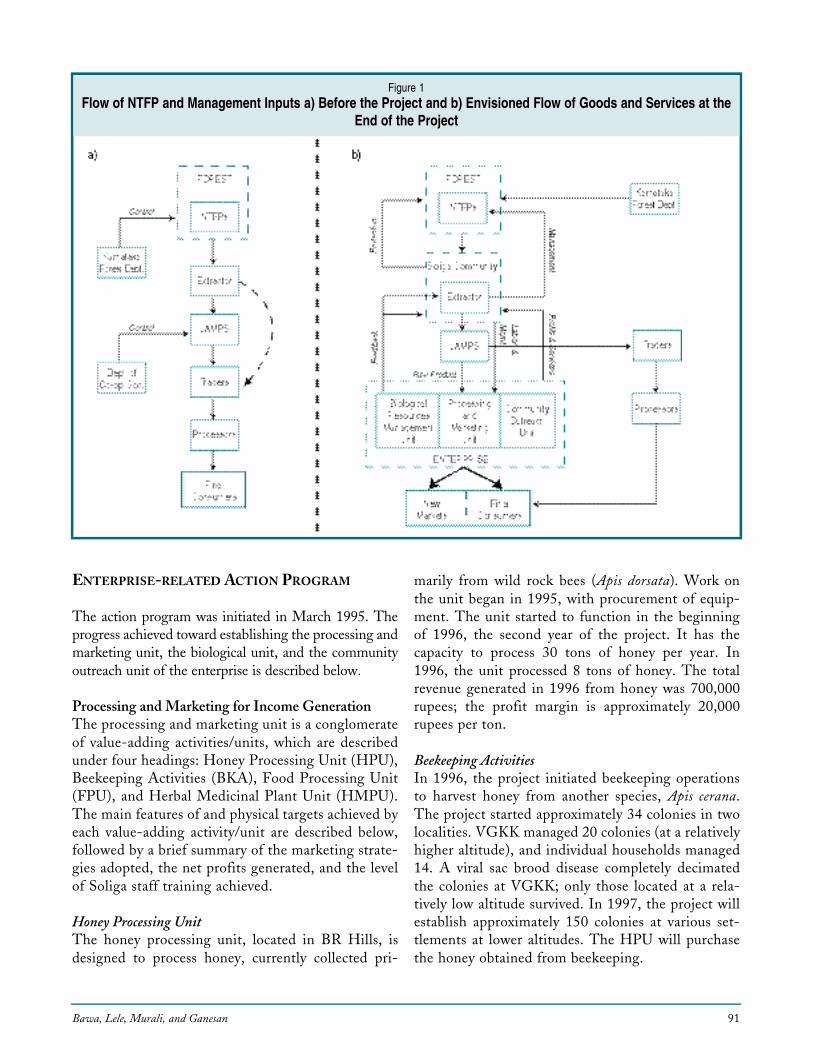
ENTERPRISE-RELATED ACTION PROGRAM
The action program was initiated in March 1995. Theprogress achieved toward establishing the processing andmarketing unit, the biological unit, and the communityoutreach unit of the enterprise is described below.
Processing and Marketing for Income GenerationThe processing and marketing unit is a conglomerateof value-adding activities/units, which are describedunder four headings: Honey Processing Unit (HPU),Beekeeping Activities (BKA), Food Processing Unit(FPU), and Herbal Medicinal Plant Unit (HMPU).The main features of and physical targets achieved byeach value-adding activity/unit are described below,followed by a brief summary of the marketing strate-gies adopted, the net profits generated, and the levelof Soliga staff training achieved.
Honey Processing UnitThe honey processing unit, located in BR Hills, isdesigned to process honey, currently collected pri-
marily from wild rock bees (Apis dorsata). Work onthe unit began in 1995, with procurement of equip-ment. The unit started to function in the beginningof 1996, the second year of the project. It has thecapacity to process 30 tons of honey per year. In1996, the unit processed 8 tons of honey. The totalrevenue generated in 1996 from honey was 700,000rupees; the profit margin is approximately 20,000rupees per ton.
Beekeeping ActivitiesIn 1996, the project initiated beekeeping operationsto harvest honey from another species, Apis cerana.The project started approximately 34 colonies in twolocalities. VGKK managed 20 colonies (at a relativelyhigher altitude), and individual households managed14. A viral sac brood disease completely decimatedthe colonies at VGKK; only those located at a rela-tively low altitude survived. In 1997, the project willestablish approximately 150 colonies at various set-tlements at lower altitudes. The HPU will purchasethe honey obtained from beekeeping.
Bawa, Lele, Murali, and Ganesan 91
Figure 1Flow of NTFP and Management Inputs a) Before the Project and b) Envisioned Flow of Goods and Services at the
End of the Project

Food Processing UnitThe food processing plant, located in BR Hills, isintended to process pickles, jams, honey, and other foodproducts. The plant processes the fruits of Phyllanthusemblica into jams and pickles. In 1996, the plantprocessed 500 kg of pickles on a trial basis. In 1997, thetarget was 2,000 kg, with a profit margin of 1,000rupees per ton.
Herbal Medicine Processing UnitThe HMPU is located at Yellandur (24 km from BRHills). VGKK originally conceived of and started theunit with funding from the Foundation for theRevitalization of Local Health Traditions (FRLHT).During the planning grant phase of the BCN project,a team from the University of Massachusetts and theTata Energy Research Institute had confirmed thepotential for such an enterprise. When funding for theherbal medicine factory ran out in 1994, VGKKneeded funds to procure equipment and machinery, aswell as working capital to run the unit. The projectinvited BCN to take over the unit and to provide inputson major policy issues, such as management, linkage toconservation of biodiversity, and distribution of profits.During the one year since its inauguration, the Unithas processed and produced more than 10 Ayurvedicdrugs. It took much effort and time to forge a market-ing arrangement with a major Ayurvedic pharmaceuti-cal company.
MarketingTo facilitate marketing, the project has obtained thenecessary regulatory approvals and registered trade-marks. In particular, the HPU has obtained “Agmark”certification (a certification of honey quality from theIndian Standards Institution). The FPU has receivedFPO certification. Both units market their productsunder the registered trademark “Prakruti” (meaning“nature”).
The project has followed a conscious strategy ofproduct and channel diversification in marketing theseproducts. The HPU currently markets honey throughthe state-owned Khadi and Village IndustriesCommission, and through wholesale and retail outlets
in Bangalore. The FPU will use the same outlets for itsproducts. The project also has opened a retail outlet inBR Hills, which sells all of these products. The HMPUhas signed a Memorandum of Understanding with amajor Ayurvedic drug company for technical assistanceand buy-back. The HMPU is also selling herbal medi-cines to a Swiss Ayurvedic physician for export markets.However, projected sales upwards of Rs 1 million (over$30,000) in 1996 with a profit margin at 50% have notmaterialized due to low product quality and staffturnover.
EmploymentThe HMPU and the FPU provided a source of incometo Soliga workers during 1996; Soligas earned Rs60,000 from the FPU and Rs 12,000 from the HMPU.Skill improvement has been significant on the produc-tion side. It is estimated that the Soligas will manage allproduction activities in the HPU within a few moremonths. The HMPU has been less successful in provid-ing Soliga employment because the unit is located toofar away from the sanctuary. With the viral disease indomesticated beehives still not under control, the bee-keeping activities have not yet generated any significantperson-days of work for the community.
Enterprise-based Biological Resource MonitoringEarly on in the project, as a result of the BCN-orga-nized Monitoring Workshop, it became clear that mon-itoring of changes in biological resources or diversityduring the three-year life of the project would beunlikely to yield any conclusive results. This is true notonly because environmental variability makes it highlyunlikely that trends in biodiversity (or for that matter, inincomes) can be spotted within three years, but alsobecause there are typically delays in getting the income-generating activity off the ground. Thus, we saw a clearneed to set up a resource monitoring system that wouldcontinue beyond the life of the project.*
We visualized enterprise-based biological monitor-ing at two complementary levels: a simpler, community-based monitoring system and a more scientific systemusing ecologists employed by the enterprise. The bio-logical research team working on the project currently
Measuring Conservation Impact92
* It should be noted that most of the medicinal plant species required by the HMPU are not in the list of NTFPs that the Forest Departmentpermits the LAMPS to harvest. Until collection from the wild is allowed, the HMPU will meet its needs through purchases in the openmarket and through encouraging cultivation in the podus and villages with a buy-back guarantee. (Executed in collaboration with aMacArthur Foundation-funded research project, Ecology, Economics, and Institutions of Forest Use, being carried out by the Institute forSocial and Economic Change, Bangalore.)

plays the latter role. Starting in late 1996, one of theecologists on this team began to work about half-timedirectly with the enterprise.
Progress toward setting up the community-basedresource monitoring system has been slower thanexpected. The project has trained select Soligas in sys-tematic monitoring of resource extraction and in esti-mating the availability of NTFPs; the project, however,has not yet generated community participation andinterest. Toward the end of 1996, the project conducteda training program on participatory resource mapping.In January 1997, the project initiated a comprehensiveprogram of participatory monitoring of nelli harvestand regeneration, which included preharvest discus-sions, online monitoring of harvest percentage, surveysof the presence of parasites and seedlings, and posthar-vest feedback sessions on six harvest days. The responsewas encouraging; similar efforts were planned for otherproducts during 1997.
Community Involvement, Empowerment, andBenefit DistributionVGKK has been working for Soliga development forthe past 15 years, and most of its staff and board mem-bers are Soligas. The enterprise activities have beenbased physically and operationally at VGKK, whichhad already initiated a number of vocational trainingprograms and even some small-scale processing activi-ties with the Soligas before our project began. Thus, inone sense, the Soliga community has been aware of andinvolved in the enterprise from the start. On the otherhand, the community outreach unit is still quite farfrom its goal of true community involvement; i.e., mak-ing the enterprise activities entirely owned and con-trolled by the Soligas. The meetings of the SoligaManaging Committee to oversee the enterprise activi-ties initially evoked little response, but the communityoutreach program has generated increased interest inthe community.
Efforts to reform the functioning of the LAMPShave evoked a somewhat more enthusiastic responsefrom the community. These efforts focused on two lev-els: reforming the local LAMPS and changing generalstatewide policies toward LAMPS. The former involvedthe BR Hills Soliga community, while the latter tar-geted the Karnataka-wide tribal community. At thelocal level, reform efforts have generated greater aware-ness in the community about malpractices occurring inthe LAMPS. Soliga members of the LAMPS aredemanding revisions in the pricing system, and there
have been some attempts to improve the NTFP tender-ing/auctioning system. At the state level, the project’sefforts have generated significant momentum amongtribal organizations and tribal development NGOs topush for LAMPS policy reform. This has resulted in thedrafting of a detailed action plan that is being finalizedand submitted to the government (Lele et al. 1996).
MONITORING PROGRAM: CONCEPTS AND
METHODS
Experience in rural development projects around theworld has shown that projects that do not define cleartargets and parameters of success and that lack a formalsystem of monitoring progress toward these targets,often do not succeed in reaching their goals. In projectsinvolving biological resources, the case for systematicmonitoring is even stronger due to the difficulty indetermining whether a project has made resource usesustainable, enhanced resource productivity, or stemmedthe loss biodiversity. Our monitoring program isdesigned to measure success in establishing the enter-prise, as well as success in the support activities that sus-tain the enterprise.
BCN explicitly tests the hypothesis that enhance-ment of economic stakes in the biological resources willlead to biodiversity conservation. Hence, BCN alsomade it mandatory that the project include componentsthat would rigorously monitor changes in biodiversityand economic well-being. Figure 2 depicts the monitor-ing scheme developed for this project. It involves track-ing various parameters of the interactions among thelocal community, the enterprise, and the biologicalresources in the sanctuary.
As discussed previously, however, it became clearearly on that a three-year period would be too short toyield data to prove or disprove this hypothesis. Weresponded by making the establishment of a long-termcommunity-based monitoring program a primaryobjective of the project. Simultaneously, we realized thatthe term monitoring needed to be interpreted in twoadditional ways. In a literal sense, and in BCN’s usage,the term project monitoring strongly suggests the use oftime-series data to provide midcourse corrections.However, applied research on biological and socioeco-nomic phenomena, using a combination of historicaland cross-sectional data, is also needed to help in pro-ject planning, problem solving, and innovation.
For instance, although the biological unit was origi-nally intended to monitor the status of biodiversity con-
Bawa, Lele, Murali, and Ganesan 93

servation after the initiation of enterprise activities, sub-stantial ecological research was necessary to identify themost important parameters to be monitored. Similarly,the socioeconomic monitoring was originally intendedto record the manner of distribution of project benefits.However, an understanding of Soliga community struc-ture and activities was necessary to estimate likely obsta-cles to community participation in the processing unitand to search for solutions to overcome these obstacles.
Thus, our activities can be better described as an “on-line project monitoring and research program” that notonly helps determine the degree of progress toward pro-ject objectives, but also enables the actualization ofenterprise objectives through critical feedback from newinformation, analyses, and ideas. The specific objectivesof this broader monitoring program are described belowin three parts, along with brief descriptions of the meth-ods used in each case.
Enterprise Unit MonitoringThe monitoring program for the processing units forthe first two years aimed to focus on the viability of the
enterprise. Specifically, the objectives were to (1) ana-lyze the profit performance of the processing units, (2)evaluate staff performance and training requirements,(3) determine the success of coordination with biologi-cal and community outreach activities, (4) evaluate thesuccess in marketing of different products, and (5)undertake a full costing of the products.
Monthly staff meetings monitored the progress of theenterprise unit toward achieving its goals. The staffmeetings, in fact, monitored the success of the entireproject. In addition to monthly meetings, there were for-mal and informal discussions among staff members withBCN staff visit teams and management experts. Themethods were not formal or systematic. However, as theproject progressed, we began to identify clear targets andformal approaches to meet those targets. Progresstoward achieving these explicit targets is now reviewedduring staff discussions and at monthly meetings.
Biological Research and MonitoringWe designed the biological program to collect basicinformation about the distribution of resources and the
Measuring Conservation Impact94
Figure 2Interrelationships among Soligas, Enterprise, and Biodiversity

factors that influence productivity, regeneration, andpopulation growth. Furthermore, the program soughtto identify parameters and techniques that the Soligacommunity could use to monitor and ensure the sus-tainability of resource utilization. For the first twoyears, the objectives were to (1) map the distributionand abundance of NTFPs, as well as the distribution ofvarious landscape and vegetation features; (2) deter-mine the effect of harvest, weeds, and fire on regenera-tion of NTFP species; (3) analyze spatial and temporalvariation in productivity and investigate the role ofsuch factors as parasites and diseases on productivity;(4) estimate the levels of extraction and production; (5)explore the potential for beekeeping; and (6) identifyparameters and rules-of-thumb for community-basedbiological monitoring of at least two NTFPs (honeyand nelli).
Distribution and Abundance of Species(Landscape Maps)The project digitized survey of India maps and ForestSurvey of India maps, showing vegetation cover, toproduce maps that could be updated and used to quan-tify patterns of change in forest cover and distributionand abundance of species. Moreover, other ecologicaland socioeconomic information, such as the locationof villages, human population density, and patterns ofextraction, can be incorporated. The maps also serve asa basis for tracking resource availability and extractionby the community. Ultimately, we expect to have per-sonal computer-based hardware, software, and exper-tise to update the maps at the field site.
The project undertook a complete survey of NTFPsand other plant species in the entire 540 km2 of thesanctuary. For this purpose, we divided the sanctuaryinto 125 equal-sized grids. In each grid (4 km2 each), aplot 80 � 5 m was laid in the center and all trees greaterthan or equal to 1 cm diameter at breast height (dbh)were enumerated. Four 1 m2 quadrants were establishedin each plot to enumerate herbs, seedlings, and saplings.We are now analyzing these data to ascertain the distri-bution and relative abundance of various species. Thedata, once incorporated into the digitized maps, willproduce detailed visual images of the distribution anddensity of various species.
Effect of Harvest on Regeneration andPopulation GrowthThe project is using several approaches to examine theimpact of harvest on regeneration and population
growth. The first approach consists of establishing tran-sects in areas close to and far from human settlements.Project staff then examine the population structure ofNTFPs to compare the distribution of different sizeclasses in the two sets of transects. The second approachconsists of harvesting fruits with different levels ofintensity (25, 50, and 100%) and then determining thenumber of seedlings under these focal trees. The thirdapproach examines population dynamics on the basis ofrecruitment and mortality of various size classes anddetermines population trends. Thousands of individualsof various size classes in three species, Phyllanthusemblica, Terminalia chebula, and T. bellirica, have beenmarked and are being monitored for this purpose.
ProductivityAssessing spatial and temporal variation in productivity iscritical to determine the levels of harvest that might be sus-tainable. We are following the phenology of five majorNTFP tree species: Terminalia chebula, T. bellirica,Phyllanthus emblica, Sapindus emarginatus, and Acacia sinu-ata. We are monitoring the phenology of 50-100 trees ofeach species, located in different parts of the sanctuary,every month, and estimating crop sizes for each tree.
In order to estimate the productivity of honey fromthe wild bee Apis dorsata, the project established 17 tran-sects along streams throughout the entire sanctuary, aswe found that the majority of hives are located aroundtrees close to streams. We also measured the length ofthese streams. The product of the total length of streamsand average number of hives per transect provides anestimate of the total number of hives in the sanctuary. Inaddition, we have measured the yield of honey fromindividual hives while the tribal people were collectinghoney. The product of total number of hives and theaverage yield per hive will give us the total productionpotential of honey across the sanctuary. In addition totransects, we have also collected data on the total num-ber of hives present on rock cliffs within the forest. Wehave marked 23 rock cliffs, and are periodically observ-ing these cliffs. Project staff visit the transects and cliffstwice a year ( June and November).
Levels of ExtractionWe are estimating the amount of NTFPs extracted as apercentage of total productivity. Data on extraction pat-terns is being collected by direct observation in the field,and on the basis of interviews at the household and podulevels. Extraction patterns, on the one hand, are beingrelated to ecological features, such as abundance and
Bawa, Lele, Murali, and Ganesan 95

tree size, and, on the other hand, to household variablesto ascertain biological, as well as socioeconomic, deter-minants of resource use and harvest.
Parameters for Community-based Biological MonitoringOur approach to community-based biological monitor-ing is based on results from ecological, as well as socioe-conomic, surveys designed to collect information abouttraditional Soliga resource management practices. Thusfar, we have not encountered much meaningful infor-mation from the socioeconomic surveys in relation tothe traditional knowledge of resource use. Ecologicalresearch indicates that parameters to be monitored areproductivity, levels of extraction, density of seedlings,and incidence of parasitism or disease.
Socioeconomic Research and MonitoringThe project redesigned the socioeconomic program tofocus broadly on the factors influencing NTFP extrac-tion, overall patterns of economic activity and socialrelations in the community, and the role of formal andinformal institutions in governing the magnitude anddistribution of forest-based incomes amongst theSoligas. Specifically, during the first two years, theobjectives of this program were to (1) understand thefactors influencing quantity, manner, and location ofextraction and sale of all commercially harvestedNTFPs, with special attention to honey and nelli; (2)analyze factors responsible for LAMPS malfunctioning,identify needed reforms, and carry out advocacy forreforms at the state level; and (3) document communityperceptions and knowledge about the conservation andmanagement of the forest.
To achieve these objectives, we initiated: (1) a censusand social mapping of all households in all nine podus inYallandur taluka (i.e., subdistrict) that are the immedi-ate focus of the project, and also in the nearest threepodus of Chamrajanagar taluka; (2) a rapid assessment ofSoliga attitudes, traditional knowledge, and practices offorest use and conservation (including consolidation ofexisting information on this topic); (3) a household-level monitoring program that covers a stratified ran-dom sample of 114 households in 12 podus inside thesanctuary and involves biweekly recording of NTFPcollection and other income-generating activities by allhousehold members; (4) a similar, but monthly, moni-toring of 40 households in two contrasting (one agricul-tural and one forest-dependent) podus in Kollegal talukafor understanding the situation in a nonsanctuaryregion; (5) detailed field-level monitoring of the quan-
tity and manner of extraction and composition ofextractor groups for the most lucrative products(Phyllanthus, honey, lichen) during their seasons; (6) astudy of the functioning and performance of allLAMPS in Karnataka state, followed by lobbying withgovernmental officials to reform the rules governingLAMPS functioning and tribal access to forests; and (7)a process of continuous consultations with Soliga col-lectors, podu-level and taluka-level Soliga political orga-nizations, and key Soliga persons regarding theirperceptions about the project, the processing and mar-keting activities, and their own role in the same.
PRELIMINARY RESULTS FROM MONITORING ANDMODIFICATION OF THE PROJECT
Although monitoring has been under way for just overa year and a half, it has yielded interesting insights andresulted in substantial modifications of the projectactivities, design, and goals. Preliminary findings andtheir impact on implementation of the program aresummarized in Table 1.
Enterprise Unit MonitoringOne of the primary goals of the enterprise is to achievefinancial viability and generate profits. We have found itdifficult to determine the financial viability of the enter-prise for three reasons. First, the enterprise staff havebeen involved in other activities of the NGO, eventhough all the salaries were charged to the enterprise.Second, overhead costs were also not proportionally dis-tributed between the enterprise and other NGO activi-ties. Third, enterprise accounts were initially mixed withthe accounts of other activities of the NGO. After weidentified these problems, it took several months toimplement steps to clearly define responsibilities andduties of the staff, maintain separate accounts, and cal-culate the true cost of the products by taking intoaccount depreciation and appropriate overhead costs.
A major hurdle in the adequate functioning of theenterprise was the lack of skilled staff. While we under-stood from the beginning that professionals might berequired to run the enterprise at the start, we underesti-mated the need for skilled staff at the entry and inter-mediate level positions. As a result, training activities atall levels for all aspects of the project, including resourcemonitoring, became an integral part of the project.
Coordination is one of the keys for success in a pro-ject that uses only local resources available in natural
Measuring Conservation Impact96

Bawa, Lele, Murali, and Ganesan 97
Table 1. Results and Impact of the Monitoring Program
FINDING RESPONSE
EnterpriseEnterprise staff are involved in other NGO activities;accounting and bookkeeping of NGO activities are mixed withthat of the enterprise. .
Labor pool has inadequate skills and littlemanagement expertise.
Procurement of raw materials, processing, and marketingactivities are not well coordinated.
There is insufficient marketing information about products.
BiologicialThere is a lack of data on abundance and spatial distributionof NTFP species.
Weeds and fire may influence regeneration of NTFP species.
Parasite loads influence yield of Phyllanthus emblica (amla).
There is an absence of information about extraction andproduction levels.
There is a reduction in thai sac brood disease in Apis ceranai.
There is a lack of participatory resource monitoring.
SocioeconomicThere is low interest in the enterprise because it directlybenefits only few houses through wages.
Community is not well informed about the project anddoes not feel in control.
NGO is ineffective in community organization.
Benefits are not sufficient.
LAMPS functioning constrained by poorly organizedSoligas and by bureaucratic control by Department ofCooperative Societies and Forest Department policies,which constrain resource management.
There is ineffective control over the enterprise.
There is low interest in the enterprise because it directlybenefits only a few harvesters.
LAMPS operate inefficiently under bureaucratic control.
Community members are not well informed about the enterprise.
There are significant differences between gender and householdswith respect to extraction of NTFPs.
Develop clearly defined responsibilities and duties; keep separateaccounts for enterprise activities.
Train staff in procurement, processing, accounting, and manage-ment.
Develop precise schedules for procurement, processing, and mar-keting of each product.
Assign marketing and sales responsibilities to a particular person;create a local retail outlet.
Map the distribution of NTFP species; use spatial information todevelop management plans.
Map the distribution of weeds and fire frequency in the sanctuary,and examine their effects on regeneration.
Remove parasite while collecting amla.
Collect data on extraction and production levels by direct observa-tions; incorporate the information collected into the participatoryresource monitoring program.
Develop enterprise plans for box beekeeping.
Develop and institute a participatory resource monitoring pro-gram.
Make efforts to restructure local LAMPS so as to pass on higherprices to the NFTP collectors.
Reconstitute the managing committee with elected representa-tives, including more NTFP collectors; hold open meetings to dis-cuss unity operations, accounts, and handover; identify and workwith a team of Soliga “promoters” for creating tribal organizationthat will eventually own the enterprise.
Hire a trained social worker to coordinate community interactionwork and to provide intensive inputs for the same.
Explore possibilities for decentralized processing of NTFPs,including re-activation of beekeeping program.
Lobby at state level for policy changes on LAMPs, while initia-ting local-level awareness-building and reforms.
Create a new, elected board of directors.
Establish new microenterprises that would benefit a large numberof harvesters (e.g., beekeeping). Plan for new, decentralized enter-prises from profits generated from the centralized enterprise.
Initiate efforts to restructure LAMPS.
Hold regular board meetings; arrange visits of community mem-bers to the Food Processing Unit and Herbal Medicine Unit.
—
populations. These resources are highly seasonal andperishable. Thus, the unprocessed NTFPs must be pro-cured and processed in a timely fashion. Furthermore,procurement, processing, and marketing must be coor-dinated. In the first year, the enterprise incurred lossesdue to a lack of planning and coordination. Project staffaddressed this problem by developing precise plans andschedules for various operations.
Successful marketing of enterprise products isanother primary determinant of the viability of theenterprise unit. Although the project undertook mar-keting surveys during the planning phase, as well asduring the first year of implementation, actual market-ing of the products did not begin until 1996, the secondyear of the project. Initial success in marketing was low,due to the absence of a person fully in charge of mar-keting and a lack of marketing plans. Marketingimproved after assigning clear responsibilities for salesto the general manager of the enterprise, who alsoopened a local retail outlet, where sales have beenincreasing.
Finally, staff turnover, particularly at the senior level,had a profound negative impact on the enterprise unit.There were several reasons for the turnover: low salaries,lack of clearly defined responsibilities, parallel lines ofauthority, and poor coordination. The project hasachieved stability in staff, in part, by improving salarystructure, developing a well-defined organizationalstructure, and planning and coordination. Nevertheless,the staff turnover problems at the HMPU persist. Wehave been slow to address these problems because of thelimited role of the BCN project in HMPU operations.
Results of Biological Research and MonitoringInformation about the abundance and distribution ofNTFP species is essential for the viability of the enter-prise. Our initial monitoring indicated that most ofthese species were unevenly distributed, and there was alack of data on the spatial distribution of NTFP speciesthroughout the sanctuary. We are refining our maps bycollecting more information at a finer scale, and will usethem for a wide variety of ecological studies, as well asfor the development of management plans.
Data on the extent and patterns of regeneration areessential to determine whether the collection of NTFPsis having a negative impact on regeneration. Our pre-liminary studies indicated that overharvesting may havea negative impact on regeneration. However, furtherfield work seems to suggest that weeds and fire may alsohave an adverse effect on regeneration. We have initiated
studies to examine the impact of these factors on recruit-ment. As a first step, we are mapping the distribution ofweeds and determining the fire frequency and locationfrom satellite imagery. We will eventually correlate thedistribution of weeds and fire with frequency of regener-ation at sites with and without weeds and fires.
Monitoring parameters that influence productivity ofNTFPs is one of the main elements of the biologicalmonitoring program. Apart from phenological studies,which seek to document spatial and temporal variationin productivity, we are also investigating the role of par-asites and diseases in limiting reproductive output. Thenelli trees are often infected with mistletoe vines. Ourfield studies indicate that the presence of these semipar-asitic vines reduces the output of fruits. Our response tothis finding has been to recommend that collectorsmanually remove the semiparasites at the time of fruitcollection. Extractors have indeed started to remove thevines.
The sustainable use of natural resources cannot beachieved if the extraction levels are close to productionlevels. LAMPS records contain information only onextraction levels, and this information is often inaccu-rate. We estimated the levels of extraction and produc-tion by following the extractors into the forest andrecording information about these parameters from theareas where they are working. The project is conveyinginformation about extraction levels to the extractors andthey are monitoring levels of production and extractionin a participatory resource monitoring program.
The project abandoned one of its initial goals, themanagement of Apis cerana for honey collection, becauseof the presence of the sac brood disease. In 1996, therewere indications that the incidence of disease had beenreduced. We invited experts in beekeeping from theCentral Bee Research Institute, Pune, to explore thepotential of beekeeping involving both A. cerana and A.dorsata. Based on their observations in the field, the pro-ject initiated beekeeping operations in June 1996.
Difficulties in adapting complicated research meth-ods to the community’s needs and capabilities slowedefforts to develop techniques for community-basedresource monitoring, particularly since information onresearch methods was scarce and level of communityinvolvement low. In one experiment, we asked key per-sons in the community to estimate the size of the nellicrop in their traditional manner, and found their esti-mates to be similar to the estimates we arrived atthrough more rigorous and systematic methods.However, we found that this information on nelli avail-
Measuring Conservation Impact98

ability, particularly its spatial distribution, was not welldistributed across the community, resulting in somehouseholds or villages going to areas of low nelli pro-duction and coming back empty-handed. This empha-sized the need for systematic, community-wideassessments, and we are in the process of experimentingwith techniques for such assessments.
Results of Socioeconomic Research and MonitoringA “social mapping” of the entire target community andmonitoring of its participation in NTFP collection isessential to understanding the level and distribution ofinterest in NTFPs in the community and its overallsocial structure. Participatory Rural Appraisal exercises,censuses, and monitoring of resource extraction showedthat the households are differentiated into traditional(“hard-core” or “full-time”) NTFP collectors who col-lect all products (15-25% of all households), marginal or“part-time” collectors who only get involved in the rela-tively unskilled and lucrative collection of fresh nellifruits (40-50%), and those who are not involved in com-mercial NTFP collection at all (35%).
This level of specialization within the community,along with the fact that the processing units wereunlikely to generate any significant levels of employ-ment, had significant implications for the enterprise. Aprocessing unit that generates profits by processingproducts collected by a variable fraction of the commu-nity but that channels its economic gains to the entirecommunity (in the form of profits) was unlikely to gen-erate sufficient support among the NTFP collectinghouseholds. If the collectors are to be persuaded tomonitor and modify their harvest levels and methods,they must see some direct benefits per kg of producethey supply to the processing unit.
However, to pass on some of the enterprise’s marginsto the collectors in the form of higher prices for the rawproducts would require a sensitive and transparent func-tioning of the LAMPS that mediate between the col-lectors and the processing units (see Figure. 1). This,and the observation that the per capita increment ineconomic benefits provided by an improvement in thefunctioning of the LAMPS would be much higher thanthe (as yet hypothetical) profits from the enterprise,made a strong case for the reform of the LAMPS.
The state-level study of LAMPS (Lele and Rao1996) was an important contribution to understandingboth the overall status of the LAMPS, and also toevolve recommendations for state-level policy changes.The study highlighted the inherent advantage of the BR
Hills LAMPS in terms of a richer forest resource andmore secure access. It also provided an analytical basisfor devising an alternative structure for the LAMPS.Although state-level policy changes would greatly facil-itate reforming the local LAMPS, these changes areunlikely to materialize soon. Our local activities are nowinformed by this analytical basis and the realization ofpractical constraints for progress. As a first step, we aretrying to set up a mechanism to generally reduce theLAMPS’ margins and, specifically, ensure that any pre-mium or bonus offered by the processing unit is passedon directly to the NTFP collectors. We are also explor-ing the role of credit from the unit for tiding over cash-flow problems of the collectors (which may result ininjudicious harvests).
Community consultations are necessary not only as afirst step toward generating community interest andparticipation, but also to generate continuous feedbackon enterprise activities. Our process of community con-sultations revealed that the Soliga community was notwell informed about the objectives of the project andtheir role in it. On the whole, we found the local NGO’sability to communicate with, mobilize, and empowerthe Soligas to be rather limited. Indeed, the NGO wasinitially reluctant to accept handover of the processingunit to the community, even though it was a goal of theproject. Correspondingly, the community did not feelthat it could control the unit, as the unit was located inand run by the NGO. Finally, these consultations alsoreinforced the feeling that a centralized, capital-inten-sive, and technologically sophisticated approach to pro-cessing was not generating sufficient interest among theSoliga community, which is dispersed, seasonally em-ployed, largely illiterate, and constrained by poor infra-structure. The people repeatedly expressed a need forprocessing activities that could be taken up at the poduor even household level.
To overcome the limitations of the local NGO, wehired a trained social worker to coordinate communityoutreach. To overcome distrust in the community, wehad to reconstitute the ad-hoc managing committee ofthe enterprise to make it more representative, particu-larly with respect to the hard-core collectors and seniorleaders in the community, hold a public meeting to dis-cuss the units’ profit-loss and assets-liabilities, andbegin work on a detailed procedure and timetable forhandover. To make the activities more decentralized andbroad-based, we are exploring the potential for otheractivities including a re-activation of our earlier idea ofbeekeeping with Apis cerana.
Bawa, Lele, Murali, and Ganesan 99

A rapid assessment of traditional knowledge andattitudes was necessary to develop a community-basedresource monitoring system. The assessment revealedthe limitations and uneven distribution of this knowl-edge, which made it unlikely that the Soligas would, ontheir own, be able to ensure the sustainability of recentlybegun or greatly intensified NTFP extraction. It hasalso become clear that the LAMPS must be an integralpart of any plan to manage the resource. Preliminaryparticipatory mapping exercises indicated the depth anddetail of ecological knowledge that resides in the com-munity and the significant potential of mapping as atool for resource management and for social mobiliza-tion. We are now implementing a participatory moni-toring and mapping exercise for the few key NTFPs,with a focus on participation by key collectors, enter-prise managing committee members, and LAMPSdirectors. We will be monitoring community responsesto this exercise.
A detailed study of wild honey extraction showedthat the timing of honey extraction significantly affectshoney productivity and possibly sustainability (throughits impact on larval loss). The nature of tenure over thehoney resource clearly affects the timing of extraction:open-access trees and cliffs are harvested earlier than isoptimal. Early harvesting may also be related to theaccess that tenure-holders have to seasonal credit. Theestablishment of tenure itself is a complex social processin which LAMPS agents—the emerging tribal elite—play key roles. These findings are being incorporatedinto developing a detailed plan for community-basedhoney extraction, training, and experimenting duringthe next honey season.
CONCLUSIONS
We confine our concluding remarks to the issue ofmonitoring. In particular, we describe the various typesof monitoring undertaken, the contributions of eachgroup to this project, and insights relevant to other pro-jects. We also offer some overall comments on the needto expand and to redefine the original concept of mon-itoring as outlined by BCN.
It is necessary to distinguish three types of monitor-ing relevant to this project. The first type is researchmonitoring, or monitoring carried out by researchers toobserve the distribution and availability of naturalresources and the participation of the community in themanagement and utilization of those resources. Thesecond type of monitoring is project monitoring, carried
out on a monthly basis by the entire project (researchers,NGO staff, and enterprise staff ), to gauge the progressof the project in meeting its enterprise-related goals.The third type of monitoring, which is still being initi-ated, is community monitoring; i.e., monitoring ofresource use, enterprise operations, and benefit distrib-ution by the community. This type of monitoring mustextend beyond the life of the project.
We believe that our research monitoring programhas been successful. The biological monitoring hasgenerated data on the distribution and abundance ofNTFP species, spatial and temporal variation in pro-ductivity, levels of NTFP extraction, the distributionof weeds and their effects on regeneration, and theimpacts of parasites and disease on productivity. Themonitoring currently under way will yield informationon the population dynamics of NTFP species, theimpact of harvests and fire on regeneration, and theforaging ecology of honey bees. The contribution ofbiological research toward understanding the biologi-cal link between the enterprise and the forest is thusinvaluable.
The socioeconomic research and monitoring efforthas similarly generated critical information on commu-nity structure, patterns of participation in NTFP extrac-tion and management, LAMPS operation, theimportance of tenure, and community perceptions ofthe project. The research under way will generate a bet-ter understanding of the overall tribal economy. Theseinsights and feedback are key to making the enter-prise—its commercial, biological, and community out-reach activities—better tuned to community needs,capacities, and concerns.
Project monitoring has identified several factors thatinfluenced the realization of basic objectives. These fac-tors include the inability to maintain a distinctionbetween the activities of the NGO and the enterprise,lack of trained staff at all levels, poor coordination, inef-ficient attention to marketing, and staff turnover. Thesephenomena are typical of NGOs working in ruraldevelopment today and are therefore worth remember-ing in designing future projects. Lack of coordinationwas not limited to the enterprise staff. Initially, therewas also inadequate communication among enterprise,biological, and socioeconomic units. The continuousproject monitoring we used is relatively informal andeasy to implement. All it requires is a culture of intro-spection, something that is critical to the day-to-dayfunctioning of any organization, especially a commercialventure.
Measuring Conservation Impact100

The enterprise-based approach to conservation pro-jects that involve relatively small community organiza-tions have little chance of success without an acceptanceof or receptivity to change. Moreover, strong profes-sional inputs are required at the initial stages of the pro-ject. Few organizations have the ability to seek suchinputs or to meet their costs. The project sponsors,therefore, have a special responsibility to ensure thatsuch inputs occur. At the same time, professional man-agers have to be socially sensitive and concerned notonly with the outcome but also with the process, as theymust show profits, as well as enable the community totake charge. Finally, if the processing activity were notcapital and technology intensive, the tenure of profes-sionals could be considerably reduced and transitionfrom a professionally managed to a community-man-aged enterprise could be eased.
The delay and limited success in our efforts to set upa system of community-based monitoring of resourceutilization, enterprise activities, and benefit distributionhighlight five factors important to any enterprise-dri-ven, community-based conservation program. First, theenterprise must generate and must be seen to generateearly, substantive, and broad-based economic gains forthe community. Participatory monitoring has an oppor-tunity cost, and unless tangible benefits offset this cost,community inclination to participate in monitoring willremain weak.
Second, the community must see a clear linkbetween their activities and the sustainability of theresource and of overall biodiversity. In our situation,where the community ceased to be the major actor inthe forest landscape and where it has yet to see theeffects of its recently intensified extraction activities,the need for monitoring is unclear. “We are hardlyaffecting the forest” is the constant refrain from thecommunity members. Focused biological research,combined with proper community outreach, can, how-ever, play an important role in dispelling this illusionwhile highlighting the big picture.
Third, for interest to be sustained the communitymust see the results of monitoring translated into tangi-ble and meaningful action. For instance, if absence offire is a major reason for poor regeneration, the com-munity must be positioned to modify fire managementin the sanctuary. This, in turn, requires that the com-munity have substantial and secure rights to manage theresource in question; Soligas, in this particular case, haveuncertain and inadequate tenure over the resources theyextract.
Fourth, traditional rural communities monitor envi-ronmental resources through accumulated knowledgepassed on orally from generation to generation. Feed-back from such monitoring is often subjective and qual-itative, which must be combined with objective andquantitative monitoring.
Fifth, participatory monitoring must be cognizant oftraditional practices and adaptive to local conditions.Thus, the key task before us is to devise a monitoringplan suited to a particular situation through a processthat is itself participatory.
Overall, the forms, methods, and prerequisites ofmonitoring in such projects are more complex andmultilayered than is apparent from BCN’s definition.In its attempt to focus attention on monitoring para-meters, criteria, sampling strategies and frequencies,etc., BCN has overemphasized the “project monitor-ing” aspect. Consequently, it has underemphasized theroles of, on the one hand, focused applied research thatalso uses cross-sectional and historical data, and ofinformal, often qualitative, but continuous feedbackand sincere introspection on the other. It also appearsthat the three-year project time frame is insufficient fordetermining its effects on biodiversity and probably forsetting up a system of community-based monitoringthat is to continue beyond the life of the project.
ACKNOWLEDGMENTS
We thank Dr. H. Sudarshan of the VivekanandaGirijana Kalyana Kendra (VGKK) for inspiration andmany suggestions concerning monitoring. ChiranjeevBedi also provided significant input to the design ofmonitoring. S. Setty, R. Hegde, V. Prabhu, and AditiSinha participated in many monitoring activities. TheKarnataka Forest Department extended cooperation inthe implementation of the project.
REFERENCES
Gadgil, M., and R. Guha. 1993. This fissured land: Anecological history of India. Berkeley: University ofCalifornia Press.
Hedge, R., S. Suryaprakash, L. Achot, and K. S. Bawa.1996. Extraction of non-timber forest products inthe forests of Biligiri Rangan Hills, India. 1.Contribution to rural income. Economic Botany50:243-250.
Lele, S., and R. J. Rao. 1996. Whose cooperatives andwhose produce? The case of LAMPS in Karnataka.
Bawa, Lele, Murali, and Ganesan 101

Measuring Conservation Impact102
In Rediscovering cooperation, ed. R. Rajagopalan, 53-91. Anand, Gujarat: Institute of Rural ManagementAnand.
Lele, S., R. J. Rao, Nanjundaiah, and V. Muthaiah. 1996.Re-lighting LAMPS: A draft action plan for revital-izing the tribal cooperatives in Karnataka. InRediscovering cooperation, ed. R. Rajagopalan, 92-105.Anand, Gujarat: Institute of Rural ManagementAnand.
Murali, K. S., Uma Shankar, R. Uma Shaanker, K. N.Ganeshaiah, and K. S. Bawa. 1996. Extraction of
non-timber forest products in the forests of BiligiriRangan Hills, India. 2. Impact of NTFP extractionon regeneration, population structure, and speciescomposition. Economic Botany 50:251-269.
Shankar, Uma, K. S. Murali, R. Uma Shaanker, K. N.Ganeshaiah, and K. S. Bawa. 1996. Extraction ofnon-timber forest products in the forests of BiligiriRangan Hills, India. 3. Productivity, extraction andprospects of sustainable harvest of Amla (Phyllan-thus emblica) [Euphorbeaceae]. Economic Botany50:270-279.

INTRODUCTION
Picture a weary coal miner, early in this century,emerging after a long shift. He’s squinting against thesetting sun, tired, hungry, and grimy. But this toughworking man lovingly carries a brightly colored canaryin a cage. He’s not an avid birder; he needs that littleguy to survive.
Among the many fears that haunted miners was thebuild-up of odorless, colorless, methane gases that couldlead to a major explosion. Miners used canaries becausethe birds responded quickly to drops in the oxygen con-tent. Miners would keep an eye and ear on the canary.When the bird stopped singing, became sluggish, andfell from its perch for lack of oxygen, the miners fled.
A burly miner and a colorful singing bird—nowthat’s an odd couple: individuals who would have littleto do with each other if humans didn’t require fossilfuels. Today we would refer to them as an “interdiscipli-nary team.” The miner needed data (ambient methane),he needed it promptly (to survive), and he needed theinformation reported in a way that he could understandunequivocally (the canary drops), and make a manage-ment decision (run!).
Similarly, programs that seek simultaneously to sup-port human development and conserve vital biologicalresources also require a mix of professionals who under-stand how people, plants, and animals behave: biolo-gists, botanists, ecologists, anthropologists, organiza-tional development experts, business experts, and so on.
They need data promptly and communicated clearly sothat all stakeholders can understand and act on theinformation. What is less obvious is that those samedisciplines are necessary to monitor project success andwarn of difficulties. A Community-Based NaturalResource Management (CBNRM) project in Namibiacan fail as much from an anthrax epidemic as from apolitical backlash that rescinds government initiatives toenlist rural residents as allies in conservation. Projectmanagers need multidisciplinary monitoring to avoidthese calamities.
This paper provides a framework for using special-ized monitoring tools, each incorporating particular dis-ciplines. Combined, these tools comprise an effectivemultidisciplinary monitoring and evaluation system forIntegrated Conservation and Development Projects(ICDPs), like a row of singing canaries alongside akhaki-clad conservation biologist.
The approach presented is the one used in theLiving in a Finite Environment (LIFE) program inNamibia. We do not believe we have found the singleanswer, but we hope readers will find enough that isfamiliar in our project to spark some fresh insights intotheir own work.
We use participatory approaches to monitoring andevaluation that emphasize special monitoring events,rather than the elusive “continuous monitoring” systemsthat some practitioners advocate. We use simple, yetrich, tools that integrate various disciplines into onecontinuous learning process. We discuss some of these
❖
8The Miner’s Canary: Applying Multidisciplinary Monitoring and
Evaluation to Integrated Conservation and Development Programs❖
MARK RENZILiving in a Finite Environment (LIFE) Program, Namibia

Measuring Conservation Impact104
tools in detail below, sharing our experience of wherethey have been used to improve project management.They are presented under the rubrics of monitoring,evaluation, and reporting, as follows:
Monitoring
• Application of an institutional strengthening toolhelped a national-level nongovernmental organiza-tion (NGO) overcome organizational constraints anddouble its output;
• Application of participatory monitoring tools helpeda CBNRM cooperative become more representa-tional.
Evaluation
• Participatory evaluation helped the NamibianNational CBNRM program revisit fundamental con-ceptual assumptions.
Reporting
• Communicating data through video is playing a sig-nificant role in supporting the passage and imple-mentation of key CBNRM policy reform inNamibia.
THE LIFE PROGRAM: CONSERVATION,DEVELOPMENT, AND EMPOWERMENT
The LIFE program is simultaneously an empowermentproject, a biodiversity conservation project, and an eco-nomic development project. Although an extremely aridcountry, Namibia possesses spectacular scenery anddiverse wildlife capable of attracting significant rev-enues in park fees, tourism income, and hunting levies.If the natural resources are managed sustainably, theseresources could be the essential ingredients in applyingsustainable resource-based economic development tomeet the needs of some of the country’s poorest citizens.
Sustainable management of wildlife in Namibia,however, has turned out to be more than a matter ofdesignating land for parks and managing the animalsand their habitat efficiently. During the German andSouth African colonial era, the state owned all wildlife.
While villagers had to suffer the constant threat ofwildlife destroying their crops or eating their livestock,they were forbidden from maintaining traditional hunt-ing practices. Moreover, many villages that had the rich-est wildlife populations were relocated to make room fornational parks that were the exclusive preserve of thecolonials. Under these circumstances, many ruralNamibians came to view the only useful animal as adead one, and poaching flourished. Government alloca-tions proved insufficient to effectively maintain itspolice role in controlling poaching and crop and live-stock loss. Wildlife numbers plummeted.
But since independence, Namibia, like its neighborsin Zambia, Botswana, Zimbabwe, Mozambique, andSouth Africa, is working on a new kind of rural devel-opment fueled by local resource management. The com-munities in northern Namibia—especially in theKunene, Caprivi, and Nyae Nyae areas—are now begin-ning to think about how to manage wildlife for them-selves and their children. The Government of Namibiais poised to adopt policies enabling communities toform local natural-resource management bodies called“conservancies.” These policies would devolve authorityfor managing wildlife to communities. Communitieswould gain the opportunity to benefit from increasedwildlife, both economically through hunting andtourism fees, and culturally by being reunited withwildlife. With these rights would come responsibilityfor sustainably managing the animals.
A significant portion of the challenge to these com-munities will be adapting their considerable naturalresource knowledge to changes brought on by popula-tion increase, modernization, and state intervention. Werefer to this as the “conservation challenge.” Ultimatesuccess in this complex social environment depends ona number of human resource and institutional factors.Namibia’s human resource and institutional base stillbears the scars of decades of apartheid: black Namibiansare generally poorly educated and inexperienced inworking with formal government and business institu-tions; NGOs are sparse and generally inexperienced;and the central government is still learning how to caterto the needs of the majority population that lives inrural areas. Private ownership of land in these areas doesnot exist. Land is communal, controlled by a combina-tion of the state and traditional authority. Most naturalresources, on the other hand, are common property.1
1 An important exception is wildlife that is currently owned by the state. The project hopes to change this by passage of the conservancypolicy, which would give communities the right to manage wildlife as they do other resources (described in more detail in “Building Blocks”section of this paper).

Renzi 105
The state and the communities must reach consensuson how the resources will be exploited, how benefitsaccrued will be distributed, and how these norms will beenforced. These are the “social challenges.”
The LIFE program must integrate human and bio-physical concerns. Poorly managed range lands willreduce the opportunity for people to earn a living fromthe resources. At the same time, dysfunctional socialsystems will return these areas to the “poach now, carelater” syndrome of the colonial era.
The program provides subgrants and technical assis-tance to NGOs, community-based organizations(CBOs), the University of Namibia’s Social ScienceDivision, and the Ministry of Environment andTourism (MET).2 These inputs are intended to assistcommunities to develop social, political, and naturalresource management systems for sustainable utilizationof their natural resources.
THE MONITORING AND EVALUATION (M&E)CHALLENGE
The objective of LIFE’s monitoring and evaluationInstitutional Development Toolkit (IDT) system is toprovide information on two levels: outcome data thatwill help managers know whether they are succeedingin their tasks, so that inputs can be adjusted asrequired; and higher level impact information that letsus know whether we have succeeded in our empower-ment, conservation, and development objectives. Thismust be done at a level appropriate for the imple-menters (NGOs, CBOs, university, and MET), thatalso tell us something at the program level (that is, con-sidering all the subgrants and technical assistance as awhole).
Before we could measure anything, we had to knowwhat to measure. And before we could know what tomeasure, the partners had to agree on a collective strat-egy. A quick glance at Figure 1 reveals that we will nevermeet our “biological” objectives if we do not first secure“social” requirements. Conversely, if the biological andphysical aspects are mismanaged, the strengthenedinstitutions will have nothing to do. The miner neededthe canary; the conservation biologist needs social sci-entists.
Figure 1 also implies that each area would need tohave expertise in institutional matters (organizationaldevelopment and, perhaps, anthropology), ecologicalmatters (possibly including wildlife biology and botany);and economics (and perhaps business). Given that theprogram is working in five geographic areas, this wouldrequire substantial human resources. A further challengeis that, while the approach to CBNRM is similar in allareas, the specifics vary widely among locations in tar-geted resources, language, supporting NGOs, and tradi-tional experience with resources. The LIFE programM&E approach indicates how we have structured ourresponse to these challenges.
LIFE’S M&E APPROACH
PhilosophyWe implement the project using an adaptive manage-ment approach that recognizes it is impossible to pre-dict all the requirements of a project from the outset.LIFE’s M&E is intended to provide accurate and timelydata on project progress and external factors so that thegovernment, NGOs, and LIFE staff can adapt theirimplementation plans to respond to emerging circum-stances.
The LIFE program team uses a participatoryapproach to M&E, usually including grantees, METofficials, community management bodies, communitysubgroups, and enterprise groups. All stakeholders par-ticipate, to varying degrees, in defining informationrequirements, collecting and analyzing data, reporting,and learning from the information.
2 The $16 million project is jointly funded by World Wildlife Fund (WWF)/USA and the United States Agency for InternationalDevelopment (USAID). Most recipients of subgrants also provide matching contributions. Overall direction for the project is provided bya steering committee, which is comprised of WWF, USAID, the Ministry of Environment and Tourism (MET), subgrant recipients, andrepresentatives from the tourism, social research, and legal sectors. Other members of the LIFE program team include Management SystemsInternational, Rössing Foundation, and World Learning, Inc.
Figure 1
Hierarchy of Objectives for LIFE Program

Advantages to using a participatory approach include:
• Increasing the credibility of the data and analysis amongproject implementers. If grantees collect and analyzedata on program impact, they are more likely tobelieve in the need to adjust implementation in lightof the results.
• Transferring M&E skills can be empowering. As uned-ucated men and women learn how to gather and ana-lyze data, draw conclusions, and implement recom-mendations, they gain important tools for naturalresource management and participatory citizenship.
• Sustainability. If one considers M&E an importantcomponent of successful program implementation,then gaining M&E skills is an important aspect ofinstitutional development. A participatory approachis generally the preferred alternative, as local peopleand institutions are collecting information to meettheir needs, not to meet the demands of outsideagencies.
MONITORING TACTICS
Lessons from Other M&E Efforts in Similar ProjectsMost monitoring efforts for similar projects in othercountries have failed for the following reasons:
• Monitoring was meant to be integrated into dailywork of the participating organizations.
• Those NGOs and government organizations wereoverworked.
• Monitoring was a final priority among all the press-ing tasks before the organizations.
• Often different stakeholders were responsible fordata collection, analysis, and decision making.
As a result, NGOs and government organizationsrarely collected data, and even when they did, the analy-sis was weak or missing. Often decision-makers gavelittle credence to data that emerged from internal mon-itoring or external evaluation, as they had no respect forthe former and scorn for the latter. As a result, the mon-itoring system was not a useful component of projectimplementation. Rather it was an easily avoided, donor-driven requirement.
Proposed SolutionLIFE attempts to avoid replication of this scenario bytaking the opposite approach. Monitoring is chieflyaccomplished by special monitoring events. Rather thanasking field staff to set aside 20 minutes each day forproject monitoring, we ask them to schedule, inadvance, several days a few times each year. This helpsus circumvent the prioritization issue and enables thepartners to compress the learning (research, analysis,and decision-making) of a monitoring visit into a shortblock of time. Where possible, we try to include a cross-section of the relevant organizations so that decision-makers participate directly in all stages of the processand have “ownership” of the results.
We still encourage our partners to collect as muchbasic data as they consider worthwhile on an ongoingbasis. This data will feed into these special monitoringevents. But we are not solely reliant on it.
Building BlocksSuccessful ICDPs typically integrate conservation biol-ogy, education, community organization, and enterprisedevelopment so that communities can gain benefitsfrom improved natural resource management. However,we have found that we must break down these variouscomponents into manageable analytic chunks to exam-ine progress. For each target area, we examine training,NGO institutional issues, CBO institutional issues,natural resource-based enterprises, biological status, andoverall success of the integrated program. Each compo-nent requires a different analytic lens to understand itsinternal dynamics and gauge progress, as illustrated inTable 1.
Clearly, each NGO or CBO working in a target areawill not be able to maintain staff with all the skillsdescribed in Table 1. Accordingly, what we haveattempted to do is build into each tool the insights ofrelevant disciplines (see third column in Table 1). In thisway, someone unskilled in institutional strengthening,for example, will still be able to track an NGO’sprogress by using the IDT. This is useful not only inmeasuring progress, but also in helping individuals gainexposure to key lessons from each discipline. The pro-ject can complete the analysis needed without requiringunsustainable human resources.
Application of these tools forces the NGO, CBO,enterprise, or program to systematically ask itself thesame important questions that a consulting anthropolo-gist or businessperson might pose. Either way, the orga-nization must find its own answer to the question and
Measuring Conservation Impact106

Renzi 107
the problems that emerge. This approach, however,ensures that the organization asks the right questions inthe self-inquiry.
By using this building-block approach we are able toassemble, for example, the IDT for the implementingNGO, a CMT for the CBNRM management body, andactivity management toolkits for the various businessesspawned in the target area. These can then all be consid-ered together in assessing the overall success of the ICDP.The best opportunity for synthetic review is during theprogram monitoring visit (described in the “Evaluation”section of this paper), which is much like an overall eval-uation, using data gained from the tools described above.
Another advantage of the building-block approach isthat it is possible to compare components across targetareas. For example, one can gain useful insights into thetypes of programwide institutional strengthening work-shops that would be appropriate by comparing the IDTscompleted for the various NGOs.
These tools provide a general framework that can beadapted to suit the institutional, ecological, social, polit-
ical, and economic circumstances of the target area.Each tool is like a set of socket wrenches, with attach-ments of many different sizes. One tool is described indetail below to provide a sense of how these tools work.
MONITORING
A Tool Explained: The Institutional DevelopmentToolkit3
The IDT consists of an analytic framework(Institutional Development Framework, or IDF), a tablepresenting the results of the analysis (InstitutionalDevelopment Calculation Sheet, or IDCS), and agraphic representation of the results of the analysis(Institutional Development Profile, or IDP). In devel-oping the IDT, we reviewed existing literature on insti-tutional development and measurement and askedNGOs what they thought were important measures ofprogress. A simple but rich framework for expressinginstitutional progress emerged. We call it the IDF. It ispresented schematically as Figure 2.
3 A more detailed description of the Institutional Development Toolkit can be found in “Integrated Toolkit for Institutional Development,”Renzi, 1996.
Table 1. Skills and Tools for ICDP Monitoring and Evaluation
Component Required Skills LIFE M&E Tools Used
1. Training • Training Training Impact Assessment Tool (TIA)• Organizational development• Topic-specific expertise
2. NGO strengthening • Organizational development Institutional Development Toolkit (IDT)• Topic-specific expertise
3. CBO strengthening • Organizational development Community Management Toolkit (CMT)• Anthropology• CBNRM theory
4. Natural resource- • Business Activity Management Profile (AMP)based enterprise • CBNRM theorydevelopment • Topic-specific enterprise
5. Wildlife monitoring • Biology • Aerial censusand conservation • Ecology • Strip census
• Wildlife management • Game Guard Reports
6. Overall ICDP • All of the above Program Monitoring Visit (PMV)integration • Evaluation

Measuring Conservation Impact108
In the far left-hand column are the various organiza-tional characteristics that NGOs identified as crucial tosuccess. They are sorted by major resources at the orga-nization’s disposal: oversight/vision, managementresources, human resources, financial resources, andexternal resources. Each of these categories represents apotential asset to support the organization. If theresources are not fully realized, success will be impeded.Each major resource includes key components, asshown in Figure 2.
The framework contains a number of “progress cells”designed to track natural development from left to right,according to the “Institutional Development Contin-uum” shown at the top of Figure 2. The frameworkdescribes four stages of an organization’s development:start-up, development, expansion/consolidation, and sus-tainability. These distinctions are somewhat arbitrary, andone might quibble with any particular entry. Taken as awhole, however, the framework sketches a reasonableblueprint for an organization’s development. Although itis described as a continuum, an organization can regress,and the expansion/consolidation phase could also repre-sent a restructuring.
The challenge of the framework is first to fill in theprogress cells with descriptions that help an organiza-
tion consider where it may be located along the contin-uum at any given time.4 We have made a first effort atdefining the progress cells for the framework, severalrows of which are excerpted in Figure 3.5
The first task for the NGO is to adapt the tool to suitits needs. Perhaps staff disagree on how a row isdescribed, or whether it should even be included. Thestaff make changes until the framework accuratelyreflects the direction the group would like to pursue.The NGO can then plot its progress, resulting in agraph, as illustrated in Figure 4.
Here, an organization has marked its progress as ofa certain time (solid bars), and set goals for itself for thefuture (clear arrows). (Please note how the organiza-tion has adapted the column titles to suit local vernac-ular.) Once the organization has repeated this processa few times, we end up with a profile like the one com-pleted for the Namibia Nature Foundation (NNF) (seeFigure 5).
Integration of Expertise from Other DisciplinesBy using these tools, we are able to accomplish the fol-lowing:
• Help an organization define how it would like todevelop
• Use a rigorous qualitative approach to measureprogress
• Provide a graphic representation of the results thatcan help unite the group’s energies
• Install a “ghost expert” in the program, greatly reduc-ing the need for external assistance
The final point may be of interest to remoteCBNRM projects that lack the resources to employexperts in organizational development, business, oranthropoligists. By distilling the complexities of thesedisciplines into these simple tools, and by adapting thetools to the needs of each organization and gainingownership by the organization over them, we greatly
Figure 2
Schematic View of Institutional DevelopmentFramework
4 The “X marks the spot” and arrows in Figure 2 convey the concept of measuring progress within the Institutional Development Framework(IDF).5 Due to space limitations, only a portion of the IDF is shown in Figure 3. The remaining rows currently include Management Resources:leadership style, participatory management, management systems, planning, community participation, monitoring and evaluation; HumanResources: staff skills, staff development, and organizational diversity; Financial Resources: financial management, financial vulnerability,and financial solvency; External Resources: public relations, ability to work with local communities, ability to work with government bod-ies, ability to access local resources, and ability to work with local NGOs.

Renzi 109
Leadership Style
ManagementSystems
Leadershipemanates fromthe founder.
Staff providetechnical inputonly.
No formal filesystem exists.
Few administra-tive proceduresformalized.
Leadership comes fromfounder and one or twoBoard members.
One or two staff provideorganizational impetus, inaddition to Director.
Files are maintained, but arenot comprehensive or sys-tematic.
Administrative proceduresincreasingly formalized, butno operating manual.
Vision increasingly comesfrom Board as Board membersimprove involvement.
Staff increasingly provide vitaldrive to organization.
Files are systematic and acces-sible, but significant gapsremain.
Administrative manual inplace, although not up-to-dateor considered the “Bible.”
All Board members contributeto leadership and developmentof the organization.
Organization would survivewithout current Director.
Files are comprehensive, sys-tematic, and accessible.
Administrative manualupdated, as needed.Considered the arbiter ofprocedures.
reduce the need for input from the experts once thesystem is established. In subsequent years, a field biol-ogist, government park warden, or CBO leader canimplement the tools. This greatly enhances the likeli-hood of project sustainability and reduces overall pro-ject costs.
The next section of this paper uses the actual IDPpresented above to show how it was used to improvemanagement at the Namibia Nature Foundation(NNF). The subsequent section on applying the CMTillustrates how an analogous tool for CBOs, the CMT,was used to improve the effectiveness of the Nyae NyaeFarmers Cooperative (NNFC).
IDT Applied: Improved Management at the NamibiaNature FoundationNGOs are frequently the implementing agent forICDPs. In many cases, NGOs are committed but over-worked and underskilled in certain areas. ICDPs, andthe NGOs themselves, are frequently concerned aboutwhich input would be most effective in bolstering theeffectiveness of these organizations and therefore ulti-mate program success. The NNF has found the IDTuseful to in lending crucial organizational developmentinsights to the organization at a key moment in theNNF’s development.
BackgroundThe NNF is a nonprofit organization that strives topromote and assist conservation and to encourage sus-tainable development in Namibia and Southern Africa.Although it implements some of its own programs,especially in environmental education, its main functionis to provide administrative and accounting support tofield-based environment and natural resource projects.The LIFE program gave NNF an institutional-strengthening grant to bolster its ability to supportCBNRM in Namibia. In the year prior to the interven-tion, the NNF had experienced tremendous growth andinstitutional change, including: (1) more than a three-fold increase in total volume of projects managed, from
Criteria for Each Progressive Stage
Resources Start up Development Expansion/Consolidation Sustainability
Management Resources
Figure 3
Excerpt from Institutional Development Framework
Figure 4
Targeting Institutional Development

$830,000 to $2,778,000; (2) resignation of NNF’sfounding Director and hiring of a replacement; (3) rapidincrease in number of professional staff; and (4) deteri-oration in client satisfaction with NNF’s services.
The InterventionThe LIFE program worked with NNF to use work-shops, client interviews, and analysis of existing data tocomplete the IDT for the NNF over a three-yearperiod. The results are presented graphically above asFigure 5. As a result of participating in the IDT process,
the NNF quickly realized that the bars farthest to theleft—management resources, human resources, andfinancial resources—needed immediate attention.
NNF used the results of the IDT exercise to beginconsidering short-, medium-, and long-term strategicoptions. In doing so, they used a SWOT analysis(Strengths, Weaknesses, Opportunities, Threats). Thisprocess requires that an organization conduct an “inter-nal scan” of its organizational strengths and weaknesses,as well as an “external scan” of opportunities and threatsposed by forces outside the organization. The IDT exer-
Measuring Conservation Impact110
Figure 5
Sample Institutional Development Profile

Renzi 111
cise provided good “radar” for the internal scan, com-plemented by interviews with clients for the externalscan.
From the analysis, the NNF decided to focus onimproving the following: (1) financial management sys-tems, (2) management systems, (3) quality improve-ment, and (4) client relations.
In addition, NNF developed a detailed one-yearwork plan, which assigned to each staff member specificresponsibilities to accomplish in order to improve theprioritized areas.
Management ImpactThe IDT assisted NNF in identifying the areas most inneed of improvement at a time when the organizationwas stretched to its limits by growth and change. It alsodemonstrated to the NNF the importance of interview-ing clients directly. The NNF used the data from theIDT to embark on its own management improvementinitiative in order to address the most urgent challenges.Importantly, the IDT also indicated which areas were ingood shape (organizational vision, fundraising, andexternal relations), which allowed NNF to focus on theproblem areas.
An end-of-grant program monitoring visit revealedthat the NNF’s work had paid off. In spite of a furthertripling in the volume of projects managed, clients ratedthe NNF’s service as improved. In subsequent years, theNNF will be able to reapply the IDT to gauge itsprogress and to adjust institutional strengtheninginputs. Now that it is familiar with the IDT, it will notrequire the assistance of external organizational devel-opment specialists to diagnose its needs.
The CMT Applied: Democratization of the NyaeNyae Farmers CooperativeThe CMT is structured similarly to the IDT. However,it looks at CBOs (rather than NGOs) dedicated tohelping their community, manage natural resources sus-tainably. Thus, it studies an organization that is typicallyone step closer to actual natural resource managementdecision-making. In addition to some of the organiza-tional development features included in the IDT, theCMT also incorporates anthropological concerns andfundamental CBNRM theory. For example, the tool
reflects the belief that a CBNRM management body isineffective if it does not represent the community ofresource users in a meaningful way. If community mem-bers believe the management body does not representtheir interests, they may well choose to sabotage thenorms and regulations supported by the body throughpoaching or other means. Applying the CMT helpsorganizations remember to ask themselves the all-important question of representation in CBNRM.
BackgroundThe Ju/Wa Farmers Union was created in 1986. It wasformed to facilitate communication links between thecommunity and external bodies. Leaders of the unionhad no
right to speak for others, but rather facilitated commu-nication and decision-making by providing informa-tion, maintaining contact with outsiders (e.g.,government representatives, technicians, donors, andothers) and communicating the opinions and ideas ofthe local residents. The egalitarianism inherent in theJu/’hoan system mitigated against individuals accruingpower or authority.6
Over time, the Union became more formalized and theorganizational structure became institutionalized with aset of statutes and model of leadership imported fromabroad.7 The NNFC was centrally run from a donor-developed training center, called “Baraka,” and was led byfour officers. Various staff and their families also lived inBaraka. A RADA was developed as a representationalbody. It consisted of two elected members (one man, onewoman) from each of the 35 villages in the area.
The Nyae Nyae area has great potential for establish-ing local management of wildlife and other naturalresources under the government’s new conservancy pol-icy.The area is sparsely populated and virtually everyoneis from the same ethnic group, Ju/’hoan, whom thecolonists called “bushmen.” Few cattle remain and thegrasslands are sound. A wide variety of game exists,although currently in low numbers. Exceptions areabundant elephant, lion, leopard, and hyena. The cul-ture of the Ju/’hoan is also an attraction to foreigntourists.
6 “Nyae Nyae Farmers Cooperative: A Question of Representation,” Barbara Wyckoff-Baird, February 1995. LIFE program document,pp. 1-2.7 See M. Biesele, 1994. Human Rights and Democratization in Namibia: Some Grassroots Political Perspectives. Paper prepared for theAnnual Meeting of the African Studies Association, Ontario, November 1994.

InterventionTo succeed, however, the people of Nyae Nyae musthave a representative management body to preside overthe conservancy. To assist the NNFC in gauging thestrength of their organization, and to help map ways inwhich it might be strengthened, the LIFE programhelped them apply the CMP to the NNFC. TheNNFC first examined the instrument with LIFE staffand then attempted to place themselves along the con-tinuum suggested by the instrument. In the course ofthis process, they modified many of the progress cells tosuit their needs. A completed version of the CMP, con-ducted at two points in time, is presented graphically asFigure 6, and in the calculation sheet in which the datawere first collaboratively entered by the LIFE staff per-son and the NNFC staff as Figure 7.
As part of the process, the NNFC agreed to have aLIFE staff person visit villages in the Nyae Nyae area toask their “constituents” what they thought of the perfor-mance of the NNFC. Community members respondedthat they felt somewhat estranged from the NNFC, asrevealed in excerpts from the CMCS, reproduced asFigure 7.
The NNFC was surprised to learn that the communityhad, to a degree, ceased to identify the NNFC with its owninterests. For the CBNRM project to succeed, it is essen-tial that the Board be representative of the interests of thecommunity. This is true technically, since the communitywill only abide by the natural resource managementregimes adopted by a representative management body. Itis also essential legally, as the government’s new regulationsrequire that all conservancies have “representative” man-agement bodies. If the body failed to meet this criteria, thecommunity would not be granted a conservancy.
Management ImpactRecognizing these shortcomings, the community tookthe following steps:
• Placed all the NNFC officers up for election
• Increased the number of members of the manage-ment committee (MC) of the NNFC to 12 so that itcould become more representative
• Developed a plan for periodic visits by the NNFC tocommunities for feedback and needs solicitation
• Followed a program of monthly institutionalstrengthening workshops
The results of the changes taken by the NNFC arereflected in the advancement of the shaded portion ofthe bars in Figure 8.
Having made these fundamental changes in theirstructure, the NNFC is better prepared to take advan-tage of the emerging policy opportunities. In additionto making the NNFC more responsive and competent,the very act of self-improvement has bolstered commu-nity confidence in the organization and created amomentum toward community unity essential for thehard work ahead.
Armed with the evidence of progress presented in theCMP (Figure 6), the NNFC is also prepared to arguethat it meets the government’s requirements for repre-sentation and capacity to manage wildlife.
In this case, the assessment of NNFC through theCMT combined organizational development issues(identification of the need for institutional strengthen-ing) with technical CBNRM issues (need to restructureto become more representative.) Neither insight (andsubsequent management action) would have been suffi-cient alone.
EVALUATION
In addition to assessing progress toward objectives, eval-uation provides an opportunity to step back and considerthe entire ICDP, to question fundamental assumptionsthat underpin project work, and to see whether somecomponent parts could be better integrated. Toward thisend, we have initiated what we call a program monitor-ing visit (PMV). We call it a “monitoring visit” insteadof an “evaluation” because we believe it is more partici-patory and less externally driven and intimidating thanthe classic external evaluation.
A Tool Explained: The Program Monitoring VisitThe LIFE program pursues evaluation in a participa-tory manner. We try to incorporate the various toolsused in an integrated event called a PMV. We try toinclude on the PMV team the LIFE subgrant man-ager, staff from the implementing NGO and CBO,where applicable, and members of the community andMET. In selecting individuals from these organiza-tions, we attempt to obtain a mix of the technical skillsoutlined in Table 1. The flow of analyses is presentedin Figure 9.
In addition to the tools already described, we also usebiological data: wildlife sightings from communitygame guards (staff employed by an NGO and the com-
Measuring Conservation Impact112

Renzi 113
Figure 6
Sample Community Management Profile

Measuring Conservation Impact114
munity to monitor wildlife and other resources) andcensus data from the government. In addition, wereview the periodic reports submitted by field managersfor the area being studied.
The main objectives of the PMV are to:
• get relevant stakeholders to review the informationcollected to date;
• identify other management questions that needanswering;
• synthesize the data to track progress;
• question basic assumptions; and
• ensure that project design continues to be appropri-ate for changing circumstances.
We try to pursue the process fully during the PMVevent, compressing into one episode the process ofidentifying questions, collecting and analyzing data, andmaking management decisions based on what welearned.
A challenge in this process is to involve a wide groupof stakeholders, often including government, NGOs,CBOs, and community leaders. Conflicting interests
A. ParticipatoryApproach
I. Community/Management Body Relations
Capability Sub-title Score Comments
Resource user identifica-tion with NNFC
Transparency/accountability of NNFCto community
NNFC perceptions ofaccountability to commu-nity
NNFC composition
1
1
1
1
Interviews revealed that resource users see the NNFC/MC primarily as apaternalistic structure, whose aim is to provide services. Resource management,business development, and advocacy were generally not seen as functions ofthe NNFC.
Community members were not aware of operations, including revenue,account balance, policies, or recently-made decisions.
While decisions are taken over resources, there is no centralized structure.
Does not reflect age groups, gender, or class.
Community Management Calculation SheetDate: 19–Jan–95 Organization: Nyae Nyae Farmers Cooperative
Figure 7
Excerpt from NNFC Community Management Toolkit
Figure 8
Excerpt from NNFC Community Management Profile – 1995

Renzi 115
and differing levels of education can, however, presentinteresting challenges in designing the process.
Applying the PMV: Revisiting Program Theology atthe National Level
BackgroundNamibia is fortunate to have a small cadre of talentedand dedicated men and women in the non-profit andgovernment sectors who are committed to improvingthe lives of rural Namibians through ICDPs. Severalindividuals valiantly stood up for the rights of thosewho live with wildlife to benefit from it. They pursuedthis objective even when it was dangerous to do sounder the apartheid regime of the South AfricanAdministration. They were pioneers in CBNRM at atime when Namibia was isolated from the rest of theworld, and they themselves were ostracized from main-stream Namibian conservation society for their willing-ness to assist rural blacks through conservation.
These individuals continue to take the lead in thepost-independence national CBNRM program. Theideas kept alive during the oppressive era of apartheidare now gradually becoming more widely accepted,partly from the dramatic shift in politics, and partly as aresult of the success of Integrated Rural Development
and Nature Conservation (IRDNC), an NGO locatedin the Kunene region of Northwestern Namibia.
IRDNC has focused on installing a community gameguard program and working with traditional leaders toimprove attitudes toward wildlife and to help re-ignitean understanding of the potential benefits communitiescan gain from wildlife. This has led to remarkableimprovements over the past decade in both conserva-tion and development. Biologically, there has been adramatic increase in the number of elephants, a dou-bling in the number of rhinos, and an increase inspringbok from 600 to well over 13,000.Socioeconomically, in the words of Erins Karatjaiva,Chairman of a local development committee:
We have protected and managed the wildlife here verywell. Wildlife is plentiful now, and our areas are verybeautiful, so we have been able to attract tourists—bringing us development and wealth. We are goingahead with our normal cattle, goat, and sheep farming,but we also have incorporated wildlife into our econ-omy. It is not one or the other—we work on both farm-ing and wildlife.8
The National CBNRM program in Namibia is nat-urally eager to install similar programs elsewhere inNamibia and several programs are now being sup-ported in the East Caprivi, West Caprivi, and theNyae Nyae areas. However, in transplanting a modelfrom one social/economic/ecological/political environ-ment to another, one must constantly question thevalidity of the system in its new home. This is oftendifficult, given pressures inherent in the day-to-daymanagement of complex field projects. The difficultiescan be compounded by what we may consider a “the-ologization” of project assumptions. If people havebeen struggling in the dark year after year to convinceothers of the merit of their ideas, it is possible for theideas to shift from sound theoretical bases to beliefs, toalmost a religion. This makes for committed workers,but can inhibit real questioning of the basis uponwhich things work. One can keep repeating the samemistake without questioning fundamental principles.It is a constant challenge of conservation and develop-ment initiatives to maintain commitment while avoid-ing treating basic assumptions as dogma. Multi-disciplinary M&E can provide useful, objective per-spectives.
Figure 9
Flow of Field Analyses Supporting ParticipatoryEvaluations
8 Excerpt from There’s a Better LIFE at Hand, a video on conservancy policy produced by WWF-USAID-LIFE program, February 1996.

Measuring Conservation Impact116
The InterventionWhile CBNRM is a complex undertaking, some of thebasic principles, as applied among Namibian practition-ers, can be summarized as follows:
• If people benefit from wildlife, then they will con-serve it.
• Control of wildlife must be in the hands of peoplewho live with it.
• If these occur, conservation will improve and localcommunities will become wealthier.
In March 1995, the LIFE program undertook a par-ticipatory review of activities in East Caprivi as part ofa regular PMV. One objective was to examine in detailsome of the project’s basic assumptions to ensure theirvalidity. In 1995, we chose to focus on the assumptionthat if people benefit from wildlife, then they will con-serve it.
The entire area had benefited reasonably uniformlyfrom employment of community game guards (consid-ered “community staff,” but salaries paid by the NGOthrough a grant from USAID-WWF-LIFE program),from various technical assistance inputs, and fromextension work from the game guards, including bothinformation and problem animal control. Some com-munities also benefited from various natural resource-based enterprises, such as the sale of thatching grass andtourism. Receipts from enterprises, however, variedwidely by community.
The test of the assumption seemed simple: withincreased benefits we would expect wildlife numbersto increase in all areas, but the increase would be mostmarked in areas that received the most benefits. Datato test the assumption were available, but are not yetcompiled. AMPs (tools like the IDT and CMT, butgeared to measure the progress of enterprises), techni-cal reports, and field data provided socioeconomicinformation on which communities received thegreatest economic benefits. On the biological side,game guards had been collecting monthly data ongame observations for over three years, but none of ithad been systematically analyzed.9 The PMV team,comprised of LIFE, the NGO, and MET participants
used a “quick and dirty” approach to review wildlifetrends in the various regions of the project area. Wecompared reports of game guards from year to year (tonormalize wet and dry season variation) for key gamespecies that were felt to be sensitive to human pres-sures (Figure 10).
Examination of these records for the area north ofMudumu National Park indicated trends consistentwith the theory, as shown in Table 2.
This was encouraging to the team, but as we lookedat a wider number of villages in another area of the pro-ject, the picture became more complex. One communityhad been distinguished from the rest as havingobtained, by far, the most natural resource-based bene-fits. Lizauli village was receiving the following :
• community-wide income from bed-night leviesremitted from a neighboring tourist lodge;
• employment from the Lizauli Traditional Villagetourism operation;
• income from the Lizauli Crafts Centre;
• employment of community game guards; and
• community-wide income from sale of thatching grassand reeds for construction.
One would expect wildlife numbers to increase evenmore in the area around Lizauli. Community membersshould be persuaded by the benefits they were earningto work especially hard to protect wildlife (the goosethat lays the golden egg). However, results of the analy-sis of the game guard data presented below revealedjust the opposite dynamic: poaching appeared to beincreasing. For all the species reviewed in the areapatrolled around Lizauli, wildlife numbers were down.In fact, they were the only areas reviewed where thiswas true.
How could this be? Our theory holds that, as bene-fits increase, so should commitment to conservation.The social data indicate that benefits increased mostmarkedly in Lizauli; however, biological data indicatedramatic drops in animal populations, both absolutelyand compared to neighboring communities.
9 This inability to analyze a wealth of data provides credence to the theory that special events are required to energize an M&E system. Allproject participants stated an eagerness to analyze the carefully recorded and filed game guard data on wildlife observations, but day-to-daypressures have “put off ” the event for four years to date.

Management ImpactWhenever data appear that are so directly contradictoryto the way we think things work, the first impulse is todeny them. In our case, we first pretended that the find-ings didn’t surface, and declared victory everywhere else.The next step was to claim that the data were not accu-
rate or that the analysis was too superficial. Finally,everyone was forced to scrutinize the findings and theirbeliefs.
What emerged was a fine-tuning of CBNRM the-ory/assumption/theology. The project needed to considerthe timing of fostering benefits, and the linkage of bene-fits to responsibility. The following conclusions emerged:
• Lizauli was given too many benefits without firstassuming sufficient responsibility.
• Benefits without responsibility do not lead to com-mitment.
• CBNRM projects should lead with responsibility,and then follow with benefit provision.
It is possible that other conclusions could be drawnfrom the data that would lead one to test other aspectsof the model.
This PMV provided an opportunity to analyze objec-tive data (originally captured by the implementer) in away that forced the Namibian CBNRM Program toobjectively review its basic operational framework. Wewere able to accomplish this by having a multidiscipli-nary team address both the social and biological issuesin an integrated way and by having most of the data col-lection already prepared through completion of thetool-based monitoring system used by the program.
Renzi 117
Figure 10
Wildlife Trends in East Caprivi, from East Caprivi PMV,1995
* Note: At the suggestion of the field manager, the following sampling procedure was followed: a) field manager identified areas likely tosupport animals most sensitive to human intrusions, such as from poaching (roan, sable, tsessebe, and lechwe); b) field manager reviewed allcommunity game guard sheets (for game guards known to be reliable) for those animals in those areas for 1992-1994, recording number ofanimals for each “indicator” species tallied at each sighting; c) an average number of key animals per sighting per year was developed.
Table 2. Average Number of Animals per Sighting per Year: Area North of Mudumu National Park, East Caprivi1992-1994*
Animal Community 1992 1994 % Change
RoanSingalamwe 2.5 3.2 � 28Lubuta 4.3 7.3 � 70
SableLubuta 4.3 9 � 109
TsessebeLubuta 4.6 6.6 � 43
LechweNgonga 2 3.4 � 70Singalamwe 3.2 8.6 � 169
REPORTING
Strive for the VisualIt is one thing to capture useful data, apply rigorousanalyses, and develop sound recommendations. Com-municating that information to relevant decision-mak-ers in a way that they understand and can act on is a verydifferent challenge. Unfortunately, project staff oftenbecome fatigued just as the analysis and recommenda-tions are completed and do not invest sufficient energyin communicating the results.
In our project, we experience three types of chal-lenges in getting our message across: (1) general apathy—the material is just not interesting; (2) decision-mak-ers who see too much written material and are “numb”to text; and (3) decision-makers who are not skilled atreading.
We have found that the way to address this con-straint is to try to make the presentation as visuallyinteresting as possible. For this reason, the IDT andCMT both have graphs (profiles) that summarize theentire exercise on an intuitively presented page. It is eas-ily understood and is something that can be put on awall to unite a group’s energies—i.e., “let’s beat that tar-get!” This is also why we used a graph to dramatize thedifference between the wildlife trends in Lizauli andneighboring villages in the example above.
Realizing the full potential of the data gatheredthrough a program monitoring system, however, occa-sionally requires stepping back and synthesizing it in away that can have a greater, or at least different, impactthan a number of reports on each activity. We attemptedthis in producing a video on the pending conservancypolicy in Namibia called “There’s a Better Life atHand.” We attempted to integrate social, biological,anthropological, and economic data and to merge itacross target areas. We present this as our final examplein the following section.
Communicating Results for Impact: Video,Monitoring, and Policy Change for Conservanciesin Namibia
BackgroundMany ICDPs express concern over the “policy environ-ment” that can impede project success. However, wemust realize that, from a project management perspec-tive, when we speak of policy constraints we are notspeaking only of the need to make changes in legislation.Rather, we include the integrated institutional, political,
regulatory, and legal environment that influences dailyimplementation and the likelihood of success.
The Namibian example is “Conservancy Policy.”Under this policy—pursued by the National CBNRMProgram since 1994—communities defined areas called“conservancies,” which they would manage sustainablyand which the government would regulate. Wildlifewould no longer be the exclusive domain of the state,but would be returned to communities. Along with thisresponsibility would come the right to reap related eco-nomic benefits, such as hunting concessions, live animalsales, and tourism concessions. A parallel front isattempting to revise national tourism policy to fosterdevelopment of community-based tourism enterprises.
The National CBNRM Program wished to get the“Conservancy Policy” and “Tourism Policy” under wayas the success of their activities depended on it. Toaccomplish this in a way that would have sustainableproject impact, they needed to gain deep and wide sup-port at the following levels:
Political• National: The lead ministry, the MET, needed sup-
port of other key ministries, the cabinet, and thePresident’s office.
• Local: Support from traditional leaders was needed.
Institutional• National: The MET was internally divided on the
idea of conservancies, with only top management andone of four branches firmly in support of the program.
• Local: Many MET field offices were particularlyskeptical.
Regulatory• For the government to help communities effectively
install conservancies, they would need to understandthe on-the-ground needs and be convinced of theusefulness of the policy.
Legal• To become law, the policy needed to be enacted by
both the National Assembly and the NationalCouncil.
Namibia’s National CBNRM Program wanted toconvince this varied assortment of policymakers to passand implement the policy.
Measuring Conservation Impact118

The InterventionTo promote passage and implementation, the NationalProgram elected to produce a video that would informthese various levels of policymakers of the successes todate in CBNRM and of the potential for the future forthe nation as a whole.
In drafting a script, we reviewed all the formal andinformal M&E data available to construct a future visionbased on actual successes in different parts of the country(see Talbe 1). We interviewed ministers, chiefs, headmen,NGO and CBO staff, farmers, bartenders, hunters, andveld food collectors to obtain data on how resources wereused and how they could benefit from the new policy.Those interviews were presented in the video in theirmother tongues. The interviews spoke to the realities ofeach ecological, economic, and social system and how thepolicies would address their particular needs. We also pre-sented striking visual images of successes and failuresthroughout the country, supported by local music andambient sounds.
The mixture of dramatization of past monitoringdata, collection of original interview data, and a com-pelling visual presentation brought a rather dry policyissue to life. It has been used in the following forums:
• A screening and conservancy policy question-and-answer session with ministers, deputy ministers andpermanent secretaries for all concerned ministries;
• A screening and discussion for the national council;
• Briefing trips on conservancy policy for MET staff inthe capital and the regions;
• Screenings for traditional authorities in the high-potential areas;
• A national television broadcast;
• Regional exchange and lessons learned; and
• Special screening events are planned to be hosted byregional governors.
Management ImpactThe result has been to inform the assortment of policy-makers of the advantages of conservancies to each oftheir portfolios and of the commitment of the govern-ment to its success. The policy has been approved by theNational Assembly and will soon be voted on by the
National Council. To rank-and-file MET staff andtheir regional outposts, seeing and hearing the perma-nent secretary and minister say that, without conservan-cies, there is no hope for conservation in Namibiaproved 10 times more powerful than a ministry circular.When the chief of a large part of Eastern Caprivi saidon television that his people would take care of wildlifeas they do their cattle, his local leaders sat up, tooknotice, and rallied behind the cause. When skepticalMET field staff see community workers handling aGlobal Positioning System apparatus, drawing maps,and monitoring wildlife, they gain confidence in localskills. And, when villagers considering starting atourism venture see the color of a tourist’s cash paid fora traditional dance in Nyae Nyae, they become con-vinced of the potential in conservation and develop-ment.
The video presents a dramatic example of how datacan be presented in ways that hit home far more power-fully than a report. It also has the useful effect of firmlyputting policymakers on record and of producing acommon vernacular to discuss policy issues. Sometimesit is words that are used. More often, however, it is audi-tory or visual: “I feel the same way as ChiefMoraliswani;” or “we want to make money by showingtourists elephants—like in the video;” or “those com-munity game guards seem to know what they’re doing.”In this case, data supported an argument and influencedthe external environment that, itself, influences projectimplementation in a multitude of ways.
CONCLUSION
This paper has provided examples of how a multidisci-plinary and participatory M&E system for the LIFEproject in Namibia has proven useful to an environ-mental NGO, a grassroots community organization, anational environmental program, and the overall LIFEprogram itself. We have emphasized the utility of sim-ple M&E tools. These are useful to capture objectivedata systematically, to foster a shared vision amongstakeholders, and to transfer needed skills to imple-menters with a wide range of training.
I have emphasized the successes we have enjoyed.A paper outlining the delays, frustrations, setbacks,and outright failures could have continued for manymore pages. I hope that readers can find elementsfrom the good news of our project that will be applic-able to the work they are doing throughout theworld.
Renzi 119
I. Introduction
8:00 – 8:10 Kathy SatersonIntroduction to the Session (History and Context)
8:10 – 8:30 Nick Salafsky and Richard MargoluisMonitoring and Evaluation in the Context of the Conservation andDevelopment Project Cycle
II. Conceptualization and Development of M&E Plan
8:30 – 8:35 Nick SalafskyOverview
8:35 – 9:00 John Ericho, Robert Bino, Arlyne Johnson, and Chris FilardiCrater Mountain Project, Research and Conservation Foundation,Papua New GuineaDeveloping an Interdisciplinary Monitoring Plan To Measure Effectiveness ofan Integrated Conservation and Development (ICAD) Project in the CraterMountain Wildlife Management Area, Papua New Guinea
9:00 – 9:25 Jan Crocker, The Nature Conservancy, Hawaii OfficeConserving Indonesia’s Lore Lindu National Park through the Promotion ofLocal Nature-based Enterprises
III. Interdisciplinary and Participatory Methods for Data Collection
9:25 – 9:30 Richard MargoluisOverview
❖
Appendix 1Symposium Schedule
❖
8 – 12 am, Tuesday, August 13Narragansett C, Westin Hotel
Providence, Rhode Island

Measuring Conservation Impact122
9:30 – 9:55 Barbara Dugelby, The Nature ConservancyTools for Monitoring Anthropogenic Impacts in Protected Areas
9:55 – 10:20 Claire Kremen, Wildlife Conservation Society/Stanford University Center forConservation BiologyMonitoring Natural Resource Use on the Masoala Peninsula, Madagascar:A Tool for Managing Integrated Conservation and Development Projects
10:20 – 10:35 Break
IV. Application of Results for Project Management
10:35 – 10:40 Kathy SatersonOverview
10:40 – 11:05 Kamal Bawa, UMass/TERI/VGKK Project, IndiaManagement of Tropical Forests for Extraction of Non-Timber Forest Products
11:05 – 11:30 Mark Renzi, LIFE Project, NamibiaThe Miner’s Canary: Multidisciplinary Program Monitoring
V. Discussion
11:30 – 12:00 Panel Discussion with all speakers (Kathy Saterson, moderator)

Ganesan BalachanderDirectorBiodiversity Conservation Network12 Zalameda StreetCorinthian GardensUgong NorteQuezon CityMetro ManilaPhilippinesPhone: 632-633-0892Email: [email protected]
Kamaljit S. BawaUMB-TERIProfessorDepartment of BiologyUniversity of Massachusetts/Boston100 Morrissey BoulevardBoston, Massachusetts 02125Phone: 617-287-6600Fax: 617-287-6650
Robert BinoSenior Project OfficerCrater Mountain ProjectP.O. Box 1261Goroka EHP, 441Papua New GuineaPhone: 675-732-3211Fax: 675-732-1123Email: [email protected]
❖
Appendix 2Contributors*
❖
* List updated May 1999
Joanna CrockerDirectorHolistic IntegrationP.O. Box 660Kailua, HI 96734Phone: 808-262-6945Email: [email protected]
Barbara L. DugelbyWildlands EcologistThe Wildlands ProjectHC 4 Box 144Blanco, Texas 78606Phone: 830-833-9615Fax: 830-833-5635Email: [email protected]
John Ericho,General ManagerResearch and Conservation
Foundation of PNGP.O. Box 1261Goroka EHP, 441Papua New GuineaPhone: 675-732-3211Fax: 675-732-1123Email: [email protected]
Arlyne JohnsonTechnical Advisor to WCS Laos
ProgramP.O. Box 6712VientianeLaos TDRPhone: 856-21-21-5400Fax: 856-21-21-5400Email:
Claire KremenResearch BiologistCenter for Conservation BiologyDepartment of Biological SciencesGilbert HallStanford UniversityStanford, California 94305Phone: 650-723-8139Fax: 650-723-5920Email:
Kate LanceUniversity of [email protected]

Measuring Conservation Impact124
Sharad LeleTata Energy Research InstitutePB No. 154, 50/7 Palace RoadBangalore 560 052IndiaPhone: 91-80-226-8296Fax: 91-80-225-5760Email: [email protected]
Richard MargoluisDirectorAnalysis and Adaptive ManagmentBiodiversity Support Program1250 24th Street NWSuite 500Washington, D.C. 20037Phone: 202-778-9776Fax: 202-861-8324Email:
K. S. MuraliTata Energy Research InstitutePB No. 154, 50/7 Palace RoadBangalore 560 052IndiaPhone: 91-80-226-8296Fax: 91-80-225-5760Email: [email protected]
Duncan NevilleActing Palu DirectorSulawesi Parks ProjectThe Nature ConservancyJl Towua 94Palu, Sulawesi TengahPhone: 62-451-25280Email: [email protected]
Isaia RaymondCARE International MadagascarProjet MasoalaB.P. 27Antalaha 207Madagascar
Mark RenziChief of PartyEPIQ/Tanzania Natural Resource
Management ProgramP.O. Box 23261Dar es SalaamTanzaniaPhone: 255-51-667-589
255-51-666-190Fax: 255-51-668-611Email: [email protected]
Nick SalafskyMacArthur Foundation140 Dearborn Street, 1100Chicago, IL 60603-0304Phone: 312-917-0304Fax: 312-917-0200Email: [email protected]
Kathryn SatersonEnvironmental Management
CenterBrandywine ConservancyChadds Ford, PA 19317Phone: 610-388-2700Fax: 610-388-1197Email: [email protected]
William H. UlfelderPeru Country DirectorThe Nature ConservancyCommunity Conservation ProgramAndean & Southern Cone Region1815 North Lynn StreetArlington, Virginia 22209Phone: 703-841-4581Fax: 703-841-4880Email: [email protected]
Andrew D. WeissNumerical Terradynamic
Simulation GroupSchool of ForestryUniversity of MontanaMissoula, MT 59812Phone: 406-243-6911Fax: 406-243-4510Email: [email protected]
Nengah WirawanExecutive DirectorKEHATI-Yayasan
Keanekaragaman HayatiGedung Patra Jasa1st Floor, Room C2Jalan Jend. Gatat Subrata Kav.
32-34Jakarta 12951IndonesiaPhone: 62-21-522-8031, 8032Fax: 62-21-522-8033