Environmental Monitoring Report Tajikistan: Golovnaya 240 ...
Upload
khangminh22Category
view
9download
0
PUBLIC. This information is being disclosed to the public in accordance with ADB’s Access to Information Policy.
Environmental Monitoring Report
Project Number: 31624-023
Semi-annual Report
January 2022
Nepal: Melamchi Water Supply Project
Prepared by Melamchi Water Supply Project for the Government of Nepal and the Asian Development
Bank.
This environmental monitoring Report is a document of the borrower. The views expressed herein do not
necessarily represent those of ADB's Board of Directors, Management, or staff, and may be preliminary in
nature.
In preparing any country program or strategy, financing any project, or by making any designation of or
reference to a particular territory or geographic area in this document, the Asian Development Bank does
not intend to make any judgments as to the legal or other status of any territory or area.
Environmental Monitoring Report – July-Dec 2021
i
PUBLIC. This information is being disclosed to the public in accordance with ADB’s Access to Information Policy.
TABLE OF CONTENTS
1. Background ……………………………………………………………………………………………………………… -1- 1.1 General Background …………………………………………………………………………………………………………….. -1- 1.2 Environmental Assessment studies of MWSP ………………………………………………………………………. -2- 1.3 Stakeholders’ Involvement …………………………………………………………………………………………………… -4- 1.4 Environmental Management and Consulting Services ………………………………………………………….. -4- 1.5 Objective, Scope and Limitation of the Report ……………………………………………………………………… -5-
2. Environmental Management Works of MWSP …………………………………………………………… -6-
2.1 Prioritized Environmental Management Works …………………………………………………………………… -6- 2.1.1 Environmental Management Works during Project’s Preparatory Works …………………… -6- 2.1.2 Headworks and Diversion Tunnel Works …………………………………………………………………….. -7-
2.2 Environmental Management Works conducted by the Project ……………………………………………. -7- 2.2.1 Environmental Monitoring Works ………………………………………………………………………………. -7- 2.2.1.1 River Discharge Monitoring …………………………………………………………………………………….. -7- 2.2.1.2 Monitoring of River Water Quality ………………………………………………………………………….. -10- 2.2.1.3 Air Quality Monitoring …………………………………………………………………………………………….. -11- 2.2.1.4 Noise Level Monitoring ……………………………………………………………………………………………. -13- 2.2.1.5 Fish Assessment ………………………………………………………………………………………………………. -14- 2.2.1.6 OHS and Campsite Monitoring ………………………………………………………………………………… -16- 2.2.1.7 Diversion Tunnel Safety and Environmental Monitoring of Tunnel Works ………………. -18- 2.2.1.8 Other Aspects of Compliance Monitoring ……………………………………………………………….. -26- 2.2.2 Environmental Mitigation Works ……………………………………………………………………………….. -27- 2.2.2.1 Physical mitigation works ………………………………………………………….…………………………….. -27- 2.2.2.2 Tree felling and Compensation ………………………………………………….…………………………….. -29- 2.2.2.3 Compensation paid to traditional water mills …………………………….……………………………. -32- 2.2.3 Environmental Enhancement Works …………………………………………….……………………………. -33- 2.2.3.1 Establishment of Environmental Monitoring Laboratory …………………………………………. -33- 2.2.3.2 Establishment of forest nursery ………..……………………………………….……………………………. -33- 2.2.3.3 Inventory of Non-Timber Forest Products ………………………………….……………………………. -35- 2.2.3.4 Installation of river staff gauge stations in Melamchi river and Indrawati river ……….. -36- 2.2.4 Public Consultations and Grievances …………..……………………………….…………………………….. -37-
3: Reflection ………..……………………………………….……………………………………………………………… -40-
3.1 Good Practices ……………………………………….……………………………………………………………………………. -40- 3.1.1 Institutional Aspects ……………………………………….……………………………………………..…………… -40- 3.1.2 Implementation Aspects ……………………………………….……………………………………………….…… -40-
3.2 Gaps ……………………………………….……………………………………………………………………………………………. -41- 3.3 Recommendations ………………….……………………………………………………………………………………………. -41-
Environmental Monitoring Report – July-Dec 2021
ii
PUBLIC. This information is being disclosed to the public in accordance with ADB’s Access to Information Policy.
LIST OF TABLES
Table 1-1: Consulting Packages/Teams for Environmental Management Works …………………. -4- Table 2-1: Representative table showing surface water flow measurements …………………….. -8- Table 2-2: Representative table showing surface water flow measurements .…………………….. -8- Table 2-3: Indicative table showing water quality monitoring works ………………………………….. -10- Table 2-4: Indicative table showing water quality monitoring works Sindhu adit ……………….. -11- Table 2-5: Representative data for measurement of air quality …………………………………………. -12- Table 2-6: Locations for monthly fish monitoring ………………………………………………………………. -14- Table 2-7: Fish Species Commonly Caught in the Project Area …………………………………………… -15- Table 2-8: Summary of OHS & Campsite Compliance Status ………………………………………………. -16- Table 2-9: Provisions of Health facilities for the workforce …….………………………………………….. -20- Table 2-10: Capacity building works carried out for the workforce ………………………………………. -22- Table 2-11: Monitoring of air quality during the tunnel works ………..……………………………………. -24- Table 2-12: List of mitigation works for physical impacts of the project ……………………………….. -27- Table 2-13: Tree felling and compensation at Sindhu Adit Access Road ….…………………………….. -29- Table 2-14: Tree felling and compensation at Gyalthum Adit Access Road ……………………………. -30- Table 2-15: Tree felling and compensation at Main Access Road ………………………………………..… -30- Table 2-16: Tree felling and compensation at Upgrading Access Road ………………………………..… -31- Table 2-17: Damage to and compensation for water mills ………………….……………………………..…. -32- Table 2-18: Plant saplings grown in Forest Nursery, 2009 ………………….……………………………..….. -34- Table 2-19: List of NTFPs found in the project area, Melamchi ………….……………………………..….. -35- Table 2-20: Location of staff gauge stations established by the project …………………………..……. -36- Table 2-21: Compilation of Community Meetings from Jan, 2008 to July, 2021 ……………..…….. -37- Table 2-22: Compilation of Grievances Registered and Resolved (Jan. 2008 to Jul. 2021) …….. -39-
LIST OF FIGURES
Figure 1.1: Project Layout Map of MWSP …………………………………………………………………………….. -1-
Figure 2.1: Strategic locations (S1, S2, S3 & S4) for installation of gauging stations ……………… -9-

Environmental Monitoring Report – July-Dec 2021
iii
PUBLIC. This information is being disclosed to the public in accordance with ADB’s Access to Information Policy.
ABBREVIATION
AAR : Adit Access Road
ADB : Asian Development Bank
APs : Affected Peoples
CA : Constitution Assembly
CBO : Community Based Organization
CDC : Compensation Determination Committee
CDO : Chief District Officer
CFL : Current Flow Level
CIRT : Community Issues Resolution Team
CRCC : China Railway Construction Company
CMC : Cooperativa Muratori & Cementisti (Tunnel Contractor)
CMS : Consolidated Management Service (P.) Ltd
CT : Consulting Team
DADO : District Agriculture Development Office
DCS : Design and Supervision Consultant
DDCs : District Development Committees
DED : Deputy Executive Director
DLRO : District Land Revenue Office/Officer
DO : Dissolved Oxygen
DSC : Design and Supervision Consultant
EC : Electric Conductivity
ED : Executive Director
EIAs : Environment Impact Assessments
EMP : Environmental Management Plan
FUGs : Forest Users' Group
GA : General Assembly
GAAR : Gyalthum Adit Access Road
GoN : Government of Nepal
HFL : Highest Flow Level
HHs : Households
HSMC : Hyolmo Sindhu Melamchi Committee
HSMVSUPIC : Hyolmo Sindhu Melamchi Valley Social Upliftment Program
Implementation Committee
HUPIC : Hyolmo Upliftment Program Implementation Committee
HUP : Hyolmo Upliftment Program
ICON : Integrated Consultants Nepal (P.) Ltd
IGCD : Income Generation and Community Development
JICA : Japan International Cooperation Agency
KUKL : Kathmandu Upatkaya Khanepani Limited
KVWSMB : Kathmandu Valley Water Supply Management Board
LAA : Land Acquisition Act
LGP : Local Governance Program
LNP : Langtang National Park
LRO : land Revenue Office/Officer
MLD : Ministry of Local Development
MoGA : Ministry of General Administration
MoLJ : Ministry of law and Justice
MoUD : Ministry of Urban Development
MoF : Ministry of Finance
MPPW : Ministry of Physical planning and Works
Environmental Monitoring Report – July-Dec 2021
iv
PUBLIC. This information is being disclosed to the public in accordance with ADB’s Access to Information Policy.
MWSDB : Melamchi Water Supply Development Board
MWSP : Melamchi Water Supply Project
MVSUPIC : Mandan Valley Social Upliftment Program Implementation Committee
MVSUPIS : Mandan Valley Social Upliftment Program Implementation Samaj (society)
NDF : Nordic Development Fund
NDWQS : National Drinking Water Quality Standard
NGOs : Non-Government Organization
NORAD : Norwegian Agency for Development
NRCS : Nepal Red Cross Society
NRM : National Representative Mission
NVC : National Vigilance Centre
OPEC : Organization of Petroleum Exporting Countries
PAPs : Project Affected Persons
PAFs : Project Affected Families
PIU : Project Implementation Units
PM : Particular Matters
PMC : Project Management Consultant
PMU : Project Management Unit
PR : Public Relation
PRC : Public Relations Consultant
PRP : Public Relation Program
PSP : Private Sector Participation
RAP : Resettlement Action Plan
RFP : Request for Proposal
RL : Reduced Level
RPF : Resettlement Policy Framework
RRA : Rural Rapid Appraisal
SAAR : Sindhu Adit Access Road
SDE : Senior Divisional Engineer
SDP : Sector Development Program
SGU : Safeguard Unit
SIDA : Swedish International Development Agency
SM : Social Mobilizer
SPAFs : Severely Project Affected Families
SSDS : Safeguard and Social Development Support
SUP : Social Uplift Program
TDS : Total Dissolve Substance
ToR : Terms of Reference
TSPM : Total Suspended Particle Matters
UAR : Upgrading Access Road
VDCs : Village Development Committees
WDT : Water Diversion Tunnel
WHO : World Health Organization
XS : Cross Section
Environmental Monitoring Report – July-Dec 2021
- 1 -
PUBLIC. This information is being disclosed to the public in accordance with ADB’s Access to Information Policy.
11.. BBAACCKKGGRROOUUNNDD
1.1 General Background
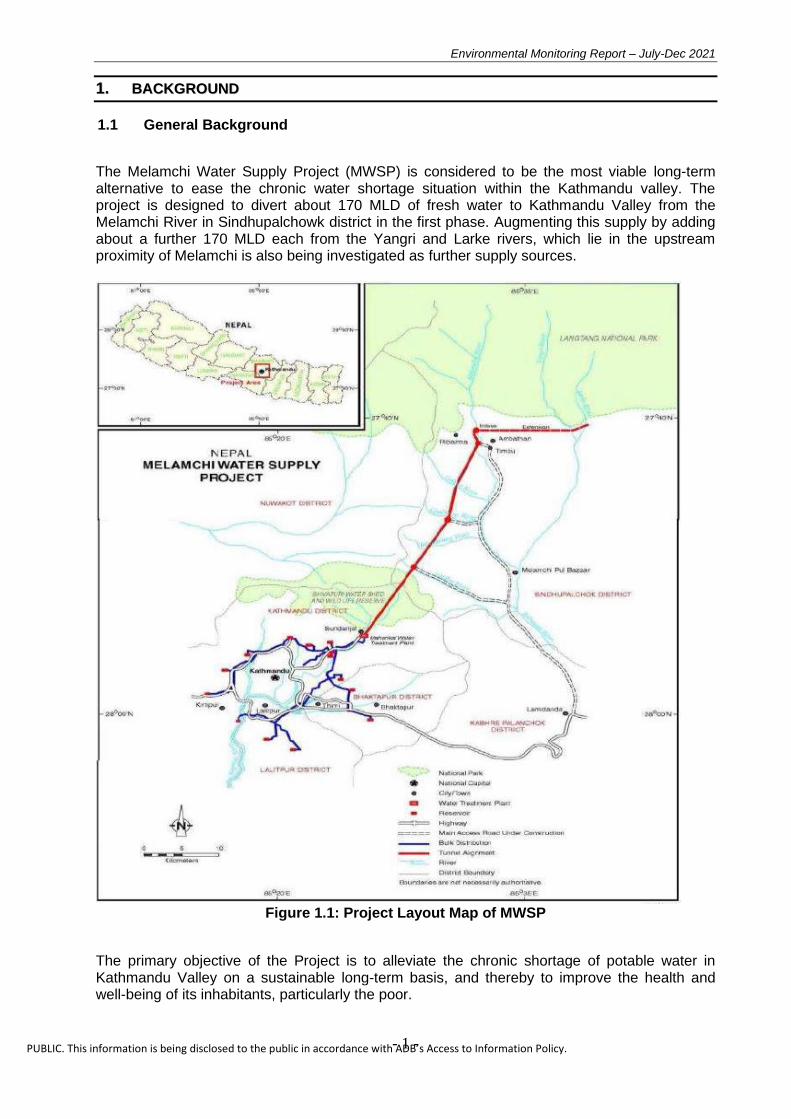
The Melamchi Water Supply Project (MWSP) is considered to be the most viable long-term alternative to ease the chronic water shortage situation within the Kathmandu valley. The project is designed to divert about 170 MLD of fresh water to Kathmandu Valley from the Melamchi River in Sindhupalchowk district in the first phase. Augmenting this supply by adding about a further 170 MLD each from the Yangri and Larke rivers, which lie in the upstream proximity of Melamchi is also being investigated as further supply sources.
Figure 1.1: Project Layout Map of MWSP
The primary objective of the Project is to alleviate the chronic shortage of potable water in Kathmandu Valley on a sustainable long-term basis, and thereby to improve the health and well-being of its inhabitants, particularly the poor.
Environmental Monitoring Report – July-Dec 2021
- 2 -
PUBLIC. This information is being disclosed to the public in accordance with ADB’s Access to Information Policy.
The project is designed to serve good quality potable drinking water as per World Health Organization’s guideline to feed in improved distribution network as set out by the Melamchi Water Supply Project – Subproject II.
Further to this, project also aims a reliable, affordable, consumer oriented and sustainable potable water supply and sanitation services in the Kathmandu Valley.
The total project totals $317.3 million. The cost was jointly funded by several agencies such as: ADB (Loan 1820-NEP) – $137 m, JBIC – $ 47.5 m, JICA – $18 m, NDF – $10.5 m, OPEC – $13.7 m, and GoN – $ 90.6 million.
1.2 Environmental Assessment studies of MWSP
The EIA report (IUCN, 1999) is very comprehensive and contains detailed baseline information. However, this report was not approved by the then MOPE due to some shortcomings in the report. It was followed by the preparation of another EIA report (Nippon Koei 2000). This report had systematized the information, followed EPR (1997), and had satisfied the then HMG’s and ADB's requirements. This EIA report (Nippon Koei’s 2000) was approved by the then MOPE on 18th September 2001, and has legal authority to comply with. A third supplementary EIA report based on stand-alone water supply was also prepared (METCON 2002). It presented some additional environmental issues of Yangri and Larke extensions. Environmental Assessment reports (Stanley and Associates, 1990, and Bellofet and Associates 1998 have also identified the environmental issues of the project implementation. These assessments documents had analysis and prediction of impacts, mainly on, physical, biological, and socio-economic environments, likely to occur during construction and operational phases of project implementation. Some of the environmental aspects focused in relation to the proposed project activities were;
• Soil erosion, sedimentation and slope instability for AARs and MAR during construction phase,
• Impact on vegetation and likeliness of causing soil erosion and degradation of the aesthetic values along the transmission line.
• Similarly the operation of quarry site, may affect arable land, disrupt infrastructure and river. Tunnel construction may produce a large quantity of tunnel muck (460,000m3) and is likely to create disposal problem (19500m2).
• Blasting may trigger vibration and may lead to damaging of houses, cracks and landslides.
• Constructions, of WTP at Mahankal, are very likely to produce, soil erosion, spoil management, disturbances on local drainages, and can affect landscape.
• BDS, requires laying of 58-km-long pipes and excavation may generate huge amount of spoil materials.
• During construction, air quality of the MWSP area will be affected. Similarly construction of WTP, BDS/RSS etc. will also generate dust and chemicals. Noise and vibration will be generated during blasting. It has been expected that the noise-level will exceed 90 dBA.
• A total of 301.83 ha of land will be required for the entire project which comprises 230 ha of agricultural land, 2 ha of forest and 59 ha of flood plain.
• Impacts on vegetation and wildlife have also been anticipated including on LNP buffer zone.
• The diversion of 1.97m3/sec form Melamchi River can affect downstream ecology and water users. March will be crucial month where shortage of water becomes critical. The flow reduction at Melamchi, will affect irrigation canal, local Ghattas (traditional water mills), and traditional fishing. The other effects anticipated in EIA reports are (i) traffic congestion, (ii) effects on health and hygiene, (iii) employment opportunities, and (iv) enhancement of local economy.
Environmental Monitoring Report – July-Dec 2021
- 3 -
PUBLIC. This information is being disclosed to the public in accordance with ADB’s Access to Information Policy.
The major mitigation measures that were recommended to be implemented during construction and operation phases in order to subdue the anticipated impacts are; Soil erosion control, slope stabilization, cut and fill practices, drainage management, minimization of tree cuttings, stockpiling, construction of protection wall, disposal of excess materials, vegetation plantation, etc . at MDS, and along MAR and AARs Toping and looping of vegetation should be adopted while construction of pillars at suitable sites along the transmission line. Proper disposal of spoil in suitable place, compaction and re-vegetation were also recommended. Regarding river water flow, release of flow of 0.4m3/sec has been recommended to maintain downstream flow. General measures have been suggested to control water, air, and noise pollution An Area of 2.5 ha of near Ambathan was identified, to use for the disposal of tunnel muck. Some sites were identified in Kathmandu, to dispose waste materials generated during the construction and operation of WTP, WWPT, and others. Protection of trees, plantation, and control of cutting and collection and trading of NTF have been suggested. Prohibition of poaching, establishment of fish nursery, and control of fishing were also proposed to mitigate the impacts on aquatic life.
1.3 Stakeholders’ Involvement
Melamchi Water Supply Development Board (MWSDB) is the umbrella entity of the project. Under the board, a separate Project Implementation Unit (PIU) at Melamchi and a Project Management Unit (PMU) in Kathmandu were instrumental during Phase I.
Hyolmo Sindhu Melamchi Valley Social Upliftment Program Implementation Committee (HSMVSUPIC) has been constituted for the implementation of Social Upliftment Program (SUP). This committee is contributing towards resolving all SUP and other issues relating to Melamchi Water Supply Project in the Hyolmo, Sindhu and Melamchi Valley through community participation. Similarly, Hyolmo Upliftment program (HUP) is underway from 2012 separately for Helambu VDC. In addition, Mandan Valley Social Upliftment Program (MVSUP) is also in existence in Kavrepalanchok. Public relation consultant (PRC) was carrying out Social Uplift Program (SUP) and Public Relation (PR) related job as an interim arrangement before this consolidated consultancy (ICON-CMS-JV) was in place. Similarly, the Environmental management program (EMP) consultant was working for implementation of the EMP document under EIA report of the project. Since December, 2009 Safeguard and Social Development Support activities including Environment Management Program was under implementation.
A significant work has already been implemented based on the RAP, EMP, and SUP of 2001 through the consultants engaged by the project. An updated status of these activities can be appraised from the updated subproject-wise RAP, EMP and SUP report.
Environmental Monitoring Report – July-Dec 2021
- 4 -
PUBLIC. This information is being disclosed to the public in accordance with ADB’s Access to Information Policy.
1.4 Environmental Management and Consulting Services
Environment, Resettlement and Social Development Division under MWSDB is the focal unit for addressing the overall environmental management works of the project. Environmental management activities of the project were conducted under following consulting packages at different project phases under supervision of MWSDB;
Table 1-1: Consulting Packages/Teams for Environmental Management Works
SN Prime Consulting team for environmental management works
Duration Remarks
1 Project Management Consultancy (PMC)
2000 to 2005
2 Environmental Management Program (EMP)
15th March 2005 to October 2009
3 Safeguards and Social Development Support (SSDS)
December 2009 to December 2017
EMP program was a part of the package
4 Design and Supervision Consultant of Headworks and Diversion Tunnel
2018 to March 2022
The project involved consultants for Project Management, Access Roads, Construction Supervision, Environment Management, Public Relation and SUP. International and National Safeguard Officers were engaged separately through the consultants. Some of the consultants hired by MWSP reported to the project.
1.5 Objective, Scope and Limitation of the Report
The objectives of this report are to;
Summarize the data and other information on environmental monitoring and
management works carried out under the Phase I of MWSP,
Summarize the results of monitoring of major environmental parameters undertaken
during the project period from 2002 to August 2021,
Provide interpretations of the analysis of information obtained about the project’s
environmental safeguards works, and provide feedback to the stakeholders concerned.
The scope of the report is limited to subject areas and geographical coverage as defined by the contract documents between the MWSDB, and the consulting firms or individual consultants engaged by MWSDB. The major activities covered under the environmental safeguards works are; There are some gap of interlinkage between the environmental safeguards activities conducted by the project under different phases of the project. Hence, the major limitation of this report is that the report will partially address the EMP designed under the EIA document of the MWSP. It rather consolidates all the efforts made to address the pertinent concerns of environmental safeguards by the project.

Environmental Monitoring Report – July-Dec 2021
- 5 -
PUBLIC. This information is being disclosed to the public in accordance with ADB’s Access to Information Policy.
22.. EEnnvviirroonnmmeennttaall MMaannaaggeemmeenntt WWoorrkkss ooff MMWWSSPP
Environmental management works conducted under the project can be documented under three major aspects;
1. Environmental Monitoring Works 2. Environmental Mitigation Works 3. Safeguards Enhancement Works
The sections below presents the prioritized activities in different activity sectors of the project followed by the environmental management works conducted by the project;
2.1 Prioritized Environmental Management Works
For the better presentation of the efforts made by the project for safeguarding the environmental sensitivities, this report presents the environmental activities under three major stages;
1. Section I - Project’s Preparatory Works 2. Section II - Headworks & Diversion Tunnel Works 3. Section III - Water Treatment Plant and Distribution Network Works
2.1.1 Environmental Management Works during Project’s Preparatory Works
The outline of works planned under this phase of the project were as follows;
1. EMP compliance monitoring for MAR, Sindhu Adit Access Road, Gyalthum Adit Access
Road, and Upgrading Access Road (UAR -02) (second level monitoring only),
2. Establishment of Environmental Laboratory at Melamchi Site Office,
3. Periodic monitoring of air quality at construction sites of MWSP,
4. Periodic monitoring of water quality of Melamchi river,
5. Periodic monitoring of noise level at construction sites of MWSP,
6. Installation of Staff Gauge at Melamchi River and Calibration of the Station,
7. Periodic monitoring of flow discharge of Melamchi river,
8. Inventory of discharge measurement of the springs, spouts and other sources of water
along the tunnel alignment,
9. Assessment of damaged infrastructure and services of MDS, and survey, design, cost
estimation and supervision of their reinstatement,
10. Assessment of fish population at different locations of Melamchi Valley,
11. Feasibility study of establishment of fish fry nursery in Melamchi Valley,
12. Impact Assessment of Melamchi Diversion Scheme on biodiversity,
13. Monitoring of Baseline Vegetation Plots during the Construction Phase,
14. Establishment of Forest Nursery,
15. Replenishing measures for the vegetation loss (afforestation),
16. Monitoring of impacts on culture, society, health and safety of construction workers and
the condition of workforce camps, monitoring of the employment opportunity for local
workers (influx of outside workers),
17. Monitoring of SUP Implementation (Environmental aspects only),
18. Preparation of Environmental Conservation Training Manual and Conducting Training
and Community Awareness, and
19. Periodic meetings.
Environmental Monitoring Report – July-Dec 2021
- 6 -
PUBLIC. This information is being disclosed to the public in accordance with ADB’s Access to Information Policy.
2.1.2 Headworks and Diversion Tunnel Works
The outline of works planned under this phase of the project were as follows;
1. Protection of the headworks site and its structures,
2. Safeguards and safety aspects of the tunnel construction works,
3. Environmental monitoring works including;
a. Collection and analysis of water quality of water sample from four different sites
(Ambathan, Gyalthum River, Sindhu Audit and Melamchi canteen) for water
quality monitoring.
b. Discharge measurement of Melamchi river at different points namely; Ribarma
Timbu (before the confluence of fountain), Gohare (after the confluence of
Gohare khola), Gyalthum (after the confluence of Gyalthum khola), Talamarang
(after the confluence of Gyalthum Khola) and Melamchi (at Pulbazar).
4. Providing technical advisory and capacity building services to the MWSDB, the
HSMVSUPIC and other similar local committees formed to assist the MWSDB in
implementing any component of the project, if any, and associated project stake holders
on environmental safeguards related activities.
2.2 Environmental Management Works conducted by the Project
Second order monitoring of the project’s activities were conducted through consulting parties hired by MWSDB. On the other hand, most of the mitigation works were conducted through involvement of local stakeholders and local committees. The enhancement works include involvement of both - the consultants as well as the local stakeholders.
2.2.1 Environmental Monitoring Works
Ambient & baseline environmental monitoring, environmental compliance monitoring and safety monitoring are the prime aspects covered by the project’s environmental monitoring works. The major environmental monitoring works carried by the project are outlined in the sections below;
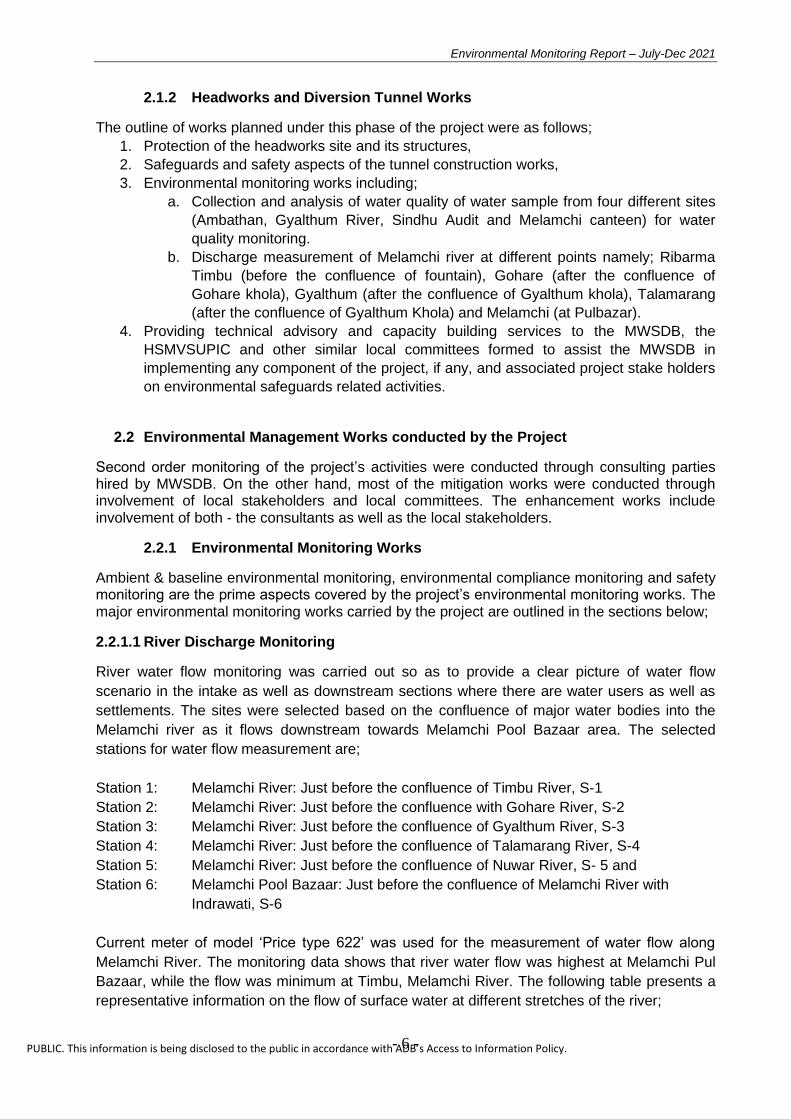
2.2.1.1 River Discharge Monitoring
River water flow monitoring was carried out so as to provide a clear picture of water flow
scenario in the intake as well as downstream sections where there are water users as well as
settlements. The sites were selected based on the confluence of major water bodies into the
Melamchi river as it flows downstream towards Melamchi Pool Bazaar area. The selected
stations for water flow measurement are;
Station 1: Melamchi River: Just before the confluence of Timbu River, S-1
Station 2: Melamchi River: Just before the confluence with Gohare River, S-2
Station 3: Melamchi River: Just before the confluence of Gyalthum River, S-3
Station 4: Melamchi River: Just before the confluence of Talamarang River, S-4
Station 5: Melamchi River: Just before the confluence of Nuwar River, S- 5 and
Station 6: Melamchi Pool Bazaar: Just before the confluence of Melamchi River with
Indrawati, S-6
Current meter of model ‘Price type 622’ was used for the measurement of water flow along
Melamchi River. The monitoring data shows that river water flow was highest at Melamchi Pul
Bazaar, while the flow was minimum at Timbu, Melamchi River. The following table presents a
representative information on the flow of surface water at different stretches of the river;

Environmental Monitoring Report – July-Dec 2021
- 7 -
PUBLIC. This information is being disclosed to the public in accordance with ADB’s Access to Information Policy.
Table 2-1: Representative table showing surface water flow measurements in Melamchi
belt (m3/s)
SN Locations Jan Feb Mar Apr May June
1. Intake site (just before the confluence with
Timbu River) 3.59 2.745 2.733 3.117 2.905 3.352
2. Melamchi River (just before the confluence
with Gohare River) 3.81 2.971 2.938 3.43 2.981 3.512
3 Melamchi River (just before the confluence
of Gyalthum River) 4.69 3.225 3.361 3.564 3.284 4.014
4 Melamchi River (just before confluence
with Talamarang River) 4.77 3.698 3.617 3.797 3.349 4.326
5. Melamchi River (just before the confluence
with Nuwar River) 4.99 3.895 4.05 4.002 3.435 4.636
6. Melamchi Pool Bazaar (Just before the
confluence of Melamchi River with
Indrawati) 5.66 4.086 4.38 4.361 3.409 4.728 Source: Annual Report, July 2008 to 15 July 2009/Environmental Management Program - MWSP (Note: Other data are given in Annex)
The river flow monitoring was continued till 2018. Periodically, the river discharge measurement was carried out at the intake site. However, the measurements taken later were only at five points, and those were measurements taken at the downstream of confluences of the tributary rivers mentioned above.
Table 2-2: Representative table showing surface water flow measurements in Melamchi belt
Location
Discharge, m3/s
Jan Feb Mar Apr May Jun July – Oct.
Nov Dec
Melamchi at Timbu /Ambathan
4.45 3.67 3.37 3.7 3.91 4.27
Dis
ch
arg
e c
ann
ot
be
me
asu
red d
ue
to t
he h
igh
flo
od
in t
he r
iver
durin
g th
is
mo
nso
on
perio
d
5.57 4.92
Melamchi at Gohare 4.98 3.99 3.74 3.83 4.26 5.26 6.55 5.80
Melamchi at Gyalthum 6.10 4.78 4.46 4.62 4.84 5.99 7.07 6.77
Melamchi at Talamarang 6.26 5.18 4.92 5.03 5.23 6.21 7.17 6.82
Melamchi at Pulbazaar 6.35 5.59 5.26 5.24 5.46 6.57 7.33 6.92
Source: Annual Report, SSDS - 2018 (Note: Other data are given in Annex)

Environmental Monitoring Report – July-Dec 2021
- 8 -
PUBLIC. This information is being disclosed to the public in accordance with ADB’s Access to Information Policy.
Staff gauging stations has been established at 4 sites of Melamchi and Indrawati River to continuously measure the River flow. These sites include;
Station 1: Melamchi River: Just before the confluence of Timbu River, S-1
Station 2: Melamchi River: Just before the confluence of Talamarang River, S-2
Station 3: Melamchi Pool Bazaar: Just before the confluence of Melamchi River with
Indrawati, S-3 and
Station 4: Melamchi Pool Bazaar: After the confluence of Melamchi River with Indrawati, S-
4, near the Melamchi Site Camp.
Figure 2.1: Strategic locations (S1, S2, S3 & S4) for installation of gauging stations for river discharge measurement
During 2009 monitoring phase, these gauging stations had been established, and local people had been trained to take gauge readings from these stations and employed as gauge readers. Routine gauge readings were taken twice a day from these stations. Apart from these routine readings; the gauge readers took readings also during high floods whenever noticed. This was a sustainable approach adopted by the project. However, this aspect of river discharge measurement seems to have been overlooked by the consulting team/s during the later phase of its implementation.

Environmental Monitoring Report – July-Dec 2021
- 9 -
PUBLIC. This information is being disclosed to the public in accordance with ADB’s Access to Information Policy.
2.2.1.2 Monitoring of River Water Quality
River water samples were taken from Melamchi River at intake site, Gyalthum River, Talamarang River, Melamchi River at Melamchi Pul Bazaar, Sindhu River and Chaa Khola of UAR. Water samples were taken at regular sampling sites. Form each site, two samples were taken; one in a one liter bottle and the next in a half-liter bottle. Sampling time and temperature of the water samples were recorded for every sample.
During sample collection parameters like Dissolved Oxygen (DO), Electric Conductivity (EC) and temperature were measured using portable equipment. Other chemical parameters were analyzed in Environmental Laboratory at site office. Different methods like titration, electrometric and spectrophotometric methods were used for water quality analysis in the field laboratory. The following table is an indicative table showing water quality analysis results for the month of September 2008.
Table 2-3: Indicative table showing water quality monitoring works
Parameters Intake Site Gyalthum
River Talamarang
River Melamchi
River Sindhu River
Physical
pH
Turbidity(NTU) 3 5 12 6 12
DO (mg/L) 8.2 7.5 7.3 6.6 6.5
EC( s/cm) 165.2 142.6 236.3 165.1 209.2
TDS (mg/L) 109.0 94.1 156.0 109.0 138.1
Chemical
T.Alkalinity (mg/L) 14.91 17.84 25.55 18.1 25.55
Bicarbonate/ 21.395 18.18 31.19 22.07 27.92
Carbonate(mg/L) Nil Nil Nil Nil Nil
Hydroxide (mg/L) Nil Nil Nil Nil Nil
Chloride(mg/L) 4.71 4.19 4.71 4.71 5.34
T. Phosphate(mg/L) 0.06 0.07 0.03 0.06 0.07
Nitrate(mg/L) 0.64 1.621 1.73 0.97 1.58
Ammonia(mg/L) 0.07 0.24 0.34 0.21 0.12
T .hardness(mg/L) 19 18 21 18 28
Calcium(mg/L) 6.4 3.2 6.4 4.8 6.4
Magnesium(mg/L) 0.97 0.605 2.9 1.46 2.18
Iron(mg/L) 0.155 0.1 0.125 1.47 0.17
Manganese(mg/L) 0.13 0.13 0.54 0.25 0.18
Source: Monthly Progress Report, EMP Package, September 2008
(Note: Other data are given in Annex)
Such monitoring works were conducted to detect any possible impacts of project activities on local surface water flows. In the later phase when the adit tunnel construction works started, the river water quality monitoring was conducted also at the adit points so as to check the immediate impacts of the project activities, and to regulate any possible cause of river water quality degradations.
Environmental Monitoring Report – July-Dec 2021
- 10 -
PUBLIC. This information is being disclosed to the public in accordance with ADB’s Access to Information Policy.
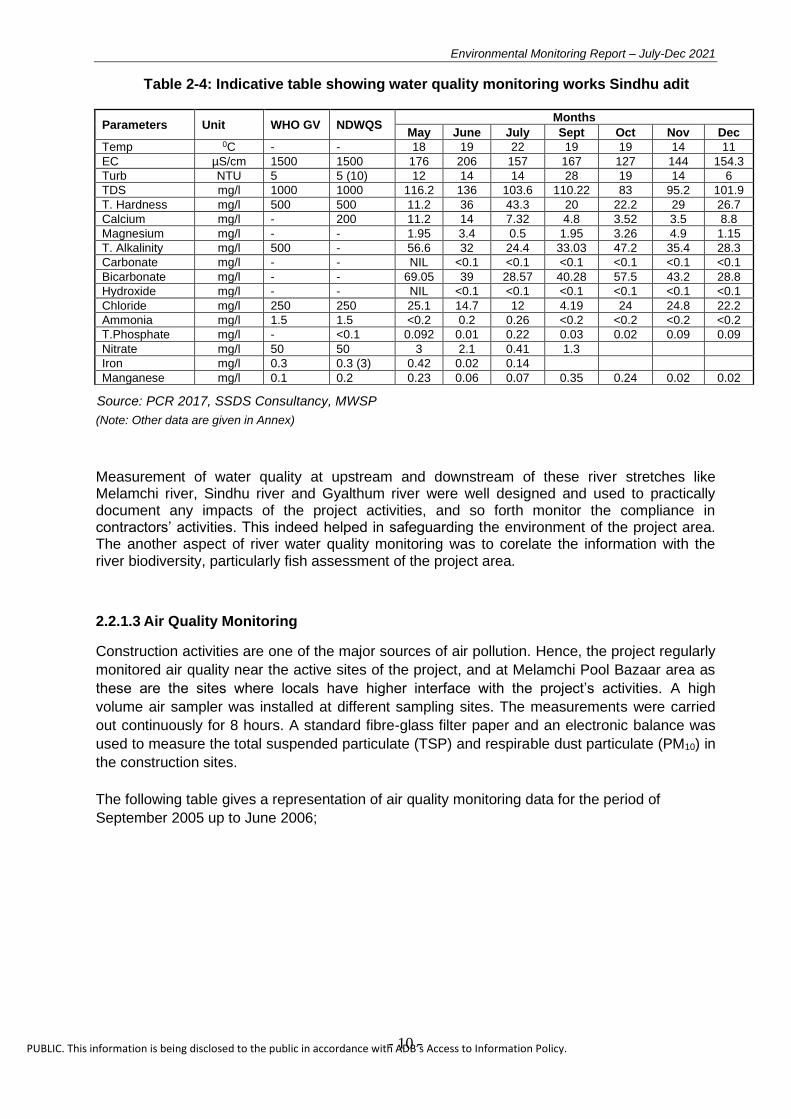
Table 2-4: Indicative table showing water quality monitoring works Sindhu adit
Parameters Unit WHO GV NDWQS Months
May June July Sept Oct Nov Dec
Temp 0C - - 18 19 22 19 19 14 11
EC µS/cm 1500 1500 176 206 157 167 127 144 154.3
Turb NTU 5 5 (10) 12 14 14 28 19 14 6
TDS mg/l 1000 1000 116.2 136 103.6 110.22 83 95.2 101.9
T. Hardness mg/l 500 500 11.2 36 43.3 20 22.2 29 26.7
Calcium mg/l - 200 11.2 14 7.32 4.8 3.52 3.5 8.8
Magnesium mg/l - - 1.95 3.4 0.5 1.95 3.26 4.9 1.15
T. Alkalinity mg/l 500 - 56.6 32 24.4 33.03 47.2 35.4 28.3
Carbonate mg/l - - NIL <0.1 <0.1 <0.1 <0.1 <0.1 <0.1
Bicarbonate mg/l - - 69.05 39 28.57 40.28 57.5 43.2 28.8
Hydroxide mg/l - - NIL <0.1 <0.1 <0.1 <0.1 <0.1 <0.1
Chloride mg/l 250 250 25.1 14.7 12 4.19 24 24.8 22.2
Ammonia mg/l 1.5 1.5 <0.2 0.2 0.26 <0.2 <0.2 <0.2 <0.2
T.Phosphate mg/l - <0.1 0.092 0.01 0.22 0.03 0.02 0.09 0.09
Nitrate mg/l 50 50 3 2.1 0.41 1.3
Iron mg/l 0.3 0.3 (3) 0.42 0.02 0.14
Manganese mg/l 0.1 0.2 0.23 0.06 0.07 0.35 0.24 0.02 0.02
Source: PCR 2017, SSDS Consultancy, MWSP
(Note: Other data are given in Annex)
Measurement of water quality at upstream and downstream of these river stretches like Melamchi river, Sindhu river and Gyalthum river were well designed and used to practically document any impacts of the project activities, and so forth monitor the compliance in contractors’ activities. This indeed helped in safeguarding the environment of the project area. The another aspect of river water quality monitoring was to corelate the information with the river biodiversity, particularly fish assessment of the project area.
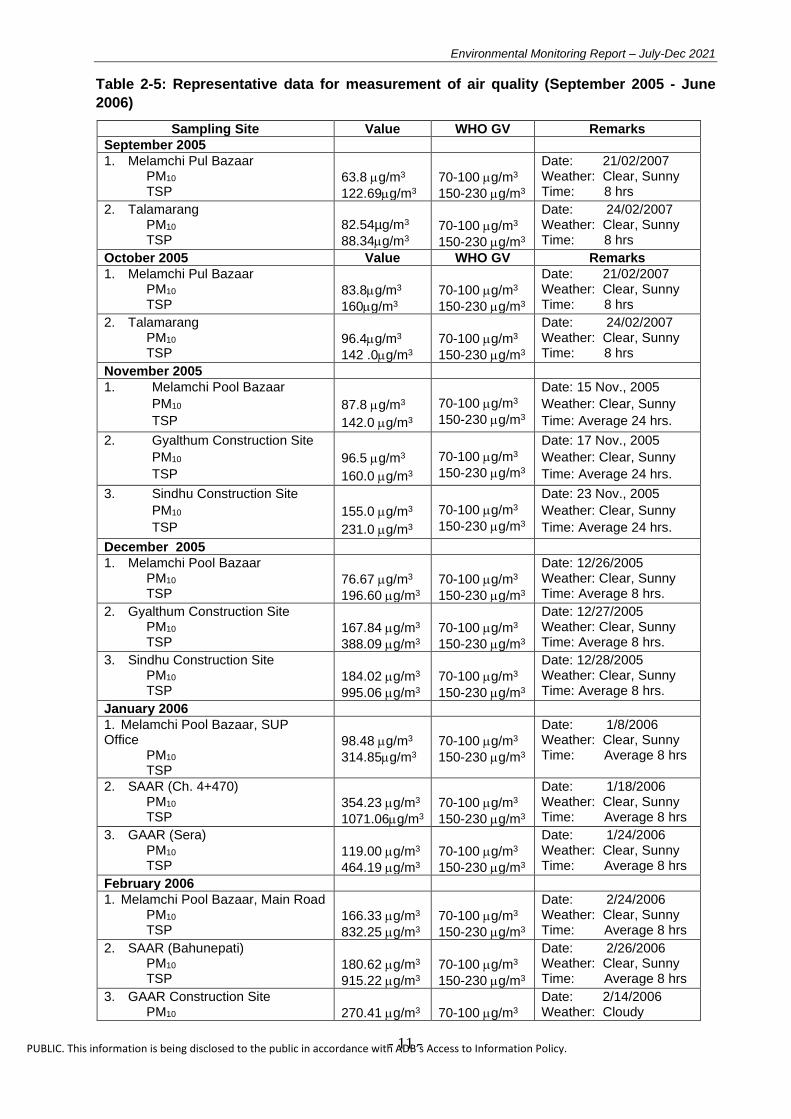
2.2.1.3 Air Quality Monitoring
Construction activities are one of the major sources of air pollution. Hence, the project regularly
monitored air quality near the active sites of the project, and at Melamchi Pool Bazaar area as
these are the sites where locals have higher interface with the project’s activities. A high
volume air sampler was installed at different sampling sites. The measurements were carried
out continuously for 8 hours. A standard fibre-glass filter paper and an electronic balance was
used to measure the total suspended particulate (TSP) and respirable dust particulate (PM10) in
the construction sites.
The following table gives a representation of air quality monitoring data for the period of
September 2005 up to June 2006;
Environmental Monitoring Report – July-Dec 2021
- 11 -
PUBLIC. This information is being disclosed to the public in accordance with ADB’s Access to Information Policy.
Table 2-5: Representative data for measurement of air quality (September 2005 - June
2006)
Sampling Site Value WHO GV Remarks
September 2005
1. Melamchi Pul Bazaar PM10 TSP
63.8 g/m3
122.69g/m3
70-100 g/m3
150-230 g/m3
Date: 21/02/2007 Weather: Clear, Sunny Time: 8 hrs
2. Talamarang PM10 TSP
82.54µg/m3
88.34g/m3
70-100 g/m3
150-230 g/m3
Date: 24/02/2007 Weather: Clear, Sunny Time: 8 hrs
October 2005 Value WHO GV Remarks
1. Melamchi Pul Bazaar PM10 TSP
83.8g/m3
160g/m3
70-100 g/m3
150-230 g/m3
Date: 21/02/2007 Weather: Clear, Sunny Time: 8 hrs
2. Talamarang PM10 TSP
96.4g/m3
142 .0g/m3
70-100 g/m3
150-230 g/m3
Date: 24/02/2007 Weather: Clear, Sunny Time: 8 hrs
November 2005
1. Melamchi Pool Bazaar
PM10
TSP
87.8 g/m3
142.0 g/m3
70-100 g/m3
150-230 g/m3
Date: 15 Nov., 2005
Weather: Clear, Sunny
Time: Average 24 hrs.
2. Gyalthum Construction Site
PM10
TSP
96.5 g/m3
160.0 g/m3
70-100 g/m3
150-230 g/m3
Date: 17 Nov., 2005
Weather: Clear, Sunny
Time: Average 24 hrs.
3. Sindhu Construction Site
PM10
TSP
155.0 g/m3
231.0 g/m3
70-100 g/m3
150-230 g/m3
Date: 23 Nov., 2005
Weather: Clear, Sunny
Time: Average 24 hrs.
December 2005
1. Melamchi Pool Bazaar PM10 TSP
76.67 g/m3
196.60 g/m3
70-100 g/m3
150-230 g/m3
Date: 12/26/2005 Weather: Clear, Sunny Time: Average 8 hrs.
2. Gyalthum Construction Site PM10 TSP
167.84 g/m3
388.09 g/m3
70-100 g/m3
150-230 g/m3
Date: 12/27/2005 Weather: Clear, Sunny Time: Average 8 hrs.
3. Sindhu Construction Site PM10 TSP
184.02 g/m3
995.06 g/m3
70-100 g/m3
150-230 g/m3
Date: 12/28/2005 Weather: Clear, Sunny Time: Average 8 hrs.
January 2006
1. Melamchi Pool Bazaar, SUP Office PM10 TSP
98.48 g/m3
314.85g/m3
70-100 g/m3
150-230 g/m3
Date: 1/8/2006 Weather: Clear, Sunny Time: Average 8 hrs
2. SAAR (Ch. 4+470) PM10 TSP
354.23 g/m3
1071.06g/m3
70-100 g/m3
150-230 g/m3
Date: 1/18/2006 Weather: Clear, Sunny Time: Average 8 hrs
3. GAAR (Sera) PM10 TSP
119.00 g/m3
464.19 g/m3
70-100 g/m3
150-230 g/m3
Date: 1/24/2006 Weather: Clear, Sunny Time: Average 8 hrs
February 2006
1. Melamchi Pool Bazaar, Main Road PM10 TSP
166.33 g/m3
832.25 g/m3
70-100 g/m3
150-230 g/m3
Date: 2/24/2006 Weather: Clear, Sunny Time: Average 8 hrs
2. SAAR (Bahunepati) PM10 TSP
180.62 g/m3
915.22 g/m3
70-100 g/m3
150-230 g/m3
Date: 2/26/2006 Weather: Clear, Sunny Time: Average 8 hrs
3. GAAR Construction Site PM10
270.41 g/m3
70-100 g/m3
Date: 2/14/2006 Weather: Cloudy

Environmental Monitoring Report – July-Dec 2021
- 12 -
PUBLIC. This information is being disclosed to the public in accordance with ADB’s Access to Information Policy.
Sampling Site Value WHO GV Remarks
TSP 608.13 g/m3 150-230 g/m3 Time: Average 8 hrs
March 2006
1. Melamchi Pool Bazaar, MWSDBCamp PM10 TSP
172.84g/m3
458.94g/m3
70-100 g/m3
150-230 g/m3
Date: 1/8/2006 Weather: Clear, Sunny Time: Average 8 hrs
2. SAAR (Ch. 4+470) PM10 TSP
158.20g/m3
593.16g/m3
70-100 g/m3
150-230 g/m3
Date: 1/18/2006 Weather: Cloudy, rainy Time: Average 8 hrs
3. GAAR PM10 TSP
76.73 g/m3
343.63g/m3
70-100 g/m3
150-230 g/m3
Date: 1/24/2006 Weather: Cloudy, rainy Time: Average 8 hrs
April 2006
1. Melamchi Pool Bazaar, MWSDBCamp PM10 TSP
95.40g/m3
212.32g/m3
70-100 g/m3
150-230 g/m3
Date: 04/02/2006 Weather: Clear, Sunny Time: Average 8 hrs
May 2006
1. MAR (Halde construction site) PM10 TSP
50.32g/m3
226.45g/m3
70-100 g/m3 150-230
g/m3
Date: 05/18/2006 Weather: Clear, Sunny Time: Average 8 hrs
2. GAAR (construction site) PM10 TSP
60.43g/m3
322.01g/m3
70-100 g/m3 150-230
g/m3
Date: 05/19/2006 Weather: Cloudy, rainy Time: Average 8 hrs
Source: EMP Monitoring, 2005/2006 (Note: Other data are given in Annex)
Though the concentrations of (Respirable Particulate Matter) PM10 and (Total Suspended Particulates) TSP were low at Melamchi Pul Bazaar, the concentrations were significantly high at the construction areas of (Main Access Road) MAR, (Sindhu Adit Access Road) SAAR and (Gyalthum Adit Access Road) GAAR. Water sprinkling was carried out to mitigate these concerns. A regular field monitoring (2nd order monitoring) was carried out by the EMP consultant team on monthly basis.
In the later phase, revised contract during December 2014, Specific Consulting Inputs, which was incorporated in original contract of November 2009, was terminated and the service of staff under SCI who was carrying these activities was also terminated. As a result, the works could not carry out.
2.2.1.4 Noise Level Monitoring
Plying of project vehicles, operation of construction equipments and loading/unloading of
construction materials were among the major sources of noise nuisance in the project area.
Noise Meters were used to measure the noise levels at the construction sites. The data on
noise level were taken at different places which included Melamchi Pool Bazaar, Talamarang
and the construction sites of (Main Access Road) MAR, (Sindhu Adit Access Road) SAAR and
(Gyalthum Adit Access Road) GAAR. Noise levels were measured at regular intervals starting
from 9 AM to 5 PM. The average noise levels are not significantly high with comparison to the
threshold limits of 70 dBA at all the construction sites. At times, and at the sites near to the
operation of heavy equipments, the noise levels were found to reach 80 dBA, but for a short
span of time. However, no complaints were reported about noise problems from the project
areas of MDS.
Environmental Monitoring Report – July-Dec 2021
- 13 -
PUBLIC. This information is being disclosed to the public in accordance with ADB’s Access to Information Policy.
Environmental Monitoring Report – July-Dec 2021
- 14 -
PUBLIC. This information is being disclosed to the public in accordance with ADB’s Access to Information Policy.
2.2.1.5 Fish Assessment
EIA reports recorded only 191 fishermen families partially or wholly dependent on fish catch. Thus it is necessary that regular and detail data on above be collected. However, data available on fish catch and fish diversity are limited in EIA reports. Hence, the project decided to develop a comprehensive plan for fishery management in the project area.
A Fishery Development Plan was developed by the project in 2004.
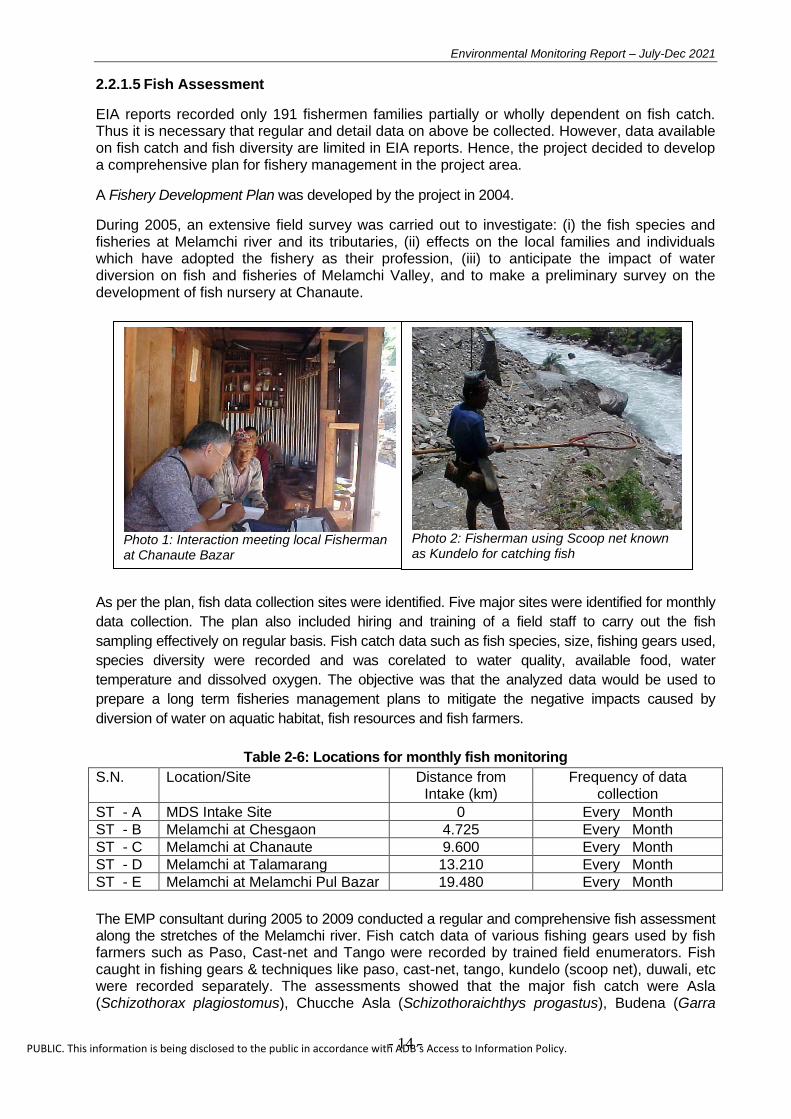
During 2005, an extensive field survey was carried out to investigate: (i) the fish species and fisheries at Melamchi river and its tributaries, (ii) effects on the local families and individuals which have adopted the fishery as their profession, (iii) to anticipate the impact of water diversion on fish and fisheries of Melamchi Valley, and to make a preliminary survey on the development of fish nursery at Chanaute.
As per the plan, fish data collection sites were identified. Five major sites were identified for monthly
data collection. The plan also included hiring and training of a field staff to carry out the fish
sampling effectively on regular basis. Fish catch data such as fish species, size, fishing gears used,
species diversity were recorded and was corelated to water quality, available food, water
temperature and dissolved oxygen. The objective was that the analyzed data would be used to
prepare a long term fisheries management plans to mitigate the negative impacts caused by
diversion of water on aquatic habitat, fish resources and fish farmers.
Table 2-6: Locations for monthly fish monitoring
S.N. Location/Site Distance from Intake (km)
Frequency of data collection
ST - A MDS Intake Site 0 Every Month
ST - B Melamchi at Chesgaon 4.725 Every Month
ST - C Melamchi at Chanaute 9.600 Every Month
ST - D Melamchi at Talamarang 13.210 Every Month
ST - E Melamchi at Melamchi Pul Bazar 19.480 Every Month
The EMP consultant during 2005 to 2009 conducted a regular and comprehensive fish assessment along the stretches of the Melamchi river. Fish catch data of various fishing gears used by fish farmers such as Paso, Cast-net and Tango were recorded by trained field enumerators. Fish caught in fishing gears & techniques like paso, cast-net, tango, kundelo (scoop net), duwali, etc were recorded separately. The assessments showed that the major fish catch were Asla (Schizothorax plagiostomus), Chucche Asla (Schizothoraichthys progastus), Budena (Garra
Photo 1: Interaction meeting local Fisherman at Chanaute Bazar
Photo 2: Fisherman using Scoop net known as Kundelo for catching fish
Environmental Monitoring Report – July-Dec 2021
- 15 -
PUBLIC. This information is being disclosed to the public in accordance with ADB’s Access to Information Policy.
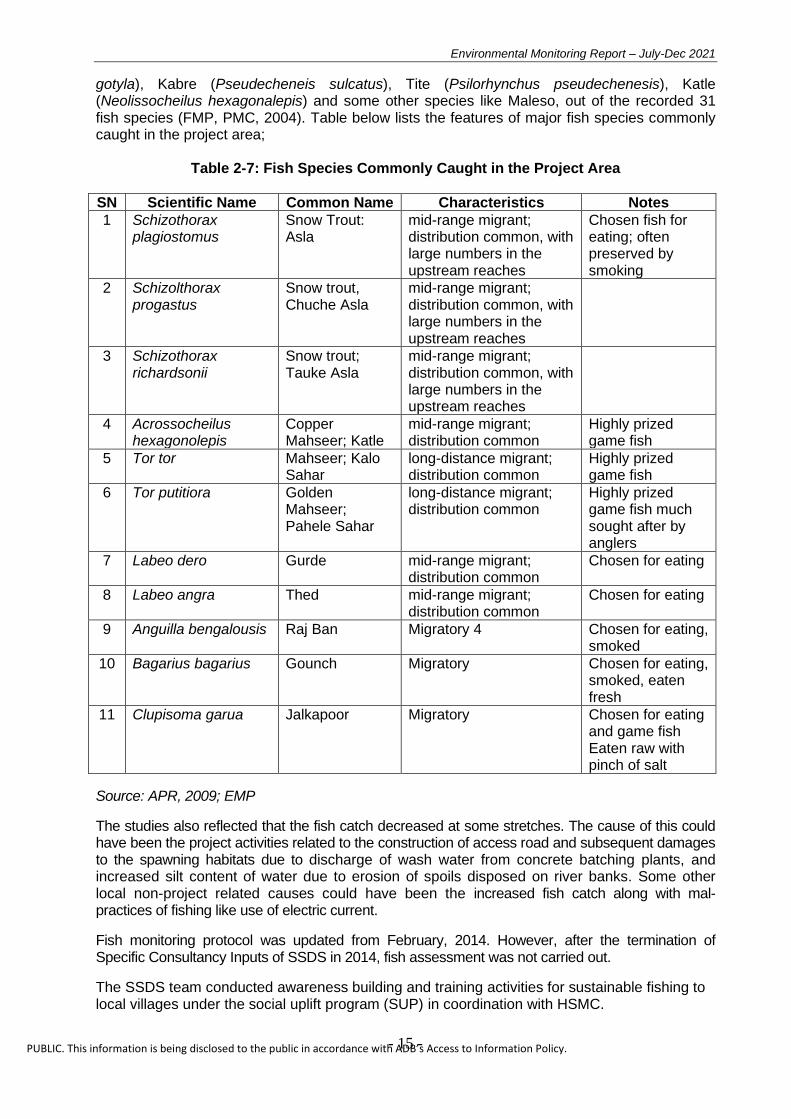
gotyla), Kabre (Pseudecheneis sulcatus), Tite (Psilorhynchus pseudechenesis), Katle (Neolissocheilus hexagonalepis) and some other species like Maleso, out of the recorded 31 fish species (FMP, PMC, 2004). Table below lists the features of major fish species commonly caught in the project area;
Table 2-7: Fish Species Commonly Caught in the Project Area
SN Scientific Name Common Name Characteristics Notes
1 Schizothorax plagiostomus
Snow Trout: Asla
mid-range migrant; distribution common, with large numbers in the upstream reaches
Chosen fish for eating; often preserved by smoking
2 Schizolthorax progastus
Snow trout, Chuche Asla
mid-range migrant; distribution common, with large numbers in the upstream reaches
3 Schizothorax richardsonii
Snow trout; Tauke Asla
mid-range migrant; distribution common, with large numbers in the upstream reaches
4 Acrossocheilus hexagonolepis
Copper Mahseer; Katle
mid-range migrant; distribution common
Highly prized game fish
5 Tor tor Mahseer; Kalo Sahar
long-distance migrant; distribution common
Highly prized game fish
6 Tor putitiora Golden Mahseer; Pahele Sahar
long-distance migrant; distribution common
Highly prized game fish much sought after by anglers
7 Labeo dero Gurde mid-range migrant; distribution common
Chosen for eating
8 Labeo angra Thed mid-range migrant; distribution common
Chosen for eating
9 Anguilla bengalousis Raj Ban Migratory 4 Chosen for eating, smoked
10 Bagarius bagarius Gounch Migratory Chosen for eating, smoked, eaten fresh
11 Clupisoma garua Jalkapoor Migratory Chosen for eating and game fish Eaten raw with pinch of salt
Source: APR, 2009; EMP
The studies also reflected that the fish catch decreased at some stretches. The cause of this could have been the project activities related to the construction of access road and subsequent damages to the spawning habitats due to discharge of wash water from concrete batching plants, and increased silt content of water due to erosion of spoils disposed on river banks. Some other local non-project related causes could have been the increased fish catch along with mal-practices of fishing like use of electric current.
Fish monitoring protocol was updated from February, 2014. However, after the termination of Specific Consultancy Inputs of SSDS in 2014, fish assessment was not carried out.
The SSDS team conducted awareness building and training activities for sustainable fishing to local villages under the social uplift program (SUP) in coordination with HSMC.
Environmental Monitoring Report – July-Dec 2021
- 16 -
PUBLIC. This information is being disclosed to the public in accordance with ADB’s Access to Information Policy.
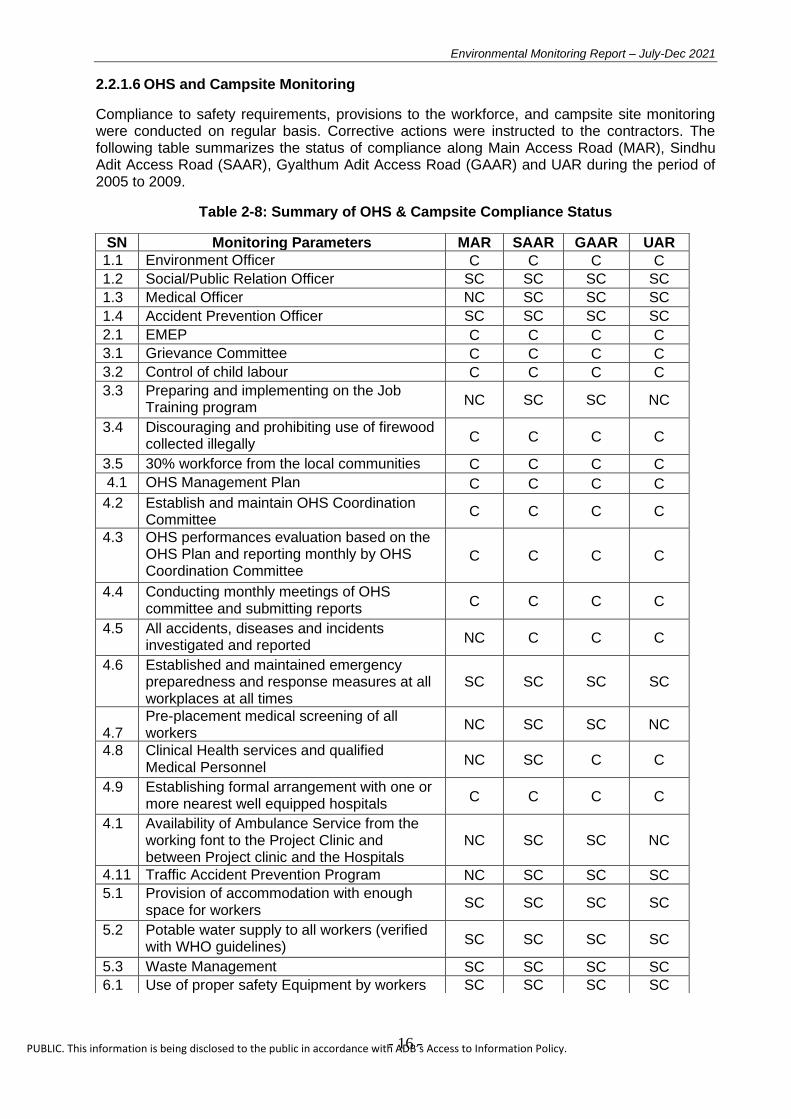
2.2.1.6 OHS and Campsite Monitoring
Compliance to safety requirements, provisions to the workforce, and campsite site monitoring were conducted on regular basis. Corrective actions were instructed to the contractors. The following table summarizes the status of compliance along Main Access Road (MAR), Sindhu Adit Access Road (SAAR), Gyalthum Adit Access Road (GAAR) and UAR during the period of 2005 to 2009.
Table 2-8: Summary of OHS & Campsite Compliance Status
SN Monitoring Parameters MAR SAAR GAAR UAR
1.1 Environment Officer C C C C
1.2 Social/Public Relation Officer SC SC SC SC
1.3 Medical Officer NC SC SC SC
1.4 Accident Prevention Officer SC SC SC SC
2.1 EMEP C C C C
3.1 Grievance Committee C C C C
3.2 Control of child labour C C C C
3.3 Preparing and implementing on the Job Training program
NC SC SC NC
3.4 Discouraging and prohibiting use of firewood collected illegally
C C C C
3.5 30% workforce from the local communities C C C C
4.1 OHS Management Plan C C C C
4.2 Establish and maintain OHS Coordination Committee
C C C C
4.3 OHS performances evaluation based on the OHS Plan and reporting monthly by OHS Coordination Committee
C C C C
4.4 Conducting monthly meetings of OHS committee and submitting reports
C C C C
4.5 All accidents, diseases and incidents investigated and reported
NC C C C
4.6 Established and maintained emergency preparedness and response measures at all workplaces at all times
SC SC SC SC
4.7 Pre-placement medical screening of all workers
NC SC SC NC
4.8 Clinical Health services and qualified Medical Personnel
NC SC C C
4.9 Establishing formal arrangement with one or more nearest well equipped hospitals
C C C C
4.1 Availability of Ambulance Service from the working font to the Project Clinic and between Project clinic and the Hospitals
NC SC SC NC
4.11 Traffic Accident Prevention Program NC SC SC SC
5.1 Provision of accommodation with enough space for workers
SC SC SC SC
5.2 Potable water supply to all workers (verified with WHO guidelines)
SC SC SC SC
5.3 Waste Management SC SC SC SC
6.1 Use of proper safety Equipment by workers SC SC SC SC
Environmental Monitoring Report – July-Dec 2021
- 17 -
PUBLIC. This information is being disclosed to the public in accordance with ADB’s Access to Information Policy.
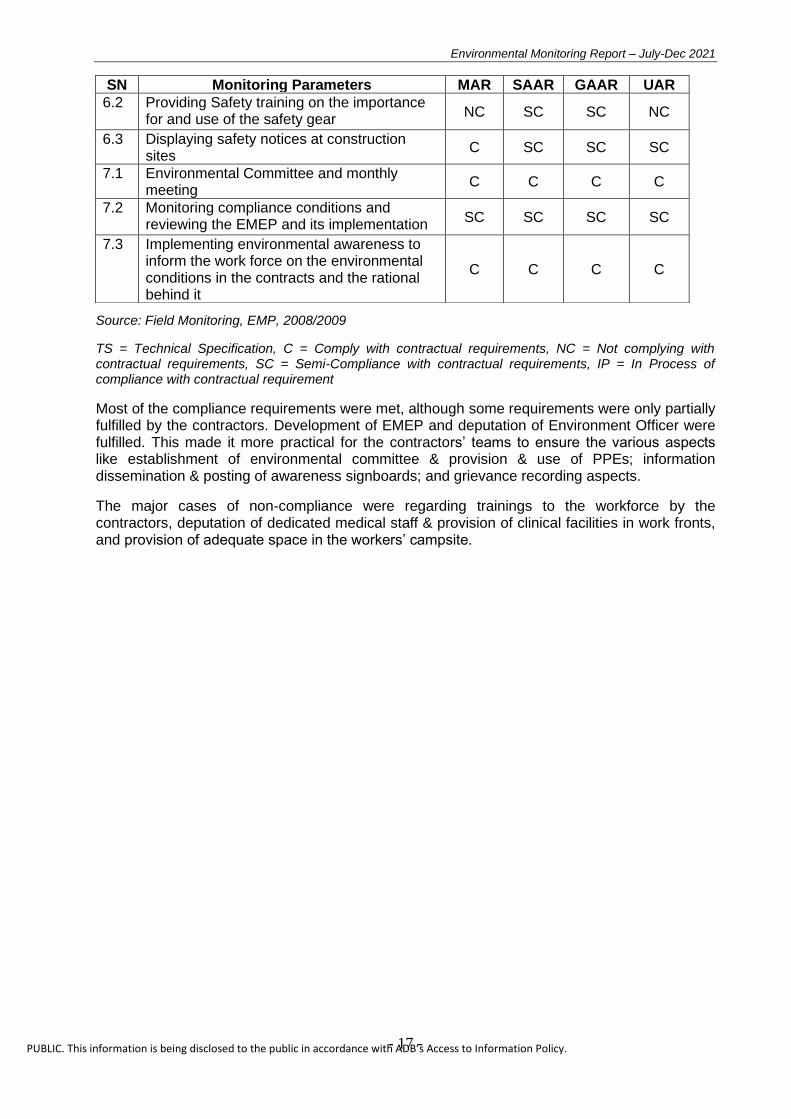
Source: Field Monitoring, EMP, 2008/2009
TS = Technical Specification, C = Comply with contractual requirements, NC = Not complying with contractual requirements, SC = Semi-Compliance with contractual requirements, IP = In Process of compliance with contractual requirement
Most of the compliance requirements were met, although some requirements were only partially fulfilled by the contractors. Development of EMEP and deputation of Environment Officer were fulfilled. This made it more practical for the contractors’ teams to ensure the various aspects like establishment of environmental committee & provision & use of PPEs; information dissemination & posting of awareness signboards; and grievance recording aspects.
The major cases of non-compliance were regarding trainings to the workforce by the contractors, deputation of dedicated medical staff & provision of clinical facilities in work fronts, and provision of adequate space in the workers’ campsite.
SN Monitoring Parameters MAR SAAR GAAR UAR
6.2 Providing Safety training on the importance for and use of the safety gear
NC SC SC NC
6.3 Displaying safety notices at construction sites
C SC SC SC
7.1 Environmental Committee and monthly meeting
C C C C
7.2 Monitoring compliance conditions and reviewing the EMEP and its implementation
SC SC SC SC
7.3 Implementing environmental awareness to inform the work force on the environmental conditions in the contracts and the rational behind it
C C C C
Environmental Monitoring Report – July-Dec 2021
- 18 -
PUBLIC. This information is being disclosed to the public in accordance with ADB’s Access to Information Policy.
2.2.1.7 Diversion Tunnel Safety and Environmental Monitoring of Tunnel Works
Safety Aspects
HSE management plan: Contractor prepared the Health, Safety and Environment (HSE) Management Plan. The HSE plan illustrates clearly about the principles and rules to be followed by contractor (Sino Hydro) and employees at work site to assure safe working environment.
Toolbox meeting: Toolbox meeting was carried out at each working site before starting the day’s works.
Safety training to workers: Induction training at the beginning is provided to each staff/worker. Similarly, the Contractor has provided safety training to its workers.
Levels of CO2, Oxygen, CO and NO2
These records were taken at Ambathan tunnel point, Sindhu Aidt tunnel, Gyalthum adit tunnel and at Sundarijal tunnel point.
✓ CO2 values ranged from 0.01 to 0.03 percentage by volume during the monitoring
period
✓ Oxygen levels ranged from 21 to 21.5 percentage by volume during the monitoring
period
✓ CO levels ranged from 0 to 4 ppm during the monitoring period
✓ NO2 levels ranged from 0 to 0.02 ppm during the monitoring period
The OSHA Respiratory Protection Standard (29 CFR 1910.134) uses 19.5 percentage oxygen as the level below which an oxygen deficient atmosphere exists and requires, generally, that all oxygen deficient atmosphere be considered immediately dangerous to life or health. Similarly, the OSHA PEL for CO is 50 parts per million (ppm). OSHA standards prohibit worker exposure to more than 50 parts of CO gas per million parts of air averaged during an 8-hour time period. As per the Confined Space Entry Policy, the oxygen percentage should be between 19.5%-23.5%. Hence, regarding this aspect, no major concerns were seen in the tunnel construction works.
Ventilation and Air conditioning inside the Tunnel
Ventilation ducts were used and ventilation fans were also operated. Special considerations
were given during drilling and blasting works. During drilling work, the problem of ventilation
rose for some time, but the contractor arranged the booster fan and exhaust fans to clear
accumulated smokes and gases at working area inside the tunnel.
However, provisions for emergency situation were not fully placed. Oxygen cylinders were not
available sufficiently. Stand-by ambulance was provisioned for emergency case.
Loader and trucks used for hauling the muck also add to pollutants inside the tunnel. Hence, the contractor strictly monitored on proper maintenance and best fuel quality for those vehicles. Use of jet fans were practiced, especially in Ambathan and Sindhu tunnel sites.
Environmental Monitoring Report – July-Dec 2021
- 19 -
PUBLIC. This information is being disclosed to the public in accordance with ADB’s Access to Information Policy.
Provision and use of PPEs
The workers are provided with all necessary safety gears like helmets, reflective vests, boots, gloves and masks. The records of later package have been documented, and it shows a rational process and provision of PPEs.
Tunnel lighting
✓ Tunnel lights are placed at every 10 m distance
✓ Tunnel light are placed at height of 2.8 m from the floor level
✓ Power sockets, junction boxes, cable trays and cable trenches are placed as per standard specifications.
✓ At conditions when extra lights are needed at working sites, the consultant instructed the contractor’s team for additional light, and the provisions were fulfilled accordingly
Drainage inside the tunnel
There was provision of side drains in tunnel. During the construction period, sometimes there was short term concerns of accumulation of water in the drains, but with instructions from the consultant, the drainage conditions were improved. No any remarkable problem was experienced due to drainage facility inside the tunnel.
Fire safety
Fire extinguishers were planted at crucial location such as near to diesel storage tank, DG, workshops and in each camp site. However, regular checking and monitoring of fire extinguishers was found to be lacking. The contractors are made aware of this situation and in later months, they improved in regularly monitoring fire extinguishers.
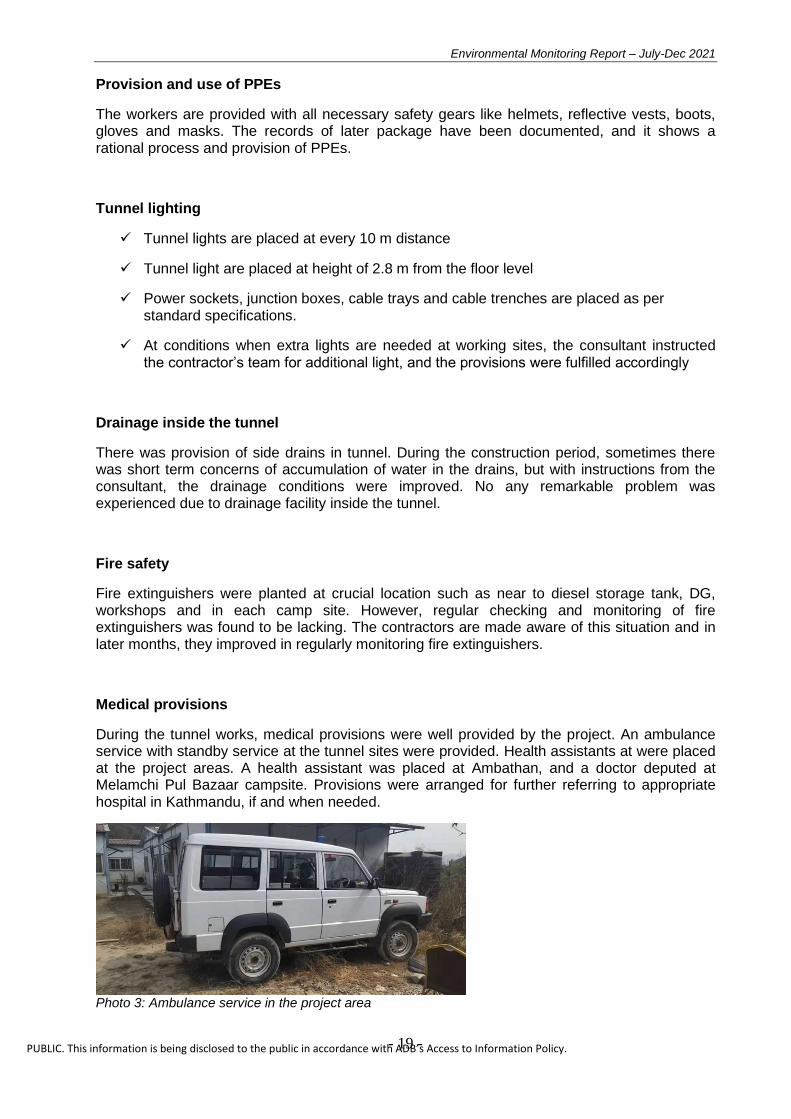
Medical provisions
During the tunnel works, medical provisions were well provided by the project. An ambulance service with standby service at the tunnel sites were provided. Health assistants at were placed at the project areas. A health assistant was placed at Ambathan, and a doctor deputed at Melamchi Pul Bazaar campsite. Provisions were arranged for further referring to appropriate hospital in Kathmandu, if and when needed.
Photo 3: Ambulance service in the project area

Environmental Monitoring Report – July-Dec 2021
- 20 -
PUBLIC. This information is being disclosed to the public in accordance with ADB’s Access to Information Policy.
Photo 5: Ambulance, provided by MWSP, in service
Photo 4: Medical facility at Ambathan site
Table 2-9: Provisions of Health facilities for the workforce
SN Particulars/Activities Provisions/Status Remarks
1
First Aid Box
1. Clinic/Dispensary at Ambathan site
2. Headworks office 3. Ambathan camp 4. Clinic/Dispensary at Gyalthum site 5. Clinic/Dispensary at Sindhu site 6. Clinic/Dispensary at Sundrijal site
First Aid Box were available at project sites
2
Medical center/facility
1. Clinic/Dispensary at Ambathan from 13th Oct, 2019 to 15th June, 2021
2. Clinic/Dispensary at Gyalthum from 13th Oct, 2019 to February, 2021
3. Clinic/Dispensary at Sindhu from 13th Oct, 2019 to February, 2021
4. Clinic/Dispensary at Sundrijal from 13th Oct, 2019 to February, 2021
Medical center/facility are available at project sites
3
Ambulance - Oxygen cylinder - First Aid Box - Stretcher
1. Ambathan site 2. Gyalthum site 3. Sindhu site 4. Sundrijal site
Ambulance available at ambathan, gyalthum, Sindhu and Sundrijal site
Environmental Monitoring Report – July-Dec 2021
- 21 -
PUBLIC. This information is being disclosed to the public in accordance with ADB’s Access to Information Policy.
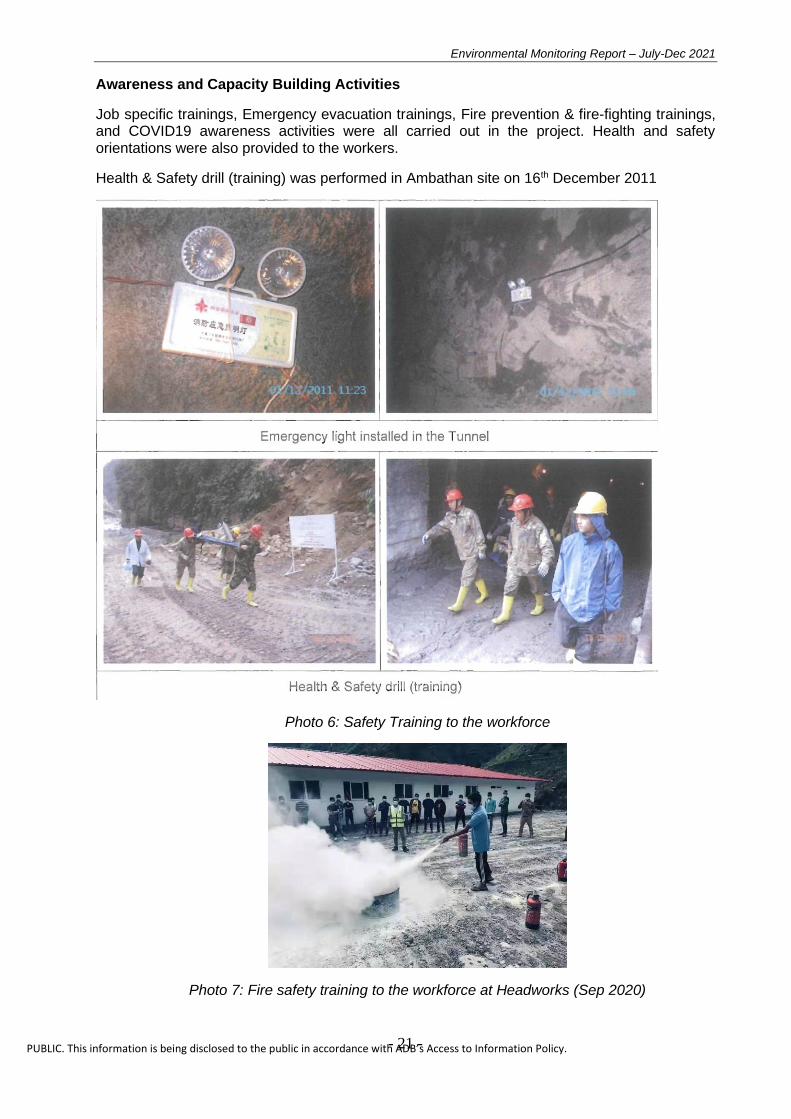
Awareness and Capacity Building Activities
Job specific trainings, Emergency evacuation trainings, Fire prevention & fire-fighting trainings, and COVID19 awareness activities were all carried out in the project. Health and safety orientations were also provided to the workers.
Health & Safety drill (training) was performed in Ambathan site on 16th December 2011
Photo 6: Safety Training to the workforce
Photo 7: Fire safety training to the workforce at Headworks (Sep 2020)

Environmental Monitoring Report – July-Dec 2021
- 22 -
PUBLIC. This information is being disclosed to the public in accordance with ADB’s Access to Information Policy.
The following table presents some records of these activities conducted by the project;
Table 2-10: Capacity building works carried out for the workforce
SN Project Site Orientation/Training & Date Date
Participants
1 Ambathan
PPE use training Dec, 2019
147 Male
2 Ambathan Safety training Jan, 2020 141 Male
3 Ambathan Job Specific Training Feb, 2020
14 Male/ 5 Female
4 Ambathan Emergency Evacuation Training March, 2020
22 Male/ 3 Female
5 Gyalthum
PPE use training Dec, 2019
31 Male
6 Gyalthum
Safety training Jan, 2020
47 Male
7 Gyalthum Job Specific Training March, 2020
26 Male/ 4 Female
8 Gyalthum Emergency Evacuation Training April, 2020
19 Male/ 2 Female
9 Sindhu PPE use training Dec, 2019
29 Male
10 Sindhu Safety training Jan, 2020
33 Male
11 Sindhu Job Specific Training Feb, 2020
15 Male/ 3 Female
12 Sindhu Emergency Evacuation Training March, 2020
19 Male/ 2 Female
13 Ambathan Fire preventing and fire fighting Sep, 2020 24 Male
14 Gyalthum Fire preventing and fire fighting Sep, 2020
25 Male/ 2 Female
15 Sindhu Fire preventing and fire fighting Sep, 2020
31 Male
16 Ambathan Covid-19 awareness orientation Oct, 2020
14 Male/ 3 Female
17 Gyalthum Covid-19 awareness orientation Oct, 2020
21Male/ 2 Female
18 Sindhu Covid-19 awareness orientation Oct, 2020
31 Male/ 2 Female
19 Sundarijal PPE use training Dec, 2019
16 Male
20 Sundarijal Safety training Jan, 2020
27 Male
Environmental Monitoring Report – July-Dec 2021
- 23 -
PUBLIC. This information is being disclosed to the public in accordance with ADB’s Access to Information Policy.
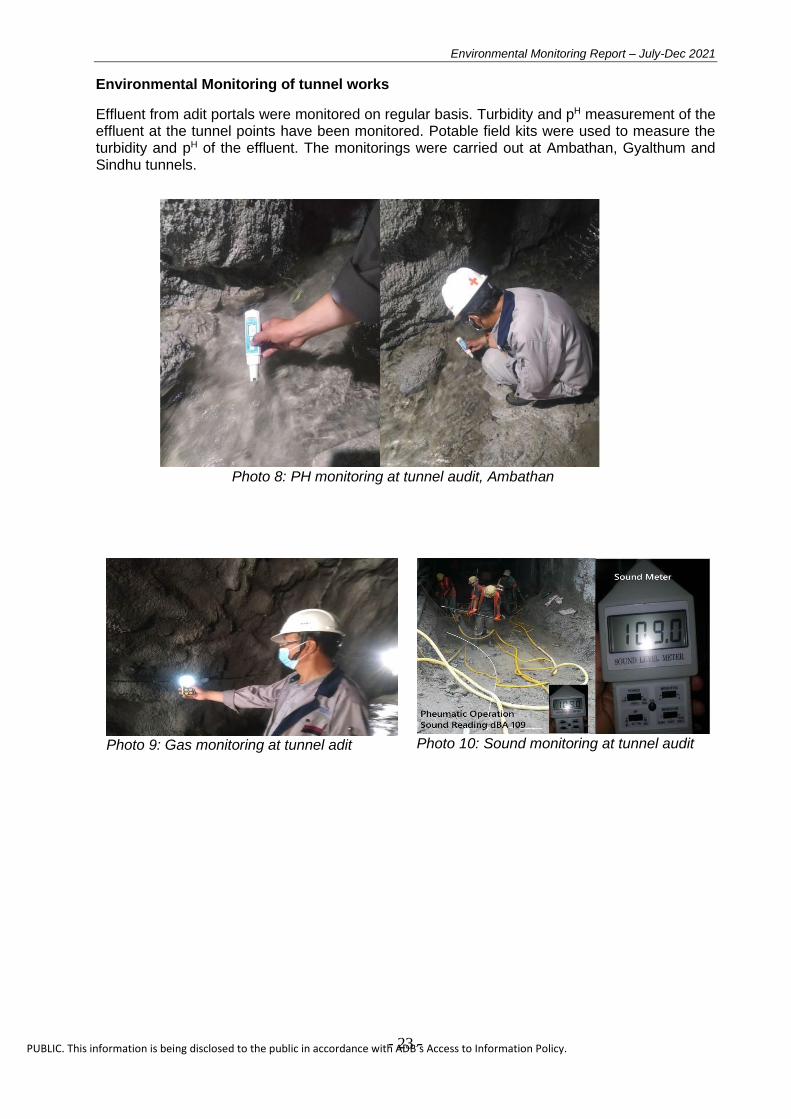
Environmental Monitoring of tunnel works
Effluent from adit portals were monitored on regular basis. Turbidity and pH measurement of the effluent at the tunnel points have been monitored. Potable field kits were used to measure the turbidity and pH of the effluent. The monitorings were carried out at Ambathan, Gyalthum and Sindhu tunnels.
Photo 8: PH monitoring at tunnel audit, Ambathan
Photo 9: Gas monitoring at tunnel adit
Photo 10: Sound monitoring at tunnel audit

Environmental Monitoring Report – July-Dec 2021
- 24 -
PUBLIC. This information is being disclosed to the public in accordance with ADB’s Access to Information Policy.
Gas monitoring and sound level monitoring works were also carried out during the tunnel works. The following table presents the sample monitoring data of the tunnel;
Table 2-11: Monitoring of air quality during the tunnel works
Date Location Activity
GAS VALUE
Comments CO 2 / Vol%
0 2/ Vol%
CO/ppm NO2/ppm
01/01/2020
AMBATHAN Schedule daily work activities 0.01 21.2 2 0.0
GYALTHUM Schedule daily work activities 0.02 21.0 4 0.0
SINDHU Schedule daily work activities 0.03 21.0 3 0.01
SUNDARIJAL Schedule daily work activities 0.02 21.2 1 0.01
05/01/2020
AMBATHAN Schedule daily work activities 0.01 21.2 2 0.02
GYALTHUM Schedule daily work activities 0.02 21.1 2 0.01
SINDHU Schedule daily work activities 0.03 21.2 2 0.02
SUNDARIJAL Schedule daily work activities 0.02 21.1 2 0.01
09/01/2020
AMBATHAN Schedule daily work activities 0.01 21.1 1 0.00
GYALTHUM Schedule daily work activities 0.02 21.0 4 0.01
SINDHU Schedule daily work activities 0.03 21.2 2 0.02
SUNDARIJAL Schedule daily work activities 0.02 21.1 2 0.01
12/01/2020
AMBATHAN Schedule daily work activities 0.01 21.4 2 0.02
GYALTHUM Schedule daily work activities 0.02 21.0 4 0.01
SINDHU Schedule daily work activities 0.03 21.2 2 0.02
SUNDARIJAL Schedule daily work activities 0.02 21.1 2 0.01
17/01/2020
AMBATHAN Schedule daily work activities 0.01 21.5 0 0.02
GYALTHUM Schedule daily work activities 0.02 21 4 0.01
SINDHU Schedule daily work activities 0.03 21.2 2 0.02
SUNDARIJAL Schedule daily work activities 0.02 21.1 2 0.01
20/01/2020
AMBATHAN Schedule daily work activities 0.03 21 2 0.02
GYALTHUM Schedule daily work activities 0.02 21 4 0.01
SINDHU Schedule daily work activities 0.03 21.1 2 0.02
SUNDARIJAL Schedule daily work activities 0.02 21 2 0.01
24/01/2020
AMBATHAN Schedule daily work activities 0.00 21.4 0 0.02
GYALTHUM Schedule daily work activities 0.02 21 3 0.01
SINDHU Schedule daily work activities 0.01 21.3 2 0.02
SUNDARIJAL Schedule daily work activities 0.02 21.1 2 0.01
27/01/2020
AMBATHAN Schedule daily work activities 0.00 21.4 3 0.02
GYALTHUM Schedule daily work activities 0.02 21 4 0.01
SINDHU Schedule daily work activities 0.03 21.2 2 0.02
SUNDARIJAL Schedule daily work activities 0.02 21.1 2 0.01
31/01/2020
AMBATHAN Schedule daily work activities 0.01 21.2 2 0.02
GYALTHUM Schedule daily work activities 0.02 21 4 0.01
SINDHU Schedule daily work activities 0.03 21.2 2 0.02
SUNDARIJAL Schedule daily work activities 0.02 21.2 0 0.01
Environmental Monitoring Report – July-Dec 2021
- 25 -
PUBLIC. This information is being disclosed to the public in accordance with ADB’s Access to Information Policy.
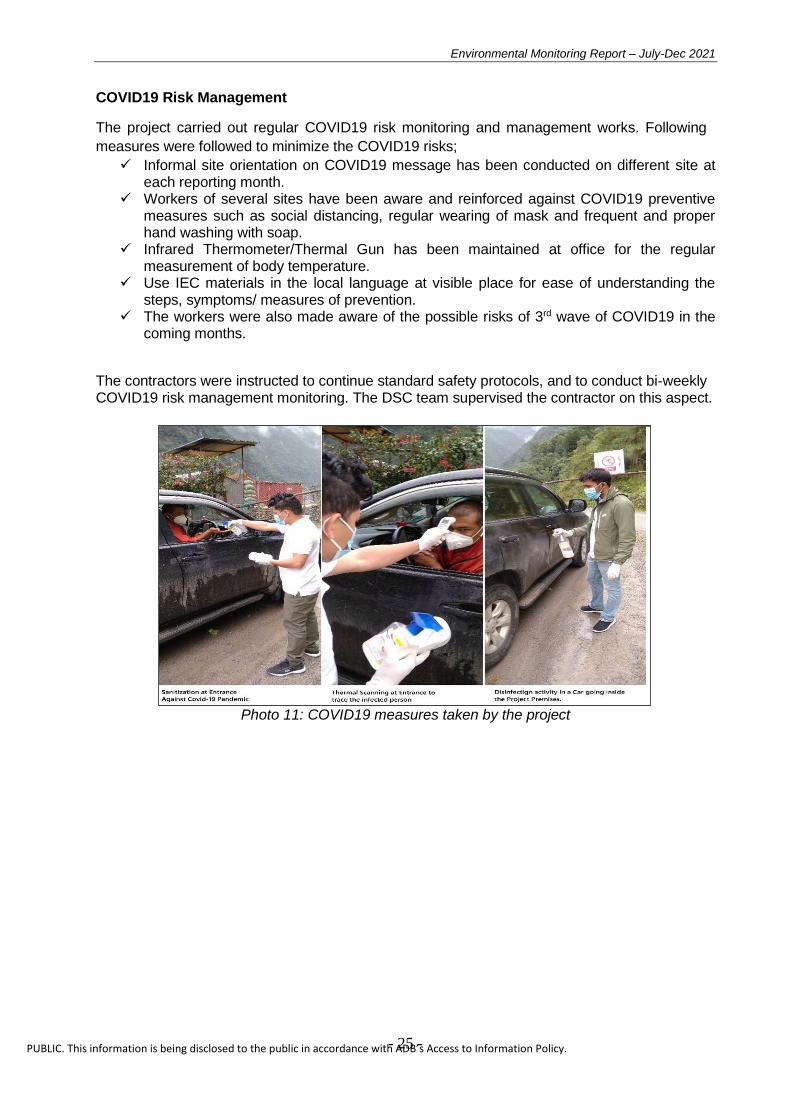
COVID19 Risk Management
The project carried out regular COVID19 risk monitoring and management works. Following
measures were followed to minimize the COVID19 risks;
✓ Informal site orientation on COVID19 message has been conducted on different site at each reporting month.
✓ Workers of several sites have been aware and reinforced against COVID19 preventive measures such as social distancing, regular wearing of mask and frequent and proper hand washing with soap.
✓ Infrared Thermometer/Thermal Gun has been maintained at office for the regular measurement of body temperature.
✓ Use IEC materials in the local language at visible place for ease of understanding the steps, symptoms/ measures of prevention.
✓ The workers were also made aware of the possible risks of 3rd wave of COVID19 in the coming months.
The contractors were instructed to continue standard safety protocols, and to conduct bi-weekly COVID19 risk management monitoring. The DSC team supervised the contractor on this aspect.
Photo 11: COVID19 measures taken by the project

Environmental Monitoring Report – July-Dec 2021
- 26 -
PUBLIC. This information is being disclosed to the public in accordance with ADB’s Access to Information Policy.
2.2.1.8 Other Aspects of Compliance Monitoring
(A) Spoil Management
With due considerations so as to prevent disposal of spoil onto water bodies, and so as to prevent any nuisance to the local communities due to haphazard disposal of the spoil, the project has well addressed the concerns of managing spoil generated during the construction works. The client provided approval for the proposed spoil disposal sites, and the contractor managed the spoil in the proposed sites under supervision of the consultant. There were a total of 21 spoil tips in the sites of MAR, SAAR, GAAR and UAR. Some of the interesting and successful cases of spoil management and land reclamation are;
The spoil generated from Sindhu area of SAAR was managed in several spoil tip sites. Among these was a spoil tip number 9. Since the site was well accessible, and the site also had a nearby stream for water piping, the site was deemed suitable for establishment of a plant nursery. Hence, a full-fledged forest nursery of production capacity of 30,000 saplings was established in the spoil tip. The saplings produced from this nursery were distributed to the concerned community forests in coordination with the district forest office as a part of compensatory greenery promotion and replantation.
Similarly, the spoil from Talamarang area was managed for disposal at back yard of Tershe Nimna Madyamik School. The spoil was disposed there, and land reclamation was done by the school for future use for construction of school building. The school requested the project for protection work at toe of spoil tip site. Hence the project constructed toe protection structure in order to protect the reclaimed land from erosion.
In Sundarijal site, two spoil tip site were identified and acquired. However, only 1 was used. In the used spoil tip, the contractor has installed a drainage culvert. Toe protection has been carried out by placing gabion protections near Dhakal khahare.
(B) Waste hauling
Some segregation at source, and pit composting were carried out. But, the records are
not well maintained. There have been reports of scattered waste - specially at the
Ambathan site.
(C) Water Sprinkling
To control the dust pollution, water sprinkling has been carried out in project sites. This
measure was focused at the Headworks camp site, and Dam site camp.
Photo 12: Start of nursery development in spoil tip 9, Sindhu
Environmental Monitoring Report – July-Dec 2021
- 27 -
PUBLIC. This information is being disclosed to the public in accordance with ADB’s Access to Information Policy.
2.2.2 Environmental Mitigation Works
The project carried out mitigation works for the impacts on physical, biological and social aspects of the local environment. Most of the mitigation works have been conducted through direct involvement of the local stakeholders and communities.
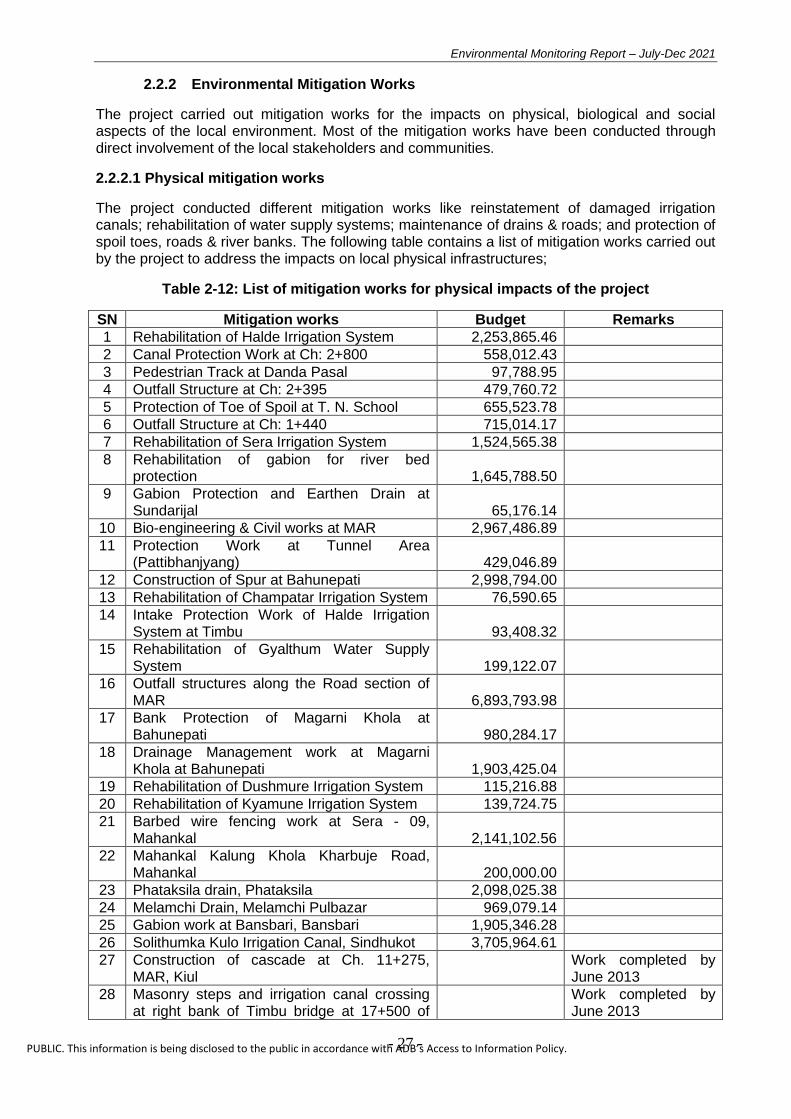
2.2.2.1 Physical mitigation works
The project conducted different mitigation works like reinstatement of damaged irrigation canals; rehabilitation of water supply systems; maintenance of drains & roads; and protection of spoil toes, roads & river banks. The following table contains a list of mitigation works carried out by the project to address the impacts on local physical infrastructures;
Table 2-12: List of mitigation works for physical impacts of the project
SN Mitigation works Budget Remarks
1 Rehabilitation of Halde Irrigation System 2,253,865.46
2 Canal Protection Work at Ch: 2+800 558,012.43
3 Pedestrian Track at Danda Pasal 97,788.95
4 Outfall Structure at Ch: 2+395 479,760.72
5 Protection of Toe of Spoil at T. N. School 655,523.78
6 Outfall Structure at Ch: 1+440 715,014.17
7 Rehabilitation of Sera Irrigation System 1,524,565.38
8 Rehabilitation of gabion for river bed protection 1,645,788.50
9 Gabion Protection and Earthen Drain at Sundarijal 65,176.14
10 Bio-engineering & Civil works at MAR 2,967,486.89
11 Protection Work at Tunnel Area (Pattibhanjyang) 429,046.89
12 Construction of Spur at Bahunepati 2,998,794.00
13 Rehabilitation of Champatar Irrigation System 76,590.65
14 Intake Protection Work of Halde Irrigation System at Timbu 93,408.32
15 Rehabilitation of Gyalthum Water Supply System 199,122.07
16 Outfall structures along the Road section of MAR 6,893,793.98
17 Bank Protection of Magarni Khola at Bahunepati 980,284.17
18 Drainage Management work at Magarni Khola at Bahunepati 1,903,425.04
19 Rehabilitation of Dushmure Irrigation System 115,216.88
20 Rehabilitation of Kyamune Irrigation System 139,724.75
21 Barbed wire fencing work at Sera - 09, Mahankal 2,141,102.56
22 Mahankal Kalung Khola Kharbuje Road, Mahankal 200,000.00
23 Phataksila drain, Phataksila 2,098,025.38
24 Melamchi Drain, Melamchi Pulbazar 969,079.14
25 Gabion work at Bansbari, Bansbari 1,905,346.28
26 Solithumka Kulo Irrigation Canal, Sindhukot 3,705,964.61
27 Construction of cascade at Ch. 11+275, MAR, Kiul
Work completed by June 2013
28 Masonry steps and irrigation canal crossing at right bank of Timbu bridge at 17+500 of
Work completed by June 2013

Environmental Monitoring Report – July-Dec 2021
- 28 -
PUBLIC. This information is being disclosed to the public in accordance with ADB’s Access to Information Policy.
MAR, Helambu
29 Canal maintenance at Talamarang-5
As per report of Jan – April 2013, work to be started immediately
30 Timbu-Kakani-Tarkeghyang-Ghyngul-Tashithang Road wall and soling 1,121,600.00
31 Timbngu-Doring-Kharchung-Nakote Road construction, maintenance and track construction 891,550.00
32 Chhendenche-Tangedhing-Pumbache Road Constructoin, Helambu-1 1,500,000.00
33 Elmunesa-Nakote-Melamchughyang road construction, wall and soling 1,300,000.00
34 Dhapkharka-Nimdombu road wall and soling 200,000.00
35 Barbed wire fencing work at Sera, Mahankal-9 1,092,644.09
36 Mahankal Kalung khola khajure road reinstatement works 100,000.00
37 Phataksila drain reinstatement works 1,057,601.20
38 Melamchi drain reinstatement works 485,529.54
39 Gabion protection works at Bansbari 996,312.03
40 Irrigation canal reinstatement - Solithumka kulo bichko kulo, Sindhukot-2 1,888,653.91
41 Dahapojhari-Salme Danda Kateri Irrigation canal maintenance 1,463,095.93
42 Ghate Fokta Irrigation Canal maintenance 337,997.34
43 Lavagaon-Halo katne Danda road reinstatement 1,086,141.07
44 Gyalthum Baluwa drain construction 831,384.03
Source: Progress reports & PCR documents of EMP & SSDS consultants,
In total, Survey, design, cost estimation and construction supervision of slope stability and drainage management works were carried out along MAR and AARs at 23 places, and Survey, design, cost estimation and construction supervision of gully control works and drainage outfall were carried out along MAR and AARs through construction of 13 drainage outfall and gully control at 7 places. Also, mitigation works were carried out under HSMVSUP, MVSUP and HUP committees.

Environmental Monitoring Report – July-Dec 2021
- 29 -
PUBLIC. This information is being disclosed to the public in accordance with ADB’s Access to Information Policy.
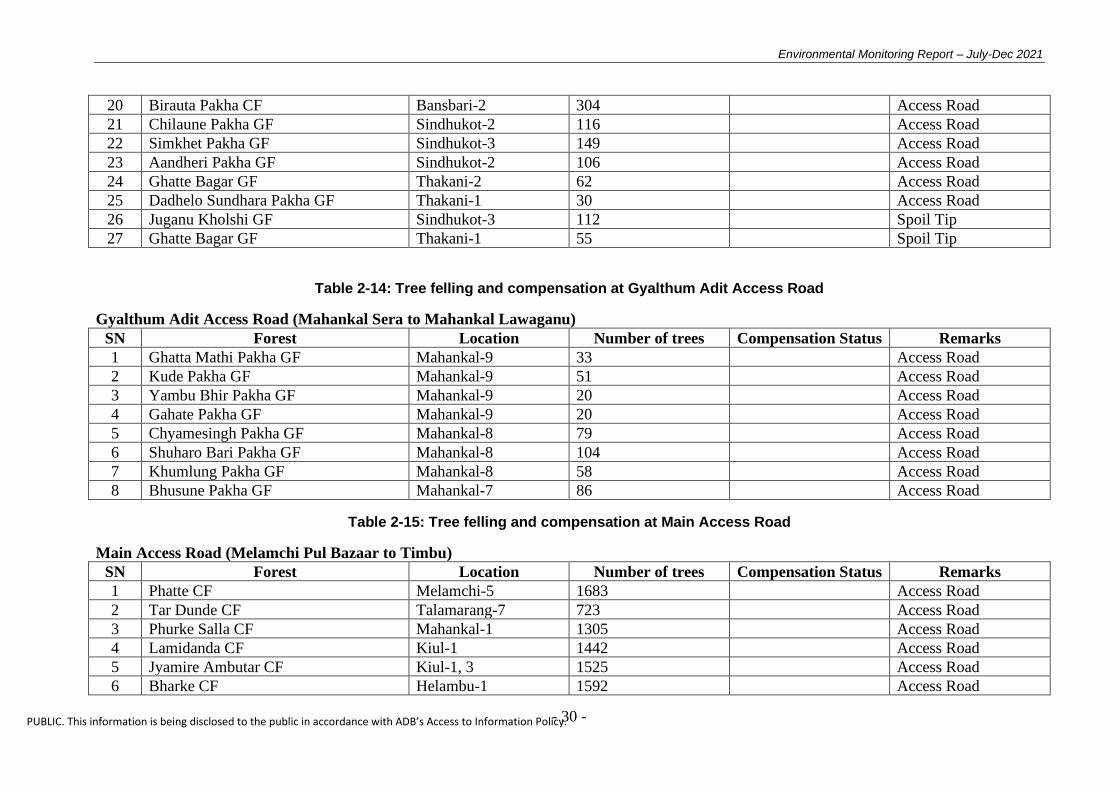
2.2.2.2 Tree felling and Compensation
Records of Trees Felled under Community Forests, and Compensatory Plantation
Compensatory plantation was carried out by the project. There was a total of 25,093 number trees felled during the project implementation of Phase I of the project.
Upon the clearance of the forest trees, the CFUGs were provided compensation as per clause 2/2.1 and 6/6.3 of Resettlement Policy of MWSDB, 2059 and as per the recommendation of CDC, Sindhupalchwok district. Details of the trees felled at different project sites are listed in the table below;
Table 2-13: Tree felling and compensation at Sindhu Adit Access Road
Sindhu Adit Access Road (Bahunepati to Thakani Kaule)
SN Forest Location Number of trees Compensation Status Remarks
1 Jamune Pakha CF Bansabari-2 263 Completed Access Road
2 Lose Pakha CF Bansabari-2 436 Completed Access Road
3 Birauta Pakha CF Bansabari-2 525 Completed Access Road
4 Bidhyalaya CF Bansabari-3 387 Completed Access Road
5 Bhumesthan CF Bansabari-9 1777 Completed Access Road
6 Salbisauna CF Bansabari-8 652 Completed Access Road
7 Thulichouri CF Thakani-2 633 Completed Access Road
8 Jamune Pakha CF Bansabari-2 1116 Completed Spoil Tip
9 Bhumesthan CF Bansabari-9 2134 Completed Spoil Tip
10 Salbisauna CF Bansabari-8 2251 Completed Spoil Tip
11 Thulichouri CF Thakani-3 1889 Completed Spoil Tip
12 Chilaune Pakha CF Sindhukot-2 229 Completed Spoil Tip
13 Patichouri CF Sindhukot-3 143 Completed Spoil Tip
14 Birauta Pakha CF Bansbari-2 304 Completed Access Road
15 Jamune Pakha CF Bansbari-2 62 Spoil Tip
16 Bhumesthan CF Bansbari-9 349 Spoil Tip
17 Salbisauna CF Bansabari-8 380 Spoil Tip
18 Chilaune Pakha CF Sindhukot-2 224 Spoil Tip
19 Patichouri CF Sindhukot-3 43 Spoil Tip
Environmental Monitoring Report – July-Dec 2021
- 30 -
PUBLIC. This information is being disclosed to the public in accordance with ADB’s Access to Information Policy.
20 Birauta Pakha CF Bansbari-2 304 Access Road
21 Chilaune Pakha GF Sindhukot-2 116 Access Road
22 Simkhet Pakha GF Sindhukot-3 149 Access Road
23 Aandheri Pakha GF Sindhukot-2 106 Access Road
24 Ghatte Bagar GF Thakani-2 62 Access Road
25 Dadhelo Sundhara Pakha GF Thakani-1 30 Access Road
26 Juganu Kholshi GF Sindhukot-3 112 Spoil Tip
27 Ghatte Bagar GF Thakani-1 55 Spoil Tip
Table 2-14: Tree felling and compensation at Gyalthum Adit Access Road
Gyalthum Adit Access Road (Mahankal Sera to Mahankal Lawaganu)
SN Forest Location Number of trees Compensation Status Remarks
1 Ghatta Mathi Pakha GF Mahankal-9 33 Access Road
2 Kude Pakha GF Mahankal-9 51 Access Road
3 Yambu Bhir Pakha GF Mahankal-9 20 Access Road
4 Gahate Pakha GF Mahankal-9 20 Access Road
5 Chyamesingh Pakha GF Mahankal-8 79 Access Road
6 Shuharo Bari Pakha GF Mahankal-8 104 Access Road
7 Khumlung Pakha GF Mahankal-8 58 Access Road
8 Bhusune Pakha GF Mahankal-7 86 Access Road
Table 2-15: Tree felling and compensation at Main Access Road
Main Access Road (Melamchi Pul Bazaar to Timbu)
SN Forest Location Number of trees Compensation Status Remarks
1 Phatte CF Melamchi-5 1683 Access Road
2 Tar Dunde CF Talamarang-7 723 Access Road
3 Phurke Salla CF Mahankal-1 1305 Access Road
4 Lamidanda CF Kiul-1 1442 Access Road
5 Jyamire Ambutar CF Kiul-1, 3 1525 Access Road
6 Bharke CF Helambu-1 1592 Access Road
Environmental Monitoring Report – July-Dec 2021
- 31 -
PUBLIC. This information is being disclosed to the public in accordance with ADB’s Access to Information Policy.
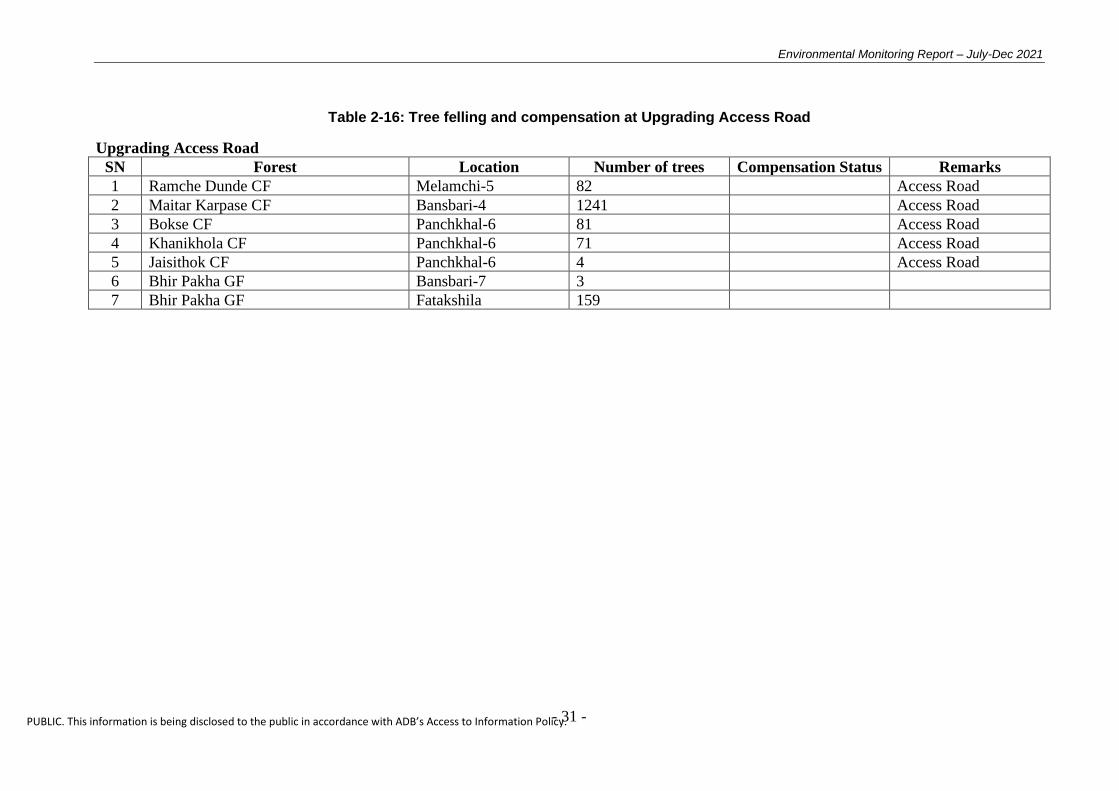
Table 2-16: Tree felling and compensation at Upgrading Access Road
Upgrading Access Road
SN Forest Location Number of trees Compensation Status Remarks
1 Ramche Dunde CF Melamchi-5 82 Access Road
2 Maitar Karpase CF Bansbari-4 1241 Access Road
3 Bokse CF Panchkhal-6 81 Access Road
4 Khanikhola CF Panchkhal-6 71 Access Road
5 Jaisithok CF Panchkhal-6 4 Access Road
6 Bhir Pakha GF Bansbari-7 3
7 Bhir Pakha GF Fatakshila 159
Environmental Monitoring Report – July-Dec 2021
- 32 -
PUBLIC. This information is being disclosed to the public in accordance with ADB’s Access to Information Policy.
2.2.2.3 Compensation paid to traditional water mills
The project conducted a detailed assessment of the traditional water mills being operated in the project area downstream of Melamchi river. During the project’s construction works, some water mills were partially damaged, some were totally damaged, and in some cases - only the operation of water mills was disturbed for some time. Hence, the impacts are varying.
Out of 14 project affected VDCs, 8 VDCs come under Water Use Impact Zone due to direct impact of diversion of water from Melamchi River. Based on the claims made by the locals and based on the assessment and evaluation made by the Resettlement Team of MWSP, compensations have been paid according to the standard norms. In total, NRs 18,09,362.40 has been paid as compensation to the affected stakeholders, which included 13 water mills.
Table 2-17: Damage to and compensation for water mills
SN Name Address Number of Mill
Nature of damage
Compensation value
Water Source
1 Nar Bahadur Thapa Talamarang-6
1 Damaged
71159.40 Melamchi river
2 Raja Kumar Lamichhane
Mahankal-9 1 Damaged
137648.20 Gyalthum Khola
3 Dal Bahadur Jyoti Kiul-1 2
Damaged
1101538.80 Melamchi river
4 Durga Bdr. Aryal Talamarang-6
2 Damaged
133461.00 Nuhar khola
5 Min Kumari Lamichhane
Melamchi-8 1 Damaged
66785.00 Melamchi river
6 Ram Prashad Dulal Melamchi-8 1 Damaged 66785.00 Melamchi river
7 Chhatra Bdr. Karki Melamchi-8 1 Damaged
71159.00 Nuharkhola river
8 Bhim Lamichhane Mahankal-1 1 Damaged
71159.00 Gyalthum Khola
9 Bed Prasad Lamichhane
Mahankal-1 1 Damaged
71159.00 Melamchi river
10 Tej Prasad Lamichhane
Mahankal-9 1 3 months'
disturbance 9254.00
Sanogohore river
11 Bir Bdr Tamang Bansbari-8 1 Only canal damaged
9254.00 Sindhukhola river
13 1809362.40
Source: Resettlement Team, MWSDB
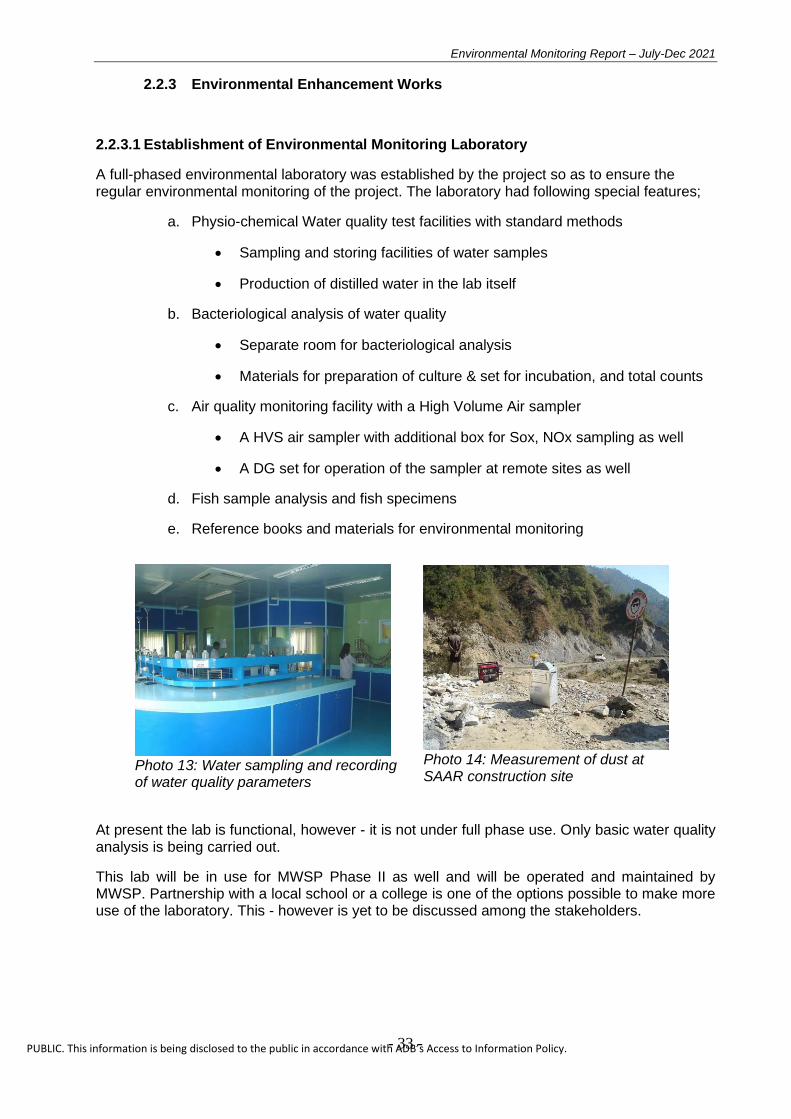
Environmental Monitoring Report – July-Dec 2021
- 33 -
PUBLIC. This information is being disclosed to the public in accordance with ADB’s Access to Information Policy.
Photo 14: Measurement of dust at SAAR construction site
Photo 13: Water sampling and recording of water quality parameters
2.2.3 Environmental Enhancement Works
2.2.3.1 Establishment of Environmental Monitoring Laboratory
A full-phased environmental laboratory was established by the project so as to ensure the regular environmental monitoring of the project. The laboratory had following special features;
a. Physio-chemical Water quality test facilities with standard methods
• Sampling and storing facilities of water samples
• Production of distilled water in the lab itself
b. Bacteriological analysis of water quality
• Separate room for bacteriological analysis
• Materials for preparation of culture & set for incubation, and total counts
c. Air quality monitoring facility with a High Volume Air sampler
• A HVS air sampler with additional box for Sox, NOx sampling as well
• A DG set for operation of the sampler at remote sites as well
d. Fish sample analysis and fish specimens
e. Reference books and materials for environmental monitoring
At present the lab is functional, however - it is not under full phase use. Only basic water quality analysis is being carried out.
This lab will be in use for MWSP Phase II as well and will be operated and maintained by MWSP. Partnership with a local school or a college is one of the options possible to make more use of the laboratory. This - however is yet to be discussed among the stakeholders.
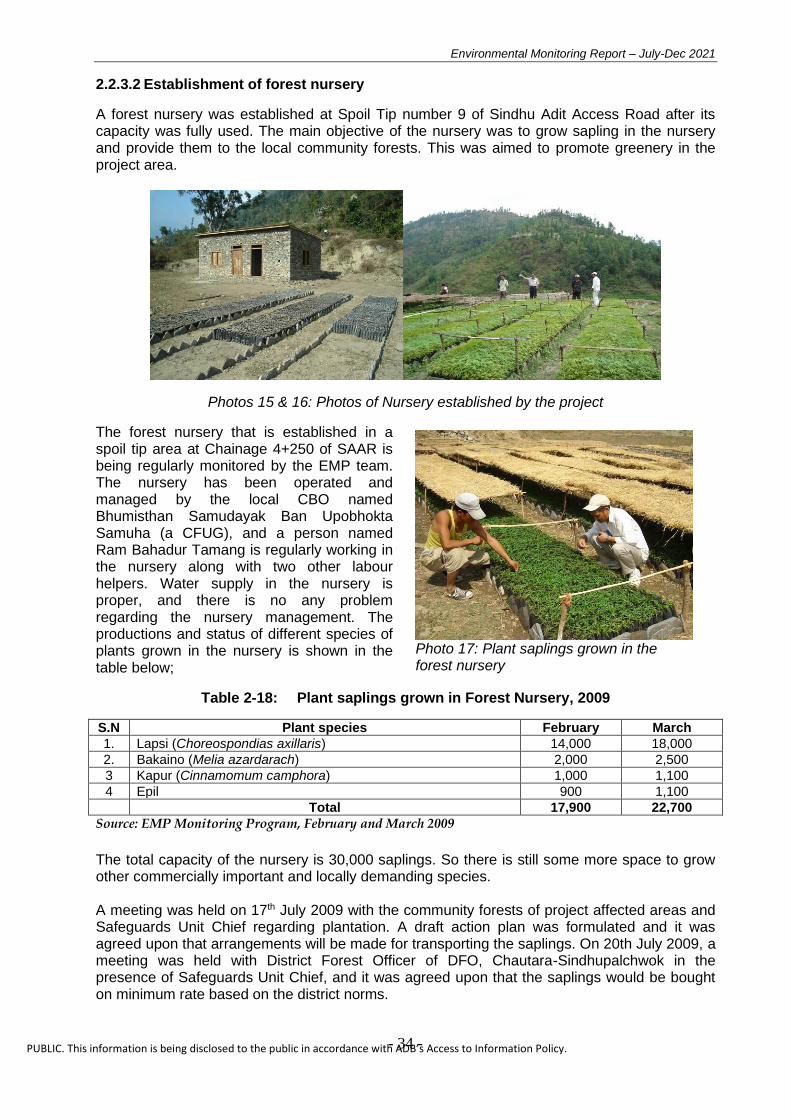
Environmental Monitoring Report – July-Dec 2021
- 34 -
PUBLIC. This information is being disclosed to the public in accordance with ADB’s Access to Information Policy.
Photo 17: Plant saplings grown in the forest nursery
2.2.3.2 Establishment of forest nursery
A forest nursery was established at Spoil Tip number 9 of Sindhu Adit Access Road after its capacity was fully used. The main objective of the nursery was to grow sapling in the nursery and provide them to the local community forests. This was aimed to promote greenery in the project area.
Photos 15 & 16: Photos of Nursery established by the project
The forest nursery that is established in a spoil tip area at Chainage 4+250 of SAAR is being regularly monitored by the EMP team. The nursery has been operated and managed by the local CBO named Bhumisthan Samudayak Ban Upobhokta Samuha (a CFUG), and a person named Ram Bahadur Tamang is regularly working in the nursery along with two other labour helpers. Water supply in the nursery is proper, and there is no any problem regarding the nursery management. The productions and status of different species of plants grown in the nursery is shown in the table below;
Table 2-18: Plant saplings grown in Forest Nursery, 2009
S.N Plant species February March
1. Lapsi (Choreospondias axillaris) 14,000 18,000
2. Bakaino (Melia azardarach) 2,000 2,500
3 Kapur (Cinnamomum camphora) 1,000 1,100
4 Epil 900 1,100
Total 17,900 22,700
Source: EMP Monitoring Program, February and March 2009
The total capacity of the nursery is 30,000 saplings. So there is still some more space to grow other commercially important and locally demanding species. A meeting was held on 17th July 2009 with the community forests of project affected areas and Safeguards Unit Chief regarding plantation. A draft action plan was formulated and it was agreed upon that arrangements will be made for transporting the saplings. On 20th July 2009, a meeting was held with District Forest Officer of DFO, Chautara-Sindhupalchwok in the presence of Safeguards Unit Chief, and it was agreed upon that the saplings would be bought on minimum rate based on the district norms.
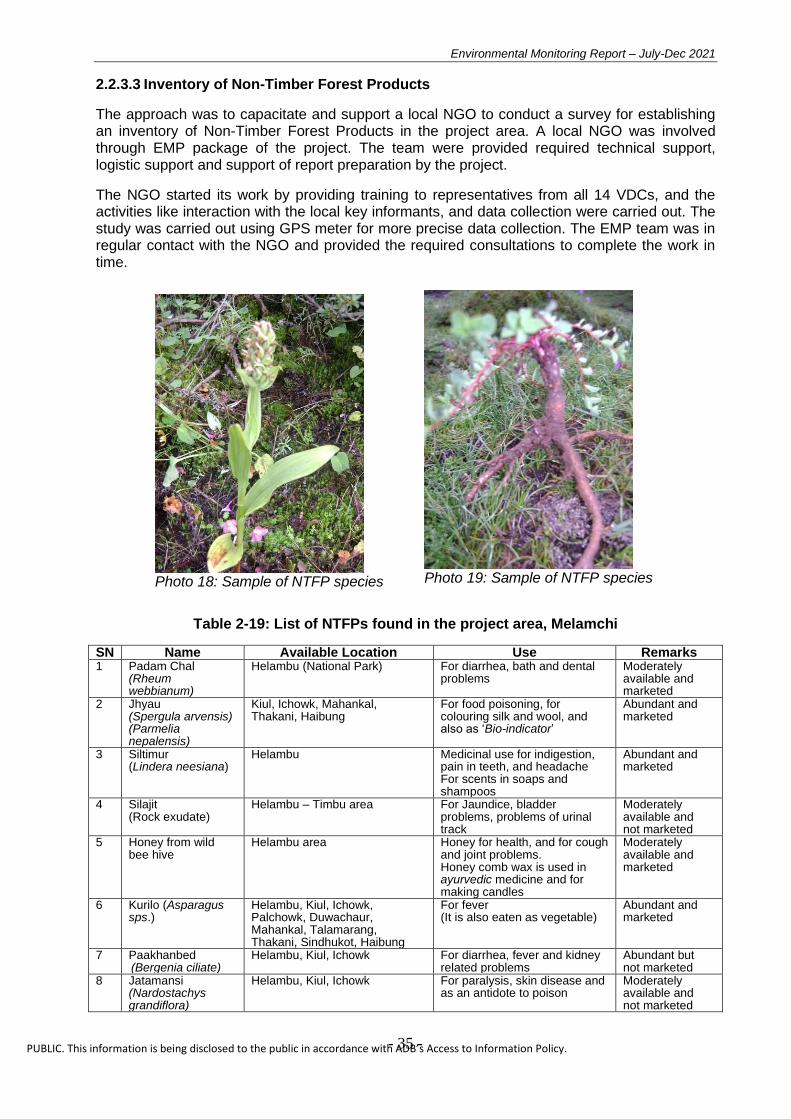
Environmental Monitoring Report – July-Dec 2021
- 35 -
PUBLIC. This information is being disclosed to the public in accordance with ADB’s Access to Information Policy.
Photo 18: Sample of NTFP species
Photo 19: Sample of NTFP species
2.2.3.3 Inventory of Non-Timber Forest Products
The approach was to capacitate and support a local NGO to conduct a survey for establishing an inventory of Non-Timber Forest Products in the project area. A local NGO was involved through EMP package of the project. The team were provided required technical support, logistic support and support of report preparation by the project.
The NGO started its work by providing training to representatives from all 14 VDCs, and the activities like interaction with the local key informants, and data collection were carried out. The study was carried out using GPS meter for more precise data collection. The EMP team was in regular contact with the NGO and provided the required consultations to complete the work in time.
Table 2-19: List of NTFPs found in the project area, Melamchi
SN Name Available Location Use Remarks 1 Padam Chal
(Rheum webbianum)
Helambu (National Park) For diarrhea, bath and dental problems
Moderately available and marketed
2 Jhyau (Spergula arvensis) (Parmelia nepalensis)
Kiul, Ichowk, Mahankal, Thakani, Haibung
For food poisoning, for colouring silk and wool, and also as ‘Bio-indicator’
Abundant and marketed
3 Siltimur (Lindera neesiana)
Helambu Medicinal use for indigestion, pain in teeth, and headache For scents in soaps and shampoos
Abundant and marketed
4 Silajit (Rock exudate)
Helambu – Timbu area For Jaundice, bladder problems, problems of urinal track
Moderately available and not marketed
5 Honey from wild bee hive
Helambu area Honey for health, and for cough and joint problems. Honey comb wax is used in ayurvedic medicine and for making candles
Moderately available and marketed
6 Kurilo (Asparagus sps.)
Helambu, Kiul, Ichowk, Palchowk, Duwachaur, Mahankal, Talamarang, Thakani, Sindhukot, Haibung
For fever (It is also eaten as vegetable)
Abundant and marketed
7 Paakhanbed (Bergenia ciliate)
Helambu, Kiul, Ichowk For diarrhea, fever and kidney related problems
Abundant but not marketed
8 Jatamansi (Nardostachys grandiflora)
Helambu, Kiul, Ichowk For paralysis, skin disease and as an antidote to poison
Moderately available and not marketed
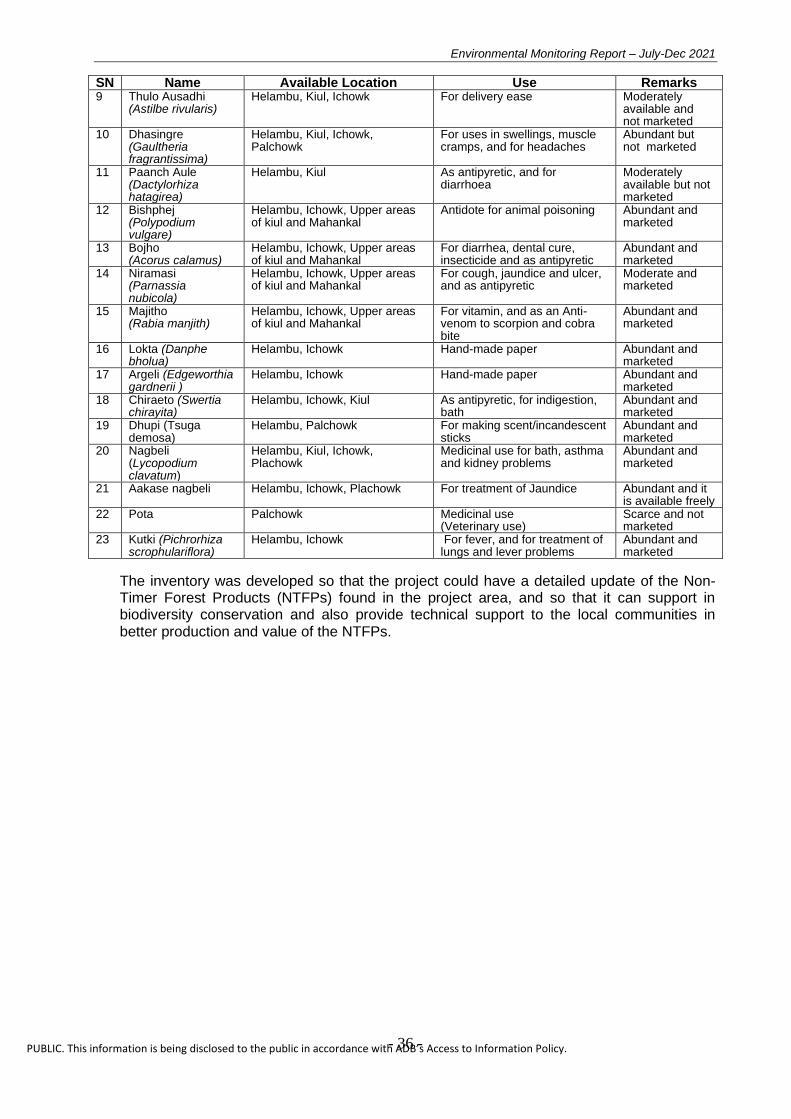
Environmental Monitoring Report – July-Dec 2021
- 36 -
PUBLIC. This information is being disclosed to the public in accordance with ADB’s Access to Information Policy.
SN Name Available Location Use Remarks 9 Thulo Ausadhi
(Astilbe rivularis) Helambu, Kiul, Ichowk For delivery ease Moderately
available and not marketed
10 Dhasingre (Gaultheria fragrantissima)
Helambu, Kiul, Ichowk, Palchowk
For uses in swellings, muscle cramps, and for headaches
Abundant but not marketed
11 Paanch Aule (Dactylorhiza hatagirea)
Helambu, Kiul As antipyretic, and for diarrhoea
Moderately available but not marketed
12 Bishphej (Polypodium vulgare)
Helambu, Ichowk, Upper areas of kiul and Mahankal
Antidote for animal poisoning Abundant and marketed
13 Bojho (Acorus calamus)
Helambu, Ichowk, Upper areas of kiul and Mahankal
For diarrhea, dental cure, insecticide and as antipyretic
Abundant and marketed
14 Niramasi (Parnassia nubicola)
Helambu, Ichowk, Upper areas of kiul and Mahankal
For cough, jaundice and ulcer, and as antipyretic
Moderate and marketed
15 Majitho (Rabia manjith)
Helambu, Ichowk, Upper areas of kiul and Mahankal
For vitamin, and as an Anti-venom to scorpion and cobra bite
Abundant and marketed
16 Lokta (Danphe bholua)
Helambu, Ichowk Hand-made paper Abundant and marketed
17 Argeli (Edgeworthia gardnerii )
Helambu, Ichowk Hand-made paper Abundant and marketed
18 Chiraeto (Swertia chirayita)
Helambu, Ichowk, Kiul As antipyretic, for indigestion, bath
Abundant and marketed
19 Dhupi (Tsuga demosa)
Helambu, Palchowk For making scent/incandescent sticks
Abundant and marketed
20 Nagbeli (Lycopodium clavatum)
Helambu, Kiul, Ichowk, Plachowk
Medicinal use for bath, asthma and kidney problems
Abundant and marketed
21 Aakase nagbeli Helambu, Ichowk, Plachowk For treatment of Jaundice Abundant and it is available freely
22 Pota Palchowk Medicinal use (Veterinary use)
Scarce and not marketed
23 Kutki (Pichrorhiza scrophulariflora)
Helambu, Ichowk For fever, and for treatment of lungs and lever problems
Abundant and marketed
The inventory was developed so that the project could have a detailed update of the Non-Timer Forest Products (NTFPs) found in the project area, and so that it can support in biodiversity conservation and also provide technical support to the local communities in better production and value of the NTFPs.
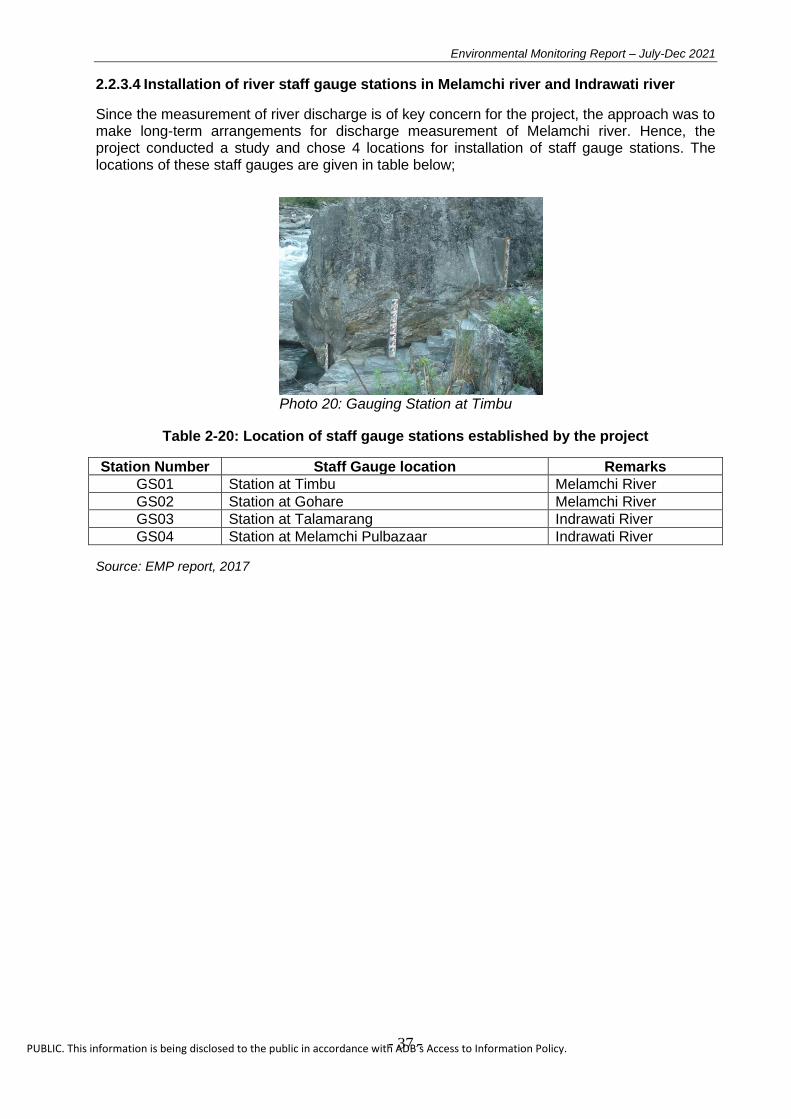
Environmental Monitoring Report – July-Dec 2021
- 37 -
PUBLIC. This information is being disclosed to the public in accordance with ADB’s Access to Information Policy.
2.2.3.4 Installation of river staff gauge stations in Melamchi river and Indrawati river
Since the measurement of river discharge is of key concern for the project, the approach was to make long-term arrangements for discharge measurement of Melamchi river. Hence, the project conducted a study and chose 4 locations for installation of staff gauge stations. The locations of these staff gauges are given in table below;
Table 2-20: Location of staff gauge stations established by the project
Station Number Staff Gauge location Remarks
GS01 Station at Timbu Melamchi River
GS02 Station at Gohare Melamchi River
GS03 Station at Talamarang Indrawati River
GS04 Station at Melamchi Pulbazaar Indrawati River
Source: EMP report, 2017
Photo 20: Gauging Station at Timbu
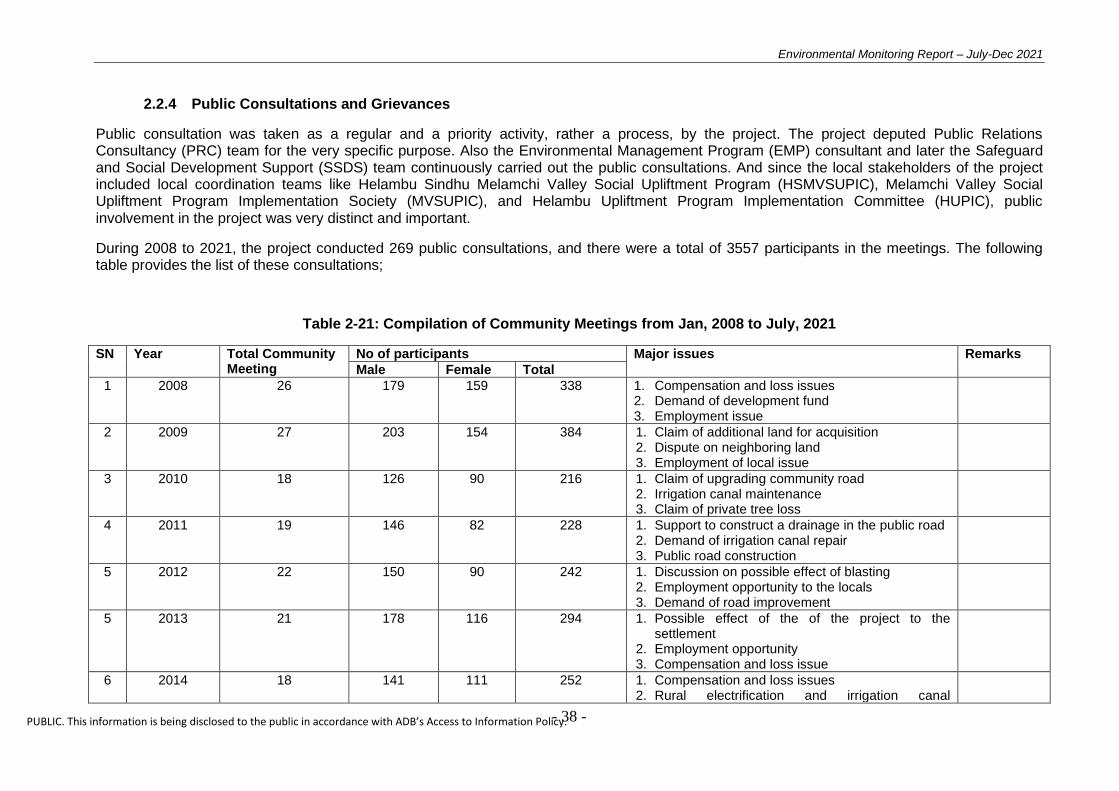
Environmental Monitoring Report – July-Dec 2021
- 38 -
PUBLIC. This information is being disclosed to the public in accordance with ADB’s Access to Information Policy.
2.2.4 Public Consultations and Grievances
Public consultation was taken as a regular and a priority activity, rather a process, by the project. The project deputed Public Relations Consultancy (PRC) team for the very specific purpose. Also the Environmental Management Program (EMP) consultant and later the Safeguard and Social Development Support (SSDS) team continuously carried out the public consultations. And since the local stakeholders of the project included local coordination teams like Helambu Sindhu Melamchi Valley Social Upliftment Program (HSMVSUPIC), Melamchi Valley Social Upliftment Program Implementation Society (MVSUPIC), and Helambu Upliftment Program Implementation Committee (HUPIC), public involvement in the project was very distinct and important.
During 2008 to 2021, the project conducted 269 public consultations, and there were a total of 3557 participants in the meetings. The following table provides the list of these consultations;
Table 2-21: Compilation of Community Meetings from Jan, 2008 to July, 2021
SN Year Total Community Meeting
No of participants Major issues Remarks
Male Female Total
1 2008 26 179 159 338 1. Compensation and loss issues 2. Demand of development fund 3. Employment issue
2 2009 27 203 154 384 1. Claim of additional land for acquisition 2. Dispute on neighboring land 3. Employment of local issue
3 2010 18 126 90 216 1. Claim of upgrading community road 2. Irrigation canal maintenance 3. Claim of private tree loss
4 2011 19 146 82 228 1. Support to construct a drainage in the public road 2. Demand of irrigation canal repair 3. Public road construction
5 2012 22 150 90 242 1. Discussion on possible effect of blasting 2. Employment opportunity to the locals 3. Demand of road improvement
5 2013 21 178 116 294 1. Possible effect of the of the project to the settlement
2. Employment opportunity 3. Compensation and loss issue
6 2014 18 141 111 252 1. Compensation and loss issues 2. Rural electrification and irrigation canal
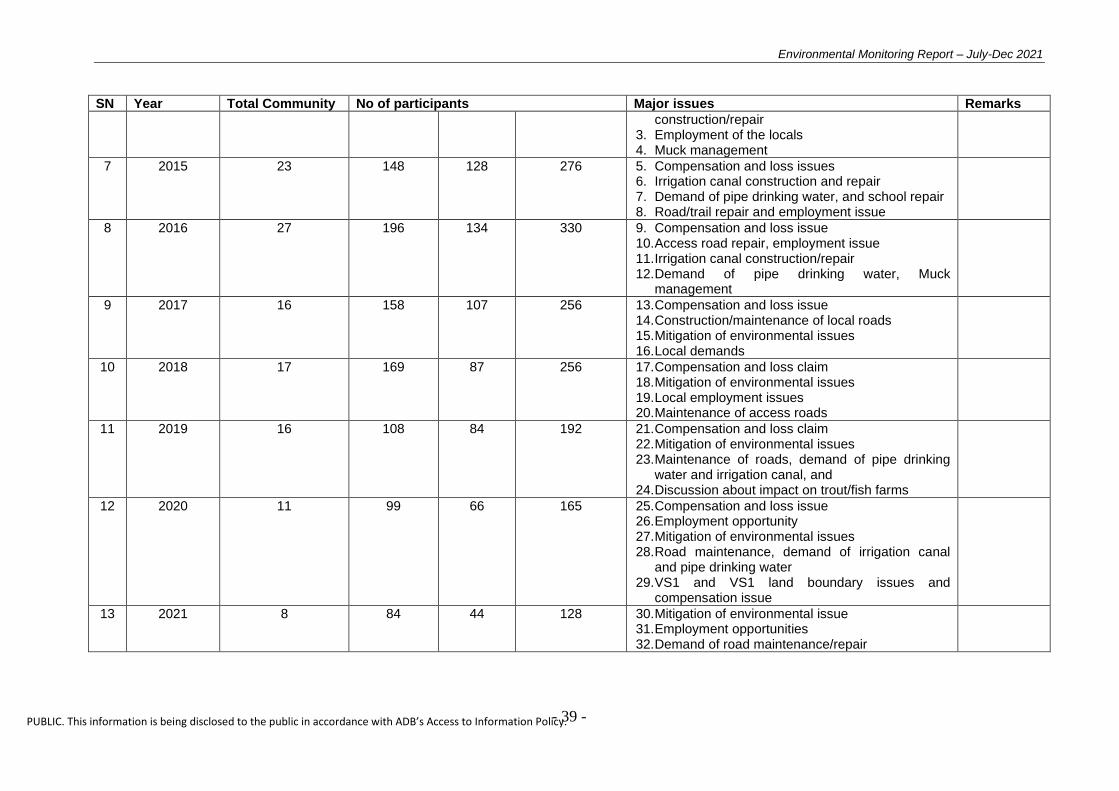
Environmental Monitoring Report – July-Dec 2021
- 39 -
PUBLIC. This information is being disclosed to the public in accordance with ADB’s Access to Information Policy.
SN Year Total Community Meeting
No of participants Major issues Remarks
construction/repair 3. Employment of the locals 4. Muck management
7 2015 23 148 128 276 5. Compensation and loss issues 6. Irrigation canal construction and repair 7. Demand of pipe drinking water, and school repair 8. Road/trail repair and employment issue
8 2016 27 196 134 330 9. Compensation and loss issue 10. Access road repair, employment issue 11. Irrigation canal construction/repair 12. Demand of pipe drinking water, Muck
management
9 2017 16 158 107 256 13. Compensation and loss issue 14. Construction/maintenance of local roads 15. Mitigation of environmental issues 16. Local demands
10 2018 17 169 87 256 17. Compensation and loss claim 18. Mitigation of environmental issues 19. Local employment issues 20. Maintenance of access roads
11 2019 16 108 84 192 21. Compensation and loss claim 22. Mitigation of environmental issues 23. Maintenance of roads, demand of pipe drinking
water and irrigation canal, and 24. Discussion about impact on trout/fish farms
12 2020 11 99 66 165 25. Compensation and loss issue 26. Employment opportunity 27. Mitigation of environmental issues 28. Road maintenance, demand of irrigation canal
and pipe drinking water 29. VS1 and VS1 land boundary issues and
compensation issue
13 2021 8 84 44 128 30. Mitigation of environmental issue 31. Employment opportunities 32. Demand of road maintenance/repair
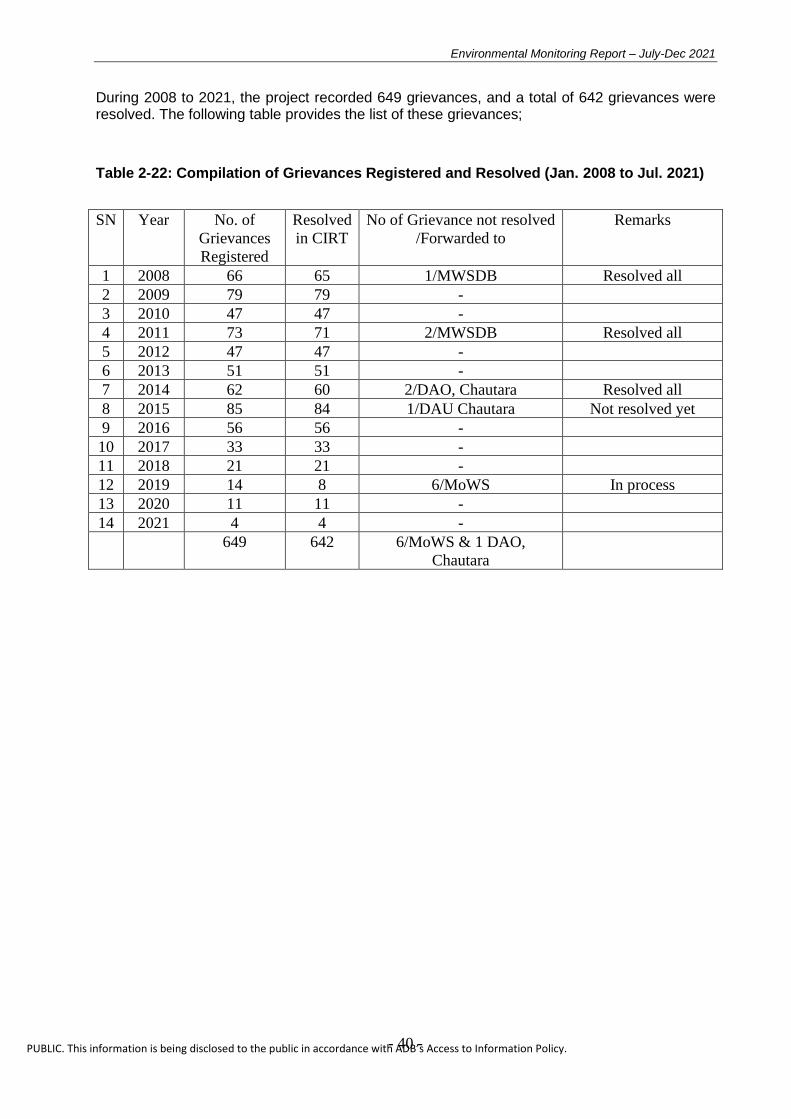
Environmental Monitoring Report – July-Dec 2021
- 40 -
PUBLIC. This information is being disclosed to the public in accordance with ADB’s Access to Information Policy.
During 2008 to 2021, the project recorded 649 grievances, and a total of 642 grievances were resolved. The following table provides the list of these grievances;
Table 2-22: Compilation of Grievances Registered and Resolved (Jan. 2008 to Jul. 2021)
SN Year No. of
Grievances
Registered
Resolved
in CIRT
No of Grievance not resolved
/Forwarded to
Remarks
1 2008 66 65 1/MWSDB Resolved all
2 2009 79 79 -
3 2010 47 47 -
4 2011 73 71 2/MWSDB Resolved all
5 2012 47 47 -
6 2013 51 51 -
7 2014 62 60 2/DAO, Chautara Resolved all
8 2015 85 84 1/DAU Chautara Not resolved yet
9 2016 56 56 -
10 2017 33 33 -
11 2018 21 21 -
12 2019 14 8 6/MoWS In process
13 2020 11 11 -
14 2021 4 4 -
649 642 6/MoWS & 1 DAO,
Chautara

Environmental Monitoring Report – July-Dec 2021
- 41 -
PUBLIC. This information is being disclosed to the public in accordance with ADB’s Access to Information Policy.
33.. RReefflleeccttiioonn
3.1 Good Practices
3.1.1 Institutional Aspects
The overall institutional commitment for environmental safeguards of the project was clearly reflected in the project’s programs, plans and activities. The institutional arrangements for environmental safeguards of the project was functional and effective. The project at all its implementation phases, had a dedicated safeguards team to address the environmental safeguards aspects. This was always supervised by the director level team from MWSDB.
The project also adhered to the environmental safeguards requirements of the Asian Development Bank (ADB), and strengthened its Safeguards Unit as per the suggestions from ADB team.
3.1.2 Implementation Aspects
The project had Environmental Management Plan (EMP) document in all its contract packages. This was based on the Environmental Impact Assessment (EIA) document of the project. All the packages like the packages of Access Roads, the package of Tunnel Works, and the packages of Intake/Headworks - all included Environmental Management Plan (EMP) in the contract document.
Some of the remarkable aspects of environmental safeguards implementation were;
Environmental Monitoring and Mitigation works
First Order Monitoring of ambient environmental conditions
Establishment of monitoring laboratory at project site by the project
Environmental Protection works
Fish survey, study and coordination with the locals/awareness
Bioengineering works, greenery promotion works
Reclamation of Spoil Tips (use for greenery promotion)
Sustainable practices
Establishment of forest nursery
Installation of Gauging Stations of River flow monitoring
Research/study works including study of Water Mills, study of NTFPs, Fishery Management Plan
Public Involvement
Regular Consultations
Functional and effective GRC mechanism

Environmental Monitoring Report – July-Dec 2021
- 42 -
PUBLIC. This information is being disclosed to the public in accordance with ADB’s Access to Information Policy.
3.2 Gaps
As a note to realization of some of the environmental safeguards aspects that could not be well addressed during the project’s implementation, following are some of the gaps;
Although the project always prioritized the effective supervision of environmental safeguards activities, the deputation of an officer level Safeguards Focal Person was interrupted during some parts of the project implementation
The project always addressed the environmental concerns in the field level. However, the systematic approach of actions through Corrective Action Plans for environmental safeguards was absent. However, this was fulfilled through programs and plans of the safeguards teams like EMP and SSDS.
Some of the long-term safeguards works, initiations and concepts taken by one consulting team/s could not be continued by the following consulting team/s. For example, continuation of plantation through development of the forest nursery; implementation of fish fry nursery as per the Fish Management Plan; and use of the Gauging Stations installed at strategic locations of Melamchi River and Indrawati River.
These, along with other safeguards aspects, can be taken as lessons to be learned from the challenges a mega scale project faces during its implementation. This is associated also with the need of institutional database keeping and information management.
3.3 Recommendations
Some of the points that can be based upon to ensure more effective implementation of environmental safeguards aspects in the MWSP Phase II based on the experiences of the MWSP Phase I works would be;
Development of a wider Management Information System (MIS) of the project. This will consolidate all the institutional frameworks, policy documents, plans, activities and database related to the project. This will help to continue the project activities even the project implementation teams (e.g. the contractors/consultants change over time period)
Prioritization of environmental safeguards aspects like deputation of Environmental Health & Safety (EHS) person in each contract package so that the contractor becomes more effective in implementation of the Environmental Management Plan (EMP) works included in its contract document

Environmental Monitoring Report – July-Dec 2021
- 43 -
PUBLIC. This information is being disclosed to the public in accordance with ADB’s Access to Information Policy.
Annexures
Annex 1: Records of Environmental Monitoring Works
Annex 2: Photographs
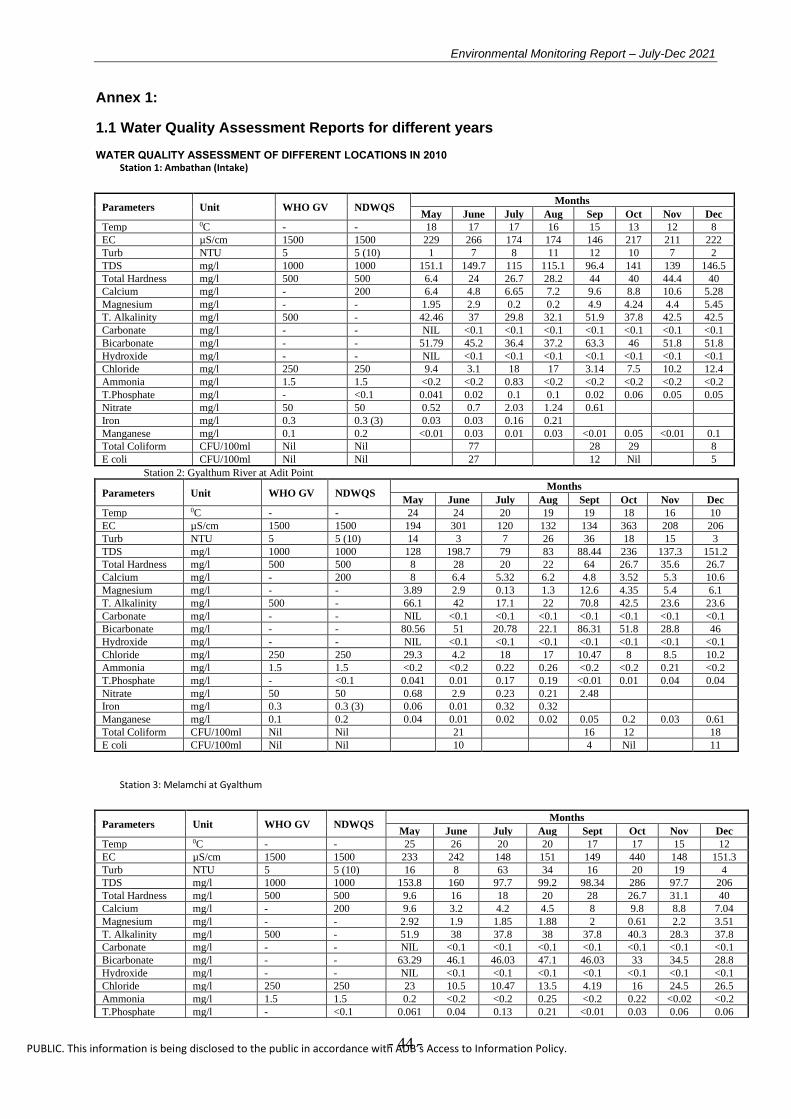
Environmental Monitoring Report – July-Dec 2021
- 44 -
PUBLIC. This information is being disclosed to the public in accordance with ADB’s Access to Information Policy.
Annex 1:
1.1 Water Quality Assessment Reports for different years
WATER QUALITY ASSESSMENT OF DIFFERENT LOCATIONS IN 2010 Station 1: Ambathan (Intake)
Parameters Unit WHO GV NDWQS Months
May June July Aug Sep Oct Nov Dec
Temp 0C - - 18 17 17 16 15 13 12 8
EC µS/cm 1500 1500 229 266 174 174 146 217 211 222
Turb NTU 5 5 (10) 1 7 8 11 12 10 7 2
TDS mg/l 1000 1000 151.1 149.7 115 115.1 96.4 141 139 146.5
Total Hardness mg/l 500 500 6.4 24 26.7 28.2 44 40 44.4 40
Calcium mg/l - 200 6.4 4.8 6.65 7.2 9.6 8.8 10.6 5.28
Magnesium mg/l - - 1.95 2.9 0.2 0.2 4.9 4.24 4.4 5.45
T. Alkalinity mg/l 500 - 42.46 37 29.8 32.1 51.9 37.8 42.5 42.5
Carbonate mg/l - - NIL <0.1 <0.1 <0.1 <0.1 <0.1 <0.1 <0.1
Bicarbonate mg/l - - 51.79 45.2 36.4 37.2 63.3 46 51.8 51.8
Hydroxide mg/l - - NIL <0.1 <0.1 <0.1 <0.1 <0.1 <0.1 <0.1
Chloride mg/l 250 250 9.4 3.1 18 17 3.14 7.5 10.2 12.4
Ammonia mg/l 1.5 1.5 <0.2 <0.2 0.83 <0.2 <0.2 <0.2 <0.2 <0.2
T.Phosphate mg/l - <0.1 0.041 0.02 0.1 0.1 0.02 0.06 0.05 0.05
Nitrate mg/l 50 50 0.52 0.7 2.03 1.24 0.61
Iron mg/l 0.3 0.3 (3) 0.03 0.03 0.16 0.21
Manganese mg/l 0.1 0.2 <0.01 0.03 0.01 0.03 <0.01 0.05 <0.01 0.1
Total Coliform CFU/100ml Nil Nil 77 28 29 8
E coli CFU/100ml Nil Nil 27 12 Nil 5
Station 2: Gyalthum River at Adit Point
Parameters Unit WHO GV NDWQS Months
May June July Aug Sept Oct Nov Dec
Temp 0C - - 24 24 20 19 19 18 16 10
EC µS/cm 1500 1500 194 301 120 132 134 363 208 206
Turb NTU 5 5 (10) 14 3 7 26 36 18 15 3
TDS mg/l 1000 1000 128 198.7 79 83 88.44 236 137.3 151.2
Total Hardness mg/l 500 500 8 28 20 22 64 26.7 35.6 26.7
Calcium mg/l - 200 8 6.4 5.32 6.2 4.8 3.52 5.3 10.6
Magnesium mg/l - - 3.89 2.9 0.13 1.3 12.6 4.35 5.4 6.1
T. Alkalinity mg/l 500 - 66.1 42 17.1 22 70.8 42.5 23.6 23.6
Carbonate mg/l - - NIL <0.1 <0.1 <0.1 <0.1 <0.1 <0.1 <0.1
Bicarbonate mg/l - - 80.56 51 20.78 22.1 86.31 51.8 28.8 46
Hydroxide mg/l - - NIL <0.1 <0.1 <0.1 <0.1 <0.1 <0.1 <0.1
Chloride mg/l 250 250 29.3 4.2 18 17 10.47 8 8.5 10.2
Ammonia mg/l 1.5 1.5 <0.2 <0.2 0.22 0.26 <0.2 <0.2 0.21 <0.2
T.Phosphate mg/l - <0.1 0.041 0.01 0.17 0.19 <0.01 0.01 0.04 0.04
Nitrate mg/l 50 50 0.68 2.9 0.23 0.21 2.48
Iron mg/l 0.3 0.3 (3) 0.06 0.01 0.32 0.32
Manganese mg/l 0.1 0.2 0.04 0.01 0.02 0.02 0.05 0.2 0.03 0.61
Total Coliform CFU/100ml Nil Nil 21 16 12 18
E coli CFU/100ml Nil Nil 10 4 Nil 11
Station 3: Melamchi at Gyalthum
Parameters Unit WHO GV NDWQS Months
May June July Aug Sept Oct Nov Dec
Temp 0C - - 25 26 20 20 17 17 15 12
EC µS/cm 1500 1500 233 242 148 151 149 440 148 151.3
Turb NTU 5 5 (10) 16 8 63 34 16 20 19 4
TDS mg/l 1000 1000 153.8 160 97.7 99.2 98.34 286 97.7 206
Total Hardness mg/l 500 500 9.6 16 18 20 28 26.7 31.1 40
Calcium mg/l - 200 9.6 3.2 4.2 4.5 8 9.8 8.8 7.04
Magnesium mg/l - - 2.92 1.9 1.85 1.88 2 0.61 2.2 3.51
T. Alkalinity mg/l 500 - 51.9 38 37.8 38 37.8 40.3 28.3 37.8
Carbonate mg/l - - NIL <0.1 <0.1 <0.1 <0.1 <0.1 <0.1 <0.1
Bicarbonate mg/l - - 63.29 46.1 46.03 47.1 46.03 33 34.5 28.8
Hydroxide mg/l - - NIL <0.1 <0.1 <0.1 <0.1 <0.1 <0.1 <0.1
Chloride mg/l 250 250 23 10.5 10.47 13.5 4.19 16 24.5 26.5
Ammonia mg/l 1.5 1.5 0.2 <0.2 <0.2 0.25 <0.2 0.22 <0.02 <0.2
T.Phosphate mg/l - <0.1 0.061 0.04 0.13 0.21 <0.01 0.03 0.06 0.06
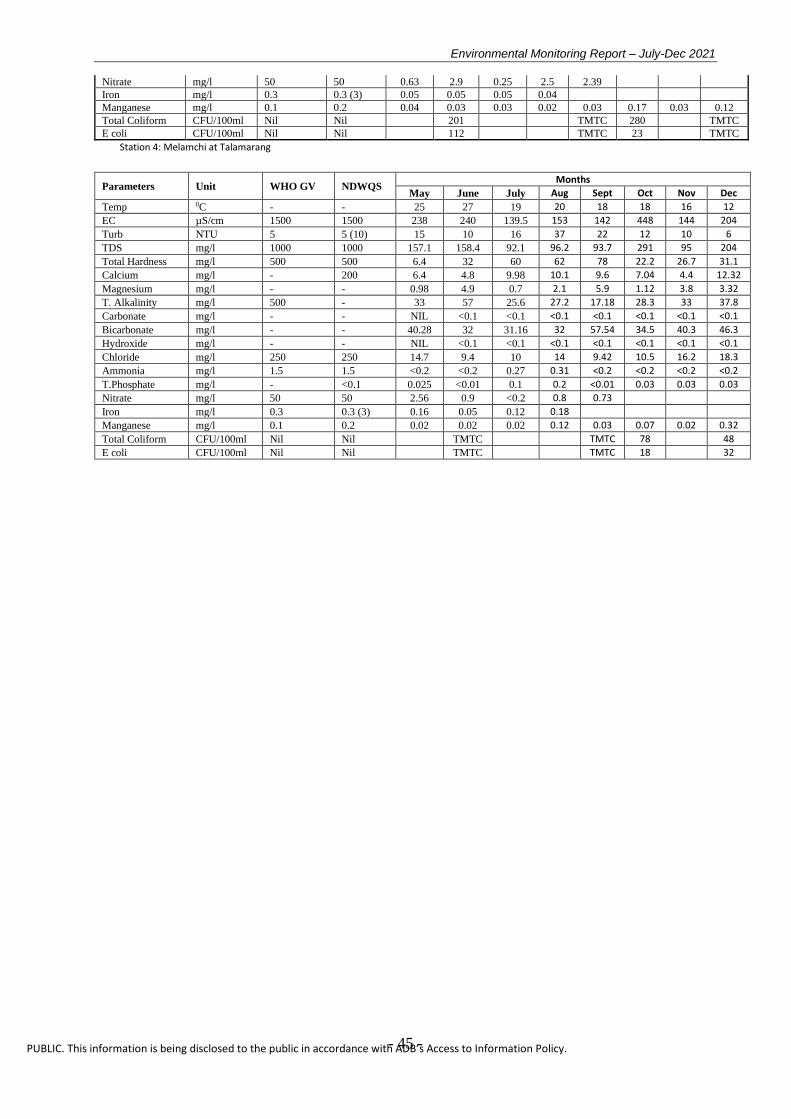
Environmental Monitoring Report – July-Dec 2021
- 45 -
PUBLIC. This information is being disclosed to the public in accordance with ADB’s Access to Information Policy.
Nitrate mg/l 50 50 0.63 2.9 0.25 2.5 2.39
Iron mg/l 0.3 0.3 (3) 0.05 0.05 0.05 0.04
Manganese mg/l 0.1 0.2 0.04 0.03 0.03 0.02 0.03 0.17 0.03 0.12
Total Coliform CFU/100ml Nil Nil 201 TMTC 280 TMTC
E coli CFU/100ml Nil Nil 112 TMTC 23 TMTC
Station 4: Melamchi at Talamarang
Parameters Unit WHO GV NDWQS Months
May June July Aug Sept Oct Nov Dec
Temp 0C - - 25 27 19 20 18 18 16 12
EC µS/cm 1500 1500 238 240 139.5 153 142 448 144 204
Turb NTU 5 5 (10) 15 10 16 37 22 12 10 6
TDS mg/l 1000 1000 157.1 158.4 92.1 96.2 93.7 291 95 204
Total Hardness mg/l 500 500 6.4 32 60 62 78 22.2 26.7 31.1
Calcium mg/l - 200 6.4 4.8 9.98 10.1 9.6 7.04 4.4 12.32
Magnesium mg/l - - 0.98 4.9 0.7 2.1 5.9 1.12 3.8 3.32
T. Alkalinity mg/l 500 - 33 57 25.6 27.2 17.18 28.3 33 37.8
Carbonate mg/l - - NIL <0.1 <0.1 <0.1 <0.1 <0.1 <0.1 <0.1
Bicarbonate mg/l - - 40.28 32 31.16 32 57.54 34.5 40.3 46.3
Hydroxide mg/l - - NIL <0.1 <0.1 <0.1 <0.1 <0.1 <0.1 <0.1
Chloride mg/l 250 250 14.7 9.4 10 14 9.42 10.5 16.2 18.3
Ammonia mg/l 1.5 1.5 <0.2 <0.2 0.27 0.31 <0.2 <0.2 <0.2 <0.2
T.Phosphate mg/l - <0.1 0.025 <0.01 0.1 0.2 <0.01 0.03 0.03 0.03
Nitrate mg/l 50 50 2.56 0.9 <0.2 0.8 0.73
Iron mg/l 0.3 0.3 (3) 0.16 0.05 0.12 0.18
Manganese mg/l 0.1 0.2 0.02 0.02 0.02 0.12 0.03 0.07 0.02 0.32
Total Coliform CFU/100ml Nil Nil TMTC TMTC 78 48
E coli CFU/100ml Nil Nil TMTC TMTC 18 32

Environmental Monitoring Report – July-Dec 2021
- 46 -
PUBLIC. This information is being disclosed to the public in accordance with ADB’s Access to Information Policy.
Station 5: Melamchi at Poolbazar
Parameters Unit WHO GV NDWQS Months
May June July Aug Sept Oct Nov Dec
Temperature 0C - - 24 27 20 20 20 19 17 13
EC µS/cm 1500 1500 275 280 256 262 149 453 149 223
Turbidity NTU 5 5 (10) 5 7 57 98 21 17 12 13
TDS mg/l 1000 1000 181.5 184.8 103 108 98.34 294 98.3 223
T. Hardness mg/l 500 500 8 28 36.7 38.2 56 32.1 40.4 35.6
Calcium mg/l - 200 8 9.6 6 7.5 9.6 7.04 8.8 7.04
Magnesium mg/l - - 0.98 1 0.43 0.53 7.8 3.28 4.4 3.31
T. Alkalinity mg/l 500 - 37.8 40 34.1 37.2 94.37 33.1 37.8 35.4
Carbonate mg/l - - NIL <0.1 <0.1 <0.1 <0.1 <0.1 <0.1 <0.1
Bicarbonate mg/l - - 46.03 48 41.55 42.3 115.1 40.3 46 43.2
Hydroxide mg/l - - NIL <0.1 <0.1 <0.1 <0.1 <0.1 <0.1 <0.1
Chloride mg/l 250 250 16.8 8.4 18 22.3 8.38 14 18.2 20.4
Ammonia mg/l 1.5 1.5 <0.2 <0.2 <0.2 0.35 <0.2 0.21 <0.2 <0.2
T.Phosphate mg/l - <0.1 0.03 <0.01 0.24 0.24 <0.01 0.01 0.03 0.03
Nitrate mg/l 50 50 1.44 0.52 <0.2 0.23 0.48
Iron mg/l 0.3 0.3 (3) 0.07 0.04 0.18 0.21
Manganese mg/l 0.1 0.2 0.05 0.01 0.09 0.11 0.08 0.07 0.06 0.66
Total Coliform CFU/100ml Nil Nil TMTC TMTC 110 TMTC
E coli CFU/100ml Nil Nil TMTC TMTC 56 28
Station 6: Sindu River at Adit point
Parameters Unit WHO GV NDWQS Months
May June July Sept Oct Nov Dec
Temp 0C - - 18 19 22 19 19 14 11
EC µS/cm 1500 1500 176 206 157 167 127 144 154.3
Turb NTU 5 5 (10) 12 14 14 28 19 14 6
TDS mg/l 1000 1000 116.2 136 103.6 110.22 83 95.2 101.9
T. Hardness mg/l 500 500 11.2 36 43.3 20 22.2 29 26.7
Calcium mg/l - 200 11.2 14 7.32 4.8 3.52 3.5 8.8
Magnesium mg/l - - 1.95 3.4 0.5 1.95 3.26 4.9 1.15
T. Alkalinity mg/l 500 - 56.6 32 24.4 33.03 47.2 35.4 28.3
Carbonate mg/l - - NIL <0.1 <0.1 <0.1 <0.1 <0.1 <0.1
Bicarbonate mg/l - - 69.05 39 28.57 40.28 57.5 43.2 28.8
Hydroxide mg/l - - NIL <0.1 <0.1 <0.1 <0.1 <0.1 <0.1
Chloride mg/l 250 250 25.1 14.7 12 4.19 24 24.8 22.2
Ammonia mg/l 1.5 1.5 <0.2 0.2 0.26 <0.2 <0.2 <0.2 <0.2
T.Phosphate mg/l - <0.1 0.092 0.01 0.22 0.03 0.02 0.09 0.09
Nitrate mg/l 50 50 3 2.1 0.41 1.3
Iron mg/l 0.3 0.3 (3) 0.42 0.02 0.14
Manganese mg/l 0.1 0.2 0.23 0.06 0.07 0.35 0.24 0.02 0.02
Total Coliform CFU/100ml Nil Nil 51 38 140 TMTC
E coli CFU/100ml Nil Nil 19 17 Nil 9
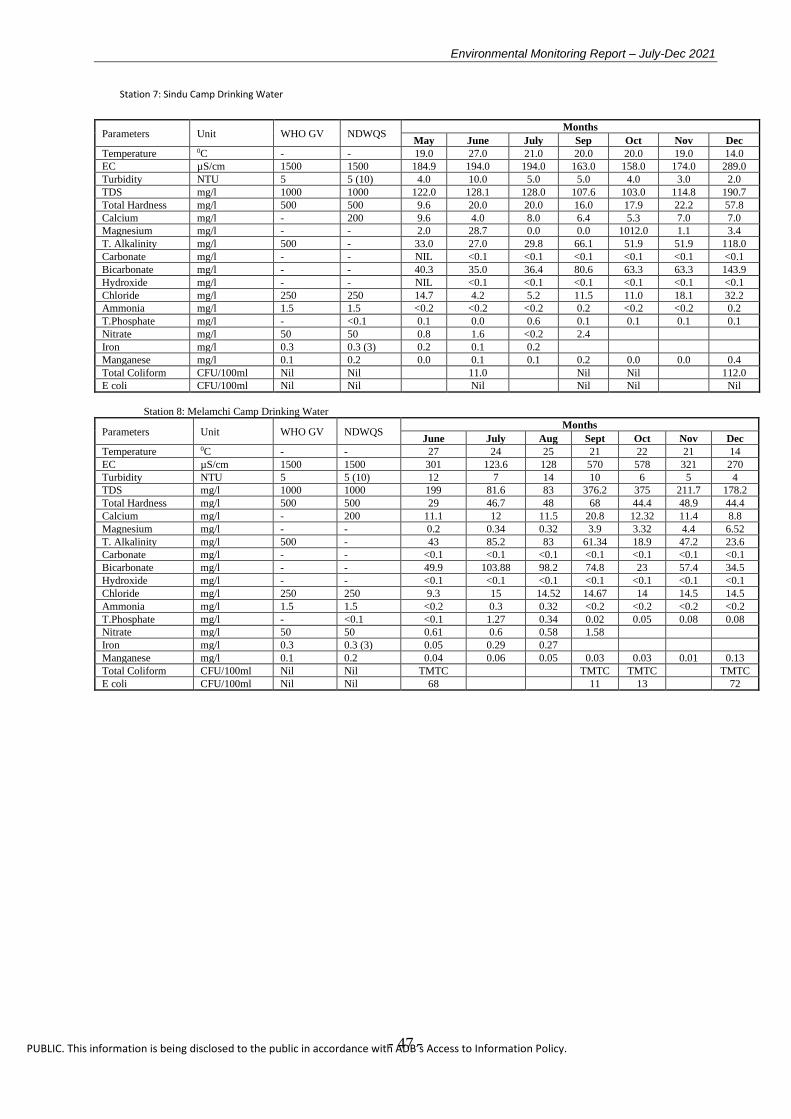
Environmental Monitoring Report – July-Dec 2021
- 47 -
PUBLIC. This information is being disclosed to the public in accordance with ADB’s Access to Information Policy.
Station 7: Sindu Camp Drinking Water
Parameters Unit WHO GV NDWQS Months
May June July Sep Oct Nov Dec
Temperature 0C - - 19.0 27.0 21.0 20.0 20.0 19.0 14.0
EC µS/cm 1500 1500 184.9 194.0 194.0 163.0 158.0 174.0 289.0
Turbidity NTU 5 5 (10) 4.0 10.0 5.0 5.0 4.0 3.0 2.0
TDS mg/l 1000 1000 122.0 128.1 128.0 107.6 103.0 114.8 190.7
Total Hardness mg/l 500 500 9.6 20.0 20.0 16.0 17.9 22.2 57.8
Calcium mg/l - 200 9.6 4.0 8.0 6.4 5.3 7.0 7.0
Magnesium mg/l - - 2.0 28.7 0.0 0.0 1012.0 1.1 3.4
T. Alkalinity mg/l 500 - 33.0 27.0 29.8 66.1 51.9 51.9 118.0
Carbonate mg/l - - NIL <0.1 <0.1 <0.1 <0.1 <0.1 <0.1
Bicarbonate mg/l - - 40.3 35.0 36.4 80.6 63.3 63.3 143.9
Hydroxide mg/l - - NIL <0.1 <0.1 <0.1 <0.1 <0.1 <0.1
Chloride mg/l 250 250 14.7 4.2 5.2 11.5 11.0 18.1 32.2
Ammonia mg/l 1.5 1.5 <0.2 <0.2 <0.2 0.2 <0.2 <0.2 0.2
T.Phosphate mg/l - <0.1 0.1 0.0 0.6 0.1 0.1 0.1 0.1
Nitrate mg/l 50 50 0.8 1.6 <0.2 2.4
Iron mg/l 0.3 0.3 (3) 0.2 0.1 0.2
Manganese mg/l 0.1 0.2 0.0 0.1 0.1 0.2 0.0 0.0 0.4
Total Coliform CFU/100ml Nil Nil 11.0 Nil Nil 112.0
E coli CFU/100ml Nil Nil Nil Nil Nil Nil
Station 8: Melamchi Camp Drinking Water
Parameters Unit WHO GV NDWQS Months
June July Aug Sept Oct Nov Dec
Temperature 0C - - 27 24 25 21 22 21 14
EC µS/cm 1500 1500 301 123.6 128 570 578 321 270
Turbidity NTU 5 5 (10) 12 7 14 10 6 5 4
TDS mg/l 1000 1000 199 81.6 83 376.2 375 211.7 178.2
Total Hardness mg/l 500 500 29 46.7 48 68 44.4 48.9 44.4
Calcium mg/l - 200 11.1 12 11.5 20.8 12.32 11.4 8.8
Magnesium mg/l - - 0.2 0.34 0.32 3.9 3.32 4.4 6.52
T. Alkalinity mg/l 500 - 43 85.2 83 61.34 18.9 47.2 23.6
Carbonate mg/l - - <0.1 <0.1 <0.1 <0.1 <0.1 <0.1 <0.1
Bicarbonate mg/l - - 49.9 103.88 98.2 74.8 23 57.4 34.5
Hydroxide mg/l - - <0.1 <0.1 <0.1 <0.1 <0.1 <0.1 <0.1
Chloride mg/l 250 250 9.3 15 14.52 14.67 14 14.5 14.5
Ammonia mg/l 1.5 1.5 <0.2 0.3 0.32 <0.2 <0.2 <0.2 <0.2
T.Phosphate mg/l - <0.1 <0.1 1.27 0.34 0.02 0.05 0.08 0.08
Nitrate mg/l 50 50 0.61 0.6 0.58 1.58
Iron mg/l 0.3 0.3 (3) 0.05 0.29 0.27
Manganese mg/l 0.1 0.2 0.04 0.06 0.05 0.03 0.03 0.01 0.13
Total Coliform CFU/100ml Nil Nil TMTC TMTC TMTC TMTC
E coli CFU/100ml Nil Nil 68 11 13 72
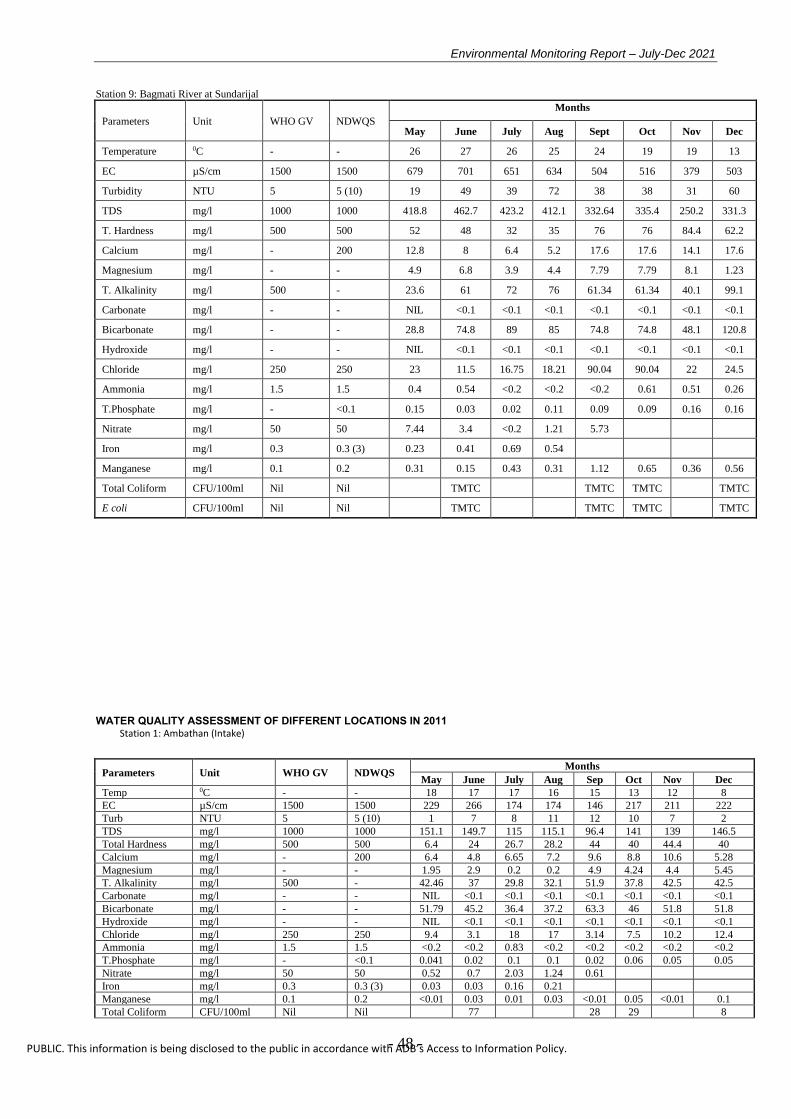
Environmental Monitoring Report – July-Dec 2021
- 48 -
PUBLIC. This information is being disclosed to the public in accordance with ADB’s Access to Information Policy.
Station 9: Bagmati River at Sundarijal
Parameters Unit WHO GV NDWQS
Months
May June July Aug Sept Oct Nov Dec
Temperature 0C - - 26 27 26 25 24 19 19 13
EC µS/cm 1500 1500 679 701 651 634 504 516 379 503
Turbidity NTU 5 5 (10) 19 49 39 72 38 38 31 60
TDS mg/l 1000 1000 418.8 462.7 423.2 412.1 332.64 335.4 250.2 331.3
T. Hardness mg/l 500 500 52 48 32 35 76 76 84.4 62.2
Calcium mg/l - 200 12.8 8 6.4 5.2 17.6 17.6 14.1 17.6
Magnesium mg/l - - 4.9 6.8 3.9 4.4 7.79 7.79 8.1 1.23
T. Alkalinity mg/l 500 - 23.6 61 72 76 61.34 61.34 40.1 99.1
Carbonate mg/l - - NIL <0.1 <0.1 <0.1 <0.1 <0.1 <0.1 <0.1
Bicarbonate mg/l - - 28.8 74.8 89 85 74.8 74.8 48.1 120.8
Hydroxide mg/l - - NIL <0.1 <0.1 <0.1 <0.1 <0.1 <0.1 <0.1
Chloride mg/l 250 250 23 11.5 16.75 18.21 90.04 90.04 22 24.5
Ammonia mg/l 1.5 1.5 0.4 0.54 <0.2 <0.2 <0.2 0.61 0.51 0.26
T.Phosphate mg/l - <0.1 0.15 0.03 0.02 0.11 0.09 0.09 0.16 0.16
Nitrate mg/l 50 50 7.44 3.4 <0.2 1.21 5.73
Iron mg/l 0.3 0.3 (3) 0.23 0.41 0.69 0.54
Manganese mg/l 0.1 0.2 0.31 0.15 0.43 0.31 1.12 0.65 0.36 0.56
Total Coliform CFU/100ml Nil Nil TMTC TMTC TMTC TMTC
E coli CFU/100ml Nil Nil TMTC TMTC TMTC TMTC
WATER QUALITY ASSESSMENT OF DIFFERENT LOCATIONS IN 2011
Station 1: Ambathan (Intake)
Parameters Unit WHO GV NDWQS Months
May June July Aug Sep Oct Nov Dec
Temp 0C - - 18 17 17 16 15 13 12 8
EC µS/cm 1500 1500 229 266 174 174 146 217 211 222
Turb NTU 5 5 (10) 1 7 8 11 12 10 7 2
TDS mg/l 1000 1000 151.1 149.7 115 115.1 96.4 141 139 146.5
Total Hardness mg/l 500 500 6.4 24 26.7 28.2 44 40 44.4 40
Calcium mg/l - 200 6.4 4.8 6.65 7.2 9.6 8.8 10.6 5.28
Magnesium mg/l - - 1.95 2.9 0.2 0.2 4.9 4.24 4.4 5.45
T. Alkalinity mg/l 500 - 42.46 37 29.8 32.1 51.9 37.8 42.5 42.5
Carbonate mg/l - - NIL <0.1 <0.1 <0.1 <0.1 <0.1 <0.1 <0.1
Bicarbonate mg/l - - 51.79 45.2 36.4 37.2 63.3 46 51.8 51.8
Hydroxide mg/l - - NIL <0.1 <0.1 <0.1 <0.1 <0.1 <0.1 <0.1
Chloride mg/l 250 250 9.4 3.1 18 17 3.14 7.5 10.2 12.4
Ammonia mg/l 1.5 1.5 <0.2 <0.2 0.83 <0.2 <0.2 <0.2 <0.2 <0.2
T.Phosphate mg/l - <0.1 0.041 0.02 0.1 0.1 0.02 0.06 0.05 0.05
Nitrate mg/l 50 50 0.52 0.7 2.03 1.24 0.61
Iron mg/l 0.3 0.3 (3) 0.03 0.03 0.16 0.21
Manganese mg/l 0.1 0.2 <0.01 0.03 0.01 0.03 <0.01 0.05 <0.01 0.1
Total Coliform CFU/100ml Nil Nil 77 28 29 8

Environmental Monitoring Report – July-Dec 2021
- 49 -
PUBLIC. This information is being disclosed to the public in accordance with ADB’s Access to Information Policy.
E coli CFU/100ml Nil Nil 27 12 Nil 5
Station 2: Gyalthum River at Adit Point
Parameters Unit WHO GV NDWQS Months
May June July Aug Sept Oct Nov Dec
Temp 0C - - 24 24 20 19 19 18 16 10
EC µS/cm 1500 1500 194 301 120 132 134 363 208 206
Turb NTU 5 5 (10) 14 3 7 26 36 18 15 3
TDS mg/l 1000 1000 128 198.7 79 83 88.44 236 137.3 151.2
Total Hardness mg/l 500 500 8 28 20 22 64 26.7 35.6 26.7
Calcium mg/l - 200 8 6.4 5.32 6.2 4.8 3.52 5.3 10.6
Magnesium mg/l - - 3.89 2.9 0.13 1.3 12.6 4.35 5.4 6.1
T. Alkalinity mg/l 500 - 66.1 42 17.1 22 70.8 42.5 23.6 23.6
Carbonate mg/l - - NIL <0.1 <0.1 <0.1 <0.1 <0.1 <0.1 <0.1
Bicarbonate mg/l - - 80.56 51 20.78 22.1 86.31 51.8 28.8 46
Hydroxide mg/l - - NIL <0.1 <0.1 <0.1 <0.1 <0.1 <0.1 <0.1
Chloride mg/l 250 250 29.3 4.2 18 17 10.47 8 8.5 10.2
Ammonia mg/l 1.5 1.5 <0.2 <0.2 0.22 0.26 <0.2 <0.2 0.21 <0.2
T.Phosphate mg/l - <0.1 0.041 0.01 0.17 0.19 <0.01 0.01 0.04 0.04
Nitrate mg/l 50 50 0.68 2.9 0.23 0.21 2.48
Iron mg/l 0.3 0.3 (3) 0.06 0.01 0.32 0.32
Manganese mg/l 0.1 0.2 0.04 0.01 0.02 0.02 0.05 0.2 0.03 0.61
Total Coliform CFU/100ml Nil Nil 21 16 12 18
E coli CFU/100ml Nil Nil 10 4 Nil 11

Environmental Monitoring Report – July-Dec 2021
- 50 -
PUBLIC. This information is being disclosed to the public in accordance with ADB’s Access to Information Policy.
Station 3: Melamchi at Gyalthum
Parameters Unit WHO GV NDWQS Months
May June July Aug Sept Oct Nov Dec
Temp 0C - - 25 26 20 20 17 17 15 12
EC µS/cm 1500 1500 233 242 148 151 149 440 148 151.3
Turb NTU 5 5 (10) 16 8 63 34 16 20 19 4
TDS mg/l 1000 1000 153.8 160 97.7 99.2 98.34 286 97.7 206
Total Hardness mg/l 500 500 9.6 16 18 20 28 26.7 31.1 40
Calcium mg/l - 200 9.6 3.2 4.2 4.5 8 9.8 8.8 7.04
Magnesium mg/l - - 2.92 1.9 1.85 1.88 2 0.61 2.2 3.51
T. Alkalinity mg/l 500 - 51.9 38 37.8 38 37.8 40.3 28.3 37.8
Carbonate mg/l - - NIL <0.1 <0.1 <0.1 <0.1 <0.1 <0.1 <0.1
Bicarbonate mg/l - - 63.29 46.1 46.03 47.1 46.03 33 34.5 28.8
Hydroxide mg/l - - NIL <0.1 <0.1 <0.1 <0.1 <0.1 <0.1 <0.1
Chloride mg/l 250 250 23 10.5 10.47 13.5 4.19 16 24.5 26.5
Ammonia mg/l 1.5 1.5 0.2 <0.2 <0.2 0.25 <0.2 0.22 <0.02 <0.2
T.Phosphate mg/l - <0.1 0.061 0.04 0.13 0.21 <0.01 0.03 0.06 0.06
Nitrate mg/l 50 50 0.63 2.9 0.25 2.5 2.39
Iron mg/l 0.3 0.3 (3) 0.05 0.05 0.05 0.04
Manganese mg/l 0.1 0.2 0.04 0.03 0.03 0.02 0.03 0.17 0.03 0.12
Total Coliform CFU/100ml Nil Nil 201 TMTC 280 TMTC
E coli CFU/100ml Nil Nil 112 TMTC 23 TMTC
Station 4: Melamchi at Talamarang
Parameters Unit WHO GV NDWQS Months
May June July Aug Sept Oct Nov Dec
Temp 0C - - 25 27 19 20 18 18 16 12
EC µS/cm 1500 1500 238 240 139.5 153 142 448 144 204
Turb NTU 5 5 (10) 15 10 16 37 22 12 10 6
TDS mg/l 1000 1000 157.1 158.4 92.1 96.2 93.7 291 95 204
Total Hardness mg/l 500 500 6.4 32 60 62 78 22.2 26.7 31.1
Calcium mg/l - 200 6.4 4.8 9.98 10.1 9.6 7.04 4.4 12.32
Magnesium mg/l - - 0.98 4.9 0.7 2.1 5.9 1.12 3.8 3.32
T. Alkalinity mg/l 500 - 33 57 25.6 27.2 17.18 28.3 33 37.8
Carbonate mg/l - - NIL <0.1 <0.1 <0.1 <0.1 <0.1 <0.1 <0.1
Bicarbonate mg/l - - 40.28 32 31.16 32 57.54 34.5 40.3 46.3
Hydroxide mg/l - - NIL <0.1 <0.1 <0.1 <0.1 <0.1 <0.1 <0.1
Chloride mg/l 250 250 14.7 9.4 10 14 9.42 10.5 16.2 18.3
Ammonia mg/l 1.5 1.5 <0.2 <0.2 0.27 0.31 <0.2 <0.2 <0.2 <0.2
T.Phosphate mg/l - <0.1 0.025 <0.01 0.1 0.2 <0.01 0.03 0.03 0.03
Nitrate mg/l 50 50 2.56 0.9 <0.2 0.8 0.73
Iron mg/l 0.3 0.3 (3) 0.16 0.05 0.12 0.18
Manganese mg/l 0.1 0.2 0.02 0.02 0.02 0.12 0.03 0.07 0.02 0.32
Total Coliform CFU/100ml Nil Nil TMTC TMTC 78 48
E coli CFU/100ml Nil Nil TMTC TMTC 18 32
Station 5: Melamchi at Poolbazar
Parameters Unit WHO GV NDWQS Months
May June July Aug Sept Oct Nov Dec
Temperature 0C - - 24 27 20 20 20 19 17 13
EC µS/cm 1500 1500 275 280 256 262 149 453 149 223
Turbidity NTU 5 5 (10) 5 7 57 98 21 17 12 13
TDS mg/l 1000 1000 181.5 184.8 103 108 98.34 294 98.3 223
T. Hardness mg/l 500 500 8 28 36.7 38.2 56 32.1 40.4 35.6
Calcium mg/l - 200 8 9.6 6 7.5 9.6 7.04 8.8 7.04
Magnesium mg/l - - 0.98 1 0.43 0.53 7.8 3.28 4.4 3.31
T. Alkalinity mg/l 500 - 37.8 40 34.1 37.2 94.37 33.1 37.8 35.4
Carbonate mg/l - - NIL <0.1 <0.1 <0.1 <0.1 <0.1 <0.1 <0.1
Bicarbonate mg/l - - 46.03 48 41.55 42.3 115.1 40.3 46 43.2
Hydroxide mg/l - - NIL <0.1 <0.1 <0.1 <0.1 <0.1 <0.1 <0.1
Chloride mg/l 250 250 16.8 8.4 18 22.3 8.38 14 18.2 20.4
Ammonia mg/l 1.5 1.5 <0.2 <0.2 <0.2 0.35 <0.2 0.21 <0.2 <0.2
T.Phosphate mg/l - <0.1 0.03 <0.01 0.24 0.24 <0.01 0.01 0.03 0.03
Nitrate mg/l 50 50 1.44 0.52 <0.2 0.23 0.48
Iron mg/l 0.3 0.3 (3) 0.07 0.04 0.18 0.21
Manganese mg/l 0.1 0.2 0.05 0.01 0.09 0.11 0.08 0.07 0.06 0.66
Total Coliform CFU/100ml Nil Nil TMTC TMTC 110 TMTC
E coli CFU/100ml Nil Nil TMTC TMTC 56 28

Environmental Monitoring Report – July-Dec 2021
- 51 -
PUBLIC. This information is being disclosed to the public in accordance with ADB’s Access to Information Policy.
Station 6: Sindu River at Adit point
Parameters Unit WHO GV NDWQS Months
May June July Sept Oct Nov Dec
Temp 0C - - 18 19 22 19 19 14 11
EC µS/cm 1500 1500 176 206 157 167 127 144 154.3
Turb NTU 5 5 (10) 12 14 14 28 19 14 6
TDS mg/l 1000 1000 116.2 136 103.6 110.22 83 95.2 101.9
T. Hardness mg/l 500 500 11.2 36 43.3 20 22.2 29 26.7
Calcium mg/l - 200 11.2 14 7.32 4.8 3.52 3.5 8.8
Magnesium mg/l - - 1.95 3.4 0.5 1.95 3.26 4.9 1.15
T. Alkalinity mg/l 500 - 56.6 32 24.4 33.03 47.2 35.4 28.3
Carbonate mg/l - - NIL <0.1 <0.1 <0.1 <0.1 <0.1 <0.1
Bicarbonate mg/l - - 69.05 39 28.57 40.28 57.5 43.2 28.8
Hydroxide mg/l - - NIL <0.1 <0.1 <0.1 <0.1 <0.1 <0.1
Chloride mg/l 250 250 25.1 14.7 12 4.19 24 24.8 22.2
Ammonia mg/l 1.5 1.5 <0.2 0.2 0.26 <0.2 <0.2 <0.2 <0.2
T.Phosphate mg/l - <0.1 0.092 0.01 0.22 0.03 0.02 0.09 0.09
Nitrate mg/l 50 50 3 2.1 0.41 1.3
Iron mg/l 0.3 0.3 (3) 0.42 0.02 0.14
Manganese mg/l 0.1 0.2 0.23 0.06 0.07 0.35 0.24 0.02 0.02
Total Coliform CFU/100ml Nil Nil 51 38 140 TMTC
E coli CFU/100ml Nil Nil 19 17 Nil 9
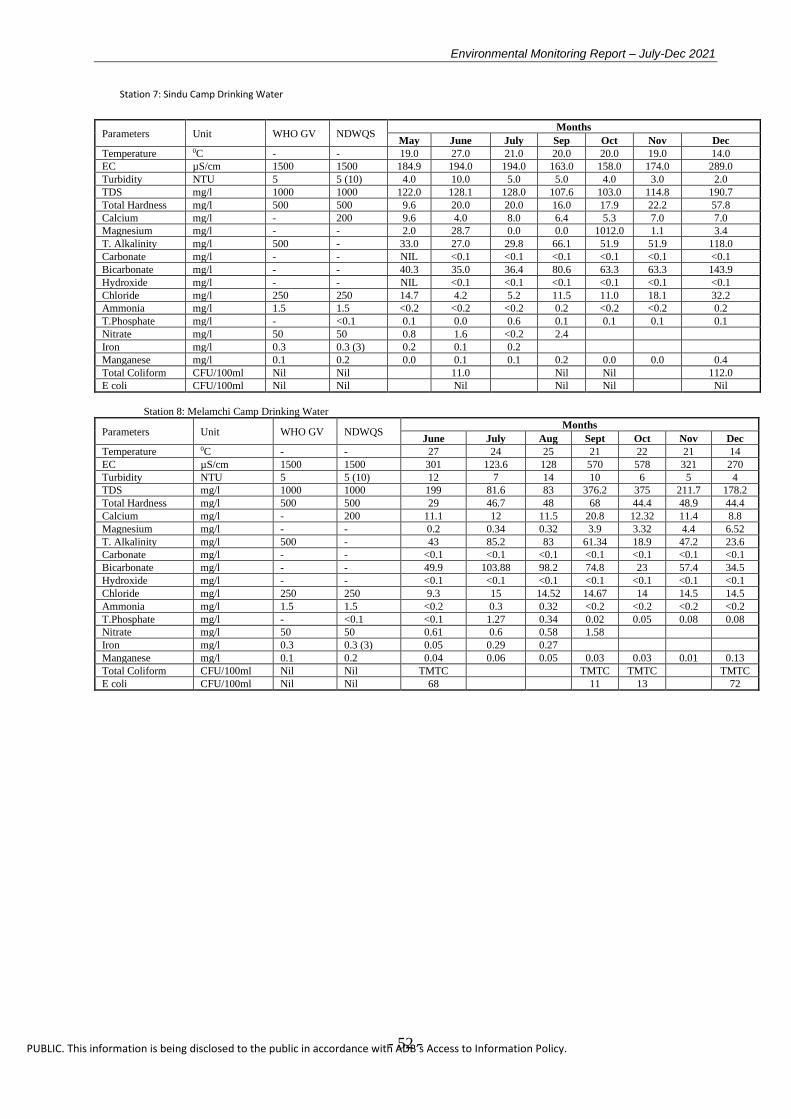
Environmental Monitoring Report – July-Dec 2021
- 52 -
PUBLIC. This information is being disclosed to the public in accordance with ADB’s Access to Information Policy.
Station 7: Sindu Camp Drinking Water
Parameters Unit WHO GV NDWQS Months
May June July Sep Oct Nov Dec
Temperature 0C - - 19.0 27.0 21.0 20.0 20.0 19.0 14.0
EC µS/cm 1500 1500 184.9 194.0 194.0 163.0 158.0 174.0 289.0
Turbidity NTU 5 5 (10) 4.0 10.0 5.0 5.0 4.0 3.0 2.0
TDS mg/l 1000 1000 122.0 128.1 128.0 107.6 103.0 114.8 190.7
Total Hardness mg/l 500 500 9.6 20.0 20.0 16.0 17.9 22.2 57.8
Calcium mg/l - 200 9.6 4.0 8.0 6.4 5.3 7.0 7.0
Magnesium mg/l - - 2.0 28.7 0.0 0.0 1012.0 1.1 3.4
T. Alkalinity mg/l 500 - 33.0 27.0 29.8 66.1 51.9 51.9 118.0
Carbonate mg/l - - NIL <0.1 <0.1 <0.1 <0.1 <0.1 <0.1
Bicarbonate mg/l - - 40.3 35.0 36.4 80.6 63.3 63.3 143.9
Hydroxide mg/l - - NIL <0.1 <0.1 <0.1 <0.1 <0.1 <0.1
Chloride mg/l 250 250 14.7 4.2 5.2 11.5 11.0 18.1 32.2
Ammonia mg/l 1.5 1.5 <0.2 <0.2 <0.2 0.2 <0.2 <0.2 0.2
T.Phosphate mg/l - <0.1 0.1 0.0 0.6 0.1 0.1 0.1 0.1
Nitrate mg/l 50 50 0.8 1.6 <0.2 2.4
Iron mg/l 0.3 0.3 (3) 0.2 0.1 0.2
Manganese mg/l 0.1 0.2 0.0 0.1 0.1 0.2 0.0 0.0 0.4
Total Coliform CFU/100ml Nil Nil 11.0 Nil Nil 112.0
E coli CFU/100ml Nil Nil Nil Nil Nil Nil
Station 8: Melamchi Camp Drinking Water
Parameters Unit WHO GV NDWQS Months
June July Aug Sept Oct Nov Dec
Temperature 0C - - 27 24 25 21 22 21 14
EC µS/cm 1500 1500 301 123.6 128 570 578 321 270
Turbidity NTU 5 5 (10) 12 7 14 10 6 5 4
TDS mg/l 1000 1000 199 81.6 83 376.2 375 211.7 178.2
Total Hardness mg/l 500 500 29 46.7 48 68 44.4 48.9 44.4
Calcium mg/l - 200 11.1 12 11.5 20.8 12.32 11.4 8.8
Magnesium mg/l - - 0.2 0.34 0.32 3.9 3.32 4.4 6.52
T. Alkalinity mg/l 500 - 43 85.2 83 61.34 18.9 47.2 23.6
Carbonate mg/l - - <0.1 <0.1 <0.1 <0.1 <0.1 <0.1 <0.1
Bicarbonate mg/l - - 49.9 103.88 98.2 74.8 23 57.4 34.5
Hydroxide mg/l - - <0.1 <0.1 <0.1 <0.1 <0.1 <0.1 <0.1
Chloride mg/l 250 250 9.3 15 14.52 14.67 14 14.5 14.5
Ammonia mg/l 1.5 1.5 <0.2 0.3 0.32 <0.2 <0.2 <0.2 <0.2
T.Phosphate mg/l - <0.1 <0.1 1.27 0.34 0.02 0.05 0.08 0.08
Nitrate mg/l 50 50 0.61 0.6 0.58 1.58
Iron mg/l 0.3 0.3 (3) 0.05 0.29 0.27
Manganese mg/l 0.1 0.2 0.04 0.06 0.05 0.03 0.03 0.01 0.13
Total Coliform CFU/100ml Nil Nil TMTC TMTC TMTC TMTC
E coli CFU/100ml Nil Nil 68 11 13 72

Environmental Monitoring Report – July-Dec 2021
- 53 -
PUBLIC. This information is being disclosed to the public in accordance with ADB’s Access to Information Policy.
Station 9: Bagmati River at Sundarijal
Parameters Unit WHO GV NDWQS Months
May June July Aug Sept Oct Nov Dec
Temperature 0C - - 26 27 26 25 24 19 19 13
EC µS/cm 1500 1500 679 701 651 634 504 516 379 503
Turbidity NTU 5 5 (10) 19 49 39 72 38 38 31 60
TDS mg/l 1000 1000 418.8 462.7 423.2 412.1 332.64 335.4 250.2 331.3
T. Hardness mg/l 500 500 52 48 32 35 76 76 84.4 62.2
Calcium mg/l - 200 12.8 8 6.4 5.2 17.6 17.6 14.1 17.6
Magnesium mg/l - - 4.9 6.8 3.9 4.4 7.79 7.79 8.1 1.23
T. Alkalinity mg/l 500 - 23.6 61 72 76 61.34 61.34 40.1 99.1
Carbonate mg/l - - NIL <0.1 <0.1 <0.1 <0.1 <0.1 <0.1 <0.1
Bicarbonate mg/l - - 28.8 74.8 89 85 74.8 74.8 48.1 120.8
Hydroxide mg/l - - NIL <0.1 <0.1 <0.1 <0.1 <0.1 <0.1 <0.1
Chloride mg/l 250 250 23 11.5 16.75 18.21 90.04 90.04 22 24.5
Ammonia mg/l 1.5 1.5 0.4 0.54 <0.2 <0.2 <0.2 0.61 0.51 0.26
T.Phosphate mg/l - <0.1 0.15 0.03 0.02 0.11 0.09 0.09 0.16 0.16
Nitrate mg/l 50 50 7.44 3.4 <0.2 1.21 5.73
Iron mg/l 0.3 0.3 (3) 0.23 0.41 0.69 0.54
Manganese mg/l 0.1 0.2 0.31 0.15 0.43 0.31 1.12 0.65 0.36 0.56
Total Coliform CFU/100ml Nil Nil TMTC TMTC TMTC TMTC
E coli CFU/100ml Nil Nil TMTC TMTC TMTC TMTC

Environmental Monitoring Report – July-Dec 2021
- 54 -
PUBLIC. This information is being disclosed to the public in accordance with ADB’s Access to Information Policy.
WATER QUALITY ASSESSMENT OF DIFFERENT LOCATIONS IN 2012
Location: Ambathan/Timbu
Parameters Units WHOGV NDWQS Months
Jan Feb Mar Apr May June July Aug Sept Oct Nov Dec
Temperature 0C - - 10.7 11.2 13.7 12.1 15 19.4 16.1 19.2 13.7 11 12 8.5
EC µS/cm 1500 1500 280.0 239.0 236.0 243.0 446.0 231.0 149.4 175.1 175.0 209.0 224.0 227.0
Turbidity NTU 5 5(10) 3.0 1.0 1.0 1.0 2.0 6.0 33.0 6.0 4.0 3.0 7.0 1.0
TDS mg/l 1000 1000 182 157.7 156 160.4 294.4 152.5 97 114 114 137.9 - -
DO mg/l - - - - - 11.2 7.2 11.3 11.2 10.1 11.4 9.9 147.8 149.8
pH mg/l 6.5-6.8 6.5-6.8 8.6 - - 8 8.48 8.78 9.06 8.33 8.7 8.86 7.8 7.5
T. Hardness mg/l 500 500 30.4 26.6 30.4 26.6 19 19 23.52 22.5 27.44 31.5 27.44 21
Calcium mg/l - - 9.1 7.6 7.57 6.8 4.8 4.8 3.136 6.27 4.704 8.2 3.13 2.16
Magnesium mg/l - - 1.9 1.9 2.79 2.3 2.1 2.1 3.81 1.91 1.91 2.67 3.81 3.79
T. alkalinity mg/l 500 500 38.8 34.1 29.81 29.8 25.6 25.6 26.7 38.8 43.65 43 25.83 24.2
Carbonate mg/l - - <0.1 <0.1 <0.1 <0.1 <0.1 <0.1 <0.1 <0.1 <0.1 <0.1 <0.1 <0.1
Bicarbonate mg/l 47.3 41.6 36.36 36.4 31.2 31.2 32.56 47.3 53.23 52.41 31.51 19.8
Hydroxide mg/l - - <0.1 <0.1 <0.1 <0.1 <0.1 <0.1 <0.1 <0.1 <0.1 <0.1 <0.1 <0.1
Chloride mg/l 250 250 3.6 4.1 4.18 5.1 2.09 2.09 8.376 4.19 4.19 4.12 4.12 4.12
Ammonia mg/l 1.5 1.5 <0.2 <0.2 <0.02 <0.02 <0.02 <0.02 <0.02 <0.02 <0.02 <0.02 <0.02 <0.02
T. Phosphate mg/l - - <0.01 <0.01 <0.01 <0.01 <0.01 <0.01 <0.01 0.15 0.15 0.13 0.14 0.12
Nitrate mg/l 50 50 - - - - - - 0.97 0.9 0.9 0.89 0.9 1.2
Manganese mg/l 0.1 0.2 0.01 0.01 0.02 0.02 0.03 0.03 0.03 0.01 0.01 0.01 0.01 0.01
Iron mg/l 0.3 0.3 - - - - - - 0.18 0.48 0.48 0.48 0.38 0.24
T. Coliform Cfu/100ml Nil Nil - - - 6 11 21 11 12 22 16 TMTC -
E. Coli Cfu/100ml Nil Nil - - - 1 4 9 6 4 14 9 7 -

Environmental Monitoring Report – July-Dec 2021
- 55 -
PUBLIC. This information is being disclosed to the public in accordance with ADB’s Access to Information Policy.
Location: Ambathan Downstream
Parameters Units WHOGV NDWQS Months
Mar Apr May June July August Sept
Physical Parameters
Temperature 0C - - 14 14.3 18 20.1 16.6 19.5 15.2
EC µS/cm 1500 1500 234.0 220.0 217.0 254.0 192.0 282.0 211.0
Turbidity NTU 5 5(10) 2.0 5.0 4.0 6.0 35.0 14.0 5.0
DO mg/l - - - 10.2 143.2 167.6 125 183 139
TDS mg/l 1000 1000 154 145.2 6.8 8.2 8.3 9.3 11.3
pH mg/l 6.5-6.8 6.5-6.8 - 7.9 8.32 8.74 8.53 8.1 8.2
T. Hardness mg/l 500 500 34.2 24.7 22 26 19.6 23.5 27.44
Calcium mg/l - - 6.06 6.1 3.2 6.4 4.704 4.7 4.704
Magnesium mg/l - - 2.83 2.3 3.2 2.6 1.91 2.86 2.86
T. alkalinity mg/l 500 500 29.81 29.8 23.5 25.6 19.07 38.8 38.8
Carbonate mg/l - - <0.1 <0.1 <0.1 <0.1 <0.1 <0.1 <0.1
Bicarbonate mg/l - - 36.36 36.4 31.2 31.1 23.26 47.3 47.31
Hydroxide mg/l - - <0.1 <0.1 <0.1 <0.1 <0.1 <0.1 <0.1
Chloride mg/l 250 250 6.28 4.2 3.14 3.14 8.376 4.19 6.28
Ammonia mg/l 1.5 1.5 <0.02 <0.02 <0.02 <0.02 <0.02 <0.02 <0.02
T. Phosphate mg/l - - <0.01 <0.01 <0.01 <0.01 <0.01 0.15 0.15
Nitrate mg/l 50 50 - - - - 1.23 1.2 1.2
Manganese mg/l 0.1 0.2 0.05 0.04 0.04 0.04 0 0.16 0.16
Iron mg/l 0.3 0.3 - - - - 0.5 0.6 0.6
Location: Gyalthum
Parameters Units WHOGV NDWQS Months
Jan Feb Mar Apr May June July Aug Sept Oct Nov Dec
Temperature 0C - - 11.4 13.1 16.5 20.7 22.1 23.9 18.2 21.8 15.2 15.2 12.7 10.5
EC µS/cm 1500 1500 256 175 245 227 228 190 192 157 161 197.2 193 214
Turbidity NTU 5 5(10) 6 7 3 2 6 7 31 8 9 8 6 2
DO mg/l - - - - - 8.8 7.2 9.7 9.6 8.6 10.2 9.7 - -
TDS mg/l 1000 1000 166 116.1 162 150 150.5 125.4 125 102 106 130.2 127.4 141.2
pH mg/l 6.5-6.8 6.5-6.8 8.6 - - 7.9 8.15 8.62 8.58 7.75 8.4 8.74 8.05 8.4
T. Hardness mg/l 500 500 26.6 36 26.6 22.8 49.4 26 27.44 19.6 19.6 20.4 27.44 31
Calcium mg/l - - 6.1 4.5 7.75 7.8 6.4 4.8 4.704 3.14 3.1 4.12 4.7 4.7
Magnesium mg/l - - 2.8 6 1.87 1 3.7 3.6 3.81 2.86 2.86 2.46 3.81 3.81
T. alkalinity mg/l 500 500 73.2 25.6 38.33 36.2 29.8 25.6 19.07 24.25 24.25 24.25 34.45 31.5
Carbonate mg/l - - <0.1 <0.1 <0.1 <0.1 <0.1 <0.1 <0.1 <0.1 <0.1 <0.1 <0.1 <0.1
Bicarbonate mg/l 89.3 31.2 46.75 44.2 36.4 31.2 23.26 29.6 29.57 19.89 42.21 25.8
Hydroxide mg/l - - <0.1 <0.1 <0.1 <0.1 <0.1 <0.1 <0.1 <0.1 <0.1 <0.1 <0.1 <0.1
Chloride mg/l 250 250 3.1 3.1 2.09 2.1 3.66 3.14 6.28 4.19 8.38 6.52 6.28 5.2
Ammonia mg/l 1.5 1.5 <0.2 <0.2 <0.02 <0.02 <0.02 <0.02 0.03 0.05 0.06 0.04 <0.02 <0.02
T. Phosphate mg/l - - <0.01 0.03 <0.01 <0.01 <0.01 <0.01 0.01 0.13 0.12 0.13 0.18 0.18
Nitrate mg/l 50 50 - - - - - - 2.46 2.47 2.47 3.12 1.6 1.6
Manganese mg/l 0.1 0.2 0.03 <0.01 0.08 0.06 0.08 0.08 0.08 0.03 0.03 0.03 0.01 0.01
Iron mg/l 0.3 0.3 - - - - - - 0.95 0.38 0.29 0.16 0.42 0.18

Environmental Monitoring Report – July-Dec 2021
- 56 -
PUBLIC. This information is being disclosed to the public in accordance with ADB’s Access to Information Policy.
Location: Talamarang
Parameters Units WHOGV NDWQS Months
Jan Feb Mar Apr May June July Aug Sept Oct Nov Dec
Temperature 0C - - 12.5 12.5 17.3 20.9 21.7 24.5 17.5 21.6 16 16 20.5 15
EC µS/cm 1500 1500 241 221 237 224 230 192.1 148.7 158 168 200 215 216
Turbidity NTU 5 5(10) 5 8 4 4 7 8 24 10 7 7 11 9
DO mg/l - - - - - 9.1 8.1 10.1 8.2 8.2 10.1 9.7 - -
TDS mg/l 1000 1000 157 145.9 156 1480 151.8 126.8 96.7 103 111 132 142 142.6
pH mg/l 6.5-6.8 6.5-6.8 8.3 - - 8.1 7.98 8.63 8.45 7.91 8.03 8.77 8.05 8.75
T. Hardness mg/l 500 500 57 34.2 30.4 30.4 38 19 27.44 19.6 19.6 19.6 35.28 34.4
Calcium mg/l - - 16.7 6.1 6.56 8.3 9.6 4 3.136 4.7 4.7 4.704 6.37 5.14
Magnesium mg/l - - 3.7 4.6 2.75 3.3 3.1 3.5 4.76 1.91 1.91 1.88 4.71 4.68
T. alkalinity mg/l 500 500 30.2 29.8 34.07 34.1 34.1 34.1 22.89 29.1 29.1 30.12 47.37 45.8
Carbonate mg/l - - <0.1 <0.1 <0.1 <0.1 <0.1 <0.1 <0.1 <0.1 <0.1 <0.1 <0.1 <0.1
Bicarbonate mg/l - - 36.8 36.4 41.55 51.6 41.6 41.6 27.91 35.5 35.48 24.7 57.77 37.6
Hydroxide mg/l - - <0.1 <0.1 <0.1 <0.1 <0.1 <0.1 <0.1 <0.1 <0.1 <0.1 <0.1 <0.1
Chloride mg/l 250 250 2.1 5.2 4.18 6.2 3.14 2.095 6.28 8.38 10.47 10.47 4.64 6.1
Ammonia mg/l 1.5 1.5 <0.2 <0.2 <0.02 <0.02 <0.02 <0.02 0.03 0.09 0.09 0.09 <0.02 <0.02
T. Phosphate mg/l - - 0.02 <0.01 <0.01 <0.01 <0.01 <0.01 0.02 0.14 0.14 0.16 0.18 0.14
Nitrate mg/l 50 50 - - - - - - 3.31 3.36 3.42 3.32 3.15 3.16
Manganese mg/l 0.1 0.2 <0.01 0.04 0.08 0.08 0.09 0.09 0.03 0.04 0.04 0.04 0.02 0.031
Iron mg/l 0.3 0.3 - - - - - - 0.14 0.38 0.28 0.32 0.31 0.21
Location: Melamchi River at Pulbazar
Parameters Units WHOGV NDWQS Months
Jan Feb Mar Apr May June July Aug Sept Oct Nov Dec
Temperature 0C - - 14.8 14.8 18.8 20.9 24 24.7 20 22.8 18.2 18.2 11.5 17
EC µS/cm 1500 1500 233 244 255 259 263 201 164 172 173 213 216 250
Turbidity NTU 5 5(10) 8 9 4 6 9 14 54 96 10 12 7 6
DO mg/l - - - - - 9.6 8.1 9.8 8.3 7.2 8.7 8.8 - -
TDS mg/l 1000 1000 151 161 168 171 173.6 132.7 107 112 114 140.6 142.6 165
pH mg/l 6.5-6.8 6.5-6.8 8.6 7.9 7.71 8.51 8 7.8 7.98 8.28 8.12 7.75
T. Hardness mg/l 500 500 26.6 34.2 34.2 34.2 34.2 34.2 23.52 19.6 19.6 20 26.6 26.6
Calcium mg/l - - 7.6 6.1 6.06 6.8 10.4 8 4.704 3.14 3.1 3.21 7.57 6.8
Magnesium mg/l - - 1.9 4.6 4.63 4.2 4.2 3.5 2.86 2.86 2.86 2.91 1.87 5.24
T. alkalinity mg/l 500 500 60.3 29.8 34.07 46.8 29.8 21.3 19.07 33.95 33.95 32.45 60.29 58.2
Carbonate mg/l - - <0.1 <0.1 <0.1 <0.1 <0.1 <0.1 <0.1 <0.1 <0.1 <0.1 <0.1 <0.1
Bicarbonate mg/l 73.5 36.4 41.55 38.3 36.4 26 23.26 41.4 41.4 26.61 73.52 47.7
Hydroxide mg/l - - <0.1 <0.1 <0.1 <0.1 <0.1 <0.1 <0.1 <0.1 <0.1 <0.1 <0.1 <0.1
Chloride mg/l 250 250 4.2 4.2 10.2 10.2 4.18 4.18 4.19 8.38 6.28 8.21 4.12 5.32
Ammonia mg/l 1.5 1.5 <0.2 <0.2 <0.02 <0.02 <0.02 <0.02 0.02 0.64 0.66 0.65 <0.02 <0.02
T. Phosphate mg/l - - 0.02 <0.01 0.1 0.15 0.14 0.16 0.02 0.18 0.16 0.14 0.16 0.16
Nitrate mg/l 50 50 - - - - - - 2.5 3.4 3.4 4.44 4.17 5.23
Manganese mg/l 0.1 0.2 0.04 0.03 0.1 0.09 0.06 0.06 0.03 0.02 0.03 0.03 0.34 0.23
Iron mg/l 0.3 0.3 - - - - - - 0.79 0.49 0.31 0.95 0.32 0.56

Environmental Monitoring Report – July-Dec 2021
- 57 -
PUBLIC. This information is being disclosed to the public in accordance with ADB’s Access to Information Policy.
Location: Gyalthum River UPS
Parameters Units WHOGV NDWQS Months
July August Sept
Temperature 0C - - 23.5 19.2 20.3
EC µS/cm 1500 1500 198.5 139.5 166
Turbidity NTU 5 5(10) 4 7 5
DO mg/l - - 9.8 10.7 110
TDS mg/l 1000 1000 129 84 10.1
pH mg/l 6.5-6.8 6.5-6.8 8.58 7.59 7.4
T. Hardness mg/l 500 500 23.52 21.5 23.52
Calcium mg/l - - 1.6 3.1 6.272
Magnesium mg/l - - 4.76 3.81 3.81
T. alkalinity mg/l 500 500 22.89 24.3 24.25
Carbonate mg/l - - <0.1 <0.1 <0.1
Bicarbonate mg/l 27.91 29.6 29.57
Hydroxide mg/l - - <0.1 <0.1 <0.1
Chloride mg/l 250 250 7.329 6.28 6.28
Ammonia mg/l 1.5 1.5 <0.02 <0.02 <0.02
T. Phosphate mg/l - - <0.01 0.14 0.16
Nitrate mg/l 50 50 1.82 1.7 1.7
Manganese mg/l 0.1 0.2 0.03 0.01 0.01
Iron mg/l 0.32 0.54 0.54
Location: Gyalthum River DWS
Parameters Units WHOGV NDWQS Months
Jan Feb Mar Apr May June July Aug Sept Oct Nov Dec
Temperature 0C - - 10.8 12.5 15.5 21.2 20.4 20.6 23 19.6 20.5 21.5 13.2 10
EC µS/cm 1500 1500 315 222 263 289 402 460 257 159 141 179.3 155.2 200
Turbidity NTU 5 5(10) 18 6 3 2 5 12 9 12 6 5 8 2
DO mg/l - - - - - 8.3 6.8 10.1 6.3 6.2 9.7 8.9 - -
TDS mg/l 1000 1000 205 146.5 174 190.7 265.3 303.6 129 103 93 118.1 102.4 132
pH mg/l 6.5-6.8 6.5-6.8 8.5 - - 8 9.81 10.05 8.98 8.04 8.06 8.5 7.7 8.09
T. Hardness mg/l 500 500 38 41.8 26.6 30 41.8 22.8 15.68 19.6 27.44 27.5 23.52 24.5
Calcium mg/l - - 3 6.1 6.1 6.1 6.4 6.4 4.704 4.7 4.704 6.33 4.7 6
Magnesium mg/l - - 7.4 6.5 4.6 3.7 6.3 3.5 0.96 1.91 1.91 2.84 2.86 2.31
T. alkalinity mg/l 500 500 38.8 34.1 29.8 42.6 34.1 38.3 24.8 43.7 29.1 25.87 30.14 31.33
Carbonate mg/l - - <0.1 <0.1 <0.1 <0.1 <0.1 <0.1 <0.1 <0.1 <0.1 <0.1 <0.1 <0.1
Bicarbonate mg/l 47.3 41.6 36.4 52 41.6 46.8 30.24 53.2 35.48 31.56 36.76 38.21
Hydroxide mg/l - - <0.1 <0.1 <0.1 <0.1 <0.1 <0.1 <0.1 <0.1 <0.1 <0.1 <0.1 <0.1
Chloride mg/l 250 250 4.7 5.1 2.1 3.1 2.09 3.14 6.28 4.19 8.38 5.26 2.14 3.16
Ammonia mg/l 1.5 1.5 <0.2 <0.2 <0.02 <0.02 <0.02 <0.02 <0.02 <0.02 <0.02 <0.02 <0.02 <0.02
T. Phosphate mg/l - - 0.02 <0.01 <0.01 <0.01 <0.01 <0.01 <0.01 0.17 0.18 0.16 0.16 0.14
Nitrate mg/l 50 50 - - - - - - 3.14 3 3 1.1 1.3 1.6
Manganese mg/l 0.1 0.2 0.01 0.01 0.05 0.04 0.04 0.02 0.05 0.02 0.02 0.01 0.01 0.01
Iron mg/l 0.3 0.3 - - - - - - 0.72 0.75 0.75 0.52 0.49 0.45
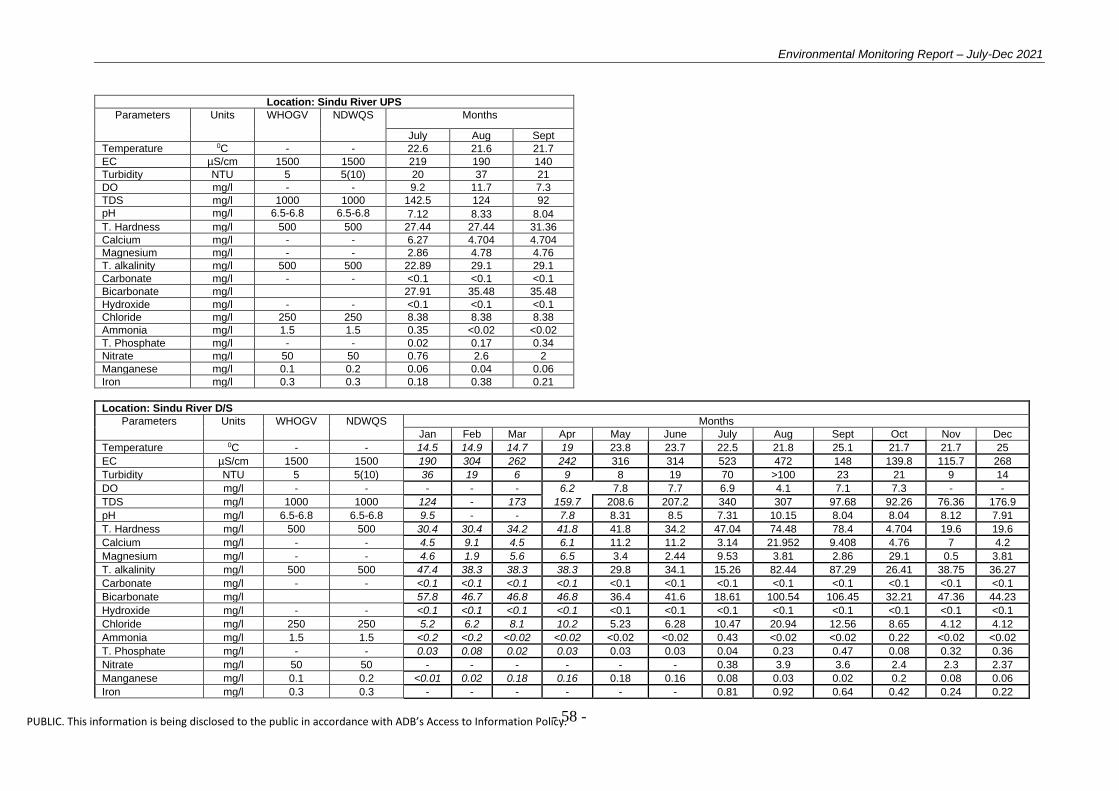
Environmental Monitoring Report – July-Dec 2021
- 58 -
PUBLIC. This information is being disclosed to the public in accordance with ADB’s Access to Information Policy.
Location: Sindu River UPS
Parameters Units WHOGV NDWQS Months
July Aug Sept
Temperature 0C - - 22.6 21.6 21.7
EC µS/cm 1500 1500 219 190 140
Turbidity NTU 5 5(10) 20 37 21
DO mg/l - - 9.2 11.7 7.3
TDS mg/l 1000 1000 142.5 124 92
pH mg/l 6.5-6.8 6.5-6.8 7.12 8.33 8.04
T. Hardness mg/l 500 500 27.44 27.44 31.36
Calcium mg/l - - 6.27 4.704 4.704
Magnesium mg/l - - 2.86 4.78 4.76
T. alkalinity mg/l 500 500 22.89 29.1 29.1
Carbonate mg/l - - <0.1 <0.1 <0.1
Bicarbonate mg/l 27.91 35.48 35.48
Hydroxide mg/l - - <0.1 <0.1 <0.1
Chloride mg/l 250 250 8.38 8.38 8.38
Ammonia mg/l 1.5 1.5 0.35 <0.02 <0.02
T. Phosphate mg/l - - 0.02 0.17 0.34
Nitrate mg/l 50 50 0.76 2.6 2
Manganese mg/l 0.1 0.2 0.06 0.04 0.06
Iron mg/l 0.3 0.3 0.18 0.38 0.21
Location: Sindu River D/S
Parameters Units WHOGV NDWQS Months
Jan Feb Mar Apr May June July Aug Sept Oct Nov Dec
Temperature 0C - - 14.5 14.9 14.7 19 23.8 23.7 22.5 21.8 25.1 21.7 21.7 25
EC µS/cm 1500 1500 190 304 262 242 316 314 523 472 148 139.8 115.7 268
Turbidity NTU 5 5(10) 36 19 6 9 8 19 70 >100 23 21 9 14
DO mg/l - - - - - 6.2 7.8 7.7 6.9 4.1 7.1 7.3 - -
TDS mg/l 1000 1000 124 - 173 159.7 208.6 207.2 340 307 97.68 92.26 76.36 176.9
pH mg/l 6.5-6.8 6.5-6.8 9.5 - - 7.8 8.31 8.5 7.31 10.15 8.04 8.04 8.12 7.91
T. Hardness mg/l 500 500 30.4 30.4 34.2 41.8 41.8 34.2 47.04 74.48 78.4 4.704 19.6 19.6
Calcium mg/l - - 4.5 9.1 4.5 6.1 11.2 11.2 3.14 21.952 9.408 4.76 7 4.2
Magnesium mg/l - - 4.6 1.9 5.6 6.5 3.4 2.44 9.53 3.81 2.86 29.1 0.5 3.81
T. alkalinity mg/l 500 500 47.4 38.3 38.3 38.3 29.8 34.1 15.26 82.44 87.29 26.41 38.75 36.27
Carbonate mg/l - - <0.1 <0.1 <0.1 <0.1 <0.1 <0.1 <0.1 <0.1 <0.1 <0.1 <0.1 <0.1
Bicarbonate mg/l 57.8 46.7 46.8 46.8 36.4 41.6 18.61 100.54 106.45 32.21 47.36 44.23
Hydroxide mg/l - - <0.1 <0.1 <0.1 <0.1 <0.1 <0.1 <0.1 <0.1 <0.1 <0.1 <0.1 <0.1
Chloride mg/l 250 250 5.2 6.2 8.1 10.2 5.23 6.28 10.47 20.94 12.56 8.65 4.12 4.12
Ammonia mg/l 1.5 1.5 <0.2 <0.2 <0.02 <0.02 <0.02 <0.02 0.43 <0.02 <0.02 0.22 <0.02 <0.02
T. Phosphate mg/l - - 0.03 0.08 0.02 0.03 0.03 0.03 0.04 0.23 0.47 0.08 0.32 0.36
Nitrate mg/l 50 50 - - - - - - 0.38 3.9 3.6 2.4 2.3 2.37
Manganese mg/l 0.1 0.2 <0.01 0.02 0.18 0.16 0.18 0.16 0.08 0.03 0.02 0.2 0.08 0.06
Iron mg/l 0.3 0.3 - - - - - - 0.81 0.92 0.64 0.42 0.24 0.22
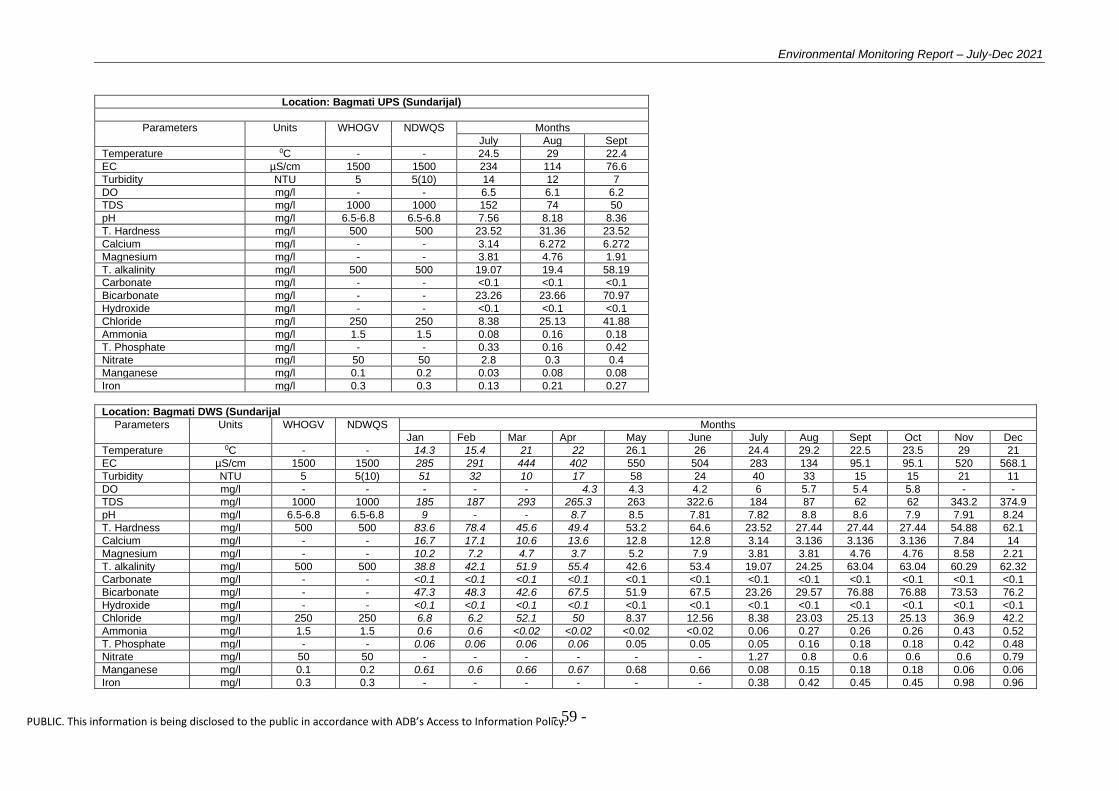
Environmental Monitoring Report – July-Dec 2021
- 59 -
PUBLIC. This information is being disclosed to the public in accordance with ADB’s Access to Information Policy.
Location: Bagmati UPS (Sundarijal)
Parameters Units WHOGV NDWQS Months
July Aug Sept
Temperature 0C - - 24.5 29 22.4
EC µS/cm 1500 1500 234 114 76.6
Turbidity NTU 5 5(10) 14 12 7
DO mg/l - - 6.5 6.1 6.2
TDS mg/l 1000 1000 152 74 50
pH mg/l 6.5-6.8 6.5-6.8 7.56 8.18 8.36
T. Hardness mg/l 500 500 23.52 31.36 23.52
Calcium mg/l - - 3.14 6.272 6.272
Magnesium mg/l - - 3.81 4.76 1.91
T. alkalinity mg/l 500 500 19.07 19.4 58.19
Carbonate mg/l - - <0.1 <0.1 <0.1
Bicarbonate mg/l - - 23.26 23.66 70.97
Hydroxide mg/l - - <0.1 <0.1 <0.1
Chloride mg/l 250 250 8.38 25.13 41.88
Ammonia mg/l 1.5 1.5 0.08 0.16 0.18
T. Phosphate mg/l - - 0.33 0.16 0.42
Nitrate mg/l 50 50 2.8 0.3 0.4
Manganese mg/l 0.1 0.2 0.03 0.08 0.08
Iron mg/l 0.3 0.3 0.13 0.21 0.27
Location: Bagmati DWS (Sundarijal
Parameters Units WHOGV NDWQS Months
Jan Feb Mar Apr May June July Aug Sept Oct Nov Dec
Temperature 0C - - 14.3 15.4 21 22 26.1 26 24.4 29.2 22.5 23.5 29 21
EC µS/cm 1500 1500 285 291 444 402 550 504 283 134 95.1 95.1 520 568.1
Turbidity NTU 5 5(10) 51 32 10 17 58 24 40 33 15 15 21 11
DO mg/l - - - - - 4.3 4.3 4.2 6 5.7 5.4 5.8 - -
TDS mg/l 1000 1000 185 187 293 265.3 263 322.6 184 87 62 62 343.2 374.9
pH mg/l 6.5-6.8 6.5-6.8 9 - - 8.7 8.5 7.81 7.82 8.8 8.6 7.9 7.91 8.24
T. Hardness mg/l 500 500 83.6 78.4 45.6 49.4 53.2 64.6 23.52 27.44 27.44 27.44 54.88 62.1
Calcium mg/l - - 16.7 17.1 10.6 13.6 12.8 12.8 3.14 3.136 3.136 3.136 7.84 14
Magnesium mg/l - - 10.2 7.2 4.7 3.7 5.2 7.9 3.81 3.81 4.76 4.76 8.58 2.21
T. alkalinity mg/l 500 500 38.8 42.1 51.9 55.4 42.6 53.4 19.07 24.25 63.04 63.04 60.29 62.32
Carbonate mg/l - - <0.1 <0.1 <0.1 <0.1 <0.1 <0.1 <0.1 <0.1 <0.1 <0.1 <0.1 <0.1
Bicarbonate mg/l - - 47.3 48.3 42.6 67.5 51.9 67.5 23.26 29.57 76.88 76.88 73.53 76.2
Hydroxide mg/l - - <0.1 <0.1 <0.1 <0.1 <0.1 <0.1 <0.1 <0.1 <0.1 <0.1 <0.1 <0.1
Chloride mg/l 250 250 6.8 6.2 52.1 50 8.37 12.56 8.38 23.03 25.13 25.13 36.9 42.2
Ammonia mg/l 1.5 1.5 0.6 0.6 <0.02 <0.02 <0.02 <0.02 0.06 0.27 0.26 0.26 0.43 0.52
T. Phosphate mg/l - - 0.06 0.06 0.06 0.06 0.05 0.05 0.05 0.16 0.18 0.18 0.42 0.48
Nitrate mg/l 50 50 - - - - - - 1.27 0.8 0.6 0.6 0.6 0.79
Manganese mg/l 0.1 0.2 0.61 0.6 0.66 0.67 0.68 0.66 0.08 0.15 0.18 0.18 0.06 0.06
Iron mg/l 0.3 0.3 - - - - - - 0.38 0.42 0.45 0.45 0.98 0.96

Environmental Monitoring Report – July-Dec 2021
- 60 -
PUBLIC. This information is being disclosed to the public in accordance with ADB’s Access to Information Policy.
Location: MWSDB Canteen Melamchi
Parameters Units WHOGV NDWQS Months
Jan Feb Mar Apr May June July Aug Sept Oct Nov Dec
Physical Parameters
Temperature 0C - - 14.7 16.2 22.5 23 30.1 30 27.1 29 24 24 24 25
EC µS/cm 1500 1500 447 457 451 512 408 405 491 480 504 532 504 504
Turbidity NTU 5 5(10) 3 4 5 4 4 4 3 5 5 4 5 6
DO mg/l - - - - - - 4 6.8 6.1 6.1 6.4 5.3 - -
TDS mg/l 1000 1000 290 301.6 298 338 269.3 267.3 319 312 333 351.1 331.3 332.6
pH mg/l 6.5-6.8 6.5-6.8 8.3 - - 7.8 7.6 7.42 8.01 7.52 7.55 7.84 7.12 7.92
T. Hardness mg/l 500 500 38 57 41.8 45.6 26.3 45.6 54.88 54.88 39.2 42.2 47.04 44.5
Calcium mg/l - - 3 15.1 13.6 15.1 8 9.6 15.68 12.54 12.5 14.12 10.97 12.12
Magnesium mg/l - - 7.4 4.7 1.89 1.9 1.6 5.3 3.81 5.72 1.91 1.68 4.77 6.59
T. alkalinity mg/l 500 500 103.4 55.4 55.37 59.6 34.1 38.3 53.4 63.04 67.89 64.23 64.59 56.1
Carbonate mg/l - - <0.1 <0.1 <0.1 <0.1 <0.1 <0.1 <0.1 <0.1 <0.1 <0.1 <0.1 <0.1
Bicarbonate mg/l 126.1 67.5 67.52 72.7 41.6 46.8 60.48 76.88 82.8 52.67 78.78 68.42
Hydroxide mg/l - - <0.1 <0.1 <0.1 <0.1 <0.1 <0.1 <0.1 <0.1 <0.1 <0.1 <0.1 <0.1
Chloride mg/l 250 250 53.4 24.2 24.2 18.2 9.42 8.37 6.28 18.85 8.38 8.41 10 16
Ammonia mg/l 1.5 1.5 <0.2 <0.2 <0.02 <0.02 <0.02 <0.02 0.05 0.04 0.042 0.038 0.01 <0.02
T. Phosphate mg/l - - 0.16 <0.01 0.02 0.02 0.02 0.02 0.03 0.13 0.15 0.15 0.12 0.14
Nitrate mg/l 50 50
- - 2.63 2.47 0.01 2.86 2.47 2.68
Manganese mg/l 0.1 0.2 0.06 0.07 0.15 0.15 0.16 0.1 0.03 0.01 2.43 0.08 0.01 0.01
Iron mg/l 0.3 0.3 - - - - - - 0.16 0.14 0.16 0.81 0.14 0.14
T. Coliform Cfu/100ml Nil Nil - - - Nil Nil Nil Nil 20
Nil Nil Nil
E. Coli Cfu/100ml Nil Nil - - - Nil Nil Nil Nil 6
Nil Nil Nil

Environmental Monitoring Report – July-Dec 2021
- 61 -
PUBLIC. This information is being disclosed to the public in accordance with ADB’s Access to Information Policy.
Location: MWSDB Sindu Camp
Parameters Units WHOGV NDWQS Months
Jan Feb Mar Apr May June July August Sept Oct Nov
Physical Parameters
Temperature 0C - - 14.3 15.5 23.1 21 27.3 25.1 25.8 20.7 25.1 27..9 25.1
EC µS/cm 1500 1500 219 198 197 193 192 192 195 169 182 200 193
Turbidity NTU 5 5(10) 12 5 5 1 1 2 3 11 4 4 4
DO mg/l - - - - - 6.8 4.82 5.1 6.2 6.2 6.5 6.1 -
TDS mg/l 1000 1000 143 130.7 130 127.4 126.7 126.7 127 110 120 132 127.8
pH mg/l 6.5-6.8 6.5-6.8 8.1 - - 7.7 7.3 8.5 6.4 8.45 7.6 7.97 8.03
T. Hardness mg/l 500 500 34.2 22.8 22.8 19 22.8 34.2 35.28 27.44 31.36 22.1 39.2
Calcium mg/l - - 4.5 3 4.5 3 7.2 11.2 10.97 4.7 4.7 6.52 6.27
Magnesium mg/l - - 5.6 3.7 2.8 2.8 0.8 1.5 1.91 3.81 4.76 1.41 5.72
T. alkalinity mg/l 500 500 60.3 29.8 29.8 29.8 55.4 59.6 30.52 38.8 43.65 34.52 43.65
Carbonate mg/l - - <0.1 <0.1 <0.1 <0.1 <0.1 <0.1 <0.1 <0.1 <0.1 <0.1 <0.1
Bicarbonate mg/l 73.5 36.4 36.4 36.4 67.5 72.7 37.22 47.31 53.23 28.31 53.23
Hydroxide mg/l - - <0.1 <0.1 <0.1 <0.1 <0.1 <0.1 <0.1 <0.1 <0.1 <0.1 <0.1
Chloride mg/l 250 250 2.6 3.1 12.2 14.2 4.18 9.42 10.47 10.47 16.75 4.12 10.47
Ammonia mg/l 1.5 1.5 <0.2 <0.2 <0.02 <0.02 <0.02 <0.02 0.08 0.2 0.2 0.04 <0.02
T. Phosphate mg/l - - 0.09 0.08 0.014 0.016 0.02 0.02 2.61 0.2 0.22 0.18 0.47
Nitrate mg/l 50 50 - - - - - - 0.68 1.28 1.32 0.78 2.7
Manganese mg/l 0.1 0.2 0.04 0.04 0.1 0.09 0.08 0.06 0.03 0.1 0.1 0.04 0.02
Iron mg/l 0.3 0.3 - - - - - - 0.05 0.12 0.12 0.18 0.62
T. Coliform Cfu/100ml Nil Nil - - - Nil Nil Nil Nil 3 7 Nil 5
E. Coli Cfu/100ml Nil Nil - - - Nil Nil Nil Nil Nil Nil Nil Nil

Environmental Monitoring Report – July-Dec 2021
- 62 -
PUBLIC. This information is being disclosed to the public in accordance with ADB’s Access to Information Policy.
Station: Gyalthum camp
Parameters Units WHO GV NDWQS May June July August Sept
Temperature 0C - - 26.7 30 27.6 28.4 21.2
EC µS/cm 1500 1500 276 295 198 198 190
Turbidity NTU 5 5 (10) 3 5 4 1 3
TDS mg/l 1000 1000 182.2 194.7 129 127 125
DO mg/l - - 6.8 9 6.1 6.8 6.2
pH 6.5-8.5 6.5-8.5 8.32 8.89 7.77 7.7 7.64
T. Hardness mg/l 500 500 32.1 32.6 19.6 19.6 19.6
Calcium mg/l - 200 6.8 6.4 6.27 6.27 6.3
Magnesium mg/l - - 3.7 4 0.96 0.96 0.96
T. Alkalinity mg/l 500 - 55.5 46.9 41.87 33.95 33.95
Carbonate mg/l - - <0.1 <0.1 <0.1 <0.1 <0.1
Bicarbonate mg/l - - 31.1 57.1 34.33 41.4 41.4
Hydroxide mg/l - - <0.1 <0.1 <0.1 <0.1 <0.1
Chloride mg/l 250 250 4.21 10.47 8.37 14.66 4.19
Ammonia mg/l 1.5 1.5 <o.2 <0.2 0.06 0.04 0.02
T. Phosphate mg/l - - 0.02 0.01 0.08 0.2 0.2
Manganese mg/l 0.1 0.2 0.06 0.04 0.05 0.04 0.76
Nirtate mg/l 50 50 - - 2.29 0.77 0.04
Iron mg/l 0.3 0.3 - - 0.12 0.06 0.07
Total coliform Cfu/100ml Nil Nil TMTC Nil Nil Nil 3
E. coli Cfu/100ml Nil Nil TMTC Nil Nil Nil 3

Environmental Monitoring Report – July-Dec 2021
- 63 -
PUBLIC. This information is being disclosed to the public in accordance with ADB’s Access to Information Policy.
WATER QUALITY ASSESSMENT OF DIFFERENT LOCATIONS IN 2013
Parameters Units WHO GV
NDWQS Melamchi at Ambathan (Intake)
Jan Feb Mar Apr May Jun Jul Aug Sept Oct Nov Dec
Date and Time Jan 8 at 12:15
Feb 20 at 12:20
Mar 19 at 13:24
Apr11at 11:00
May 15 at 11:30
June 15 at 9:30
July 24 at 10:30
Aug 22 at 12:30
Sept 19 at 11:30
Oct 16 at 11:40
Nov 20 at 11:00
Dec 24 at 11:35
Physical
Temperature 0C - - 12 13 12 13 14.2 15 16 13 14 11 10 8
EC µS/cm 1500 1500 252 349 224 220 211 178.5 175 201 193.45 196.2 145.2 229
Turbidity NTU 5 5 (10) <1.0 4 1 1 2 4 4 5 1 1 2 1
TDS mg/l 1000 1000 166.3 230 147.84 145 139.26 117.8 115.5 132.6 127.7 129.49 220 151.14
DO mg/l - - - 7.1 - - 6.8 7 6.5 6.5 10.7 10.5 6.4 8.6
Chemical
pH - 6.5-8.5 6.5-8.5 7.04 7.45 7.8 6.9 8.71 7.61 7.52 8.5 7.29 7.29 7.5 7.9
T. Hardness mg/l 500 500 27.44 27 43.12 40 23.52 19.6 20 23.52 23.52 20 27.44 19.6
Calcium mg/l - 200 3.14 3.16 10.97 8.41 6.27 4.7 5 6.27 6.27 6 7.84 7.84
Magnesium mg/l - - 1 1 3.82 7.06 1.91 1.91 2 1.91 1.91 2.43 1.91 1.91
T. Alkalinity mg/l 500 - 30.15 29 38.76 36 30.15 25.84 22 25.84 25.84 20 51.7 34.45
Carbonate mg/l - - <0.1 <0.1 <0.1 <0.1 <0.1 <0.1 <0.1 <0.1 <0.1 <0.1 <0.1 <0.1
Bicarbonate mg/l - - 36.76 24 47.28 44.5 36.76 31.51 27 31.51 31.51 25 63.02 42.016
Hydroxide mg/l - - <0.1 <0.1 <0.1 <0.1 <0.1 <0.1 <0.1 <0.1 <0.1 <0.1 <0.1 <0.1
Chloride mg/l 250 250 4.12 2.14 6.8 5.12 4.19 4.12 2.5 4.12 3.14 3.12 3.14 6.282
Ammonia mg/l 1.5 1.5 <0.2 <0.2 <0.02 <0.02 <0.02 <0.02 <0.02 <0.02 <0.02 <0.02 <0.02 <0.02
T. Phosphate mg/l - - <0.1 0.02 0.14 0.02 0.01 0.01 <0.01 0.02 0.01 0.01 0.02 0.01
Manganese mg/l 0.1 0.2 0.01 <0.01 0.012 <0.1 <0.1 <0.1 <0.1 <0.1 <0.1 <0.1 <0.1 <0.1
Nitrate mg/l 50 50 1.2 0.1 1.1 0.2 0.67 0.68 0.1 0.52 1.2 0.14 1.24 1
Total Iron mg/l 0.3 0.3 0.05 0.04 0.38 0.32 0.31 0.32 0.32 0.32 0.3 0.06 0.32 0.07
Microbiological
Total Coliform Cfu/100ml Nil Nil - - - - 11 42 114 24 95 40 84 26
E coli Cfu/100ml Nil Nil - - - - 4 11 24 8 54 3 45 20

Environmental Monitoring Report – July-Dec 2021
- 64 -
PUBLIC. This information is being disclosed to the public in accordance with ADB’s Access to Information Policy.
Parameters Units WHO GV
NDWQS Melamchi at Gyalthum
Jan Feb Mar Apr May Jun Jul Aug Sept Oct Nov Dec
Date and Time Jan 8 at
14:05 Feb 20 at
13:45 Mar 19 at
14:56 Apr 11 at
12:00 Mey 15 at
9:30 June 15 at
10:30 July 24 at
11:30 Aug 22 at
14:00 Sept 19 at
9:30 Oct 16 at
9:35 Nov 20 at
13:30 Dec 24 at
8:30
Physical
Temperature 0C - - 13.1 14.9 12.7 12.7 17.6 20 22 18 20 18 16.3 11
EC µS/cm 1500 1500 220 240 193 192 220 176.7 180 215 196.3 201 131.34 201
Turbidity NTU 5 5 (10) 1 9 1 1 5 7 10 10 2 3 4 1
TDS mg/l 1000 1000 145.2 158 127.38 127 145.2 116.6 118.8 141.9 129.6 132.66 199 132.66
DO mg/l - - - 6.9 - - 6.9 6.9 6.9 6.5 8.5 8.5 8.6 12.9
Chemical
pH - 6.5-8.5 6.5-8.5 8.43 8.48 8.05 7.4 7.61 7.5 7.5 7.23 8.5 8.4 8.1 7.77
T. Hardness mg/l 500 500 31.36 32 39.2 40 23.52 27.44 24 20 27.44 24 39.2 35.28
Calcium mg/l - 200 3.14 6 6.27 8.6 9.41 4.7 5.2 4.7 4.7 4.5 6.272 6.272
Magnesium mg/l - - 2.21 3.59 5.72 7.36 0.01 3.81 2.8 1.91 3.81 3.1 5.72 4.77
T. Alkalinity mg/l 500 - 28 23.89 34.45 31 30.15 25.84 28 25.84 30.15 31.4 30.1 30.15
Carbonate mg/l - - <0.1 <0.1 <0.1 <0.1 <0.1 <0.1 <0.1 <0.1 <0.1 <0.1 <0.1 <0.1
Bicarbonate mg/l - - 39.39 36.2 42.01 38 36.76 31.51 34 31.51 36.76 25.75 36.76 36.764
Hydroxide mg/l - - <0.1 <0.1 <0.1 <0.1 <0.1 <0.1 <0.1 <0.1 <0.1 <0.1 <0.1 <0.1
Chloride mg/l 250 250 5.2 4.16 8.22 2.4 6.28 5.12 6.2 3.12 4.12 4.12 4.12 4.188
Ammonia mg/l 1.5 1.5 0.05 <0.2 <0.02 <0.02 <0.02 <0.02 <0.02 <0.02 <0.02 <0.02 <0.02 <0.02
T. Phosphate mg/l - - 0.016 0.05 0.16 0.08 0.01 0.01 0.01 0.016 0.01 0.02 0.01 0.02
Manganese mg/l 0.1 0.2 0.01 0.01 0.01 <0.1 <0.1 <0.1 <0.1 <0.1 <0.1 <0.1 <0.1 <0.1
Nitrate mg/l 50 50 1.6 1.1 1.8 0.8 1.24 0.87 0.8 2.1 0.84 0.62 0.96 0.82
Total Iron mg/l 0.3 0.3 0.05 0.05 0.92 0.1 0.31 0.3 0.3 0.25 0.3 0.13 0.26 0.04
Microbiological
Total Coliform Cfu/100ml Nil Nil - - - - 18 55 117 39 TMTC 181 340 54
E coli Cfu/100ml Nil Nil - - - - 7 17 26 12 54 110 130 30
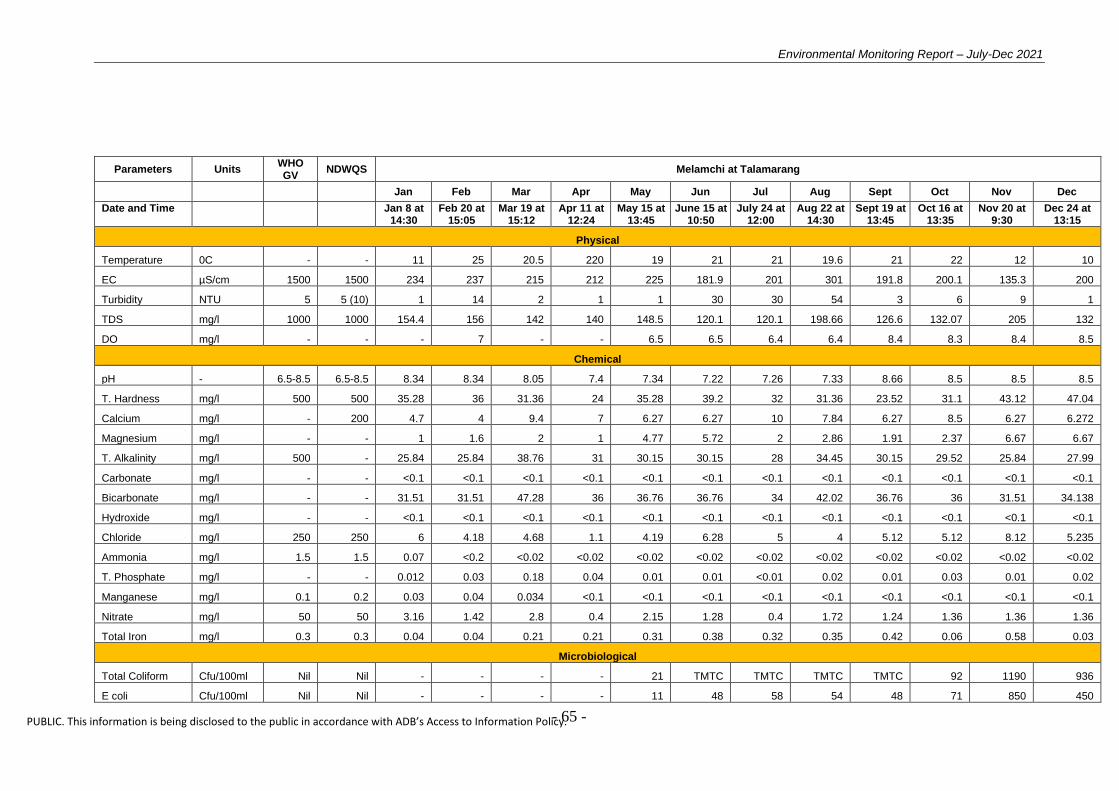
Environmental Monitoring Report – July-Dec 2021
- 65 -
PUBLIC. This information is being disclosed to the public in accordance with ADB’s Access to Information Policy.
Parameters Units WHO GV
NDWQS Melamchi at Talamarang
Jan Feb Mar Apr May Jun Jul Aug Sept Oct Nov Dec
Date and Time Jan 8 at 14:30
Feb 20 at 15:05
Mar 19 at 15:12
Apr 11 at 12:24
May 15 at 13:45
June 15 at 10:50
July 24 at 12:00
Aug 22 at 14:30
Sept 19 at 13:45
Oct 16 at 13:35
Nov 20 at 9:30
Dec 24 at 13:15
Physical
Temperature 0C - - 11 25 20.5 220 19 21 21 19.6 21 22 12 10
EC µS/cm 1500 1500 234 237 215 212 225 181.9 201 301 191.8 200.1 135.3 200
Turbidity NTU 5 5 (10) 1 14 2 1 1 30 30 54 3 6 9 1
TDS mg/l 1000 1000 154.4 156 142 140 148.5 120.1 120.1 198.66 126.6 132.07 205 132
DO mg/l - - - 7 - - 6.5 6.5 6.4 6.4 8.4 8.3 8.4 8.5
Chemical
pH - 6.5-8.5 6.5-8.5 8.34 8.34 8.05 7.4 7.34 7.22 7.26 7.33 8.66 8.5 8.5 8.5
T. Hardness mg/l 500 500 35.28 36 31.36 24 35.28 39.2 32 31.36 23.52 31.1 43.12 47.04
Calcium mg/l - 200 4.7 4 9.4 7 6.27 6.27 10 7.84 6.27 8.5 6.27 6.272
Magnesium mg/l - - 1 1.6 2 1 4.77 5.72 2 2.86 1.91 2.37 6.67 6.67
T. Alkalinity mg/l 500 - 25.84 25.84 38.76 31 30.15 30.15 28 34.45 30.15 29.52 25.84 27.99
Carbonate mg/l - - <0.1 <0.1 <0.1 <0.1 <0.1 <0.1 <0.1 <0.1 <0.1 <0.1 <0.1 <0.1
Bicarbonate mg/l - - 31.51 31.51 47.28 36 36.76 36.76 34 42.02 36.76 36 31.51 34.138
Hydroxide mg/l - - <0.1 <0.1 <0.1 <0.1 <0.1 <0.1 <0.1 <0.1 <0.1 <0.1 <0.1 <0.1
Chloride mg/l 250 250 6 4.18 4.68 1.1 4.19 6.28 5 4 5.12 5.12 8.12 5.235
Ammonia mg/l 1.5 1.5 0.07 <0.2 <0.02 <0.02 <0.02 <0.02 <0.02 <0.02 <0.02 <0.02 <0.02 <0.02
T. Phosphate mg/l - - 0.012 0.03 0.18 0.04 0.01 0.01 <0.01 0.02 0.01 0.03 0.01 0.02
Manganese mg/l 0.1 0.2 0.03 0.04 0.034 <0.1 <0.1 <0.1 <0.1 <0.1 <0.1 <0.1 <0.1 <0.1
Nitrate mg/l 50 50 3.16 1.42 2.8 0.4 2.15 1.28 0.4 1.72 1.24 1.36 1.36 1.36
Total Iron mg/l 0.3 0.3 0.04 0.04 0.21 0.21 0.31 0.38 0.32 0.35 0.42 0.06 0.58 0.03
Microbiological
Total Coliform Cfu/100ml Nil Nil - - - - 21 TMTC TMTC TMTC TMTC 92 1190 936
E coli Cfu/100ml Nil Nil - - - - 11 48 58 54 48 71 850 450
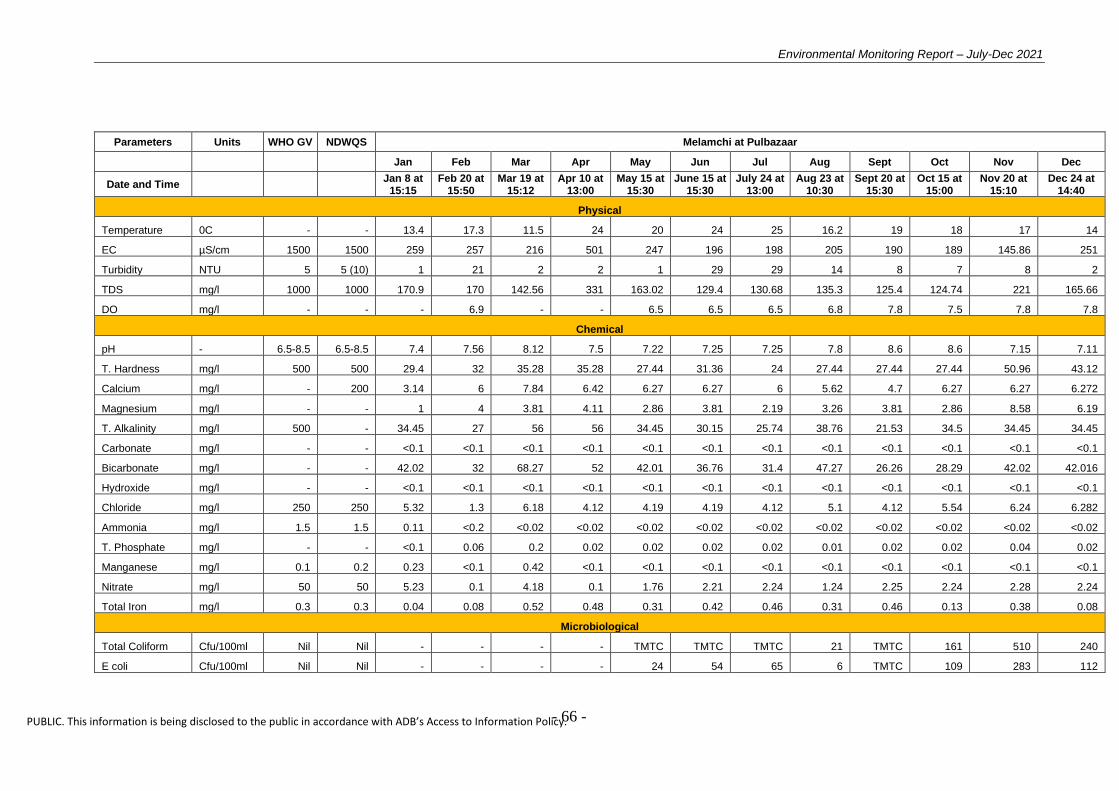
Environmental Monitoring Report – July-Dec 2021
- 66 -
PUBLIC. This information is being disclosed to the public in accordance with ADB’s Access to Information Policy.
Parameters Units WHO GV NDWQS Melamchi at Pulbazaar
Jan Feb Mar Apr May Jun Jul Aug Sept Oct Nov Dec
Date and Time Jan 8 at 15:15
Feb 20 at 15:50
Mar 19 at 15:12
Apr 10 at 13:00
May 15 at 15:30
June 15 at 15:30
July 24 at 13:00
Aug 23 at 10:30
Sept 20 at 15:30
Oct 15 at 15:00
Nov 20 at 15:10
Dec 24 at 14:40
Physical
Temperature 0C - - 13.4 17.3 11.5 24 20 24 25 16.2 19 18 17 14
EC µS/cm 1500 1500 259 257 216 501 247 196 198 205 190 189 145.86 251
Turbidity NTU 5 5 (10) 1 21 2 2 1 29 29 14 8 7 8 2
TDS mg/l 1000 1000 170.9 170 142.56 331 163.02 129.4 130.68 135.3 125.4 124.74 221 165.66
DO mg/l - - - 6.9 - - 6.5 6.5 6.5 6.8 7.8 7.5 7.8 7.8
Chemical
pH - 6.5-8.5 6.5-8.5 7.4 7.56 8.12 7.5 7.22 7.25 7.25 7.8 8.6 8.6 7.15 7.11
T. Hardness mg/l 500 500 29.4 32 35.28 35.28 27.44 31.36 24 27.44 27.44 27.44 50.96 43.12
Calcium mg/l - 200 3.14 6 7.84 6.42 6.27 6.27 6 5.62 4.7 6.27 6.27 6.272
Magnesium mg/l - - 1 4 3.81 4.11 2.86 3.81 2.19 3.26 3.81 2.86 8.58 6.19
T. Alkalinity mg/l 500 - 34.45 27 56 56 34.45 30.15 25.74 38.76 21.53 34.5 34.45 34.45
Carbonate mg/l - - <0.1 <0.1 <0.1 <0.1 <0.1 <0.1 <0.1 <0.1 <0.1 <0.1 <0.1 <0.1
Bicarbonate mg/l - - 42.02 32 68.27 52 42.01 36.76 31.4 47.27 26.26 28.29 42.02 42.016
Hydroxide mg/l - - <0.1 <0.1 <0.1 <0.1 <0.1 <0.1 <0.1 <0.1 <0.1 <0.1 <0.1 <0.1
Chloride mg/l 250 250 5.32 1.3 6.18 4.12 4.19 4.19 4.12 5.1 4.12 5.54 6.24 6.282
Ammonia mg/l 1.5 1.5 0.11 <0.2 <0.02 <0.02 <0.02 <0.02 <0.02 <0.02 <0.02 <0.02 <0.02 <0.02
T. Phosphate mg/l - - <0.1 0.06 0.2 0.02 0.02 0.02 0.02 0.01 0.02 0.02 0.04 0.02
Manganese mg/l 0.1 0.2 0.23 <0.1 0.42 <0.1 <0.1 <0.1 <0.1 <0.1 <0.1 <0.1 <0.1 <0.1
Nitrate mg/l 50 50 5.23 0.1 4.18 0.1 1.76 2.21 2.24 1.24 2.25 2.24 2.28 2.24
Total Iron mg/l 0.3 0.3 0.04 0.08 0.52 0.48 0.31 0.42 0.46 0.31 0.46 0.13 0.38 0.08
Microbiological
Total Coliform Cfu/100ml Nil Nil - - - - TMTC TMTC TMTC 21 TMTC 161 510 240
E coli Cfu/100ml Nil Nil - - - - 24 54 65 6 TMTC 109 283 112
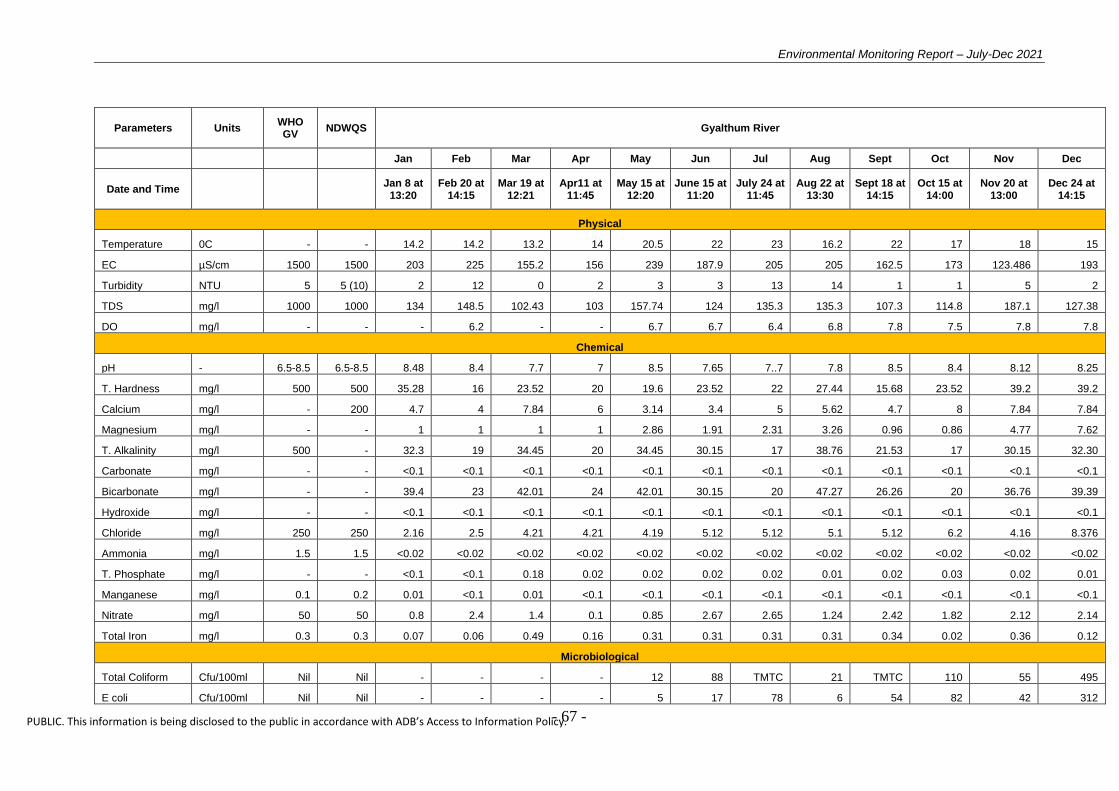
Environmental Monitoring Report – July-Dec 2021
- 67 -
PUBLIC. This information is being disclosed to the public in accordance with ADB’s Access to Information Policy.
Parameters Units WHO GV
NDWQS Gyalthum River
Jan Feb Mar Apr May Jun Jul Aug Sept Oct Nov Dec
Date and Time Jan 8 at 13:20
Feb 20 at 14:15
Mar 19 at 12:21
Apr11 at 11:45
May 15 at 12:20
June 15 at 11:20
July 24 at 11:45
Aug 22 at 13:30
Sept 18 at 14:15
Oct 15 at 14:00
Nov 20 at 13:00
Dec 24 at 14:15
Physical
Temperature 0C - - 14.2 14.2 13.2 14 20.5 22 23 16.2 22 17 18 15
EC µS/cm 1500 1500 203 225 155.2 156 239 187.9 205 205 162.5 173 123.486 193
Turbidity NTU 5 5 (10) 2 12 0 2 3 3 13 14 1 1 5 2
TDS mg/l 1000 1000 134 148.5 102.43 103 157.74 124 135.3 135.3 107.3 114.8 187.1 127.38
DO mg/l - - - 6.2 - - 6.7 6.7 6.4 6.8 7.8 7.5 7.8 7.8
Chemical
pH - 6.5-8.5 6.5-8.5 8.48 8.4 7.7 7 8.5 7.65 7..7 7.8 8.5 8.4 8.12 8.25
T. Hardness mg/l 500 500 35.28 16 23.52 20 19.6 23.52 22 27.44 15.68 23.52 39.2 39.2
Calcium mg/l - 200 4.7 4 7.84 6 3.14 3.4 5 5.62 4.7 8 7.84 7.84
Magnesium mg/l - - 1 1 1 1 2.86 1.91 2.31 3.26 0.96 0.86 4.77 7.62
T. Alkalinity mg/l 500 - 32.3 19 34.45 20 34.45 30.15 17 38.76 21.53 17 30.15 32.30
Carbonate mg/l - - <0.1 <0.1 <0.1 <0.1 <0.1 <0.1 <0.1 <0.1 <0.1 <0.1 <0.1 <0.1
Bicarbonate mg/l - - 39.4 23 42.01 24 42.01 30.15 20 47.27 26.26 20 36.76 39.39
Hydroxide mg/l - - <0.1 <0.1 <0.1 <0.1 <0.1 <0.1 <0.1 <0.1 <0.1 <0.1 <0.1 <0.1
Chloride mg/l 250 250 2.16 2.5 4.21 4.21 4.19 5.12 5.12 5.1 5.12 6.2 4.16 8.376
Ammonia mg/l 1.5 1.5 <0.02 <0.02 <0.02 <0.02 <0.02 <0.02 <0.02 <0.02 <0.02 <0.02 <0.02 <0.02
T. Phosphate mg/l - - <0.1 <0.1 0.18 0.02 0.02 0.02 0.02 0.01 0.02 0.03 0.02 0.01
Manganese mg/l 0.1 0.2 0.01 <0.1 0.01 <0.1 <0.1 <0.1 <0.1 <0.1 <0.1 <0.1 <0.1 <0.1
Nitrate mg/l 50 50 0.8 2.4 1.4 0.1 0.85 2.67 2.65 1.24 2.42 1.82 2.12 2.14
Total Iron mg/l 0.3 0.3 0.07 0.06 0.49 0.16 0.31 0.31 0.31 0.31 0.34 0.02 0.36 0.12
Microbiological
Total Coliform Cfu/100ml Nil Nil - - - - 12 88 TMTC 21 TMTC 110 55 495
E coli Cfu/100ml Nil Nil - - - - 5 17 78 6 54 82 42 312
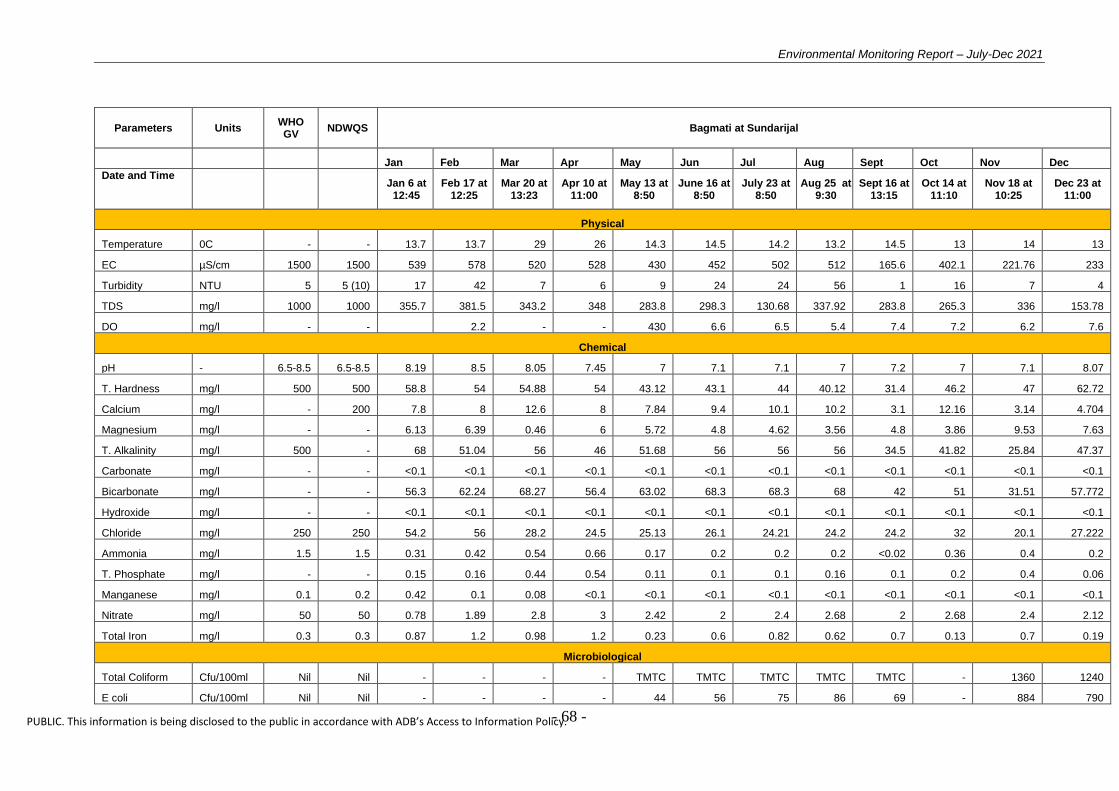
Environmental Monitoring Report – July-Dec 2021
- 68 -
PUBLIC. This information is being disclosed to the public in accordance with ADB’s Access to Information Policy.
Parameters Units WHO GV
NDWQS Bagmati at Sundarijal
Jan Feb Mar Apr May Jun Jul Aug Sept Oct Nov Dec
Date and Time Jan 6 at
12:45 Feb 17 at
12:25 Mar 20 at
13:23 Apr 10 at
11:00 May 13 at
8:50 June 16 at
8:50 July 23 at
8:50 Aug 25 at
9:30 Sept 16 at
13:15 Oct 14 at
11:10 Nov 18 at
10:25 Dec 23 at
11:00
Physical
Temperature 0C - - 13.7 13.7 29 26 14.3 14.5 14.2 13.2 14.5 13 14 13
EC µS/cm 1500 1500 539 578 520 528 430 452 502 512 165.6 402.1 221.76 233
Turbidity NTU 5 5 (10) 17 42 7 6 9 24 24 56 1 16 7 4
TDS mg/l 1000 1000 355.7 381.5 343.2 348 283.8 298.3 130.68 337.92 283.8 265.3 336 153.78
DO mg/l - - 2.2 - - 430 6.6 6.5 5.4 7.4 7.2 6.2 7.6
Chemical
pH - 6.5-8.5 6.5-8.5 8.19 8.5 8.05 7.45 7 7.1 7.1 7 7.2 7 7.1 8.07
T. Hardness mg/l 500 500 58.8 54 54.88 54 43.12 43.1 44 40.12 31.4 46.2 47 62.72
Calcium mg/l - 200 7.8 8 12.6 8 7.84 9.4 10.1 10.2 3.1 12.16 3.14 4.704
Magnesium mg/l - - 6.13 6.39 0.46 6 5.72 4.8 4.62 3.56 4.8 3.86 9.53 7.63
T. Alkalinity mg/l 500 - 68 51.04 56 46 51.68 56 56 56 34.5 41.82 25.84 47.37
Carbonate mg/l - - <0.1 <0.1 <0.1 <0.1 <0.1 <0.1 <0.1 <0.1 <0.1 <0.1 <0.1 <0.1
Bicarbonate mg/l - - 56.3 62.24 68.27 56.4 63.02 68.3 68.3 68 42 51 31.51 57.772
Hydroxide mg/l - - <0.1 <0.1 <0.1 <0.1 <0.1 <0.1 <0.1 <0.1 <0.1 <0.1 <0.1 <0.1
Chloride mg/l 250 250 54.2 56 28.2 24.5 25.13 26.1 24.21 24.2 24.2 32 20.1 27.222
Ammonia mg/l 1.5 1.5 0.31 0.42 0.54 0.66 0.17 0.2 0.2 0.2 <0.02 0.36 0.4 0.2
T. Phosphate mg/l - - 0.15 0.16 0.44 0.54 0.11 0.1 0.1 0.16 0.1 0.2 0.4 0.06
Manganese mg/l 0.1 0.2 0.42 0.1 0.08 <0.1 <0.1 <0.1 <0.1 <0.1 <0.1 <0.1 <0.1 <0.1
Nitrate mg/l 50 50 0.78 1.89 2.8 3 2.42 2 2.4 2.68 2 2.68 2.4 2.12
Total Iron mg/l 0.3 0.3 0.87 1.2 0.98 1.2 0.23 0.6 0.82 0.62 0.7 0.13 0.7 0.19
Microbiological
Total Coliform Cfu/100ml Nil Nil - - - - TMTC TMTC TMTC TMTC TMTC - 1360 1240
E coli Cfu/100ml Nil Nil - - - - 44 56 75 86 69 - 884 790

Environmental Monitoring Report – July-Dec 2021
- 69 -
PUBLIC. This information is being disclosed to the public in accordance with ADB’s Access to Information Policy.
Parameters Units WHO GV NDWQS Sindhu River
Jan Feb Mar Apr May Jun Jul Aug Sept Oct Nov Dec
Date and Time Jan 7 at 16:25
Feb 21 at 12:25
Mar 20 at 9:24
Apr 12 at 11:00
May 13 at 10:25
June 16 at 11:25
July 25 at 11:25
Aug 19 at 8:20
Sept 16 at 15:15
Oct 14 at 15:10
Nov 18 at 13:15
Dec 23 at 13:00
Physical
Temperature 0C - - 13.5 18.5 21.7 22 20.6 19.6 20 21.6 16 15 15 14
EC µS/cm 1500 1500 189 172 115.7 120 308 228 230 310 183.2 182.3 135.3 133
Turbidity NTU 5 5 (10) 4 32 3 4 5 5 15 15 2 2 4 4
TDS mg/l 1000 1000 124.7 113.5 76.36 79 203.28 150.5 151.8 204.6 120.9 120.32 205 198.4
DO mg/l - - - 6.4 - - 308 7.1 7.3 6.3 7.6 7.6 7.5 7.5
Chemical
pH - 6.5-8.5 6.5-8.5 7.93 7.93 7.75 6.9 7.11 7.95 7.52 7.12 7.6 7.6 7.5 7.5
T. Hardness mg/l 500 500 15.68 28 43.12 38 23.52 23.52 20 35.28 27.44 25.75 27.44 27
Calcium mg/l - 200 7.4 8 9.4 8 6.27 3.4 6 7.84 3.14 5.24 4.7 4.7
Magnesium mg/l - - 2.21 2 0.39 0.39 1.91 3.21 1 2.86 4.76 3.08 3.81 3.8
T. Alkalinity mg/l 500 - 25.84 30 43.06 41 34.45 34.45 31 25.84 25.84 26 25.84 24.6
Carbonate mg/l - - <0.1 <0.1 <0.1 <0.1 <0.1 <0.1 <0.1 <0.1 <0.1 <0.1 <0.1 <0.1
Bicarbonate mg/l - - 31.5 36 52.52 50 42.02 34.45 36 31.51 31.51 32 31.51 32.5
Hydroxide mg/l - - <0.1 <0.1 <0.1 <0.1 <0.1 <0.1 <0.1 <0.1 <0.1 <0.1 <0.1 <0.1
Chloride mg/l 250 250 4.18 3.6 4.12 2.14 8.38 8.38 8.5 10.1 10.2 12.1 10.2 11.2
Ammonia mg/l 1.5 1.5 0.11 0.1 <0.02 <0.02 0.18 0.2 0.14 <0.02 0.24 0.2 0.24 0.24
T. Phosphate mg/l - - <0.1 0.13 0.34 0.06 0.01 0.01 0.01 0.01 0.01 0.01 0.01 0.01
Manganese mg/l 0.1 0.2 0.06 <0.1 0.06 <0.1 <0.1 <0.1 <0.1 <0.1 <0.1 <0.1 <0.1 <0.1
Nitrate mg/l 50 50 2.51 0.2 0.8 0.2 2.4 2.46 2.24 2.6 2.42 2.12 2.42 2.22
Total Iron mg/l 0.3 0.3 0.04 0.04 0.24 0.22 0.5 0.46 0.44 0.5 0.42 0.19 0.42 0.42
Microbiological
Total Coliform Cfu/100ml Nil Nil - - - - 42 56 119 69 89 - 110 120
E coli Cfu/100ml Nil Nil - - - - 18 18 27 19 44 - 45 50

Environmental Monitoring Report – July-Dec 2021
- 70 -
PUBLIC. This information is being disclosed to the public in accordance with ADB’s Access to Information Policy.
Parameters Units WHO GV NDWQS Sindhu Camp
Jan Feb Mar Apr May Jun Jul Aug Sept Oct Nov Dec
Date and Time Feb 21 at 12:45
Mar 20 at 9:39
Apr 12 at 11:15
May 13 at 10:30
June 16 at 11:20
July 16 at 11:20
Aug 19 at 8:00
Sept 16 at 15:30
Oct 14 at 13:15
Nov 18 at 13:15
Dec 23 at 13:15
Physical
Temperature 0C - - - 18.8 25.1 25.7 16.7 18 20 16.7 16 14 14 22
EC µS/cm 1500 1500 - 370 193 201 193 187.4 189.2 200 165.6 168.2 87.12 260.4
Turbidity NTU 5 5 (10) - 4 2 2 1 4 5 1 1 1 1 1
TDS mg/l 1000 1000 - 244.2 127.8 133 127.38 123.68 124.74 132 109.3 11.01 132 300
DO mg/l - - - 2.4 - - 193 7.5 6.4 5.8 7.4 7.4 6.8 6.3
Chemical
pH - 6.5-8.5 6.5-8.5 - 7.54 8.25 7.7 7.06 7.28 7.42 7.5 7..5 7..5 7.42 7.5
T. Hardness mg/l 500 500 - 48 35.28 31 19.6 19.6 28 27.44 19.6 20 31.36 54.9
Calcium mg/l - 200 - 8 9.4 7 3.14 3.14 8 4.7 3.14 4 8.4 6.7
Magnesium mg/l - - - 6.93 0.23 5.61 2.86 2.86 2 3.81 2.86 2.43 8.2 3.6
T. Alkalinity mg/l 500 - - 67.24 34.45 49 30.15 30.15 39 25.84 28 29.52 30.15 45.3
Carbonate mg/l - - - <0.1 <0.1 <0.1 <0.1 <0.1 <0.1 <0.1 <0.1 <0.1 <0.1 <0.1
Bicarbonate mg/l - - - 82 68.27 60.27 36.76 36.76 41 31.51 34.14 36 36.76 58.2
Hydroxide mg/l - - - <0.1 <0.1 <0.1 <0.1 <0.1 <0.1 <0.1 <0.1 <0.1 <0.1 <0.1
Chloride mg/l 250 250 - 4.2 10.47 10.47 18.85 16.12 12.14 14.85 14.2 12.2 16.2 12.32
Ammonia mg/l 1.5 1.5 - <0.2 <0.02 <0.02 0.18 0.22 0.2 <0.02 <0.2 <0.2 <0.2 <0.2
T. Phosphate mg/l - - - 0.2 0.47 0.4 0.05 0.06 <0.1 0.06 0.08 0.06 0.06 0.02
Manganese mg/l 0.1 0.2 - <0.1 0.04 <0.1 <0.1 <0.1 <0.1 <0.1 <0.1 <0.1 <0.1 <0.1
Nitrate mg/l 50 50 - 0.4 1.8 0.8 2.39 2.49 0.2 2.48 2.5 0.12 2.4 1.7
Total Iron mg/l 0.3 0.3 - 0.06 0.92 0.86 0.03 0.034 0.12 0.03 0.03 0.16 0.12 0.14
Microbiological
Total Coliform Cfu/100ml Nil Nil - - - - Nil Nil Nil Nil Nil Nil Nil Nil
E coli Cfu/100ml Nil Nil - - - - Nil Nil Nil Nil Nil Nil Nil Nil
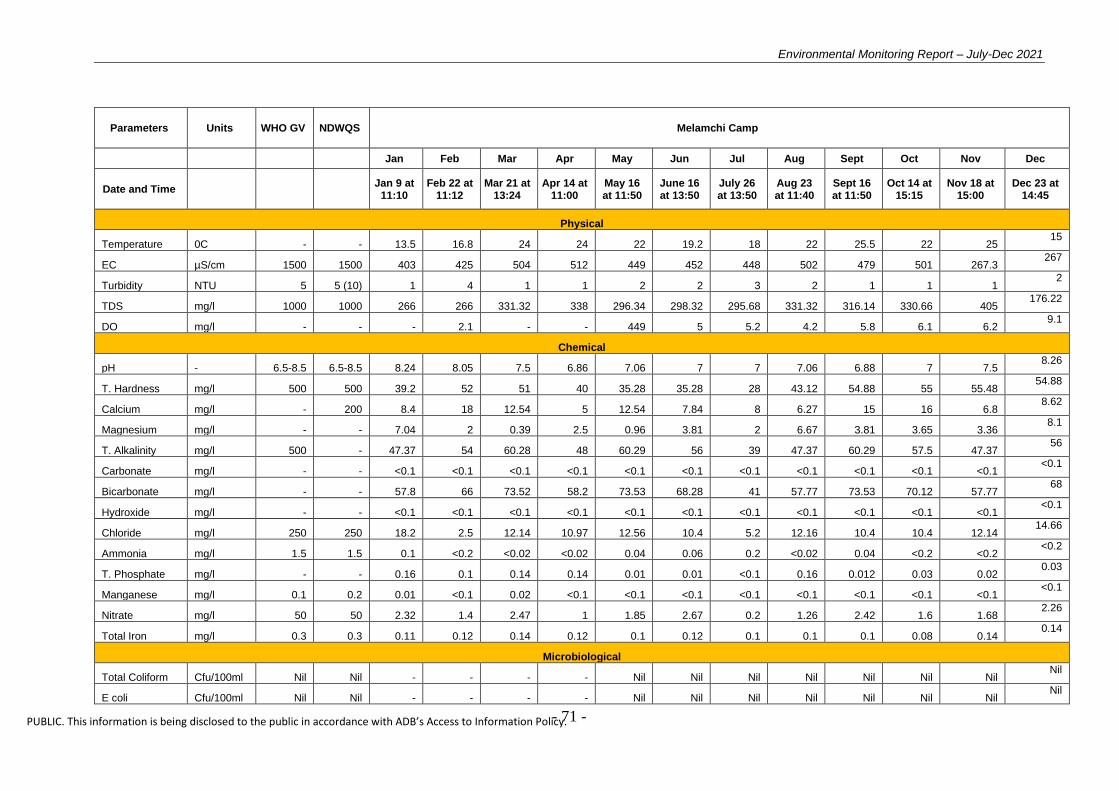
Environmental Monitoring Report – July-Dec 2021
- 71 -
PUBLIC. This information is being disclosed to the public in accordance with ADB’s Access to Information Policy.
Parameters Units WHO GV NDWQS Melamchi Camp
Jan Feb Mar Apr May Jun Jul Aug Sept Oct Nov Dec
Date and Time Jan 9 at 11:10
Feb 22 at 11:12
Mar 21 at 13:24
Apr 14 at 11:00
May 16 at 11:50
June 16 at 13:50
July 26 at 13:50
Aug 23 at 11:40
Sept 16 at 11:50
Oct 14 at 15:15
Nov 18 at 15:00
Dec 23 at 14:45
Physical
Temperature 0C - - 13.5 16.8 24 24 22 19.2 18 22 25.5 22 25 15
EC µS/cm 1500 1500 403 425 504 512 449 452 448 502 479 501 267.3 267
Turbidity NTU 5 5 (10) 1 4 1 1 2 2 3 2 1 1 1 2
TDS mg/l 1000 1000 266 266 331.32 338 296.34 298.32 295.68 331.32 316.14 330.66 405 176.22
DO mg/l - - - 2.1 - - 449 5 5.2 4.2 5.8 6.1 6.2 9.1
Chemical
pH - 6.5-8.5 6.5-8.5 8.24 8.05 7.5 6.86 7.06 7 7 7.06 6.88 7 7.5 8.26
T. Hardness mg/l 500 500 39.2 52 51 40 35.28 35.28 28 43.12 54.88 55 55.48 54.88
Calcium mg/l - 200 8.4 18 12.54 5 12.54 7.84 8 6.27 15 16 6.8 8.62
Magnesium mg/l - - 7.04 2 0.39 2.5 0.96 3.81 2 6.67 3.81 3.65 3.36 8.1
T. Alkalinity mg/l 500 - 47.37 54 60.28 48 60.29 56 39 47.37 60.29 57.5 47.37 56
Carbonate mg/l - - <0.1 <0.1 <0.1 <0.1 <0.1 <0.1 <0.1 <0.1 <0.1 <0.1 <0.1 <0.1
Bicarbonate mg/l - - 57.8 66 73.52 58.2 73.53 68.28 41 57.77 73.53 70.12 57.77 68
Hydroxide mg/l - - <0.1 <0.1 <0.1 <0.1 <0.1 <0.1 <0.1 <0.1 <0.1 <0.1 <0.1 <0.1
Chloride mg/l 250 250 18.2 2.5 12.14 10.97 12.56 10.4 5.2 12.16 10.4 10.4 12.14 14.66
Ammonia mg/l 1.5 1.5 0.1 <0.2 <0.02 <0.02 0.04 0.06 0.2 <0.02 0.04 <0.2 <0.2 <0.2
T. Phosphate mg/l - - 0.16 0.1 0.14 0.14 0.01 0.01 <0.1 0.16 0.012 0.03 0.02 0.03
Manganese mg/l 0.1 0.2 0.01 <0.1 0.02 <0.1 <0.1 <0.1 <0.1 <0.1 <0.1 <0.1 <0.1 <0.1
Nitrate mg/l 50 50 2.32 1.4 2.47 1 1.85 2.67 0.2 1.26 2.42 1.6 1.68 2.26
Total Iron mg/l 0.3 0.3 0.11 0.12 0.14 0.12 0.1 0.12 0.1 0.1 0.1 0.08 0.14 0.14
Microbiological
Total Coliform Cfu/100ml Nil Nil - - - - Nil Nil Nil Nil Nil Nil Nil Nil
E coli Cfu/100ml Nil Nil - - - - Nil Nil Nil Nil Nil Nil Nil Nil

Environmental Monitoring Report – July-Dec 2021
- 72 -
PUBLIC. This information is being disclosed to the public in accordance with ADB’s Access to Information Policy.
WATER QUALITY ASSESSMENT OF DIFFERENT LOCATIONS IN 2014
Parameters Units WHO GV
NDWQS Melamchi at Ambathan (Intake)
Jan Feb Mar Apr May Jun Jul Aug Sept Oct Nov Dec
Date and Time Jan 8
at 12:15
Feb 20 at 12:20
Mar 19 at 13:24
Apr11at 11:00
May 15 at 11:30
June 15 at 9:30
July 24 at 10:30
Aug 22 at 12:30
Sept 19 at 11:30
Oct 16 at 11:40
Nov 20 at
11:00
Dec 24 at 11:35
Physical
Temperature 0C - - 9 10 12 11 15 18 19 19 18 11 10 9
EC µS/cm 1500 1500 239 198 227 275 191
Turbidity NTU 5 5 (10) 1 1 11
TDS mg/l 1000 1000 157.7 130.7 149.8 181.5 114.6
DO mg/l - - 8.7 8.7 8.24 -
Chemical
pH - 6.5-8.5 6.5-8.5 7.5 7.8 7.52 7.38 7.18 7.68 6.94 7.01 7 8.8 8.66 8.2
T. Hardness mg/l 500 500 20 20 23.52 31.36 23.5 23.7 23.5 22.1 22.5 31.5 31 30.95
Calcium mg/l - 200 6 7 6.27 9.41 7.8 7.2 .6 4.7 4.1 8.2 7.9 7.6
Magnesium mg/l - - 1.2 .61 1.91 1.91 1 1.1 3.8 3.2 3 2.67 2.47 2.27
T. Alkalinity mg/l 500 - 34.4 21 30.1 32.75 24.6 24.9 26.1 22 21 43 42.5 42.2
Carbonate mg/l - - <0.1 <0.1 <0.1 <0.1 <0.1 <0.1 <0.1 <0.1 <0.1 <0.1 <0.1 <0.1
Bicarbonate mg/l - - 42 26 36.76 34.94 30 28.6 30.2 31.2 29.3 5241 51.31 50.31
Hydroxide mg/l - - <0.1 <0.1 <0.1 <0.1 <0.1 <0.1 <0.1 <0.1 <0.1 <0.1 <0.1 <0.1
Chloride mg/l 250 250 4.12 2.8 4 3.14 5.2 5.1 7.9 8 8.2 4.12 4.09 4.01
Ammonia mg/l 1.5 1.5 <0.2 <0.2 <0.02
T. Phosphate mg/l - - <0.1 0.02 0.01
Manganese mg/l 0.1 0.2 0.01 <0.01 <0.01
Nitrate mg/l 50 50 1 0.5 1.2
Total Iron mg/l 0.3 0.3 0.06 0.08
Microbiological
Total Coliform Cfu/100ml Nil Nil 25 48 13 45 46
Cfu/100ml Nil Nil 14 42 27 41 35

Environmental Monitoring Report – July-Dec 2021
- 73 -
PUBLIC. This information is being disclosed to the public in accordance with ADB’s Access to Information Policy.
Parameters Units WHO GV
NDWQS Melamchi at Gyalthum
Jan Feb Mar Apr May Jun Jul Aug Sept Oct Nov Dec
Date and Time Jan 8 at 14:05
Feb 20 at 13:45
Mar 19 at 14:56
Apr 11 at 12:00
May 15 at 9:30
June 15 at 10:30
July 24 at 11:30
Aug 22 at 14:00
Sept 19 at 9:30
Oct 16 at 9:35
Nov 20 at 13:30
Dec 24 at 8:30
Physical
Temperature 0C - - 11 12 15 20 21 28 27 28 24 15.2 13.2 18.2
EC µS/cm 1500 1500 195 05 2 287 194
Turbidity NTU 5 5 (10) 1 1 10
mg/l 1000 1000 128.2 35.3 146.5 189.42 116.4
DO mg/l - - 10.2 10.2 7.62 -
Chemical
pH - 6.5-8.5 6.5-8.5 8.2 7.5 7.55 7.02 7.93 7.3 6.52 6.48 6.8 8.74 8.54 8.54
T. Hardness mg/l 500 500 35.24 34 27.44 31.36 35.3 34 34 28.3 26.4 20.4 20 20.09
Calcium mg/l - 200 7.2 8 7.84 9.41 7.8 7.3 7.3 7 6.2 4.12 4.12 4.02
Magnesium mg/l - - 4.13 3.41 1.91 1.91 3.8 3.3 3.3 3.1 3.5 2.46 2.06 2
T. Alkalinity mg/l 500 - 23 223 34.5 28.65 36.8 36.1 36.1 31.7 30.8 24.25 24.05 24
Carbonate mg/l - - <0.1 <0.1 <0.1 <0.1 <0.1 <0.1 <0.1 <0.1 <0.1 <0.1 <0.1 <0.1
Bicarbonate mg/l - - 28 28 42.02 34.94 44.9 42.3 42.3 32.4 30.1 19.89 19.09 19
Hydroxide mg/l - - <0.1 <0.1 <0.1 <0.1 <0.1 <0.1 <0.1 <0.1 <0.1 <0.1 <0.1 <0.1
Chloride mg/l 250 250 4.1 2.7 4.12 4.19 5.2 4.9 4.9 5.6 5.3 6.52 6.02 6.07
Ammonia mg/l 1.5 1.5 <0.02 <0.02 <0.02
T. Phosphate mg/l - - 0.03 0.02 0.02
Manganese mg/l 0.1 0.2 <0.1 <0.1 <0.1
Nitrate mg/l 50 50 0.64 0.5 0.78
Total Iron mg/l 0.3 0.3 0.05 0.06 0.06
Microbiological
Total Coliform Cfu/100ml Nil Nil 102 48 320 -
E coli Cfu/100ml Nil Nil 56 42 110 -
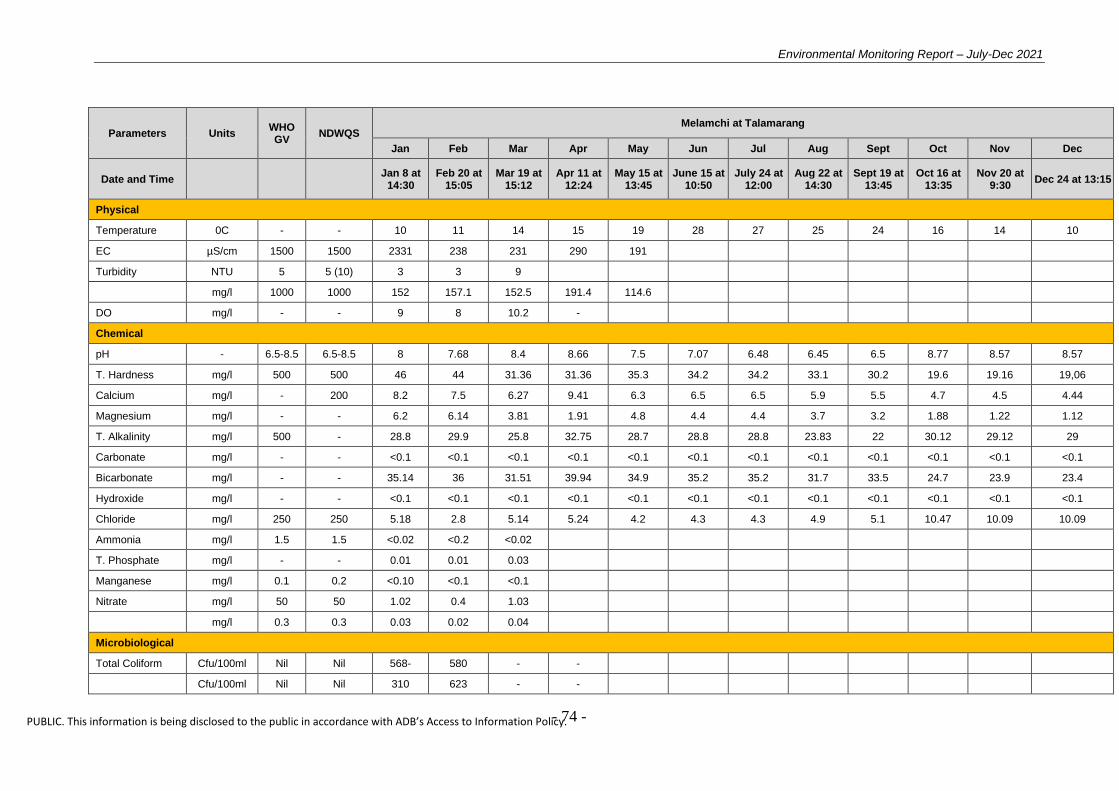
Environmental Monitoring Report – July-Dec 2021
- 74 -
PUBLIC. This information is being disclosed to the public in accordance with ADB’s Access to Information Policy.
Parameters Units WHO GV
NDWQS Melamchi at Talamarang
Jan Feb Mar Apr May Jun Jul Aug Sept Oct Nov Dec
Date and Time Jan 8 at 14:30
Feb 20 at 15:05
Mar 19 at 15:12
Apr 11 at 12:24
May 15 at 13:45
June 15 at 10:50
July 24 at 12:00
Aug 22 at 14:30
Sept 19 at 13:45
Oct 16 at 13:35
Nov 20 at 9:30
Dec 24 at 13:15
Physical
Temperature 0C - - 10 11 14 15 19 28 27 25 24 16 14 10
EC µS/cm 1500 1500 2331 238 231 290 191
Turbidity NTU 5 5 (10) 3 3 9
mg/l 1000 1000 152 157.1 152.5 191.4 114.6
DO mg/l - - 9 8 10.2 -
Chemical
pH - 6.5-8.5 6.5-8.5 8 7.68 8.4 8.66 7.5 7.07 6.48 6.45 6.5 8.77 8.57 8.57
T. Hardness mg/l 500 500 46 44 31.36 31.36 35.3 34.2 34.2 33.1 30.2 19.6 19.16 19,06
Calcium mg/l - 200 8.2 7.5 6.27 9.41 6.3 6.5 6.5 5.9 5.5 4.7 4.5 4.44
Magnesium mg/l - - 6.2 6.14 3.81 1.91 4.8 4.4 4.4 3.7 3.2 1.88 1.22 1.12
T. Alkalinity mg/l 500 - 28.8 29.9 25.8 32.75 28.7 28.8 28.8 23.83 22 30.12 29.12 29
Carbonate mg/l - - <0.1 <0.1 <0.1 <0.1 <0.1 <0.1 <0.1 <0.1 <0.1 <0.1 <0.1 <0.1
Bicarbonate mg/l - - 35.14 36 31.51 39.94 34.9 35.2 35.2 31.7 33.5 24.7 23.9 23.4
Hydroxide mg/l - - <0.1 <0.1 <0.1 <0.1 <0.1 <0.1 <0.1 <0.1 <0.1 <0.1 <0.1 <0.1
Chloride mg/l 250 250 5.18 2.8 5.14 5.24 4.2 4.3 4.3 4.9 5.1 10.47 10.09 10.09
Ammonia mg/l 1.5 1.5 <0.02 <0.2 <0.02
T. Phosphate mg/l - - 0.01 0.01 0.03
Manganese mg/l 0.1 0.2 <0.10 <0.1 <0.1
Nitrate mg/l 50 50 1.02 0.4 1.03
mg/l 0.3 0.3 0.03 0.02 0.04
Microbiological
Total Coliform Cfu/100ml Nil Nil 568- 580 - -
Cfu/100ml Nil Nil 310 623 - -
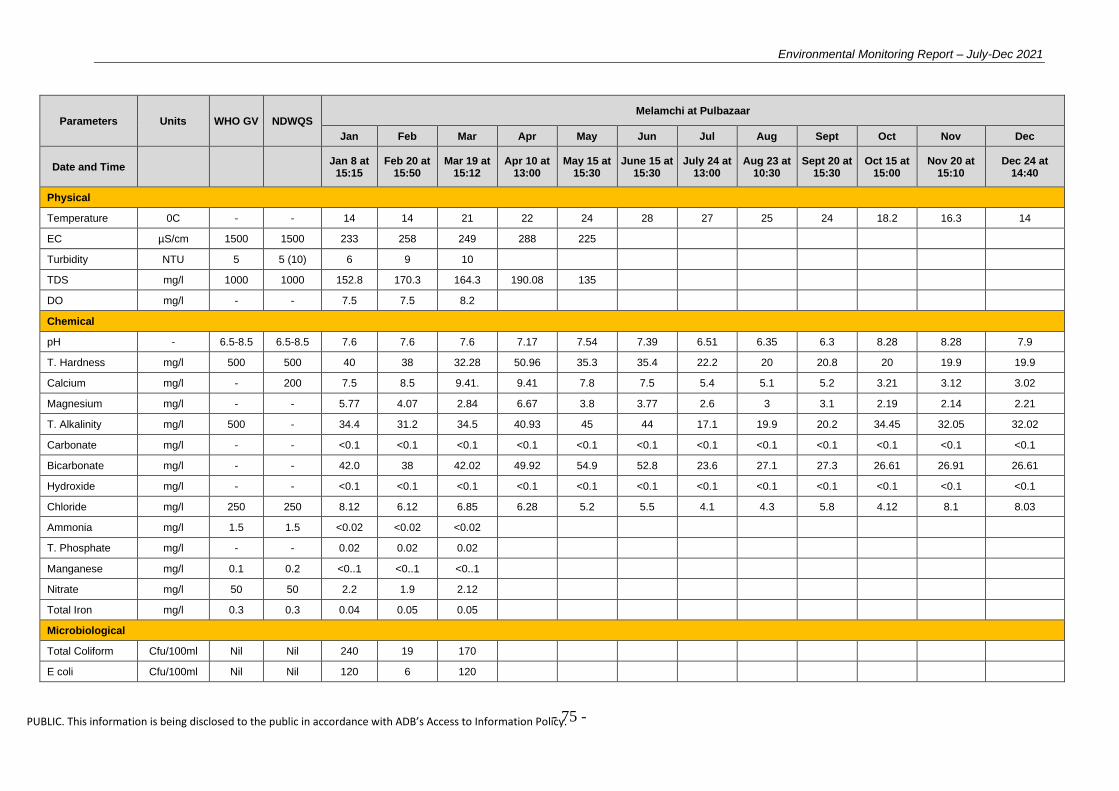
Environmental Monitoring Report – July-Dec 2021
- 75 -
PUBLIC. This information is being disclosed to the public in accordance with ADB’s Access to Information Policy.
Parameters Units WHO GV NDWQS Melamchi at Pulbazaar
Jan Feb Mar Apr May Jun Jul Aug Sept Oct Nov Dec
Date and Time Jan 8 at 15:15
Feb 20 at 15:50
Mar 19 at 15:12
Apr 10 at 13:00
May 15 at 15:30
June 15 at 15:30
July 24 at 13:00
Aug 23 at 10:30
Sept 20 at 15:30
Oct 15 at 15:00
Nov 20 at 15:10
Dec 24 at 14:40
Physical
Temperature 0C - - 14 14 21 22 24 28 27 25 24 18.2 16.3 14
EC µS/cm 1500 1500 233 258 249 288 225
Turbidity NTU 5 5 (10) 6 9 10
TDS mg/l 1000 1000 152.8 170.3 164.3 190.08 135
DO mg/l - - 7.5 7.5 8.2
Chemical
pH - 6.5-8.5 6.5-8.5 7.6 7.6 7.6 7.17 7.54 7.39 6.51 6.35 6.3 8.28 8.28 7.9
T. Hardness mg/l 500 500 40 38 32.28 50.96 35.3 35.4 22.2 20 20.8 20 19.9 19.9
Calcium mg/l - 200 7.5 8.5 9.41. 9.41 7.8 7.5 5.4 5.1 5.2 3.21 3.12 3.02
Magnesium mg/l - - 5.77 4.07 2.84 6.67 3.8 3.77 2.6 3 3.1 2.19 2.14 2.21
T. Alkalinity mg/l 500 - 34.4 31.2 34.5 40.93 45 44 17.1 19.9 20.2 34.45 32.05 32.02
Carbonate mg/l - - <0.1 <0.1 <0.1 <0.1 <0.1 <0.1 <0.1 <0.1 <0.1 <0.1 <0.1 <0.1
Bicarbonate mg/l - - 42.0 38 42.02 49.92 54.9 52.8 23.6 27.1 27.3 26.61 26.91 26.61
Hydroxide mg/l - - <0.1 <0.1 <0.1 <0.1 <0.1 <0.1 <0.1 <0.1 <0.1 <0.1 <0.1 <0.1
Chloride mg/l 250 250 8.12 6.12 6.85 6.28 5.2 5.5 4.1 4.3 5.8 4.12 8.1 8.03
Ammonia mg/l 1.5 1.5 <0.02 <0.02 <0.02
T. Phosphate mg/l - - 0.02 0.02 0.02
Manganese mg/l 0.1 0.2 <0..1 <0..1 <0..1
Nitrate mg/l 50 50 2.2 1.9 2.12
Total Iron mg/l 0.3 0.3 0.04 0.05 0.05
Microbiological
Total Coliform Cfu/100ml Nil Nil 240 19 170
E coli Cfu/100ml Nil Nil 120 6 120
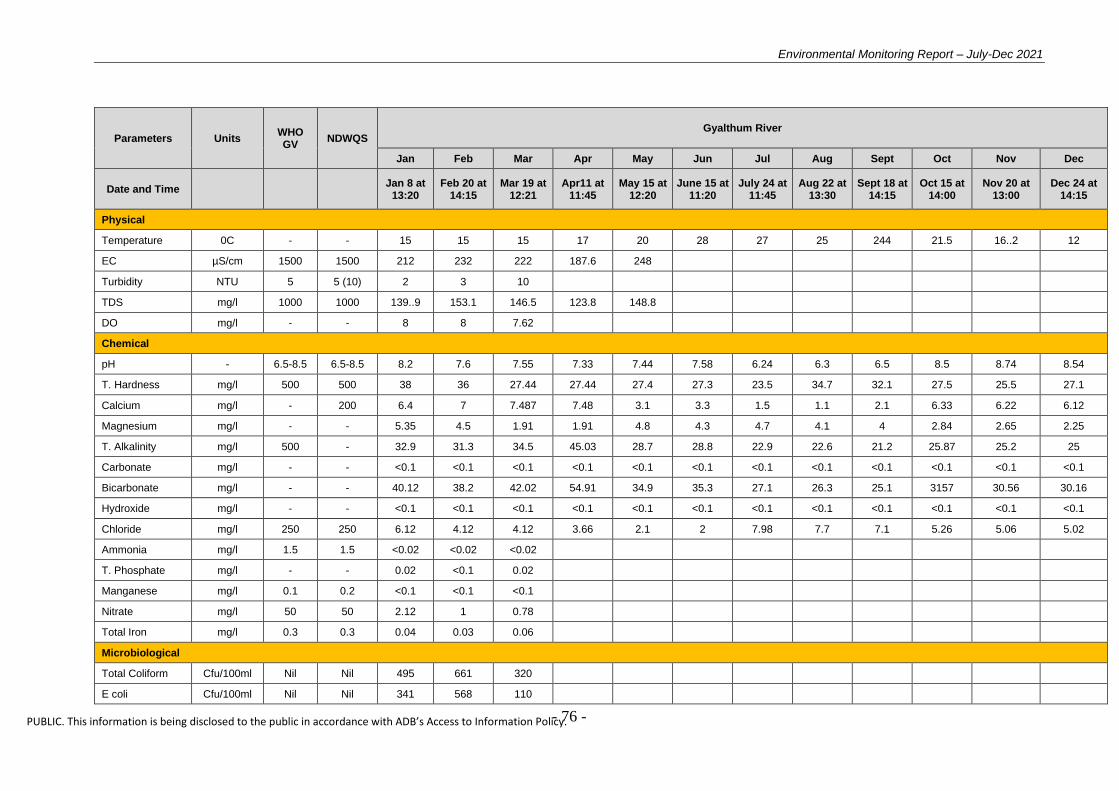
Environmental Monitoring Report – July-Dec 2021
- 76 -
PUBLIC. This information is being disclosed to the public in accordance with ADB’s Access to Information Policy.
Parameters Units WHO GV
NDWQS Gyalthum River
Jan Feb Mar Apr May Jun Jul Aug Sept Oct Nov Dec
Date and Time Jan 8 at 13:20
Feb 20 at 14:15
Mar 19 at 12:21
Apr11 at 11:45
May 15 at 12:20
June 15 at 11:20
July 24 at 11:45
Aug 22 at 13:30
Sept 18 at 14:15
Oct 15 at 14:00
Nov 20 at 13:00
Dec 24 at 14:15
Physical
Temperature 0C - - 15 15 15 17 20 28 27 25 244 21.5 16..2 12
EC µS/cm 1500 1500 212 232 222 187.6 248
Turbidity NTU 5 5 (10) 2 3 10
TDS mg/l 1000 1000 139..9 153.1 146.5 123.8 148.8
DO mg/l - - 8 8 7.62
Chemical
pH - 6.5-8.5 6.5-8.5 8.2 7.6 7.55 7.33 7.44 7.58 6.24 6.3 6.5 8.5 8.74 8.54
T. Hardness mg/l 500 500 38 36 27.44 27.44 27.4 27.3 23.5 34.7 32.1 27.5 25.5 27.1
Calcium mg/l - 200 6.4 7 7.487 7.48 3.1 3.3 1.5 1.1 2.1 6.33 6.22 6.12
Magnesium mg/l - - 5.35 4.5 1.91 1.91 4.8 4.3 4.7 4.1 4 2.84 2.65 2.25
T. Alkalinity mg/l 500 - 32.9 31.3 34.5 45.03 28.7 28.8 22.9 22.6 21.2 25.87 25.2 25
Carbonate mg/l - - <0.1 <0.1 <0.1 <0.1 <0.1 <0.1 <0.1 <0.1 <0.1 <0.1 <0.1 <0.1
Bicarbonate mg/l - - 40.12 38.2 42.02 54.91 34.9 35.3 27.1 26.3 25.1 3157 30.56 30.16
Hydroxide mg/l - - <0.1 <0.1 <0.1 <0.1 <0.1 <0.1 <0.1 <0.1 <0.1 <0.1 <0.1 <0.1
Chloride mg/l 250 250 6.12 4.12 4.12 3.66 2.1 2 7.98 7.7 7.1 5.26 5.06 5.02
Ammonia mg/l 1.5 1.5 <0.02 <0.02 <0.02
T. Phosphate mg/l - - 0.02 <0.1 0.02
Manganese mg/l 0.1 0.2 <0.1 <0.1 <0.1
Nitrate mg/l 50 50 2.12 1 0.78
Total Iron mg/l 0.3 0.3 0.04 0.03 0.06
Microbiological
Total Coliform Cfu/100ml Nil Nil 495 661 320
E coli Cfu/100ml Nil Nil 341 568 110
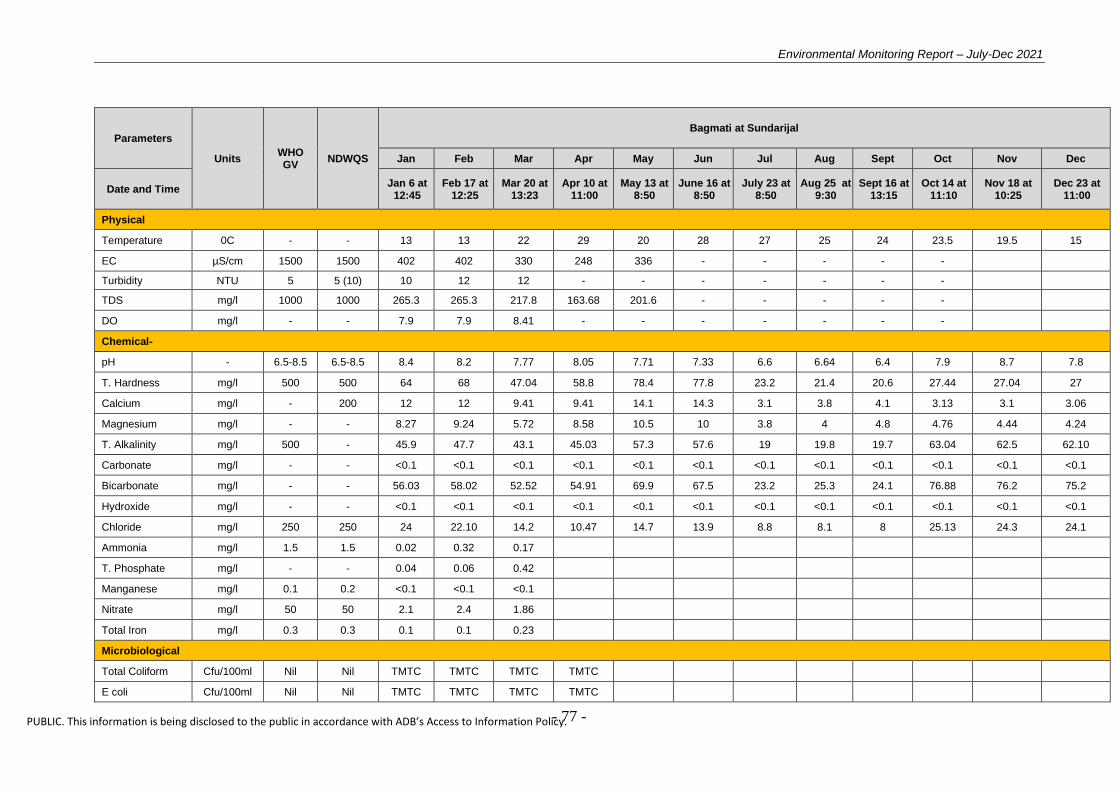
Environmental Monitoring Report – July-Dec 2021
- 77 -
PUBLIC. This information is being disclosed to the public in accordance with ADB’s Access to Information Policy.
Parameters
Units WHO GV
NDWQS
Bagmati at Sundarijal
Jan Feb Mar Apr May Jun Jul Aug Sept Oct Nov Dec
Date and Time Jan 6 at
12:45 Feb 17 at
12:25 Mar 20 at
13:23 Apr 10 at
11:00 May 13 at
8:50 June 16 at
8:50 July 23 at
8:50 Aug 25 at
9:30 Sept 16 at
13:15 Oct 14 at
11:10 Nov 18 at
10:25 Dec 23 at
11:00
Physical
Temperature 0C - - 13 13 22 29 20 28 27 25 24 23.5 19.5 15
EC µS/cm 1500 1500 402 402 330 248 336 - - - - -
Turbidity NTU 5 5 (10) 10 12 12 - - - - - - -
TDS mg/l 1000 1000 265.3 265.3 217.8 163.68 201.6 - - - - -
DO mg/l - - 7.9 7.9 8.41 - - - - - - -
Chemical-
pH - 6.5-8.5 6.5-8.5 8.4 8.2 7.77 8.05 7.71 7.33 6.6 6.64 6.4 7.9 8.7 7.8
T. Hardness mg/l 500 500 64 68 47.04 58.8 78.4 77.8 23.2 21.4 20.6 27.44 27.04 27
Calcium mg/l - 200 12 12 9.41 9.41 14.1 14.3 3.1 3.8 4.1 3.13 3.1 3.06
Magnesium mg/l - - 8.27 9.24 5.72 8.58 10.5 10 3.8 4 4.8 4.76 4.44 4.24
T. Alkalinity mg/l 500 - 45.9 47.7 43.1 45.03 57.3 57.6 19 19.8 19.7 63.04 62.5 62.10
Carbonate mg/l - - <0.1 <0.1 <0.1 <0.1 <0.1 <0.1 <0.1 <0.1 <0.1 <0.1 <0.1 <0.1
Bicarbonate mg/l - - 56.03 58.02 52.52 54.91 69.9 67.5 23.2 25.3 24.1 76.88 76.2 75.2
Hydroxide mg/l - - <0.1 <0.1 <0.1 <0.1 <0.1 <0.1 <0.1 <0.1 <0.1 <0.1 <0.1 <0.1
Chloride mg/l 250 250 24 22.10 14.2 10.47 14.7 13.9 8.8 8.1 8 25.13 24.3 24.1
Ammonia mg/l 1.5 1.5 0.02 0.32 0.17
T. Phosphate mg/l - - 0.04 0.06 0.42
Manganese mg/l 0.1 0.2 <0.1 <0.1 <0.1
Nitrate mg/l 50 50 2.1 2.4 1.86
Total Iron mg/l 0.3 0.3 0.1 0.1 0.23
Microbiological
Total Coliform Cfu/100ml Nil Nil TMTC TMTC TMTC TMTC
E coli Cfu/100ml Nil Nil TMTC TMTC TMTC TMTC
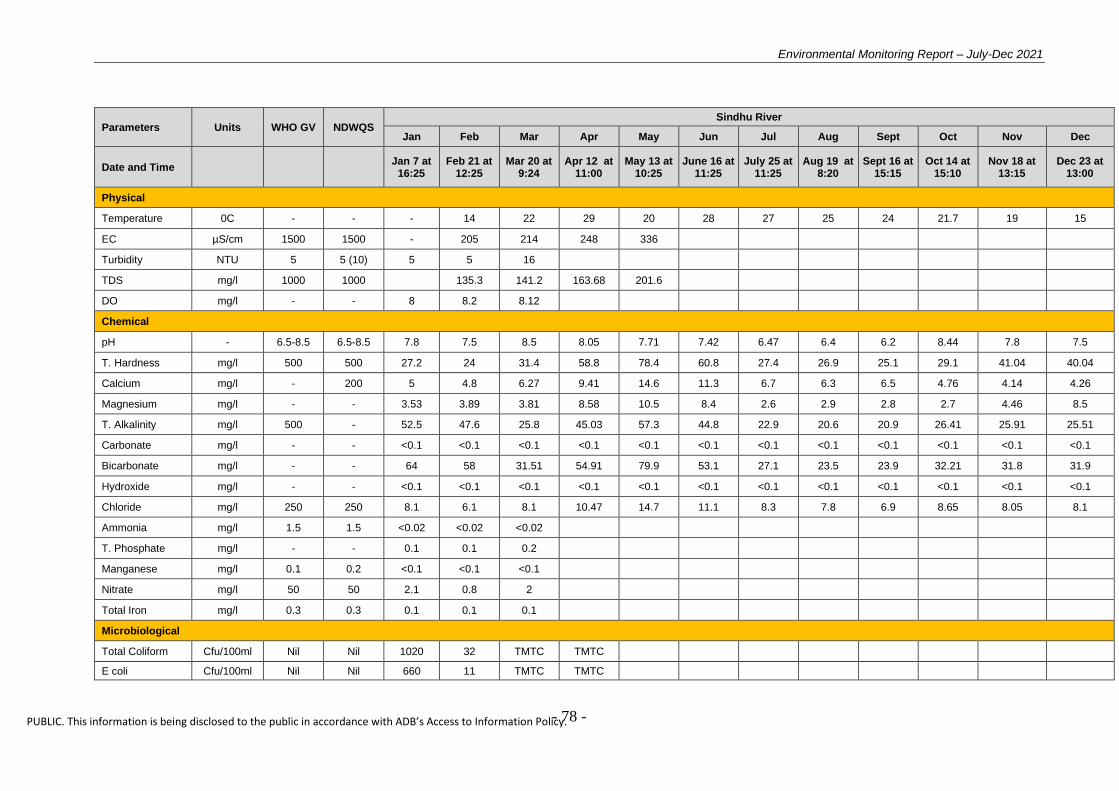
Environmental Monitoring Report – July-Dec 2021
- 78 -
PUBLIC. This information is being disclosed to the public in accordance with ADB’s Access to Information Policy.
Parameters Units WHO GV NDWQS Sindhu River
Jan Feb Mar Apr May Jun Jul Aug Sept Oct Nov Dec
Date and Time Jan 7 at 16:25
Feb 21 at 12:25
Mar 20 at 9:24
Apr 12 at 11:00
May 13 at 10:25
June 16 at 11:25
July 25 at 11:25
Aug 19 at 8:20
Sept 16 at 15:15
Oct 14 at 15:10
Nov 18 at 13:15
Dec 23 at 13:00
Physical
Temperature 0C - - - 14 22 29 20 28 27 25 24 21.7 19 15
EC µS/cm 1500 1500 - 205 214 248 336
Turbidity NTU 5 5 (10) 5 5 16
TDS mg/l 1000 1000 135.3 141.2 163.68 201.6
DO mg/l - - 8 8.2 8.12
Chemical
pH - 6.5-8.5 6.5-8.5 7.8 7.5 8.5 8.05 7.71 7.42 6.47 6.4 6.2 8.44 7.8 7.5
T. Hardness mg/l 500 500 27.2 24 31.4 58.8 78.4 60.8 27.4 26.9 25.1 29.1 41.04 40.04
Calcium mg/l - 200 5 4.8 6.27 9.41 14.6 11.3 6.7 6.3 6.5 4.76 4.14 4.26
Magnesium mg/l - - 3.53 3.89 3.81 8.58 10.5 8.4 2.6 2.9 2.8 2.7 4.46 8.5
T. Alkalinity mg/l 500 - 52.5 47.6 25.8 45.03 57.3 44.8 22.9 20.6 20.9 26.41 25.91 25.51
Carbonate mg/l - - <0.1 <0.1 <0.1 <0.1 <0.1 <0.1 <0.1 <0.1 <0.1 <0.1 <0.1 <0.1
Bicarbonate mg/l - - 64 58 31.51 54.91 79.9 53.1 27.1 23.5 23.9 32.21 31.8 31.9
Hydroxide mg/l - - <0.1 <0.1 <0.1 <0.1 <0.1 <0.1 <0.1 <0.1 <0.1 <0.1 <0.1 <0.1
Chloride mg/l 250 250 8.1 6.1 8.1 10.47 14.7 11.1 8.3 7.8 6.9 8.65 8.05 8.1
Ammonia mg/l 1.5 1.5 <0.02 <0.02 <0.02
T. Phosphate mg/l - - 0.1 0.1 0.2
Manganese mg/l 0.1 0.2 <0.1 <0.1 <0.1
Nitrate mg/l 50 50 2.1 0.8 2
Total Iron mg/l 0.3 0.3 0.1 0.1 0.1
Microbiological
Total Coliform Cfu/100ml Nil Nil 1020 32 TMTC TMTC
E coli Cfu/100ml Nil Nil 660 11 TMTC TMTC

Environmental Monitoring Report – July-Dec 2021
- 79 -
PUBLIC. This information is being disclosed to the public in accordance with ADB’s Access to Information Policy.
Parameters Units WHO GV NDWQS Sindhu Camp
Jan Feb Mar Apr May Jun Jul Aug Sept Oct Nov Dec
Date and Time Feb 21 at 12:45
Mar 20 at 9:39
Apr 12 at 11:15
May 13 at 10:30
June 16 at 11:20
July 16 at 11:20
Aug 19 at 8:00
Sept 16 at 15:30
Oct 14 at 13:15
Nov 18 at 13:15
Dec 23 at 13:15
Physical
Temperature 0C - - - 14 22 22 25 28 27 25 24 27.9 20 20
EC µS/cm 1500 1500 - 236 198 198 139.8 -
Turbidity NTU 5 5 (10) - 1 11 11 -
TDS mg/l 1000 1000 - 155.76 130.68 130.68 83.88
DO mg/l - - - 6.5 7.8 7.8 NA
Chemical
pH - 6.5-8.5 6.5-8.5 - 7.5 7.73 7.73 8.25 7.43 6.17 6.3 6.4 7.97 7.97 7.97
T. Hardness mg/l 500 500 - 48 27.44 27.44 15.7 36.9 19.7 21.7 20.6 22.1 22.01 21.91
Calcium mg/l - 200 - 8.12 6.27 6.27 4.7 4.6 10.7 11.2 13.5 6.52 6.02 6.02
Magnesium mg/l - - - 6.8 2.86 2.86 1 6.8 1.9 2.1 2.1 1.14 1.11 1.01
T. Alkalinity mg/l 500 - - 42.65 25.84 25.84 30.7 22.1 30.2 32.7 27.9 34.52 34.02 34.02
Carbonate mg/l - - - <0.1 <0.1 <0.1 <0.1 <0.1 <0.1 <0.1 <0.1 <0.1 <0.1 <0.1
Bicarbonate mg/l - - - 52.01 31.51 31.51 37.4 20.2 32 33.2 32.1 28.31 27.8 27.5
Hydroxide mg/l - - - <0.1 <0.1 <0.1 <0.1 <0.1 <0.1 <0.1 <0.1 <0.1 <0.1 <0.1
Chloride mg/l 250 250 - 6.48 8.14 8.14 3.1 3.2 6.4 6.8 6.1 4.12 3.92 3.72
Ammonia mg/l 1.5 1.5 - <0.2 <0.2 <0.2
T. Phosphate mg/l - - - 0.03 0.1 0.1
Manganese mg/l 0.1 0.2 - <0.1 <0.1 <0.1
Nitrate mg/l 50 50 - 1.01 0.14 0.14
Total Iron mg/l 0.3 0.3 - 0.12 0.12 0.12
Microbiological
Total Coliform Cfu/100ml Nil Nil - Nil Nil Nil Nil Nil Nil Nil Nil Nil Nil Nil
E coli Cfu/100ml Nil Nil - Nil Nil Nil Nil Nil Nil Nil Nil Nil Nil Nil
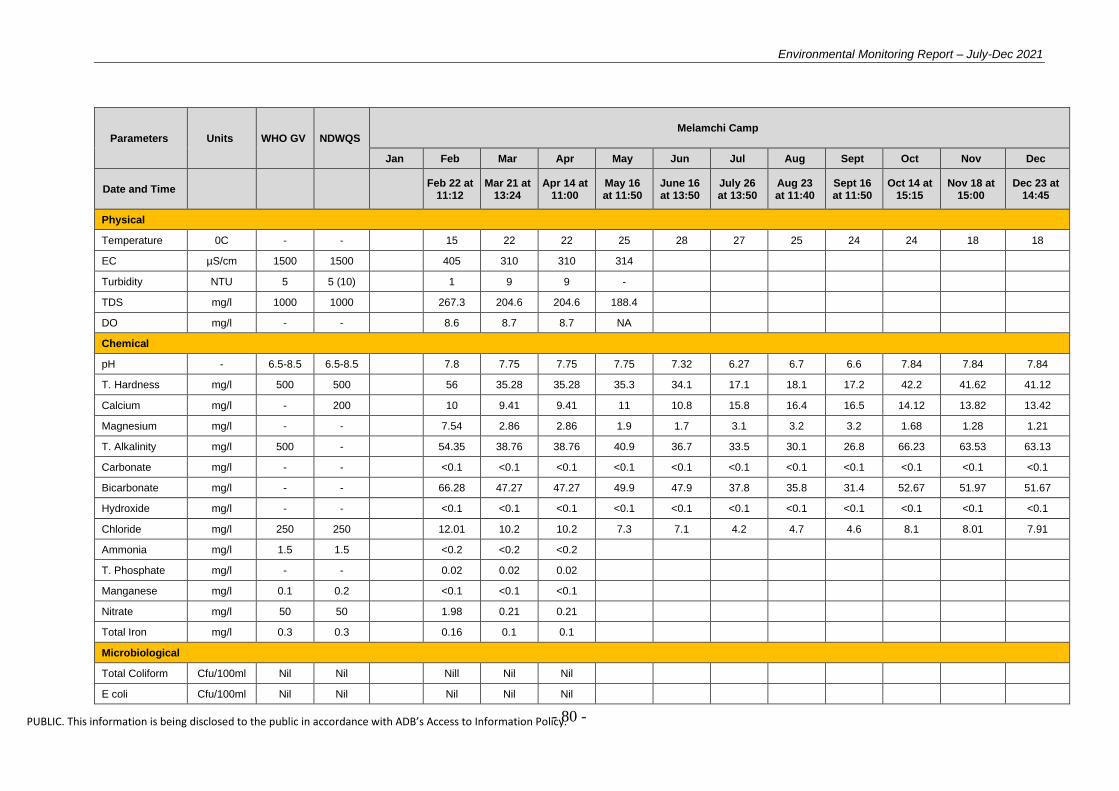
Environmental Monitoring Report – July-Dec 2021
- 80 -
PUBLIC. This information is being disclosed to the public in accordance with ADB’s Access to Information Policy.
Parameters Units WHO GV NDWQS Melamchi Camp
Jan Feb Mar Apr May Jun Jul Aug Sept Oct Nov Dec
Date and Time Feb 22 at 11:12
Mar 21 at 13:24
Apr 14 at 11:00
May 16 at 11:50
June 16 at 13:50
July 26 at 13:50
Aug 23 at 11:40
Sept 16 at 11:50
Oct 14 at 15:15
Nov 18 at 15:00
Dec 23 at 14:45
Physical
Temperature 0C - - 15 22 22 25 28 27 25 24 24 18 18
EC µS/cm 1500 1500 405 310 310 314
Turbidity NTU 5 5 (10) 1 9 9 -
TDS mg/l 1000 1000 267.3 204.6 204.6 188.4
DO mg/l - - 8.6 8.7 8.7 NA
Chemical
pH - 6.5-8.5 6.5-8.5 7.8 7.75 7.75 7.75 7.32 6.27 6.7 6.6 7.84 7.84 7.84
T. Hardness mg/l 500 500 56 35.28 35.28 35.3 34.1 17.1 18.1 17.2 42.2 41.62 41.12
Calcium mg/l - 200 10 9.41 9.41 11 10.8 15.8 16.4 16.5 14.12 13.82 13.42
Magnesium mg/l - - 7.54 2.86 2.86 1.9 1.7 3.1 3.2 3.2 1.68 1.28 1.21
T. Alkalinity mg/l 500 - 54.35 38.76 38.76 40.9 36.7 33.5 30.1 26.8 66.23 63.53 63.13
Carbonate mg/l - - <0.1 <0.1 <0.1 <0.1 <0.1 <0.1 <0.1 <0.1 <0.1 <0.1 <0.1
Bicarbonate mg/l - - 66.28 47.27 47.27 49.9 47.9 37.8 35.8 31.4 52.67 51.97 51.67
Hydroxide mg/l - - <0.1 <0.1 <0.1 <0.1 <0.1 <0.1 <0.1 <0.1 <0.1 <0.1 <0.1
Chloride mg/l 250 250 12.01 10.2 10.2 7.3 7.1 4.2 4.7 4.6 8.1 8.01 7.91
Ammonia mg/l 1.5 1.5 <0.2 <0.2 <0.2
T. Phosphate mg/l - - 0.02 0.02 0.02
Manganese mg/l 0.1 0.2 <0.1 <0.1 <0.1
Nitrate mg/l 50 50 1.98 0.21 0.21
Total Iron mg/l 0.3 0.3 0.16 0.1 0.1
Microbiological
Total Coliform Cfu/100ml Nil Nil Nill Nil Nil
E coli Cfu/100ml Nil Nil Nil Nil Nil
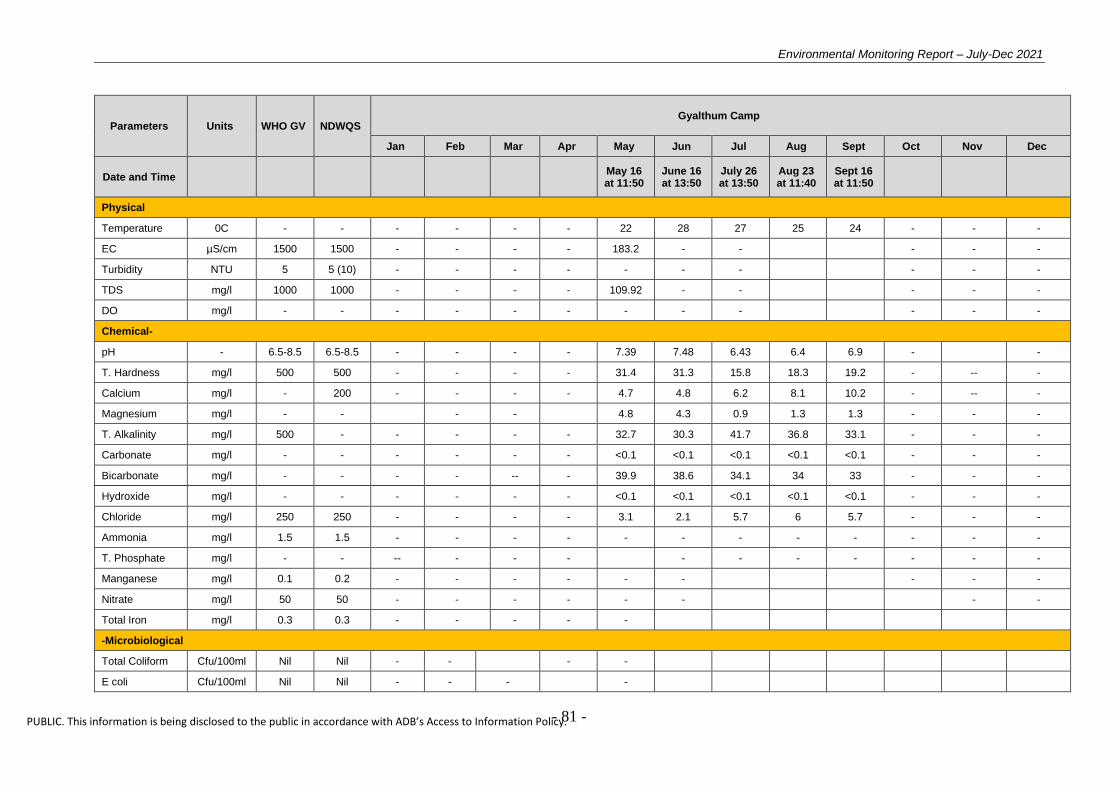
Environmental Monitoring Report – July-Dec 2021
- 81 -
PUBLIC. This information is being disclosed to the public in accordance with ADB’s Access to Information Policy.
Parameters Units WHO GV NDWQS Gyalthum Camp
Jan Feb Mar Apr May Jun Jul Aug Sept Oct Nov Dec
Date and Time May 16 at 11:50
June 16 at 13:50
July 26 at 13:50
Aug 23 at 11:40
Sept 16 at 11:50
Physical
Temperature 0C - - - - - - 22 28 27 25 24 - - -
EC µS/cm 1500 1500 - - - - 183.2 - - - - -
Turbidity NTU 5 5 (10) - - - - - - - - - -
TDS mg/l 1000 1000 - - - - 109.92 - - - - -
DO mg/l - - - - - - - - - - - -
Chemical-
pH - 6.5-8.5 6.5-8.5 - - - - 7.39 7.48 6.43 6.4 6.9 - -
T. Hardness mg/l 500 500 - - - - 31.4 31.3 15.8 18.3 19.2 - -- -
Calcium mg/l - 200 - - - - 4.7 4.8 6.2 8.1 10.2 - -- -
Magnesium mg/l - - - - 4.8 4.3 0.9 1.3 1.3 - - -
T. Alkalinity mg/l 500 - - - - - 32.7 30.3 41.7 36.8 33.1 - - -
Carbonate mg/l - - - - - - <0.1 <0.1 <0.1 <0.1 <0.1 - - -
Bicarbonate mg/l - - - - -- - 39.9 38.6 34.1 34 33 - - -
Hydroxide mg/l - - - - - - <0.1 <0.1 <0.1 <0.1 <0.1 - - -
Chloride mg/l 250 250 - - - - 3.1 2.1 5.7 6 5.7 - - -
Ammonia mg/l 1.5 1.5 - - - - - - - - - - - -
T. Phosphate mg/l - - -- - - - - - - - - - -
Manganese mg/l 0.1 0.2 - - - - - - - - -
Nitrate mg/l 50 50 - - - - - - - -
Total Iron mg/l 0.3 0.3 - - - - -
-Microbiological
Total Coliform Cfu/100ml Nil Nil - - - -
E coli Cfu/100ml Nil Nil - - - -
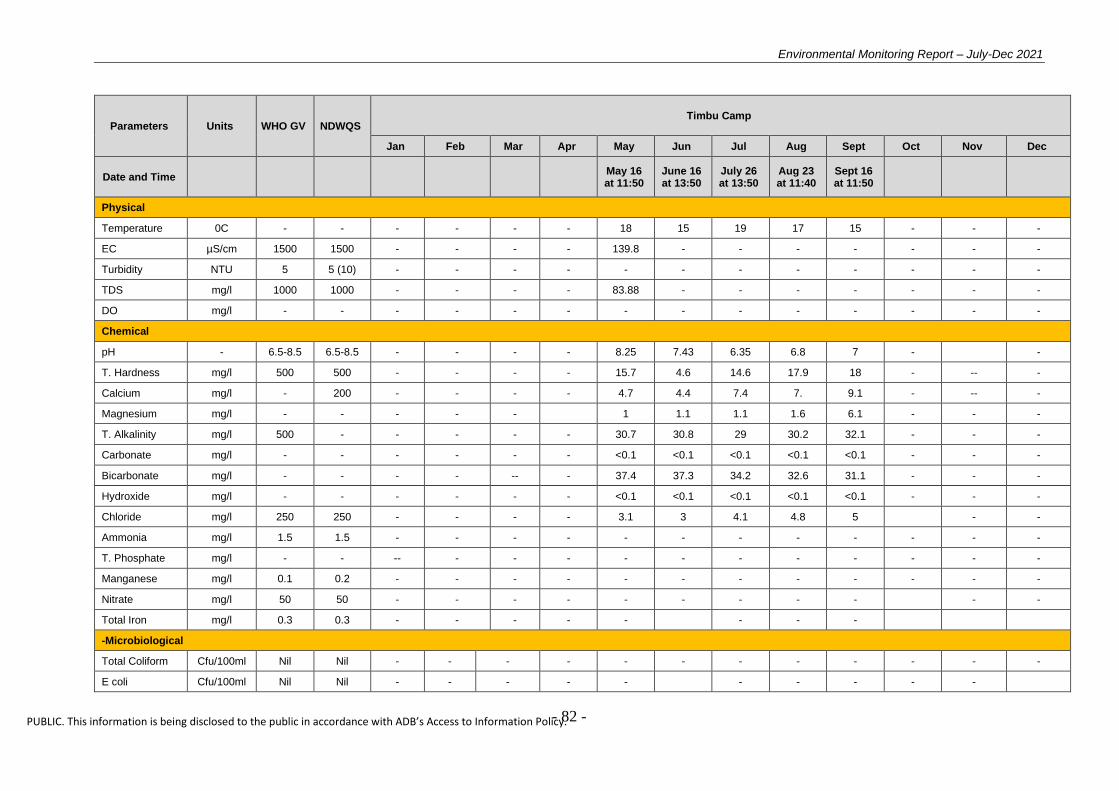
Environmental Monitoring Report – July-Dec 2021
- 82 -
PUBLIC. This information is being disclosed to the public in accordance with ADB’s Access to Information Policy.
Parameters Units WHO GV NDWQS Timbu Camp
Jan Feb Mar Apr May Jun Jul Aug Sept Oct Nov Dec
Date and Time May 16 at 11:50
June 16 at 13:50
July 26 at 13:50
Aug 23 at 11:40
Sept 16 at 11:50
Physical
Temperature 0C - - - - - - 18 15 19 17 15 - - -
EC µS/cm 1500 1500 - - - - 139.8 - - - - - - -
Turbidity NTU 5 5 (10) - - - - - - - - - - - -
TDS mg/l 1000 1000 - - - - 83.88 - - - - - - -
DO mg/l - - - - - - - - - - - - - -
Chemical
pH - 6.5-8.5 6.5-8.5 - - - - 8.25 7.43 6.35 6.8 7 - -
T. Hardness mg/l 500 500 - - - - 15.7 4.6 14.6 17.9 18 - -- -
Calcium mg/l - 200 - - - - 4.7 4.4 7.4 7. 9.1 - -- -
Magnesium mg/l - - - - - 1 1.1 1.1 1.6 6.1 - - -
T. Alkalinity mg/l 500 - - - - - 30.7 30.8 29 30.2 32.1 - - -
Carbonate mg/l - - - - - - <0.1 <0.1 <0.1 <0.1 <0.1 - - -
Bicarbonate mg/l - - - - -- - 37.4 37.3 34.2 32.6 31.1 - - -
Hydroxide mg/l - - - - - - <0.1 <0.1 <0.1 <0.1 <0.1 - - -
Chloride mg/l 250 250 - - - - 3.1 3 4.1 4.8 5 - -
Ammonia mg/l 1.5 1.5 - - - - - - - - - - - -
T. Phosphate mg/l - - -- - - - - - - - - - - -
Manganese mg/l 0.1 0.2 - - - - - - - - - - - -
Nitrate mg/l 50 50 - - - - - - - - - - -
Total Iron mg/l 0.3 0.3 - - - - - - - -
-Microbiological
Total Coliform Cfu/100ml Nil Nil - - - - - - - - - - - -
E coli Cfu/100ml Nil Nil - - - - - - - - - -

Environmental Monitoring Report – July-Dec 2021
- 83 -
PUBLIC. This information is being disclosed to the public in accordance with ADB’s Access to Information Policy.
WATER QUALITY DATA 2015
Parameters
Units WHO GV
NDWQS
Melamchi at Ambathan (Intake)
Jan Feb Mar Apr May Jun Jul Aug Sept Oct Nov Dec
Date and Time
Jan 12at
12:15
Feb 11at
12:20
Mar 18at
12:15
Apr18at 12:20
May 20 at 2:20
June 22 at 11:30
July 20 at 12:20
Aug 17 at 12:20
Sept 19at 12:20
Oct 7 at 11:40
Nov 22 at 12:20
Dec 21 at
12:20
Physical
Temperature 0C - - 9 9.5 13.5 13 15.5 16.5 15.5 15.5 14.5 11.5 10 10.5
EC µS/c
m 1500 1500 -
Turbidity NTU 5 5 (10) -
TDS mg/l 1000 1000 -
DO mg/l - -
Chemical
pH - 6.5-8.5 6.5-8.5 8.6 8.2 8.25 8.05 8.15 8.15 8.0 8.0 8.1 7.7 8.66 7.2
T. Hardness mg/l 500 500 30 30.11 30.7 30.16 31.1 31.17 31.1 31.1 32.1 31.3 31 31.55
Calcium mg/l - 200 7.5 7.10 6.9 6.7 6.25 6.15 6.0 6 6.1 5.7 7.9 5.5
Magnesium mg/l - - 2.07 2.0 2.0 2.08 12.17 2.11 2.19 2.5 2.22 2.1 2.47 2.15
T. Alkalinity mg/l 500 - 42 41.5 41.1 41.15 40.15 40.13 40.1 40 41.1 41.5 42.5 41.1
Carbonate mg/l - - <0.1 <0.1 <0.1 <0.1 <0.1 <0.1 <0.1 <0.1 <0.1 <0.1 <0.1 <0.1
Bicarbonate mg/l - - 51.01 50.41 50.11 49.11 49 49.15 49.1 48.3 48 48.6 51.31 48.1
Hydroxide mg/l - - <0.1 <0.1 <0.1 <0.1 <0.1 <0.1 <0.1 <0.1 <0.1 <0.1 <0.1 <0.1
Chloride mg/l 250 250 4.0 4.1 4.18 3.10 4.0 4.09 4.0 4.8 5.0 5.2 4.09 5.0
Ammonia mg/l 1.5 1.5
T. Phosphate mg/l - -
Manganese mg/l 0.1 0.2
Nitrate mg/l 50 50
Total Iron mg/l 0.3 0.3
Microbiological
Tota Coliform Cfu/100ml
Nil Nil
Cfu/100ml
Nil Nil
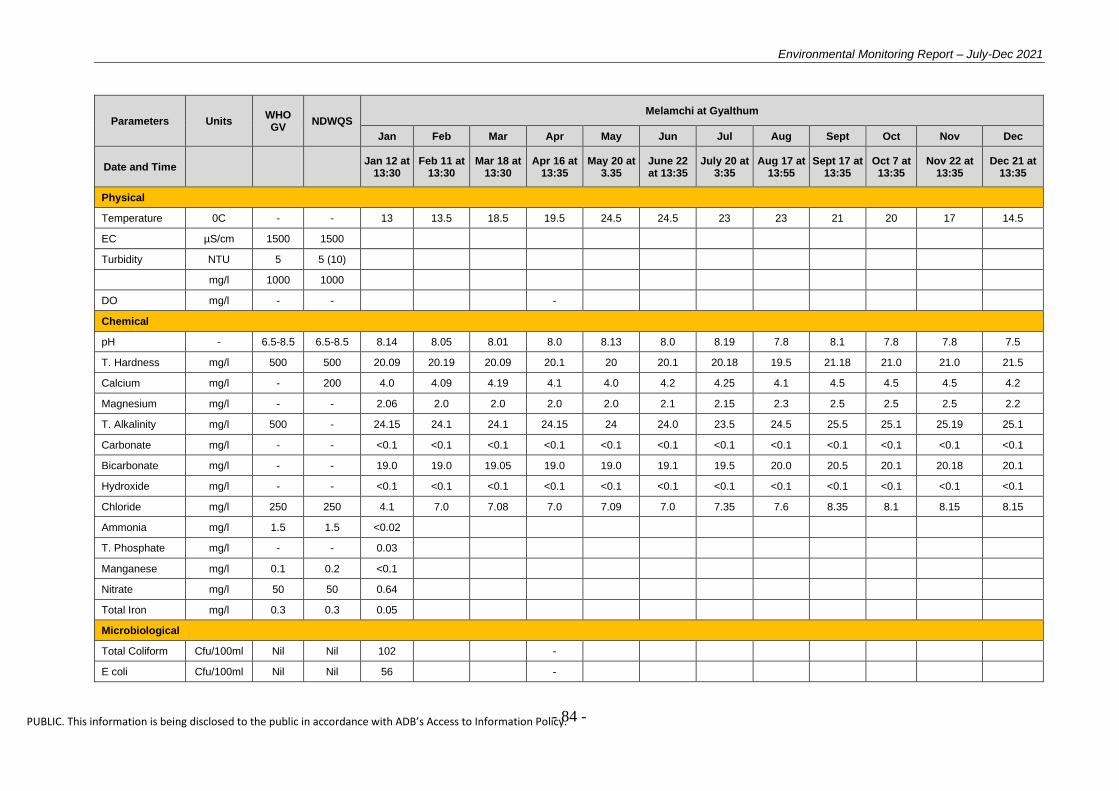
Environmental Monitoring Report – July-Dec 2021
- 84 -
PUBLIC. This information is being disclosed to the public in accordance with ADB’s Access to Information Policy.
Parameters Units WHO GV
NDWQS Melamchi at Gyalthum
Jan Feb Mar Apr May Jun Jul Aug Sept Oct Nov Dec
Date and Time Jan 12 at 13:30
Feb 11 at 13:30
Mar 18 at 13:30
Apr 16 at 13:35
May 20 at 3.35
June 22 at 13:35
July 20 at 3:35
Aug 17 at 13:55
Sept 17 at 13:35
Oct 7 at 13:35
Nov 22 at 13:35
Dec 21 at 13:35
Physical
Temperature 0C - - 13 13.5 18.5 19.5 24.5 24.5 23 23 21 20 17 14.5
EC µS/cm 1500 1500
Turbidity NTU 5 5 (10)
mg/l 1000 1000
DO mg/l - - -
Chemical
pH - 6.5-8.5 6.5-8.5 8.14 8.05 8.01 8.0 8.13 8.0 8.19 7.8 8.1 7.8 7.8 7.5
T. Hardness mg/l 500 500 20.09 20.19 20.09 20.1 20 20.1 20.18 19.5 21.18 21.0 21.0 21.5
Calcium mg/l - 200 4.0 4.09 4.19 4.1 4.0 4.2 4.25 4.1 4.5 4.5 4.5 4.2
Magnesium mg/l - - 2.06 2.0 2.0 2.0 2.0 2.1 2.15 2.3 2.5 2.5 2.5 2.2
T. Alkalinity mg/l 500 - 24.15 24.1 24.1 24.15 24 24.0 23.5 24.5 25.5 25.1 25.19 25.1
Carbonate mg/l - - <0.1 <0.1 <0.1 <0.1 <0.1 <0.1 <0.1 <0.1 <0.1 <0.1 <0.1 <0.1
Bicarbonate mg/l - - 19.0 19.0 19.05 19.0 19.0 19.1 19.5 20.0 20.5 20.1 20.18 20.1
Hydroxide mg/l - - <0.1 <0.1 <0.1 <0.1 <0.1 <0.1 <0.1 <0.1 <0.1 <0.1 <0.1 <0.1
Chloride mg/l 250 250 4.1 7.0 7.08 7.0 7.09 7.0 7.35 7.6 8.35 8.1 8.15 8.15
Ammonia mg/l 1.5 1.5 <0.02
T. Phosphate mg/l - - 0.03
Manganese mg/l 0.1 0.2 <0.1
Nitrate mg/l 50 50 0.64
Total Iron mg/l 0.3 0.3 0.05
Microbiological
Total Coliform Cfu/100ml Nil Nil 102 -
E coli Cfu/100ml Nil Nil 56 -

Environmental Monitoring Report – July-Dec 2021
- 85 -
PUBLIC. This information is being disclosed to the public in accordance with ADB’s Access to Information Policy.
Parameters Units WHO GV
NDWQS Melamchi at Talamarang
Jan Feb Mar Apr May Jun Jul Aug Sept Oct Nov Dec
Date and Time Jan 12at 14:05
Feb 11 at 15:05
Mar 18 at 14:05
Apr 16 at 14:10
May 20 at 4.10
June 22 at 14:10
July 20 at 4:10
Aug 17 at 14:30
Sept 17 at 14:10
Oct 7 at 14:10
Nov 22 at 14:10
Dec 21 at 14:10
Physical
Temperature 0C - - 14 14.0 19 19 24 24 22.5 22 21 20 17 15
EC µS/cm 1500 1500
Turbidity NTU 5 5 (10)
mg/l 1000 1000
DO mg/l - - -
Chemical
pH - 6.5-8.5
6.5-8.5 8.17 8.07 8.02 8.15 8.11 8.1 8.19 7.8 8.0 7.9 7.6 7.3
T. Hardness mg/l 500 500 18.56 18.46 18.16 19.15 18.0 18.1 18.18 18.9.1 19.18 19.1 19.6 19.2
Calcium mg/l - 200 4.04 4.14 4.04 3.18 4.0 4.1 4.19 5.9 5.19 5.1 4.3 5.12
Magnesium mg/l - - 1.12 1.1 1.1 2.0 1.1 1.1 1.15 1.6 1.1 1.1 1.1 1.13
T. Alkalinity mg/l 500 - 29.15 28.15 28.11 30.35 28.0 28.0 27.5 26.83 29.5 28.5 28.9 28.12
Carbonate mg/l - - <0.1 <0.1 <0.1 <0.1 <0.1 <0.1 <0.1 <0.1 <0.1 <0.1 <0.1 <0.1
Bicarbonate mg/l - - 23.0 22.0 22.09 24.1 22.0 22.2 22.5 21.7 24.5 24.1 24.17 24.12
Hydroxide mg/l - - <0.1 <0.1 <0.1 <0.1 <0.1 <0.1 <0.1 <0.1 <0.1 <0.1 <0.1 <0.1
Chloride mg/l 250 250 10.0 9.0 9.09 7.0 9.08 9.0 9.25 4.9 10.25 10.1 10.14 10.13
Ammonia mg/l 1.5 1.5
T. Phosphate mg/l - -
Manganese mg/l 0.1 0.2
Nitrate mg/l 50 50
mg/l 0.3 0.3
Total Coliform Cfu/100ml Nil Nil - -
Cfu/100ml Nil Nil - -
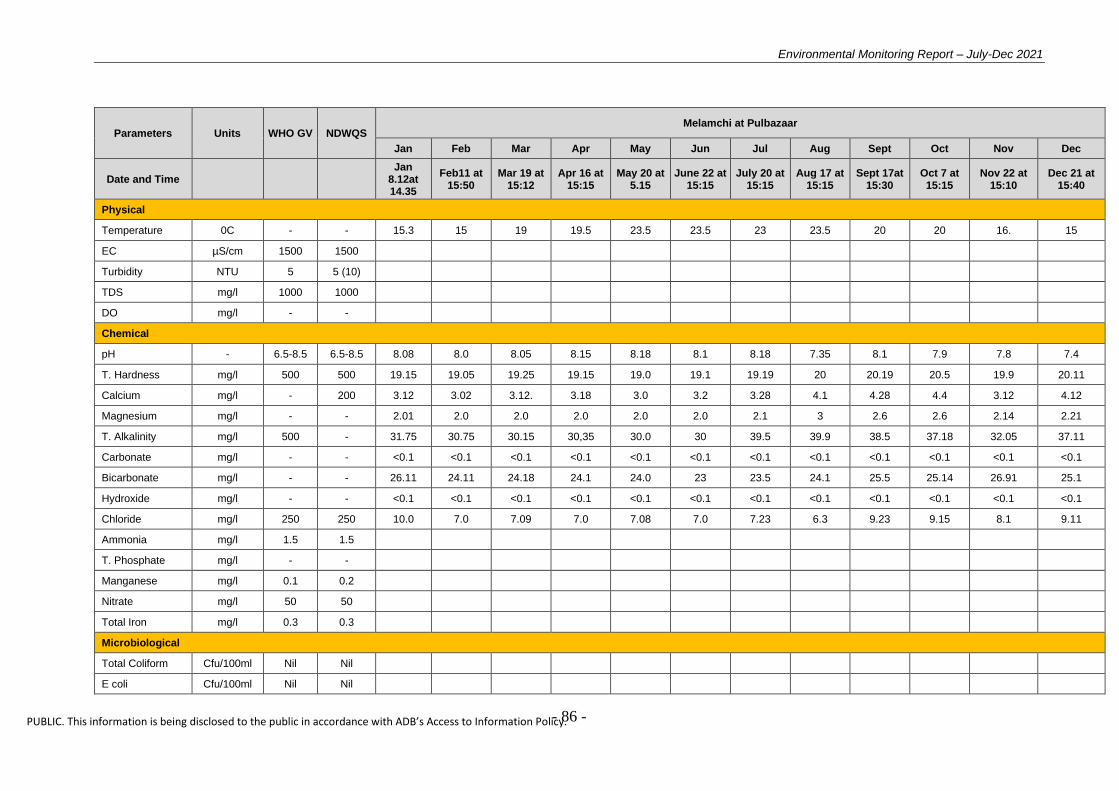
Environmental Monitoring Report – July-Dec 2021
- 86 -
PUBLIC. This information is being disclosed to the public in accordance with ADB’s Access to Information Policy.
Parameters Units WHO GV NDWQS Melamchi at Pulbazaar
Jan Feb Mar Apr May Jun Jul Aug Sept Oct Nov Dec
Date and Time Jan
8.12at 14.35
Feb11 at 15:50
Mar 19 at 15:12
Apr 16 at 15:15
May 20 at 5.15
June 22 at 15:15
July 20 at 15:15
Aug 17 at 15:15
Sept 17at 15:30
Oct 7 at 15:15
Nov 22 at 15:10
Dec 21 at 15:40
Physical
Temperature 0C - - 15.3 15 19 19.5 23.5 23.5 23 23.5 20 20 16. 15
EC µS/cm 1500 1500
Turbidity NTU 5 5 (10)
TDS mg/l 1000 1000
DO mg/l - -
Chemical
pH - 6.5-8.5 6.5-8.5 8.08 8.0 8.05 8.15 8.18 8.1 8.18 7.35 8.1 7.9 7.8 7.4
T. Hardness mg/l 500 500 19.15 19.05 19.25 19.15 19.0 19.1 19.19 20 20.19 20.5 19.9 20.11
Calcium mg/l - 200 3.12 3.02 3.12. 3.18 3.0 3.2 3.28 4.1 4.28 4.4 3.12 4.12
Magnesium mg/l - - 2.01 2.0 2.0 2.0 2.0 2.0 2.1 3 2.6 2.6 2.14 2.21
T. Alkalinity mg/l 500 - 31.75 30.75 30.15 30,35 30.0 30 39.5 39.9 38.5 37.18 32.05 37.11
Carbonate mg/l - - <0.1 <0.1 <0.1 <0.1 <0.1 <0.1 <0.1 <0.1 <0.1 <0.1 <0.1 <0.1
Bicarbonate mg/l - - 26.11 24.11 24.18 24.1 24.0 23 23.5 24.1 25.5 25.14 26.91 25.1
Hydroxide mg/l - - <0.1 <0.1 <0.1 <0.1 <0.1 <0.1 <0.1 <0.1 <0.1 <0.1 <0.1 <0.1
Chloride mg/l 250 250 10.0 7.0 7.09 7.0 7.08 7.0 7.23 6.3 9.23 9.15 8.1 9.11
Ammonia mg/l 1.5 1.5
T. Phosphate mg/l - -
Manganese mg/l 0.1 0.2
Nitrate mg/l 50 50
Total Iron mg/l 0.3 0.3
Microbiological
Total Coliform Cfu/100ml Nil Nil
E coli Cfu/100ml Nil Nil

Environmental Monitoring Report – July-Dec 2021
- 87 -
PUBLIC. This information is being disclosed to the public in accordance with ADB’s Access to Information Policy.
Parameters Units WHO GV
NDWQS Gyalthum River
Jan Feb Mar Apr May Jun Jul Aug Sept Oct Nov Dec
Date and Time Jan 12 at 13:30
Feb 11 at 12:15
Mar 19 at 13:30
Apr19 at 13:40
May 20 at 13.40
June 22 at 13.40
July 20 at 15:40
Aug 17 at 13:40
Sept 17 at 13:40
Oct 7 at 13:40
Nov 22 at 13:40
Dec 21 at 13:40
Physical
Temperature 0C - - 13.2 12.5 17.5 19.5 23.5 24.5 23.5 23.5 21.5 18.5 15..5 13.5
EC µS/cm 1500 1500
Turbidity NTU 5 5 (10)
TDS mg/l 1000 1000
DO mg/l - -
Chemical
pH - 6.5-8.5 6.5-8.5 8.14 8.1 8.19 8.11 8.19 8.05 8.15 7.3 8.05 7.7 7.8 7.5
T. Hardness mg/l 500 500 65.5 65.43 64.43 64.13 62.13 62.19 62.1 61.7 64.1 63.1 62.1 62.19
Calcium mg/l - 200 6.02 6.02 6.52 6.22 6.05 6.0 6.15 5.1 6.3 6.0 6.6 6.2
Magnesium mg/l - - 2.15 2.05 2.05 2.15 2.19 2.12 2.19 2.1 2.29 2.1 2.1 2.18
T. Alkalinity mg/l 500 - 25.0 24.7 24.4 24.24 23.24 23.21 23.1 22.6 24.1 24.0 24.5 24.2
Carbonate mg/l - - <0.1 <0.1 <0.1 <0.1 <0.1 <0.1 <0.1 <0.1 <0.1 <0.1 <0.1 <0.1
Bicarbonate mg/l - - 30.16 30.1 30.19 30.0 30.0 30.19 30.1 29.3 32.1 32.1 32.5 32.2
Hydroxide mg/l - - <0.1 <0.1 <0.1 <0.1 <0.1 <0.1 <0.1 <0.1 <0.1 <0.1 <0.1 <0.1
Chloride mg/l 250 250 5.0 4.8 4.5 4.25 4.12 4.19 4.1 4.7 5.1 5.0 5.1 4.9
Ammonia mg/l 1.5 1.5
T. Phosphate mg/l - -
Manganese mg/l 0.1 0.2
Nitrate mg/l 50 50
Total Iron mg/l 0.3 0.3
Total Coliform Cfu/100ml Nil Nil
E coli Cfu/100ml Nil Nil

Environmental Monitoring Report – July-Dec 2021
- 88 -
PUBLIC. This information is being disclosed to the public in accordance with ADB’s Access to Information Policy.
Parameters
Units WHO GV
NDWQS
Bagmati at Sundarijal
Jan Feb Mar Apr May Jun Jul Aug Sept Oct Nov Dec
Date and Time Jan 17 at
1.05 Feb 16 at
12:25 Mar 22 at
11:05 Apr 22 at
11:25 May 19 at
11.25 June 21at
11:25 July 19 at
11:25 Aug 16 at
11:25 Sept 16 at
11:25 Oct 11 at
11:25 Nov 19 at
11:25 Dec 20 at
11:25
Physical
Temperature 0C - - 15.5 15 18 19 22.5 23.5 23 23 20 17.5 14.5 14
EC µS/cm 1500 1500 - - - - - -
Turbidity NTU 5 5 (10) - - - - - -
TDS mg/l 1000 1000 - - - - - -
DO mg/l - - - - - - - - -
Chemical-
pH - 6.5-8.5 6.5-8.5 7.10 7.19 7.39 7.19 7.49 7.69 6.69 7.64 7.9 7.5 7.5 7.2
T. Hardness mg/l 500 500 28.14 28.1 29.1 29.19 30.19 30.39 30.3 29.4 32.3 32.0 32.8 32.3
Calcium mg/l - 200 3.06 3.16 3.46 3.16 3.0 3.08 3.0 3.8 3.2 3.0 3.8 3.5
Magnesium mg/l - - 4.14 4.04 3.9 3.7 3.5 3.55 3.15 3.7 3.18 3.1 3.1 3.16
T. Alkalinity mg/l 500 - 62.0 61.5 61.1 60.1 59.1 59.19 59.1 59.8 57.1 57 56.0 55.5
Carbonate mg/l - - <0.1 <0.1 <0.1 <0.1 <0.1 <0.1 <0.1 <0.1 <0.1 <0.1 <0.1 <0.1
Bicarbonate mg/l - - 74.2 72.2 71.2 70.2 70.0 69.0 69.09 68.3 70.09 69.0 68.1 75.2
Hydroxide mg/l - - <0.1 <0.1 <0.1 <0.1 <0.1 <0.1 <0.1 <0.1 <0.1 <0.1 <0.1 <0.1
Chloride mg/l 250 250 14.3 13.80 13.5 13.25 13.1 13.19 13.1 13.1 14.1 13.1 12.5 12.1
Ammonia mg/l 1.5 1.5
T. Phosphate mg/l - -
Manganese mg/l 0.1 0.2
Nitrate mg/l 50 50
Total Iron mg/l 0.3 0.3
Microbiological
Total Coliform Cfu/100ml Nil Nil
E coli Cfu/100ml Nil Nil
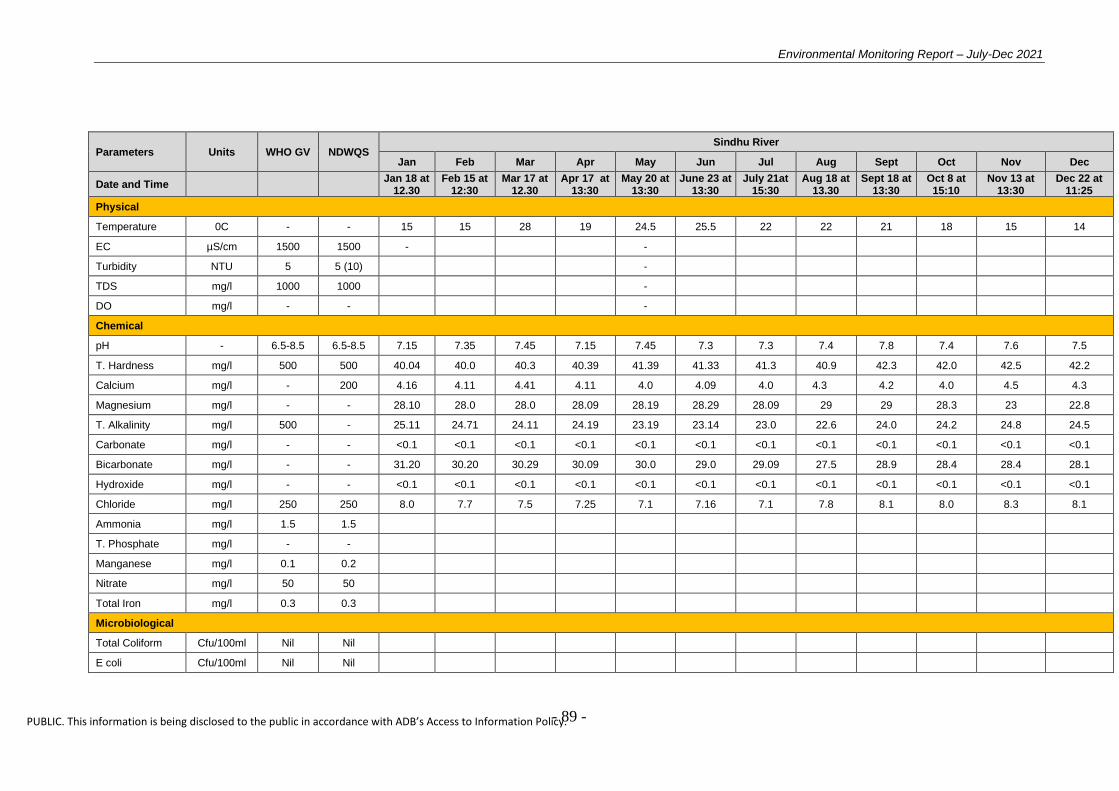
Environmental Monitoring Report – July-Dec 2021
- 89 -
PUBLIC. This information is being disclosed to the public in accordance with ADB’s Access to Information Policy.
Parameters Units WHO GV NDWQS Sindhu River
Jan Feb Mar Apr May Jun Jul Aug Sept Oct Nov Dec
Date and Time Jan 18 at 12.30
Feb 15 at 12:30
Mar 17 at 12.30
Apr 17 at 13:30
May 20 at 13:30
June 23 at 13:30
July 21at 15:30
Aug 18 at 13.30
Sept 18 at 13:30
Oct 8 at 15:10
Nov 13 at 13:30
Dec 22 at 11:25
Physical
Temperature 0C - - 15 15 28 19 24.5 25.5 22 22 21 18 15 14
EC µS/cm 1500 1500 - -
Turbidity NTU 5 5 (10) -
TDS mg/l 1000 1000 -
DO mg/l - - -
Chemical
pH - 6.5-8.5 6.5-8.5 7.15 7.35 7.45 7.15 7.45 7.3 7.3 7.4 7.8 7.4 7.6 7.5
T. Hardness mg/l 500 500 40.04 40.0 40.3 40.39 41.39 41.33 41.3 40.9 42.3 42.0 42.5 42.2
Calcium mg/l - 200 4.16 4.11 4.41 4.11 4.0 4.09 4.0 4.3 4.2 4.0 4.5 4.3
Magnesium mg/l - - 28.10 28.0 28.0 28.09 28.19 28.29 28.09 29 29 28.3 23 22.8
T. Alkalinity mg/l 500 - 25.11 24.71 24.11 24.19 23.19 23.14 23.0 22.6 24.0 24.2 24.8 24.5
Carbonate mg/l - - <0.1 <0.1 <0.1 <0.1 <0.1 <0.1 <0.1 <0.1 <0.1 <0.1 <0.1 <0.1
Bicarbonate mg/l - - 31.20 30.20 30.29 30.09 30.0 29.0 29.09 27.5 28.9 28.4 28.4 28.1
Hydroxide mg/l - - <0.1 <0.1 <0.1 <0.1 <0.1 <0.1 <0.1 <0.1 <0.1 <0.1 <0.1 <0.1
Chloride mg/l 250 250 8.0 7.7 7.5 7.25 7.1 7.16 7.1 7.8 8.1 8.0 8.3 8.1
Ammonia mg/l 1.5 1.5
T. Phosphate mg/l - -
Manganese mg/l 0.1 0.2
Nitrate mg/l 50 50
Total Iron mg/l 0.3 0.3
Microbiological
Total Coliform Cfu/100ml Nil Nil
E coli Cfu/100ml Nil Nil
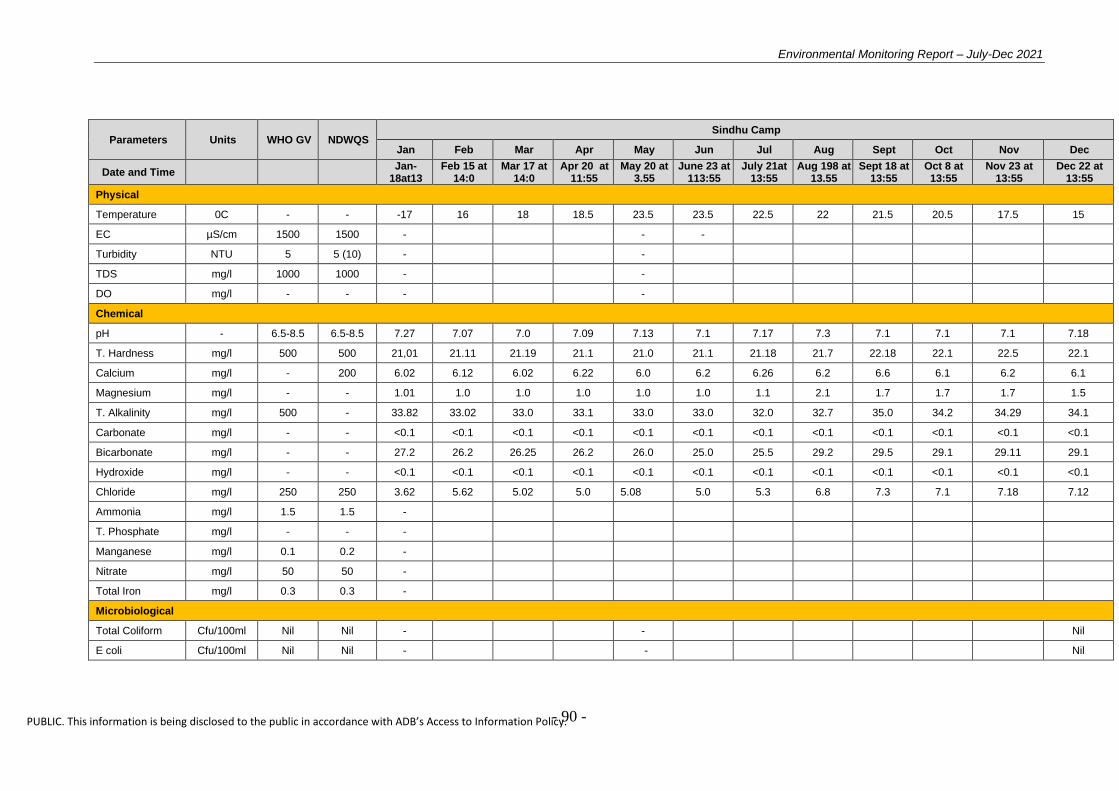
Environmental Monitoring Report – July-Dec 2021
- 90 -
PUBLIC. This information is being disclosed to the public in accordance with ADB’s Access to Information Policy.
Parameters Units WHO GV NDWQS Sindhu Camp
Jan Feb Mar Apr May Jun Jul Aug Sept Oct Nov Dec
Date and Time Jan-18at13
Feb 15 at 14:0
Mar 17 at 14:0
Apr 20 at 11:55
May 20 at 3.55
June 23 at 113:55
July 21at 13:55
Aug 198 at 13.55
Sept 18 at 13:55
Oct 8 at 13:55
Nov 23 at 13:55
Dec 22 at 13:55
Physical
Temperature 0C - - -17 16 18 18.5 23.5 23.5 22.5 22 21.5 20.5 17.5 15
EC µS/cm 1500 1500 - - -
Turbidity NTU 5 5 (10) - -
TDS mg/l 1000 1000 - -
DO mg/l - - - -
Chemical
pH - 6.5-8.5 6.5-8.5 7.27 7.07 7.0 7.09 7.13 7.1 7.17 7.3 7.1 7.1 7.1 7.18
T. Hardness mg/l 500 500 21,01 21.11 21.19 21.1 21.0 21.1 21.18 21.7 22.18 22.1 22.5 22.1
Calcium mg/l - 200 6.02 6.12 6.02 6.22 6.0 6.2 6.26 6.2 6.6 6.1 6.2 6.1
Magnesium mg/l - - 1.01 1.0 1.0 1.0 1.0 1.0 1.1 2.1 1.7 1.7 1.7 1.5
T. Alkalinity mg/l 500 - 33.82 33.02 33.0 33.1 33.0 33.0 32.0 32.7 35.0 34.2 34.29 34.1
Carbonate mg/l - - <0.1 <0.1 <0.1 <0.1 <0.1 <0.1 <0.1 <0.1 <0.1 <0.1 <0.1 <0.1
Bicarbonate mg/l - - 27.2 26.2 26.25 26.2 26.0 25.0 25.5 29.2 29.5 29.1 29.11 29.1
Hydroxide mg/l - - <0.1 <0.1 <0.1 <0.1 <0.1 <0.1 <0.1 <0.1 <0.1 <0.1 <0.1 <0.1
Chloride mg/l 250 250 3.62 5.62 5.02 5.0 5.08 5.0 5.3 6.8 7.3 7.1 7.18 7.12
Ammonia mg/l 1.5 1.5 -
T. Phosphate mg/l - - -
Manganese mg/l 0.1 0.2 -
Nitrate mg/l 50 50 -
Total Iron mg/l 0.3 0.3 -
Microbiological
Total Coliform Cfu/100ml Nil Nil - - Nil
E coli Cfu/100ml Nil Nil - - Nil

Environmental Monitoring Report – July-Dec 2021
- 91 -
PUBLIC. This information is being disclosed to the public in accordance with ADB’s Access to Information Policy.
Parameters Units WHO GV NDWQS Melamchi Camp
Jan Feb Mar Apr May Jun Jul Aug Sept Oct Nov Dec
Date and Time Jan19-at-11
Feb 19 at 11:0
Mar 22at 11:0
Apr 22at 11:15
May 22at 11:15
June 22 at 11:15
July 23at 11:15
Aug 19 at 11:15
Sept 19 at 11:15
Oct 11at 11:15
Nov24 at 11:15
Dec 23 at 11:15
Physical
Temperature 0C - - 16 16 18.5 19.5 22.5 22.5 21.5 21 19.5 18.5 15.5 15
EC µS/cm 1500 1500 -
Turbidity NTU 5 5 (10) -
TDS mg/l 1000 1000 -
DO mg/l - - -
Chemical
pH - 6.5-8.5 6.5-8.5 7.14 7.14 7.24 7.14 7.5 7.2 6.21 7.7 7.0 7.0 7.1 7.15
T. Hardness mg/l 500 500 41.12 41.12 31.22 31.02 31.0 31.1 31.15 30.1 32.15 32.1 31.1 31.19
Calcium mg/l - 200 13.82 13.82 13.12 13.22 13.0 13.1 13.18 12.4 11.18 11.0 10.5 10.1
Magnesium mg/l - - 1.18 1.18 1.1 1.1 1.1 1.1 1.17 2.2 1.8 1.8 1.8 1.5
T. Alkalinity mg/l 500 - 63.13 63.13 51.03 50.03 50.0 50 49.5 48.1 45.5 44.3 44.39 44.11
Carbonate mg/l - - <0.1 <0.1 <0.1 <0.1 <0.1 <0.1 <0.1 <0.1 <0.1 <0.1 <0.1 <0.1
Bicarbonate mg/l - - 51.17 51.17 40.07 40.17 40.0 39.0 38.0 35.8 33.0 33.1 33.13 33.12
Hydroxide mg/l - - <0.1 <0.1 <0.1 <0.1 <0.1 <0.1 <0.1 <0.1 <0.1 <0.1 <0.1 <0.1
Chloride mg/l 250 250 7.71 7.71 7.15 7.1 7.11 7.0 7.33 6.7 8.33 8.1 8.12 8.13
Ammonia mg/l 1.5 1.5
T. Phosphate mg/l - -
Manganese mg/l 0.1 0.2
Nitrate mg/l 50 50
Total Iron mg/l 0.3 0.3
Total Coliform Cfu/100ml Nil Nil
E coli Cfu/100ml Nil Nil

Environmental Monitoring Report – July-Dec 2021
- 92 -
PUBLIC. This information is being disclosed to the public in accordance with ADB’s Access to Information Policy.
WATER QUALITY TEST RESULT 2016
Parameters Units WHO GV NDWQS Intake(ups)
Jan Feb Mar Apr May Jun Jul Aug Sept Oct Nov Dec
Date and Time Jan 22 at 12:20
Feb. 15 at 12:25
Mar .24 at 12:20
Apr18 at 12:20
May 18 at 12:25
June 20 at 12:15
July 19 at 12:15
Aug 19 at 12:10
Sept 19 at 12:15
Oct 19 at 12:10
Nov 21 at 12:25
Dec 19 at 12:15
Physical
Temperature 0C - - -10 10 11 13.5 14 14.5 15 14.5 14 12 11 10
EC µS/cm 1500 1500 - - -
Turbidity NTU 5 5 (10) - -
TDS mg/l 1000 1000 - -
DO mg/l - - - -
Chemical
pH - 6.5-8.5 6.5-8.5 7.6 7.8 7.9 8.0 7.5 7.7 7.8 7.7 7.9 7.7 7.5 7.3
T. Hardness mg/l 500 500 31.2 31.35 31.15 31.16 31.0 31.25 31.15 31.0 31.5 31.1 31. 31.5
Calcium mg/l - 200 5.2 5.4 5.45 6.2 5.8 5.9 5.9 5.8 5.9 5.5 5. 5.2
Magnesium mg/l - - 2.1 2.15 2.05 2.0 2.0 2.2 2.1 2.1 2.3 2.1 2. 2.1
T. Alkalinity mg/l 500 - 41.0 41.3 41.35 41.1 41.1 41.18 41.15 41.1 41.6 41.2 41. 41.5
Carbonate mg/l - - <0.1 <0.1 <0.1 <0.1 <0.1 <0.1 <0.1 <0.1 <0.1 <0.1 <0.1 <0.1
Bicarbonate mg/l - - 48.15 48.0 48.5 49. 48.1 48.15 48.35 48.3 48.8 48.5 48. 48.4
Hydroxide mg/l - - <0.1 <0.1 <0.1 <0.1 <0.1 <0.1 <0.1 <0.1 <0.1 <0.1 <0.1 <0.1
Chloride mg/l 250 250 5.1 5.0 5.5 4.0 4.0 4.25 4.2 4.1 4.4 4.2 5. 5.2
Ammonia mg/l 1.5 1.5 -
T. Phosphate mg/l - - -
Manganese mg/l 0.1 0.2 -
Nitrate mg/l 50 50 -
Total Iron mg/l 0.3 0.3 -
Microbiological
Total Coliform Cfu/100ml Nil Nil - - Nil
E coli Cfu/100ml Nil Nil - - Nil

Environmental Monitoring Report – July-Dec 2021
- 93 -
PUBLIC. This information is being disclosed to the public in accordance with ADB’s Access to Information Policy.
Parameters Units WHO GV NDWQS Gyalthum River
Jan Feb Mar Apr May Jun Jul Aug Sept Oct Nov Dec
Date and Time Jan 22 at 13:40
Feb. 15at 13:45
Mar .24 at 13:40
Apr19 at 13:45
May 19 at 13:45
June 22 at 11:45
July 21 at 13:35
Aug 21 at 13:30
Sep 21 at 13:35
Oct 21 at 13:15
Nov 22at 13:15
Dec 19 at 12:15
Physical
Temperature 0C - - 12.5 13 14 21 23 23 24 24.5 24 21 14.5 13
EC µS/cm 1500 1500 -
Turbidity NTU 5 5 (10) -
TDS mg/l 1000 1000 -
DO mg/l - - -
Chemical
pH - 6.5-8.5 6.5-8.5 7.6 7.7 7.8 7.9 7.5 7.5 7.7 7.3 7.5 7.6 7.9 7.5
T. Hardness mg/l 500 500 62.1 62.35 62.15 63.13 62.13 62.35 62.33 62.3 62.6 62.1 62. 62.7
Calcium mg/l - 200 6.0 6.2 6.25 6.1 5.8 5.9 5.7 5.6 5.6 5.2 6. 6.4
Magnesium mg/l - - 2.1 2.15 2.05 2.1 2.0 2.3 2.15 2.1 2.3 2.1 2. 2.1
T. Alkalinity mg/l 500 - 24.0 24.3 24.35 24.2 24.2 24.25 24.25 24.2 24.6 24.2 24. 24.4
Carbonate mg/l - - <0.1 <0.1 <0.1 <0.1 <0.1 <0.1 <0.1 <0.1 <0.1 <0.1 <0.1 <0.1
Bicarbonate mg/l - - 32.25 32.0 32.4 30.1 30.15 30.25 31.1 31.1 31.8 31.4 32. 32.3
Hydroxide mg/l - - <0.1 <0.1 <0.1 <0.1 <0.1 <0.1 <0.1 <0.1 <0.1 <0.1 <0.1 <0.1
Chloride mg/l 250 250 4.7 4.2 4.5 4.2 4.2 4.25 4.3 4.2 4.7 4.3 5. 5.3
Ammonia mg/l 1.5 1.5
T. Phosphate mg/l - -
Manganese mg/l 0.1 0.2
Nitrate mg/l 50 50
Total Iron mg/l 0.3 0.3
Microbiological
Total Coliform Cfu/100ml Nil Nil
E coli Cfu/100ml Nil Nil
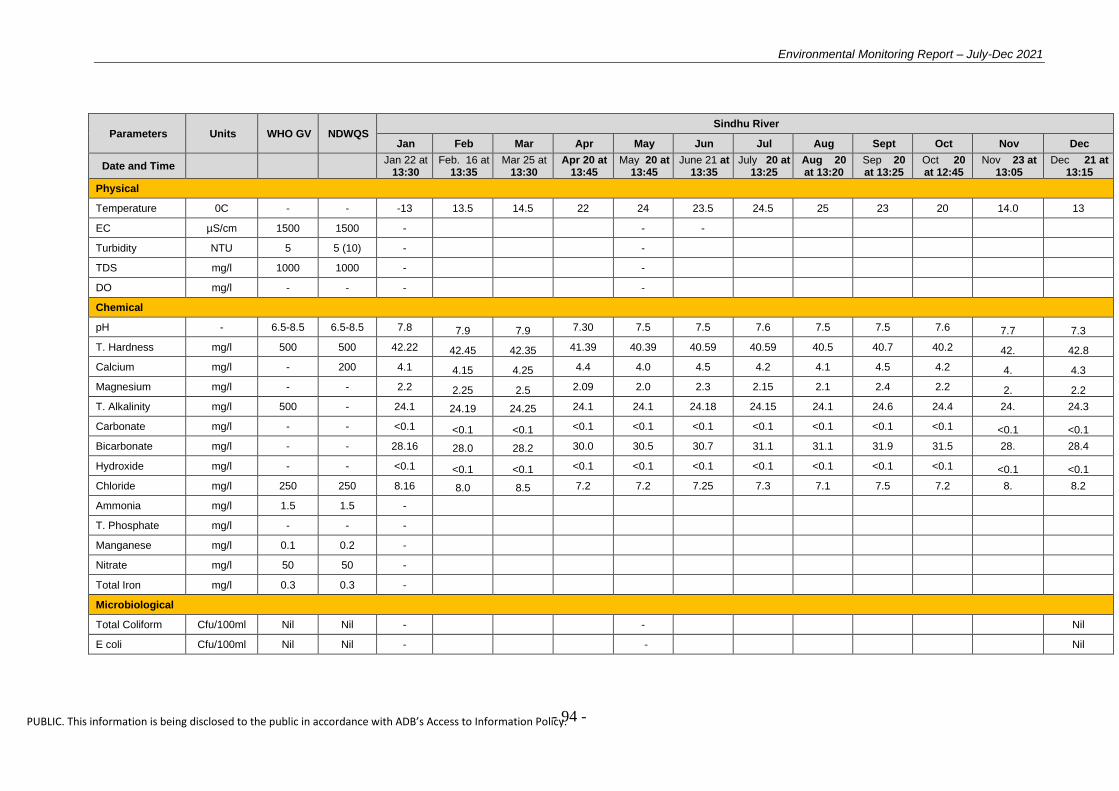
Environmental Monitoring Report – July-Dec 2021
- 94 -
PUBLIC. This information is being disclosed to the public in accordance with ADB’s Access to Information Policy.
Parameters Units WHO GV NDWQS Sindhu River
Jan Feb Mar Apr May Jun Jul Aug Sept Oct Nov Dec
Date and Time Jan 22 at 13:30
Feb. 16 at 13:35
Mar 25 at 13:30
Apr 20 at 13:45
May 20 at 13:45
June 21 at 13:35
July 20 at 13:25
Aug 20 at 13:20
Sep 20 at 13:25
Oct 20 at 12:45
Nov 23 at 13:05
Dec 21 at 13:15
Physical
Temperature 0C - - -13 13.5 14.5 22 24 23.5 24.5 25 23 20 14.0 13
EC µS/cm 1500 1500 - - -
Turbidity NTU 5 5 (10) - -
TDS mg/l 1000 1000 - -
DO mg/l - - - -
Chemical
pH - 6.5-8.5 6.5-8.5 7.8 7.9 7.9 7.30 7.5 7.5 7.6 7.5 7.5 7.6 7.7 7.3
T. Hardness mg/l 500 500 42.22 42.45 42.35 41.39 40.39 40.59 40.59 40.5 40.7 40.2 42. 42.8
Calcium mg/l - 200 4.1 4.15 4.25 4.4 4.0 4.5 4.2 4.1 4.5 4.2 4. 4.3
Magnesium mg/l - - 2.2 2.25 2.5 2.09 2.0 2.3 2.15 2.1 2.4 2.2 2. 2.2
T. Alkalinity mg/l 500 - 24.1 24.19 24.25 24.1 24.1 24.18 24.15 24.1 24.6 24.4 24. 24.3
Carbonate mg/l - - <0.1 <0.1 <0.1 <0.1 <0.1 <0.1 <0.1 <0.1 <0.1 <0.1 <0.1 <0.1
Bicarbonate mg/l - - 28.16 28.0 28.2 30.0 30.5 30.7 31.1 31.1 31.9 31.5 28. 28.4
Hydroxide mg/l - - <0.1 <0.1 <0.1 <0.1 <0.1 <0.1 <0.1 <0.1 <0.1 <0.1 <0.1 <0.1
Chloride mg/l 250 250 8.16 8.0 8.5 7.2 7.2 7.25 7.3 7.1 7.5 7.2 8. 8.2
Ammonia mg/l 1.5 1.5 -
T. Phosphate mg/l - - -
Manganese mg/l 0.1 0.2 -
Nitrate mg/l 50 50 -
Total Iron mg/l 0.3 0.3 -
Microbiological
Total Coliform Cfu/100ml Nil Nil - - Nil
E coli Cfu/100ml Nil Nil - - Nil

Environmental Monitoring Report – July-Dec 2021
- 95 -
PUBLIC. This information is being disclosed to the public in accordance with ADB’s Access to Information Policy.
Parameters Units WHO GV NDWQS Bagmati Sundarijal
Jan Feb Mar Apr May Jun Jul Aug Sept Oct Nov Dec
Date and Time Jan 22 at 11:25
Feb14 at 11:25
Mar 23 at 11:20
Apr17at 11:20
May 17at 11:25
June 19 at 11:25
July 18 at 11:15
Aug 18 at 11:10
Sep 18 at 11:15
Oct 18 at 11:00
Nov 20-at 11:05
Dec 18-at 11:15
Physical
Temperature 0C - - 13 13.5 14 20 24 24 24.5 24.5 22 19 13.5 12.5
EC µS/cm 1500 1500 -
Turbidity NTU 5 5 (10) -
TDS mg/l 1000 1000 -
DO mg/l - - -
Chemical
pH - 6.5-8.5 6.5-8.5 7.5 7.7 7.8 7.35 7.5 7.5 7.7 7.6 7.7 7.8 7.7 7.4
T. Hardness mg/l 500 500 32.38 32.55 32.49 30.19 31.19 31.39 31.39 31.3 31.8 31.5 32. 32.5
Calcium mg/l - 200 3.3 3.35 3.45 3.4 4.1 4.19 4.3 4.1 4.6 4.1 3. 3.5
Magnesium mg/l - - 3.1 3.15 3.5 3.5 3.0 3.3 3.15 3.1 3.3 3.1 3. 3.2
T. Alkalinity mg/l 500 - 55.1 54.1 54.3 56.1 54.1 54.19 54.15 54.1 54.5 53.5 56. 56.5
Carbonate mg/l - - <0.1 <0.1 <0.1 <0.1 <0.1 <0.1 <0.1 <0.1 <0.1 <0.1 <0.1 <0.1
Bicarbonate mg/l - - 67.58 67.0 67.3 70.0 69.0 69.7 68.1 68.1 67.3 66.3 68. 68.4
Hydroxide mg/l - - <0.1 <0.1 <0.1 <0.1 <0.1 <0.1 <0.1 <0.1 <0.1 <0.1 <0.1 <0.1
Chloride mg/l 250 250 12.15 12.0 11.0 13.2 12.2 12.25 12.3 12.1 12.5 11.5 12. 12.1
Ammonia mg/l 1.5 1.5
T. Phosphate mg/l - -
Manganese mg/l 0.1 0.2
Nitrate mg/l 50 50
Total Iron mg/l 0.3 0.3
Microbiological
Total Coliform Cfu/100ml Nil Nil
E coli Cfu/100ml Nil Nil
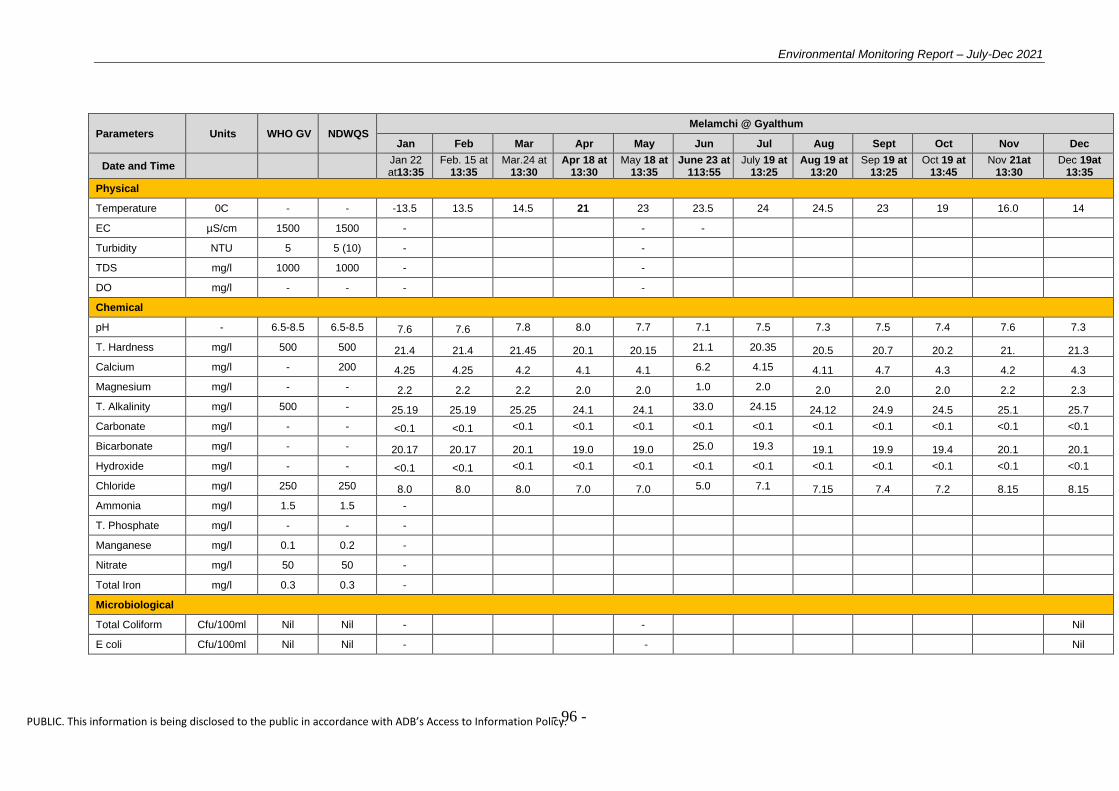
Environmental Monitoring Report – July-Dec 2021
- 96 -
PUBLIC. This information is being disclosed to the public in accordance with ADB’s Access to Information Policy.
Parameters Units WHO GV NDWQS Melamchi @ Gyalthum
Jan Feb Mar Apr May Jun Jul Aug Sept Oct Nov Dec
Date and Time Jan 22 at13:35
Feb. 15 at 13:35
Mar.24 at 13:30
Apr 18 at 13:30
May 18 at 13:35
June 23 at 113:55
July 19 at 13:25
Aug 19 at 13:20
Sep 19 at 13:25
Oct 19 at 13:45
Nov 21at 13:30
Dec 19at 13:35
Physical
Temperature 0C - - -13.5 13.5 14.5 21 23 23.5 24 24.5 23 19 16.0 14
EC µS/cm 1500 1500 - - -
Turbidity NTU 5 5 (10) - -
TDS mg/l 1000 1000 - -
DO mg/l - - - -
Chemical
pH - 6.5-8.5 6.5-8.5 7.6 7.6 7.8 8.0 7.7 7.1 7.5 7.3 7.5 7.4 7.6 7.3
T. Hardness mg/l 500 500 21.4 21.4 21.45 20.1 20.15 21.1 20.35 20.5 20.7 20.2 21. 21.3
Calcium mg/l - 200 4.25 4.25 4.2 4.1 4.1 6.2 4.15 4.11 4.7 4.3 4.2 4.3
Magnesium mg/l - - 2.2 2.2 2.2 2.0 2.0 1.0 2.0 2.0 2.0 2.0 2.2 2.3
T. Alkalinity mg/l 500 - 25.19 25.19 25.25 24.1 24.1 33.0 24.15 24.12 24.9 24.5 25.1 25.7
Carbonate mg/l - - <0.1 <0.1 <0.1 <0.1 <0.1 <0.1 <0.1 <0.1 <0.1 <0.1 <0.1 <0.1
Bicarbonate mg/l - - 20.17 20.17 20.1 19.0 19.0 25.0 19.3 19.1 19.9 19.4 20.1 20.1
Hydroxide mg/l - - <0.1 <0.1 <0.1 <0.1 <0.1 <0.1 <0.1 <0.1 <0.1 <0.1 <0.1 <0.1
Chloride mg/l 250 250 8.0 8.0 8.0 7.0 7.0 5.0 7.1 7.15 7.4 7.2 8.15 8.15
Ammonia mg/l 1.5 1.5 -
T. Phosphate mg/l - - -
Manganese mg/l 0.1 0.2 -
Nitrate mg/l 50 50 -
Total Iron mg/l 0.3 0.3 -
Microbiological
Total Coliform Cfu/100ml Nil Nil - - Nil
E coli Cfu/100ml Nil Nil - - Nil

Environmental Monitoring Report – July-Dec 2021
- 97 -
PUBLIC. This information is being disclosed to the public in accordance with ADB’s Access to Information Policy.
Parameters Units WHO GV NDWQS Melamchi @ Talamarang
Jan Feb Mar Apr May Jun Jul Aug Sept Oct Nov Dec
Date and Time Jan 22 at 14:10
Feb 15 at 14:15
Mar 24 at 14:10
Apr 18 at 14:15
May 18 at 14:15
June 20 at 14:25
July 19 at 14:05
Aug 19 at 14:00
Sep 19 at 14:15
Oct 19 at 14:00
Nov 21 at 14:25
Dec 19 at 14:35
Physical
Temperature 0C - - -14 14 15 21 24 24.5 24 25 24 20.0 16 14
EC µS/cm 1500 1500 - - -
Turbidity NTU 5 5 (10) - -
TDS mg/l 1000 1000 - -
DO mg/l - - - -
Chemical
pH - 6.5-8.5 6.5-8.5 7.4 7.5 7.7 8.0 7.6 7.9 7.9 7.8 7.6 7.5 7.2 7.1
T. Hardness mg/l 500 500 19.25 19.0 19.45 18.o 18.2 18.29 18.25 18.5 18.8 18.2 19. 19.2
Calcium mg/l - 200 5.2 5.25 5.2 4.1 4.1 4.16 4.15 4.12 4.8 4.2 5. 5.2
Magnesium mg/l - - 1.13 1.19 1.1 1.1 1.1 1.15 1.1 1.1 1.1 1.1 1.1 1.2
T. Alkalinity mg/l 500 - 28.2 28.35 28.45 28.1 28.1 28.15 28.15 28.12 28.9 28.5 28.2 28.5
Carbonate mg/l - - <0.1 <0.1 <0.1 <0.1 <0.1 <0.1 <0.1 <0.1 <0.1 <0.1 <0.1 <0.1
Bicarbonate mg/l - - 24.2 24.0 24.4 22.0 22.0 22.15 22.2 22.1 22.9 22.3 24.1 24.1
Hydroxide mg/l - - <0.1 <0.1 <0.1 <0.1 <0.1 <0.1 <0.1 <0.1 <0.1 <0.1 <0.1 <0.1
Chloride mg/l 250 250 10.0 10.1 9.15 8.7 7.8 7.5 7.7 7.6 7.5 7.3 10.1 10.15
Ammonia mg/l 1.5 1.5 -
T. Phosphate mg/l - - -
Manganese mg/l 0.1 0.2 -
Nitrate mg/l 50 50 -
Total Iron mg/l 0.3 0.3 -
Microbiological
Total Coliform Cfu/100ml Nil Nil - - Nil
E coli Cfu/100ml Nil Nil - - Nil

Environmental Monitoring Report – July-Dec 2021
- 98 -
PUBLIC. This information is being disclosed to the public in accordance with ADB’s Access to Information Policy.
Parameters Units WHO GV NDWQS Melamchi Pool Bazar
Jan Feb Mar Apr May Jun Jul Aug Sept Oct Nov Dec
Date and Time Jan 22 at 15.15
Feb. 15 at 15.15
Mar 24 at 15.10
Apr18 at: 15:10
May 18 at 5:15
June 20 at 15:15
July 19 at 15:05
Aug 19 at 15:00
Sep 19 at 15:15
Oct 19 at 15:25
Nov 21at: 15.25
Dec 19at: 15.30
Physical
Temperature 0C - - 14 14 15.5 22 23 23.5 23.5 24 24 19.0 15.5 14.5
EC µS/cm 1500 1500 -
Turbidity NTU 5 5 (10) -
TDS mg/l 1000 1000 -
DO mg/l - - -
Chemical
pH - 6.5-8.5 6.5-8.5 7.4 7.55 7.8 8.15 7.5 7.5 7.5 7.6 7.7 7.6 7.5 7.3
T. Hardness mg/l 500 500 20.18 20.0 20.35 19.15 19.15 19.35 19.35 19.5 19.7 19.2 20. 20.2
Calcium mg/l - 200 4.2 4.29 4.2 3.1 3.1 3.16 3.15 3.11 3.9 3.3 4. 4.3
Magnesium mg/l - - 2.2 2.25 2.2 2.0 2.0 2.15 2.0 2.0 2.0 2.0 2.6 2.7
T. Alkalinity mg/l 500 - 37.21 37.32 37.35 30.3 30.3 30.35 30.35 30.31 30.8 30.5 37.1 37.3
Carbonate mg/l - - <0.1 <0.1 <0.1 <0.1 <0.1 <0.1 <0.1 <0.1 <0.1 <0.1 <0.1 <0.1
Bicarbonate mg/l - - 25.18 25.0 25.4 24.0 24.0 24.15 24.2 24.1 24.7 24.3 25.1 25.1
Hydroxide mg/l - - <0.1 <0.1 <0.1 <0.1 <0.1 <0.1 <0.1 <0.1 <0.1 <0.1 <0.1 <0.1
Chloride mg/l 250 250 9.0 9.3 9.35 7.0 7.0 7.5 7.0 7.1 7.5 7.3 9.1 9.16
Ammonia mg/l 1.5 1.5
T. Phosphate mg/l - -
Manganese mg/l 0.1 0.2
Nitrate mg/l 50 50
Total Iron mg/l 0.3 0.3
Microbiological
Total Coliform Cfu/100ml Nil Nil
E coli Cfu/100ml Nil Nil
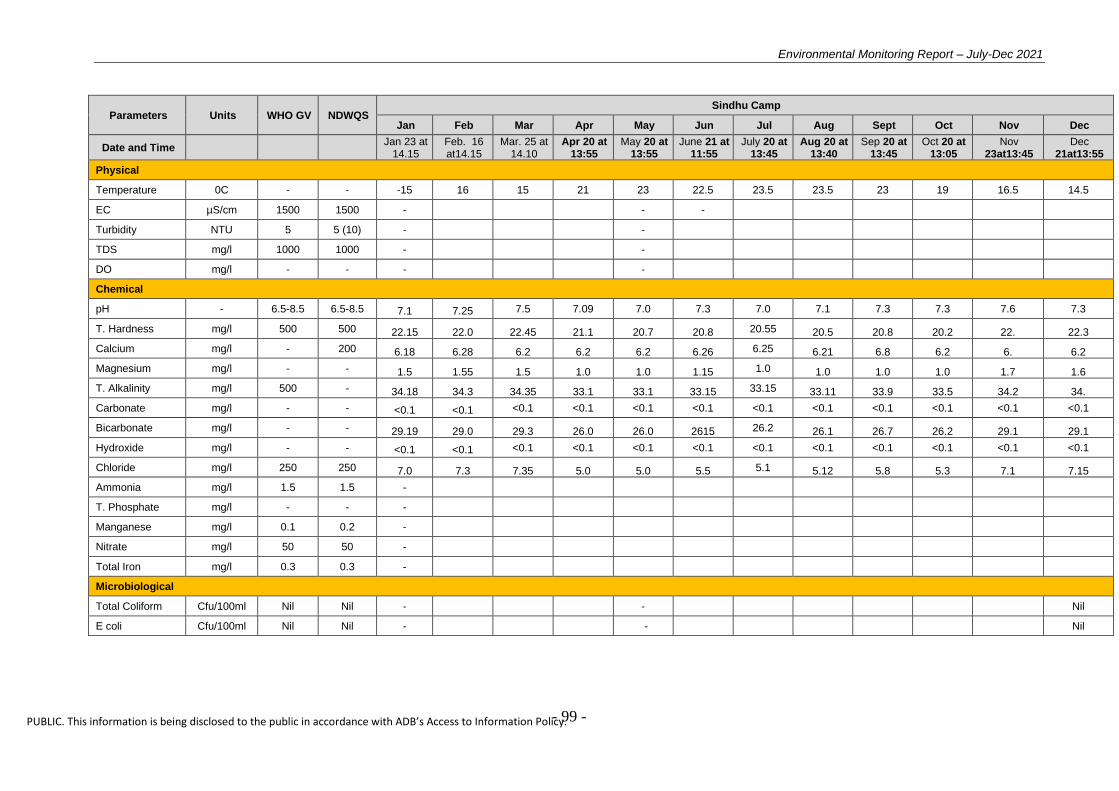
Environmental Monitoring Report – July-Dec 2021
- 99 -
PUBLIC. This information is being disclosed to the public in accordance with ADB’s Access to Information Policy.
Parameters Units WHO GV NDWQS Sindhu Camp
Jan Feb Mar Apr May Jun Jul Aug Sept Oct Nov Dec
Date and Time Jan 23 at 14.15
Feb. 16 at14.15
Mar. 25 at 14.10
Apr 20 at 13:55
May 20 at 13:55
June 21 at 11:55
July 20 at 13:45
Aug 20 at 13:40
Sep 20 at 13:45
Oct 20 at 13:05
Nov 23at13:45
Dec 21at13:55
Physical
Temperature 0C - - -15 16 15 21 23 22.5 23.5 23.5 23 19 16.5 14.5
EC µS/cm 1500 1500 - - -
Turbidity NTU 5 5 (10) - -
TDS mg/l 1000 1000 - -
DO mg/l - - - -
Chemical
pH - 6.5-8.5 6.5-8.5 7.1 7.25 7.5 7.09 7.0 7.3 7.0 7.1 7.3 7.3 7.6 7.3
T. Hardness mg/l 500 500 22.15 22.0 22.45 21.1 20.7 20.8 20.55 20.5 20.8 20.2 22. 22.3
Calcium mg/l - 200 6.18 6.28 6.2 6.2 6.2 6.26 6.25 6.21 6.8 6.2 6. 6.2
Magnesium mg/l - - 1.5 1.55 1.5 1.0 1.0 1.15 1.0 1.0 1.0 1.0 1.7 1.6
T. Alkalinity mg/l 500 - 34.18 34.3 34.35 33.1 33.1 33.15 33.15 33.11 33.9 33.5 34.2 34.
Carbonate mg/l - - <0.1 <0.1 <0.1 <0.1 <0.1 <0.1 <0.1 <0.1 <0.1 <0.1 <0.1 <0.1
Bicarbonate mg/l - - 29.19 29.0 29.3 26.0 26.0 2615 26.2 26.1 26.7 26.2 29.1 29.1
Hydroxide mg/l - - <0.1 <0.1 <0.1 <0.1 <0.1 <0.1 <0.1 <0.1 <0.1 <0.1 <0.1 <0.1
Chloride mg/l 250 250 7.0 7.3 7.35 5.0 5.0 5.5 5.1 5.12 5.8 5.3 7.1 7.15
Ammonia mg/l 1.5 1.5 -
T. Phosphate mg/l - - -
Manganese mg/l 0.1 0.2 -
Nitrate mg/l 50 50 -
Total Iron mg/l 0.3 0.3 -
Microbiological
Total Coliform Cfu/100ml Nil Nil - - Nil
E coli Cfu/100ml Nil Nil - - Nil
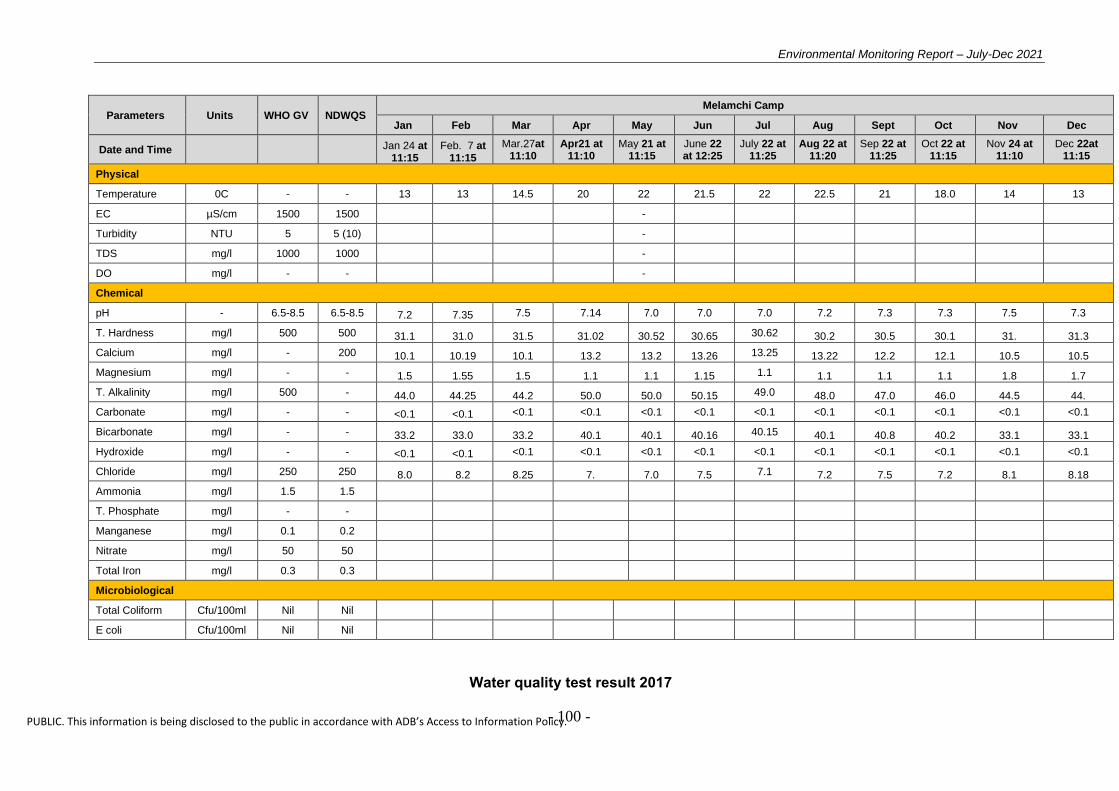
Environmental Monitoring Report – July-Dec 2021
- 100 -
PUBLIC. This information is being disclosed to the public in accordance with ADB’s Access to Information Policy.
Parameters Units WHO GV NDWQS Melamchi Camp
Jan Feb Mar Apr May Jun Jul Aug Sept Oct Nov Dec
Date and Time Jan 24 at 11:15
Feb. 7 at 11:15
Mar.27at 11:10
Apr21 at 11:10
May 21 at 11:15
June 22 at 12:25
July 22 at 11:25
Aug 22 at 11:20
Sep 22 at 11:25
Oct 22 at 11:15
Nov 24 at 11:10
Dec 22at 11:15
Physical
Temperature 0C - - 13 13 14.5 20 22 21.5 22 22.5 21 18.0 14 13
EC µS/cm 1500 1500 -
Turbidity NTU 5 5 (10) -
TDS mg/l 1000 1000 -
DO mg/l - - -
Chemical
pH - 6.5-8.5 6.5-8.5 7.2 7.35 7.5 7.14 7.0 7.0 7.0 7.2 7.3 7.3 7.5 7.3
T. Hardness mg/l 500 500 31.1 31.0 31.5 31.02 30.52 30.65 30.62 30.2 30.5 30.1 31. 31.3
Calcium mg/l - 200 10.1 10.19 10.1 13.2 13.2 13.26 13.25 13.22 12.2 12.1 10.5 10.5
Magnesium mg/l - - 1.5 1.55 1.5 1.1 1.1 1.15 1.1 1.1 1.1 1.1 1.8 1.7
T. Alkalinity mg/l 500 - 44.0 44.25 44.2 50.0 50.0 50.15 49.0 48.0 47.0 46.0 44.5 44.
Carbonate mg/l - - <0.1 <0.1 <0.1 <0.1 <0.1 <0.1 <0.1 <0.1 <0.1 <0.1 <0.1 <0.1
Bicarbonate mg/l - - 33.2 33.0 33.2 40.1 40.1 40.16 40.15 40.1 40.8 40.2 33.1 33.1
Hydroxide mg/l - - <0.1 <0.1 <0.1 <0.1 <0.1 <0.1 <0.1 <0.1 <0.1 <0.1 <0.1 <0.1
Chloride mg/l 250 250 8.0 8.2 8.25 7. 7.0 7.5 7.1 7.2 7.5 7.2 8.1 8.18
Ammonia mg/l 1.5 1.5
T. Phosphate mg/l - -
Manganese mg/l 0.1 0.2
Nitrate mg/l 50 50
Total Iron mg/l 0.3 0.3
Microbiological
Total Coliform Cfu/100ml Nil Nil
E coli Cfu/100ml Nil Nil
Water quality test result 2017
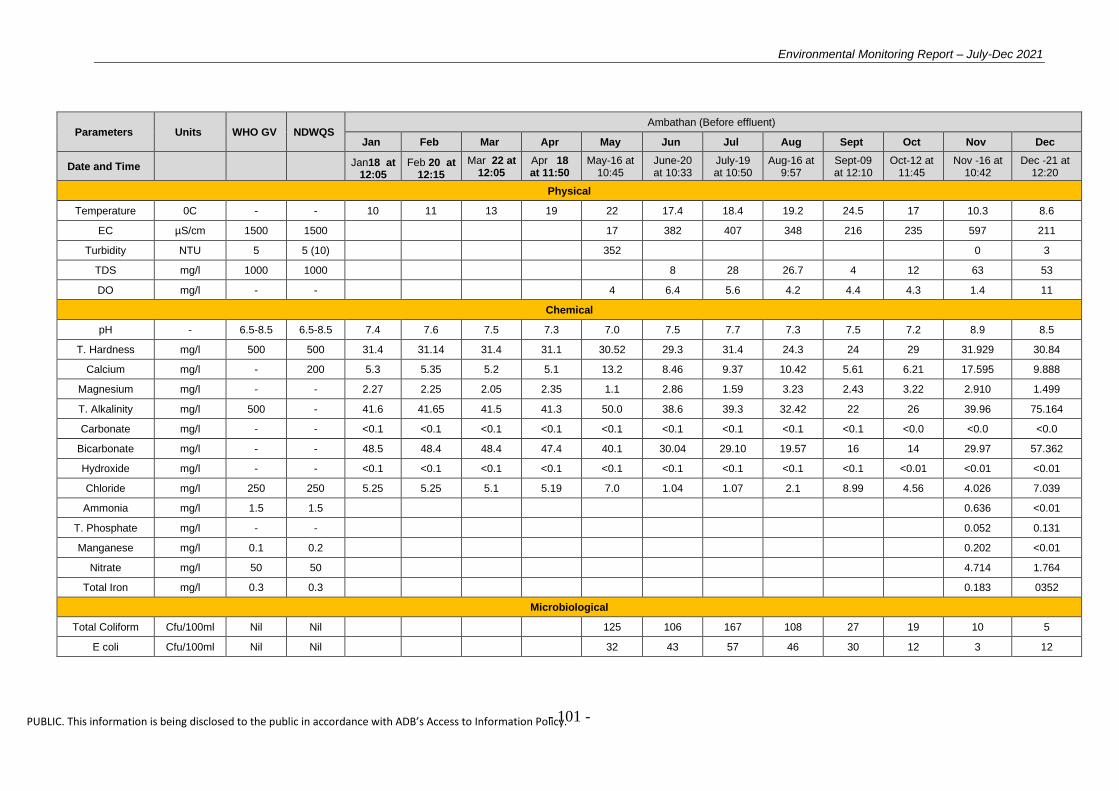
Environmental Monitoring Report – July-Dec 2021
- 101 -
PUBLIC. This information is being disclosed to the public in accordance with ADB’s Access to Information Policy.
Parameters Units WHO GV NDWQS Ambathan (Before effluent)
Jan Feb Mar Apr May Jun Jul Aug Sept Oct Nov Dec
Date and Time Jan18 at 12:05
Feb 20 at 12:15
Mar 22 at 12:05
Apr 18 at 11:50
May-16 at 10:45
June-20 at 10:33
July-19 at 10:50
Aug-16 at 9:57
Sept-09 at 12:10
Oct-12 at 11:45
Nov -16 at 10:42
Dec -21 at 12:20
Physical
Temperature 0C - - 10 11 13 19 22 17.4 18.4 19.2 24.5 17 10.3 8.6
EC µS/cm 1500 1500 17 382 407 348 216 235 597 211
Turbidity NTU 5 5 (10) 352 0 3
TDS mg/l 1000 1000 8 28 26.7 4 12 63 53
DO mg/l - - 4 6.4 5.6 4.2 4.4 4.3 1.4 11
Chemical
pH - 6.5-8.5 6.5-8.5 7.4 7.6 7.5 7.3 7.0 7.5 7.7 7.3 7.5 7.2 8.9 8.5
T. Hardness mg/l 500 500 31.4 31.14 31.4 31.1 30.52 29.3 31.4 24.3 24 29 31.929 30.84
Calcium mg/l - 200 5.3 5.35 5.2 5.1 13.2 8.46 9.37 10.42 5.61 6.21 17.595 9.888
Magnesium mg/l - - 2.27 2.25 2.05 2.35 1.1 2.86 1.59 3.23 2.43 3.22 2.910 1.499
T. Alkalinity mg/l 500 - 41.6 41.65 41.5 41.3 50.0 38.6 39.3 32.42 22 26 39.96 75.164
Carbonate mg/l - - <0.1 <0.1 <0.1 <0.1 <0.1 <0.1 <0.1 <0.1 <0.1 <0.0 <0.0 <0.0
Bicarbonate mg/l - - 48.5 48.4 48.4 47.4 40.1 30.04 29.10 19.57 16 14 29.97 57.362
Hydroxide mg/l - - <0.1 <0.1 <0.1 <0.1 <0.1 <0.1 <0.1 <0.1 <0.1 <0.01 <0.01 <0.01
Chloride mg/l 250 250 5.25 5.25 5.1 5.19 7.0 1.04 1.07 2.1 8.99 4.56 4.026 7.039
Ammonia mg/l 1.5 1.5 0.636 <0.01
T. Phosphate mg/l - - 0.052 0.131
Manganese mg/l 0.1 0.2 0.202 <0.01
Nitrate mg/l 50 50 4.714 1.764
Total Iron mg/l 0.3 0.3 0.183 0352
Microbiological
Total Coliform Cfu/100ml Nil Nil 125 106 167 108 27 19 10 5
E coli Cfu/100ml Nil Nil 32 43 57 46 30 12 3 12

Environmental Monitoring Report – July-Dec 2021
- 102 -
PUBLIC. This information is being disclosed to the public in accordance with ADB’s Access to Information Policy.
Parameters Units WHO GV NDWQS Ambathan (After effluent)
Jan Feb Mar Apr May Jun Jul Aug Sept Oct Nov Dec
Date and Time Jan 24 at 11:15
Feb. 7 at 11:15
Mar.27at 11:10
Apr21 at 11:10
May-16 at 11:15
June-20 at 11:15
July-19 at 11:19
Aug -16 at 10:19
Sept-09 at 12:23
Oct -12 at 12:05
Nov -16 at 09:47
Dec -21 at 12:35
Physical
Temperature 0C - - 13 13 14.5 20 18 18.3 19.5 20.1 24.1 18 11.5 8.7
EC µS/cm 1500 1500 436 675 723 632 209 276 294 284
Turbidity NTU 5 5 (10) 0 2
TDS mg/l 1000 1000 52 63 79 97.4 20 26 235 73
DO mg/l - - 5.3 5.1 4.4 4.3 4.6 4.2 14.3
Chemical
pH - 6.5-8.5 6.5-8.5 7.2 7.35 7.5 7.14 7.7 7.4 7.3 7.9 7.4 7.1 8.8 8.9
T. Hardness mg/l 500 500 31.1 31.0 31.5 31.02 28.2 26.4 29.6 28.2 22 23 27.938 30.84
Calcium mg/l - 200 10.1 10.19 10.1 13.2 6.2 8.6 9.32 12.5 6.41 6.32 9.597 9.064
Magnesium mg/l - - 1.5 1.55 1.5 1.1 3.32 4.75 3.84 2.14 1.46 2.19 0.970 1.999
T. Alkalinity mg/l 500 - 44.0 44.25 44.2 50.0 39.4 41.3 40.2 37.9 18 16 41.958 59.34
Carbonate mg/l - - <0.1 <0.1 <0.1 <0.1 <0.1 <0.1 <0.1 <0.1 <0.1 <0.01 <0.01 <0.01
Bicarbonate mg/l - - 33.2 33.0 33.2 40.1 31.4 29.04 27.3 24.67 14 17 17.982 33.626
Hydroxide mg/l - - <0.1 <0.1 <0.1 <0.1 <0.1 <0.1 <0.1 <0.1 <0.1 <0.01 <0.01 <0.01
Chloride mg/l 250 250 8.0 8.2 8.25 7. 5.08 3.09 2.93 3.64 5.99 4.32 6.039 6.033
Ammonia mg/l 1.5 1.5 0.545 0.067
T. Phosphate mg/l - - 0.070 0.0.227
Manganese mg/l 0.1 0.2 0.091 0.250
Nitrate mg/l 50 50 5.714 2.199
Total Iron mg/l 0.3 0.3 0.171 0.389
Microbiological
Total Coliform Cfu/100ml Nil Nil 119 96 103 97 14 20 20 120
E coli Cfu/100ml Nil Nil 94 82 84 72 65 52 Nil 93

Environmental Monitoring Report – July-Dec 2021
- 103 -
PUBLIC. This information is being disclosed to the public in accordance with ADB’s Access to Information Policy.
Parameters Units WHO GV NDWQS Ambathan (Camp)
Jan Feb Mar Apr May Jun Jul Aug Sept Oct Nov Dec
Date and Time Jan 24 at 11:15
Feb. 7 at 11:15
Mar.27at 11:10
Apr21 at 11:10
May-16 at 11:30
June-20 at 11:35
July-19 at 11:43
August -16 at 10:38
Sept-09 at 12:43
Oct -12 at 12:25
Nov -16 at 10:55
Dec -21 at 10:05
Physical
Temperature 0C - - 13 13 14.5 20 17 18.2 20.2 22.4 26.2 20 13.2 8.4
EC µS/cm 1500 1500 154 163 198 207 101 125 296 254
Turbidity NTU 5 5 (10) 0 1
TDS mg/l 1000 1000 18 14 11 15.2 23 15 41 50
DO mg/l - - 6.7 6.5 5.6 4.9 5.2 2.1 5.3
Chemical
pH - 6.5-8.5 6.5-8.5 7.2 7.35 7.5 7.14 7.3 7.7 7.8 7.4 7.8 8.1 8.3 8.7
T. Hardness mg/l 500 500 31.1 31.0 31.5 31.02 10.3 13.2 14.1 11.9 6 8 9.978 16.44
Calcium mg/l - 200 10.1 10.19 10.1 13.2 4.1 5.3 6.13 6.37 3.20 4.01 4.798 3.296
Magnesium mg/l - - 1.5 1.55 1.5 1.1 1.23 1.34 2.71 1.19 0.48 1.02 0.485 1.999
T. Alkalinity mg/l 500 - 44.0 44.25 44.2 50.0 25.5 27.5 28.9 19.3 14 13 27.972 39.56
Carbonate mg/l - - <0.1 <0.1 <0.1 <0.1 <0.1 <0.1 <0.1 <0.1 <0.1 <0.01 <0.01 <0.01
Bicarbonate mg/l - - 33.2 33.0 33.2 40.1 21.4 23.4 21.2 13.14 8.0 3.7 13.986 21.758
Hydroxide mg/l - - <0.1 <0.1 <0.1 <0.1 <0.1 <0.1 <0.1 <0.1 <0.1 <0.01 <0.01 <0.01
Chloride mg/l 250 250 8.0 8.2 8.25 7. 6.04 5.01 4.48 5.33 5.99 4.66 6.039 5.027
Ammonia mg/l 1.5 1.5 0.000 <0.01
T. Phosphate mg/l - - 0.131 0.545
Manganese mg/l 0.1 0.2 0.254 <0.01
Nitrate mg/l 50 50 3.714 0.068
Total Iron mg/l 0.3 0.3 0.208 0.572
Microbiological
Total Coliform Cfu/100ml Nil Nil 4 1 Nil 25 40 12 5 50
E coli Cfu/100ml Nil Nil 1 Nil Nil 9 35 7 3 46
Parameters Units WHO GV NDWQS Gyalthum (Before effluent)

Environmental Monitoring Report – July-Dec 2021
- 104 -
PUBLIC. This information is being disclosed to the public in accordance with ADB’s Access to Information Policy.
Jan Feb Mar Apr May Jun Jul Aug Sept Oct Nov Dec
Date and Time Jan 19 at 13:30
Feb 20at 13:15
Mar 22at 13:15
Apr 19at 12:50
May-16 at 1:05
June-20 at 1:15
July-19 at 1:23
August -16 at 11:46
Sept-09 at 2:33
Oct -12 at 1:48
Nov -16 at 12:40
Dec -21 at 01:26
Physical
Temperature 0C - - 12.5 14 16 18 19 19.6 20.5 21.3 26.1 21 17.4 12.7
EC µS/cm 1500 1500 400 563 618 645 147 273 405 176
Turbidity NTU 5 5 (10) 0 1
TDS mg/l 1000 1000 36 42 45 41.5 2 4 70 30
DO mg/l - -
7.2 7.3 6.9 4.9 5.3 8.2 7.5
Chemical
pH - 6.5-8.5 6.5-8.5 7.6 7.6 7.6 7.5 7.6 8.1 8.2 8.3 7.9 8.1 7.9 8.5
T. Hardness mg/l 500 500 62.5 21.15 62.5 62.2 18.3 16.4 18.7 19.8 22 21 13.969 14.392
Calcium mg/l - 200 6.5 4.3 6.4 6.2 5.04 5.67 6.19 9.41 6.41 6.87 8.797 5.768
Magnesium mg/l - - 2.25 2.4 2.02 2.32 2.32 3.96 4.62 2.02 1.46 1.99 1.455 <0.01
T. Alkalinity mg/l 500 - 24.6 25.7 24.5 24.4 27.4 26.4 27.3 22.19 16 18 43.956 53.406
Carbonate mg/l - - <0.1 <0.1 <0.1 <0.1 <0.1 <0.1 <0.1 <0.1 <0.1 <0.01 <0.01 <0.01
Bicarbonate mg/l - - 32.5 20.15 33.4 33.4 25.4 27.4 22.3 10.9 8.0 5.7 17.982 33.626
Hydroxide mg/l - - <0.1 <0.1 <0.1 <0.1 <0.1 <0.1 <0.1 <0.1 <0.1 <0.01 3.996 3.996
Chloride mg/l 250 250 5.35 8.14 5.1 5.18 6.04 5.03 5.45 4.34 5.97 4.79 5.033 3.016
Ammonia mg/l 1.5 1.5 1.045 0.112
T. Phosphate mg/l - - 0.571 0.818
Manganese mg/l 0.1 0.2 0.145 <0.01
Nitrate mg/l 50 50 6.712 0.350
Total Iron mg/l 0.3 0.3 0.196 0.573
Microbiological
Total Coliform Cfu/100ml Nil Nil 220 196 213 40 67 35 14
E coli Cfu/100ml Nil Nil 180 145 153 60 78 35 12
Parameters Units WHO GV NDWQS Gyalthum (After effluent)

Environmental Monitoring Report – July-Dec 2021
- 105 -
PUBLIC. This information is being disclosed to the public in accordance with ADB’s Access to Information Policy.
Jan Feb Mar Apr May Jun Jul Aug Sept Oct Nov Dec
Date and Time Jan 18at 13:25
Feb 20 at 14:15
Mar 22at 13:15
Apr 18at 13:25
May-16 at 1:35
June-20 at 1:45
July-19 at 1:42
August -16 at 12:13
Sept-09 at 2:24
Oct -12 at 2:15
Nov -16 at 01:10
Dec -21 at 01:28
Physical
Temperature 0C - - 13 13 16 19 20 21 22.8 23.5 26.4 22 18.3 16.6
EC µS/cm 1500 1500 525 745 796 814 318 287 957 450
Turbidity NTU 5 5 (10) 69 78
TDS mg/l 1000 1000 404 475 516 618.2 1794 850 155 92
DO mg/l - -
5.9 5.4 6.3 6.2 6.3 8.7 7.4
Chemical
pH - 6.5-8.5 6.5-8.5 7.5 7.5 7.6 7.4 7.5 7.5 7.5 7.8 7.7 7.9 8.1 8.4
T. Hardness mg/l 500 500 21.35 19.15 21.5 21.2 21.1 23.3 24.1 26.2 32 30 89.802 37.008
Calcium mg/l - 200 4.35 5.2 4.3 4.3 4.32 5.42 6.56 17.44 9.62 9.12 31.992 12.360
Magnesium mg/l - - 2.4 1.4 2.4 2.4 2.31 3.94 4.01 3.92 1.94 2.31 10.185 1.499
T. Alkalinity mg/l 500 - 25.9 28.6 25.7 25.7 54.6 56.4 58.7 47.60 16 22 37.962 100.878
Carbonate mg/l - - <0.1 <0.1 <0.1 <0.1 <0.1 <0.1 <0.1 <0.1 <0.1 <0.01 <0.01 <0.01
Bicarbonate mg/l - - 20.15 24.2 20.15 20.15 51.7 58.7 57.8 31.6 8.0 7.6 23.976 21.758
Hydroxide mg/l - - <0.1 <0.1 <0.1 <0.1 <0.1 <0.1 <0.1 <0.1 <0.1 <0.01 <0.01 <0.01
Chloride mg/l 250 250 8.1 10.15 8.1 8.1 5.03 3.01 3.70 3.33 5.98 6.30 6.039 3.016
Ammonia mg/l 1.5 1.5 1.136 0.202
T. Phosphate mg/l - - 0.123 0.5
Manganese mg/l 0.1 0.2 0.254 1.132
Nitrate mg/l 50 50 8.428 0.678
Total Iron mg/l 0.3 0.3 1.221 0.757
Microbiological
Total Coliform Cfu/100ml Nil Nil 41 57 87 107 35 39 120 120
E coli Cfu/100ml Nil Nil 150 145 73 94 20 35 20 450
Parameters Units WHO GV NDWQS Gyalthum (Camp)

Environmental Monitoring Report – July-Dec 2021
- 106 -
PUBLIC. This information is being disclosed to the public in accordance with ADB’s Access to Information Policy.
Jan Feb Mar Apr May Jun Jul Aug Sept Oct Nov Dec
Date and Time Jan 18 at 14:25
Feb. 7 at 11:15
Mar 22 at 14:05
Apr 18 at 14:30
May-16 at 1:55
June-20 at 2:15
July-19 at 2:10
August -16 at 12:35
Sept-09 at 2:59
Oct -12 at 2:25
Nov -16 at 12:57
Dec -21 at 01:42
Physical
Temperature 0C - - 13 13 17 19 18 22 24.2 26.5 27.2 24 18.3 17.1
EC µS/cm 1500 1500 165 175 215 198 214 252 475 410
Turbidity NTU 5 5 (10) 0 1
TDS mg/l 1000 1000 83 86 76 91.3 42 32 49 48
DO mg/l - -
6.6 5.9 5.0 4.9 8.9 4.4
Chemical
pH - 6.5-8.5 6.5-8.5 7.2 7.35 7.5 7.3 7.4 7.6 7.4 7.3 7.6 8.4 7.2 8.2
T. Hardness mg/l 500 500 31.1 31.0 19.5 19.2 15.2 17.5 18.5 15.7 28 27 19.956 18.504
Calcium mg/l - 200 10.1 10.19 5.2 5.0 5.78 6.06 6.15 6.34 4.00 3.76 7.198 4.944
Magnesium mg/l - - 1.5 1.55 1.4 1.3 1.03 2.45 2.93 1.33 4.38 4.72 0.484 1.499
T. Alkalinity mg/l 500 - 44.0 44.25 28.8 28.5 29.4 30.4 32.1 25.22 20 17 51.948 47.472
Carbonate mg/l - - <0.1 <0.1 <0.1 <0.1 <0.1 <0.1 <0.1 <0.1 <0.1 <0.01 <0.01 <0.01
Bicarbonate mg/l - - 33.2 33.0 24. 24.4 23.1 25.6 23.8 18.4 10 9.36 29.97 17.802
Hydroxide mg/l - - <0.1 <0.1 <0.1 <0.1 <0.1 <0.1 <0.1 <0.1 <0.1 <0.01 <0.01 <0.01
Chloride mg/l 250 250 8.0 8.2 10.1 9.8 5.03 4.85 5.68 5.62 7.93 7.34 8.052 5.027
Ammonia mg/l 1.5 1.5 0.136 <0.01
T. Phosphate mg/l - - 0.061 0.181
Manganese mg/l 0.1 0.2 0.632 <0.01
Nitrate mg/l 50 50 9.233 0.145
Total Iron mg/l 0.3 0.3 0.261 0.379
Microbiological
Total Coliform Cfu/100ml Nil Nil 3 Nil Nil 29 2 Nil 8 Nil
E coli Cfu/100ml Nil Nil 1 Nill Nil 7 15 5 2 Nil
Parameters Units WHO GV NDWQS Sindu(Before effluent)
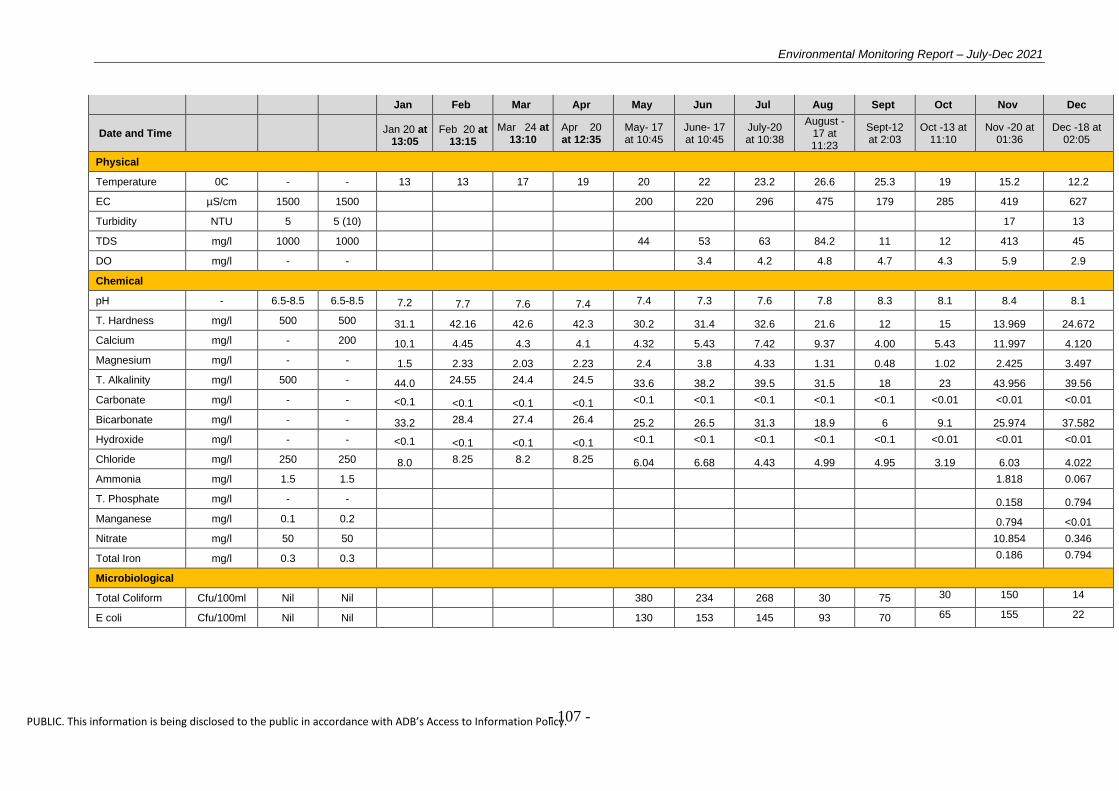
Environmental Monitoring Report – July-Dec 2021
- 107 -
PUBLIC. This information is being disclosed to the public in accordance with ADB’s Access to Information Policy.
Jan Feb Mar Apr May Jun Jul Aug Sept Oct Nov Dec
Date and Time Jan 20 at 13:05
Feb 20 at 13:15
Mar 24 at 13:10
Apr 20 at 12:35
May- 17 at 10:45
June- 17 at 10:45
July-20 at 10:38
August -17 at 11:23
Sept-12 at 2:03
Oct -13 at 11:10
Nov -20 at 01:36
Dec -18 at 02:05
Physical
Temperature 0C - - 13 13 17 19 20 22 23.2 26.6 25.3 19 15.2 12.2
EC µS/cm 1500 1500 200 220 296 475 179 285 419 627
Turbidity NTU 5 5 (10) 17 13
TDS mg/l 1000 1000 44 53 63 84.2 11 12 413 45
DO mg/l - - 3.4 4.2 4.8 4.7 4.3 5.9 2.9
Chemical
pH - 6.5-8.5 6.5-8.5 7.2 7.7 7.6 7.4 7.4 7.3 7.6 7.8 8.3 8.1 8.4 8.1
T. Hardness mg/l 500 500 31.1 42.16 42.6 42.3 30.2 31.4 32.6 21.6 12 15 13.969 24.672
Calcium mg/l - 200 10.1 4.45 4.3 4.1 4.32 5.43 7.42 9.37 4.00 5.43 11.997 4.120
Magnesium mg/l - - 1.5 2.33 2.03 2.23 2.4 3.8 4.33 1.31 0.48 1.02 2.425 3.497
T. Alkalinity mg/l 500 - 44.0 24.55 24.4 24.5 33.6 38.2 39.5 31.5 18 23 43.956 39.56
Carbonate mg/l - - <0.1 <0.1 <0.1 <0.1 <0.1 <0.1 <0.1 <0.1 <0.1 <0.01 <0.01 <0.01
Bicarbonate mg/l - - 33.2 28.4 27.4 26.4 25.2 26.5 31.3 18.9 6 9.1 25.974 37.582
Hydroxide mg/l - - <0.1 <0.1 <0.1 <0.1 <0.1 <0.1 <0.1 <0.1 <0.1 <0.01 <0.01 <0.01
Chloride mg/l 250 250 8.0 8.25 8.2 8.25 6.04 6.68 4.43 4.99 4.95 3.19 6.03 4.022
Ammonia mg/l 1.5 1.5
1.818 0.067
T. Phosphate mg/l - - 0.158 0.794
Manganese mg/l 0.1 0.2 0.794 <0.01
Nitrate mg/l 50 50
10.854 0.346
Total Iron mg/l 0.3 0.3
0.186 0.794
Microbiological
Total Coliform Cfu/100ml Nil Nil 380 234 268 30 75 30 150 14
E coli Cfu/100ml Nil Nil 130 153 145 93 70 65 155 22

Environmental Monitoring Report – July-Dec 2021
- 108 -
PUBLIC. This information is being disclosed to the public in accordance with ADB’s Access to Information Policy.
Parameters Units WHO GV NDWQS Sindu(After effluent)
Jan Feb Mar Apr May Jun Jul Aug Sept Oct Nov Dec
Date and Time Jan 24 at 11:15
Feb. 7 at 11:15
Mar.27at 11:10
Apr21 at 11:10
May-17 at 11:30
June-17 at 11:30
July-20 at 11:08
August -17 at 12:21
Sept-12 at 2:2
Oct -13 at 11:50
Nov -20 at 01:55
Dec -18 at 02:14
Physical
Temperature 0C - - 13 13 14.5 20 21 23.1 24.3 26.8 24.9 20 15.9 13.8
EC µS/cm 1500 1500 228 248 276 289.6 257 255 1088 431
Turbidity NTU 5 5 (10) 204 290
TDS mg/l 1000 1000 56 67 49 144.0 13 18 133 177
DO mg/l - - 5.8 6.2 4.8 5.4 5.2 6.0 2.7
Chemical
pH - 6.5-8.5 6.5-8.5 7.2 7.35 7.5 7.14 7.3 7.6 7.9 8.3 8.1 8.0 8.6 8.4
T. Hardness mg/l 500 500 31.1 31.0 31.5 31.02 43.4 44.8 43.8 46.8 18 22 39.912 53.456
Calcium mg/l - 200 10.1 10.19 10.1 13.2 13.3 14.8 16.4 14.42 5.61 6.29 12.796 17.304
Magnesium mg/l - - 1.5 1.55 1.5 1.1 2.8 3.34 3.91 5.69 0.97 1.59 1.940 2.498
T. Alkalinity mg/l 500 - 44.0 44.25 44.2 50.0 63.0 58.5 61.0 46.2 24 25 75.924 79.12
Carbonate mg/l - - <0.1 <0.1 <0.1 <0.1 <0.1 <0.1 <0.1 <0.1 <0.1 <0.01 <0.01 <0.01
Bicarbonate mg/l - - 33.2 33.0 33.2 40.1 54.6 57.3 54.2 29.4 18 19.98 35.964 43.516
Hydroxide mg/l - - <0.1 <0.1 <0.1 <0.1 <0.1 <0.1 <0.1 <0.1 <0.1 <0.01 19.980 41.958
Chloride mg/l 250 250 8.0 8.2 8.25 7. 6.04 6.96 7.23 4.99 5.89 4.29 6.03 5.027
Ammonia mg/l 1.5 1.5
1.272 0.427
T. Phosphate mg/l - - 0.246 0.867
Manganese mg/l 0.1 0.2 0.636 0.102
Nitrate mg/l 50 50
8.146 1.256
Total Iron mg/l 0.3 0.3
0.808 0.867
Microbiological
Total Coliform Cfu/100ml Nil Nil 250 196 203 30 85 76 178 136
E coli Cfu/100ml Nil Nil 120 102 98 84 70 56 180 44
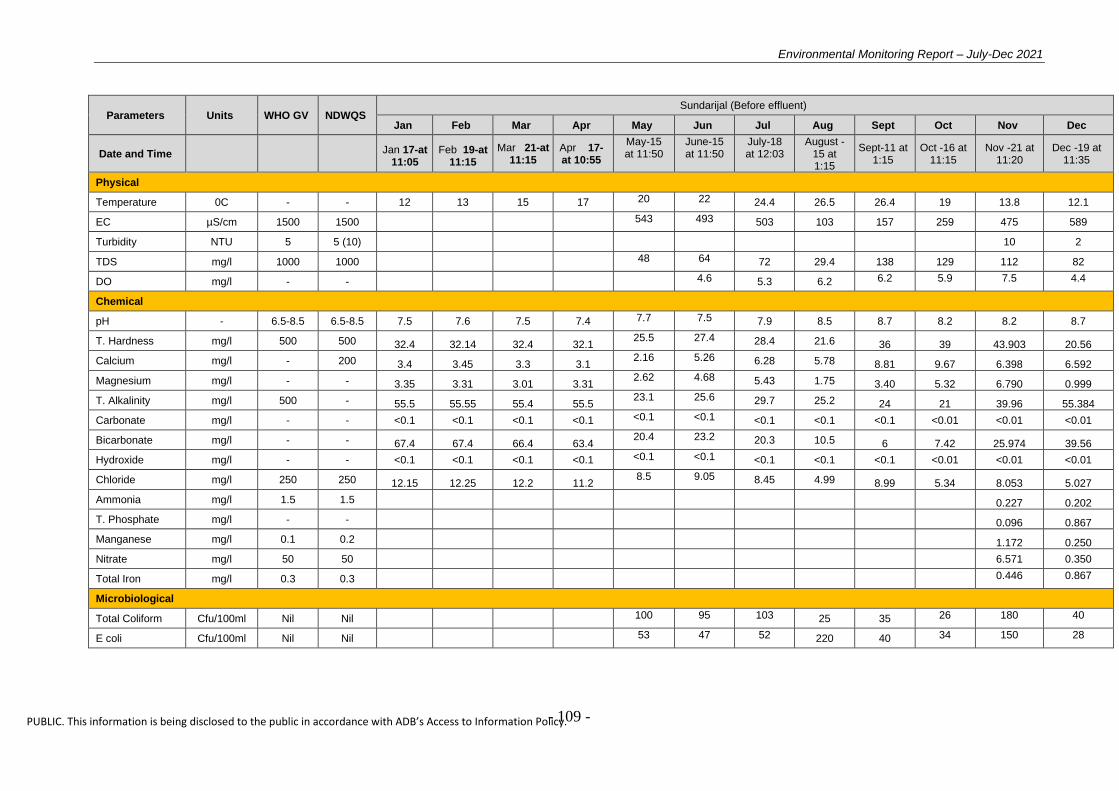
Environmental Monitoring Report – July-Dec 2021
- 109 -
PUBLIC. This information is being disclosed to the public in accordance with ADB’s Access to Information Policy.
Parameters Units WHO GV NDWQS Sundarijal (Before effluent)
Jan Feb Mar Apr May Jun Jul Aug Sept Oct Nov Dec
Date and Time Jan 17-at 11:05
Feb 19-at 11:15
Mar 21-at 11:15
Apr 17-at 10:55
May-15 at 11:50
June-15 at 11:50
July-18 at 12:03
August -15 at 1:15
Sept-11 at 1:15
Oct -16 at 11:15
Nov -21 at 11:20
Dec -19 at 11:35
Physical
Temperature 0C - - 12 13 15 17 20 22 24.4 26.5 26.4 19 13.8 12.1
EC µS/cm 1500 1500 543 493 503 103 157 259 475 589
Turbidity NTU 5 5 (10)
10 2
TDS mg/l 1000 1000 48 64 72 29.4 138 129 112 82
DO mg/l - -
4.6 5.3 6.2 6.2 5.9 7.5 4.4
Chemical
pH - 6.5-8.5 6.5-8.5 7.5 7.6 7.5 7.4 7.7 7.5 7.9 8.5 8.7 8.2 8.2 8.7
T. Hardness mg/l 500 500 32.4 32.14 32.4 32.1 25.5 27.4 28.4 21.6 36 39 43.903 20.56
Calcium mg/l - 200 3.4 3.45 3.3 3.1 2.16 5.26 6.28 5.78 8.81 9.67 6.398 6.592
Magnesium mg/l - - 3.35 3.31 3.01 3.31 2.62 4.68 5.43 1.75 3.40 5.32 6.790 0.999
T. Alkalinity mg/l 500 - 55.5 55.55 55.4 55.5 23.1 25.6 29.7 25.2 24 21 39.96 55.384
Carbonate mg/l - - <0.1 <0.1 <0.1 <0.1 <0.1 <0.1 <0.1 <0.1 <0.1 <0.01 <0.01 <0.01
Bicarbonate mg/l - - 67.4 67.4 66.4 63.4 20.4 23.2 20.3 10.5 6 7.42 25.974 39.56
Hydroxide mg/l - - <0.1 <0.1 <0.1 <0.1 <0.1 <0.1 <0.1 <0.1 <0.1 <0.01 <0.01 <0.01
Chloride mg/l 250 250 12.15 12.25 12.2 11.2 8.5 9.05 8.45 4.99 8.99 5.34 8.053 5.027
Ammonia mg/l 1.5 1.5
0.227 0.202
T. Phosphate mg/l - -
0.096 0.867
Manganese mg/l 0.1 0.2
1.172 0.250
Nitrate mg/l 50 50
6.571 0.350
Total Iron mg/l 0.3 0.3
0.446 0.867
Microbiological
Total Coliform Cfu/100ml Nil Nil 100 95 103 25 35 26 180 40
E coli Cfu/100ml Nil Nil 53 47 52 220 40 34 150 28
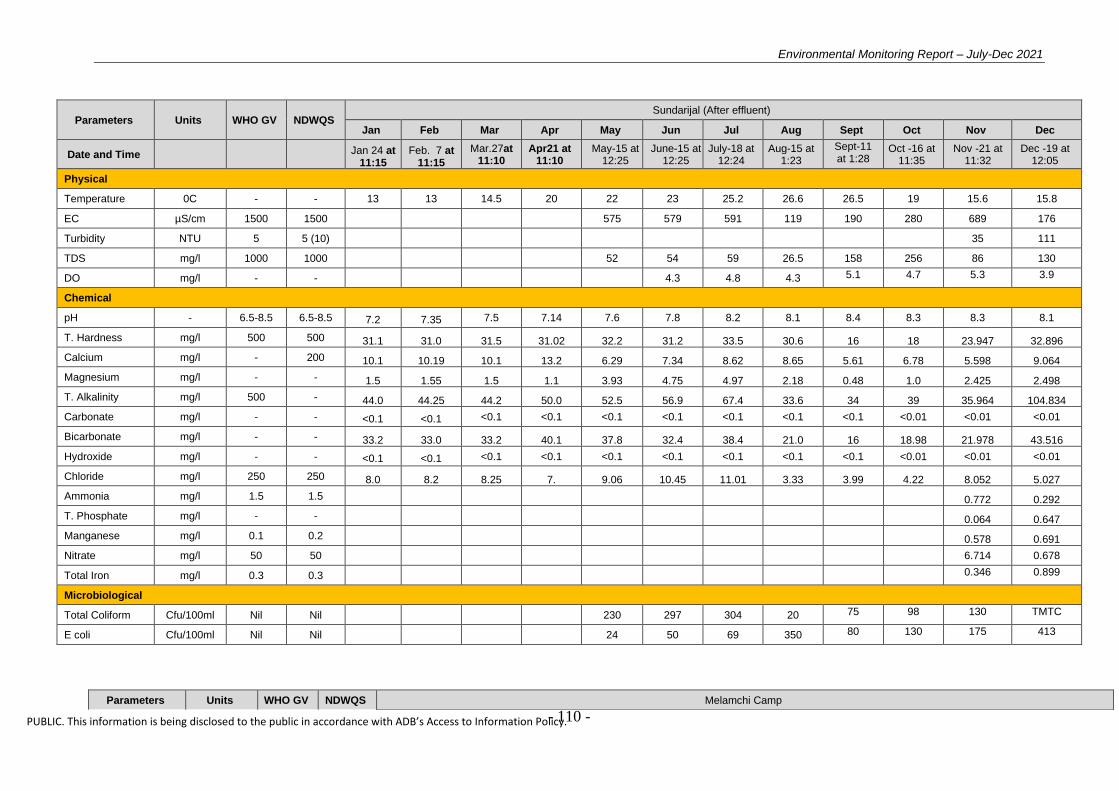
Environmental Monitoring Report – July-Dec 2021
- 110 -
PUBLIC. This information is being disclosed to the public in accordance with ADB’s Access to Information Policy.
Parameters Units WHO GV NDWQS Sundarijal (After effluent)
Jan Feb Mar Apr May Jun Jul Aug Sept Oct Nov Dec
Date and Time Jan 24 at 11:15
Feb. 7 at 11:15
Mar.27at 11:10
Apr21 at 11:10
May-15 at 12:25
June-15 at 12:25
July-18 at 12:24
Aug-15 at 1:23
Sept-11 at 1:28
Oct -16 at 11:35
Nov -21 at 11:32
Dec -19 at 12:05
Physical
Temperature 0C - - 13 13 14.5 20 22 23 25.2 26.6 26.5 19 15.6 15.8
EC µS/cm 1500 1500 575 579 591 119 190 280 689 176
Turbidity NTU 5 5 (10) 35 111
TDS mg/l 1000 1000 52 54 59 26.5 158 256 86 130
DO mg/l - - 4.3 4.8 4.3 5.1 4.7 5.3 3.9
Chemical
pH - 6.5-8.5 6.5-8.5 7.2 7.35 7.5 7.14 7.6 7.8 8.2 8.1 8.4 8.3 8.3 8.1
T. Hardness mg/l 500 500 31.1 31.0 31.5 31.02 32.2 31.2 33.5 30.6 16 18 23.947 32.896
Calcium mg/l - 200 10.1 10.19 10.1 13.2 6.29 7.34 8.62 8.65 5.61 6.78 5.598 9.064
Magnesium mg/l - - 1.5 1.55 1.5 1.1 3.93 4.75 4.97 2.18 0.48 1.0 2.425 2.498
T. Alkalinity mg/l 500 - 44.0 44.25 44.2 50.0 52.5 56.9 67.4 33.6 34 39 35.964 104.834
Carbonate mg/l - - <0.1 <0.1 <0.1 <0.1 <0.1 <0.1 <0.1 <0.1 <0.1 <0.01 <0.01 <0.01
Bicarbonate mg/l - - 33.2 33.0 33.2 40.1 37.8 32.4 38.4 21.0 16 18.98 21.978 43.516
Hydroxide mg/l - - <0.1 <0.1 <0.1 <0.1 <0.1 <0.1 <0.1 <0.1 <0.1 <0.01 <0.01 <0.01
Chloride mg/l 250 250 8.0 8.2 8.25 7. 9.06 10.45 11.01 3.33 3.99 4.22 8.052 5.027
Ammonia mg/l 1.5 1.5 0.772 0.292
T. Phosphate mg/l - - 0.064 0.647
Manganese mg/l 0.1 0.2 0.578 0.691
Nitrate mg/l 50 50
6.714 0.678
Total Iron mg/l 0.3 0.3
0.346 0.899
Microbiological
Total Coliform Cfu/100ml Nil Nil 230 297 304 20 75 98 130 TMTC
E coli Cfu/100ml Nil Nil 24 50 69 350 80 130 175 413
Parameters Units WHO GV NDWQS Melamchi Camp
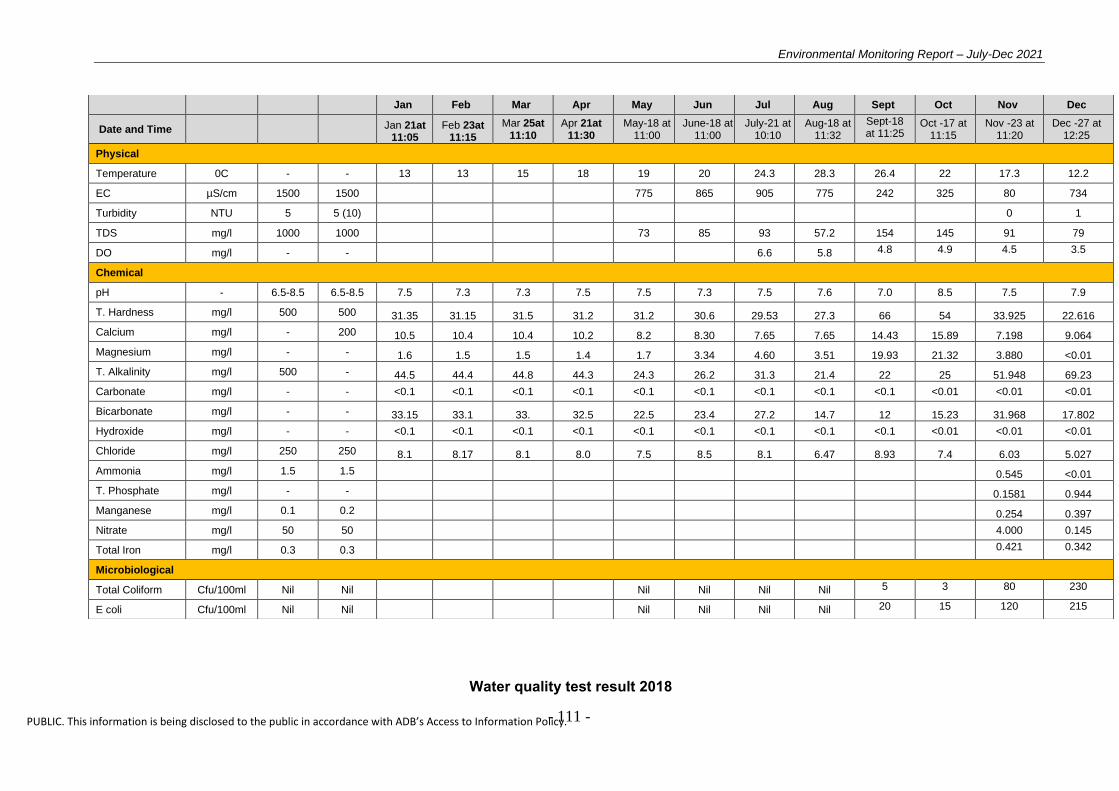
Environmental Monitoring Report – July-Dec 2021
- 111 -
PUBLIC. This information is being disclosed to the public in accordance with ADB’s Access to Information Policy.
Water quality test result 2018
Jan Feb Mar Apr May Jun Jul Aug Sept Oct Nov Dec
Date and Time Jan 21at 11:05
Feb 23at 11:15
Mar 25at 11:10
Apr 21at 11:30
May-18 at 11:00
June-18 at 11:00
July-21 at 10:10
Aug-18 at 11:32
Sept-18 at 11:25
Oct -17 at 11:15
Nov -23 at 11:20
Dec -27 at 12:25
Physical
Temperature 0C - - 13 13 15 18 19 20 24.3 28.3 26.4 22 17.3 12.2
EC µS/cm 1500 1500 775 865 905 775 242 325 80 734
Turbidity NTU 5 5 (10) 0 1
TDS mg/l 1000 1000 73 85 93 57.2 154 145 91 79
DO mg/l - - 6.6 5.8 4.8 4.9 4.5 3.5
Chemical
pH - 6.5-8.5 6.5-8.5 7.5 7.3 7.3 7.5 7.5 7.3 7.5 7.6 7.0 8.5 7.5 7.9
T. Hardness mg/l 500 500 31.35 31.15 31.5 31.2 31.2 30.6 29.53 27.3 66 54 33.925 22.616
Calcium mg/l - 200 10.5 10.4 10.4 10.2 8.2 8.30 7.65 7.65 14.43 15.89 7.198 9.064
Magnesium mg/l - - 1.6 1.5 1.5 1.4 1.7 3.34 4.60 3.51 19.93 21.32 3.880 <0.01
T. Alkalinity mg/l 500 - 44.5 44.4 44.8 44.3 24.3 26.2 31.3 21.4 22 25 51.948 69.23
Carbonate mg/l - - <0.1 <0.1 <0.1 <0.1 <0.1 <0.1 <0.1 <0.1 <0.1 <0.01 <0.01 <0.01
Bicarbonate mg/l - - 33.15 33.1 33. 32.5 22.5 23.4 27.2 14.7 12 15.23 31.968 17.802
Hydroxide mg/l - - <0.1 <0.1 <0.1 <0.1 <0.1 <0.1 <0.1 <0.1 <0.1 <0.01 <0.01 <0.01
Chloride mg/l 250 250 8.1 8.17 8.1 8.0 7.5 8.5 8.1 6.47 8.93 7.4 6.03 5.027
Ammonia mg/l 1.5 1.5 0.545 <0.01
T. Phosphate mg/l - - 0.1581 0.944
Manganese mg/l 0.1 0.2 0.254 0.397
Nitrate mg/l 50 50
4.000 0.145
Total Iron mg/l 0.3 0.3
0.421 0.342
Microbiological
Total Coliform Cfu/100ml Nil Nil Nil Nil Nil Nil 5 3 80 230
E coli Cfu/100ml Nil Nil Nil Nil Nil Nil 20 15 120 215
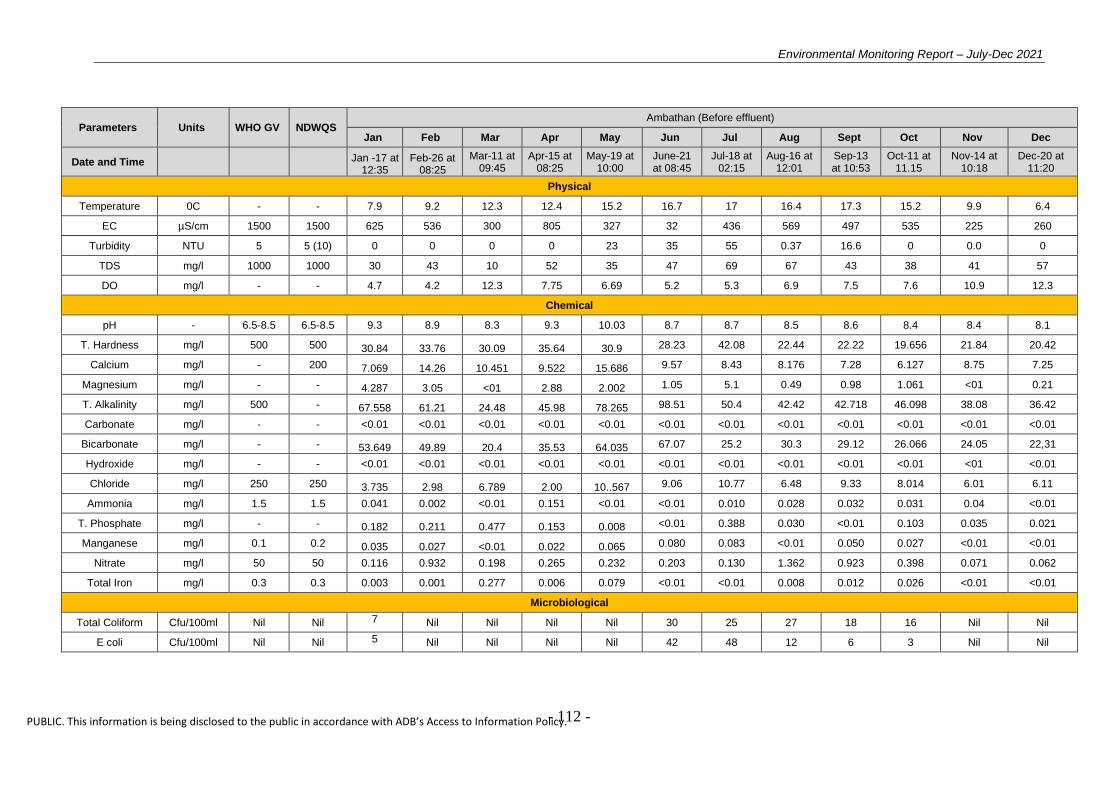
Environmental Monitoring Report – July-Dec 2021
- 112 -
PUBLIC. This information is being disclosed to the public in accordance with ADB’s Access to Information Policy.
Parameters Units WHO GV NDWQS Ambathan (Before effluent)
Jan Feb Mar Apr May Jun Jul Aug Sept Oct Nov Dec
Date and Time Jan -17 at 12:35
Feb-26 at 08:25
Mar-11 at 09:45
Apr-15 at 08:25
May-19 at 10:00
June-21 at 08:45
Jul-18 at 02:15
Aug-16 at 12:01
Sep-13 at 10:53
Oct-11 at 11.15
Nov-14 at 10:18
Dec-20 at 11:20
Physical
Temperature 0C - - 7.9 9.2 12.3 12.4 15.2 16.7 17 16.4 17.3 15.2 9.9 6.4
EC µS/cm 1500 1500 625 536 300 805 327 32 436 569 497 535 225 260
Turbidity NTU 5 5 (10) 0 0 0 0 23 35 55 0.37 16.6 0 0.0 0
TDS mg/l 1000 1000 30 43 10 52 35 47 69 67 43 38 41 57
DO mg/l - - 4.7 4.2 12.3 7.75 6.69 5.2 5.3 6.9 7.5 7.6 10.9 12.3
Chemical
pH - 6.5-8.5 6.5-8.5 9.3 8.9 8.3 9.3 10.03 8.7 8.7 8.5 8.6 8.4 8.4 8.1
T. Hardness mg/l 500 500 30.84 33.76 30.09 35.64 30.9 28.23 42.08 22.44 22.22 19.656 21.84 20.42
Calcium mg/l - 200 7.069 14.26 10.451 9.522 15.686 9.57 8.43 8.176 7.28 6.127 8.75 7.25
Magnesium mg/l - - 4.287 3.05 <01 2.88 2.002 1.05 5.1 0.49 0.98 1.061 <01 0.21
T. Alkalinity mg/l 500 - 67.558 61.21 24.48 45.98 78.265 98.51 50.4 42.42 42.718 46.098 38.08 36.42
Carbonate mg/l - - <0.01 <0.01 <0.01 <0.01 <0.01 <0.01 <0.01 <0.01 <0.01 <0.01 <0.01 <0.01
Bicarbonate mg/l - - 53.649 49.89 20.4 35.53 64.035 67.07 25.2 30.3 29.12 26.066 24.05 22,31
Hydroxide mg/l - - <0.01 <0.01 <0.01 <0.01 <0.01 <0.01 <0.01 <0.01 <0.01 <0.01 <01 <0.01
Chloride mg/l 250 250 3.735 2.98 6.789 2.00 10..567 9.06 10.77 6.48 9.33 8.014 6.01 6.11
Ammonia mg/l 1.5 1.5 0.041 0.002 <0.01 0.151 <0.01 <0.01 0.010 0.028 0.032 0.031 0.04 <0.01
T. Phosphate mg/l - - 0.182 0.211 0.477 0.153 0.008 <0.01 0.388 0.030 <0.01 0.103 0.035 0.021
Manganese mg/l 0.1 0.2 0.035 0.027 <0.01 0.022 0.065 0.080 0.083 <0.01 0.050 0.027 <0.01 <0.01
Nitrate mg/l 50 50 0.116 0.932 0.198 0.265 0.232 0.203 0.130 1.362 0.923 0.398 0.071 0.062
Total Iron mg/l 0.3 0.3 0.003 0.001 0.277 0.006 0.079 <0.01 <0.01 0.008 0.012 0.026 <0.01 <0.01
Microbiological
Total Coliform Cfu/100ml Nil Nil 7 Nil Nil Nil Nil 30 25 27 18 16 Nil Nil
E coli Cfu/100ml Nil Nil 5 Nil Nil Nil Nil 42 48 12 6 3 Nil Nil

Environmental Monitoring Report – July-Dec 2021
- 113 -
PUBLIC. This information is being disclosed to the public in accordance with ADB’s Access to Information Policy.
Parameters Units WHO GV NDWQS Ambathan (After effluent)
Jan Feb Mar Apr May Jun Jul Aug Sept Oct Nov Dec
Date and Time Jan -17 at 12:43
Feb-26 at 10:15
Mar-11 at 09:55
Apr-15 at 08:35
May-19 at 10:35
June-21 at 09:15
Jul-18 at 02:49
Aug -16 at 01:03
Sep-13 at 11:27
Oct-11 at 11:45
Nov-14 at 11:22
Dec-20 at 12:15
Physical
Temperature 0C - - 8.1 9.5 13.4 13.5 15.7 17.3 19.7 18.6 19.6 18.2 10.4 7.8
EC µS/cm 1500 1500 777 732 150 864 333 312 475 548 512 572 310 322
Turbidity NTU 5 5 (10) 17 15 0 1 61 75 43.6 18.62 10.07 12 7.16 2
TDS mg/l 1000 1000 30 62 26 46 43 59 59 75 39 63 44 45
DO mg/l - - 6.2 6.7 11.8 7.25 8.36 6.3 4.6 5.6 6.97 7.1 6.9 7.8
Chemical
pH - 6.5-8.5 6.5-8.5 9.6 9.1 10.1 9.6 10.14 8.3 8.3 8.3 8.7 8.6 8.7 8.6
T. Hardness mg/l 500 500 30.84 35.94 34.102 33.66 28.84 23.8 31.56 24.48 28.28 24.02 32.76 30.21
Calcium mg/l - 200 12.568 13.54 8.843 11.90 5.779 5.22 10.96 6.540 7.28 7.00 14.00 13.12
Magnesium mg/l - - 0.952 1.87 2.9 0.96 3.504 2.63 1.02 1.98 2.45 1.59 <0.01 1.01
T. Alkalinity mg/l 500 - 73.519 71.35 26.52 58.52 81.111 111.08 44.1 46.46 36.89 34.07 46.09 44.87
Carbonate mg/l - - <0.01 <0.01 <0.01 6.27 6.27 <0.01 <0.01 <0.01 <0.01 <0.01 <0.01 <0.01
Bicarbonate mg/l - - 55.636 50.20 23.46 16.72 71.15 88.03 29.4 28.28 27.18 22.04 36.09 32.54
Hydroxide mg/l - - <0.01 <0.01 <0.01 3.24 3.24 3.24 <0.01 <0.01 <0.01 <0.01 <0.01 <0.01
Chloride mg/l 250 250 2.801 2.74 5.819 6.02 6.724 6.04 6.85 4.63 8.40 7.01 8.01 6.22
Ammonia mg/l 1.5 1.5 <0.01 <0.01 <0.01 0.068 0.126 0.085 0.091 0.0877 0.047 0.062 0.045 0.035
T. Phosphate mg/l - - 0.844 0.723 0.678 0.100 0.044 0.130 0.277 0.060 0.063 0.023 0.010 0.042
Manganese mg/l 0.1 0.2 0.082 0.071 <0.01 0.088 0.721 0.596 0.833 <0.01 0.082 0.421 <0.01 <0.01
Nitrate mg/l 50 50 0.107 0.102 0.148 0.180 0.176 0.177 0.200 3.00 0.391 0.335 0.142 0.213
Total Iron mg/l 0.3 0.3 0.015 0.010 0.301 0.033 0.106 0.013 0.101 0.188 0.206 0.345 0.026 0.012
Microbiological
Total Coliform Cfu/100ml Nil Nil 51 56 32 56 46 58 82 97 72 68 19 15
E coli Cfu/100ml Nil Nil 25 27 25 27 20 72 125 42 38 42 6 3
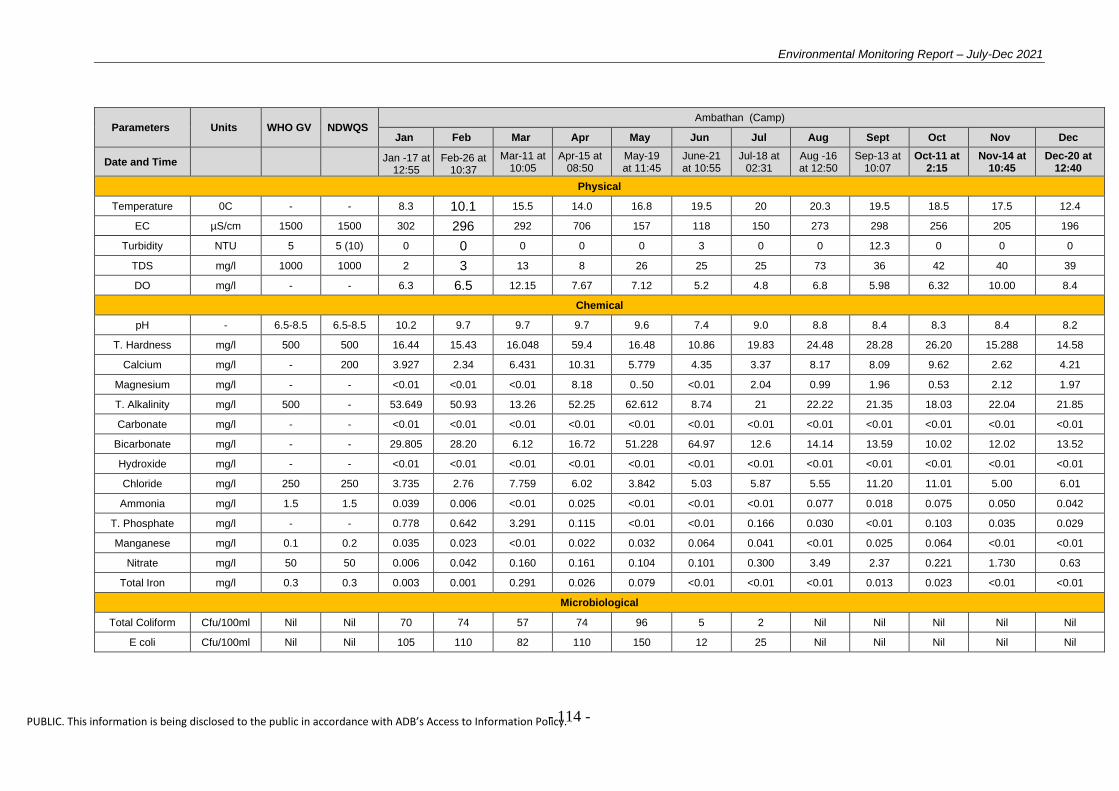
Environmental Monitoring Report – July-Dec 2021
- 114 -
PUBLIC. This information is being disclosed to the public in accordance with ADB’s Access to Information Policy.
Parameters Units WHO GV NDWQS Ambathan (Camp)
Jan Feb Mar Apr May Jun Jul Aug Sept Oct Nov Dec
Date and Time Jan -17 at 12:55
Feb-26 at 10:37
Mar-11 at 10:05
Apr-15 at 08:50
May-19 at 11:45
June-21 at 10:55
Jul-18 at 02:31
Aug -16 at 12:50
Sep-13 at 10:07
Oct-11 at 2:15
Nov-14 at 10:45
Dec-20 at 12:40
Physical
Temperature 0C - - 8.3 10.1 15.5 14.0 16.8 19.5 20 20.3 19.5 18.5 17.5 12.4
EC µS/cm 1500 1500 302 296 292 706 157 118 150 273 298 256 205 196
Turbidity NTU 5 5 (10) 0 0 0 0 0 3 0 0 12.3 0 0 0
TDS mg/l 1000 1000 2 3 13 8 26 25 25 73 36 42 40 39
DO mg/l - - 6.3 6.5 12.15 7.67 7.12 5.2 4.8 6.8 5.98 6.32 10.00 8.4
Chemical
pH - 6.5-8.5 6.5-8.5 10.2 9.7 9.7 9.7 9.6 7.4 9.0 8.8 8.4 8.3 8.4 8.2
T. Hardness mg/l 500 500 16.44 15.43 16.048 59.4 16.48 10.86 19.83 24.48 28.28 26.20 15.288 14.58
Calcium mg/l - 200 3.927 2.34 6.431 10.31 5.779 4.35 3.37 8.17 8.09 9.62 2.62 4.21
Magnesium mg/l - - <0.01 <0.01 <0.01 8.18 0..50 <0.01 2.04 0.99 1.96 0.53 2.12 1.97
T. Alkalinity mg/l 500 - 53.649 50.93 13.26 52.25 62.612 8.74 21 22.22 21.35 18.03 22.04 21.85
Carbonate mg/l - - <0.01 <0.01 <0.01 <0.01 <0.01 <0.01 <0.01 <0.01 <0.01 <0.01 <0.01 <0.01
Bicarbonate mg/l - - 29.805 28.20 6.12 16.72 51.228 64.97 12.6 14.14 13.59 10.02 12.02 13.52
Hydroxide mg/l - - <0.01 <0.01 <0.01 <0.01 <0.01 <0.01 <0.01 <0.01 <0.01 <0.01 <0.01 <0.01
Chloride mg/l 250 250 3.735 2.76 7.759 6.02 3.842 5.03 5.87 5.55 11.20 11.01 5.00 6.01
Ammonia mg/l 1.5 1.5 0.039 0.006 <0.01 0.025 <0.01 <0.01 <0.01 0.077 0.018 0.075 0.050 0.042
T. Phosphate mg/l - - 0.778 0.642 3.291 0.115 <0.01 <0.01 0.166 0.030 <0.01 0.103 0.035 0.029
Manganese mg/l 0.1 0.2 0.035 0.023 <0.01 0.022 0.032 0.064 0.041 <0.01 0.025 0.064 <0.01 <0.01
Nitrate mg/l 50 50 0.006 0.042 0.160 0.161 0.104 0.101 0.300 3.49 2.37 0.221 1.730 0.63
Total Iron mg/l 0.3 0.3 0.003 0.001 0.291 0.026 0.079 <0.01 <0.01 <0.01 0.013 0.023 <0.01 <0.01
Microbiological
Total Coliform Cfu/100ml Nil Nil 70 74 57 74 96 5 2 Nil Nil Nil Nil Nil
E coli Cfu/100ml Nil Nil 105 110 82 110 150 12 25 Nil Nil Nil Nil Nil

Environmental Monitoring Report – July-Dec 2021
- 115 -
PUBLIC. This information is being disclosed to the public in accordance with ADB’s Access to Information Policy.
Parameters Units WHO GV NDWQS Ambathan( effluent)
Jan Feb Mar Apr May Jun Jul Aug Sept Oct Nov Dec
Date and Time Aug-16 at 12:25
Sep-13 at 11:44
Oct-11 at 2:45
Nov-14 at 10:38
Dec-20 at 01:20
Physical
Temperature 0C - >400C 21.9 22.3 20.2 19.6 18.5
EC µS/cm - - 1862 2384 1948 1875 955
Turbidity NTU - - 337 332 378 223 87
TDS mg/l - - 257 402 408 135 98
DO mg/l - - 3.5 5.50 5.72 5.42 6.3
Chemical
pH - - 5.5-9.0 9.7 10.4 10.2 10.38 9.4
T. Hardness mg/l - - 22.44 165.54 190.08 30.57 29.36
Calcium mg/l - - 5.723 65.57 72.65 7.00 7.33
Magnesium mg/l - - 1.983 0.49 2.21 3.18 2.98
T. Alkalinity mg/l - - 86.86 320.38 286.61 74.15 68.83
Carbonate mg/l - - 16.16 74.29 56.23 14.03 8.27
Bicarbonate mg/l - - 72.72 246.60 228.43 42.09 39.45
Hydroxide mg/l - - <0.01 <0.01 <0.01 <0.01 <0.01
Chloride mg/l - 1 4.633 13.07 13.02 3.005 3.32
Ammonia mg/l - 40 1.649 1.84 2.41 0.152 0.153
T. Phosphate mg/l - - 30.909 11.03 31.79 2.021 2.342
Manganese mg/l - - <0.01 <0.01 <0.01 <0.01 <0.01
Nitrate mg/l - - 4.947 1.074 1.707 0.370 0.301
Total Iron mg/l - - 0.287 0.270 0.521 0.894 0.721
Microbiological
Total Coliform Cfu/100ml Nil Nil TMTC TMTC TMTC TMTC 128
E coli Cfu/100ml Nil Nil TMTC TMTC TMTC TMTC 83
Note:Tolerance Limitis given by Environmental Protection Act – 2054 Government of Nepal

Environmental Monitoring Report – July-Dec 2021
- 116 -
PUBLIC. This information is being disclosed to the public in accordance with ADB’s Access to Information Policy.
Parameters Units WHO GV NDWQS Gyalthum (Before effluent)
Jan Feb Mar Apr May Jun Jul Aug Sept Oct Nov Dec
Date and Time Jan -17 at 01:10
Feb-27 at 10:20
Mar-12 at 10:35
Apr-22 at 11:15
May-18 at 12:15
June-22 at 10:20
Jul-18 at 04:00
Aug -16 at 02:36
Sep -19 at 10:18
Oct-10 at 10:48
Nov-14 at 2:22
Dec-24 at 11:20
Physical
Temperature 0C - - 11.2 11.5 14.2 14.0 19.8 19.3 20.5 20.3 21.9 19.2 14.7 9.7
EC µS/cm 1500 1500 178 198 244 495 237 215 294 411 394 354 255 287
Turbidity NTU 5 5 (10) 4 6 19 3 10 52 20.7 0 6.8 4.5 2.1 2
TDS mg/l 1000 1000 23 27 16 15 27 33 33 54 36 63 44 47
DO mg/l - - 5.8 6.1 12.14 7.67 9.51 7.2 5.2 7.3 4.7 5.3 8.5 9.3
Chemical
pH - 6.5-8.5 6.5-8.5 8.8 8.6 9.5 9.7 9.5 8.3 9.1 8.4 8.6 8.7 8.3 8.3
T. Hardness mg/l 500 500 14.392 12.27 30.09 33.66 24.72 32.58 37.87 24.48 12.12 17,47 19.65 23.83
Calcium mg/l - 200 4.713 5.19 9.647 7.935 4.128 3.48 5.90 6.54 3.23 4.37 7.00 10.62
Magnesium mg/l - - 0.476 0.479 1.479 3.368 3.504 5.80 5.62 1.98 0.98 1.59 0.53 1.09
T. Alkalinity mg/l 500 - 83.454 79.32 19.38 45.98 66.881 79.64 27.3 34.34 40.77 38.08 38.08 39.73
Carbonate mg/l - - <0.01 <0.01 <0.01 <0.01 <0.01 <0.01 <0.01 <0.01 <0.01 <0.01 <0.01 <0.01
Bicarbonate mg/l - - 45.701 41.05 17.34 33.44 56.92 60.78 18.9 22.22 21.35 16.03 24.05 25.44
Hydroxide mg/l - - 3.996 2.84 <0.01 <0.01 <0.01 <0.01 <0.01 <0.01 <0.01 <0.01 <0.01 <0.01
Chloride mg/l 250 250 3.735 3.76 7.759 4.01 4.803 7.04 5.87 6.486 8.40 8.01 4.00 6.34
Ammonia mg/l 1.5 1.5 0.028 0.009 <0.01 0.097 <0.01 0.084 0.098 0.028 <0.01 0.053 0.041 0.049
T. Phosphate mg/l - - 0.182 0.099 0.879 0.153 0.008 <0.01 0.166 1.212 0.91 0,144 0.107 0.201
Manganese mg/l 0.1 0.2 0.035 0.031 <0.01 0.022 0.098 0.096 0.062 <0.01 0.043 0.037 <0.01 <0.01
Nitrate mg/l 50 50 0.397 0.273 0.537 0.484 0.502 0.529 0.488 3.325 2.05 0.404 1.05 1.075
Total Iron mg/l 0.3 0.3 0.003 0.001 0.287 0.013 0.088 <0.01 <0.01 0.048 0.144 0.102 0.032 0.043
Microbiological
Total Coliform Cfu/100ml Nil Nil Nil Nil Nil Nil 5 98 34 36 32 28 22 19
E coli Cfu/100ml Nil Nil Nil Nil Nil Nil 28 120 68 22 19 12 10 8
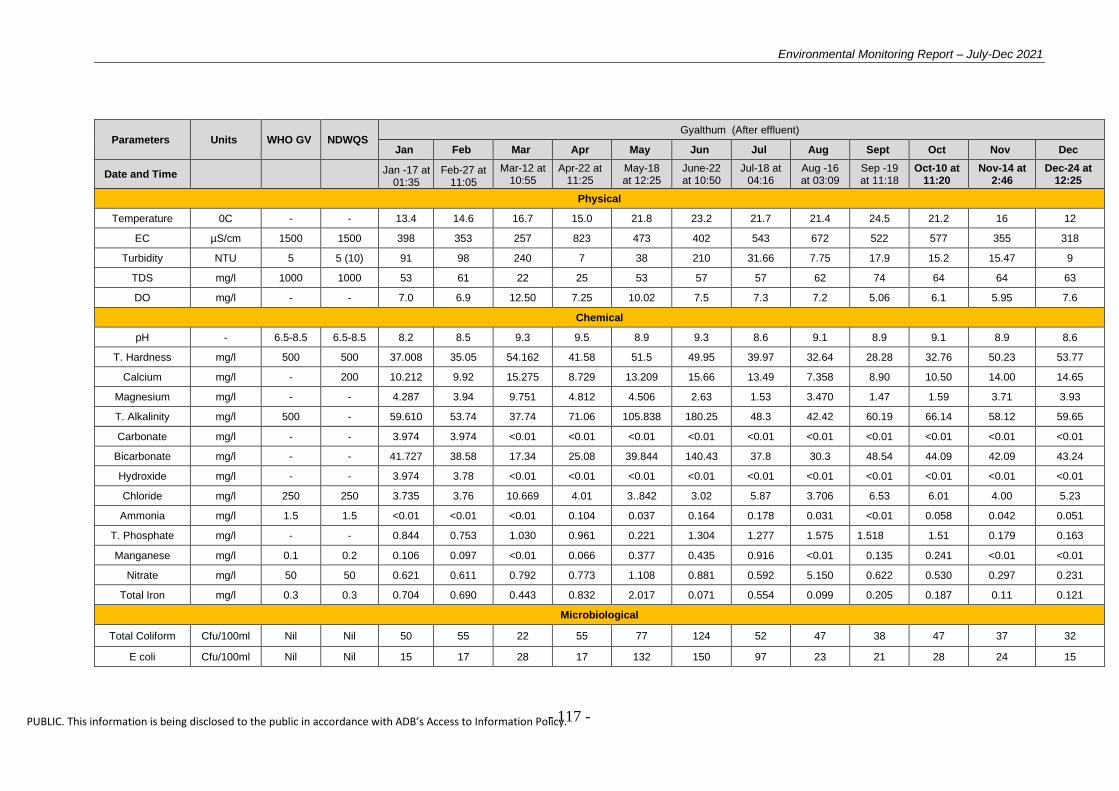
Environmental Monitoring Report – July-Dec 2021
- 117 -
PUBLIC. This information is being disclosed to the public in accordance with ADB’s Access to Information Policy.
Parameters Units WHO GV NDWQS Gyalthum (After effluent)
Jan Feb Mar Apr May Jun Jul Aug Sept Oct Nov Dec
Date and Time Jan -17 at 01:35
Feb-27 at 11:05
Mar-12 at 10:55
Apr-22 at 11:25
May-18 at 12:25
June-22 at 10:50
Jul-18 at 04:16
Aug -16 at 03:09
Sep -19 at 11:18
Oct-10 at 11:20
Nov-14 at 2:46
Dec-24 at 12:25
Physical
Temperature 0C - - 13.4 14.6 16.7 15.0 21.8 23.2 21.7 21.4 24.5 21.2 16 12
EC µS/cm 1500 1500 398 353 257 823 473 402 543 672 522 577 355 318
Turbidity NTU 5 5 (10) 91 98 240 7 38 210 31.66 7.75 17.9 15.2 15.47 9
TDS mg/l 1000 1000 53 61 22 25 53 57 57 62 74 64 64 63
DO mg/l - - 7.0 6.9 12.50 7.25 10.02 7.5 7.3 7.2 5.06 6.1 5.95 7.6
Chemical
pH - 6.5-8.5 6.5-8.5 8.2 8.5 9.3 9.5 8.9 9.3 8.6 9.1 8.9 9.1 8.9 8.6
T. Hardness mg/l 500 500 37.008 35.05 54.162 41.58 51.5 49.95 39.97 32.64 28.28 32.76 50.23 53.77
Calcium mg/l - 200 10.212 9.92 15.275 8.729 13.209 15.66 13.49 7.358 8.90 10.50 14.00 14.65
Magnesium mg/l - - 4.287 3.94 9.751 4.812 4.506 2.63 1.53 3.470 1.47 1.59 3.71 3.93
T. Alkalinity mg/l 500 - 59.610 53.74 37.74 71.06 105.838 180.25 48.3 42.42 60.19 66.14 58.12 59.65
Carbonate mg/l - - 3.974 3.974 <0.01 <0.01 <0.01 <0.01 <0.01 <0.01 <0.01 <0.01 <0.01 <0.01
Bicarbonate mg/l - - 41.727 38.58 17.34 25.08 39.844 140.43 37.8 30.3 48.54 44.09 42.09 43.24
Hydroxide mg/l - - 3.974 3.78 <0.01 <0.01 <0.01 <0.01 <0.01 <0.01 <0.01 <0.01 <0.01 <0.01
Chloride mg/l 250 250 3.735 3.76 10.669 4.01 3..842 3.02 5.87 3.706 6.53 6.01 4.00 5.23
Ammonia mg/l 1.5 1.5 <0.01 <0.01 <0.01 0.104 0.037 0.164 0.178 0.031 <0.01 0.058 0.042 0.051
T. Phosphate mg/l - - 0.844 0.753 1.030 0.961 0.221 1.304 1.277 1.575 1.518 1.51 0.179 0.163
Manganese mg/l 0.1 0.2 0.106 0.097 <0.01 0.066 0.377 0.435 0.916 <0.01 0.135 0.241 <0.01 <0.01
Nitrate mg/l 50 50 0.621 0.611 0.792 0.773 1.108 0.881 0.592 5.150 0.622 0.530 0.297 0.231
Total Iron mg/l 0.3 0.3 0.704 0.690 0.443 0.832 2.017 0.071 0.554 0.099 0.205 0.187 0.11 0.121
Microbiological
Total Coliform Cfu/100ml Nil Nil 50 55 22 55 77 124 52 47 38 47 37 32
E coli Cfu/100ml Nil Nil 15 17 28 17 132 150 97 23 21 28 24 15

Environmental Monitoring Report – July-Dec 2021
- 118 -
PUBLIC. This information is being disclosed to the public in accordance with ADB’s Access to Information Policy.
Parameters Units WHO GV NDWQS Gyalthum (Camp)
Jan Feb Mar Apr May Jun Jul Aug Sept Oct Nov Dec
Date and Time Jan -17 at 02:05
Feb-27 at 11:35
Mar-12 at 11:20
Apr-22 at 11:43
May-18 at 01:43
June-22 at 10:50
Jul-18 at 03:37
Aug -16 at 03:20
Sep -19 at 12:24
Oct-10 at 01:25
Nov-14 at 2:46
Dec-24 at 01:00
Physical
Temperature 0C - - 15.1 16.6 18.2 16.0 18.0 24.1 32.3 27.9 27.4 25.3 21.2 16
EC µS/cm 1500 1500 187 125 523 1120 307 325 522 557 521 433 210 250
Turbidity NTU 5 5 (10) 0 0 0 0 0 4 2.9 0 0 0 0 0
TDS mg/l 1000 1000 2 5 3 13 14 29 29 83 74 83 79 81
DO mg/l - - 5.3 5.7 12.29 7.25 7.07 6.2 5.9 7.3 4.04 4.7 6.2 10.0
Chemical
pH - 6.5-8.5 6.5-8.5 8.4 8.2 9.0 9.0 9.6 8.2 8.2 8.7 8.8 8.6 8.5 8.2
T. Hardness mg/l 500 500 18.504 16.42 61.103 49.50 22.66 28.23 25.24 18.36 14.14 17.47 21.84 23.45
Calcium mg/l - 200 5.498 4.86 5.627 13.49 11.558 11.31 5.90 3.27 8.90 3.50 5.25 4.87
Magnesium mg/l - - 0.952 0.861 3.900 3.849 1.502 <0.01 2.55 2.47 1.47 2.12 2.12 2.34
T. Alkalinity mg/l 500 - 35.766 31.49 20.40 87.78 58.343 67.07 39.9 30.3 48.54 46.09 34.07 32.86
Carbonate mg/l - - <0.01 <0.01 <0.01 <0.01 <0.01 <0.01 <0.01 <0.01 <0.01 <0.01 <0.01 <0.01
Bicarbonate mg/l - - 17.802 13.23 14.28 64.79 45.536 54.49 29.4 22.22 33.00 22.04 26.05 27.55
Hydroxide mg/l - - <0.01 <0.01 <0.01 <0.01 <0.01 <0.01 <0.01 <0.01 <0.01 <0.01 <0.01 <0.01
Chloride mg/l 250 250 3.735 3.45 13.578 14.06 4.803 6.04 6.85 4.633 5.60 5.00 4.00 6,42
Ammonia mg/l 1.5 1.5 <0.01 <0.01 <0.01 <0.01 <0.01 <0.01 <0.01 0.029 <0.01 <0.01 0.039 0.065
T. Phosphate mg/l - - 0.281 0.147 3.492 0.115 <0.01 <0.01 0.277 0.030 <0.01 0.103 0.059 0.061
Manganese mg/l 0.1 0.2 0.035 0.037 <0.01 0.022 0.327 0.064 <0.01 <0.01 0.076 0.064 <0.01 <0.01
Nitrate mg/l 50 50 0.486 0.436 0.705 0.611 0.550 0.312 0.388 3.110 2.534 2.450 0.556 0.543
Total Iron mg/l 0.3 0.3 0.660 0.625 0.281 0.671 0.088 <0.01 <0.01 0.040 0.186 0.147 0.013 0.011
Microbiological
Total Coliform Cfu/100ml Nil Nil Nil Nil Nil Nil Nil Nil Nil Nil Nil Nil Nil Nil
E coli Cfu/100ml Nil Nil Nil Nil Nil Nil Nil Nil Nil Nil Nil Nil Nil Nil
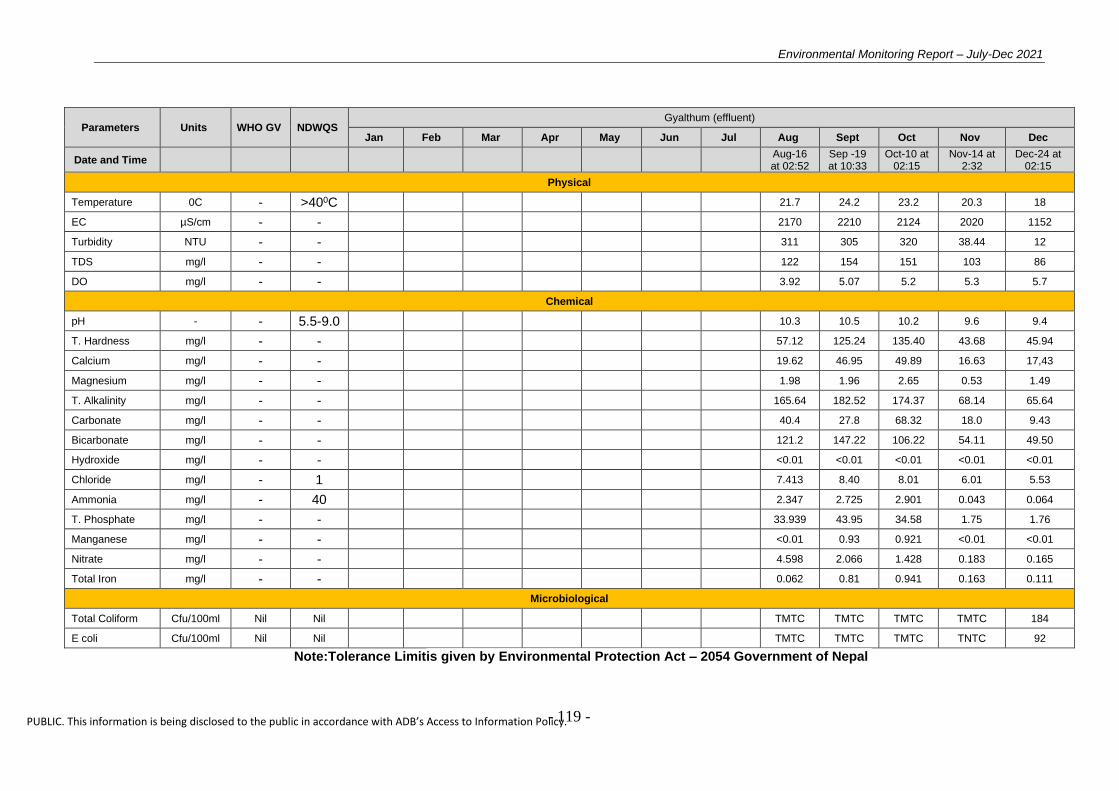
Environmental Monitoring Report – July-Dec 2021
- 119 -
PUBLIC. This information is being disclosed to the public in accordance with ADB’s Access to Information Policy.
Parameters Units WHO GV NDWQS Gyalthum (effluent)
Jan Feb Mar Apr May Jun Jul Aug Sept Oct Nov Dec
Date and Time
Aug-16 at 02:52
Sep -19 at 10:33
Oct-10 at 02:15
Nov-14 at 2:32
Dec-24 at 02:15
Physical
Temperature 0C - >400C 21.7 24.2 23.2 20.3 18
EC µS/cm - - 2170 2210 2124 2020 1152
Turbidity NTU - - 311 305 320 38.44 12
TDS mg/l - - 122 154 151 103 86
DO mg/l - - 3.92 5.07 5.2 5.3 5.7
Chemical
pH - - 5.5-9.0 10.3 10.5 10.2 9.6 9.4
T. Hardness mg/l - - 57.12 125.24 135.40 43.68 45.94
Calcium mg/l - - 19.62 46.95 49.89 16.63 17,43
Magnesium mg/l - - 1.98 1.96 2.65 0.53 1.49
T. Alkalinity mg/l - - 165.64 182.52 174.37 68.14 65.64
Carbonate mg/l - - 40.4 27.8 68.32 18.0 9.43
Bicarbonate mg/l - - 121.2 147.22 106.22 54.11 49.50
Hydroxide mg/l - - <0.01 <0.01 <0.01 <0.01 <0.01
Chloride mg/l - 1 7.413 8.40 8.01 6.01 5.53
Ammonia mg/l - 40 2.347 2.725 2.901 0.043 0.064
T. Phosphate mg/l - - 33.939 43.95 34.58 1.75 1.76
Manganese mg/l - - <0.01 0.93 0.921 <0.01 <0.01
Nitrate mg/l - - 4.598 2.066 1.428 0.183 0.165
Total Iron mg/l - - 0.062 0.81 0.941 0.163 0.111
Microbiological
Total Coliform Cfu/100ml Nil Nil TMTC TMTC TMTC TMTC 184
E coli Cfu/100ml Nil Nil TMTC TMTC TMTC TNTC 92
Note:Tolerance Limitis given by Environmental Protection Act – 2054 Government of Nepal

Environmental Monitoring Report – July-Dec 2021
- 120 -
PUBLIC. This information is being disclosed to the public in accordance with ADB’s Access to Information Policy.
Parameters Units WHO GV NDWQS Sindu(Before effluent)
Jan Feb Mar Apr May Jun Jul Aug Sept Oct Nov Dec
Date and Time Jan -16 at 01:05
Feb-12 at 12:15
Mar-18 at 11:25
Apr-23 at 12:10
May-17 at 10:10
June-at 01:10
Jul-16 at 01:55
Aug -14 at 03:02
Sep -12 at 01:25
Oct-12 at 12:18
Nov-15 at 9:22
Dec-19 at 12:20
Physical
Temperature 0C - - 11.1 13.3 15.5 14.5 21.7 23.7 24 24.8 20.3 19.3 12.7 9.8
EC µS/cm 1500 1500 448 405 395 607 248 237 195 177.7 201 255 221 265
Turbidity NTU 5 5 (10) 50 76 29 4 30 120 18.6 18.9 15 13 28.13 20
TDS mg/l 1000 1000 21 18 12 17 26 27 27 57 94 108 50 53
DO mg/l - - 6.0 6.3 7.3 6.7 8.20 4.7 6.2 6.6 5.60 6.3 6.5 8.2
Chemical
pH - 6.5-8.5 6.5-8.5 9.6 8.7 8.5 8.5 9.3 8.1 8.5 7.9 8.4 8.0 8.2 8.1
T. Hardness mg/l 500 500 13.72 12.32 23.452 37.62 16.48 36.92 16.83 16.32 34.34 32.76 19.65 20.48
Calcium mg/l - 200 5.498 4.93 7.621 10.31 7.430 12.18 4.21 4.90 8.09 10.50 5.25 5.83
Magnesium mg/l - - <0.01 <0.01 <0.01 2.88 0.50 1.58 1.53 0.99 3.43 1.59 1.59 1.88
T. Alkalinity mg/l 500 - 55.636 50.97 30.60 66.88 54.074 37.72 39.9 38.38 58.25 56.12 30.06 30.14
Carbonate mg/l - - <0.01 <0.01 <0.01 <0.01 <0.01 <0.01 <0.01 <0.01 <0.01 <0.01 <0.01 <0.01
Bicarbonate mg/l - - 37.753 33.45 23.46 43.89 36.998 31.44 31.5 32.32 38.83 22.04 20.04 21,95
Hydroxide mg/l - - <0.01 <0.01 <0.01 <0.01 <0.01 <0.01 <0.01 <0.01 <0.01 <0.01 <0.01 <0.01
Chloride mg/l 250 250 4.668 3.93 6.789 4.01 4.803 5.03 6.85 4.633 8.40 8.01 4.00 5.42
Ammonia mg/l 1.5 1.5 <0.01 <0.01 <0.01 0.011 1.026 0.258 0.314 0.035 <0.01 0.064 0.046 0.032
T. Phosphate mg/l - - 0.182 0.121 1.582 0.076 <0.01 <0.01 0.138 0.181 0.126 0.172 0.083 0.089
Manganese mg/l 0.1 0.2 0.035 0.002 <0.01 0.111 0.0327 0.080 0.166 <0.01 0.050 0.035 <0.01 <0.01
Nitrate mg/l 50 50 0.323 0.299 0.597 0.446 0.473 0.289 0.684 2.952 0.69 0.691 0.430 0.521
Total Iron mg/l 0.3 0.3 0.003 0.001 0.282 0.006 0.070 <0.01 <0.01 0.062 0.193 0.130 0.652 0.673
Microbiological
Total Coliform Cfu/100ml Nil Nil 2 1 3 Nil 20 37 62 52 47 63 54 63
E coli Cfu/100ml Nil Nil 2 4 7 Nil 97 150 94 25 25 32 23 31

Environmental Monitoring Report – July-Dec 2021
- 121 -
PUBLIC. This information is being disclosed to the public in accordance with ADB’s Access to Information Policy.
Parameters Units WHO GV NDWQS Sindu(After effluent)
Jan Feb Mar Apr May Jun Jul Aug Sept Oct Nov Dec
Date and Time Jan -16 at 02:05
Feb-12 at 01:05
Mar-18 at 11:45
Apr-23 at 12:20
May-17 at 11:00
June-15 at 01:45
Jul-16 at 02:30
Aug -14 at 03:28
Sep -12 at 01:50
Oct-12 at 01:20
Nov-15 at 3:16
Dec-19 at 01: 10
Physical
Temperature 0C - - 12.3 14.4 16.2 15.4 26.9 27.9 29 25.1 22.6 21.3 16.1 10
EC µS/cm 1500 1500 1509 1398 1474 1215 1052 43.1 181.1 624 544 553 566 414
Turbidity NTU 5 5 (10) 608 870 830 720 76 76 21 31.38 46 48 334 197
TDS mg/l 1000 1000 53 76 19 56 73 66 66 70 51 53 114 84
DO mg/l - - 4.8 5.3 6.7 6.2 10.08 7.3 4.8 6.6 4.8 5.2 6.3 7.2
Chemical
pH - 6.5-8.5 6.5-8.5 8.4 8.3 8.1 8.1 9.6 9.2 9.14 8.64 8.8 8.7 9.8 9.1
T. Hardness mg/l 500 500 105.84 108.31 30.231 71.28 216.3 41.26 29.45 24.48 16.16 19.65 45.86 49.08
Calcium mg/l - 200 35.349 32.33 24.427 9.522 24.768 7.83 5.05 6.54 6.47 5.25 16.63 18.55
Magnesium mg/l - - 4.287 3.12 1.355 11.549 37.551 5.27 4.09 1.98 <0.01 <0.01 1.06 1.21
T. Alkalinity mg/l 500 - 149.025 159.12 56.1 60.66 194.95 56.59 31.5 34.34 34.95 32.06 72.15 69.06
Carbonate mg/l - - <0.01 <0.01 <0.01 <0.01 <0.01 <0.01 <0.01 <0.01 <0.01 <0.01 22.7 <0.01
Bicarbonate mg/l - - 53.649 50.38 49.98 50.16 194.95 44.01 23.1 28.28 25.24 22.04 64.13 54,34
Hydroxide mg/l - - 55.636 3.26 <0.01 <0.01 113.84 83.84 <0.01 <0.01 <0.01 <0.01 <0.01 <0.01
Chloride mg/l 250 250 3.735 4.84 7.759 5.02 3.842 3.02 5.87 7.413 6.53 6.01 6.01 7.5
Ammonia mg/l 1.5 1.5 1.210 1.002 <0.01 0.982 1.027 1.004 1.11 0.077 0.02 0.010 0.061 0.069
T. Phosphate mg/l - - 0.215 0.198 2.487 0.153 0.168 0.130 0.333 0.6363 0.79 0.30 0.203 0.340
Manganese mg/l 0.1 0.2 0.035 0.011 1.186 0.022 0.540 1.129 1.520 <0.01 1.44 0.635 <0.01 <0.01
Nitrate mg/l 50 50 0.886 0.823 0.819 1.1 1.421 1.440 0.465 2.911 0,709 1.412 0.021 0.026
Total Iron mg/l 0.3 0.3 0.103 0.103 0.420 0.167 1.132 0.022 0.171 0.051 1.93 0.538 0.234 0.162
Microbiological
Total Coliform Cfu/100ml Nil Nil 25 29 42 07 52 97 82 72 63 73 118 164
E coli Cfu/100ml Nil Nil 70 75 80 15 102 350 250 37 53 42 64 76
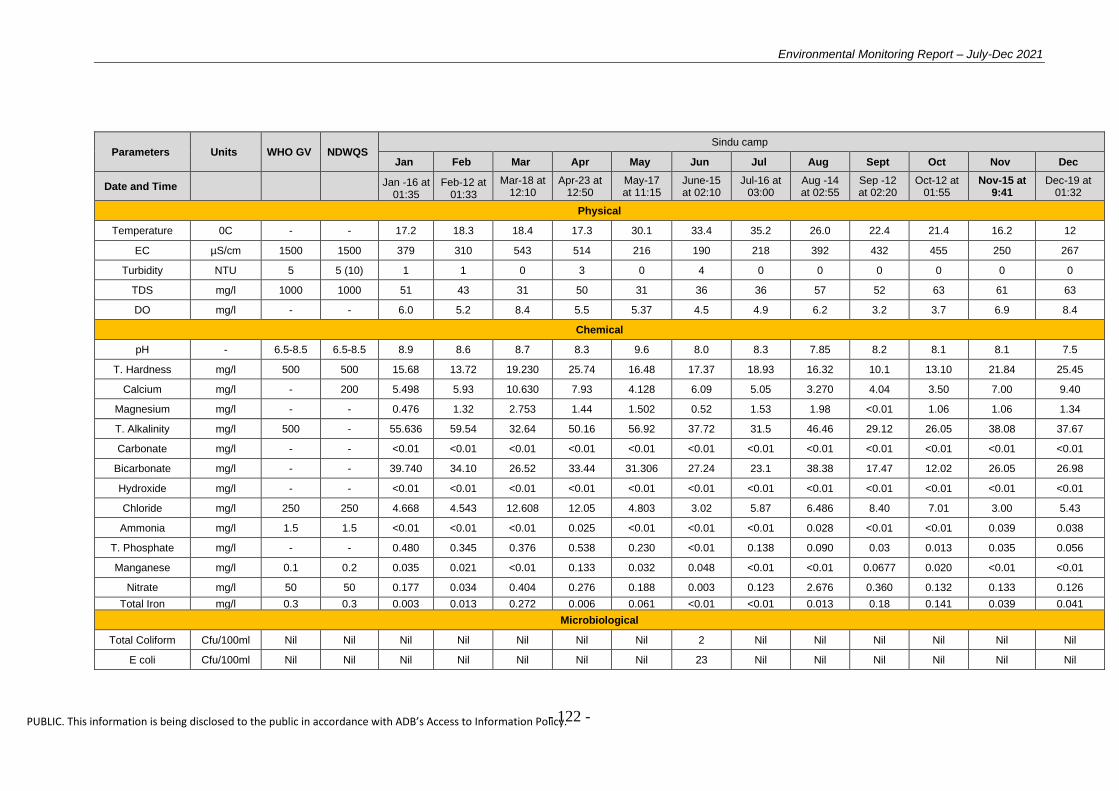
Environmental Monitoring Report – July-Dec 2021
- 122 -
PUBLIC. This information is being disclosed to the public in accordance with ADB’s Access to Information Policy.
Parameters Units WHO GV NDWQS Sindu camp
Jan Feb Mar Apr May Jun Jul Aug Sept Oct Nov Dec
Date and Time Jan -16 at 01:35
Feb-12 at 01:33
Mar-18 at 12:10
Apr-23 at 12:50
May-17 at 11:15
June-15 at 02:10
Jul-16 at 03:00
Aug -14 at 02:55
Sep -12 at 02:20
Oct-12 at 01:55
Nov-15 at 9:41
Dec-19 at 01:32
Physical
Temperature 0C - - 17.2 18.3 18.4 17.3 30.1 33.4 35.2 26.0 22.4 21.4 16.2 12
EC µS/cm 1500 1500 379 310 543 514 216 190 218 392 432 455 250 267
Turbidity NTU 5 5 (10) 1 1 0 3 0 4 0 0 0 0 0 0
TDS mg/l 1000 1000 51 43 31 50 31 36 36 57 52 63 61 63
DO mg/l - - 6.0 5.2 8.4 5.5 5.37 4.5 4.9 6.2 3.2 3.7 6.9 8.4
Chemical
pH - 6.5-8.5 6.5-8.5 8.9 8.6 8.7 8.3 9.6 8.0 8.3 7.85 8.2 8.1 8.1 7.5
T. Hardness mg/l 500 500 15.68 13.72 19.230 25.74 16.48 17.37 18.93 16.32 10.1 13.10 21.84 25.45
Calcium mg/l - 200 5.498 5.93 10.630 7.93 4.128 6.09 5.05 3.270 4.04 3.50 7.00 9.40
Magnesium mg/l - - 0.476 1.32 2.753 1.44 1.502 0.52 1.53 1.98 <0.01 1.06 1.06 1.34
T. Alkalinity mg/l 500 - 55.636 59.54 32.64 50.16 56.92 37.72 31.5 46.46 29.12 26.05 38.08 37.67
Carbonate mg/l - - <0.01 <0.01 <0.01 <0.01 <0.01 <0.01 <0.01 <0.01 <0.01 <0.01 <0.01 <0.01
Bicarbonate mg/l - - 39.740 34.10 26.52 33.44 31.306 27.24 23.1 38.38 17.47 12.02 26.05 26.98
Hydroxide mg/l - - <0.01 <0.01 <0.01 <0.01 <0.01 <0.01 <0.01 <0.01 <0.01 <0.01 <0.01 <0.01
Chloride mg/l 250 250 4.668 4.543 12.608 12.05 4.803 3.02 5.87 6.486 8.40 7.01 3.00 5.43
Ammonia mg/l 1.5 1.5 <0.01 <0.01 <0.01 0.025 <0.01 <0.01 <0.01 0.028 <0.01 <0.01 0.039 0.038
T. Phosphate mg/l - - 0.480 0.345 0.376 0.538 0.230 <0.01 0.138 0.090 0.03 0.013 0.035 0.056
Manganese mg/l 0.1 0.2 0.035 0.021 <0.01 0.133 0.032 0.048 <0.01 <0.01 0.0677 0.020 <0.01 <0.01
Nitrate mg/l 50 50 0.177 0.034 0.404 0.276 0.188 0.003 0.123 2.676 0.360 0.132 0.133 0.126
Total Iron mg/l 0.3 0.3 0.003 0.013 0.272 0.006 0.061 <0.01 <0.01 0.013 0.18 0.141 0.039 0.041
Microbiological
Total Coliform Cfu/100ml Nil Nil Nil Nil Nil Nil Nil 2 Nil Nil Nil Nil Nil Nil
E coli Cfu/100ml Nil Nil Nil Nil Nil Nil Nil 23 Nil Nil Nil Nil Nil Nil
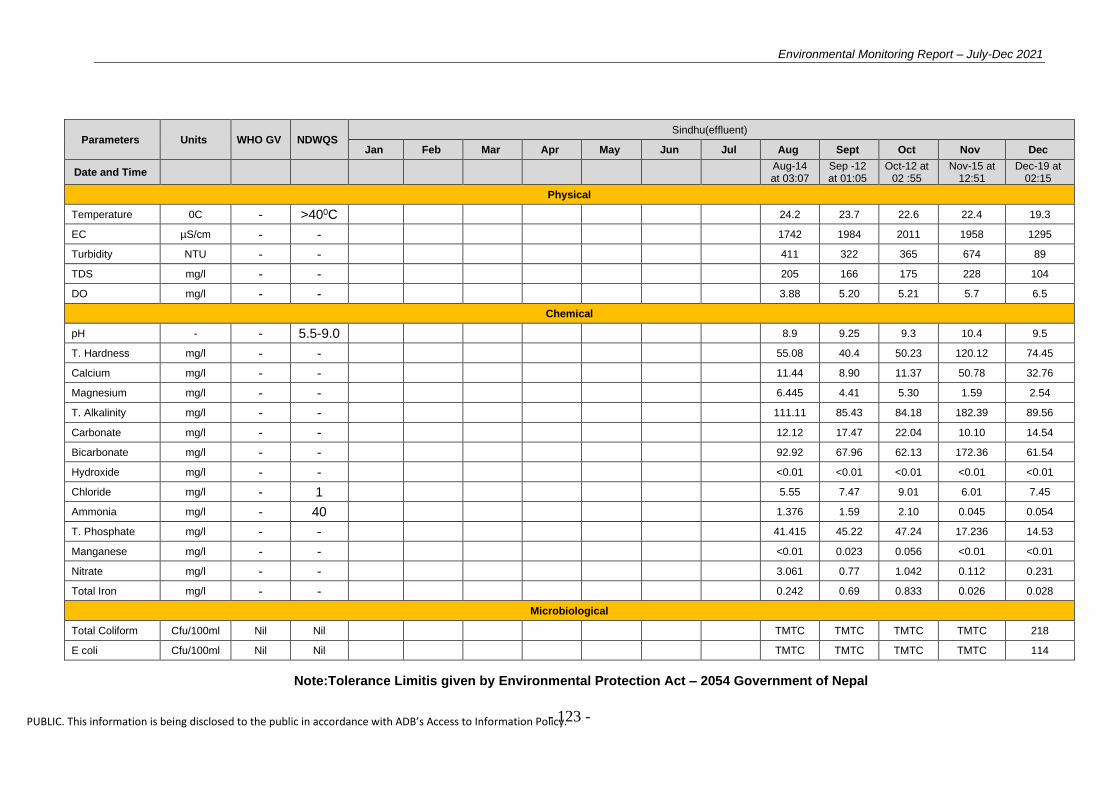
Environmental Monitoring Report – July-Dec 2021
- 123 -
PUBLIC. This information is being disclosed to the public in accordance with ADB’s Access to Information Policy.
Parameters Units WHO GV NDWQS Sindhu(effluent)
Jan Feb Mar Apr May Jun Jul Aug Sept Oct Nov Dec
Date and Time
Aug-14 at 03:07
Sep -12 at 01:05
Oct-12 at 02 :55
Nov-15 at 12:51
Dec-19 at 02:15
Physical
Temperature 0C - >400C 24.2 23.7 22.6 22.4 19.3
EC µS/cm - - 1742 1984 2011 1958 1295
Turbidity NTU - - 411 322 365 674 89
TDS mg/l - - 205 166 175 228 104
DO mg/l - - 3.88 5.20 5.21 5.7 6.5
Chemical
pH - - 5.5-9.0 8.9 9.25 9.3 10.4 9.5
T. Hardness mg/l - - 55.08 40.4 50.23 120.12 74.45
Calcium mg/l - - 11.44 8.90 11.37 50.78 32.76
Magnesium mg/l - - 6.445 4.41 5.30 1.59 2.54
T. Alkalinity mg/l - - 111.11 85.43 84.18 182.39 89.56
Carbonate mg/l - - 12.12 17.47 22.04 10.10 14.54
Bicarbonate mg/l - - 92.92 67.96 62.13 172.36 61.54
Hydroxide mg/l - - <0.01 <0.01 <0.01 <0.01 <0.01
Chloride mg/l - 1 5.55 7.47 9.01 6.01 7.45
Ammonia mg/l - 40 1.376 1.59 2.10 0.045 0.054
T. Phosphate mg/l - - 41.415 45.22 47.24 17.236 14.53
Manganese mg/l - - <0.01 0.023 0.056 <0.01 <0.01
Nitrate mg/l - - 3.061 0.77 1.042 0.112 0.231
Total Iron mg/l - - 0.242 0.69 0.833 0.026 0.028
Microbiological
Total Coliform Cfu/100ml Nil Nil TMTC TMTC TMTC TMTC 218
E coli Cfu/100ml Nil Nil TMTC TMTC TMTC TMTC 114
Note:Tolerance Limitis given by Environmental Protection Act – 2054 Government of Nepal

Environmental Monitoring Report – July-Dec 2021
- 124 -
PUBLIC. This information is being disclosed to the public in accordance with ADB’s Access to Information Policy.
Parameters Units WHO GV NDWQS Sundarijal (Before effluent)
Jan Feb Mar Apr May Jun Jul Aug Sept Oct Nov Dec
Date and Time Jan -15 at 11:20
Feb-11 at 11:32
Mar-26 at 11:10
Apr-09 at 12:00
May-13 at 11:00
June-14 at 10
Jul-16 at 11:50
Aug -14 at 12:25
Sep-17 at 01:23
Oct-09 at 11:15
Nov-19 at 12:49
Dec-17 at 11:20
Physical
Temperature 0C - - 11.7 13.2 14.4 14.4 21.7 25.2 26 25.0 19.05 18.4 16.8 10.12
EC µS/cm 1500 1500 810 782 682 850 460 333 165,6 308 318 342 415 434
Turbidity NTU 5 5 (10) 53 62 12 47 23 252 18.5 21.86 17.2 15.3 32.44 28
TDS mg/l 1000 1000 101 105 32 107 50 39 39 40 48 62 84 45
DO mg/l - - 5.7 6.1 8.7 6.4 10.30 6.8 4.6 5.2 5.74 5.6 7.13 8.5
Chemical
pH - 6.5-8.5 6.5-8.5 9.0 8.7 8.1 8.7 9.2 8.4 9.2 7.99 8.81 8.6 8.4 7.9
T. Hardness mg/l 500 500 23.52 22.12 26.520 63.36 39.14 21.72 21.04 12.24 20.2 24.02 111.38 87.97
Calcium mg/l - 200 7.855 6.81 9.063 16.66 10.733 7.83 4.21 4.08 7.28 8.75 10.50 20.15
Magnesium mg/l - - 0.952 1.52 2.321 5.293 3.004 0.52 2.55 0.49 0.49 0.53 2.70 3.32
T. Alkalinity mg/l 500 - 79.480 71.95 37.74 83.60 65.458 56.56 10.5 28.28 25.24 22.04 50.10 53.73
Carbonate mg/l - - <0.01 <0.01 <0.01 <0.01 <0.01 <0.01 <0.01 <0.01 <0.01 <0.01 <0.01 <0.01
Bicarbonate mg/l - - 63.584 57.77 31.62 64.79 55.497 37.72 4.2 22.22 15.53 12.02 42.09 45.85
Hydroxide mg/l - - <0.01 <0.01 <0.01 <0.01 <0.01 <0.01 <0.01 <0.01 <0.01 <0.01 <0.01 <0.01
Chloride mg/l 250 250 7.740 6.456 10.669 9.04 5.764 9.06 8.81 6.486 6.53 6.01 6.01 5.92
Ammonia mg/l 1.5 1.5 <0.01 <0.01 <0.01 0.046 0.380 0.362 0.426 0.091 0.05 0.0411 0.076 0.067
T. Phosphate mg/l - - 0.877 0.799 1.984 0.961 0.362 0.826 0.777 0.696 0.8 1.03 0.155 0.121
Manganese mg/l 0.1 0.2 0.177 0.012 <0.01 0.133 0.065 0.129 0.083 <0.01 0.067 0.042 <0.01 <0.01
Nitrate mg/l 50 50 0.393 0.276 0.935 <0.01 0.096 0.082 0.146 3.55 3.08 1.502 0.137 0.153
Total Iron mg/l 0.3 0.3 1.173 1.001 0.386 1.234 1.929 083 1.429 0.728 0.26 0.205 0.411 0.435
Microbiological
Total Coliform Cfu/100ml Nil Nil 30 37 41 52 96 110 210 TMTC 295 310 TMTC TMTC
E coli Cfu/100ml Nil Nil 50 59 67 67 182 220 320 TMTC 180 143 TMTC TMTC

Environmental Monitoring Report – July-Dec 2021
- 125 -
PUBLIC. This information is being disclosed to the public in accordance with ADB’s Access to Information Policy.
Parameters Units WHO GV NDWQS Sundarijal (After effluent)
Jan Feb Mar Apr May Jun Jul Aug Sept Oct Nov Dec
Date and Time Jan -15 at 11:35
Feb-11 at 11:55
Mar-26 at 11:30
Apr-09 at 12:30
May-13 at 01:30
June-14 at 11:35
Jul-16 at 12:00
Aug -14 at 12:32
Sep-17 at 01:08
Oct-09 at 12:20
Nov-19 at 12:59
Dec-17 at 12:35
Physical
Temperature 0C - - 14.3 15.2 16.5 16.3 24.6 26.2 29 25.3 20.1 19.4 17.8 12.4
EC µS/cm 1500 1500 1152 1082 1103 915 604 424 220 450 431 414 576 411
Turbidity NTU 5 5 (10) 105 270 69 450 812 925 81 486 488 315 80 54
TDS mg/l 1000 1000 69 57 43 108 124 83 83 154 73 99 33 42
DO mg/l - - 5.7 5.5 8.1 7.1 4.61 3.4 4.1 3.8 5.12 5.23 6.2 7.4
Chemical
pH - 6.5-8.5 6.5-8.5 8.4 8.3 8.5 8.6 9.8 8.1 8.7 7.6 8.3 8.4 8.7 8.5
T. Hardness mg/l 500 500 94.08 97.38 67.243 73.26 53.56 41.26 48.39 18.36 16.16 19.65 50.23 53.45
Calcium mg/l - 200 33.778 42.61 47.951 18.25 12.384 9.57 16.86 4.905 4.85 6.12 14.00 26.06
Magnesium mg/l - - 2.381 3.96 5.369 6.737 5.507 4.22 1.53 1.487 0.98 1.06 3.71 3.56
T. Alkalinity mg/l 500 - 123.193 130.91 55.08 98.23 93.918 83.84 54.6 30.3 29.12 36.07 76.16 73.64
Carbonate mg/l - - <0.01 <0.01 <0.01 <0.01 <0.01 <0.01 <0.01 <0.01 <0.01 <0.01 <0.01 <0.01
Bicarbonate mg/l - - 99.350 94.46 49.98 75.24 81.111 39.82 44.1 20.2 17.47 22.04 60.12 62.40
Hydroxide mg/l - - <0.01 <0.01 <0.01 <0.01 <0.01 <0.01 <0.01 <0.01 <0.01 <0.01 <0.01 <0.01
Chloride mg/l 250 250 6.536 5.432 11.638 14.06 8.646 9.06 10.77 6.486 5.60 5.00 15.02 10.23
Ammonia mg/l 1.5 1.5 <0.01 <0.01 <0.01 0.104 0.028 0.466 0.646 1.012 0.88 1.21 0.125 0.164
T. Phosphate mg/l - - 0.380 0.339 2.537 1.807 0.265 1.304 1.277 2.969 3.10 2.344 0.299 0.342
Manganese mg/l 0.1 0.2 0.154 0.093 <0.01 0.155 0.1475 0.177 0.208 <0.01 0.423 0.564 <0.01 <0.01
Nitrate mg/l 50 50 0.087 0.032 1.000 0.500 0.012 0.200 0.219 3.536 3.362 0.2.43 <0.01 0.045
Total Iron mg/l 0.3 0.3 1.060 1.012 0.382 1.302 2.106 0.252 1.196 1.979 0.25 0.255 1.142 1.430
Microbiological
Total Coliform Cfu/100ml Nil Nil 40 49 42 78 230 350 335 TMTC TMTC TMTC TMTC TMTC
E coli Cfu/100ml Nil Nil 13 19 32 96 850 530 480 TMTC TMTC TMTC TMTC TMTC

Environmental Monitoring Report – July-Dec 2021
- 126 -
PUBLIC. This information is being disclosed to the public in accordance with ADB’s Access to Information Policy.
Parameters Units WHO GV NDWQS Sundarijal(Camp)
Jan Feb Mar Apr May Jun Jul Aug Sept Oct Nov Dec
Date and Time
Sep-17 at 12:40
Oct-09 at 01:15
Nov-19 at 12:04
Dec-17 at 12:55
Physical
Temperature 0C - - 24.3 21.4 16.9 11.2
EC µS/cm 1500 1500 394 343 365 354
Turbidity NTU 5 5 (10) 17 12 21.38 18
TDS mg/l 1000 1000 54 57 50 53
DO mg/l - - 4.5 4.7 6.01 7.3
Chemical
pH - 6.5-8.5 6.5-8.5 9.2 8.9 8.9 8.4
T. Hardness mg/l 500 500 24.24 28.29 63.33 65.19
Calcium mg/l - 200 3.23 2.62 5.25 5.72
Magnesium mg/l - - 3.92 5.30 12.20 12.53
T. Alkalinity mg/l 500 - 38.83 38.08 36.07 37.77
Carbonate mg/l - - <0.01 <0.01 <0.01 <0.01
Bicarbonate mg/l - - 29.12 24.05 28.06 29.88
Hydroxide mg/l - - <0.01 <0.01 <0.01 <0.01
Chloride mg/l 250 250 5.60 7.01 4.00 5.13
Ammonia mg/l 1.5 1.5 <0.01 0.05 0.065 0.072
T. Phosphate mg/l - - 1.96 1.48 0.179 0.143
Manganese mg/l 0.1 0.2 0.50 0.35 <0.01 <0.01
Nitrate mg/l 50 50 0.29 0.126 <0.01 0.031
Total Iron mg/l 0.3 0.3 0.20 0.147 0.678 0.729
Microbiological
Total Coliform Cfu/100ml Nil Nil 4 6 4 6
E coli Cfu/100ml Nil Nil 2 2 1 2
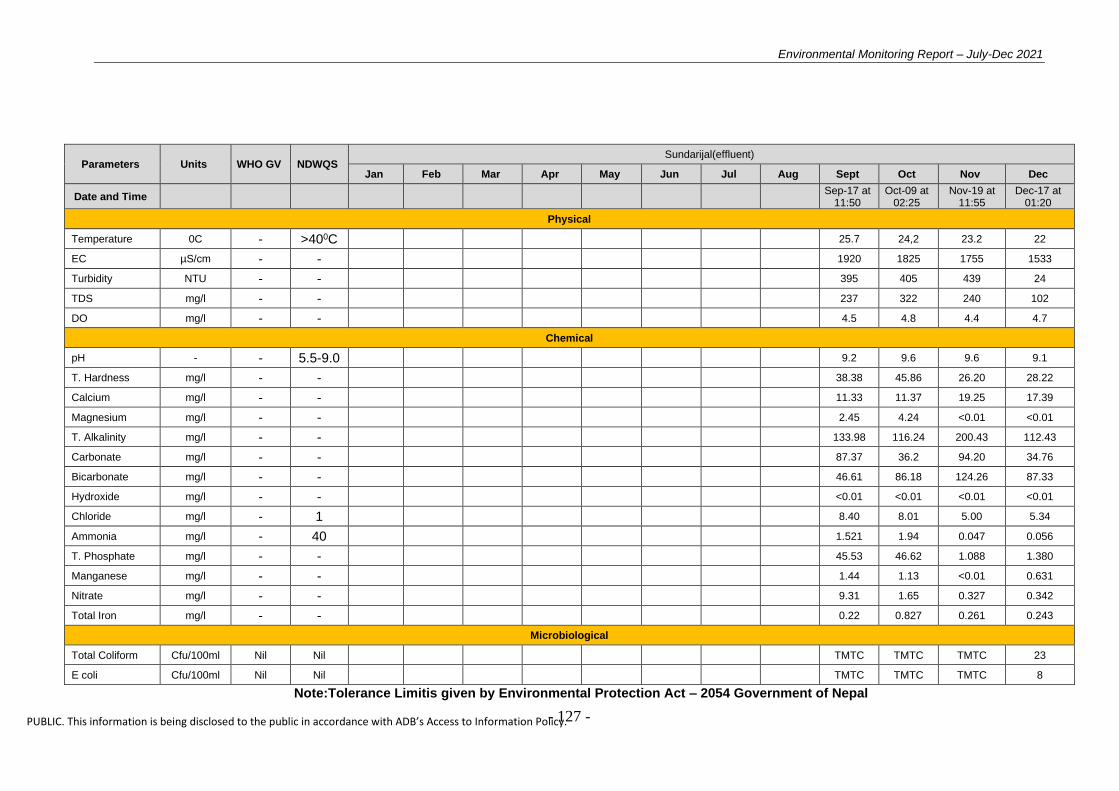
Environmental Monitoring Report – July-Dec 2021
- 127 -
PUBLIC. This information is being disclosed to the public in accordance with ADB’s Access to Information Policy.
Parameters Units WHO GV NDWQS Sundarijal(effluent)
Jan Feb Mar Apr May Jun Jul Aug Sept Oct Nov Dec
Date and Time
Sep-17 at 11:50
Oct-09 at 02:25
Nov-19 at 11:55
Dec-17 at 01:20
Physical
Temperature 0C - >400C 25.7 24,2 23.2 22
EC µS/cm - - 1920 1825 1755 1533
Turbidity NTU - - 395 405 439 24
TDS mg/l - - 237 322 240 102
DO mg/l - - 4.5 4.8 4.4 4.7
Chemical
pH - - 5.5-9.0 9.2 9.6 9.6 9.1
T. Hardness mg/l - - 38.38 45.86 26.20 28.22
Calcium mg/l - - 11.33 11.37 19.25 17.39
Magnesium mg/l - - 2.45 4.24 <0.01 <0.01
T. Alkalinity mg/l - - 133.98 116.24 200.43 112.43
Carbonate mg/l - - 87.37 36.2 94.20 34.76
Bicarbonate mg/l - - 46.61 86.18 124.26 87.33
Hydroxide mg/l - - <0.01 <0.01 <0.01 <0.01
Chloride mg/l - 1 8.40 8.01 5.00 5.34
Ammonia mg/l - 40 1.521 1.94 0.047 0.056
T. Phosphate mg/l - - 45.53 46.62 1.088 1.380
Manganese mg/l - - 1.44 1.13 <0.01 0.631
Nitrate mg/l - - 9.31 1.65 0.327 0.342
Total Iron mg/l - - 0.22 0.827 0.261 0.243
Microbiological
Total Coliform Cfu/100ml Nil Nil TMTC TMTC TMTC 23
E coli Cfu/100ml Nil Nil TMTC TMTC TMTC 8
Note:Tolerance Limitis given by Environmental Protection Act – 2054 Government of Nepal
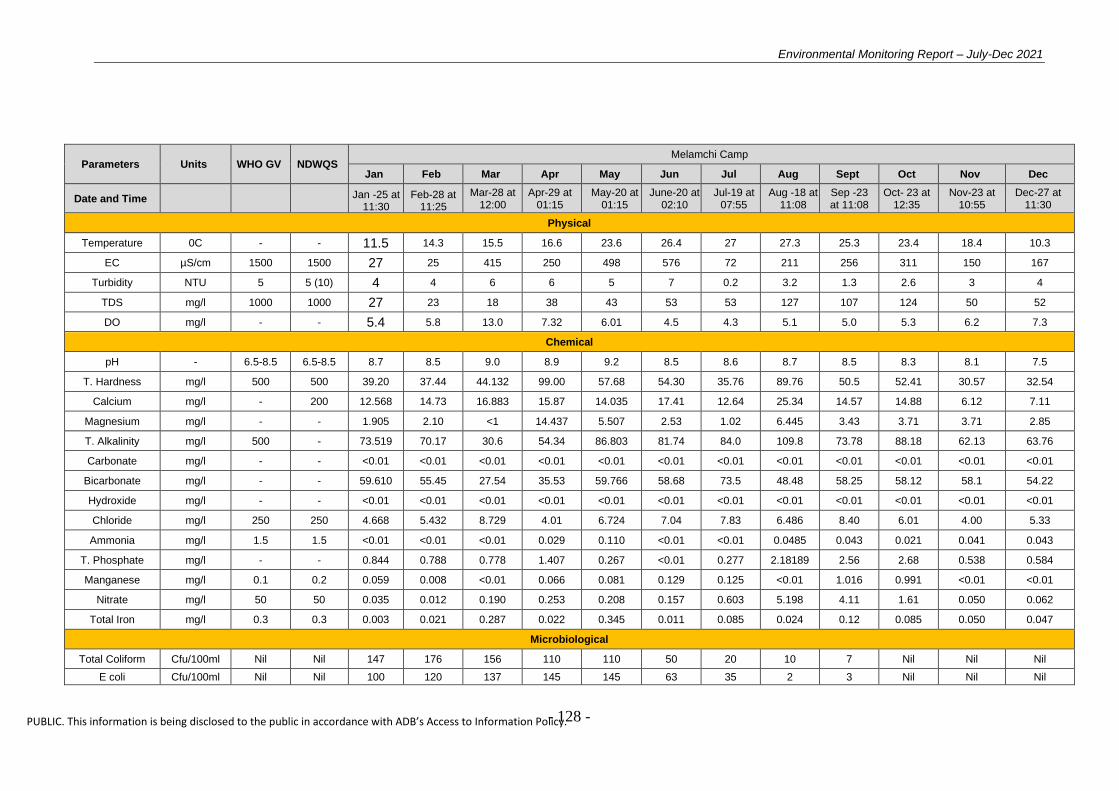
Environmental Monitoring Report – July-Dec 2021
- 128 -
PUBLIC. This information is being disclosed to the public in accordance with ADB’s Access to Information Policy.
Parameters Units WHO GV NDWQS Melamchi Camp
Jan Feb Mar Apr May Jun Jul Aug Sept Oct Nov Dec
Date and Time Jan -25 at 11:30
Feb-28 at 11:25
Mar-28 at 12:00
Apr-29 at 01:15
May-20 at 01:15
June-20 at 02:10
Jul-19 at 07:55
Aug -18 at 11:08
Sep -23 at 11:08
Oct- 23 at 12:35
Nov-23 at 10:55
Dec-27 at 11:30
Physical
Temperature 0C - - 11.5 14.3 15.5 16.6 23.6 26.4 27 27.3 25.3 23.4 18.4 10.3
EC µS/cm 1500 1500 27 25 415 250 498 576 72 211 256 311 150 167
Turbidity NTU 5 5 (10) 4 4 6 6 5 7 0.2 3.2 1.3 2.6 3 4
TDS mg/l 1000 1000 27 23 18 38 43 53 53 127 107 124 50 52
DO mg/l - - 5.4 5.8 13.0 7.32 6.01 4.5 4.3 5.1 5.0 5.3 6.2 7.3
Chemical
pH - 6.5-8.5 6.5-8.5 8.7 8.5 9.0 8.9 9.2 8.5 8.6 8.7 8.5 8.3 8.1 7.5
T. Hardness mg/l 500 500 39.20 37.44 44.132 99.00 57.68 54.30 35.76 89.76 50.5 52.41 30.57 32.54
Calcium mg/l - 200 12.568 14.73 16.883 15.87 14.035 17.41 12.64 25.34 14.57 14.88 6.12 7.11
Magnesium mg/l - - 1.905 2.10 <1 14.437 5.507 2.53 1.02 6.445 3.43 3.71 3.71 2.85
T. Alkalinity mg/l 500 - 73.519 70.17 30.6 54.34 86.803 81.74 84.0 109.8 73.78 88.18 62.13 63.76
Carbonate mg/l - - <0.01 <0.01 <0.01 <0.01 <0.01 <0.01 <0.01 <0.01 <0.01 <0.01 <0.01 <0.01
Bicarbonate mg/l - - 59.610 55.45 27.54 35.53 59.766 58.68 73.5 48.48 58.25 58.12 58.1 54.22
Hydroxide mg/l - - <0.01 <0.01 <0.01 <0.01 <0.01 <0.01 <0.01 <0.01 <0.01 <0.01 <0.01 <0.01
Chloride mg/l 250 250 4.668 5.432 8.729 4.01 6.724 7.04 7.83 6.486 8.40 6.01 4.00 5.33
Ammonia mg/l 1.5 1.5 <0.01 <0.01 <0.01 0.029 0.110 <0.01 <0.01 0.0485 0.043 0.021 0.041 0.043
T. Phosphate mg/l - - 0.844 0.788 0.778 1.407 0.267 <0.01 0.277 2.18189 2.56 2.68 0.538 0.584
Manganese mg/l 0.1 0.2 0.059 0.008 <0.01 0.066 0.081 0.129 0.125 <0.01 1.016 0.991 <0.01 <0.01
Nitrate mg/l 50 50 0.035 0.012 0.190 0.253 0.208 0.157 0.603 5.198 4.11 1.61 0.050 0.062
Total Iron mg/l 0.3 0.3 0.003 0.021 0.287 0.022 0.345 0.011 0.085 0.024 0.12 0.085 0.050 0.047
Microbiological
Total Coliform Cfu/100ml Nil Nil 147 176 156 110 110 50 20 10 7 Nil Nil Nil
E coli Cfu/100ml Nil Nil 100 120 137 145 145 63 35 2 3 Nil Nil Nil

Environmental Monitoring Report – July-Dec 2021
- 129 -
PUBLIC. This information is being disclosed to the public in accordance with ADB’s Access to Information Policy.
1.2 Discharge measurement of Melamchi River at Different Junction from 2010 to 2018
Discharge measurement of Melamchi River 2010
Sites March April May June July-October Nov Dec
Melamchi at Intake - 3.3 - -
Discharge cannot be measured due to the high flood in the river during this
monsoon period
- -
Melamchi at Timbu/Ambathan 3.69 3.33 3.43 5.4 7.94 7.31
Melamchi at Gohore - 4.01 3.95 5.8 9.75 8.54
Melamchi at Gyalthum - 4.56 5.96 6.8 11.37 8.72
Melamchi at Talamarang - 4.87 6.11 6.6 11.53 8.82
Melamchi at Nuwar - 4.93 6.27 12.4 - -
Melamchi at Poolbazar 5.25 5.58 6.34 11.7 14.93 9.49
2 Discharge measurement of Melamchi River 2011
Location
Discharge, m3/s Remarks
Jan
Feb
Mar Apr May
June-Oct Nov
Dec
Melamchi at Timbu /Ambathan 5.76 3.25 3.05 2.96 4.47
Discharge cannot be measured due to the high flood in the river during this monsoon
period
3.11
3.01 Downstream of the junction of Sky fall
Melamchi at Gohore
6.54 4.62 4.5 3.5 5.84 3.91
3.82
Downstream of the Junction of
Melamchi and Gohare Rivers
Melamchi at Gyalthum
7.24 4.86 4.57 4.16 6.28 4.31
4.13
Downstream of the Junction of
Melamchi and Gyalthum Rivers
Melamchi at Talamarang
7.54 5.14 4.84 4.22 6.49 4.63
4.46 At gauge station
Melamchi at Pulbazaar
7.66 5.23 5.01 4.39 6.63 5.02
4.89
Upstream of the Junction of
Melamchi and Indrawati Rivers
3
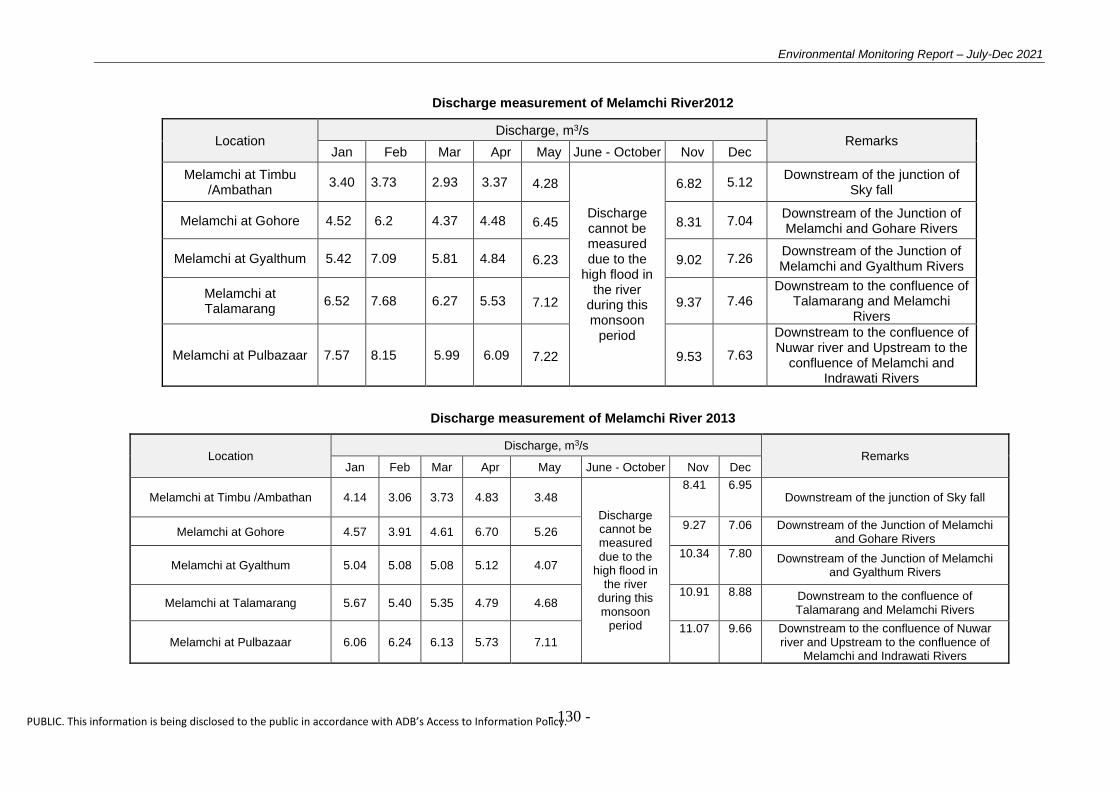
Environmental Monitoring Report – July-Dec 2021
- 130 -
PUBLIC. This information is being disclosed to the public in accordance with ADB’s Access to Information Policy.
Discharge measurement of Melamchi River2012
Location Discharge, m3/s
Remarks Jan Feb Mar Apr May June - October Nov Dec
Melamchi at Timbu /Ambathan
3.40 3.73 2.93 3.37 4.28
Discharge cannot be measured due to the
high flood in the river
during this monsoon
period
6.82 5.12 Downstream of the junction of
Sky fall
Melamchi at Gohore 4.52 6.2 4.37 4.48 6.45 8.31 7.04 Downstream of the Junction of Melamchi and Gohare Rivers
Melamchi at Gyalthum 5.42 7.09 5.81 4.84 6.23 9.02 7.26 Downstream of the Junction of Melamchi and Gyalthum Rivers
Melamchi at Talamarang
6.52 7.68 6.27 5.53 7.12 9.37 7.46 Downstream to the confluence of
Talamarang and Melamchi Rivers
Melamchi at Pulbazaar 7.57 8.15 5.99 6.09 7.22 9.53 7.63
Downstream to the confluence of Nuwar river and Upstream to the
confluence of Melamchi and Indrawati Rivers
Discharge measurement of Melamchi River 2013
Location Discharge, m3/s
Remarks Jan Feb Mar Apr May June - October Nov Dec
Melamchi at Timbu /Ambathan 4.14 3.06 3.73 4.83 3.48
Discharge cannot be measured due to the
high flood in the river
during this monsoon
period
8.41 6.95 Downstream of the junction of Sky fall
Melamchi at Gohore 4.57 3.91 4.61 6.70 5.26 9.27 7.06 Downstream of the Junction of Melamchi
and Gohare Rivers
Melamchi at Gyalthum 5.04 5.08 5.08 5.12 4.07 10.34 7.80 Downstream of the Junction of Melamchi
and Gyalthum Rivers
Melamchi at Talamarang 5.67 5.40 5.35 4.79 4.68 10.91 8.88 Downstream to the confluence of
Talamarang and Melamchi Rivers
Melamchi at Pulbazaar 6.06 6.24 6.13 5.73 7.11 11.07 9.66 Downstream to the confluence of Nuwar
river and Upstream to the confluence of Melamchi and Indrawati Rivers
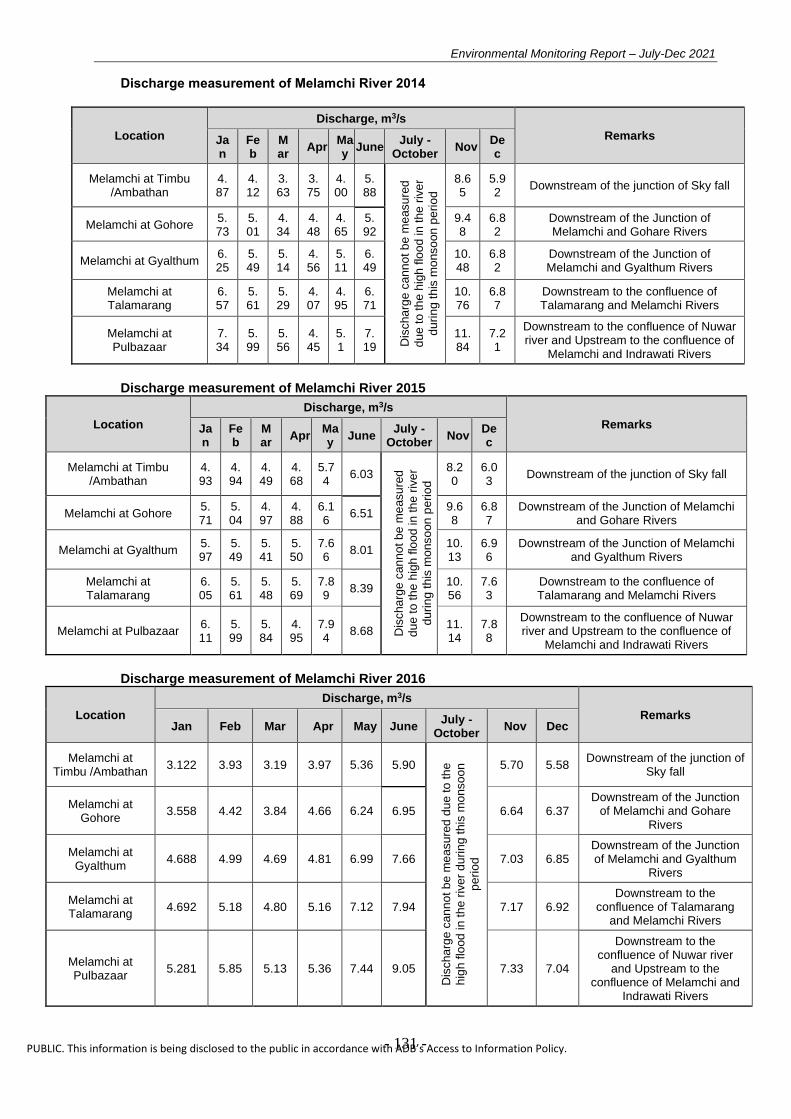
Environmental Monitoring Report – July-Dec 2021
- 131 -
PUBLIC. This information is being disclosed to the public in accordance with ADB’s Access to Information Policy.
Discharge measurement of Melamchi River 2014
Location
Discharge, m3/s
Remarks Jan
Feb
Mar
Apr May
June July -
October Nov
Dec
Melamchi at Timbu /Ambathan
4.87
4.12
3.63
3.75
4.00
5.88
Dis
cha
rge
can
no
t b
e m
easu
red
du
e t
o t
he h
igh
flo
od
in
th
e r
ive
r
du
rin
g t
his
mo
nso
on
pe
rio
d
8.65
5.92
Downstream of the junction of Sky fall
Melamchi at Gohore 5.73
5.01
4.34
4.48
4.65
5.92
9.48
6.82
Downstream of the Junction of Melamchi and Gohare Rivers
Melamchi at Gyalthum 6.25
5.49
5.14
4.56
5.11
6.49
10.48
6.82
Downstream of the Junction of Melamchi and Gyalthum Rivers
Melamchi at Talamarang
6.57
5.61
5.29
4.07
4.95
6.71
10.76
6.87
Downstream to the confluence of Talamarang and Melamchi Rivers
Melamchi at Pulbazaar
7.34
5.99
5.56
4.45
5.1
7.19
11.84
7.21
Downstream to the confluence of Nuwar river and Upstream to the confluence of
Melamchi and Indrawati Rivers
Discharge measurement of Melamchi River 2015
Location
Discharge, m3/s
Remarks Jan
Feb
Mar
Apr May
June July -
October Nov
Dec
Melamchi at Timbu /Ambathan
4.93
4.94
4.49
4.68
5.74
6.03
Dis
cha
rge
can
no
t b
e m
easu
red
du
e t
o t
he h
igh
flo
od
in
th
e r
ive
r
du
rin
g t
his
mo
nso
on
pe
rio
d
8.20
6.03
Downstream of the junction of Sky fall
Melamchi at Gohore 5.71
5.04
4.97
4.88
6.16
6.51 9.68
6.87
Downstream of the Junction of Melamchi and Gohare Rivers
Melamchi at Gyalthum 5.97
5.49
5.41
5.50
7.66
8.01 10.13
6.96
Downstream of the Junction of Melamchi and Gyalthum Rivers
Melamchi at Talamarang
6.05
5.61
5.48
5.69
7.89
8.39 10.56
7.63
Downstream to the confluence of Talamarang and Melamchi Rivers
Melamchi at Pulbazaar 6.11
5.99
5.84
4.95
7.94
8.68 11.14
7.88
Downstream to the confluence of Nuwar river and Upstream to the confluence of
Melamchi and Indrawati Rivers
Discharge measurement of Melamchi River 2016
Location
Discharge, m3/s
Remarks Jan Feb Mar Apr May June
July - October
Nov Dec
Melamchi at Timbu /Ambathan
3.122 3.93 3.19 3.97 5.36 5.90
Dis
cha
rge
can
no
t b
e m
easu
red
du
e to
th
e
hig
h flo
od
in t
he r
ive
r d
urin
g t
his
mo
nso
on
pe
rio
d
5.70 5.58 Downstream of the junction of
Sky fall
Melamchi at Gohore
3.558 4.42 3.84 4.66 6.24 6.95 6.64 6.37 Downstream of the Junction
of Melamchi and Gohare Rivers
Melamchi at Gyalthum
4.688 4.99 4.69 4.81 6.99 7.66 7.03 6.85 Downstream of the Junction of Melamchi and Gyalthum
Rivers
Melamchi at Talamarang
4.692 5.18 4.80 5.16 7.12 7.94 7.17 6.92 Downstream to the
confluence of Talamarang and Melamchi Rivers
Melamchi at Pulbazaar
5.281 5.85 5.13 5.36 7.44 9.05 7.33 7.04
Downstream to the confluence of Nuwar river
and Upstream to the confluence of Melamchi and
Indrawati Rivers
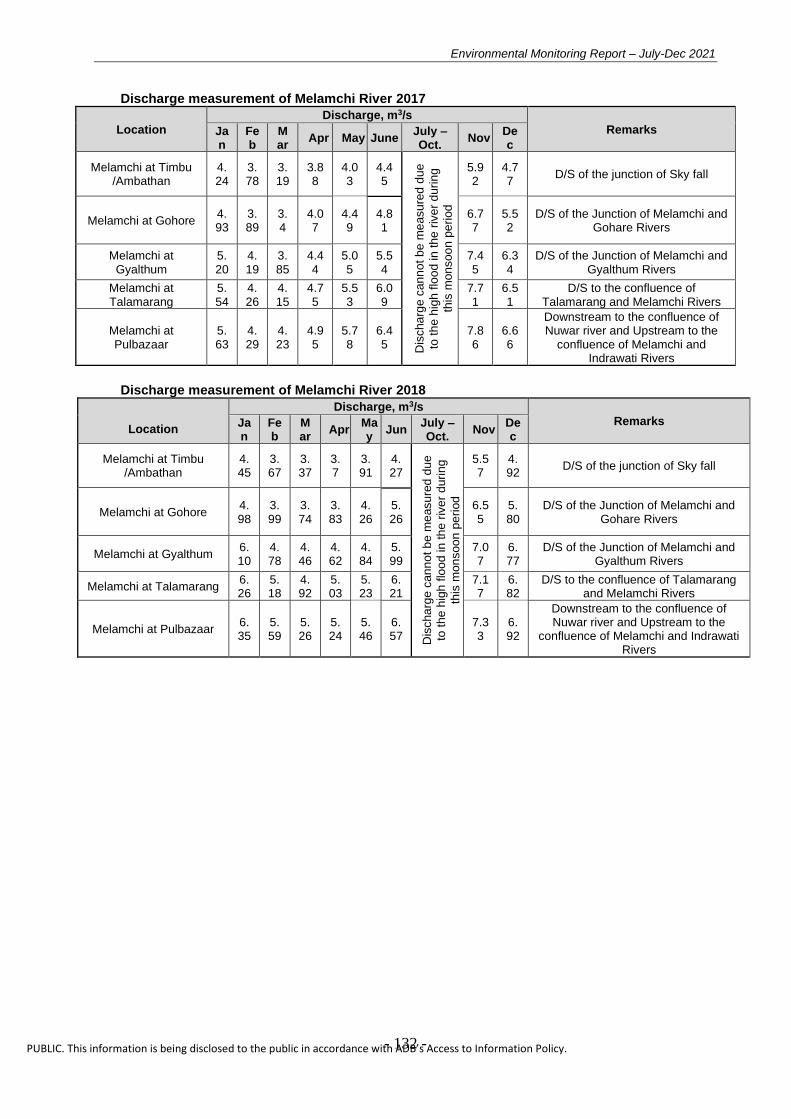
Environmental Monitoring Report – July-Dec 2021
- 132 -
PUBLIC. This information is being disclosed to the public in accordance with ADB’s Access to Information Policy.
Discharge measurement of Melamchi River 2017
Location
Discharge, m3/s
Remarks Jan
Feb
Mar
Apr May June July – Oct.
Nov Dec
Melamchi at Timbu /Ambathan
4.24
3.78
3.19
3.88
4.03
4.45
Dis
cha
rge
can
no
t b
e m
easu
red
du
e
to t
he
hig
h f
loo
d in
th
e r
ive
r d
uri
ng
this
mon
soo
n p
eri
od
5.92
4.77
D/S of the junction of Sky fall
Melamchi at Gohore 4.93
3.89
3.4
4.07
4.49
4.81
6.77
5.52
D/S of the Junction of Melamchi and Gohare Rivers
Melamchi at Gyalthum
5.20
4.19
3.85
4.44
5.05
5.54
7.45
6.34
D/S of the Junction of Melamchi and Gyalthum Rivers
Melamchi at Talamarang
5.54
4.26
4.15
4.75
5.53
6.09
7.71
6.51
D/S to the confluence of Talamarang and Melamchi Rivers
Melamchi at Pulbazaar
5.63
4.29
4.23
4.95
5.78
6.45
7.86
6.66
Downstream to the confluence of Nuwar river and Upstream to the
confluence of Melamchi and Indrawati Rivers
Discharge measurement of Melamchi River 2018
Location
Discharge, m3/s
Remarks Jan
Feb
Mar
Apr May
Jun July – Oct.
Nov Dec
Melamchi at Timbu /Ambathan
4.45
3.67
3.37
3.7
3.91
4.27
Dis
cha
rge
can
no
t b
e m
easu
red
du
e
to t
he
hig
h f
loo
d in
th
e r
ive
r d
uri
ng
this
mon
soo
n p
eri
od
5.57
4.92
D/S of the junction of Sky fall
Melamchi at Gohore 4.98
3.99
3.74
3.83
4.26
5.26
6.55
5.80
D/S of the Junction of Melamchi and Gohare Rivers
Melamchi at Gyalthum 6.10
4.78
4.46
4.62
4.84
5.99
7.07
6.77
D/S of the Junction of Melamchi and Gyalthum Rivers
Melamchi at Talamarang 6.26
5.18
4.92
5.03
5.23
6.21
7.17
6.82
D/S to the confluence of Talamarang and Melamchi Rivers
Melamchi at Pulbazaar 6.35
5.59
5.26
5.24
5.46
6.57
7.33
6.92
Downstream to the confluence of Nuwar river and Upstream to the
confluence of Melamchi and Indrawati Rivers
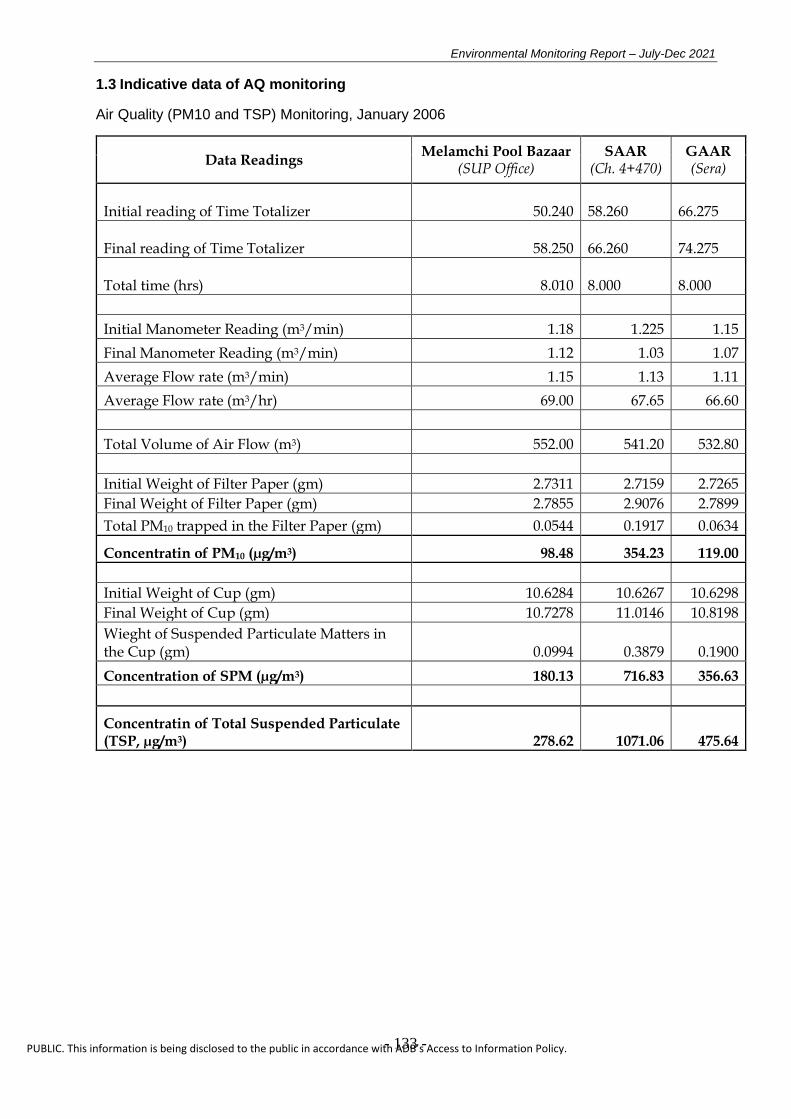
Environmental Monitoring Report – July-Dec 2021
- 133 -
PUBLIC. This information is being disclosed to the public in accordance with ADB’s Access to Information Policy.
1.3 Indicative data of AQ monitoring
Air Quality (PM10 and TSP) Monitoring, January 2006
Data Readings Melamchi Pool Bazaar
(SUP Office) SAAR
(Ch. 4+470) GAAR (Sera)
Initial reading of Time Totalizer 50.240 58.260
66.275
Final reading of Time Totalizer 58.250 66.260
74.275
Total time (hrs) 8.010 8.000
8.000
Initial Manometer Reading (m3/min) 1.18 1.225 1.15
Final Manometer Reading (m3/min) 1.12 1.03 1.07
Average Flow rate (m3/min) 1.15 1.13 1.11
Average Flow rate (m3/hr) 69.00 67.65 66.60
Total Volume of Air Flow (m3) 552.00 541.20 532.80
Initial Weight of Filter Paper (gm) 2.7311 2.7159 2.7265
Final Weight of Filter Paper (gm) 2.7855 2.9076 2.7899
Total PM10 trapped in the Filter Paper (gm) 0.0544 0.1917 0.0634
Concentratin of PM10 (µg/m3) 98.48 354.23 119.00
Initial Weight of Cup (gm) 10.6284 10.6267 10.6298
Final Weight of Cup (gm) 10.7278 11.0146 10.8198
Wieght of Suspended Particulate Matters in the Cup (gm) 0.0994 0.3879 0.1900
Concentration of SPM (µg/m3) 180.13 716.83 356.63
Concentratin of Total Suspended Particulate (TSP, µg/m3) 278.62 1071.06 475.64
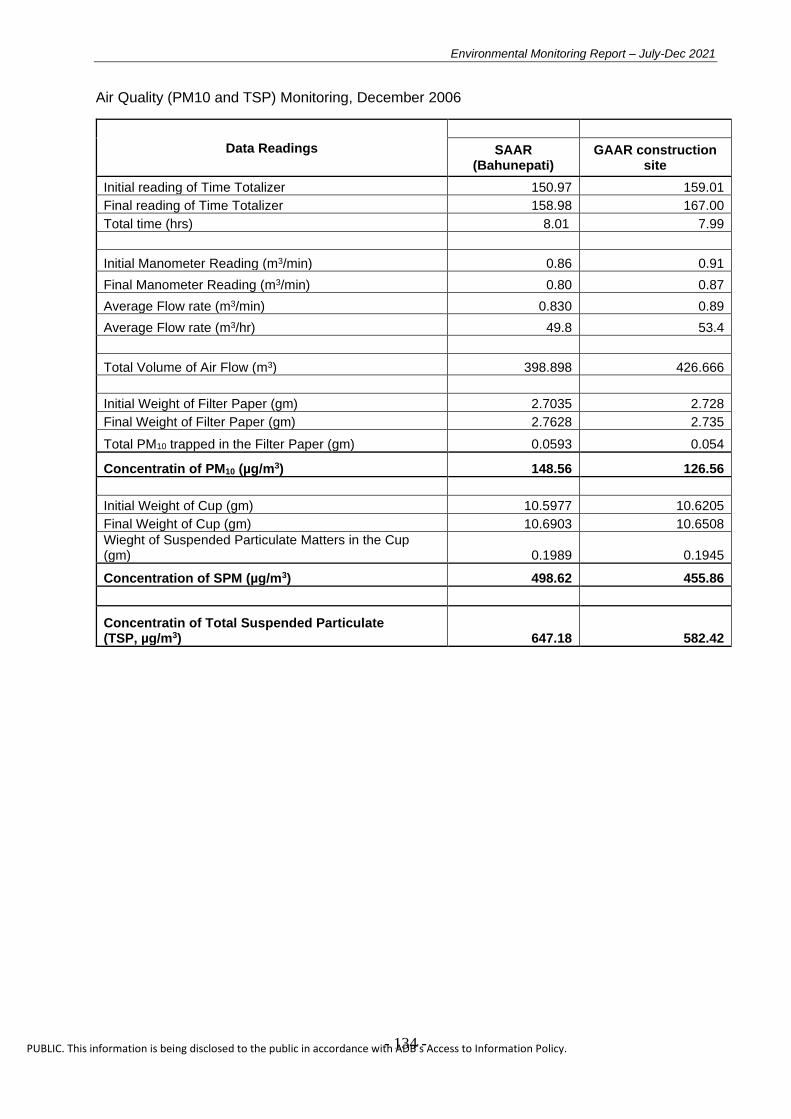
Environmental Monitoring Report – July-Dec 2021
- 134 -
PUBLIC. This information is being disclosed to the public in accordance with ADB’s Access to Information Policy.
Air Quality (PM10 and TSP) Monitoring, December 2006
Data Readings
SAAR (Bahunepati)
GAAR construction site
Initial reading of Time Totalizer 150.97 159.01
Final reading of Time Totalizer 158.98 167.00
Total time (hrs) 8.01 7.99
Initial Manometer Reading (m3/min) 0.86 0.91
Final Manometer Reading (m3/min) 0.80 0.87
Average Flow rate (m3/min) 0.830 0.89
Average Flow rate (m3/hr) 49.8 53.4
Total Volume of Air Flow (m3) 398.898 426.666
Initial Weight of Filter Paper (gm) 2.7035 2.728
Final Weight of Filter Paper (gm) 2.7628 2.735
Total PM10 trapped in the Filter Paper (gm) 0.0593 0.054
Concentratin of PM10 (µg/m3) 148.56 126.56
Initial Weight of Cup (gm) 10.5977 10.6205
Final Weight of Cup (gm) 10.6903 10.6508
Wieght of Suspended Particulate Matters in the Cup (gm) 0.1989 0.1945
Concentration of SPM (µg/m3) 498.62 455.86
Concentratin of Total Suspended Particulate (TSP, µg/m3) 647.18 582.42
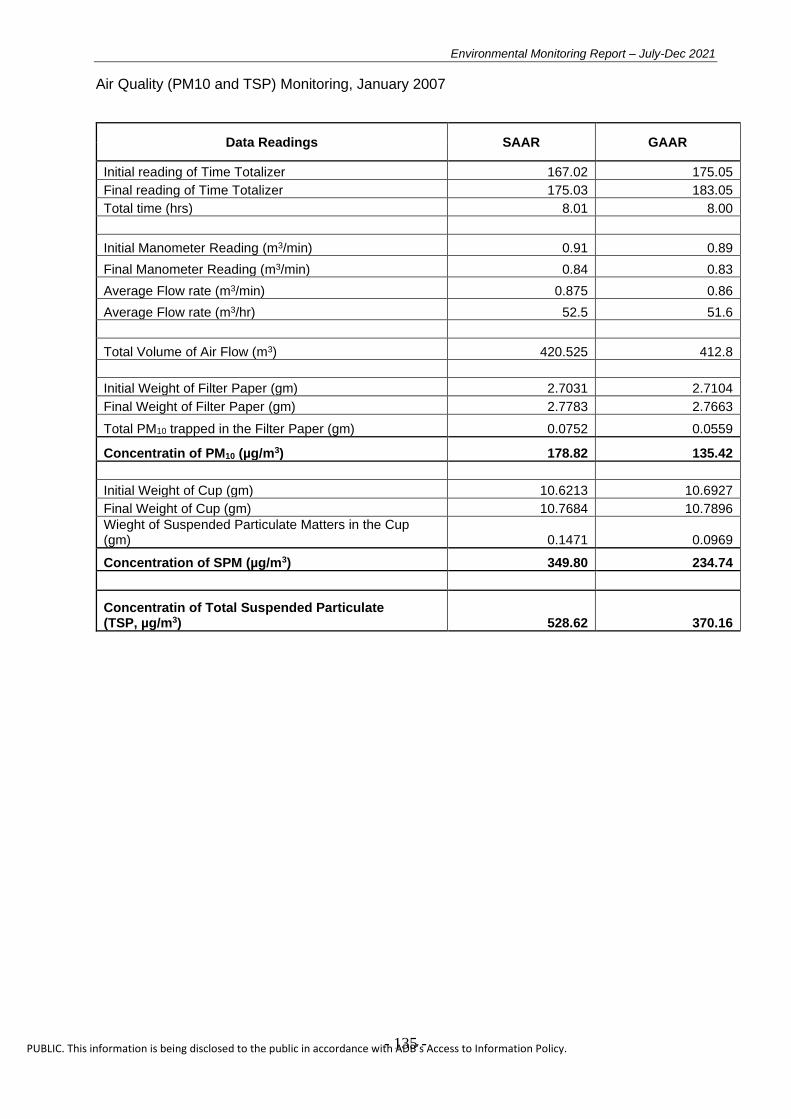
Environmental Monitoring Report – July-Dec 2021
- 135 -
PUBLIC. This information is being disclosed to the public in accordance with ADB’s Access to Information Policy.
Air Quality (PM10 and TSP) Monitoring, January 2007
Data Readings SAAR GAAR
Initial reading of Time Totalizer 167.02 175.05
Final reading of Time Totalizer 175.03 183.05
Total time (hrs) 8.01 8.00
Initial Manometer Reading (m3/min) 0.91 0.89
Final Manometer Reading (m3/min) 0.84 0.83
Average Flow rate (m3/min) 0.875 0.86
Average Flow rate (m3/hr) 52.5 51.6
Total Volume of Air Flow (m3) 420.525 412.8
Initial Weight of Filter Paper (gm) 2.7031 2.7104
Final Weight of Filter Paper (gm) 2.7783 2.7663
Total PM10 trapped in the Filter Paper (gm) 0.0752 0.0559
Concentratin of PM10 (µg/m3) 178.82 135.42
Initial Weight of Cup (gm) 10.6213 10.6927
Final Weight of Cup (gm) 10.7684 10.7896
Wieght of Suspended Particulate Matters in the Cup (gm) 0.1471 0.0969
Concentration of SPM (µg/m3) 349.80 234.74
Concentratin of Total Suspended Particulate (TSP, µg/m3) 528.62 370.16
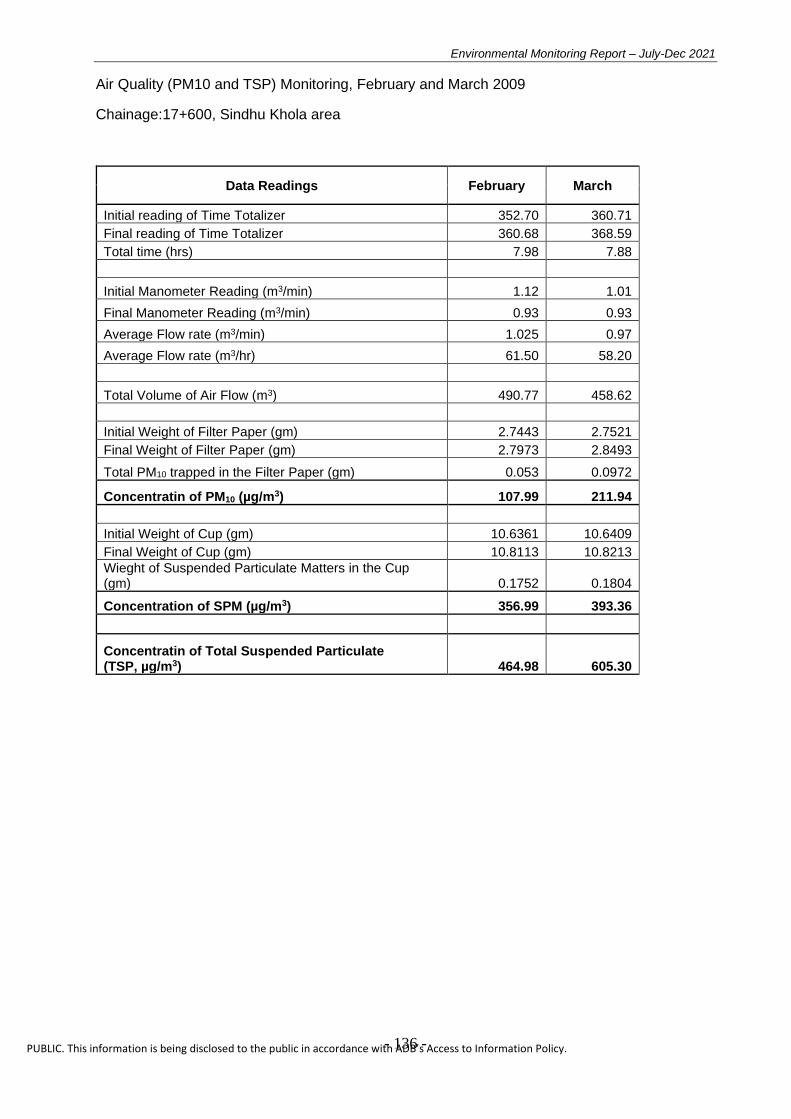
Environmental Monitoring Report – July-Dec 2021
- 136 -
PUBLIC. This information is being disclosed to the public in accordance with ADB’s Access to Information Policy.
Air Quality (PM10 and TSP) Monitoring, February and March 2009
Chainage:17+600, Sindhu Khola area
Data Readings February March
Initial reading of Time Totalizer 352.70 360.71
Final reading of Time Totalizer 360.68 368.59
Total time (hrs) 7.98 7.88
Initial Manometer Reading (m3/min) 1.12 1.01
Final Manometer Reading (m3/min) 0.93 0.93
Average Flow rate (m3/min) 1.025 0.97
Average Flow rate (m3/hr) 61.50 58.20
Total Volume of Air Flow (m3) 490.77 458.62
Initial Weight of Filter Paper (gm) 2.7443 2.7521
Final Weight of Filter Paper (gm) 2.7973 2.8493
Total PM10 trapped in the Filter Paper (gm) 0.053 0.0972
Concentratin of PM10 (µg/m3) 107.99 211.94
Initial Weight of Cup (gm) 10.6361 10.6409
Final Weight of Cup (gm) 10.8113 10.8213
Wieght of Suspended Particulate Matters in the Cup (gm) 0.1752 0.1804
Concentration of SPM (µg/m3) 356.99 393.36
Concentratin of Total Suspended Particulate (TSP, µg/m3) 464.98 605.30
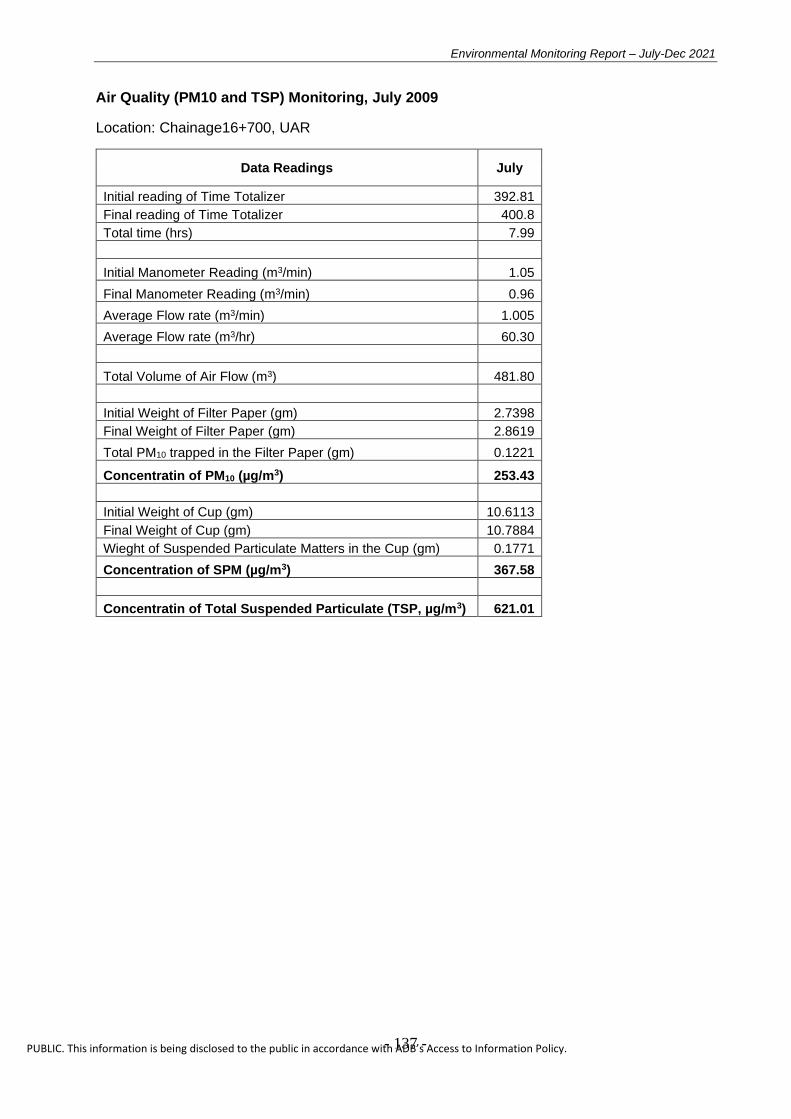
Environmental Monitoring Report – July-Dec 2021
- 137 -
PUBLIC. This information is being disclosed to the public in accordance with ADB’s Access to Information Policy.
Air Quality (PM10 and TSP) Monitoring, July 2009
Location: Chainage16+700, UAR
Data Readings July
Initial reading of Time Totalizer 392.81
Final reading of Time Totalizer 400.8
Total time (hrs) 7.99
Initial Manometer Reading (m3/min) 1.05
Final Manometer Reading (m3/min) 0.96
Average Flow rate (m3/min) 1.005
Average Flow rate (m3/hr) 60.30
Total Volume of Air Flow (m3) 481.80
Initial Weight of Filter Paper (gm) 2.7398
Final Weight of Filter Paper (gm) 2.8619
Total PM10 trapped in the Filter Paper (gm) 0.1221
Concentratin of PM10 (µg/m3) 253.43
Initial Weight of Cup (gm) 10.6113
Final Weight of Cup (gm) 10.7884
Wieght of Suspended Particulate Matters in the Cup (gm) 0.1771
Concentration of SPM (µg/m3) 367.58
Concentratin of Total Suspended Particulate (TSP, µg/m3) 621.01
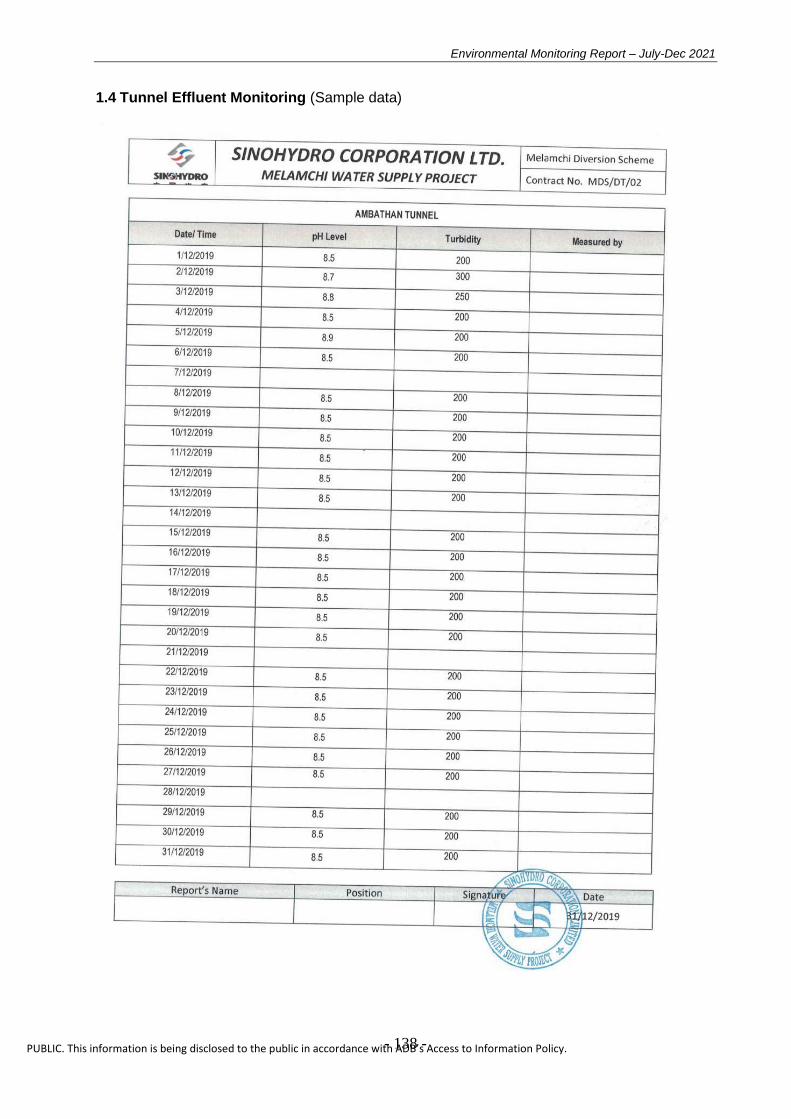
Environmental Monitoring Report – July-Dec 2021
- 138 -
PUBLIC. This information is being disclosed to the public in accordance with ADB’s Access to Information Policy.
1.4 Tunnel Effluent Monitoring (Sample data)
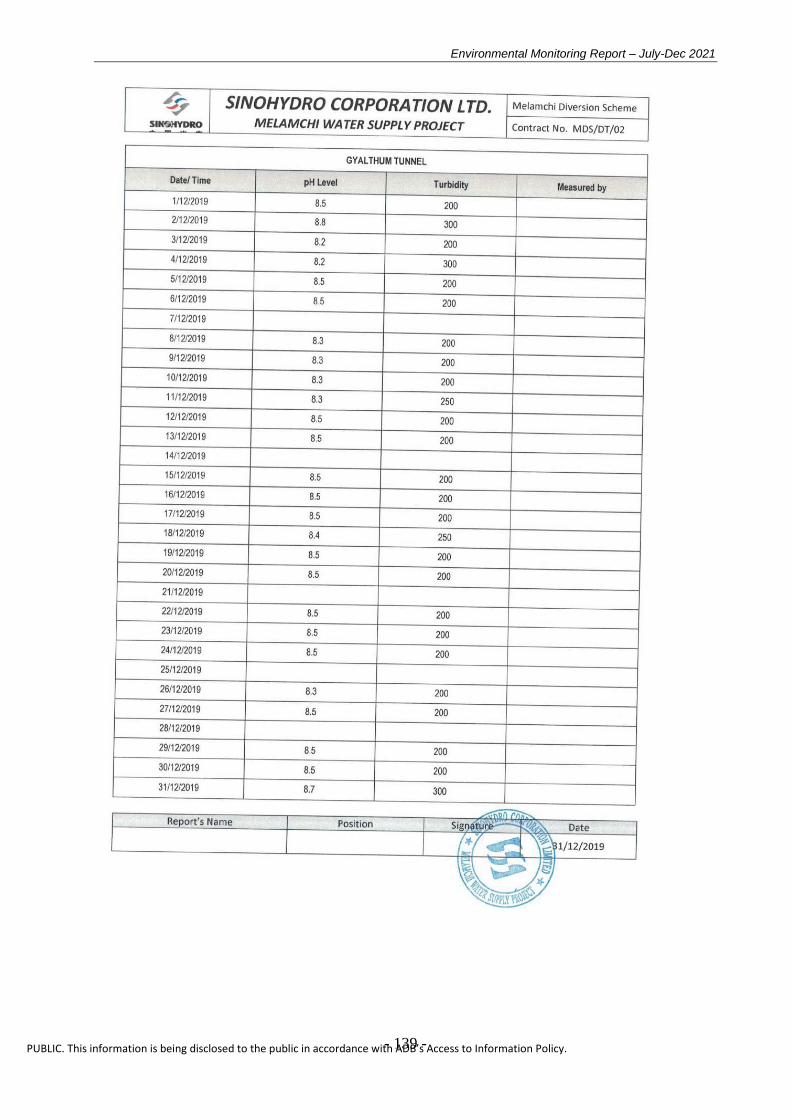
Environmental Monitoring Report – July-Dec 2021
- 139 -
PUBLIC. This information is being disclosed to the public in accordance with ADB’s Access to Information Policy.
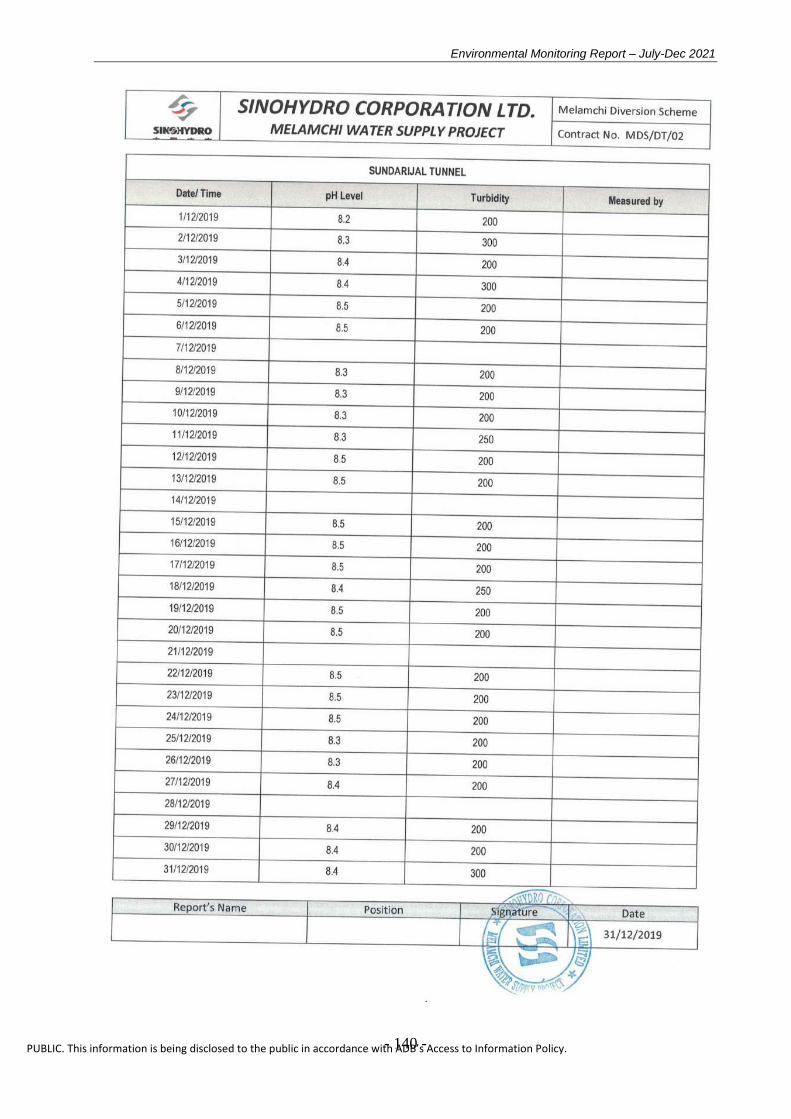
Environmental Monitoring Report – July-Dec 2021
- 140 -
PUBLIC. This information is being disclosed to the public in accordance with ADB’s Access to Information Policy.

Environmental Monitoring Report – July-Dec 2021
- 141 -
PUBLIC. This information is being disclosed to the public in accordance with ADB’s Access to Information Policy.
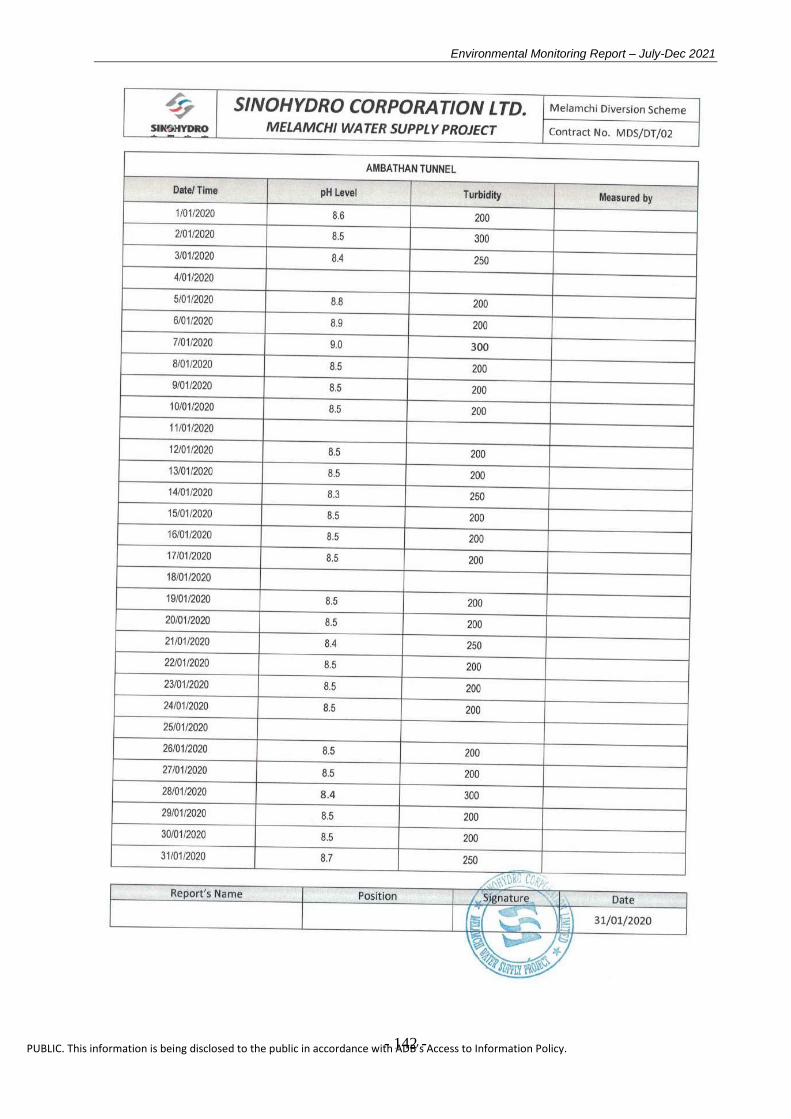
Environmental Monitoring Report – July-Dec 2021
- 142 -
PUBLIC. This information is being disclosed to the public in accordance with ADB’s Access to Information Policy.
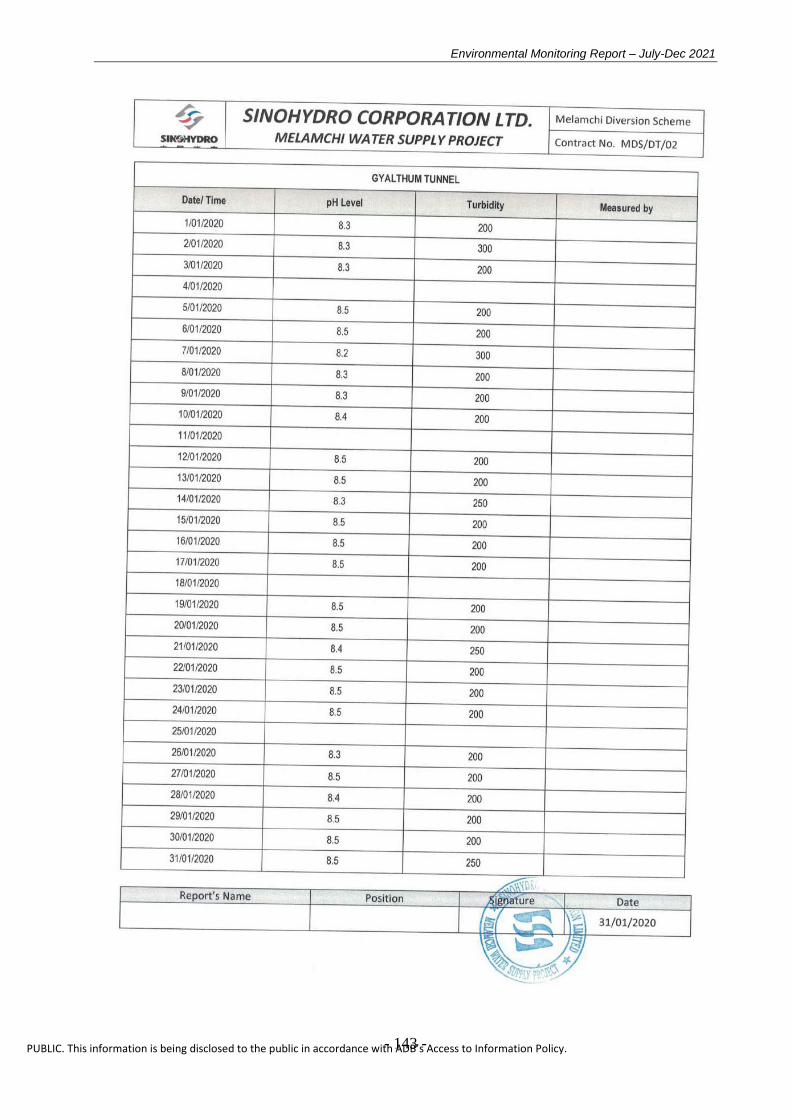
Environmental Monitoring Report – July-Dec 2021
- 143 -
PUBLIC. This information is being disclosed to the public in accordance with ADB’s Access to Information Policy.

Environmental Monitoring Report – July-Dec 2021
- 144 -
PUBLIC. This information is being disclosed to the public in accordance with ADB’s Access to Information Policy.
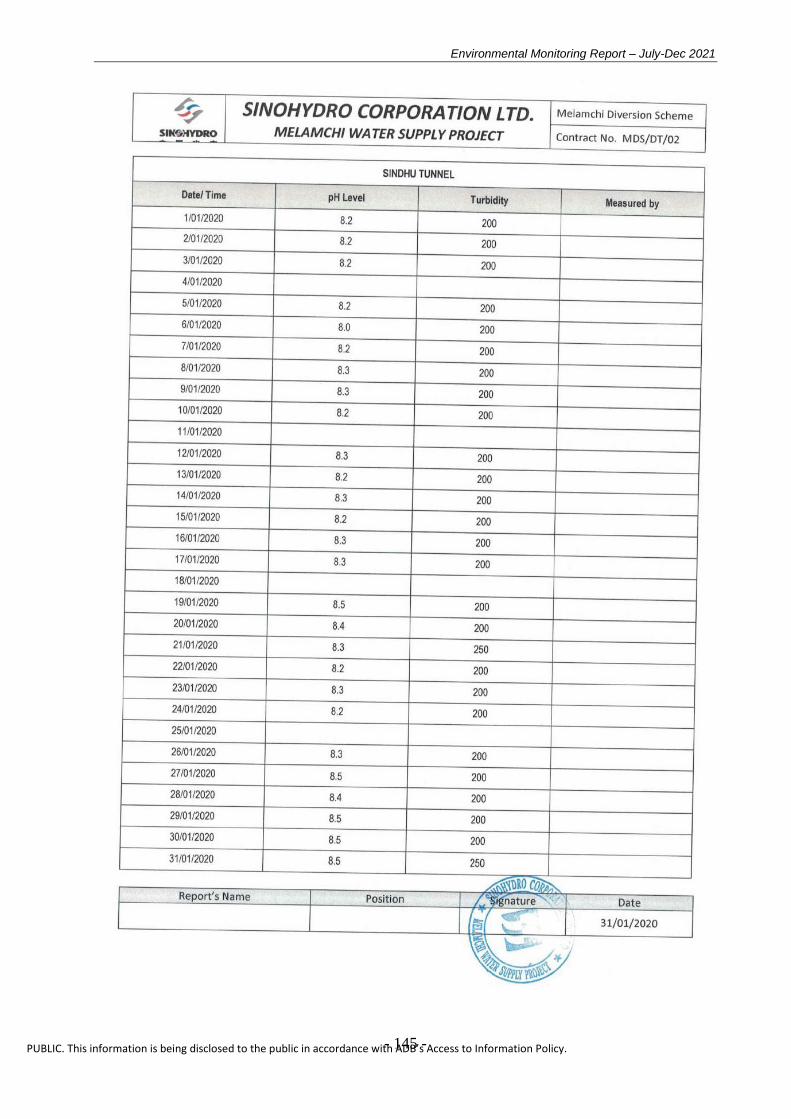
Environmental Monitoring Report – July-Dec 2021
- 145 -
PUBLIC. This information is being disclosed to the public in accordance with ADB’s Access to Information Policy.
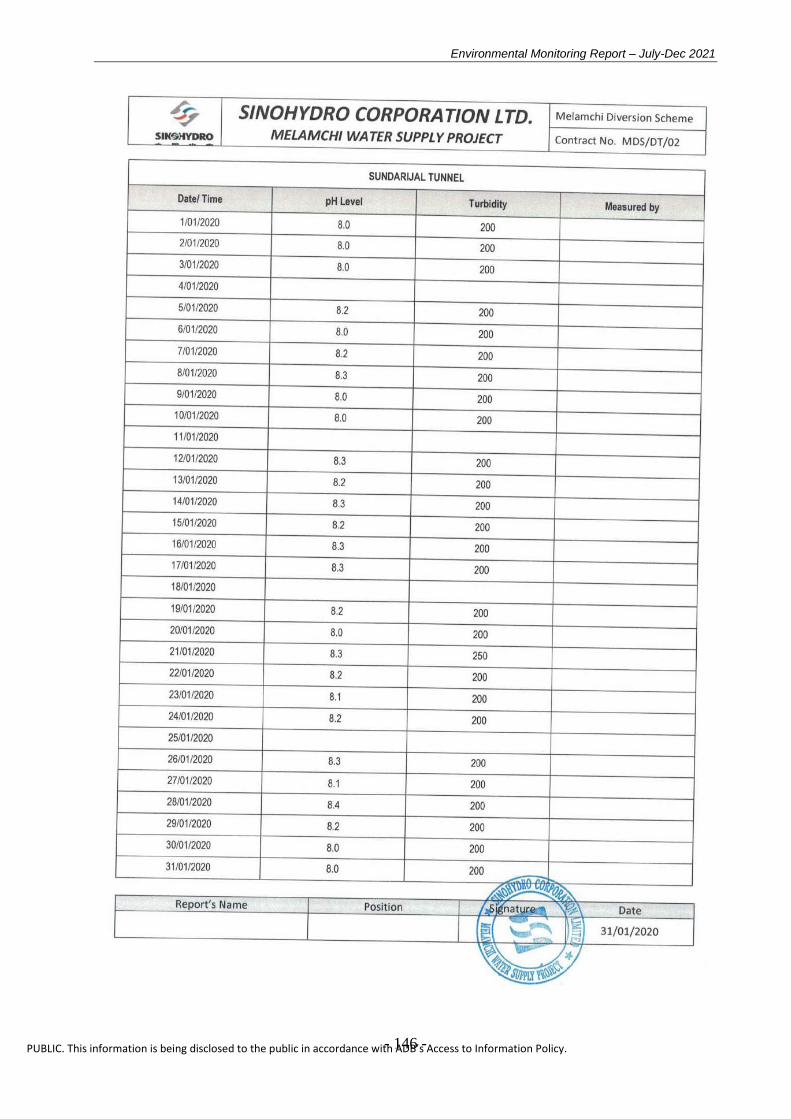
Environmental Monitoring Report – July-Dec 2021
- 146 -
PUBLIC. This information is being disclosed to the public in accordance with ADB’s Access to Information Policy.

Environmental Monitoring Report – July-Dec 2021
- 147 -
PUBLIC. This information is being disclosed to the public in accordance with ADB’s Access to Information Policy.
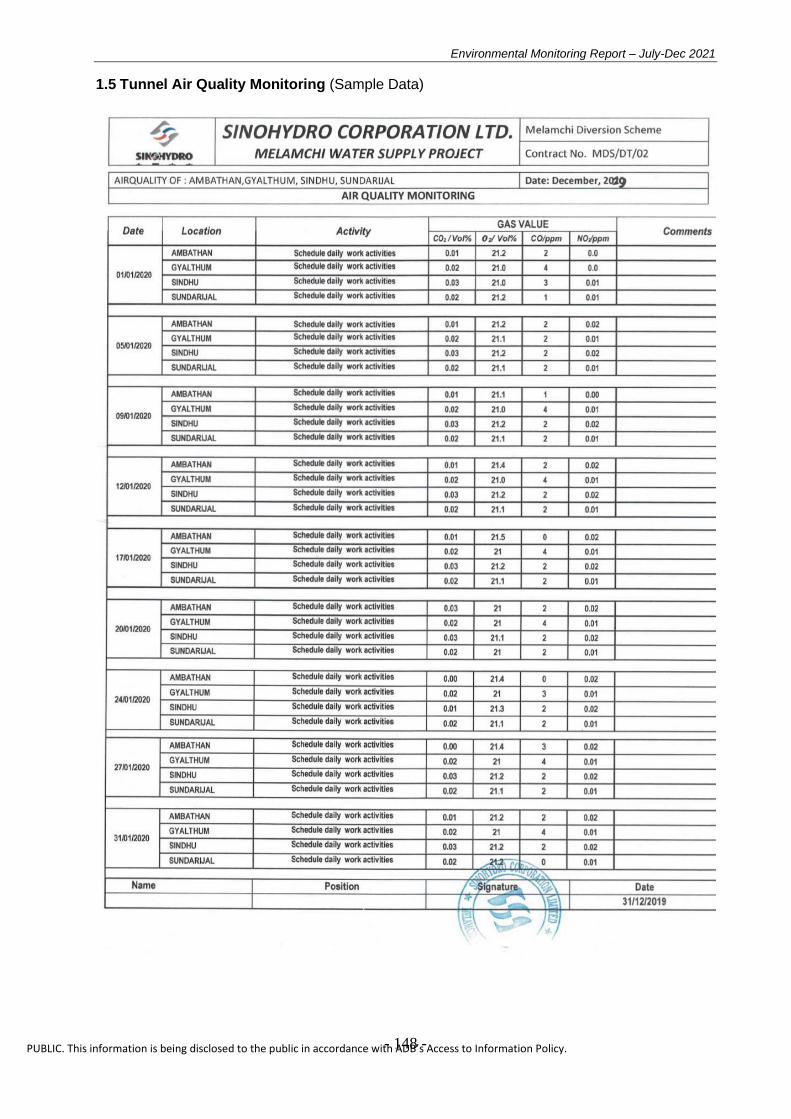
Environmental Monitoring Report – July-Dec 2021
- 148 -
PUBLIC. This information is being disclosed to the public in accordance with ADB’s Access to Information Policy.
1.5 Tunnel Air Quality Monitoring (Sample Data)

Environmental Monitoring Report – July-Dec 2021
- 149 -
PUBLIC. This information is being disclosed to the public in accordance with ADB’s Access to Information Policy.

Environmental Monitoring Report – July-Dec 2021
- 150 -
PUBLIC. This information is being disclosed to the public in accordance with ADB’s Access to Information Policy.

Environmental Monitoring Report – July-Dec 2021
- 151 -
PUBLIC. This information is being disclosed to the public in accordance with ADB’s Access to Information Policy.

Environmental Monitoring Report – July-Dec 2021
- 152 -
PUBLIC. This information is being disclosed to the public in accordance with ADB’s Access to Information Policy.
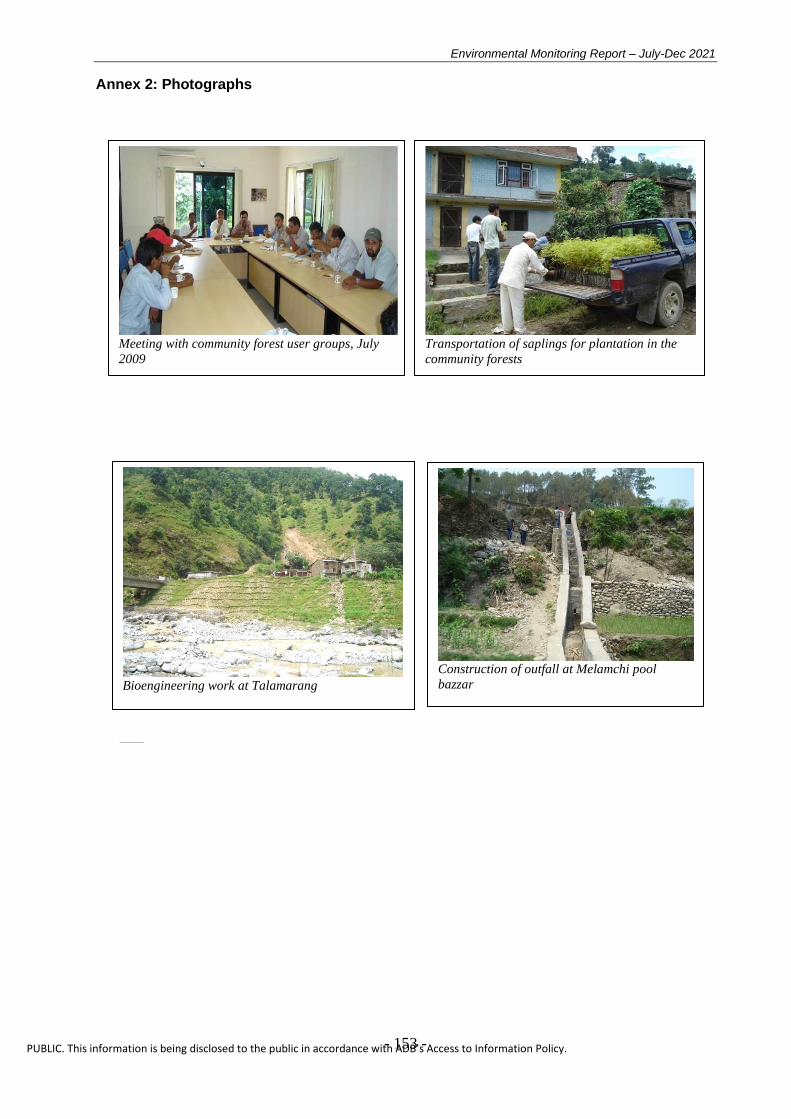
Environmental Monitoring Report – July-Dec 2021
- 153 -
PUBLIC. This information is being disclosed to the public in accordance with ADB’s Access to Information Policy.
Transportation of saplings for plantation in the
community forests Meeting with community forest user groups, July
2009
Bioengineering work at Talamarang
Annex 2: Photographs
Construction of outfall at Melamchi pool
bazzar
Copyright © 2022 FDOKUMEN