Integrated Approach for Sustainable Lighting Product ...
169
i Integrated Approach for Sustainable Lighting Product Development Xuemin Xu A thesis submitted in partial fulfilment of the requirements of Nottingham Trent University for the degree of Doctor of Philosophy This research was carried out at: Advanced Design and Manufacturing Engineering Centre School of Architecture, Design and the Built Environment Nottingham Trent University 50 Shakespeare Street Nottingham NG1 4FQ, UK August 2019
-
Upload
khangminh22 -
Category
Documents
-
view
4 -
download
0
Transcript of Integrated Approach for Sustainable Lighting Product ...
i
Integrated Approach for Sustainable Lighting Product
Development
Xuemin Xu
A thesis submitted in partial fulfilment of the requirements of Nottingham
Trent University for the degree of Doctor of Philosophy
This research was carried out at:
Advanced Design and Manufacturing Engineering Centre
School of Architecture, Design and the Built Environment
Nottingham Trent University
50 Shakespeare Street Nottingham
NG1 4FQ, UK
August 2019
ii
Copyright Statement
This work is the intellectual property of the author. You may copy up to 5% of this work for
private study, or personal, non-commercial research. Any re-use of the information
contained within this document should be fully referenced, quoting the author, title,
university, degree level and pagination. Queries or requests for any other use, or if a more
substantial copy is required, should be directed in the owner of the Intellectual Property
Rights.
iii
Publication list
Su, D., Casamayor, J. and Xu, X., 2015. Utilisation of a toolbox for computer aided
development of LED lighting products. International Journal of Mechanical and Production
Engineering (IJMPE), 3(4), pp.56-61.
Daizhong Su, Xuemin Xu and Jose Casamayor, 2019, ‘An integrated approach for sustainable
production of LED lighting products’, 8th l International Workshop on Advances in Cleaner
Production, 13-15 November, 2019. Sanya, China.
Daizhong Su, Jose Casamayor and Xuemin Xu, 2015, Section 2 – Integration of Eco-
production methods and tools into the development of LED lighting products, in Deliverable
D.3.1: Proposal for increasing resource efficiency and reducing environmental impact from
the production of LED lighting products, EU FP7 cycLED project.
Daizhong Su, Arivazhagan Anbalagan, Xuemin Xu and Zhongming Ren, 2015, Deliverable 3.2
LED Toolbox: Toolbox aiming to increase resource efficiency of LED products, EU FP7 cycLED
project
iv
Abstract
The research presented in this thesis aims to contribute to the body of knowledge and state
of the art in the area of eco-lighting products by: 1) development of an integrated approach
for sustainable lighting product by integrating various tools and methods through the
product development process, including product design specification, conceptual design,
detail design, prototyping and test, and manufacture. 2) Development of a web-based
toolbox to support product designers to develop (design, test, manufacture) lighting
products with low environmental impact. 3) utilisation of the integrated approach and the
toolbox, a novel eco-lighting product is developed.
This study has been conducted in a real industrial context with lighting product
manufacturer and other organizations involved with the lighting product life cycle, and the
following main methods and techniques have been applied to collect and analyse the data,
and to develop the product. A dedicated environmental and social LCA on the domestic
lighting product has been conducted by using a professional LCA software. The LCI datasets
are provided by its manufacturer, a Spain based company, and also fulfilled by applying
ecoinvent database. The analytical results of these studies present an in-depth modelling
and analysis on the table lamp product lifecycle with the aid of real manufacturing data.
This research contributes to the state of the art of eco-lighting products with the
development of a novel eco-lighting product, and provide a new integrative approach to
design, test, manufacture and commercialize eco-lighting products, in order to contribute to
the body of knowledge in the area of approaches/methods to develop and commercialize
eco-lighting products.
This research is financially supported by the cycLED project (Grant Agreement No. 282793)
under the European Commission FP7 Eco-Innovation programme.
v
Acknowledgement
I am grateful to my Director of Study, Professor Daizhong Su for his supervision, advice and
guidance from the starting of my study, and also for giving me opportunities to work on
such exciting and demanding research and teaching projects. I thank my second supervisor
Dr Jose Luis Casamayor for his expert advices in this study journey.
I acknowledge the financial support from the cycLED project (Grant No. 282793) under the
programme of FP7-ENV-2011-ECO-INNOVATION-TwoStage.
I would like to thank the support received from Ona Product SL(Spain). They provided
valuable advice in the design and quality manufacture of the products. They also kindly
provided technique information needed for the research.
Finally, I would like to thank my parents, family and friends, for their unconditional love and
support.
vi
Table of Content
Copyright Statement........................................................................................................ ii
Publication list ................................................................................................................. iii
Abstract .......................................................................................................................... iv
Acknowledgement ............................................................................................................v
Table of Content .............................................................................................................. vi
List of Figures ................................................................................................................... x
List of Tables .................................................................................................................. xii
Nomenclature................................................................................................................ xiii
Chapter 1: Introduction .............................................................................................15
1.1 Research background ................................................................................................. 15
1.2 Research aim and objectives ...................................................................................... 15
1.3 Structure of the thesis ................................................................................................ 18
Chapter 2: Literature Review .....................................................................................20
2.1 Eco-design methods ................................................................................................... 20
2.2 Eco-design tools ......................................................................................................... 21
2.2.1 Directives and regulations............................................................................................................. 22
2.2.2 Environmental impact assessment tools ...................................................................................... 24
2.3 Life Cycle Assessment ................................................................................................ 25
2.3.1 LCA studies related to LED lighting products ................................................................................ 26
2.3.2 Social Life Cycle Assessment (SLCA) .............................................................................................. 29
2.4 Characteristic of LED lighting products ........................................................................ 37
2.4.1 Working mechanisms of LED......................................................................................................... 37
2.4.2 LED lamp life .................................................................................................................................. 38
2.4.3 Electrical characteristics and quality control ................................................................................ 39
2.4.4 Luminous efficacy .......................................................................................................................... 39
vii
2.4.5 Light distribution ........................................................................................................................... 40
2.4.6 Dimming ........................................................................................................................................ 41
2.5 Conclusions of the literature review ........................................................................... 42
Chapter 3: Research Methodology .............................................................................45
3.1 Introduction .............................................................................................................. 45
3.2 Research design and outcomes ................................................................................... 45
3.3 Quality analysis for source data used in case studies ................................................... 47
3.4 Summary ................................................................................................................... 48
Chapter 4: A Web-based Toolbox to Support Eco-innovation in LED Lighting Products 49
4.1 Introduction .............................................................................................................. 49
4.1.1 Demand for the toolbox of led lighting products ......................................................................... 49
4.1.2 Web technology related to tool integration and technology base online learning ..................... 50
4.1.3 Design and manufacture of LED lighting products ....................................................................... 52
4.2 Structure and contents: recommendations for a flexible and easy to use toolbox ........ 53
4.3 Web development of the toolbox ............................................................................... 54
4.3.1 Design: the toolbox structure ....................................................................................................... 54
4.3.2 Contents and functionalities ......................................................................................................... 55
4.3.3 Testing the Toolbox website in different browsers ...................................................................... 67
4.4 Concluding remark ..................................................................................................... 69
Chapter 5: The Integrated Approach ..........................................................................70
5.1 Overview of the integrated approach ......................................................................... 70
5.1.1 The methods and tools considered in the integrated approach .................................................. 70
5.1.2 The product development process considered in the integrated approach ................................ 71
5.2 Prototyping and testing .............................................................................................. 72
5.3 Hardware-based measurement tools utilized .............................................................. 74
5.4 Concluding remarks ................................................................................................... 75
Chapter 6: Sustainable Lighting Product Design .........................................................76
6.1 Configuration of Product Design Specifications (PDS) .................................................. 76
6.2 Conceptual design ...................................................................................................... 77
viii
6.3 Detail design .............................................................................................................. 79
6.4 Lighting products utilized for demonstration of the integrated approach ..................... 82
6.5 Conclusions ............................................................................................................... 85
Chapter 7: Experimental Investigation of the LED Lighting Product .............................86
7.1 Evaluating the optical qualities of the lighting product ................................................ 86
7.1.1 Optics criteria ................................................................................................................................ 86
7.1.2 Overview of selected tools ............................................................................................................ 86
7.1.3 Experimental setup and implementation ..................................................................................... 87
7.1.4 Optic experiment analysis ............................................................................................................. 90
Chapter 8: Environmental Life Cycle Assessment of the LED Lighting Product ..............96
8.1 Introduction .............................................................................................................. 96
8.2 Goal and scope .......................................................................................................... 96
8.2.1 Function and Functional Unit ........................................................................................................ 96
8.2.2 Product General Description ......................................................................................................... 97
8.2.3 System boundaries ........................................................................................................................ 97
8.3 Life cycle impact assessment method ......................................................................... 98
8.4 Calculation tool ........................................................................................................ 100
8.5 Life cycle inventory data .......................................................................................... 100
8.5.1 Key Data for Materials and Processes......................................................................................... 100
8.5.2 Data assumptions ........................................................................................................................ 102
8.6 Life cycle impact assessment results ......................................................................... 102
8.6.1 Default scenario analysis............................................................................................................. 102
8.6.2 Sensitivity Analysis ...................................................................................................................... 106
8.7 Comparison of LCA analysis results ........................................................................... 108
8.8 Conclusions ............................................................................................................. 111
Chapter 9: Social Life Cycle Assessment for the LED Lighting Product ........................ 112
9.1 Introduction ............................................................................................................ 112
9.2 Methodology for the social life cycle assessment ...................................................... 112
9.3 Social life cycle impact assessment ........................................................................... 116
9.3.1 Social categories/subcategories and indicators definition ......................................................... 116
ix
9.3.2 System description ...................................................................................................................... 124
9.3.3 Life Cycle Inventory and quality data .......................................................................................... 125
9.3.4 Social Life Cycle Impact Assessment ........................................................................................... 132
9.3.5 Results and discussion................................................................................................................. 140
Chapter 10: Conclusions ............................................................................................ 150
10.1 Discussion ................................................................................................................ 150
10.1.1 Limitations of the research .................................................................................................... 150
10.1.2 Research contributions .......................................................................................................... 151
10.2 Conclusions ............................................................................................................. 152
10.3 Further work ............................................................................................................ 154
Appendix ...................................................................................................................... 156
Reference ..................................................................................................................... 159
x
List of Figures
Figure 1-1 Structure of this thesis ............................................................................................ 19
Figure 2-1 Stakeholder groups of SLCA .................................................................................... 31
Figure 2-2 Generic assessment system of SLCA impact assessment ....................................... 33
Figure 2-3 Two types of SLCA methods (Wu 2014) ................................................................. 34
Figure 2-4 US DOE forecast of LED efficacy improvements, relative to current conventional
lighting technologies and monochromatic red LEDs and green OLEDs (US DOE, 2014) ......... 40
Figure 2-5 Typical light distribution from a white LED (source: Philips Lumileds) .................. 41
Figure 4-1 Structure of the Toolbox ......................................................................................... 54
Figure 4-2 Screen shot of the Front page of the Toolbox Website ......................................... 68
Figure 4-3 Screen shot of the Software Tools page of the Toolbox Website .......................... 68
Figure 5-1 The integrated approach ........................................................................................ 70
Figure 6-1 Initial architecture of the product .......................................................................... 80
Figure 6-2 The designed LED table lamp.................................................................................. 82
Figure 6-3 Driver components of the redesigned table lamp ................................................. 83
Figure 6-4 Base of the redesigned table lamp ......................................................................... 83
Figure 6-5 LED Table lamp B .................................................................................................... 84
Figure 7-1 Test room model..................................................................................................... 88
Figure 7-2 Luminance meter used for determining reflectance of surfaces ........................... 88
Figure 7-3 Comparison of measured and simulated illuminance data for 4 lighting simulation
packages, for data series A ...................................................................................................... 91
Figure 7-4 Comparison of measured and simulated illuminance data for 4 lighting simulation
packages, for data series E ....................................................................................................... 91
Figure 7-5 Comparison of measured and simulated illuminance data for 4 lighting simulation
packages ................................................................................................................................... 92
Figure 7-6 Comparison of measured and simulated in terms of overall average, maximum
data value and minimum data value ....................................................................................... 93
Figure 7-7 Polar radiation pattern for the designed lighting product ..................................... 94
Figure 7-8 Photometric specification of light output profile in ECOTECT ............................... 94
xi
Figure 8-1 A schematic system for the luminaire life cycles ................................................... 98
Figure 8-2 Life cycle impact results for the functional unit with the default scenario ......... 103
Figure 8-3 Environmental impact (endpoint) per impact category of the luminaire the
default scenario ..................................................................................................................... 104
Figure 8-4 Contribution analysis of the functional unit’s processes under default scenario 105
Figure 8-5 Relative impacts (total) among scenarios ............................................................ 107
Figure 8-6 Results per damage category ............................................................................... 109
Figure 8-7 Results per impact category ................................................................................. 110
Figure 9-1 Principal phases of an LCA study .......................................................................... 113
Figure 9-2 Relationship between stakeholders (UNEP/SETAC/LCI, 2009)............................. 114
Figure 9-3 Overall methodology proposed for S-LCA implementation ................................. 115
Figure 9-4 ONA’s simplified process flowchart. ..................................................................... 125
Figure 9-5 ONA’s table lamp input/output flowchart. .......................................................... 126
Figure 9-6 Contribution of the stages in ONA´s domestic LED table lamp SLCA results ....... 143
Figure 9-7 The table lamp (ONA) SLCA vs PSILCA reference sector ...................................... 147
xii
List of Tables
Table 2-1 Subcategories of stakeholders ................................................................................. 31
Table 2-2 Lifetime data of LEDs (US DOE, 2009) ...................................................................... 39
Table 4-1 Regulations Applicable to the Current Scenario ...................................................... 56
Table 4-2 List of Directives Applicable To the Current Scenario ............................................. 57
Table 4-3 Voluntary & National Legislation ............................................................................. 58
Table 4-4 Indicative relevance of Legislation to production phase ......................................... 59
Table 4-5 Application Tools (Software) .................................................................................... 65
Table 4-6 Application Tools Hardware ..................................................................................... 66
Table 6-1 Technical specifications of designed LED table lamp .............................................. 83
Table 6-2 BoM of benchmark product ..................................................................................... 83
Table 6-3 BoM of the redesigned LED table lamp ................................................................... 84
Table 7-1 Lighting software settings used for simulations ...................................................... 90
Table 8-1 The technical specification of the table lamp .......................................................... 97
Table 8-2 ReCiPe endpoint indicators description (Goedkoop et al., 2009) ........................... 99
Table 8-3 Key parameters for the materials .......................................................................... 101
Table 8-4 Key parameters of the processes........................................................................... 101
Table 8-5 Life cycle impact results of product stages under default scenario ...................... 104
Table 8-6 Sensitivity results, Impact analysis total results for scenarios .............................. 107
Table 8-7 Results per damage category ................................................................................. 109
Table 8-8 Results per impact category .................................................................................. 110
Table 9-1 List of social subcategories in PSILCA and social indicators .................................. 117
Table 9-2 Criteria for impact category and social indicator selection ................................... 121
Table 9-3 Domestic lighting product materiality matrix ........................................................ 123
Table 9-4 Technical specifications of the luminaire .............................................................. 124
Table 9-5 Life cycle inventory of ONA domestic lighting product ......................................... 127
Table 9-6 ONA’s social indicator specific data. Source: ONA and Spanish statistics ............. 130
Table 9-7 ONA’s risk level assessment matrix ....................................................................... 134
xiii
Table 9-8 PSILCA risk level weights. (PSILCA Social Life Cycle Impact Analysis method v1.00)
................................................................................................................................................ 140
Table 9-9 ONA´s LED domestic table lamp SLCA absolute results per impact indicator ....... 141
Table 9-10 Comparative results of the table lamp SLCA vs PSILCA reference sector ........... 145
Nomenclature
AoP Area of Protection
SLCA Social life cycle assessment
SROI Social Return on Investment
SIA Social Impact Assessment
SEIA Socio-Economic Impact Assessment
JRC Joint Research Centre
CEMS Certification in environmental management systems
WEEE Waste Electrical and Electronic Equipment
PCB Printed Circuit Board
PBB PolyBrominated Biphenyls
PBDE PolyBrominated Diphenyl Ether
RoHS Restriction of Hazardous Substances
ErP Energy-related Products
EoL End of Life
LCIA Life Cycle Impact Assessment
LCI Life Cycle Inventory
AoP Area of Protection
QALY Quality Adjusted Life Years
SHDB Social Hotspot Database
ASSIST Alliance for Solid State Illumination System and Technologies
PWM Pulse Width Modulation
VLE virtual learning environment
PDS Product Design Specification
EPD Environmental Product Declarations
xiv
CCT Correlated Colour Temperature
SROI Social Return on Investment
SEIA Socio-Economic Impact Assessment
15
Chapter 1: Introduction
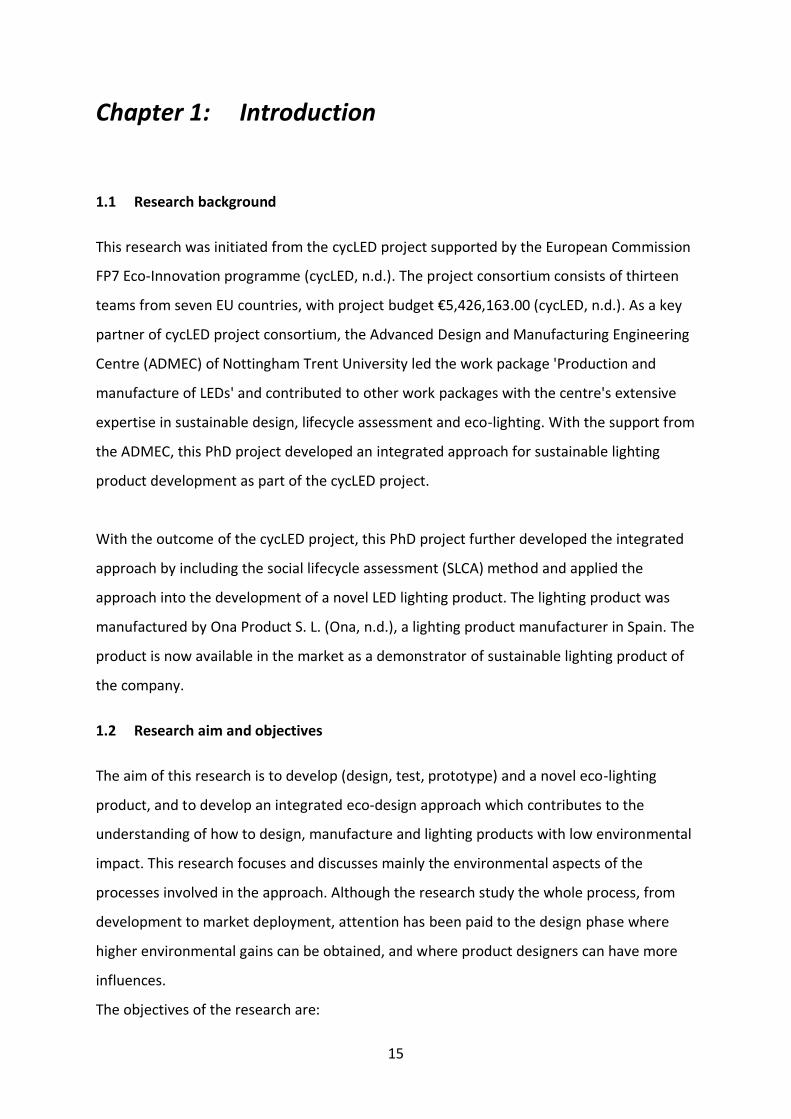
1.1 Research background
This research was initiated from the cycLED project supported by the European Commission
FP7 Eco-Innovation programme (cycLED, n.d.). The project consortium consists of thirteen
teams from seven EU countries, with project budget €5,426,163.00 (cycLED, n.d.). As a key
partner of cycLED project consortium, the Advanced Design and Manufacturing Engineering
Centre (ADMEC) of Nottingham Trent University led the work package 'Production and
manufacture of LEDs' and contributed to other work packages with the centre's extensive
expertise in sustainable design, lifecycle assessment and eco-lighting. With the support from
the ADMEC, this PhD project developed an integrated approach for sustainable lighting
product development as part of the cycLED project.
With the outcome of the cycLED project, this PhD project further developed the integrated
approach by including the social lifecycle assessment (SLCA) method and applied the
approach into the development of a novel LED lighting product. The lighting product was
manufactured by Ona Product S. L. (Ona, n.d.), a lighting product manufacturer in Spain. The
product is now available in the market as a demonstrator of sustainable lighting product of
the company.
1.2 Research aim and objectives
The aim of this research is to develop (design, test, prototype) and a novel eco-lighting
product, and to develop an integrated eco-design approach which contributes to the
understanding of how to design, manufacture and lighting products with low environmental
impact. This research focuses and discusses mainly the environmental aspects of the
processes involved in the approach. Although the research study the whole process, from
development to market deployment, attention has been paid to the design phase where
higher environmental gains can be obtained, and where product designers can have more
influences.
The objectives of the research are:
16
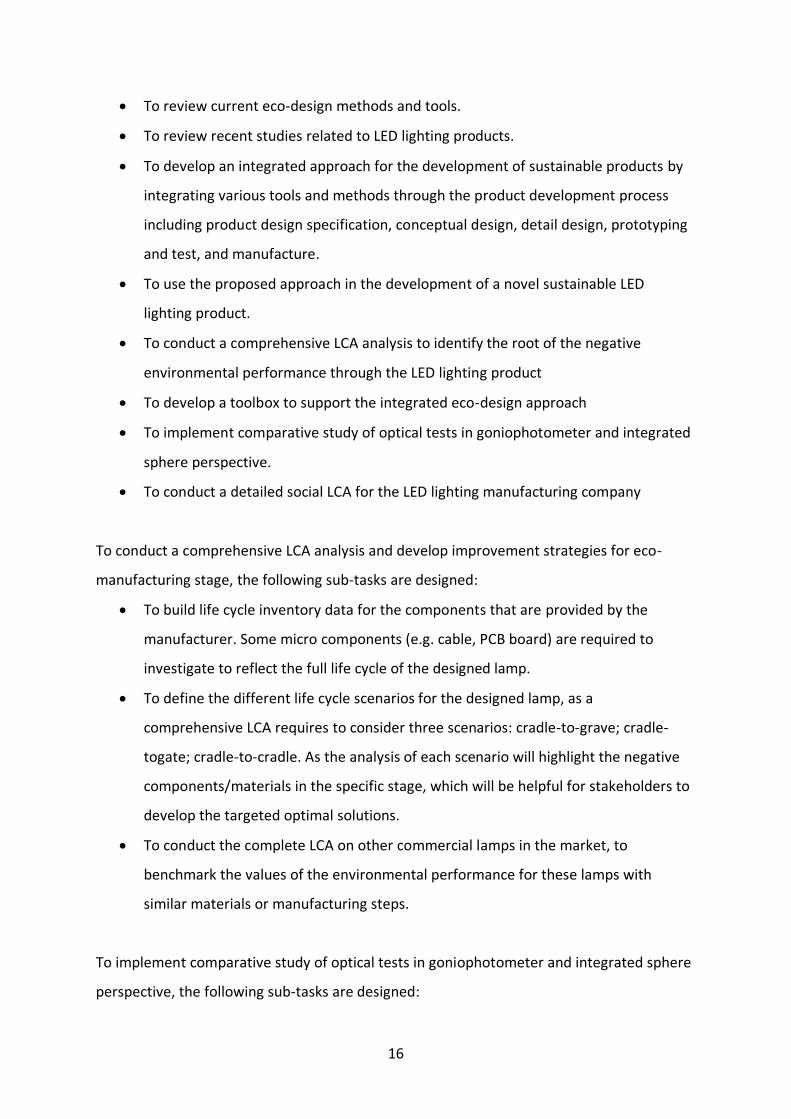
• To review current eco-design methods and tools.
• To review recent studies related to LED lighting products.
• To develop an integrated approach for the development of sustainable products by
integrating various tools and methods through the product development process
including product design specification, conceptual design, detail design, prototyping
and test, and manufacture.
• To use the proposed approach in the development of a novel sustainable LED
lighting product.
• To conduct a comprehensive LCA analysis to identify the root of the negative
environmental performance through the LED lighting product
• To develop a toolbox to support the integrated eco-design approach
• To implement comparative study of optical tests in goniophotometer and integrated
sphere perspective.
• To conduct a detailed social LCA for the LED lighting manufacturing company
To conduct a comprehensive LCA analysis and develop improvement strategies for eco-
manufacturing stage, the following sub-tasks are designed:
• To build life cycle inventory data for the components that are provided by the
manufacturer. Some micro components (e.g. cable, PCB board) are required to
investigate to reflect the full life cycle of the designed lamp.
• To define the different life cycle scenarios for the designed lamp, as a
comprehensive LCA requires to consider three scenarios: cradle-to-grave; cradle-
togate; cradle-to-cradle. As the analysis of each scenario will highlight the negative
components/materials in the specific stage, which will be helpful for stakeholders to
develop the targeted optimal solutions.
• To conduct the complete LCA on other commercial lamps in the market, to
benchmark the values of the environmental performance for these lamps with
similar materials or manufacturing steps.
To implement comparative study of optical tests in goniophotometer and integrated sphere
perspective, the following sub-tasks are designed:
17
• The goniophotometer and tests for the designed lamp are conducted and reported
in this thesis. The benchmarking values for the existing competitive LED products in
the market are needed to investigate, to ensure the lighting quality of the designed
lamp is acceptable by the market.
• Another key issue involved in these optical relates tests regards the harm to
consumers’ eyes that is usually caused by colour temperature of the luminaire. The
results indicator (i.e. lumens, colour rendering index) of integrated sphere test can
show the relevant qualities, which will be helpful in the iterated design stages.
To optimise the integrated approach, the following sub-tasks are designed:
• Through the complete design, prototyping and evaluating stages, the effectiveness
of the integrated approach may need further improve, for instance, weather the
suggested tool can perform the best functions in the allocated product development
process.
• To further improve the energy quality of the designed lighting product, a few
solutions will be proposed, including: adding the individual switch on/off on each
lighting module; developing light control further by considering the incorporation of
sensors (smart lighting) as standard, because they reduce the use of energy in all
types of lighting applications, although energy savings are higher when applied
lighting products that it will be used in public lighting applications.
• The integrated eco-design approach will be described and formalized in a step-by-
step process model in next stage. This model will focus in the design stage, in
particular, where decisions have the greatest effect in the final environmental
impact of the lighting product, and where all the major decisions about the life cycle
of the lighting product are carried out.
• Another sub-task should be carried out in the areas of eco-design tools used in
product design processes. In particular, the seamless integration of LCA
functionalities into product development process. Within this area, further
understanding about the relationship between LCA results and design decisions
(components, geometry, finish, etc.) will benefit to make the LCA results more
meaningful for product developers.
18
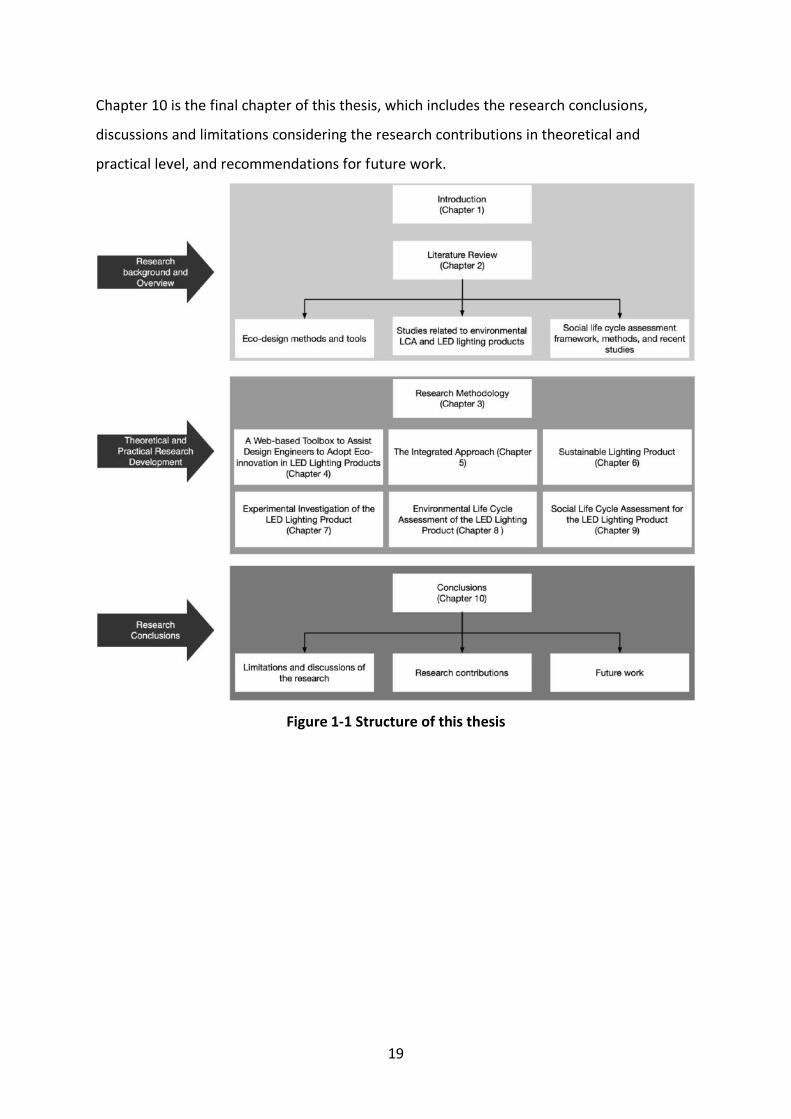
1.3 Structure of the thesis
This thesis is structured with three distinct sections: research background and overview;
theoretical and practical research development; and research conclusions as shown in
Figure 1-1. The first section, Research Background and Overview, provides an introduction
to the research, exploring the context of the sustainable product design, sustainability
performance assessment, and the LED lighting sector. Two chapters are included in this
section: Chapter 1 introduces the research context, research objectives and aims, describes
the overview of this thesis structure, Chapter 2 is a review chapter, which reviews the
relevant background of the designed research objectives and aim: eco-design methods and
tools, and examples of these tools and methods in the LED lighting studies; studies related
to environmental LCA and LED lighting products; social life cycle assessment framework,
methods, and recent studies.
The second section, Theoretical and Practical Research Development, consists of seven
chapters. As well as the development of a general research methodology, a series of
framework and methods the proposed solution are proposed, which are based on the
findings of the literature reviews. A web-based toolbox is developed for demonstrating the
application of the proposed integrated eco-design approaches. The validity of the proposed
approaches is then conducted by applying it in a real domestic LED table lamp. Chapter 3
offers the description of the research methodology in this research. Chapter 4 reports the
development of a web-based toolbox for the sustainable product development. Chapter 5
introduces the proposed integrated eco-design method, along with a case study
demonstrating the application, effectiveness and benefits of this approach are reported in
Chapter 6. Chapter 7 introduces the experimental analysis for the lighting characteristics ,
and Chapter 8 presents the a detailed environmental LCA for the designed LED table lamp.
The used datasets, explanations of calculation methods, and calculation results
interpretations are reported. Chapter 9 introduces a comprehensive social life cycle
assessment for the LED lighting company in the Spain.
19
Chapter 10 is the final chapter of this thesis, which includes the research conclusions,
discussions and limitations considering the research contributions in theoretical and
practical level, and recommendations for future work.
Figure 1-1 Structure of this thesis
20
Chapter 2: Literature Review
2.1 Eco-design methods
This section will introduce the recent studies linking the LCA and sustainable production
activities including the design, manufacturing, recycling. etc. Keller et al. introduced an
integrated life cycle sustainability assessment (ILCSA) methodology that combines the
outcomes of the LCA, life cycle costing, and social life cycle assessment. This study used the
ILCSA to examine the biorefineries production scenarios and demonstrated an ex-ante
decision support for the sustainability assessment (Keller et al. 2015). Lanfang et al.
developed a LCA based modelling approach, and Material Energy Flow Analysis (MEFA) was
integrated to identify the recoverable and unrecoverable resources in the more complex
product systems. The study examined the methodology with tracking the lifecycle iron and
energy use of producing construction steels (Lanfang et al. 2015). Ribeiro et al. integrated
the LCA, product design and supply chain framework to build an approach evaluating the
emerging sustainable manufacturing technologies, and this approach performs
environmental and economical level evaluation with the life cycle engineering foundation.
The study demonstrates the feasibility with evaluating innovative manufacturing
technologies (e.g. three-dimensional contoured thermoplastic sandwich structures) in the
bicycle rocker design process (Ribeiro et al. 2015). Shin et al. used LCA to acquire
quantitative results and integrate them into the process planning algorithm for assessing
green performance of machine operations, and a Green Productivity Index was developed
to represent overall environmental and productivity performance for the manufacturing
phase (Shin et al. 2015). Bernier et al. developed an optimal methodology that minimizes
costs to achieve zero life cycle impacts through integrating the LCA into a single or multi-
objective process design optimization scenarios. The study used Ecocosts 2007 impact
assessment method to evaluate compensation costs for reducing carbon dioxide emissions
of a natural gas combined cycle power plant (Bernier et al. 2013). Scheepens et al. used the
EVR and Circular Transition Framework to develop a new approach guiding the design of
sustainable business models, and the eco-costs was applied to analyse the environmental
impacts of business activities on a system level. The feasibility and utility of the approach
21
was demonstrated by a case study describing the recreation of a sustainable water tourist
system in Netherlands (Scheepens et al. 2015). Romli et al. developed an integrated eco-
designmaking (IEDM) methodology, and the LCA results were incorporated in the Eco-
Process model and conceptual Eco-QFD (quality function deployment) framework, in order
to offer quantitative and quality evidences to support sustainable product design (Romli et
al. 2014). Mestre & Vogtlander developed a design intervention method to increase the
customer perceived value, which used the eco-cost to examine the eco-burden and relative
values among multiple design solutions for cork products (Mestre & Vogtlander 2013).
Casamayor & Su used the eco-indicator 99 that is a LCA methodology to examine the
environmental performance of the main components of lighting products and their
production processes. The analytical results were used in benchmarking for each optimal
design iterations (Casamayor & Su 2013). Morales-Mora et al. examined the carbon
emissions and wastewater flow of manufacturing acrylonitrile products in Mexico, and the
LCA results were used to support that the new design of the production process has a major
emission reduction than the old design (Morales-Mora et al. 2012). The reviewed studies
prove that as a technological progression, the LCA enables to lead main production activities
into a sustainability level. This inspired the core idea of this research that the actors in the
same supply chain can contribute in building LCA or LCA based evaluations in terms of
providing required data and designing evaluation indicators, and the evaluation results are
shared and distilled into actions reducing the environmental burden.
2.2 Eco-design tools
The main difference between eco-design methods/approaches and traditional design
methods/approaches is that eco-design methods also take into consideration the
environmental impact of the product during the design process. Traditional design methods
and the tools rarely consider how to assess and reduce the environmental impact of
products, that is why additional eco-design tools have to be integrated in traditional design
processes.
22
2.2.1 Directives and regulations
Many mandatory directives and regulations are needed consider in an eco-design process of
lighting products. Main directives and regulations that affect lighting products are explained
below, which are needed to adopt in the eco-design process of lighting products:
Energy labelling directive (2010/30/EU) (European Commission, 2010):
This label specifies the lamp energy efficiency class the luminaire is compatible with, and
the energy efficiency class of the light source used is specified. The label also specifies
information for a LED luminaire with an integrated LED module that cannot be replaced by
the end consumer. It also contains the name or trademark of the supplier, the model ID of
the supplier (e. g. EAN code), a specification of the supplied or fitted light source, as well as
a scale of energy efficiency classes.
Eco-design directive (2005/125/EC) (European Commission, 2005):
The aim of the Eco-design Directive is to reduce (at the design stage) the energy
consumption and other negative environmental impacts of products. Although the primary
aim is to reduce energy use, it is also aimed to consider other factors that may influence the
environmental impact of the product such as materials use, water use, polluting emissions,
waste issues and recyclability.
Waste Electrical and Electronic Equipment (WEEE) recycling directive (European Comission,
2008a):
The WEEE directive requires producers and distributors to finance the collection, treatment
and recycling or reuse of WEEE. The aim of this directive is to address the environmental
impacts of WEEE and to encourage its separate collection and subsequent treatment, reuse,
recovery, recycling and environmentally sound disposal. It affects any importer, re-brander
or manufacturer of products that requires electricity for its main purpose. These will have to
finance the cost of: Collecting, treating (e.g. mercury in lamps, Printed Circuit Board (PCB)),
recovering and recycling products imported, re-branded or manufactured.
23
Restriction of Hazardous Substances (RoHS) directive (European Comission, 2008b):
This directive restricts the use of six hazardous substances: Lead (Pb), Mercury (Hg),
Cadmium (Cd), Hexavalent chromium (Cr6+), PolyBrominated Biphenyls (PBB) and
PolyBrominated Diphenyl Ether (PBDE), in products.
Energy-related Products (ErP) Directive 2009/125/EC (European Council, 2009):
The aim of this directive is to improve energy efficiency and environmental protection, it
applies to products that affect energy consumption throughout their life cycle. This directive
does not introduce directly binding requirements for specific product categories, but rather
outlines the conditions and criteria relating to environmental characteristics of products,
such as energy and water waste, or lifespan, so they can be improved quickly and efficiently.
It encourages manufacturers and/or importers to offer products designed to reduce their
overall impact on the environment, including the resources consumed during manufacture
and disposal. It applies to energy-related products that meet the following criteria: Are sold
in high quantities (over 200,000 units/year in the EU), have a significant environmental
impact and have a potential for improvement.
Packaging and Packaging waste directive (European Commission, 1994):
This directive affects any type of product that uses any type (primary/secondary) of
packaging. Its main objectives are: Reduce packaging material excess, eliminate/avoid
specific hazardous substances/materials, inform the consumers about the content of
product/packaging, reduce the amount of waste at end of life of the packaging,
increase/promote the re-use and recycle of packaging waste and inform the
producer/manufacturer about their responsibility to recuperate and recycle its packaging.
Lighting is governed by regulations that provide targets to be met in terms of light levels,
energy consumption and safety. Regulations do not cover all aspects of lighting, so there are
many supplementary guides available for different types of buildings and spaces that fill this
gap. There are also some regulations and guides relating to this report, together with other
standards and directives affecting lighting is provided on Appendix 1, with a primary focus
on the Europe.
24
2.2.2 Environmental impact assessment tools
Environmental impact assessment tools consider the whole life cycle of systems or products
in the assessments. This is necessary in order to assess the environmental impact of
materials, processes and activities involved during the whole product life cycle. Then,
impacts can be identified and reduction and/or elimination of these implemented.
Numerous environmental impact assessment tools have been developed (Finnveden and
Moberg, 2005) in order to assess and identify environmental impacts caused by products.
There are several types of tools that can assess quantitatively the environmental impact of
products. These types of tools are usually based on the LCA method and usually require
time and specialized knowledge and skills to apply them, which are reviewed and reported
in the following section.
It is a software developed for LCA consultants, engineers and product designers with
high/low (depending on version) expertise for highly detailed modelling and assessment of
the environmental impact of any general product system (product, process or activity)
produced in nearly any part of the world.
It is a software developed for engineers, designers and LCA consultants with high/low
expertise (depending on version), for highly (although simplified analysis is also possible)
detailed modelling and assessment of the environmental impact of any general product
system (product, process or activity) produced worldwide, as the databases have worldwide
coverage. It has its own Gabi database, and can have access to industry standard datasets
drawn from actual industry processes. It offers fourteen extension databases containing
datasets (8,000 datasets), as well as developed ad hoc datasets on
components/materials/processes.
It is a software developed for product designers to carry out environmental impact
assessment of any type of product produced in America, Asia and Australia (although it can
Simapro:
GaBi:
Sustainable minds:
25
also be used for estimated results in EU). It has its own database which is based on Impact
factors built with Ecoinvent and NREL North American Life Cycle Inventory databases.
It provides LCA functionality in a CAD software application. It can be considered a
‘screening’ tool although the databases and environmental impact assessment methods are
provided by Gabi (detailed LCA software-based tool). It can provide real-time assessment of
the products modelled in Solidworks. The results are shown based on 4 environmental
indicators: Air acidification, carbon footprint, total energy consumed and water
eutrophication.
One of the disadvantages of this tool is that product designers need to model this product in
Solidworks, which means that product designers that use another CAD software cannot use
it. Another disadvantage is that this tool does not allow a complete detailed LCA, and the
number of functionalities and assessment possibilities that are possible with LCA software-
based tools such as SimaPro or Gabi are not possible.
Some LCA-based software tools are not available in English or they were developed long
time ago but have not been updated or are in use anymore, so only tools currently available
and updated relevant for product developers have been included in this section. Simapro
and Gabi are detailed LCA software-based tools, and Sustainable Minds is a Screening LCA
software-based tool. Simapro and Gabi are well-known tools that allow comprehensive
detailed environmental impact assessment of products and processes. Both have up-to-date
databases and Life Cycle Impact Assessment (LCIA) methods and are available in several
languages and versions. These are both recommended for detailed environmental impact
assessment for product developers. Sustainable Minds is the only active and up to date
screening LCA software-based tool available for product developers at the moment.
2.3 Life Cycle Assessment
One advantage of LCA is that it has an international standard, ISO14040 (ISO, 2006b), which
sets out guidelines for consistency of method and interpretation. Useful outcomes of LCA
include discovering hotspots within supply chains where the largest impacts occur and
Solidworks-Sustainability:
26
tracking improvement over time (Acquaye et al., 2011). LCA is a flexible and transparent
tool and using consequential LCA allows the assessment of various scenarios in order to
pinpoint changes in environmental impact reductions corresponding to changes.
The literature shows that the Process LCA that follow the International Standard
Organisation’s (ISO) 14040 four phases: 1) goal and scope definition; 2) inventory analysis;
3) impact assessment and; 4) interpretation (ISO, 2006b).
The Life Cycle Inventory (LCI) is the second phase which involves collection of the
background data and which can be time consuming (VROM, 2000). The LCIA is the third
phase in which the boundaries and data in the LCI are applied to the specific product or
system under review. This can inform decisions such as whether energy use in a factory
should be attributed evenly across all the items that were produced or by the number of
hours it took to make each specific product. Life cycle interpretation is the final phase
during which a summary of the results in the LCIA is given in accordance with the goal and
scope definition. In this stage, weighting and grouping can provide a further degree of
inconsistency between LCAs (Ahlroth et al., 2011). LCA are used in this research following
these standards to quantify the environmental emissions and attempts are made to identify
any limitations and drawbacks of the methodologies used.
In order for a company to manage its environmental performance it needs to be able to
identify and measure its environmental impact. Depending on industry and companies,
different additional needs can occur. Some industries may face political targets or are
required to measure specific emissions regarding the specific products, (e.g. toxicity in ICT
or GHG in agriculture). This practical factor requires the consideration towards the specific
impact associated with the selected product in this research project. Hence, there is need to
select indicator/indicators for the system proposed in this research project.
2.3.1 LCA studies related to LED lighting products
The material contents of indicator-type LED components of various colours have been
studied by Lim et al. Their leachability tests proposed that the LED components – varying by
27
the colour of the LED – may contain copper, lead, nickel and silver so much that some of the
indicator LEDs are classified as hazardous (Lim et al., 2010).
Dubberley et al. analysed the environmental impacts of an intelligent lighting system for
commercial buildings in the US. The lighting system consisted of a sensor, wireless network,
ballast and batteries. Their main finding was that the potential environmental impacts of an
intelligent system are significantly lower (18 to 344 times smaller) compared to a
conventional lighting system (Dubberley, Agogino and Horvath, 2004). A fluorescent lamp
was the subject of a non-comparative LCA by Techato et al. They calculated the amount of
waste from fluorescent lamps and an air-conditioner. The analysis of the fluorescent lamp
resulted in a significant amount of hazardous waste compared to bulk waste, but the
amount of any type of waste was very low compared to the total weight of the lamp.
However, the amount of hazardous waste became relevant when the scope is widened to
national (Techato, Watts and Chaiprapat, 2009). The ballasts for fluorescent lamps have
been analysed by scholars (Valkama and Keskinen, 2008) (Bakri, Ramasamy and Surif, 2010).
Both of the LCAs concluded that the use-stage energy consumption was the major
environmental aspect. Valkama and Keskinen stated also that the use of simplified LCA may
cause significant changes in the LCA results of the electronic products.
The primary energy consumption for manufacturing of one LED-lamp to 9.9 kWh are also
studied (Semiconductors, 2009). The fabrication of the LED-packages has a share of 30%.
The LED-chip was fabricated in Germany (frontend) and Malaysia (backend) and the final
production of the LED-lamp in China. It was assumed that the production of 1 kWh of
electricity requires 3.3 kWh primary energy.
The study calculated the lamp assembly by adding 10% of the production data.
Transportation was estimated with 8000 miles (12,875 km) by ocean-going freighter and
4000 miles (6437 km) by light duty truck. The author states the problem that countries with
increasing energy efficiency or renewable electricity production tend to outsource the
manufacturing emissions to foreign countries with carbon intensive electricity mixes and
there is no research about the imported embedded energy of products. This fact leads to
distortion of the domestic emission inventories of up to 20% (Quirk, 2009).
28
The end-of-life of LED lamps and luminaires was studied by Hendrickson et al. They stated
that it is possible to reduce the environmental impacts of a solid-state lighting product by
implementing design for end-of-life in the product development, e.g., by facilitating the
disassembly and enabling the recovery of components, parts and materials to be reused or
remanufactured (Hendrickson et al., 2010).
Welz et al. conducted a comparative life cycle assessment study for four different lighting
technologies (Welz, Hischier and Hilty, 2011). Although no LED-lamp was assessed, the study
results are relevant for this review due to the fact that there are environmental impact
results of linear fluorescent lamps. They are rarely compared in comparative life cycle
assessment studies on LED-lamps despite of their good environmental performance. The
external electronic ballast was included, but the luminaire was not considered. The results
of the study show that the manufacturing impact of the linear fluorescent lamp has a share
of 8% (Swiss mix) and 2% (European UCTE mix) of the total life cycle impact. Abdul Hadi et
al. compared two lamps with a lifetime dependent luminous flux of 25,000 lm–17,500 lm
(CMH lamp) and 19,000 lm15,000 lm (LED lamp). These two lamps were considered as
equally. The mean luminous flux of the LED-lamp with 17,000 lm is 15% lower than of the
CMH lamp with 20,000 lm (GE Lighting, 2011). The study defines that the LED lamp matches
the minimum luminous flux of the CMH lamp at the end of the lifetime. Increasing the
calculation values of the LED-lamp by 15% to an equal mean level of the CMH lamp, the eco-
indicator damage points are close to each other (Hadi et al., 2013).
A life cycle assessment of two lighting technologies based on compact fluorescent (CFL) and
Light Emitting Diode (LED) luminaires for the general lighting of the office is studied. The life
cycle assessments are carried out considering all the parts of the luminaire: lamp, housing
and ballast (or driver for LED). The environmental impact is evaluated considering the whole
life cycle of the devices, from manufacturing (including the extraction of raw materials), to
use and disposal. An experimental test was conducted to verify the illuminance produced by
the two systems. The life cycle assessments show that the LED luminaire allows the
environmental impacts to be significantly reduced (reduction of 41% of greenhouse gas
emission and cumulative energy demand), mainly due to high energy efficiency in the use
stage (Principi and Fioretti, 2014).
29
This paper undertakes a series of Life Cycle Assessments on two alternative lighting choices
(Light Emitting Diodes and Compact Florescent Lamps) under a range of use conditions. It
was found that the environmental impacts were comparable for CFLs and LEDs, though
significantly less than traditional incandescent, for a range of different use cases. The
sensitivity analysis carried out shows that the variation in lamp parameters has a far greater
effect on the lifecycle impact rather than the use patterns (Yu, Soo and Doolan, 2016).
GHG emissions of compact fluorescent lamps with linear fluorescent lamps using life cycle
assessment method in China's national conditions was studied. The GHG emissions of
fluorescent lamps from their manufacture to the final disposal phase on the national level of
China were also quantified. The results indicate that the use phase dominates the GHG
emissions for both lamps. Linear fluorescent lamp is a better source of light compared to
compact fluorescent lamp with respect to GHG emissions (Chen, Zhang and Kim, 2017).
The comparative LCA results showed that, overall, improved luminaire had about 60% or
less environmental impact than luminaire with conventional design in all midpoint impact
categories in all scenarios, mainly due to the higher luminous efficacy of the improved
version. It is estimated that approximately 84 kg of CO 2 could be saved per luminaire per
year if the improved version luminaire was used instead of L1 (Casamayor, Su and Ren,
2018).
2.3.2 Social Life Cycle Assessment (SLCA)
LCA is often considered to be a valuable support tool in integrating sustainability into
product design and evaluation of products due to its systematic approach. Environmental
LCA, hereafter referred as ELCA, is primarily considers environmental impacts along supply
chains, from extraction of raw materials to the End-of-Life of products. Social life cycle
assessment (SLCA) shares the life cycle perspective with environmental LCA and integrates
traditional environmental LCA methodological steps while having social impacts as focus.
Similar to ELCA, SLCA adopted the same framework which is comprised of four main steps:
goal and scope, life cycle inventory analysis, life cycle impact assessment, and
interpretation.
30
O’Brien et al. first raised the notion of accompanying ELCA with social considerations
assessment (O’Brien, Doig and Clift, 1996). Kloffer and Weidema advanced the idea further
by proposing ways to integration and alignment of SLCA with ELCA (Klöpffer, 2003;
Weidema, 2006). Various indicators have been proposed and implemented, for instance,
Quality Adjusted Life Years (QALY) (Weidema, 2006), additional employment (Hunkeler,
2006), and health impacts (Norris, 2006). Dreyer et al. proposed a site-specific assessment
where impacts are directly related to company behaviour (Dreyer, 2006).
In 2009, the SLCA guidelines were issued (Benoît et al., 2009). The guidelines are formulated
by an open global process involving stakeholders from public, academic, and business
sectors. The guidelines are currently the most established and well-used framework for
conducting SLCA. It is a framework with guidelines on several approaches, it is by no means
an established tool like its ELCA counterpart. Furthermore, SLCA does not determine
whether a product should be made, nor does it provide recommendations on addressing
any identified social impacts. It only provides a ‘snapshot’ to support decisions on the
production of products.
2.3.2.1 Methodology of social life cycle assessment
The assessment boundary of SLCA is set in relation to an Area of Protection (AoP). AoP is
indicated to be human well-being in the case of SLCA, which, according to the guidelines, is
described as the state of an individual’s life situation. Impacts on human well-being are
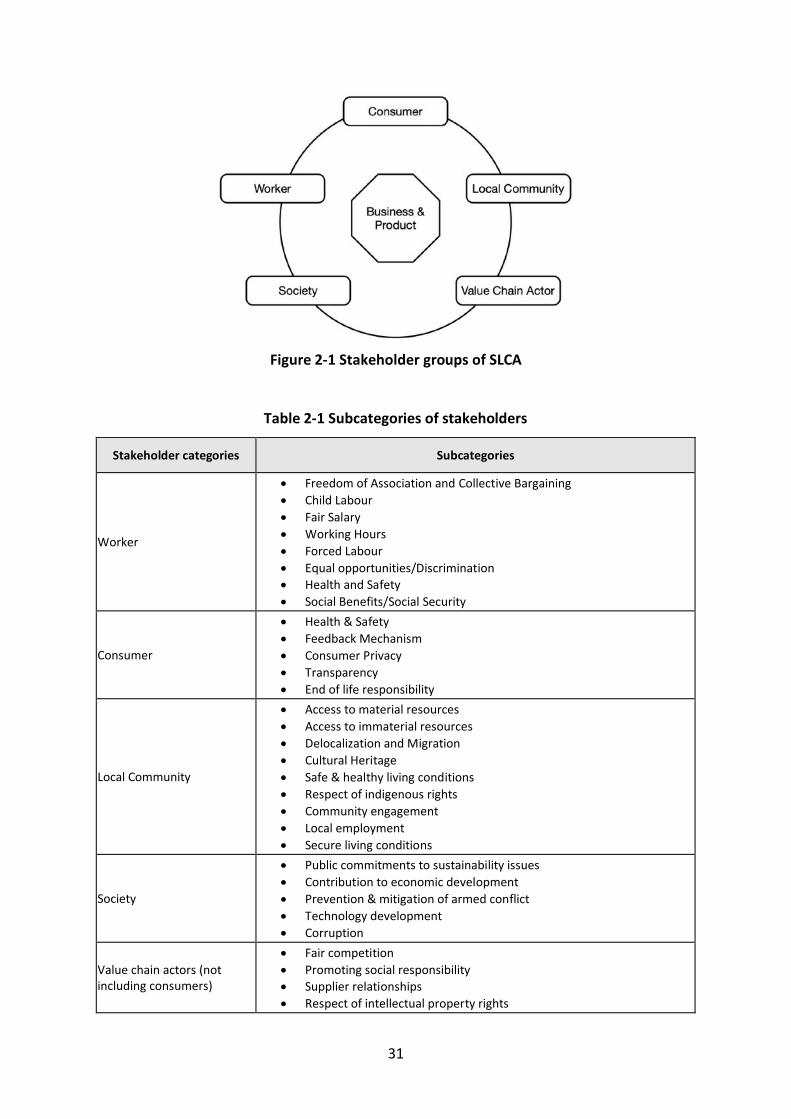
assessed in connection to five stakeholder groups that are affected potentially. Figure 2-1
illustrates these stakeholders which are worker, local community, value chain actor, society,
and consumer (Benoît et al., 2009). It is worth of note that the consumer stakeholder is only
included in scenarios of retail interaction, whilst impacts during use phase (the core purpose
of a product or service) are not considered. Each stakeholder is associated with a number of
subcategories, such as fair salary, working hours, and health and safety for the worker
stakeholder, and cultural heritage, local employment, and community engagement for the
local community stakeholder. All the stakeholders along with their relating subcategories
are presented in Table 2-1 (Benoît et al., 2009).
31
Figure 2-1 Stakeholder groups of SLCA
Table 2-1 Subcategories of stakeholders
Stakeholder categories Subcategories
Worker
• Freedom of Association and Collective Bargaining
• Child Labour
• Fair Salary
• Working Hours
• Forced Labour
• Equal opportunities/Discrimination • Health and Safety
• Social Benefits/Social Security
Consumer
• Health & Safety
• Feedback Mechanism
• Consumer Privacy
• Transparency
• End of life responsibility
Local Community
• Access to material resources
• Access to immaterial resources
• Delocalization and Migration
• Cultural Heritage
• Safe & healthy living conditions
• Respect of indigenous rights
• Community engagement
• Local employment
• Secure living conditions
Society
• Public commitments to sustainability issues
• Contribution to economic development
• Prevention & mitigation of armed conflict
• Technology development
• Corruption
Value chain actors (not including consumers)
• Fair competition
• Promoting social responsibility
• Supplier relationships
• Respect of intellectual property rights
32
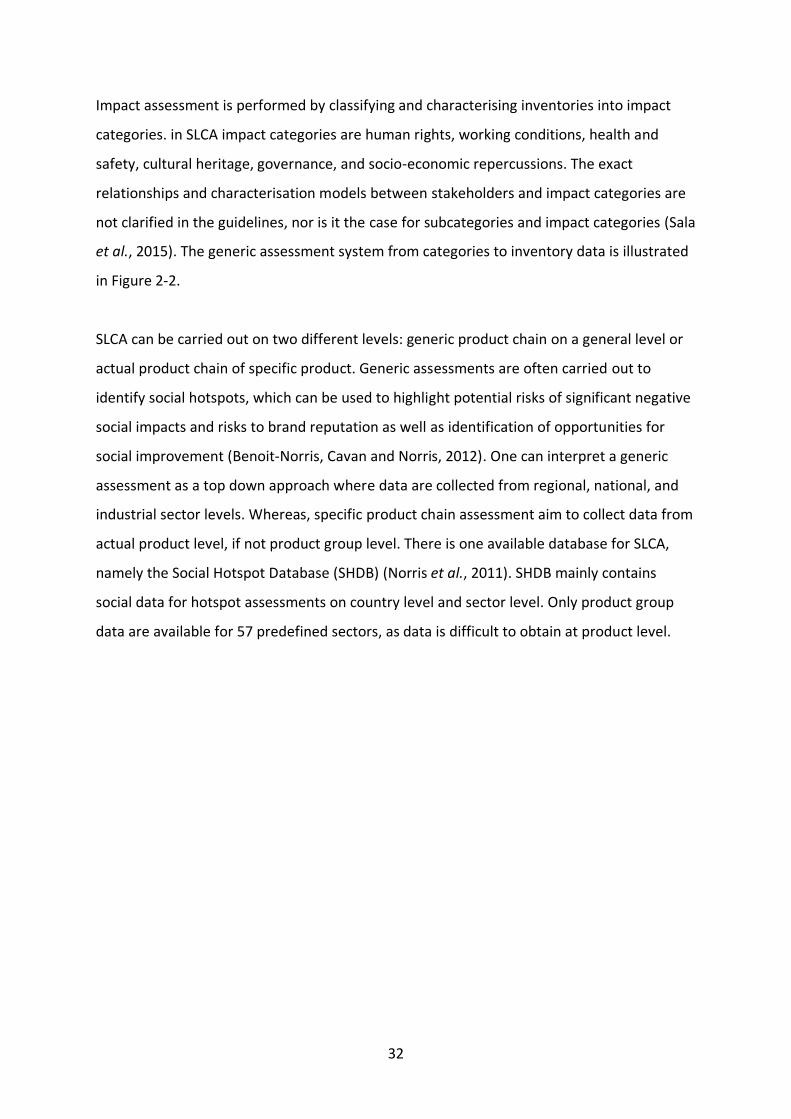
Impact assessment is performed by classifying and characterising inventories into impact
categories. in SLCA impact categories are human rights, working conditions, health and
safety, cultural heritage, governance, and socio-economic repercussions. The exact
relationships and characterisation models between stakeholders and impact categories are
not clarified in the guidelines, nor is it the case for subcategories and impact categories (Sala
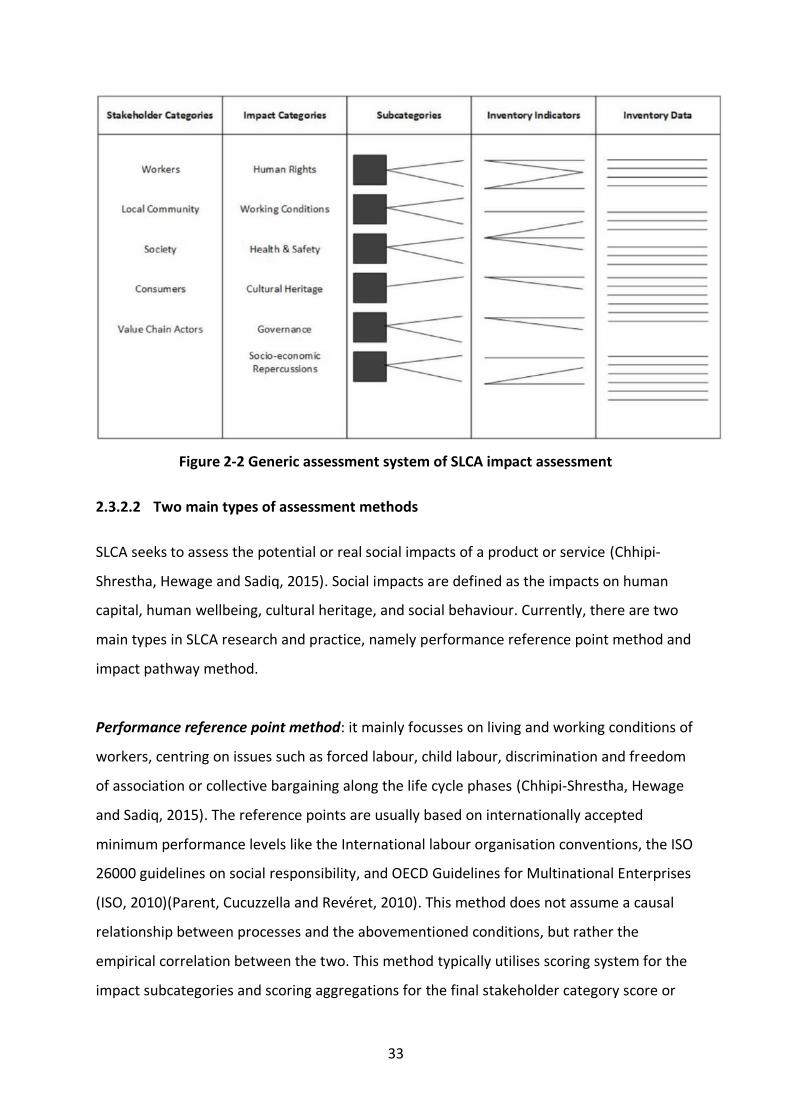
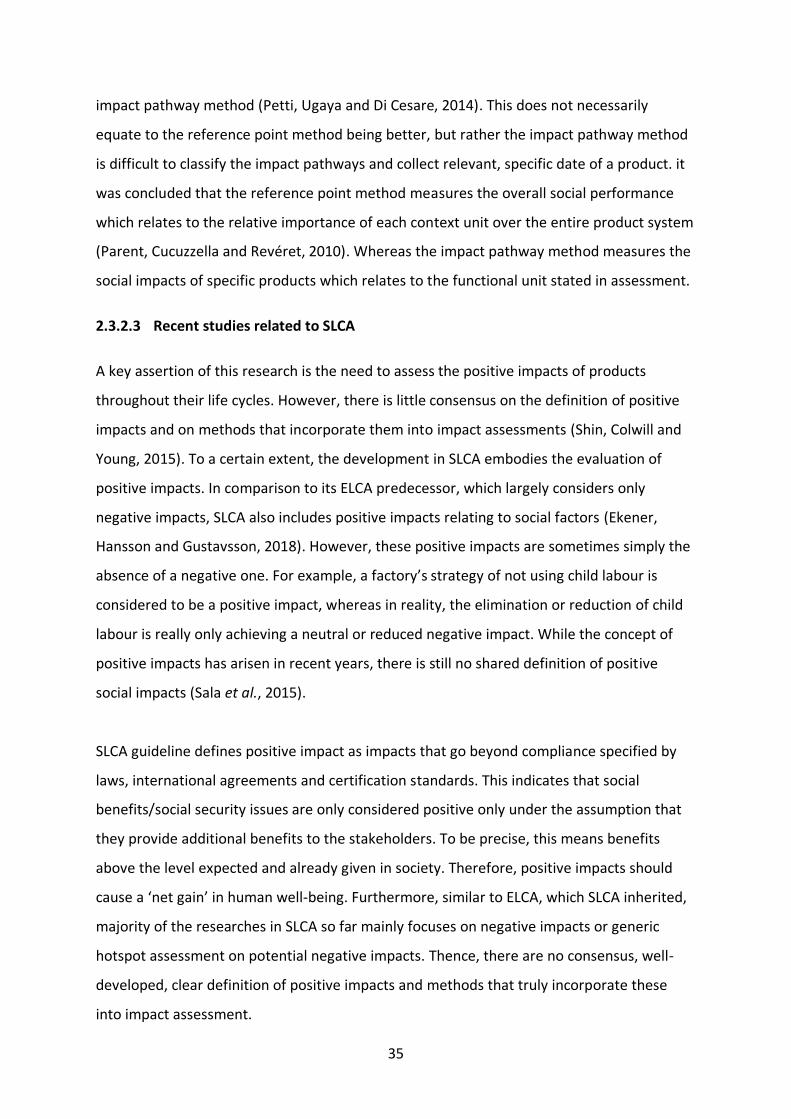
et al., 2015). The generic assessment system from categories to inventory data is illustrated
in Figure 2-2.
SLCA can be carried out on two different levels: generic product chain on a general level or
actual product chain of specific product. Generic assessments are often carried out to
identify social hotspots, which can be used to highlight potential risks of significant negative
social impacts and risks to brand reputation as well as identification of opportunities for
social improvement (Benoit-Norris, Cavan and Norris, 2012). One can interpret a generic
assessment as a top down approach where data are collected from regional, national, and
industrial sector levels. Whereas, specific product chain assessment aim to collect data from
actual product level, if not product group level. There is one available database for SLCA,
namely the Social Hotspot Database (SHDB) (Norris et al., 2011). SHDB mainly contains
social data for hotspot assessments on country level and sector level. Only product group
data are available for 57 predefined sectors, as data is difficult to obtain at product level.
33
Figure 2-2 Generic assessment system of SLCA impact assessment
2.3.2.2 Two main types of assessment methods
SLCA seeks to assess the potential or real social impacts of a product or service (Chhipi-
Shrestha, Hewage and Sadiq, 2015). Social impacts are defined as the impacts on human
capital, human wellbeing, cultural heritage, and social behaviour. Currently, there are two
main types in SLCA research and practice, namely performance reference point method and
impact pathway method.
Performance reference point method: it mainly focusses on living and working conditions of
workers, centring on issues such as forced labour, child labour, discrimination and freedom
of association or collective bargaining along the life cycle phases (Chhipi-Shrestha, Hewage
and Sadiq, 2015). The reference points are usually based on internationally accepted
minimum performance levels like the International labour organisation conventions, the ISO
26000 guidelines on social responsibility, and OECD Guidelines for Multinational Enterprises
(ISO, 2010)(Parent, Cucuzzella and Revéret, 2010). This method does not assume a causal
relationship between processes and the abovementioned conditions, but rather the
empirical correlation between the two. This method typically utilises scoring system for the
impact subcategories and scoring aggregations for the final stakeholder category score or
34
impact category score. The scoring methods can be two levels (e.g. yes or no, or 1 or 0)
(Aparcana and Salhofer, 2013; Foolmaun and Ramjeeawon, 2013) or multi-level (Dreyer,
2006; Hutchins and Sutherland, 2008; Ciroth and Franze, 2011; Ekener-Petersen and
Finnveden, 2013). However, the utilisation of subcategories can raise questions regarding
whether the subcategories are positive or negative in nature.
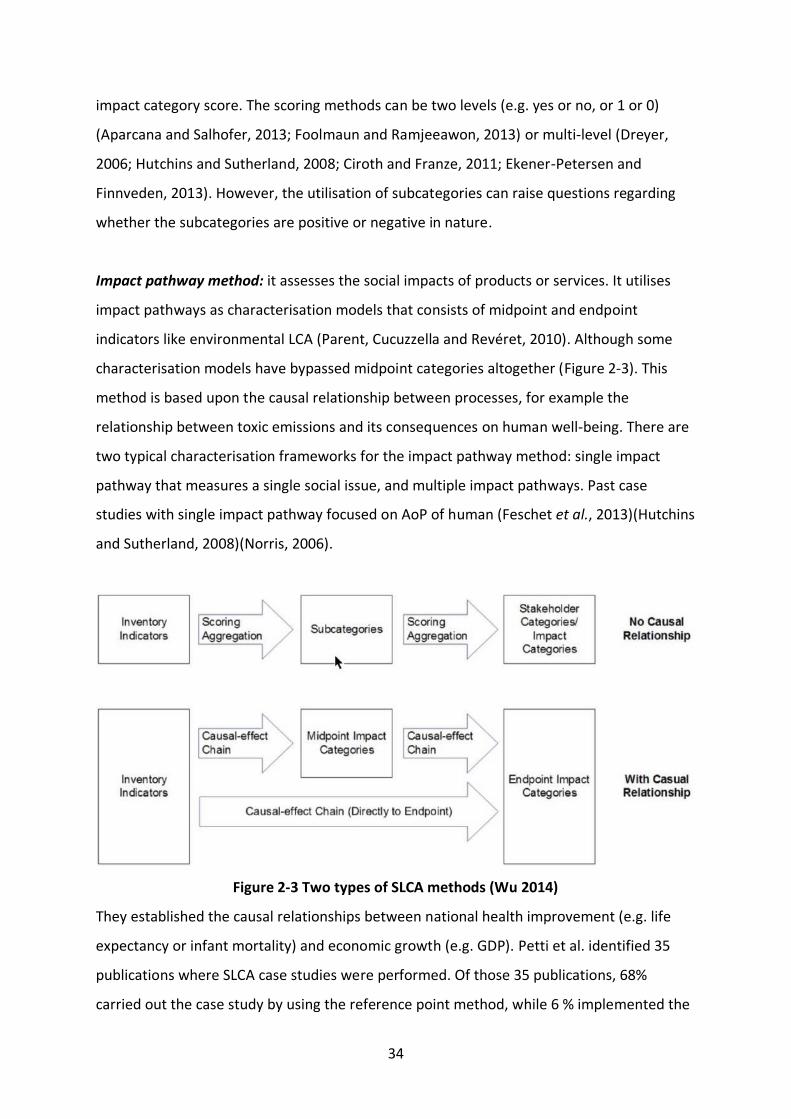
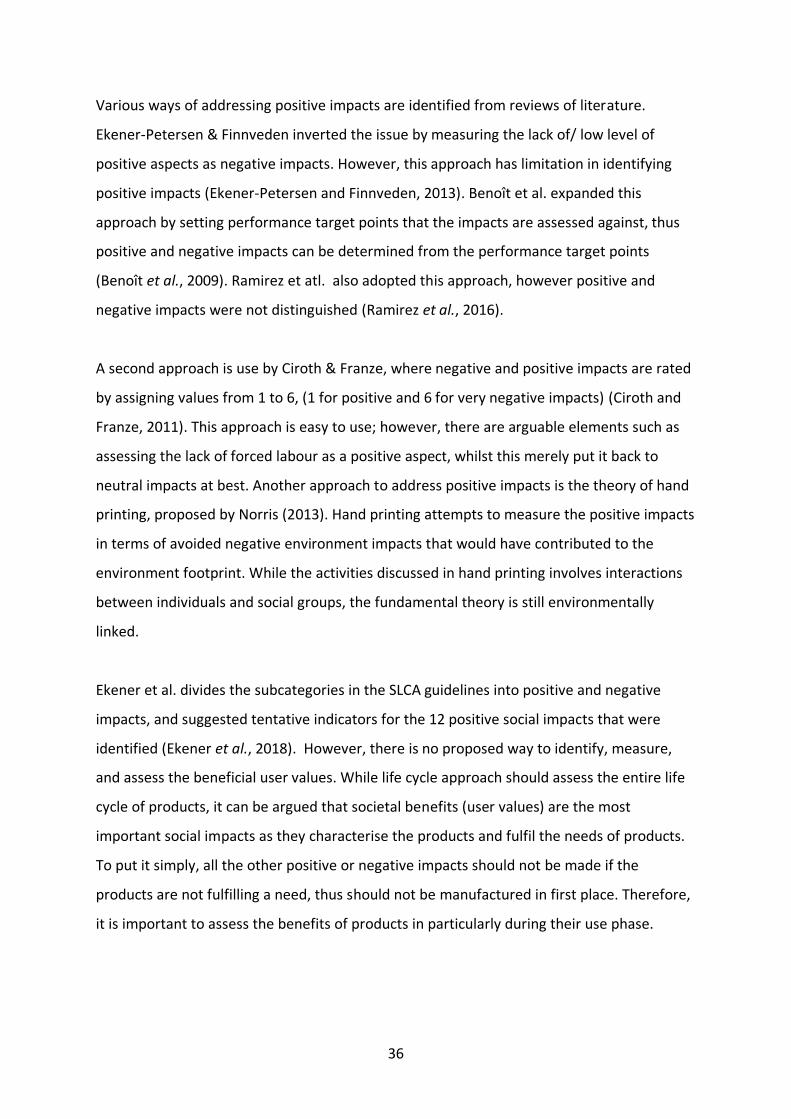
Impact pathway method: it assesses the social impacts of products or services. It utilises
impact pathways as characterisation models that consists of midpoint and endpoint
indicators like environmental LCA (Parent, Cucuzzella and Revéret, 2010). Although some
characterisation models have bypassed midpoint categories altogether (Figure 2-3). This
method is based upon the causal relationship between processes, for example the
relationship between toxic emissions and its consequences on human well-being. There are
two typical characterisation frameworks for the impact pathway method: single impact
pathway that measures a single social issue, and multiple impact pathways. Past case
studies with single impact pathway focused on AoP of human (Feschet et al., 2013)(Hutchins
and Sutherland, 2008)(Norris, 2006).
Figure 2-3 Two types of SLCA methods (Wu 2014)
They established the causal relationships between national health improvement (e.g. life
expectancy or infant mortality) and economic growth (e.g. GDP). Petti et al. identified 35
publications where SLCA case studies were performed. Of those 35 publications, 68%
carried out the case study by using the reference point method, while 6 % implemented the
35
impact pathway method (Petti, Ugaya and Di Cesare, 2014). This does not necessarily
equate to the reference point method being better, but rather the impact pathway method
is difficult to classify the impact pathways and collect relevant, specific date of a product. it
was concluded that the reference point method measures the overall social performance
which relates to the relative importance of each context unit over the entire product system
(Parent, Cucuzzella and Revéret, 2010). Whereas the impact pathway method measures the
social impacts of specific products which relates to the functional unit stated in assessment.
2.3.2.3 Recent studies related to SLCA
A key assertion of this research is the need to assess the positive impacts of products
throughout their life cycles. However, there is little consensus on the definition of positive
impacts and on methods that incorporate them into impact assessments (Shin, Colwill and
Young, 2015). To a certain extent, the development in SLCA embodies the evaluation of
positive impacts. In comparison to its ELCA predecessor, which largely considers only
negative impacts, SLCA also includes positive impacts relating to social factors (Ekener,
Hansson and Gustavsson, 2018). However, these positive impacts are sometimes simply the
absence of a negative one. For example, a factory’s strategy of not using child labour is
considered to be a positive impact, whereas in reality, the elimination or reduction of child
labour is really only achieving a neutral or reduced negative impact. While the concept of
positive impacts has arisen in recent years, there is still no shared definition of positive
social impacts (Sala et al., 2015).
SLCA guideline defines positive impact as impacts that go beyond compliance specified by
laws, international agreements and certification standards. This indicates that social
benefits/social security issues are only considered positive only under the assumption that
they provide additional benefits to the stakeholders. To be precise, this means benefits
above the level expected and already given in society. Therefore, positive impacts should
cause a ‘net gain’ in human well-being. Furthermore, similar to ELCA, which SLCA inherited,
majority of the researches in SLCA so far mainly focuses on negative impacts or generic
hotspot assessment on potential negative impacts. Thence, there are no consensus, well-
developed, clear definition of positive impacts and methods that truly incorporate these
into impact assessment.
36
Various ways of addressing positive impacts are identified from reviews of literature.
Ekener-Petersen & Finnveden inverted the issue by measuring the lack of/ low level of
positive aspects as negative impacts. However, this approach has limitation in identifying
positive impacts (Ekener-Petersen and Finnveden, 2013). Benoît et al. expanded this
approach by setting performance target points that the impacts are assessed against, thus
positive and negative impacts can be determined from the performance target points
(Benoît et al., 2009). Ramirez et atl. also adopted this approach, however positive and
negative impacts were not distinguished (Ramirez et al., 2016).
A second approach is use by Ciroth & Franze, where negative and positive impacts are rated
by assigning values from 1 to 6, (1 for positive and 6 for very negative impacts) (Ciroth and
Franze, 2011). This approach is easy to use; however, there are arguable elements such as
assessing the lack of forced labour as a positive aspect, whilst this merely put it back to
neutral impacts at best. Another approach to address positive impacts is the theory of hand
printing, proposed by Norris (2013). Hand printing attempts to measure the positive impacts
in terms of avoided negative environment impacts that would have contributed to the
environment footprint. While the activities discussed in hand printing involves interactions
between individuals and social groups, the fundamental theory is still environmentally
linked.
Ekener et al. divides the subcategories in the SLCA guidelines into positive and negative
impacts, and suggested tentative indicators for the 12 positive social impacts that were
identified (Ekener et al., 2018). However, there is no proposed way to identify, measure,
and assess the beneficial user values. While life cycle approach should assess the entire life
cycle of products, it can be argued that societal benefits (user values) are the most
important social impacts as they characterise the products and fulfil the needs of products.
To put it simply, all the other positive or negative impacts should not be made if the
products are not fulfilling a need, thus should not be manufactured in first place. Therefore,
it is important to assess the benefits of products in particularly during their use phase.
37
2.4 Characteristic of LED lighting products
2.4.1 Working mechanisms of LED
An LED light source is a small chip comprised of layers of semi-conducting material. LED
packages may contain just one chip or multiple chips that are mounted on a heat
conducting material called a heat sink and all enclosed in a lens. This LED device can be used
separately or in arrays to produce light. LEDs when mounted on a circuit board can be
programmed to include lighting controls such as dimming, light sensing and pre-set timing.
The circuit board is mounted on another heat sink to handle the heat from all the LEDs in
the array. The system is then encased in a lighting fixture or an ‘LED bulb’ package.
The working mechanism of an LED to produce light lies in the semiconducting material it is
made of. An LED consists of a chip made of a semiconducting material. The material is
usually doped with some impurities in order to create the P-N junctions, which are made of
p-type and n-type semiconductor materials placed in contact with each other. For other
types of diodes, current tends to flow easily from the anode or the P-side to the N-side, also
known as the cathode. However, this does not take place in the reverse. This process is
what makes it possible for the semiconductor to function as a LED (Humphreys, 2008). Holes
and electrons, also known as charge carriers, flow into the P-N junction directly carrying
different voltages. The moment the electron meets the hole, it falls into a low energy level
thus causing it to release some energy. This kind of energy is released in the form of
photons.
In the emission of light from an LED, the wavelength is crucial, as it determines the colour
temperature of the light produced. The colour of the LED will usually depend on the band
gap of the material that is used in the formation of the P-N junction. In germanium or silicon
diodes, the holes and electrons recombine through the use of non-radiative transition
(Craford, 2008). That being the case, it is important to note that the materials that have
been used for the LED will always have a direct band gap such that they have energies that
correspond to visible, near infrared, or near ultraviolet lights.
38
With advances in material science, it has been possible to have other devices with shorter
wavelengths and as a result being able to emit different colours of light. Such lights are
therefore applied uniquely based on the intended purpose. The LEDs are built mainly on the
N-type substrate such that the electrode has been attached to the P-type that is deposited
as a layer on the surface. The majority of LEDs used for commercial purposes are known to
use different substrates such as sapphire. As discussed above, it is worth noting that the
materials used, and the junction determine the light-optical characteristics and therefore
applying them accordingly is important in order for the LED to meet the characteristics
required for the intended purpose.
2.4.2 LED lamp life
As it would take years to test the real life of LEDs, and by then such products would be
surpassed by other LEDs, estimations on LED life are made through laboratory testing. Due
to the long expected life of LEDs and their lumen depreciation, the concept of ‘Useful LED
Life’ has been proposed by the Alliance for Solid State Illumination System and Technologies
(ASSIST), a group led by the Lighting Research Centre, of Ranssellaer University, New York.
This is the point at which light output has reduced to a specific percentage of the original.
For decorative applications, this would be L 50 (i.e. time taken until lumens have reduced to
50% of the original). For the case of general lighting, that is more relevant to this thesis, L70
is proposed as research has shown that most occupants in an office environment would not
perceive a gradual reduction over time of 30% in general illumination (Rea, 2004).
Most manufacturers are quoting lifetime figures of 50,000 hours, or even 100,000 hours
(see Table 2-2), but these figures are yet to be measured in the field, hence it is important at
this early stage of LED technology to be more cautions on such figures. In any case though,
LEDs appear to offer longer lifetimes than existing light sources.
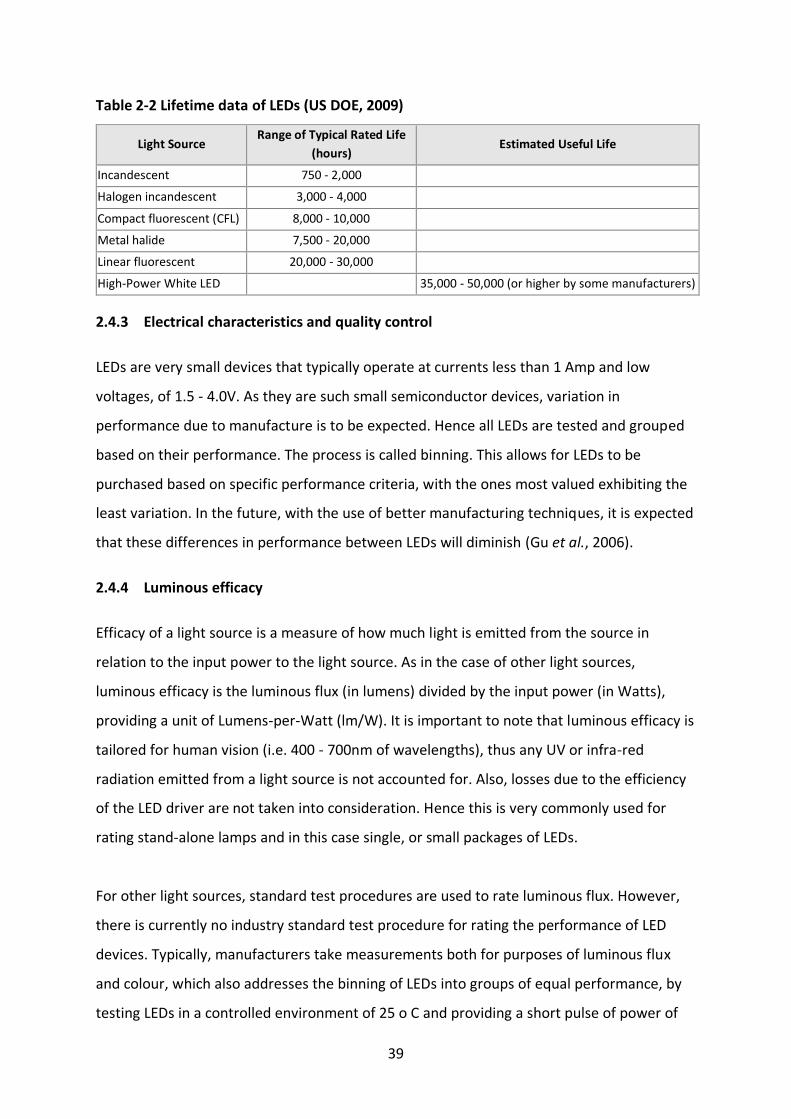
39
Table 2-2 Lifetime data of LEDs (US DOE, 2009)
Light Source Range of Typical Rated Life
(hours) Estimated Useful Life
Incandescent 750 - 2,000
Halogen incandescent 3,000 - 4,000
Compact fluorescent (CFL) 8,000 - 10,000
Metal halide 7,500 - 20,000
Linear fluorescent 20,000 - 30,000
High-Power White LED 35,000 - 50,000 (or higher by some manufacturers)
2.4.3 Electrical characteristics and quality control
LEDs are very small devices that typically operate at currents less than 1 Amp and low
voltages, of 1.5 - 4.0V. As they are such small semiconductor devices, variation in
performance due to manufacture is to be expected. Hence all LEDs are tested and grouped
based on their performance. The process is called binning. This allows for LEDs to be
purchased based on specific performance criteria, with the ones most valued exhibiting the
least variation. In the future, with the use of better manufacturing techniques, it is expected
that these differences in performance between LEDs will diminish (Gu et al., 2006).
2.4.4 Luminous efficacy
Efficacy of a light source is a measure of how much light is emitted from the source in
relation to the input power to the light source. As in the case of other light sources,
luminous efficacy is the luminous flux (in lumens) divided by the input power (in Watts),
providing a unit of Lumens-per-Watt (lm/W). It is important to note that luminous efficacy is
tailored for human vision (i.e. 400 - 700nm of wavelengths), thus any UV or infra-red
radiation emitted from a light source is not accounted for. Also, losses due to the efficiency
of the LED driver are not taken into consideration. Hence this is very commonly used for
rating stand-alone lamps and in this case single, or small packages of LEDs.
For other light sources, standard test procedures are used to rate luminous flux. However,
there is currently no industry standard test procedure for rating the performance of LED
devices. Typically, manufacturers take measurements both for purposes of luminous flux
and colour, which also addresses the binning of LEDs into groups of equal performance, by
testing LEDs in a controlled environment of 25 o C and providing a short pulse of power of
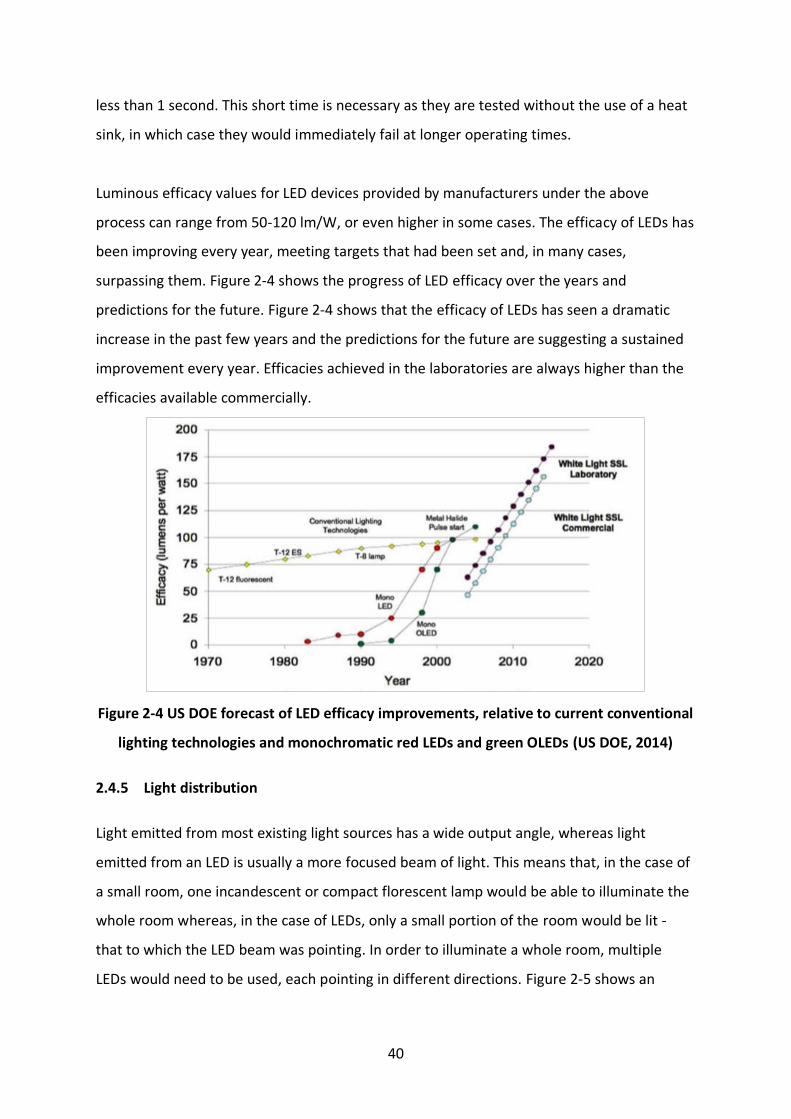
40
less than 1 second. This short time is necessary as they are tested without the use of a heat
sink, in which case they would immediately fail at longer operating times.
Luminous efficacy values for LED devices provided by manufacturers under the above
process can range from 50-120 lm/W, or even higher in some cases. The efficacy of LEDs has
been improving every year, meeting targets that had been set and, in many cases,
surpassing them. Figure 2-4 shows the progress of LED efficacy over the years and
predictions for the future. Figure 2-4 shows that the efficacy of LEDs has seen a dramatic
increase in the past few years and the predictions for the future are suggesting a sustained
improvement every year. Efficacies achieved in the laboratories are always higher than the
efficacies available commercially.
Figure 2-4 US DOE forecast of LED efficacy improvements, relative to current conventional
lighting technologies and monochromatic red LEDs and green OLEDs (US DOE, 2014)
2.4.5 Light distribution
Light emitted from most existing light sources has a wide output angle, whereas light
emitted from an LED is usually a more focused beam of light. This means that, in the case of
a small room, one incandescent or compact florescent lamp would be able to illuminate the
whole room whereas, in the case of LEDs, only a small portion of the room would be lit -
that to which the LED beam was pointing. In order to illuminate a whole room, multiple
LEDs would need to be used, each pointing in different directions. Figure 2-5 shows an
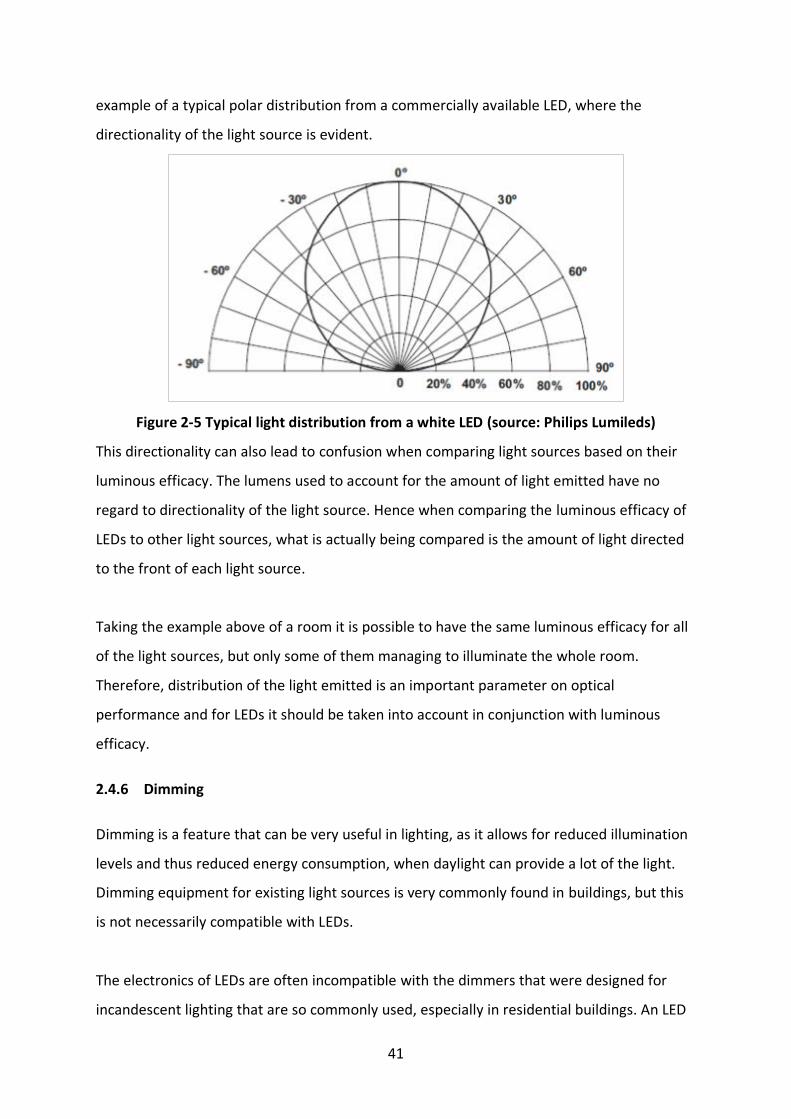
41
example of a typical polar distribution from a commercially available LED, where the
directionality of the light source is evident.
Figure 2-5 Typical light distribution from a white LED (source: Philips Lumileds)
This directionality can also lead to confusion when comparing light sources based on their
luminous efficacy. The lumens used to account for the amount of light emitted have no
regard to directionality of the light source. Hence when comparing the luminous efficacy of
LEDs to other light sources, what is actually being compared is the amount of light directed
to the front of each light source.
Taking the example above of a room it is possible to have the same luminous efficacy for all
of the light sources, but only some of them managing to illuminate the whole room.
Therefore, distribution of the light emitted is an important parameter on optical
performance and for LEDs it should be taken into account in conjunction with luminous
efficacy.
2.4.6 Dimming
Dimming is a feature that can be very useful in lighting, as it allows for reduced illumination
levels and thus reduced energy consumption, when daylight can provide a lot of the light.
Dimming equipment for existing light sources is very commonly found in buildings, but this
is not necessarily compatible with LEDs.
The electronics of LEDs are often incompatible with the dimmers that were designed for
incandescent lighting that are so commonly used, especially in residential buildings. An LED
42
driver, in this case, may be damaged by current spikes or not receive enough power to
operate at lower dimming levels. In the case of dimming controls designed for fluorescent
lighting though, there is more potential there for LEDs to be used as well, making them
more suitable for retrofitting applications.
LEDs can be dimmed by reducing the drive current. The most common LED drivers use pulse
width modulation (PWM) to control input power to the LEDs, by turning LEDs on and off at
high frequency, varying the total on time to achieve perceived dimming. At frequencies
above 120 Hertz, this would not typically be perceived by the human eye. If a dimmer is
specifically designed for LEDs, or the existing dimmer has been appropriately matched with
the LED driver, dimming is possible down to 5%, or even less (Gu et al., 2006).
For phosphor converted white LEDs a study conducted by Dyble et al. (Dyble et al., 2005),
showed very little chromaticity shift when the light output was reduced from 100% to 3%. In
contrast, an RGB white LED showed very large chromaticity shifts, over the same range. The
technology continues to evolve in this area, but phosphor converted white LEDs which are
the focus of this thesis, are already performing well in this area, even when dimmed to a
very low level.
2.5 Conclusions of the literature review
This section has reviewed the eco-design process models/methods/approaches, the eco-
design tools, and the studies related with the development and market deployment of
sustainable LED lighting products available in the literature. All these methods and tools are
used to reduce the environmental impact of generic products, and generally adopt a life
cycle approach, which takes into account all the life cycle stages of the product life in order
to reduce the environmental impact. Therefore, all the process models/methods and tools
used in these studies are comprehensive. After reviewing the eco-design process
models/methods for generic products and lighting products, it has been noticed a gap of
knowledge in models/methods/approaches specific for the eco-design and development of
lighting products. Although some of the features of models/methods/approaches to design
generic products are also applicable to lighting products, the eco-design of lighting products
43
present particular characteristics that require specific approaches, which highlight the need
for the development of an approach to eco-design lighting products.
In addition to this, the models/methods and approaches available not always look at the
testing, manufacturing and market deployment stages of the product life cycle, which are
necessary for the product developer who has to adopt a life cycle approach in order to
reduce the environmental impact of the product. Eco-design tools were also reviewed to
find out the advantages and disadvantages of these tools to confirm their suitability in order
to be included in the development of an approach to design, test, manufacture and
commercialize lighting products with low environmental impact. Different types of eco-
design tools for different purposes were reviewed. Some of them were ‘prescriptive’ such as
guidelines, regulations, directives and checklists, and were used to prescribe guidelines.
Others were ‘analytical’ and were used to allow to assess quantitatively the environmental
impact of the product. LCA software-based have been reviewed in more detail because they
can provide accurate and objective results. The integration of LCA software within the
design process has been reviewed and discussed, and it has been concluded that, in general,
detailed LCA software-based tools are more suitable for the beginning and end of the design
process and screening LCA software-based tools are more suitable for the middle stages of
the design process.
Recent studies related to LED lighting products and environmental LCA are also examined.
Despite the found differences, the findings of the LCAs were unanimous on two things: the
use-stage energy consumption is the most important environmental aspect in the LCAs, and
thus, the energy-efficient light sources, such as the CFLs and LED lamps, are more
environmentally friendly than their conventional counterparts from the life cycle point of
view.
The review of LCA and its recent studies show that LCAs can provide up-to-date information
for products, processes and products. Modern society thrives on a diverse and complex
economic structure, which makes the acquisition of reliable data even more important and
difficult. This chapter also reviewed the social consideration within sustainable design and
assessment tools. The concept of positive and negative impacts was introduced, and the
44
importance of such considerations was highlighted. SLCA’s historical development was
described, its method was expounded, and the two impact assessment methods were
explained. Reviews on researches in positive impacts in SLCA were carried out, it was
discovered that there is no consensual definition in positive impacts, and methods to assess
them varied.
45
Chapter 3: Research Methodology
3.1 Introduction
This section explains how this research will be conducted in order to achieve the objectives
of the research as stated in Chapter 1. It explains the methods and techniques that are used
and followed to produce the outcomes of this study.
3.2 Research design and outcomes
1) Development of an integrated eco-design approach:
The first step was to develop an integrated approach to be used as a reference to guide the
development of a lighting product with low environmental impacts. In order to create the
approach, first it was conducted a critical review and analysis of current eco-design
methods/approaches; current eco-design tools; current studies about the design,
manufacturing and market deployment of eco-lighting products.
The selection of the relevant issues from these areas, to be used to develop the approach, is
based on the review and discussion by other researchers and design practitioners in
published material (papers an books) of these topics, and also on the judgement of the
author based on trials with these methods and tools during the study, and based on
previous professional experience in design practice.
2) Design of the eco-lighting product:
The second step was the design (concept/detail design) of the lighting product with low
environmental impact. The design process of the eco-lighting product only focused on how
to reduce the environmental impact (with the integration of eco-design tools).
3) Test of the eco-lighting product:
In order to identify suitable lighting simulation software that can accurately predict room
illumination from artificial lighting. This was necessary so that the light distribution from
luminaires in case study buildings can be accurately predicted. A range of software are
reviewed, and selection criteria are put in place. An experiment is then setup in a room so
46
that comparisons between measured and simulated data can be made, which leads to a
selection of an appropriate software.
The third step involved testing the lighting product. This step had several objectives: to
evaluate and validate the performance of the product, and to pass the required
certifications and standards (i.e. IP). The following methods and techniques will be applied:
thermal resistance test; Light quality analysis.
4) Test of the web-based eco-deign support toolbox
In addition to the guidance obtained from the review of existing eco-design tools and
assessments, these discussions also provided clear support for the novelty of the web-based
eco-design support toolbox. It was intended that the integrated eco-design approach would
provide a stepwise approach structure to identify required knowledge to build an
assessment tool. In addition to the concepts of positive social value assessment of products,
a toolbox is also developed to demonstrate how this may fit into a current sustainable
practice and aid strategic product management and design for manufacturers. The case
study was selected to demonstrate one typical scenario in the lighting product
manufacturing industry.
5) Evaluation from the environmental LCA perspective
Environmental LCA will be used to assess, compare and evaluate the developed luminaire.
The Goal and Scope stage specifies and defines the functional unit, the system boundaries
of the assessment and the assumptions and limitations of the assessment. The LCI defines
the inventory of substances contained in the luminaire, the LCIA explains the LCIA method
selected and how the substances are assessed, the interpretation of results stage is the
stage where results are analysed and interpreted.
More specifically, the following steps will be followed:
• Selection of the benchmark lighting product;
• Full disassembly of the benchmark lighting product and the lighting product
developed to obtain the Bill of Materials (BoM) of both products; definition of the
functional unit informed by the light analysis;
• Definition of the boundaries of the assessment according to the aim and scope;
• Explanation of limitations and omissions of the data included in the assessment;
47
• Definition of the LCIA method selected;
• Definition of alternative scenarios to check the sensibility of the results with
different likely scenarios;
• Input the Bill of Materials (BoM) previously specified in step 1 into Simapro software;
• Analysis with LCA software and creation of results;
• Display of results (of both luminaires) in tables for interpretation and analysis;
• Design recommendations to further reduce the environmental impact of the
assessed lighting products.
6) Evaluation from the social LCA perspective
The LCA framework was selected as a foundation for the development of the social
assessment framework for the domestic lighting products. The phases of the LCA framework
can effectively encapsulate the key factors highlighted earlier. Relevant social impacts
should be identified and listed as a first step in the phase. It is important to capture all the
benefits and stakeholders, and impact categories that are related to all the functional
inventories, communication with product designers and expert opinions can help to ensure
that. Then, the step is classification where the causal relationship between the functional
inventories and the benefits are established. These benefits are calculated into indicators
for interpretation in the characterisation step.
3.3 Quality analysis for source data used in case studies
All the data used in this research is mainly about the inputs and outputs associated with the
LED lighting products. The quality of these adopted data varies considerably depending on
the sources, which influences the accuracy of the finalised calculation results. There are
three type data sources adopted in this study, and their quality are rated as follows:
• Primary data, if provided by firsthand source directly connected to the analysed case
(e.g. the product manufacturer).
• Secondary data, if gathered from informed but not directly connected source to the
analysed case (e.g. third-party database; relevant studies).
• Tertiary data, if taken from generic source that are assumed to be equivalent to the
analysed case (e.g. governmental departments’ report).
48
The data sources and their quality assessment rate involved with the products are will be
detailed in Chapter 6. The data quality evaluation deserves particular attention and extra
efforts, as it affects the accuracy of the calculation results.
Average data are used for the product life cycle inventory modelling. For example, the
distance between the manufacturing factory to the retailer shop; average heating time in a
manufacturing process. The specific data value is not possibly acquired within the context of
this research; hence, the accuracy of the finalised analysis results would be moderated by
adopting those average figures. Moreover, aggregating several data sources together for
the LCI modelling and LCIA increases the uncertainties for the calculation results, because
the methodology used by different databases varies in collecting and compiling their
datasets.
3.4 Summary
This chapter introduces the approaches undertaken for achieving the research objectives,
which shows the general rationale of conducting this research. Main tools, techniques and
testing environments for the LED lighting products are introduced. The advantages of the
adopted technologies are also discussed. The last but not least, the source data of the case
studies are outlined, and their quality are assessed with three level. The possible limitations
associated with the adopted data are also discussed, with the aim of clarifying the directions
and targets for future refinement works.
49
Chapter 4: A Web-based Toolbox to Support Eco-innovation in LED Lighting Products
4.1 Introduction
This chapter presents a Web-based toolbox to assist design engineers for developing Eco-
innovative LED lighting Products. The methods analysed the tools information such as
prescriptive analytical methods including regulations, directives, standards, CAD software
tools/ plugins for LCA analysis / Cost assessment and Hardware tools. Based on the
outcome, a web-based toolbox is developed with the required information’s and tools. The
toolbox provides design engineers a practical means of learning and utilization of necessary
tools for developing eco innovative LED products. A case study is presented at the end
illustrating the usefulness and utilization of the toolbox.
4.1.1 Demand for the toolbox of led lighting products
LED lighting products have been emerging in the lighting market. They are considered to be
the replacement for future lightening (Schwartz et al., 2009; El-Zein, 2013; Kylili and
Fokaides, 2015) as a powerful energy saving technology in the globe. About 19% of the total
global electricity produced in the world is consumed by lighting products (Waide, Tanishima
and Harrington, 2006), and energy consumption has a negative impact in the environment
and consumers’ cost. It is in fact important to reduce the energy consumed by lighting
products where recently LED technology and LED lighting products have received great
attention. This is mainly because they can help efficiently reduce energy consumption as
well as provide other benefits such as reducing environmental impact and increase
performance of lighting products (Waide, Tanishima and Harrington, 2006). Nowadays,
there are tools available to develop and manufacture LED lighting products. Design
Engineers who play an important role in the process of LED lighting product development
need be aware of the available tools, in order to not only successfully produce the products,
but also reduce the product’s negative impact on the environment.
50
However, design engineers in LED lighting product manufacturing industries, and SMEs in
particular, may be not aware of some of the available tools and may have difficulties to
select those tools. These tools can help them to increase reliability, performance, energy
efficiency, modularity and recyclability of the LED lighting products. Therefore, it is
necessary and demanded by the LED lighting manufacturing industry to develop a toolbox
that lighting product design engineers can use to select the tools. The toolbox should not
only contain the tools for design and manufacture of the lighting product, but also provide
the tools for reducing the product’s impact on the environment throughout the product
lifecycle, such as elimination of the harmful emission during manufacture, reduction of
production waste, recycling rare materials embedded in LED and component/materials
reuse. Importantly, the toolbox should also have a learning environment for the designer to
learn how to use the tools. However, according to the literature survey conducted by the
authors, there has not been such a toolbox available for LED lighting products. To fill this
gap, the authors worked with the consortium of the cycLED project supported by the
European Commission (cycLED, no date), developed a toolbox to help develop eco-
innovative LED lighting products, which is presented in this chapter.
The toolbox is developed using Web technology, with an online self-learning function.
During the past few years, many researchers attempted to develop and integrate various
tools using a web-based technology. As the web-based technology is very diverse it is
necessary to review the existing research works. The forthcoming paragraphs provide a brief
overview of the works in the web-based tools usage, technology based online learning
environment, and design and manufacture of LED lighting products.
4.1.2 Web technology related to tool integration and technology base online learning
Robin Kay (Kay, 2011) evaluated leaning, design and engagement in web-based learning
tools by adopting a method called Learning Object Evaluation Scale for Students. The author
also conducted surveys among 834 students and collected data for their analyses. Their
results revealed that the constructs for WBLT evaluation scale were internally reliable and
demonstrated good construct, convergent, and predictive validity. Kurilovas and
Juskeviciene (Kurilovas and Juskeviciene, 2015) reviewed ontology tools for learners to
quickly find suitable Web 2.0 tools for their preferred learning activities in virtual learning
51
environment (VLE) by using semantic search engine. They followed a three phased process
namely (i) planning (ii) conduction and (iii) reporting. Triangular Fuzzy Numbers method is
used to select the best relevant ontology development tool. They also mentioned that the
created ontology interconnects VARK learning styles (Visual (V), Aural (A), Read/Write (R),
and Kinaesthetic (K)), preferred learning activities and relevant Web 2.0 tools in VLE
Moodle.
Kam and Katerattanakul (Kam and Katerattanakul, 2014) created a structural model by
applying ground theory approach for a web 2.0 collaborative software. A three-stage coding
procedure was followed in their research, namely (i) open (ii) axial and (iii) selective. Then
these procedures are evaluated within a team of 3-5 members of 15 groups comprising a
total of 65 members. Finally, based on their reports a structural model was formulated for
team-based learning.
The importance of Technology based Learning Environments has been analysed by Cavusa
and Kanbul (Cavus and Kanbul, 2010). In their study they provided questionnaire and
collected the data from a group of 69 students. The study revealed that the most
appropriate software having web 2.0 tools which supply students’ expectations from TBLE is
learning management systems. Kam and Katerattanakul developed and analysed a tool
named RSS_PROYECT to effectively produce the RSS feeds. An open source software named
‘Joomla!’ was used for searching the news related to the exclusion of women in the society.
They performed different speed test and confirmed that when the number of feed sources
increases, the computational efficiency increases (Kam and Katerattanakul, 2014).
An investigation on the relationship of Web-based data mining tools and business models
on strategic performance capabilities has been studied by Heinrichs and Lim (Heinrichs and
Lim, 2003). In their work, the impact of using the web-based tools by the worker in an
industry is analysed and a business model was developed. They mentioned that to improve
the performance and capability of the company, web-based data mining tools is necessary
and should be understandable and usable by their workers. An online web-based constraint
system to manage the complex configuration requirements for assembly computers is
developed by Slater (Slater, 1999). In his work, various possibilities of configurations that
52
can be available for a computer and its integration are mentioned with the help of the tool.
Sánchez-Franco proposed a model which link between visual aesthetics, perceived
usefulness, non-economic satisfaction and learning performance (Sánchez-Franco et al.,
2013). The main aim of the work was to analyse visual design and usefulness on learning
and productivity in the domain of web-based tools. Homol compared various web-based
citation tools for verifying the accuracy of the results searched by various researchers. He
used four web-based citation tools namely EBSCO Discovery Service's Cite tool, EndNote
Basic RefWorks and Zotero (Homol, 2014). It has been observed that none of these tools
were able to produce accurate citation results for a specified number of test cases.
Isotani et.al developed an intelligent authoring tool using Semantic Web technologies in
order to represent knowledge about different pedagogies and practices related to
collaborative learning (CL) (Isotani et al., 2013). A pedagogical framework was developed for
maintaining a collaborative learning in ontology and to help teachers to create theory-based
CL scenarios. Fortmann-Roe developed a web-based, general-purpose simulation and
modelling tool to perform modelling and simulation. The work emphasised on System
Dynamics, Agent-Based Modelling, and imperative programming (Fortmann-Roe, 2014).
4.1.3 Design and manufacture of LED lighting products
As the present study, focusses on the eco innovation & life cycle analysis which includes
environmental impacts, reuse/ recycling, the next few paragraphs are presented focussing
these areas. Principi and Fioretti conducted a lifecycle assessment and made a comparative
study for Compact fluorescent and Light Emitting Diode (LED) (Principi and Fioretti, 2014). In
their work they adopted European Directive 2009/125/EC and 2005/32/EC which focuses on
eco-design requirements. Further, the complete product life cycle of the two products are
analysed by using SimaPro software. Tahkamo and Halonen presented a life cycle
assessment study for high-pressure sodium (HPS) and light-emitting diode (LED) luminaires
(Tähkämö and Halonen, 2015). The analysis on eco-friendly street lightning has been
performed in accordance with the international standards (ISO, 2006b).
Franceschini and Pansera discussed on unsustainable eco-innovation in lighting sector. They
proposed two perspectives namely (i) conceptual map that positions and operationalizes a
53
number of alternative narratives of sustainability and innovation, and (ii) evolution of the
lighting sector to show how different narratives may lead to the transformation of the
sector. Further to these, six narratives were proposed and discussed on how lighting
industry could be improvised especially on thinking beyond LED’s and to achieve a real time
sustainable eco-innovation (Franceschini and Pansera, 2015). Powers et.al developed a web-
based decision support tool named CEAWeb that employs a collective judgment method to
gather expert input and find factors which hamper environmental, health, and safety
assessments. The tool implemented U.S. EPA's comprehensive environmental assessment
approach to prioritize research gaps in areas where new data could make future risk
assessments more scientifically robust, and subsequently inform risk management decisions
involving emerging materials (Powers et al., 2014).
In addition to these works, there are also some notable research works on eco-design tools
(Casamayor and Su, 2013) and future lighting (Vahl, Campos and Casarotto Filho, 2013).
These works provide information on various tools available in the LED design and
manufacture. Based on these literatures, it is very clear that researchers have adopted web-
based tools in assisting engineers, students to improve the quality of learning and improving
their business. Many have adopted with different software’s for Life Cycle Assessment for
LED’s and gave some strong insight to future lighting and eco-innovation. Although those
tools exist, there has not been a toolbox to integrate the tools together to form a useful
information base and to provide a learning environment for designer to develop the LED
lighting products in an eco-innovative way, which indicate that the toolbox presented in this
chapter is a novel contribution. Also, the literature revealed a strong adaption that the Web-
based tools improve the quality of learning and provides a path for eco-innovation. Hence,
these research works, it is decided to develop the Web-based toolbox suitable for design
engineers to select/utilise suitable tools for eco-design of LED lighting products.
4.2 Structure and contents: recommendations for a flexible and easy to use toolbox
Based on the investigations conducted, it is decided to add the following contents which is
considered to be the specification of the toolbox. The toolbox specified will manage
resources for the manufacturing of LED product. The toolbox will offer easy access to
information on timing, product/component purchasing, cost benefit assessment, LED
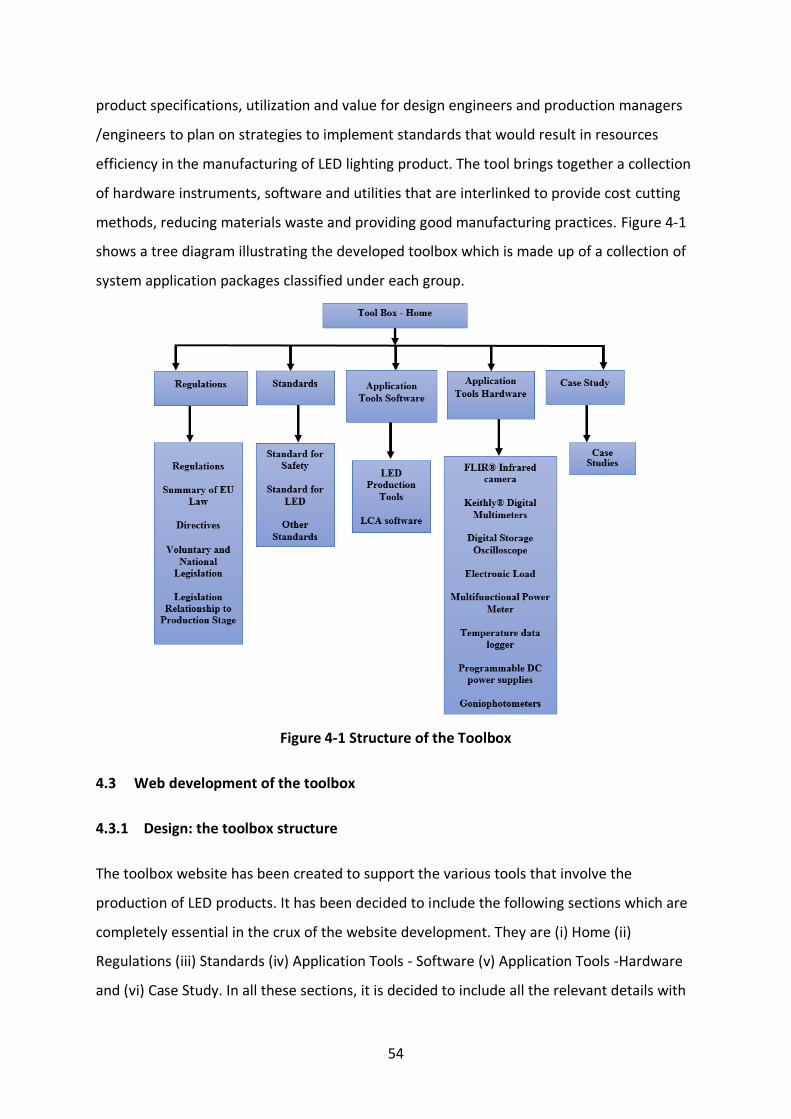
54
product specifications, utilization and value for design engineers and production managers
/engineers to plan on strategies to implement standards that would result in resources
efficiency in the manufacturing of LED lighting product. The tool brings together a collection
of hardware instruments, software and utilities that are interlinked to provide cost cutting
methods, reducing materials waste and providing good manufacturing practices. Figure 4-1
shows a tree diagram illustrating the developed toolbox which is made up of a collection of
system application packages classified under each group.
Figure 4-1 Structure of the Toolbox
4.3 Web development of the toolbox
4.3.1 Design: the toolbox structure
The toolbox website has been created to support the various tools that involve the
production of LED products. It has been decided to include the following sections which are
completely essential in the crux of the website development. They are (i) Home (ii)
Regulations (iii) Standards (iv) Application Tools - Software (v) Application Tools -Hardware
and (vi) Case Study. In all these sections, it is decided to include all the relevant details with
55
a easy to quick view and having the ability (i) to change images within the design using the
File Manager, e.g. rotating images in the header (ii) - to modify the text, in editable ‘calls-to-
action’ or homepage panel(s) to use the ‘CSS’ or ‘HTML’ tags (iii) to link the web-based data
in the form of ‘pdf’ or ‘doc’ files.
4.3.2 Contents and functionalities
The main function of the website is for the end user to aware various standards, regulations,
directives, software and hardware tools for increasing resource efficiency and reducing
environmental impact from production of LED products. It opens up with a homepage and
gives importance how the toolbox can be utilized by the users. Once the user navigates
through the regulations page, the site provides the information on five topics namely (i)
regulations (ii) summary of EU law (iii) directives (iv) voluntary and national legislations and
(iv) legislation relationship to production stage. Under each category the details that are
related to the topics are given and are summarized as follows: (i) regulations giving a brief
overview available to the present LED manufacturing. They are (i) EC 244/2009: Eco-design -
Lamps Implementing Directive 2005/32/EC of the European Parliament and of the Council
with regard to eco-design requirements for non-directional household lamps (ii) EC
1194/2012: Eco-design (recast) - lamps Implementing Directive 2009/125/EC of the
European Parliament and of the Council with regard to eco-design requirements for
directional lamps, light emitting diode lamps and related equipment and (iii) EC 347/2010
(amendment of EC 245/2009) The eco-design requirements for fluorescent lamps without
integrated ballast, for high intensity discharge lamps, and for ballasts and luminaires able to
operate such lamps. In the subpage ‘summary of EU law’ under regulations the details of EU
law are provided and followed by the directives in the consecutive subpage. The page of
voluntary and national legislation and legislation relationship to the productions stage gives
the details of the various legislations available and applicable in the LED manufacturing
industry conforming to EU standards.
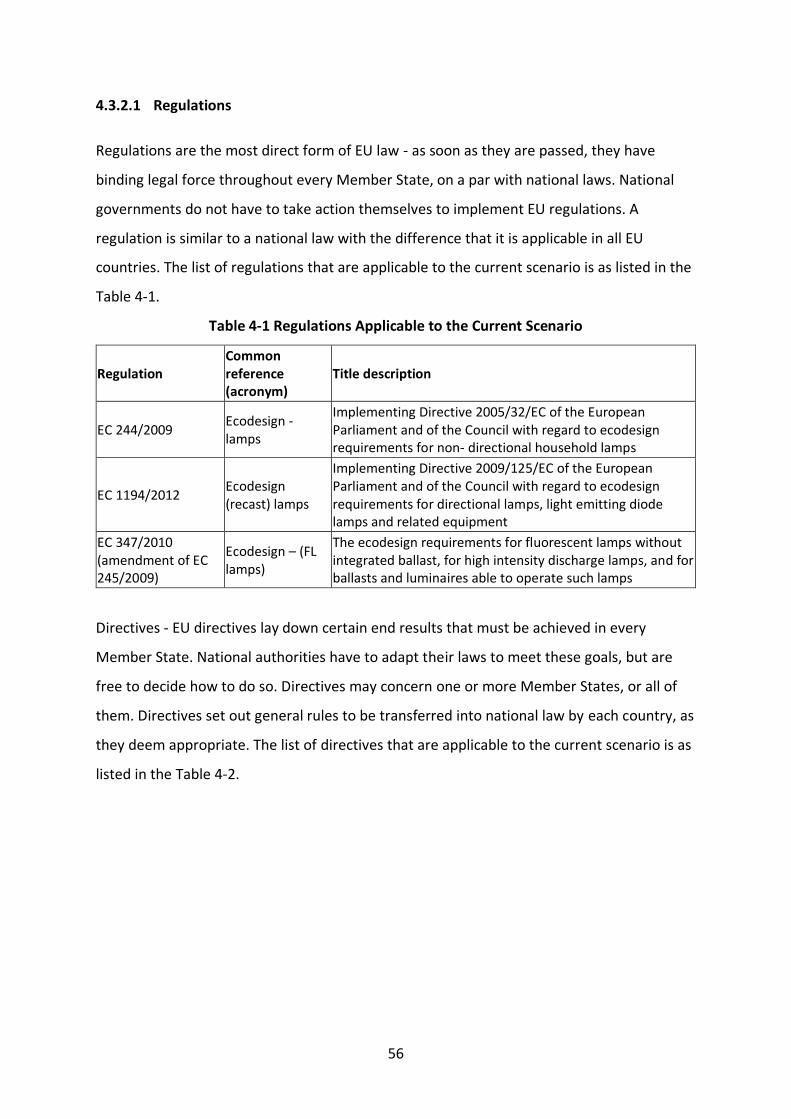
56
4.3.2.1 Regulations
Regulations are the most direct form of EU law - as soon as they are passed, they have
binding legal force throughout every Member State, on a par with national laws. National
governments do not have to take action themselves to implement EU regulations. A
regulation is similar to a national law with the difference that it is applicable in all EU
countries. The list of regulations that are applicable to the current scenario is as listed in the
Table 4-1.
Table 4-1 Regulations Applicable to the Current Scenario
Regulation Common reference (acronym)
Title description
EC 244/2009 Ecodesign - lamps
Implementing Directive 2005/32/EC of the European Parliament and of the Council with regard to ecodesign requirements for non- directional household lamps
EC 1194/2012 Ecodesign (recast) lamps
Implementing Directive 2009/125/EC of the European Parliament and of the Council with regard to ecodesign requirements for directional lamps, light emitting diode lamps and related equipment
EC 347/2010 (amendment of EC 245/2009)
Ecodesign – (FL lamps)
The ecodesign requirements for fluorescent lamps without integrated ballast, for high intensity discharge lamps, and for ballasts and luminaires able to operate such lamps
Directives - EU directives lay down certain end results that must be achieved in every
Member State. National authorities have to adapt their laws to meet these goals, but are
free to decide how to do so. Directives may concern one or more Member States, or all of
them. Directives set out general rules to be transferred into national law by each country, as
they deem appropriate. The list of directives that are applicable to the current scenario is as
listed in the Table 4-2.
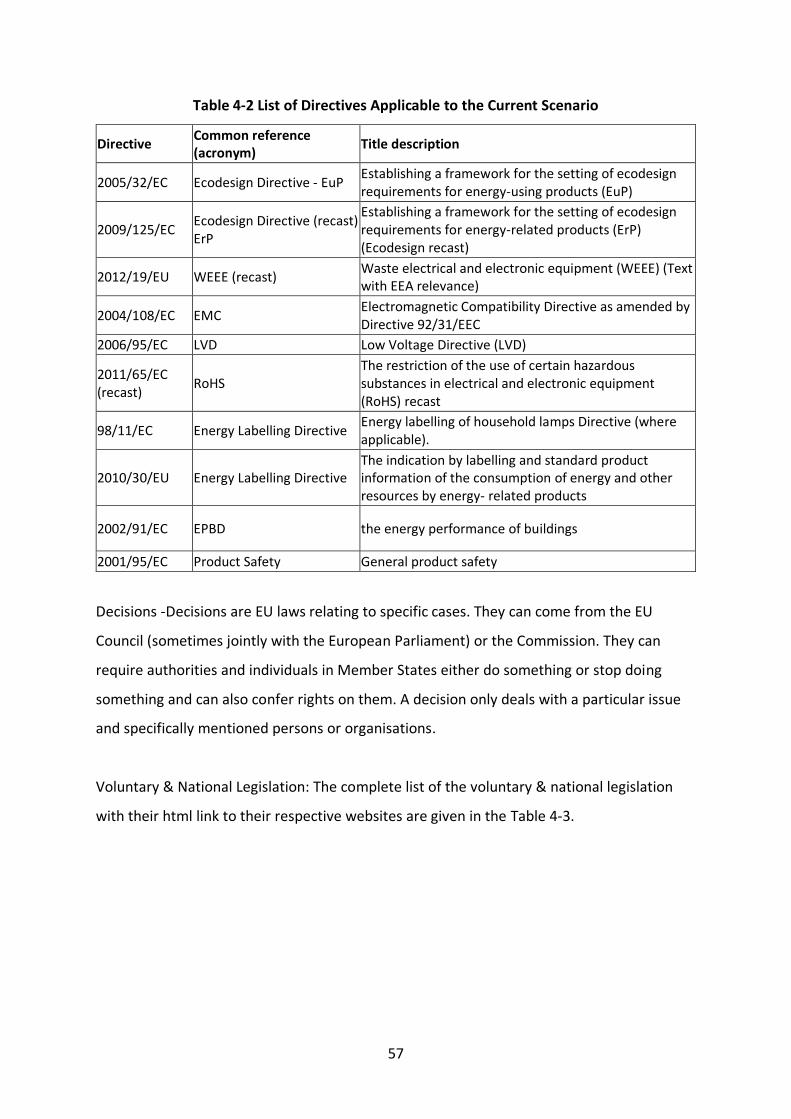
57
Table 4-2 List of Directives Applicable to the Current Scenario
Directive Common reference (acronym)
Title description
2005/32/EC Ecodesign Directive - EuP Establishing a framework for the setting of ecodesign requirements for energy-using products (EuP)
2009/125/EC Ecodesign Directive (recast) ErP
Establishing a framework for the setting of ecodesign requirements for energy-related products (ErP) (Ecodesign recast)
2012/19/EU WEEE (recast) Waste electrical and electronic equipment (WEEE) (Text with EEA relevance)
2004/108/EC EMC Electromagnetic Compatibility Directive as amended by Directive 92/31/EEC
2006/95/EC LVD Low Voltage Directive (LVD)
2011/65/EC (recast)
RoHS The restriction of the use of certain hazardous substances in electrical and electronic equipment (RoHS) recast
98/11/EC Energy Labelling Directive Energy labelling of household lamps Directive (where applicable).
2010/30/EU Energy Labelling Directive The indication by labelling and standard product information of the consumption of energy and other resources by energy- related products
2002/91/EC EPBD the energy performance of buildings
2001/95/EC Product Safety General product safety
Decisions -Decisions are EU laws relating to specific cases. They can come from the EU
Council (sometimes jointly with the European Parliament) or the Commission. They can
require authorities and individuals in Member States either do something or stop doing
something and can also confer rights on them. A decision only deals with a particular issue
and specifically mentioned persons or organisations.
Voluntary & National Legislation: The complete list of the voluntary & national legislation
with their html link to their respective websites are given in the Table 4-3.
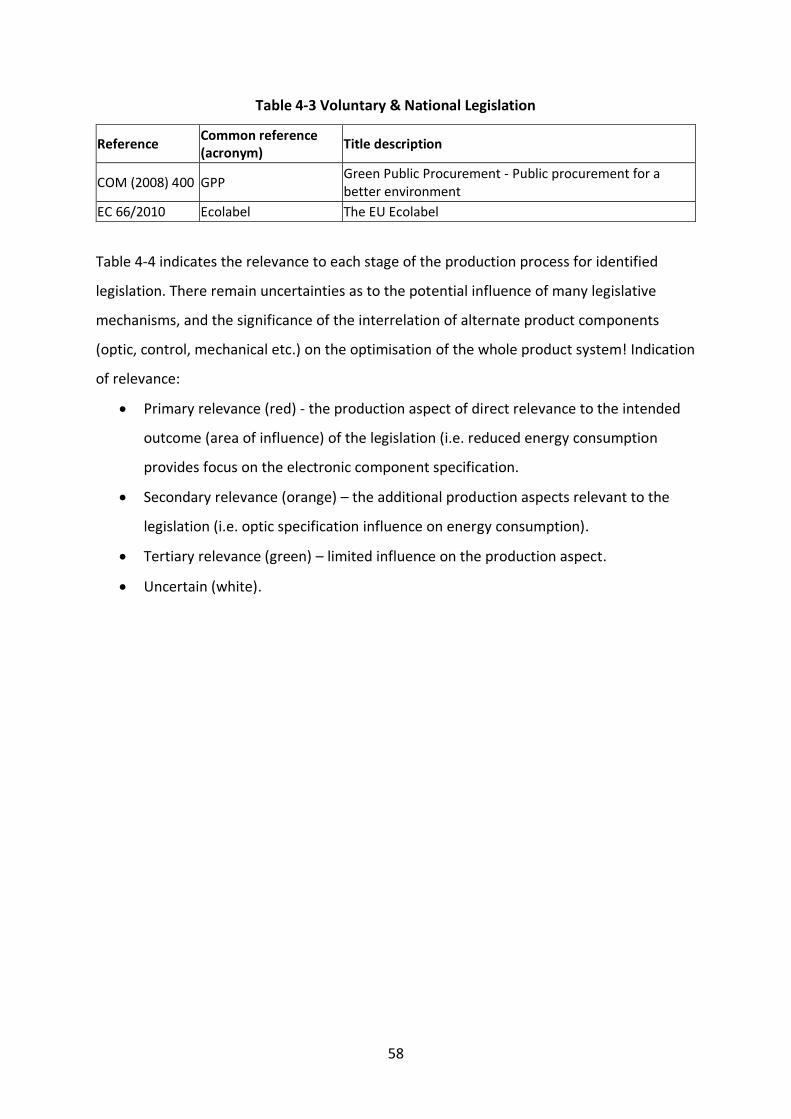
58
Table 4-3 Voluntary & National Legislation
Reference Common reference (acronym)
Title description
COM (2008) 400 GPP Green Public Procurement - Public procurement for a better environment
EC 66/2010 Ecolabel The EU Ecolabel
Table 4-4 indicates the relevance to each stage of the production process for identified
legislation. There remain uncertainties as to the potential influence of many legislative
mechanisms, and the significance of the interrelation of alternate product components
(optic, control, mechanical etc.) on the optimisation of the whole product system! Indication
of relevance:
• Primary relevance (red) - the production aspect of direct relevance to the intended
outcome (area of influence) of the legislation (i.e. reduced energy consumption
provides focus on the electronic component specification.
• Secondary relevance (orange) – the additional production aspects relevant to the
legislation (i.e. optic specification influence on energy consumption).
• Tertiary relevance (green) – limited influence on the production aspect.
• Uncertain (white).
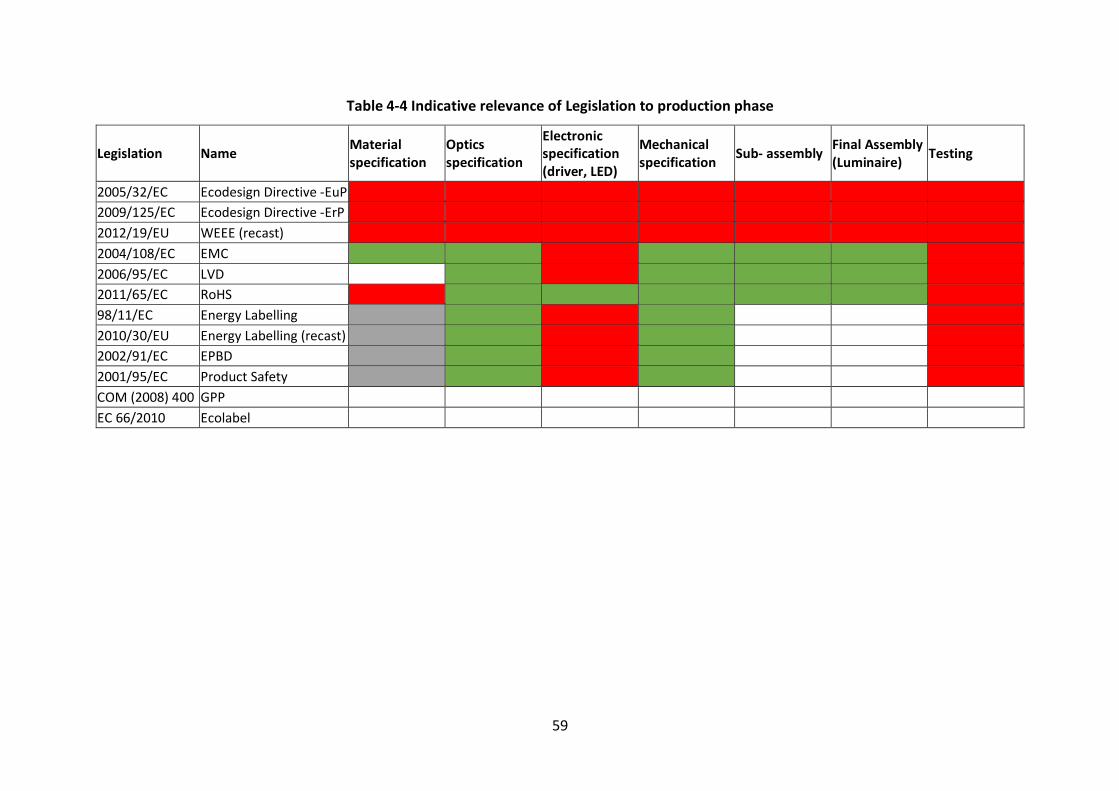
59
Table 4-4 Indicative relevance of Legislation to production phase
Legislation Name Material specification
Optics specification
Electronic specification (driver, LED)
Mechanical specification
Sub- assembly Final Assembly (Luminaire)
Testing
2005/32/EC Ecodesign Directive -EuP
2009/125/EC Ecodesign Directive -ErP
2012/19/EU WEEE (recast)
2004/108/EC EMC
2006/95/EC LVD
2011/65/EC RoHS
98/11/EC Energy Labelling
2010/30/EU Energy Labelling (recast)
2002/91/EC EPBD
2001/95/EC Product Safety
COM (2008) 400 GPP
EC 66/2010 Ecolabel
60
4.3.2.2 Standards
In essence, a standard is an agreed way of doing something. It could be about making a
product, managing a process, delivering a service or supplying materials – standards can
cover a huge range of activities undertaken by organizations and used by their customers.
Standards are the distilled wisdom of people with expertise in their subject matter and who
know the needs of the organizations they represent – people such as manufacturers, sellers,
buyers, customers, trade associations, users or regulators. Standards are knowledge. They
are powerful tools that can help drive innovation and increase productivity. They can make
organizations more successful and people’s everyday lives easier, safer and healthier.
UL8750-2009: Light Emitting Diode (LED) Equipment for Use in Lighting Products:
Organization: Underwriters Laboratories (UL) an independent product safety certification
organization based in Northbrook, Illinois, US. Edition Date: 18/11/2009. This document
covers the LED part which is an integral part of the luminaire or other lighting equipment
operating in the range of 400-700nm.These requirements also cover the component parts
of light emitting diode (LED) equipment, including LED drivers, controllers, arrays, modules,
and packages as defined within this standard.
IES LM-82-12: Characterization of LED Light Engines and LED Lamps for Electrical and
Photometric Properties as a Function of Temperature
Organization: The Illuminating Engineering Society of North America (IESNA). Edition Date:
13/02/2012. The new standard is designed to establish consistent methods of testing and
data presentation to assist luminaire manufacturers in selecting LED light engines and
integrated lamps for their luminaire products. This approved laboratory method defines the
procedures to quantify the performance of LED light engines and integrated LED lamps as a
function of temperature.
61
JESD 51-51: Implementation of the Electrical Test Method for the Measurement of Real
Thermal Resistance and Impedance of Light Emitting Diodes with Exposed Cooling
Organization: JEDEC Solid State Technology Association Edition Date: 12/04/2012. This
document provides information on thermal test requirements (static test methods) for the
measurement of real thermal resistance and impedance of LED (Power LED’s and High
brightness LED’s) with exposed cooling surface. The purpose of this document is to specify,
how LED's thermal metrics and other thermally-related data are best identified by physical
measurements using well established testing procedures defined for thermal testing of
packaged semiconductor devices (published and maintained by JEDEC) and defined for
characterization of light sources (published and maintained by CIE – the International
Commission on Illumination).
IES LM-80-08: LED Lumen Maintenance of LED Light Sources
Organization: The Illuminating Engineering Society of North America (IESNA) Edition Date:
22/09/2008. The purpose of LM-80-08 is to allow a reliable comparison of test results
among laboratories by establishing uniform test methods. It addresses the measurement of
lumen maintenance testing for LED light sources including LED packages, arrays and
modules only. It does not provide guidance or recommendations regarding prediction
estimations or extrapolations for lumen maintenance beyond the limits of the lumen
maintenances determined from actual measurements.
IES TM-21-11: Lumen Maintenance Life Test Projection
Organization: The Illuminating Engineering Society of North America (IESNA) Edition Date:
25/07/2011. This document recommends a method for projecting the lumen maintenance
of LED light sources from the data obtained by the procedures found in IES document LM-
80-08 Approved Method for Measuring Lumen Maintenance of LED Light Sources. LED light
sources provide a very long usable life but light output gradually depreciates over time.
TM21-11 provides the method for determining when the “useful lifetime” of an LED is
reached, a point when the light emitted from an LED depreciates to a level where it is no
longer considered adequate for a specific application. Lumen maintenance of LEDs can vary
from manufacturer to manufacturer and between different LED package types produced by
a single manufacturer.
62
NEMA SSL-1-2010: Electric Driver for LED Devices, Arrays and Systems
Organization: The National Electrical Manufacturers Association (NEMA). Edition Date:
28/02/2011. This standard provides specifications for and operating characteristics of
nonintegral electronic drivers (power supplies) for LED devices, arrays, or systems intended
for general lighting applications. Electronic drivers are devices that use semiconductors to
control and supply dc power for LED starting and operation. The drivers operate from
multiple supply sources of 600 V maximum at a frequency of 50 or 60 hertz.
NEMA White Paper Lsd-45
Organization: The National Electrical Manufacturers Association (NEMA) Edition Date:
03/09/2009. This document provides guidelines on solid state lighting sub assembly
interface for luminaires – guidelines does not apply to LED retrofit lamps. This new white
paper, prepared by the NEMA Solid State Lighting Section, covers the design and
construction of interconnects for solid-state lighting applications. It compiles the latest
industry information regarding mechanical, electrical, and thermal connections and
documents existing industry best practices
IES LM-79-08: Approved Method: Electrical and Photometric Measurements of Solid-State
Lighting Products
Organization: The Illuminating Engineering Society of North America (IESNA) Edition Date:
31/12/2007. This approved method describes the procedures and precautions for
performing reproducible measurements of total luminous flux, electrical power, luminous
intensity distribution and chromaticity of solid-state lighting (SSL) products for illumination
purposes under standard conditions. Covers LED-based SSL products with control
electronics and heat sinks incorporated. It does not cover external operating circuits or
external heat sinks (e.g., LED chips, LED packages, and LED modules). Uses absolute
photometry rather than relative photometry (historically the lighting industry standard) for
the measurement of SSL.
63
IES TM-25-13: Ray File Format for the Description of the Emission Property of Light
Sources
Organization: The Illuminating Engineering Society of North America (IESNA) Edition Date:
2013 TM-25-13 provides recommendations for a standard ray file format to describe the
emission properties of light sources. The ray file format contains information necessary to
interface between ray tracing or other optical design, simulation, analysis and metrology
software used in lighting applications.
IEC/PAS 60598-1 Edition7.0
Organization: International Electro technical Commission (IEC) Edition Date: 2008 1 of
International Standard IEC 60598 specifies general requirements for luminaires,
incorporating electric light sources for operation from supply voltages up to 1 000 V. The
requirements and related tests of this standard cover: classification, marking, mechanical
construction and electrical construction.
IEC/PAS 62722-2-1 Edition 1.0: Luminaire performance - Part 2-1: Particular requirements
for LED luminaires
Organization: International Electro technical Commission (IEC) Edition Date: 01/06/2011 The
first edition for a performance PAS for LED luminaires for general lighting applications
acknowledges the need for relevant tests for luminaires using this new source of electrical
light, sometimes called “solid state lighting”. The publication is seen in close context with
simultaneously developed and edited publication of performance standards (or PAS) for
luminaires in general and for LED modules. Changes in the LED luminaires PAS will have
impact on the module standards and vice versa, due to the behaviour of LED. Therefore, in
the development of the present PAS, mutual consultancy of experts of both products has
taken place. The provisions in the standard represent the technical knowledge of experts
from the fields of the semiconductor (LED chip) industry and of those of the traditional
electrical light sources and luminaires.
IEC 60838 ed4.2
Organization: International Electro technical Commission (IEC) Edition Date: 16/06/2011
Part 1 version of this document provides information on general requirement and test for
64
miscellaneous lamp holders. The IEC 60838-1 applies to lamp holders of miscellaneous types
intended for building-in (to be used with general purpose light sources, projection lamps,
floodlighting lamps and street-lighting lamps with caps) and the methods of test to be used
in determining the safe use of lamps in lamp holders. This part of IEC 60838 also covers
lamp holders which are integral with a luminaire. It covers the requirements for the lamp
holder only. The technical content is therefore identical to the base edition and its
amendments and has been prepared for user convenience. It bears the edition number 4.2.
IEC60838-2-2 Edition 1.1: Part 2-2: Particular requirements – Connectors for LED-modules
Organization: International Electro technical Commission (IEC) Edition Date: 01/04/2012
Part 2 version of this document provides information on particular requirement of
connectors for LED modules.
4.3.2.3 Application Tools Software
A brief overview of the LCA software tools is provide in Table 4-5. Five popular LCA tools,
including CES EduPack, Solidworks Sustainability tool, Sustainable Minds, SimaPro and Gabi
are included. It covers different LCA categories, with assessment goals ranging from basic
ones (carbon footprints and energy consumption) to a list of 17 mid-points impact and three
endpoints (human health, eco-system and resource); embedded assessment methods
ranging from single one to 15 comprehensive ones. The tool categories include online tools,
LCA embedded in engineering material databases, CAD packages, and stand-alone
specialized LCA tools.
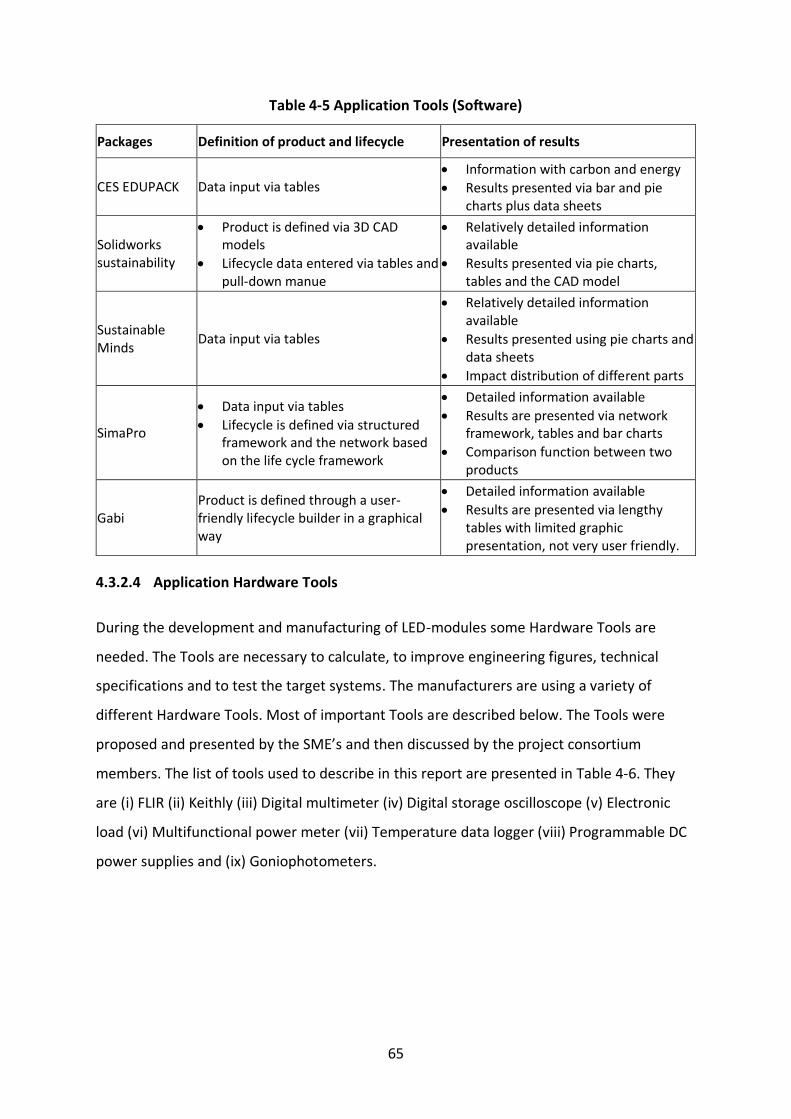
65
Table 4-5 Application Tools (Software)
Packages Definition of product and lifecycle Presentation of results
CES EDUPACK Data input via tables • Information with carbon and energy
• Results presented via bar and pie charts plus data sheets
Solidworks sustainability
• Product is defined via 3D CAD models
• Lifecycle data entered via tables and pull-down manue
• Relatively detailed information available
• Results presented via pie charts, tables and the CAD model
Sustainable Minds
Data input via tables
• Relatively detailed information available
• Results presented using pie charts and data sheets
• Impact distribution of different parts
SimaPro
• Data input via tables
• Lifecycle is defined via structured framework and the network based on the life cycle framework
• Detailed information available
• Results are presented via network framework, tables and bar charts
• Comparison function between two products
Gabi Product is defined through a user- friendly lifecycle builder in a graphical way
• Detailed information available
• Results are presented via lengthy tables with limited graphic presentation, not very user friendly.
4.3.2.4 Application Hardware Tools
During the development and manufacturing of LED-modules some Hardware Tools are
needed. The Tools are necessary to calculate, to improve engineering figures, technical
specifications and to test the target systems. The manufacturers are using a variety of
different Hardware Tools. Most of important Tools are described below. The Tools were
proposed and presented by the SME’s and then discussed by the project consortium
members. The list of tools used to describe in this report are presented in Table 4-6. They
are (i) FLIR (ii) Keithly (iii) Digital multimeter (iv) Digital storage oscilloscope (v) Electronic
load (vi) Multifunctional power meter (vii) Temperature data logger (viii) Programmable DC
power supplies and (ix) Goniophotometers.
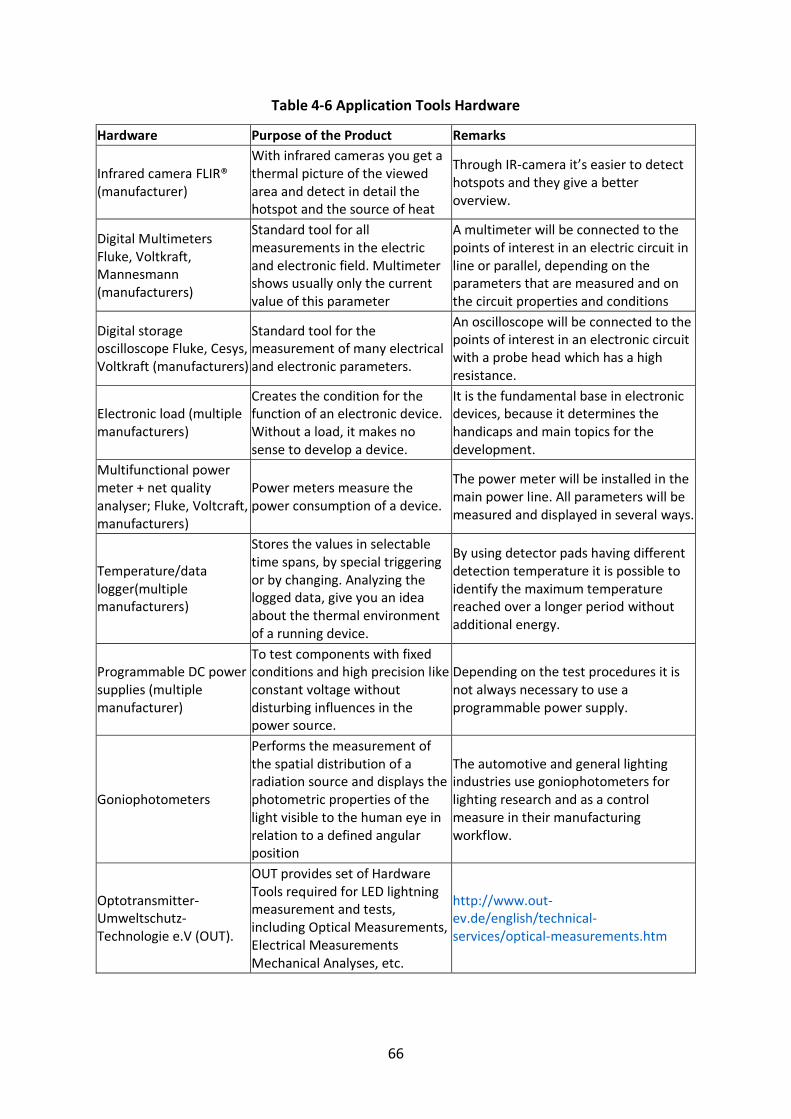
66
Table 4-6 Application Tools Hardware
Hardware Purpose of the Product Remarks
Infrared camera FLIR® (manufacturer)
With infrared cameras you get a thermal picture of the viewed area and detect in detail the hotspot and the source of heat
Through IR-camera it’s easier to detect hotspots and they give a better overview.
Digital Multimeters Fluke, Voltkraft, Mannesmann (manufacturers)
Standard tool for all measurements in the electric and electronic field. Multimeter shows usually only the current value of this parameter
A multimeter will be connected to the points of interest in an electric circuit in line or parallel, depending on the parameters that are measured and on the circuit properties and conditions
Digital storage oscilloscope Fluke, Cesys, Voltkraft (manufacturers)
Standard tool for the measurement of many electrical and electronic parameters.
An oscilloscope will be connected to the points of interest in an electronic circuit with a probe head which has a high resistance.
Electronic load (multiple manufacturers)
Creates the condition for the function of an electronic device. Without a load, it makes no sense to develop a device.
It is the fundamental base in electronic devices, because it determines the handicaps and main topics for the development.
Multifunctional power meter + net quality analyser; Fluke, Voltcraft, manufacturers)
Power meters measure the power consumption of a device.
The power meter will be installed in the main power line. All parameters will be measured and displayed in several ways.
Temperature/data logger(multiple manufacturers)
Stores the values in selectable time spans, by special triggering or by changing. Analyzing the logged data, give you an idea about the thermal environment of a running device.
By using detector pads having different detection temperature it is possible to identify the maximum temperature reached over a longer period without additional energy.
Programmable DC power supplies (multiple manufacturer)
To test components with fixed conditions and high precision like constant voltage without disturbing influences in the power source.
Depending on the test procedures it is not always necessary to use a programmable power supply.
Goniophotometers
Performs the measurement of the spatial distribution of a radiation source and displays the photometric properties of the light visible to the human eye in relation to a defined angular position
The automotive and general lighting industries use goniophotometers for lighting research and as a control measure in their manufacturing workflow.
Optotransmitter- Umweltschutz- Technologie e.V (OUT).
OUT provides set of Hardware Tools required for LED lightning measurement and tests, including Optical Measurements, Electrical Measurements Mechanical Analyses, etc.
http://www.out- ev.de/english/technical- services/optical-measurements.htm
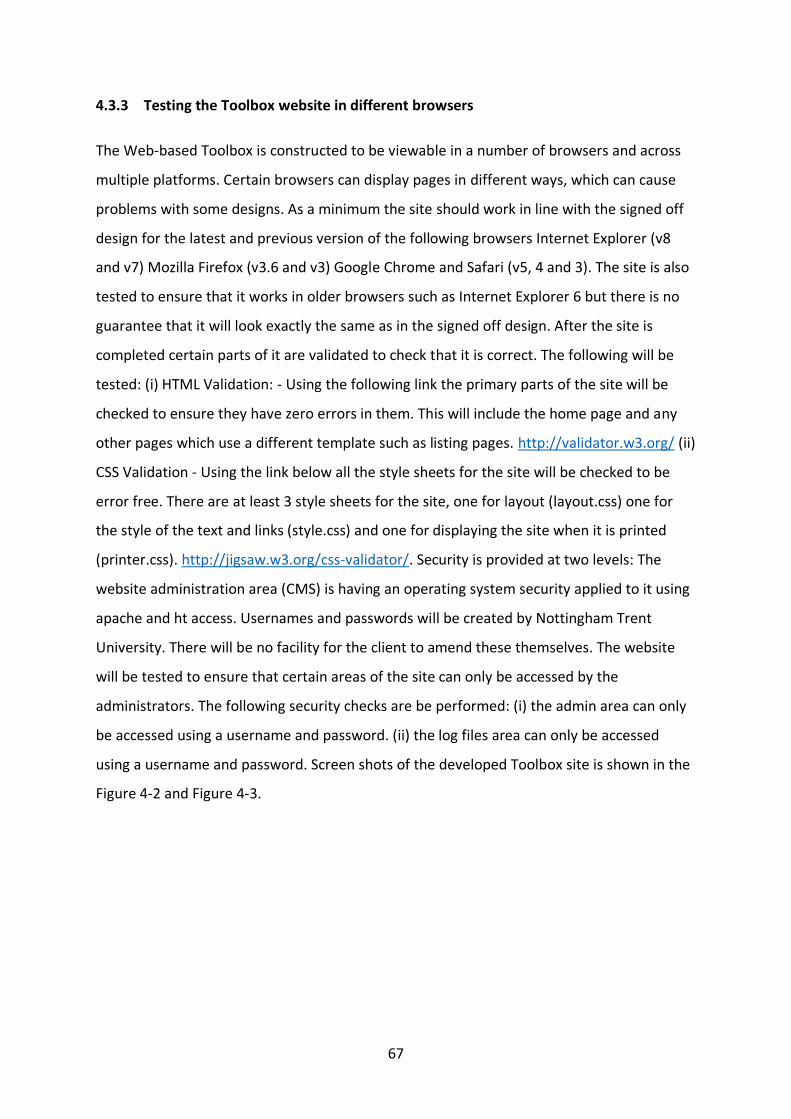
67
4.3.3 Testing the Toolbox website in different browsers
The Web-based Toolbox is constructed to be viewable in a number of browsers and across
multiple platforms. Certain browsers can display pages in different ways, which can cause
problems with some designs. As a minimum the site should work in line with the signed off
design for the latest and previous version of the following browsers Internet Explorer (v8
and v7) Mozilla Firefox (v3.6 and v3) Google Chrome and Safari (v5, 4 and 3). The site is also
tested to ensure that it works in older browsers such as Internet Explorer 6 but there is no
guarantee that it will look exactly the same as in the signed off design. After the site is
completed certain parts of it are validated to check that it is correct. The following will be
tested: (i) HTML Validation: - Using the following link the primary parts of the site will be
checked to ensure they have zero errors in them. This will include the home page and any
other pages which use a different template such as listing pages. http://validator.w3.org/ (ii)
CSS Validation - Using the link below all the style sheets for the site will be checked to be
error free. There are at least 3 style sheets for the site, one for layout (layout.css) one for
the style of the text and links (style.css) and one for displaying the site when it is printed
(printer.css). http://jigsaw.w3.org/css-validator/. Security is provided at two levels: The
website administration area (CMS) is having an operating system security applied to it using
apache and ht access. Usernames and passwords will be created by Nottingham Trent
University. There will be no facility for the client to amend these themselves. The website
will be tested to ensure that certain areas of the site can only be accessed by the
administrators. The following security checks are be performed: (i) the admin area can only
be accessed using a username and password. (ii) the log files area can only be accessed
using a username and password. Screen shots of the developed Toolbox site is shown in the
Figure 4-2 and Figure 4-3.
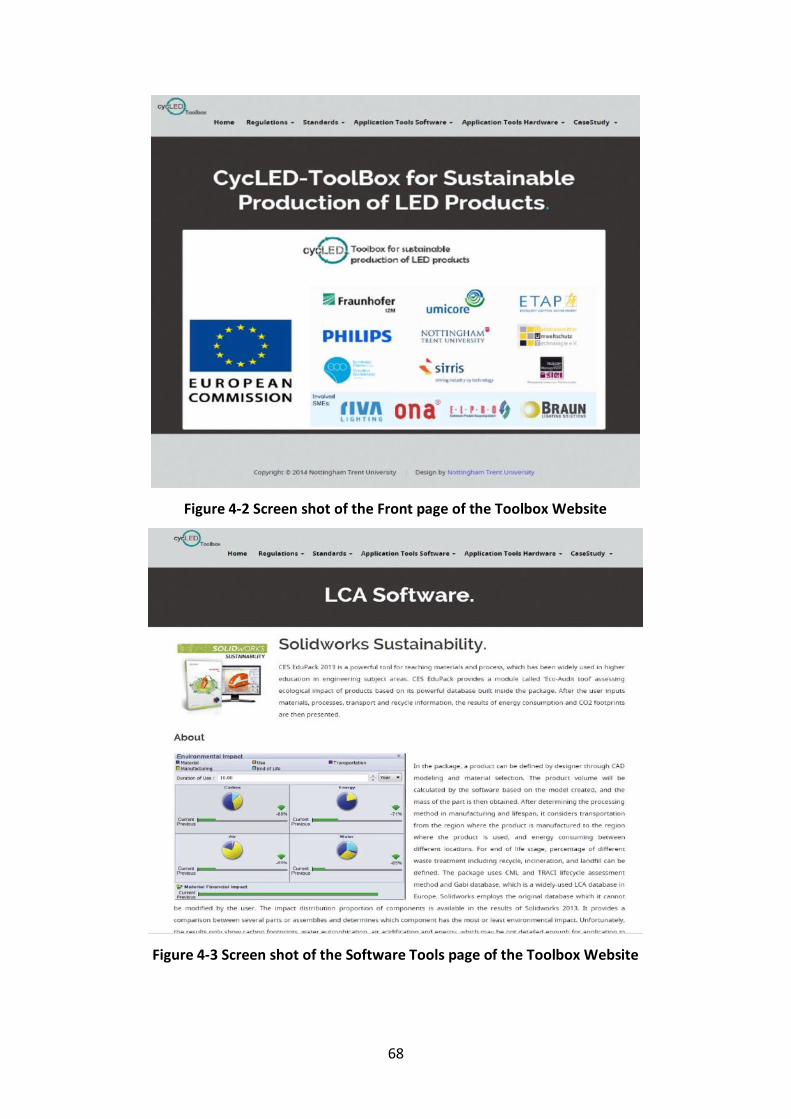
68
Figure 4-2 Screen shot of the Front page of the Toolbox Website
Figure 4-3 Screen shot of the Software Tools page of the Toolbox Website
69
4.4 Concluding remark
In this chapter, an eco-design support toolbox has been successfully developed with various
tools for assisting design engineers to develop eco innovative LED lighting products. The
toolbox contains the regulations, directives, standards, and software and hardware tools
used in the LED lighting product industry. The Web-based toolbox is now fully functional. A
case study illustrating the application of the toolbox within the development of eco-lighting
product, ONA LED table lamp, will be presented in the following Chapters.
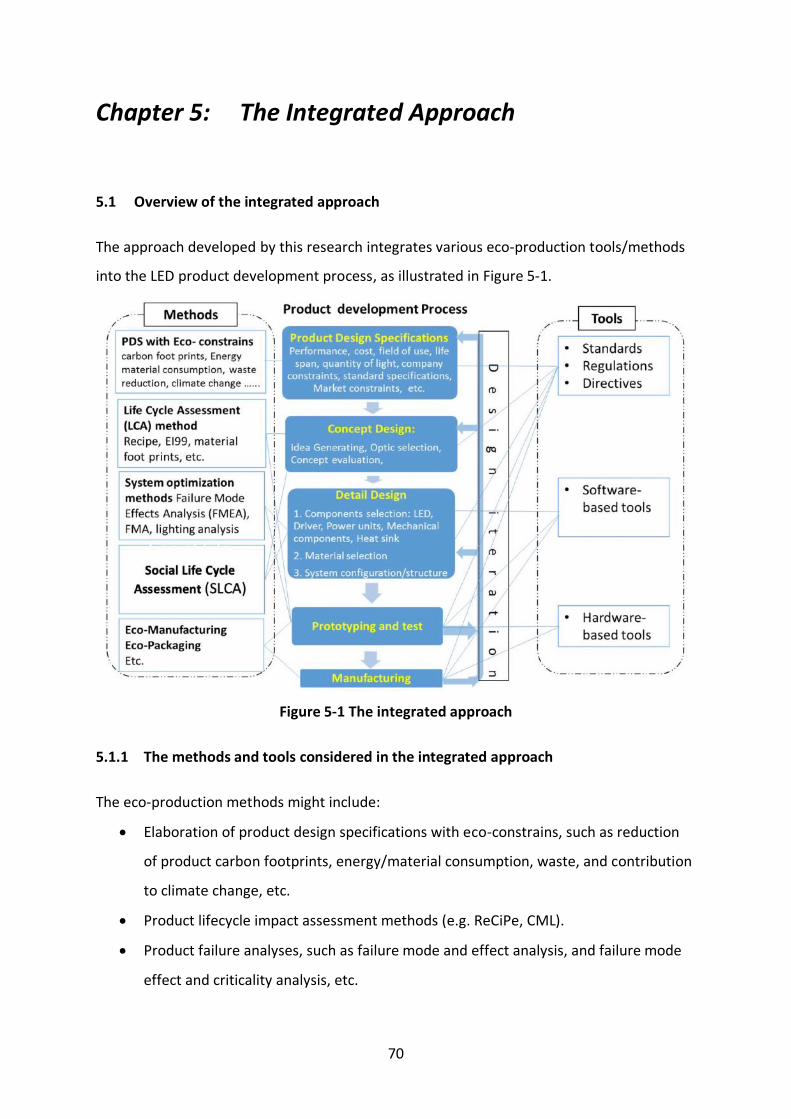
70
Chapter 5: The Integrated Approach
5.1 Overview of the integrated approach
The approach developed by this research integrates various eco-production tools/methods
into the LED product development process, as illustrated in Figure 5-1.
Figure 5-1 The integrated approach
5.1.1 The methods and tools considered in the integrated approach
The eco-production methods might include:
• Elaboration of product design specifications with eco-constrains, such as reduction
of product carbon footprints, energy/material consumption, waste, and contribution
to climate change, etc.
• Product lifecycle impact assessment methods (e.g. ReCiPe, CML).
• Product failure analyses, such as failure mode and effect analysis, and failure mode
effect and criticality analysis, etc.
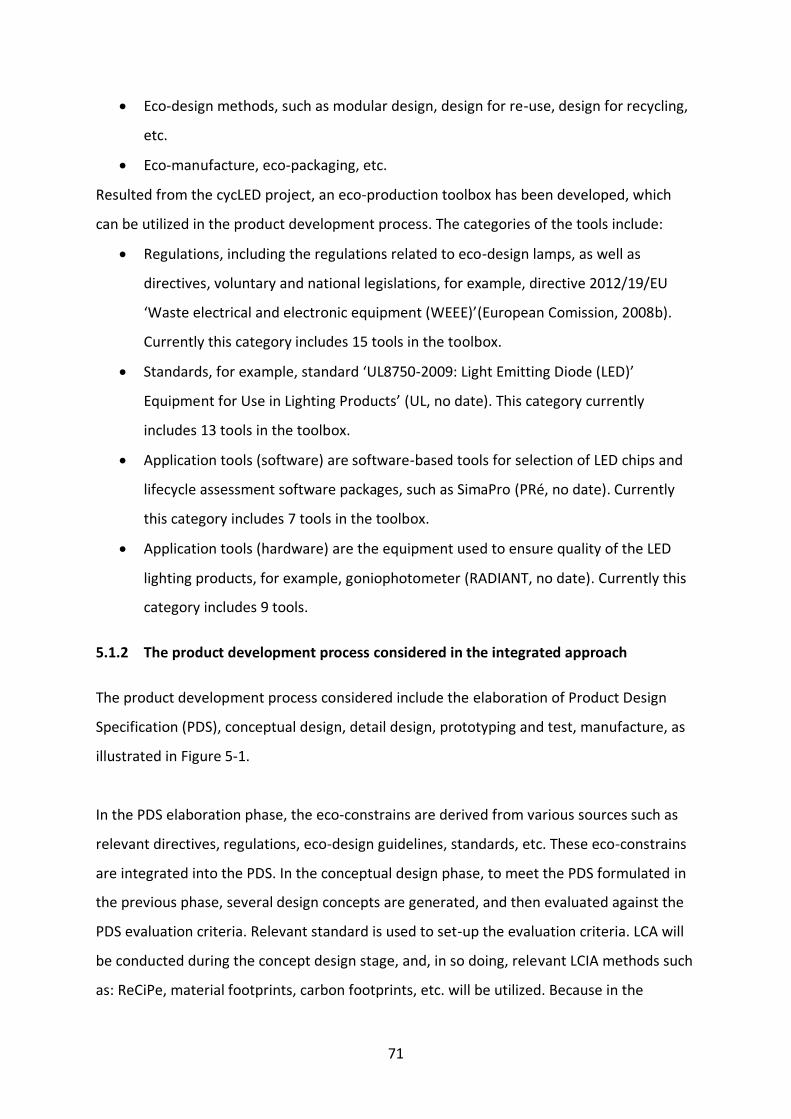
71
• Eco-design methods, such as modular design, design for re-use, design for recycling,
etc.
• Eco-manufacture, eco-packaging, etc.
Resulted from the cycLED project, an eco-production toolbox has been developed, which
can be utilized in the product development process. The categories of the tools include:
• Regulations, including the regulations related to eco-design lamps, as well as
directives, voluntary and national legislations, for example, directive 2012/19/EU
‘Waste electrical and electronic equipment (WEEE)’(European Comission, 2008b).
Currently this category includes 15 tools in the toolbox.
• Standards, for example, standard ‘UL8750-2009: Light Emitting Diode (LED)’
Equipment for Use in Lighting Products’ (UL, no date). This category currently
includes 13 tools in the toolbox.
• Application tools (software) are software-based tools for selection of LED chips and
lifecycle assessment software packages, such as SimaPro (PRé, no date). Currently
this category includes 7 tools in the toolbox.
• Application tools (hardware) are the equipment used to ensure quality of the LED
lighting products, for example, goniophotometer (RADIANT, no date). Currently this
category includes 9 tools.
5.1.2 The product development process considered in the integrated approach
The product development process considered include the elaboration of Product Design
Specification (PDS), conceptual design, detail design, prototyping and test, manufacture, as
illustrated in Figure 5-1.
In the PDS elaboration phase, the eco-constrains are derived from various sources such as
relevant directives, regulations, eco-design guidelines, standards, etc. These eco-constrains
are integrated into the PDS. In the conceptual design phase, to meet the PDS formulated in
the previous phase, several design concepts are generated, and then evaluated against the
PDS evaluation criteria. Relevant standard is used to set-up the evaluation criteria. LCA will
be conducted during the concept design stage, and, in so doing, relevant LCIA methods such
as: ReCiPe, material footprints, carbon footprints, etc. will be utilized. Because in the
72
conceptual design phase, the product information is not very detailed, unlike the detail
design phase, a quick estimation is preferred, LCA software for simple and fast analysis, such
as Sustainable Minds (Sustainable Minds, no date), is more suitable.
In the detail design phase, the product is further developed from the concept obtained in
the conceptual design phase. The major tasks to be conducted include selection of
components (LED chips, heat sink, LED driver, etc.), material selection, and the product
system configuration. Several software tools will be utilized to help to select the
components and conduct the detail design task. Relevant standards are also referred during
this stage of the process to ensure the product quality and to meet the eco-specifications.
In the prototyping and testing phase, the prototype of the product will be produced and
tested, and relevant eco-manufacture/eco-packaging methods will be utilized in order to
ensure the product to meet the required eco-constrains and the product quality according
to the referred standards. Proper testing equipment will be utilized to test the product
quality. The LCA methods, eco-design methods and product failure analysis methods are all
utilized in this phase. Unlike the simple/quick LCA conducted in conceptual design phase, a
more comprehensive LCA is conducted at this stage. A suitable LCA software such as
Simapro ((PRé, no date) is utilized to conduct more detailed analysis. This is because, in this
phase of the product development, the product prototype is completed and hence more
detailed information about the product is available.
The prototyping and test are further detailed in Sections 5.2 and 5.3 below. In the
manufacturing phase, relevant eco-manufacturing and eco-packaging methods are applied
to reduce waste, material, energy consumption, and impact on the environment. Relevant
standards are also followed at this stage to ensure product quality.
5.2 Prototyping and testing
In this phase, the manufactured prototype will be tested and analysed to confirm that the
final real product could pass all the tests and standards required. In so doing, software-
based tools, hardware tools, and test/testing methods were used. To illustrate how the
hardware tools and software tools will be used in this phase, the light analysis (using
73
goniometer) and the environment impact assessment (using LCA software) will be
introduced in the following sections. The prototype of the design table lamp is presented in
Figure 6-1 Initial architecture of the product’, see Chapter 6.
Type of tests/analysis involved
• Luminaire efficacy test: The efficiency and efficacy of the electronic components,
sub-systems and whole luminaire will be tested, measured and analysed.
• Energy consumption test: The measurement will be taken after a 30 minutes-period
to allow stabilization of the light source and lighting system energy consumption,
and it will be measured using a plug-in power meter.
• Light analysis test: The Light performance of the luminaire will be measured and
analysed.
• Disassembly test: The luminaire is easy to dismantle, only a screwdriver is required,
and it takes around 5 minutes to take apart the main parts and components.
• Environment impact assessment: The environmental impact of the luminaire will be
measured and analysed.
Software-based analysis tools utilized
• ProSource (RADIANT, no date): This software can process the data captured by the
goniometer, and translate it into EULUMDAT and IESNA photometric files that can
be exported and analysed in Photometric analysis software. The light performance of
the prototype was analysed to obtain the photometric files and calculate the efficacy
of the luminaire. Photometric files ultimately provide the light distribution of the
luminaire, which can help to reduce the energy consumption. If the light distribution
is known, the light output of the luminaire can be used more efficiently.
• Photometrics Pro (Photometric.com, 2015): This software can analyse the data
contained in EULUMDAT and IESNA photometric files and translate it into graphs-
results which shows the light performance (light distribution, light intensity, beam
angle, etc.) of the luminaire. After using the goniometer and ProSource software to
obtain the EULUMDAT and IESNA files, these were used in Photometric Pro to
analyse the light parameters and performance of the luminaire.
74
• Simapro (PRé, no date): This software is used to assess the environmental impact of
the luminaire. The prototype was dismantled, and all the materials and substances
weighted, and its values input into the software for analysis. The results of the
assessment showed the total environmental impact of the luminaire, each life cycle
stage, and each process and material used. This information was used to know which
product life cycle stage and components had higher impact to inform possible
further eco-design improvements to reduce the impact of the luminaire. Since this is
not the final manufactured product the assessment results cannot be used
(externally) to inform consumers, to support Environmental Product Declarations
(EPD), or for benchmarking.
5.3 Hardware-based measurement tools utilized
• Source meter: This is a tool used to measure the energy efficacy of the LED, LED
driver and LED-LED driver system, among other functions. Once the LEDs and LED
drivers were selected based on several criteria: energy efficacy, compliance with
RoHS, reliability and serviceability; these were tested with a source meter to confirm
the energy efficacy of each component, and to find out the energy efficacy of the
LED-LED driver system. The efficiency of the driver was 80.4%, and the efficacy of the
LED-LED driver system was 112 Lm/W, which is a good value.
• Goniometer: This tool is used to capture and measure the photometric data from
the luminaire. The light performance of the prototype was measured using the
goniometer, and photometric files (EULUMDAT and IESNA) produced using
ProSource software.
• Illuminance meter: This tool is used to measure the illuminance of the luminaire in
lux. This value is necessary to carry out the analysis with the goniometer and obtain
the photometric files. The illuminance of the prototype was calculated when the
luminaire was mounted on the goniometer previous to conduct the full light
goniometer analysis.
• Colour meter: This tool is used to measure the Correlated Colour Temperature (CCT)
in Kelvin (K) of light sources or luminaires. The CCT of the luminaire was measured as
part of the light analysis. CCT measurements are required because the colour
75
temperature of the luminaire may differ from the one provided by the light source
supplier when the light source is used within the luminaire whole system. The
luminaire function is to provide a specific light quantity and quality because both
parameters affect the energy used and the lifespan of the luminaire. For example: If
the CCT degrades below certain levels, the function of the luminaire may not satisfy
the user needs and hence the luminaire will be disposed.
• Power meter: This tool is used to measure the energy consumption of the luminaire.
The energy consumption of the prototype was measured before the light analysis
with the goniometer. The measurement was carried out after 30 minutes of
functioning in order to allow the luminaire consumption to stabilize.
5.4 Concluding remarks
An integrated approach for sustainable lighting product development is presented in this
chapter. The approach integrates various sustainable tools and methods into the lighting
product development process including product design specification, conceptual design and
detail design, prototyping and test, and manufacture. This chapter gave an overall
presentation of the integrated approach. Further detailed presentation are given in other
chapters: the tools to be considered in the approach are presented in Chapter 4; the
conceptual and detail designs, prototyping and testing are detailed in Chapters 6 and 7. The
important life cycle assessment methods, environmental LCA and social LCA, utilised in the
design of the lighting product, are further detailed in Chapters 8 and 9.
76
Chapter 6: Sustainable Lighting Product Design
In order to examine the quality of the designed lighting product, the following section
introduces the overview of the integrated eco-design approach and the parameters of the
designed product. In addition to this, to compare and evaluate the environmental impact
and product optical performance between the designed lighting product with the existing
commercial product. Utilisation of the integrated approach to develop an eco-lighting
product the integrated approach has been utilised to develop a lighting product, which is
detailed int this section. The product is manufactured by Ona product L.S.(Spain).
6.1 Configuration of Product Design Specifications (PDS)
The following PDS with eco-constrains (eco-PDS) are specified during PDS configuration
phase:
• The product should use as a smaller number of components as possible, whilst
maintaining the required quality.
• Extend the product lifespan. The product should be durable, and components should
have easy access for repair.
• To apply eco-design methods, such as modular design, design for easy repair and
upgrade, design for disassembly, design for reuse.
• Design and implement systems (related with the product) that facilitate components
and luminaires’ recovery for re-use, re-manufacture and recycle.
• Use the minimum type of materials, which facilities the sorting of components for
reuse and recycling when the product reaches its end of service life.
• Avoid: The use of special tools for disassembly, non-detachable joints (welded or
glued joints), labels attached the product, finishes in materials, and toxic materials.
• Use low environmental impact materials and manufacturing processes.
The above PDS are derived from relevant directives, regulations and standards related to
sustainable development. For example, the ‘Restriction of Hazardous Substances (RoHS)
directive’ restricts the use of six hazardous materials: Lead (Pb), Mercury (Hg), Cadmium
(Cd), Hexavalent chromium (Cr6+), Polybrominated biphenyls (PBB) and Polybrominated
77
diphenyl ether (PBDE), in the manufacture of various types of electronic and electrical
equipment. Derived from this directive, the ‘avoid using toxic materials’ is specified in the
PDS, and all the electrical and electronic components (LEDs, driver, circuit, etc.) used in the
demonstrator comply with RoHS.
6.2 Conceptual design
In the conceptual design phase, the product concept was developed in compliance with the
eco-PDS and relevant regulations and directives.
Compliance with the eco-PDS
• Use less components: The product is made of 3 main housing parts, and the
architecture of the product is quite basic and simple, which make it easy to
dismantle for repair, re-manufacture or recycle.
• Increase product lifespan: Several strategies have been implemented to increase the
product lifespan: 1) Increase the reliability of the product, 2) design the product for
easy disassembly, 3) long warranty, 4) Use recyclable materials, 5) design a system to
incentive return of products, 6) Register with WEEE to facilitate recycling and 7)
informing the consumer how to use and where to dispose the product for recycling.
• The product should be easy to repair and upgrade: The product has a basic
architecture with few parts which facilitates disassembly. It does not use non-
detachable joints so the product can be dismantled and repaired without breaking
the product (non-destructive disassembly). It can be dismantled with a standard
screwdriver.
• Use standard components and provide product structure information with suppliers’
name and component ref. to consumers to facilitate repair and upgrade outside the
warranty period.
• Use recycled materials: The main materials used in the product are aluminium and
PMMA. The aluminium is 100% recycled.
• Easy access to components for repair: Access to electrical-electronic components
that may fail or get out of date is easy, and only one screwdriver is needed for
disassembly.
78
• Improve the energy-efficiency of the product system: The LED driver has been
selected to optimally function with the LED, to save energy and extend lifespan.
Energy-efficient light sources have been used.
• Use the minimum type of different materials: The number of materials used in the
product have been reduced to 2 main materials (in the housing) for easy separation.
• Use recyclable materials: The main (with the highest weight %) material used in the
product is 100% recycled aluminum.
• Design for disassembly: The product has a basic architecture with three main parts
which facilitate disassembly. It uses eight screws that can be dismantled to have
access to all internal components without breaking the product (non-destructive
disassembly). It can be dismantled with a screwdriver.
• Avoid the use of (special) tools for disassembly: The only tool required for
disassembly of the product is a screwdriver.
• Avoid non-detachable joints (welded or glued joints): All the joints used in the
product are detachable, so the product can be dismantled without breaking it (non-
destructive disassembly).
• Avoid the use of labels: Labels are not used in the product and the packaging, which
facilitates recycling of the materials.
• Avoid the use of finishes on the materials: The materials used have no additional
coating, which facilitates recycling.
• Reduce the weight and volume of the product and packaging: The volume of the
product is quite small, and the total weight is 601 g. This contribute to reduce the
impact caused during distribution. The geometry of the product also facilitates to
pack more products within the same volume, which also reduce the impact in the
distribution stage.
79
Compliance with eco-regulations and directives
• Energy labelling directive (2010/30/EU): The packaging of the luminaire provide
information about energy consumption, light output performance, and useful
lifetime of the light sources used (European Commission, 2010).
• Waste Electrical and Electronic Equipment recycling (WEEE) directive: The company
has been registered with a WEEE recovery and recycling scheme (European
Comission, 2008b).
• Restriction of Hazardous Substances (RoHS) directive: The product and all the
components included comply with RoHS directive (European Comission, 2008a)
• The Eco-design directive (2009/125/EC): The LED driver-LED system has been
optimized to save energy, and Energy-efficient light sources have been used. In
terms of materials, the lifespan of the product has been extended, it has been
designed the product, so it is easy to dismantle to facilitate repair, re-use, re-
manufacture and recycling. Recycled materials have been used, that are recyclable
(European Council, 2009).
6.3 Detail design
In the detail design phase, the eco-PDS, directives and standards are followed, and relevant
software is utilized to develop the lighting product.
Compliance with the eco-PDS
Due to limitation of space, only selected eco-PDS are mentioned in this sub-section:
• Specify reliable components from well-known suppliers: LEDs and LED drivers have
been outsourced from well-known suppliers (Samsung supplied the LEDs, and
Lumotech supplied the LED driver), and the models selected have passed reliability
tests.
• LEDs specifications: LED chips: Samsung LM561A - 5630 Middle Power LED
• Driver specifications: Lumotech: LEDlight Micro series - L05050/L05150
• The driver feature a series of properties that contribute to extend its lifespan (and
the whole luminaire): Open circuit protection, overload, over voltage and over
temperature protection, high power factor (0.91), Future-proof flexibility: industry
leading output voltage range enabling seamless support of LED generations and
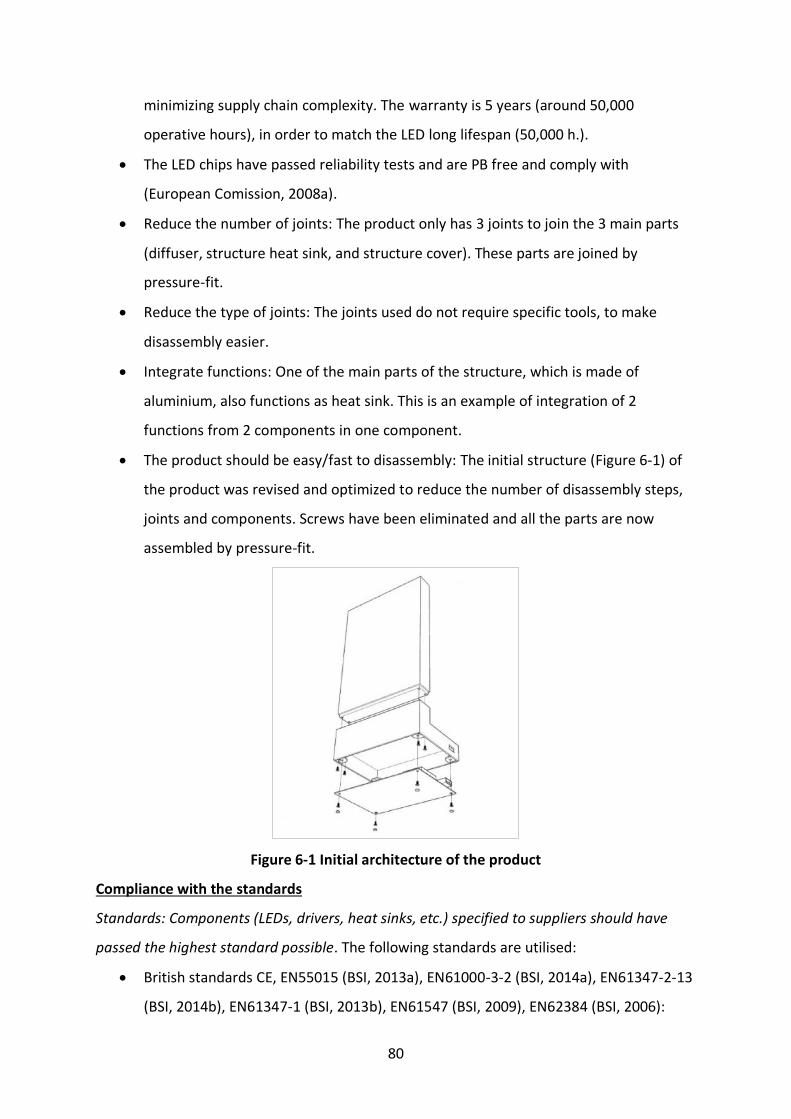
80
minimizing supply chain complexity. The warranty is 5 years (around 50,000
operative hours), in order to match the LED long lifespan (50,000 h.).
• The LED chips have passed reliability tests and are PB free and comply with
(European Comission, 2008a).
• Reduce the number of joints: The product only has 3 joints to join the 3 main parts
(diffuser, structure heat sink, and structure cover). These parts are joined by
pressure-fit.
• Reduce the type of joints: The joints used do not require specific tools, to make
disassembly easier.
• Integrate functions: One of the main parts of the structure, which is made of
aluminium, also functions as heat sink. This is an example of integration of 2
functions from 2 components in one component.
• The product should be easy/fast to disassembly: The initial structure (Figure 6-1) of
the product was revised and optimized to reduce the number of disassembly steps,
joints and components. Screws have been eliminated and all the parts are now
assembled by pressure-fit.
Figure 6-1 Initial architecture of the product
Compliance with the standards
Standards: Components (LEDs, drivers, heat sinks, etc.) specified to suppliers should have
passed the highest standard possible. The following standards are utilised:
• British standards CE, EN55015 (BSI, 2013a), EN61000-3-2 (BSI, 2014a), EN61347-2-13
(BSI, 2014b), EN61347-1 (BSI, 2013b), EN61547 (BSI, 2009), EN62384 (BSI, 2006):
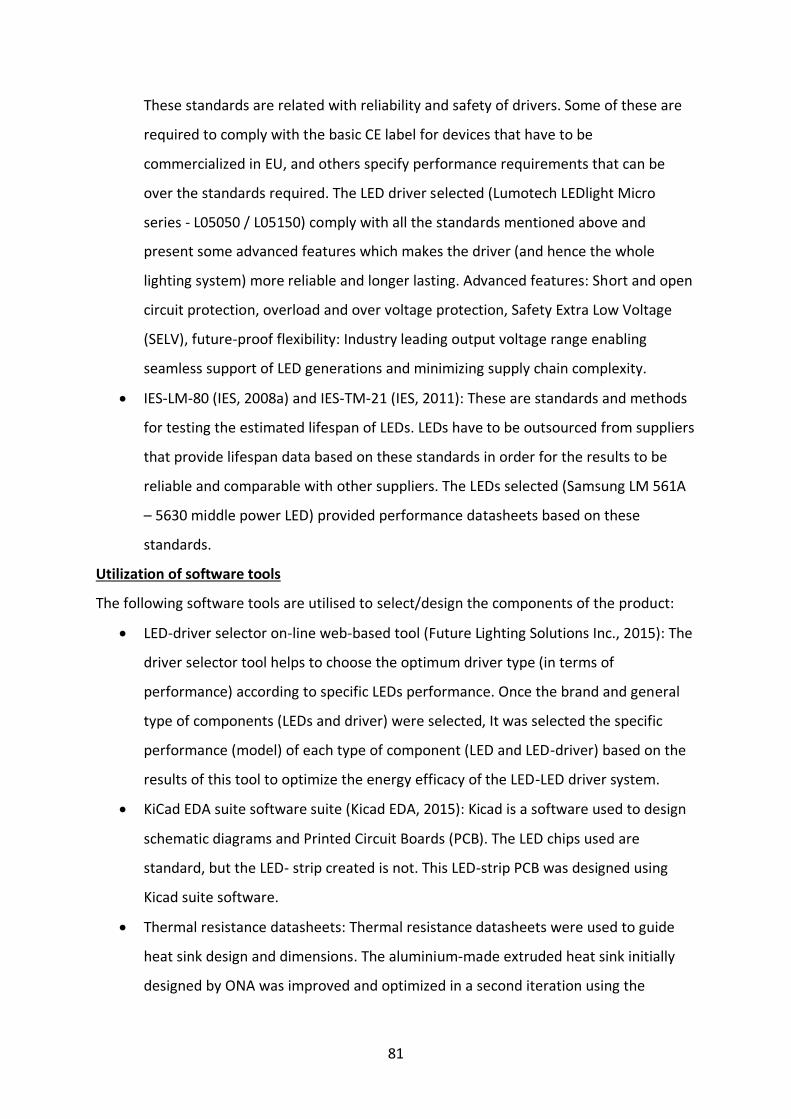
81
These standards are related with reliability and safety of drivers. Some of these are
required to comply with the basic CE label for devices that have to be
commercialized in EU, and others specify performance requirements that can be
over the standards required. The LED driver selected (Lumotech LEDlight Micro
series - L05050 / L05150) comply with all the standards mentioned above and
present some advanced features which makes the driver (and hence the whole
lighting system) more reliable and longer lasting. Advanced features: Short and open
circuit protection, overload and over voltage protection, Safety Extra Low Voltage
(SELV), future-proof flexibility: Industry leading output voltage range enabling
seamless support of LED generations and minimizing supply chain complexity.
• IES-LM-80 (IES, 2008a) and IES-TM-21 (IES, 2011): These are standards and methods
for testing the estimated lifespan of LEDs. LEDs have to be outsourced from suppliers
that provide lifespan data based on these standards in order for the results to be
reliable and comparable with other suppliers. The LEDs selected (Samsung LM 561A
– 5630 middle power LED) provided performance datasheets based on these
standards.
Utilization of software tools
The following software tools are utilised to select/design the components of the product:
• LED-driver selector on-line web-based tool (Future Lighting Solutions Inc., 2015): The
driver selector tool helps to choose the optimum driver type (in terms of
performance) according to specific LEDs performance. Once the brand and general
type of components (LEDs and driver) were selected, It was selected the specific
performance (model) of each type of component (LED and LED-driver) based on the
results of this tool to optimize the energy efficacy of the LED-LED driver system.
• KiCad EDA suite software suite (Kicad EDA, 2015): Kicad is a software used to design
schematic diagrams and Printed Circuit Boards (PCB). The LED chips used are
standard, but the LED- strip created is not. This LED-strip PCB was designed using
Kicad suite software.
• Thermal resistance datasheets: Thermal resistance datasheets were used to guide
heat sink design and dimensions. The aluminium-made extruded heat sink initially
designed by ONA was improved and optimized in a second iteration using the
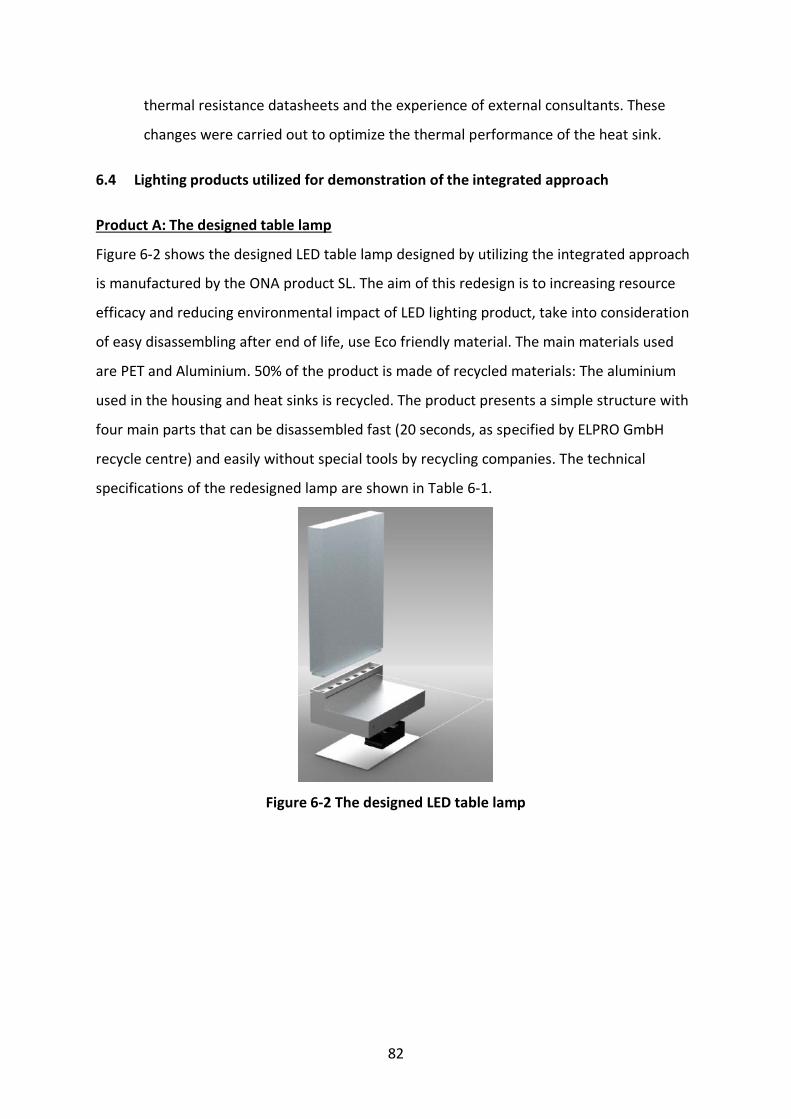
82
thermal resistance datasheets and the experience of external consultants. These
changes were carried out to optimize the thermal performance of the heat sink.
6.4 Lighting products utilized for demonstration of the integrated approach
Product A: The designed table lamp
Figure 6-2 shows the designed LED table lamp designed by utilizing the integrated approach
is manufactured by the ONA product SL. The aim of this redesign is to increasing resource
efficacy and reducing environmental impact of LED lighting product, take into consideration
of easy disassembling after end of life, use Eco friendly material. The main materials used
are PET and Aluminium. 50% of the product is made of recycled materials: The aluminium
used in the housing and heat sinks is recycled. The product presents a simple structure with
four main parts that can be disassembled fast (20 seconds, as specified by ELPRO GmbH
recycle centre) and easily without special tools by recycling companies. The technical
specifications of the redesigned lamp are shown in Table 6-1.
Figure 6-2 The designed LED table lamp
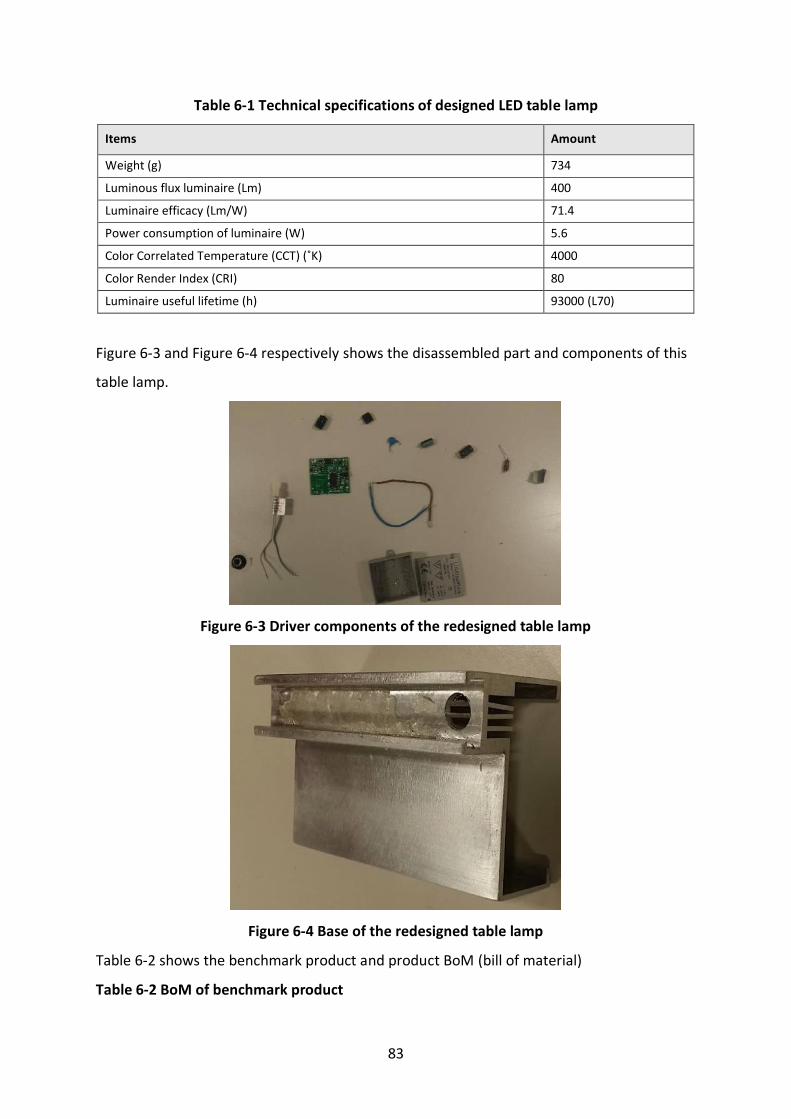
83
Table 6-1 Technical specifications of designed LED table lamp
Items Amount
Weight (g) 734
Luminous flux luminaire (Lm) 400
Luminaire efficacy (Lm/W) 71.4
Power consumption of luminaire (W) 5.6
Color Correlated Temperature (CCT) (˚K) 4000
Color Render Index (CRI) 80
Luminaire useful lifetime (h) 93000 (L70)
Figure 6-3 and Figure 6-4 respectively shows the disassembled part and components of this
table lamp.
Figure 6-3 Driver components of the redesigned table lamp
Figure 6-4 Base of the redesigned table lamp
Table 6-2 shows the benchmark product and product BoM (bill of material)
Table 6-2 BoM of benchmark product
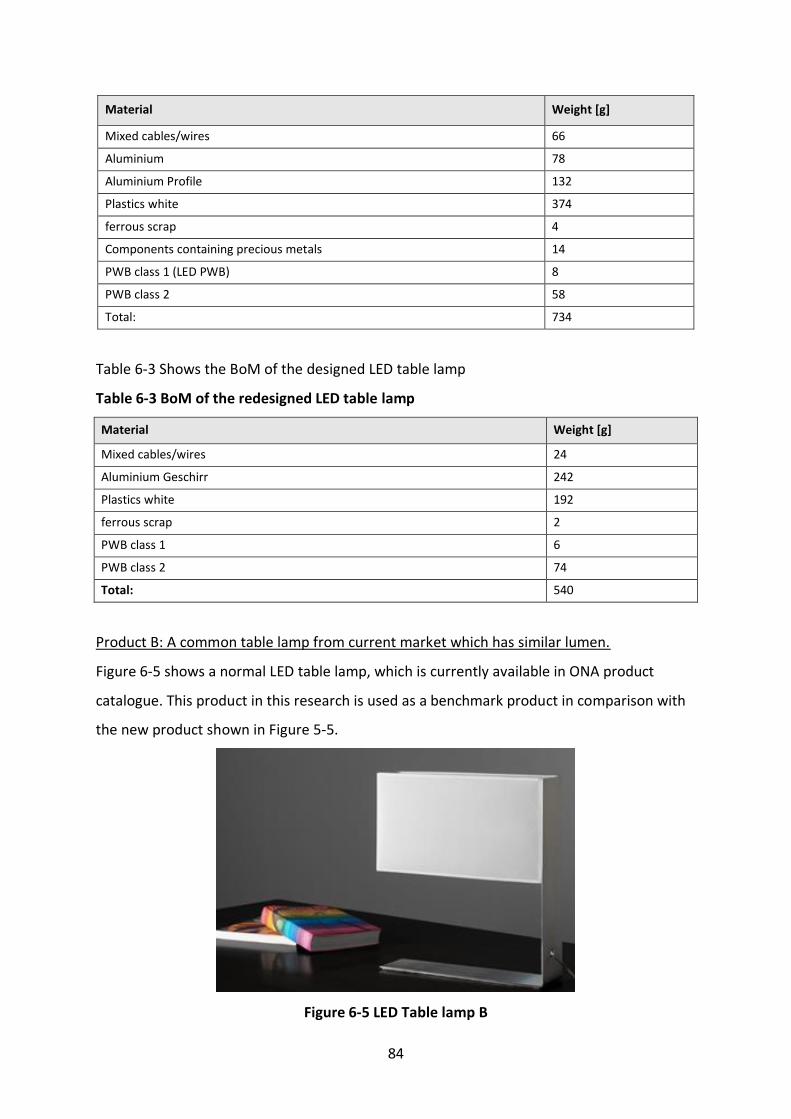
84
Material Weight [g]
Mixed cables/wires 66
Aluminium 78
Aluminium Profile 132
Plastics white 374
ferrous scrap 4
Components containing precious metals 14
PWB class 1 (LED PWB) 8
PWB class 2 58
Total: 734
Table 6-3 Shows the BoM of the designed LED table lamp
Table 6-3 BoM of the redesigned LED table lamp
Material Weight [g]
Mixed cables/wires 24
Aluminium Geschirr 242
Plastics white 192
ferrous scrap 2
PWB class 1 6
PWB class 2 74
Total: 540
Product B: A common table lamp from current market which has similar lumen.
Figure 6-5 shows a normal LED table lamp, which is currently available in ONA product
catalogue. This product in this research is used as a benchmark product in comparison with
the new product shown in Figure 5-5.
Figure 6-5 LED Table lamp B
85
Philips LED light bulb Product information:
Kelvin: 2700K
Lifetime (Hours) :15000
Lightbulb Shape: Classic
Lightbulb Type: LED
Lightbulb Wattage: 6W
Lumens: 470
The Experimental test has been conducted by utilising the tools mentioned above and
detailed in Chapter 7. The environmental LCA and social LCA are conducted using SimaPro
and openLCA, which are future detailed in Chapter 8 and Chapter 9.
6.5 Conclusions
This chapter offered an approach for the design, manufacturing and market deployment of
eco-lighting products in particular, and there is not such an approach in the current
literature. Although there are approaches and methods to eco-design products, these have
been developed to eco-design ‘generic’ products, and do not take into account the
particular characteristics of any specific category of products such as lighting products. A
novel up-to-date eco-design method to eco-design lighting products has been developed
and used base on the integration of specific eco-design tools such as eco-design guidelines,
regulations/directives, LCA software-based tools, testing tools and light analysis tools at a
specific time during the design and development process. The designed lighting products
present particular ‘environmental impact patterns’ in specific life cycle stages and
components, and also require specific types of methods, tools and eco-design strategies to
assess their environmental impact, and reduce/eliminate these impacts.
86
Chapter 7: Experimental Investigation of the LED Lighting Product
7.1 Evaluating the optical qualities of the lighting product
7.1.1 Optics criteria
Optics is an important field in physics used to study the behaviour of light, including how
different materials interact to produce different forms of light. This section will deal with
the optical characteristics of the designed eco-lighting product. More specifically, it will deal
with the light output of the product in terms of quantity of light, distribution of light and
colour characteristics. Other aspects such as dim-ability and control will also be considered.
A wide range of lighting simulation software exist on the market. A lot of them only deal
with daylight whilst others deal only with artificial lighting, and there are some that deal
with both. For this study, a range of criteria were put in place to test and select appropriate
lighting simulation software, as detailed below:
• Accuracy of results in predicting room illumination from artificial light sources;
• Ability to model a physical environment ranging in geometry, from the scale of a
whole building, to a room;
• Ability to define fluorescent and LED luminaire lighting specifications from existing
luminaires in the market and predict lighting performance in a space;
• Ability to provide rendered images of results;
7.1.2 Overview of selected tools
RADIANCE: It is a freely available radiosity-based lighting simulation program that uses a
backward ray-tracing process for simulation. It was developed by Lawrence Berkeley
Laboratory and its accuracy in lighting simulation is well established as it has been validated.
Radiance requires the 3D geometric information of a model to be provided as a text file,
usually derived from other software. Radiance is capable of handling complex geometries
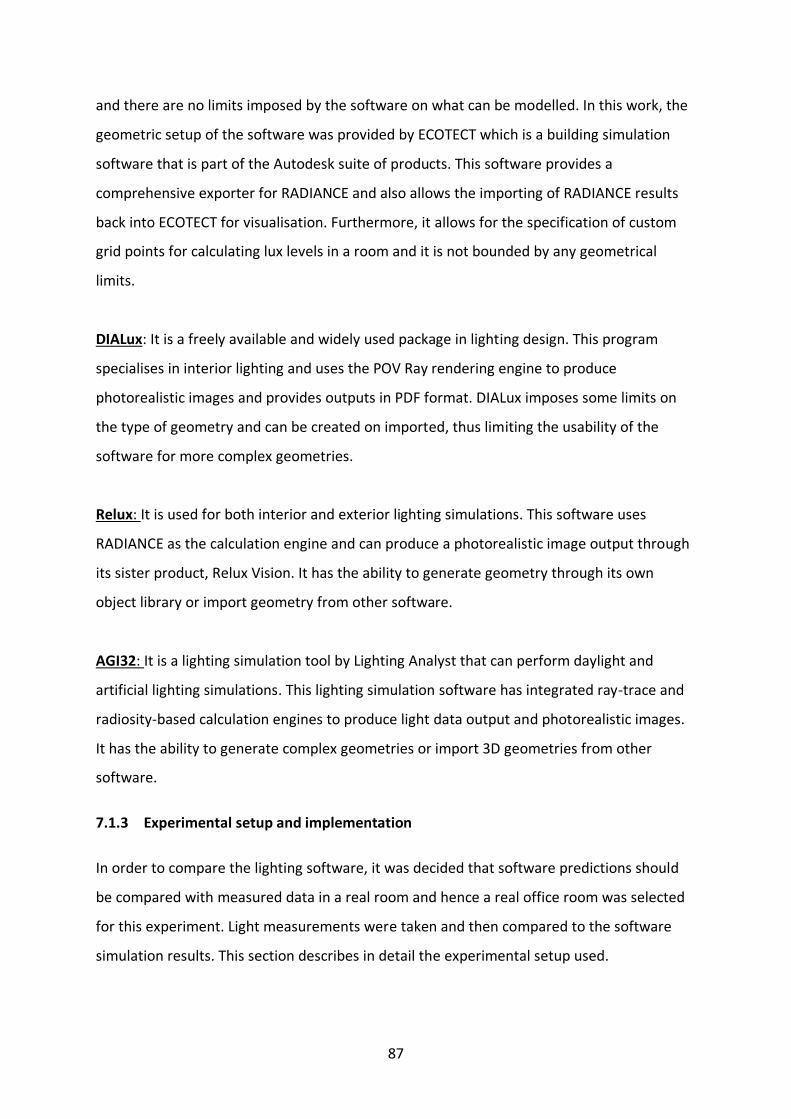
87
and there are no limits imposed by the software on what can be modelled. In this work, the
geometric setup of the software was provided by ECOTECT which is a building simulation
software that is part of the Autodesk suite of products. This software provides a
comprehensive exporter for RADIANCE and also allows the importing of RADIANCE results
back into ECOTECT for visualisation. Furthermore, it allows for the specification of custom
grid points for calculating lux levels in a room and it is not bounded by any geometrical
limits.
DIALux: It is a freely available and widely used package in lighting design. This program
specialises in interior lighting and uses the POV Ray rendering engine to produce
photorealistic images and provides outputs in PDF format. DIALux imposes some limits on
the type of geometry and can be created on imported, thus limiting the usability of the
software for more complex geometries.
Relux: It is used for both interior and exterior lighting simulations. This software uses
RADIANCE as the calculation engine and can produce a photorealistic image output through
its sister product, Relux Vision. It has the ability to generate geometry through its own
object library or import geometry from other software.
AGI32: It is a lighting simulation tool by Lighting Analyst that can perform daylight and
artificial lighting simulations. This lighting simulation software has integrated ray-trace and
radiosity-based calculation engines to produce light data output and photorealistic images.
It has the ability to generate complex geometries or import 3D geometries from other
software.
7.1.3 Experimental setup and implementation
In order to compare the lighting software, it was decided that software predictions should
be compared with measured data in a real room and hence a real office room was selected
for this experiment. Light measurements were taken and then compared to the software
simulation results. This section describes in detail the experimental setup used.
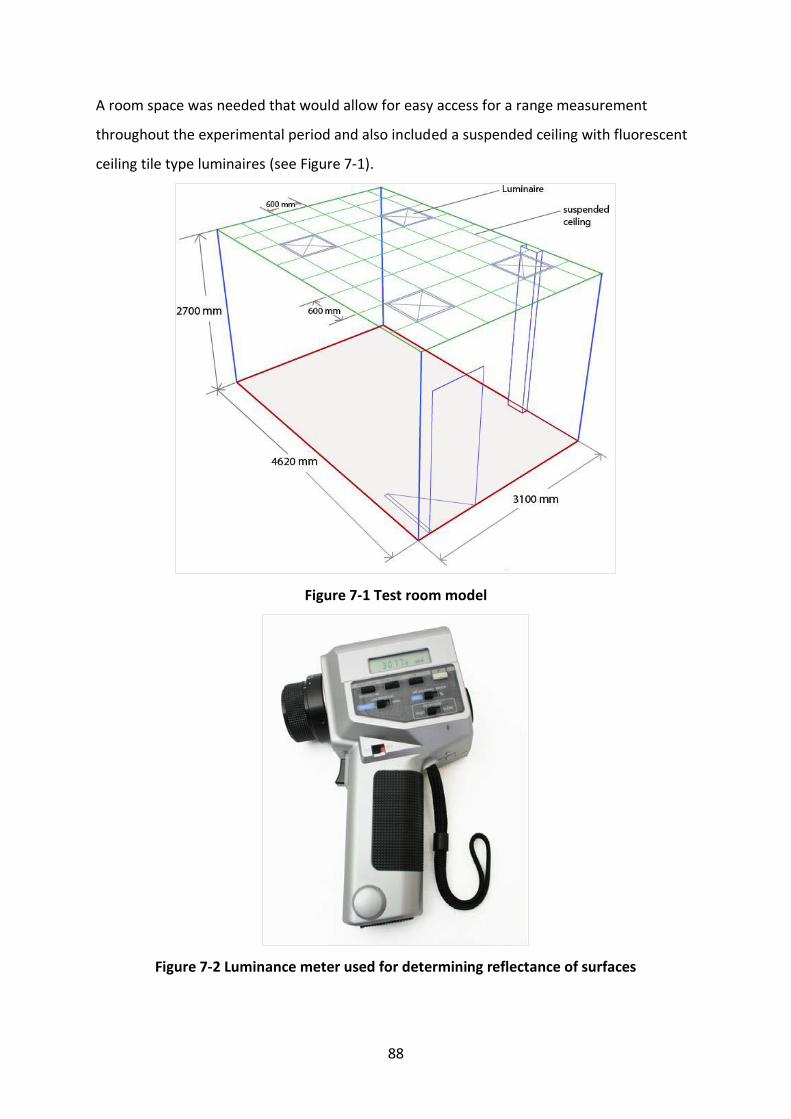
88
A room space was needed that would allow for easy access for a range measurement
throughout the experimental period and also included a suspended ceiling with fluorescent
ceiling tile type luminaires (see Figure 7-1).
Figure 7-1 Test room model
Figure 7-2 Luminance meter used for determining reflectance of surfaces
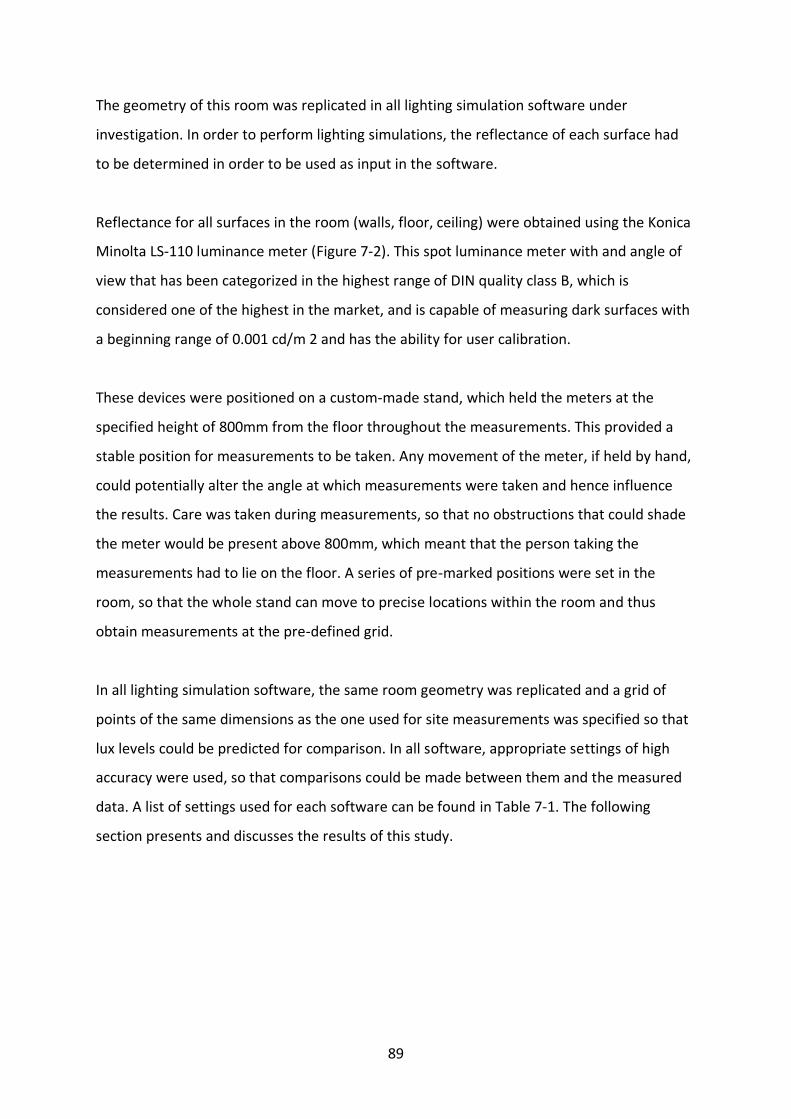
89
The geometry of this room was replicated in all lighting simulation software under
investigation. In order to perform lighting simulations, the reflectance of each surface had
to be determined in order to be used as input in the software.
Reflectance for all surfaces in the room (walls, floor, ceiling) were obtained using the Konica
Minolta LS-110 luminance meter (Figure 7-2). This spot luminance meter with and angle of
view that has been categorized in the highest range of DIN quality class B, which is
considered one of the highest in the market, and is capable of measuring dark surfaces with
a beginning range of 0.001 cd/m 2 and has the ability for user calibration.
These devices were positioned on a custom-made stand, which held the meters at the
specified height of 800mm from the floor throughout the measurements. This provided a
stable position for measurements to be taken. Any movement of the meter, if held by hand,
could potentially alter the angle at which measurements were taken and hence influence
the results. Care was taken during measurements, so that no obstructions that could shade
the meter would be present above 800mm, which meant that the person taking the
measurements had to lie on the floor. A series of pre-marked positions were set in the
room, so that the whole stand can move to precise locations within the room and thus
obtain measurements at the pre-defined grid.
In all lighting simulation software, the same room geometry was replicated and a grid of
points of the same dimensions as the one used for site measurements was specified so that
lux levels could be predicted for comparison. In all software, appropriate settings of high
accuracy were used, so that comparisons could be made between them and the measured
data. A list of settings used for each software can be found in Table 7-1. The following
section presents and discusses the results of this study.
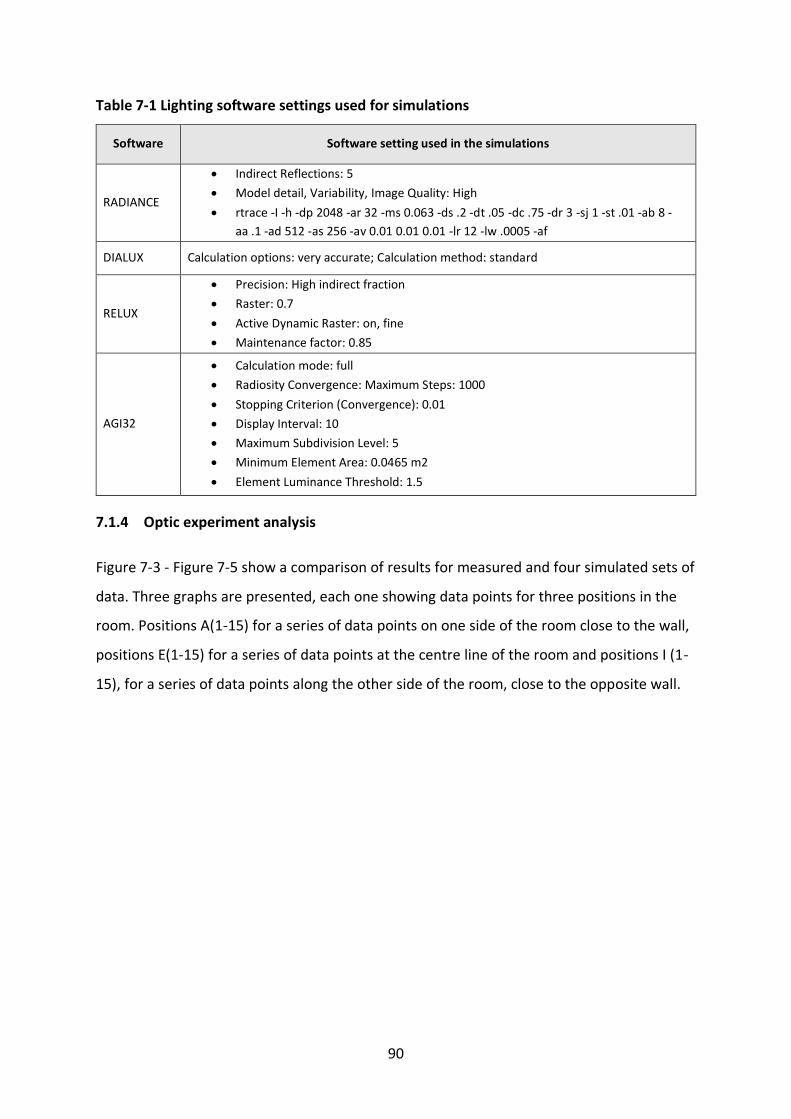
90
Table 7-1 Lighting software settings used for simulations
Software Software setting used in the simulations
RADIANCE
• Indirect Reflections: 5
• Model detail, Variability, Image Quality: High
• rtrace -I -h -dp 2048 -ar 32 -ms 0.063 -ds .2 -dt .05 -dc .75 -dr 3 -sj 1 -st .01 -ab 8 -
aa .1 -ad 512 -as 256 -av 0.01 0.01 0.01 -lr 12 -lw .0005 -af
DIALUX Calculation options: very accurate; Calculation method: standard
RELUX
• Precision: High indirect fraction
• Raster: 0.7
• Active Dynamic Raster: on, fine
• Maintenance factor: 0.85
AGI32
• Calculation mode: full
• Radiosity Convergence: Maximum Steps: 1000
• Stopping Criterion (Convergence): 0.01
• Display Interval: 10
• Maximum Subdivision Level: 5
• Minimum Element Area: 0.0465 m2
• Element Luminance Threshold: 1.5
7.1.4 Optic experiment analysis
Figure 7-3 - Figure 7-5 show a comparison of results for measured and four simulated sets of
data. Three graphs are presented, each one showing data points for three positions in the
room. Positions A(1-15) for a series of data points on one side of the room close to the wall,
positions E(1-15) for a series of data points at the centre line of the room and positions I (1-
15), for a series of data points along the other side of the room, close to the opposite wall.
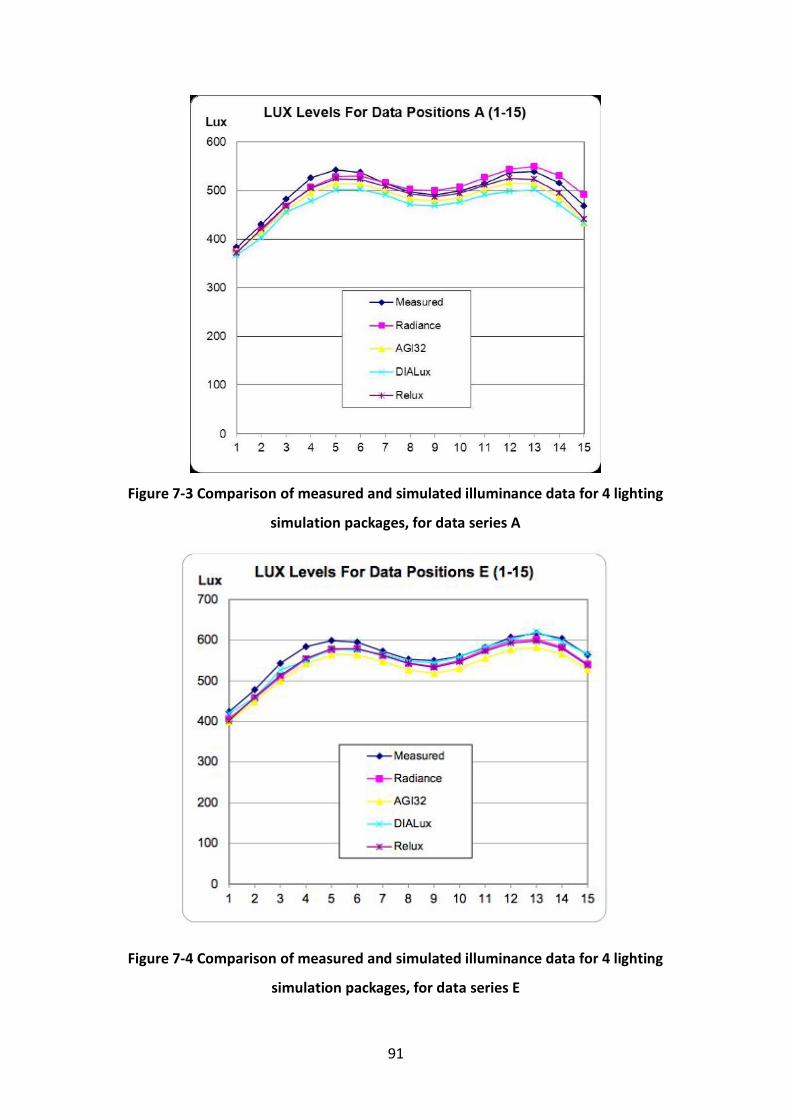
91
Figure 7-3 Comparison of measured and simulated illuminance data for 4 lighting
simulation packages, for data series A
Figure 7-4 Comparison of measured and simulated illuminance data for 4 lighting
simulation packages, for data series E
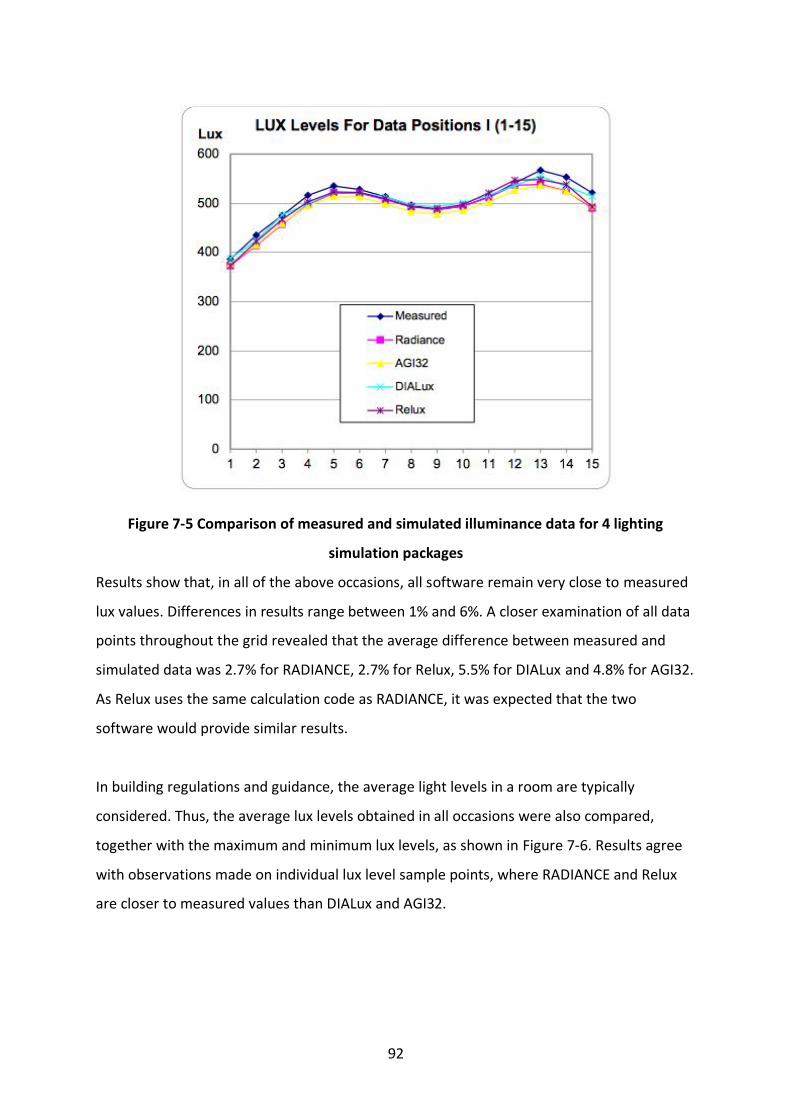
92
Figure 7-5 Comparison of measured and simulated illuminance data for 4 lighting
simulation packages
Results show that, in all of the above occasions, all software remain very close to measured
lux values. Differences in results range between 1% and 6%. A closer examination of all data
points throughout the grid revealed that the average difference between measured and
simulated data was 2.7% for RADIANCE, 2.7% for Relux, 5.5% for DIALux and 4.8% for AGI32.
As Relux uses the same calculation code as RADIANCE, it was expected that the two
software would provide similar results.
In building regulations and guidance, the average light levels in a room are typically
considered. Thus, the average lux levels obtained in all occasions were also compared,
together with the maximum and minimum lux levels, as shown in Figure 7-6. Results agree
with observations made on individual lux level sample points, where RADIANCE and Relux
are closer to measured values than DIALux and AGI32.
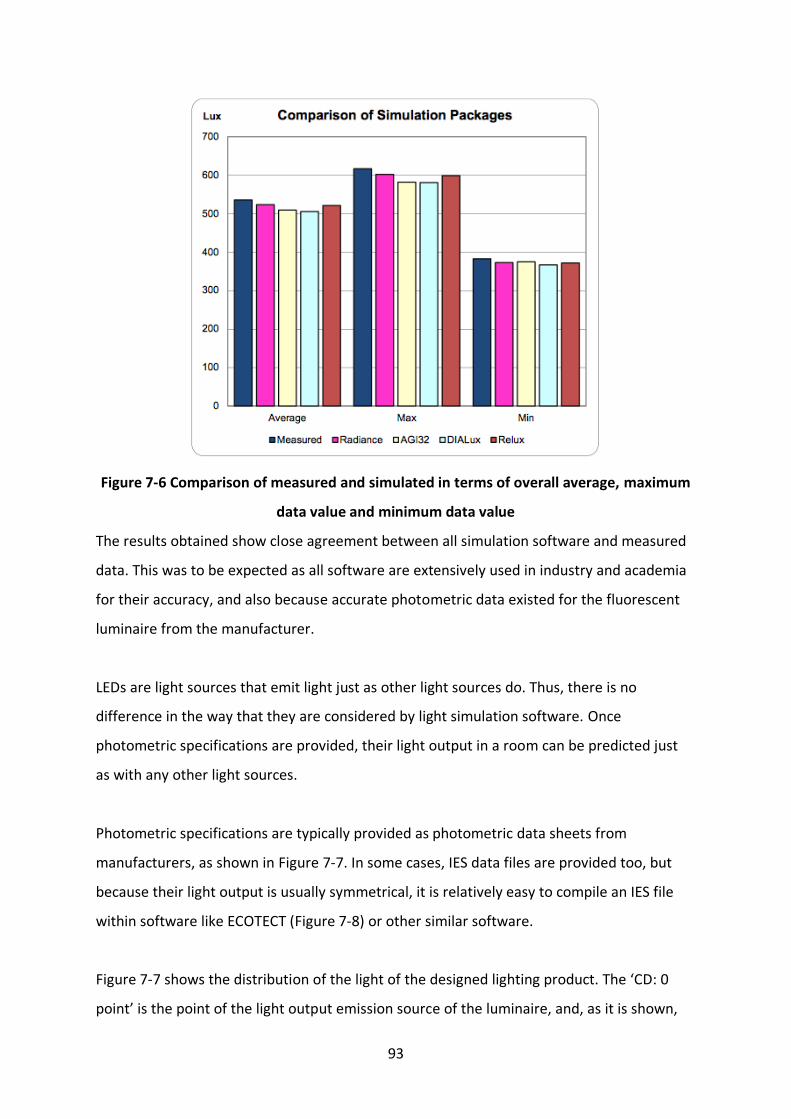
93
Figure 7-6 Comparison of measured and simulated in terms of overall average, maximum
data value and minimum data value
The results obtained show close agreement between all simulation software and measured
data. This was to be expected as all software are extensively used in industry and academia
for their accuracy, and also because accurate photometric data existed for the fluorescent
luminaire from the manufacturer.
LEDs are light sources that emit light just as other light sources do. Thus, there is no
difference in the way that they are considered by light simulation software. Once
photometric specifications are provided, their light output in a room can be predicted just
as with any other light sources.
Photometric specifications are typically provided as photometric data sheets from
manufacturers, as shown in Figure 7-7. In some cases, IES data files are provided too, but
because their light output is usually symmetrical, it is relatively easy to compile an IES file
within software like ECOTECT (Figure 7-8) or other similar software.
Figure 7-7 shows the distribution of the light of the designed lighting product. The ‘CD: 0
point’ is the point of the light output emission source of the luminaire, and, as it is shown,
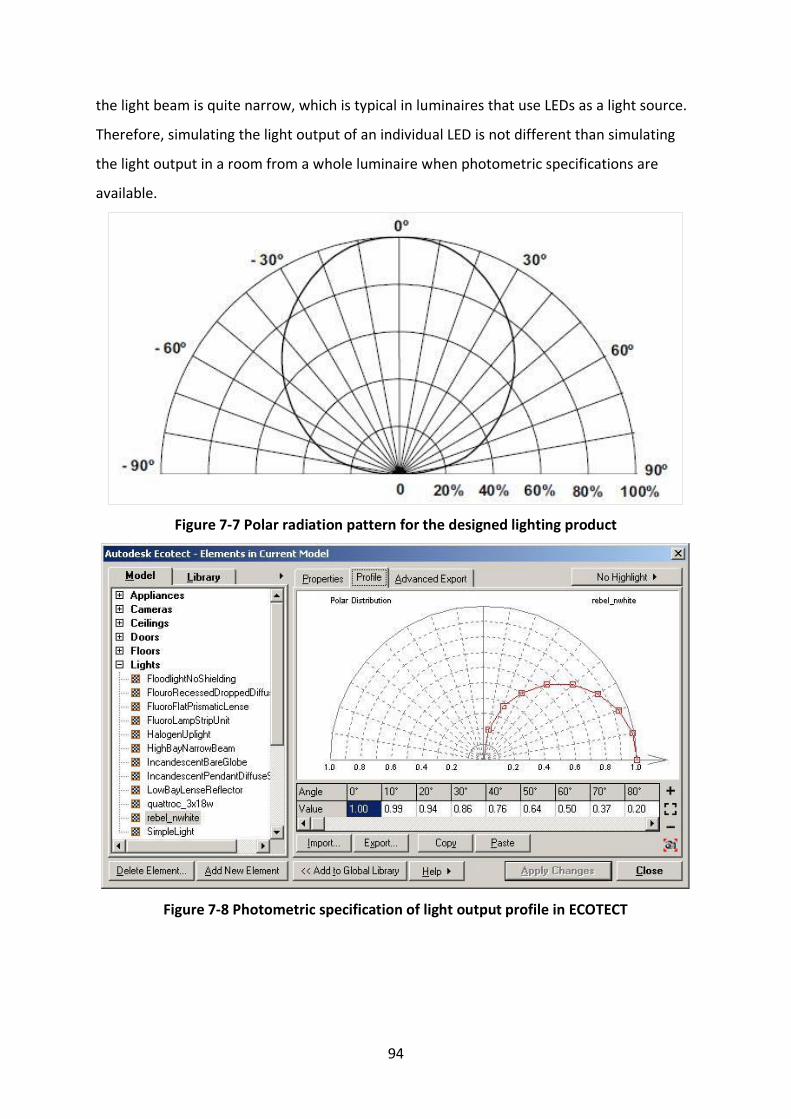
94
the light beam is quite narrow, which is typical in luminaires that use LEDs as a light source.
Therefore, simulating the light output of an individual LED is not different than simulating
the light output in a room from a whole luminaire when photometric specifications are
available.
Figure 7-7 Polar radiation pattern for the designed lighting product
Figure 7-8 Photometric specification of light output profile in ECOTECT
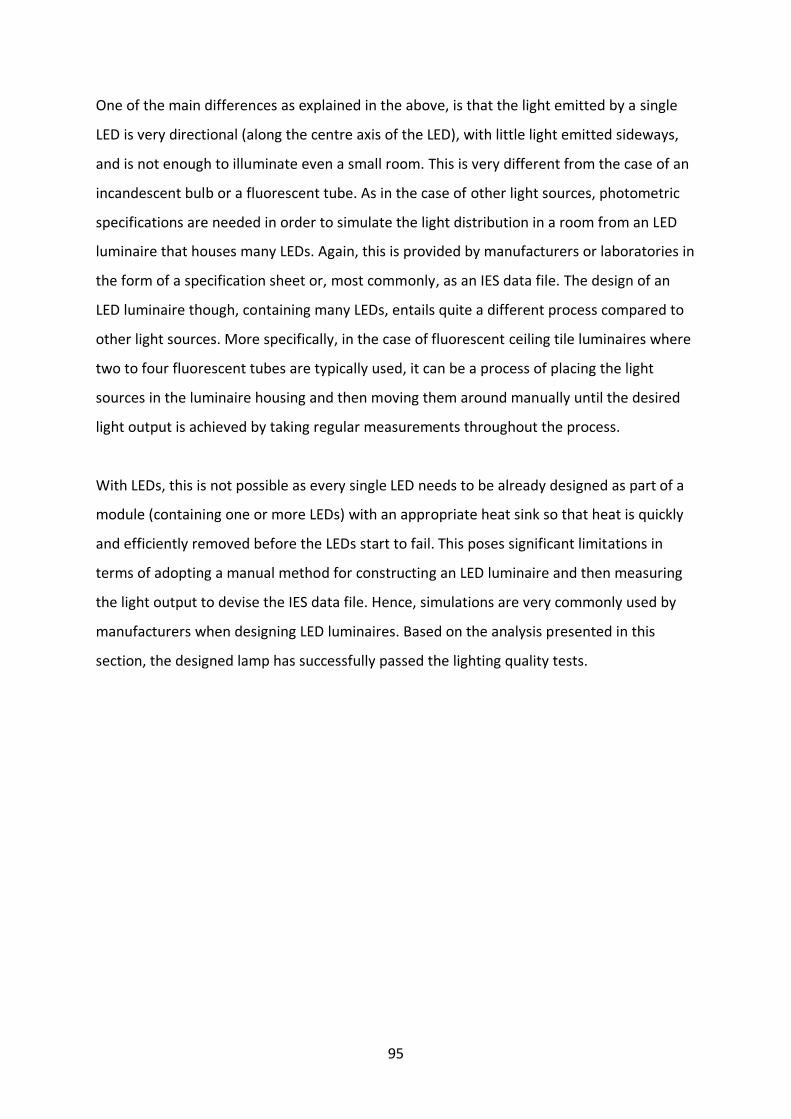
95
One of the main differences as explained in the above, is that the light emitted by a single
LED is very directional (along the centre axis of the LED), with little light emitted sideways,
and is not enough to illuminate even a small room. This is very different from the case of an
incandescent bulb or a fluorescent tube. As in the case of other light sources, photometric
specifications are needed in order to simulate the light distribution in a room from an LED
luminaire that houses many LEDs. Again, this is provided by manufacturers or laboratories in
the form of a specification sheet or, most commonly, as an IES data file. The design of an
LED luminaire though, containing many LEDs, entails quite a different process compared to
other light sources. More specifically, in the case of fluorescent ceiling tile luminaires where
two to four fluorescent tubes are typically used, it can be a process of placing the light
sources in the luminaire housing and then moving them around manually until the desired
light output is achieved by taking regular measurements throughout the process.
With LEDs, this is not possible as every single LED needs to be already designed as part of a
module (containing one or more LEDs) with an appropriate heat sink so that heat is quickly
and efficiently removed before the LEDs start to fail. This poses significant limitations in
terms of adopting a manual method for constructing an LED luminaire and then measuring
the light output to devise the IES data file. Hence, simulations are very commonly used by
manufacturers when designing LED luminaires. Based on the analysis presented in this
section, the designed lamp has successfully passed the lighting quality tests.
96
Chapter 8: Environmental Life Cycle Assessment of the LED Lighting Product
8.1 Introduction
LCA is best practiced as an iterative process, where the findings at each stage influence
changes and improvements in the others to arrive at a study design that is of adequate
quality to meet the defined goals. The principles, framework, requirements and guidelines
to perform an LCA are described by the international standards ISO 14040 series (ISO,
2006a).
This chapter offers the LCA methodology and the scope of the study (section 8.2), the
inventory data used and the assumptions (section 8.3 - 8.5), the LCIA results of the ONA LED
lighting product (section 8.6), and conclusions and recommendation (section 8.7 - 8.8).
8.2 Goal and scope
8.2.1 Function and Functional Unit
The function of ONA lighting products is to provide efficient lighting service in a domestic
environment. The functional unit quantifies the performance of a product system and is
used as a reference unit for which the life cycle assessment study is performed, and the
results are presented. It is therefore critical that this parameter is clearly defined and
measurable.
The function of a luminaire is to produce a specific quantity and quality of light for a period
of time. The quantity of light is measured with the luminous flux (lm) emitted by the
luminaire, and the quality of light is mainly measured with the correlated colour
temperature (CCT) and the colour rendering index (CRI). Therefore, the functional unit used
in this LCA is considered as the production of 948 lm of light (quantity of light) of CCT=4000
K, and CRI=65 (quality of light) for 40,000 hours. Therefore, the function unit in this study is
defined below:
97
Functional unit = 1 luminaire providing lighting service 948 Lumens per hour + 40,000
working hours
8.2.2 Product General Description
The ONA luminaire is a table lamp (see Figure 5-5.) and its’ technique specification is listed
in Table 8-1.
Table 8-1 The technical specification of the table lamp
Item Amount
LED useful lifetime 40,000 hours
Energy consumption (luminaire) 6.7 Watts
Luminous flux (Luminaire) 102.5 Lm
Luminaire efficacy 15.29 Lm/Watts
Light source efficacy 56.66 Lm/Watts
Luminous flux (Light source) 340 Lm
CRI (light source) 65
CCT (light source) 4000 °K
Beam angle - vertical spread (luminaire) 102.1°
Beam angle- horizontal spread (luminaire) 96.3°
8.2.3 System boundaries
The setting of system boundaries identifies the stages, processes and flows considered in
the LCA and should include:
• All activities relevant to achieve the present LCA study objectives and therefore
necessary to carry out the studied function; and
• All the processes and flows that significantly contribute to the potential
environmental impacts.
This section describes the life cycle stages of the studied systems and determines which
processes and flows are included in the LCA, i.e., what is considered to be in the system and
is therefore analysed, and what is outside the system boundaries and therefore not
included in the assessment.
The boundaries of this assessment comprise cradle-to-grave luminaire’s life cycle processes.
The processes related with the packaging (i.e., manufacturing, transport, use and end of life
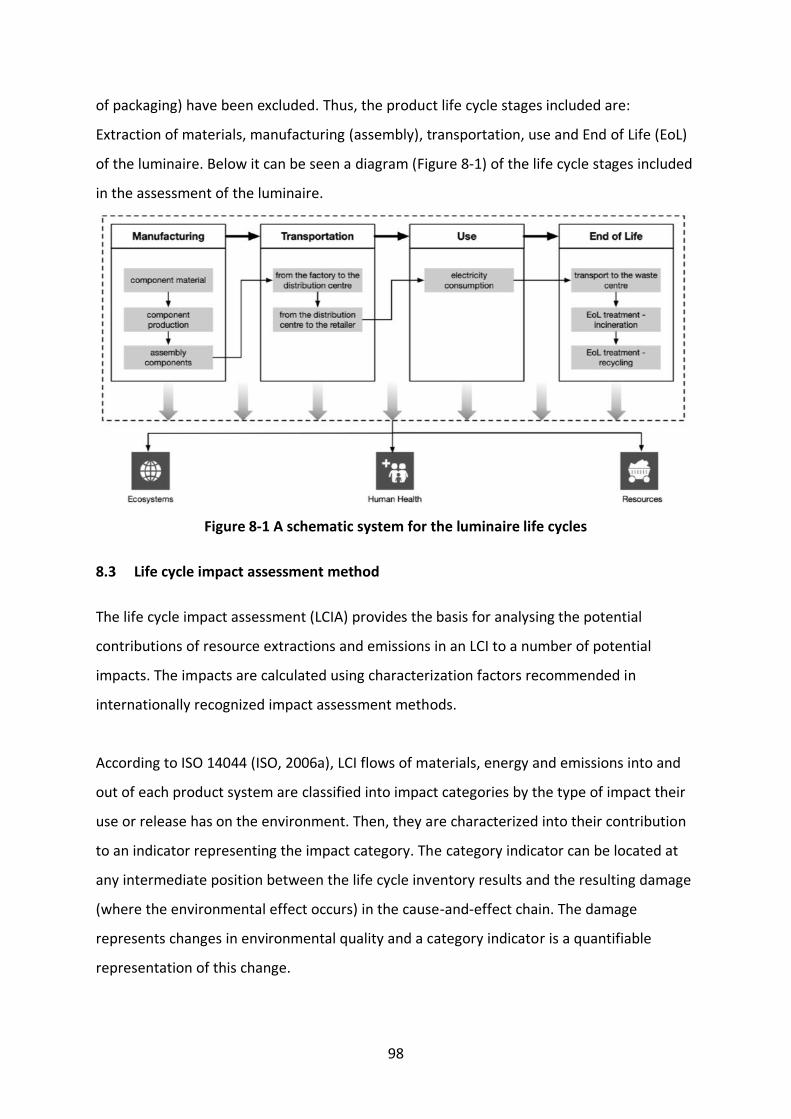
98
of packaging) have been excluded. Thus, the product life cycle stages included are:
Extraction of materials, manufacturing (assembly), transportation, use and End of Life (EoL)
of the luminaire. Below it can be seen a diagram (Figure 8-1) of the life cycle stages included
in the assessment of the luminaire.
Figure 8-1 A schematic system for the luminaire life cycles
8.3 Life cycle impact assessment method
The life cycle impact assessment (LCIA) provides the basis for analysing the potential
contributions of resource extractions and emissions in an LCI to a number of potential
impacts. The impacts are calculated using characterization factors recommended in
internationally recognized impact assessment methods.
According to ISO 14044 (ISO, 2006a), LCI flows of materials, energy and emissions into and
out of each product system are classified into impact categories by the type of impact their
use or release has on the environment. Then, they are characterized into their contribution
to an indicator representing the impact category. The category indicator can be located at
any intermediate position between the life cycle inventory results and the resulting damage
(where the environmental effect occurs) in the cause-and-effect chain. The damage
represents changes in environmental quality and a category indicator is a quantifiable
representation of this change.
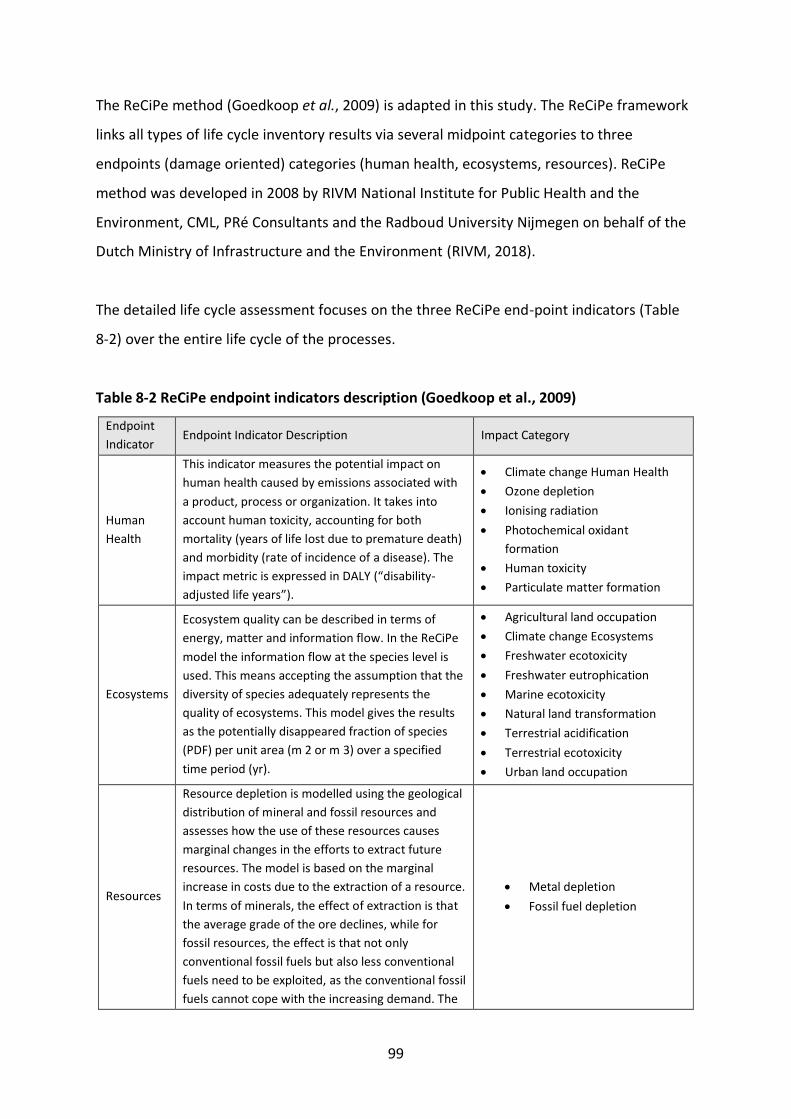
99
The ReCiPe method (Goedkoop et al., 2009) is adapted in this study. The ReCiPe framework
links all types of life cycle inventory results via several midpoint categories to three
endpoints (damage oriented) categories (human health, ecosystems, resources). ReCiPe
method was developed in 2008 by RIVM National Institute for Public Health and the
Environment, CML, PRé Consultants and the Radboud University Nijmegen on behalf of the
Dutch Ministry of Infrastructure and the Environment (RIVM, 2018).
The detailed life cycle assessment focuses on the three ReCiPe end-point indicators (Table
8-2) over the entire life cycle of the processes.
Table 8-2 ReCiPe endpoint indicators description (Goedkoop et al., 2009)
Endpoint
Indicator Endpoint Indicator Description Impact Category
Human
Health
This indicator measures the potential impact on
human health caused by emissions associated with
a product, process or organization. It takes into
account human toxicity, accounting for both
mortality (years of life lost due to premature death)
and morbidity (rate of incidence of a disease). The
impact metric is expressed in DALY (“disability-
adjusted life years”).
• Climate change Human Health
• Ozone depletion
• Ionising radiation
• Photochemical oxidant
formation
• Human toxicity
• Particulate matter formation
Ecosystems
Ecosystem quality can be described in terms of
energy, matter and information flow. In the ReCiPe
model the information flow at the species level is
used. This means accepting the assumption that the
diversity of species adequately represents the
quality of ecosystems. This model gives the results
as the potentially disappeared fraction of species
(PDF) per unit area (m 2 or m 3) over a specified
time period (yr).
• Agricultural land occupation
• Climate change Ecosystems
• Freshwater ecotoxicity
• Freshwater eutrophication
• Marine ecotoxicity
• Natural land transformation
• Terrestrial acidification
• Terrestrial ecotoxicity
• Urban land occupation
Resources
Resource depletion is modelled using the geological
distribution of mineral and fossil resources and
assesses how the use of these resources causes
marginal changes in the efforts to extract future
resources. The model is based on the marginal
increase in costs due to the extraction of a resource.
In terms of minerals, the effect of extraction is that
the average grade of the ore declines, while for
fossil resources, the effect is that not only
conventional fossil fuels but also less conventional
fuels need to be exploited, as the conventional fossil
fuels cannot cope with the increasing demand. The
• Metal depletion
• Fossil fuel depletion
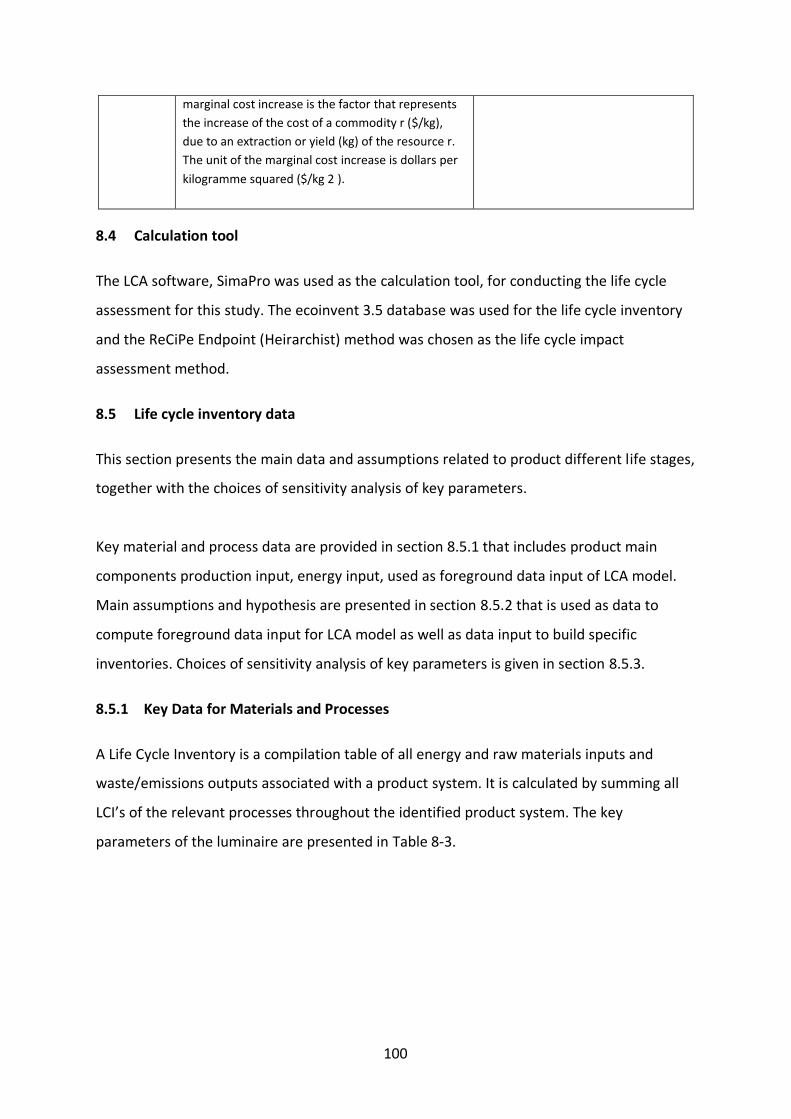
100
marginal cost increase is the factor that represents
the increase of the cost of a commodity r ($/kg),
due to an extraction or yield (kg) of the resource r.
The unit of the marginal cost increase is dollars per
kilogramme squared ($/kg 2 ).
8.4 Calculation tool
The LCA software, SimaPro was used as the calculation tool, for conducting the life cycle
assessment for this study. The ecoinvent 3.5 database was used for the life cycle inventory
and the ReCiPe Endpoint (Heirarchist) method was chosen as the life cycle impact
assessment method.
8.5 Life cycle inventory data
This section presents the main data and assumptions related to product different life stages,
together with the choices of sensitivity analysis of key parameters.
Key material and process data are provided in section 8.5.1 that includes product main
components production input, energy input, used as foreground data input of LCA model.
Main assumptions and hypothesis are presented in section 8.5.2 that is used as data to
compute foreground data input for LCA model as well as data input to build specific
inventories. Choices of sensitivity analysis of key parameters is given in section 8.5.3.
8.5.1 Key Data for Materials and Processes
A Life Cycle Inventory is a compilation table of all energy and raw materials inputs and
waste/emissions outputs associated with a product system. It is calculated by summing all
LCI’s of the relevant processes throughout the identified product system. The key
parameters of the luminaire are presented in Table 8-3.
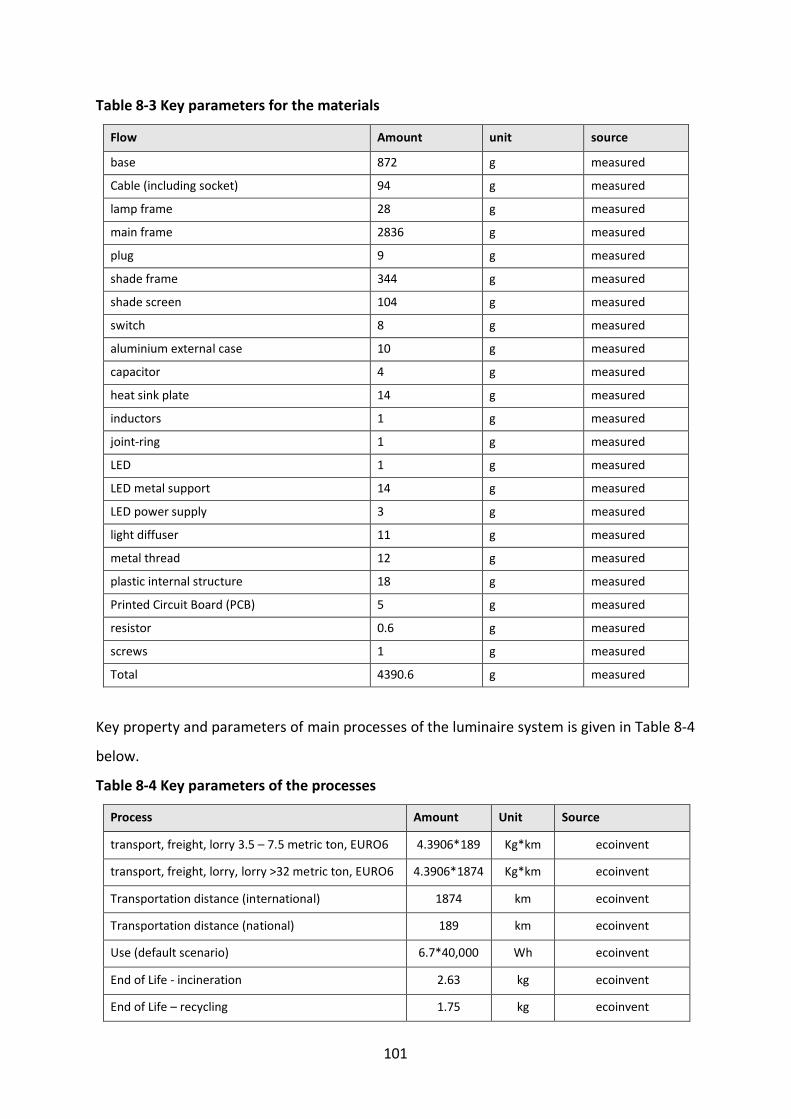
101
Table 8-3 Key parameters for the materials
Flow Amount unit source
base 872 g measured
Cable (including socket) 94 g measured
lamp frame 28 g measured
main frame 2836 g measured
plug 9 g measured
shade frame 344 g measured
shade screen 104 g measured
switch 8 g measured
aluminium external case 10 g measured
capacitor 4 g measured
heat sink plate 14 g measured
inductors 1 g measured
joint-ring 1 g measured
LED 1 g measured
LED metal support 14 g measured
LED power supply 3 g measured
light diffuser 11 g measured
metal thread 12 g measured
plastic internal structure 18 g measured
Printed Circuit Board (PCB) 5 g measured
resistor 0.6 g measured
screws 1 g measured
Total 4390.6 g measured
Key property and parameters of main processes of the luminaire system is given in Table 8-4
below.
Table 8-4 Key parameters of the processes
Process Amount Unit Source
transport, freight, lorry 3.5 – 7.5 metric ton, EURO6 4.3906*189 Kg*km ecoinvent
transport, freight, lorry, lorry >32 metric ton, EURO6 4.3906*1874 Kg*km ecoinvent
Transportation distance (international) 1874 km ecoinvent
Transportation distance (national) 189 km ecoinvent
Use (default scenario) 6.7*40,000 Wh ecoinvent
End of Life - incineration 2.63 kg ecoinvent
End of Life – recycling 1.75 kg ecoinvent
102
8.5.2 Data assumptions
The power cable and socket production have been assessed by selecting an average generic
cable (from a typical computer desktop cable) available in ecoinvent databases.
Some plastic-based materials of components: switch (casing), LED bulb (joint ring, internal
structure and light diffuser) and LED bulb holder, could not be identified by the authors and
suppliers. In one case (internal structure of LED lamp) it could be identified, but the material
(PBT) could not be found in the analysis software databases. Due to this data gap,
assumptions based on closer material available selected. It was assumed that the plastic
used in the switch was transparent polycarbonate (which is sometimes used in transparent
casings’ switches), and that the material used for the LED bulb plastic internal structure was
PET, because is close related (in terms of composition) with PBT (real material of the part).
PET was selected for the LED lamp diffuser, and for the joint ring, and Polycarbonate was
selected for the LED bulb holder.
8.6 Life cycle impact assessment results
This section presents first the LCIA results for default and sensitivity scenarios. The goal is to
identify and understand the most influencing stages or parameters to overall comparative
LCA results.
8.6.1 Default scenario analysis
The parameters, methodological choices and assumptions used when modelling the product
systems present a certain degree of uncertainty and variability. It is important to evaluate
whether the choice of parameters, methods, and assumptions significantly influences the
study’s conclusions and to what extent the findings are dependent upon certain sets of
conditions. Following the ISO 14044 standard (ISO, 2006a), sensitivity analyses are used to
study the influence of the uncertainty and variability of modelling assumptions and data on
the results and conclusions, thereby evaluating their robustness and reliability. Sensitivity
analyses help in the interpretation phase to understand the uncertainty of results and
identify limitations.
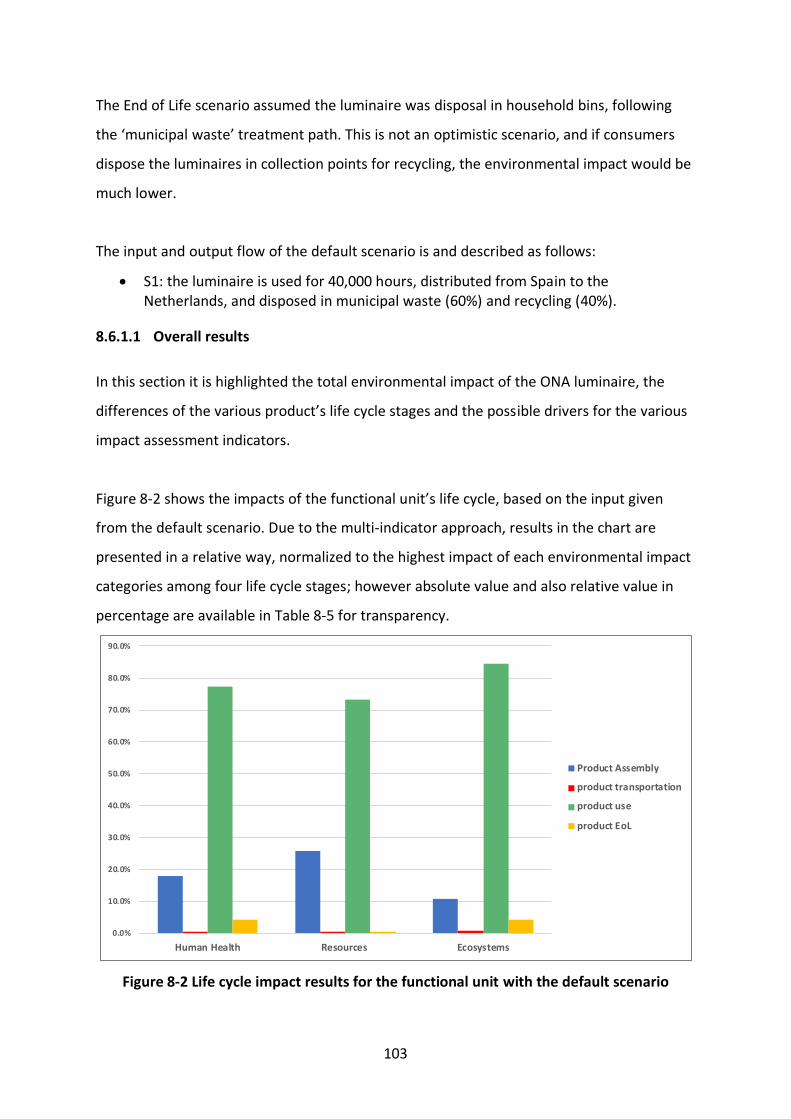
103
The End of Life scenario assumed the luminaire was disposal in household bins, following
the ‘municipal waste’ treatment path. This is not an optimistic scenario, and if consumers
dispose the luminaires in collection points for recycling, the environmental impact would be
much lower.
The input and output flow of the default scenario is and described as follows:
• S1: the luminaire is used for 40,000 hours, distributed from Spain to the Netherlands, and disposed in municipal waste (60%) and recycling (40%).
8.6.1.1 Overall results
In this section it is highlighted the total environmental impact of the ONA luminaire, the
differences of the various product’s life cycle stages and the possible drivers for the various
impact assessment indicators.
Figure 8-2 shows the impacts of the functional unit’s life cycle, based on the input given
from the default scenario. Due to the multi-indicator approach, results in the chart are
presented in a relative way, normalized to the highest impact of each environmental impact
categories among four life cycle stages; however absolute value and also relative value in
percentage are available in Table 8-5 for transparency.
Figure 8-2 Life cycle impact results for the functional unit with the default scenario
0.0%
10.0%
20.0%
30.0%
40.0%
50.0%
60.0%
70.0%
80.0%
90.0%
Human Health Resources Ecosystems
Product Assembly
product transportation
product use
product EoL
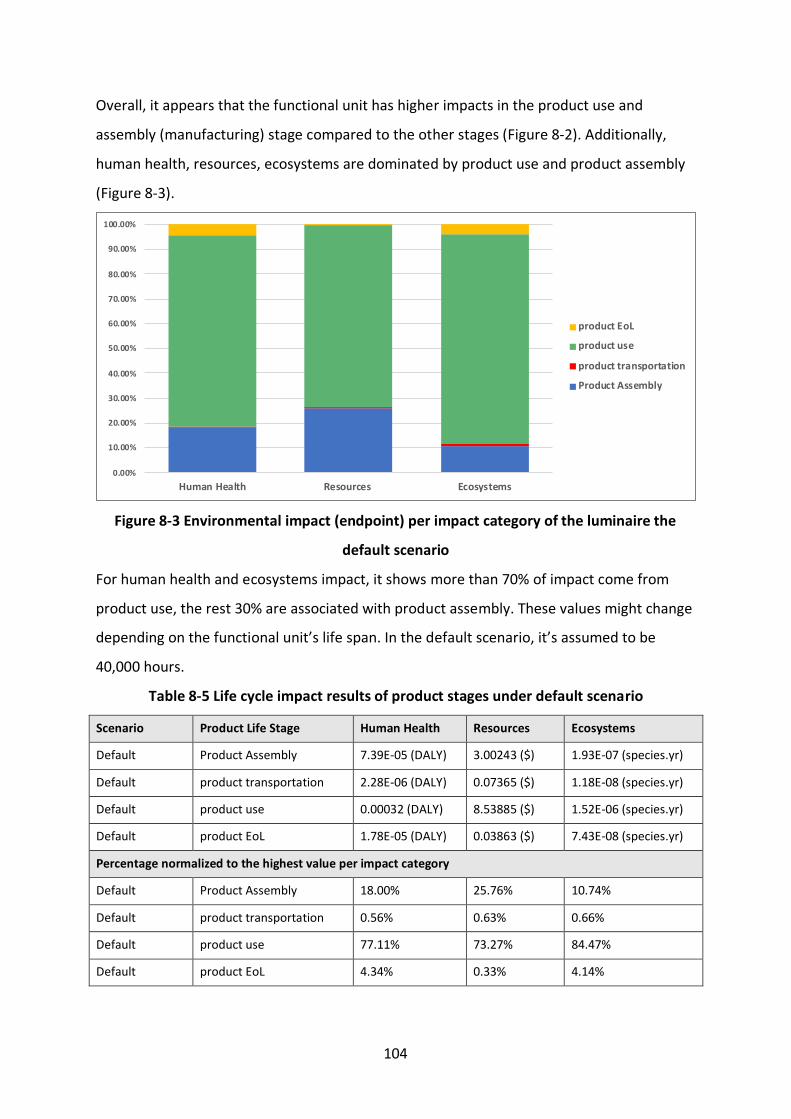
104
Overall, it appears that the functional unit has higher impacts in the product use and
assembly (manufacturing) stage compared to the other stages (Figure 8-2). Additionally,
human health, resources, ecosystems are dominated by product use and product assembly
(Figure 8-3).
Figure 8-3 Environmental impact (endpoint) per impact category of the luminaire the
default scenario
For human health and ecosystems impact, it shows more than 70% of impact come from
product use, the rest 30% are associated with product assembly. These values might change
depending on the functional unit’s life span. In the default scenario, it’s assumed to be
40,000 hours.
Table 8-5 Life cycle impact results of product stages under default scenario
Scenario Product Life Stage Human Health Resources Ecosystems
Default Product Assembly 7.39E-05 (DALY) 3.00243 ($) 1.93E-07 (species.yr)
Default product transportation 2.28E-06 (DALY) 0.07365 ($) 1.18E-08 (species.yr)
Default product use 0.00032 (DALY) 8.53885 ($) 1.52E-06 (species.yr)
Default product EoL 1.78E-05 (DALY) 0.03863 ($) 7.43E-08 (species.yr)
Percentage normalized to the highest value per impact category
Default Product Assembly 18.00% 25.76% 10.74%
Default product transportation 0.56% 0.63% 0.66%
Default product use 77.11% 73.27% 84.47%
Default product EoL 4.34% 0.33% 4.14%
0.00%
10.00%
20.00%
30.00%
40.00%
50.00%
60.00%
70.00%
80.00%
90.00%
100.00%
Human Health Resources Ecosystems
product EoL
product use
product transportation
Product Assembly
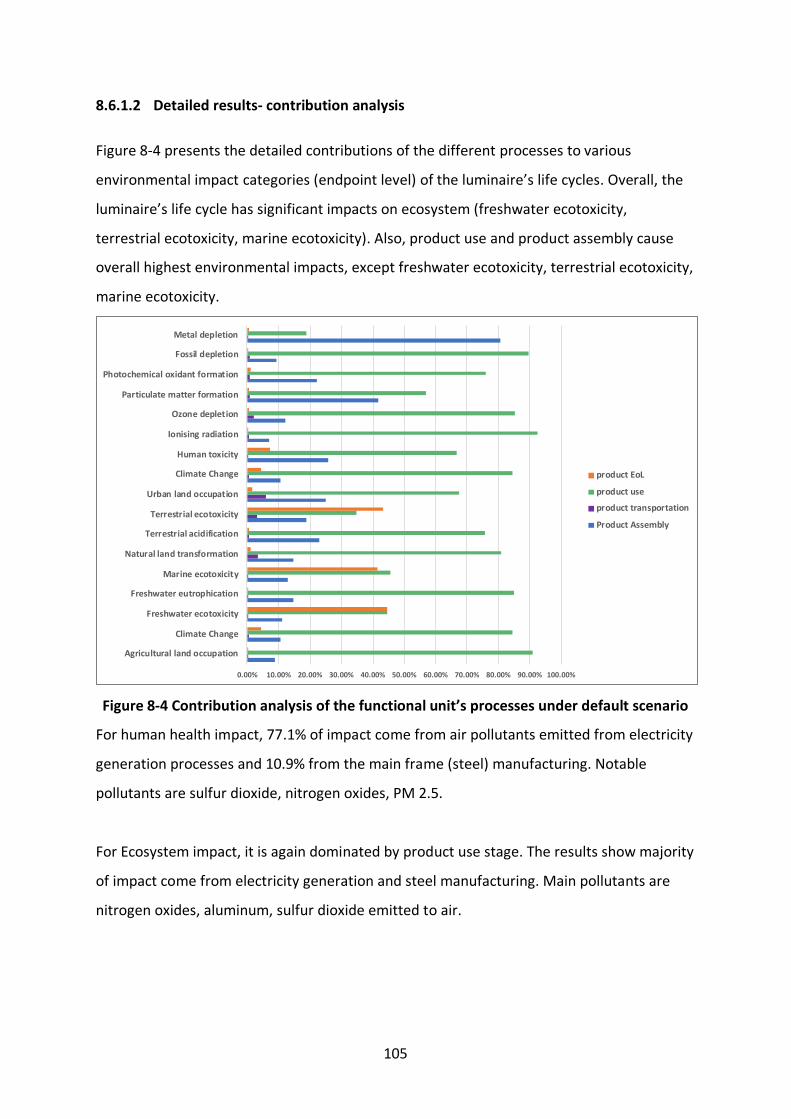
105
8.6.1.2 Detailed results- contribution analysis
Figure 8-4 presents the detailed contributions of the different processes to various
environmental impact categories (endpoint level) of the luminaire’s life cycles. Overall, the
luminaire’s life cycle has significant impacts on ecosystem (freshwater ecotoxicity,
terrestrial ecotoxicity, marine ecotoxicity). Also, product use and product assembly cause
overall highest environmental impacts, except freshwater ecotoxicity, terrestrial ecotoxicity,
marine ecotoxicity.
Figure 8-4 Contribution analysis of the functional unit’s processes under default scenario
For human health impact, 77.1% of impact come from air pollutants emitted from electricity
generation processes and 10.9% from the main frame (steel) manufacturing. Notable
pollutants are sulfur dioxide, nitrogen oxides, PM 2.5.
For Ecosystem impact, it is again dominated by product use stage. The results show majority
of impact come from electricity generation and steel manufacturing. Main pollutants are
nitrogen oxides, aluminum, sulfur dioxide emitted to air.
0.00% 10.00% 20.00% 30.00% 40.00% 50.00% 60.00% 70.00% 80.00% 90.00% 100.00%
Agricultural land occupation
Climate Change
Freshwater ecotoxicity
Freshwater eutrophication
Marine ecotoxicity
Natural land transformation
Terrestrial acidification
Terrestrial ecotoxicity
Urban land occupation
Climate Change
Human toxicity
Ionising radiation
Ozone depletion
Particulate matter formation
Photochemical oxidant formation
Fossil depletion
Metal depletion
product EoL
product use
product transportation
Product Assembly
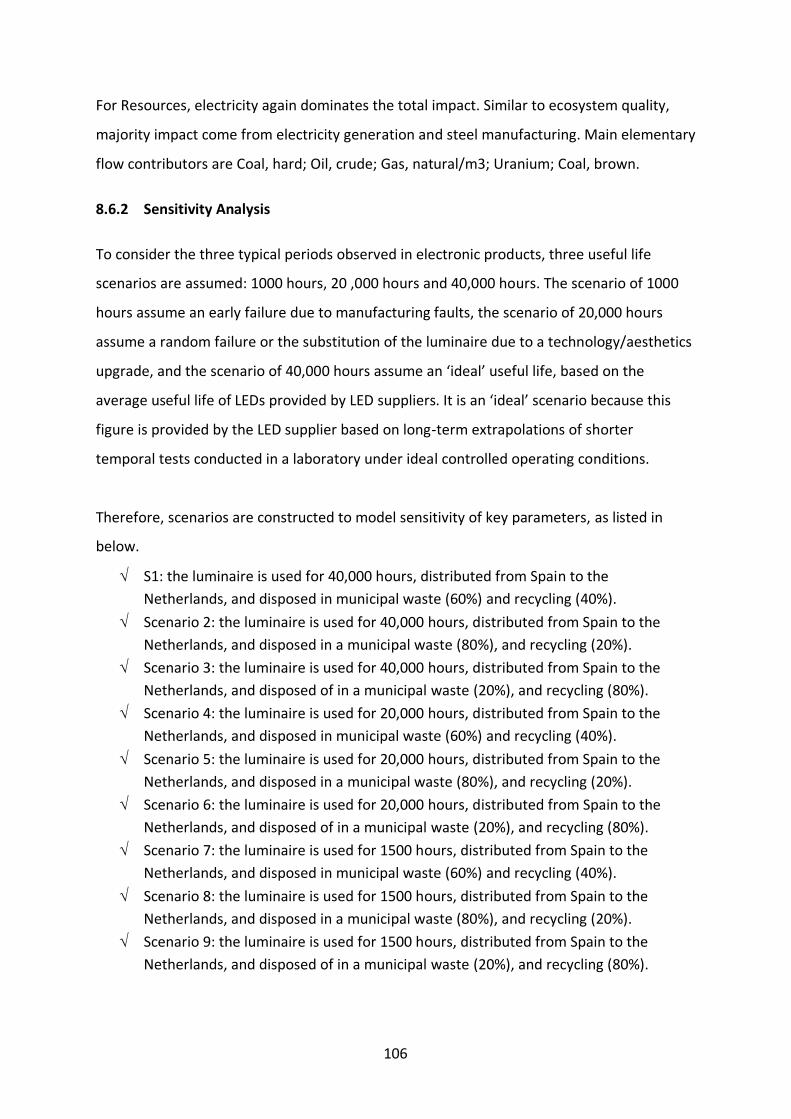
106
For Resources, electricity again dominates the total impact. Similar to ecosystem quality,
majority impact come from electricity generation and steel manufacturing. Main elementary
flow contributors are Coal, hard; Oil, crude; Gas, natural/m3; Uranium; Coal, brown.
8.6.2 Sensitivity Analysis
To consider the three typical periods observed in electronic products, three useful life
scenarios are assumed: 1000 hours, 20 ,000 hours and 40,000 hours. The scenario of 1000
hours assume an early failure due to manufacturing faults, the scenario of 20,000 hours
assume a random failure or the substitution of the luminaire due to a technology/aesthetics
upgrade, and the scenario of 40,000 hours assume an ‘ideal’ useful life, based on the
average useful life of LEDs provided by LED suppliers. It is an ‘ideal’ scenario because this
figure is provided by the LED supplier based on long-term extrapolations of shorter
temporal tests conducted in a laboratory under ideal controlled operating conditions.
Therefore, scenarios are constructed to model sensitivity of key parameters, as listed in
below.
S1: the luminaire is used for 40,000 hours, distributed from Spain to the
Netherlands, and disposed in municipal waste (60%) and recycling (40%).
Scenario 2: the luminaire is used for 40,000 hours, distributed from Spain to the
Netherlands, and disposed in a municipal waste (80%), and recycling (20%).
Scenario 3: the luminaire is used for 40,000 hours, distributed from Spain to the
Netherlands, and disposed of in a municipal waste (20%), and recycling (80%).
Scenario 4: the luminaire is used for 20,000 hours, distributed from Spain to the
Netherlands, and disposed in municipal waste (60%) and recycling (40%).
Scenario 5: the luminaire is used for 20,000 hours, distributed from Spain to the
Netherlands, and disposed in a municipal waste (80%), and recycling (20%).
Scenario 6: the luminaire is used for 20,000 hours, distributed from Spain to the
Netherlands, and disposed of in a municipal waste (20%), and recycling (80%).
Scenario 7: the luminaire is used for 1500 hours, distributed from Spain to the
Netherlands, and disposed in municipal waste (60%) and recycling (40%).
Scenario 8: the luminaire is used for 1500 hours, distributed from Spain to the
Netherlands, and disposed in a municipal waste (80%), and recycling (20%).
Scenario 9: the luminaire is used for 1500 hours, distributed from Spain to the
Netherlands, and disposed of in a municipal waste (20%), and recycling (80%).
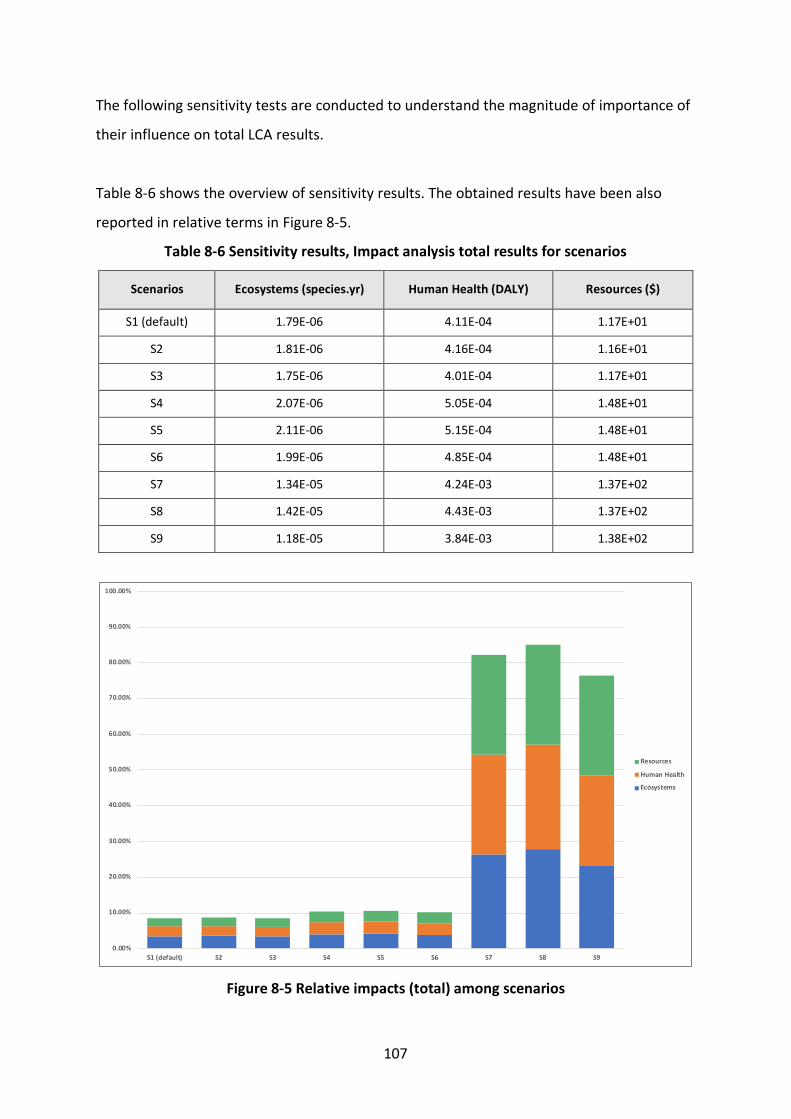
107
The following sensitivity tests are conducted to understand the magnitude of importance of
their influence on total LCA results.
Table 8-6 shows the overview of sensitivity results. The obtained results have been also
reported in relative terms in Figure 8-5.
Table 8-6 Sensitivity results, Impact analysis total results for scenarios
Scenarios Ecosystems (species.yr) Human Health (DALY) Resources ($)
S1 (default) 1.79E-06 4.11E-04 1.17E+01
S2 1.81E-06 4.16E-04 1.16E+01
S3 1.75E-06 4.01E-04 1.17E+01
S4 2.07E-06 5.05E-04 1.48E+01
S5 2.11E-06 5.15E-04 1.48E+01
S6 1.99E-06 4.85E-04 1.48E+01
S7 1.34E-05 4.24E-03 1.37E+02
S8 1.42E-05 4.43E-03 1.37E+02
S9 1.18E-05 3.84E-03 1.38E+02
Figure 8-5 Relative impacts (total) among scenarios
0.00%
10.00%
20.00%
30.00%
40.00%
50.00%
60.00%
70.00%
80.00%
90.00%
100.00%
S1 (default) S2 S3 S4 S5 S6 S7 S8 S9
Resources
Human Health
Ecosystems
108
Sensitivity results overall show the same luminaire has a longer life span (use stage) has
lowest impacts (Figure 8-5, Table 8-6). This conclusion is consistent with the analysis results
in default scenario that the impact from the electricity power generation process is the key
factor affecting the impacts, which proves that the life cycle impact analysis in the default
scenario is correct.
S1, S2 and S3 have the lowest impact amongst all the scenarios because the luminaire has
the longest useful life (40,000 hours). The impact in all categories occurs mainly during the
use stage, followed by the manufacturing stage.
S7, S8, S9 (S1: 1000 hours – domestic bin) has the highest environmental impact, followed
by Scenario 2 (S2: 1000 hours recycling). S7 and S8 has a lower impact than S9 because the
luminaire is recycled at the end of life. The reason for the minimal difference in impact is
because the end of life stage plays a minor role in the total impact of the luminaires.
8.7 Comparison of LCA analysis results
Except the evaluation on lighting quality of the designed lighting product, the environmental
performance assessment is also required based on the requirements of the integrated
approach. The comparison results (Figure 8-6 and Table 8-7) of the redesigned table lamp
(product A) and bench mark product (product B) are presented in the following three end-
point damage categories: Human Health (HH), Ecosystem Quality (EQ) and Resources (R).
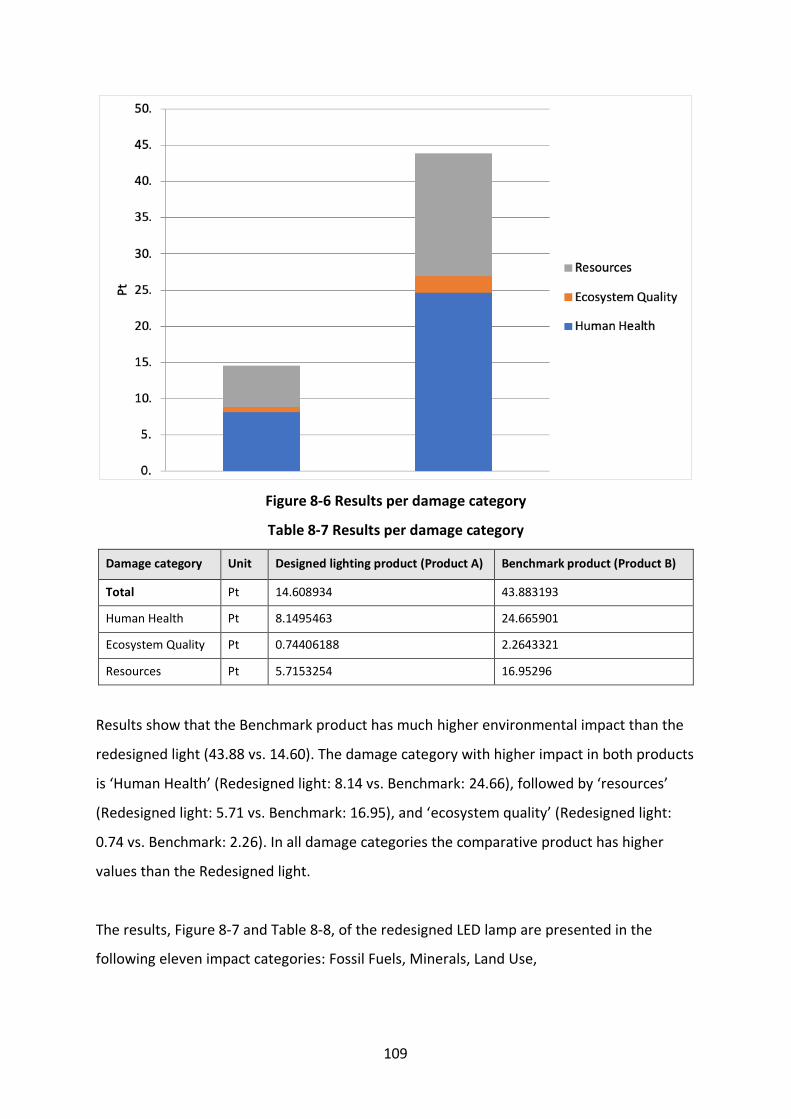
109
Figure 8-6 Results per damage category
Table 8-7 Results per damage category
Damage category Unit Designed lighting product (Product A) Benchmark product (Product B)
Total Pt 14.608934 43.883193
Human Health Pt 8.1495463 24.665901
Ecosystem Quality Pt 0.74406188 2.2643321
Resources Pt 5.7153254 16.95296
Results show that the Benchmark product has much higher environmental impact than the
redesigned light (43.88 vs. 14.60). The damage category with higher impact in both products
is ‘Human Health’ (Redesigned light: 8.14 vs. Benchmark: 24.66), followed by ‘resources’
(Redesigned light: 5.71 vs. Benchmark: 16.95), and ‘ecosystem quality’ (Redesigned light:
0.74 vs. Benchmark: 2.26). In all damage categories the comparative product has higher
values than the Redesigned light.
The results, Figure 8-7 and Table 8-8, of the redesigned LED lamp are presented in the
following eleven impact categories: Fossil Fuels, Minerals, Land Use,
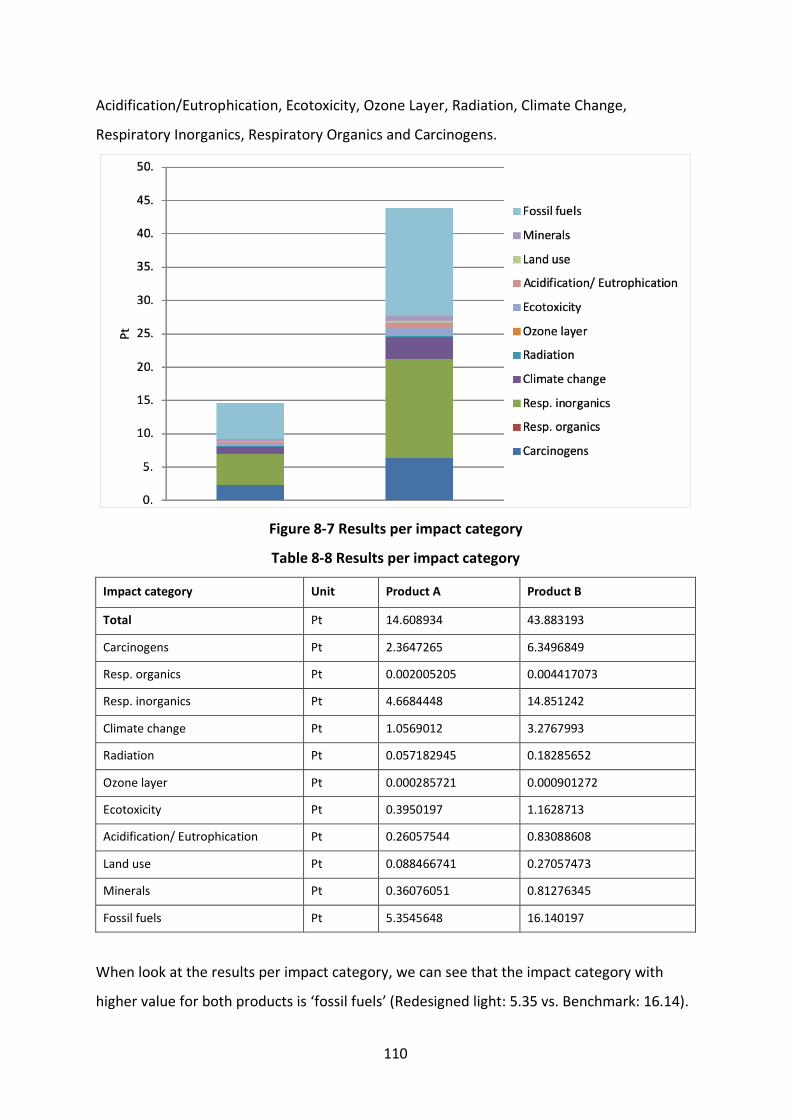
110
Acidification/Eutrophication, Ecotoxicity, Ozone Layer, Radiation, Climate Change,
Respiratory Inorganics, Respiratory Organics and Carcinogens.
Figure 8-7 Results per impact category
Table 8-8 Results per impact category
Impact category Unit Product A Product B
Total Pt 14.608934 43.883193
Carcinogens Pt 2.3647265 6.3496849
Resp. organics Pt 0.002005205 0.004417073
Resp. inorganics Pt 4.6684448 14.851242
Climate change Pt 1.0569012 3.2767993
Radiation Pt 0.057182945 0.18285652
Ozone layer Pt 0.000285721 0.000901272
Ecotoxicity Pt 0.3950197 1.1628713
Acidification/ Eutrophication Pt 0.26057544 0.83088608
Land use Pt 0.088466741 0.27057473
Minerals Pt 0.36076051 0.81276345
Fossil fuels Pt 5.3545648 16.140197
When look at the results per impact category, we can see that the impact category with
higher value for both products is ‘fossil fuels’ (Redesigned light: 5.35 vs. Benchmark: 16.14).
111
This is due to the high demand of energy (and electricity production) to make the products
function during their useful lifespan. The second impact category with higher impact is
‘respiratory inorganics’ (Redesigned light: 4.66 vs. Benchmark: 14.85), followed by:
‘carcinogens’ (Redesigned light: 2.34 vs. Benchmark: 6.34), ‘climate change’ (Redesigned
light: 1.05 vs. Benchmark: 3.27), ‘ecotoxicity’ (Redesigned light: 0.39 vs. Benchmark: 1.16),
‘Minerals’ (Redesigned light: 0.36 vs. Benchmark: 0.81), ‘acidification/eutrophication’
(Redesigned light: 0.26 vs. Benchmark: 0.83), ‘Land use’ (Redesigned light: 0.088 vs.
Benchmark: 0.27), ‘radiation’ (Redesigned light: 0.057 vs. Benchmark: 0.18), ‘respiratory
organics‘ (Redesigned light: 0.002 vs. Benchmark: 0.00441) and ‘ozone layer’ (Redesigned
light: 0.00028 vs. Benchmark: 0.00090).
8.8 Conclusions
Overall, it shows that major impacts come from the electricity power consumption process
in product use stage, and steel production process in the product assembly stage. Also, the
luminaire’s useful life span is the key factor affecting the impacts. Among all of the
luminaire’s components, the main frame contributes the most impacts (10.9% for Human
Health, 7.4% for Ecosystems, 20.5% for Resources), which could be considered by the
product engineers to replace with other materials instead of steel. The disposal treatment
doesn’t have much effects for environmental impacts of the end of life luminaire with a
longer life span (i.e. beyond 20,000 hours). Also, recycling the luminaire’s components (e.g.
frame, cable) can significantly reduce the resource impacts, which proves the necessity of
offering an incentive scheme to encourage consumers to implement more recycling.
112
Chapter 9: Social Life Cycle Assessment for the LED Lighting Product
9.1 Introduction
Social sustainability is a wide concept, which covers several definitions and can be
approached through different methodologies (Florman, Klingler-Vidra and Facada, 2016;
Rafiaani et al., 2018) list general and specific social impact assessment methodologies
launched since 1997, as for example, Social Return on Investment (SROI) and Social Value
Metrics. More specifically, Rafiaani et al. compare within bio-based economy the Social
Impact Assessment (SIA), Socio-Economic Impact Assessment (SEIA) and Social Life Cycle
Assessment (Rafiaani et al., 2018). In order to evaluate the sustainability assessment of the
domestic lighting products, social aspects are conducted from a Life Cycle Assessment point
of view. Thus, standards ISO 14040/44 stablish S-LCA framework. Thus, S-LCA is a procedure
for social impacts analysis within products’ life cycle, which assesses social and socio-
economic features of products, as well as, potential positive and negative impacts
(Andrews, 2009). It has to be highlighted that existing social impact methodologies at
product level foster flexibility due to relative immaturity and specific background
requirements.
This chapter contains the results of the Social Life Cycle Impact Assessment of ONA
domestic lighting product; using existing and new innovative methods of social impact
analysis. These results represent a reference scenario for the future assessment of
innovation solutions. Finally, a conclusion section is added including the main findings and
recommendations for every product.
9.2 Methodology for the social life cycle assessment
SLCA presents some methodological particularities that are defined hereafter and which are
amended to the demonstrators characteristics (UNEP/SETAC/LCI, 2009). The social impact
assessment is made in a similar way than the environmental life cycle assessment, and in
agreement with it since the initial stages for the analysis design and configuration are the
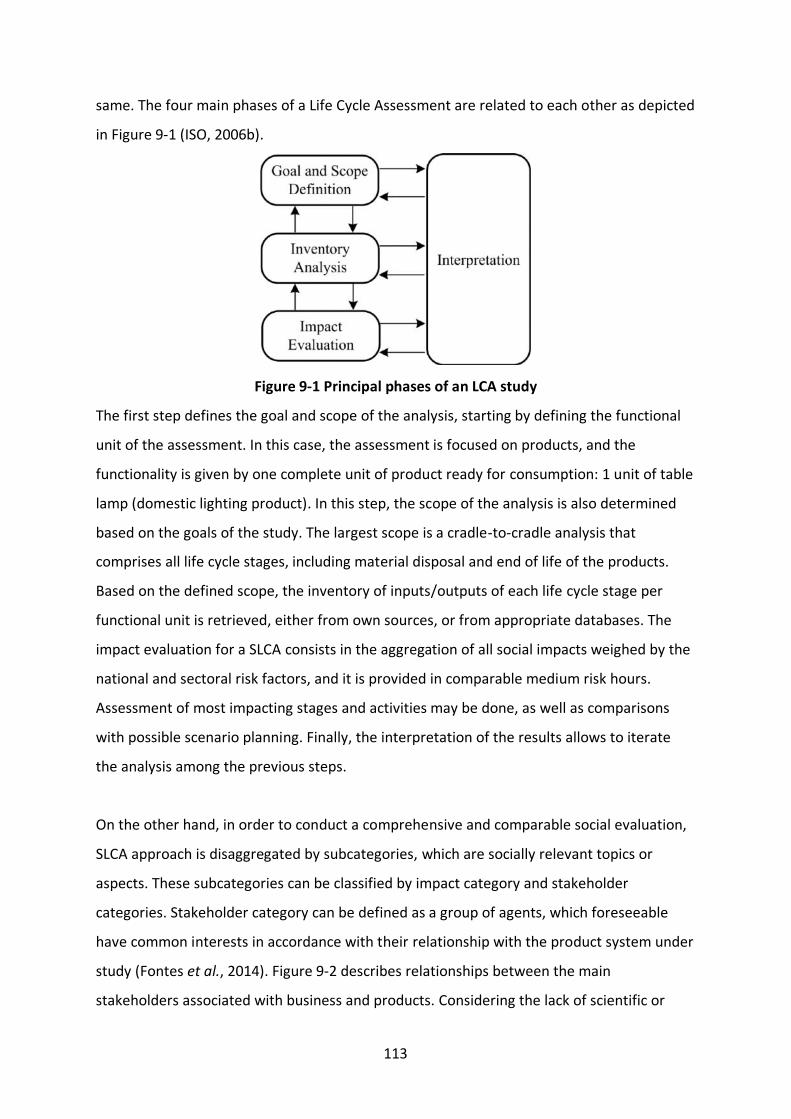
113
same. The four main phases of a Life Cycle Assessment are related to each other as depicted
in Figure 9-1 (ISO, 2006b).
Figure 9-1 Principal phases of an LCA study
The first step defines the goal and scope of the analysis, starting by defining the functional
unit of the assessment. In this case, the assessment is focused on products, and the
functionality is given by one complete unit of product ready for consumption: 1 unit of table
lamp (domestic lighting product). In this step, the scope of the analysis is also determined
based on the goals of the study. The largest scope is a cradle-to-cradle analysis that
comprises all life cycle stages, including material disposal and end of life of the products.
Based on the defined scope, the inventory of inputs/outputs of each life cycle stage per
functional unit is retrieved, either from own sources, or from appropriate databases. The
impact evaluation for a SLCA consists in the aggregation of all social impacts weighed by the
national and sectoral risk factors, and it is provided in comparable medium risk hours.
Assessment of most impacting stages and activities may be done, as well as comparisons
with possible scenario planning. Finally, the interpretation of the results allows to iterate
the analysis among the previous steps.
On the other hand, in order to conduct a comprehensive and comparable social evaluation,
SLCA approach is disaggregated by subcategories, which are socially relevant topics or
aspects. These subcategories can be classified by impact category and stakeholder
categories. Stakeholder category can be defined as a group of agents, which foreseeable
have common interests in accordance with their relationship with the product system under
study (Fontes et al., 2014). Figure 9-2 describes relationships between the main
stakeholders associated with business and products. Considering the lack of scientific or
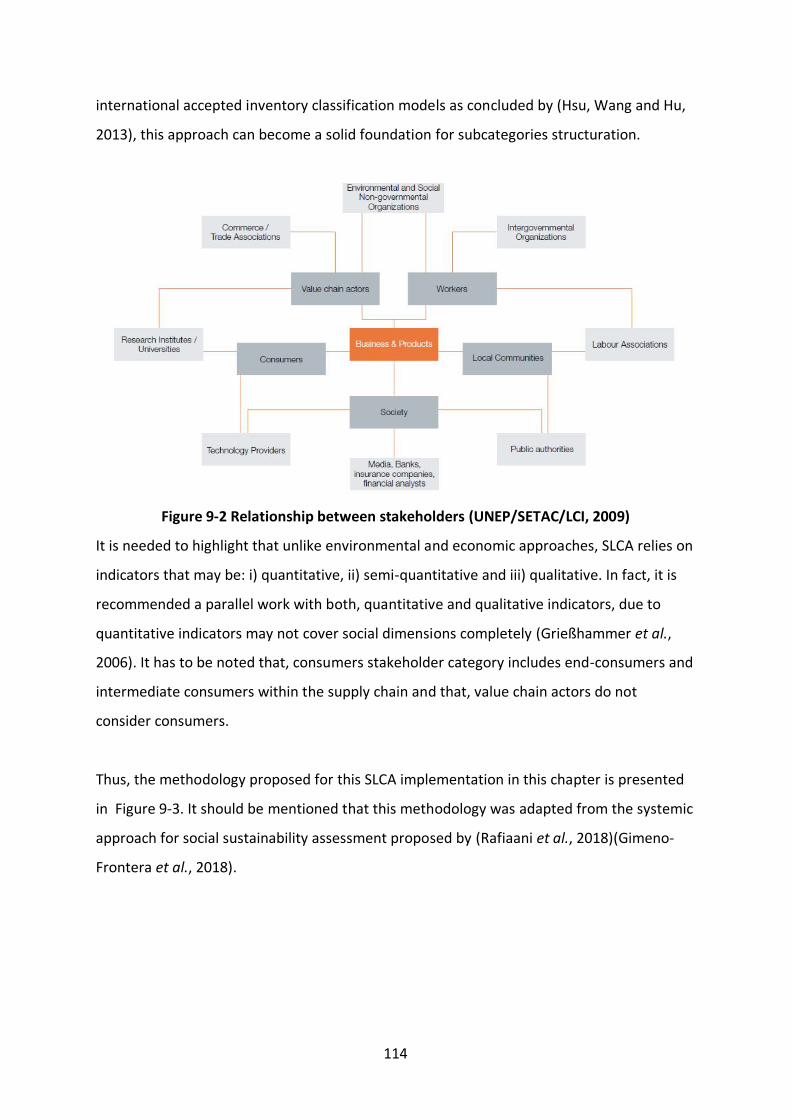
114
international accepted inventory classification models as concluded by (Hsu, Wang and Hu,
2013), this approach can become a solid foundation for subcategories structuration.
Figure 9-2 Relationship between stakeholders (UNEP/SETAC/LCI, 2009)
It is needed to highlight that unlike environmental and economic approaches, SLCA relies on
indicators that may be: i) quantitative, ii) semi-quantitative and iii) qualitative. In fact, it is
recommended a parallel work with both, quantitative and qualitative indicators, due to
quantitative indicators may not cover social dimensions completely (Grießhammer et al.,
2006). It has to be noted that, consumers stakeholder category includes end-consumers and
intermediate consumers within the supply chain and that, value chain actors do not
consider consumers.
Thus, the methodology proposed for this SLCA implementation in this chapter is presented
in Figure 9-3. It should be mentioned that this methodology was adapted from the systemic
approach for social sustainability assessment proposed by (Rafiaani et al., 2018)(Gimeno-
Frontera et al., 2018).
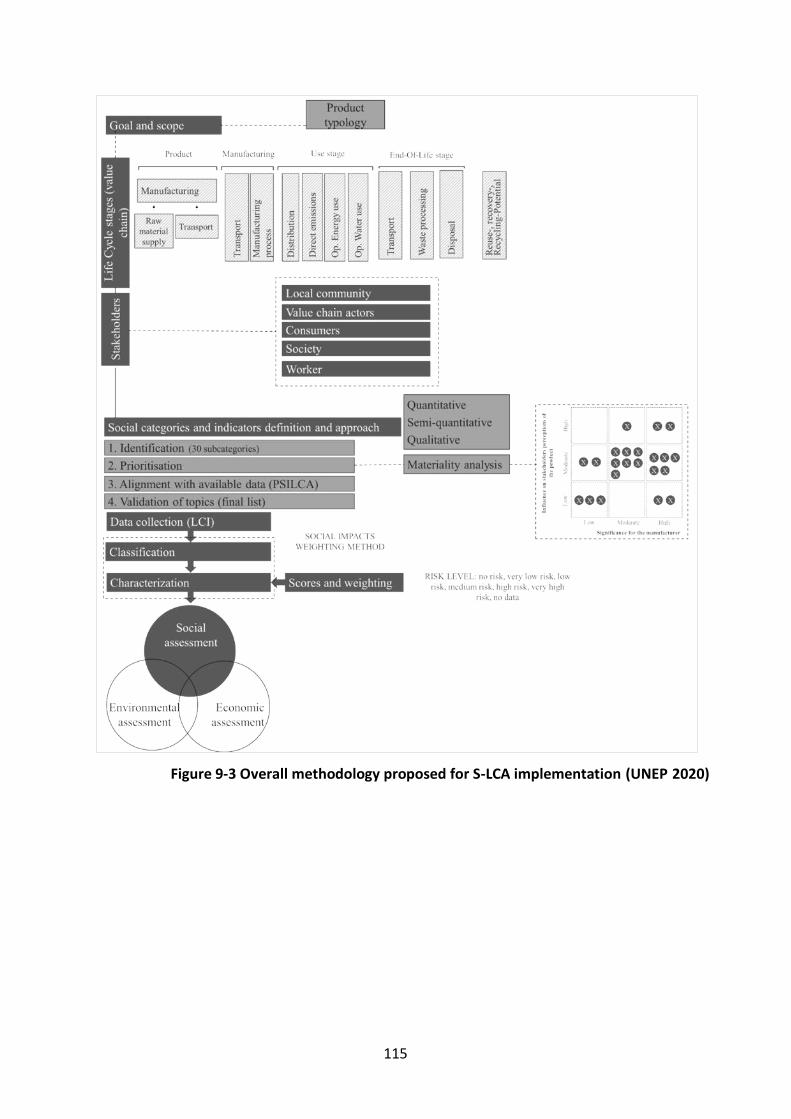
115
Figure 9-3 Overall methodology proposed for S-LCA implementation (UNEP 2020)
116
9.3 Social life cycle impact assessment
9.3.1 Social categories/subcategories and indicators definition
The social categories and indicators are based on the ‘Guidelines for social life cycle
assessment of products’ (UNEP/SETAC/LCI, 2009) and ‘The Methodological Sheets
Guidelines for Subcategories in Social Life Cycle Assessment’ (Benoît et al., 2010), designed
for the social life cycle assessment of products and services. They include 5 stakeholders
typologies, and 23 social and socio-economic subcategories (topics).
There are not many complete databases about social aspects of products and services, that
include most of the UNEP/SETAC categories and indicators. Several requirements are
elicited in the search of the most suitable social impact database. Among others, a database
should meet the following minimum requirements:
• Commercially available.
• World-wide global coverage of social aspects.
• Stakeholder, impact categories and subcategories, and indicators in line with widely
recognised official methodologies like the UNEP’s Life Cycle Initiative
• Compatible with commonly used aggregation and calculation tools like openLCA and
SimaPro.
• Information is transparent, comprehensive and updated regularly.
• Validated and backed by well-known experts and institutions.
From the list of requirements above, the best positioned in the market is PSILCA (Ciroth and
Eisfeldt, 2017). PSILCA stands for ‘Product Social Impact Life Cycle Assessment’ and it is a
database developed by GreenDelta. In order to provide insights into global supply chains,
PSILCA uses a multi-regional input/output database, called Eora. Eora covers the entire
world economy, on an industrial sector basis, comprising 189 countries and nearly 16,000
activity sectors distributed in Industries and commodities per country. Eora features raw
data drawn from the UN’s System of National Accounts, Eurostat, Comtrade database and
many national agencies.
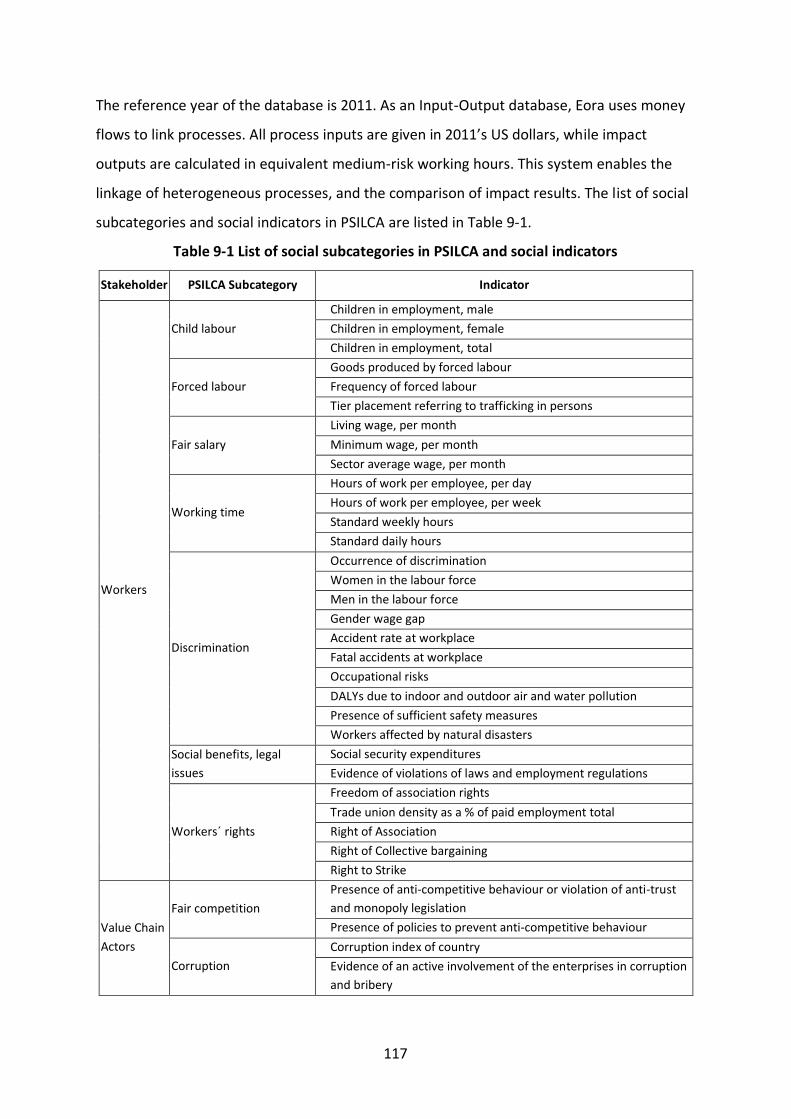
117
The reference year of the database is 2011. As an Input-Output database, Eora uses money
flows to link processes. All process inputs are given in 2011’s US dollars, while impact
outputs are calculated in equivalent medium-risk working hours. This system enables the
linkage of heterogeneous processes, and the comparison of impact results. The list of social
subcategories and social indicators in PSILCA are listed in Table 9-1.
Table 9-1 List of social subcategories in PSILCA and social indicators
Stakeholder PSILCA Subcategory Indicator
Workers
Child labour
Children in employment, male
Children in employment, female
Children in employment, total
Forced labour
Goods produced by forced labour
Frequency of forced labour
Tier placement referring to trafficking in persons
Fair salary
Living wage, per month
Minimum wage, per month
Sector average wage, per month
Working time
Hours of work per employee, per day
Hours of work per employee, per week
Standard weekly hours
Standard daily hours
Discrimination
Occurrence of discrimination
Women in the labour force
Men in the labour force
Gender wage gap
Accident rate at workplace
Fatal accidents at workplace
Occupational risks
DALYs due to indoor and outdoor air and water pollution
Presence of sufficient safety measures
Workers affected by natural disasters
Social benefits, legal
issues
Social security expenditures
Evidence of violations of laws and employment regulations
Workers´ rights
Freedom of association rights
Trade union density as a % of paid employment total
Right of Association
Right of Collective bargaining
Right to Strike
Value Chain
Actors
Fair competition
Presence of anti-competitive behaviour or violation of anti-trust
and monopoly legislation
Presence of policies to prevent anti-competitive behaviour
Corruption
Corruption index of country
Evidence of an active involvement of the enterprises in corruption
and bribery
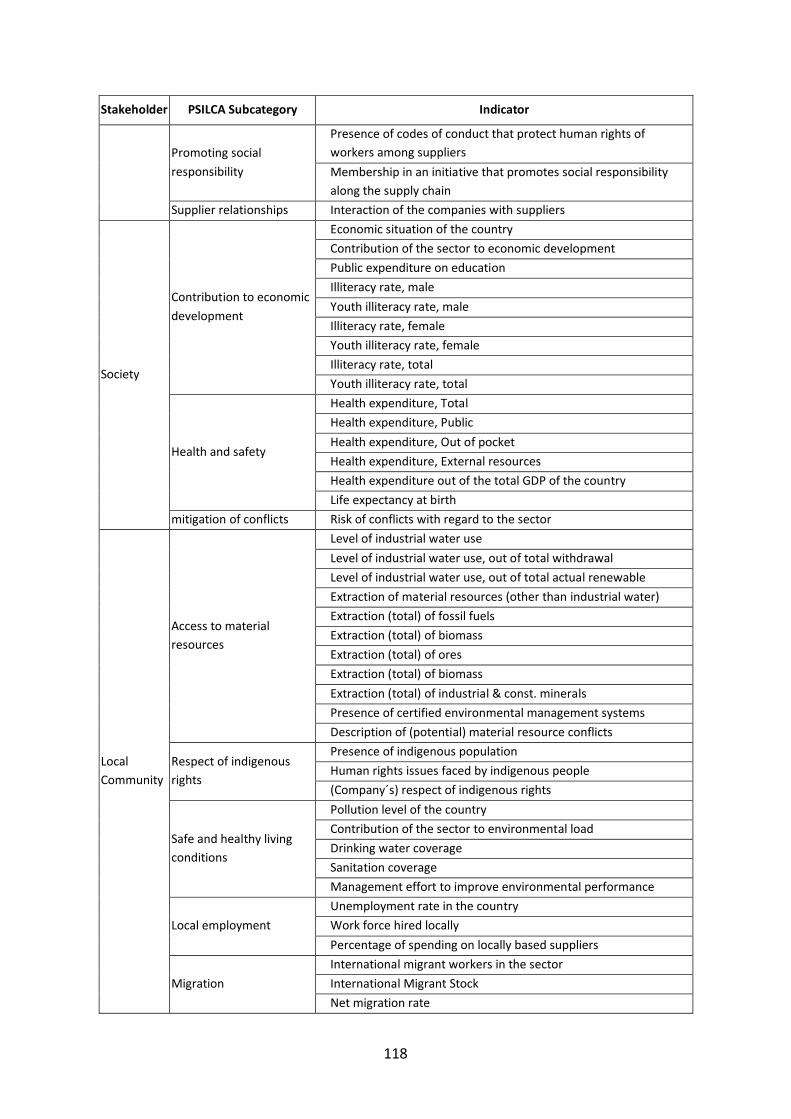
118
Stakeholder PSILCA Subcategory Indicator
Promoting social
responsibility
Presence of codes of conduct that protect human rights of
workers among suppliers
Membership in an initiative that promotes social responsibility
along the supply chain
Supplier relationships Interaction of the companies with suppliers
Society
Contribution to economic
development
Economic situation of the country
Contribution of the sector to economic development
Public expenditure on education
Illiteracy rate, male
Youth illiteracy rate, male
Illiteracy rate, female
Youth illiteracy rate, female
Illiteracy rate, total
Youth illiteracy rate, total
Health and safety
Health expenditure, Total
Health expenditure, Public
Health expenditure, Out of pocket
Health expenditure, External resources
Health expenditure out of the total GDP of the country
Life expectancy at birth
mitigation of conflicts Risk of conflicts with regard to the sector
Local
Community
Access to material
resources
Level of industrial water use
Level of industrial water use, out of total withdrawal
Level of industrial water use, out of total actual renewable
Extraction of material resources (other than industrial water)
Extraction (total) of fossil fuels
Extraction (total) of biomass
Extraction (total) of ores
Extraction (total) of biomass
Extraction (total) of industrial & const. minerals
Presence of certified environmental management systems
Description of (potential) material resource conflicts
Respect of indigenous
rights
Presence of indigenous population
Human rights issues faced by indigenous people
(Company´s) respect of indigenous rights
Safe and healthy living
conditions
Pollution level of the country
Contribution of the sector to environmental load
Drinking water coverage
Sanitation coverage
Management effort to improve environmental performance
Local employment
Unemployment rate in the country
Work force hired locally
Percentage of spending on locally based suppliers
Migration
International migrant workers in the sector
International Migrant Stock
Net migration rate
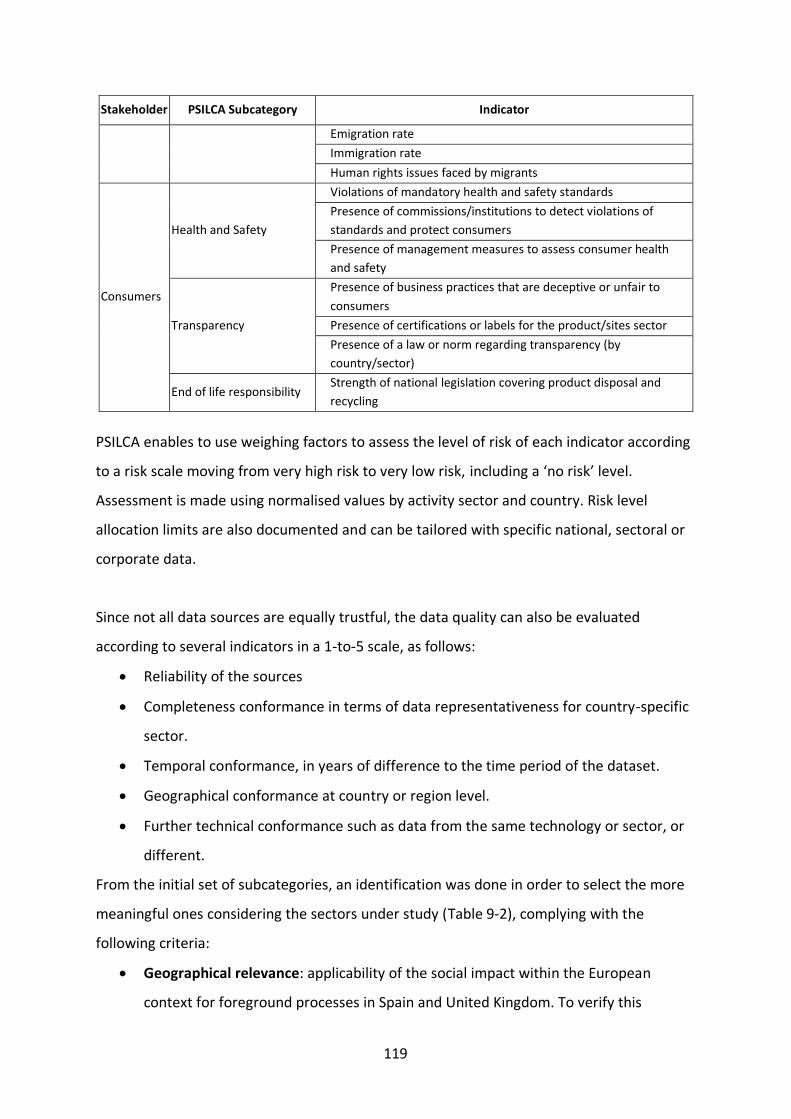
119
Stakeholder PSILCA Subcategory Indicator
Emigration rate
Immigration rate
Human rights issues faced by migrants
Consumers
Health and Safety
Violations of mandatory health and safety standards
Presence of commissions/institutions to detect violations of
standards and protect consumers
Presence of management measures to assess consumer health
and safety
Transparency
Presence of business practices that are deceptive or unfair to
consumers
Presence of certifications or labels for the product/sites sector
Presence of a law or norm regarding transparency (by
country/sector)
End of life responsibility Strength of national legislation covering product disposal and
recycling
PSILCA enables to use weighing factors to assess the level of risk of each indicator according
to a risk scale moving from very high risk to very low risk, including a ‘no risk’ level.
Assessment is made using normalised values by activity sector and country. Risk level
allocation limits are also documented and can be tailored with specific national, sectoral or
corporate data.
Since not all data sources are equally trustful, the data quality can also be evaluated
according to several indicators in a 1-to-5 scale, as follows:
• Reliability of the sources
• Completeness conformance in terms of data representativeness for country-specific
sector.
• Temporal conformance, in years of difference to the time period of the dataset.
• Geographical conformance at country or region level.
• Further technical conformance such as data from the same technology or sector, or
different.
From the initial set of subcategories, an identification was done in order to select the more
meaningful ones considering the sectors under study (Table 9-2), complying with the
following criteria:
• Geographical relevance: applicability of the social impact within the European
context for foreground processes in Spain and United Kingdom. To verify this
120
criteria, National-, sector-, and company-specific data and comments for each
subcategory in all five stakeholder categories were collected from industrial
partners. National level indicator classified as ‘not applicable’ or omitted are
considered as out of boundary in respect of the socioeconomic framework of the EU.
• Data availability: this criterion is not to get comparable results among
heterogeneous products/process, but to guarantee that the methodology and the
results’ structure is equivalent for all parts involved. The information collected from
ONA was checked to verify if data is available for each of the indicators in all the
subcategories. A scale is used to classify how much information per indicator is
indeed collectable and, thus, if the subcategory is feasible to be assessed.
• Bibliography validation: the last criterion verifies the pertinence given by S-LCA
specialised literature over the last decade. Three main sources are consulted: i) the
findings of (Jørgensen et al., 2008), one of the most cited papers in the field, that
include the review of 11 S-LCA studies until 2008, ii) the updated review done by
(Siebert et al., 2018) that comprises an extra 12 S-LCA papers; and iii) the most
recent report on S-LCA done by the Joint Research Centre (JRC) in 2018 (Mancini,
Eynard and Eisfeldt, 2018). The three sources sum a total of 24 cases that serve to
identify the most relevant social indicators by their frequency of use.
Following the triple criteria of geographical relevance, data availability and bibliography
validation, the identification of subcategories resulted in a final number of 13. Notice that
the availability of information plays a key role in this exercise, whereas the bibliography
validation serves more as an added value for the selection.
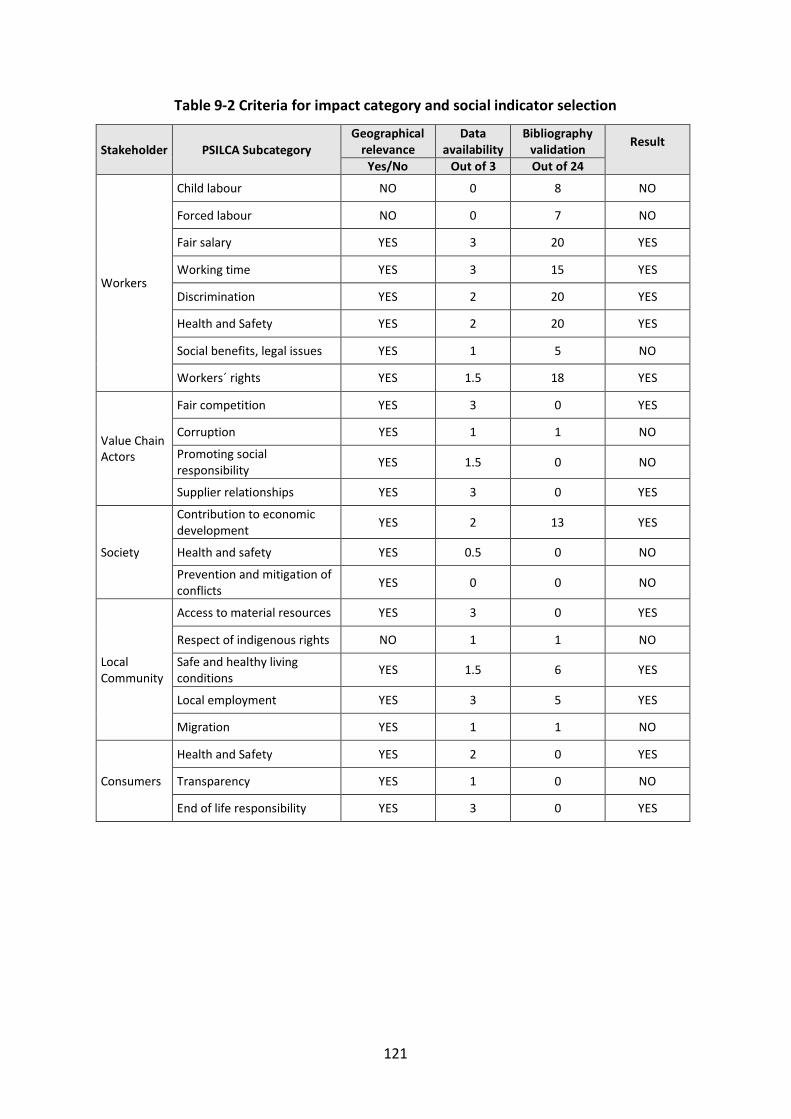
121
Table 9-2 Criteria for impact category and social indicator selection
Stakeholder PSILCA Subcategory Geographical
relevance Data
availability Bibliography
validation Result
Yes/No Out of 3 Out of 24
Workers
Child labour NO 0 8 NO
Forced labour NO 0 7 NO
Fair salary YES 3 20 YES
Working time YES 3 15 YES
Discrimination YES 2 20 YES
Health and Safety YES 2 20 YES
Social benefits, legal issues YES 1 5 NO
Workers´ rights YES 1.5 18 YES
Value Chain Actors
Fair competition YES 3 0 YES
Corruption YES 1 1 NO
Promoting social responsibility
YES 1.5 0 NO
Supplier relationships YES 3 0 YES
Society
Contribution to economic development
YES 2 13 YES
Health and safety YES 0.5 0 NO
Prevention and mitigation of conflicts
YES 0 0 NO
Local Community
Access to material resources YES 3 0 YES
Respect of indigenous rights NO 1 1 NO
Safe and healthy living conditions
YES 1.5 6 YES
Local employment YES 3 5 YES
Migration YES 1 1 NO
Consumers
Health and Safety YES 2 0 YES
Transparency YES 1 0 NO
End of life responsibility YES 3 0 YES
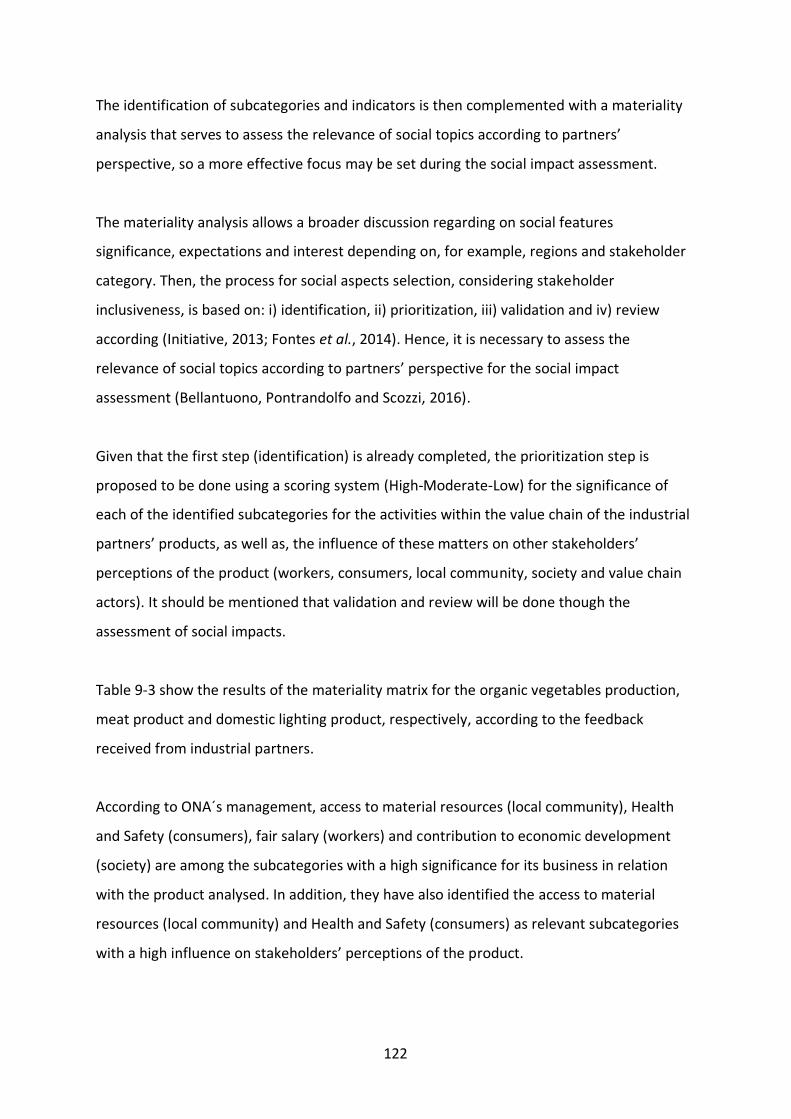
122
The identification of subcategories and indicators is then complemented with a materiality
analysis that serves to assess the relevance of social topics according to partners’
perspective, so a more effective focus may be set during the social impact assessment.
The materiality analysis allows a broader discussion regarding on social features
significance, expectations and interest depending on, for example, regions and stakeholder
category. Then, the process for social aspects selection, considering stakeholder
inclusiveness, is based on: i) identification, ii) prioritization, iii) validation and iv) review
according (Initiative, 2013; Fontes et al., 2014). Hence, it is necessary to assess the
relevance of social topics according to partners’ perspective for the social impact
assessment (Bellantuono, Pontrandolfo and Scozzi, 2016).
Given that the first step (identification) is already completed, the prioritization step is
proposed to be done using a scoring system (High-Moderate-Low) for the significance of
each of the identified subcategories for the activities within the value chain of the industrial
partners’ products, as well as, the influence of these matters on other stakeholders’
perceptions of the product (workers, consumers, local community, society and value chain
actors). It should be mentioned that validation and review will be done though the
assessment of social impacts.
Table 9-3 show the results of the materiality matrix for the organic vegetables production,
meat product and domestic lighting product, respectively, according to the feedback
received from industrial partners.
According to ONA´s management, access to material resources (local community), Health
and Safety (consumers), fair salary (workers) and contribution to economic development
(society) are among the subcategories with a high significance for its business in relation
with the product analysed. In addition, they have also identified the access to material
resources (local community) and Health and Safety (consumers) as relevant subcategories
with a high influence on stakeholders’ perceptions of the product.
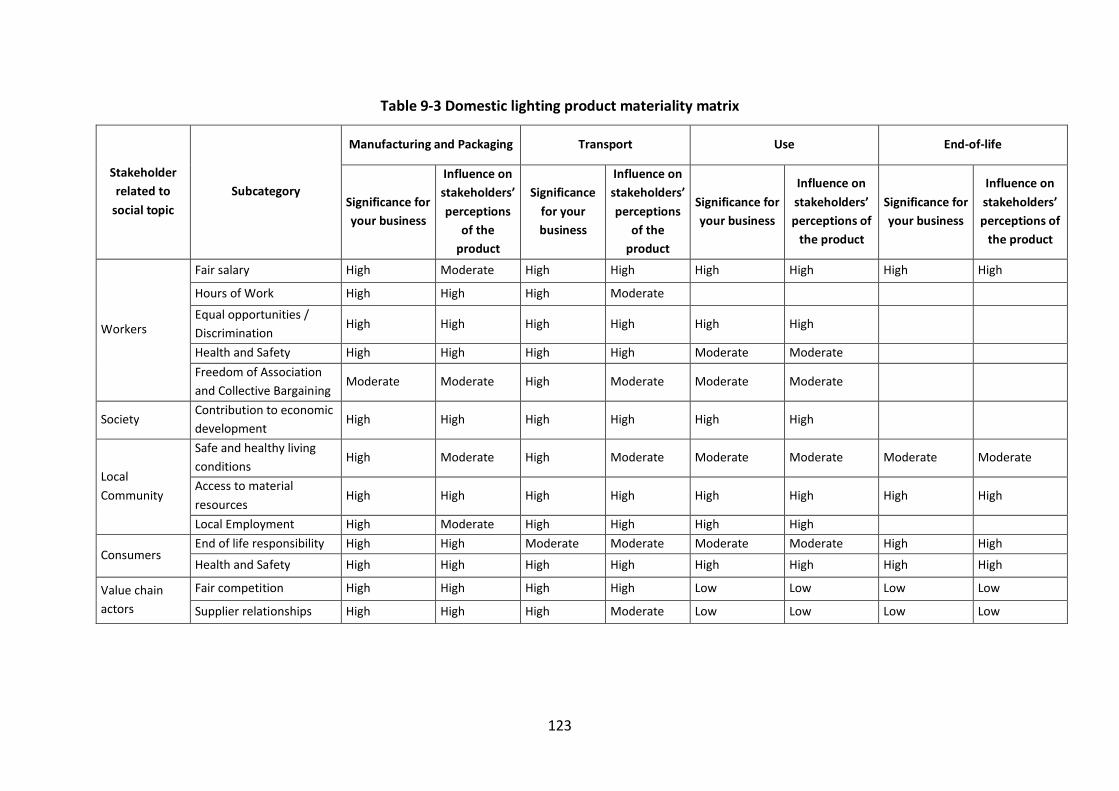
123
Table 9-3 Domestic lighting product materiality matrix
Stakeholder
related to
social topic
Subcategory
Manufacturing and Packaging Transport Use End-of-life
Significance for
your business
Influence on
stakeholders’
perceptions
of the
product
Significance
for your
business
Influence on
stakeholders’
perceptions
of the
product
Significance for
your business
Influence on
stakeholders’
perceptions of
the product
Significance for
your business
Influence on
stakeholders’
perceptions of
the product
Workers
Fair salary High Moderate High High High High High High
Hours of Work High High High Moderate
Equal opportunities /
Discrimination High High High High High High
Health and Safety High High High High Moderate Moderate
Freedom of Association
and Collective Bargaining Moderate Moderate High Moderate Moderate Moderate
Society Contribution to economic
development High High High High High High
Local
Community
Safe and healthy living
conditions High Moderate High Moderate Moderate Moderate Moderate Moderate
Access to material
resources High High High High High High High High
Local Employment High Moderate High High High High
Consumers End of life responsibility High High Moderate Moderate Moderate Moderate High High
Health and Safety High High High High High High High High
Value chain
actors
Fair competition High High High High Low Low Low Low
Supplier relationships High High High Moderate Low Low Low Low
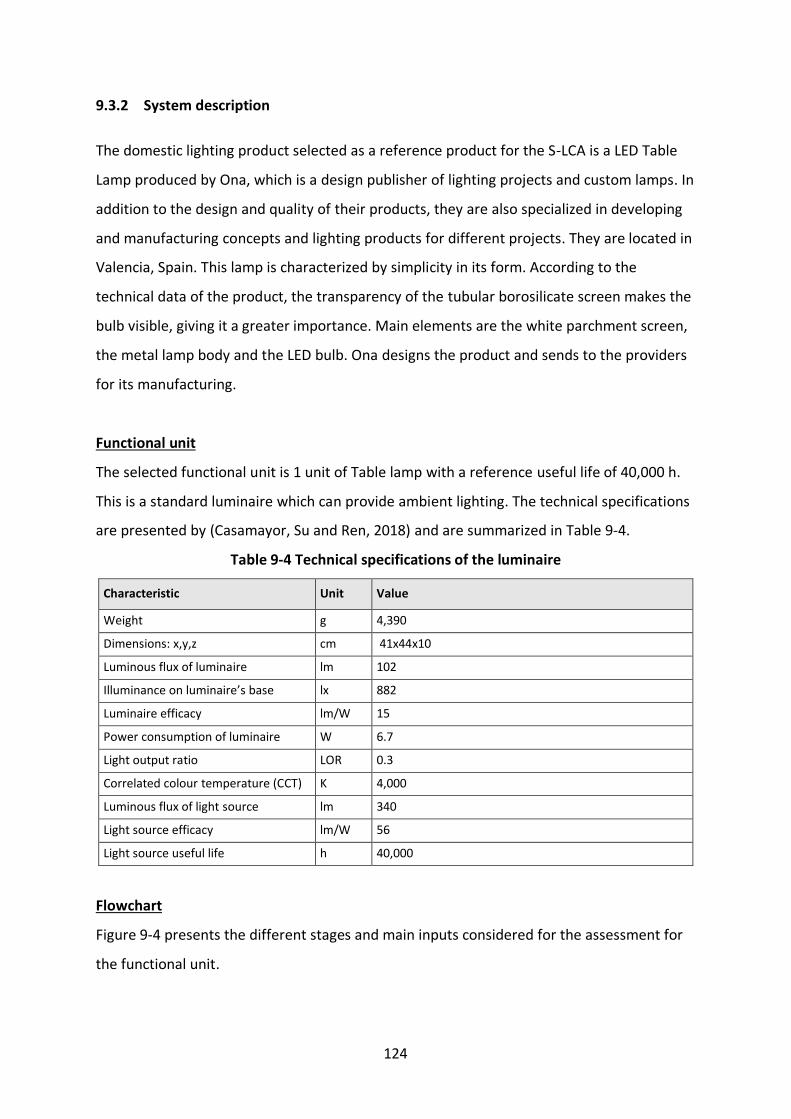
124
9.3.2 System description
The domestic lighting product selected as a reference product for the S-LCA is a LED Table
Lamp produced by Ona, which is a design publisher of lighting projects and custom lamps. In
addition to the design and quality of their products, they are also specialized in developing
and manufacturing concepts and lighting products for different projects. They are located in
Valencia, Spain. This lamp is characterized by simplicity in its form. According to the
technical data of the product, the transparency of the tubular borosilicate screen makes the
bulb visible, giving it a greater importance. Main elements are the white parchment screen,
the metal lamp body and the LED bulb. Ona designs the product and sends to the providers
for its manufacturing.
Functional unit
The selected functional unit is 1 unit of Table lamp with a reference useful life of 40,000 h.
This is a standard luminaire which can provide ambient lighting. The technical specifications
are presented by (Casamayor, Su and Ren, 2018) and are summarized in Table 9-4.
Table 9-4 Technical specifications of the luminaire
Characteristic Unit Value
Weight g 4,390
Dimensions: x,y,z cm 41x44x10
Luminous flux of luminaire lm 102
Illuminance on luminaire’s base lx 882
Luminaire efficacy lm/W 15
Power consumption of luminaire W 6.7
Light output ratio LOR 0.3
Correlated colour temperature (CCT) K 4,000
Luminous flux of light source lm 340
Light source efficacy lm/W 56
Light source useful life h 40,000
Flowchart
Figure 9-4 presents the different stages and main inputs considered for the assessment for
the functional unit.
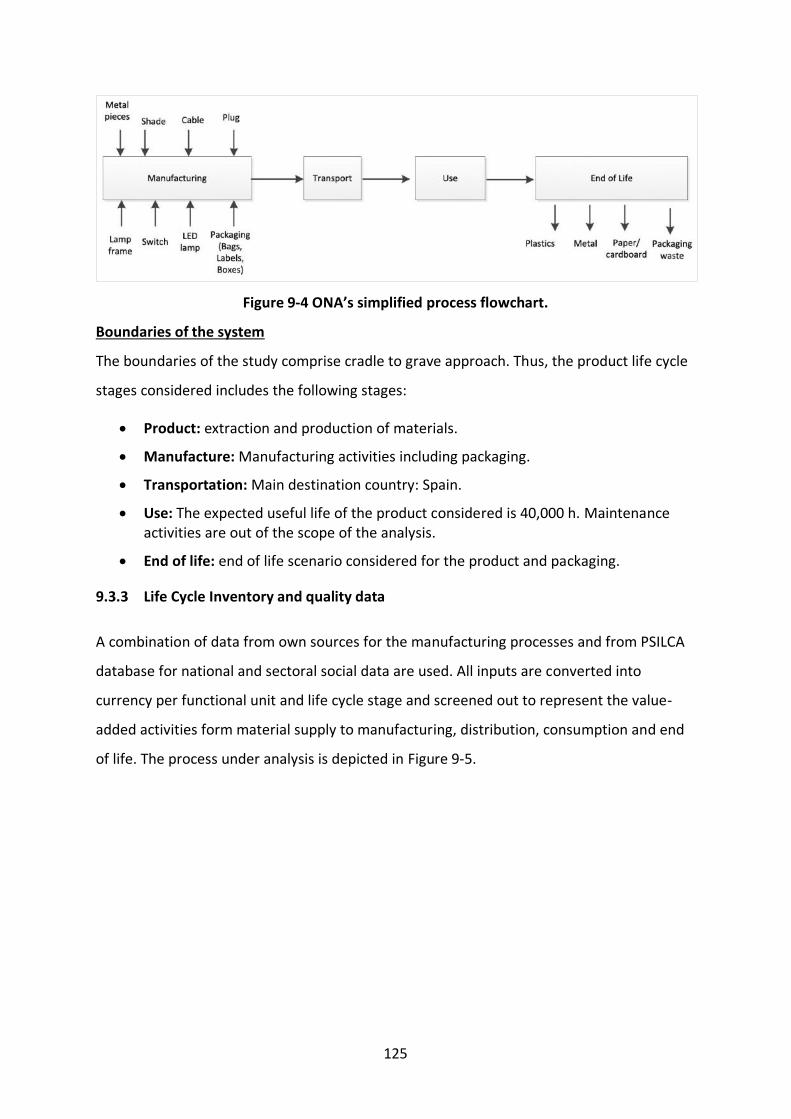
125
Figure 9-4 ONA’s simplified process flowchart.
Boundaries of the system
The boundaries of the study comprise cradle to grave approach. Thus, the product life cycle
stages considered includes the following stages:
• Product: extraction and production of materials.
• Manufacture: Manufacturing activities including packaging.
• Transportation: Main destination country: Spain.
• Use: The expected useful life of the product considered is 40,000 h. Maintenance activities are out of the scope of the analysis.
• End of life: end of life scenario considered for the product and packaging.
9.3.3 Life Cycle Inventory and quality data
A combination of data from own sources for the manufacturing processes and from PSILCA
database for national and sectoral social data are used. All inputs are converted into
currency per functional unit and life cycle stage and screened out to represent the value-
added activities form material supply to manufacturing, distribution, consumption and end
of life. The process under analysis is depicted in Figure 9-5.
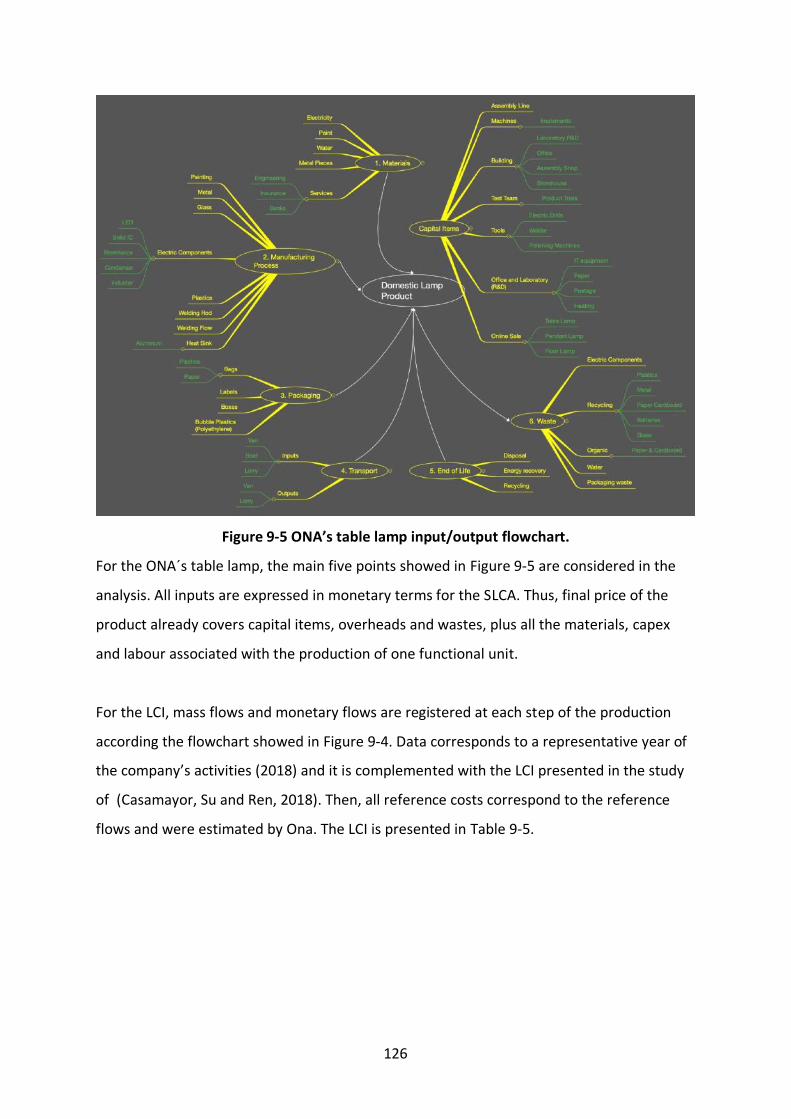
126
Figure 9-5 ONA’s table lamp input/output flowchart.
For the ONA´s table lamp, the main five points showed in Figure 9-5 are considered in the
analysis. All inputs are expressed in monetary terms for the SLCA. Thus, final price of the
product already covers capital items, overheads and wastes, plus all the materials, capex
and labour associated with the production of one functional unit.
For the LCI, mass flows and monetary flows are registered at each step of the production
according the flowchart showed in Figure 9-4. Data corresponds to a representative year of
the company’s activities (2018) and it is complemented with the LCI presented in the study
of (Casamayor, Su and Ren, 2018). Then, all reference costs correspond to the reference
flows and were estimated by Ona. The LCI is presented in Table 9-5.
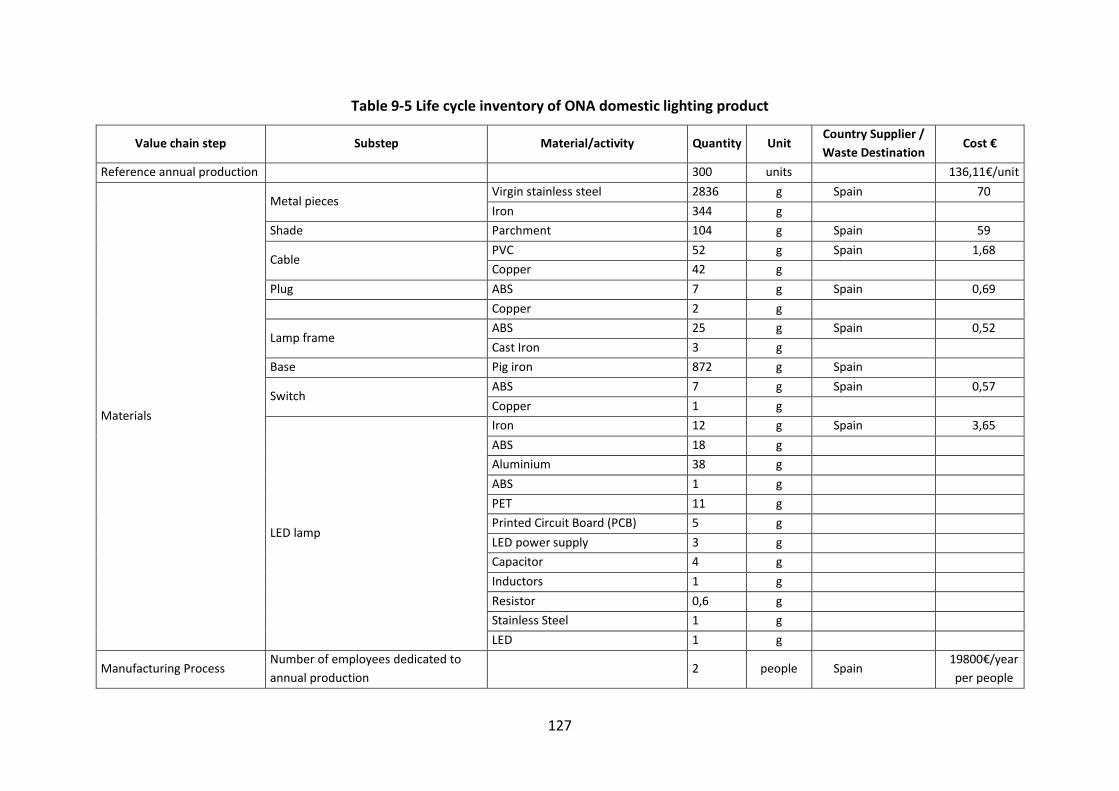
127
Table 9-5 Life cycle inventory of ONA domestic lighting product
Value chain step Substep Material/activity Quantity Unit Country Supplier /
Waste Destination Cost €
Reference annual production 300 units 136,11€/unit
Materials
Metal pieces Virgin stainless steel 2836 g Spain 70
Iron 344 g
Shade Parchment 104 g Spain 59
Cable PVC 52 g Spain 1,68
Copper 42 g
Plug ABS 7 g Spain 0,69
Copper 2 g
Lamp frame ABS 25 g Spain 0,52
Cast Iron 3 g
Base Pig iron 872 g Spain
Switch ABS 7 g Spain 0,57
Copper 1 g
LED lamp
Iron 12 g Spain 3,65
ABS 18 g
Aluminium 38 g
ABS 1 g
PET 11 g
Printed Circuit Board (PCB) 5 g
LED power supply 3 g
Capacitor 4 g
Inductors 1 g
Resistor 0,6 g
Stainless Steel 1 g
LED 1 g
Manufacturing Process Number of employees dedicated to
annual production 2 people Spain
19800€/year
per people
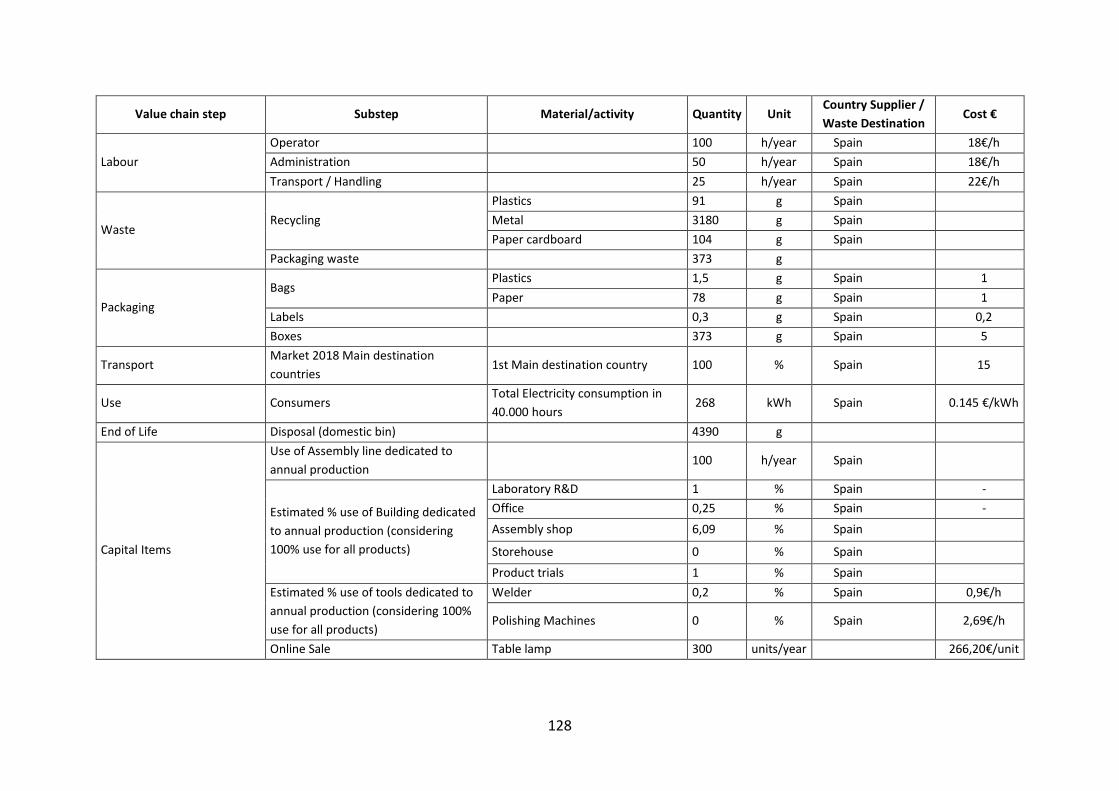
128
Value chain step Substep Material/activity Quantity Unit Country Supplier /
Waste Destination Cost €
Labour
Operator 100 h/year Spain 18€/h
Administration 50 h/year Spain 18€/h
Transport / Handling 25 h/year Spain 22€/h
Waste Recycling
Plastics 91 g Spain
Metal 3180 g Spain
Paper cardboard 104 g Spain
Packaging waste 373 g
Packaging
Bags Plastics 1,5 g Spain 1
Paper 78 g Spain 1
Labels 0,3 g Spain 0,2
Boxes 373 g Spain 5
Transport Market 2018 Main destination
countries 1st Main destination country 100 % Spain 15
Use Consumers Total Electricity consumption in
40.000 hours 268 kWh Spain 0.145 €/kWh
End of Life Disposal (domestic bin) 4390 g
Capital Items
Use of Assembly line dedicated to
annual production 100 h/year Spain
Estimated % use of Building dedicated
to annual production (considering
100% use for all products)
Laboratory R&D 1 % Spain -
Office 0,25 % Spain -
Assembly shop 6,09 % Spain
Storehouse 0 % Spain
Product trials 1 % Spain
Estimated % use of tools dedicated to
annual production (considering 100%
use for all products)
Welder 0,2 % Spain 0,9€/h
Polishing Machines 0 % Spain 2,69€/h
Online Sale Table lamp 300 units/year 266,20€/unit
129
The selected product is manufactured about order. Thus, they not have a big stock of the
product. Regarding electricity consumption for the manufacturing step, since the product
does not have a considerable volume within the company, it was not considered in the LCI.
The total number of workers in the company is 4 people. From them, 50% are women. The
male median wage is 1,068.37 € and the female median wage is 1,328.44 €. Due the
company size, they don´t have obligation to have a labour union. Regarding water
consumption, the total consumption per year is 12 m3 with a cost of 9,31€/m3. The ratio of
annual cost of personnel/annual turnover is 0,75. This value denotes a characteristic of the
company where their main activity is the product design. The mean hourly wage paid to
employees is 38€/h. It should be mentioned that the cost payed to AMBILAMP for the
recycling activity of the product is 0.5€ per unit with corresponds to the extended
responsibility of the producer.
Finally, with the aim to assess the ONA´s risk values adapted to its performance, Table 9-6
shows the data collected related to the indicators studied. Since, PSILCA database contains
reference data from specific sectors at national level, ONA´s values are used to adapt the
reference data to a company level and assuming that this information can be extrapolated
to the lighting sector in Spain.
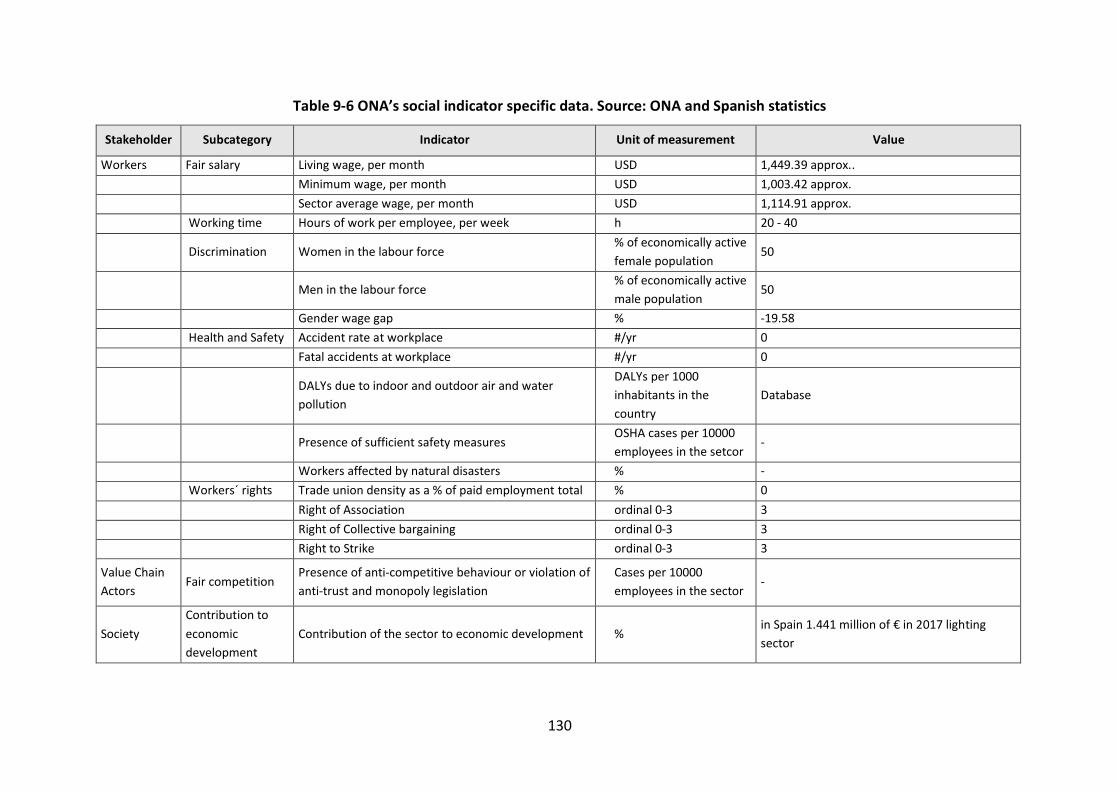
130
Table 9-6 ONA’s social indicator specific data. Source: ONA and Spanish statistics
Stakeholder Subcategory Indicator Unit of measurement Value
Workers Fair salary Living wage, per month USD 1,449.39 approx..
Minimum wage, per month USD 1,003.42 approx.
Sector average wage, per month USD 1,114.91 approx.
Working time Hours of work per employee, per week h 20 - 40
Discrimination Women in the labour force % of economically active
female population 50
Men in the labour force % of economically active
male population 50
Gender wage gap % -19.58
Health and Safety Accident rate at workplace #/yr 0
Fatal accidents at workplace #/yr 0
DALYs due to indoor and outdoor air and water
pollution
DALYs per 1000
inhabitants in the
country
Database
Presence of sufficient safety measures OSHA cases per 10000
employees in the setcor -
Workers affected by natural disasters % -
Workers´ rights Trade union density as a % of paid employment total % 0
Right of Association ordinal 0-3 3
Right of Collective bargaining ordinal 0-3 3
Right to Strike ordinal 0-3 3
Value Chain
Actors Fair competition
Presence of anti-competitive behaviour or violation of
anti-trust and monopoly legislation
Cases per 10000
employees in the sector -
Society
Contribution to
economic
development
Contribution of the sector to economic development % in Spain 1.441 million of € in 2017 lighting
sector
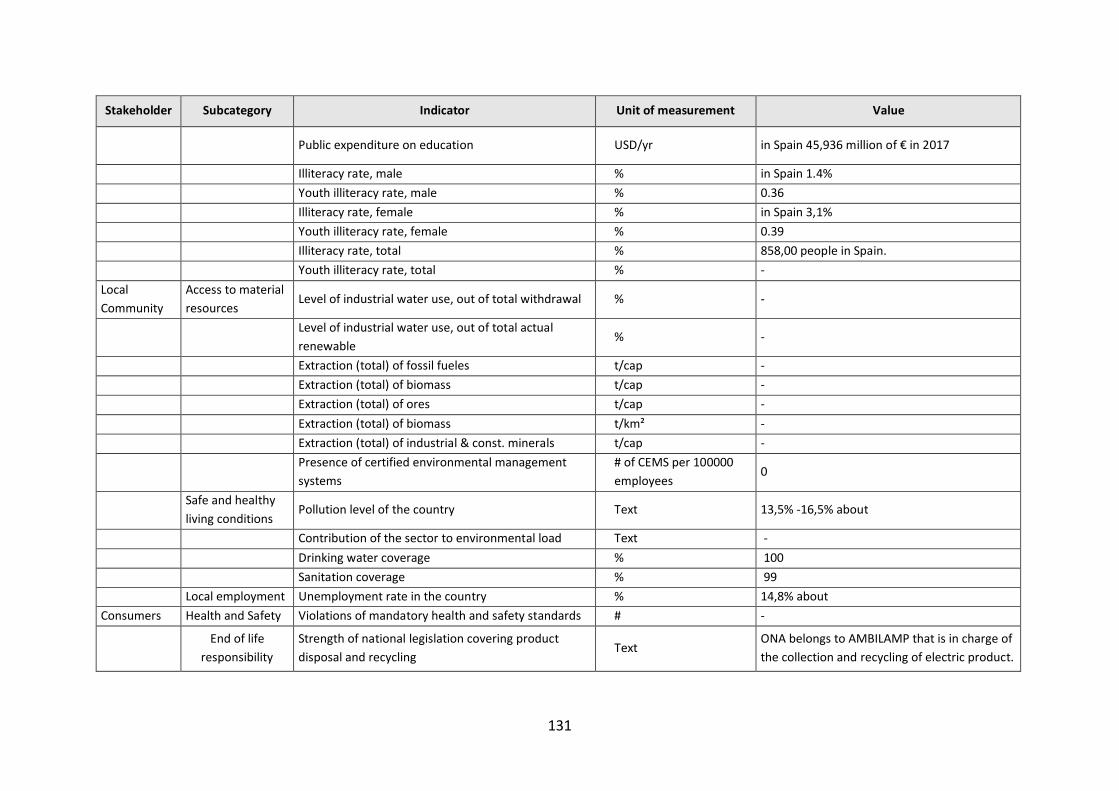
131
Stakeholder Subcategory Indicator Unit of measurement Value
Public expenditure on education USD/yr in Spain 45,936 million of € in 2017
Illiteracy rate, male % in Spain 1.4%
Youth illiteracy rate, male % 0.36
Illiteracy rate, female % in Spain 3,1%
Youth illiteracy rate, female % 0.39
Illiteracy rate, total % 858,00 people in Spain.
Youth illiteracy rate, total % -
Local
Community
Access to material
resources Level of industrial water use, out of total withdrawal % -
Level of industrial water use, out of total actual
renewable % -
Extraction (total) of fossil fueles t/cap -
Extraction (total) of biomass t/cap -
Extraction (total) of ores t/cap -
Extraction (total) of biomass t/km² -
Extraction (total) of industrial & const. minerals t/cap -
Presence of certified environmental management
systems
# of CEMS per 100000
employees 0
Safe and healthy
living conditions Pollution level of the country Text 13,5% -16,5% about
Contribution of the sector to environmental load Text -
Drinking water coverage % 100
Sanitation coverage % 99
Local employment Unemployment rate in the country % 14,8% about
Consumers Health and Safety Violations of mandatory health and safety standards # -
End of life
responsibility
Strength of national legislation covering product
disposal and recycling Text
ONA belongs to AMBILAMP that is in charge of
the collection and recycling of electric product.
132
9.3.4 Social Life Cycle Impact Assessment
Based on: i) the social categories and indicators definition approach, ii) finding out the level
of importance of each subcategory for the company and for the company customers and
stakeholders with a materiality analysis and iii) by developing the life cycle inventories of
input/output per process (including calculation of the process inputs in 2011 US$ in order to
refer to PSILCA database), the social life cycle assessment of the reference products has
been conducted following the steps below:
• Specific social data collection from company and sector to assess the level of risk for
each selected indicator.
• Calculation of the worker hours of the main activity in hours per $ of output. This is
calculated as a ratio of the unit labour costs ($/h) and the mean hourly wage per
employee, as presented below:
o Construct the simulation models in openLCA, using self-made processes supported by the built-in industries and commodities available per country and sector in PSILCA.
o Perform the LCI assessment by simulation using openLCA.
o Interpret the results.
o Adjust model and iterate.
The ratio of annual cost of personnel/annual turnover is 0,75 for the reference year and the
mean hourly labour cost per employee is 38€/h (42 US$/h considering a exchange rate of
0,897 €/US$), the worker hours of the main activity (in hours per $ of output) is 0,01770
h/US$. In order to have a comparable value with PSILCA database ones, the exchange rate
considered for 2011 US$ is 0.75 €/US$. As explained previously, we neglect differences
between the two currencies’ depreciation rates, as both economies have had similar
inflation levels in the period. Thus, the worker hours of the main activity (in hours per $ of
output) for 2011 is 0,01480 h/US$. This is higher than PSILCA’s value for the reference
sector in Spain: Manufacture of domestic appliances/Commodities/Spain (0,01028 h/US$).
Other reference sectors where the worker hours of the main activity are lower than ONA
could be: Manufacture of lighting equipment and electric lamps/Commodities/ Great Britain
(0,01020 h/US$), Electric lamp bulb and part manufacturing/Commodities/United States
(0,01012 h/US$), Lamp & lighting fixtures/Commodities/Singapore (0,002369 h/US$) and
133
Electric lamps and lighting equipment/Commodities/Taiwan (0,009456 h/US$). On the other
hand, ONA´s worker hours of the main activity are lower than Incandescent electric lamps
or discharge, arc lamps, electric lighting equipment, and parts and
pieces/Commodities/Argentina (0,09039 h/US$). After a deep analysis comparing the
aforementioned reference sectors in PSILCA (mainly geographic and socio-economic
situation in each country) and considering that the Spanish reference sector is not
specifically related only with the lighting sector, it has been selected the Manufacture of
domestic appliances/Commodities/Spain as reference sector for the analysis in this report.
The aim is to make a comparative analysis evaluating the changes of the database in risk
assessment and worker hours (h/US$) and considering also the module created in SimaPro
software with ONA´s LCI.
In this sense, the analysis starts by calculating the PSILCA metrics for risk assessment of the
company ONA in the Spanish lighting sector. Each of the indicators selected are classified by
scope (national, sectoral, or company-specific) and then by existence in PSILCA database.
The relative importance level for the company and its stakeholders have been considered
related to manufacturing and packaging, transport, use and end-of-life activities (included in
the materiality analysis). The indicator index is calculated according to the PSILCA database
definition and compared against the risk level factors to assign risk levels, the results of
which are presented in Table 9-7.
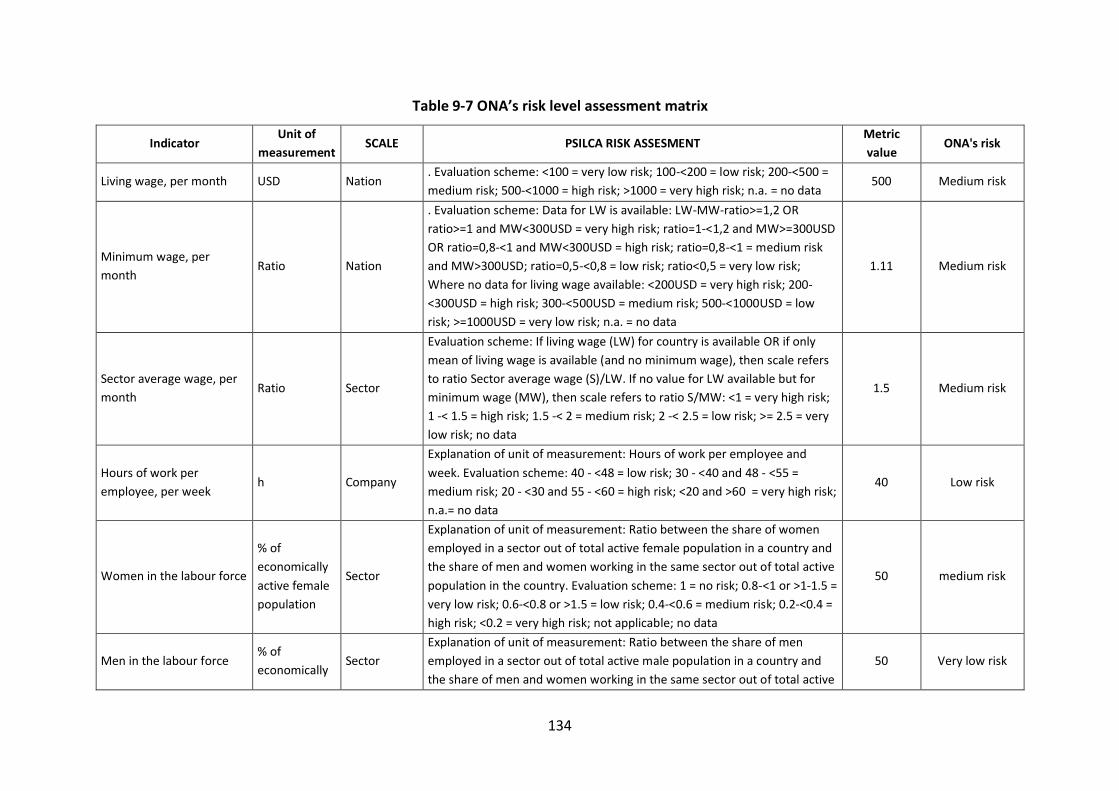
134
Table 9-7 ONA’s risk level assessment matrix
Indicator Unit of
measurement SCALE PSILCA RISK ASSESMENT
Metric
value ONA's risk
Living wage, per month USD Nation . Evaluation scheme: <100 = very low risk; 100-<200 = low risk; 200-<500 =
medium risk; 500-<1000 = high risk; >1000 = very high risk; n.a. = no data 500 Medium risk
Minimum wage, per
month Ratio Nation
. Evaluation scheme: Data for LW is available: LW-MW-ratio>=1,2 OR
ratio>=1 and MW<300USD = very high risk; ratio=1-<1,2 and MW>=300USD
OR ratio=0,8-<1 and MW<300USD = high risk; ratio=0,8-<1 = medium risk
and MW>300USD; ratio=0,5-<0,8 = low risk; ratio<0,5 = very low risk;
Where no data for living wage available: <200USD = very high risk; 200-
<300USD = high risk; 300-<500USD = medium risk; 500-<1000USD = low
risk; >=1000USD = very low risk; n.a. = no data
1.11 Medium risk
Sector average wage, per
month Ratio Sector
Evaluation scheme: If living wage (LW) for country is available OR if only
mean of living wage is available (and no minimum wage), then scale refers
to ratio Sector average wage (S)/LW. If no value for LW available but for
minimum wage (MW), then scale refers to ratio S/MW: <1 = very high risk;
1 -< 1.5 = high risk; 1.5 -< 2 = medium risk; 2 -< 2.5 = low risk; >= 2.5 = very
low risk; no data
1.5 Medium risk
Hours of work per
employee, per week h Company
Explanation of unit of measurement: Hours of work per employee and
week. Evaluation scheme: 40 - <48 = low risk; 30 - <40 and 48 - <55 =
medium risk; 20 - <30 and 55 - <60 = high risk; <20 and >60 = very high risk;
n.a.= no data
40 Low risk
Women in the labour force
% of
economically
active female
population
Sector
Explanation of unit of measurement: Ratio between the share of women
employed in a sector out of total active female population in a country and
the share of men and women working in the same sector out of total active
population in the country. Evaluation scheme: 1 = no risk; 0.8-<1 or >1-1.5 =
very low risk; 0.6-<0.8 or >1.5 = low risk; 0.4-<0.6 = medium risk; 0.2-<0.4 =
high risk; <0.2 = very high risk; not applicable; no data
50 medium risk
Men in the labour force % of
economically Sector
Explanation of unit of measurement: Ratio between the share of men
employed in a sector out of total active male population in a country and
the share of men and women working in the same sector out of total active
50 Very low risk
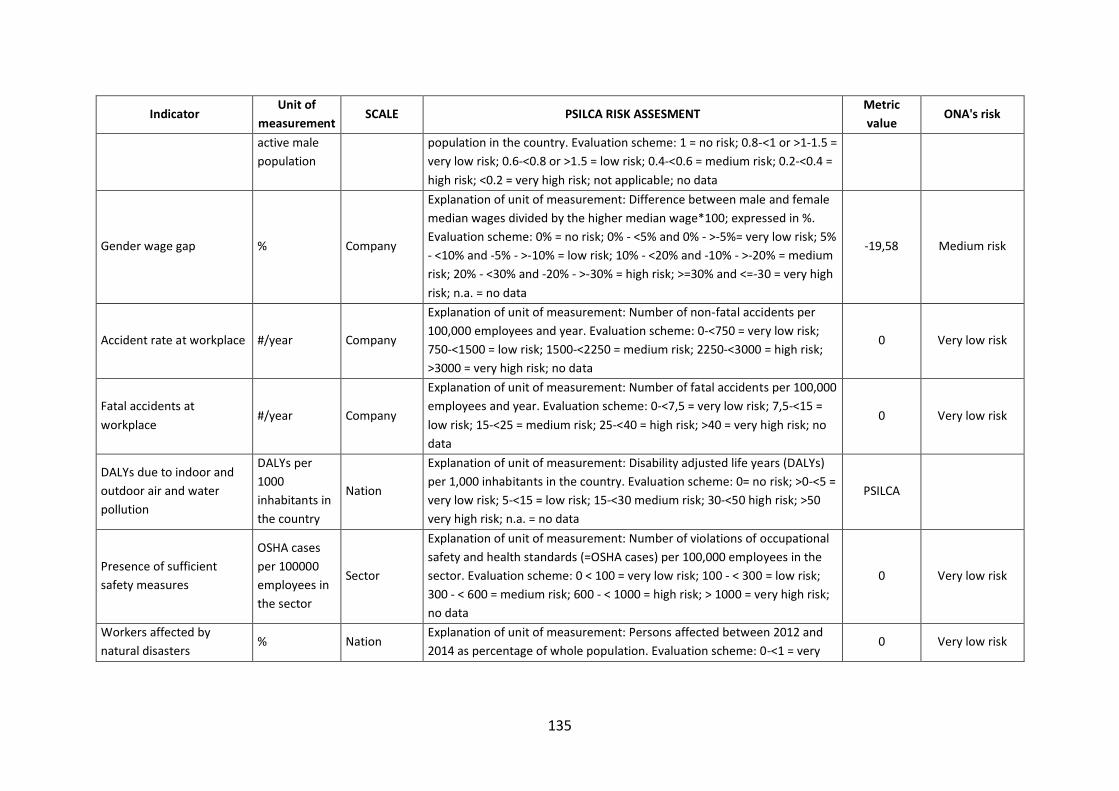
135
Indicator Unit of
measurement SCALE PSILCA RISK ASSESMENT
Metric
value ONA's risk
active male
population
population in the country. Evaluation scheme: 1 = no risk; 0.8-<1 or >1-1.5 =
very low risk; 0.6-<0.8 or >1.5 = low risk; 0.4-<0.6 = medium risk; 0.2-<0.4 =
high risk; <0.2 = very high risk; not applicable; no data
Gender wage gap % Company
Explanation of unit of measurement: Difference between male and female
median wages divided by the higher median wage*100; expressed in %.
Evaluation scheme: 0% = no risk; 0% - <5% and 0% - >-5%= very low risk; 5%
- <10% and -5% - >-10% = low risk; 10% - <20% and -10% - >-20% = medium
risk; 20% - <30% and -20% - >-30% = high risk; >=30% and <=-30 = very high
risk; n.a. = no data
-19,58 Medium risk
Accident rate at workplace #/year Company
Explanation of unit of measurement: Number of non-fatal accidents per
100,000 employees and year. Evaluation scheme: 0-<750 = very low risk;
750-<1500 = low risk; 1500-<2250 = medium risk; 2250-<3000 = high risk;
>3000 = very high risk; no data
0 Very low risk
Fatal accidents at
workplace #/year Company
Explanation of unit of measurement: Number of fatal accidents per 100,000
employees and year. Evaluation scheme: 0-<7,5 = very low risk; 7,5-<15 =
low risk; 15-<25 = medium risk; 25-<40 = high risk; >40 = very high risk; no
data
0 Very low risk
DALYs due to indoor and
outdoor air and water
pollution
DALYs per
1000
inhabitants in
the country
Nation
Explanation of unit of measurement: Disability adjusted life years (DALYs)
per 1,000 inhabitants in the country. Evaluation scheme: 0= no risk; >0-<5 =
very low risk; 5-<15 = low risk; 15-<30 medium risk; 30-<50 high risk; >50
very high risk; n.a. = no data
PSILCA
Presence of sufficient
safety measures
OSHA cases
per 100000
employees in
the sector
Sector
Explanation of unit of measurement: Number of violations of occupational
safety and health standards (=OSHA cases) per 100,000 employees in the
sector. Evaluation scheme: 0 < 100 = very low risk; 100 - < 300 = low risk;
300 - < 600 = medium risk; 600 - < 1000 = high risk; > 1000 = very high risk;
no data
0 Very low risk
Workers affected by
natural disasters % Nation
Explanation of unit of measurement: Persons affected between 2012 and
2014 as percentage of whole population. Evaluation scheme: 0-<1 = very 0 Very low risk
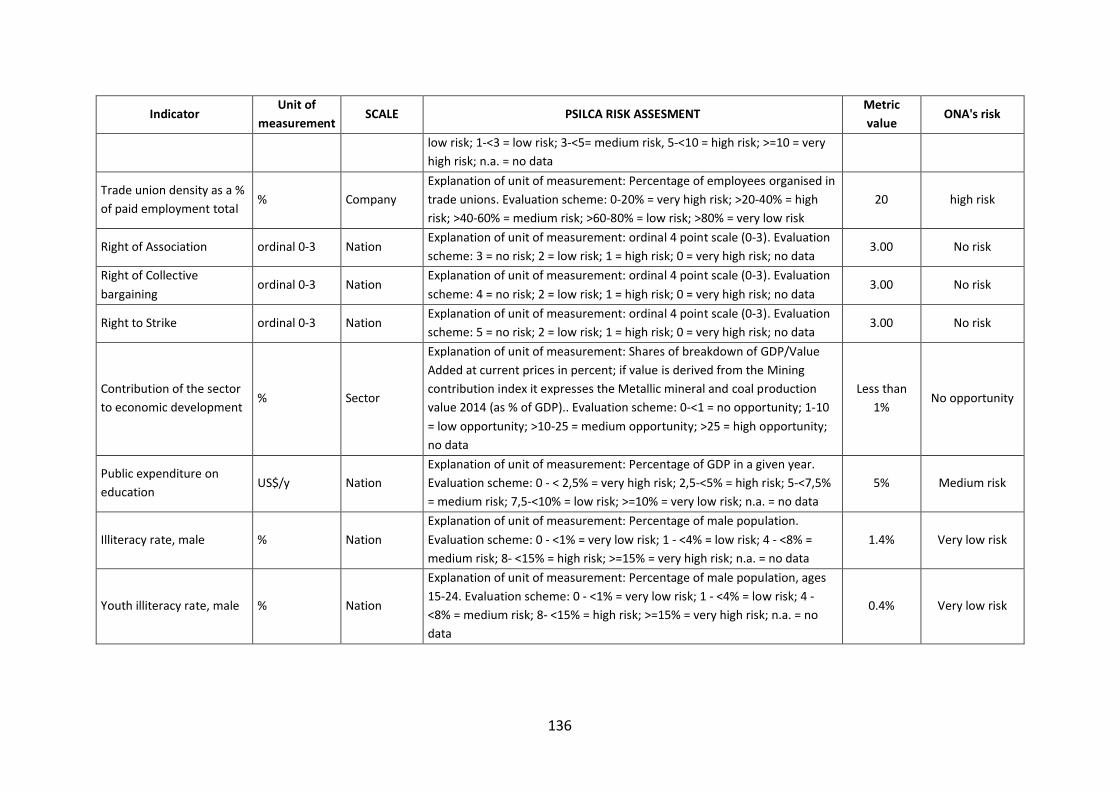
136
Indicator Unit of
measurement SCALE PSILCA RISK ASSESMENT
Metric
value ONA's risk
low risk; 1-<3 = low risk; 3-<5= medium risk, 5-<10 = high risk; >=10 = very
high risk; n.a. = no data
Trade union density as a %
of paid employment total % Company
Explanation of unit of measurement: Percentage of employees organised in
trade unions. Evaluation scheme: 0-20% = very high risk; >20-40% = high
risk; >40-60% = medium risk; >60-80% = low risk; >80% = very low risk
20 high risk
Right of Association ordinal 0-3 Nation Explanation of unit of measurement: ordinal 4 point scale (0-3). Evaluation
scheme: 3 = no risk; 2 = low risk; 1 = high risk; 0 = very high risk; no data 3.00 No risk
Right of Collective
bargaining ordinal 0-3 Nation
Explanation of unit of measurement: ordinal 4 point scale (0-3). Evaluation
scheme: 4 = no risk; 2 = low risk; 1 = high risk; 0 = very high risk; no data 3.00 No risk
Right to Strike ordinal 0-3 Nation Explanation of unit of measurement: ordinal 4 point scale (0-3). Evaluation
scheme: 5 = no risk; 2 = low risk; 1 = high risk; 0 = very high risk; no data 3.00 No risk
Contribution of the sector
to economic development % Sector
Explanation of unit of measurement: Shares of breakdown of GDP/Value
Added at current prices in percent; if value is derived from the Mining
contribution index it expresses the Metallic mineral and coal production
value 2014 (as % of GDP).. Evaluation scheme: 0-<1 = no opportunity; 1-10
= low opportunity; >10-25 = medium opportunity; >25 = high opportunity;
no data
Less than
1% No opportunity
Public expenditure on
education US$/y Nation
Explanation of unit of measurement: Percentage of GDP in a given year.
Evaluation scheme: 0 - < 2,5% = very high risk; 2,5-<5% = high risk; 5-<7,5%
= medium risk; 7,5-<10% = low risk; >=10% = very low risk; n.a. = no data
5% Medium risk
Illiteracy rate, male % Nation
Explanation of unit of measurement: Percentage of male population.
Evaluation scheme: 0 - <1% = very low risk; 1 - <4% = low risk; 4 - <8% =
medium risk; 8- <15% = high risk; >=15% = very high risk; n.a. = no data
1.4% Very low risk
Youth illiteracy rate, male % Nation
Explanation of unit of measurement: Percentage of male population, ages
15-24. Evaluation scheme: 0 - <1% = very low risk; 1 - <4% = low risk; 4 -
<8% = medium risk; 8- <15% = high risk; >=15% = very high risk; n.a. = no
data
0.4% Very low risk
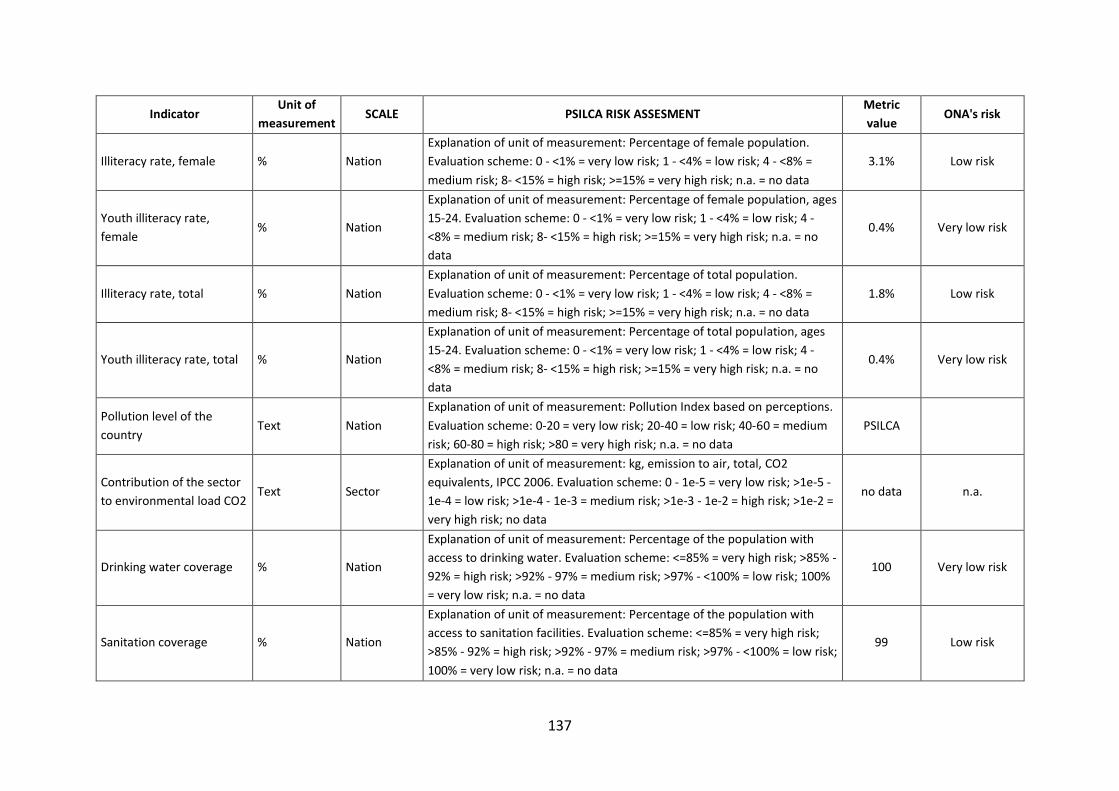
137
Indicator Unit of
measurement SCALE PSILCA RISK ASSESMENT
Metric
value ONA's risk
Illiteracy rate, female % Nation
Explanation of unit of measurement: Percentage of female population.
Evaluation scheme: 0 - <1% = very low risk; 1 - <4% = low risk; 4 - <8% =
medium risk; 8- <15% = high risk; >=15% = very high risk; n.a. = no data
3.1% Low risk
Youth illiteracy rate,
female % Nation
Explanation of unit of measurement: Percentage of female population, ages
15-24. Evaluation scheme: 0 - <1% = very low risk; 1 - <4% = low risk; 4 -
<8% = medium risk; 8- <15% = high risk; >=15% = very high risk; n.a. = no
data
0.4% Very low risk
Illiteracy rate, total % Nation
Explanation of unit of measurement: Percentage of total population.
Evaluation scheme: 0 - <1% = very low risk; 1 - <4% = low risk; 4 - <8% =
medium risk; 8- <15% = high risk; >=15% = very high risk; n.a. = no data
1.8% Low risk
Youth illiteracy rate, total % Nation
Explanation of unit of measurement: Percentage of total population, ages
15-24. Evaluation scheme: 0 - <1% = very low risk; 1 - <4% = low risk; 4 -
<8% = medium risk; 8- <15% = high risk; >=15% = very high risk; n.a. = no
data
0.4% Very low risk
Pollution level of the
country Text Nation
Explanation of unit of measurement: Pollution Index based on perceptions.
Evaluation scheme: 0-20 = very low risk; 20-40 = low risk; 40-60 = medium
risk; 60-80 = high risk; >80 = very high risk; n.a. = no data
PSILCA
Contribution of the sector
to environmental load CO2 Text Sector
Explanation of unit of measurement: kg, emission to air, total, CO2
equivalents, IPCC 2006. Evaluation scheme: 0 - 1e-5 = very low risk; >1e-5 -
1e-4 = low risk; >1e-4 - 1e-3 = medium risk; >1e-3 - 1e-2 = high risk; >1e-2 =
very high risk; no data
no data n.a.
Drinking water coverage % Nation
Explanation of unit of measurement: Percentage of the population with
access to drinking water. Evaluation scheme: <=85% = very high risk; >85% -
92% = high risk; >92% - 97% = medium risk; >97% - <100% = low risk; 100%
= very low risk; n.a. = no data
100 Very low risk
Sanitation coverage % Nation
Explanation of unit of measurement: Percentage of the population with
access to sanitation facilities. Evaluation scheme: <=85% = very high risk;
>85% - 92% = high risk; >92% - 97% = medium risk; >97% - <100% = low risk;
100% = very low risk; n.a. = no data
99 Low risk
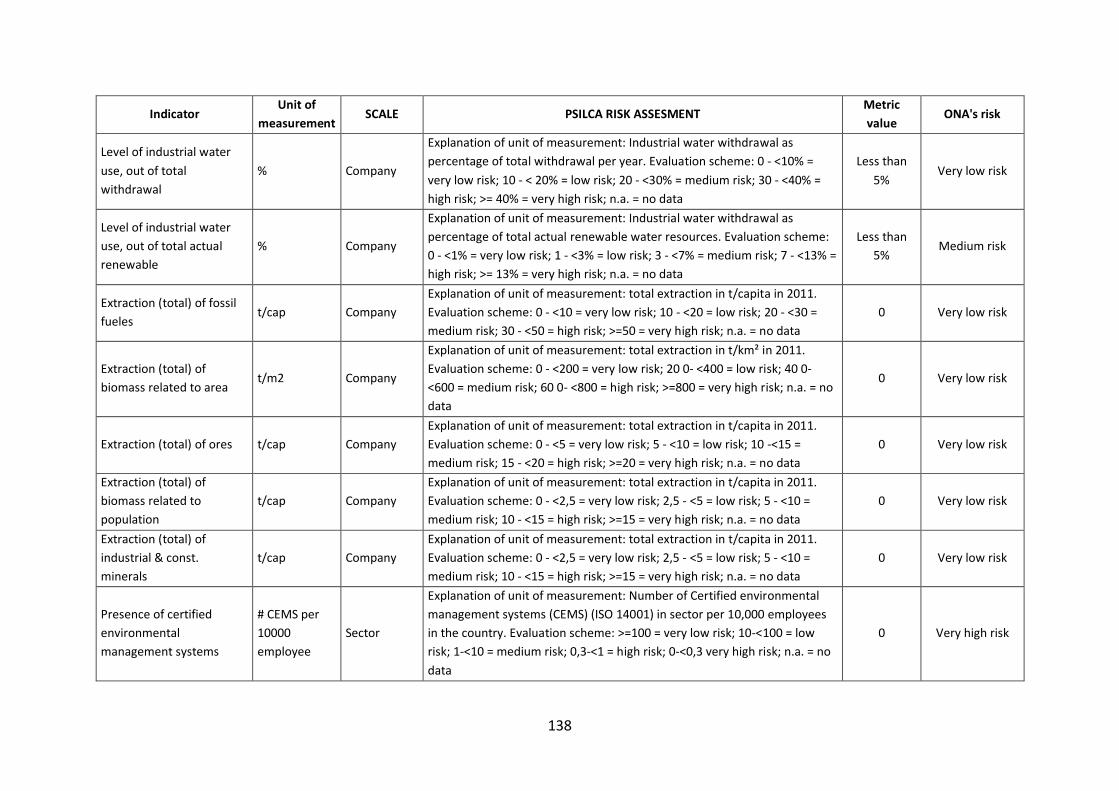
138
Indicator Unit of
measurement SCALE PSILCA RISK ASSESMENT
Metric
value ONA's risk
Level of industrial water
use, out of total
withdrawal
% Company
Explanation of unit of measurement: Industrial water withdrawal as
percentage of total withdrawal per year. Evaluation scheme: 0 - <10% =
very low risk; 10 - < 20% = low risk; 20 - <30% = medium risk; 30 - <40% =
high risk; >= 40% = very high risk; n.a. = no data
Less than
5% Very low risk
Level of industrial water
use, out of total actual
renewable
% Company
Explanation of unit of measurement: Industrial water withdrawal as
percentage of total actual renewable water resources. Evaluation scheme:
0 - <1% = very low risk; 1 - <3% = low risk; 3 - <7% = medium risk; 7 - <13% =
high risk; >= 13% = very high risk; n.a. = no data
Less than
5% Medium risk
Extraction (total) of fossil
fueles t/cap Company
Explanation of unit of measurement: total extraction in t/capita in 2011.
Evaluation scheme: 0 - <10 = very low risk; 10 - <20 = low risk; 20 - <30 =
medium risk; 30 - <50 = high risk; >=50 = very high risk; n.a. = no data
0 Very low risk
Extraction (total) of
biomass related to area t/m2 Company
Explanation of unit of measurement: total extraction in t/km² in 2011.
Evaluation scheme: 0 - <200 = very low risk; 20 0- <400 = low risk; 40 0-
<600 = medium risk; 60 0- <800 = high risk; >=800 = very high risk; n.a. = no
data
0 Very low risk
Extraction (total) of ores t/cap Company
Explanation of unit of measurement: total extraction in t/capita in 2011.
Evaluation scheme: 0 - <5 = very low risk; 5 - <10 = low risk; 10 -<15 =
medium risk; 15 - <20 = high risk; >=20 = very high risk; n.a. = no data
0 Very low risk
Extraction (total) of
biomass related to
population
t/cap Company
Explanation of unit of measurement: total extraction in t/capita in 2011.
Evaluation scheme: 0 - <2,5 = very low risk; 2,5 - <5 = low risk; 5 - <10 =
medium risk; 10 - <15 = high risk; >=15 = very high risk; n.a. = no data
0 Very low risk
Extraction (total) of
industrial & const.
minerals
t/cap Company
Explanation of unit of measurement: total extraction in t/capita in 2011.
Evaluation scheme: 0 - <2,5 = very low risk; 2,5 - <5 = low risk; 5 - <10 =
medium risk; 10 - <15 = high risk; >=15 = very high risk; n.a. = no data
0 Very low risk
Presence of certified
environmental
management systems
# CEMS per
10000
employee
Sector
Explanation of unit of measurement: Number of Certified environmental
management systems (CEMS) (ISO 14001) in sector per 10,000 employees
in the country. Evaluation scheme: >=100 = very low risk; 10-<100 = low
risk; 1-<10 = medium risk; 0,3-<1 = high risk; 0-<0,3 very high risk; n.a. = no
data
0 Very high risk
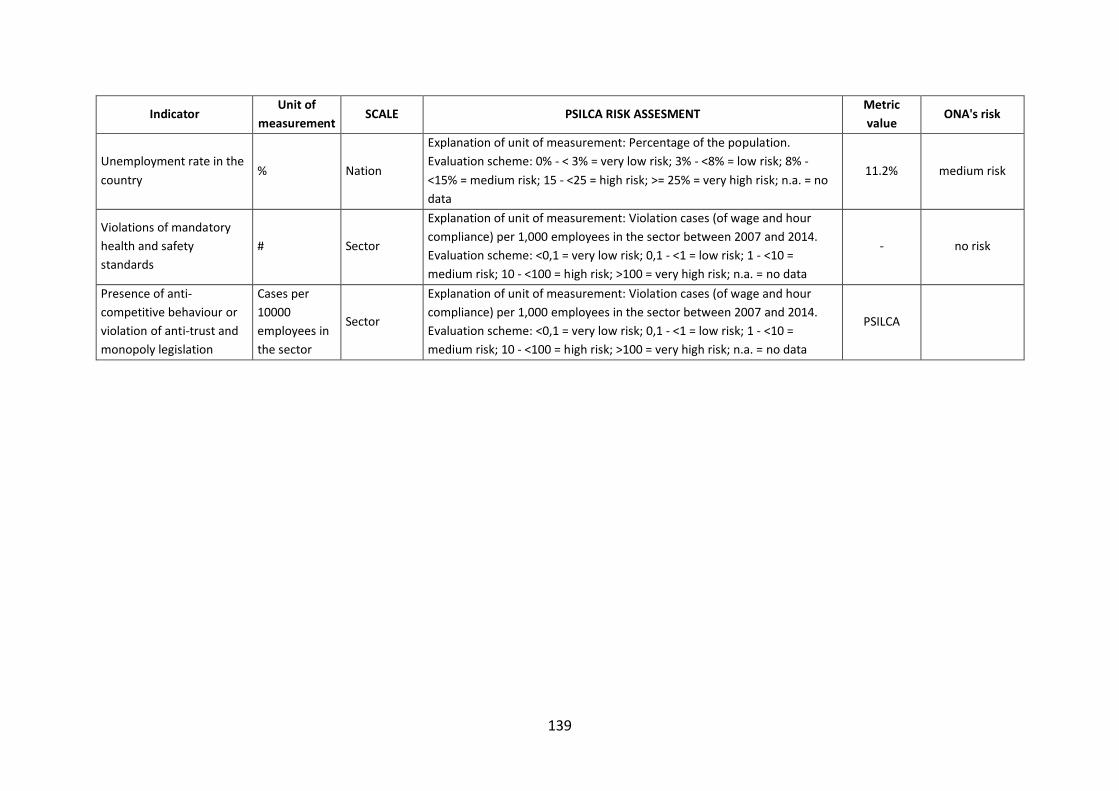
139
Indicator Unit of
measurement SCALE PSILCA RISK ASSESMENT
Metric
value ONA's risk
Unemployment rate in the
country % Nation
Explanation of unit of measurement: Percentage of the population.
Evaluation scheme: 0% - < 3% = very low risk; 3% - <8% = low risk; 8% -
<15% = medium risk; 15 - <25 = high risk; >= 25% = very high risk; n.a. = no
data
11.2% medium risk
Violations of mandatory
health and safety
standards
# Sector
Explanation of unit of measurement: Violation cases (of wage and hour
compliance) per 1,000 employees in the sector between 2007 and 2014.
Evaluation scheme: <0,1 = very low risk; 0,1 - <1 = low risk; 1 - <10 =
medium risk; 10 - <100 = high risk; >100 = very high risk; n.a. = no data
- no risk
Presence of anti-
competitive behaviour or
violation of anti-trust and
monopoly legislation
Cases per
10000
employees in
the sector
Sector
Explanation of unit of measurement: Violation cases (of wage and hour
compliance) per 1,000 employees in the sector between 2007 and 2014.
Evaluation scheme: <0,1 = very low risk; 0,1 - <1 = low risk; 1 - <10 =
medium risk; 10 - <100 = high risk; >100 = very high risk; n.a. = no data
PSILCA
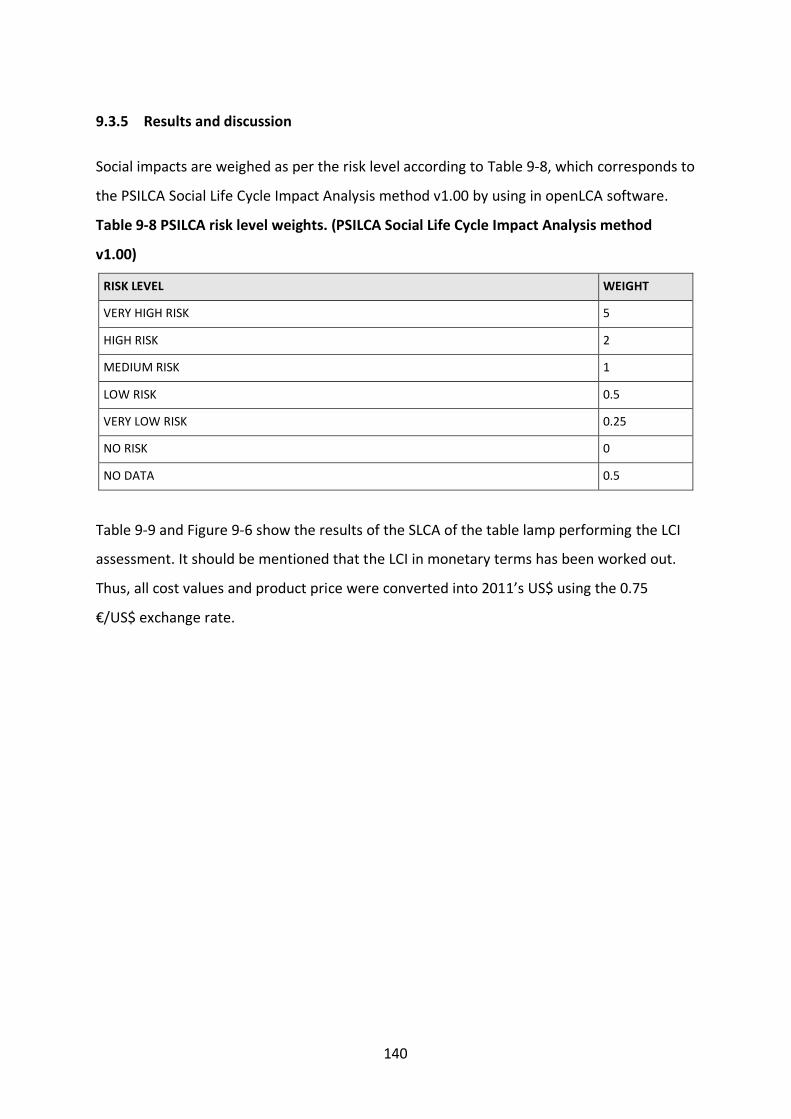
140
9.3.5 Results and discussion
Social impacts are weighed as per the risk level according to Table 9-8, which corresponds to
the PSILCA Social Life Cycle Impact Analysis method v1.00 by using in openLCA software.
Table 9-8 PSILCA risk level weights. (PSILCA Social Life Cycle Impact Analysis method
v1.00)
RISK LEVEL WEIGHT
VERY HIGH RISK 5
HIGH RISK 2
MEDIUM RISK 1
LOW RISK 0.5
VERY LOW RISK 0.25
NO RISK 0
NO DATA 0.5
Table 9-9 and Figure 9-6 show the results of the SLCA of the table lamp performing the LCI
assessment. It should be mentioned that the LCI in monetary terms has been worked out.
Thus, all cost values and product price were converted into 2011’s US$ using the 0.75
€/US$ exchange rate.
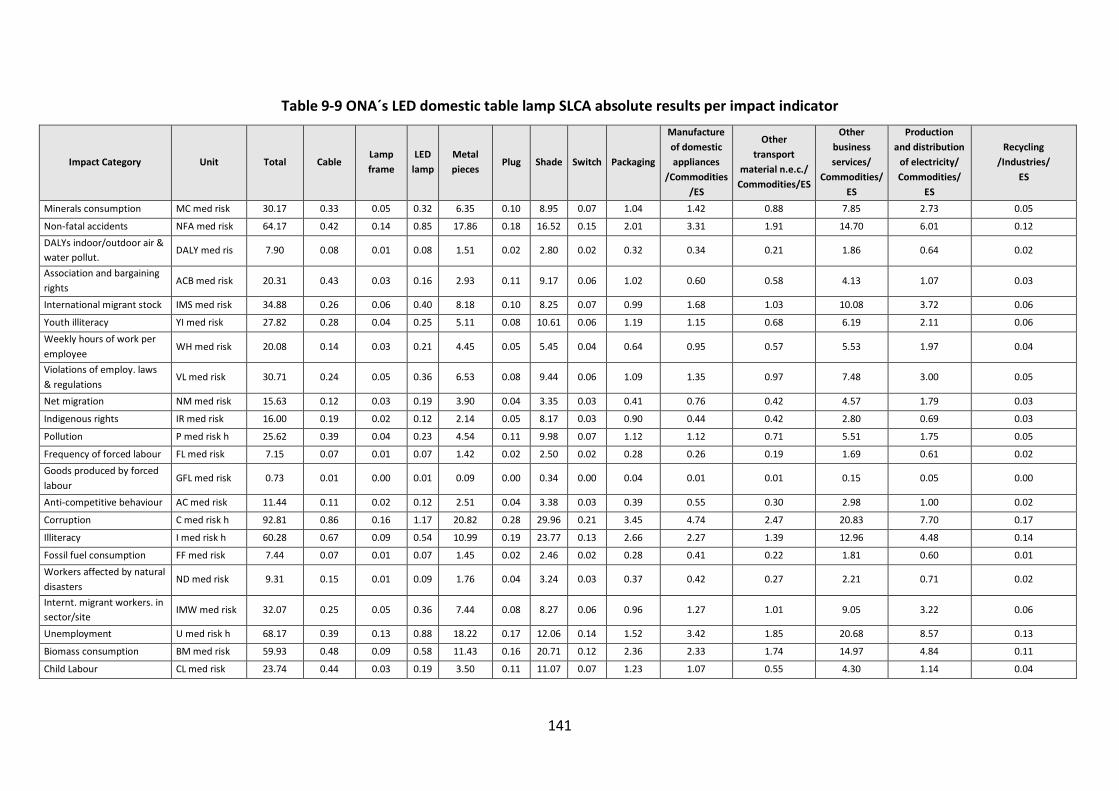
141
Table 9-9 ONA´s LED domestic table lamp SLCA absolute results per impact indicator
Impact Category Unit Total Cable Lamp
frame
LED
lamp
Metal
pieces Plug Shade Switch Packaging
Manufacture
of domestic
appliances
/Commodities
/ES
Other
transport
material n.e.c./
Commodities/ES
Other
business
services/
Commodities/
ES
Production
and distribution
of electricity/
Commodities/
ES
Recycling
/Industries/
ES
Minerals consumption MC med risk 30.17 0.33 0.05 0.32 6.35 0.10 8.95 0.07 1.04 1.42 0.88 7.85 2.73 0.05
Non-fatal accidents NFA med risk 64.17 0.42 0.14 0.85 17.86 0.18 16.52 0.15 2.01 3.31 1.91 14.70 6.01 0.12
DALYs indoor/outdoor air &
water pollut. DALY med ris 7.90 0.08 0.01 0.08 1.51 0.02 2.80 0.02 0.32 0.34 0.21 1.86 0.64 0.02
Association and bargaining
rights ACB med risk 20.31 0.43 0.03 0.16 2.93 0.11 9.17 0.06 1.02 0.60 0.58 4.13 1.07 0.03
International migrant stock IMS med risk 34.88 0.26 0.06 0.40 8.18 0.10 8.25 0.07 0.99 1.68 1.03 10.08 3.72 0.06
Youth illiteracy YI med risk 27.82 0.28 0.04 0.25 5.11 0.08 10.61 0.06 1.19 1.15 0.68 6.19 2.11 0.06
Weekly hours of work per
employee WH med risk 20.08 0.14 0.03 0.21 4.45 0.05 5.45 0.04 0.64 0.95 0.57 5.53 1.97 0.04
Violations of employ. laws
& regulations VL med risk 30.71 0.24 0.05 0.36 6.53 0.08 9.44 0.06 1.09 1.35 0.97 7.48 3.00 0.05
Net migration NM med risk 15.63 0.12 0.03 0.19 3.90 0.04 3.35 0.03 0.41 0.76 0.42 4.57 1.79 0.03
Indigenous rights IR med risk 16.00 0.19 0.02 0.12 2.14 0.05 8.17 0.03 0.90 0.44 0.42 2.80 0.69 0.03
Pollution P med risk h 25.62 0.39 0.04 0.23 4.54 0.11 9.98 0.07 1.12 1.12 0.71 5.51 1.75 0.05
Frequency of forced labour FL med risk 7.15 0.07 0.01 0.07 1.42 0.02 2.50 0.02 0.28 0.26 0.19 1.69 0.61 0.02
Goods produced by forced
labour GFL med risk 0.73 0.01 0.00 0.01 0.09 0.00 0.34 0.00 0.04 0.01 0.01 0.15 0.05 0.00
Anti-competitive behaviour AC med risk 11.44 0.11 0.02 0.12 2.51 0.04 3.38 0.03 0.39 0.55 0.30 2.98 1.00 0.02
Corruption C med risk h 92.81 0.86 0.16 1.17 20.82 0.28 29.96 0.21 3.45 4.74 2.47 20.83 7.70 0.17
Illiteracy I med risk h 60.28 0.67 0.09 0.54 10.99 0.19 23.77 0.13 2.66 2.27 1.39 12.96 4.48 0.14
Fossil fuel consumption FF med risk 7.44 0.07 0.01 0.07 1.45 0.02 2.46 0.02 0.28 0.41 0.22 1.81 0.60 0.01
Workers affected by natural
disasters ND med risk 9.31 0.15 0.01 0.09 1.76 0.04 3.24 0.03 0.37 0.42 0.27 2.21 0.71 0.02
Internt. migrant workers. in
sector/site IMW med risk 32.07 0.25 0.05 0.36 7.44 0.08 8.27 0.06 0.96 1.27 1.01 9.05 3.22 0.06
Unemployment U med risk h 68.17 0.39 0.13 0.88 18.22 0.17 12.06 0.14 1.52 3.42 1.85 20.68 8.57 0.13
Biomass consumption BM med risk 59.93 0.48 0.09 0.58 11.43 0.16 20.71 0.12 2.36 2.33 1.74 14.97 4.84 0.11
Child Labour CL med risk 23.74 0.44 0.03 0.19 3.50 0.11 11.07 0.07 1.23 1.07 0.55 4.30 1.14 0.04
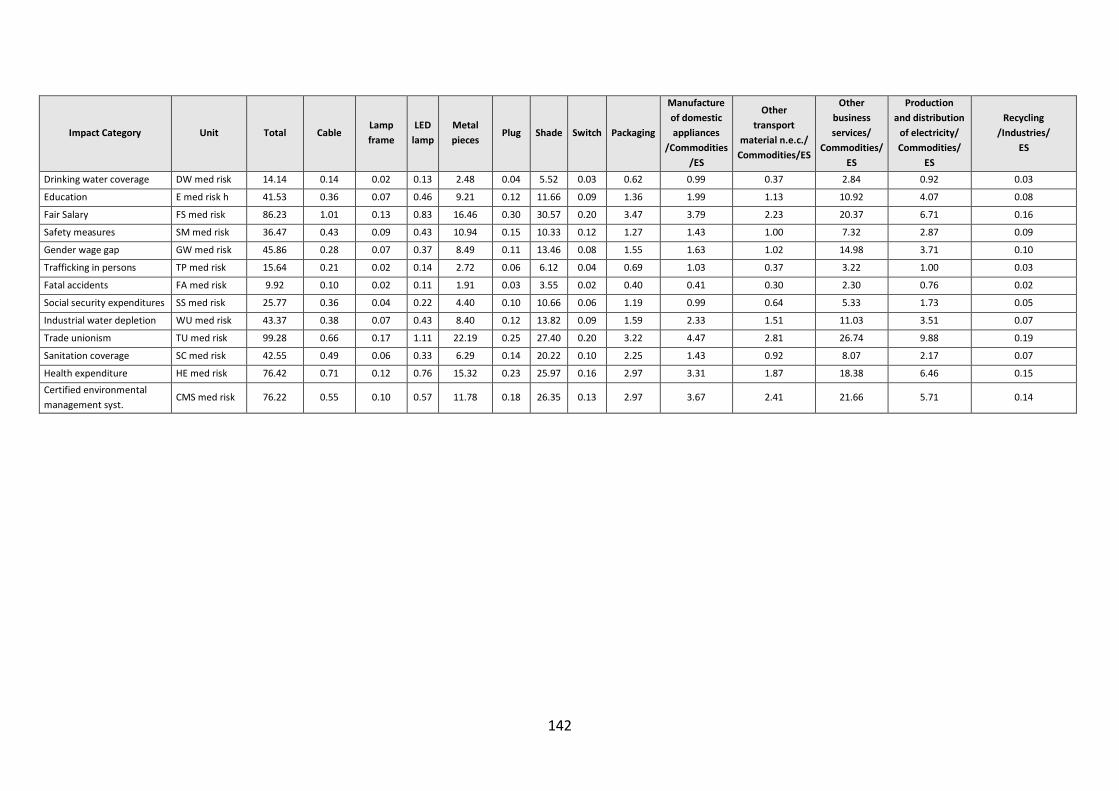
142
Impact Category Unit Total Cable Lamp
frame
LED
lamp
Metal
pieces Plug Shade Switch Packaging
Manufacture
of domestic
appliances
/Commodities
/ES
Other
transport
material n.e.c./
Commodities/ES
Other
business
services/
Commodities/
ES
Production
and distribution
of electricity/
Commodities/
ES
Recycling
/Industries/
ES
Drinking water coverage DW med risk 14.14 0.14 0.02 0.13 2.48 0.04 5.52 0.03 0.62 0.99 0.37 2.84 0.92 0.03
Education E med risk h 41.53 0.36 0.07 0.46 9.21 0.12 11.66 0.09 1.36 1.99 1.13 10.92 4.07 0.08
Fair Salary FS med risk 86.23 1.01 0.13 0.83 16.46 0.30 30.57 0.20 3.47 3.79 2.23 20.37 6.71 0.16
Safety measures SM med risk 36.47 0.43 0.09 0.43 10.94 0.15 10.33 0.12 1.27 1.43 1.00 7.32 2.87 0.09
Gender wage gap GW med risk 45.86 0.28 0.07 0.37 8.49 0.11 13.46 0.08 1.55 1.63 1.02 14.98 3.71 0.10
Trafficking in persons TP med risk 15.64 0.21 0.02 0.14 2.72 0.06 6.12 0.04 0.69 1.03 0.37 3.22 1.00 0.03
Fatal accidents FA med risk 9.92 0.10 0.02 0.11 1.91 0.03 3.55 0.02 0.40 0.41 0.30 2.30 0.76 0.02
Social security expenditures SS med risk 25.77 0.36 0.04 0.22 4.40 0.10 10.66 0.06 1.19 0.99 0.64 5.33 1.73 0.05
Industrial water depletion WU med risk 43.37 0.38 0.07 0.43 8.40 0.12 13.82 0.09 1.59 2.33 1.51 11.03 3.51 0.07
Trade unionism TU med risk 99.28 0.66 0.17 1.11 22.19 0.25 27.40 0.20 3.22 4.47 2.81 26.74 9.88 0.19
Sanitation coverage SC med risk 42.55 0.49 0.06 0.33 6.29 0.14 20.22 0.10 2.25 1.43 0.92 8.07 2.17 0.07
Health expenditure HE med risk 76.42 0.71 0.12 0.76 15.32 0.23 25.97 0.16 2.97 3.31 1.87 18.38 6.46 0.15
Certified environmental
management syst. CMS med risk 76.22 0.55 0.10 0.57 11.78 0.18 26.35 0.13 2.97 3.67 2.41 21.66 5.71 0.14
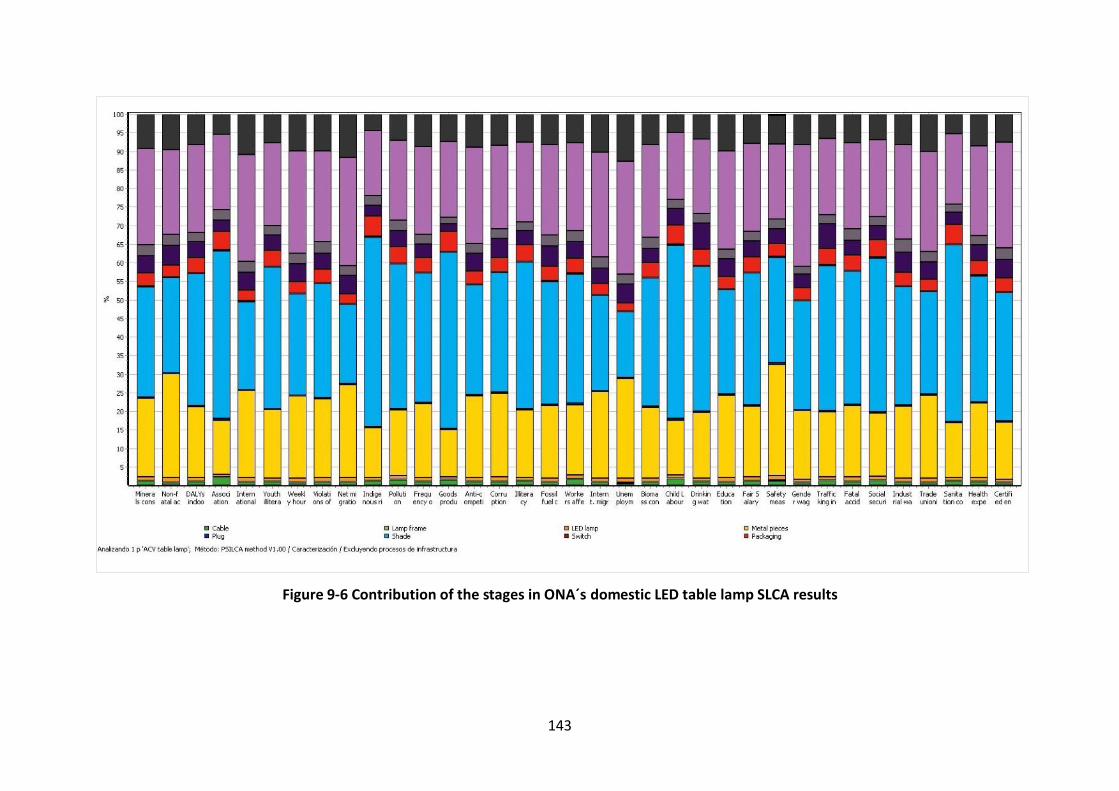
143
Figure 9-6 Contribution of the stages in ONA´s domestic LED table lamp SLCA results
144
As can be seen in Figure 9-6, the metal pieces plus the shade represent more than 45% if
the impact in all social impact categories. The category of ‘Other business
services/Commodities/ES’ (represented in purple) also represents an important part of the
impact. This category represents the ‘indirect costs’, which are all costs related to business
activities as the difference between the final price and all the cost stated in LCI. In this case,
the indirect costs estimated for the table lamp is 109.6 US$ which represents 37% of the
final price of the product. It should be mentioned that an important part of this percentage
corresponds to the commercial margin of the company. In addition, use phase (electricity
consumption during 40.000 hours of lifetime) corresponds to 51,9 US$ being the fourth
most important variable in terms of social impact.
In order to compare these results with the Spanish representative sector in PSILCA, Table
9-10 and Figure 9-7 shows the comparative results of the table lamp SLCA and the
Manufacture of domestic appliances/Commodities/Spain. It should be mentioned that for
the reference sector, the worker hours estimated for ONA of 0.01480 h/US$ and ONA´s risk
levels factors for the indicators studied (Table 9-7) were considered. In addition, since
PSILCA database covers a cradle to gate approach, comparison is made accordingly.
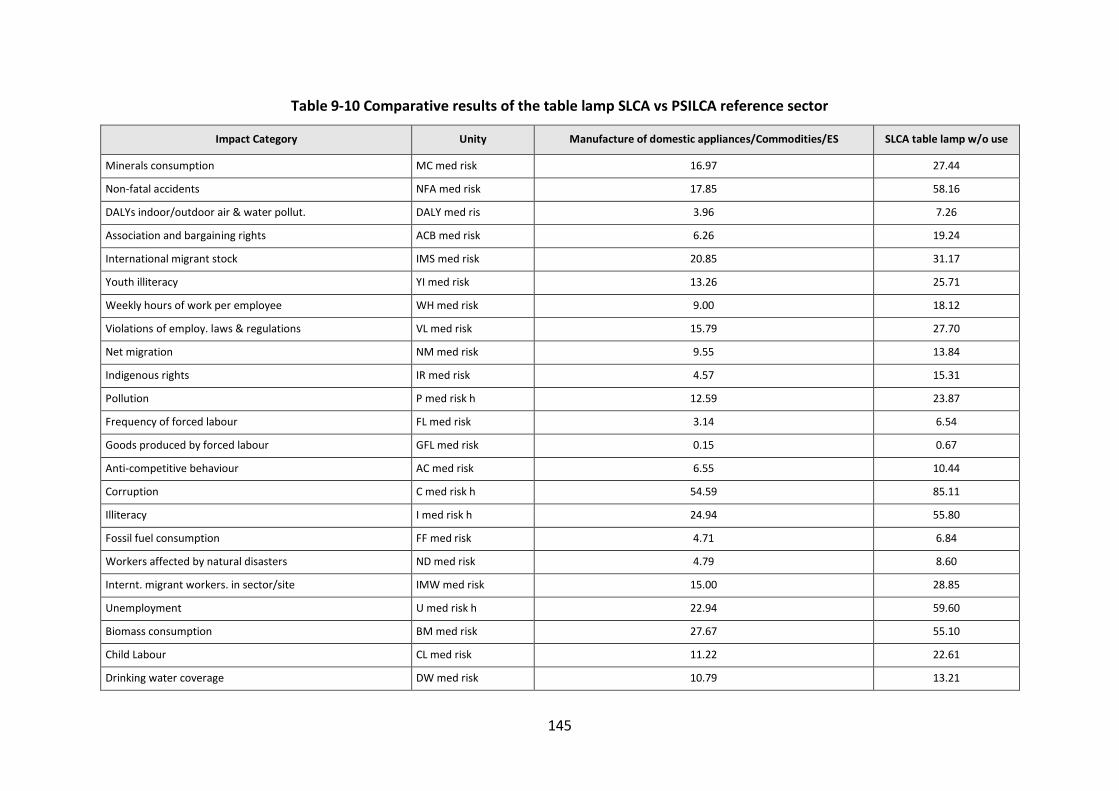
145
Table 9-10 Comparative results of the table lamp SLCA vs PSILCA reference sector
Impact Category Unity Manufacture of domestic appliances/Commodities/ES SLCA table lamp w/o use
Minerals consumption MC med risk 16.97 27.44
Non-fatal accidents NFA med risk 17.85 58.16
DALYs indoor/outdoor air & water pollut. DALY med ris 3.96 7.26
Association and bargaining rights ACB med risk 6.26 19.24
International migrant stock IMS med risk 20.85 31.17
Youth illiteracy YI med risk 13.26 25.71
Weekly hours of work per employee WH med risk 9.00 18.12
Violations of employ. laws & regulations VL med risk 15.79 27.70
Net migration NM med risk 9.55 13.84
Indigenous rights IR med risk 4.57 15.31
Pollution P med risk h 12.59 23.87
Frequency of forced labour FL med risk 3.14 6.54
Goods produced by forced labour GFL med risk 0.15 0.67
Anti-competitive behaviour AC med risk 6.55 10.44
Corruption C med risk h 54.59 85.11
Illiteracy I med risk h 24.94 55.80
Fossil fuel consumption FF med risk 4.71 6.84
Workers affected by natural disasters ND med risk 4.79 8.60
Internt. migrant workers. in sector/site IMW med risk 15.00 28.85
Unemployment U med risk h 22.94 59.60
Biomass consumption BM med risk 27.67 55.10
Child Labour CL med risk 11.22 22.61
Drinking water coverage DW med risk 10.79 13.21
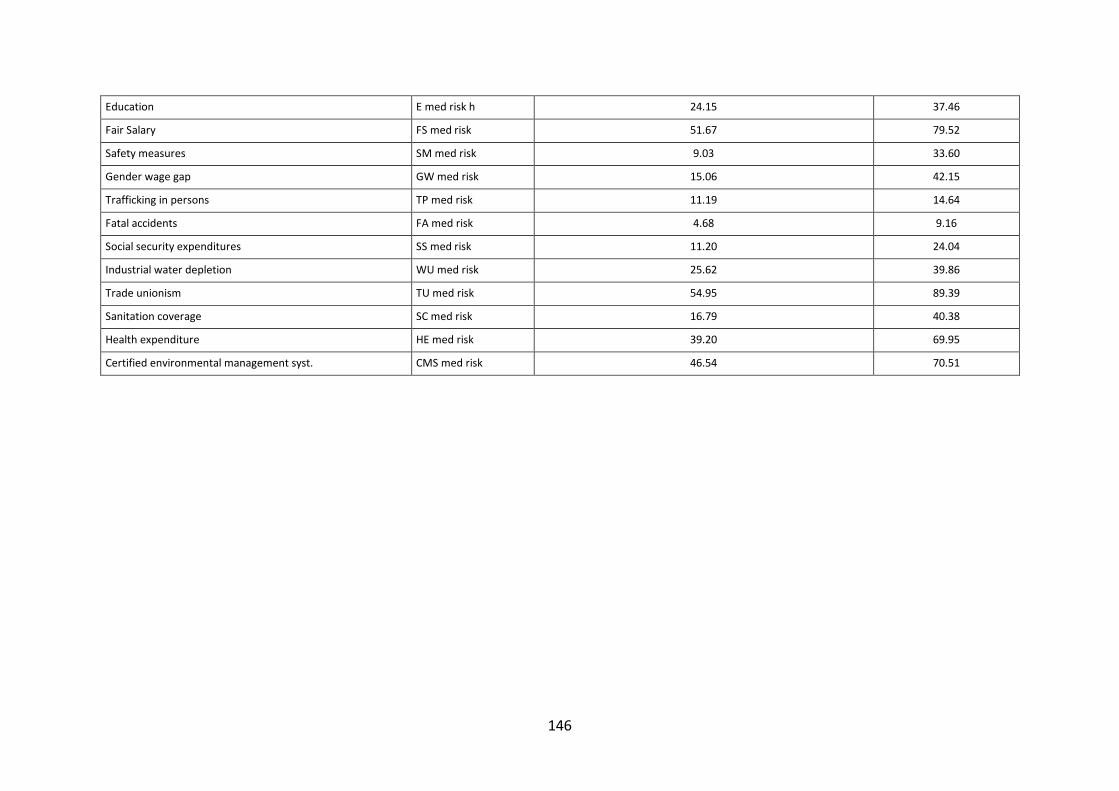
146
Education E med risk h 24.15 37.46
Fair Salary FS med risk 51.67 79.52
Safety measures SM med risk 9.03 33.60
Gender wage gap GW med risk 15.06 42.15
Trafficking in persons TP med risk 11.19 14.64
Fatal accidents FA med risk 4.68 9.16
Social security expenditures SS med risk 11.20 24.04
Industrial water depletion WU med risk 25.62 39.86
Trade unionism TU med risk 54.95 89.39
Sanitation coverage SC med risk 16.79 40.38
Health expenditure HE med risk 39.20 69.95
Certified environmental management syst. CMS med risk 46.54 70.51
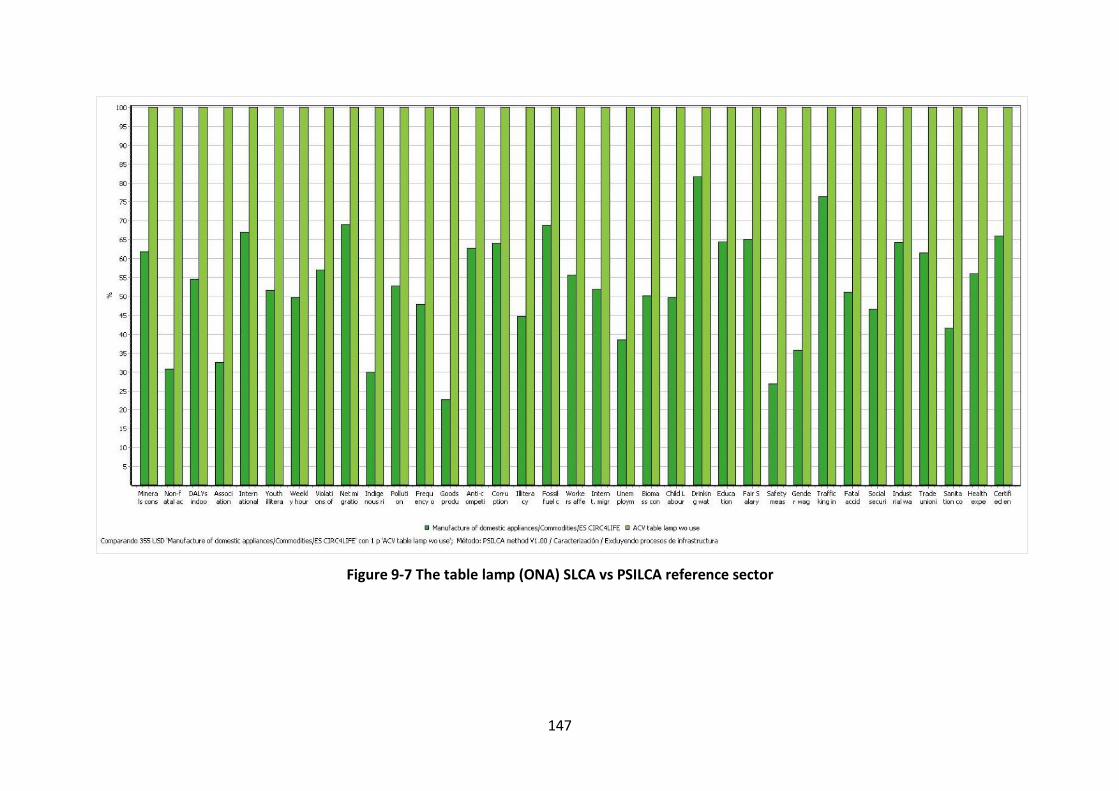
147
Figure 9-7 The table lamp (ONA) SLCA vs PSILCA reference sector
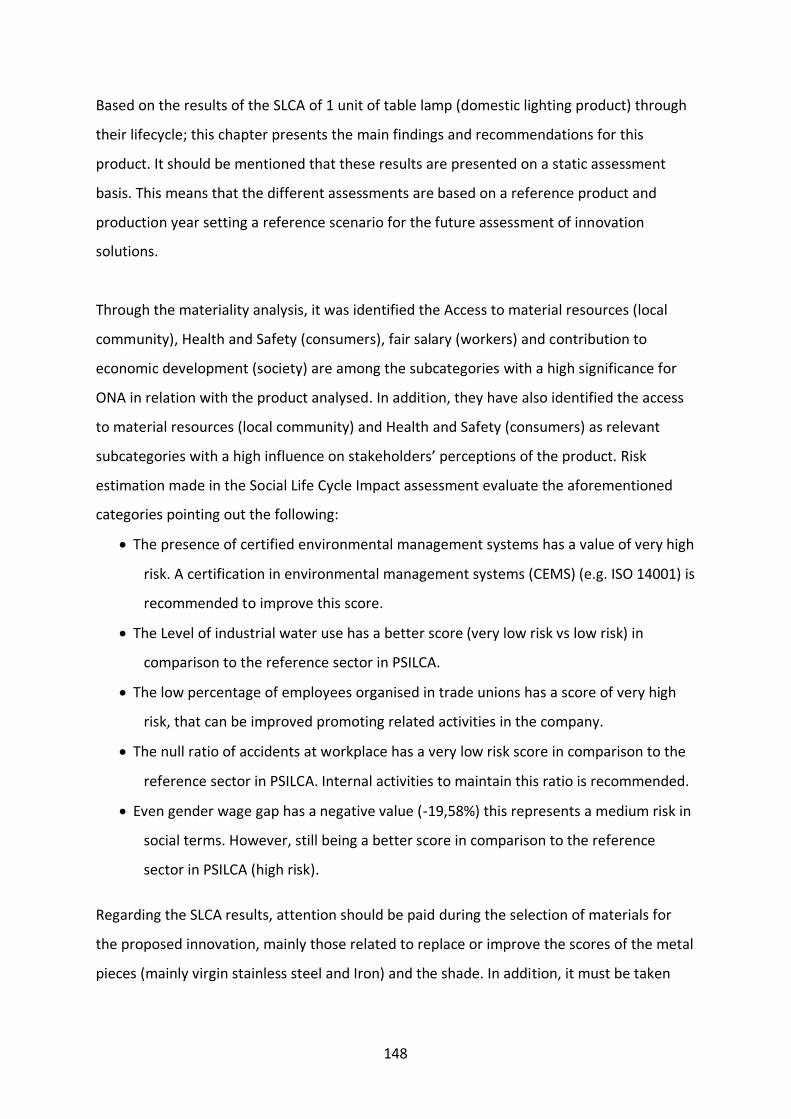
148
Based on the results of the SLCA of 1 unit of table lamp (domestic lighting product) through
their lifecycle; this chapter presents the main findings and recommendations for this
product. It should be mentioned that these results are presented on a static assessment
basis. This means that the different assessments are based on a reference product and
production year setting a reference scenario for the future assessment of innovation
solutions.
Through the materiality analysis, it was identified the Access to material resources (local
community), Health and Safety (consumers), fair salary (workers) and contribution to
economic development (society) are among the subcategories with a high significance for
ONA in relation with the product analysed. In addition, they have also identified the access
to material resources (local community) and Health and Safety (consumers) as relevant
subcategories with a high influence on stakeholders’ perceptions of the product. Risk
estimation made in the Social Life Cycle Impact assessment evaluate the aforementioned
categories pointing out the following:
• The presence of certified environmental management systems has a value of very high
risk. A certification in environmental management systems (CEMS) (e.g. ISO 14001) is
recommended to improve this score.
• The Level of industrial water use has a better score (very low risk vs low risk) in
comparison to the reference sector in PSILCA.
• The low percentage of employees organised in trade unions has a score of very high
risk, that can be improved promoting related activities in the company.
• The null ratio of accidents at workplace has a very low risk score in comparison to the
reference sector in PSILCA. Internal activities to maintain this ratio is recommended.
• Even gender wage gap has a negative value (-19,58%) this represents a medium risk in
social terms. However, still being a better score in comparison to the reference
sector in PSILCA (high risk).
Regarding the SLCA results, attention should be paid during the selection of materials for
the proposed innovation, mainly those related to replace or improve the scores of the metal
pieces (mainly virgin stainless steel and Iron) and the shade. In addition, it must be taken
149
into account that indirect costs (including commercial margin) have a representative impact
in each indicator studied.
This is a characteristic of this sector where products are designed in ONA and then send to
the providers for its manufacturing. Finally, due the use phase has also a representative
impact in the results, options with a lower power of lamp could improve the final scores.
150
Chapter 10: Conclusions
This thesis presents the doctoral research performed in sustainability (environmental and
social) studies. The activities also aimed to contribute to the goals of the EU FP7 cycLED
project and had three main objectives:
• Review the needs of stakeholders in addressing the complex eco-design methods
associated with LED lighting products through the lifecycle;
• Development of an integrated approach for sustainable lighting product
development process including product design specification, conceptual design,
detail design, prototyping and test and manufacture.
• Develop a conceptual integrated eco-decision approach framework for engineers
and sustainability assessment of LED lighting products based on stakeholders’ needs
and a case study to demonstrate such an approach;
• Apply the integrated approach and related methods into the development of a
sustainable LED lighting products.
All the above objectives have been achieved. The value of this research is most evident in
case study application, where trade-offs between innovation, eco-design and environmental
and social impacts could be better understood and prescription for improving the
sustainability of sustainable LED lighting products. The summary interpretation of the
environmental and social LCA studies is in agreement with the intuition of product experts,
and a systematic approach to case study application is demonstrated that would enable
stakeholders to achieve important insights during early sustainable product development.
10.1 Discussion
10.1.1 Limitations of the research
The research reported in this thesis has involved several research areas which are highly
complex and diverse in their scopes. Research into assessing a company’s or product’s
environmental and social performances has somewhat divided the business practices and
their responsibilities. This research has extended these to benefits and identified how this
151
can be incorporated at a sustainable product development and at the corporate level
through using the developed integrated eco-design approach and the Toolkit.
The limitations of this study have been explained throughout the thesis. However, there are
a few more limitations which need to be discussed and clarified due to the time and
resources available, which are described as below:
• Lack of access to updated data surrounding the lighting product transportation
process in the environmental LCA studies.
• Investigation into the social impacts associated with LED lighting lamp use stage was
not fully considered as the consumers feedback are difficult to obtain.
• Comprehensive and varied case studies assessing the ease of the developed toolkit
and eco-design method within a broader range of products was not carried out.
• The proposed Sustainable Production Support Toolbox including the LCA
technologies, standards of environmental management system, and the EU
regulations and directives, which are all updated in a regular time period,
particularly, the regulations and directives usually have a variety of amendments.
• Detailed consideration of future legislation and its potential impact on current
resource consumption and material supply was not considered sufficiently.
10.1.2 Research contributions
The author has identified the following as the important contributions made by this
research in the area of sustainability assessment and eco-design for sustainable product
development:
• Highlighting the significant advantages in environmental life cycle assessment, which
not only can be used to compare products’ environmental performance, but also for
products design process.
• Extending the scope of existing eco-design knowledge and tools on sustainable
product development by integrating the requirements of manufacturing and supply
chain, along with those from regulations, resulting from the extensive review in
available literatures and project resources for new products.
152
• Definition of a novel integrated approach for assessing the environmental
performance of a product through its life cycle.
• Demonstration of a comprehensive societal assessment framework and associated
assessment methods to provide a means of ensuring product development can be
directed towards the manufacture of products with the greatest societal benefits.
• Development of an eco-design design Toolkit to support the implementation and
integration of the environmental LCA framework within a sustainable product
development.
10.2 Conclusions
The literature review of current environmental and social LCA methods and case studies
clearly identifies a capability gap in their ability to form a comprehensive sustainability
assessment. This is due partly to the current lack of framework for practitioners to balance
the current business model of consumer demand and to the fundamental basis upon which
LCA methodology is built.
A number of tools have been developed and made available to industry to support their
activities to develop more sustainable products and conduct sustainable production. These
tools focus primarily on assessing the environmental and to a lesser degree of applying eco-
design methods. What they fail to address is the fundamental phase where the
environmental performance of a product life cycle can be addressed more efficiently. The
integrated eco-design toolkit developed in this research supports the implementation and
integration of the eco-design tools and methods within the sustainable product design
process, therefore it is beneficial for the company to consider products sustainability
performance in their overall business activities.
The integrated eco-design approach reported in this thesis provides a comprehensive
approach to provide state of art tools and methods for the development of sustainable
products and allowing the comparison of products with different materials or designs to be
made. The included methods and tools for supporting the implementation of the integrated
framework provides a systematic approach for each of product development phases. The
153
development of this method is also validated by the development of a commercialized
domestic lighting product which provide a more detailed and focused range of sustainable
benefit categories for consumers.
A novel up-to-date eco-design method to eco-design lighting products has been developed
and used base on the integration of specific eco-design tools such as eco-design guidelines,
regulations/directives, LCA software-based tools, testing tools and light analysis tools at a
specific time during the design and development process. The designed lighting products
present particular ‘environmental impact patterns’ in specific life cycle stages and
components, and also require specific types of methods, tools and eco-design strategies to
assess their environmental impact, and reduce/eliminate these impacts.
The case studies by applying environmental LCA reported in this thesis clearly demonstrate
that the implementation of the framework, method and toolkit by a domestic LED table
lamp, supports the decision making for engineers to move towards a more environmental
friendly of lighting product development which combine resource efficiency that could be
used to demonstrate the company’s sustainability responsibilities on business activities.
Although the results of this research have advanced the understanding and application of
environmental and social LCA assessment benefits within sustainable product development,
clearly a number of additional areas which require further investigation as highlighted in the
Future Work section of this chapter.
SLCA was adopted in this thesis to elaborate the scope of LCA to social impacts, whilst still
an emerging area of research, it remains focused mainly on the damage impacts of the
product associated with its manufacture and disposal phases, and uses the functional unit
as the basis of comparative studies in the lighting product sector. Through the materiality
analysis, it was identified the Access to material resources (local community), Health and
Safety (consumers), fair salary (workers) and contribution to economic development
(society) are among the subcategories with a high significance for ONA in relation with the
product analysed. In addition, they have also identified the access to material resources
(local community) and Health and Safety (consumers) as relevant subcategories with a high
influence on stakeholders’ perceptions of the product.
154
10.3 Further work
Development of the decision-making model within the integrated eco-design approach
The integrated eco-design approach that has been developed and followed should be
described and formalized in a step-by-step decision-making model in further research. This
model should demonstrate how to guide users to understand the life cycle of the lighting
product and make feasible decisions. The descriptive model should then be transformed
into a prescriptive process framework indicating the product designer how to proceed at
each step of the process.
Considering the impacts from the use phase
A drawback of the methodology is the limited assessment of the use phase in the
environmental and social LCA studies. To encourage the company to apply the analytical
results into the business practices, it would be beneficial for complemented with an
extensive analysis of the use phase in the LCA studies. That would enable the promotion of
the potentially positive social aspects of a product in this life cycle phase.
Development of weighting factors for SLCA
In an SLCA, there is a wide range of social impacts to consider, measured by quantitative,
qualitative or semi-quantitative indicators, mixing positive and negative impacts. In
addition, there is a demand to weight the impacts in different ways, which has been
identified in the literature review phase. A possible approach for handling this might be to
use multi-criteria decision analysis, which provides techniques for weighing a range of
different criteria in a structured and transparent way. Using this approach would enable
decision makers to express and be transparent about their values in prioritising among the
subcategories.
Development of decision-making approach for applying the environmental and social LCA
results into the practices of sustainable product development
Linking to environmental and social LCA results into the sustainable development is a trend.
The development of social LCA needs to be linked to the simultaneously on-going
development of environmental LCA, the objective of which is to integrate these two
155
approaches somehow into a wider sustainability assessment. In order to make the approach
available for common use, the development of a computer aided tool capable of supporting
this possible approach at a process and data input/calculation level.
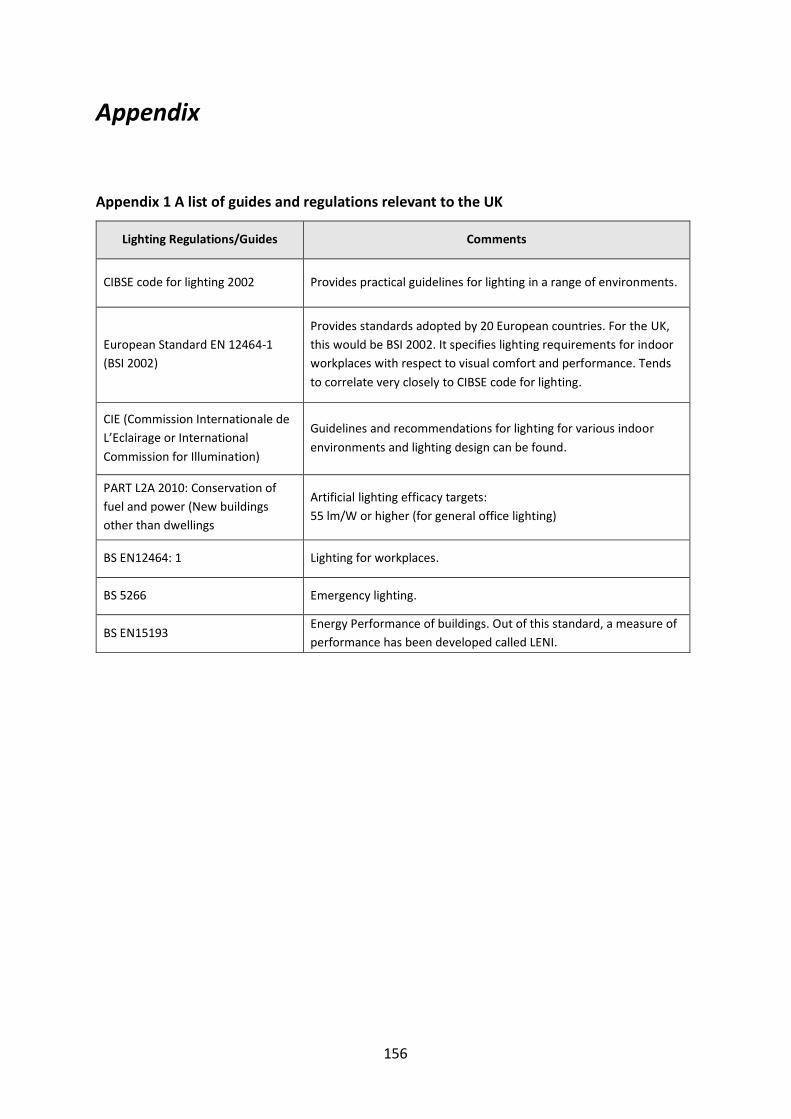
156
Appendix
Appendix 1 A list of guides and regulations relevant to the UK
Lighting Regulations/Guides Comments
CIBSE code for lighting 2002 Provides practical guidelines for lighting in a range of environments.
European Standard EN 12464-1
(BSI 2002)
Provides standards adopted by 20 European countries. For the UK,
this would be BSI 2002. It specifies lighting requirements for indoor
workplaces with respect to visual comfort and performance. Tends
to correlate very closely to CIBSE code for lighting.
CIE (Commission Internationale de
L’Eclairage or International
Commission for Illumination)
Guidelines and recommendations for lighting for various indoor
environments and lighting design can be found.
PART L2A 2010: Conservation of
fuel and power (New buildings
other than dwellings
Artificial lighting efficacy targets:
55 lm/W or higher (for general office lighting)
BS EN12464: 1 Lighting for workplaces.
BS 5266 Emergency lighting.
BS EN15193 Energy Performance of buildings. Out of this standard, a measure of
performance has been developed called LENI.
157
Appendix 2 A list of environmental LCA Databases
Hazardous Substances Data Bank (HSDB) (U.S. National Library of Medicine, 2015):
It is a database that provides toxicology data about 5,000 substances.
European Aluminium Association database (European Aluminium, 2015):
It provides European datasets for the production of primary and recycled aluminium, as well
as for transformation of aluminium into semi-finished products.
European Federation of Corrugated Board Manufacturers (FEFCO) (FEFCO, 2015):
It provides a European database of life cycle studies of corrugated board and paper. This
database is updated every three years.
International Iron and Steel Institute (IISI) (IISI, 2015):
It provides worldwide data about life cycle inventory for steel products.
The EcoInvent database (Ecoinvent, 2015):
It is the world’s leading supplier of consistent and transparent data. It provides Life Cycle
Inventory (LCI) data on energy supply, resource extraction, material supply, chemicals,
metals, agriculture, waste management services, and transport services.
CPM LCA Database (Swedish lifecycle centre, 2015):
It is an on-line database that provides access to over 500 datasets. All LCI datasets can be
viewed in three formats: SPINE, a format compatible with the ISO/TS 14048 LCA data
documentation format criteria, and ILCD. A Life Cycle Impact Assessment (LCIA) method
calculator provided can calculate the impact of the datasets using three different LCIA
methods: EPS, EDIP and ECO-Indicator.
EIME (Bureau Veritas CODDE, 2015):
This database provides cradle to gate life cycle Inventory (LCI) data from materials,
processes, and electrical/electronic components. The databases comprise Ecoinvent 346
database (8800 modules) and generic and sectorial databases. The generic databases
consist of the European Life Cycle Database (ELCD) database with over 300 modules and the
materials and processes database developed by CODDE with over 700 modules. It also
comprises sectorial databases such as: E&E (over 400 modules), Textiles database (over 400
modules) and transport database (150 modules).
Eurofer data sets (Eurofer, 2015):
158
It provides European Average LCI data for stainless steel flat coil and quarto plate products.
The datasets are based on average site-specific data (gate to gate) of European and global
steel producers.
IVAM LCA Database (IVAM UvA BV, 2015):
It is a database comprising about 1350 (cradle to grave) processes related with the following
areas: Energy carriers and technologies, materials production, transport services and end-
of-life treatment. It is a compilation of several databases such as: APME, Buwal, ETH 96, and
additional LCA data originating from own Life Cycle Assessment (LCA) studies.
Plastics Europe Eco-profiles database (PlasticsEurope, 2015):
It provides average (cradle to gate) LCI datasets of the main polymers and their
intermediates produced in Europe.
US Life Cycle Inventory (USLCI) Database (NREL, 2015):
This database provides cradle-to-gate, gate-to-gate, and cradle-to-grave LCI datasets
associated with producing materials, components, or assemblies in the U.S.
159
Reference
Acquaye, A. A. et al. (2011) ‘Identification of “carbon hot-spots” and quantification of
GHG intensities in the biodiesel supply chain using hybrid LCA and structural path analysis’,
Environmental science & technology. ACS Publications, 45(6), pp. 2471–2478.
Ahlroth, S. et al. (2011) ‘Weighting and valuation in selected environmental systems
analysis tools--suggestions for further developments’, Journal of Cleaner Production.
Elsevier, 19(2–3), pp. 145–156.
Andrews, E. S. (2009) Guidelines for social life cycle assessment of products: social and
socio-economic LCA guidelines complementing environmental LCA and Life Cycle Costing,
contributing to the full assessment of goods and services within the context of sustainable
development. UNEP/Earthprint.
Aparcana, S. and Salhofer, S. (2013) ‘Application of a methodology for the social life cycle
assessment of recycling systems in low income countries: three Peruvian case studies’, The
International Journal of Life Cycle Assessment. Springer, 18(5), pp. 1116–1128.
Bakri, S. N. S., Ramasamy, R. K. and Surif, S. (2010) ‘Life cycle assessment of magnetic and
electronic ballast for 36-W fluorescent lamp’, The International Journal of Life Cycle
Assessment. Springer, 15(8), pp. 837–841.
Bellantuono, N., Pontrandolfo, P. and Scozzi, B. (2016) ‘Capturing the stakeholders’ view
in sustainability reporting: a novel approach’, Sustainability. Multidisciplinary Digital
Publishing Institute, 8(4), p. 379.
Benoit-Norris, C., Cavan, D. A. and Norris, G. (2012) ‘Identifying social impacts in product
supply chains: overview and application of the social hotspot database’, Sustainability.
Molecular Diversity Preservation International, 4(9), pp. 1946–1965.
Benoît, C. et al. (2009) Guidelines for Social Life Cycle Assessment of Products. Belgium:
Belgium: UNEP/SETAC Life CycleInitiative (Druk in de weer). Available at:
http://www.unep.fr/shared/publications/pdf/DTIx1164xPA-guidelines_sLCA.pdf.
Benoît, C. et al. (2010) ‘The guidelines for social life cycle assessment of products: just in
160
time!’, The international journal of life cycle assessment. Springer, 15(2), pp. 156–163.
Casamayor, J. L. and Su, D. (2013) ‘Integration of eco-design tools into the development
of eco-lighting products’, Journal of cleaner production. Elsevier, 47, pp. 32–42.
Casamayor, J. L., Su, D. and Ren, Z. (2018) ‘Comparative life cycle assessment of LED
lighting products’, Lighting Research and Technology, 50(6), pp. 801–826. doi:
10.1177/1477153517708597.
Cavus, N. and Kanbul, S. (2010) ‘Designation of Web 2.0 tools expected by the students
on technology-based learning environment’, Procedia-Social and Behavioral Sciences.
Elsevier, 2(2), pp. 5824–5829.
Chen, S., Zhang, J. and Kim, J. (2017) ‘Life cycle analysis of greenhouse gas emissions for
fluorescent lamps in mainland China’, Science of the Total Environment. Elsevier, 575, pp.
467–473.
Chhipi-Shrestha, G. K., Hewage, K. and Sadiq, R. (2015) ‘‘Socializing’sustainability: a
critical review on current development status of social life cycle impact assessment
method’, Clean Technologies and Environmental Policy. Springer, 17(3), pp. 579–596.
Ciroth, A. and Eisfeldt, F. (2017) ‘PSILCA -A Product Social Impact Life Cycle Assessment
database - Database version 2.1’, GreenDelta GmbH, 1. Available at:
http://www.openlca.org/wp-
content/uploads/2017/12/PSILCA_documentation_update_PSILCA_v2_final.pdf.
Ciroth, A. and Franze, J. (2011) LCA of an Ecolabeled Notebook: Consideration of Social
and Environmental Impacts Along the Entire Life Cycle. Lulu. com. Available at:
http://www.greendelta.com/uploads/media/LCA_Notebook.pdf.
Craford, M. G. (2008) ‘High Power LEDs for Solid State Lighting’, Journal of Light & Visual
Environment. The Illuminating Engineering Institute of Japan, 32(2), pp. 58–62.
cycLED (no date) cycLED. Available at: http://www.cyc-led.eu/ (Accessed: 26 December
2020).
Dreyer, L. (2006) ‘A framework for social life cycle impact assessment’, The international
journal of life cycle assessment, 11(2), pp. 88–97. Available at:
http://www.springerlink.com/index/10.1065/lca2005.08.223.
161
Dubberley, M., Agogino, A. M. and Horvath, A. (2004) ‘Life-cycle assessment of an
intelligent lighting system using a distributed wireless mote network’, in IEEE International
Symposium on Electronics and the Environment, 2004. Conference Record. 2004. IEEE, pp.
122–127.
Dyble, M. et al. (2005) ‘Impact of dimming white LEDs: chromaticity shifts due to
different dimming methods’, in Fifth international conference on solid state lighting, p.
59411H.
Ekener-Petersen, E. and Finnveden, G. (2013) ‘Potential hotspots identified by social
LCA—part 1: a case study of a laptop computer’, The International Journal of Life Cycle
Assessment. Springer, 18(1), pp. 127–143.
Ekener, E. et al. (2018) ‘Developing Life Cycle Sustainability Assessment methodology by
applying values-based sustainability weighting-Tested on biomass based and fossil
transportation fuels’, Journal of Cleaner Production. Elsevier, 181, pp. 337–351.
Ekener, E., Hansson, J. and Gustavsson, M. (2018) ‘Addressing positive impacts in social
LCA—discussing current and new approaches exemplified by the case of vehicle fuels’, The
International Journal of Life Cycle Assessment. Springer, 23(3), pp. 556–568.
El-Zein, N. (2013) ‘The LED Lighting Revolution’, Sustainability, Energy and Architecture:
Case Studies in Realizing Green Buildings. Academic Press, p. 171.
European Comission (2008a) ‘Proposal for a Directive of the European Parliament and of
the Council on the Restriction of the Use of Certain Hazardous Substances in Electrical and
Electronic Equipment - Impact Assessment’, p. 78. Available at: http://eur-
lex.europa.eu/LexUriServ/LexUriServ.do?uri=SEC:2008:2930:FIN:EN:PDF (Accessed: 1 April
2018).
European Comission (2008b) ‘Proposal for a Directive of the European Parliament and of
the Council on the Restriction of the Use of Certain Hazardous Substances in Electrical and
Electronic Equipment - Impact Assessment’, p. 78. Available at: http://eur-
lex.europa.eu/LexUriServ/LexUriServ.do?uri=SEC:2008:2930:FIN:EN:PDF.
European Commission (1994) ‘Packaging and Packaging Waste Directive’, Official Journal
of the European Commission. Available at: http://eur-lex.europa.eu/legal-
162
content/EN/TXT/?uri=CELEX:31994L0062 (Accessed: 31 March 2018).
European Commission (2005) ‘Eco-design directive (2005/125/EC)’. Available at:
http://eur-lex.europa.eu/legal-content/EN/TXT/?uri=CELEX:32009L0125 (Accessed: 31
March 2018).
European Commission (2010) ‘Energy labelling directive (2010/30/EU)’. Available at:
http://eur-lex.europa.eu/legal-content/EN/TXT/?uri=CELEX:32010L0030 (Accessed: 1 April
2018).
European Council (2009) ‘Directive 2009/125/EC of the European Parliament and of the
Council of 21 October 2009 establishing a framework for the setting of ecodesign
requirements for energy-related products (recast)’, Official Journal of the European Union,
pp. 10–35. doi: 10.1016/j.cirp.2012.03.121.
Feschet, P. et al. (2013) ‘Social impact assessment in LCA using the Preston pathway’,
International Journal of Life Cycle Assessment, 18(2), pp. 490–503. doi: 10.1007/s11367-012-
0490-z.
Finnveden, G. and Moberg, Å. (2005) ‘Environmental systems analysis tools--an
overview’, Journal of cleaner production. Elsevier, 13(12), pp. 1165–1173.
Florman, M., Klingler-Vidra, R. and Facada, M. J. (2016) ‘A critical evaluation of social
impact assessment methodologies and a call to measure economic and social impact
holistically through the External Rate of Return platform’. LSE Enterprise.
Fontes, J. et al. (2014) ‘Handbook for product social impact assessment’, Roundtable for
Product Social Metrics.
Foolmaun, R. K. and Ramjeeawon, T. (2013) ‘Comparative life cycle assessment and social
life cycle assessment of used polyethylene terephthalate ( PET ) bottles in Mauritius’,
International Journal of Life Cycle Assessment, 18(1), pp. 155–171. doi: 10.1007/s11367-012-
0447-2.
Fortmann-Roe, S. (2014) ‘Insight Maker: A general-purpose tool for web-based modeling
& simulation’, Simulation Modelling Practice and Theory. Elsevier, 47, pp. 28–45.
Franceschini, S. and Pansera, M. (2015) ‘Beyond unsustainable eco-innovation: The role
of narratives in the evolution of the lighting sector’, Technological Forecasting and Social
163
Change. Elsevier, 92, pp. 69–83.
Gimeno-Frontera, B. et al. (2018) ‘Sustainability of non-residential buildings and
relevance of main environmental impact contributors’ variability. A case study of food retail
stores buildings’, Renewable and Sustainable Energy Reviews. Elsevier, 94, pp. 669–681.
Goedkoop, M. et al. (2009) ‘ReCiPe 2008’, Potentials, pp. 1–44. doi:
10.029/2003JD004283.
Grießhammer, R. et al. (2006) ‘Feasibility study: integration of social aspects into LCA’.
UNEP/SETAC Life cycle initiative.
Gu, Y. et al. (2006) ‘Spectral and luminous efficacy change of high-power LEDs under
different dimming methods’, in Sixth International Conference on Solid State Lighting, p.
63370J.
Hadi, S. A. et al. (2013) ‘Comparative life cycle assessment (LCA) of streetlight
technologies for minor roads in United Arab Emirates’, Energy for Sustainable Development.
Elsevier, 17(5), pp. 438–450.
Heinrichs, J. H. and Lim, J.-S. (2003) ‘Integrating web-based data mining tools with
business models for knowledge management’, Decision Support Systems. Elsevier, 35(1), pp.
103–112.
Hendrickson, C. T. et al. (2010) ‘Reducing environmental burdens of solid-state lighting
through end-of-life design’, Environmental Research Letters. IOP Publishing, 5(1), p. 14016.
Homol, L. (2014) ‘Web-based citation management tools: Comparing the accuracy of
their electronic journal citations’, The Journal of Academic Librarianship. Elsevier, 40(6), pp.
552–557.
Hsu, C.-W., Wang, S.-W. and Hu, A. H. (2013) ‘Development of a new methodology for
impact assessment of SLCA’, in Re-engineering Manufacturing for Sustainability. Springer,
pp. 469–473.
Humphreys, C. J. (2008) ‘Solid-state lighting’, MRS bulletin. Cambridge University Press,
33(4), pp. 459–470.
Hunkeler, D. (2006) ‘Societal LCA Methodology and Case Study’, The International Journal
of Life Cycle Assessment. Ecomed, 11(6), pp. 371–382. doi: 10.1065/lca2006.08.261.
164
Hutchins, M. J. and Sutherland, J. W. (2008) ‘An exploration of measures of social
sustainability and their application to supply chain decisions’, Journal of cleaner production.
Elsevier, 16(15), pp. 1688–1698.
Initiative, G. R. (2013) ‘G4 sustainability reporting guidelines: Reporting principles and
standard disclosures’, Global Reporting Initiative, Amsterdam, pp. 7–14.
ISO (2006a) 14040: Environmental Management - Life Cycle Assessment - Principles and
Framework. Geneva, Switzerland: International Standard Organization.
ISO (2006b) ‘Life Cycle Assessment: Principles and Framework’, Environmental
Management. Available at: https://www.iso.org/standard/37456.html?browse=tc
(Accessed: 1 April 2018).
ISO (2010) ISO 26000:2010 - Guidance on social responsibility. Available at:
https://www.iso.org/standard/42546.html (Accessed: 29 December 2018).
Isotani, Seiji et al. (2013) ‘A Semantic Web-based authoring tool to facilitate the planning
of collaborative learning scenarios compliant with learning theories’, Computers &
Education. Elsevier, 63, pp. 267–284.
Jørgensen, A. et al. (2008) ‘Methodologies for Social Life Cycle Assessment’, International
Journal of Life Cycle Assessment, pp. 96–103. doi: http://dx.doi.org/10.1065/lca2007.11.367
Please.
Kam, H.-J. and Katerattanakul, P. (2014) ‘Structural model of team-based learning using
Web 2.0 collaborative software’, Computers & Education. Elsevier, 76, pp. 1–12.
Kay, R. (2011) ‘Evaluating learning, design, and engagement in web-based learning tools
(WBLTs): The WBLT Evaluation Scale’, Computers in Human Behavior. Elsevier, 27(5), pp.
1849–1856.
Klöpffer, W. (2003) ‘Life-cycle based methods for sustainable product development’.
Springer.
Kurilovas, E. and Juskeviciene, A. (2015) ‘Creation of Web 2.0 tools ontology to improve
learning’, Computers in Human Behavior. Elsevier, 51, pp. 1380–1386.
Kylili, A. and Fokaides, P. A. (2015) ‘European smart cities: The role of zero energy
buildings’, Sustainable Cities and Society. Elsevier, 15, pp. 86–95.
165
Lewis, H. et al. (2001) ‘Design and environment’, A global guide to designing greener
goods. Greenleaf, Sheffield. ISBN, 13, pp. 978–1874719434.
Lim, S.-R. et al. (2010) ‘Potential environmental impacts of light-emitting diodes (LEDs):
metallic resources, toxicity, and hazardous waste classification’, Environmental science &
technology. ACS Publications, 45(1), pp. 320–327.
Mancini, L., Eynard, U. and Eisfeldt, F. (2018) ‘Social assessment of raw materials supply
chains’.
McAloone, T. C. and Bey, N. (2009) Environmental improvement through product
development: A guide. Danish Environmental Protection Agency.
Norris, C. B. et al. (2011) ‘A social hotspot database for acquiring greater visibility in
product supply chains: overview and application to orange juice’, in Towards Life Cycle
Sustainability Management. Springer, pp. 53–62.
Norris, G. A. (2006) ‘Social impacts in product life cycles-towards life cycle attribute
assessment’, The International Journal of Life Cycle Assessment. Springer, 11(1), pp. 97–104.
O’Brien, M., Doig, A. and Clift, R. (1996) ‘Social and environmental life cycle assessment
(SELCA)’, The International Journal of Life Cycle Assessment. Springer, 1(4), pp. 231–237.
Parent, J., Cucuzzella, C. and Revéret, J.-P. (2010) ‘Impact assessment in SLCA: sorting the
sLCIA methods according to their outcomes’, The international journal of life cycle
assessment. Springer, 15(2), pp. 164–171.
Petti, L., Ugaya, C. M. L. and Di Cesare, S. (2014) ‘Systematic review of social-life cycle
assessment (S-LCA) case studies’, Social LCA in progress. FruiTrop, Montpellier.
Pigosso, D. C. A., McAloone, T. C. and Rozenfeld, H. (2015) ‘Characterization of the state-
of-the-art and identification of main trends for Ecodesign Tools and Methods: Classifying
three decades of research and implementation’, Indian Institute of Science. Journal. Indian
Institute of Science, 94(4), pp. 405–427.
Powers, C. M. et al. (2014) ‘A web-based tool to engage stakeholders in informing
research planning for future decisions on emerging materials’, Science of the Total
Environment. Elsevier, 470, pp. 660–668.
PRé (no date) ‘SimaPro ’.
166
Principi, P. and Fioretti, R. (2014) ‘A comparative life cycle assessment of luminaires for
general lighting for the office--compact fluorescent (CFL) vs Light Emitting Diode (LED)-a
case study’, Journal of Cleaner Production. Elsevier, 83, pp. 96–107.
Quirk, I. (2009) ‘Life-cycle assessment and policy implications of energy efficient lighting
technologies’, University of California.
RADIANT (no date) Radiant Vision Systems | World leaders in consumer electronics,
display technologies, and lighting. Available at: https://www.radiantvisionsystems.com/
(Accessed: 27 December 2018).
Rafiaani, P. et al. (2018) ‘Social sustainability assessments in the biobased economy:
Towards a systemic approach’, Renewable and Sustainable Energy Reviews. Elsevier, 82, pp.
1839–1853.
Ramirez, P. K. S. et al. (2016) ‘Subcategory assessment method for social life cycle
assessment. Part 2: application in Natura’s cocoa soap’, The International Journal of Life
Cycle Assessment. Springer, 21(1), pp. 106–117.
Rea, M. (2004) ‘Lighting for caregivers in the neonatal intensive care unit’, Clinics in
perinatology. Elsevier, 31(2), pp. 229–242.
RIVM (2018) National Institute for Public Health and the Environment.
Sala, S. et al. (2015) ‘Social Life Cycle Assessment: State of the art and challenges for
supporting product policies’, JRC Technical Reports. Publications Office of the European
Union.
Sánchez-Franco, M. J. et al. (2013) ‘Users’ perception of visual design and the usefulness
of a web-based educational tool’, Procedia-Social and Behavioral Sciences. Elsevier, 93, pp.
1916–1921.
Schwartz, G. et al. (2009) ‘Triplet harvesting in hybrid white organic Light-Emitting
diodes’, Advanced Functional Materials. Wiley Online Library, 19(9), pp. 1319–1333.
Semiconductors, O. O. (2009) ‘Life cycle assessment of illuminants—A comparison of light
bulbs, compact fluorescent lamps and LED lamps’, OsramOpto Semiconductors GmbH.
Shamseldin, A. K. M. (2016) ‘Assessment of Minimizing the Environmental Functions
Conflict in Buildings’, Journal of Building Construction and Planning Research. Scientific
167
Research Publishing, 4(02), p. 119.
Shin, K. L. F., Colwill, J. A. and Young, R. I. M. (2015) ‘Expanding the scope of LCA to
include “societal value”: a framework and methodology for assessing positive product
impacts’, Procedia CIRP. Elsevier, 29, pp. 366–371.
Siebert, A. et al. (2018) ‘Social life cycle assessment indices and indicators to monitor the
social implications of wood-based products’, Journal of cleaner production. Elsevier, 172, pp.
4074–4084.
Slater, P. J. P. (1999) ‘Pconfig: a Web-based configuration tool for Configure-To-Order
products’, Knowledge-Based Systems. Elsevier, 12(5–6), pp. 223–230.
Solidworks (no date) ‘Solidworks : 3D CAD design software’. Available at:
https://www.solidworks.com/.
Sustainable Minds (no date) ‘Sustainable Minds’. Available at:
http://www.sustainableminds.com/.
Tähkämö, L. and Halonen, L. (2015) ‘Life cycle assessment of road lighting luminaires--
Comparison of light-emitting diode and high-pressure sodium technologies’, Journal of
Cleaner Production. Elsevier, 93, pp. 234–242.
Techato, K., Watts, D. J. and Chaiprapat, S. (2009) ‘Life cycle analysis of retrofitting with
high energy efficiency air-conditioner and fluorescent lamp in existing buildings’, Energy
Policy. Elsevier, 37(1), pp. 318–325.
Thinkstep (no date) ‘GaBi Life Cycle Engineering Suite’. Available at: http://www.gabi-
software.com/uploads/media/GaBi_Life_Cycle_Engineering_Suite.pdf.
Tukker, A. et al. (2000) ‘Eco-design: European state of the art’, Institute for Prospective
Technological Studies (Joint Research Centre, European Commission), Brussels-Luxembourg.
UL (no date) UL - 8750 Standard for Light Emitting Diode (LED) Equipment for Use in
Lighting Products | Standards Catalog. Available at:
https://standardscatalog.ul.com/standards/en/standard_8750_2 (Accessed: 27 December
2018).
UNEP/SETAC/LCI (2009) Guidelines for Social Life Cycle Assessment of Products,
Sustainable Development. UNEP/Earthprint.
168
US DOE (2009) Building Technologies Program SSL Fact Sheet: Lifetime of White LEDs.
Available at: https://www.energy.gov/eere/ssl/solid-state-lighting (Accessed: 29 December
2018).
US DOE (2014) Solid-State Lighting Research and Development: Multi-Year Program Plan
April 2014 (Updated May 2014). Available at:
http://www1.eere.energy.gov/buildings/ssl/about.html (Accessed: 30 December 2018).
Vahl, F. P., Campos, L. M. S. and Casarotto Filho, N. (2013) ‘Sustainability constraints in
techno-economic analysis of general lighting retrofits’, Energy and Buildings. Elsevier, 67,
pp. 500–507.
Valkama, J. and Keskinen, M. (2008) ‘Comparison of simplified LCA variations for three
LCA cases of electronic products from the ecodesign point of view’, in 2008 IEEE
International Symposium on Electronics and the Environment. IEEE, pp. 1–6.
VROM (2000) ‘Eco-Indicator Manual for designers’, Ministry of Housing, Spatial Planning
and the Environment, (October). Available at: http://www.pre-
sustainability.com/download/manuals/EI99_Manual.pdf.
Waide, P., Tanishima, S. and Harrington, P. (2006) ‘Light’s labour’s lost: Policies for
energy-efficient lighting’, OECD, 12, pp. 255–292.
Weidema, B. P. (2006) ‘The integration of economic and social aspects in life cycle impact
assessment’, The International Journal of Life Cycle Assessment. Springer, 11(1), pp. 89–96.
Welz, T., Hischier, R. and Hilty, L. M. (2011) ‘Environmental impacts of lighting
technologies—Life cycle assessment and sensitivity analysis’, Environmental Impact
Assessment Review. Elsevier, 31(3), pp. 334–343.
Wimmer, W., Züst, R. and Ch, S. (2002) ‘The Application of the ECODESIGN PILOT and
Methodical Support for the Implementation of ECODESIGN in Products’, in DS 30:
Proceedings of DESIGN 2002, the 7th International Design Conference, Dubrovnik.
Yu, Z. Y., Soo, V. K. and Doolan, M. (2016) ‘The Effect of Consumer Behaviour on the Life
Cycle Assessment of Energy Efficient Lighting Technologies’, Procedia CIRP. Elsevier, 40, pp.
185–190.

169