Copper toxicity in the microalga Chlamydomonas reinhardtii: an integrated approach

J. of University of Anbar for Pure Science: Vol. :No. : ISSN:1991-8941
An Integrated Hydrogeological Approach for Aquifers Systems and Groundwater Flow within Nukhaib-Km.160 Region (West Iraq).
Bayan M Hussien* Abed Salih Fayyadh* Nafi Abdulilah Nassar** *Center of desert studies
** Anbar University, College of Science Received: / /2013 Accepted: 12/8/2013
Abstract The study examines the hydrogeological conditions and the hydraulic characteristics of the water bearing horizons within the hydrogeologic regime of Nukhaib-Km.160. Also the study sheds light on the flow behavior regime and its impacts on the groundwater balance and groundwater velocities (permeability and hydraulic gradients) considering the regional structural phenomena. Many hydrogeologic districts are selected for future development and exploitation depending on hydrogeological data. A presentation of three dimensional models and spatial distribution maps are used for phenomena interpretation, supported by hydrogeologic control points such as storage and transmissivity coefficients, groundwater depths, aquifers thickness, lateral extensions, well productivity and specific capacity. Kimball statistical method and prediction applications on transmissivity of aquifers and specific capacities of wells penetrated aquifers are used in determining groundwater mixing and feeding percent from Erdhuma and/or Tayarat aquifers to production wells. The hydrogeologic regime of Nukhaib-Km160 area is classified and screened into eight aquifers including, Mullusi, Mullusi-Ubaid, Hartha, Muhaywir-Ubaid, Muhaywir-Najma, Tayarat, Erdhuma and Tayarat-Erdhuma aquifers. The changes in the hydraulic parameters of all aquifers are examined to determine the spatial hydrogeological facts of aquifers, where traditional distribution of total dissolved solids and hydraulic interpretation show same phenomenon of groundwater source and interconnection. According to the hydrogeologic facts, Tayarat and Erdhuma aquifers are preferred for future importance plan for the water supply in the western desert of Iraq, particularly of increasing demand in water resources and sustainable assessment. Key words: hydraulic parameters, aquifer, groundwater flow, groundwater velocity.
Introduction
The determination of groundwater resources and the identification of aquifer systems are of main requirements in the various hydrogeological studies. A significant contribution of stratigraphic, structural, hydrodynamics and geologic boundar- ies are used for defining aquifer characteristics [1, 2 and 3]. These subsurface integrated hydrogeol- ogical technique explains the hydrogeologic model of the aquifers and the groundwater occurrence. Hydrodynamic characterization is used in determining the behaviour of groundwater flow and groundwater balance [4,5,6,7,8 and 9]. The hydrogeologic parameters ( permeability, transmissivity, storage coefficients and pressure heads of waters), geometry of aquifers system in horizontal extensions (represented by spatial distribution analysis) and vertical extensions (represented by hydrogeologic models), lead to study and use the stratigraphic, structural and hydrogeologic boundaries in the interpretation of
hydrogeologic phenomena throughout estimation of groundwater recharge and flow, groundwater velocity, productivity of wells, specific capacity of water wells and feeding ratios from mixed water bearing horizons [10,11,12,13,14 and 15]. The aim of the study is to evaluate the aquifers systems throughout the determination of hydrogeologic facts as bilateral hydrogeological maps and three dimensional hydro-stratigraphic models as well to determine the relationship of hydraulic parameters with the direction of groundwater flow and groundwater recharge. Physiographically, the study area is located at the western desert of Iraq, crossed by the express way which joins Ramadi and Rutba cities and Nukhaib-km160 road in a direction of (North-South). It is bordered by longitudes of 41°02′00″ to 42°30′15″ and latitudes of 31°14′00″ to 33°32′00″ with total area of (45,000) km2 at an altitude of (150-590) m asl (Fig. 1).
J. of University of Anbar for Pure Science: Vol. :No. : ISSN:1991-8941
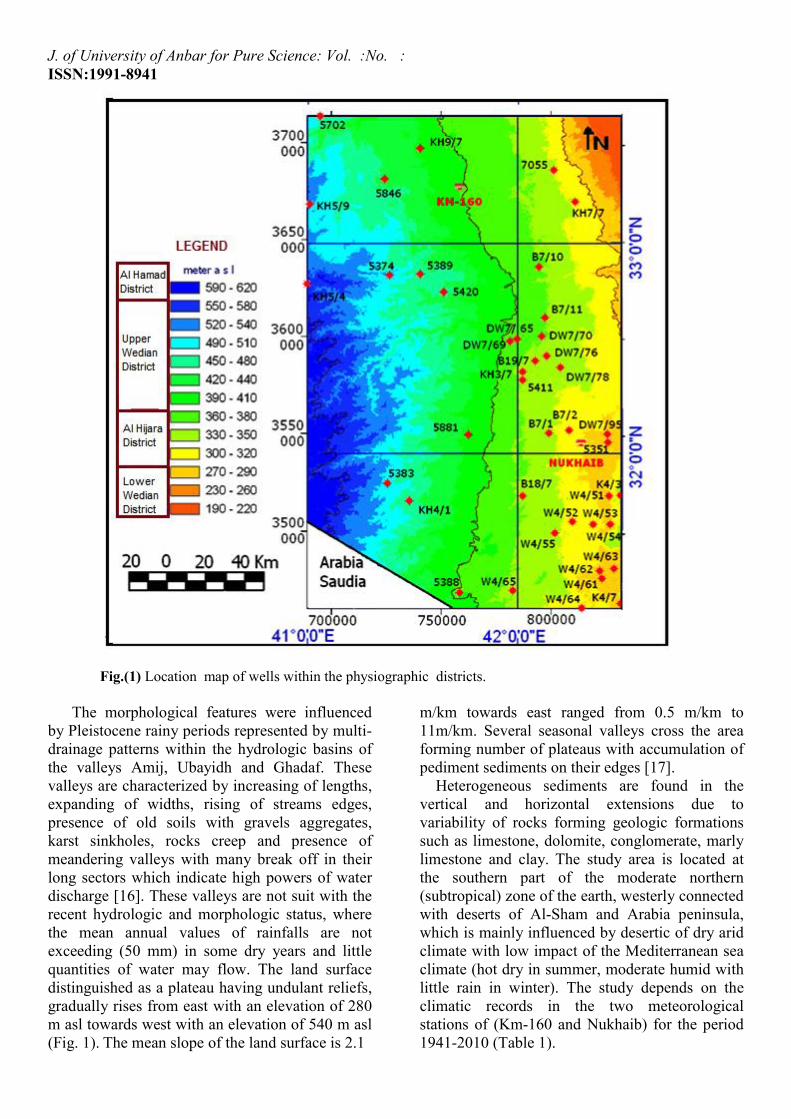
Fig.(1) Location map of wells within the physiographic districts. The morphological features were influenced by Pleistocene rainy periods represented by multi-drainage patterns within the hydrologic basins of the valleys Amij, Ubayidh and Ghadaf. These valleys are characterized by increasing of lengths, expanding of widths, rising of streams edges, presence of old soils with gravels aggregates, karst sinkholes, rocks creep and presence of meandering valleys with many break off in their long sectors which indicate high powers of water discharge [16]. These valleys are not suit with the recent hydrologic and morphologic status, where the mean annual values of rainfalls are not exceeding (50 mm) in some dry years and little quantities of water may flow. The land surface distinguished as a plateau having undulant reliefs, gradually rises from east with an elevation of 280 m asl towards west with an elevation of 540 m asl (Fig. 1). The mean slope of the land surface is 2.1
m/km towards east ranged from 0.5 m/km to 11m/km. Several seasonal valleys cross the area forming number of plateaus with accumulation of pediment sediments on their edges [17]. Heterogeneous sediments are found in the vertical and horizontal extensions due to variability of rocks forming geologic formations such as limestone, dolomite, conglomerate, marly limestone and clay. The study area is located at the southern part of the moderate northern (subtropical) zone of the earth, westerly connected with deserts of Al-Sham and Arabia peninsula, which is mainly influenced by desertic of dry arid climate with low impact of the Mediterranean sea climate (hot dry in summer, moderate humid with little rain in winter). The study depends on the climatic records in the two meteorological stations of (Km-160 and Nukhaib) for the period 1941-2010 (Table 1).

J. of University of Anbar for Pure Science: Vol. :No. : ISSN:1991-8941
Table (1) Temperature, relative humidity, rainfall and evaporation of two stations within study area .
The mean annual values of air temperatures, relative humidity, speed of winds, rainfall and evaporation are 19.25°C,46%, 4.3m/sec, 96.4mm and 1800mm in Km-160 station and 20.4°C, 39.19%, 3.71m/sec, 54mm, 2148mm, in Nukhaib station, respectively. The hours of sun brightness in the two stations amounted between 6.2 hour/day and 12.3 hour/day, with an average of radiation energy ranged from 278 to 730 kilowatt/m2/day. The prevailing directions of winds are towards west and northwest in months of summer and spring, while remainders of the
directions are of irregular occurrence, especially the eastern winds and south-west. According to classification of United Nations Environment Programme, [18] (Table 2) and depending on the ratio of rainfall (P) divided by evapotranspiration (PE), the ratio (P/PE) is amounted between 0.025 and 0.053 in an average of 0.039, the climate of the study area is classified within the Hyper arid zone, which reflects drought case of negative impacts on the groundwater recharge during the second half of the twentieth century and the first tenth years of the present century.
Table (2) Climatic classification of UN Environments Programme).
Methods and Materials
The study of hydraulic parameters, aquifers properties and groundwater flow are examined by using data base comprised TDS measurements in thirty three boreholes and hydrogeologic information obtaining hydraulic collected data measured in February 2009 from forty one boreholes (Fig. 1) achieved by the center of desert studies and geologic data from eleven key boreholes [19, 20, 21 and 22], (Tables 3, 4 and 5). The groundwater flow model which is based on hydraulic information are used to evaluate the groundwater recharge and/or replenishment [23] and groundwater mixing within aquifers for exploitation plans and groundwater managements. This would facilitate the impact of hydro-stratigraphy and geostructural change on the flow
regime. Static and dynamic water levels with water discharges as mentioned in previous studies are measured in the wells using electrical sounder for levels and volumetric–time method for discharge application depending on the procedures of [13, 24, 25, 26, 27, 28, 29, 30, 31 and 32], related to the monitored variables in this study.
Rock ware-14 software program is used in finding 2D spatial groundwater flow maps, while ArcGis 9.3 program used for other maps. The hydro-stratigraphic boundaries are used along with structural setting to build the conceptual model of the hydrogeologic flow system, where the three dimensional hydrogeologic models provide significant advantages when conducting groundwater resource assessments which lead to improve resource-management outcomes.
Mean annual Period 1941- 2010
Evapotranspiration mm/year
Rainfall mm/year
Wind speed m/sec
Relative Humidity%
Temperature C°
1800 96.4 4.3 46 19.25 Km-160
2148 54 3.71 39.19 20.4 Nukhaib
Precipitation/ evapotranspiration(P/PE) Zone
<0.05 Hyper arid
0.05 - 0.2 Arid
0.2 - 0.5 Semi-arid
0.51 - 0.65 Dry- Sub Humid
>0.65 Moist- Sub Humid and Humid

J. of University of Anbar for Pure Science: Vol. :No. : ISSN:1991-8941
Table (3) Depth of Formations,[20 and 22].
Table (4) Hydraulic data within study area, [19,20,21 and 22].
No. Station Name
X coordinate Y coordinate Flow Rate
K T Sp. Cap. storativity
m m m3/d m/d m2/d l/ sec/m Dimensionless
1 KH-9/7 740307 3696766 505.44 7.7 452 1.56 / 2 5846 724323 3681187 / 0.2 17 / 0.001 3 KH-5/9 690115 3667917 219.45 0.5 41 / 0.0001 4 B-7/11 797263 3609523 2011.39 / 600 40.14 0.040 5 B-7/10 794700 3636000 / / / 28 / 6 W4/64 814348 3460158 2073 / 45 15.0 0.1 7 KH4/7 831764 3462544 1651 0.9 377 3.2 0.0021 8 W4/61 825181 3469740 2471 / 150 5.7 0.023 9 W4/62 823423 3475237 2650 / 110 79 0.1 10 B-18/7 787099 3518058 2071 / / 12 / 11 DW7/65 783490 3598021 486.43 / 636 3.04 0.001 12 B-19/7 793216 3587200 2203 / / 27 / 13 DW7/95 825839 3549337 173 / 15 0.24 / 14 5351 825957 3545639 162 0.7 70 2 / 15 DW7/69 781924 3597977 1811 / 350 3.16 / 16 B-7/1 799012 3550365 1079 / / 0.8 / 17 B-7/2 808431 3551571 1814 / / 1.5 / 18 DW7/76 797867 3589187 527.04 / 500 2.23 / 19 DW7/78 804309 3583829 1924.12 / 800 8.84 0.05 20 DW7/70 795971 3600233 2207 / 124 8.38 / 21 W4/55 802105 3498651 1641 / / 13.2 0.035
ID Qt. Maudod N. Umer
Muhaywir Amij Husayniyat Ubaid Zor -Horan Mullusi Ga’ara
Am-2 0-1.5 1.5-61 61-122 122-183 183-380
Hu-1 0-0.5 0.5-24 24-102 102-174 174-300
KH5/2 0-1 1-23 23-160 160-580
KH5/9 0-0.5 0.5 - 40 40 - 95 95-175 175 - 325 325 - 450 450 - 580 580 -700
ID Qt. Euphrates Dammam Um-Erdhuma Tayarat Sa'adi Msad Rutba
KH-7/7 0 - 1.2 1.2 - 45 45 - 80 80 - 101 101 - 153 153 - 251 251 - 277 277 - 300
KH-3/7 0 - 3.3 3.3 - 76 76 - 131 131 - 221 221-271
B-7/10 0 - 1 1 - 109 109 - 152
ID Qt. Rutba Maudod N. Umer
Najma Muhaywir
KH9/7 0 - 1.0 1.0 - 55 55 - 80 80 - 110 110 - 180
ID Qt. Msad Rutba Muhaywir Ubaid ZorHoran Ga'ara
KH5/4 0 - 1.8 1.8 - 75 75 - 115 115 - 211 211 - 255 255 - 335 335 - 600
ID Qt. Dammam Um-Erdhuma. Tayarat Hartha Sa'adi Khasieb Ahmadi - Rumaila
KH4/3 0 - 1.5 1.5 - 8 8 - 120 120 - 270 270 - 687 687 - 722 722 - 742 742 - 825
ID Qt. Dammam Um-Erdhuma. Tayarat Hartha Msad Rutba Muhaywir
KH4/1 0 - 2 2.0 - 7 7 - 11.0 11 - 190 190 - 460 460 - 535 535 - 670 670 - 765

J. of University of Anbar for Pure Science: Vol. :No. : ISSN:1991-8941
-Continued table (4)
Table (5) Hydrogeologic data within study area, [19, 20 and 21].
No. Station Name
X coordinate Y coordinate Flow Rate
K T Sp. Cap. storativity
m m m3/d m/d m2/d l/ sec/m Dimensionless
22 K4/3 831579 3518058 1469 1.3 555 27 / 23 7055 801196 3685515 518 0.3 20 17 0.001 24 W4/63 832882 3477384 2160 / / 3.8 0.2 25 5411 787205 3577776 224 11.5 407 16 / 26 5389 740339 3632032 432 15.3 277 9 0.01 27 KH7/7 811046 3669167 734.4 6.25 812 21 / 28 5388 758533 3467884 368 2.3 138 41 / 29 W4/65 782309 3469422 1469 / / 47.2 0.014 30 5881 762803 3549366 / / / 12 / 31 W4/51 826840 3517907 1728 / / 1.13 0.02 32 5420 751502 3623061 719 13.1 1000 11 / 33 W4/52 809851 3504430 1814 / / 8.9 0.026 34 W4/53 827308 3503117 2073 / / 5.8 0.019 35 KH3/7 787099 3581473 2200 20.73 407 18 0.005 36 W4/54 819398 3502870 2073 / / 1.56 0.0045
37 KH5/4 688898 3627219 247 0.4 30 / 0.0001 38 5374 726394 3631703 242 0.4 28 / 0.00007 39 5702 694802 3713310 151 1.3 20 0.875 0.001 40 5383 725553 3524437 329 9.2 588 / 0.0006 41 KH4/1 735231 3515409 778 1 10 / 0.025
No. Station Name
X coordinate Y coordinate Elevation Well Depth
depth of water
SWL TDS
m m m (asl) m m m(asl) mg/L
1 KH-9/7 740307 3696766 404.8 619 179.7 225.1 2700
2 5846 724323 3681187 453 354 210 243 /
3 KH-5/9 690115 3667917 501.3 580 186 315.3 1700
4 B-7/11 797263 3609523 334 201 152 182 6000
5 B-7/10 794700 3636000 331.5 200 150.4 181.1 / 6 W4/64 814348 3460158 304 201.5 109.89 194.11 1967
7 KH4/7 831764 3462544 281.7 700.5 84.91 196.79 3021
8 W4/61 825181 3469740 249 201 76 173 1793
9 W4/62 823423 3475237 274 202 92.13 181.87 2222
10 B-18/7 787099 3518058 302 374 113.3 188.7 1920
11 DW7/65 783490 3598021 326 218 139 187 1396
12 B-19/7 793216 3587200 329 286 144.3 184.7 6963
13 DW7/95 825839 3549337 279 / 96 183 /
14 5351 825957 3545639 280.4 125 95.9 184.5 873 15 DW7/69 781924 3597977 328 / 139 189 /
16 B-7/1 799012 3550365 316 202 121.75 194.25 /
17 B-7/2 808431 3551571 304 162 110.95 193.05 /

J. of University of Anbar for Pure Science: Vol. :No. : ISSN:1991-8941
- Continued table (5)
The evolution of 3D geological model has been worked on around the world [33 and 34]. Also, a comprehensive coverage of the current activities in hydrogeologic field was provided by the Illinois State Geological Survey (2011) website [35]. On the basis of available litho-logs of eleven key boreholes (Table 3), using rockware software, a three dimension hydrogeologic model is perfor- med showing the spatial distribution of the hydrogeologic system and their hosted geologic formations (extension of the Hydrogeologic units in X, Y and Z directions). The specific capacity of the production wells and transmissivity of aquifers are studied in a statistical manner for the purpose of high accurate level, after plotting specific capacity and transmissivity values against frequency percent of wells (Fs%), on a probability -logarithm graph paper [25]. Fs%= [M0/(Nw+1)]*100, where, Fs% = frequency of wells; M0 = order number; Nw = total of wells.
Results and Discussions:
Geomorphologic and Structural boundaries
The plateaus in the study area are existed on multi-levels of elevations with the extension of north-south direction within the Iraqi desert. The western plateau where Amij, Ubayidh and Ghadaf valleys are initiated and formed occurred on a level of (550-590) m asl. The plateau is covered by calcareous soils and rocks fragments of Erdhuma, Tayarat, Hartha, Msad, Amij and Hussayniyat Formations. The middle plateau of a level ranges between 450 and 485 m asl, incised by various drainage system of Horan, Amij, Hazimi, Ghadaf, Tubal, Ubayidh, Hamer Valleys, which divide the main plateau into sub plateau of minor scale and/or Mesas, forming badland texture. The eastern plateau exists on a level ranges between 380 and 415 m asl, crossed by Amij, Ghadaf, Ubayidh valleys, where these valleys are of wide passages and little sinuosity. The plateau is of low relief in the
No. Station Name
X coordinate Y coordinate Elevation Well Depth
depth of water
SWL TDS
m m m (asl) m m m(asl) mg/L
18 DW7/76 797867 3589187 331 183 143.3 187.7 1486
19 DW7/78 804309 3583829 324 188 137.7 186.3 1435
20 DW7/70 795971 3600233 326 / 141 185 /
21 W4/55 802105 3498651 279 203 106.5 172.5 1824
22 K4/3 831579 3518058 320 913 123.6 196.4 3330
23 7055 801196 3685515 322 254 155 167 2783 24 W4/63 832882 3477384 239 198 68.53 170.47 3072
25 5411 787205 3577776 343 538 151.3 191.7 2258 26 5389 740339 3632032 441 293 238 203 1613 27 KH-7/7 811046 3669167 282 870 105.5 176.5 3760
28 5388 758533 3467884 373 226 165 208 1681 29 W4/65 782309 3469422 335 202 142.78 192.22 675
30 5881 762803 3549366 398 241 201 197 / 31 W4/51 826840 3517907 289 196 105.55 183.45 1351
32 5420 751502 3623061 430 270 232 198 1878 33 W4/52 809851 3504430 310 204 121 189 880
34 W4/53 827308 3503117 304 201.5 96.8 207.2 3042
35 KH-3/7 787099 3581473 338 538 150.6 187.4 2258
36 W4/54 819398 3502870 288 210 97.7 190.3 3199
37 KH5/4 688898 3627219 559 600 294 265 1218
38 5374 726394 3631703 486 336 234 252 2139
39 5702 694802 3713310 452 213 198 274 2850 40 5383 725553 3524437 490 360 296 194 1386 41 KH4/1 735231 3515409 440 810 253.6 186.4 1259

J. of University of Anbar for Pure Science: Vol. :No. : ISSN:1991-8941
exposure area of Euphrates, Zahra and Habbariyia Gravel Formations. Valleys are the obvious morphologic features in the study area (Fig. 2), such as Amij, Mohemidi, Ghadaf, Hazimi and Ubayidh with its tributaries (Tubal, Abu Ghar, Mdaycece, Shabwan, Safawyet el Sheikh, and Ubaydat, Hamer and Arar), which are considered as important hydrologic basins that recharge aquifers (Fig. 2).
Fig.(2) Distribution map of hydrologic basins. These basins vary in shape and area, where Ubayidh basin is the largest and of circular shape, influenced by structural processes (Nukhaib Graben) followed by Ghadaf basin of rectangular shape, Amij and Mohemidi basins respectively. The drainage patterns of the main valleys are paralleled and dendritic with high stream order in bad land area of elevation more than 510 meter asl characterized by presence of strata exposures of Hartha, Tayarat and Erdhuma Formations. Systems of blind valleys are existed in Alshwaweek dendritic valleys within Amij basin which ends in a plain filled by friable sediments. The depression and valley fill sediments are considered as important land forms, classified within the lands that can be used for agricultural activities and natural life protection. The depression fill sediments overlain the plateaus surface in an areas of few square kilometers.
The depressions may be originated to the disso- lution of fractured carbonate rocks influenced by structural setting of beds. The active winds and sheet runoff participate in filling depressions by sediments of sands, clays and silts. The largest depressions in the study area is Amij depression originated to the faulting in the direction of north-south and north west-south east parallel to Al-qaseer Fault. The depression is flat and the hydrologic status depends on the quantity of waters received by Amij and the surrounding valleys from several sides. Level of waters rises during season of rains detains for a short time and then large quantity lost as a result of evaporation and infiltration process. Tlayha depression is filled with clay and silty clay deposits classified as karst topography and formed by the impact of dissolution process on carbonates of Maudod Formation. Shwaweek Al-sagar depression is a part of desert plain resulted by dissolution process on the carbonate rocks of Hartha Formation which underlain carbonates rocks of Maudod Formation. This depression is of gradational slope from plateau lands towards pediment zone (SW towards NE). Habbariyia depression is a large geomorphic feature with north-south extension represents close depression gathered its water and sediments from valleys of low channels slopes originated to rainy periods of Pleistocene and Holocene. Structurally, the study area is a part of Rutba subzone within the western zone of the stable shelf related to Arabic-African plate [36], in the SE limb of Horan Fold. A rock ware program (RW-14) is used in accomplishment of the Hydro-structure model depending on geologic information represented by lithologic sections of wells (Fig. 3). Results of the model (Fig. 4) show that the water bearing horizons in Nukhaib and kilo-160 areas influenced by Horan fold (southern limb) with beds dipping between 1.0° and 2.0° in a direction of ESE. The model also explains the horizontal and vertical extension of geologic formations within the general geo-structure setting of the area. There are many strike slip faults extended in a direction of NW-SE including Al-qaseer, Srayser and Sagar Faults confirmed by geological studies of [37,38] while [39] categorizes these faults within the normal faults accompanied by horizontal shifting.

J. of University of Anbar for Pure Science: Vol. :No. : ISSN:1991-8941
Fig.(3) Distribution model of geologic well sections within study area.
Fig.(4) Geo-structural model of the study area. As for the southern part, the impact of alpine orogeny initiated in Cretaceous period reflects vertical uplift accompanied by horizontal shifting causing forms of plateau and depressions like Al Habbariyia fold with axes trend of (SSE-NNW) parallel to Al Habbariyia depression in addition to Maayna syncline which extends to the southern part of study area. Another anticline fold extends to the east characterized by plateau shape related to the basement mass movement and this fold may occur on the extension of Safawi block faulting (branch of Hail regional arc) [36]. The axis of fold forms the groundwater divide which controls the groundwater movement by deviating water towards Nukhaib Depression. Al-Ubayidh fault of east-west direction which extends from the north of Nukhaib towards Saudi Arabia borders controls the zone of groundwater recharge. Also, the hydrogeologic regime influenced by (NE-SW) faults system in area of Hamer Valley. The lineaments phenomena from compiled structure
map (Fig. 5), [36] confirm direct impact of Horan subsurface fold (Rutba Uplift) on the extension of geologic Formation and morphologic features which possibly affect the groundwater recharge through exposure rocks. Distribution map of the lineaments phenomena (Fig.5), indicates that ratio of lineaments repetition in a direction of WNW (orthogonal on strike lines) is dominant with lengths ranged between 10 and 150 km and has a ratio of 48% from the total lineaments.
Fig.(5) Distribution map of lineaments within study area,[36]. The majority located in the northern part including areas surrounding Km-160, Muhaywir and Tulaha. The second dominant lineaments are of NE direction in a percent of 28% conform to the direction of main valleys in the southern part (Kasra, Nukhaib and Arar), with lengths ranged between (5-120) Km. As for the linear phenomena in a direction of north-south, its lengths ranged (25-180) Km corresponding with the direction of plateau edges in a repetition ratio of 17%. These lineaments present as geomorphic cliffs (viz, Alzor slope) in conjugate direction to the valleys courses which help waters retention for long period, and allow more water to penetrate and invading through Quaternary sediments and carbonates rocks. Lineaments percent of east-west direction is 7% conformed with the direction of the main valleys created as a result of differential weathering which means the lineaments may be originated to the stratigraphic settings and topographic features.

J. of University of Anbar for Pure Science: Vol. :No. : ISSN:1991-8941
Geologic and Hydrogeologic Boundaries
According to the geologic studies of 42 and 43], a representative geologic section was created (Fig. 6), where the study area includes Quaternary sediments, Zahra FormationMiocene-Pliocene), Euphrates Fn (Burdigalian), Dammam Fn (Lutetian), Erdhuma Fn Tayarat Fn (Late Maestrichtian), Hartha Fn (Campanian - Early Maestrichtian),(Cenomanian-Turonian), Rutba Fn (Cenomanian), Maudod- Naher Umer Fns (Albian-Cenomanian), Najma Formation (Late Jurassic), Muhaywir Fn (Bathonian), Amij Fn (Lias), Hussayniyat Fn (Lias), Ubaid Fn (Lias), ZorHoran FnMullusi Formation (Carnian-Nornian) and Ga’ra Formation (Early-late Permian Age).
Fig.(6) Lithologic section represents formations. The horizontal and vertical extensions of the Geologic Formations are explained in a surface geologic map and geologic model as Figs.(7 and 8). Depending on the presence of groundwater in water bearing horizons of the geologic Formation, eight hydrogeologic districts are determined (Fig.9), including: -First district (Hussayniyat): The district exists in the northwest portion of the study area.groundwater occurred in the water bearing horizons of Mullusi Formation.
J. of University of Anbar for Pure Science: Vol. :No. :
Geologic and Hydrogeologic Boundaries
According to the geologic studies of [40, 41, a representative geologic section was
created (Fig. 6), where the study area includes Quaternary sediments, Zahra Formation (Late
Pliocene), Euphrates Fn (Burdigalian), ), Erdhuma Fn ( Danian ),
), Hartha Fn ( Late Early Maestrichtian), Msad Fn
(Cenomanian), Cenomanian),
Jurassic), Muhaywir Fn (Bathonian), Amij Fn (Lias), Hussayniyat Fn (Lias), Ubaid Fn (Lias), ZorHoran Fn (Rhaetic),
Nornian) and Ga’ra
Lithologic section represents geologic
The horizontal and vertical extensions of the Geologic Formations are explained in a surface geologic map and geologic model as shown in
Depending on the presence of groundwater in water bearing horizons of the
hydrogeologic districts
First district (Hussayniyat): The district exists in the northwest portion of the study area. The groundwater occurred in the water bearing
Fig. (7) Geologic map of the study area
Fig. (8) Three dimensional geologic model.Unsaturated zone in this district is represented by stratigraphic layers of Ubaid and ZorHoran Formations. -Second district (Tlayha): Tlayha district is found in the east and south pagroundwater exists in Ubaid and Mullusi water bearing horizons. The zone of unsaturation comprises stratigraphic beds of Hussayniyat, Amij, Maudod, Rutba and Msad Formations.-Third district (Hazimi): Hazimi district is locateat the south part of second district. groundwater exists in the water bearing horizons of Ubaid and Muhaywir Formations. Unsaturated zone in this district is representelayers of Husayniyat, Amij, Maudod, Rutba and Msad Formations.
Geologic and Hydrogeologic Boundaries
of the study area,[36].
Three dimensional geologic model. Unsaturated zone in this district is represented by stratigraphic layers of Ubaid and ZorHoran
Second district (Tlayha): Tlayha district is found in the east and south part of the first district. The groundwater exists in Ubaid and Mullusi water bearing horizons. The zone of unsaturation comprises stratigraphic beds of Hussayniyat, Amij, Maudod, Rutba and Msad Formations. Third district (Hazimi): Hazimi district is located
south part of second district. The groundwater exists in the water bearing horizons of Ubaid and Muhaywir Formations. Unsaturated zone in this district is represented by stratigraphic
sayniyat, Amij, Maudod, Rutba and

J. of University of Anbar for Pure Science: Vol. :No. : ISSN:1991-8941
-Fourth district (Km-160): This district is in the site east of the 2nd and the 3rd districts. The groundwater exists in Najma and Muhaywir water bearing horizons. The unsaturation zone includes stratigraphic layers of Maudod, Rutba and Msad Formations. -Fifth district (Al mera-Abu Menttar): The district is located at the south-west part of the study area towards Saudi Arabia borders (Fig. 9). The groundwater exists in Hartha water bearing horizons. The unsaturation zone contained layers of Tayarat and Erdhuma Formations. -Sixth district (Arar-Ghadaf): Arar-Ghadaf district is situated to the east of third, fourth and fifth districts. The groundwater exists in Tayarat water bearing horizons. Unsaturated zone in this district is represented by layers of Erdhuma, Dammam, Zahra and Habbariyia Gravel Formations. -Seventh district (Habbariyia-Nukhaib): The district is situated to the east of the sixth district. The groundwater exists in Erdhuma water bearing horizons. The unsaturation zone comprises stratigraphic layers of Dammam, Zahra and Habbariyia Gravel Formations. -Eighth district (Habbariyia-Beret): Habbariyia-Beret district is located at the eastern and southern part of the study area. The groundwater exists in Erdhuma-Tayarat water bearing horizons. The unsaturation zone obtains stratigraphic layers of Dammam, Zahra and Habbariyia Gravel Formations.
Boundary conditions of aquifers.
The boundary conditions of aquifers are summarized according to the thickness and extension of water bearing horizons, as follows: 1-Mullusi Aquifer: Mullusi aquifer is recharged from the scope of Rutba Uplift lands along Horan Valley and its tributaries, which represent the groundwater divide after water penetration through the uppermost geological layers. Mullusi aquifer is of semi-confined conditions [44]. The water bearing horizons influenced by structural setting of the area resulted from Rutba uplift process (branch of Hail arc), creating dip in layers in different direction surrounding uplift. Mullusi aquifer characterized by large extensions and its thickness reaches 100 m in the south definitely in Abu Menttar, 130 meters in Amij and northerly wedge out in Ga’ra depression at 30 meters thick. The thickness of aquifer in the 1st and 2nd districts(Fig. 9) are ranged between 100 and 130
meters. Fig. 8 explains the model of Mullusi Aquifer extension in three dimensions.
Fig. (9) Spatial distribution map of aquifers.
2-Ubaid Aquifer: Ubaid aquifer is recharged from the extension zone of Horan and Hussayniyat Valleys in which the Ubaid layers were exposed, creating boundaries of unconfined to semi-confined conditions [45]. The thickness of Ubaid water bearing horizons is influenced by structural settings, where Ubaid layers represent part of geologic sequences in Rutba Uplift zone. The thickness of Ubaid carbonates aquifer and its extension in the 2nd and 3rd districts (Fig. 9), ranged between 44 and 80 m, (Fig. 8). 3-Muhaywir Aquifer: Muhaywir aquifer is recharged from its exposure zone within Amij catchment area. The aquifer is characterized by unconfined storage condition in the 3rd and 4th district (Fig. 9), which gradually changes to semi confined aquifer in the western parts of the study area. The thickness of aquifer including sandstone and carbonates ranged from 40 to 95m.
J. of University of Anbar for Pure Science: Vol. :No. : ISSN:1991-8941
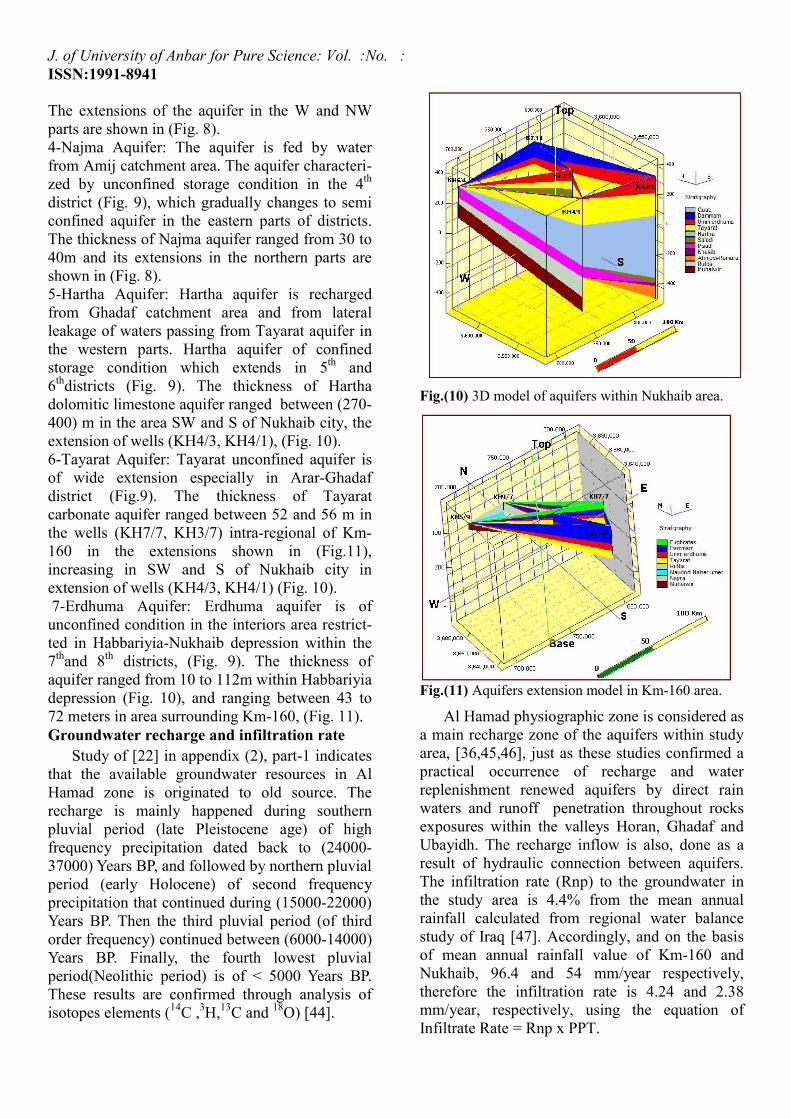
The extensions of the aquifer in the W and NW parts are shown in (Fig. 8). 4-Najma Aquifer: The aquifer is fed by water from Amij catchment area. The aquifer characteri- zed by unconfined storage condition in the 4th district (Fig. 9), which gradually changes to semi confined aquifer in the eastern parts of districts. The thickness of Najma aquifer ranged from 30 to 40m and its extensions in the northern parts are shown in (Fig. 8). 5-Hartha Aquifer: Hartha aquifer is recharged from Ghadaf catchment area and from lateral leakage of waters passing from Tayarat aquifer in the western parts. Hartha aquifer of confined storage condition which extends in 5th and 6thdistricts (Fig. 9). The thickness of Hartha dolomitic limestone aquifer ranged between (270-400) m in the area SW and S of Nukhaib city, the extension of wells (KH4/3, KH4/1), (Fig. 10). 6-Tayarat Aquifer: Tayarat unconfined aquifer is of wide extension especially in Arar-Ghadaf district (Fig.9). The thickness of Tayarat carbonate aquifer ranged between 52 and 56 m in the wells (KH7/7, KH3/7) intra-regional of Km-160 in the extensions shown in (Fig.11), increasing in SW and S of Nukhaib city in extension of wells (KH4/3, KH4/1) (Fig. 10). 7-Erdhuma Aquifer: Erdhuma aquifer is of unconfined condition in the interiors area restrict- ted in Habbariyia-Nukhaib depression within the 7thand 8th districts, (Fig. 9). The thickness of aquifer ranged from 10 to 112m within Habbariyia depression (Fig. 10), and ranging between 43 to 72 meters in area surrounding Km-160, (Fig. 11). Groundwater recharge and infiltration rate
Study of [22] in appendix (2), part-1 indicates that the available groundwater resources in Al Hamad zone is originated to old source. The recharge is mainly happened during southern pluvial period (late Pleistocene age) of high frequency precipitation dated back to (24000-37000) Years BP, and followed by northern pluvial period (early Holocene) of second frequency precipitation that continued during (15000-22000) Years BP. Then the third pluvial period (of third order frequency) continued between (6000-14000) Years BP. Finally, the fourth lowest pluvial period(Neolithic period) is of < 5000 Years BP. These results are confirmed through analysis of isotopes elements (14C ,3H,13C and 18O) [44].
Fig.(10) 3D model of aquifers within Nukhaib area.
Fig.(11) Aquifers extension model in Km-160 area.
Al Hamad physiographic zone is considered as a main recharge zone of the aquifers within study area, [36,45,46], just as these studies confirmed a practical occurrence of recharge and water replenishment renewed aquifers by direct rain waters and runoff penetration throughout rocks exposures within the valleys Horan, Ghadaf and Ubayidh. The recharge inflow is also, done as a result of hydraulic connection between aquifers. The infiltration rate (Rnp) to the groundwater in the study area is 4.4% from the mean annual rainfall calculated from regional water balance study of Iraq [47]. Accordingly, and on the basis of mean annual rainfall value of Km-160 and Nukhaib, 96.4 and 54 mm/year respectively, therefore the infiltration rate is 4.24 and 2.38 mm/year, respectively, using the equation of Infiltrate Rate = Rnp x PPT.

J. of University of Anbar for Pure Science: Vol. :No. : ISSN:1991-8941
The amount of water infiltration in area (Km-
160) north of Ghadaf valley is calculated by using the following equation:
Amount of infiltration = infiltration rate× area = 0.00424(m/year) ×170.44x10⁸ m2 =72.2 x10⁶ m3/year
Also, the amount of water infiltration in area of Nukhaib south of Ghadaf valley is equal to: =0.00238 (m/year) 204.56x10⁸ m2 = 48.7×10⁶ m3/year. Hydraulic parameters
The evaluation of the aquifer characteristics are determined according to the available hydraulic information gathered from multi previous hydrogeologic studies, Tables (4, 5). The amount of permeability for the water bearing horizons of Muhaywir-Najma, Mullusi-Ubaid, Tayarat-Erdhuma, Erdhuma, Tayarat, Muhaywir-Ubaid, Mullusi and Hartha aquifers are (7.7), (0.2-0.5), (0.9-1.7), (0.2-0.7), (0.3-20.7), (0.3-0.4), (1.3), (1-9.2) m/day respectively, (Table 4). Those aquifers are classified as aquifers of low permeability except for Tayarat and Hartha which are of middle class depending on [48], (Table 6). Table (6) Laboutka Classification for hydraulic parameters of aquifers.
The variation in the values of permeability originated to the heterogeneity of the rocks forming aquifers, density of fractures and joints. Spatial distribution map of permeability (Fig. 12), shows increasing in permeability variation grade ranged between 0.000002 and 0.0016 m/day/meter distance towards Tayarat and its extensions with Erdhuma aquifer in Habbariyia depression and with Hartha aquifer in Tubal catchment area, whereas the permeability values decrease in the area SW Nukhaib and Tlayha, specifically in aquifers of Ubaid-Muhaywir and Mullusi-Ubaid. The amounts of aquifers transmis-sivity including Muhaywir-Najma, Mullusi-Ubaid, Tayarat-Erdhuma, Erdhuma, Tayarat, Muhaywir-Ubaid, Mullusi and Hartha are 452, (17-41), (45-600), (15-800), (20-1000), (28-30), 20, (10-588) m2/day, respectively,(Table 4). Depending on [48] (Table 6), the aquifers are classified as of middle
to high transmissivity except for Mullusi, Muhaywir-Ubaid and Mullusi-Ubaid which are of low to middle class.
Fig.(12) Spatial variation map of permeability. Spatial distribution map of transmissivity (Fig. 13), shows approximate and limited corres- ponddence with the distribution of permeability. There is an increasing in transmissivity variation grade ranged between 0.00007 and 0.049 m2/day/m within the zone of Tayarat aquifer (Ghadaf and Mohammedi catchment area) and its extensions with Erdhuma aquifer in Habbariyia depression and with Hartha aquifer in Tubal catchment area, whereas the transmissivity value decreases in Nukhaib region and Tlayha areas, specifically in Ubaid-Muhaywir and Ubaid-Mullusi aquifers.
Statistical method is used in comparison of transmissivity values within Tayarat, Erdhuma and the mixed of Tayarat-Erdhuma. [25, 49 and 50] for the purpose of define which aquifer has the large impact on the water discharge of wells (productivity from mixed aquifers).
Perm-eability m/d
Transm-issivity m2/d
Specific capacity m3/d/m
Discharge m3/d
Class
>864 >950 >864 >2160 V.high 86.4-864 95- 950 86.4-864 432-2160 high 8.64-86.4 9.5- 95 8.64-86.4 432-43.2 middle < 8.64 <9.5 < 8.64 < 43.2 low

J. of University of Anbar for Pure Science: Vol. :No. : ISSN:1991-8941
Fig.(13) Distribution model of transmissivityThree groups of transmissivity values for
Tayarat, Erdhuma and Tayarat-Erdhumare scheduled in (Table 7). The three groups of transmissivity values and their frequency percent (Fs%) plotted on the probability-logarithm paper, (Fig. 14), where frequency percent is = [M0/ (NW+1)] *100, M0; rank number, Nnumber of wells. The results derived from probability-logarithm graph paper (Fig. 14) are follows: 1-Transmissivity values of Erdhuma aquifer within study area are (40, 300 and 510) mpossibilities of 80%, 50% and 30%, respec2-Transmissivity values of Tayarat aquifer are (100, 400 and 600) m2/day, in the possibilities of 80%, 50% and 30%, respectively. 3-Transmissivity coefficient values of TayaratErdhuma mixed aquifer are (28, 200 and 380) m2/day, in the possibilities of 80%, 50% and 30%, respectively. The comparison of the three results above as clarified in (Fig. 14) shows that the transmissivity values of Tayarat-Erdhuma mixed aquifer are less than the transmissivity values of Tayarat aquifer in a ratio of (36–72)% and less than the transmissivity of Erdhuma aquifer in a ratio of (25-33) percent.
J. of University of Anbar for Pure Science: Vol. :No. :
transmissivity. Three groups of transmissivity values for
Erdhuma aquifer The three groups of
transmissivity values and their frequency percent logarithm paper,
14), where frequency percent is (Fs%) ; rank number, Nw; total
The results derived from (Fig. 14) are as
Transmissivity values of Erdhuma aquifer with -in study area are (40, 300 and 510) m2/day, in the
respectively. Transmissivity values of Tayarat aquifer are
/day, in the possibilities of
values of Tayarat-mixed aquifer are (28, 200 and 380)
50% and 30%, The comparison of the three results
above as clarified in (Fig. 14) shows that the Erdhuma mixed
aquifer are less than the transmissivity values of 72)% and less
than the transmissivity of Erdhuma aquifer in a
This indicates the heterogeneity of aquifer sediments which reflects permeability variation and the differences in layers thickness. The amount of storage coefficientMullusi-Ubaid, MuhaywirNajma, Tayarat-Erdhuma, Erdhuma, Tayarat, Mullusi and Hartha are (10(10-3), (4x10⁻³-10-1), (103.5x10⁻²), (10-3), (6x10(Table 4), [20,21]. The results of storage coefficient show variable values among aquifers originated to structural setting of each aquifer and the variation of rocks characteristics
Fig.(14) Transmissivity and percent of wells for aquifers on probability logarithmic paper
Productivity of wells and specific capacity
The amount of well productivityof Muhaywir-Najma, MullusiErdhuma, Erdhuma, Tayarat, MuhayMullusi and Hartha are 505.4, 1112650, 162-2207, 224-2200, 240778 m3/day, respectively (Table 4).Laboutka classification(1974)the study area are classified within the wells of medium-high productive in exclusion wells of Tayarat-Erdhuma classified as wells of high to very high productivity.the water wells which depths ranged from 125meters to 913 meters for the aquifers MuhaywirNajma, Tayarat-Erdhuma, ErdhumMullusi are 1.56, 3.2-15.0, 0.24and 0.875 liter/sec/m respectively (Table 4).
This indicates the heterogeneity of aquifer sediments which reflects permeability variation and the differences in layers thickness.
of storage coefficient for the aquifers Ubaid, Muhaywir-Ubaid, Muhaywir-
Erdhuma, Erdhuma, Tayarat, Mullusi and Hartha are (10- 4-10- 3), (10- 4 -7x10- 5),
), (10-3-5x10⁻²), (4.5x10⁻³-), (6x10⁻⁴-2.5x10⁻²) respectively,
. The results of storage coefficient show variable values among aquifers originated to structural setting of each aquifer and the variation of rocks characteristics.
Transmissivity and percent of wells for on probability logarithmic paper.
Productivity of wells and specific capacity
The amount of well productivity in the aquifers Najma, Mullusi-Ubaid, Tayarat-
Erdhuma, Erdhuma, Tayarat, Muhaywir-Ubaid, Mullusi and Hartha are 505.4, 111-219.4, 1651-
2200, 240-247, 151, 329-/day, respectively (Table 4). Depending on
Laboutka classification(1974) [48], the wells of the study area are classified within the wells of
high productive in exclusion wells of Erdhuma classified as wells of high to
very high productivity. The specific capacity of the water wells which depths ranged from 125
for the aquifers Muhaywir-Erdhuma, Erdhuma, Tayarat and
15.0, 0.24-8.84, 1.13-47.2 and 0.875 liter/sec/m respectively (Table 4).

J. of University of Anbar for Pure Science: Vol. :No. : ISSN:1991-8941
Table (7) Frequency and Transmissivity within study area.
The distribution map of the specific capacity(Fig. 15), confirmed spatial variation in an increasing grade ranged between 0.000001 and 0.0036 l/sec/m towards wells of (Tayarat-Erdhuma and Tayarat aquifers) in high to very high category of specific capacity compared with Laboutka classification, while it decreases to medium-high category of specific capacity classification in the other part. Statistical method is used in comparison of specific capacity values within Tayarat, Erdhuma and the mixed of Tayarat-Erdhuma [25,49 and 50] for the purpose of define, which aquifer has the large impact on the productivity of wells from mixed aquifers.
Fig.(15) Spatial analysis map of specific capacity.
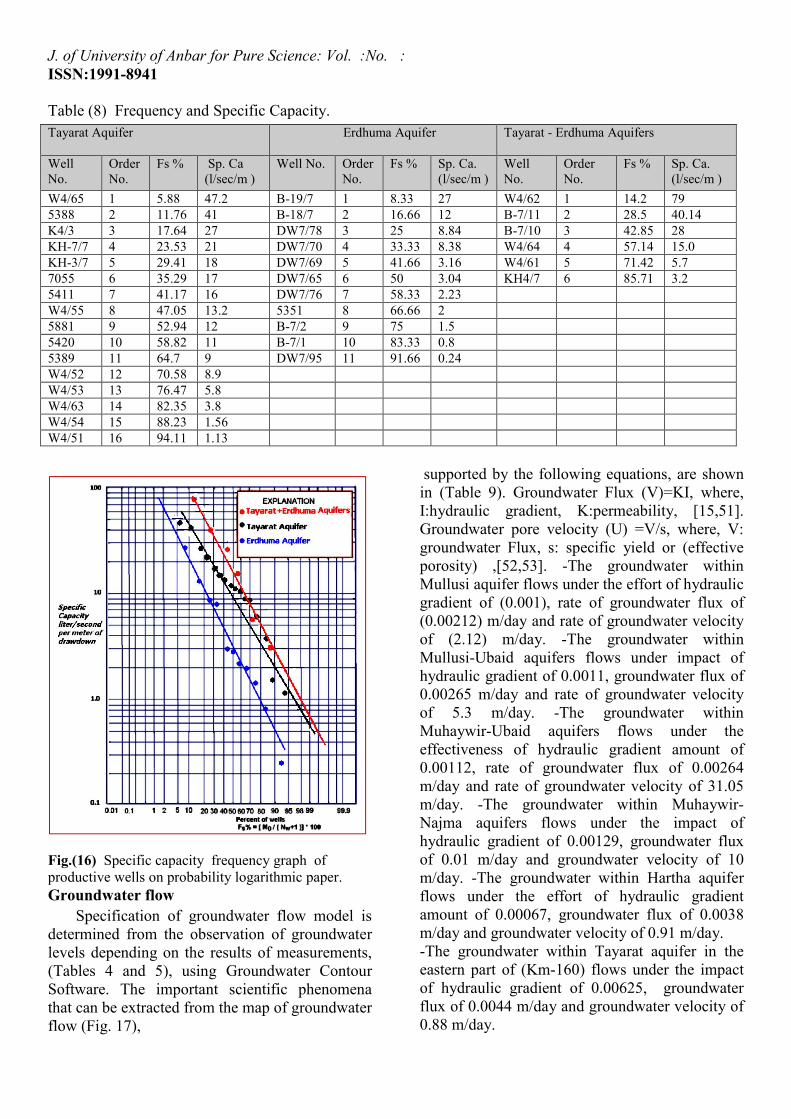
Three groups of specific capacity values for Tayarat, Erdhuma and mixed of Tayarat-Erdhuma aquifers are scheduled in (Table 8). The groups of specific capacity values and their frequency percent(Fs%) plotted on the probability–logarithm paper. The results derived from probability-logarithm graph paper (Fig. 16) are as follows: -Erdhuma aquifer: productive wells have a specific capacity of 0.5 liter/day/m (of drawdown) at high probability estimated at 90%. Productive wells can also obtain a specific capacity of 3 liter/day/m in moderate probability estimated at 50%, whereas productive wells can be obtained with specific capacity of eight liter/day/m in low probability estimated at 30%. -Tayarat aquifer: Productive wells that can be obtained have a specific capacity of 2, 9 and 18 liter/day/m in a probability of 90%, 50% and 30% respectively. -Tayarat-Erdhuma aquifer: Productive wells that can be obtained have a specific capacity of 3, 15 and 35 liter/day/m in a probability of 90%, 50% and 30% respectively. Comparing the results of the three groups as illustrated in Fig. 15, shows that the specific capacity of wells produced from mixed aquifers of Tayarat-Erdhuma is more than the specific capacity of Tayarat or Erdhuma aquifer where the outcome feeding ratio of groundwater given to the wells from each aquifer are: -In the probability 90% : 80% feeding ratio comes from Tayarat and 20% from Erdhuma aquifer. -In the probability 50% : 75% feeding ratio comes from Tayarat and 25% from Erdhuma aquifer. -In the probability 30% : 70% feeding ratio comes from Tayarat and 30% from Erdhuma aquifer.
Tayarat Aquifer Erdhuma Aquifer
Tayarat - Erdhuma Aquifers
Well No.
Order No.
Fs % T m2/day
Well No. Order No.
Fs % T m2/day
Well No.
Order No.
Fs % T m2/day
5420 1 11.11 1000 DW7/78 1 12.5 800 B-7/11 1 16.6 600
KH-7/7 2 22.22 812 DW7/65 2 25 636 KH4/7 2 33.3 377 K4/3 3 33.33 555 DW7/76 3 37.5 500 W4/61 3 50 150 KH-3/7 4 44.44 407 DW7/69 4 50 350 W4/62 4 66.6 110 5411 5 55.55 407 DW7/70 5 62.5 124 W4/64 5 83.3 25 5389 6 66.66 277 5351 6 75 70 5388 7 77.77 138 DW7/95 7 87.5 15 7055 8 88.88 20
J. of University of Anbar for Pure Science: Vol. :No. : ISSN:1991-8941
Table (8) Frequency and Specific Capacity.
Fig.(16) Specific capacity frequency graph of productive wells on probability logarithmic paper. Groundwater flow
Specification of groundwater flow model is determined from the observation of groundwater levels depending on the results of measurements, (Tables 4 and 5), using Groundwater Contour Software. The important scientific phenomena that can be extracted from the map of groundwater flow (Fig. 17),
supported by the following equations, are shown in (Table 9). Groundwater Flux (V)=KI, where, I:hydraulic gradient, K:permeability, [15,51]. Groundwater pore velocity (U) =V/s, where, V: groundwater Flux, s: specific yield or (effective porosity) ,[52,53]. -The groundwater within Mullusi aquifer flows under the effort of hydraulic gradient of (0.001), rate of groundwater flux of (0.00212) m/day and rate of groundwater velocity of (2.12) m/day. -The groundwater within Mullusi-Ubaid aquifers flows under impact of hydraulic gradient of 0.0011, groundwater flux of 0.00265 m/day and rate of groundwater velocity of 5.3 m/day. -The groundwater within Muhaywir-Ubaid aquifers flows under the effectiveness of hydraulic gradient amount of 0.00112, rate of groundwater flux of 0.00264 m/day and rate of groundwater velocity of 31.05 m/day. -The groundwater within Muhaywir-Najma aquifers flows under the impact of hydraulic gradient of 0.00129, groundwater flux of 0.01 m/day and groundwater velocity of 10 m/day. -The groundwater within Hartha aquifer flows under the effort of hydraulic gradient amount of 0.00067, groundwater flux of 0.0038 m/day and groundwater velocity of 0.91 m/day. -The groundwater within Tayarat aquifer in the eastern part of (Km-160) flows under the impact of hydraulic gradient of 0.00625, groundwater flux of 0.0044 m/day and groundwater velocity of 0.88 m/day.
Tayarat Aquifer Erdhuma Aquifer
Tayarat - Erdhuma Aquifers
Well No.
Order No.
Fs % Sp. Ca (l/sec/m )
Well No. Order No.
Fs % Sp. Ca. (l/sec/m )
Well No.
Order No.
Fs % Sp. Ca. (l/sec/m )
W4/65 1 5.88 47.2 B-19/7 1 8.33 27 W4/62 1 14.2 79 5388 2 11.76 41 B-18/7 2 16.66 12 B-7/11 2 28.5 40.14 K4/3 3 17.64 27 DW7/78 3 25 8.84 B-7/10 3 42.85 28 KH-7/7 4 23.53 21 DW7/70 4 33.33 8.38 W4/64 4 57.14 15.0 KH-3/7 5 29.41 18 DW7/69 5 41.66 3.16 W4/61 5 71.42 5.7 7055 6 35.29 17 DW7/65 6 50 3.04 KH4/7 6 85.71 3.2 5411 7 41.17 16 DW7/76 7 58.33 2.23 W4/55 8 47.05 13.2 5351 8 66.66 2 5881 9 52.94 12 B-7/2 9 75 1.5 5420 10 58.82 11 B-7/1 10 83.33 0.8 5389 11 64.7 9 DW7/95 11 91.66 0.24 W4/52 12 70.58 8.9 W4/53 13 76.47 5.8 W4/63 14 82.35 3.8 W4/54 15 88.23 1.56 W4/51 16 94.11 1.13

J. of University of Anbar for Pure Science: Vol. :No. : ISSN:1991-8941
Table 9 Hydraulic and hydrogeologic data of aquifers extracted from the groundwater flow model.
Fig.( 17) Groundwater flow within study area.
Aquifer GW. depth (m)
GW. Head (m.asl)
Hydraulic gradient
Permeability m/day
GW. flux (m/day)
Effective porosity
GW. pore velocity (m/day) from to
Mullusi aquifer 145-196 295 245 0.001 2.12 0.00212 0.001 2.12
Mullusi-Ubaid aquifer 136-186 305 235 0.0011 2.41 0.00265 0.0005 5.3
Muhaywir-Ubaid aquifer
234-294 285 235 0.00112 2.36 0.00264 0.00085 3.11
Muhaywir-Najma aquifer 160-220 238 196 0.00129 7.77 0.01 0.001 10
Hartha aquifer 253-296 226 195 0.00067 5.675 0.0038 0.0042 0.91
Tayarat aquifer eastern of (Km-160)
105-155 195 170 0.000625 7.045 0.0044 0.005 0.88
Tayarat aquifer in the middle of study area
150-232 240 190 0.0005 13.2 0.0066 0.005 1.32
Tayarat aquifer south of Nukhaib city
97-123 195 175 0.00036 4.3 0.0015 0.02 0.071
Erdhuma aquifer 95-144 190 175 0.00016 9.41 0.0015 0.025 0.06
Tayarat-Erdhuma aquifer in Kasra area
144-152 185 175 0.00022 9.78 0.0021 0.04 0.052
Tayarat-Erdhuma aquifer in Beret area
76-109 190 175 0.0005 1.785 0.00089 0.045 0.0197

J. of University of Anbar for Pure Science: Vol. :No. : ISSN:1991-8941
-The groundwater within Tayarat aquifer in the middle part of study area flows under the effort of hydraulic gradient amount of 0.0005, rate of groundwater flux of 0.0066 m/day and rate of groundwater velocity of 1.32 m/day. -The groundwater within Tayarat aquifer south of Nukhaib city flows under the effectiveness of hydraulic gradient amount of 0.00036, rate of groundwater flux of 0.0015 m/day and rate of groundwater velocity of 0.071 m/day. -The groundwater within Erdhuma aquifer flows under the impact of hydraulic gradient amount of 0.00016, rate of groundwater flux of 0.0015 m/day and rate of groundwater velocity of 0.06 m/day. - The groundwater within Tayarat-Erdhuma aquifers in Kasra area flows under the effort of hydraulic gradient of 0.00022, rate of groundwater flux of 0.0021 m/day and groundwater velocity of 0.052 m/day. - The groundwater within Tayarat-Erdhuma aquifers in Beret area flows under the impact of hydraulic gradient of 0.0005, rate of groundwater flux of 0.00089 m/day and groundwater velocity of 0.0197 m/day.
The inflow and outflow rate to/from the hydrogeologic regime are calculated, depending on map of groundwater flow and hydraulic parameters of aquifers, using Darcy equation; Q=TIL (Darcy equation in [11 and 15] where Q = Inflow or Outflow (m3/day), T=Transmissivity (m2/day), I= Hydraulic Gradient (dimensionless), L=Section length (meters). The inflow and outflow rates for each aquifer are calculated on various equipotential lines representing the borders of aquifers as mentioned in Table 10 where the groundwater within Tayarat aquifer south of Nukhaib city flows from hydraulic head of 195 m asl to the head of 175 m asl, towards well (W4/55) from all direction, influenced by intense exploitation or/and deep percolation throughout karst passages forming a boundary of captured zone. The groundwater balance which is determined by rate difference of groundwater inflow and outflow (ΔQ) in Mullusi, Mullusi-Ubaid, Muhaywir - Ubaid, Muhaywir - Najma, Hartha, Tayarat-Erdhuma aquifers, is 0.028x10⁶, 0.058x10⁶, -0.4x10⁶, 1.064x10⁶, -1.9 x10⁶ and -0.181x10⁶ m3/year, respectively, where the posit- ive values represent the average difference lost in aquifers (groundwater depletion) originated either
to rate of leakage through Faults and fractures deformations to the regional groundwater or the discharge of productive wells within the hydrogeologic basin, or both. The negative values of(ΔQ) for Hartha and Tayarat-Erdhuma aquifers represent the flow coming from the border regions (Saudia Arabia), where the calculation achieved as partial inflow which obtain the inflow within the study area only. The negative value of balance changes within Muhaywir-Ubaid aquifers, may represent lateral or/and vertical leakage recharge through structural weak zones or groundwater inflow from hydraulic head more than 285 m. asl. Finally, 36.19x10⁶ m3/year is the total ground-water outflow (Table 10), which forms 30% from the total infiltration amount of (120.9x10⁶) m3/year, while the 70% of infiltration rate is retained in unsaturation zone of (76-296 m thick) as a vadose water. Total Dissolve Solids (TDS)
Concentration of total dissolved solids in the groundwater of the aquifers Muhaywir-Najma, Mullusi-Ubaid, Tayarat-Erdhuma, Erdhuma, Tayarat, Muhaywir-Ubaid, Mullusi and Hartha are (2700), (1500-1700), (1793-6000), (873-6963), (675-3760), (1218-2139), (2850) and (1259-1386) mg/liter, respectively, (Table 5). The groundwater is classified as slightly saline to saline water according to TDS classification in [15,54,55 and 56] except for fresh groundwater in some pockets within Nukhaib depression in Tayarat aquifer (wells;W4/52, W4/65) and Erdhuma aquifer (well-5351). Distribution map of TDS (Fig. 18), shows increase of concentration in an enrichment grade of 0.00024 to 0.342 mg/liter/m in E and NE direction corresponding with the flow direction within Tayarat and its extensions with Erdhuma aquifer, while TDS values decrease towards east, south and south west of Nukhaib city. The model of TDS distribution indicates, the following phenomena: - Presence of recharge source coming from the west and the southwest direction where the TDS concentration is of less values, representing the zone of infiltration and replenishment within valleys catchment area. - Presence of enrichment mechanism where the groundwater is characterized by slightly saline water, which gradually changes to saline water towards NE direction. These results are explained by the followings:

J. of University of Anbar for Pure Science: Vol. :No. : ISSN:1991-8941
Table (10) Hydraulic data of aquifers and groundwater balance.
Fig. (18) Distribution map of TDS within study area.
Aquifer T m2/d
Hy. gradient
Width (m) Hydraulic head (m.asl)
GW inflow m3/day
GW outflow m3/day
GW outflow m3/year
Balance change (ΔQ)
inflow outflow inflow
outflow
m3/day m3/year
Mullusi aquifer
20 0.001 20000 18000 295 245 400 324.0 0.118x10⁶ 76 0.028x10⁶
Mullusi-Ubaid aquifer
24 0.0011 40000 34000 305 235 1056 897.6 0.327x10⁶ 158.4 0.058x10⁶
Muhaywir-Ubaid aquifer
29 0.00112 28000 62000 285 235 909.44 2013.7 0.735x10⁶ - 1104.3 - 0.4x10⁶
Muhaywir-Najma aquifer
452 0.00129 70000 65000 238 196 40815.6 37900.2 13.833x10⁶ 2915.6 1.064x10⁶
Hartha aquifer 299 0.00067 32000 58000 226 195 6410.56 11619.1 4.241 x10⁶ -5208.5 -1.9 x10⁶
Tayarat-Erdhuma aquifers
413 0.00039 285000 158000 195 185
45904
25449
46401 16.93 x10⁶ - 496.1 - 0.181x10⁶ Tayarat aquifer south of Nukhaib city
485 0.00036 / 120000 195 185 20952

J. of University of Anbar for Pure Science: Vol. :No. : ISSN:1991-8941
*Dilution process is done in TDS concentration by a percent of 30% in the area which forms 10% of the study area calculated on concentration contour of 1500 mg/liter, and this indicates that the groundwater is mixed with infiltrated waters and be possible described within the zone of replenishment or near the recharge zone. *Enrichment process of TDS concentration at a percent of 150% in the area which forms 30% from the study area, calculated on iso-line concentration of 2400 mg/liter, indicating that the enrichment occurred by two impacts including the mixture with waters of more salty or/and the dissolution of minerals forming aquifers. Conclusions
The study identifies the hydrogeological properties and the hydraulic characteristics of the aquifers within the hydrogeologic regime of Nukhaib-Km.160 using an integrated approach combining geo-structural settings and geological boundaries to develop the hydrogeological geometry of the aquifers. A spatial bimodel of hydrodynamic distribution is examined in order to determine the behaviour of groundwater flow and recharge within the aquifers of the study area. The study area represents a plateau of dry arid zone having undulant reliefs with accumulation of pediment sediments on edges. The water bearing horizons in Nukhaib and Kilo-160 areas are influenced by Horan anticline form a part of southern limb, with beds dipping between 1.0° and 2.0° in a direction of ESE. The impact of alpine orogeny initiated in Cretaceous period and reflected as vertical uplift accompanied by horizontal slip causing plateau form like Al Habbariyia fold. Anticline related to the basement mass movement on the extension of faults system in a direction of (NNE-SSW) may occur on the extension of Safawi block faulting (branch of Hail regional arc). The axis of fold forms the groundwater divide which controls the groundwater movement by deviating water towards Nukhaib Depression. Tayarat and Erdhuma aquifers in Kasra and Nukhaib are of both lateral and vertical hydraulic connections through faults and cracks system. Those aquifers are of laterally connection with Hartha aquifer in area west and south west of Nukhaib towards Hamer and Arar Valleys, also of lateral connection with Muhaywir aquifer due to layers intertongueing in the extension of east-west and
impact of faults in Tlayha region. As for in the northwest parts, there is a vertical hydraulic connection resulting from impact of faults on Mullusi, Ubaid and Muhaywir aquifers. Accordingly and depending on the geo-structural phenomena, the boundary condition of aquifers are determined as follows: -Mullusi and Ubaid aquifers are of semi-confined conditions recharged from Rutba Uplift zone in the extension of Horan Valley and its tributaries which represents the groundwater divide. -Muhaywir aquifer is recharged from its exposure zone within Amij catchment area. The aquifer is characterized by unconfined storage condition in the 3rd and 4th district and gradually changes to semi confined aquifer in the western parts of the study area. -Najma aquifer is recharged from Amij catchment area. The aquifer is characterized by unconfined storage condition in the 4th district and gradually changes to semi confined aquifer in the eastern parts of districts. -Hartha aquifer is recharged from Ghadaf catchment area and from lateral leakage of waters passing from aquifers in the western parts. Hartha aquifer of confined storage condition extends in the 5th and the 6thdistricts. -Tayarat unconfined aquifer is of wide extension represented by the 6th district. The thickness of dolomitic limestone aquifer ranged from 52m to 56 m in the wells (KH7/7, KH3/7) and in intra-regional of Km-160 increases in SW and S of Nukhaib city in the extension of wells (KH4/3, KH4/1). -Erdhuma aquifer is of unconfined condition in the interiors area restricted in Habbariyia-Nukhaib depression, within the 7thand 8th districts.
The aquifers are of low permeability except for Tayarat and Hartha which are of middle class. The increasing in permeability variation grade ranged from 0.000002 to 0.0016 m/day/m towards Tayarat and its extensions with Erdhuma aquifer in Habbariyia depression and with Hartha aquifer in Tubal catchment area while the permeability values decreases in the aquifers of Ubaid-Muhaywir and Ubaid-Mullusi (SW Nukhaib and Tlayha). The aquifers are classified as of middle to high transmissivity except for Mullusi, Muhaywir-Ubaid and Mullusi-Ubaid which are of low to middle class. An increasing in transmissivity variation grade ranged between 0.00007and 0.049m2/day/m within the zone of

J. of University of Anbar for Pure Science: Vol. :No. : ISSN:1991-8941
Tayarat aquifer and its extensions with Erdhuma aquifer in Habbariyia depression and with Hartha aquifer in Tubal catchment area, while the transmissivity values decreased in the area south of Nukhaib and Tlayha(aquifers of Ubaid-Muhaywir and Ubaid- Mullusi). The specific capacity of wells produced from mixed aquifers of Tayarat-Erdhuma is more than the specific capacity of wells produced from Tayarat or Erdhuma aquifer where the outcome feeding ratio of groundwater given to the wells from each aquifer are: -In the probability90% : 80% of feeding ratio comes from Tayarat aquifer and 20% from Erdhuma aquifer. -In the probability50% : 75% of feeding ratio comes from Tayarat aquifer and 25% from Erdhuma aquifer. -In the probability30% : 70% of feeding ratio comes from Tayarat aquifer and 30% from Erdhuma aquifer.
The groundwater flow map indicates transmission of water among aquifers from the west and southwest towards east (Nukhaib depression) and north east (Amij depression). Also the presence of another direction of deviated flow is caused by the presence of groundwater divides formed as a result of structural setting such as subsurface Habbariyia fold of (SSE-NNW) axes, just as anticline extends with Safawi uplift which represents a branch of Hail arc. This fold forms a groundwater division causing deviation in groundwater flow towards Nukhaib area (replenished zone with low TDS values).
The groundwater within the aquifers system flows from maximum hydraulic head of 305 m asl to the lowest head of 170 m asl, in the direction of E and/or NE considered as groundwater of medium to deep depths, where the depths range between 76 and 296m from the land surface, existing within Amij, Hazimi-Ghadaf, Awaj, Ubayidh catchment areas. The groundwater moves under the effectiveness of hydraulic gradient rate of (0.00016-0.00129), rate of groundwater flux of (0.00089-0.01) m/day and rate of groundwater pore velocity of (0.0197-10) m/day. The groundwater balance which determined by rate difference of groundwater inflow and outflow in Mullusi, Mullusi-Ubaid, Muhaywir-Ubaid, Muhaywir-Najma, Hartha, Tayarat-Erdhuma aquifers, are 0.028x10⁶,
0.058x10⁶,-0.4x10⁶, 1.064x10⁶, -1.9x10⁶ and - 0.181x10⁶ m3/year, respectively.
Depending on detail information for each aquifer using correlation technique for hydraulic data of the aquifers, the important aquifers that can be classified for best future exploitation are Tayarat-Erdhuma aquifer in Beret and Kasra areas, Tayarat aquifer south of Nukhaib city and east of (Km160) region and also Erdhuma aquifer in Tubal catchment area. The groundwater in these aquifers is classified as a groundwater of medium depths(76-155) meters flows from hydraulic head of 195 m.asl to the head of 170 m.asl, under the impact of hydraulic gradient rate of (0.00016-0.000625), groundwater flux of (0.00089-0.0044) m/day and groundwater pore velocity of (0.019-0.88) m/day. The other aquifers which is classified as of second exploitation grade and characterized by groundwater of high depths (145-296) meters, flow from hydraulic head of 305 m.asl to the head of 195 m.asl, under the impact of hydraulic gradient rate of (0.0007-0.001), groundwater flux of (0.00212-0.01)m/day and groundwater pore velocity of (0.91-10)m/day.
The model of TDS distribution indicates a presence of recharge source coming from the W and SW direction where TDS concentration is of less values representing the zone of infiltration and replenishment within valleys catchment area. Dilution process occurred in TDS concentration
by a percent of 30% in the area forms 10% of the
study area, calculated on concentration iso-line of
1500 mg/liter, and this indicates that the
groundwater mixed with infiltrated waters can be
possible described within the zone of
replenishment or near the recharge zone.
References 1-Lachaal F, Bédir M, Tarhouni J, Ben Gacha A, Leduc C
(2011) Characterizing a complex aquifer system using geophysics, hydrodynamics and geochemistry: A new distribution of Miocene aquifers in the Zéramdine and Mahdia-Jébéniana blocks (east-central Tunisia). Journal of African Earth Sciences, 60, 222-236. DOI: 10.1016/j.jafrearsci. 2011.03.003.
2-Lachaal F, Mlayah A, Anane M, Bédir B, Tarhouni J, Leduc C, (2011c).Comprehension and hydrogeological conceptualization of aquifer in arid and semi arid regions using integrated hydrogeological information system: case of the deep aquifer of Zéramdine-Béni Hassen (east-central Tunisia). Arabian Journal of Geosciences. doi: 10.1007/s12517-011-0498-x.
3-Ayenew T, Demlie M, Wohnlich S (2008) Hydrogeological framework and occurrence of

J. of University of Anbar for Pure Science: Vol. :No. : ISSN:1991-8941
groundwater in the Ethiopian aquifers. Journal of African Earth Sciences 52, 97-113.
4-Lihe Y, Guangcheng H, Jinting H, Dongguang W, Jiaqu D, Xiaoyong W, Hongbo L (2011) Groundwater-recharge estimation in the Ordos Plateau, China: comparison of methods. Hydrogeology Journal, DOI 10.1007/s10040-011-0777-3, Vo. 19:1563-1575.
5-Healy R, Cook P (2002) Using groundwater levels to estimate recharge. Hydrogeology Journal,Vol.10 ,No.1. pp (91-109).
6-Fawcett J, Cherry D, Reid M (2006) Hydrogeological units of the Upper London and Spring Hill Groundwater Management units. Department of Primary Industries, Melbourne, Australia.
7-Bruce G, Cherry D, Adelana M, Xiang C, Mark R (2011) Using three-dimensional geological mapping methods to inform sustainable groundwater development in a volcanic landscape, Victoria, Australia. Hydrogeology Journal (DOI 10.1007/s10040-011-0757-7),Vol.19: 1349-1365.
8-Andrzej J, Andrzej K, Vrba J (2007) Groundwater Vulnerability, Assessment and Mapping Selected papers from the Groundwater, Vulnerability Assessment and Mapping, International Conference, Ustron, Poland, 2004, UNESCO Consultant and Chairman of IAH Commission on Groundwater Protection, Prague, Czech Republic / New York /Philadelphia. c 2007 Taylor and Francis Group, London, UK.
9-Stephen J, Carleton G (2005) Hydrogeology and Simulated Effects of Ground-Water Withdrawals, Kirkwood-Cohansey Aquifer System, Upper Maurice River Basin Area, New Jersey, Scientific Investigations Report 2005-5258, U.S. Department of the Interior, U.S. Geological Survey.48P.
10-Fetter C (1988) Applied Hydrogeology. Merrill Publishing Columbus, OH, pp 592.
11-Heath R (2004) Basic Groundwater Hydrology, US Geological Survey water supply. Paper 2220, tenth printing ,ISBN-0-607-68973-0, 91 P.
12-Freeze R, Cherry J (1987) Groundwater. Prentice-Hall International, London, UK, pp 524.
13-Weight W (2004) Manual of applied Hydrogeology, Mc Graw-Hill, Professional Engineering copy right, 553p.
14-William M, Thomas E, Franke O (1999) Sustainability of Ground-Water Resources, U.S. Geological Survey Circular 1186, Denver, Colorado; U.S Government Printing Office, Free on application to the U.S. Geological Survey Branch of Information Services, Box25286 Denver, CO 80225-0286 Library of Congress Cataloging-in-Publications Data .
15-Todd D and Mays L (2005) Groundwater Hydrology, John Wiley and Sons, Inc. Third editions. 652 p.
16-Hamza N (2007) Geomorphology of the Iraqi western desert, Iraqi Bulletin of Geology and Mining, ISSN1811-4539, Special Issue2007, State Company of Geological Survey and Mining, pp9-29. Baghdad.
17-Hamza N (1997) Geomorphological Map of Iraq, Scale 1: 1 000 000. GEOSURV, Baghdad, Iraq.
18-Gems/Grid of United Nation Environments Programme (1991) in world Environment Day 2006, Status of Desertification and implementation of the United
Nation Plan of Action to Combat Desertification. (m5-files/Unep-status. Html).
19-CDS (2010) Hydrogeologic evaluation of Mullusi aquifer and groundwater properties within Dhabaa region east of Rutba, Internal Report, Al-Anbar Univ. Center of desert studies, 170 p.
20-Consortium Yugoslavia (1981) Regional hydro geological study for block No.5 (Rutba area) &for block No.7 (Ramadi-Ana-K-160), Unpubl. Study. Ministry of Irrigation.
21-Al-Jabbari M, Hassan Q, Imad M (2002) The Water Resources In Euphrates Basin, Unpublished Study, Ministry of Agriculture, 524.P.
22-ACSAD (1983) Groundwater Resources of Al-Hamad Basin, No.13, Final Report, Annex-4 Al-Hamad Basin Studies, Damascus (In Arabic).
23-Mazor E, Nativ R (1992) Hydraulic calculation of groundwater flow velocity and age: examination of the basic premises. Journal of Hydrology 138, 211–222.
24-U.S.EPA (1989) Intérim Final Guidance on Statistical Analysis of Groundwater Monitoring Data at RCRA Facilities, April, 1989.
25-Walton W (1970) Groundwater Resource Evaluation. Mc. Graw-Hill series. 664 p.
26-Thornhill T (1989) Accuracy of depth to water measurements, U.S. EPA Superfund Groundwater Issue, EPAu540u4-89-002, Robert S. Kerr Environm- ental Research Laboratory, Ada, OK, 3 pp, 1989.
27-Plazak D (1994) Differences between water level probes, GW. Monitoring and Remediation, 14(1), 84 pp.
28-Nielsen D, Nielsen G (2005) The essential hand book of groundwater sampling. CRC Press Taylor & Francis Group 6000 Broken Sound Parkway NW, Suite 300 Boca Raton, FL 33487-2742 , 326 P.
29-Driscoll G (1986) Groundwater and Wells, Johnson Division, St. Paul, MN, 1089 pp.
30-Barcelona J, Gibb P, Helfrich A, Garske E (1985) Practical Guide for Groundwater Sampling, EPA-600u2-85104,U.S, EP Agency, Robert S. Kerr Environ-mental Research Laboratory, Ada, OK, pp. 78-80.
31-Bollen bach W (1975) Groundwater and wells, A reference book for the water well industry, 4th. printing, Johnson Division, UOP Inc. Saint Paul, 440 p.
32-Nielsen D (2006) The Practical Handbook of Environ-mental Site Characterization and Groundwater monitoring, second edition, CRC Press/Taylor and Francis Group, Boca Raton, FL,1318 pp.
33-Turner, A. K, 1991; Three-dimensional modelling with geoscientific information systems, NATO ASI series C: mathematical and physical sciences, vol. 354, Kluwer, Dordrecht, The Netherlands, 443 pp.
34-Berg R, Russel H, Thorleifson L (2009) Introduction: three dimensional geologic mapping-international pers-pective. Three dimensional Geologic Mapping Work-shop GSA Portland Oregon.(http://www.isgs.uiuc .edu/research/3DWorkshop/2009/workshop.shtml). Cited May 2011.
35-McKay E (2011) Illinois S. geological Survey (29011) Three-dimensional geological mapping for ground water applications workshops.
http://www.isgs.uiuc.edu/research/3DWorkshop/index. shtml. Cited May 2011.

J. of University of Anbar for Pure Science: Vol. :No. : ISSN:1991-8941
36-Jasim S, Goff J (2006) Geology of Iraq, Published by
Dolin, Prague & Moravian Museum Brno. Printed in (Zech. Repub.), ISBN 80-7028-287-8.
37-Al-Mubarak M (1996) Regional geological setting of the central part of the Iraqi western desert. Iraqi Geological Journal Vol.29, p.64-83.
38-Fouad S (2007) Tectonic and Structural Evolution of the Iraqi Western Desert. Iraqi Bulletin of Geology and Mining ISSN 1811-4539, Special ISSUE. SCGSM. P29-51.
39-Al-Bassam K, Al-Azzawi A, Dawood R, Al-Bedaiwi J (2004) Subsurface study of the pre-Cretaceous regional unconformity in the western desert of Iraq. Iraqi Geological Journal, Vol.32/33, p(1-25).
40-Al-Mubarak M, Amin R (1983) Report on the regional geological mapping of the eastern part of the western desert and western part of the southern desert. geosurv. int. Rep. No. 1380.
41-Al-Naqib S, Said I, Taha Y, Al-Sharbati F, Yakta S, Hussien M, Yacoub I, Al-Mukhtar L(1986) Detailed Geological survey of Rutba area. geosurv. Int. Rep. No.1560.
42-Sessikian V, Mahmud B (2007) Stratigraphy of the Iraqi western desert. IBGM, ISSN 1811-4639, Special ISSUE, SCGSM, P51-125.
43-Al-Azzawi A, Dawood R (1996) Report on detailed geological survey in North West of kilo-160, Rutba area. Geosurv.int.Rep.No.2491.
44-Hussien B (2010,a) Application of environmental isotopes technique in groundwater recharge within Mullusi carbonate aquifer-West Iraq. Journal of Iraqi desert studies ISSN:1994-7801, Vol.2, No.2. Congress, 2010.
45-Hussien B (2010,b) Hydrogeologic condition within al-Anbar governorate.
Journal of Anbar University for Pure Science. ISSN: 1994-7801 volume.4, No.3, pp97-111.
46-Araim H (1990) Regional Hydrological Map of Iraq. Scale 1: 1 000 000, GEOSURV.
47-Hassan A, Zeki N (1982) Water Availability Periods and water Balance parameters - JRAWR, NOl, 1, No. 1, Apnt1982 council for Scientific Research, Baghdad, Iraq.
48-Laboutka M (1974) The hydrogeological tables and data. The basic instructions No.3 Report No.8. National Iraqi Minerals Company. Baghdad. 1974.
49-Helsel D, Hirsch R (2002) Chapter A3, Statistical Methods in Water Resources, Techniques of Water- Resources Investigations of the United States Geological Survey, Book 4, Hydrologic Analysis and Interpretation. Publication available at:
http://water.usgs.gov/pubs/twri/twri4a3/.510 p. 50-Bedient P, Huber W (1988) Hydrology and floodplain
analysis. Addison-Wesley Publishing Company. 650p. 51-IAEA (1984) Safety series,No.50, SG-S7, Nuclear power
plants siting, Hydrogeologic Aspects, A Safety Guide, Vienna ,77p .
52-Huisman L(1972) Groundwater recovery, Macmillan pub.
53-Fitts C (2002) Groundwater Science. Elsevier Science Ltd. 450 p.
54-Matthess G (1982) The properties of groundwater. Dep. of E Science. J. Wiley and Sons. Inc. New York, 406 p.
55-Hem J (1970) Study and Interpretation of the chemical characteristics of natural water. Second edition. Geological Survey Water Supply. Paper 1473. Washington. 363 p
56-Collin's A (1975) Geochemistry of oil field water. Development in petroleum science-1, Holland 496 p.
).غرب العراق(160كم -جریان المیاه الجوفیة ضمن نطاق النخیبو كاملیة ألنظمة الخزانات الجوفیةمقاربة هیدروجیولوجیة ت
**نافع عبد االله نصار * عبد صالح فیاض *بیان محي حسین
قسم الجیولوجي- كلیة العلوم** .مركز دراسات الصحراء*
المستخلص
ضـمن التكوینـات الجیولوجیـة ) غـرب العـراق( 160 كم –ق النخیب االجوفیة في النظام الهیدروجیولوجي لنطخلصت الدراسة إلى تحدید ثمانیة خزانات
تمـت دراسـة النظـام . ارضـمة المخـتلط -نجمـة، الهارثـة، الطیـارات، ارضـمة و طیـارات -عبیـد، محیـور -عبیـد، محیـور -ملصـي، ملصـيو شملت خـزان
وجیـة و الطبقـات الهیدروجیولوجي من خالل تحدید الوضع الهیدروجیولوجي و الظروف المحددة للطبقات الحاملة للمیاه من الناحیـة التركیبیـة و الجیومورفول
تمــت مناقشـة و تفســیر المعطیــات .جیولوجیـة وتقیــیم ذلـك باســتخدام المــودیالت الجیولوجیـة والتركیبیــة والطبوغرافیــة والهیدروجیولوجیـة ثالثیــة وثنائیـة األبعــادال
عالقتهـا ت الجیولوجیة و التركیبیة والهیدروجیولوجیة المتمثلة بالمعامالت الهیدرولیكیة للخزانات الجوفیة و حركة المیاه الجوفیة وأنظمة ألجریان و المحددا
خرائط التوزیع المكاني في استخدمت. صفات الخزانات و أعماق المیاه الجوفیة و المیل الهیدرولیكي و سرعة الجریانادات الخزانات الجوفیة و أنواع و بامتد
ضـمن منطقـة ) متـر(و لكـل وحـدة طـول ) x،y(تغیراتهـا باالتجـاهین مقارنة وتفسیر المعطیات الهیدروجیولوجیة من خالل حساب التباینـات المكانیـة ومتابعـة
وتوظیــف نتائجهــا فــي تصــنیف الخزانــات الجوفیــة اســتنادا الــى خصائصــها الهیدرولیكیــة و تحدیــد أفضــل الخزانــات الواقــع الهیــدروجیولوجي الدراســة وتحدیــد
. تغالل میاهه ألغراض متنوعة و یلیه خزان ارضمةالجوفیة الستثمارها مستقبال، اذ كان خزان الطیارات هو االوفر حظا الس
.سرعة المیاه الجوفیة -جریان المیاه الجوفیة - الخزانات الجوفیة-المعامالت الهیدرولیكیة: كلمات المفتاح

J. of University of Anbar for Pure Science: Vol. :No. : ISSN:1991-8941
Copyright © 2022 FDOKUMEN