An integrated hierarchical programming approach for industrial planning
10
Computers ind. Engng Vol. 16, No. 4, pp. 525-534, 1989 0360-8352/89 $3.00+ 0.00 Printed in Great Britain. All rights reserved Copyright © 1989 Pergamon Press plc AN INTEGRATED HIERARCHICAL PROGRAMMING APPROACH FOR INDUSTRIAL PLANNING MOHAMMED A. MUSTAFA Techno-Economics Division, K.I.S.R.P.O. Box 24885, 13109 Safat, Kuwait (Received for publication 14 February 1989) Abstract--This paper describes of prototype of a microcomputer implementation of an integrated multicriteria expert support system (MCESS). The system is an interactive, comprehensive, and easy to use tool to support the manager in project selection and resource allocation. The MCESS combines the capabilities of goal programming, the analytic hierarchy process, net present value analysis, and a spreadsheet. The literature on modeling with spreadsheets and on software integration is reviewed. Goal program- ming, a multicriteria decision making technique is described and the analytic hierarchy process is shown to be able to overcome some of its limitations. The structure of the MCESS is described. An illustration of its use in industrial planning is presented. I. INTRODUCTION Computers have always been identified as useful tools for performing the modeling process in the decision making environment. However, the increasing power and availability of microcomputers have made computer modeling more useful than ever for decision support. Microcomputer-based modeling has several advantages over the use of larger, mainframe computers despite the greater computation capability of the latter: (1) Mainframe computers have limitations in terms of accessibility. These limitations hinder the modeling process which is dynamic in nature. Recent advancement in microcomputer hardware and software have substantially increased the accessibility to sophisticated models and has reduced the response time required for feedback, which is an essential feature of creative and dynamic modeling [1]. (2) Microcomputers provide the privacy that strategic planning requires [2]. (3) Microcomputers offer advantage in terms of the cost of computing, the scheduling of batch jobs, and the ability to process the output of models [3]. (4) Microcomputers are easy to use. Ease-of-use encourages interested non-computer specialists to do decision modeling. (5) The capability of presenting information graphically in an interactive mode is a valuble feature of microcomputers and therefore of microcomputer-based modeling [1]. The tremendous possibilities for individually developed applications of electronic spreadsheet packages have had a major impact on the microcomputer revolution [4]. Similarly, electronic spreadsheets would not have their current popularity and wide use if microcomputers were not readily available. Thus, the two have contributed to each other's success. While electronic spreadsheets were originally introduced as financial planning and analysis tools, microcomputer-based electronic spreadsheets have proven to be versatile tools in a variety of disciplines [5]. Not the least of these is in the area of modeling for decision support. Bodily [6] described spreadsheet modeling as a "stepping stone" in decision modeling. He states that "... the spreadsheet has become the point of convergence of two significant parties. One is the non-specialist user, who for the first time has discovered modeling and its benefits. The other is the operations research or management science specialist who has been modeling right along, but with languages that lacked the immediacy and the impact of the spreadsheet and personal computer graphics. The spreadsheet has influenced how both parties think. It brings greater rigor and productivity to the nonspecialist. The MS/OR (management science/operations research) specialist is better able to respond to the needs of the user because of the spreadsheet". 525
-
Upload
independent -
Category
Documents
-
view
8 -
download
0
Transcript of An integrated hierarchical programming approach for industrial planning

Computers ind. Engng Vol. 16, No. 4, pp. 525-534, 1989 0360-8352/89 $3.00 + 0.00 Printed in Great Britain. All rights reserved Copyright © 1989 Pergamon Press plc
A N I N T E G R A T E D H I E R A R C H I C A L P R O G R A M M I N G
A P P R O A C H F O R I N D U S T R I A L P L A N N I N G
MOHAMMED A. MUSTAFA
Techno-Economics Division, K.I .S.R.P.O. Box 24885, 13109 Safat, Kuwait
(Received for publication 14 February 1989)
Abstract--This paper describes of prototype of a microcomputer implementation of an integrated multicriteria expert support system (MCESS). The system is an interactive, comprehensive, and easy to use tool to support the manager in project selection and resource allocation. The MCESS combines the capabilities of goal programming, the analytic hierarchy process, net present value analysis, and a spreadsheet.
The literature on modeling with spreadsheets and on software integration is reviewed. Goal program- ming, a multicriteria decision making technique is described and the analytic hierarchy process is shown to be able to overcome some of its limitations. The structure of the MCESS is described. An illustration of its use in industrial planning is presented.
I. INTRODUCTION
Computers have always been identified as useful tools for performing the modeling process in the decision making environment. However, the increasing power and availability of microcomputers have made computer modeling more useful than ever for decision support. Microcomputer-based modeling has several advantages over the use of larger, mainframe computers despite the greater computation capability of the latter:
(1) Mainframe computers have limitations in terms of accessibility. These limitations hinder the modeling process which is dynamic in nature. Recent advancement in microcomputer hardware and software have substantially increased the accessibility to sophisticated models and has reduced the response time required for feedback, which is an essential feature of creative and dynamic modeling [1].
(2) Microcomputers provide the privacy that strategic planning requires [2]. (3) Microcomputers offer advantage in terms of the cost of computing, the scheduling of batch
jobs, and the ability to process the output of models [3]. (4) Microcomputers are easy to use. Ease-of-use encourages interested non-computer specialists
to do decision modeling. (5) The capability of presenting information graphically in an interactive mode is a valuble
feature of microcomputers and therefore of microcomputer-based modeling [1].
The tremendous possibilities for individually developed applications of electronic spreadsheet packages have had a major impact on the microcomputer revolution [4]. Similarly, electronic spreadsheets would not have their current popularity and wide use if microcomputers were not readily available. Thus, the two have contributed to each other's success.
While electronic spreadsheets were originally introduced as financial planning and analysis tools, microcomputer-based electronic spreadsheets have proven to be versatile tools in a variety of disciplines [5]. Not the least of these is in the area of modeling for decision support.
Bodily [6] described spreadsheet modeling as a "stepping stone" in decision modeling. He states that " . . . the spreadsheet has become the point of convergence of two significant parties. One is the non-specialist user, who for the first time has discovered modeling and its benefits. The other is the operations research or management science specialist who has been modeling right along, but with languages that lacked the immediacy and the impact of the spreadsheet and personal computer graphics. The spreadsheet has influenced how both parties think. It brings greater rigor and productivity to the nonspecialist. The MS/OR (management science/operations research) specialist is better able to respond to the needs of the user because of the spreadsheet".
525

526 MOHAMMED A. MUSTAFA
While electronic spreadsheets provide excellent decision support capabilities, they have their limitations. Spreadsheets, for example, have no "optimization" capability. Although the automatic recalculation feature of the spreadsheets allows managers to evaluate quickly and easily different scenarios, this can be described as only a "quasi-optimization" capability of spreadsheets [5].
On the other hand, decision sciences (DS) have many techniques capable of aiding managers to obtain truly "optimal" solutions for their complex problems including those of project selection and resource allocation. Managers, however, argue that these techniques have several limitations. These limitations include:
(1) The rigid structure of the techniques imposed by their algorithms makes these techniques difficult to apply to specific decision problems.
(2) Implementation is time consuming while managers are time constrained. (3) Many of these tools are constrained to a single objective and a single unit of measure.
Managers, however, face decision problems with multiple, often conflicting objectives and many different units of measure.
(4) Managers have a priority structure associated with their multiple objectives. These priorities are subject to change based on feedback. Most of the decision sciences techniques do not accommodate this type of information.
(5) The techniques do not provide the managers with a framework to help think through choices. (6) They do not allow the managers to utilize subjective information during the model building
phase as well as in the solution generation phase [7].
Integrating microcomputer-based spreadsheets and decision sciences optimizing techniques seems to be the logical step for many managers. This integration converts these techniques into powerful decision support systems that are more usable and more useful for managers.
In Section 2 of this paper, we review the published literature on the issues of modeling with spreadsheet; goal programming (GP) as a multicriteria decision making tool; the analytic hierarchy process (AHP) as a tool to overcome some of the GP limitations; and expert support systems. Section 3 introduces a new approach that integrates the capabilities of a spreadsheet, GP, AHP and net present value analysis (NPV) in microcomputer-based multicriteria expert support system (MCESS). An illustration of the use of the MCESS in industrial planning is also described. Section 4 contains the conclusions of this paper.
2. SURVEY OF RELATED LITERATURE
2. I. Use of electronic spreadsheets Jot modeling In this part of the paper we will review literature that shows how spreadsheets have been used
for modeling and how they can be combined with software application programs for decision sciences (DS) techniques. Such modeling can take one of the following forms [6, 8]:
(a) Modeling within the spreadsheet. In this form of modeling, the spreadsheet language itself can be used to implement the DS technique. With the help of the "Macro" capability of the spreadsheets a number of commands can be initiated with a single key stroke. Examples of this type of modeling can be found in Partar [9]; Masri and Moodie [10]; Bammi and Padelford [4]; Kuo and Folkers [11]; and Godin [12].
(b) Separate software. This refers to stand-alone software that implements the DS technique and can be linked to the spreadsheet. Linkage here refers to the limited capability of reading spreadsheet files so as to get data and display results back into the spreadsheet files. Software packages under this category include VINO [13] and What's Best [14].
(c) Integrated software. This form of modeling involves the integration of a spreadsheet with one or more DS techniques in one package using a software integrating program. Examples of such programs are DESQview from Quarterdeck, Windows from Microsoft, and TopView from IBM. Despite their differences, these programs share a major goal, to relieve the user of the need to interact directly with the computer operating system (DOS). By allowing windowing, switching, and cut and paste operations, these systems can provide much of the convenience of integrated packages without locking the user into a single package.
An integrated hierarchical programming approach for industrial planning 527
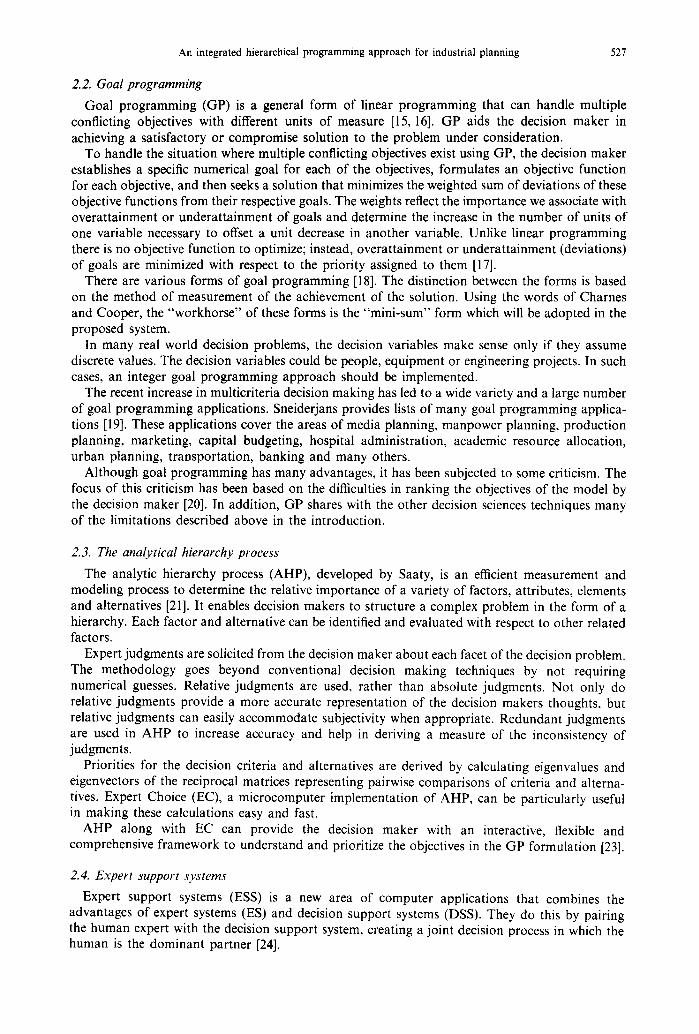
2.2. Goal programming
Goal programming (GP) is a general form of linear programming that can handle multiple conflicting objectives with different units of measure [15, 16]. GP aids the decision maker in achieving a satisfactory or compromise solution to the problem under consideration.
To handle the situation where multiple conflicting objectives exist using GP, the decision maker establishes a specific numerical goal for each of the objectives, formulates an objective function for each objective, and then seeks a solution that minimizes the weighted sum of deviations of these objective functions from their respective goals. The weights reflect the importance we associate with overattainment or underattainment of goals and determine the increase in the number of units of one variable necessary to offset a unit decrease in another variable. Unlike linear programming there is no objective function to optimize; instead, overattainment or underattainment (deviations) of goals are minimized with respect to the priority assigned to them [17].
There are various forms of goal programming [18]. The distinction between the forms is based on the method of measurement of the achievement of the solution. Using the words of Charnes and Cooper, the "workhorse" of these forms is the "mini-sum" form which will be adopted in the proposed system.
In many real world decision problems, the decision variables make sense only if they assume discrete values. The decision variables could be people, equipment or engineering projects. In such cases, an integer goal programming approach should be implemented.
The recent increase in multicriteria decision making has led to a wide variety and a large number of goal programming applications. Sneiderjans provides lists of many goal programming applica- tions [19]. These applications cover the areas of media planning, manpower planning, production planning, marketing, capital budgeting, hospital administration, academic resource allocation, urban planning, transportation, banking and many others.
Although goal programming has many advantages, it has been subjected to some criticism. The focus of this criticism has been based on the difficulties in ranking the objectives of the model by the decision maker [20]. In addition, GP shares with the other decision sciences techniques many of the limitations described above in the introduction.
2.3. The analytical hierarchy process
The analytic hierarchy process (AHP), developed by Saaty, is an efficient measurement and modeling process to determine the relative importance of a variety of factors, attributes, elements and alternatives [21]. It enables decision makers to structure a complex problem in the form of a hierarchy. Each factor and alternative can be identified and evaluated with respect to other related factors.
Expert judgments are solicited from the decision maker about each facet of the decision problem. The methodology goes beyond conventional decision making techniques by not requiring numerical guesses. Relative judgments are used, rather than absolute judgments. Not only do relative judgments provide a more accurate representation of the decision makers thoughts, but relative judgments can easily accommodate subjectivity when appropriate. Redundant judgments are used in AHP to increase accuracy and help in deriving a measure of the inconsistency of judgments.
Priorities for the decision criteria and alternatives are derived by calculating eigenvalues and eigenvectors of the reciprocal matrices representing pairwise comparisons of criteria and alterna- tives. Expert Choice (EC), a microcomputer implementation of AHP, can be particularly useful in making these calculations easy and fast.
AHP along with EC can provide the decision maker with an interactive, flexible and comprehensive framework to understand and prioritize the objectives in the GP formulation [23].
2.4. Expert support systems
Expert support systems (ESS) is a new area of computer applications that combines the advantages of expert systems (ES) and decision support systems (DSS). They do this by pairing the human expert with the decision support system, creating a joint decision process in which the human is the dominant partner [24].
528 MOHAMMED A. MUSTAFA
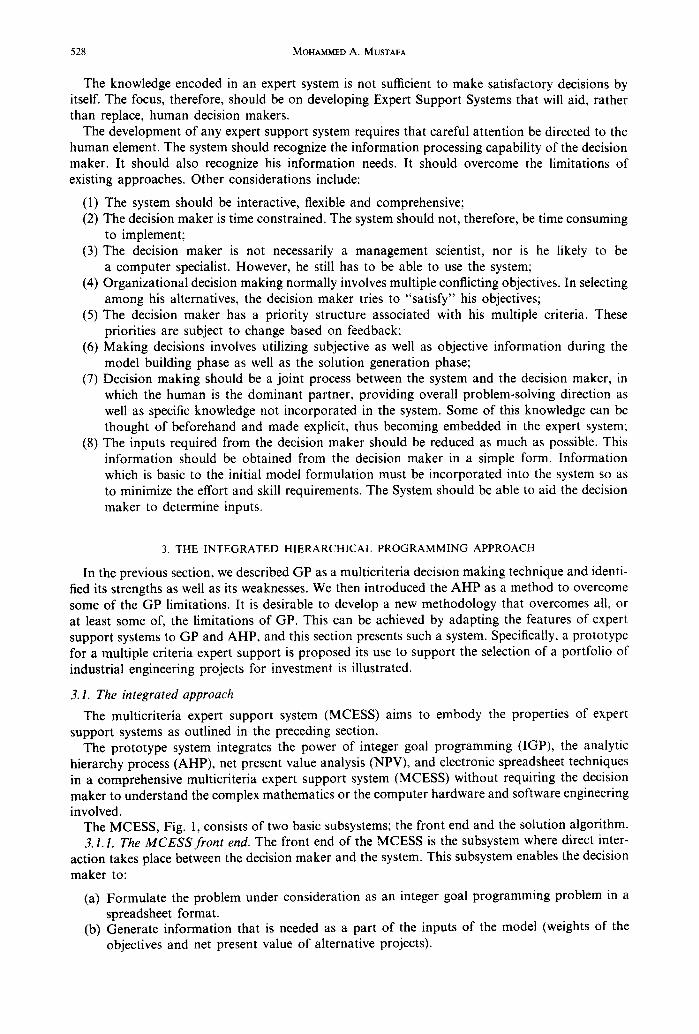
The knowledge encoded in an expert system is not sufficient to make satisfactory decisions by itself. The focus, therefore, should be on developing Expert Support Systems that will aid, rather than replace, human decision makers.
The development of any expert support system requires that careful attention be directed to the human element. The system should recognize the information processing capability of the decision maker. It should also recognize his information needs. It should overcome the limitations of existing approaches. Other considerations include:
(1) The system should be interactive, flexible and comprehensive; (2) The decision maker is time constrained. The system should not, therefore, be time consuming
to implement; (3) The decision maker is not necessarily a management scientist, nor is he likely to be
a computer specialist. However, he still has to be able to use the system; (4) Organizational decision making normally involves multiple conflicting objectives. In selecting
among his alternatives, the decision maker tries to "satisfy" his objectives; (5) The decision maker has a priority structure associated with his multiple criteria. These
priorities are subject to change based on feedback; (6) Making decisions involves utilizing subjective as well as objective information during the
model building phase as well as the solution generation phase; (7) Decision making should be a joint process between the system and the decision maker, in
which the human is the dominant partner, providing overall problem-solving direction as well as specific knowledge not incorporated in the system. Some of this knowledge can be thought of beforehand and made explicit, thus becoming embedded in the expert system;
(8) The inputs required from the decision maker should be reduced as much as possible. This information should be obtained from the decision maker in a simple form. Information which is basic to the initial model formulation must be incorporated into the system so as to minimize the effort and skill requirements. The System should be able to aid the decision maker to determine inputs.
3. THE INTEGRATED HIERARCHICAL PROGRAMMING APPROACH
In the previous section, we described GP as a multicriteria decision making technique and identi- fied its strengths as well as its weaknesses. We then introduced the AHP as a method to overcome some of the GP limitations. It is desirable to develop a new methodology that overcomes all, or at least some of, the limitations of GP. This can be achieved by adapting the features of expert support systems to GP and AHP, and this section presents such a system. Specifically, a prototype for a multiple criteria expert support is proposed its use to support the selection of a portfolio of industrial engineering projects for investment is illustrated.
3. I. The integrated approach
The multicriteria expert support system (MCESS) aims to embody the properties of expert support systems as outlined in the preceding section.
The prototype system integrates the power of integer goal programming (IGP), the analytic hierarchy process (AHP), net present value analysis (NPV), and electronic spreadsheet techniques in a comprehensive muiticriteria expert support system (MCESS) without requiring the decision maker to understand the complex mathematics or the computer hardware and software engineering involved.
The MCESS, Fig. 1, consists of two basic subsystems; the front end and the solution algorithm. 3. I.I. The MCESSfront end. The front end of the MCESS is the subsystem where direct inter-
action takes place between the decision maker and the system. This subsystem enables the decision maker to:
(a) Formulate the problem under consideration as an integer goal programming problem in a spreadsheet format.
(b) Generate information that is needed as a part of the inputs of the model (weights of the objectives and net present value of alternative projects).

An integrated hierarchical programming approach for industrial planning
FRONT END SOLUTION
529
Input/Output Interface Component
it" I ModeT Formulation: I I Integer Goal
~ ] - - "~'i Programming (IGP) I
I
I
_ __..~
I
I Reports & i Graphics Generation i
i .m.lm
I
I
I.gt i I
Rankinq Component
, Weighs Objectives Using AHP
NPV Component i I Calculation of
~- NPV for Various i Projects i
Solution
Algorithm
Fig. I. The MCESS framework.
(c) Initiate the integer goal programming solution algorithm. (d) Display solution results on the computer display in an interpretable way. (e) Prepare and print results in report from as well as in graphical form. (f) Carry out sensitivity analyses until the decision maker is satisfied with the achievement level
obtained for various objectives.
In order to achieve these functions, the front end integrates three basic components:
(i) An interface that provides the input/output interface between the decision maker and the system. To accomplish the functions involved, the MCESS utilizes Lotus 1-2-3 program [25]. A preformulated spreadsheet file contains the IGP formulation: The inputs required to complete the preformulated model will, therefore, be in a spreadsheet format. Similarly, the outcome of the solution of the IGP model will be in a spreadsheet format. Lotus will also be used to obtain reports and graphical presentations.
(ii) A ranking component that aids the decision maker in gaining a better understanding of his objectives and to generate the priorities (weights) he associates with the objectives. The weights are normally part of the inputs of the model. For this purpose, Expert Choice, a microcomputer implementation of the analytic hierarchy process, is utilized.
(iii) An "NPV" component that enables the decision maker to determine the net present value for each project under consideration when necessary. It is designed within a Lotus 1-2-3 spreadsheet. The decision maker can easily transfer data from one component to another.
3.1.2. The solution algorithm. The Solution Algorithm subsystem works in the "background" of the MCESS and is initiated from the front end subsystem. It has the capability to solve the integer linear goal programming problems. The system utilizes a part of the VINO program (VINO-123) for this purpose [13]. VINO is an implementation of the revised simplex method algorithm and has the capability to accept certain spreadsheet files.
The prototype system utilizes the DESQview (DV) program to integrate the various components of the system. This is achieved by creating four different windows;
(a) The first window is used to depict and display the integer goal programming formulation in the Lotus spreadsheet format.
(b) The second window displays the graphics part of the I/O interface component, which utilizes the Lotus Printgraph program.

530 MOHAMMED A. MUSTAFA
(c) The third window contains the ranking component, which utilizes the EC program. (d) The fourth window displays the solution algorithm, which uses a part of the VINO program.
The macro capability of DV has been used to program the MCESS in order to:
(i) Automate the switching from one component to another or from one window to another in one step using a function key.
(ii) Automate the process of data transfer from the ranking component and NPV component to the input matrix of the IGP model.
(iii) Automate the process of model solution. The functions of opening the solution algorithm window (i.e. initiating the solution algorithm component), sending the model formulation for solution as a spreadsheet file, optimizing the model, saving the solution as a spreadsheet file, closing the solution algorithm window (i.e. terminating the solution algorithm component) and displaying the output in the input/output interface component in the same format are performed in response to a single function key.
(iv) Automate the process of preparing reports and graphical representation of results.
3.2. Illustrative problem: resource planning in an industrial firm
The system can be best understood via an illustrative problem. This section describes a real world selection and resource allocation problem and the steps followed to formulate and solve the problem, as a typical application with the MCESS support. The steps and responsibilities are shown in Table 1.
The table shows that using MCESS in a typical application involves both the decision maker and the system. The decision maker is responsible for defining the problem, accessing the system, identifying organizational objectives, establishing the desired level of achievement of the objectives and providing the list of the projects under consideration. The MCESS, which already contains the model formulation, solves it after the inputs are entered. It also provides managerial reports and graphical presentation of results. The decision maker and the MCESS share the responsibility to rank the objectives, provide or generate the parameters of the projects and carry out the solution analysis. As the table also shows, in the iterative process of looking for the best solution, the decision maker may bypass some steps.
3.2.1. Definition of the problem. The managers of the American Industrial Corporation (AIC) are considering 10 industrial opportunities. The problem is a case of capital budgeting where multiple conflicting objectives exist. Furthermore, investment projects under consideration are indivisible. Thus the problem requires an integer zero-one GP approach.
3.2.2. Formulation of the model. The MCESS provides the decision maker with a preprepared spreadsheet format that depicts the integer goal programming model. The model is built so that minimal or no modifications need to be made by the decision maker. The format contains input matrix, output matrix and a decision column ("Selected").
The input matrix of the model has two basic groups of inputs. The first group is related to the organizational objectives to be achieved (4 objectives in this problem). The decision maker is expected to enter the description, the desired level of achievement, and the relative weight of each objective (see Table 2). The ranking component of the front end is used to "think through" the organizational objectives and to help the decision maker prioritize them and determine their relative weights. In this case, the list of objectives includes:
(1) Limit the total investment cost to the allocated budget of $1000 (in $1000). (2) Limit the number of managerial staff for the new projects to 100. (3) Maximize net present value of the selected projects. (4) Secure a satisfactory level of profit after tax. The desired after tax profit is $150 (in $1000).
For example, the desired level of achievement of the first objective represents the budget of the corporation, which is $1000 (in $1000) in this problem. The weight associated with this objective, as determined by the decision maker with the support of the ranking component, was (0.185). It represents the relative importance of the cost objective when compared with the rest of the objectives.

A n in t eg ra t ed h i e r a r ch i ca l p r o g r a m m i n g a p p r o a c h for indus t r i a l p l a n n i n g 531
Table 1. Steps and responsibilities in the typical MCESS application
Steps Responsibility
Define the problem Access the MCESS Select the objectives Establish the desired level of achievement of the objectives Rank the objectives Provide the list of projects Provide or generate the parameter values Solve the problem formulation Generate reports and graphs Solution analysis
DM = Decision maker. MCESS = The Multicriteria Expert Support System.
DM DM DM DM
MCESS/DM DM
MCESS/DM MCESS MCESS
DM/MCESS
The second group of inputs is related to the alternatives (the 10 projects in this example). A list of the projects and the coefficients which represent the contribution, or influence, of each alternative project to each objective (see Table 2). In this problem, the initial cost of project No. 1 is $375 (in thousands).
The NPV component can be used to calculate the NPV of the various alternatives if needed. The component provides a preformulated spreadsheet in which the decision maker has to enter the name of the project, the annual discount rate, the compounding period (a year or a month), and the positive and negative cash flows for each period of the life of the project.
The output matrix, Table 3, contains rows for objective constraints, underachievement, overachievement, actual achievement ratio, and the achievement function. The cells of the objective constraints row contain the major part of the goal programming formulation, the goals. Every cell has a formula that corresponds to an objective. These cells are constrained to zero. They are omitted from the output matrix shown in Table 3 because they do not provide any useful information to the decision maker. The cells of the rows of underachievement and overachievement are defined by the system as decision variables (not necessarily integers). They are, in addition to the cells of the "Selected" column, the variables to be manipulated by the solution algorithm to obtain a "best" solution. The cells of the achievement ratio have the ratio of the actual achievement of various objectives to its desired level of achievement. The achievement function is the weighted sum of the deviation of the various objectives from the desired level of achievement. In goal programming, we seek to minimize this sum.
The cells of the "Selected" column are integer decision variables. They are defined in a way to make the solution algorithm try to manipulate the values of these variables in order to come up with a "best" solution.
3.2.3. Solution, report generation and graphical representation of the model. As soon as the formulation of the problem is completed, the solution algorithm of the MCESS is initiated by using
Enter organizational objectives:
Table 2. Input matrix of the model
Objective No. I Objective No. 2 Objective No. 3 Objective No. 4
Minimize Minimize Maximize initial management net present Maximize
Description cost need value profits
Description abbreviation: Min. cost Min. MGT Max. NPV Max. profit Desired achievement level: 1000.000 100.000 1000.000 150.000 Weight of objectives: 0.185 0.071 0.355 0.388
Enter the name of the project, probability of award and its contribution or influence on each of the objectives shown:
Contribution to Contribution to Contribution to Contribution to Project name object. No. I object. No. 2 object. No. 3 object. No. 4
IE No. 1 375 31 215 56 IE No. 2 350 29 150 46 IE No. 3 100 20 40 7 IE No. 4 380 32 280 2 IE No. 5 500 42 365 15 IE No. 6 440 37 220 20 IE No. 7 330 27 115 5 IE No. 8 150 21 65 10 IE No. 9 210 17 95 10 IE No. 10 600 50 475 0
C A I .E 16,4--E

532 MOHAMMED A. MUSTAFA
Table 3. Output matrix of the model
Objectives dexription: Objective No. 1 Objective No. 2 Objective No. 3 Objective No. 4
Minimize Minimize Maximize initial management net present Maximize cost need value profits
Description abbreviation: Min. cost Min. MGT Max NPV Max. profit Desired achievement level: 1000.000 100.000 1000.000 150.000 Weight of objectives: 0.185 0.071 0,355 0,388
Selected Contribution to Contribution to Contribution to Contribution to Project name (1 = Y, 0 = N) Object. No. 1 Object. No. 2 Object. No. 3 Object. No. 4
IE No. I 0 0 0 0 0 IE No. 2 I 350 29 150 46 IE No. 3 0 0 0 0 0 IE No. 4 0 0 0 0 0 IE No. 5 1 500 42 365 15 IE No. 6 0 0 0 0 0 IE No. 7 0 0 0 0 0 IE No. 8 I 150 21 65 10 IE No. 9 0 0 0 0 0 IE No. 10 0 0 0 0 0
Under achiev, of objects 0.00 8.00 420.00 79.00 Over achiev, of objects 0.00 0.00 0.00 0,00 Actual achiev, of objects 1000.00 92.00 580.00 71 00 Achievement ratio 1.00 0,92 0.58 0.47 Achievement function 179.75
one command. The file containing the model is sent for solution. When a solution is obtained, the results are saved and displayed on the screen.
When the solution is obtained, three reports can be obtained:
(1) The report of the inputs of the model (Table 2). (2) The report of the outputs of the model. This includes a list of the projects selected and the
achievement ratio of each objective. Report 2 is shown in Table 3. The projects selected are IE No. 2, IE No. 5 and IE No. 8.
(3) A graphical representation of the achievement level of the various objectives is shown in Fig. 2.
3.2.4. Sensitivity analysis. One part of the results provides recommendations to the decision maker about the portfolio of projects to be selected. Another part of the results shows the level of achievement of the various objectives. If the decision maker determines that the levels of
1.0
0.9
0.8
0.7 o
' - 0.6
~ 0.5
~ 0.4
0.5
0.2 ~
O.q
0 Min cost
L
i
/ / / / / / / / / / / / / / / / / / / /~ / / / / / / /
/ / / / / / / / / / / / / / / / / / / / / I I I I I I I
/ / I I
Min MGT Max NPV Mox profit
Objectives Fig. 2. A c h i e v e m e n t o f object ives.

An in tegra ted hierarchical p r o g r a m m i n g a p p r o a c h for indus t r ia l p l ann ing
Table 4. The selected projects with various budgets with no overspending allowed
Project
Budget ($ thousand) $1000 $900 $800
Selected Selected Selected (1 =Y, 0 = N ) (1 = Y , 0 = N ) (1 = Y , 0 = N )
IE No. 1 0 0 0 IE No. 2 1 0 0 IE No. 3 0 I 0 IE No. 4 0 0 0 IE No. 5 1 0 0 IE No. 6 0 I 1 IE No. 7 0 0 0 IE No. 8 1 1 1 IE No. 9 0 1 1 IE No. 10 0 0 0
533
achievement of some or all objectives as determined by the solution do not reflect the organizational environment, he will then be able to carry out a sensitivity analysis. Different scenarios with different objectives, weights, and desired level of achievements; different projects and parameters (contribution or influence); etc., can be formulated. Every time a new model is formed, it can be solved and the results displayed. Reports are printed and new graphical presentations are produced and printed. The process can be repeated time after time until the decision maker is satisfied that the achievement ratios reflect the organizational needs.
To illustrate, the desired level of achievement of the "Minimize Initial Cost" objective was reduced from the original value of $1000 to $900 and then to $800 thousand and no overspending was allowed. The model was then solved for each of these new values. In the first case, the selected projects were IE No. 3, IE No. 6, IE No. 8 and IE No. 9. In the second case projects IE No. 6, IE No. 8 and IE No. 9 were selected. These results are shown in Table 4.
4. S U M M A R Y A N D C O N C L U S I O N S
The primary objective of this study was to design, develop, and test a prototype for a new management expert support system that would be understandable, easy to use and interpret, and effective. The multicriteria expert support system developed combines the capabilities of goal programming, the analytic hierarchy process, net present value analysis, and a spreadsheet into an integrated microcomputer-based system.
The MCESS architecture is defined in terms of two highly integrated subsystems: the front end and the solution algorithm. The front end is the subsystem in which interaction between the decision maker and the system takes place. It integrates three basic components: the interface component, the ranking component, and the net present value analysis component. The interface component contains the formulation for integer goal programming in a spreadsheet format. While the IGP model is preformulated, the decision maker has to provide some of the model parameters and help in deriving the rest of them. The solution algorithm works in the background of the system and can be initiated from the front end. It solves the IGP problem, and the results are displayed in a spreadsheet format that is easy to interpret. The MCESS supports report generation, graphics presentation, and sensitivity analysis. It also allows the decision maker to incorporate their expertise and experience into the formulation of the model and improvement of the solution.
The decision maker does not formulate the integer goal programming model. The model is preformulated. The decision maker has to fill in the input matrix and help in deriving the necessary inputs of the particular problem.
The MCESS can be used to address a specific kind of problems. The system can be useful to evaluate and allocate resources among investment projects especially when multiple conflicting objectives are to be considered. In order to test the system, it was used to evaluate and allocate resources among a number of industrial projects. Test results indicate that the system is operational, understandable and easy to use.
Acknowledgements~omments by the Edi to r and the referees o f this j ou rna l are grateful ly acknowledged .

534 MOHAMMED A. MUSTAFA
REFERENCES
1. P. A. Jensen. Modeling with microcomputers for operations research. Computers Opns Res. 13(2/3), 359-366 (1986). 2. G. C. Sekar and R. Ramesh. Microcomputer-based multiple criteria decision support system for strategic planning.
Working Paper No. 660. State University of New York at Buffalo (1986). 3. R. Sharda and C. Somarajan. Comparative performance of advanced microcomputer LP systems. Computers Opns Res.
13(2/3), 131-147 (1986). 4. D. Bammi and J. Padelford. Using spreadsheets for decision analysis. In Impacts of Microcomputers on Operations
Research. (Edited by S. I. Gass, H. J. Greenberg, K. L. Hoffman, and R. W. Langly). Elsevier, New York (1986). 5. J. R. Evans. Spreadsheets and optimization: complementary tools for decision making. Prod. Invent. Mgmt, First
Quarter, 3~46 (1986). 6. S. E. Bodily. Spreadsheet modeling as a stepping stone. Interfaces 16(5), 34-52 (1988). 7. M. A. Mustafa. Microcomputer-based expert support system for engineering project selection and resource allocation,
Proc. of the Annual Meeting of the American Society for Engineering Management. St. Louis, Mo. (1987). 8. C. W. Holsapple and A. B. Whinston. Integrated software for DSS development. In Impacts of Microcomputers on
Operations Research. (Edited by S. I. Gass, H. J. Greenberg, K. L. Hoffman, and R. W. Langly). Elsevier, New York (1986).
9. M. Parlar, Dynamic programming on an electronic spreadsheet. Computers ind. Engng 10(3), 203-213 (1986). 10. S. Masri and C. Moodie. Using an electronic spreadsheet to analyze manufacturing flow systems. Computers ind. Engng
19(2), 183-193 (1985). 11. W. Kuo and R. Folkers. Spreadsheet Programs solve systems dynamics problems. IE, (November, 1986). 12. V. B. Godin, Solving decision tree analysis using IFPS or Lotus. IE, (April, 1987). 13. K. Cunningham and L. Schrage. Optimizing in Spreadsheets with VINO, The Scientific Press, Palo Alto, Calif. (1986). 14. S. Savage. What's Best~Academic, General Optimization, Chicago. Ill. (1986). 15. A. Charnes and W. Cooper. Management Models and the Industrial Application of Linear Programming, 2 Vols. Wiley,
New York (1961). 16. Y. ljiri. Management Goals and Accounting for Control, Rand McNally, Chicago (1965). 17. L. Franz, S. Lee and J. C. Vanthorn. An adaptive DSS for academic resource planning. Decis. Sci. 12(2) (1981). 18. J. Ignizio. Linear Programming in Single and Multiple Objective Systems. Prentice-Hall, New Jersey (1982) 19. M. Sniederjans and N. Kwak. An alternative solution method for goal programming problems: a tutorial. J. Opl Res.
Soc. 33, 247-251 (1982). 20. M. Zeleny. Technical note--The pros and cons of goal programming. Computers Opns Res. 8(4), 357 359 (1981). 21. T. Saaty. Decision Making for Leaders. Wadsworth, Belmont, Calif. (1982). 22. E. Forman and T. Saaty. Expert Choice. Decision Support Software, McLean, Va. (1983). 23. M. A. Mustafa. Multicriteria expert support system for engineering project selection and resource allocation.
Unpublished Doctoral Dissertation, The George Washington University, Washington, D.C. (1987). 24. F. Luconi, T. Malone and M, Scott Morton. Expert systems and expert support systems: the next challenge for
management. Center of Information Research, CISR WP No. 122, MIT, Cambridge, Mass. (1984). 25. Lotus I-2-3, Lotus Development Corporation. Cambridge, Mass (1986).