Generation of Microbial Oil via a Process Engineering Approach
Upload
shoppingmallbestpriceCategory
view
0download
0
1
A new Approach for Process Monitoring
Dr. Subhi R. M. Zebari
Dept. of Computers Systems
Amedi Technical Institute
Foundation of Technical Education/Erbil
Abstract The sequence of processes and threads states during their Life-Cycles (LC) from the creation as a new-process
to its termination (or even Starvation), is very important and must be studied to keep track its traversing.
Users have no idea about what happened during programs execution, this may be a normal situation for
nonprogrammers, but for programmers the structure of the program may prevents the occurrence of different
complexities for processes states sequence if they knew the real events occurred for programs. So, they know what
happening immediately for the process, and have the ability of interference on its states, the programming approach and
consequently the system can be improved.
Pervious works are the general tests and mostly for a certain program language (PL) like Java. So, this work is
useful for all PLs, and it addresses a useful and an accurate approach which enables the user (programmer) to monitor
and track the system-status, each program, each process and each thread in the system and make the suitable changes on
any state during its LC. The software is under-windows & built in pure API-VC++, the monitoring and changes
operations are displayed in very friendly usage GUIs.
1. Introduction Research over the past few years has made significant strides in the development of stealth
attacks and tools and techniques for monitoring the integrity of the kernel. Numerous novel research
challenges have also emerged that show promise towards building more robust and comprehensive
kernel integrity monitors [1].
All applications interact with the operating system and many interact with middleware
services for distributed communication, fault tolerance, security, resource management, and so
forth. Measuring behavior in the layers that supports application execution is crucial to gaining a
complete understanding of the broader system because applications share resources (e.g., memory,
files and devices) via these layers. Complex interactions and dependencies are often hidden and not
obviously understood by the systems engineer. As large-scale systems are integrated together, these
hidden dependencies result in resource conflicts and “causal chains” that lead to unexpected, and
often undesirable, behavior [1].
1.1 Multi-Processes and Multithreaded Techniques The model of thread creation produced in [2], by marking the input places of functions
spawned by ThreadCreate() with an infinite number of tokens. This models the scenario in which
any number of threads could be running concurrently, and deadlock is detected for this scenario. An
architectural description of the multithreaded program was provided by [3], which specifies at a
high level of abstraction the program topology in terms of thread instances and their interactions. In
Windows, the login process and local security authority are processes which run in user-space.
Security reference monitor executed in kernel-space and used to determine whether or not a user
has permission to access a system object [2]. A combination of thread-modular and procedure-
modular reasoning for verifying safety properties of multithreaded programs were described by [4].
In their methodology, the specification of each procedure consisted of an environment assumption
and an abstraction.
In order to make multithreaded programming manageable, programmers often follow a
design principle where they break the problem into tasks which are then solved asynchronously and
concurrently on different threads [5].
2
A public tool for generating and collecting traces in multithreaded environments presented
by [6], which are suitable for simulating and studying Simultaneous Multithreading (SMT) cache
organizations. They have developed a new module for open-source debugging and profiling tool.
To assist developing robust multithreaded software, a thread monitoring system developed by [7]
for multithreaded Java programs, which traced or monitored running threads and synchronization.
They designed a monitoring system which had options to select interesting threads and
synchronized actions. Using this tool, programmers can monitor only interesting threads and
synchronization in more details by selecting options, and can detect a deadlock.
1.2 Monitors The development of monitors was inspired by the class of SIMULA 67, which was itself a
generalization of the procedure concept of ALGOL 60. The basic insight is that all meaningful
operations on data (including its initialization and perhaps its finalization) should be collected
together with the declaration of the structure and type of the data itself; and these operations should
be invoked by procedure calls whenever required by the processes, which share the data. The
important characteristic of a monitor is that only one of its procedure bodies can be active at one
time; even when two processes call a procedure simultaneously (either the same procedure or two
different ones), one of the calls is delayed until the other is completed. Thus, the procedure bodies
act like critical regions protected by the same semaphore [8].
A user monitor program is designed with two function Swap Token laities: adjusting user
memory space allocation and collecting system data. To flexibly adjust the available memory space
for user programs in the experiments, the monitor program requests a memory space of certain
predefined size, and exclude it from the page replacement with the help from the kernel. The
remaining memory is available for executions of application programs in our experiments. The
monitor program will not affect the experiment measurements, because (1) it consumes few CPU
cycles; (2) Its resident memory is excluded from the global page replacement scope, so its memory
usage has no interactions with application programs [1].
A ThreadMon was addressed by [9], which was a monitoring tool for improving the
performance of multithreaded programs by using it to examine various aspects of the many-to-many
(or two-level) threads implementation model. It was shown that the behavior of multithreaded
programs, particularly those running on multiprocessors, often defies intuition when the many-to-
many threads implementation model is used.
2. Background Theory
2.1 Programming and its Relations with Processes and Processors Conventional operating systems treat the CPU as a single indivisible resource, and the CPU
is shared by time-slicing, i.e., allocating CPU time slots to threads. This makes sense for
conventional single-threaded processors, because a thread gets the exclusive use of the entire CPU
while it runs. On chip multithreaded processors, concurrent threads share the CPU’s internal
resources, such as processor caches. Therefore, treating the CPU as an indivisible resource
diminishes the operating system’s control over resource sharing [10].
The ability of a program to concurrently execute multiple regions of code provides
capabilities that are difficult or impossible to achieve with strictly sequential languages. Sequential
object-oriented languages send messages (make method calls) and then block or wait for the
operation to complete [11].

3
2.2 Understanding the Inter-thread and Inter-process communications With many things happening at once in a system, need some way of separating them all out
cleanly so that they are protected from each other and appear to be independent activities. That is a
process. An intuitive definition is just a running piece of code along with all the things that the code
can affect or be affected by. Key aspect of a process: Processes protected from each other. Each
process is given the illusion that it has protected state [12].
The following are summarized definitions produced by Robert Love [13]:
Process ID: Each process is represented by a unique identifier, the process ID (frequently
shortened to pid). The pid is guaranteed to be unique at any single point in time.
idle process: the process that the kernel “runs” when there are no other runnable processes, it has
the pid 0. The first process that the kernel executes after booting the system, called the init process,
has the pid 1.
Process ID Allocation: The kernel allocates process IDs to processes in a strictly linear fashion. If
pid 17 is the highest number currently allocated, pid 18 will be allocated next, even if the process
last assigned pid 17 is no longer running when the new process starts. The kernel does not reuse
process ID values until it wraps around from the top—that is, earlier values will not be reused until
the value in /proc/sys/kernel/pid_max is allocated.
The Process Hierarchy: The process that spawns a new process is known as the parent; the new
process is known as the child. Every process is spawned from another process (except, of course,
the init process). Therefore, every child has a parent. This relationship is recorded in each process’
parent process ID (ppid), which is the pid of the child’s parent. Each process is owned by a user
and a group. This ownership is used to control access rights to resources. To the kernel, users and
groups are mere integer values.
Running a New Process: A different system call is used to create a new process, which initially is
a near duplicate of its parent process. Often, the new process immediately executes a new program.
The act of creating a new process is called forking, and this functionality is provided by the fork( )
system call.
Terminating a Process: A standard function for terminating the current process:
#include <stdlib.h>
void exit (int status);
A call to exit( ) performs some basic shutdown steps, and then instructs the kernel to
terminate the process. This function has no way of returning an error—in fact, it never returns at all.
Therefore, it does not make sense for any instructions to follow the exit( ) call.
The challenges of threads are many. Primary of these challenges is the increased program
complexity caused by the need to synchronize access to shared data structures, the potential for
timing-dependent failures, errors using the programming interface, and the difficulty of debugging
and optimizing the application [14].
In a non-concurrent application, there is only one path (or thread) of execution through the
application’s code. That path starts and ends with the application’s main routine and branches one-
by-one to different methods or functions to implement the application’s overall behavior. There are
two important reasons to have multiple paths of execution in an application [15]:
■ Multiple paths can improve an application’s perceived responsiveness.
■ Multiple paths can improve an application’s real-time performance on multicore systems.
2.3 Infrastructure of Monitoring Operations on Processes and Threads Monitoring is the process of asynchronously (or synchronously) collecting information
about a program’s execution, which can be displayed during the program’s execution or afterwards.
Visualization is the process of displaying monitored information in a concise and meaningful way.
The raw monitored data can be presented directly as a sequence of data values; the dynamic
execution of concurrent programs is significantly more complex than in sequential programs;

4
understanding that complexity is aided by monitoring, visualization and debugging tools.
Furthermore, a concurrent program introduces new kinds of errors, such as race-conditions, livelock
and deadlock, that do not occur in a sequential program [16].
Whenever a thread makes a system call, it transitions (e.g., via a trap) from user space to
kernel space. Invoking system calls for thread management (e.g., thread creation, suspension, or
termination) and synchronization (e.g., mutex or semaphore acquisition) often require such a
transition. System call transitioning code therefore provides a useful interception point at which
process activity can be monitored and a profile of system resource use can be extracted on a per-
thread basis [1]. The threadmon tool uses interpositioning to insert trace code between the user-
level threads library and the application by redefining many of the functions that the library uses
internally to change thread state. This technique is also used for Visualization of Parallel Program
Behavior (VPPB) tool to gather user-level thread information [1]. Another tool known as Trace
Normal Form (TNF) can be used, which generates execution event traces from the Solaris kernel
and user processes. Solaris provides an API for inserting TNF probes into the source code of any
C/C++ program [1].
There are several ways that monitors can mediate all application operations. A traditional
reference monitor is implemented by halting execution before certain machine instructions and
invoking the reference monitor with the instruction as input. An alternate implementation, not
limited by hardware support, runs applications inside an interpreter like JVM that executes the
application code and invokes a reference monitor before each instruction. However, this approach
has unacceptable performance overhead [3], since a cost is incurred on every executed instruction.
An inlined reference monitor is obtained by modifying an application to include the functionality of
a reference monitor [7].
2.4 Microsoft Windows Performance Counters Windows stores the collected values in the registry, which is refreshed periodically.
Developers typically retrieve the data from the registry directly or use an API known as
Performance Data Helper. Windows performance counters can be used to acquire data related to the
running system, which can be correlated with a particular application run. These counters give an
external view of the application, however, and there is no straightforward method of mapping
counter values to logical application events. When each new interface is invoked, the stub receives
the identifier from the thread-specific storage, creates a record with it, and stores a number
identifying its position in the call chain. After control returns to the caller stub, the last record is
generated and the call chain record completed. Whenever a new thread is created by the application,
the parent thread identifier is stored along with the new thread identifier to help identify the logical
call chain in cases where threads are spawned by user-application code [1].
Although of the above abilities, windows registry not brows the CPU usage, CPU time, and
RAM usage (taking in mind that the available RAM can be browsed) for each process or thread in
the system. This is in order to avoid the slow-execution of programs because checking these states
during the programs-running will consumes wasted-time.
So, there will still a need for monitoring the non-browsed properties related with process
and threads at necessary-cases (e.g. when studying states of processes or threads).
3. The Algorithm The algorithm structure for Monitoring-Tracking software is constructed of several stages.
The software is designed according to the main requirements that translate the problems faced by
users and programmers to suitable solutions represent the major tasks to get friendly monitor
software. The monitor tasks handle full-tracking of LC of all processes and threads currently
existing in the system and all related features for each one of them.
The algorithm-structure can be summarized by following steps:

5
1. Detection the main properties of the computer.
2. Checking the instance (current) status of the (available and used) Physical Memory.
3. Number of processes in the system.
4. Memory size of each process (what ever be its state) during its Life-Cycle (LC).
The above steps are related to instance-status of the system. The software also gives the ability of
apply monitoring of testing any wanted program which is called Target Program (TP), as bellow:
5. Apply steps (3 and 4) above for the TP.
6. Interactive Tracking of all threads of TP.
7.Calculate the (CPU) time of each thread.
8.Calculate the Idle-Time (IT) for each process.
9.Calculate the CPU-usage percentage for each thread.
10. Interactive-tracking-status for memory allocation for processes and threads.
11. Killing a process, which:
Slowdown the performance of execution of the TP.
Make common troubles (i.e. long waiting, and …)
12. The software finally will give the user overall computer operating-time (from starting to the
instance moment)
13. Step (13) can apply whenever the user run it (not necessary at the beginning of turn-ON the
computer)
The software is capable to apply the tests for above steps in any duration of time less-than or
greater one second. But as standard one second is usually depended. So, for fourteen seconds we
can monitor the system and get the accurate results which will be appeared on special windows and
at the same time stored in tables that can be retrieved later to check or plot them .
Why using VC++ language for software designing?
1. Most parts of the Windows-System are designed in C or C++ language especially APIs.
2. By C++, we can treat directly with APIs without needing to define them, and hence avoiding
adding additional programming-layer between C++ and APIs.
3. This approach depends completely on APIs without needing to Microsoft-Foundation-Classes
(MFC) library and any other library.
4. In spite of that programming by MFC is simpler than by VC++, but it takes more time in
execution because of the additional programming-layer. So, this work depends on APIs to
provide more speed in execution.
4. Case Studies and Results The system is implemented on Window XP on Pentium 4 processor. And two case-studies
are applied to monitor the system and the tested-program.
The software will detect firstly the main properties of the computer which are:
Processor: 2.5 GHz Core 2 due.
RAM: 4 GByte.
Win XP SP3 Ver. 5.1 Build 2600.
Total RAM usage (1506/4096)
Number of the processes instantly in the system is 74.

6
Table (1): Memory and CPU usage for some of monitored system processes at a moment of time
System
Ram usage 660KB
Threads: Thread Id:0008 Cpu 54%
Thread Id:0016 Cpu 03%
Thread Id:0020 Cpu 06%
Thread Id:0024 Cpu 05%
Thread Id:0028 Cpu 06%
Thread Id:0032 Cpu 03%
Thread Id:0036 Cpu 01%
Thread Id:0040 Cpu 01%
Thread Id:0044 Cpu 01%
Thread Id:0048 Cpu 01%
Thread Id:0052 Cpu 01%
Thread Id:0056 Cpu 01%
Thread Id:0060 Cpu 01%
Thread Id:0064 Cpu 00%
Thread Id:0068 Cpu 00%
Thread Id:0072 Cpu 00%
Thread Id:0076 Cpu 00%
Thread Id:0080 Cpu 00%
Thread Id:0084 Cpu 00%
Thread Id:0088 Cpu 00%
Thread Id:0092 Cpu 00%
Thread Id:0096 Cpu 00%
Thread Id:0100 Cpu 00%
Thread Id:0104 Cpu 00%
Thread Id:0108 Cpu 00%
Thread Id:0112 Cpu 03%
Thread Id:0116 Cpu 00%
Thread Id:0120 Cpu 00%
Thread Id:0124 Cpu 00%
Thread Id:0128 Cpu 00%
Thread Id:0132 Cpu 04%
Thread Id:0140 Cpu 00%
Thread Id:0144 Cpu 00%
Thread Id:0148 Cpu 00%
Thread Id:0152 Cpu 00%
Thread Id:0176 Cpu 00%
Thread Id:0180 Cpu 00%
Thread Id:0184 Cpu 00%
Thread Id:0188 Cpu 00%
Thread Id:0308 Cpu 00%
Thread Id:0312 Cpu 00%
Thread Id:0316 Cpu 00%
smss.exe
Ram usage 400KB
Threads:
Thread Id:1580 Cpu 99%
Thread Id:1632 Cpu 00%
Thread Id:1636 Cpu 00%
csrss.exe
Ram Usage 3,516KB
Threads: Thread Id:1684 Cpu 00%
Thread Id:1688 Cpu 00%
Thread Id:1692 Cpu 10%
Thread Id:1696 Cpu 00%
Thread Id:1708 Cpu 10%
Thread Id:1720 Cpu 03%
Thread Id:1724 Cpu 03%
Thread Id:1772 Cpu 00%
Thread Id:1992 Cpu 10%
Thread Id:2472 Cpu 09%
Thread Id:2480 Cpu 09%
Thread Id:2488 Cpu 09%
Thread Id:3320 Cpu 00%
Thread Id:3192 Cpu 00%
Thread Id:5528 Cpu 00%
Thread Id:4756 Cpu 06%
Thread Id:3456 Cpu 02%
Thread Id:3384 Cpu 02%
Thread Id:5620 Cpu 02%
Thread Id:2364 Cpu 02%
winlogon.exe
Ram usage 2,708KB
Threads: Thread Id:1704 Cpu 06%
Thread Id:1740 Cpu 00%
Thread Id:1744 Cpu 00%
Thread Id:1748 Cpu 00%
Thread Id:1760 Cpu 00%
Thread Id:1928 Cpu 00%
Thread Id:1932 Cpu 00%
Thread Id:1936 Cpu 00%
Thread Id:0668 Cpu 00%
Thread Id:0672 Cpu 00%
Thread Id:0928 Cpu 93%
services.exe
Ram usage 4,076KB
Threads:
Thread Id:1792 Cpu 00%
Thread Id:1796 Cpu 00%
Thread Id:1800 Cpu 00%
Thread Id:1888 Cpu 00%
Thread Id:1896 Cpu 36%
Thread Id:1916 Cpu 00%
Thread Id:2016 Cpu 00%
Thread Id:0212 Cpu 00%
Thread Id:0396 Cpu 00%
Thread Id:0412 Cpu 00%
Thread Id:2096 Cpu 22%
lsass.exe
Ram usage 1,948KB
Threads:
Thread Id:1812 Cpu 00%
Thread Id:1816 Cpu 00%
Thread Id:1824 Cpu 00%
Thread Id:1828 Cpu 00%
Thread Id:1844 Cpu 00%
Thread Id:1852 Cpu 99%
Thread Id:1860 Cpu 00%
Thread Id:1864 Cpu 00%
Thread Id:1876 Cpu 00%
Thread Id:1912 Cpu 00%
Thread Id:3256 Cpu 00%
Thread Id:3572 Cpu 00%
Thread Id:3856 Cpu 00%
avp.exe
Ram Usage 6,168KB
Threads: Thread Id:2444 Cpu 02%
Thread Id:2560 Cpu 00%
Thread Id:2576 Cpu 00%
Thread Id:1124 Cpu 00%
Thread Id:2468 Cpu 00%
Thread Id:2492 Cpu 86%
Thread Id:0956 Cpu 09%
Thread Id:4692 Cpu 00%
Thread Id:8096 Cpu 00%
spoolsv.exe
Ram usage 8,792KB
Threads: Thread Id:1104 Cpu 13%
Thread Id:1128 Cpu 00%
Thread Id:1132 Cpu 12%
Thread Id:1144 Cpu 00%
Thread Id:2024 Cpu 02%
Thread Id:1788 Cpu 06%
Thread Id:1648 Cpu 00%
Thread Id:1588 Cpu 01%
searchfilterhost.exe
Ram usage 5,200KB
Threads: Thread Id:4364 Cpu 50%
Thread Id:4428 Cpu 00%
Thread Id:3956 Cpu 50%
Thread Id:5496 Cpu 00%
Thread Id:7696 Cpu 00%
Thread Id:6324 Cpu 00%
iexplore.exe
Ram usage 71,236KB
Threads:
Thread Id:3392 Cpu 00%
Thread Id:4820 Cpu 00%
Thread Id:5968 Cpu 00%
Thread Id:5732 Cpu 00%
Thread Id:5424 Cpu 00%
Thread Id:4312 Cpu 06%
Thread Id:1204 Cpu 43%
Thread Id:4768 Cpu 00%
ida.exe
Ram usage 18,528KB
Threads: Thread Id:6140 Cpu 02%
Thread Id:4256 Cpu 94%
Thread Id:4524 Cpu 00%
Thread Id:0224 Cpu 00%
Thread Id:0464 Cpu 00%
Thread Id:6748 Cpu 00%
Thread Id:7268 Cpu 00%
The case study used in this work as a test is a sorting program constructed in 8-threads; each
thread will generate and try to sort an array of (15000) integer numbers by using the Bubble-
method. The reason of taking the same method of sorting is to neglect the effects of the program-
length or program-complexity. The software will signal the operating system to create each thread
with default (normal) priority, then the OS will treat with them according to the creation-time and
resources assigning.
The TP is constructed to be run in two modes (Serial and Parallel) and the monitor is
monitoring it during the two cases. In serial case there is one thread that will generate and sort the
8-arrays, each of (15000) elements (i.e. a single thread will manipulate the 8-arrays in sequence).

7
The following are the results of Serial-running case:
Total-time execution is: 32 seconds.
CPU usage time is: 30 milliseconds.
CPU idle time = Total-time execution - CPU usage time = 32 – 0.030 = 31.970 seconds
RAM Usage: 740 KB.
Table (2): CPU usage of 30-seconds running-time for Serial-operation case.
Time in Seconds 2 4 8 12 16 20 24 28 32
Thread ID 4340 40% 44% 50% 50% 50% 48% 49% 50% 47%
Note: The time of monitoring operation is about 30 seconds divided by 2 such that the thread is
monitored each 2 seconds.
Figure (1): Relationship between the Time and CPU usage for Serial-operation
Figure (2): Histogram representation of Figure (1).
The following are the results of Parallel-running of the 8-threads:
Total-time execution is: 18 seconds.
CPU usage time is: 11 milliseconds.
CPU idle time = Total-time execution - CPU usage time = 18 – 0.011 = 17.989 seconds
RAM Usage: 1,068 KB.

8
The Summary of the Results: Number of the threads=8
Table (3): Termination Sequence of Parallel-operation case for 8-threads Threads IDs The sequence of threads finished
6240
2716
7572
7484
6128
2864
3048
7460
3048
6240
2716
2864
7572
7460
6128
7484
The thread of id=3048 has the 7th
order of creation, but it has terminated its job first.
Table (4): CPU usage of 14-seconds running-time for Parallel-operation case.
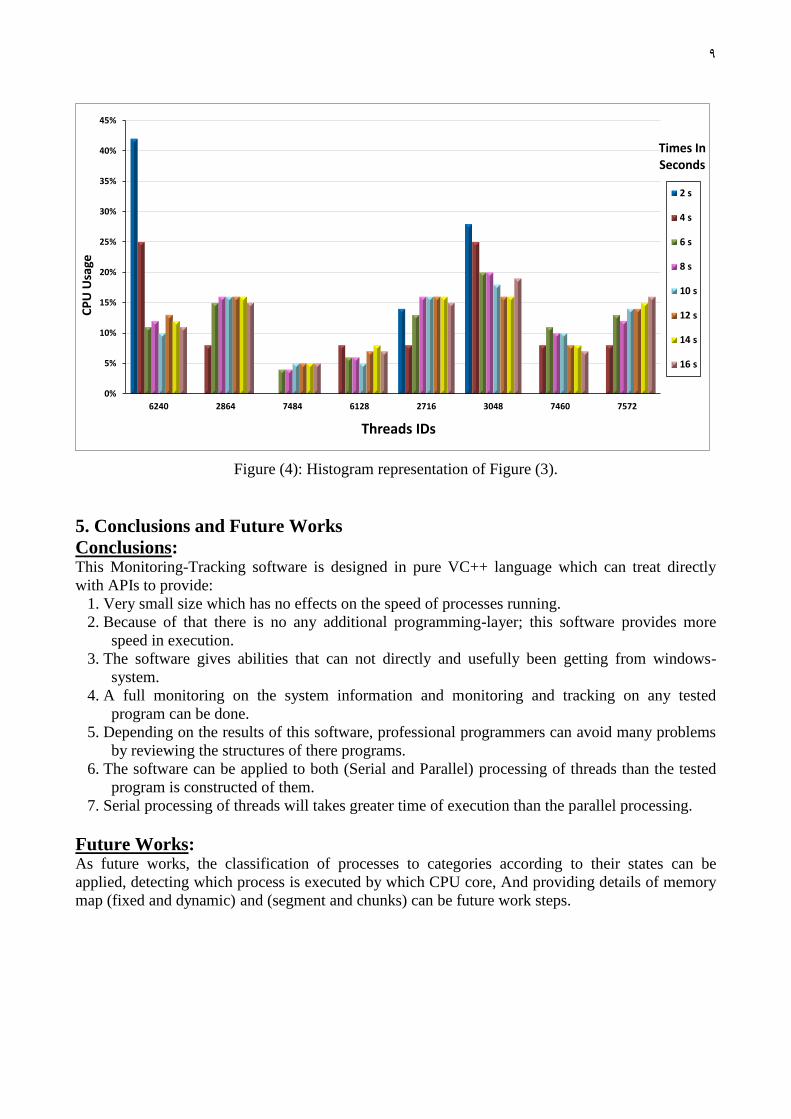
Note: The time of monitoring operation is about 14 seconds divided by 2 such that the threads are
monitored each 2 seconds. The last two seconds were not monitored because some threads would be
terminated before others and we can do that by letting the operation to continue to the end but we
concentrated on showing all the threads in a graphical way.
Figure (3): Relationship between the Time and CPU usage for Parallel-operation
Time in Seconds
Threads IDs 2 4 6 8 10 12 14 16
CPU Usage
6240 42% 25% 11% 12% 10% 13% 12% 11%
2864 0% 8% 15% 16% 16% 16% 16% 15%
7484 0% 0% 4% 4% 5% 5% 5% 5%
6128 0% 8% 6% 6% 5% 7% 8% 7%
2716 14% 8% 13% 16% 16% 16% 16% 15%
3048 28% 25% 20% 20% 18% 16% 16% 19%
7460 0% 8% 11% 10% 10% 8% 8% 7%
7572 0% 8% 13% 12% 14% 14% 15% 16%
9
0%
5%
10%
15%
20%
25%
30%
35%
40%
45%
6240 2864 7484 6128 2716 3048 7460 7572
CP
U U
sage
Threads IDs
Times In Seconds
2 s
4 s
6 s
8 s
10 s
12 s
14 s
16 s
Figure (4): Histogram representation of Figure (3).
5. Conclusions and Future Works
Conclusions: This Monitoring-Tracking software is designed in pure VC++ language which can treat directly
with APIs to provide:
1. Very small size which has no effects on the speed of processes running.
2. Because of that there is no any additional programming-layer; this software provides more
speed in execution.
3. The software gives abilities that can not directly and usefully been getting from windows-
system.
4. A full monitoring on the system information and monitoring and tracking on any tested
program can be done.
5. Depending on the results of this software, professional programmers can avoid many problems
by reviewing the structures of there programs.
6. The software can be applied to both (Serial and Parallel) processing of threads than the tested
program is constructed of them.
7. Serial processing of threads will takes greater time of execution than the parallel processing.
Future Works: As future works, the classification of processes to categories according to their states can be
applied, detecting which process is executed by which CPU core, And providing details of memory
map (fixed and dynamic) and (segment and chunks) can be future work steps.
11
6. References
[1] Yair Wiseman and Song Jiang, “Advanced Operating Systems and Kernel Applications:
Techniques and Technologies”, Book, Information Science Reference (IGI Global), 2010.
[2] Yin Wang, Terence Kelly, Manjunath Kudlur, St´ephane Lafortune and Scott Mahlke, “Gadara:
Dynamic Deadlock Avoidance for Multithreaded Programs”, 8th USENIX Symposium on
Operating Systems Design and Implementation, pp. 281-294, 2008.
[3] Marco Bernardo and Edoardo Bontà, “Generating Well-Synchronized Multithreaded
Programs from Software Architecture Descriptions”, Università di Urbino “Carlo Bo” – Italy,
WICSA 2004.
[4] Cormac Flanagan, Shaz Qadeer, and Sanjit A. Seshia, “A Modular Checker for Multithreaded
Programs”, NDSEG Fellowship, 2002.
[5] Koushik Sen and Mahesh Viswanathan, “Model Checking Multithreaded Programs with
Asynchronous Atomic Methods”, University of Illinois at Urbana-Champaign, 2006.
[6] Augusto J. Vega, Jos´e Luis Hamkalo, and Bruno Cernuschi-Fr´ıas, “Facultad de Ingenier´ıa,
Universidad de Buenos Aires”, 2006.
[7] Sewon Moon and Byeong-Mo Chang, “A Thread Monitoring System for Multithreaded Java
Programs”, ACM SIGPLAN Notices, Vol. 41 (5), pp. 21-29, May 2006.
[8] C. A. R. Hoare, “Communicating Sequential Processes”, C. A. R. Hoare, June 21, 2004.
[9] Bryan M. Cantrill and Thomas W. Doeppner Jr., “ThreadMon: A Tool for Monitoring
Multithreaded Program Performance”, Sun Microsystems and by ARPA order 8225, ONR
grant N00014-91-J-4052, 1997.
[10] Alexandra Fedorova, “Operating System Scheduling for Chip Multithreaded Processors”,
Ph.D. Thesis, Harvard University, September, 2006.
[11] http://www.jGuru.com, “Threads”, 2003.
[12] Tanenbaum, “Introduction to Processes and Threads”, http://www.gogetpapers.com,
downloaded at 2010.
[13] Robert Love, “LINUX System Programming”, Book, First Edition O’Reilly Media, Inc.,
September 2007.
[14] Jerry J. Harrow, Jr., "Runtime Checking of Multithreaded Applications with Visual Threads",
Compaq Computer Corporation, Business Critical Servers Group, 2000.
[15] Apple Inc., "Threading Programming Guide", Apple Inc., 08-02-2008.
[16] Peter A. Buhr and Martin Karsten, "C++ Monitoring, Visualization and Debugging Annotated
Reference Manual", November 15, 1996.
Copyright © 2022 FDOKUMEN