Analysis of diurnal and vertical microbial diversity of a hypersaline microbial mat
Upload
khangminh22Category
view
3download
0
MAHMOUD MASRI
Vollständiger Abdruck der vor der Fakultät für Chemie der Technischen Universität München
zur Erlangung des akademischen Grades eines
Doktors der Naturwissenschaften (Dr. rer. nat.)genehmigten Dissertation
Vorsitzender: 1. Prof. Dr. Andreas Jentys
Prüfer: 1. Prof. Dr. Thomas Brück
2. Prof. Dr. Volker Sieber
3. Prof. Dr. Rainer Buchholz
Die Dissertation wurde am 23.07.2019 bei der Technischen Universität München eingereicht und
durch die Fakultät für Chemie am 29.11.2019 angenommen.
Generation of Microbial Oil via a Process Engineering Approach
New generation of up- /downstream processing and a feedstock
Technische Universität München
Werner Siemens-Lehrstuhl für
Synthetische Biotechnologie (WSSB)


Generation of Microbial Oil A Process Engineering Approach
M . A . M a s r i , III
This work was performed from April 2013 to December 2016 under the supervision of Prof. Dr. T. Brück
at the institute of Werner Siemens-Chair of Synthetic Biotechnology (WSSB), Department of Chemistry,
Technical University of Munich.
First Reviewer Prof. Dr. Thomas Brück Werner Siemens-Chair of Synthetic Biotechnology (WSSB) Faculty in Chemistry Technical University of Munich
Second Reviewer Prof. Dr. Volker Sieber Chair of Chemistry Biogenic Raw Materials Faculty in Chemistry Technical University of Munich
Third Reviewer Prof. Dr. Rainer Buchholz Institute of Bioprocess Engineering Faculty in Engineering Friederich Alexander University of Erlangen Nürnberg
Date of defense 09.12.2019


Generation of Microbial Oil A Process Engineering Approach
M . A . M a s r i , V
Table of Contents
Table of Contents .................................................................................................................................................... V
Declaration ............................................................................................................................................................ VII
Acknowledgments .................................................................................................................................................. IX
Abstract .................................................................................................................................................................. XI
List of publications (as a first-author) ................................................................................................................... XV
List of publications (as a co-author) ..................................................................................................................... XIX
List of patents: ...................................................................................................................................................... XXI
PART I: SCIENTIFIC BACKGROUND .......................................................................................................................... 0
1 Introduction .................................................................................................................................................... 2
2 Oleaginous yeast ............................................................................................................................................ 3
2.1 Terrestrial biomass as Yeast feedstock ................................................................................................... 3
2.2 Marine biomass as yeast feedstock ........................................................................................................ 4
2.3 Waste biomass as feedstock ................................................................................................................... 5
2.1 Volatile fatty acids (VFAs) as feedstock .................................................................................................. 6
3 Triacylglycerol biosynthetic and lipid droplet biogenesis............................................................................... 7
3.1 From Sugar and acetate to a giant lipid droplet ..................................................................................... 8
3.2 Factors that influence LD size ............................................................................................................... 16
4 Challenges in lipid production from oleaginosus yeast ................................................................................ 19
4.1 Techno-economic analysis (TEA) and MO cost: .................................................................................... 19
4.2 Technical challenges: ............................................................................................................................ 20
4.3 Life cycle assessment (LCA) and environmental challenges: ................................................................ 21
5 Work objectives ............................................................................................................................................ 24
6 Discussion ..................................................................................................................................................... 25
7 Methods ....................................................................................................................................................... 31
7.1 Strains and precultures ......................................................................................................................... 31
7.2 Media .................................................................................................................................................... 31
7.3 Bioreactors ............................................................................................................................................ 31
7.4 Analysis and assays ............................................................................................................................... 32
7.5 Techno-economic analysis .................................................................................................................... 33
7.6 Life-cycle for global warming potential (GWP) ..................................................................................... 34
8 References .................................................................................................................................................... 35
PART II: PUBLICATIONS OVERVIEW ........................................................................................................................ 0
PART III: PUBLICATIONS FULL TEXT ........................................................................................................................ 0


Generation of Microbial Oil A Process Engineering Approach
M . A . M a s r i , VII
Declaration
I hereby declare that the current dissertation has been independently written by me. All the presented
results, explanations and thoughts have not been taken from any other writings analogously or literally.
The sources and aids have been indicated and cited. The present work has not yet been submitted or
otherwise published to another examination authority in the same or similar form.
Mahmoud Masri
Garching, dem 09.12.2019


Generation of Microbial Oil A Process Engineering Approach
M . A . M a s r i , IX
Acknowledgments
To the First, the Last, the All-knowing, the Evident, and the Eternal Owner of Sovereignty, thank you
with my full submission. It is all from your guiding, supporting, helping, and blessing. Praise be to Allah.
Firstly, I would like to express my sincere gratitude to my advisor Prof. Dr. Thomas Brück for the
continuous support of my Ph.D. study and related research, for his patience, motivation, and immense
knowledge. His guidance helped me in all the time of research and writing this thesis. Prof. Dr. Brück
coaching was not limited to scientific aspects but it expanded to many aspects of life, planning, and
leadership. I could not have imagined having a better advisor and mentor for my Ph.D. study. Thank
you a lot Prof. Dr. Thomas Brück.
Besides my advisor, I would like to thank the rest of my thesis committee: Prof. Dr. Andreas Jentys,
Prof. Dr. Volker Sieber, and Prof. Dr. Rainer Buchholz, not only for their insightful comments and
encouragement, but also for the questions which incented me to widen my research from various
perspectives.
My sincere thanks also go to Dr. Norbert Mehlmer, Dr. Farah Qoura, Dr. Daniel Garbe, and Dr. Monika
Fuchs, who provided me the opportunity to join their team as intern. Without their precious support
it would not be possible to conduct this research.
I thank my fellow lab-mates: Samer, Pariya, Dirk, Wojciech, Johannes, Jan, Elias, Tobias, Markus, Max,
Matthias, Katarina, Felix B., Wolfgang, Steven, Christian, Patrick, Dania, Nikolaus, Zora, Marion,
Kevin, Nathanael, Felix M., Sophia, Michael, and Timm for the stimulating discussions, for the
sleepless nights we were working together before deadlines, and for all the fun we have had in the last
years. With a special mention to Gülnaz, Martina, Veronika, Petra, Dominik, Barbara and Tom the
pilot supporting team. It was fantastic to have the opportunity to work with all of you. What a cracking
place to work! Also, I thank my friends Abdulsalam, Ahmed, Boutheina, Martina, Eszter and Asma for
working together.
My deepest thanks to my family; my parents, my brother and sisters Shaza, Qutaiba, and Ruba for
supporting me spiritually throughout writing this thesis and my life in general. I am proud that I am
part of this family. Thanks for all your encouragement!
And finally, last but by no means least, because they are the first, they are a part of me, they are the
target behind, they are the sense of all. To my beloved small family Salam, Leen and Tala, thank you
for all support.
To the very special persons in my life:
To my wife Salam, to who endures difficulties with me, to who shared my concerns, sorrows as well
as my joys and my happiness. Many Thanks.
To my life-coach, to the one who opens all the doors, and breaks the odds and hardships in my life, to
my Mom, I owe it all to you. Many Thanks
To my father, I fully understand that you can’t read my words. But I well know that you were looking
forward to this moment and you would be fully proud of my achievements. I miss you every single day,
I see you in my dreams. I ask Allah Almighty to have mercy on you.
Sincerely yours
Mahmoud Masri


Generation of Microbial Oil A Process Engineering Approach
M . A . M a s r i , XI
Abstract
Contemporary societies heavily rely on fossil fuels as their major energy source. Renewable
energy sources, such biofuel, are desired to displace fossil fuels owing to concerns about
climate change. In this respect, alternative bio-based technologies aim to supply fuels in a cost-
effective and sustainable manner while contributing to the reduction of greenhouse gases. The
current generation of biofuel is completely dependent upon edible crop oil, which is derived
from sources such as palm oil, resulting in serious complications to universal food-chain and
biodiversity. Lipids from oleaginous microorganisms have great potential for displacing crop-
derived oils as biofuel substrates, but many restrictions prevent their economical and industrial
application.
The current project primarily addressed the key technical and environmental constraints
concerning single cell lipid production from oleaginous yeasts related to sustainable feedstock,
time-effective biomass and lipid yield, low-energy-demand for downstream processing as well
as solvent-free processing as well as fermentative CO2 emission. Additional points contributing
to thesis are from collaborations with different partners.
With respect to sustainable feedstock, we attempted to utilize monosaccharides from
marine macrophytes (Seagrass and Macroalgae) as feedstock for MO production. Among the
studied samples, P. oceanica from the Mediterranean Sea and L. digitata from the western cost
of Ireland displayed the best lipid productivity, exceeding the well-documented minimal
nitrogen media.
Additionally, the non-lipid yeast biomass (the yeast cell-wall) was applied, for first time, as a
unique sugar source. The enzymatically produced yeast hydrolysate provided a sugar/nutrition
rich medium for yeast fermentation, resulting in increasing biomass and lipid productivities.
Acetic acid, as a sustainable yeast feedstock, was evaluated whether solo or in jointly with
sugar. The monoauxic co-fermentation system enabled the simultaneous assimilation of sugar
and acetic acid in rich-based medium. Via this co-fermentation, C. oleaginosus had a
significantly high cell density (245 g L-1), lipid content (87% w/dwbiomass) and lipid productivity
(2.4 g L-1 h-1). This co-fermentation freed TGs biosynthesis from nitrogen-scarce needs, which
subsequently avoided the classical diauxic fermentation and paved the way to the flash (short,
approximately 45 h) or continuous fermentation mode.
Microalgae, as another lipid producer, might be the optimal platform to assimilate CO2 from
yeast fermentation. In this respect, the fatty acid profile and productivity were evaluated in


Generation of Microbial Oil A Process Engineering Approach
M . A . M a s r i , XIII
wild-type and ultraviolet-C mutants of Isochrysis sp., Nannochloropsis maritima and
Tetraselmis sp.
Relocation of CO2 from heterotrophic yeast to autotrophic algae was discussed in a common
work with our partner at the University of Jordan. In this collaboration, chemisorption based
on chitosan oligosaccharide/DMSO was used to capture CO2. For our part, the biodegradation
test justified the green sorbent consideration.
Development of downstream processing and lipid recovery was a major part of the current
work. In the framework of the LIPOMAR project, a single in-situ enzymatic treatment process
was established to achieve holistic cell lysis and lipid recovery/purification without the need for
pretreatment or subsequent application of an organic solvent.
In more details, the established enzymatic downstream processing compromises a two-step
enzymatic treatment. While the initial step imposes a holistic cell-wall lysis performed by a
mixture of hydrolases, the second treatment requires cell emulsion systems, such proteins. The
activity of mixtures of commercial hydrolases were tested in the first generation. Subsequently,
an in-house yeast-selective hydrolase system was produced using the yeast cell itself induced
by the filamentous fungus T. reesei. A commercial protease treatment, alone or in combination
with the addition of DISSOLVAN® (Clariant), was successfully applied for the demulsification
step.
An alkaline extracellular protease from Yarrowia lipolytica was isolated and characterized.
This cured protease shows promising stability and activities that may allow it to be used
downstream for lipid recovery in future work.
To evaluate the economic and ecological advantages of the designed MO process, a techno-economic
analysis estimated a cost of $0.95-1.6 per kg lipid according to the current process design due to the
baseline productivity of 1.4 g L-1 h-1. Furthermore, life cycle assessment analysis assumed an emission
of 3.56 kg CO2 equivalents for every 1 kg of yeast oil produced.


Generation of Microbial Oil A Process Engineering Approach
M . A . M a s r i , XV
List of publications (as a first-author)
The current thesis is based on the publications and patents listed below.
I. A seagrass based biorefinery for generation of single cell oils targeted at biofuel and
oleochemical production. Masri M. A., Younis S., Mehlmer N., Quora F., Brück T.,
EnergyTechnol.2018,6,1026–1038. Status: Accepted
https://doi.org/10.1002/ente.201700919
MM analyzed and enzymatically hydrolyzed the seagrass biomass. MM cultivated yeast on the
hydrolysate. MM contributed to manuscript writing
II. A waste free, microbial oil centered cyclic bio-refinery approach based on flexible macroalgae
biomass, M. A. Masri, W. Jurkowski, P. Shaigani, M. Haack, N. Mehlmer and T. Brück, Applied
Energy 224 (2018) 1–12 Status: Accepted
https://doi.org/10.1016/j.apenergy.2018.04.089
MM analyzed and enzymatically hydrolyzed the algal biomass. MM cultivated yeast on the hydrolysate
and established the FACS based lipid assay. MM contributed to manuscript writing
III. A sustainable, high-performance process for the economic production of waste-free microbial
oils that can replace plant-based equivalents, Masri M.A., Garbe D, Mehlmer N., Brück T., 2019,
12, 2717, Energy & Environmental Science, 2019 Status: Accepted
https://doi.org/10.1039/C9EE00210C
MM was responsible for the entire work.
IV. Single Step Extraction and Purification of Renewable Triglycerides from Oleaginous Yeast
Cutaneotrichosporon oleaginous. Using A Completely Solvent Free Enzymatic Cell Lysis, Masri
M. A., Schmidt Y., Mehlmer N., Brück T., 2019. Status: In preparation
MM was responsible for the entire work.


Generation of Microbial Oil A Process Engineering Approach
M . A . M a s r i , XVII
Featured work:
Front cover page: in Energy Technol, 2018,6,1026–1038
Back cover page: in Energy & Environmental Science, EES, 2019, 12, 2717
Highlights: Nat. Rev. Chem., 3, 464, 2019


Generation of Microbial Oil A Process Engineering Approach
M . A . M a s r i , XIX
List of publications (as a co-author)
V. Chemisorption of CO2 by chitosan oligosaccharide/DMSO: organic carbamato–carbonato bond
formation; Abdussalam K. Qaroush, Khaleel I. Assaf, Sanaa K. Bardaweel, Ala'a Al-Khateeb,
Fatima Alsoubani, Esraa Al-Ramahi, Mahmoud A. Masri, Thomas Brück, Carsten Troll,
Bernhard Rieger and Ala'a F. Eftaiha, Green Chem., 2017, 19, 4305. Status: Accepted
https://doi.org/10.1039/C7GC01830D
MM performed the biodegradation test. MM contributed to the manuscript writing.
VI. Catalytic decomposition of the oleaginous yeast Cutaneotrichosporon oleaginous and
subsequent biocatalytic conversion of liberated free fatty acids, Martina K. Braun, Jan
Lorenzen, Mahmoud A. Masri, Yue Liu, Eszter Baráth, Thomas Brück, Johannes A. Lercher, ACS
Sustainable Chemistry & Engineering. Status: Accepted
https://doi.org/10.1021/acssuschemeng.8b04795
MM analyzed the yeast biomass, produced the ethanol and TEA and contributed to the manuscript
writing.
VII. Strain selection of microalgae isolated from Tunisian coast: characterization of the lipid profile
for potential biodiesel production, Asma Gnouma, Emna Sehli, Walid Medhioub, Rym Ben
Dhieb, Mahmoud A. Masri, Norbert Mehlmer, Wissem Slimani, Khaled Sebai, Amel Zouari,
Thomas Brück, Amel Medhioub, Bioprocess and Biosystems Engineering 41:1449–1459 (2018).
Status: Accepted
https://doi.org/10.1007/s00449-018-1973-5
MM analyzed the algal biomass and lipid and contributed to the manuscript writing.
VIII. Isolation and Screening for Protease Activity by Marine Microorganisms; Bessadok, Boutheina;
Masri A., Mahmoud; Brück, Thomas; Sadok, Saloua; Bull. Inst. Natn. Scien. Tech. Mer de
Salammbô, Vol. 42, (2015). Status: Accepted
M performed the protein extraction, DNA extraction, SDS-gel, strain identification.
IX. Characterization of the Crude Alkaline Extracellular Protease of Yarrowia lipolytica YlTun15,
Bessadok, Boutheina; Masri A., Mahmoud; Brück, Thomas; Sadok, Saloua. Journal of
FisheriesSciences.com, 11(4): 019-024 (2017). Status: Accepted
https://doi.org/10.21767/1307-234X.1000137
MM designed the assay methods and characterization experiments.


Generation of Microbial Oil A Process Engineering Approach
M . A . M a s r i , XXI
List of patents:
X. Extraction of Renewable Triglycerides from Oleaginous Microorganisms, Mahmoud A. Masri,
Thomas Brück. Patent No.: EP 3 536 800 A1 (2019). Status: Published
XI. A method for producing microbial lipids, Mahmoud A. Masri, Thomas Brück. Application
Patent No.: EP19157805.3 (2019). Status: Submitted


PART I: SCIENTIFIC BACKGROUND
Introduction
Oleaginous yeast
Triacylglycerol biosynthetic and lipid
droplet biogenesis
Challenges in lipid production from
oleaginosus yeast
Work objectives
Methods
Discussion

Generation of Microbial Oil SCIENTIFIC BACKGROUND A Process Engineering Approach
M . A . M a s r i , 1

Generation of Microbial Oil SCIENTIFIC BACKGROUND A Process Engineering Approach
M . A . M a s r i , 2
1 Introduction
Driven by massive demands for energy, human impacts on the environment are exposing the
ecosystems of Earth to increasing risk. 1-3 The need for low-carbon energy sources as alternatives to
fossil fuel is realized by originating several generations of biofuel. 4, 5 In fact, desired carbon savings
from biofuel usage is influenced by the way they are produced. First biofuels generation availing edible-
crops, such as corn, sugarcane, soybeans, and palm, were associated with land-use change and habitat
fragmentation, which subsequently threatened several mammal, bird, plant and other species. 6-8 Over
the last 50 years, accumulating land clearing and increasing population density have resulted in almost
two-thirds of mammals that weigh 10 kg or more being threatened with extinction. 8
Converting rainforests, peatlands, savannas, or grasslands to food crop–based biofuels is releasing
massive amounts of CO2 into the atmosphere, far exceeding those released by the fossil fuels they
were created to displace. In contrast, biofuels made from waste biomass, biomass grown on degraded
and abandoned agricultural lands or non-terrestrial biomass grown from direct fixation of CO2 provide
immediate and sustained greenhouse gas (GHG) advantages.
As alternative lipid producers, oleaginous microorganisms display great potential for displacing
crop-derived oils due to their increased aerial and space-time productivity. 9 Oleaginous yeast, in more
specifically Cutaneotrichosporon oleaginosus (ATCC 20509), surpass other microbial producers due
their unique biochemical characteristics of rapid growth to high cell density, harnessing a wide spectra
of feedstocks and coping with a variety of cytotoxic compounds. 10, 11
At present, microbial oil (MO) has failed to be established at industrial manufacturing, as it was
below the set sustainability goals of economic and social development, as well as environmental
protection. 12

Generation of Microbial Oil SCIENTIFIC BACKGROUND A Process Engineering Approach
M . A . M a s r i , 3
2 Oleaginous yeast
Oleaginous yeasts are characterized by their significant ability to accumulate fatty acids in the form
of triglycerides, 13 as well as their capacity to convert a broad variety of biomass feedstocks of varying
quality and composition into biomass and lipids.
With respect to single cell oil (SCO) production, oleaginous yeasts have numerous advantages over
other microbial producers. Yeast fermentation is less affected by climate compared to phototrophic
microalgae. Yeast fermentation is even more tolerant to diverse complex sugar matrixes and it can use
other simple compounds as carbon sources compared to heterotrophic microalgae cultivation. 2
Tolerance to metal ions and relatively low oxygen demand are yeast advantages over oleaginous fungi.
Moreover, yeast’s relatively large cell size simplifies harvesting and handling compared to bacteria. 14,
15
Of the nearly 600 known yeast species, approximately 30 are considered oleaginous species. These
belong to the following genera: Yarrowia, Candida, Cryptococcus, Rhodotorula, Rhodosporidium,
Rhizopus, Trichosporon and Lipomyces. Oleaginous species such as Y. lipolytica, L. starkeyi, R. toruloides
and C. oleaginosus are among the most studied oleaginous yeast. 16, 17
In general, oleaginous yeasts have superior metabolic flexibility compared to classical yeast, such as
S. cerevisiae. Amongst oleaginous yeasts, C. oleaginosus and R. toruloides demonstrate extensive
metabolic flexibility compared to the model yeasts Y. lipolytica and L. starkeyi. In particular, C.
oleaginosus demonstrates the most extensive capability of metabolizing diverse carbon source classes.
10, 18
Many feedstocks classes have been evaluated within the aim of seeking out for a sustainable carbon
source. Glucose from varied matrixes is the most studied feedstock for oleaginous yeasts. Xylose, the
second constituent sugar of hemicellulosic biomass, has received the most attention as an alternative
carbon source. 10, 18 Application of glycerol as a carbon source has many advantages over sugars,
including lower cost (as a crude byproduct from biodiesel), better availability, a greater degree of
reduction, reduced CO2 emission during fermentation and less direct competition with food and feed
production. 19 Waste-fats or hydrophobic materials have been tested as a carbon source for oleaginous
yeast as well. 20 Besides, volatile fatty acids (VFAs), such as acetic acid, propionic acid and n-butyric
acid, are yet another class of potential feedstocks. Bioconversion of VFAs via oleaginous yeast to SCO
can be considered a viable prospect for sustainable waste management. 21-24
2.1 Terrestrial biomass as Yeast feedstock Terrestrial cellulolytic and hemicellulolytic based biomass hydrolysates may represent an
economical way to provide a high concentration of sugars. Hydrolysis of microcrystalline cellulose,

Generation of Microbial Oil SCIENTIFIC BACKGROUND A Process Engineering Approach
M . A . M a s r i , 4
which is the main component in such biomasses, requires harsh chemical pretreatment, resulting in
inhibitory byproduct formation (acetic acid, furfural, and 5-hydroxymethylfurural). R. toruloides and C.
oleaginosus are capable of metabolizing hydrolysate feedstocks of various biomass sources without
the need for dilution or detoxification. 25 In contrast, L. starkeyi growth was affected by these
byproducts even in diluted feedstock. 26
High xylose content is another challenge for hemicellulolytic based biomass hydrolysates. C.
oleaginosus metabolizes xylose without any catabolite repression or genetic modification at similar
rates to glucose. 10, 18 In contrast, Y. lipolytica exhibits cryptic xylose metabolism, resulting in low-rate
utilization of xylose as a sole carbon source. 11 Interestingly, Y. lipolytica was able to use xylose in
ammonia fiber expansion pretreated corn stover hydrolysates but not as a sole carbon source. 27
As third challenge, lignin is an underutilized component because of its heterogeneous structure and
the toxicity of its depolymerized products. In fact, lignocellulosic biomasses, which comprise
agricultural byproducts, municipal solid wastes, low input energy crops and forest residue, are the
most abundant renewable organic resource, occupying half of total global biomass. 28
One recent publication demonstrated that C. oleaginosus cells showed high tolerance to high
concentrations of mono-aromatic compounds (15 different compounds). Specifically, lipid
accumulation reached up to 69.5% (w/w) when grown on lignin-derived aromatics. 10 C. oleaginosus
showed a unique tolerance to toxic byproducts generated during thermo-catalytic pretreatment of
lignocellulose, such as acetic acid, HMF, and furfural, at concentrations that are lethal for other
organisms. Interestingly, C. oleaginosus has the metabolic capacity to both tolerate and convert these
common fermentation inhibitors into biomass. 29
2.2 Marine biomass as yeast feedstock
Macrophyte marine biomass (MB) comprises primarily macroalgae and seagrass and accounts up
to 71% (w/w) of all biologically stored carbon. 30, 31 MB converts solar energy into chemical energy with
higher photosynthetic efficiency comparing to terrestrial biomass. 32-35 For example, macroalgae
species such as Ulva sp., Fucus sp., and Laminaria sp. can fix a 48.7, 561 and 124 µmol CO2/h for each
1 g dry weight biomass. 36 Moreover, seagrass meadows are among the ecosystems with the highest
productivity on earth. Seagrass stores 27.4 million tons per year of organic carbon (Corg). 34
In fact, both high photosynthetic efficiency and aerial productivity enable the MB to generate and
store sufficient carbon to comply with feedstock demands of any biorefinery concept. Additionally, MB
has less risk to compete with food and energy generation compared to terrestrial energy crops, like

Generation of Microbial Oil SCIENTIFIC BACKGROUND A Process Engineering Approach
M . A . M a s r i , 5
corn and wheat. For instance, markets for seaweed based foodstuffs are limited to East Asia, where
macroalgae are used for food, hydrocolloids, fertilizer, and animal feed. 37
Due to unfavorable C/N/P ratio of 474:24:1, seagrass biomass shows a relatively low natural
biodegradation rate (about 19%) with regard to its leafy biomass being degraded by herbivores and
heterotrophs. 38 Therefore, detached seagrass-leaf material seasonally accumulates as banquettes on
beaches and shorelines. Utilization of such biomass for biotechnology processes offers a great
socioeconomic opportunity.
Taxonomically, macroalgae and seagrass are multicellular photosynthetic organisms. Seagrass
belongs to higher flowering plants. These occupy four plant families; Posidoniaceae, Zosteraceae,
Hydrocharitaceae, and Cymodoceaceae. By contrast, macroalgae belong to the lower plants, consisting
of a leaf-like thallus instead of roots, stems, and leaves. Macroalgae are classified into; green (phylum
Chlorophyta), red (Rhodophyceae), gold (Chrysophyceae) and brown algae (Phaeophyceae), according
to the thallus color derived from natural pigments and chlorophylls.
In general, green algae biomass contains mannan, ulvan, starch and cellulose as polysaccharides
which results in monomers of glucose, mannose, rhamnose, xylose, uronic acid, and glucuronic acid.
In return, brown algae cell wall contains laminarin, mannitol, fucoidan, cellulose, and network of
alginate which can be hydrolyzed to glucose, galactose, fucose, xylose, uronic acid, mannuronic acid,
guluronic acid, and glucuronic acid. Red algae biomass consists of carrageenan, agar, cellulose and
lignin, which correspond to glucose, galactose and agarose. Cellulose is the main polymeric sugar in
seagrass, therefore, glucose is the major monomeric sugar of seagrass hydrolysates. 39 High sugar
content (mainly glucose) is an additional reason to consider the seagrass and macroalgae as attractive,
alternative feedstock for biotechnological platforms.
To that end, biomass hydrolysate of the marine microalgae Scenedesmus sp. 40, macroalgae and
beach-cast seagrass 41 have been demonstrated to be suitable fermentation substrates for yeast-based
lipid production. C. oleaginosus was able to utilize microalgae hydrolysate (Scenedesmus sp.) cells,
accumulating good biomass at the same lipid content. 40 Brown algae hydrolysate is a preferable carbon
source over green algae hydrolysate for C. oleaginosus. 42 Seven beach-cast seagrass hydrolysates were
tested to produce SCO. 41 In this work, Pasadena Ocean was shown to be superior.
2.3 Waste biomass as feedstock Industrial byproducts could provide a carbon source for oleaginous yeasts. The biodiesel industry
generates crude glycerol (80% glycerol, 10% water, 7% ash and 3% methanol) as a byproduct. 43, 44
Methanol contamination severely inhibits microbial growth. Crude glycerol as feedstock for yeasts has
been thoroughly evaluated in genera including Candida, Yarrowia, Rhodosporodium, Rhodotorula,

Generation of Microbial Oil SCIENTIFIC BACKGROUND A Process Engineering Approach
M . A . M a s r i , 6
Cryptococcus, Trichosporonoides, Lipomyces and Schizosaccharomyces. 45-47 R. toruloides showed good
performance with high lipid yield and content, up to 26.7 g L-1 and 70% (w/w), which was observed
with the strain AS2.1389, a 5-L fermenter. 48 C. oleaginosus achieved the highest biomass, lipid
production and lipid content on diluted crude glycerol fermentation medium to 1.4% methanol (w/v).43
. Waste oil from vegetable frying was successfully applied as feedstock for Y. lipolytica, where a lipid
content of 57.89% (w/w) was obtained. 20 It is noteworthy that lipid accumulation in this experiment
was dependent on nitrogen content, contained in the waste oil fraction (e.g., nitrogen seeping from
meat, chicken and fish into the frying oil). 20 In that regard, increasing nitrogen concentrations lead to
lower lipids yields, as nitrogen limitation is an initiator of lipogenesis.
2.1 Volatile fatty acids (VFAs) as feedstock VFAs, commonly, refers to acetic acid (AA), propionic acid (PA), n-butyric acid (BA), isobutyric acid
(iBA), n-valeric acid (VA), and isovaleric acid (iVA). VFAs can be generated from ecologically sound
starting materials, such as CO, waste gases, and CO2/H2, 49-51 using biotechnological processes (i.e.,
fermentation of Clostridium aceticum and Acetobacterium woodii). 49, 50, 52, 53 Sludge, food wastes, and
a variety of biodegradable organic wastes are considered as feedstock platform for VFAs production
via anaerobic fermentation. It worthy to mention that acetic acid has relativity low market price, 52
which favors economically sound production routes. Accordingly, VFAs are a promising feedstock
platform for MO production with many ecological and economic advantages.
The feasibility of valorization of VFAs on some yeast strains, such as Y. lipolytica, R.
toruloides, C. oleaginosus and C. albidus, has been investigated. 21-24 Recently, some reports
have demonstrated that acetic acid can serve as the sole feedstock for C. oleaginosus
cultivation. 21, 23, 54-57 VFAs from rice straw hydrolysates lead to lipid content of 28% (w/w). 58 In
this experiment, odd-chain fatty acids (C15, C17) was detected which was attributed to the
presence of propionic acid. 58 These findings were consistent with detecting the formation of
C15:0, C17:0 and C17:1 , when propionic acid is used within the feed. 59 VFAs from anaerobic
fermentation of brown algae have been used by the oleaginous yeast C. oleaginosus to produce
lipids in a repeated batch system, resulting in a high lipid content of 61% (w/w). 23
Recently, some reports have demonstrated that acetic acid can serve as the sole feedstock for
Cutaneotrichosporon oleaginosus cultivation. 21, 23, 54-57 However, although application of acetic acid as
the sole carbon source results in considerably high intracellular lipid content (60–73%, wlipid/dwbiomass),
biomass productivity is inhibited, leading to poor overall oil yields. 23, 54, 56 Moreover, multistep, 21
continuous, 54 and pH-stat 55, 56 fermentation have been tested to identify the best method for
implementation of acetic acid as the sole carbon source feedstock. The pH-stat approach shows

Generation of Microbial Oil SCIENTIFIC BACKGROUND A Process Engineering Approach
M . A . M a s r i , 7
promising lipid productivity. 55 However, constant feeding of costly yeast extract, peptone, vitamins,
and other nutrients in all pH-stat trials prohibits the economic development of this process. Thus,
further studies are needed to achieve optimal integration of acetic acid in the microbial oil production
process.
In fact, to build a fermentation system with high lipid productivity it essential to understand lipid
formation inside yeast and to understand the current challenges that SCO production is facing.
3 Triacylglycerol biosynthetic and lipid droplet biogenesis
Cytoplasmic lipid droplets (LDs) are ubiquitous, dynamic cellular organelles serving as crucial
reservoirs of energetic triacylglycerols (TGs). LDs are a central metabolic hub participating in various
cellular activities, such as protein and lipid trafficking, protein degradation and cell signaling 60, LDs also
supply lipids for membrane synthesis. 61, 62 LD formation is a subsequent step to TG sequestering
between the two leaflets of the endoplasmic reticulum (ER) membrane. 63 Therefore, understanding
the proportional relationship between TG biosynthesis and LD biogenesis is essential to maximize the
lipid productivity.
LDs consist of highly hydrophobic cores surrounded by a monolayer phospholipid shield. Diverse
TGs, their precursor intermediates and degradation products occupy the LDs hydrophobic core.
Depending on the cell type, the LD core might contain sterol esters (SEs) beside TGs, and the TG/SE
ratio fluctuates among cells. 64 TGs and SEs could be colocalized within one LD or dominant in separated
LDs. In colocalized LDs, TGs and ESs can be segregated in random ways or structured in concentric
layers: inner dominant TG cores (Di: 350 nm) are surrounded by a concentric SE layers (Thickness: 3.7
nm) encircled by a phospholipid monolayer and end up with LD diameters of 400 nm. 65 Additionally,
LD cores can also contain precursors of more complex molecules, such as sphingolipids, signaling
molecules (e.g., eicosanoids), and lipophilic hormones (retinoic acid, retinyl esters and steroids) or
even a wax ester. 66, 67 Membranes, RNA, RNA-binding proteins, and ribosomal subunits beside
proteins, such as eicosanoid-producing enzymes, have been previously detected in the hydrophobic
core of LDs. 68, 69
The outer phospholipid monolayer shield seems similar across different cell types. 66, 70 However,
yeast LDs in general are primarily composed of phosphatidylcholine (PC), phosphatidylinositol (PI) and
phosphatidylethanolamine (PE) with very small percentages of phosphatidylserine (PS) and
phosphatidic acid (PA). 71-74 Bound proteins, comprising TG synthesis, N-linked glycosylation, lipolysis,

Generation of Microbial Oil SCIENTIFIC BACKGROUND A Process Engineering Approach
M . A . M a s r i , 8
lipolytic regulators, phospholipids (PLs) metabolism, ER-associated protein organization and
degradation, are localized to LD surfaces. 75, 76
Cells dynamically regulate LD size, number, and distribution in response to physiological cues.
Therefore, LD sizes might range from very small (less than 4 nm), such as exists in wide type
Saccharomyces cerevisiae 62, to rich supersized LDs (approximately 1 µm) in some S. cerevisiae mutants,
77-79 even exceeding 100 µm as giant and unilocular LD occupying the entire cytoplasm of an oleaginous
yeast cell under stressed conditions (Figure 1). 80
LD density is inversely correlated with size, ranging from less than 0.95 g mL-1, in cases of large LDs,
to greater than 1.063 g mL-1 for small LDs, which is larger than microsomes. 63, 81 Therefore, by density-
based separation methods, only LDs larger than 1 µm will be in the top-floating LD fraction.
Accordingly, smaller LDs will remain in denser fractions. 82 Given that many factors can enhance LD size,
observation has shown that such factors subsequently enhance TG production. 78 In that respect, it is
critical to understand the molecular mechanisms underlying LD growth to large LDs sizes, especially
where oleaginous yeasts are concerned, taking into consideration oleaginous yeast’s central role as
lipid sources for food, pharmaceutical and biofuel industries.
Figure 1: Lipid droplet sizes (Source: Modified from Current “Opinion in Cell Biology 2012, 24:509–516”). 83
3.1 From Sugar and acetate to a giant lipid droplet
Acetic acid utilization as a carbon sources first requires passing through the cell membrane.
Carboxylate transporter proteins mediate transport of acetate ions, while direct diffusion is thought to
be the mechanism for transport of the undissociated form of acetic acid at low pH. 84 Monocarboxylate
transporters, such as Jen1p or Ady2p, transport acetate anions into the cytoplasm. 85 The
aquaglyceroporin channel (Fps 1) facilitates the direct diffusion of undissociated form of acetic acid.
Acetic acid is subsequently converted into acetyl-CoA via acetyl-CoA synthetase (ACS) or acetate-CoA

Generation of Microbial Oil SCIENTIFIC BACKGROUND A Process Engineering Approach
M . A . M a s r i , 9
ligase (ACL). 85 This direct conversion was reported in microalgae and in non-oleaginous
microorganisms, such as Saccharomyces cerevisiae. 86 In the case of oleaginous microorganisms, some
yeast species, such Cutaneotrichosporon oleaginosus, demonstrate the ability to directly utilize acetate
as a carbon source, resulting in high lipid content. 55 Both the monocarboxylate transporter and
acetate-CoA ligase have previously been reported in a transcriptomic analysis of Cutaneotrichosporon
oleaginosus. 87
Biomass growth inhibition associated with acetic acid usage as a carbon source is widely reported
in yeast. 23, 54, 56 All weak acids cause a growth delay or even cell death, depending on their
concentrations as well as on their lipophilic properties. 88 The less lipophilic acetic acid compromises
cell viability and activates acetic acid-programmed cell death (AA-PCD). At lethal concentrations of
acetic acid (in S. cerevisiae ~80 mM), the first response (15 min) is production of reactive oxygen
species (ROS), such as intracellular hydrogen peroxide and superoxide anions. Subsequently,
mitochondria induce (60-150 min) cytochrome c (cyt c) release, leading to mitochondrial dysfunction.
The increase of caspase-like activity eventually leads to AA-PCD. 89, 90 Therefore, organic acid
concentrations, as well as their lipophilic moiety, should be considered before the application of
organic acids as feedstock.
Once acetate is converted into acetyl-CoA, fatty acid synthesis is virtually started. Acetyl-CoA is
considered a universal precursor for fatty acid synthesis. In fact, overexpression of ACS in
Saccharomyces cerevisiae, Chlamydomonas reinhardtii and Schizochytrium sp. leads to increased lipid
accumulation. 91, 92 Acetyl-CoA carboxylase (ACC) converts acetyl-CoA to malonyl-CoA. This reaction
occurs in the cytosol in all general heterotrophs. 93 The presence of glucose in the cultivation media
deactivates the ACS1 form of acetyl-CoA synthetase, encoded by the facA. Subsequently, co-
fermentation of acetic acid and glucose in organisms process the ACS1 form of acetyl-CoA synthetase
in a diauxic shift. 94 In contrast, some oleaginous yeasts show the capability to up-take glucose and
acetic acid simultaneously.
Overexpression of ACC alone is insufficient to boost lipid biosynthesis. Actually, ACC overexpression
needs to occur in combination with overexpression of other essential genes to increase lipid
accumulation. 86 An engineered Y. lipolytica doubles lipid content when ACC1 is overexpressed in
combination with diacylglycerol acyltransferase (DGA1). 95 In contrast, solely overexpressing ACC1 in Y.
lipolytica and Aspergillus oryzae resulted in only minor changes in lipid accumulation. 95, 96
Fatty acid biosynthesis requires one molecule of Acetyl-CoA with 7-9 molecules of malonyl-CoA to
begin 7-8 cycles of multistep chemical reactions that end with 16- and 18-carbon fatty acids. 97, 98 Fatty
acid synthase (FAS), particularly FAS I in yeast, has two subunits, α and ß, which each contain six copies
of four functional domains. 99 In total, six copies of eight independent functional domains catalyze the

Generation of Microbial Oil SCIENTIFIC BACKGROUND A Process Engineering Approach
M . A . M a s r i , 10
C16:0 and C18:0 bio synthesis via activation (phosphopantetheinyl transferase [subunit α], PPT), priming
(acetyltransferase [subunit ß], AT), multiple cycles of elongation (ketoacyl synthase [subunit α], KS→
malonyl transacylase [subunit ß], MPT→ ketoacyl reductase [subunit α], KR→ dehydratase [subunit ß],
DH→ enoyl reductase [subunit ß], ENR→ ketoacyl synthase [subunit α], KS…), and termination
(malonyl/palmitoyl transacylase[subunit α], MPT). These reactions all occur in a limited space inside
the α6ß6 complex. 97, 98
These C2-addition serial reactions require 1 ATP and 2 NADPH molecules and release 1 CO2 molecule
for each cycle. 98 Therefore, NADPH deficiency is considered a restricting factor. Conversion of malate
into pyruvate, intermediated by the malic enzyme (ME), is one major common sources of NADPH in
oleaginous yeast. 100 Overexpression of NADP+-dependent ME in Rhodotorula glutinis significantly
enhanced lipid accumulation. 101 The pentose phosphate pathway (PPP) is another source for NADPH
that leads to improved lipid productivity when up-regulated in Y. lipolytica. 102
Overexpression of acyl-carrier protein (ACP) or 3-ketoacyl ACP synthase, together with fatty acyl-
ACP thioesterase, in Haematococcus pluvialis improved FA synthesis and was significantly correlated
with monounsaturated FA (MUFA) synthesis and polyunsaturated FA (PUFA) synthesis. 103 In S.
cerevisiae, overexpression of three fatty acid biosynthesis genes, acetyl-CoA carboxylase (ACC1), fatty
acid synthase 1 (FAS1) and fatty acid synthase 2 (FAS2), led to accumulated lipids of approximately 17%
of the dry cell weight. 104
Figure 2: Fatty acid synthase FASII. Acetyl carboxylase (ACC), Acetyl transferase (AT), Ketoacyl synthase (KS), ketoacyl reductase (KR), Dehydratase (DH), Enoyl reductase (ER), malonyl/palmitoyl transferase (MPT), and domains acyl carrier protein (ACP).

Generation of Microbial Oil SCIENTIFIC BACKGROUND A Process Engineering Approach
M . A . M a s r i , 11
Once saturated C16:0 and C18:0 fatty acids are initially synthesized, C16:0 and C18:0 are successively
moved into the endoplasmic reticulum (ER) where the desaturases and elongases are located. In the
ER, a series of desaturation and elongation steps begin. In general, elongase complexes have b-
ketoacyl-CoA synthase (KCS), b-ketoacyl-CoA reductase, b-hydroxyacyl-CoA dehydratase and enoyl-
CoA reductase activities.105 The first step of these reactions is Δ9 desaturase to produce the mono-
unsaturated oleic acid (C18:1, ω-9). Oleic acid (OA) is first esterified with phospholipids, such as PC, to
undergo the next desaturation step with Δ12 desaturase. Resultant linoleic acid (LA) (C18:2, ω-6) may
subsequently be converted into α-linolenic acid (ALA) (C18:3 ω-3) via Δ15 desaturase. OA, LA and ALA
separately go through sequential desaturation (by; Δ6, Δ5 and Δ4 desaturases) and elongation (various
elongases) for the synthesis of all poly unsaturated fatty acids (PUFAs) (Figure 3).
Figure 3: Biosynthesis of v-6 and v-3 PUFAs in yeasts starting from saturated stearic acid and going through successive desaturations and elongations. D: desaturases, Elo: elongases, ADA: adrenic acid, ALA: a-linolenic acid, DPA: docosapentaenoic acid, EDA: eicosadienoic acid, ETA: eicosatetraenoic acid, ETEA: eicosatrienoic acid, LA: linoleic acid, OA: oleic acid, SA: stearic acid, and SDA: stearidonic acid.
Out of five different Δ5 desaturases overexpressed in S. cerevisiae, Δ5 desaturases from P.
tetraurelia were shown to be superior in arachidonic acid (ARA) and eicosapentaenoic acid (EPA) up-
regulation. 106 PUFA production in Y. lipolytica has been extensively studied. GLA production was
enhanced by overexpressing Δ12 and Δ6 desaturases in M. alpine, 107 while overexpressing Δ4, Δ5, Δ6
and Δ17 desaturases resulted in DHA production. 108, 109 EPA was also produced by overexpressing Δ12,
8, 17 and 17 desaturases and C16-18 elongases.110, 111 In contrast, few reports have demonstrated

Generation of Microbial Oil SCIENTIFIC BACKGROUND A Process Engineering Approach
M . A . M a s r i , 12
production of PUFA from C. oleaginous. ALA production was improved by expression of Δ9 elongase
and Δ12 desaturase in C. oleaginous. 112
Figure 4: Triacylglycerol synthesis starting from dihydroxyacetone phosphate (DHAP) and glycerol-3-phosphate.
Fatty acids are moved into the ER endoplasmic reticulum and the outer mitochondrial membrane
where they are activated by acyl CoA synthase to be attached to the glycerol backbone and form TGs.

Generation of Microbial Oil SCIENTIFIC BACKGROUND A Process Engineering Approach
M . A . M a s r i , 13
The Kennedy pathway, which describes TG synthesis via various acyltransferases (i.e., glycerol-3-
phosphate acyltransferase, GPAT; lysophosphatidic acid acyltransferase, LPAAT; diacylglycerol
acyltransferase, DGAT; lysophosphatidylcholine acyltransferase, LPAT) takes place in the ER.
Sn-Glycerol-3-phosphate (G3P) has been suggested to play an important role in TAG biosynthesis as
it is the glycerol backbone precursor. Glycerol can be considered a source for G3P. Glycerol first passes
through the cell membrane via the glycerol/H1-symporter encoded by STL1. 113, 114 Glycerol kinase (GK)
catalyzes glycerol phosphorylation to G3P. 115 Alternatively, G3P is produced during the glycolysis
metabolic pathway.
Glucose is phosphorylated by hexokinase to form α-D-glucose 6-phosphate, which isomerizes to β-
D-fructose 6-phosphate via glucose-6-phosphate isomerase. A second phosphorylation step by
phosphofructokinase occurs on fructose 6-phosphate to synthesize fructose 1,6-bisphosphate.
Fructose-bisphosphate aldolase breaks down fructose 1,6-bisphosphate into dihydroxyacetone
phosphate (DHAP) and glyceraldehyde 3-phosphate (GALP). Finally, G3P is synthesized by reducing
dihydroxyacetone phosphate (DHAP) performed by glycerol-3-phosphate dehydrogenase (GPDH,
encoded: GPD1 and GPD2). Glycerol generated upon hydrolyzing fats with glycerol kinase can be
converted to G3P by phosphorylation as an additional source of G3P. Overexpression of G3P
dehydrogenase in Y. lipolytica results in increased G3P, which leads to increased TG accumulation. 116
Once generated, sn-glycerol-3-phosphate is subsequently esterified with a long-chain acyl-CoA as
the initial step of the synthesis of TGs and PLs. 117, 118 This esterification is catalyzed by sn-glycerol-3-
phosphate acyltransferases (GPATs, encoded: Gpt2/Gat1 and Sct1/Gat2), forming 1-acyl-sn-glycerol 3-
phosphate (lysophosphatidic acid LPA). LPA can also be synthesized from acylation of
dihydroxyacetone phosphate by a two-step reaction involving sn-glycerol-3-phosphate
acyltransferases followed by 1-acyldihYdroxyacetone-phosphate reductase (AYPR, encoded: Ayr1).119
LPA is subsequently acylated at position sn-2, making 1,2-distearoyl-sn-glycero-3-phosphate
(phosphatidic acid PA) via lysophosphatidic acid acyltransferase (LPAAT, encoded: Slc1, Ale1/Slc4). PA
hydrolysis to diacylglycerols (DGs) and phosphate is mediated by phosphatidate phosphatase (PAP,
encoded: Pah1). 120, 121 Diacylglycerol acyltransferase (DGA, encoded: Dga1 and Dga2) catalyzes the
terminal reaction in the acyl-Co A Kennedy pathway and converts DGs to TGs via esterification with a
FA-CoA. A second pathway for TG formation in yeast is mediated by lecithin cholesterol acyl transferase
(LCAT encoded: Lor1), which is esterified by lysophospholipids, such as PC and PE, to DG. 122, 123
GPAT is one of the limiting factors in triacylglycerol biosynthesis. 124 While no work was performed
on yeast, overexpression of GPAT in Arabidopsis thaliana results in increased seed oil. 125 DGA is
another limiting factor that has received extended efforts and work. Lipid accumulation was enhanced
in the model yeast S. cerevisiae when DGA1 was overexpressed alone and in combination with FAA3

Generation of Microbial Oil SCIENTIFIC BACKGROUND A Process Engineering Approach
M . A . M a s r i , 14
(long chain fatty acid-CoA ligase 3). 126, 127 Overexpression of DGA1 in Y. lipolytica yielded a 4-fold
increase in lipid content. 95 Lipid accumulation of 90% (w/dwbiomass) was recorded in Y. lipolytica by
overexpressing a number of genes involved in lipogenesis, i.e., ACL, AMPD MAE, DGA1 and DGA2. 128
In contrast to DGA1, Lor1 has not been tested in oleaginous yeast. In fact, Lor1 has several advantages
over DGA1. Lor1 is capable of remodeling membrane phospholipids, resulting in reducing the amount
of PC (converts PLs to TGs) and subsequently enhancing LD formation. 129, 130 Secondly, Dga1
significantly contributes to TAG synthesis during the stationary phase. In contrast, Lro1 activity is more
prominent in the exponential growth phase. 131 This characteristic advantage could improve lipid
productivity, even in a rich medium.
Up-regulation of lipogenesis genes results in deactivation of ATP-dependent citrate lyase (ATP-CL),
subsequently leading to increased citrate concentration. 128 Citrate is either secreted into the growth
medium or accumulated in the cytosol, causing inhibition of 6-phosphoro-fructokinase (Embden-
Meyerhof-Parnas catabolic pathway) and leading to intracellular 93 or extracellular polysaccharide
accumulation, causing high viscosity in the growth medium. 132 Utilization of acetate as feedstock via
ACS/ACL could also inhabit ATP-CL, as acetyl-CoA is the mutual product.
Now TGs have been synthesized, and LDs are about to emerge. Several models have descried how
synthesized TGs contribute to LD biogenesis. The most popular model hypothesizes that TGs, at very
low concentration, are likely to be assimilated in parallel with phospholipids within the ER
membrane.133 As TG content exceeds the solubility limit, TGs are sequestered and oiled out between
the two leaflets of the ER membrane. At this step, TG concentration is estimated at 3-7% (w/dwcell)
(Figure 5). 134, 135 A mere accumulation, TGs coalesce to form lipid lenses through laterally diffusing
within the ER leaflets. In terms of terminology, lipid lenses are called prenascent LDs. Electron
microscopy has recently been used to observe lipid lens formation in yeast immediately after induction
of droplet formation via overexpression of fat storage-inducing transmembrane (FIT) proteins. 136 A
homo-oligomeric integral membrane protein called seipin (encoded: FLD1) destabilizes the ER PL
bilayer, resulting in increased prenascent droplet stabilization that permits them to mature. 67, 137
As prenascent LDs are increased in size, ER membrane deformation toward the cytosol occurs. This
vectorial deformation toward the cytosol could simply be explained by the slight differences in surface
tension between the two ER leaflets, which are sufficient to induce vectorial budding in model systems.
138, 139 In fact, many factors, such as phospholipids and proteins, control cytosol-oriented vectorial
deformation. 15 FIT2 and its orthologs in yeast, Yft2p and Scs3p, play an important role in vectorial
budding. These enzymes directly bind to DGs and TGs and have weak PA activity. The results have
shown that deletion of these two genes (Yft2p and Scs3p) results in the failure of LDs to emerge from

Generation of Microbial Oil SCIENTIFIC BACKGROUND A Process Engineering Approach
M . A . M a s r i , 15
the ER. 136 Perilipins, in yeast Pln1 p, is another protein family that contributes to ER membrane
deformation. 140
The surface area of the ER outer leaflet then expands, as TGs are accumulated in the core of
prenascent LDs, resulting in growth of the droplet, which becomes largely surrounded by
phospholipids. In yeast, growth of prenascent LDs is accompanied by transmigration of Dga1p from RE
to the LD surface. 141 In the absence of LDs, Dga1p is distributed throughout the ER.142 Thus, it is possible
that TGs are synthesized throughout the ER and diffuse through the bilayer to LD formation sites.
Alternatively, enzyme activity for TG synthesis may occur specifically at regions of the ER where LDs
form. 143
Above a certain size, depending on TG and PL composition, lipid lenses in the ER are predicted to
be unstable and bud; however, it is the mechanism for how the prenascent LDs become nascent LDs
has only recently been clarified. 143 In most prevailing budding modules, the mechanism of LD
formation is similar to dewetting due to thermal fluctuations. 144 Nascent LDs could also form by
transformation of ER-associated vesicles. 145, 146
Figure 5: Lipid droplet formation (Source: modified from “The EMBO Journal (2018) 37: e98947”). 67
The smallest mature cytosolic LDs have diameters in the range of 250–500 nm, which will increase
in size as more TGs are continuously built. 79 LDs are often found in proximity to the ER. There is
significant evidence that mature LDs are separated from the ED, 67 and in some instances, LDs build a
connection to the ER through ER–LD membrane bridges. 147 These ER–LD connections are playing an
important role in the migration of TGs from the ER to LDs, as well as in relocation of enzymes necessary
for TG synthesis from the ER to the LD surface for in situ TG synthesis. 148, 149 In both cases, the LDs will
grow to a great size. There are other models projecting how LDs might grow, such as through LD-LD
fusion. 150
In fact, LD-LD fusion is remarkably uncommon in normal cells under regular circumstances;
however, this is not the case when cells are under extreme conditions. In this respect, prototypes based
on LD surface modulation or protein-intermediate direct fusion have been suggested. 151

Generation of Microbial Oil SCIENTIFIC BACKGROUND A Process Engineering Approach
M . A . M a s r i , 16
Modulating the LD surface by decreasing the amount of PC and increasing the amount of PA
improves homotypic LD-LD fusion. 78, 152 Some surfactants induce LD-LD fusion as well. 153 Surfactants
such as 3-(2-Ethylphenoxy)-1-[[(1S)-1,2,3,4-tetrahydronaphth-1-yl] amino]-(2S)-2-propanol oxalate
salt (SR 59230A), DMSO and N-[2-(p-Bromocinnamylamino)ethyl]-5-isoquinolinesulfonamide
dihydrochloride (H-89 dihydrochloride hydrate) have been proven to enhance LD-LD fusion. 153
Figure 6: Surfactants can be used to enhance lipid droplet fusion. (a) N-[2-(p-Bromocinnamylamino)
ethyl]-5-isoquinolinesulfonamide dihydrochloride (H-89 dihydrochloride hydrate). (b) 3-(2-
Ethylphenoxy)-1-[[(1S)-1,2,3,4-tetrahydronaphth-1-yl] amino] -(2S)-2-propanol oxalate salt (SR
59230A).
Direct fusion of LDs can be accrued either by removing phospholipids by COPI or by fat-specific
protein (FSP27) mediating permeation. 143
On the LD surface, coatomer protein (COP-I) machinery plays an important role in establishing
connections to the ER. 148, 154 COPI proteins act on LD surfaces by removing phospholipids, thereby
increasing LD surface tension and favoring the fusion of LDs with other membranes. 154 COP-I (encoded
by Arf1-C159S-K181C in humans) has been produced in E. coli where purified protein was tested in-
vitro (on budded Nanodroplets) and in-vivo (in S. cerevisiae). In both experiments, COP-I was able to
increase the surface tension of LDs to the water, making LDs subsequently float on the top of the water
phase. 154
The permeation module is supported by localization of FSP27 to the LD surface. FSP27 builds an LD–
LD contact site where TAG can be freely exchanged through Fsp27-enriched LD contact sites. 155 Fsp27
directly binds to triglyceride lipase (ATGL) and inhibits lipolysis, which is considered a second
mechanism that helps Fsp27 increase LD sizes. 156 Overexpression of FSP27 in cells leads to increased
LD size, whereas depletion abolishes LDs with diameters larger than ~12 µm in adipocytes.
3.2 Factors that influence LD size Many factors have been identified that affect LD size. Such factors include proteins that are directly
involved in TG/SE synthesis/hydrolysis and LD associated proteins or phospholipids. 83

Generation of Microbial Oil SCIENTIFIC BACKGROUND A Process Engineering Approach
M . A . M a s r i , 17
3.2.1 Phospholipids Phosphatidylcholine (PC) and phosphatidylethanolamine (PE), as a general rule, are the major
components of most LDs in yeast cells 74 with little phosphatidylserine (PS) and phosphatidic acid (PA)
found. PC acts as a surfactant to prevent LD coalescence, resulting stunted LD growth. 152 Likewise,
yeast mutants with severely impaired PC synthesis (mutants with opi3Δ, ino2Δ, and ino4Δ) showed
increasing levels of PA and synthesized supersized LDs (SLDs) and consequently enhanced TG
formation.78 In fact, a small amount of PA, ~2% of total PLs, is sufficient to trigger LD coalescence in
vitro.78 Therefore, it believed that the size of LDs can be increased by reducing the amount of PC and/or
by increasing the amount of PA. Cholesterol and sphingolipids are additional types of lipids that localize
to the surface of LDs, but where they impact LD growth remains to be explored. 74
Upon starvation, yeast cells convert phospholipid intermediates and sterols to neutral lipids, which
in turn can be hydrolyzed to release fatty acids and sterols for immediate membrane synthesis and cell
growth when glucose becomes available. 78 Therefore, starvation might decreased PC synthesis, and
consequently, an increased PE to PL ratio (or a decrease in PC/TAG) has been associated with SLD
(supersized LD) formation. 157
3.2.2 Glycosylation proteins Glycosylation proteins, including anp1, erd1, mnn10, mnn11, och1, ost4 and pmr1, significantly
restrict the growth of LDs. 76 In fact, glycosylation proteins remarkably impact the lipid profile and
elevated TGs/SEs when compared to wild type. Mutants defective in anp1 and pmr1 display increased
synthesis of both TGs (by 30% and 70%, respectively) and SEs (by 40% and 110%, respectively). In
contrast, deletion of erd1, och1 and ost4 resulted in a 70–100% increase in TG synthesis only.76 The
same effect was noted when glycosylation inhibitors were used. Chemicals such as Tm (Tunicamycin)
and BFA (Brefeldin A), which inhibit N-linked glycosylation, induce neutral lipid synthesis and LD
formation at low concentrations (Tm: 10 μg/ml, BFA: 75 μg/ml). 158
3.2.3 Fsp27 and CIDE proteins Two protein families are LD-associated proteins that have recently been reported to regulate lipid
storage and energy homeostasis in mice and humans.159 The first family is the fat-specific protein
(Fsp27) and cell death-inducing DFF45-like effector (CIDE), which includes Cidea and Cideb. Fsp27-
mediates LD growth by merging smaller donor LDs slowly into larger acceptor LDs. 155
3.2.4 Perilipin 1 The perilipin family (PLIN) is one of most extensively characterized proteins localized to LD surfaces.
Perilipin1 is highly expressed in white adipocytes, where it coats giant and unilocular LD. 160, 161
Perilipin1 is a member of the PAT family (such as perilipin, adipophilin and TIP47) and includes
perilipins1-5. Perilipin1 and 2 primarily localize to the surface of normal LDs, and perilipin1 displaces

Generation of Microbial Oil SCIENTIFIC BACKGROUND A Process Engineering Approach
M . A . M a s r i , 18
all perilipin2 when LDs become giant, implying that perilipin1 may promote the formation of giant LDs.
This hypothesis was supported by findings that perilipin1-deficient mice exhibit dramatically reduced
adipocyte and LD sizes. 162, 163 Perilipin3, 4 and 5 are stable in the cytoplasm and relocate to nascent
LDs upon increased TAG synthesis. 164
Additionally, the oleosin family is located on LDs with high lipid content. Overexpression of Oleosin
and perilipin family members (PLIN1, ADRP/PLIN2 and TIP47/PLIN3) in Saccharomyces cerevisiae cells
promotes the sequestration of neutral lipids from the ER bilayer, thereby inducing LD formation.165, 166
One of the suggested mechanisms for Perilipin1 to promote unilocular LD formation is through
activation of Fsp27. 167
3.2.5 Seipin (Fld1p) LD sizes were enlarged by approximately 30% in Saccharomyces cerevisiae lacking FLD1 (caused by
the deletion of YLR404W). Moreover, small LDs from fld1Δ cells demonstrate significantly enhanced
fusion activities of 60% both in vivo and in vitro. 77 The fld1Δ cells were identified, and most of the
mutated genes are known to regulate synthesis of phospholipids. This effect can be explained given
that Fld1/seipin may modulates PA metabolism. 78, 168 Levels of seipin/Fld1p are also adversely
correlated with TAG storage in yeast. 169
3.2.6 FITM1&2 Fat storage-inducing transmembrane proteins (FITM) are integral ER membrane proteins produced
in yeast to human species. Overexpression of FITM2 significantly increases TAG storage and droplet
size in mouse liver and in cultured cells, and this effect was enhanced when a gain of function mutant
of FIT2 was expressed. 170
3.2.7 Acyl-CoA synthetase 3 Acyl-CoA synthetase 3 promotes lipid droplet biogenesis in ER microdomains. ACSL3 plays an
important role in channeling fatty acids into nascent LDs. 75 Absence of ACSL3 was shown to
significantly reduce nucleation of emerging LDs, short- and long-term accumulation of neutral lipids,
and the size and number of mature LDs.75 ACSL3’s crucial interactions with scaffolding proteins, such
as Spartin/SPG20 and AUP1, determine LD composition, size, and number. 171, 172 Accordingly, ACSL3
has been found in complexes with neutral lipid synthesis enzymes. 149 Furthermore, ACSL3 plays a
dynamic role in relocation of the enzyme between the ER and LDs, which may represent a cellular
homeostatic sensor given that ACSL3 regulates the activity of key lipogenic transcription factors, such
as PPAR-ɣ, ChREBP, SREBP1-c, and LXR-α. 173

Generation of Microbial Oil SCIENTIFIC BACKGROUND A Process Engineering Approach
M . A . M a s r i , 19
4 Challenges in lipid production from oleaginosus yeast
In the present state-of-art, several technical and environmental challenges are restricting any
sustainably viable industrial manufacturing of MO. Costly feedstock procurement, extended
fermentation times, complex lipid recovery, and poorly lipid titer are the major technical challenges.
From the environmental perspective, application of toxic solvents, high energy demand (indirect CO2
emission), and direct CO2 emission during the fermentation, increases the associated GHGs emission
with MO production.
Therefore, MO processes need to be improved in a way, that all technical and environmental
challenges are taken into consideration. However, it is vitally important to implement keep-
performance-indicators (KPIs) to continually evaluate and monitor any changes within the MO process
design. Such KPIs can be; a process cost assessment (such TEA methodology) and environment impact
analysis (such LCA framework).
4.1 Techno-economic analysis (TEA) and MO cost: TEA is a methodology framework to analyze the technical and economic viability of a production
process. TEA normally combines process modeling, engineering design and economic evaluation. The
initial step to prepare a TEA, is to identify the mass flux through consecutive functional units and define
the equations for any mass conversion. The in-silico process modeling is then the next step, where each
functional unit is represented by; machinery, mass inputs, mass outputs, energy balance, men-power
need, time, and consumables. The equipment sizing, mass- and energy fluxes need to be assessed using
well known procedures and rules of thumb. Alternatively, a modeling software such SuperPro Designer
(SPD) or Aspen can be applied, where an internal mathematical function is integrated. Normally,
different scenarios for mass- and energy balance are taken in consideration to epitomize an optimistic,
pessimistic, and an average (baseline) scenarios. Consequently, capital, operation, and raw material
costs can be estimated. As last step, cost sensitivity to highest impacted parameters is calculated.
To that end, TEA offers a reliable framework for mass conversion, energy consumption, waste
emission, and thus overall process efficiency.
TEA methodology was applied to estimate the cost of MO. In this respect, microbial oil expected
prices from Candida curvata were estimated at US$3000/ton based on lactose fermentation excluding
the raw materials cost. 174 Recently, microbial oil from R. toruloides for production and biodiesel from
glucose carried an estimated production cost of US$5500/ton oil and US$5900/ton biodiesel 175, which
is not feasible in the current market where vegetable oil prices are around US$500–900/ton and
biodiesel is at US$1220/ton. 175 In addition, waste treatment costs were not considered in these
techno-economic studies. This additional cost not only extensively impacts the total lipid price but

Generation of Microbial Oil SCIENTIFIC BACKGROUND A Process Engineering Approach
M . A . M a s r i , 20
heavily impacts the environment results in fresh water depletion and eutrophication. The microbe
meal, as a coproduct, has a price of around US$400–800/ton. 176 This coproduct can be considered as
extra cost savings. Thus, SCO biorefinery would be slightly more encouraging (~US$5000/ ton oil) but
would still not be viable. Production of high-value FAs, such as ARA, GLA, DHA, or upgrading the lipid
for high-value products, such as biolubricants or food/ pharmaceutical targeting oleochemicals, could
improve the economic viability of SCO.
4.2 Technical challenges: Improvement of lipid yield, productivity, and titer is critical for making SCO economically feasible.
Diauxic growth effects are one of the major challenges that reduce productivity. Yeast grown in
nutrient-rich media exhibit rapid cell growth associated with high phospholipid production and
correspondingly low levels of neutral lipids. 71, 177 As nutrients become exhausted, yeast respond to this
imminent starvation by decreasing their phospholipid production and shunting precursor lipids into
the synthesis of TGs at the ER, corresponding to a burst of LD biogenesis. This transition phase from
fermentation to respiration is defined as the diauxic shift. 79, 178 While the first phase requires
approximately 2-3 days, and biogenesis of large LDs first appear on the third to fourth fermentation
day. Diauxic growth effects elongate the fermentation time where lipid productivity is decayed,
operation cost is increased and substrate-to-lipid yield is reduced.
Low lipid productivity and low lipid titer are primarily associated with utilization of a complex sugar
matrix, such as lignocellulosic hydrolysates. 179, 180 This can be attributed to a limited ability to control
C:N, low sugar concentration, presence of sugar mixtures and inhibitor formation during pretreatment,
such as furfural, hydroxymethylfurfural (HMF), VFAs, phenolic compounds, and other chemical species.
181 An effective fermentation system can be established once yeast growth and lipid accumulation are
dissociated from the C:N ratio. Such decoupling can reduce the side effect of the sugar mixture in
complex media. Managing inhibitor formation as well as developing yeast mutants that are capable of
tolerating them has been the subject of considerable research. An approach toward developing
biomass-specific enzyme systems offers an inhibitor-free hydrolysate ditto that minimizes processing
steps, such as pretreatment/detoxification. 179, 180
Lipid extraction and lipid purification from intracellular compartments involves harvesting of
microbial cells from broth, either by drying the cells or forcing cell disruption then lipid extraction.
Frequently used cell-harvesting techniques include centrifugation, filtration, and flocculation. 182, 183
The lower the cell density obtained, the more expensive the harvesting. Likewise, high lipid content
leads to technical difficulties, restricting centrifugation and flocculation, as the cell specific gravity is
less than water.

Generation of Microbial Oil SCIENTIFIC BACKGROUND A Process Engineering Approach
M . A . M a s r i , 21
After harvesting, drying yeast cells practically improves lipid recovery during extraction compared
to disrupted wet cell biomass. 184 Since the cell drying is a high-energy process therefore, several
methods have been investigated, such as high-pressure homogenization, bead beating,
ultrasonication, microwave treatment or chemical hydrolysis, to efficiently disrupt wet microbial cells.
184-186 Alternatively, enzymatic hydrolysis has previously been applied to enhance cell rupture in
oleaginous yeasts. 183, 185, 187-189 Outmoded organic solvent based lipid extraction methods, such as Bligh
and Dyer and the Soxhlet, are still implemented using chloroform, methanol, or even hexane even after
such enzymatic treatment. 186, 190 Supercritical liquids, such as SCCO2, are alternatively applied in a state
of organic solvents to avoid energy-intensive solvent recovery. 184-186, 191 The high pressure applied in
such alternative methods is still an energy consuming process. Hydrothermal liquefaction has been
used for algae (at 300°C for 5 min) and for yeast (at 180°C for 5 min). 192, 193 Other energy-consuming
extraction methods that can be applied include pyrolysis, gasification, and direct combustion, which
are reviewed by Millege et al. 194 Upscaling of such mechanical stress, temperature shock, or chemical
treatment results in additional complications/cost in the downstream process. 195, 196 It is a challenging
task to apply such methods at the industrial level due to cost issues and lack of environmental
sustainability.
4.3 Life cycle assessment (LCA) and environmental challenges:
4.3.1 Life cycle Assessment (LCA) LCA or cradle to the grave analysis is a methodology framework to evaluate environmental impacts
of a product's life comprising; raw material extraction, raw materials processing, manufacture,
distribution, use, repair and maintenance, and later on disposal or recycling.
According to ISO 14040 guidelines, LCA is carried out in four phases which are; goal and scope,
inventory analysis, impact assessment, and interpretation of a life cycle. At the initial phase (goal and
scope phase), a clear system boundary and serving criteria for the in-focus part of the product-life-
cycle should be defined. The inventory analysis is concerned with the description of material- and
energy flux within the defined system boundary. It is very important at this stage to consider the
process; interaction with environment such as; consumed raw materials and the emissions to the
environment. Detailed inventory analysis data was used for impact assessment of each functional unit
on all environmental impact categories. The impact assessment is evaluated by normalization and
eventually also by weighting. Finally, interpretation of a life cycle involves critical review,
determination of data sensitivity, and result presentation.

Generation of Microbial Oil SCIENTIFIC BACKGROUND A Process Engineering Approach
M . A . M a s r i , 22
Attributional and consequential approaches are the main approaches to proceed with LCA. By the
attributional approach, inputs and outputs are attributed to the functional unit of a product system by
linking and/or partitioning the unit processes of the system under the specified normative allocation
rule. In consequential approach, activities in a product system are linked so that the activities are
included in the product system to the extent that they are expected to be changed as a consequence
of a change in demand for the functional unit.
Many methodologies can be used to perform an LCA. The full LCA involves all functional units of
specific product from resource extraction (cradle) to use phase and disposal phase (grave) so called,
cradle-to-grave method. A partial LCA can be limited to certain part of the product life such as: cradle-
to-gate, which focus on steps from resource extraction (cradle) to the factory gate(gate). Gate-to-gate
is seeking at only one value-added process in the entire production chain. Gate-to-gate modules may
also later be linked in their appropriate production chain to form a complete cradle-to-gate evaluation.
4.3.2 Environmental challenges for MO production Application of organic solvents leads to contamination in the water phase, along with residual
biomass and lipids. Traces of toxic organic solvents prevent recycling of side products under economic
constraints. Additionally, application of organic solvents negatively affects quality of the finished
product and restricts applications of the products in foods and pharmaceuticals. 196 Hence, the
complexity of advanced solvent removal is considered an extra cost and energy squandering.
Moreover, application of hydrothermal methods results in the formation of inhibitory compounds,
which again restrict recycling of the water phase. 193
Carbon dioxide emission is one of the major environmental challenge for any fermentative process.
In fact, 50-60% of total input carbon is converted to CO2, where the rest is fixed within the biomass
and lipid. In this respect, released CO2 can be used as feedstock for microalgae or acetic acid producer
microorganism such as Acetobacterium woodii. However, due to the variation in the growth rate
between the yeast and microalgae, direct transformation will result in many technical problems and
reduce the efficiency. Therefore, such transformation needs an intermediate step, which captures the
CO2 and released at appropriate rate.
Green sorbents for carbon dioxide (CO2) capturing has widely been reported. These reports focused
on synthesis/use bio-feedstocks, 197, 198 metal organic frameworks (MOFs) 198-200 and synthetic oligomers
201. In co-work with Dr. Qarousha, we exploited a sustainable oligochitosan dissolved in DMSO as a
green sorbent for CO2 capturing.

Generation of Microbial Oil SCIENTIFIC BACKGROUND A Process Engineering Approach
M . A . M a s r i , 23
In fact, the key to an economically successful SCO platform is to shorten and simplify cultivation and
downstream methods, which could significantly reduce production cost. 202

Generation of Microbial Oil SCIENTIFIC BACKGROUND A Process Engineering Approach
M . A . M a s r i , 24
5 Work objectives
In this work, we aimed to establish a new integrated process chain for production of yeast-based
lipids, enabling uncoupled, monoauxic biomass growth and lipid accumulation with short fermentation
time. To apply an economically feasible and environmentally sustainable process, monoauxic growth
should be accomplished in a single step, in-situ and solvent free extraction to recover downstream lipid
processing, permitting complete recycling of water and side product streams. This process permits
operation in continuous or batch fermentation mode using a sustainable system that incurs no land
use changes, ecosystem destruction, or biodiversity reduction that is associated with utilization of
terrestrial biomass. Therefore, we aimed to utilize marine macrophyte carbon sources, such as
seagrass and macroalgae, in co-fermentation with acetic acid. A comprehensive techno-economic
analysis (TEA) and life cycle assessment (LCA) of the new yeast lipid production process needs to be
performed to validate our findings.

Generation of Microbial Oil SCIENTIFIC BACKGROUND A Process Engineering Approach
M . A . M a s r i , 25
6 Discussion
Contemporary societies heavily rely on fossil fuels as their major source of energy, which
accompanied by high CO2 emission and subsequent increases the average surface air
temperatures on Earth. Renewable energy sources, such as biofuels, are desired to displace
fossil fuels as they have a lower carbon content. In this respect, alternative bio-based
technologies seek to supply fuels in a cost-effective and sustainable manner, while contributing
to the reduction of greenhouse gases. Current generation biofuels are completely dependent
upon crop oils, such as palm oil, resulting in serious issues for biodiversity. Lipids from
oleaginous microorganisms have great potential to displace crop-derived oils as a biofuel
substrate, but many restrictions prevent their economical and industrial application.
The current project primarily addressed the key technical and environmental constraints
concerning single cell lipid production from oleaginous yeast related to sustainable feedstock,
time-effective biomass and lipid yield, as well as low-energy-demand for downstream
processing. Additionally, environmental restrictions regarding solvent needs and fermentative
CO2 emission. Moreover, publication concerning lipid production form microalgae, and
screening and characterization of extracellular proteases, contributed to the thesis were
performed in collaboration with different partners.
With respect to a sustainable feedstock, we used marine biomass to avoid any associated
land use changes or any negative impacts to the Earth’s ecosystem. Two published manuscripts
discuss the conversion of monosaccharides from marine macrophytes (Seagrass 41 and
Macroalgae 42) to yeast-based lipid production. In both work, MB was liquefied via a solo
enzymatic hydrolysis without any chemical treatment. Readily available beach-cast seagrass
provides a potentially sustainable feedstock for cost effective bioenergy/biofuel production.
Among the studied seagrass samples, P. oceanica from the Mediterranean Sea displays the best
lipid productivity, exceeding well-documented minimal nitrogen media. 41 Likewise, marine
macroalgae, such as U. lactuca (green algae) and L. digitata (brown algae), offer a prospective
feedstock for bio-oil production from yeast. In this work. L. digitata exhibited high biomass and
lipid productivity. 42
Application of macroalgae or seagrass in biotechnological processes has been
demonstrated. In previous reports, chemical hydrolysis 203, chemo-enzymatic hydrolysis 204,
biological degradation 205 and anaerobic digestion 206, 207 were applied to hydrolyze and liquefy

Generation of Microbial Oil SCIENTIFIC BACKGROUND A Process Engineering Approach
M . A . M a s r i , 26
the macroalgae biomass. Resulted sugar- / VFAs-rich hydrolysates were introduced to be
bioenergy generation, encompassing biogas (methane)207, bio-ethanol 208, acetone and bio-
butanol generation 209. To the best of our knowledge, beach-cast seagrass and macroalgae
hydrolysates have not been investigated in the field of MO production. Nevertheless, solid
fraction, which is the residual biomass after biomass hydrolysis, has been completely ignored.
There is no value adding applications for this fraction, which negatively impact the overall
process cost. To present, the most widespread application for this hydrolysis residue is an
application as fertilizer or animal feed 210, 211.
In the current work, we avoided any chemical pretreatment via stablishing an efficient
enzymatic hydrolysis process that can stand alone for selective seagrass, macroalgae and yeast
hydrolysis. 41, 42, 80 Even more, we have demonstrated that the solid macroalgae residue is able
to recover about 0.6 mmol g-1 of heavy metals per dry biomass with selectivity to Pb=Ce=Cu>Ni.
Additionally, the non-lipid yeast biomass, the yeast cell-wall, is applied for first time as a
unique sugar source. The enzymatically produced yeast hydrolysate displays a sugar/nutrition
rich medium for yeast fermentation, resulting in high biomass and lipid productivities 2.4 g L-1
h-1 (Biomass: 147 g L-1, Lipid 77% (w/w), Time: 42 h). 80
To compare current work lipid productivity with previous reported one, the best lipid
productivity of Lipomyces starkeyi was 0.12 g L−1 h−1 (biomass: 31.5 g L-1, lipids: 55%
[wlipid/dwbiomass]) in a co-fermentation of 90 g L-1 cellobiose and xylose. 212 Using corn stover
hydrolysate as the medium, a lipid productivity of 0.23 g L−1 h−1 (biomass: 48 g L-1, lipids: 34%
[wlipid/dwbiomass]) was reported with Rhodotorula graminis.213 Similarly, Rhodosporidium
toruloides Y4, was cultivated in a 15-L stirred-tank fermenter on glucose, afforded a lipid
productivity of 0.54 g L−1 h−1 (biomass: 106.5 g L−1, lipids: 67.5% [wlipid/dwbiomass]).214
A lipid productivity of 0.66 g L−1 h−1 (biomass: 168 g L-1, lipids: 75% [wlipid/dwbiomass]) was
recorded of C. oleaginosus based on pH-stat acetic acid fermentation. 55 Yarrowia lipolytica
NS432 showed a productivity of 0.73 g L−1 h−1 (biomass: 110 g L-1, lipids: 77% [wlipid/dwbiomass]) in
fed-batch glucose fermentation. 215 However, the best yield reported in the literature was
obtained in an oxygen-rich batch culture of Rhodotorula glutinis, with a productivity of 0.87 g
L−1 h−1 (biomass: 185 g L-1, lipids: 40% [wlipid/dwbiomass]). 216
Acetic acid, as feedstock, is another sustainable nutrient source since it can be generated
from ecologically sound starting materials, such as CO, waste gases, and CO2/H2 49-51 using
biotechnological processes (i.e., fermentation of Clostridium aceticum and Acetobacterium
woodii). 49, 50, 52, 53 At industrial scale, SEKAB, Sweden, demonstrates production of acetic acid

Generation of Microbial Oil SCIENTIFIC BACKGROUND A Process Engineering Approach
M . A . M a s r i , 27
from bioethanol, which was originally a second-generation cellulosic bioethanol from forestry
waste.
In fact, acetic acid fermentation has previously demonstrated as a sole feedstock for C.
oleaginosus cultivation. 21, 23, 54-57 In this respect, the application of acetic acid as the sole carbon
source results in considerably high intracellular lipid content (60–73%, wlipid/dwbiomass) with low
total biomass productivity, leading to poor overall oil yields. 23, 54, 56 Moreover, multistep, 21
continuous, 54 and pH-stat 55, 56 fermentations have been tested in order to identify the best
implementation of acetic acid as the sole carbon source feedstock. The pH-stat approach shows
promising lipid productivity. 55 However, constant feeding of costly yeast extract, peptone,
vitamins, and other nutrients in all pH-stat trials prohibits the economic development of this
process.
Some of the key achievements in the current work include the development of a monoauxic
co-fermentation system enabling simultaneous assimilation of sugar and acetic acid in rich-
based medium into yeast biomass and lipid. The co-fermentation freed TG biosynthesis from
nitrogen scarcity, which subsequently avoided classical diauxic fermentation and paved the way
to the flash (short, approximately 40-48 h) or continuous operation mode. 80
In return, a considerable fraction of feedstock is still converted to CO2 by yeast respiration.
Microalgae, in this respect, might be the optimal platform to assimilate released CO2 utilized to
build biomass and lipids. Our common work with Aquaculture Laboratory on Isochrysis sp.,
Nannochloropsis maritima and Tetraselmis sp shows that Isochrysis sp. contains approximately
29.3% and 18.4% (w/wtotal FA) monounsaturated and polyunsaturated fatty acids, respectively,
whereas random mutagenesis using ultraviolet-C results in significantly increased C16:0–C18:0
content compared to the wild type strain. 217
Relocation of CO2 from heterotrophic yeast to autotrophic algae was discussed in a
collaboration with our partner at the University of Jordan. In this collaboration, a CO2
chemisorption system was created. CO2 was captured on chitosan oligosaccharide/DMSO
(CS·HCl/DMSO) system based on reversible carbamato–carbonato bonds. For our part, the
biodegradation test revealed that degradation of approximately 80% of CS·HCl/DMSO was
achieved after 33 days. These results indicate that established chemisorption systems can be
considered as green sorbent. The CS·HCl/DMSO sorbent system has a capacity of 2.4 mmol CO2
per g of sorbent. 218
Development of downstream processing for lipid recovery was also a focus of the current
thesis. A single step catalytic cell-wall lysis via hydrothermal treatment (180°C, 10 min) was the
concern of a common publication with a catalysis research center in TUM. For my contribution,

Generation of Microbial Oil SCIENTIFIC BACKGROUND A Process Engineering Approach
M . A . M a s r i , 28
yeast biomass was analyzed, and yeast hydrolysate was evaluated as feedstock for bioethanol
production.
An enzymatic based downstream processing approach was established as part of the main
tasks in the LPOMAR project. A single in situ enzymatic treatment process was allowed holistic
cell lysis and lipid recovery/purification without the need for pretreatment or subsequent
application of an organic solvent. After such enzymatic treatment, moderate density-based
separation forces, such as centrifugation, will be sufficient to release 90% (w/w) of lipids as the
upper phase.
Enzymatic approaches have previously been applied to enhance the cell rupture of
oleaginous yeasts 185, 187-189. A partial enzymic hydrolysis followed by ethyl acetate lipid
extraction has recently been reported for Rhodosporidium toruloides. 219 In analogy, a process
termed enzyme-assisted aqueous extraction processing (EAEP) was applied for lipid extraction
in the microalgae Chlorella vulgaris, Scenedesmus dimorphus, and Nannochloropsis sp.. 220 In
the EAEP, a pre-treatment by ultrasonic irradiation and post-treatment by heating at 95°C were
required. These pre- / post-treatments considered as a high-energy consuming process thus it
is inapplicable at industrial scale. In 2011, a mix of different enzymes; papain, pectinase,
snailase, neutrase, alcalase and cellulase were optimized on the filamentous fungus Mortierella
alpina for arachidonic acid extraction. To support the hydrolysis procedure, an addition of
hexane was still required 187. Overall in the published processes, various pre-treatments have
been applied prior to the enzymatic cell lysis. Moreover, the lipids still have to be extracted
with an organic solvent to recover the triglycerides.
In the current work, the established enzymatic based downstream processing compromises
two enzyme treatments, while the initial step imposes a holistic cell-wall lysis performed by a
mixture of hydrolases, and second treatment inflicts cell emulsion systems, such as proteins.
The hydrolase mixture can be produced either by mixing of commercial enzyme activities as it
is described in our first patent filed with Clariant (related paper is still in preparation) or can be
produced in single preparation by filamentous fungus T. reesei where a yeast-selective
hydrolase system was produced using the yeast cell itself as an inducing system (the second
patent filed with TUM). 80
Following hydrolase treatment, a demulsification step is still needed. In both
patents/papers, a commercial protease was used. In the first patent with Clariant, we claimed
that DISSOLVAN® addition (Clariant) improves lipid recovery.

Generation of Microbial Oil SCIENTIFIC BACKGROUND A Process Engineering Approach
M . A . M a s r i , 29
In this regard, two common papers with marine biodiversity and biotechnology laboratory
were concerned with isolation and characterization of alkaline extracellular proteases from
Yarrowia lipolytica. 221, 222 This cured protease could be considered for the demulsification step
as an alternative to commercial proteases in a future work. From these publications, the
purified extracellular alkaline protease extracted from Yarrowia lipolytica show promising
stability and activities that may be used downstream for lipid recovery.
Finally, the main focus of this thesis was to establish an integrated operation for
bioconversion of acetic acid and sugar to sustainable lipids at maximum productivity with
minimal waste generation and energy consumption. In the suggested bioprocess, all side-
products were reintegrated into the main production route.
To gain a better understanding of our designed bioprocess, a techno-economic analysis
revealed that the cost gap compared to plant-based lipids was considerably reduced from $5.5
per kg lipid (in a previous study 175) to an estimated cost of $1.1-1.6 per kg lipid. Moreover, life
cycle assessment analysis assumed an emission of 3.56 kg CO2 equivalents for every 1 kg of
yeast oil produced. 80
The approaches established in this work link previous efforts to a forward-thinking optimized
approach. There are still many possible parameters to be optimized and metabolic
modifications that can be implemented to further improve productivity or change the fatty acid
profile.
Acetate-CoA ligase (ACL) directly transforms acetic acid into acetyl-CoA, which is further
converted to fatty acids. Some publications have shown that propionic acid or butyric acid
follow the same uptake pathway, resulting in alteration of the lipid profile and formation of
nonconventional fatty acids, such C15:0, C17:0 and C17:1.59 From this perspective, determining
which lipid profile can be obtained if the volatile fatty acid contains a double bound, functional
group or even side-chain is important. Moreover, manipulating this process through changes
in pH, temperature, pO2 content, and acetic acid concentration could enhance lipid productivity
and change the lipid profile.
Lipid productivity based on co-fermentation can also be boosted, whereas tool boxes
compromise process and genetic approaches. Fermentation conditions, modes, and media can
all play a role in enhancing lipid productivity. Genetic approaches, however, are still an essential
key. Overexpression of Acyl-CoA synthetase 3 accelerates acetate conversion to FA, promoting
TG biosynthesis and LD biogenesis. 75

Generation of Microbial Oil SCIENTIFIC BACKGROUND A Process Engineering Approach
M . A . M a s r i , 30
Enhancing yeast’s ability to uptake oligosaccharides together with monosaccharides is also
beneficial for improving lipid yield and reducing production cost, especially when the
lignocellulosic biomass is in focus. 223
Overexpression of Lor1 is another example that can reduce PL content and endorse TG formation.
129, 130 In fact, Lor1 was shown to be more prominent in nutrition-rich conditions (the exponential
growth phase).131 Therefore, such enzymes are more compatible with designed processes.
Modulating the PL level to reduce PC and increase PA, downregulation of glycosylation proteins and
overexpression of fat storage-inducing transmembrane proteins (FITM) could be targets for future
work within the same aim.
To improve lipid recovery, two directions can be followed. In the first direction, mixtures could be
generated from other fungi, such as Aspergillus niger or Fusarium oxysporum.
Improving the efficacy of hydrolases can lead to enhanced lipid recovery. Therefore, screening for
higher hydrolases from Aspergillus niger, Fusarium oxysporum or other hydrolase producers can be
performed as a next step. Addition of surfactants, such as 3-(2-Ethylphenoxy)-1-[[(1S)-1,2,3,4-
tetrahydronaphth-1-yl] amino]-(2S)-2-propanol oxalate salt (SR 59230A), DMSO, and N-[2-(p-
Bromocinnamylamino)ethyl]-5-isoquinolinesulfonamide dihydrochloride (H-89 dihydrochloride
hydrate), could improve the demulsification step. 153
Coatomer protein (COP-I) machinery shows a unique and apparently intrinsic capability to work on
PL monolayers and budding oil droplets. In vivo and at the molecular level, LP monolayers work to keep
a low cytosol/oil interface tension (below 2 mN/m). Thus, the action of COPI prevents PL from
completely covering LD surfaces, which provides more accessibility to TGs for binding/reacting with
other components. In vitro, COP-I machinery clamps to the surface of the monolayer at a water/oil
interface, causing increased surface tension that facilitates TG separation from water. This unique
capability can be employed to improve the demulsification step of single cell lipid production.
Finally, current TEA and CLA were assumed to procure a chemical-based acetic acid from China.
Alternatively, on-site fermentative acetic acid can be modeled starting from CO, waste gases, or
CO2/H249-51 using microbial producers, such as Clostridium aceticum and Acetobacterium woodii.49, 50, 52,
53 This approach can reduce the cost and GHG emission via dispensing the transportation cost and GHG.
To that end, the current thesis is an unpretentious contribution to society’s efforts to promote world
economic sustainability and enhance the quality of life, so help me, God.

Generation of Microbial Oil SCIENTIFIC BACKGROUND A Process Engineering Approach
M . A . M a s r i , 31
7 Methods
7.1 Strains and precultures C. oleaginosus (ATCC 20509) and Yarrowia lipolytica YlTun15 were activated from -80°C stock by sub-culturing on YPD
plate (10 g L-1 yeast extract, 20 g L-1 peptone, 20 g L-1 glucose, and 15% agar). Pre-culture was cultivated in Erlenmeyer flasks
containing YPD media broth (10 g L-1 yeast extract, 20 g L-1 peptone, and 20 g L-1 glucose) containing antibiotics (10 mg L-1
ampicillin, 10 mg L-1 kanamycin, and 12 mg L-1 tetracycline). The yeast was incubated in a rotary shaker at 100 rpm and 28°C
for 2 days and was then was used as the inoculum.
Two brown algae (Laminaria digitata) and one green algae (Ulva lactuca) sample were harvested from the western cost
of Ireland in March and June 2013 (North Seaweed Ltd- Netherlands). The samples were washed thoroughly (with distilled
water) to eliminate salt, sand and contaminants. Subsequently, samples were dried and grind down to ≤ 0.5 mm grain size
using a Planetary Ball Mill- (Fritsch, Germany).
Fresh and aged seagrass samples were collected during the summer seasons of 2013 and 2014 from six different locations
worldwide: two samples from Baltic Sea (Hohenkirchen and Greifswald), two from Mediterranean Sea (Malta), one in
Caribbean Sea (Isla de Mujeres, Mexico), one from Great Australian Bight (Beachport, South Australia) and one sample from
North Atlantic Ocean (Bahamas). The samples were washed thoroughly to get rid of accumulated salt, sand and contaminants,
dried and grinded down to ≤ 0.5 mm thickness using Planetary Ball Mill (Fritsch, Germany). For reproducibility purposes, all
experiments and analysis were conducted in triplicates.
T. reesei ATCC 56765 (RUT C-30) and ATCC 13631 were activated in LB media (5 g L-1 yeast extract, 10 g L-1 tryptone) and
was then used as inoculum for fermentation.
7.2 Media Different media were applied for each experiment. These media contained major nutrient components (carbon
and nitrogen sources) plus base medium. The composition of the base medium was as follow: 0.05 g L -1 NH4Cl, 2.4 g
L-1 KH2PO4, 0.9 g L-1 Na2HPO4·12H2O, 1.5 g L-1 MgSO4·7H2O, 0.025 g L-1 FeCl3·6H2O, 0.001 g L-1 ZnSO4·7H2O, 0.2 g L-1
CaCl2·2H2O, 0.024 g L-1 MnSO4·5H2O, 0.025 g L-1 CuSO4·5H2O, and 0.003 g L-1 Co(NO3)2·6H2O. The composition of the
main nutrition was as follows: medium A (C/N ratio 125) was composed of 30.0 g L-1 glucose and 0.5 g L-1 yeast
extract; medium B (C/N ratio 125) was composed of 0.5 g L-1 yeast extract and 4.1 g L-1 CH3COONa; medium C (C/N
ratio 130) was composed of 30.0 g L-1 glucose, 0.5 g L-1 yeast extract, and 4.1 g L-1 CH3COONa; medium D (C/N ratio
34) was composed of 30.0 g L-1 glucose, 0.5 g L-1 yeast extract, and 5.0 g L-1 peptone; medium E was composed of
1.0 g L-1 yeast extract, 1.0 g L-1 peptone, and 4.1 g L-1 CH3COONa; and medium G (C/N ratio 28) was composed of
60.0 g L-1 glucose, 5.0 g L-1 yeast extract, 5.0 g L-1 peptone, and 4.1 g L-1 CH3COONa.
Brown algae hydrolysate (C/N ratio 85) was prepared by enzymatic hydrolysis of Laminaria digitata without any
chemical pretreatment. Detailed information for the enzymatic hydrolysis is presented in our previous publication.42
For T. reesei cultivation, medium F was composed of 10 g L-1 C. oleaginosus cell wall, 10 g L-1 yeast extract, 10.0
g L-1 glucose, 1.4 g L-1(NH4)2SO4, 2 g L-1 KH2PO4, 0.4 g L-1 CaCl2·2H2O, 0.3 g L-1 MgSO4·7H2O, 0.005 g L-1 FeSO4·7H2O,
0.004 g L-1 CoCl2·6H2O, 0.003 g L-1 MnSO4·H2O, and 0.002 g L-1 ZnSO4·7H2O. Glucose was obtained from Roth-
Germany (Art. No. 6780.2), yeast extract was obtained from PanReac AppliChem- Germany (A1552,1000), peptone
from casein was obtained from Roth- Germany (Art. No. 8952.2), and other chemicals were obtained from Merck-
Germany.
7.3 Bioreactors For cultivation of C. oleaginosus, the following bioreactor systems were used: 1) a DASGIP four parallel bioreactor
system (Eppendorf, Germany) with a working volume of 1 L (4× 1 L); 2) INFORS HT three parallel System (Switzerland)
with a working volume of 3 L (3× 3 L); and 3) Bio-Engineer fermentation system (Bio-Engineer, USA) with a working
volume of 50 L. The temperature was set to 28°C, and the pH of the bioreactor was adjusted to pH 6.5 ± 0.02 with 3
M NaOH or 70–100% (w/w) acetic acid. Stirring (350–800 rpm), oxygen ratio (21–100%), aeration (8.0–1.5 vvm), and
pressure (1.25–1.5 bar) were regulated automatically to maintain dissolved oxygen at a pO2 of 50% or more. Foam
was prevented by the addition of 0.01% (v/v) of an antifoam agent (Antifoam 204; Merck). To evaluate
reproducibility, each fermentation was carried out three times. The values are presented as averages, and each point
was analysed in triplicate. Error bars represent the standard deviation.

Generation of Microbial Oil SCIENTIFIC BACKGROUND A Process Engineering Approach
M . A . M a s r i , 32
7.4 Analysis and assays
7.4.1 Sugar, lipid, and fatty acid profiles; cell counting, and dry biomass
analyses Sugars consumption and release were analysed by high-performance liquid chromatography (HPLC; Agilent 1100
series) with a Rezex ROA-Organic Acid (Aminex HPX 87H) column. Biomass growth was monitored by measuring the
optical density at 600 nm, using the gravimetric method (lyophilisation of 5 × 2 mL washed culture for 2 days [Christ
alpha 2-4 LD Plus]), and using cell counting (FACS S3 [Bio-Rad, Germany]). Lipid content was analysed using the Bligh-
Dyer method. 190 Detailed procedures are described in our previous work. 42 To evaluate reproducibility, all
experiments were repeated three times. The values are presented as averages, and error bars represent standard
deviations. Fatty acid profiles were measured using GC-FID (Shimadzu, Japan) after methylation. The methylation
procedure and analysis set up were reported previously. 42
7.4.2 On-site production of yeast-specific cell wall hydrolases The fermentation of T. reesei ATCC 56765 (RUT C-30) and ATCC 13631 was carried out in the Bio-Engineer
fermentation system. Fermentation parameters were set according to a previously established protocol. 224 Medium
F was applied as the cultivation medium.
As part of medium F, the partially purified cell wall was prepared as follows. Briefly, after lipid extraction, residual
C. oleaginosus biomass was washed with double distilled water three times, dried by lyophilisation for 2 days,
ground, and then used as a hydrolase-inducing system in the T. reesei fermentation.
After fermentation, T. reesei biomass was removed by centrifugation. The resulting water phase (50 L
supernatant) contained all secreted hydrolase enzymes, which were subsequently purified and concentrated by
cross-flow filtration (10 kDa polyethersulfone filter; Pall). The final volume of the resulting hydrolase enzyme system
was 1 L.
7.4.3 Flow cytometry-based cell counting Cell counting via flow cytometry was carried out with a Bio-Rad S3 FACS (BioRad, Hercules, USA) equipped with 488 nm/ 100
mW laser beam. The counting was conducted using 100 µl of sample after 100 times dilution. The cell density diagram
describes Side scatter [SSC] on “Y” axis and Forward scatter [FSC] on the “X”-axis.
7.4.4 Cerium concentration measurement Samples were first diluted 1:99 by mixing 50 µl with 4.95 ml of deionized water. The measurement was then performed in a
multi well plate with 100 µl diluted sample mixed with 100 µl buffer in each well. The buffer contained 100 mM sodium
acetate, 10 mM copper (II), 10 mM nickel (II), and 10 mM lead (II). The pH was adjusted to 5.0 with glacial acetic acid. For
every series of measurements, a calibration curve consisting of 4 points (cerium: 2.5 mM, 5 mM, 7.5 mM and 10 mM) was
prepared the same way, as the samples. For measuring luminescence, a black quartz-glass 96-well microtiter plate
manufactured by Hellma Analytics (Germany) and an EnSpire 2 Multimode Plate Reader (Perkin Elmer, USA) were used.
The reliability of the luminescence-based cerium detection method in presence of other metals has also been evaluated. To
that end, triplicate samples with known copper concentration (10 mM, 20 mM and 40 mM) have been measured in the cerium
concentration range 2.5 mM to 10 mM. All datasets can be described by a global linear regression curve with very good
coefficients of determination (R-square) of 0.985 (Cu 40 mM) 0.987 (Cu 20 mM) and 0.992 (Cu 10 mM). The data plot with
regression curve is depicted in the supplementary information (AE, 224, 2018, 1–12, Supplementary Fig. 1S). The applicable
limit for this method is about 1 mM cerium if interfering metals are present. For model samples containing only cerium the
dilution factor can be decreased (until self-quenching occurs) leading to a limit of quantification (LOQ) at about 0.62 µM with
signals at 308 RFU compared to 193 +/- 12 RFU for the blank (AE, 224, 2018, 1–12, Supplementary Table 1S). Notably, all
metal chelating/binding agents should be eliminated from the assay solution. This was achieved, by repeated washing of the
sample to eliminate any water-soluble components.
7.4.5 Hydrolase activity assays Multiple hydrolase activities were detected in the on-site generated enzyme system. For yeast cell wall
hydrolysis, activities of cellulase, xyloglucanase, β-glucosidase, mannanase, xylanase, and laminarinase were
evaluated. Therefore, 50.0 mg cellulose, xyloglucan, cellobiose, mannan, xylan, and laminarin was incubated with 1
mL buffer (Na acetate, 50 mM, pH 5.0) and 0.35% (w/wbiomass) enzyme solution. To test the enzyme activity of C.
oleaginosus biomass, 50.0 mg of partially purified cell wall was incubated with 1 mL buffer (Na acetate, 50 mM, pH
5.0) and 0.35% (w/wbiomass) enzyme solution. All tests were incubated for 28 h at 50°C. Gravimetric /sugar analyses
(HPLC) were used after hydrolysis.
To evaluate the performance of the on-site generated system, a tailored hydrolase system with regard to
commercial equivalents, we conducted comparative experiments. The evaluated commercial enzyme systems were

Generation of Microbial Oil SCIENTIFIC BACKGROUND A Process Engineering Approach
M . A . M a s r i , 33
as follows: mix 1 (mannanase [Clariant, Switzerland], Cellic Ctec2 [Novozymes, Denmark], Cellic Htec [Novozymes],
and β-glucosidase [Novozymes]; mix 2 (Liquebeet [Clariant], CLA [Clariant], mannanase [Clariant], 1.3-β-glucanase
[Megazyme, France], and β-glucosidase [Novozymes]. To ensure reproducibility, all experiments were conducted in
triplicate. The reported values are presented as averages, and error bars represent standard deviations.
7.4.6 Determination of total dissolved solids and elemental analysis Total dissolved solids [TDS] and element analysis was carried by drying 100.0 ml of the hydrolysate at 105°C (overnight).
Resulting crystals were incinerated at 1500°C for 3 hours. Obtained ash material was subjected to scanning electron
microscopy (SEM) with energy-dispersive X-ray (EDX) analysis using a JSM-7500F scanning electron microscope (JEOL, Japan).
Crystals were mounted on carbon film and prepped for analysis. EDX analysis was performed on multiple areas (100 × 100
μm) in backscattered electron (BSE) mode for each ash sample. The average value was calculated to obtain the elemental
composition for the ash of the hydrolysate.
7.5 Techno-economic analysis Techno-economic analysis (TEA) was carried out to estimate the total capital investment and operating cost for
process flowsheets that could be used for the production of lipids from oily yeast.
As there is a lack of major databases (such as NREL) for process design related to oleaginous yeasts oil production,
process and economic data were collected from current results and those reported in the available literature, 175, 225,
226, 227 as well as integrated mathematical functions in SuperPro Designer version 10 (Intelligen, Inc., Scotch Plains,
NJ, USA). 228, 229
The in-silico process simulation created a production plant with an annual lipid production capacity of 23,000
metric tonnes. The required feedstock (i.e., acetic acid, glucose, and amino acids) and chemicals were estimated
based on current media compositions and the results of the current work. The individual yeast biomass, lipid
formation, and enzymatic hydrolysis are represented by respective equations in the supplementary data. The built-
in material and energy balance data in SPD were applied to determine the required equipment sizing and respective
purchasing prices.
Therefore, the simulated plant consisted of multiple unit operations, encompassing feed handling, fermentation,
hydrolysis, product recovery, and side-product recycling. Hence, 11 fermenters (10 in use, one as standby, 250 m3
each), four stirred tank reactors for C. oleaginosus lysis and lipid mobilization (three in use, one as standby, 250 m3
each), five bending/storage/receiving tanks (250 m3 each), three decanter centrifuges (two in use, one as standby,
159920 L h-1 each), a centrifugal compressor, an air filter, and an ultrafiltration unit were modelled in SPD (see the
simplified process flow diagram in EES, 2019, 12, 2717, Fig. S8). The standby units were included to avoid
maintenance-based downtime.
Major process parameters and assumptions applied to develop the process model and determine the required
materials, energy, and costs are presented in, EES, 2019, 12, 2717, Table S2.
As lipid productivity had the highest impact on cost with respect to all other process parameters, the baseline
scenario was established based on harvesting 4 days after initiation of the fermentation process. Thus, baseline lipid
productivity was approximately 1.4 g L-1 h-1 (biomass: 200 g L-1, lipids: 85% [wlipid/dwbiomass], after 120 h). However,
the optimal scenario was consistent with the best productivity reported in this study, which was 2.4 g L-1 h-1 (biomass:
147 g L-1, lipids: 73% [wlipid/dwbiomass], after 42 h). These productivity values represented the average value of six
biological replications with ± 5% relative standard deviation (EES, 2019, 12, 2717, Fig. S13). EES, 2019, 12, 2717, Figs.
S9–S11 show data for the sensitivity analysis during lipid productivity.
An internal SPD mathematical function adjusted the equipment purchase cost (PC) based on the required process
equipment sizing with respect to the analysis year (2018). 230 Relevant installation cost factors of 1.6 and 1.8, derived from
the initial PC, were extracted from a very detailed biomass conversion focused TEA study. 229, 231 Process piping, warehouse
and site development were estimated as 4.5, 4.4 and 9.0% of the inside-battery-limit (ISBL) equipment costs respectively. 231
The indirect plant costs, including engineering and construction, were estimated as 20% and 10% of total direct cost (TDC),
respectively, where TDC is defined as PC plus installation cost plus process piping. 231 A capital interest factor of 6% was added
to the total capital investment. The annual operating cost was estimated by the facility-dependent cost (including
maintenance) as 3% of TDC. 231 The operator cost was adjusted to German full-cost tariff TV-L 11, 13, and 14. 232 Raw material
costs were estimated based on the available whole-sale market price. The cooperate insurance was calculated as 0.7% of the
total capital investment (TCI). 231 A detailed cost analysis is presented in EES, 2019, 12, 2717, Tables S3–S11.

Generation of Microbial Oil SCIENTIFIC BACKGROUND A Process Engineering Approach
M . A . M a s r i , 34
7.6 Life-cycle for global warming potential (GWP) The life cycle and environmental analysis (LCA) for the entire process chain described in this study was investigated
in order to identify environmental process hotspots that could indicate whether the yeast products were a viable
alternative to conventional plant oils. An attributional cradle-to-gate assessment of a fully integrated, commercial-
scale yeast lipid production unit based on the data presented in the TEA section was performed. Allocation was not
applied. All side product streams were entirely recycled within a process loop. The underlying models were based
on experimental data generated within the project (lab-scale) and fed into process simulation models for the initial
TEA analysis; all other required datasets were complemented by literature data (e.g., transport). The environmental
data are based on publicly available LCA databases, such as US LCI 233 and the BioEnergieDat 234 database. The mass
balance for the functional unit of 1 kg oil is illustrated in EES, 2019, 12, 2717, Fig. S15. This Sankey diagram of the
complete process chain highlights two aspects: the large share of acetic acid as a feedstock and the importance of
medium recycling for process efficiency. In-papyro, the model reflected a simulated business case in North Germany
near the North Sea coast, designed with minimal land requirements in order to avoid competition with food
production. The model also included all processes from sourcing initial feedstocks, such as acetic acid and
macroalgae carbohydrates, followed by processing steps that encompasses yeast fermentation, side-stream
recycling, and subsequent downstream processing for lipid production. The algae L. digitata could be collected by
tractor and subsequently hydrolysed. Transport of feedstocks was included in the analysis. However, like numerous
other LCA studies 235, 236, infrastructure, such as fermenters and centrifuges, was not considered. Moreover,
chemicals, such as sodium hydroxide, calcium chloride, magnesium sulphate, and other inorganic chemical
components required for growth medium and process cleaning activities, were excluded from the LCA matrix
because they were used in minor amounts that did not affect the overall material flow. The full system boundary is
depicted in EES, 2019, 12, 2717, Fig. S14c. The impact analysis, as defined in the process flow diagram (EES, 2019,
12, 2717, Fig. S14c), was calculated based on the CML method (Faculty of Science in Leiden University method
[Centrum voor Milieuwetenschappen, V4.4, 2015]); however, because of its relevance, this publication concentrates
on the global warming potential. The life cycle inventory is documented in the supplementary data (EES, 2019, 12,
2717, Tables S12–S21).

Generation of Microbial Oil SCIENTIFIC BACKGROUND A Process Engineering Approach
M . A . M a s r i , 35
8 References
1. W. Steffen, P. J. Crutzen and J. R. McNeill, AMBIO: A Journal of the Human Environment, 2007, 36, 614-622.
2. W. Steffen, W. Broadgate, L. Deutsch, O. Gaffney and C. Ludwig, The Anthropocene Review, 2015, 2, 81-98.
3. P. M. Vitousek, H. A. Mooney, J. Lubchenco and J. M. Melillo, Science, 1997, 277, 494-499.
4. J. Fargione, J. Hill, D. Tilman, S. Polasky and P. Hawthorne, Science, 2008, 319, 1235-1238.
5. T. Searchinger, R. Heimlich, R. A. Houghton, F. Dong, A. Elobeid, J. Fabiosa, S. Tokgoz, D. Hayes and T.-H. Yu, Science, 2008, 319, 1238-1240.
6. T. Newbold, L. N. Hudson, S. L. Hill, S. Contu, I. Lysenko, R. A. Senior, L. Börger, D. J. Bennett, A. Choimes and B. Collen, Nature, 2015, 520, 45.
7. I. T. I. R. L. o. T. S. V. 2016-2., http://www.iucnredlist.org. , (accessed 2016, 2016).
8. J. K. McKee, P. W. Sciulli, C. D. Fooce and T. A. Waite, Biological Conservation, 2004, 115, 161-164.
9. S. Pinzi, D. Leiva, I. López‐García, M. D. Redel‐Macías and M. P. Dorado, Biofuels, Bioproducts and Biorefining, 2014, 8, 126-143.
10. A. Yaguchi, A. Robinson, E. Mihealsick and M. Blenner, Microbial cell factories, 2017, 16, 206.
11. G. M. Rodriguez, M. S. Hussain, L. Gambill, D. Gao, A. Yaguchi and M. Blenner, Biotechnology for biofuels, 2016, 9, 149.
12. U. N. G. Assembly, Journal, 2005. 13. M. Spagnuolo, A. Yaguchi and M. Blenner, Current
opinion in biotechnology, 2019, 57, 73-81. 14. C. A. Santos and A. Reis, Applied microbiology and
biotechnology, 2014, 98, 5839-5846. 15. H. Shen, Z. Gong, X. Yang, G. Jin, F. Bai and Z. K.
Zhao, Journal of biotechnology, 2013, 168, 85-89. 16. I. R. Sitepu, L. A. Garay, R. Sestric, D. Levin, D. E.
Block, J. B. German and K. L. Boundy-Mills, Biotechnology advances, 2014, 32, 1336-1360.
17. G. Munch, R. Sestric, R. Sparling, D. B. Levin and N. Cicek, Bioresource technology, 2015, 185, 49-55.
18. M. Spagnuolo, M. S. Hussain, L. Gambill and M. Blenner, Frontiers in microbiology, 2018, 9.
19. C. Li, K. Lesnik and H. Liu, Energies, 2013, 6, 4739-4768.
20. H. El Bialy, O. M. Gomaa and K. S. Azab, World Journal of Microbiology and Biotechnology, 2011, 27, 2791-2798.
21. P. Fontanille, V. Kumar, G. Christophe, R. Nouaille and C. Larroche, Bioresource technology, 2012, 114, 443-449.
22. X.-F. Huang, J.-N. Liu, L.-J. Lu, K.-M. Peng, G.-X. Yang and J. Liu, Bioresource technology, 2016, 206, 141-149.
23. X. Xu, J. Y. Kim, H. U. Cho, H. R. Park and J. M. Park, Chemical Engineering Journal, 2015, 264, 735-743.
24. S. Vajpeyi and K. Chandran, Bioresource technology, 2015, 188, 49-55.
25. J. Brandenburg, J. Blomqvist, J. Pickova, N. Bonturi, M. Sandgren and V. Passoth, Yeast, 2016, 33, 451-462.
26. K. V. Probst and P. V. Vadlani, Bioresource technology, 2015, 198, 268-275.
27. P. J. Slininger, B. S. Dien, C. P. Kurtzman, B. R. Moser, E. L. Bakota, S. R. Thompson, P. J. O'Bryan, M. A. Cotta, V. Balan and M. Jin, Biotechnology and bioengineering, 2016, 113, 1676-1690.
28. L. Qin, L. Liu, A.-P. Zeng and D. Wei, Bioresource technology, 2017, 245, 1507-1519.
29. A. Yaguchi, M. Spagnuolo and M. Blenner, Current opinion in biotechnology, 2018, 53, 122-129.
30. I. K. Chung, J. Beardall, S. Mehta, D. Sahoo and S. Stojkovic, Journal of Applied Phycology, 2011, 23, 877-886.
31. S. Beer and E. Koch, Marine Ecology Progress Series, 1996, 141, 199-204.
32. B. Subhadra and M. Edwards, Energy Policy, 2010, 38, 4897-4902.
33. K. Gao and K. R. McKinley, Journal of Applied Phycology, 1994, 6, 45-60.
34. J. W. Fourqurean, C. M. Duarte, H. Kennedy, N. Marbà, M. Holmer, M. A. Mateo, E. T. Apostolaki, G. A. Kendrick, D. Krause-Jensen and K. J. McGlathery, Nature geoscience, 2012, 5, 505.
35. N. Wei, J. Quarterman and Y.-S. Jin, Trends in biotechnology, 2013, 31, 70-77.
36. K. A. Jung, S.-R. Lim, Y. Kim and J. M. Park, Bioresource technology, 2013, 135, 182-190.
37. H. J. Bixler and H. Porse, Journal of applied Phycology, 2011, 23, 321-335.
38. J. Cebrián, C. M. Duarte and N. Marbà, Journal of Experimental Marine Biology and Ecology, 1996, 204, 103-111.
39. M. Uchida, T. Miyoshi, M. Kaneniwa, K. Ishihara, Y. Nakashimada and N. Urano, Journal of bioscience and bioengineering, 2014, 118, 646-650.
40. A. Meo, X. L. Priebe and D. Weuster-Botz, Journal of biotechnology, 2017, 241, 1-10.
41. M. A. Masri, S. Younes, M. Haack, F. Qoura, N. Mehlmer and T. Brück, Energy Technology, 2018.
42. M. Mahmoud, Y. Samer, H. Martina, Q. Farah, M. Norbert and B. Thomas, Energy Technology, 2018, 6, 1026-1038.
43. J. Chen, X. Zhang, R. D. Tyagi and P. Drogui, Bioresource technology, 2018, 253, 8-15.
44. F. Bauer and C. Hulteberg, Biofuels, Bioproducts and Biorefining, 2013, 7, 43-51.
45. L. Signori, D. Ami, R. Posteri, A. Giuzzi, P. Mereghetti, D. Porro and P. Branduardi, Microbial cell factories, 2016, 15, 75.
46. F. Spier, J. G. Buffon and C. A. Burkert, Indian journal of microbiology, 2015, 55, 415-422.
47. Y. Liang, Y. Cui, J. Trushenski and J. W. Blackburn, Bioresource technology, 2010, 101, 7581-7586.
48. J. Xu, X. Zhao, W. Wang, W. Du and D. Liu, Biochemical engineering journal, 2012, 65, 30-36.

Generation of Microbial Oil SCIENTIFIC BACKGROUND A Process Engineering Approach
M . A . M a s r i , 36
49. J. H. Sim, A. H. Kamaruddin, W. S. Long and G. Najafpour, Enzyme and microbial technology, 2007, 40, 1234-1243.
50. J. L. Gaddy, Journal, 1997. 51. M. Straub, M. Demler, D. Weuster-Botz and P.
Dürre, Journal of biotechnology, 2014, 178, 67-72. 52. P. Pal and J. Nayak, Separation & Purification
Reviews, 2017, 46, 44-61. 53. E. V. LaBelle and H. D. May, Frontiers in
microbiology, 2017, 8. 54. Z. Gong, H. Shen, W. Zhou, Y. Wang, X. Yang and Z.
K. Zhao, Biotechnology for biofuels, 2015, 8, 189. 55. Z. Chi, Y. Zheng, J. Ma and S. Chen, international
journal of hydrogen energy, 2011, 36, 9542-9550. 56. V. Béligon, L. Poughon, G. Christophe, A. Lebert, C.
Larroche and P. Fontanille, Bioresource technology, 2015, 192, 582-591.
57. Z. Gong, W. Zhou, H. Shen, Z. Yang, G. Wang, Z. Zuo, Y. Hou and Z. K. Zhao, Bioresource technology, 2016, 207, 102-108.
58. G. W. Park, H. N. Chang, K. Jung, C. Seo, Y.-C. Kim, J. H. Choi, H. C. Woo and I.-j. Hwang, Process Biochemistry, 2017, 56, 147-153.
59. J. Liu, M. Yuan, J.-N. Liu and X.-F. Huang, Bioresource technology, 2017, 241, 645-651.
60. M. A. J. T. i. c. b. Welte, 2007, 17, 363-369. 61. D. J. Murphy and J. J. T. i. b. s. Vance, 1999, 24, 109-
115. 62. D. Zweytick, K. Athenstaedt and G. J. B. e. B. A.-R. o.
B. Daum, 2000, 1469, 101-120. 63. Y. Ohsaki, M. Suzuki, T. J. C. Fujimoto and biology,
2014, 21, 86-96. 64. D. J. J. P. i. l. r. Murphy, 2001, 40, 325-438. 65. T. Czabany, A. Wagner, D. Zweytick, K. Lohner, E.
Leitner, E. Ingolic and G. J. J. o. B. C. Daum, 2008, 283, 17065-17074.
66. K. Tauchi-Sato, S. Ozeki, T. Houjou, R. Taguchi and T. J. J. o. B. C. Fujimoto, 2002, 277, 44507-44512.
67. W. M. Henne, M. L. Reese and J. M. Goodman, The EMBO journal, 2018, 37, e98947.
68. H.-C. Wan, R. C. Melo, Z. Jin, A. M. Dvorak and P. F. J. T. F. J. Weller, 2007, 21, 167-178.
69. R. C. Melo, H. D’Avila, H.-C. Wan, P. T. Bozza, A. M. Dvorak, P. F. J. J. o. H. Weller and Cytochemistry, 2011, 59, 540-556.
70. R. Bartz, W.-H. Li, B. Venables, J. K. Zehmer, M. R. Roth, R. Welti, R. G. Anderson, P. Liu and K. D. J. J. o. l. r. Chapman, 2007, 48, 837-847.
71. M. Radulovic, O. Knittelfelder, A. Cristobal-Sarramian, D. Kolb, H. Wolinski and S. D. Kohlwein, Current genetics, 2013, 59, 231-242.
72. K. Grillitsch, M. Connerth, H. Köfeler, T. N. Arrey, B. Rietschel, B. Wagner, M. Karas and G. Daum, Biochimica et Biophysica Acta (BBA)-Molecular and Cell Biology of Lipids, 2011, 1811, 1165-1176.
73. R. Schneiter, B. Brügger, R. Sandhoff, G. Zellnig, A. Leber, M. Lampl, K. Athenstaedt, C. Hrastnik, S. Eder and G. Daum, The Journal of cell biology, 1999, 146, 741-754.
74. R. Bartz, W.-H. Li, B. Venables, J. K. Zehmer, M. R. Roth, R. Welti, R. G. Anderson, P. Liu and K. D. Chapman, Journal of lipid research, 2007, 48, 837-847.
75. A. Kassan, A. Herms, A. Fernández-Vidal, M. Bosch, N. L. Schieber, B. J. Reddy, A. Fajardo, M. Gelabert-Baldrich, F. Tebar and C. J. J. C. B. Enrich, 2013, 203, 985-1001.
76. W. Fei, H. Wang, X. Fu, C. Bielby and H. J. B. J. Yang, 2009, 424, 61-67.
77. W. Fei, G. Shui, B. Gaeta, X. Du, L. Kuerschner, P. Li, A. J. Brown, M. R. Wenk, R. G. Parton and H. J. J. C. B. Yang, 2008, 180, 473-482.
78. W. Fei, G. Shui, Y. Zhang, N. Krahmer, C. Ferguson, T. S. Kapterian, R. C. Lin, I. W. Dawes, A. J. Brown and P. J. P. g. Li, 2011, 7, e1002201.
79. C.-W. Wang, Y.-H. Miao and Y.-S. Chang, J Cell Sci, 2014, 127, 1214-1228.
80. M. A. Masri, D. Garbe, N. Mehlmer and T. B. Brück, Energy & Environmental Science, 2019, 12, 2717-2732.
81. S. R. Bartholomew, E. H. Bell, T. Summerfield, L. C. Newman, E. L. Miller, B. Patterson, Z. P. Niday, W. E. Ackerman IV, J. T. J. B. e. B. A.-M. Tansey and C. B. o. Lipids, 2012, 1821, 268-278.
82. K. Takahashi, N. Sasabe, K. Ohshima, K. Kitazato, R. Kato, Y. Masuda, M. Tsurumaki, T. Obama, S.-i. Okudaira and J. J. J. o. l. r. Aoki, 2010, 51, 2571-2580.
83. H. Yang, A. Galea, V. Sytnyk and M. J. C. o. i. c. b. Crossley, 2012, 24, 509-516.
84. M. Casal, O. Queirós, G. Talaia, D. Ribas and S. Paiva, in Yeast membrane transport, Springer, 2016, pp. 229-251.
85. S. Giannattasio, N. Guaragnella, M. Ždralević and E. J. F. i. m. Marra, 2013, 4, 33.
86. S. Bellou, I.-E. Triantaphyllidou, D. Aggeli, A. M. Elazzazy, M. N. Baeshen and G. J. C. o. i. B. Aggelis, 2016, 37, 24-35.
87. R. Kourist, F. Bracharz, J. Lorenzen, O. N. Kracht, M. Chovatia, C. Daum, S. Deshpande, A. Lipzen, M. Nolan and R. A. Ohm, mBio, 2015, 6, e00918-00915.
88. P. Piper, C. O. Calderon, K. Hatzixanthis and M. Mollapour, Microbiology, 2001, 147, 2635-2642.
89. N. Guaragnella, S. Passarella, E. Marra and S. J. F. l. Giannattasio, 2010, 584, 3655-3660.
90. S. Giannattasio, N. Guaragnella, M. Ždralević and E. Marra, Frontiers in Microbiology, 2013, 4.
91. R. Ramanan, B.-H. Kim, D.-H. Cho, S.-R. Ko, H.-M. Oh and H.-S. J. F. l. Kim, 2013, 587, 370-377.
92. J. Yan, R. Cheng, X. Lin, S. You, K. Li, H. Rong, Y. J. A. m. Ma and biotechnology, 2013, 97, 1933-1939.
93. S. Papanikolaou and G. Aggelis, European Journal of Lipid Science and Technology, 2011, 113, 1031-1051.
94. S. De Cima, J. Rúa, E. Perdiguero, P. del Valle, F. Busto, A. Baroja-Mazo and D. de Arriaga, Research in microbiology, 2005, 156, 663-669.
95. M. Tai and G. J. M. e. Stephanopoulos, 2013, 15, 1-9.
96. K. Tamano, K. S. Bruno, S. A. Karagiosis, D. E. Culley, S. Deng, J. R. Collett, M. Umemura, H. Koike, S. E. Baker, M. J. A. m. Machida and biotechnology, 2013, 97, 269-281.
97. I. B. Lomakin, Y. Xiong and T. A. J. C. Steitz, 2007, 129, 319-332.

Generation of Microbial Oil SCIENTIFIC BACKGROUND A Process Engineering Approach
M . A . M a s r i , 37
98. F. LYNEN, H. Engeser, E. C. Foerster, J. L. Fox, S. Hess, G. B. Kresze, T. Schmitt, T. Schreckenbach, E. Siess and F. J. E. j. o. b. Wieland, 1980, 112, 431-442.
99. F. Fichtlscherer, C. Wellein, M. Mittag and E. J. E. j. o. b. Schweizer, 2000, 267, 2666-2671.
100. C. J. B. l. Ratledge, 2014, 36, 1557-1568. 101. Z. Li, H. Sun, X. Mo, X. Li, B. Xu, P. J. A. m. Tian and
biotechnology, 2013, 97, 4927-4936. 102. T. M. Wasylenko, W. S. Ahn and G. J. M. e.
Stephanopoulos, 2015, 30, 27-39. 103. A. Lei, H. Chen, G. Shen, Z. Hu, L. Chen and J. J. B. f.
B. Wang, 2012, 5, 18. 104. W. Runguphan and J. D. J. M. e. Keasling, 2014, 21,
103-113. 105. M. Certik, S. J. J. o. b. Shimizu and bioengineering,
1999, 87, 1-14. 106. S. Tavares, T. Grotkjær, T. Obsen, R. P. Haslam, J. A.
Napier and N. J. A. E. M. Gunnarsson, 2011, 77, 1854-1861.
107. L.-T. Chuang, D.-C. Chen, J.-M. Nicaud, C. Madzak, Y.-H. Chen and Y.-S. J. N. b. Huang, 2010, 27, 277-282.
108. H. G. Damude, P. J. Gillies, D. J. Macool, S. K. Picataggio, J. J. Ragghianti, J. E. Seip, Z. Xue, N. S. Yadav, H. Zhang and Q. Q. Zhu, Journal, 2014.
109. H. G. Damude, H. Zhang, L. Farrall, K. G. Ripp, J.-F. Tomb, D. Hollerbach and N. S. J. P. o. t. N. A. o. S. Yadav, 2006, 103, 9446-9451.
110. D. Xie, E. N. Jackson, Q. J. A. m. Zhu and biotechnology, 2015, 99, 1599-1610.
111. Z. Xue, P. L. Sharpe, S.-P. Hong, N. S. Yadav, D. Xie, D. R. Short, H. G. Damude, R. A. Rupert, J. E. Seip and J. J. N. b. Wang, 2013, 31, 734.
112. C. Görner, V. Redai, F. Bracharz, P. Schrepfer, D. Garbe and T. J. G. C. Brück, 2016, 18, 2037-2046.
113. C. Ferreira, F. van Voorst, A. Martins, L. Neves, R. Oliveira, M. C. Kielland-Brandt, C. Lucas and A. Brandt, Molecular Biology of the Cell, 2005, 16, 2068-2076.
114. M. Klein, S. Swinnen, J. M. Thevelein and E. Nevoigt, Environmental microbiology, 2017, 19, 878-893.
115. M. Turk and C. Gostinčar, Fungal biology, 2018, 122, 63-73.
116. T. Dulermo and J.-M. J. M. e. Nicaud, 2011, 13, 482-491.
117. E. P. Kennedy, 1961. 118. S. B. Weiss and E. P. J. J. o. t. A. C. S. Kennedy, 1956,
78, 3550-3550. 119. Z. Zheng and J. Zou, Journal of Biological Chemistry,
2001, 276, 41710-41716. 120. G.-S. Han, W.-I. Wu and G. M. Carman, Journal of
Biological Chemistry, 2006, 281, 9210-9218. 121. G. M. Carman and G.-S. Han, Trends in biochemical
sciences, 2006, 31, 694-699. 122. A. Dahlqvist, U. Ståhl, M. Lenman, A. Banas, M. Lee,
L. Sandager, H. Ronne and S. Stymne, Proceedings of the National Academy of Sciences, 2000, 97, 6487-6492.
123. P. Oelkers, A. Tinkelenberg, N. Erdeniz, D. Cromley, J. T. Billheimer and S. L. Sturley, Journal of Biological Chemistry, 2000, 275, 15609-15612.
124. A. A. Wendel, T. M. Lewin, R. A. J. B. e. B. A.-M. Coleman and C. B. o. Lipids, 2009, 1791, 501-506.
125. R. Jain, M. Coffey, K. Lai, A. Kumar and S. MacKenzie, Journal, 2000.
126. Y. Kamisaka, K. Kimura, H. Uemura and M. Yamaoka, Applied microbiology and biotechnology, 2013, 97, 7345-7355.
127. M. S. Greer, M. Truksa, W. Deng, S.-C. Lung, G. Chen and R. J. Weselake, Applied microbiology and biotechnology, 2015, 99, 2243-2253.
128. J. Blazeck, A. Hill, L. Liu, R. Knight, J. Miller, A. Pan, P. Otoupal and H. S. J. N. c. Alper, 2014, 5, 3131.
129. S. D. Kohlwein, Journal of Biological Chemistry, 2010, 285, 15663-15667.
130. J. R. Skinner, T. M. Shew, D. M. Schwartz, A. Tzekov, C. M. Lepus, N. A. Abumrad and N. E. Wolins, Journal of Biological Chemistry, 2009, 284, 30941-30948.
131. P. Oelkers, D. Cromley, M. Padamsee, J. T. Billheimer and S. L. Sturley, Journal of Biological Chemistry, 2002, 277, 8877-8881.
132. M. Galiotou-Panayotou, O. Kalantzi and G. Aggelis, Antonie Van Leeuwenhoek, 1998, 73, 155-162.
133. H. Gorrissen, A. P. Tulloch, R. J. J. C. Cushley and p. o. lipids, 1982, 31, 245-255.
134. W. B. Mackinnon, G. L. May and C. E. J. E. j. o. b. Mountford, 1992, 205, 827-839.
135. N. J. King, E. J. Delikatny and K. T. J. I. Holmes, 1994, 4, 188-198.
136. V. Choudhary, N. Ojha, A. Golden and W. A. Prinz, J Cell Biol, 2015, 211, 261-271.
137. H. Wang, M. Becuwe, B. E. Housden, C. Chitraju, A. J. Porras, M. M. Graham, X. N. Liu, A. R. Thiam, D. B. Savage and A. K. Agarwal, Elife, 2016, 5, e16582.
138. A. Chorlay and A. R. Thiam, Biophysical journal, 2018, 114, 631-640.
139. J. Zanghellini, F. Wodlei and H. Von Grünberg, Journal of theoretical biology, 2010, 264, 952-961.
140. Q. Gao, D. D. Binns, L. N. Kinch, N. V. Grishin, N. Ortiz, X. Chen and J. M. Goodman, J Cell Biol, 2017, 216, 3199-3217.
141. N. Jacquier, V. Choudhary, M. Mari, A. Toulmay, F. Reggiori and R. Schneiter, J Cell Sci, 2011, 124, 2424-2437.
142. N. Jacquier, V. Choudhary, M. Mari, A. Toulmay, F. Reggiori and R. J. J. C. S. Schneiter, 2011, 124, 2424-2437.
143. F. Wilfling, J. T. Haas, T. C. Walther and R. V. J. C. o. i. c. b. Farese Jr, 2014, 29, 39-45.
144. A. R. Thiam, R. V. Farese Jr and T. C. J. N. r. M. c. b. Walther, 2013, 14, 775.
145. T. Fujimoto, Y. Ohsaki, J. Cheng, M. Suzuki, Y. J. H. Shinohara and c. biology, 2008, 130, 263-279.
146. T. C. Walther and R. V. J. A. r. o. b. Farese Jr, 2012, 81, 687-714.
147. K. G. Soni, G. A. Mardones, R. Sougrat, E. Smirnova, C. L. Jackson and J. S. J. J. o. c. s. Bonifacino, 2009, 122, 1834-1841.
148. F. Wilfling, A. R. Thiam, M.-J. Olarte, J. Wang, R. Beck, T. J. Gould, E. S. Allgeyer, F. Pincet, J. Bewersdorf and R. V. J. E. Farese Jr, 2014, 3, e01607.
149. F. Wilfling, H. Wang, J. T. Haas, N. Krahmer, T. J. Gould, A. Uchida, J.-X. Cheng, M. Graham, R. Christiano and F. J. D. c. Fröhlich, 2013, 24, 384-399.

Generation of Microbial Oil SCIENTIFIC BACKGROUND A Process Engineering Approach
M . A . M a s r i , 38
150. C. Thiele and J. Spandl, Current opinion in cell biology, 2008, 20, 378-385.
151. L. V. Chernomordik and M. M. Kozlov, Cell, 2005, 123, 375-382.
152. N. Krahmer, Y. Guo, F. Wilfling, M. Hilger, S. Lingrell, K. Heger, H. W. Newman, M. Schmidt-Supprian, D. E. Vance and M. J. C. m. Mann, 2011, 14, 504-515.
153. S. Murphy, S. Martin and R. G. Parton, 2010. 154. A. R. Thiam, B. Antonny, J. Wang, J. Delacotte, F.
Wilfling, T. C. Walther, R. Beck, J. E. Rothman and F. J. P. o. t. N. A. o. S. Pincet, 2013, 110, 13244-13249.
155. J. Gong, Z. Sun, L. Wu, W. Xu, N. Schieber, D. Xu, G. Shui, H. Yang, R. G. Parton and P. J. J. C. B. Li, 2011, 195, 953-963.
156. T. H. M. Grahn, R. Kaur, J. Yin, M. Schweiger, V. M. Sharma, M.-J. Lee, Y. Ido, C. M. Smas, R. Zechner and A. Lass, Journal of Biological Chemistry, 2014, 289, 12029-12039.
157. Y. Guo, T. C. Walther, M. Rao, N. Stuurman, G. Goshima, K. Terayama, J. S. Wong, R. D. Vale, P. Walter and R. V. J. N. Farese, 2008, 453, 657.
158. N. E. Wolins, J. R. Skinner, M. J. Schoenfish, A. Tzekov, K. G. Bensch and P. E. J. J. o. B. C. Bickel, 2003, 278, 37713-37721.
159. J. Gong, Z. Sun and P. J. C. o. i. l. Li, 2009, 20, 121-126.
160. D. L. J. J. o. l. r. Brasaemle, 2007, 48, 2547-2559. 161. D. L. Brasaemle and N. E. J. J. o. B. C. Wolins, 2012,
287, 2273-2279. 162. J. Tansey, C. Sztalryd, J. Gruia-Gray, D. Roush, J. Zee,
O. Gavrilova, M. Reitman, C.-X. Deng, C. Li and A. Kimmel, Proceedings of the National Academy of Sciences, 2001, 98, 6494-6499.
163. J. Martinez-Botas, J. B. Anderson, D. Tessier, A. Lapillonne, B. H.-J. Chang, M. J. Quast, D. Gorenstein, K.-H. Chen and L. Chan, Nature genetics, 2000, 26, 474.
164. N. E. Wolins, D. L. Brasaemle and P. E. J. F. l. Bickel, 2006, 580, 5484-5491.
165. N. Jacquier, S. Mishra, V. Choudhary and R. Schneiter, J Cell Sci, 2013, 126, 5198-5209.
166. N. Jacquier, S. Mishra, V. Choudhary and R. J. J. C. S. Schneiter, 2013, 126, 5198-5209.
167. Z. Sun, J. Gong, H. Wu, W. Xu, L. Wu, D. Xu, J. Gao, J.-w. Wu, H. Yang and M. Yang, Nature communications, 2013, 4, 1594.
168. W. Fei, X. Du and H. Yang, Trends in Endocrinology & Metabolism, 2011, 22, 204-210.
169. W. Fei, H. Li, G. Shui, T. S. Kapterian, C. Bielby, X. Du, A. J. Brown, P. Li, M. R. Wenk and P. Liu, Journal of lipid research, 2011, 52, 2136-2147.
170. D. A. Gross, E. L. Snapp and D. L. J. P. o. Silver, 2010, 5, e10796.
171. M. Milewska, J. McRedmond and P. C. J. J. o. n. Byrne, 2009, 111, 1022-1030.
172. E. J. Klemm, E. Spooner and H. L. J. J. o. B. C. Ploegh, 2011, 286, 37602-37614.
173. S. Y. Bu, M. T. Mashek and D. G. J. J. o. B. C. Mashek, 2009, 284, 30474-30483.
174. C. Ratledge and Z. Cohen, Lipid Technology, 2008, 20, 155-160.
175. A. A. Koutinas, A. Chatzifragkou, N. Kopsahelis, S. Papanikolaou and I. K. Kookos, Fuel, 2014, 116, 566-577.
176. M. Jin, P. J. Slininger, B. S. Dien, S. Waghmode, B. R. Moser, A. Orjuela, L. da Costa Sousa and V. Balan, Trends in biotechnology, 2015, 33, 43-54.
177. D. F. Markgraf, R. W. Klemm, M. Junker, H. K. Hannibal-Bach, C. S. Ejsing and T. A. Rapoport, Cell reports, 2014, 6, 44-55.
178. A. D. Barbosa, H. Sembongi, W.-M. Su, S. Abreu, F. Reggiori, G. M. Carman and S. Siniossoglou, Molecular biology of the cell, 2015, 26, 3641-3657.
179. B. S. Dien, J. Zhu, P. J. Slininger, C. P. Kurtzman, B. R. Moser, P. J. O'Bryan, R. Gleisner and M. A. Cotta, RSC Advances, 2016, 6, 20695-20705.
180. S. Harde, Z. Wang, M. Horne, J. Zhu and X. Pan, Fuel, 2016, 175, 64-74.
181. E. Palmqvist and B. Hahn-Hägerdal, Bioresource technology, 2000, 74, 25-33.
182. A. Ahmad, N. M. Yasin, C. Derek and J. Lim, Environmental technology, 2014, 35, 2244-2253.
183. Z. Li, L. Zhang, X. Shen, B. Lai and S. Sun, Wei sheng wu xue tong bao, 2000, 28, 72-75.
184. J. Kim, G. Yoo, H. Lee, J. Lim, K. Kim, C. W. Kim, M. S. Park and J.-W. Yang, Biotechnology advances, 2013, 31, 862-876.
185. G. Jin, F. Yang, C. Hu, H. Shen and Z. K. Zhao, Bioresource technology, 2012, 111, 378-382.
186. K. de Boer, N. R. Moheimani, M. A. Borowitzka and P. A. Bahri, Journal of Applied Phycology, 2012, 24, 1681-1698.
187. J.-Y. You, C. Peng, X. Liu, X.-J. Ji, J. Lu, Q. Tong, P. Wei, L. Cong, Z. Li and H. Huang, Bioresource technology, 2011, 102, 6088-6094.
188. K. Liang, Q. Zhang and W. Cong, Journal of agricultural and food chemistry, 2012, 60, 11771-11776.
189. C.-C. Fu, T.-C. Hung, J.-Y. Chen, C.-H. Su and W.-T. Wu, Bioresource Technology, 2010, 101, 8750-8754.
190. E. G. Bligh and W. J. Dyer, Canadian journal of biochemistry and physiology, 1959, 37, 911-917.
191. X. Zhang, S. Yan, R. D. Tyagi, R. Y. Surampalli and J. R. Valéro, Bioresource technology, 2014, 169, 175-180.
192. L. Garcia Alba, M. P. Vos, C. Torri, D. Fabbri, S. R. Kersten and D. W. Brilman, ChemSusChem, 2013, 6, 1330-1333.
193. M. Braun, J. Lorenzen, M. Masri, Y. Liu, E. Baráth, T. B. Brück and J. A. Lercher, ACS Sustainable Chemistry & Engineering, 2019.
194. J. J. Milledge and S. Heaven, Reviews in Environmental Science and Bio/Technology, 2014, 13, 301-320.
195. A. L. Colombo, A. C. B. Padovan and G. M. Chaves, Clinical microbiology reviews, 2011, 24, 682-700.
196. J. M. Ageitos, J. A. Vallejo, P. Veiga-Crespo and T. G. Villa, Applied microbiology and biotechnology, 2011, 90, 1219-1227.
197. H. Xie, S. Zhang and S. Li, 2006. 198. K. Pohako-Esko, M. Bahlmann, P. S. Schulz and P.
Wasserscheid, Industrial & Engineering Chemistry Research, 2016, 55, 7052-7059.
199. Y. Lin, Q. Yan, C. Kong and L. Chen, Scientific reports, 2013, 3, 1859.

Generation of Microbial Oil SCIENTIFIC BACKGROUND A Process Engineering Approach
M . A . M a s r i , 39
200. Z. Hu, M. Khurana, Y. H. Seah, M. Zhang, Z. Guo and D. Zhao, Chemical Engineering Science, 2015, 124, 61-69.
201. A. K. Qaroush, D. A. Castillo‐Molina, C. Troll, M. A. Abu‐Daabes, H. M. Alsyouri, A. S. Abu‐Surrah and B. Rieger, ChemSusChem, 2015, 8, 1618-1626.
202. F. Santamauro, F. M. Whiffin, R. J. Scott and C. J. Chuck, Biotechnology for biofuels, 2014, 7, 34.
203. J.-H. Yeon, S.-E. Lee, W.-Y. Choi, D.-H. Kang, H.-Y. Lee and K.-H. Jung, Journal of microbiology and biotechnology, 2011, 21, 323-331.
204. N.-J. Kim, H. Li, K. Jung, H. N. Chang and P. C. Lee, Bioresource technology, 2011, 102, 7466-7469.
205. J.-S. Jang, Y. Cho, G.-T. Jeong and S.-K. Kim, Bioprocess and biosystems engineering, 2012, 35, 11-18.
206. T. N. Pham, W. J. Nam, Y. J. Jeon and H. H. Yoon, Bioresource technology, 2012, 124, 500-503.
207. S. Gupta, N. Abu-Ghannam and A. G. Scannell, Food and Bioproducts Processing, 2011, 89, 346-355.
208. S. Horn, I. Aasen and K. Østgaard, Journal of Industrial Microbiology & Biotechnology, 2000, 25, 249-254.
209. H. van der Wal, B. L. Sperber, B. Houweling-Tan, R. R. Bakker, W. Brandenburg and A. M. López-Contreras, Bioresource technology, 2013, 128, 431-437.
210. M. Soleymani and K. A. Rosentrater, Bioengineering, 2017, 4, 92.
211. R. P. John, G. Anisha, K. M. Nampoothiri and A. Pandey, Bioresource technology, 2011, 102, 186-193.
212. Z. Gong, Q. Wang, H. Shen, C. Hu, G. Jin and Z. K. Zhao, Bioresource technology, 2012, 117, 20-24.
213. S. Galafassi, D. Cucchetti, F. Pizza, G. Franzosi, D. Bianchi and C. Compagno, Bioresource technology, 2012, 111, 398-403.
214. Y. Li, Z. K. Zhao and F. Bai, Enzyme and microbial technology, 2007, 41, 312-317.
215. J. Friedlander, V. Tsakraklides, A. Kamineni, E. H. Greenhagen, A. L. Consiglio, K. MacEwen, D. V. Crabtree, J. Afshar, R. L. Nugent and M. A. Hamilton, Biotechnology for biofuels, 2016, 9, 77.
216. J. G. Pan, M. Y. Kwak and J. S. Rhee, Biotechnology letters, 1986, 8, 715-718.
217. A. Gnouma, E. Sehli, W. Medhioub, R. B. Dhieb, M. Masri, N. Mehlmer, W. Slimani, K. Sebai, A. Zouari and T. Brück, Bioprocess and biosystems engineering, 2018, 41, 1449-1459.
218. A. K. Qaroush, K. I. Assaf, S. K. Bardaweel, F. Alsoubani, E. Al-Ramahi, M. Masri, T. Brück, C. Troll, B. Rieger and F. E. Ala'a, Green Chemistry, 2017, 19, 4305-4314.
219. Z. Li, L. Zhang, X. Shen, B. Lai and S. Sun, Wei sheng wu xue tong bao, 2001, 28, 72-75.
220. Y. Ohsaki, M. Suzuki and T. Fujimoto, Chemistry & biology, 2014, 21, 86-96.
221. B. Bessadok, M. Masri, T. Breuck and S. Sadok, Bull. Ins. Natn. Scien. Tech. Mer de Salammbô, 2015, 42, 21-23.
222. B. Bessadok, M. Masri, T. Breuck and S. Sadok, Journal of FisheriesSciences. com, 2017, 11, 019-024.
223. Z. Gong, Q. Wang, H. Shen, L. Wang, H. Xie and Z. K. Zhao, Biotechnology for biofuels, 2014, 7, 13.
224. A. Ahamed and P. Vermette, Biochemical Engineering Journal, 2008, 40, 399-407.
225. N. R. Baral, O. Kavvada, D. Mendez-Perez, A. Mukhopadhyay, T. S. Lee, B. A. Simmons and C. D. Scown, Energy & Environmental Science, 2019, 12, 807-824.
226. F. Xu, J. Sun, N. Konda, J. Shi, T. Dutta, C. D. Scown, B. A. Simmons and S. Singh, 2015.
227. J. Sun, N. M. Konda, J. Shi, R. Parthasarathi, T. Dutta, F. Xu, C. D. Scown, B. A. Simmons and S. Singh, Energy & Environmental Science, 2016, 9, 2822-2834.
228. D. P. Petrides, Computers & chemical engineering, 1994, 18, S621-S625.
229. D. Petrides, Bioseparations science and engineering, 2000.
230. S. Designer, User’s Guide V10, http://www.intelligen.com/downloads/SuperPro_ManualForPrinting_v10.pdf, (accessed Intelligen, Inc., ).
231. D. Humbird, R. Davis, L. Tao, C. Kinchin, D. Hsu, A. Aden, P. Schoen, J. Lukas, B. Olthof and M. Worley, Process design and economics for biochemical conversion of lignocellulosic biomass to ethanol: dilute-acid pretreatment and enzymatic hydrolysis of corn stover, National Renewable Energy Lab.(NREL), Golden, CO (United States), 2011.
232. F. government, public service information, https://oeffentlicher-dienst.info/tv-l/west/).
233. National Renewable Energy Laboratory (NREL), U.S. Life Cycle Inventory Database,, https://www.nrel.gov/lci/).
234. L. Schebek, The open source data platform for bio-energy in Germany, http://www.bioenergiedat.de/, 2018).
235. C. Liptow, A.-M. Tillman, M. Janssen, O. Wallberg and G. A. Taylor, The International Journal of Life Cycle Assessment, 2013, 18, 1071-1081.
236. J. H. Schmidt, Journal of Cleaner Production, 2015, 87, 130-138.

Generation of Microbial Oil SCIENTIFIC BACKGROUND A Process Engineering Approach
M . A . M a s r i , 40

Generation of Microbial Oil SCIENTIFIC BACKGROUND A Process Engineering Approach
M . A . M a s r i , 41

PART II: PUBLICATIONS OVERVIEW
Seagrass
Macroalgae
Co-fermentation
Downstream Processing
Chemo-sorption
Macroalgae
Hydrothermal
Extracellular protease

Generation of Microbial Oil PUBLICATIONS OVERVIEW A Process Engineering Approach
M . A . M a s r i , 1

Generation of Microbial Oil PUBLICATIONS OVERVIEW A Process Engineering Approach
M . A . M a s r i , 2
A seagrass based biorefinery for generation of single cell oils
targeted at biofuel and oleochemical production
Masri M. A., Younis S., Mehlmer N., Quora F., Brück T.
Energy Technology, 2018,6,1026–1038.
https://doi.org/10.1002/ente.201700919
Status: Accepted
Contribution: MM analyzed and enzymatically hydrolyzed the seagrass biomass. MM cultivated yeast
on the hydrolysate. MM contributed to manuscript writing.
Summary
The increasing use of plant‐based lipids for sustainable energy and biofuels applications does
compromise food security and results in reduced biodiversity. Currently, more than two times the
globally available arable land would be required to meet the global market demand of biodiesel.
Consequently, searching for alternative starting materials that offer renewability and sustainability is
of vital importance.
78 million tons of residual seagrass deposits accumulate annually on shorelines worldwide. These
represent an untapped feedstock for fermentative single‐cell oil production, targeted at biofuel and
oleochemical generation, without affecting the sensitive marine environment or compromising food
security. Seven beach‐cast samples of seagrass (related to Z. marina, Z. noltii, S. filiforme, P. australis,
P. oceanic, and T. testudinum) were collected from marine ecosystems around the world. A
combination of 18S rRNA phylogenetic, structural, and comprehensive biomass analyses of seagrass
leaves were applied. The carbohydrate content ranged from 73 to 81% (w/dwbiomass). Single‐step
enzymatic hydrolysis was developed to efficiently release the monomeric sugars contained in
seagrasses biomass without any pretreatment. P. oceanica hydrolysate allowed for higher lipid yields
(6.8 g L−1) compared to the synthetic minimal medium (5.1 g L−1) in shake flasks, and was subsequently
utilized as the sole fermentation medium for oleaginous yeast T. oleaginosus at a technical scale using
a fed‐batch bioreactor, which provided 24.5 g L−1 lipids (0.35 g L−1 h−1). Moreover, the sugar/lipid
conversion ratio was 0.41 (w/w). Cumulative data indicates that by exploiting only half of the global
beach‐cast seagrass, approximately 4 million tons of microbial oils could be generated.
Produced from readily available beach‐cast waste materials, this simplified enzyme‐treated
seagrass media, provides a potential route to cost‐effective sustainable bioenergy/biofuel production.
Out of seven samples of seagrasses, P. oceanica (Mediterranean Sea) displays the best lipid
productivity exceeding the well‐optimized minimal nitrogen media. Generally, marine biomass does
not affect terrestrial agricultural activity. Moreover, in this study we only employ aged seagrass
banquettes that are washed ashore and do not affect the marine ecosystem. Therefore, the process
presented in this study offers a biorefinery model for sustainable generation of microbial lipids with
no impact on agricultural security or sensitive marine ecosystems.

Generation of Microbial Oil PUBLICATIONS OVERVIEW A Process Engineering Approach
M . A . M a s r i , 3
A waste-free, microbial oil centered cyclic bio-refinery approach based on
flexible macroalgae biomass
M. A. Masri, W. Jurkowski, P. Shaigani, M. Haack, N. Mehlmer and T. Brück.
Applied Energy, 224 (2018) 1–12
https://doi.org/10.1016/j.apenergy.2018.04.089
Status: Accepted
Contribution: MM analyzed and enzymatically hydrolyzed the algal biomass. MM cultivated yeast on
the hydrolysate and established the FACS based lipid assay. MM contributed to manuscript writing.
Summary
Biofuels and the oleochemical industry are highly dependent on plant oils for the generation of
renewable product lines. Consequently, production of plant lipids, such as palm and rapeseed oil, for
industrial applications competes with agricultural activity and is associated with a negative
environmental impact. Additionally, established chemical routes for upgrading bio-lipids to renewable
products depend on metal-containing catalysts. Metal leaching during oil processing results in heavy
metal contaminated process wastewater. This water is difficult to remediate and leads to the loss of
precious metals. Therefore, the biofuels and chemical industry requires sustainable solutions for
production and upgrading of bio-lipids. With regard to the former, a promising approach is the
fermentative conversion of abundant, low-value biomass into microbial, particularly yeast-based lipids.
This study describes the holistic, value-adding conversion of underexploited, macroalgae feedstocks
into yeast oil, animal feed and biosorbents for metal-based detoxification of process wastewater. The
initial step comprises a selective enzymatic liquefaction step that yields a supernatant containing 62.5%
and 59.3% (w/dwbiomass) fermentable sugars from L. digitata and U. lactuca, respectively. By dispensing
with chemical pretreatment constraints, we achieved a 95% (w/w) glucose recovery. Therefore, the
supernatant was qualified as a cultivation media without any detoxification step or nutrition addition.
Additionally, the hydrolysis step provided 27–33% (w/dwbiomass) of a solid residue, which was qualified
as a metal biosorbent. Cultivation of the oleaginous yeast C. oleaginosus on the unprocessed hydrolysis
supernatant provided 44.8 g L−1 yeast biomass containing 37.1% (w/dwbiomass) lipids. The remaining
yeast biomass after lipid extraction is targeted as a performance animal feed additive.
To facilitate the integration of our technology in existing chemical and biotechnological production
environments, we have devised simple, rapid and cost-efficient methods for monitoring both
lipogenesis and metal sorption processes. The application of the new optical monitoring tools is
essential to determine yeast cell harvesting times and biosorption capacities respectively. For the first
time we report on a waste-free bioprocess that combines sustainable, microbial lipid production from
low value marine biomass with in-process precious metal recycling options. Our data allowed for a
preliminary economic analysis, which indicated that each product could be cost competitive with
current market equivalents. Hence, the synaptic nature of the technology platform provides for the
economic and ecologic viability of the overall process chain.

Generation of Microbial Oil PUBLICATIONS OVERVIEW A Process Engineering Approach
M . A . M a s r i , 4
A sustainable, high-performance process for the economic production of waste-
free microbial oils that can replace plant-based equivalents
Mahmoud A. Masri, Daniel Garbe, Norbert Mehlmer, and Thomas Brück.
Energy and Environmental Science, 2019, 12, 2717
Patent Application No.: EP19157805.3 (2019)
https://doi.org/10.1039/C9EE00210C
Status: Paper: Accepted
Contribution: MM was responsible for the entire work.
Summary
Globally, biofuel and oleochemical production based on plant oils negatively affects biodiversity.
As an alternative triglyceride source, lipid production from oleaginous yeasts faces numerous
challenges in feedstock availability, lipid productivity, downstream processing, and waste treatment,
prohibiting the design of a cost-competitive process with regard to plant equivalents.
In this study, we present a fully integrated operation for microbial oil production, which
consolidates upstream and downstream processing with side-stream recycling. Co-fermentation of
sugar and acetic acid was successfully implemented in fed-batch, semi-continuous, and continuous
fermentation modes. Process validation was conducted at a 25-L scale with a lipid productivity of 1.2
g L−1 h−1. Cutaneotrichosporon oleaginosus cell debris was used as an inducer in Trichoderma reesei
fermentation for on-site generation of yeast-specific cell-wall hydrolases. In situ hydrolase application
allowed for efficient C. oleaginosus cell lysis (85% w/w) and simultaneous lipid release. A subsequent
centrifugation step yielded 90% (w/w) recovery of intracellular lipids without the need for any organic
solvent. The nutrient-rich water phase was applied as an internal sugar source for yeast subsequent
fermentation cycles. With this yeast hydrolysate, the lipid productivity was considerably increased to
2.4 g L-1 h-1.
A techno-economic analysis of the current lipid production processes estimated costs at $1.6/kg
lipid. Moreover, life cycle assessment analysis assumed an emission of 3.56 kg CO2 equivalents for
every 1 kg produced yeast oil. Accordingly, we established an integrated operation for bioconversion
of acetic acid and sugar to sustainable lipids at maximum productivity coupled with minimal waste
generation and energy consumption.
In this study, we established an integrated operation for bioconversion of acetic acid and sugar to
sustainable lipids at maximum productivity with minimal waste generation and energy consumption;
the cost gap compared with plant-based lipids was considerably reduced.
The approach established in this report links previous efforts to a forward-thinking optimized
approach. Thus, we believe there are still many possible parameters to be optimized and metabolic
modifications that can be implemented to further improve productivity. Moreover, proteomic and
metabolomics analyses could further guide process development.

Generation of Microbial Oil PUBLICATIONS OVERVIEW A Process Engineering Approach
M . A . M a s r i , 5
Extraction of Renewable Triglycerides from Oleaginous Microorganisms.
Masri M. A., Brück T.
Patent No. EP 3 536 800 A1 (2019)
Status: Published
Contribution: MM was responsible for the entire work
Summary
In the past decade, the global demand for plant- and animal-based lipids as platform for
pharmaceutical, food, biofuel and oleochemical industry increased by 65%. To meet the increase of
market demand with taking into consideration the environmental aspects as to mitigate the CO2
emissions motivate industry to develop novel sustainable bioprocesses.
With an ability to accumulate up to 70% lipids of their dry weight, oleaginous microorganisms are
poised to be the next generation for host lipid production. The conversion of microorganism’s lipids
into bio-kerosene, bio-diesel and bio-lubricants as well pharmaceutical and food applications has been
well documented.
Conventional triglyceride extraction procedures require two discrete consecutive steps: The initial
step comprises cell-wall lysis either via temperature shocks, chemical treatment or high-pressure
homogenization. In the second step triglycerides are extracted with organic solvent such as petroleum
ether, methanol, or chloroform. None of these methods are easily scaled to industrial level due to cost
issues and lack of environmental sustainability. Moreover, the latter application of organic solvents
negatively impacts the quality of the finished product. Hence, the complexity of solvent removal is
considered as extra cost and energy squandering.
The design of a specific enzyme system is essential for cell lysis and oil recovery, encompassing;
cellulase, polygalacturonase, mannanase, laminarinase and beta-glucosidase activities. The enzyme
system was optimized on an artificial biomass in order to carry out a complete cell lysis into
monosaccharaides. In the first stage of optimization, the biochemical components of a partially purified
cell-wall of the well-established oleaginous yeasts, T. oleaginosus was analyzed. Data resulting from
biomass analysis was used for the selection of required enzyme activates for selective cell lysis of T.
oleaginosus. Subsequently, the optimized enzyme system was tested directly on harvested culture of
living cells without any pretreatment. Process conditions of pH, incubation temperature, enzyme
concentration and space-time conversion yields were evaluated in order to minimize the process cost
and duration. For the demulsification of the cell lysate, a protease activity was added to the enzyme
system to accomplish a direct release of single cellular lipid. FACS cell counting in combination with
fluoresce-/ electron- microscope and gravimetric analysis was used to evaluate the efficiency of the
newly established process. Finally, lipids extraction at scale of 2 liters was performed to verify the
scalability of the suggested downstream process.

Generation of Microbial Oil PUBLICATIONS OVERVIEW A Process Engineering Approach
M . A . M a s r i , 6
Chemisorption of CO2 by chitosan oligosaccharide/DMSO: organic
carbamato–carbonato bond formation
Abdussalam K. Qaroush, Khaleel I. Assaf, Sanaa K. Bardaweel, Ala'a Al-Khateeb, Fatima Alsoubani,
Esraa Al-Ramahi, Mahmoud A. Masri, Thomas Brück, Carsten Troll, Bernhard Rieger and Ala'a F.
Eftaiha.
Green Chem., 2017, 19, 4305
https://doi.org/10.1039/C7GC01830D
Status: Accepted
Contribution: MM performed the biodegradation test. MM contributed to the manuscript writing.
Summary
One of the efficient approaches for climate change mitigation is carbon capture and sequestration (CCS).
It is considered as an important technology to minimize CO2 emission from flue gas in order to adhere to
emission regulations imposed by several governmental agencies in leading industrial countries, viz., China,
USA, and countries in the EU. To overcome problems associated with the mature technology of
monoethanolamine (MEA) wet scrubbing agent, ‘Green sorbents for carbon dioxide (CO2) capturing’ is a new
addition in sustainable chemistry that was introduced very recently by our research group, although others
have also reported significant contributions.
A newly formed bond of organic carbamato–carbonato emerged upon bubbling CO2 in a low molecular
weight chitosan hydrochloride oligosaccharide CS·HCl/DMSO binary mixture. The aforementioned bond was
detected and confirmed using attenuated total reflectance-Fourier transform Infrared (ATR-FTIR)
spectroscopy, with two prominent peaks at 1551 cm−1 and 1709 cm−1 corresponding to ionic organic
alkylcarbonate (RCO3−) and carbamate (RNH–CO2
− NH3+–R), respectively.1H–, 13C–, and 1H–15N heteronuclear
single quantum coherence (HSQC) NMR experiments were also employed. According to 13C NMR, two newly
emerged peaks at 157.4 ppm and 161.5 ppm attributed for the carbonyl carbon within the sequestered
species RCO3− and RNH–CO2
− NH3+–R, respectively. Upon CO2 bubbling, cross peaks obtained from 1H–15N
HSQC at 84.7 and 6.8 ppm correlated to the ammonium counterpart chemical shift bound to the proton
resonances. Volumetric uptake of CO2 was measured using an ATR-FTIR autoclave equipped with a silicon
probe. The equilibrium sorption capacity was 0.6 and 0.2 bars through the formation of RCO3− and RNH–CO2
−
NH3+–R, respectively. Moreover, physisorption by the dried DMSO contributed to additional 0.4 bars. Density
functional theory (DFT) calculations supported the occurrence of the suggested dual mechanisms and
confirmed the formation of carbonate at C-6 of the glucosamine co-monomer.
Moreover, CS·HCl/DMSO showed a slight impact on cell proliferation after 48 hours; this was a clear
evidence of its non-toxicity. The biodegradation test revealed that a degradation of about 80% of
CS·HCl/DMSO was achieved after 33 days; these results indicated that this method is suitable for green
industry. CS·HCl/DMSO showed modest activities against Staphylococcus aureus an Escherichia coli. In
addition, CS·HCl/DMSO demonstrated a significant antifungal activity against Aspergillus flavusin comparison
with Fluconazole.

Generation of Microbial Oil PUBLICATIONS OVERVIEW A Process Engineering Approach
M . A . M a s r i , 7
Catalytic decomposition of the oleaginous yeast Cutaneotrichosporon
oleaginous and subsequent biocatalytic conversion of liberated free fatty acids.
Martina K. Braun, Jan Lorenzen, Mahmoud A. Masri, Yue Liu, Eszter Baráth, Thomas Brück,
Johannes A. Lercher.
ACS Sustainable Chem, Eng.2019, 7, 7
https://doi.org/10.1021/acssuschemeng.8b04795
Status: Accepted
Contribution: MM analyzed the yeast biomass, produced the ethanol and TEA and contributed to the
manuscript writing.
Summary
A single step catalytic cell wall lysis and triglyceride hydrolysis combined with the enzymatic conversion
of lipids using the oleaginous yeast Cutaneotrichosporon oleaginosus (ATCC 20509) as a model is described.
Catalytic decomposition of yeast cells resulted in hydrolysis of about a third of cellular polysaccharides and
all triglycerides. Enzymatic processing of the lipid fraction with an oleate hydratase from Stenotrophomonas
maltophilia led to conversion of oleic acid to 10-hydroxystearic acid (10-HSA) (50%) without additional
purification. Cell wall polysaccharides were depolymerized by in situ formed amino acids from cell protein
fragments. The activity of the in situ generated, free amino acids was higher compared to that of additionally
added acids. Studies with the cellobiose and β-(1→3)-glucan indicated that glutamic and aspartic acids, which
are the dominant amino acids in yeast cells, are surprisingly more effective in hydrolysis in aqueous phase
than sulfuric acid. This points to a concerted mechanism of glycosidic ether bond cleavage catalyzed by amino
acids rather than to a pathway catalyzed by hydronium ions. The overall yield of the presented downstream
process at 453 K resulted in the release of 80% of total lipids.
Following our zero-waste strategy, the yeast hydrolysate after the hydrothermal treatment was tested
as cultivation media for ethanol production, as alternative for terrestrial biomass. The hydrolysate was used
without further nutrient addition or optimization. S. cerevisiae showed ability to metabolize the sugar
contained in the hydrolysate and convert it to ethanol. The ethanol titer (7.5 g L−1) was comparable to other
ethanol production procedures, using thermochemical processed biomass hydrolysates with wild type
baker’s yeast as the fermentation organism.
This work offers a green and economic way for the utilization of yeast and a new insight into the
conversion of biomass in the presence of endogenous catalysts. This present study shows the synergy
between chemical and biotechnological techniques to develop industrially relevant processes.

Generation of Microbial Oil PUBLICATIONS OVERVIEW A Process Engineering Approach
M . A . M a s r i , 8
Strain selection of microalgae isolated from Tunisian coast: characterization
of the lipid profile for potential biodiesel production
Asma Gnouma, Emna Sehli, Walid Medhioub, Rym Ben Dhieb, Mahmoud A. Masri, Norbert Mehlmer,
Wissem Slimani, Khaled Sebai, Amel Zouari, Thomas Brück, Amel Medhioub.
Bioprocess and Biosystems Engineering 41:1449–1459 (2018).
https://doi.org/10.1007/s00449-018-1973-5
Status: Accepted
Contribution: MM analyzed the algal biomass and lipid and contributed to the manuscript writing.
Summary
In the marine ecosystem, photosynthetic microalgae constitute an important component of the
marine flora since they form the basis of the aquatic food chain. These tiny plants have attracted a
lot of attention as sustainable producers of bioactive compounds and lipid-containing biomass for
food, animal feed and for biofuels.
Microalgae could be of importance for future biodiesel production as an alternative for a third
generation of biofuels. To select the most appropriate strain for biodiesel production, three
microalgae species, namely Isochrysis sp., Nannochloropsis maritima and Tetraselmis sp., isolated
from Tunisian coast, were biochemically characterized. Initially, gas chromatography analysis
showed that Isochrysis sp. and N. maritima contained 5- and 10-fold total fatty acids, respectively,
more than Tetraselmis sp. Then, the two microalgae Isochrysis sp. and N. maritima were subject to
random mutagenesis using ultraviolet-C radiation. Subsequently, a total of 18 mutants were
obtained from both species. The neutral lipid evaluation on said 18 mutants allowed the retention
of only 7 to further fatty acid characterization. Finally, gas chromatography revealed that the mutant
5c Isochrysis sp. was characterized by a high level of saturated fatty acids (52.3%), higher amount of
monounsaturated fatty acids (29.3%), lower level of polyunsaturated fatty acids (18.4%) and a
significant 1.3-fold increase in its C16–C18 content compared to the wild-type strain, which would
make it an interesting candidate for biofuel production.
To summarize, the mutant 5c Iso. sp. has shown the highest FI value among all the samples
analyzed by FCM reflecting a twofold increase of NL content compared to WT Iso. sp. Furthermore,
considering its higher SFA and MUFA levels, its lower PUFA levels and its significant 1.3-fold increase
of C16–C18 content compared to WT Iso. sp., it could be indicated that the mutant 5c Iso. sp. has a
good combination of different parameters which would make it an interesting candidate for an
eventual biodiesel production. The contribution of this work lies in the possibility to select candidate
microalgae strains which could be interesting for biodiesel production without formally resorting to
many mutation-selection procedures or to many types of expensive equipment.

Generation of Microbial Oil PUBLICATIONS OVERVIEW A Process Engineering Approach
M . A . M a s r i , 9
Isolation and Screening for Protease Activity by Marine Microorganisms
Bessadok, Boutheina; Masri A., Mahmoud; Brück, Thomas; Sadok, Saloua.
Bull. Inst. Natn. Scien. Tech. Mer de Salammbô, Vol. 42, (2015)
https://www.oceandocs.org/bitstream/handle/1834/9040/11.pdf?sequence=1
Status: Accepted
Contribution: MM performed the protein extraction, DNA extraction, SDS-gel, strain identification.
Summary
The aim of this study was to isolate and identify marine yeast strains from seawater, sediments
seaweed, and fish/shrimp coproducts. Over six-different identified species of marine yeast, Yarrowia
lipolytica strain having a proteolytic activity. Enzyme extracts showed that the relative optimal
enzymatic activity was reached at pH = 9.0 and temperature of 45.0°C.

Generation of Microbial Oil PUBLICATIONS OVERVIEW A Process Engineering Approach
M . A . M a s r i , 10
Characterization of the Crude Alkaline Extracellular Protease of Yarrowia
lipolytica YlTun15.
Bessadok, Boutheina; Masri A., Mahmoud; Brück, Thomas; Sadok, Saloua.
Journal of FisheriesSciences.com, 11(4): 019-024 (2017)
https://doi.org/10.21767/1307-234X.1000137
Status: Accepted
Contribution: MM designed the assay methods and characterization experiments.
Summary
Yarrowia lipolytica YlTun15 (GeneBank Acc. N MF327143), isolated from farmed Dicentrarchus
labrax’s gills, secretes an alkaline extracellular protease, which exhibited the highest activity at pH 9
and temperature 45°C. The enzyme activity extracted was tested in the presence of different ion metal
and protein inhibitors. The enzyme activity increased in the presence of both Cu2+ (1 mM) and Mn2+
(5mM) in the medium. K+, Na2+, Mg2+ and Ca2+ had no effect on the enzyme activity while Ni+, Hg+, Zn2+
and Fe2+ decreased significantly its relative activity to 43.63%, 66.25%, 30.75% and 19.48% respectively
at the 5 mM level. The enzyme was almost (activity=1.47%) inhibited by phenylmethylsulfonyl fluoride
at the concentration of 5 mM. However, the protease activity was relatively constant in the presence
of EDTA and SDS that may conclude that this enzyme was not a metalloprotease and belong to the
serine protease category. After 18 months-storage at -20°C, the enzyme activity has decreased to
23.17%. This protease may have a potential application in food and detergent activity.
The purified extracellular alkaline protease extracted from Yarrowia lipolytica YlTun15 shows
promising proprieties of stability and activities that may be used in profile various applications.
Further, this study will be completed with proteomic analysis to sequence and well characterization.

Generation of Microbial Oil PUBLICATIONS OVERVIEW A Process Engineering Approach
M . A . M a s r i , 11

PART III: PUBLICATIONS FULL TEXT
A seagrass based biorefinery for generation of single
cell oils targeted at biofuel and oleochemical
production
A waste free, microbial oil centered cyclic bio-refinery
approach based on flexible macroalgae biomass
A sustainable, high-performance process for the economic
production of waste-free microbial oils that can replace plant-
based equivalents
Chemisorption of CO2 by chitosan oligosaccharide/DMSO: organic
carbamato–carbonato bond formation

M . A . M a s r i , 1

Generation of Microbial Oil PUBLICATIONS FULL TEXT A Process Engineering Approach
M . A . M a s r i , 2
A seagrass based biorefinery for generation of single cell oils
targeted at biofuel and oleochemical production

M . A . M a s r i , 3

6/2018
Generation, Conversion, Storage, Distribution
Energy Technology
www.entechnol.de
Front Cover: Mahmoud A. Masri et al.A Seagrass-Based Biorefinery for Generation of Single-Cell Oils for Biofuel and Oleochemical Production

DOI: 10.1002/ente.201700604
A Seagrass-Based Biorefinery for Generation of Single-Cell Oils for Biofuel and Oleochemical ProductionMahmoud A. Masri+, Samer Younes+, Martina Haack, Farah Qoura, Norbert Mehlmer,*and Thomas Brgck*[a]
Introduction
The increasing use of plant-based lipids for sustainableenergy and biofuels applications does compromise food se-curity and results in reduced biodiversity.[1] Currently, morethan two times the globally available arable land would berequired to meet the global market demand of biodiesel.[2]
Consequently, searching for alternative starting materialsthat offer renewability and sustainability is of vital impor-tance.
Single-cell oil (SCO) production as a platform for biofuelproduction has been investigated with microorganisms en-compassing Aspergillus awamori,[3] Scenedesmus sp. ,[4] Yarro-wia lipolytica,[5] Cryptococcus sp.,[6] and Trichosporon oleagi-nosus.[7] T. oleaginosus (ATCC 20509), a recently isolatedoleaginous yeast,[8] is able to convert different monomericcarbon sources (C5 and C6 sugars), as well as complex wastefeedstock materials, into triacylglycerol lipids stored in sub-cellular compartments,[9] with cellular lipid yields of up to70 % of the cell dry weight.[8] Palmitic acid, stearic acid, andoleic acid are the major fatty acids of the accumulated trigly-cerides. Moreover, the biodiesel B20 derivative from T. olea-ginosus lipid has been shown to meet the ASTM certificatio-n.[7a] Therefore, the SCO fatty acid composition offers apotent alternative to vegetable oils, by alleviating competi-tion with food resources. Nevertheless, feeding these oleagi-nous microorganisms with a suitable carbon source, whichallows for cost-effective biodiesel production, remains a con-siderable challenge.
Marine biomass as a carbon source, accounts for up to71 % (w/w) of all biologically stored carbon globally.[10] Atpresent, macroalgae and seagrass are the most abundant
marine macrophytes available.[11] With relatively high photonconversion efficiency,[12] seagrass meadows are among thehighest productivity ecosystems on earth. This productivity isestimated to be approximately 27.4 million tons per year oforganic carbon (Corg).
[13] Seasonally, detached seagrass-leafmaterial accumulates as banquettes on beaches and shore-lines. This phenomenon is enhanced by the relatively lownatural biodegradation rate (&19 %) of this leafy biomass byherbivores and heterotrophs.[14] For instance, in the southcoast of Australia (Beachport, South Australia), seagrass ac-cumulated at a height of 1.5 m extending along the shorelinewith a length in excess of 50 km (Figure S1, Supporting Infor-mation). Seagrass biomass contains an unfavorable C/N/Pratio of 474:24:1 which hampers its biological degenera-tion.[15] Factoring in that approximately 50 % of the availableseagrass biomass is degraded, buried on the ocean seabed, or
78 million tons of residual seagrass deposits accumulate an-nually on shorelines worldwide. These represent an untappedfeedstock for fermentative single-cell oil production, targetedat biofuel and oleochemical generation, without affecting thesensitive marine environment or compromising food security.Seven beach-cast samples of seagrass (related to Z. marina,Z. noltii, S. filiforme, P. australis, P. oceanic, and T. testudi-num) were collected from marine ecosystems around theworld. A combination of 18S rRNA phylogenetic, structural,and comprehensive biomass analyses of seagrass leaves wereapplied. The carbohydrate content ranged from 73 to 81 %(w/dwbiomass). Single-step enzymatic hydrolysis was developed
to efficiently release the monomeric sugars contained in sea-grasses biomass without any pretreatment. P. oceanica hydro-lysate allowed for higher lipid yields (6.8 g L@1) compared tothe synthetic minimal medium (5.1 g L@1) in shake flasks, andwas subsequently utilized as the sole fermentation mediumfor oleaginous yeast T. oleaginosus at a technical scale usinga fed-batch bioreactor, which provided 24.5 g L@1 lipids(0.35 g L@1 h@1). Moreover, the sugar/lipid conversion ratiowas 0.41 (w/w). Cumulative data indicates that by exploitingonly half of the global beach-cast seagrass, approximately4 million tons of microbial oils could be generated.
[a] M. A. Masri,+ S. Younes,+ M. Haack, Dr. F. Qoura, Dr. N. Mehlmer,Prof. Dr. T. BrfckDepartment of Chemistry—Professorship of Industrial BiocatalysisTechnical University of Munich (Germany)E-mail: [email protected]
[++] These authors contributed equally to this work.
Supporting information and the ORCID identification number(s) for theauthor(s) of this article can be found under:https://doi.org/10.1002/open.201700604.
T 2017 The Authors. Published by Wiley-VCH Verlag GmbH & Co. KGaA.This is an open access article under the terms of the Creative CommonsAttribution Non-Commercial NoDerivs License, which permits use anddistribution in any medium, provided the original work is properly cited,the use is non-commercial and no modifications or adaptations aremade.
Energy Technol. 2018, 6, 1026 – 1038 T 2018 The Authors. Published by Wiley-VCH Verlag GmbH & Co. KGaA, Weinheim 1026

consumed by herbivores, simple calculations indicate that40 million tons of dry seagrass biomass remain available forbiotechnological applications. To that end, efficient enzymat-ic hydrolysis of seagrass leaf microfibril could provide a sus-tainable stream of monomeric hexose and pentose sugarsthat could be used as a fermentation medium. In general, theresulting sugar-rich hydrolysate as well low nitrogen andphosphor content may actually be beneficial for cultivationof selected oleaginous yeasts, as these organisms initiate lipo-genesis only when the nitrogen or phosphate concentration islow. However, according to published data, enzymatic hy-drolysis and fermentation steps were successful only whenpretreatment stages were used in advance. These pretreat-ment processes present additional costs and usually releaseinhibitory compounds that hinder the fermentation.[16]
Few studies have evaluated the utilization of fresh sea-grasses biomass as a feedstock platform for the production ofbioethanol.[17] In the available reports, the utilization ofbeach-cast seagrass residue has not been considered. To thebest of our knowledge, the production of SCO by microbialfermentation on hydrolysates derived from beach-cast sea-grass biomass has not been investigated.
The aim of this work was to investigate the feasibility ofutilizing seagrass hydrolysate for the fermentation of oleagi-nous yeast with the focus on biodiesel production, in additionto other industrial applications.[9] Seven seagrass samplesfrom six different seagrass eco-regions were collected, and aphylogenetic classification of each sample was establishedusing ITS1 and 18s rRNA sequencing. To further elucidatethe structure of the samples, electron microscopy analysis ofthe leaves was performed. Biomass analysis of each seagrasssample was also conducted in a detailed manner. Subse-quently, an optimized enzyme system was devised that al-lowed efficient hydrolysis and liquefaction of the seagrassbiomass without the need for chemical pretreatment. With-out further nutrient addition, the resulting seagrass hydroly-sate was utilized as the sole cultivation medium for the olea-ginous yeast Trichosporon oleaginosus. Hydrolysates derivedfrom aged-seagrass samples proved to be an excellent culti-vation media, comparable to conventional defined syntheticmedia. Lipid production was scaled to fed-batch fermenta-tion using the best performing seagrass hydrolysate to evalu-ate the potential for biodiesel generation. Finally, the fattyacid profile of the produced lipid was characterized to test itssuitability for biodiesel production. This study demonstratedfor the first time that residual seagrass biomass, accumulatingin massive deposits on beaches and shorelines, can be appliedas a new feedstock for the production of biogenetic fats andoils. With downstream processing, the resulting plant oil-likelipids could be upgraded by using well-known processes intohigh-value biokerosene, biodiesel, and biolubricants.[6,7,9]
Results and Discussion
Previous reports demonstrated that oleaginous yeasts such asYarrowia lipolytica and Lipomyces starkeyi can producelipids from sources such as pure glucose, xylose, and sucrose
in batch fermenters.[18] Further studies investigated the use ofrenewable feedstocks such as glycerol and molasses ascarbon sources for lipid accumulation in oleaginous yeast-s.[18a] Trichosporon oleaginosus (ATCC 20509) has the capaci-ty to metabolize a variety of carbon sources including hexo-ses and pentoses.[8] Under nitrogen- or phosphate-limitingconditions, this yeast can accumulate up to 70 % of its dryweight as lipids, composed mainly of C16 and C18 fattyacids.[19]
Regarded as nuisance, especially in resorts and touristicdestinations, beach-cast seagrass deposits are exclusively dis-posed of without valorization.[20] In this study, we have exam-ined the value-added use of aged seagrass waste as a readilyavailable, low-cost, raw feedstock for production of microbiallipids in T. oleaginosus. Nevertheless, neither a comprehen-sive biomass analysis nor an optimized enzymatic treatmentsystem have yet been established.
Identification of seagrass samples
The different seagrass strains and their corresponding loca-tions are shown in Table 1. These identified seagrasses arerelated to the four genera (out of eleven total knownGenera) Zostera, Syringodium, Posidonia, and Thalassia sp.,which cluster in the four seagrass families Zosteraceae, Cym-odoceaceae, Posidoniaceae, and Hydrocharitaceae, respective-ly.
In this study, the standard 18S sequence information wasemployed, for the first time for phylogenetic analysis of sea-grass. The data was subsequently assembled to generate amaximum-likelihood phylogenetic tree (Figure S2). This treeidentified two major groups: Posidonia australis is resolvedin the smaller one, basal to the group containing Zosteraspp., Syringodium filiforme, Thalassia testudinum, and Posi-donia oceanica, all species with complex phyllotaxy. All se-quences are available in the Supplementary Information.
The Zostera clade was resolved based solely on strain level(Z. noltii and Z. marina) and not into different geographical-ly distinct groups. Posidonia oceanica and Syringodium fili-forme are resolved in a third clade within two lineages ofspecies and the forth clade harbored Thalassia testudinum.
Unexpectedly, Posidonia oceanica and Posidonia australisshowed a considerable genetic divergence in the 18S rDNA-based phylogenetic tree. In contrast, previous reports apply-
Table 1. Selected seagrass samples, locations, and identification based onITS1 and 18S rRNA sequencing.
Strain Location[a]
Z. marina (1) Baltic Sea (Hohenkirchen)S. filiforme Caribbean Sea (Mexico)P. australis South AustraliaT. testudinum North Sea (Bahamas)Z. marina (2) Baltic Sea (Greifswald)Z. noltii Mediterranean Sea (Malta1)P. oceanic Mediterranean Sea (Malta2)
[a] GPS Data is given in the Supporting Information (Table S1).
Energy Technol. 2018, 6, 1026 – 1038 T 2018 The Authors. Published by Wiley-VCH Verlag GmbH & Co. KGaA, Weinheim 1027

ing an rbcL cladogram showed that these two Posidoniastrains are closely related.[21] However, the present study isthe first using conventional 18S rDNA sequences to assemblea phylogenetic relatedness of global seagrass populations.Consequently, more work should be conducted towards thechoice of genetic markers that can be reproducibly used toconstruct the seagrass phylogeny, as it is predicted that 91 %of the entire seagrass diversity is still unknown.[22] Possiblecandidates that could complement the current phylogeneticmarker are phyB and the plastidial matK.[22]
Comprehensive biomass analysis
The overall biochemical composition of the seven seagrasssamples is summarized in Table 2. As expected, all samples
display a high carbohydrate content of 73–81 % (w/dwbiomass)of total dry weight. Interestingly, the protein content differswidely among the various seagrasses. P. oceanica and T. testu-dinum 5 % (w/dwbiomass) contained less protein than Z. marina(14 % w/dwbiomass, Baltic Sea, Hohenkirchen, Germany). Inter-estingly, the lipid content of 2–3 % (w/dwbiomass) was relativelylow for all seagrass samples, except for Z. noltii, whichshowed a lipid content of 7 % (w/dwbiomass). The fatty acidanalysis data for each lipid sample is reported in the Sup-porting Information (Table S2). Ash constituted 12–13 % (w/dwbiomass) of the dry weight for most seagrass samples. Z.noltii and Z. marina (Baltic Sea- Hohenkirchen, Germany)were the exception with lower-than-average ash contents of 7and 10 % (w/dwbiomass), respectively. The subtle differences inthe biochemical compositions of all seven examined seagrassstrains may be attributed to different climate conditions, the
composition of the ocean water, the time of the year, or thecomposition of marine sediments.
Moreover, as most samples were collected as beach-castresidues, sun bleaching and exposure to the weather is an es-sential factor that will influence the biomass composition ofall seagrass samples. The state of the biomass is also reflectedby its color as in the case of the Z. marina sample, collectedfrom the Baltic Sea- Hohenkirchen, which was fresh, rela-tively pure, and had a dark green color. Conversely, thesecond Z. marina sample collected from Baltic Sea, Greifs-wald was aged and characterized by a light-yellowish color.
Finally, biomass analysis showed water contents of the var-ious seagrass samples ranging between 8 and 10 % (w/wbiomass)(data not shown).
Carbohydrate compositional content
The biomass analysis indicates that conventional chemicalbiomass hydrolysis with single acid treatment will result inan underestimation of the actual sugar content.[23] Conse-quently, we have developed and optimized a combined ap-proach involving both a chemical and an enzymatic biomasstreatment, which improved the determination of the totaland differential carbohydrate contents (optimization data isnot shown). The results are presented in Table 3 as a per-centage of the total dry biomass weight.
As expected, glucose is the dominant monomeric carbohy-drate, most likely derived from cellulosic leaf fibers. Hence,glucose contributes approximately 67 % (w/dwbiomass) of thetotal biomass in Z. noltii, whereas it only accounts for about40 % (w/dwbiomass) of P. australis. All seven strains contain var-ious neutral pentose (rhamnose and xylose) and hexose (glu-cose and galactose) sugars as well as some sugar acids (glu-curonic and galacturonic acid). Glucose is the dominantsugar in all samples, whereas all other sugar types have beendetected at concentrations <10 % (w/dwbiomass). This datamakes seagrass biomass a potentially suitable source for thefermentation of various microorganisms, as glucose is thepreferred carbon source for a diverse array of pro- and eu-karyotic microorganisms.
Chemical composition of biomass ash
Minerals contained in the ash are important for yeast fer-mentation as some trace elements play an essential role in
Table 2. Biochemical analysis of seagrass samples.
Seagrass Content in seagrass [% (w/dwbiomass)]lipid protein sugar ash
Z. marina (1) 2.6:0.13 13.4:0.13 73.4:1.17 10.6:0.94S. filiforme 1.8:0.09 07.6:0.08 77.3:0.87 13.3:1.03P. australis 2.1:0.19 07.5:0.06 78.7:1.17 11.7:0.04T. testudinum 2.4:0.34 05.3:0.11 79.1:0.74 13.2:0.66Z. marina (2) 3.0:0.25 10.4:0.11 73.3:0.57 13.3:0.03Z. noltii 7.2:0.46 11.9:0.14 73.9:0.91 07.0:0.41P. oceanica 2.3:0.41 05.1:0.06 80.8:0.57 11.8:0.68
Table 3. Carbohydrate composition of collected seagrass samples.
Seagrass Carbohydrate in seagrass [% (w/dwbiomass)]galacturonic acid glucose xylose, mannose, fructose rhamnose fucose
Z. marina(1) 6.46:0.26 58.13:0.11 4.27:0.16 3.82:0.39 0.99:0.06S. filiforme 5.73:0.10 56.08:0.19 3.67:0.19 3.05:0.17 1.19:0.03P. australis 5.18:0.15 51.53:0.15 7.31:0.51 7.79:0.07 1.31:0.05T. testudinum 8.81:0.08 56.09:0.22 2.77:0.05 3.91:0.27 1.01:0.03Z. marina(2) 6.54:0.12 54.06:0.01 3.87:0.16 5.54:0.13 1.12:0.01Z. noltii 4.11:0.24 66.36:0.02 2.48:0.35 3.31:0.07 0.56:0.02P. oceanica 6.61:0.10 55.99:0.17 3.67:0.09 7.17:0.12 1.23:0.02
Energy Technol. 2018, 6, 1026 – 1038 T 2018 The Authors. Published by Wiley-VCH Verlag GmbH & Co. KGaA, Weinheim 1028

lipid production.[24] At present, this is the first report on theash composition from banquettes of various seagrass spe-cies.[25] Elemental analysis of ash from each seagrass samplewas performed using SEM and energy-dispersive X-ray spec-troscopy (EDX). The main inorganic elements constitutingthe ash structure are Ca and Mg, followed by smalleramounts of Al and S. The concentrations of these elementsvary extensively between the seagrass species; this is largelydependent on the availability of nutrients in the specificmarine ecosystem. Minute concentrations of Sr, W, Cr, andMo were detected among the various samples. Interestingly,phosphate was completely absent from both P. oceanica andT. testudinum. The detailed elemental analysis is presented inSupporting Information (Table 4).
Structural analysis
For industrial applications, high biomass density offers aneconomical advantage concerning the cost of handling andtransportation of the materials. To gain detailed insight intothe seagrass structural characteristics, fiber location, andquantity, SEM was applied to examine cross sections of eachtype of seagrass leaf. As depicted, Z. marina leafs (Figure 1)are organized in closed cell structures located only at theouter surfaces of the leaf. They appear to reinforce a centralhollow matrix, which leads to a low density of leaves. Con-versely, a dense non-hollow structure is observed in P. oce-anica, with fiber bundles interspersed within the leaf matrix(Figure 1). This observation might explain the fact that,throughout the handling of the seagrass samples, P. oceanicahad the highest density, which presents it as the most advan-tageous material for processing and transportation.
Treatment of seagrass biomass
The production of biomass hydrolysates for microbial biofuelproduction can be conducted using complete chemical hy-drolysis (H2SO4 or solid acid catalysts).[26] Moreover, mildchemical processing can be also implemented as pretreat-ment for subsequent enzymatic hydrolyses. However bothmethods often generate inhibitory substances, thereby neces-sitating a complex detoxification step preceding fermenta-tion.[27] To circumvent these difficulties, a purely enzymatic-
based approach was applied in the current study, which effi-ciently releases the carbohydrate monomers without any pre-treatment. Sterilization of the various seagrass samples wasperformed in a laboratory-scale autoclave at 120 8C for15 min. This step was performed to eliminate microbial con-taminants that could be present within the seagrass residues.Sterilization opens up the cell wall to allow access for the hy-drolytic enzymes; however, this step is not really consideredas pretreatment (such as chemical pretreatment and hydroly-sis of carbohydrates), as saccharification of hemicelluloseand cellulose starts at temperatures above 150 8C.[16] Nitsoset al. , (2012) implemented optimization procedures of hydro-thermal pretreatment of lignocellulosic biomass with temper-atures varying within 130–220 8C over 15–180 min,[28] whichstill generated—although to a lower extent—unwanted inhib-itory chemicals. The main structural constituents of seagrassare cellulose and hemicellulose with no lignin present, allevi-ating the harsh pretreatment that lignocellulosic biomasswould have required.
A mixture of seagrass-specific hydrolases, including cellu-lolytic, hemicellulolytic, pectinolytic, laminarolytic enzymesand a b-glucosidase, was formulated to provide an optimumhydrolase system. The corresponding activities were obtainedfrom four commercial enzyme products: Cellic CTec 2 (C),Cellic HTec (H), Pectinex (P), and Novozymes 188 (B),which are all products of Novozymes. The optimization ofthe required enzymes system extended over 35 differentenzyme mixtures at varied concentrations. Briefly, the opti-mization process was performed using Z. marina as a modelsubstrate. Biomass-to-glucose conversion ratios from variousmixtures of Cellic CTec 2 with Cellic HTec at a fixed totalconcentration of 1.0 % (w/dwbiomass) are presented in Figure S3(Supporting Information). The ratio ranges 2:3 and 1:4 (C/Hw/w) showed the highest conversion ratios at 36.1 to 37.8 %(w/dwbiomass), respectively. The ratio 1:4 (C/H w/w) was usedat different concentrations starting from 0.2 to 2.0 % (w/dwbiomass) (2–20 mg g@1 biomass). Addition of the b-glucosidaseactivity to the previous mix increased the glucose recoveryfrom 37.8 to 47.5 % (Figure S4).
The optimum activity was obtained at a commercially rele-vant concentration (1.5 % w/dwbiomass, 15 mgg@1 biomass), tem-perature of 50.0 8C, and pH 5.0 (50.0 mm, Sodium acetate)for 72 h. All seven seagrass samples were subjected to the
Table 4. Mineral composition of seagrass ash samples.
Seagrass Elemental content [% (w/dwash)]O Na Mg Al Si P S Cl K Ca Mn Fe Cu Sr W Cr Mo
Z. marina (1) 67.4[a] 1.4 10.3 1.4 7.3 0.7 1.8 0.0 0.6 8.5 0.2 0.2 0.1 n.d. n.d[b] . n.d. n.d.S. filiforme 65.8 n.d. 8.9 0.7 n.d. 0.9 6.1 n.d. n.d. 17.2 n.d. n.d. n.d. 0.5 n.d. n.d. n.d.P. australis 63.0 n.d. 9.8 1.1 0.1 0.3 1.5 n.d. n.d. 23.7 n.d. 0.2 n.d. n.d. 0.1 n.d. n.d.T. testudinum 73.1 n.d. 6.0 0.6 n.d. n.d. 5.3 n.d. n.d. 15.0 n.d. n.d. n.d. n.d. n.d. n.d. n.d.Z. marina (2) 66.4 2.6 8.4 1.3 6.3 0.8 1.8 n.d. 2.1 9.1 0.5 0.3 0.3 n.d. n.d. 0.0 n.d.Z. noltii 65.0 2.3 10.6 1.3 2.6 3.2 1.3 0.5 0.5 11.9 0.1 0.2 0.1 n.d. n.d. n.d. 0.5P. oceanica 69.3 n.d. 12.7 1.0 n.d. n.d. 2.6 n.d. n.d. 14.1 n.d. n.d. n.d. 0.3 n.d. n.d. n.d.
[a] Relative STDV for all given numbers is , :2 %. [b] n.d.: Not detectable
Energy Technol. 2018, 6, 1026 – 1038 T 2018 The Authors. Published by Wiley-VCH Verlag GmbH & Co. KGaA, Weinheim 1029

same enzymatic treatment for three days. Glucose release asthe controlling process indicator was monitored by HPLC(Figure 2). Hydrolysate from Z. noltii contained the highestamount of glucose with 32 g L@1 followed by P. oceanica withalmost 28.5 g L@1. As expected, glucose was the major sugarin the hydrolysate. However, other monosaccharides havebeen generated as well. The sugar composition of the finalhydrolysates is presented in Supporting Information(Table S3).
The remainder of the organic-bound nitrogen in the finalhydrolysate (following 10 kDa cross filtration) was deter-mined by using the Kjeldahl method. For all samples, the ni-trogen content was measured in g L@1 and a Kjeldahl nitro-gen-to-protein conversion factor of 6.25 was used (Table 5).Consistent with the biomass analysis results prior to the crossfiltration, T. testudinum and P. oceanica hydrolysates exhibit-ed the lowest nitrogen contents with 0.6 and 0.5 g L@1, respec-tively, whereas Z. marina (North Sea) hydrolysate containedthe highest amount (3.5 g L@1). It is also worth mentioningthat the Kjeldahl method applied here measured the nitro-gen bound in organic substances only (total Kjeldahl nitro-gen was not determined). However, it is acceptable to con-sider that nitrogen as ammonia (NH3) and ammonium(NH4
+) are negligible and the total nitrogen in the hydroly-sates was not appreciably underestimated. Factoring in glu-cose as the main carbon source, T. testudinum and P. oceani-
ca hydrolysates hold the highest C/N ratios with approximatevalues of 48 and 52, respectively.
Utilization of hydrolysates as sole media for bio-oil production
The potential use of seagrass hydrolysate as sole carbonsource for lipid production was evaluated. This assessmentwas conducted without any nutritional addition to the hydro-lysate. The well-documented oleaginous yeast Trichosporonoleaginosus was cultivated in each of the seven hydrolysates.The resulting data are compared to the cultivation data ob-tained in nitrogen-limiting medium A, optimized to promotehigh lipid accumulation.[29] To evaluate the T. oleaginosusgrowth rate, the optical density (OD600) was recorded every24 h with an initial optical density of 0.5 (Figure 3). Culturesgrown in P. oceanica hydrolysate as the sole cultivationmedium, reached OD600 = 45 at day 5, which was faster thanany other cultivation medium.[29] Most interestingly, nogrowth was observed in hydrolysates from Z. noltii and Z.marina (North Sea).
By contrast, T. oleaginosus grew very well in Z. marina hy-drolysate from the Baltic Sea. This is due to the former hy-drolysates originating from fresh seagrass samples, whereasthe latter hydrolysates were all derived from aged seagrasssamples that were previously exposed to sunlight.
Figure 1. Electron microscopy image. Applied energy: 1.00 kV, LEI, detector: SEM/LM. Zostera marina : (A, B) show the leaf transverse section at 300 and1500 times magnification, respectively, (C, D) show the leaf fibers at 430 and 600 times magnification, respectively and (E, F) show the surface of leaf at 300and 1000 times magnification, respectively. Posidonia oceanica : (G, J) show the leaf transverse section at 300 and 1500 times magnification, respectively,(H, K) show the leaf fibers at 430 and 600 times magnification, respectively ; and (I, L) show the surface of leaf at 300 and 1000 times magnification, respectively.Scale bars correspond to 10 mm.
Energy Technol. 2018, 6, 1026 – 1038 T 2018 The Authors. Published by Wiley-VCH Verlag GmbH & Co. KGaA, Weinheim 1030

Certain inhibitory compounds, including phenolic acids,[30]
bacteriostatic agent,[31] and rosmarinic acid,[32] could be stillpresent in fresh samples from Z. noltii and Z. marina (NorthSea). Interestingly, yeast grown in T. testudinum, Z. marina(Baltic Sea), and P. oceanica reached OD600 values of 29, 39,and 40, respectively, in just 3 days, whereas T. oleaginous cul-tivated in medium A (Minimal-N medium) was only able toreach OD600 =15 in the same time period. The presence ofvarious nutrients and trace elements in the respective sea-grass hydrolysates could account for this high growth rate.
Gravimetric analysis was performed to determine the totallipid content in T. oleaginosus after 5 days of fermentation
(Figure 4). The yeast produced nearly 55 % (w/dwbiomass) lipidswhile growing in minimal-N medium. Amongst the seagrass-es, P. australis and S. filiforme hydrolysates enabled the high-est lipid accumulation of approximately 50 % (w/dwbiomass). T.oleaginosus cultivated in P. oceanica hydrolysate accumulat-ed approximately 45 % (w/dwbiomass) lipid content.
These aforementioned results show the total lipid content(C) as percent of cell dry weight. Measuring lipid production(P)—expressed as grams per liter of culture—produced dif-fering results (Figure 5). After 5 days fermentation, the lipidproductivity of T. oleaginosus reached its peak of 6.8 g L@1 inP. oceanica hydrolysate. T. testudinum hydrolysate allowedfor a 5.7 g L@1 lipid accumulation, whereas yeast grown inmedium A produced roughly 5.1 g L@1 of SCO.
Lipid accumulation in oleaginous microorganisms is usual-ly initiated upon nutrient deprivation (nitrogen, phosphate,or sulfur).[33] Minimal-N medium is known to induce lipidbiosynthesis in T. oleaginosus as it contains low nitrogen con-tent. Nitrogen-limitation is considered to be essential for in-duction of lipogenesis in oleaginous yeasts and other organ-isms. Consequently, it was implemented for large-scale (15-Lstirred-tank) fed-batch fermentation and biofuel productionin yeast.[34]
The results of biomass analysis of P. oceanica and T. testu-dinum may explain the high lipid accumulation in T. oleagi-
Figure 2. Time dependent release of glucose during enzymatic treatment ofthe seagrass samples. [a] S. filiforme, P. australis, T. testudinum, and Z. marina(2); [b] Z. marina (1), Z. noltii and P. oceanica.
Table 5. Kjeldahl nitrogen content in the hydrolysate after 10 kDa cross fil-tration.[a]
Hydrolysate Protein content Nitrogen content[% (w/dw)] [% (w/dw)] [g L@1]
Z. marina (1) 2.10 0.34 3.54S. filiforme 0.43 0.07 0.72P. australis 0.47 0.07 0.76T. testudinum 0.38 0.06 0.59Z. marina (2) 0.55 0.09 0.90Z. noltii 1.60 0.26 2.56P. oceanica 0.36 0.06 0.55
[a] All relative standard deviation are less than 5%.
Figure 3. T. oleaginous growth by the time during shake flask fermentationusing the seagrass hydrolysates as a sole medium. [a]: hydrolysate of Z.marina (1), S. filiforme, T. testudinum and P. oceanica ; [b] hydrolysate of Z.marina (2), Z. noltii and P. australis.
Energy Technol. 2018, 6, 1026 – 1038 T 2018 The Authors. Published by Wiley-VCH Verlag GmbH & Co. KGaA, Weinheim 1031

nosus cultivated in their corresponding hydrolysates. Proteincontent in these two samples was the lowest amongst all sea-grasses with only 5 % (wlipid/
dwbiomass) of total dry weight. Fol-lowing 10 kDa cross-filtration, P. oceanica and T. testudinumhydrolysates contained the least amount of nitrogen and ex-hibited the highest C/N ratios (52 and 48 respectively)among all other samples. However, the C/N ratio of medi-um A is approximately 150; thus, other factors besides nitro-gen-limitation may be driving the lipogenesis in T. oleagino-sus grown in these two samples. In the ash analysis, phos-phate from P. oceanica and T. testudinum strains was not de-tectable. The effect of phosphate limitation on the lipid pro-duction in yeast strains has been previously examined.[35]
Exemplary, lipid accumulation in Rhodosporidium toruloideswas directly associated with a high carbon/phosphorus (C/P)ratio, and it was maintained even in the presence of excessnitrogen.[36] P. oceanica and T. testudinum hydrolysates withboth high C/N and high C/P ratios allowed for higher lipidaccumulation compared to minimal-N medium exhibitingonly nitrogen limitation. The deficiency of phosphate and ex-haustion of nitrogen allowed rapid lipid accumulation from
less than 2.4 g L@1 at day 3 (T. testudinum hydrolysate) to amaximum of 6.8 g L@1 at day 5 (P. oceanica hydrolysate). Fur-thermore, the relatively high nitrogen content in the hydroly-sates compared to medium A allowed for higher yeast bio-mass production. Following 5 days culture, T. oleaginosus cul-tivated in T. testudinum and P. oceanica reached cell drymasses of approximatey 11.6 and 15.5 g L@1, respectively.Conversely the yeast only achieved approximately 9.8 g L@1
of dry biomass when grown in medium A (Figure S5, Sup-porting Information). The Seagrass hydrolysates exhibitedrather optimal C/N/P content, thereby allowing simultaneoushigh cell biomass and high lipid production. C/N and C/Pratios might not be the only reason behind the high lipidyields. Chemical nutrition and the presence of various traceelements in the hydrolysates could also explain the clear ad-vantage over the synthetic medium A. Further investigationwould help to elucidate the factors contributing to lipogene-sis in T. oleaginosus grown in seagrass hydrolysates.
In this study, the hydrolysates from seagrass were used asthe sole carbon source for yeast growth and lipid productionin aerated shake flasks. Optimization of fermentation canhelp to enhance the obtained lipids yield. This is achieved byadding further nutrition to the media or using bioreactors.
Lipid production in fed-batch bioreactor
Based on the data from previous shake flask cultures, P. oce-anica from Malta was chosen as biomass feedstock for fer-mentation at liter scale. T. oleaginosus was cultivated in con-trolled fed-batch with P. oceanica hydrolysate as the solecarbon source and without any nutrients addition. The hy-drolysate contained 28.5:0.59 g L@1 glucose and 5.53:0.26 g L@1 pentose. 1 L of undiluted hydrolysate was em-ployed as the main fermentation medium with another100 mL of concentrated P. oceanica hydrolysate used as feedfor the fermentation. The highest yeast dry cell weight(DCW) of approximately 42 g L@1 was obtained from 70 hbatch culture (Figure 6). Lipid accumulation was initiatedafter 24 h upon depletion of nitrogen as nutrient. Yeast lipidcontent peaked at 54.4 % (w/dwbiomass) triglycerides(0.35 g L@1 h@1) after 96 h of fermentation (Figure 7), with thetotal lipid concentration reaching 24.5 g L@1 of hydrolysate atthe same time point (Figure 8).
Bioconversion of cellulosic biomass by microbial fermenta-tion usually necessitates an acidic/alkaline thermochemicalpretreatment step to facilitate the subsequent enzymatic hy-drolysis of cellulose.[37] Lipid production from corn stover bythe oleaginous yeast Cryptococcus curvatus required a pre-treatment of the biomass with 0.5 m NaOH at 80 8C for75 min.[38]
Moreover, pretreatment could generate substances that in-hibit the enzymatic hydrolysis step and disrupt the microbialfermentation. Furfural was found to elongate the lag-phase,whereas benzoic acid negatively affected the microbialgrowth rate and biomass yield.[39] A complex chemical detox-ification phase would be required, and all these extra stepspresent additional costs and diminish the eco-friendly aspect
Figure 4. Lipid production of T. oleaginous cultivated in various seagrass hy-drolysates after 5 days shake flask fermentation as percent dry weight%(wlipid/
dwbiomass).
Figure 5. Lipid production of T. oleaginous cultivated in various seagrass hy-drolysates after 3 and 5 days as lipid g L@1 culture.
Energy Technol. 2018, 6, 1026 – 1038 T 2018 The Authors. Published by Wiley-VCH Verlag GmbH & Co. KGaA, Weinheim 1032

of the process. In our upscaling experiment, neither dilutionnor detoxification of the hydrolysate medium was necessarygiven that no inhibitory effect on the yeast was detected.This fact highlights the importance of using a purely enzy-matic-based hydrolysis approach, and the viability of seagrassbiomass as feedstock for microbial oil production.
Following fermentation, seagrass biomass (120 g) was con-verted to 25 g of microbial lipids with a lipid coefficient of208.4 mg g@1. In comparison, Meo et al., 2017 used T. oleagi-nosus in a bioreactor to convert 250 g of microalgae biomassinto 30 g of lipids with a lipid coefficient of only 120 mg [email protected], the researchers supplemented 126 g pure glu-cose as feed,[40] whereas in our experiment, seagrass hydroly-sate was used as the sole carbon source for both the mainand the feeding fermentation media. Additionally, the micro-algae biomass was disrupted (to open the cell and facilitatethe subsequent hydrolysis) with a high-pressure homogeniz-er—an energy consuming process—and required additionalpretreatment. Therefore, our result demonstrate that sea-grass is a superior feedstock compared to microalgae hydro-lysate. Finally, the yeast fatty acid profile, measured by gaschromatography with flame ionization detection (GC–FID),shows high percentages of C16:0, C18:0, and C18:1, which aresuitable for subsequent high-quality biodiesel production(Table 6).
With no need for pretreatment or expensive additives, lackof environmental impact, and universal availability, seagrassbiomass can be a cost-effective feedstock for microbial lipidproduction—a particularly valuable factor in advancing andachieving the sustainable production of biodiesel.
Material balance and techno-economic evaluation
Every 1 ton of seagrass could theoretically generate approxi-mately 17 000 L of hydrolysate (60 g L@1). After centrifuga-tion and separation, 16 000 L of hydrolysate can be recov-ered, which contain an average of 0.510 ton of fermentablesugars (34 g L@1). Moreover, the hydrolysate contains variousorganic materials, such as proteins, which represent nitrogenand carbon sources in addition to carbohydrates. To liquefythe seagrass, approximately 14 kg of enzyme and 83 kg ofchemicals (buffer solution) are required per ton of seagrassfeedstock. The hydrolysis step would generate 0.370 tons ofsolid residual biomass, which can be utilized in further appli-cations such as animal feed or plant fertilizers. According tocurrent results, 0.21 tons of oil can be produced.
Figure 6. Increase of biomass and substrate consumption of T. oleaginousduring fermentation time using P. oceanica hydrolysate in a 1 L stirred tankbioreactor.
Figure 7. T. oleaginous fermentations on P. oceanica hydrolysate conducted in1 L stirred tank bioreactors. Lipid yield expressed as percentage of the drycell weight.
Figure 8. T. oleaginous fermentations on P. oceanica hydrolysate conducted in1 L stirred tank bioreactors. Lipid productivity as gL@1.
Table 6. Comparison of the T. oleaginosus fatty-acid profile cultivated inmedium A and P. oceanica hydrolysate.
Media Fatty acid content [% (w/w)]C16:0
[a] C18:0 C18:1 other
medium A 31.6a 9.5 51.0 7.9P. oceanica 34.7 6.2 51.2 7.9
[a] Relative STDV for all given numbers is , :1%.
Energy Technol. 2018, 6, 1026 – 1038 T 2018 The Authors. Published by Wiley-VCH Verlag GmbH & Co. KGaA, Weinheim 1033

In 2014, a techno-economic evaluation for microbial oilproduction estimated the costs to be $5.5 kg@1.[41] The studywas based on pure glucose as feedstock with an annual pro-duction capacity of 10 000 tons of oil. To achieve targeted ca-pacity, 12 fermenters each having a volume of 250 m3, wouldbe required, and these fermenters each would run 47 timesper year. The total volume of culture media would amountto 140 850 m3, with a total glucose content of 42 081 tons. Inthe reported evaluation, the glucose-to-SCO conversion yieldwas 0.23 g g@1.[41]
Based on the current study, supplying the previous unitwith seagrass hydrolysate as alternative and sole fermenta-tion media requires two times a volume of 140 850 m3 (firstas main media and second as feeding after 10 times concen-tration). To produce the required volume, 18.78 tons of sea-grass are required (0.06 ton m@3). In addition, 12 vessels eachwith a volume of 250 m3 would be necessary to run about104 times per year. Taking into consideration that each runrequires approximately 7 h loading and 70 h operation, thetotal process time would be 7500 hours per year.
Following hydrolysis, a solid/liquid disk separator shouldbe installed in combination with a hydrolysate concentrationunit. Furthermore, sterilization of raw materials is always re-quired prior to hydrolysis. As the techno-economic evalua-tion has already included the sterilization step, it would beredundant to re-include it in the hydrolysate production pro-cess.
The installed equipment costs, fixed capital investment(FCI) calculations, operations (COL) costs, and utility costs(CUT) of the previously mentioned process steps can be esti-mated using a similar unit equivalent to the study from Kou-tinas et al.[41] Hence, the costs of the bioreactor (R-101),solid/liquid disk separator (VE-101), filtration (D-201), andcondenser (V-202) can be used to estimate the cost of the hy-drolysate manufacturing process.[41] Additionally, heatingunits (E-101 and E-102)[41] will be included. Overall afore-mentioned items and their respective costs are listed inTables 7 and 8.
Finally the estimated annual cost of hydrolysate manufac-ture (COM) can be calculated by applying the Turton equa-tion:[42]
COM ¼ 0:28FCIþ 2:73COL þ 1:23ðCRM þ CUT þ CWTÞ
Therefore, the COM of hydrolysate will be $ 34.38 million togenerate 281 690 m3 hydrolysate, which corresponds to$ 0.112 per liter.
Based on the calculation following Koutinas et al. , after re-placing the glucose with seagrass hydrolysate, the cost of mi-crobial oil from seagrass hydrolysate is estimated to be$ 7.3 kg@1. It is worth mentioning that the glucose-to-SCOconversion yield was 0.23 g g@1,[34,41] whereas the seagrass bio-mass and the contained sugar-to-SCO conversion yields were0.21 and 0.41 g g@1, respectively.
Contrary to plant-derived oil, microbial oil production isnot affected by seasonal or climate changes. Moreover, mi-crobial oil (MO) production does not affect agricultural ac-tivity and food security. However, due to the low biomassproduction costs, vegetable oil costs are lower than MOranging between 1.1 and $ 2.1 kg@1 for soybean and peanutoil, respectively.[41] Despite the availability of cheap raw ma-terials, the challenge of SCOs production remains in the hy-drolysis and biomass formation steps, which represent a sig-nificant part of the overall process costs.
Discussion
Seasonally, piles of seagrass residues accumulate on beachesand shores all over the globe. In excess of 80 % of this bio-mass is not degraded biologically. This undesirable “waste” isconstantly being removed or buried, especially in touristicdestinations. In this work, we assessed the application of thiswaste material as a feedstock for SCO and subsequent bio-fuel/biolubricant production. This assessment presents sea-grass biomass as a new starting material for biodiesel produc-tion, alternative to edible plant-based lipids.
Electron microscopy and comprehensive biomass analysiswere performed on the various seagrass samples. The ac-quired data facilitated the optimization of enzymatic hydrol-ysis and offered insights regarding the hydrolysate composi-tions, trace elements content, and C/N/P ratios. An enzymat-ic-based hydrolysis method was optimized that efficiently re-leased the carbohydrate monomers and allowed the produc-tion of seagrass hydrolysate without the need for energy-intensive thermochemical pretreatment. This single-stepmethod prevented the generation of inhibitory compounds
Table 7. Cost of raw materials of the hydrolysate production.
Material Unit costs Amount per Year [ton] Cost per Year [$]
seagrass $1 ton@1 18 779 $18 779enzyme $10 kg@1 262.9 $2629 000chemical $1.5 kg@1 524.2 $7863 000total $10 510 779
Table 8. FCI cost, operational cost, and utility cost of the hydrolysate production
Category Description Cost peryear [M$]
FCI cost sum of (R-101, VE-101, d-201 V-202 E-101 and E-102) W 1.2[41] 54.6operational cost (COL) sum of worker count x4.5=20 0.50utility cost (CUT) sum of (R-101, VE-101, d-201 V-202 E-101 and E-102)[41] 3.912material cost (CRM) from Table 7 10.5
Energy Technol. 2018, 6, 1026 – 1038 T 2018 The Authors. Published by Wiley-VCH Verlag GmbH & Co. KGaA, Weinheim 1034

that normally required complex detoxification steps prior tofermentation. This approach is both cost-effective and eco-friendly.
Low density and high moisture content in feedstock mate-rials are the main limitations for energy-efficient biomass-based processes, generating increased transport and opera-tional costs.[16] Biomass analysis of the collected samplesshowed low water content. Furthermore, structural analysis,in particular that of P. oceanica, revealed a dense (non-hollow) structure. Seagrass biomass, exhibiting high densityand minimal water content, is an advantageous raw materialfor cost-effective industrial applications. However, the bio-mass composition of seagrass might vary depending on theenvironment (location) and time of harvest. Furthermore,not all seagrass species offer the same industrial advantagesas P. oceanica.
Previous reports used pure sucrose,[7a] synthetic media,[43]
pre-treated secondary wastewater sludge,[7b] and pre-treatedmicroalgae hydrolysate fed with pure glucose[40] as cultivationmedia for oily yeasts. Conversely, T. oleaginosus was success-fully cultivated in all hydrolysates of aged-seagrass as thesole carbon source, without expensive additives such as yeastextract and biotin. T. oleaginosus cultivated in P. oceanica hy-drolysate in a bioreactor accumulated a substantial amountof lipids (&25 g L@1). The produced lipid, mainly in the formof triglycerides, is a preferred feedstock for chemo-catalyticconversion into green jet fuels,[44] thermochemical (pyrolysis)conversion into biogas and biosolids,[45] and ultrasonic cavita-tion to make clean biodiesel.[46] McCurdy et al. , showed thatlipids from T. oleaginosus can be converted into biodieselwith a recovery of 98.9 %. Furthermore, flash point, viscosity,sulfur content, and acid number of the corresponding B20meet the ASTM requirement and it is comparable to Soy-bean B20.[7a]
Based on the data presented in this study, 120 g of seagrasscould be converted fermentatively to 25.0 g of lipids. Accord-ingly, by exploiting only half of the available residual sea-grass biomass from around the globe, approximately3.915 million tons of triglyceride-type lipids could theoreti-cally be produced (with a process efficiency 85 %). Enzymat-ic transesterification of these lipids with methanol or ethanolwould yield 6.24 million tons (5.6 billion liters) of B100 bio-diesel and 0.48 million tons glycerol [based on a conversionfactor of 80 % (w/w)]. Interestingly, this potential biodieselyield from seagrass residues is comparable to the entire B100production of USA in 2015 (4.8 billion liters),[1] which addsup to 26 % of the global B100 production volume (21.6 bil-lion liters) in that same year.[47] Moreover, the USA predom-inantly (53 %) generated this B100 production volumethrough conversion of edible oils, such as corn and soybeanoil.[1] The generation of these edible oil feedstocks requiredapproximately 6.4 and 11.8 million hectares of agriculturalland, respectively, for corn and soybean cultivation.[1,48]
The use of seagrass residues for the production of equiva-lent volumes of B100 biodiesel would not affect any agricul-tural activity or have any effect on sensitive marine ecosys-tems. Therefore, seagrass biomass would represent a real sus-
tainable alternative to the application of edible plant oils par-ticularly. However, despite its many industrial advantages,the use of seagrass as feedstock for SCO production mightsuffer from logistical drawbacks, such as collection and trans-portation of feedstocks from around the globe. The use ofseagrass residue for renewable fuel production would requirea significant alteration in the production logistics of the cen-tralized processing of biofuels. As seagrasses are availableonly at scattered locations, which commonly are not close tohuman populations, its effective utilization as a biofuels feed-stock would argue for a small decentralized production net-work. It is conceivable, that small, decentralized fermenta-tion/chemical upgrading units could be installed at seagrasscollection sites, which would convert only the relevant bio-mass amounts locally available. The resulting biofuel vol-umes could either be collected and then brought to central-ized logistic hubs, or more preferably be utilized by nearbyhuman settlements or industrial facilities that require a self-sustaining energy source. This study offers fundamentalknowledge that can be used in future work to optimize oilproduction in large-scale bioreactors, investigate mechanismsof substrate-to-lipid conversion, and further assess the eco-nomics of biofuel and biodiesel production before commerci-alization of this technology.
Conclusions
Produced from readily available beach-cast waste materials,this simplified enzyme-treated seagrass media, provides a po-tential route to cost-effective sustainable bioenergy/biofuelproduction. Out of seven samples of seagrasses, P. oceanica(Mediterranean Sea) displays the best lipid productivity ex-ceeding the well-optimized minimal nitrogen media. Gener-ally, marine biomass does not affect terrestrial agriculturalactivity. Moreover, in this study we only employ aged sea-grass banquettes that are washed ashore and do not affectthe marine ecosystem. Therefore, the process presented inthis study offers a biorefinery model for sustainable genera-tion of microbial lipids with no impact on agricultural securi-ty or sensitive marine ecosystems.
Experimental Section
Samples
Fresh and aged seagrass samples were collected during thesummer seasons of 2013 and 2014 from six different locationsworldwide: two samples from the Baltic Sea (Hohenkirchen andGreifswald), two from the Mediterranean Sea (Malta), one inthe Caribbean Sea (Isla de Mujeres, Mexico), one from theGreat Australian Bight (Beachport, South Australia), and onesample from the North Atlantic Ocean (Bahamas). The sampleswere washed thoroughly to remove accumulated salt, sand andcontaminants, dried, and ground down to ,0.5 mm thicknessusing a planetary ball mill (Fritsch, Germany). For reproducibili-ty purposes, all experiments and analyses were conducted in trip-licate.
Energy Technol. 2018, 6, 1026 – 1038 T 2018 The Authors. Published by Wiley-VCH Verlag GmbH & Co. KGaA, Weinheim 1035

Sequence determination, phylogeny
Genomic DNA was isolated from seagrass samples using the in-nuPREP Plant DNA Kit (Analytik Jena, Germany). ExtractedDNA was then run on 1% agarose gel (100 mA, 120 V) for10 min. A gel area corresponding to 8000–10000 kilobase (kb)size was cut. DNA was purified from the cut gel using innuPREPDOUBELEpure Kit (Analytik Jena, Germany). Two sets of pri-mers were used for DNA amplification from all samples. Thefirst set EukA (5’- AACCTGGTTGATCCTGCCAGT-3’) andEukB (5’-TGATCCTTCTGCAGGTTCACCTAC-3’) amplify theentire 18S rRNA region (almost 950 bp).[49] Primers ITS1 (5’-TCCGTAGGTGAACCTGCGG-3’) and NL4 (5’-GGTCCGTGTTTCA AGACGG-3’)[50] bind to entire interven-ing ITS1, 5.8S, ITS2 rRNA, and the D1/D2 domain (a portion ofthe 26S rRNA gene).
Biomass analysis
HPLC analysis
Sugar composition was analyzed by an Agilent 1100 seriesHPLC with a Refractive Index (RI) detector (Shodex, RI101)and Ultraviolet Index (Sedere-France, Sedex 75). The sugarswere separated by using two different methods. In the first, aRezex ROA-Organic Acid column (Aminex HPX 87H) wasused with the eluent (5.0 mm H2SO4) at a flow rate of0.5 mLmin@1. The column heater was set at 70 8C, and the detec-tor was set at 40 8C. In the second method, sugars were separatedusing an Aminex HPX-87P column. An isocratic mobile phase ofdouble distilled H2O was pumped at a rate of 0.6 mLmin@1. Thecolumn temperature was 70 8C with the detector set at 50 8C.
GC–FID analysis
Lipids were extracted according to the Folch procedure.[51] Thefatty acids were converted into fatty acid methyl esters (FAMEs)as described in Griffiths et al.[52] Glyceryl trinonadecanoate(C19:0-TAG, 1.00 mg) was added prior to the reaction as an inter-nal standard. FAMEs was analysed using GC–FID [Zebron Ca-pillary GC column (Phenomenex, Germany)]. The column was30.0 m in length with an internal diameter of 0.32 mm and a filmthickness of 0.25 mm. The column operated at a temperature of150 8C for 1 min before increasing to 240 8C at a rate of5 8C min@1. The injector injected a sample amount of 1.0 mL at atemperature of 240 8C with a split ratio of 10 and hydrogen wasused as the carrier gas at a flow rate of 3 [email protected] injec-tion, FAME (C12:0) was added to the samples as an internal stan-dard for quantitation.
Electron microscope and EDX
Scanning electron microscopy (SEM) was performed using aJSM-7500F scanning electron microscope (JEOL, Japan) with anaccelerating voltage of 1, 2, or 5 kV and a secondary electron de-tector.The ash profile was determined using SEM with energy-disper-sive X-ray (EDX) analysis. Ash samples were mounted on acarbon film and prepped for analysis. EDX analysis was per-formed on multiple areas (100X 100 mm2) in backscattered elec-tron (BSE) mode for each ash sample. The average value wascalculated to obtain the elemental composition of the ash.
Kjeldahl analysis
The protein amount was determined using the standard operat-ing procedure by Kjeldahl et al. Dry seagrass biomass (2.00 g)was digested (InKjel M, behr Labor technik GmbH-Germany)and distilled (Vapodest 10, Gerhardt- Germany).
Seagrass treatment
Enzymatic hydrolysis of each of the seagrass samples was con-ducted using 2 L glass bottles (Schott) containing 1.0 L of acetatebuffer solution (50.0 mm, pH 5.0) and 60.0 g of biomass. Reac-tions were initiated by adding an enzyme solution and incubatingat 50 8C while stirring at 400 rpm using magnetic stirrer for 72 h.The used enzymes include Cellic CTec 2 (Novozymes- Den-mark), Cellic HTec (Novozymes- Denmark), Pectinex (Novo-zymes- Denmark), and Novozymes 188 (Novozymes- Denmark).In parallel, two controls were included: control one contained asubstrate without the enzyme solution and control two containedan enzyme solution without a substrate. The controls were con-ducted in 50 mL falcon tubes containing 25.0 mL of acetatebuffer solution (50.0 mm, pH 5.0) and 500.0 mg of biomass.
Hydrolysate preparation
The samples were then centrifuged for 30 min at 8000 g, followedby cross-filtration (10 kDa membrane made from regeneratedcellulose was used with the following parameters: inlet pressure(P1) 2 bar, repentant pressure (P2) 0.3–0.5 bar, and the permeatewas open to atmospheric pressure. The flow rates of repentantand permeate were approximately 2 Lmin@1 and 0.1 L min@1, re-spectively. 0.2 mm filter capsules were installed at the outlet tosterilize the resulted hydrolysate). A sexokinase assay kit (Mega-zyme- Ireland), was used to measure the glucose concentrationof each sample at 340 nm, repeated four times. For the standardcurve, five calibration points were measured at concentrations:0.5, 1.0, 2.0, 3.0, and 4.0 gL@1. The final sugar analysis was per-formed by using HPLC as described above. A subsample fromeach hydrolysate was analyzed to detect reduced nitrogen usingthe Kjeldahl method.
Utilization of hydrolysates as sole medium for bio-oil production
For observation of its growth rate and lipid accumulation, theyeast Trichosporon oleaginosus (ATCC 20509) was cultivated in1 L Erlenmeyer flasks containing 300 mL of the different enzy-matic hydrolysates. The flasks were supplemented with an aera-tion system supplying the cultures with 0.2 L min@1 pre-filteredair. Nitrogen-limited medium (medium A) as previously de-scribed,[53] was used as a positive control. With an initial seedingOD600 =0.5, all cultures were incubated in a rotary shaker at120 rpm at 28 8C for 5 days. OD600 was measured every day, andliquid cultures were divided for subsequent gravimetric analysis.A technical draw for aerated flasks is available in the SupportingInformation (Figure S6).
Lipid at fed-batch bioreactor
Dried grinded P. oceanica (120 g) was subjected to enzymatic hy-drolysis followed by 10 kDa cross-filtration (as previously de-scribed) generating 2 L of hydrolysate. For fed-batch cultivation,1 L served as the main fermentation medium and the remaining
Energy Technol. 2018, 6, 1026 – 1038 T 2018 The Authors. Published by Wiley-VCH Verlag GmbH & Co. KGaA, Weinheim 1036

1 L was concentrated 10 times by using a rotary evaporator andused as feed for the bioreactor. T. oleaginosus was cultured inthe seed medium YPD (10 gL@1 yeast extract, 20 gL@1 peptone,and 20 gL@1 glucose) at 28 8C and 120 rpm for 24 h. 10% of theculture was inoculated into the seagrass hydrolysate. Fed-Batchcultivation of T. oleaginosus was performed in a 2 L bioreactor(INFORS HT system, Switzerland) with a working volume of1 L in P. oceanica hydrolysate with an approximate C/N ratio of52. The temperature was maintained at 28 8C, and the pH of thebioreactor was adjusted to pH 6.5:0.2 with 1m NaOH by thesystem. Stirring (200–400 rpm) and aeration (1.0–2.0 normalliters per minute of air) were regulated automatically to maintainthe dissolved oxygen at above 50 %. Foam was prevented by theaddition of 0.01% (v/v) of an antifoam agent (Antifoam 204,Sigma Aldrich). Substrate feeding was initiated at day 1. Sampleswere withdrawn manually at 24 h intervals for 6 days, and wereused for subsequent determination of OD600, the dry cell weight,and lipid content.
Dry biomass determination/ gravimetric analysis lipids
Dry biomass was processed by lyophilization for 2 days at @80 8Cand 0.04 mbar (Christ alpha 2–4 LD plus). Gravimetric quantifi-cation of the lipid was performed using the Bligh–Dyermethod.[54] Briefly, a high-pressure homogenizer (Avestin emulsi-flex C3) was used followed by three times solvent extractionusing Folch solution.
Fatty acid profile
GC–FID, see the procedure as described above.
Acknowledgements
M.M., F.Q., and T.B. acknowledge financial support by theGerman Federal Ministry of Education and Research for sup-porting the “LIPOMAR” (grant number: 031A261) and “Ad-vanced Biomass Value” (grant number: 03SF0446A) projects.Information concerning the Advanced biomass projects canbe obtained at: http://www.ibbnetzwerk-gmbh.com/de/service/pressebereich/pm-06052013-advanced-biomass-value/. S.Y.,N.M., and T.B. also acknowledge financial support for theproject “Resource efficient production processes for polyhy-droxybutyrate based biopolymers” of the Bavarian State Min-istry for Environment and Consumer Protection (StMUV,grant number TLKO1U-69045).
Conflict of interest
The authors declare no conflict of interest.
Keywords: bioenergy · biofuels · enzymatic treatment ·fermentation · seagrass
[1] U.S.E.I. Administration, U.S. Energy Information Administration,2016.
[2] V. H. Smith, B. S. Sturm, S. A. Billings, Trends Ecol. Evol. 2010, 25,301 – 309.
[3] G. V. Subhash, S. V. Mohan, Fuel 2014, 116, 509 – 515.[4] a) L. Chng, K. Lee, D. Chan; b) A. Guldhe, B. Singh, I. Rawat, K.
Ramluckan, F. Bux, Fuel 2014, 128, 46 –52.[5] Y. A. Tsigie, L. H. Huynh, P. L. T. Nguyen, Y.-H. Ju, Fuel Process.
Technol. 2013, 115, 50 –56.[6] Y.-H. Chang, K.-S. Chang, C.-L. Hsu, L.-T. Chuang, C.-Y. Chen, F.-Y.
Huang, H.-D. Jang, Fuel 2013, 105, 711 – 717.[7] a) A. T. McCurdy, A. J. Higham, M. R. Morgan, J. C. Quinn, L. C.
Seefeldt, Fuel 2014, 137, 269 – 276; b) X. Zhang, S. Yan, R. D. Tyagi,R. Y. Surampalli, J. R. Val8ro, Fuel 2014, 134, 274 – 282.
[8] P. Gujjari, S.-O. Suh, K. Coumes, J. J. Zhou, Mycologia 2011, 103,1110 – 1118.
[9] a) P. Akhtar, J. Gray, A. Asghar, J. Food Lipids 1998, 5, 283 –297;b) P. Meesters, G. Huijberts, G. Eggink, Appl. Microbiol. Biotechnol.1996, 45, 575 – 579; c) Y. Liang, T. Tang, T. Siddaramu, R. Choudhary,A. L. Umagiliyage, Renewable Energy 2012, 40, 130 –136.
[10] I. K. Chung, J. Beardall, S. Mehta, D. Sahoo, S. Stojkovic, J. Appl.Phycol. 2011, 23, 877 – 886.
[11] S. Beer, E. Koch, Mar. Ecol. Prog. Ser. 1996, 141, 199 –204.[12] B. Subhadra, M. Edwards, Energy Policy 2010, 38, 4897 –4902.[13] J. W. Fourqurean, C. M. Duarte, H. Kennedy, N. Marb/, M. Holmer,
M. A. Mateo, E. T. Apostolaki, G. A. Kendrick, D. Krause-Jensen,K. J. McGlathery, Nat. Geosci. 2012, 5, 505 –509.
[14] J. Cebri#n, C. M. Duarte, N. Marb/, J. Exp. Mar. Biol. Ecol. 1996,204, 103 –111.
[15] S. Enr&quez, C. M. Duarte, K. Sand-Jensen, Oecologia 1993, 94, 457 –471.
[16] M. H. L. Silveira, A. R. C. Morais, A. M. D. C. Lopes, D. N. Olekszys-zen, R. Bogel-Łukasik, J. Andreaus, L. P. Ramos, ChemSusChem2015, 8, 3366 –3390.
[17] a) M. Uchida, T. Miyoshi, M. Kaneniwa, K. Ishihara, Y. Nakashima-da, N. Urano, J. Biosci. Bioeng. 2014, 118, 646 –650; b) M. Pilavtepe,M. S. Celiktas, S. Sargin, O. Yesil-Celiktas, Ind. Crops Prod. 2013, 51,348 – 354.
[18] a) M. Rakicka, Z. Lazar, T. Dulermo, P. Fickers, J. M. Nicaud, Bio-technol. Biofuels 2015, 8, 1; b) R. Wang, J. Wang, R. Xu, Z. Fang, A.Liu, BioResources 2014, 9, 7027 –7040.
[19] R. Kourist, F. Bracharz, J. Lorenzen, O. N. Kracht, M. Chovatia, C.Daum, S. Deshpande, A. Lipzen, M. Nolan, R. A. Ohm, mBio 2015,6, e00918-15.
[20] a) E. P. Green, F. T. Short, World atlas of seagrasses, University ofCalifornia Press, 2003 ; b) G. De Falco, S. Simeone, M. Baroli, J.Coastal Res. 2008, 24, 69– 75.
[21] a) D. H. Les, M. A. Cleland, M. Waycott, Syst. Bot. 1997, 22, 443 –463; b) Y. Kato, K. Aioi, Y. Omori, N. Takahata, Y. Satta, GenesGenet. Syst. 2003, 78, 329 –342.
[22] B. H. Daru, K. Yessoufou in DNA Barcoding in Marine Perspectives,Springer, Switzerland, 2016, pp. 313 – 330.
[23] D. W. Templeton, M. Quinn, S. Van Wychen, D. Hyman, L. M. Lau-rens, J. Chromatogr. A 2012, 1270, 225 – 234.
[24] J. M. Ageitos, J. A. Vallejo, P. Veiga-Crespo, T. G. Villa, Appl. Micro-biol. Biotechnol. 2011, 90, 1219 –1227.
[25] a) M. Yamamuro, A. Chirapart, J. Oceanogr. 2005, 61, 183 –186;b) J. L. Siegal-Willott, K. Harr, L.-A. C. Hayek, K. C. Scott, T. Ger-lach, P. Sirois, M. Reuter, D. W. Crewz, R. C. Hill, J. Zoo WildlifeMed. 2010, 41, 594 – 602; c) G. Brudecki, R. Farzanah, I. Cybulska,J. E. Schmidt, M. H. Thomsen, Energy Procedia 2015, 75, 760 –766.
[26] a) Y. A. Tsigie, C.-Y. Wang, N. S. Kasim, Q.-D. Diem, L.-H. Huynh,Q.-P. Ho, C.-T. Truong, Y.-H. Ju, BioMed Res. Int. 2012, 2012,378384; b) S. Morales-delaRosa, J. M. Campos-Martin, J. L. Fierro,Cellulose 2014, 21, 2397 – 2407.
[27] H. Huang, X. Guo, D. Li, M. Liu, J. Wu, H. Ren, Bioresour. Technol.2011, 102, 7486 –7493.
[28] C. K. Nitsos, K. A. Matis, K. S. Triantafyllidis, ChemSusChem 2013, 6,110 – 122.
[29] L. Yong-Hong, L. Bo, Z. Zong-Bao, B. Feng-Wu, Chin. J. Biotechnol.2006, 22, 650 –656.
[30] P. Davies, C. Morvan, O. Sire, C. Baley, J. Mater. Sci. 2007, 42, 4850 –4857.
[31] Y. Liu, G. Jiang, Z. Wu, J. Ocean Univ. China 2010, 9, 68 –70.
Energy Technol. 2018, 6, 1026 – 1038 T 2018 The Authors. Published by Wiley-VCH Verlag GmbH & Co. KGaA, Weinheim 1037

[32] J. Wang, X. Pan, Y. Han, D. Guo, Q. Guo, R. Li, Mar. Drugs 2012,10, 2729 –2740.
[33] S. Papanikolaou, G. Aggelis, Eur. J. Lipid Sci. Technol. 2011, 113,1031 – 1051.
[34] Y. Li, Z. K. Zhao, F. Bai, Enzyme Microb. Technol. 2007, 41, 312 –317.
[35] G. Zhang, W. T. French, R. E. Hernandez, J. Hall, D. Sparks, W. E.Holmes, J. Chem. Technol. Biotechnol. 2011, 86, 642 –650.
[36] S. Wu, C. Hu, G. Jin, X. Zhao, Z. K. Zhao, Bioresour.Technol. 2010,101, 6124 –6129.
[37] L. J. Jçnsson, B. Alriksson, N.-O. Nilvebrant, Biotechnol. Biofuels2013, 6, 16.
[38] Z. Gong, H. Shen, X. Yang, Q. Wang, H. Xie, Z. K. Zhao, Biotech-nol. Biofuels 2014, 7, 158.
[39] Y. Zha, B. Muilwijk, L. Coulier, P. J. Punt, J. Bioprocess. Biotech.2012, 2, 112 –122.
[40] A. Meo, X. L. Priebe, D. Weuster-Botz, J. Biotechnol. 2017, 241, 1 –10.
[41] A. A. Koutinas, A. Chatzifragkou, N. Kopsahelis, S. Papanikolaou,I. K. Kookos, Fuel 2014, 116, 566 – 577.
[42] R. Turton, R. C. Bailie, W. B. Whiting, J. A. Shaeiwitz, Analysis, syn-thesis and design of chemical processes, Pearson Education, 2008.
[43] Y. Wei, V. Siewers, J. Nielsen, Appl. Microbiol. Biotechnol. 2017, 101,3577 – 3585.
[44] C. Zhao, T. Brgck, J. A. Lercher, Green Chem. 2013, 15, 1720 –1739.[45] N. Muradov, A. Gujar, J. Baik, T. Ali, Fuel Process. Technol. 2015,
140, 236 –244.[46] S. Asif, L. F. Chuah, J. J. Klemes, M. Ahmad, M. M. Akbar, K. T.
Lee, A. Fatima, J. Cleaner Prod. 2017, 161, 1360 – 1373.[47] S. GmbH, https://www.statista.com, 2016.[48] T. J. t. F. Project, 2016.[49] B. D&ez, C. Pedrls-Alil, R. Massana, Appl. Environ. Microbiol. 2001,
67, 2932 –2941.[50] C. Kurtzman, C. Robnett, J. Clin. Microbiol. 1997, 35, 1216 –1223.[51] J. Folch, M. Lees, G. S. Stanley, J. Biol. Chem. 1957, 226, 497 –509.[52] M. Griffiths, R. Van Hille, S. Harrison, Lipids 2010, 45, 1053 –1060.[53] M. Suutari, P. Priha, S. Laakso, J. Am. Oil Chem. Soc. 1993, 70, 891 –
894.[54] E. G. Bligh, W. J. Dyer, Can. J. Biochem. Physiol. 1959, 37, 911 – 917.
Manuscript received: August 23, 2017Revised manuscript received: September 24, 2017
Accepted manuscript online: September 27, 2017Version of record online: December 11, 2017
Energy Technol. 2018, 6, 1026 – 1038 T 2018 The Authors. Published by Wiley-VCH Verlag GmbH & Co. KGaA, Weinheim 1038

Supporting Information
A Seagrass-Based Biorefinery for Generation of Single-Cell Oils for Biofuel and Oleochemical ProductionMahmoud A. Masri+, Samer Younes+, Martina Haack, Farah Qoura, Norbert Mehlmer,*and Thomas Br�ck*[a]
ente_201700604_sm_miscellaneous_information.pdf

Figure 1S: Accumulated seagrass at the south coast of Australia (the photo has taken from Beachsport, South Australia, Australia in 2013). These deposits can exceed a height of 1.5 meter extending along the shoreline and beyond the range of vision.

Figure 2S: Phylogenetic dendrogram based on nucleic acids sequences of 18s rRNA. Performed by the neighbour-joining method using software from PHYLIP, version 3.57c; the PRODIST program with Kimura-2 factor was used to compute the pairwise evolutionary distances for the above aligned sequences , the topology of the phylogenetic tree was evaluated by performing a bootstrap (algorithm version 3.6 b) with 1000 bootstrapped trials. The tree was drawn using Tree View 32 software. Bar corresponds to 1 nucleic acid substitutions per 10 nucleic acids.

Table 1: Selected seagrass samples, locations and identification based on ITS1 and 18S rRNA sequencing.
Strain Location GPS Data
Zostera marina (1) Baltic Sea
(Hohenkirchen)
53°56'36.4"N
11°19'01.5"E
Syringodium filiforme Caribbean Sea
(Mexico)
21°14'41.5"N
86°44'18.0"W
Posidonia australis South Australia 37°29'26.9"S
140°00'51.9"E
Thalassia testudinum North Sea (Bahamas) 25°04'19.5"N
77°57'55.0"W
Zostera marina (2) Baltic Sea (Greifswald) 54°05'26.1"N
13°27'31.0"E
Zostera noltii Mediterranean Sea
(Malta1)
35°52'06.2"N
14°34'26.2"E
Posidonia oceanic Mediterranean Sea
(Malta2)
35°49'15.4"N
14°33'32.1"E

Table 2S: Lipid analysis of seagrass using GC-MS with C19:0 TAG as internal standard for methylation.
Fatty Acid
% (w/dwBiomass)
Z. marina
(1) S. filiforme P. australis T. testudinum
Z. marina
(2) Z. noltii P. oceanica
C12:0 0.00±0.000 0.00±0.000 0.00±0.000 0.023±0.004 0.012±0.001 0.029±0.004 0.021±0.001
C14:0 0.033±0.002 0.050±0.004 0.083±0.014 0.125±0.016 0.090±0.019 0.131±0.007 0.061±0.038
C14:1 0.06±0.001 0.070±0.001 0.040±0.0007 0.045±0.008 0.046±0.002 0.054±0.005 0.045±0.027
C16:0 0.634±0.026 0.602±0.018 0.580±0.063 0.789±0.125 0.818±0.059 1.616±0.099 0.471±0.308
C16:1 0.282±0.022 0.057±0.003 0.115±0.012 0.058±0.007 0.102±0.003 0.084±0.008 0.051±0.021
C16: 3
(Ω4) 0.033±0.004 0.023±0.001 0.021±0.002 0.020±0.001 0.031±0.001 0.040±0.002 0.010±0.002
C18:0 0.243±0.032 0.330±0.023 0.326±0.031 0.357±0.066 0.344±0.037 0.321±0.044 0.152±0.125
C18:1
(Ω9) 0.106±0.011 0.109±0.010 0.195±0.023 0.343±0.047 0.389±0.056 0.375±0.017 0.206±0.196
C18:1
(Ω7) 0.065±0.007 0.054±0.006 0.111±0.013 0.054±0.008 0.128±0.004 0.059±0.004 0.076±0.032
C18:2
(Ω6) 0.204±0.012 0.057±0.004 0.073±0.010 0.057±0.009 0.203±0.025 1.506±0.072 0.085±0.037
C18:3
(Ω3) 0.417±0.004 0.040±0.002 0.032±0.004 0.019±0.002 0.152±0.007 2.689±0.030 0.076±0.027
C18:4
(Ω3) 0.055±0.009 0.073±0.010 0.089±0.006 0.020±0.001 0.020±0.000 0.060±0.007 0.040±0.008
C20:0 0.060±0.002 0.070±0.002 0.030±0.001 0.023±0.004 0.086±0.002 0.035±0.003 0.035±0.016
C20:1
(Ω9) 0.020±0.003 0.030±0.002 0.040±0.001 0.024±0.010 0.030±0.002 0.030±0.008 0.042±0.011
C20:2
(Ω6) 0.010±0.005 0.01±0.005 0.010±0.006 0.022±0.016 0.009±0.000 0.019±0.001 0.023±0.027
C20:4
(Ω6) 0.010±0.002 0.02±0.003 0.010±0.004 0.006±0.001 0.006±0.000 0.008±0.000 0.029±0.024
C20:3
(Ω3) 0.010±0.002 0.01±0.001 0.020±0.002 0.012±0.004 0.017±0.002 0.016±0.001 0.025±0.029
C20:5
(Ω3) 0.017±0.01 0.013±0.002 0.024±0.01 0.073±0.006 0.055±0.007 0.107±0.008 0.064±0.016
C22:0 0.110±0.000 0.03±0.001 0.100±0.005 0.029±0.002 0.142±0.004 0.086±0.005 0.034±0.025
C22:1
(Ω9) 0.05±0.001 0.01±0.0008 0.030±0.004 0.010±0.001 0.006±0.002 0.038±0.003 0.025±0.034
C24:0 0.110±0.005 0.12±0.008 0.120±0.004 0.07±0.004 0.152±0.004 0.125±0.008 0.435±0.606
C22:6
(Ω6) 0.022±0.001 0.038±0.002 0.046±0.007 0.012±0.001 0.075±0.003 0.193±0.023 0.052±0.027


Figure 3S: Glucose concentration in the Zostera marina hydrolysate obtained with different combination of Cellic CTec2® : Cellic HTec® at total concentration of 1.0 [% w Enzyme /W Biomass] . The enzymatic hydrolysis was conducted in acetate buffer ( pH 5.0, 50mM), at 50°C, 250 rpm for 3 days.
25
38 36
32 3230 28
0
5
10
15
20
25
30
35
40
45
[0.0 : 5.0] [1.0 : 4.0] [2.0 : 3.0] [2.5 : 2.5] [3.0 : 2.0] [4.0 : 1.0] [5.0 : 0.0]
[% w
Glu
cose
/dw
Bio
mas
s]
Total 1.0 [% w Enzyme /W Biomass]
[Cellic CTec2® : Cellic HTec® w:w]

Figure 4S: Glucose concentration in the Zostera marina hydrolysate obtained with different concentration of β- glucosidase with Cellic CTec2® : Cellic HTec® 1:4 at total concentration of 1.0 [% w Enzyme /W Biomass] . The enzymatic hydrolysis was conducted in acetate buffer ( pH 5.0, 50mM), at 50°C, 250 rpm for 3 days.
38
47 46 44 45
0
10
20
30
40
50
60
0 0,3 0,5 0,6 1
[% w
Glu
cose
/dw
Bio
mas
s]
β- glucosidase [% w Enzyme /dw Biomass]
CTec: HTec 1:4 1.0 [% w Enzyme /dw Biomass]

Table 3S: The sugar analysis of the final hydrolysates.
Seagrass
g.L-1
Z. marina(1) S. filiforme P. australis T.
testudinum Z. marina(2) Z. noltii P. oceanica
Glucose 29.1±1.59 25.1±3.1 21.3± 0.89 28.5±2.64 28.3±0.83 32.2±1.91 28.5±0.59
Galacturonic Acid
2.9±0.66 0.81±0.067 0.27±0.01 0.87±0.05 0.6±0.02 2.88±0.1 0.63±0.02
Xyl, Man, Gal, Fruc
4.21±1.02 4.07±0.51 4.02±0.00 5.25±0.3 5.42±0.08 8.09±0.39 5.53±0.26
Rhamnose 0.53±0.09 n.d. n.d. n.d. n.d. n.d. n.d.
Arabinose n.d[a]. 0.1±0.01 n.d. n.d. n.d. n.d. 0.15±0.01
Fucose 0.28±0.04 0.16±0.01 0.18±0.01 0.2±0.01 0.18±0.01 0.37±0.02 0.2±0.01
[a] n.d.: Not detectable.

Figure 5S: Dry biomass after 5 days fermentation of T. oleaginosus using seagrass hydrolysates comparing
to minimal nitrogen media.
0
2
4
6
8
10
12
14
16
18
S. filiforme P. australis T. testudinum Z. marina P. oceanica Minial -N media
[BIo
mas
s] g
/l
Seagrass
Dry Biomass after 5 days

Figure 6S: The flasks were supplemented with an aeration system supplying the cultures with 0.2 L/min pre-filtered air.
Air flo
w
Off Gas Sampling valve

The Used 18s-rRNA Sequences for the phylogenetic relatedness:
> Zostera marina
GATAACTTGACGGATCGCATGGCCTTTGTGCCGGCGACGCATCATTCAAATTTCTGCCCTATCAACTTTCGATGGTAGGATAGGGGCCTACCATGGTGGTGACGGGTGACGGAGAATTAGGGTTCGATTCCGGAGAGGGAGCCTGAGAAACGGCTACCACATCCAAGGAAGGCAGCAGGCGCGCAAATTACCCAATCCTGACACGGGGAGGTAGTGACAATAAATAACAATACCGGGCTCTTTGAGTCTGGTAATTGGAATGAGTACAATCTAAATCCCTTAACGAGGATCCATTGGAGGGCAAGTCTGGTGCCAGCAGCCGCGGTAATTCCAGCTCCAATAGCGTATATTTAAGTTGTTGCAGTTAAAAAGCTCGTAGTTGGACTTTGGGTTGGGTCGGCCGGTCCGCCTTTTGGTGTGCACCGACTGTCTTGTCCCTTCTGCTGGTGATGCGTTCCTGTCCTTAGTTGGTCGGGTCGTGCCTCCGGCGCTGTTACTTTGAAGAAATTAGAGTGCTCAAAGCAAGCCTACGCTCTGTATACATTAGCATGGGATAACATCACAGGATTTCGATCCTATTTTGTTGGCCTTCGGGATCGGAGTAATGATTAAGAGGGACAGTCGGGGGCATTCGTATTTCATAGTCAGAGGTGAAATTCTTGGATTTATGAAAGACGAACAACTGCGAAAGCATTTGCCAAGGATGTTTTCATTAATCAAGAACGAAAGTTGGGGGCTCGAAGACGATCAGATACCGTCCTAGTCTCAACCATAAACGATGCCGACCAGGGATTGGCGGATGTTGCTTTTAGGACTCTGCCAGCACCTTATGAGAAATCAAAGTTTTTGGGTTCCGGGGGGAGTATGGTCGCAAGGCTGAAACTTAAAGGAATTGACGGAAGGGCACCACCAGGAGTGGAGCCTGCGGCTTAATTTGACTCAACACGGGGAAACTTACCAGGTCCAGACATAGTAAGGATTGACAGATTGAGAGCTCTTTCTTGATTCTATGGGTGGTGGTGCATGGCCGTTCTTAGTTGGTGGAGCGATTTGTCTGGTTAATTCCGTTAACGAACGAGACCTCAGCCTGCTAACTAGCTATGCGGAGGATACCCTTCGTGGCCAGCTTCTTAGAGGGACTATGGCCGCCTAGGCCACGGAAGTTTGAGGCAATAACAGGTCTGTGATGCCCTTAGATGTTCTGGGCCGCACGCGCGCTACACTGATGTATTCAACGAGTTTATAACCTTAGTTGATAGGCTTGGGTAATCTTTGAAAATTTCATCGTGATGGGGATAGATCATTGCAATTGTTGGTCTTCAACGAGGAATTCCTAGTAAGCGTGAGTCATCAGCTCGCGTTGACTACGTCCCTGCCCTTTGTACACACCGCCCGTCGCTCCTA
> Syringodium filiforme
TCATATGCTTGTCTCAAAGATTAAGCCATGCATGTGCAAGTATGAACAGAATCATATTGTGAAACTGCGAATGGCTCATTAAATCAGTTATAGTTTGTTTGATGGTATCACCTTACTCGGATAACCGTAGTAATTCTAGAGCTAATACGTGCACCCAAGTCCCAACTTCCGGAAGGGACGCATTTGTTAGATAAAAGGTCGATGCGGGCTTTGCCCGTTTCTCGGATGAATCATGATAACTTGACGGATCGCATGGCCGTTGTGCTGGCGACGCATCATTCAAATTTCTGCCCTATCAACTTTCGATGGTAGGATAGGGGCCTACCATGGTGTTGACGGGTGACGGAGAATTAGGGTTCGATTCCGGAGAGGGAGCCTGAGAAACGGCTACCACATCCAAGGAAGGCAGCAGGCGCGCAAATTACCCAATCCTGACACGGGGAGGTAGTGACAATAAATAACAATACCGGGCTCTTAGAGTCTGGTAATTGGAATGAGTACAATCTAAATCCCTTAACGAGGATCCATTGGAGGGCAAGTCTGGTGCCAGCAGCCGCGGTAATTCCAGCTCCAATAGCGTATATTTAAGTTGTTGCAGTTAAAAAGCTCGTAGTTGGACCTTGGGTTGGGCCGGCCGGTCTGCCTTGGGTGTGTATCGGCCGTCTCGTCCCTTCTGCCGGAGACGCGCTCCTGTCCTTCATTGGTCGGGTCGTGCTTCTGGCGCTGTTACTTTGAAGAAATTAGAGTGCTTAAAGCAAGCCTATGCTCTGTATACATCAGCATGGGATAACATCATAGGATTTCGGTCCTATTGTGTTGGCCTTCGGGATCGGAGTAATGATTAAGAGGGACAGTCGGGGGCATTCGTATTTCATAGTCAGAGGTGAAATTCTTGGATTTATGAAAGACGAACAACTGCGAAAGCATTTGCCAAGGATGTTTTCATTAATCAAGAACGAAAGTTGGGGGCTCGAAGACGATCAGATACCGTCCTAGTCTCAACCATAAACGATGCCGACCAGGGATTGGCGGATGTTGCTTTTAGGACTCTGCCAGCACCTTATGAGAAATCAAAGTTTTTGGGTTCCGGGGGGAGTATGGTCGCAAGGCTGAAACTTAAAGGAATTGACGGAAGGGCACCACCAGGAGTGGAGCCTGCGGCTTAATTTGACTCAACACGGGGAAACTTACCAGGTCCAGACATAGTAAGGATTGACAGATTGAGAGCTCTTTCTTGATACTATGGGTGGTGGTGCATGGCCGTTACTTAGTTGGTGGAGCGATTTGTCTGGTTAATTCCGTTAACGAACGAGACCTCAGCCTGCTAACTAGCTATGCGGAGGTGACCCTTCGTGGCCAGCTTCTTAGAGGGACTATGGCCGCTTAGGCCACGGAAGTTTGAGGCAATAACAGGTCTGTGATGCCCWWWRAYGTTNNYGGGCCGCACGCGCGCTACACTGATGTATTCAACGAGTTTATAACCTTGACCGACAGGTTTGGGTAATCTTCGAAAATTTCATCGTGATGGGGATAGATCATTGCAATTGTTGGTCTTCAACGAGGAATTCCTAGTAAGCGCGAGTCATCAGCTCGCGTTGACTACGTCCCTGCCCTTTGTACACACCGCCCGTCGCTCCTACCGATTGAATGGTCCGGTGAAGTGCTCGGATCGTGGCGACGTTGGTGGTCTGCCGCTGACGACGCTGCGAGAAGTCCATTGAACCTTATCATTTAGAGGAAGGAGAAT

> Posidonia australis
GTAGTCATATGCTTGTCTCAAAGATTAAGCCATGCATGTGCAAGTATGAACTAATTCAGACTGTGAAA
CTGCGAATGGCTCATTAAATCAGTTATAGTTTGTTTGATGGTATCTTGCTACTCGGATAACCGTAGTA
ATTCTAGAGCTAATACGTGCACCAAAACCCCGACTTCANGGAAGGGATGCATTTGTTAGATAAAAGG
CCGACGCGGGCTTTGCCCGTTGCTCTGATGATACATGATAACTTGACGGATCGCATGGCCATTGTGC
CGGCGACGCATCATTCAAATTTCTGCCCTATCAACTTTCGATGGTAGGATCGGGGCCTACCATGGTG
GTGACGGGTGACGGAGAATTAGGGTTCGATTCCGGAGAGGGAGCCTGAGAAACGGCTACCACATC
CAAGGAAGGCAGCAGGCGCGCAAATTACCCAATCCTGACACGGGGAGGTAGTGACAATAAATAACA
ATACCGGGCTCATTGAGTCTGGTAATTGGAATGAGTACAATCTAAATCCCTTAACGAGGATCCATTGG
AGGGCAAGTCTGGTGCCAGCAGCCGCGGTAATTCCAGCTCCAATAGCGTATATTTAAGTTGTTGCAG
TTAAAAAGCTCGTAGTTGGACCTTGGGTTGGGTCGGTCGGTCTGCCTATNGGTGTGCACCGGCCGT
CTCGTCCCTTNNNNNNNNNCTGCTGGTGACGCGCTCCTGTCCTTAACTGGTCGGGTCGTGCCTCCG
GCGCTGTTACTTTGAAGAAATTAGAGTGCTCAAAGCAAGCCTATGCTCNATATACATTAGCATGGGAT
AACGCCATAGGATTTCGGTCCTATTGTGTTGGCCTTCGGGATCGGAGTAATGATTAAGAGGGACAGT
CGGGGGCATTCGTATTTCATAGTCAGAGGTGAAATTCTTGGATTTATGAAAGACGAACGACTGCGAA
AGCATTTGCCAAGGATGTTTTCATTAATCAAGAACGAAAGTTGGGGGCTCGAAGACGATCAGATACC
GTCCTAGTCTCAACCATAAACGATGCCGACCAGGGATTGGCGGATGTTGCTTTAAGGACTCCGCCA
GCACCTTATGAGAAATCAAAGTCTTTGGGTTCCGGGGGGAGTATGGTCGCAAGGCTGAAACTTAAAG
GAATTGACGGAAGGGCACCACCAGGAGTGGAGCCTGCGGCTTAATTTGACTCAACACGGGGAAACT
TACCAGGTCCAGACATAGTAAGGATTGACAGATTGAGAGCTCTTTCTTGATTCTATGGGTGGTGGTG
CATGGCCGTTCTTAGTTGGTGGAGCGATTTGTCTGGTTAATTCCGTTAACGAACGAGACCTCASCCT
GCTAACTAGCTATGCGGAGGTGACCCTTCGTGSCCAGCTTCTTAGAGGGACTATGGCCGCTTAGGC
CACGGAAGTTTGAGGCAATAACAGGTCTGTGATGCCCTTAGATGTTCTGGGCCGCACGCGCGCTAC
ACTGATGTATTCAACGAGTTTATAACCTTGGCCGATAGGCTTGGGTAATCTTGGAAAATTTCATCGTG
ATGGGGATAGATCATTGCAATTGTTGGTCTTCAACGAGGAATTCCTAGTAAGCGTGAGTCATCAGCT
CGCGTTGACTACGTCCCTGCCCTTTGTACACACCGCCCGTCGCTCCTACCGATTGAATGGTCCGGT
GAAGTGCTCGGATCGTGACGACGTGAGTGGTCTGCCGCTGGCGACGTTGCGAGAAGTCCATTGAAC
CTTATCATTTAGAGGAAGGAGAAGTCGTAACAAGGTTTCCGTAGGTGAACCTGCGGAAGGATCAA
> Thalassia testudinum
TGTTTCCCAGAATAAACCATGCATGTGCAAGTATGAACTAATTCGGACTGTGAAACTGCGAATGGCTC
ATTAAATCAGTTATAGTTTGTTTGATGGTACTTACTACTCGGATAACCGTAGTAATTCTAGAGCTAATA
CGTGCTCCAAGCCCCGACTTCTGGAAGGGCTGCATTTATTAGGTAAAAGGCCAATGTGGGCTTTGCC
CGCTTYTCGGATGACACATGGTAACTCGGCGGATCGCACGGCCCTCGTGCTGGCGACGCATCATTC
AAATTTCTGCCCTATCAACTTTCGATGGTAGGATAGGGGCTTACCATGGTGGTGACGGGTGACGGAG
AATTAGGGTTCGATTCCGGAGAGGGAGCCTGAGAAACGGCTACCACATCCAAGGAAGGCAGCAGGC
GCGCAAATTACCCAATCCTGACACGGGGAGGTAGTGACAATAAATAACAATACCGGGCTCTACGAGT
CTGGTAATTGGAATGAGTACAATCTAAATCCCTTAACGAGGATCCATTGGAGGGCAAGTCTGGTGCC
AGCAGCCGCGGTAATTCCAGCTCCAATAGCGTATATTTAAGTTGTTGCAGTTAAAAAGCTCGTAGTTG
GACTTTGGGTTGGGCCGGCCGGTCCGCCTTTGGTGTGCACCGGTCGTCTCGTCCCTTTCGCCGGG
GGCGCGCTCCTGGTCTTAATTGGCCGGGTCGTGCCTTCGGCGCTGTTACTTTGAAGAAATTAGAGT
GCTCAAAGCAAGCCCAAGCTCTGCATACATTAGCATGGGATAACATCACAGGATTTCGGTCCTATTG
TGTTGGCCTTCGGGATCGGAGTAATGATTAAGAGGGACAGTCGTGGGCATTCGTATTTCATAGTCAG
AGGTGAAATTCTTGGATTTATGAAAGACGAACAACTGCGAAAGCATTTGCCAAGGATGTTTTCATTAA
TCAAGAACGAAAGTTGGGGGCTCGAAGACGATCAGATACCGTCCTAGTCTCAACCATAAACGATGCC
GACCAGGGATCGGCGGATGTTGCTTGTACGACATCGCCGGCACCTTATGAGAAATCAGAGTTTTTG
GGTTCCGGGGGGAGTATGGTCGCAAGGCTGAAACTTAAAGGAATTGACGGAAGGGCACCACCAGG

AGTGGAGCCTGCGGCTTAATTTGACTCAACACGGGGAAACTTACCAGGTCCAGACATAGTAAGGATT
GACAGACTGAGAGCTCTTTCTTGATTCTATGGGTGGTGGTGCATGGCCGTCCTTAGTTGGTGGAGC
GATTTGTCTGGTTAATTCCGATAACGAACGAGACCTCAGCCTGCTAACTAGCTATGCGGAGGCGACC
CTCCGTGGCCAGCTTCTTAGAGGGACTATGGCCGTTCAGGCCACGGAAGTTTGAGGCAATAACAGG
TCTGTGATGCCCTTAGATGTTCTGGGCCGCACGCGCGCTACACTGATGTATTCAACGAGTTTATAAC
CTTGGCTGACAGGCCCGGGTAATCTTGCAAATTTCATCGTGATGGGGATAGATCATTGCAACTGTTG
GTCTTCAACGAGGAATTCCTAGTAAGCGCGAGTCATCAGTTCGCGTTGACTACGTCCCTGCCCTTTG
TACACACCGCCCGTCGCTCCTACCGATTGAATGGTCCGGTGAAGTGCCCGGATCGCGGCGACGCC
GGCGGTCTGCCGCTGGTGACGTCGCGAGAAGTCCACTGAACCTTATCATTTAGAGGAAGGAG
> Zostera marina
GATAACTTGACGGATCGCATGGCCTTTGTGCCGGCGACGCATCATTCAAATTTCTGCCCTATCAACT
TTCGATGGTAGGATAGGGGCCTACCATGGTGGTGACGGGTGACGGAGAATTAGGGTTCGATTCCGG
AGAGGGAGCCTGAGAAACGGCTACCACATCCAAGGAAGGCAGCAGGCGCGCAAATTACCCAATCCT
GACACGGGGAGGTAGTGACAATAAATAACAATACCGGGCTCTTTGAGTCTGGTAATTGGAATGAGTA
CAATCTAAATCCCTTAACGAGGATCCATTGGAGGGCAAGTCTGGTGCCAGCAGCCGCGGTAATTCCA
GCTCCAATAGCGTATATTTAAGTTGTTGCAGTTAAAAAGCTCGTAGTTGGACTTTGGGTTGGGTCGG
CCGGTCCGCCTTTTGGTGTGCACCGACTGTCTTGTCCCTTCTGCTGGTGATGCGTTCCTGTCCTTAG
TTGGTCGGGTCGTGCCTCCGGCGCTGTTACTTTGAAGAAATTAGAGTGCTCAAAGCAAGCCTACGCT
CTGTATACATTAGCATGGGATAACATCACAGGATTTCGATCCTATTTTGTTGGCCTTCGGGATCGGAG
TAATGATTAAGAGGGACAGTCGGGGGCATTCGTATTTCATAGTCAGAGGTGAAATTCTTGGATTTATG
AAAGACGAACAACTGCGAAAGCATTTGCCAAGGATGTTTTCATTAATCAAGAACGAAAGTTGGGGGC
TCGAAGACGATCAGATACCGTCCTAGTCTCAACCATAAACGATGCCGACCAGGGATTGGCGGATGTT
GCTTTTAGGACTCTGCCAGCACCTTATGAGAAATCAAAGTTTTTGGGTTCCGGGGGGAGTATGGTCG
CAAGGCTGAAACTTAAAGGAATTGACGGAAGGGCACCACCAGGAGTGGAGCCTGCGGCTTAATTTG
ACTCAACACGGGGAAACTTACCAGGTCCAGACATAGTAAGGATTGACAGATTGAGAGCTCTTTCTTG
ATTCTATGGGTGGTGGTGCATGGCCGTTCTTAGTTGGTGGAGCGATTTGTCTGGTTAATTCCGTTAA
CGAACGAGACCTCAGCCTGCTAACTAGCTATGCGGAGGATACCCTTCGTGGCCAGCTTCTTAGAGG
GACTATGGCCGCCTAGGCCACGGAAGTTTGAGGCAATAACAGGTCTGTGATGCCCTTAGATGTTCTG
GGCCGCACGCGCGCTACACTGATGTATTCAACGAGTTTATAACCTTAGTTGATAGGCTTGGGTAATC
TTTGAAAATTTCATCGTGATGGGGATAGATCATTGCAATTGTTGGTCTTCAACGAGGAATTCCTAGTA
AGCGTGAGTCATCAGCTCGCGTTGACTACGTCCCTGCCCTTTGTACACACCGCCCGTCGCTCCTA
> Zostera noltii
AGTCATATGCTTGTCTCAAAGATTAAGCCATGCATGTGCAAGTATGAACTAATTCAGACTGTGAAACT
GCGAATGGCTCATTAAATCAGTTATAGTTTGTTTGATGGTACCTTGCTACTCGGATAACCGTAGTAAT
TCTAGAGCTAATACGTGCACCAAACCCCAACTTCTGGAAGGGATGCATTTGTTAGATAAAAGGTTGA
CACGGCTTTGTTCGTTGCTCTGATGATTCATGATAACTTGACGGATCGCACGGCCTTTGTGCCGGCG
ACGCATCATTCAAATTTCTGCCCTATCAACTTTCGATGGTAGGATAGGGGCCTACCATGGTGGTGAC
GGGTGACGGAGAATTAGGGTTCGATTCCGGAGAGGGAGCCTGAGAAACGGCTACCACATCCAAGG
AAGGCAGCAGGCGCGCAAATTACCCAATCCTGACACGGGGAGGTAGTGACAATAAATAACAATACC
GGGCTCTTTGAGTCTGGTAATTGGAATGAGTACAATCTAAATCCCTTAACGAGGATCCATTGGAGGG
CAAGTCTGGTGCCAGCAGCCGCGGTAATTCCAGCTCCAATAGCGTATATTTAAGTTGTTGCAGTTAA
AAAGCTCGTAGTTGGACCTTGGGTTGGGTCGGCCGGTCCGCCTTTTGGTGTGCACCGACTGTCTTG
TCCCTTCTGCTGGTGATGCGTTCCTGTCCTTAGTTGGTCGGGTCGTGCCTCCGGCGCTGTTACTTTG
AAGAAATTAGAGTGCTCAAAGCAAGCCTATGCTCTGTATACATTAGCATGGGATAACATCACAGGATT
TCGATCCTATTTTGTTGGCCTTCGGGATCGGAGTAATGATTAAGAGGGACAGTCGGGGGCATTCGTA
TTTCATAGTCAGAGGTGAAATTCTTGGATTTATGAAAGACGAACAACTGCGAAAGCATTTGCCAAGGA

TGTTTTCATTAATCAAGAACGAAAGTTGGGGGCTCGAAGACGATCAGATACCGTCCTAGTCTCAACC
ATAAACGATGCCGACCAGGGATTGGCGGATGTTGCTTTTAGGACTCTGCCAGCACCTTATGAGAAAT
CAAAGTTTTTGGGTTCCGGGGGGAGTATGGTCGCAAGGCTGAAACTTAAAGGAATTGACGGAAGGG
CACCACCAGGAGTGGAGCCTGCGGCTTAATTTGACTCAACACGGGGAAACTTACCAGGTCCAGACA
TAGTAAGGATTGACAGATTGAGAGCTCTTTCTTGATTCTATGGGTGGTGGTGCATGGCCGTTCTTAGT
TGGTGGAGCGATTTGTCTGGTTAATTCCGTTAACGAACGAGACCTCAGCCTGCTAACTAGCTATGCG
GAGGATACCCTTCGTGGCCAGCTTCTTAGAGGGACTATGGCCGCCTAGGCCACGGAAGTTTGAGGC
AATAACAGGTCTGTGATGCCCTTAGATGTTCTGGGCCGCACGCGCGCTACACTGATGTATTCAACGA
GTTTATAACCTTAGCTGATAGGCTTGGGTAATCTTTGAAAATTTCATCGTGATGGGGATAGATCATTG
CAATTGTTGGTCTTCAACGAGGAATTCCTAGTAAGCGTGAGTCATCAGCTCGCGTTGACTACGTCCC
TGCCCTTTGTACACACCGCCCGTCGCTCCTACCGATTGAATGGTCCGGTGAAGTGCTCGGATTGTG
GCGACGTTTGTGGGTCTGCCGCTGGCGACGTCGTGAGAAGTCCACTGAACCTTATCATTGAGAGGA
AGGAG
> Posidonia oceanica
GTTTGTCTTTAAGATTAGCCATGCATGTGCAAGTATGAACTAAATCATATTGTGAAACTGCGAATGGC
TCATTAAATCAGTTATAGTTTGTTTGATGGTATCATTTTACTCGGATAACCGTAGTAATTCTAGAGCTA
ATACGTGCACCGAAGTCCCAACTTCCGGAAGGGACGCATTTGTTAGATAAAAGGTCGATGCGGGCC
TAGCCCGTTGCTCTGATGATTCATGATAACTTGACGGATCGCATGGCCATCGTGCTGGCGACGCATC
ATTCAAATTTCTGCCCTATCAACTTTCGATGGTAGGATAGGGGCCTACCATGGTGTTGACGGGTGAC
GGAGAATTAGGGTTCGATTCCGGAGAGGGAGCCTGAGAAACGGCTACCACATCCAAGGAAGGCAG
CAGGCGCGCAAATTACCCAATCCTGACACGGGGAGGTAGTGACAATAAATAACAATACCGGGCTCTT
GGAGTCTGGTAATTGGAATGAGTACAATCTAAATCCCTTAACGAGGATCCATTGGAGGGCAAGTCTG
GTGCCAGCAGCCGCGGTAATTCCAGCTCCAATAGCGTATATTTAAGTTGTTGCAGTTAAAAAGCTCG
TAGTTGGACCTTGGGTTGGGTCGGCCGGTCCGCCTATGGTGTGCATCGGCCGTCTCGTCCCTTCTG
CTGGAGACGCGTTCCTGTCCTTGATTGGTCGGGTCGTGCTTCTGGCGCTGTTACTTTGAAGAAATTA
GAGTGCTTAAAGCAAGCCTATGCTCTGGATACATCAGCATGGGATAACATCATAGGATTTCGGTCCT
ATTGTGTTGGCCTTCGGGATCGGAGTAATGATTAAGAGGGACAGTCGGGGGCATTCGTATTTCATAG
TCAGAGGTGAAATTCTTGGATTTATGAAAGACGAACAACTGCGAAAGCATTTGCCAAGGGATGTTTTC
ATTAATCAGAACGAAAGTTGGGGGCTCGAAGACGATCAGATACCGTCCTAGTCTCAACCATAAACGA
TGCCGGACAGGATTGCGGGATGTGCTTTTAGGACTCTGCAAGCAACTTATGAGAATCAAGGTTTTTG
GAATCGGGGGGAAGTATGGTTCGCAGCTGGAACTAATGATTGACGACGGACTACAGATGAGCCTGG
CGTCCGTAGCTTAATTTGACTCAACACGGGGAAACTTACCAGGTCCAGACATAGTAAGGATTGACAG
ATTGAGAGCTCTTTCTTGATTCTATGGGTGGTGGTGCATGGCCGTTCTTAGTTGGTGGAGCGATTTG
TCTGGTTAATTCCGTTAACGAACGAGACCTCAGCCTGCTAACTAGCTATGCGGAGGTGACCCTTCGT
GGCCAGCTTCTTAGAGGGACTATGGCCGCTTAGGCCACGGAAGTTTGAGGCAATAACAGGTCTGTG
ATGCCCTTAGATGTTCTGGGCCGCACGCGCGCTACACTGATGTATTCAACGAGTTTATAACCTTGAC
CGATAGGTTTGGGTAATCTTCGAAAATTTCATCGTGATGGGGATAGATCATTGCAATTGTTGGTCTTC
AACGAGGAATTCCTAGTAAGCGCGAGTCATCAGCTCGCGTTGACTACGTCCCTGCCCTTTGTACACA
CCGCCCGTCGCTCCTACCGATTGAATGGTCCGGTGAAGTGCTCGGATCGTGGCGACGTGGGTGGT
CTGCCGCTGACGACGCTGCGAGAAGTCCATTGAACCTTATCATTTAGAGAAGGAAGAAGTCATAACC
ATTGCCC

>Halodule uninervis
GTAACTAATTCAGACTGTGAAACTGCGAATGGCTCATTAAATCAGTTATAGTTTGTTTGATGGTACCTT
GCTACTCGGATAACCGTAGTAATTCTAGAGCTAATACGTGCACCAAACCCCAACTTCTGGAAGGGAT
GCATTTGTTAGATAAAAGGTTGACACGGCTTTGTTCGTTGCTCTGATGATTCATGATAACTTGACGGA
TCGCATGGCCTTTGTGCCGGCGACGCATCATTCAAATTTCTGCCCTATCAACTTTCGATGGTAGGAT
AGGGGCCTACCATGGTGGTGACGGGTGACGGAGAATTAGGGTTCGATTCCGGAGAGGGAGCCTGA
GAAACGGCTACCACATCCAAGGAAGGCAGCAGGCGCGCAAATTACCCAATCCTGACACGGGGAGGT
AGTGACAATAAATAACAATACCGGGCTCTTTGAGTCTGGTAATTGGAATGAGTACAATCTAAATCCCT
TAACGAGGATCCATTGGAGGGCAAGTCTGGTGCCAGCAGCCGCGGTAATTCCAGCTCCAATAGCGT
ATATTTAAGTTGTTGCAGTTAAAAAGCTCGTAGTTGGACCTTGGGTTGGGTCGGCCGGTCCGCCTTT
TGGTGTGCACCGACTGTCTTGTCCCTTCTGCTGGTGATGCGTTCCTGTCCTTAGTTGGTCGGGTCGT
GCTTCCGGCGCTGTTACTTTGAAGAAATTAGAGTGCTCAAAGCAAGCCTATGCTCTGTATACATTAGC
ATGGGATAACATCACAGGATTTCGATCCTATTTTGTTGGCCTTCGGGATCGGAGTAATGATTAAGAG
GGACAGTCGGGGGCATTCGTATTTCATAGTCAGAGGTGAAATTCTTGGATTTATGAAAGACGAACAA
CTGCGAAAGCATTTGCCAAGGATGTTTTCATTAATCAAGAACGAAAGTTGGGGGCTCGAAGACGATC
AGATACCGTCCTAGTCTCAACCATAAACGATGCCGACCAGGGATTGGCGGATGTTGCTTTTAGGACT
CTGCCAGCACCTTATGAGAAATCAAAGTTTTTGGGTTCCGGGGGGAGTATGGTCGCAAGGCTGAAA
CTTAAAGGAATTGACGGAAGGGCACCACCAGGAGTGGAGCCTGCGGCTTAATTTGACTCAACACGG
GGAAACTTACCAGGTCCAGACATAGTAAGGATTGACAGATTGAGAGCTCTTTCTTGATTCTATGGGT
GGTGGTGCATGGCCGTTCTTAGTTGGTGGAGCGATTTGTCTGGTTAATTCCGTTAACGAACGAGACC
TCAGCCTGCTAACTAGCTATGCGGAGGATACCCTTCGTGGCCAGCTTCTTAGAGGGACTATGGCCG
CCTAGGCCACGGAAGTTTGAGGCAATAACAGGTCTGTGATGCCCTTAGATGTTCTGGGCCGCACGC
GCGCTACACTGATGTATTCAACGAGTTTATAACCTTAGCTGATAGGCTTGGGTAATCTTTGAAAATTT
CATCGTGATGGGGATAGATCATTGCAATTGTTGGTCTTCAACGAGGAATTCCTAGTAAGCGTGAGTC
ATCAGCTCGCGTTGACTACGTCCCTGCCCTTTGTACACACCGCCCGTCGCTCCTACCGATTGAATGG
TCCGGTGAAGTGCTCGGATTGTGGCGACGTTAGTGGGTCTGCCGCTGGCGACG
>Phyllospadix iwatensis
CAACCTGGTTGATCCTGCCAGTAGTCATATGCTTGTCTCAAAGATTAAGCCATGCATGTGCAAGTATG
AACTAATTCAGACTGTGAAACTGCGAATGGCTCATTAAATCAGTTATAGTTTGTTTGATGGTACCTTG
CTACTCGGATAACCGTAGTAATTCTAGAGCTAATACGTGCACCAAACCCCGACTTCTGGAAGGGATG
CATTTGTTAGATAAAAGGTTGACACGGGCCTTGTGCCTGTTGCTCTGATGATTCATGATAACTTGACG
GATCGCATGGCCTTTGTGCCGGCGACGCATCATTCAAATTTCTGCCCTATCAACTTTCGATGGTAGG
ATAGGGGCCTACCATGGTGGTGACGGGTGACGGAGAATTAGGGTTCGATTCCGGAGAGGGAGCCT
GAGAAACGGCTACCACATCCAAGGAAGGCAGCAGGCGCGCAAATTACCCAATCCTGACACGGGGA
GGTAGTGACAATAAATAACAATACCGGGCTCTTTGAGTCTGGTAATTGGAATGAGTACAATCTAAATC
CCTTAACGAGGATCCATTGGAGGGCAAGTCTGGTGCCAGCAGCCGCGGTAATTCCAGCTCCAATAG
CGTATATTTAAGTTGTTGCAGTTAAAAAGCTCGTAGTTGGACCTTGGGTTGGGTCGGCCGGTCCGCC
TTATGGTGTGCACCGACCGTCTCGTCCCTTCTGCTGGTGATGCGTTCCTGTCCTTAGTTGGTCGGGT
CGTGCCTCCGGCGCTGTTACTTTGAAAGAAATTAGAGTGCTCAAAGCAAGCCTATGCTCTGTATACA
TTAGCATGGGATAACATCACAGGATTTCGATCCTATTTTGTTGGCCTTCGGGATCGGAGTAATGATTA
AAAGGGACAGTCGGGGGCATTCGTATTTCATAGTCAGAGGTGAAATTCTTGGATTTATGAAAGACGA
ACAACTGCGAAAGCATTTGCCAAGGATGTTTTCATTAATCAAGAACGAAAGTTGGGGGCTCGAAGAC
GATCAGATACCGTCCTAGTCTCAACCATAAACGATGCCGACCAGGGATTGGCGGATGTTGCTTTTAG
GACTCCGCCAGCACCTTATGAGAAATCAAAGTTTTTGGGTTCCGGGGGGAGTATGGTCGCAAGGCT
GAAACTTAAAGGAATTGACGGAAGGGCACCACCAGGAGTGGAGCCTGCGGCTTAATTTGACTCAAC
ACGGGGAAACTTACCAGGTCCAGACATAGTAAGGATTGACAGATTGAGAGCTCTTTCTTGATTCTAT
GGGTGGTGGTGCATGGCCGTTCTTAGTTGGTGGAGCGATTTGTCTGGTTAATTCCGTTAACGAACGA
GACCTCAGCCTGCTAACTAGCTATGCGGAGGTGACCCTTCGTGGCCAGCTTCTTAGAGGGACTATG
GCCGCCTAGGCCACGGAAGTTTGAGGCAATAACAGGTCTGTGATGCCCTTAGATGTTCTGGGCCGC
ACGCGCGCTACACTGATGTATTCAACGAGTTTATAACCTTAGCTGATAGGCTTGGGTAATCTTTGAAA

ATTTCATCGTGATGGGGATAGATCATTGCAATTGTTGGTCTTCAACGAGGAATTCCTAGTAAGCGTGA
GTCATCAGCTCGCGTTGACTACGTCCCTGCCCTTTGTACACACCGCCCGTCGCTCCTACCGATTGAA
TGGTCCGGTGAAGTGCTCGGATTGTGGCGACGTTAGTGGTCTGCCGCTGGCGACGTCGTGAGAAGT
CCACTGAACCTTATCATTTAGAGGAAGGAGAAGTCGTAACAAGGTTTCCGTAGGTGAACCTGCAGAA
GGATCAG
>Cymodocea serrulata
GATAACTTGACGGATCGCATGGCCATTGTGCTGGCGACGCATCATTCAAATTTCTGCCCTATCAACTT
TCGATGGTAGGATAGGGGCCTACCATGGTGTTGACGGGTGACGGAGAATTAGGGTTCGATTCCGGA
GAGGGAGCCTGAGAAACGGCTACCACATCCAAGGAAGGCAGCAGGCGCGCAAATTACCCAATCCTG
ACACGGGGAGGTAGTGACAATAAATAACAATACCGGGCTCTTGGAGTCTGGTAATTGGAATGAGTAC
AATCTAAATCCCTTAACGAGGATCCATTGGAGGGCAAGTCTGGTGCCAGCAGCCGCGGTAATTCCA
GCTCCAATAGCGTATATTTAAGTTGTTGCAGTTAAAAAGCTCGTAGTTGGACCTTGGGTTGGGCCGG
CCGGTCCGCCTATGGTGTGCATCGGCCGTCTCGTCCCTTCTGCCGGAGATACGTTCCCGTCCTTTT
GTTGGTCGGGTCGTGCTTCCGGGCGCTGTTACTTTGAAGAAATTAGAGTGCTTAAAGCAAGCCTATG
CTCTGTATACATCAGCATGGGATAACATCATAGGATTTCGGTCCTATTGTGTTGGCCTTCGGGATCG
GAGTAATGATTAAGAGGGACAGTCGGGGGCATTCRTATTTCATAGTCAGAGGTGAAATTCTTGGATT
TATGAAAGACGAACAACTGCGAAAGCATTTGCCAAGGATGTTTTCATTAATCAAGAACGAAAGTTGGG
GGCTCGAAGACGATCAGATACCGTCCTAGTCTCAACCATAAACGATGCCGACCAGGGATTGGCGGA
TGTTGCTTTTAGGACTCTGCCAGCACCTTATGAGAAATCAAAGTTTTTGGGTTCCGGGGGGAGTATG
GTCGCAAGGCTGAAACTTAAAGGAATTGACGGAAGGGCACCACCAGGAGTGGAGCCTGCGGCTTAA
TTTGACTCAACACGGGGAAACTTACCAGGTCCAGACATAGTAAGGATTGACAGATTGAGAGCTCTTT
CTTGATTCTATGGGTGGTGGTGCATGGCCGTTCTTAGTTGGTGGAGCGATTTGTCTGGTTAATTCCG
TTAACGAACGAGACCTCAGCCTGCTAACTAGCTATGCGGAGGTGACCCTTCGTGGCCAGCTTCTTAG
AGGGACTATGGCCGCTTAGGCCACGGAAGTTTGAGGCAATAACAGGTCTGTGATGCCCTTAGATGTT
CTGGGCCGCACGCGCGCTACACTGATGTATTCAACGAGTTTATAACCTTGACCGATAGGTTTGGGTA
ATCTTCGAAAATTTCATCGTGATGGGGATAGATCATTGCAATTGTTGGTCTTCAACGAGGAATTCCTA
GTAAGCGCGAGTCATCAGCTCGCGTTGACTACGTCCCTGCCCTTTGTACACACCGCCCGTCGCTCC
TA
>Ruppia maritima
TGTGAAACTGCGAATGGCTCATTAAATCAGTTATAGTTTGTTTGATGGTATTTGCTACTCGGATAACC
GTAGTAATTCTAGAGCTAATACGTGCACCGAAACCCCGACTTTTGGAAGGGATGCATTTGTTAGATAA
AAGGCTGACGCGGGCTTTGCTCGTTGTTCCGATGATTCATGATAACTTGACGGATCGCATGGCCATA
GTGCCGGCGACGCATCATTCAAATTTCTGCCCTATCAACTTTCGATGGTAGGATATTTGCCTACCATG
GTGGTGACGGGTGACGGAGAATTAGGGTTCGATTCCGGAGAGGGAGCCTGAGAAACGGCTACCAC
ATCCAAGGAAGGCAGCAGGCGCGCAAATTACCCAATCCTGACACGGGGAGGTAGTGACAATAAATA
ACAATACCGGGCTCTTCGAGTCTGGTAATTGGAATGAGTACAATCTAAATCCCTTAACGAGGATCCAT
TGGAGGGCAAGTCTGGTGCCAGCAGCCGCGGTAATTCCAGCTCCAATAGCGTATATTTAAGTTGTTG
CAGTTAAAAAGCTCGTAGTTGGACCTTGGGTTGGTTCGATCGGTCTGCTTGGTGTGCATCGGTCGGT
TCGTCCCTTCTGCTGGTGTCGCGTTCCTGTCCTTAATTGGTCGGGTCGTGCCTCTGGCGCTGTTACT
TTGAAGAAATTAGAGTGCTCAAAGCAAGCCTATGCTCTGCATACATTAGCATGGGATAACATCACAG
GATTTCGGTCCTATTTTGTTGGCCTTCGGGATCGGAGTAATGATTAAGAGGGACAGTCGGGGGCATT
CGTATTTCATAGTCAGAGGTGAAATTCTTGGATTTATGAAAGACGAACAACTGCGAAAGCATTTGCCA
AGGATGTTTTCATTAATCAAGAACGAAAGTTGGGGGCTCGAAGACGATCAGATACCGTCCTAGTCTC
AACCATAAACGATGCCGACCAGGGATTGGCGGATGTTGCTTTTAGGACTTCGCCAGCACCTTTTGAG
AAATCAAAGTTTTTGGGTTCCGGGGGGAGTATGGTCGCAAGGCTGAAACTTAAAGGAATTGACGGAA
GGGCACCACCAGGAGTGGAGCCTGCGGCTTAATTTGACTCAACACGGGGAAACTTACCAGGTCCAG
ACATAGTAAGGATTGACAGATTGAGAGCTCTTTCTTGATTCTATGGGTGGTGGTGCATGGCCGTTCTT
AGTTGGTGGAGCGATTTGTCTGGTTAATTCCGTTAACGAACGAGACCTCAGCCTGCTAACTAGCTAT
GCGAAGGTAACCCTTCGTGGCCAGCTTCTTAGAGGGACTATGGCCGCTTAGGCTACGGAAGTTTGA

GGCAATAACAGGTCTGTGATGCCCTTAGATGTTCTGGGCCGCACGCGCGCTACACTGATGTATTCAA
CGAGTTTATAACCTTAGCCGATAGGCTTGGGTAATCTTTGAAAATTTCATCGTGATGGGGATAGATCA
TTGCAACTGTTGGTCTTCAACGAGGAATTCCTAGTAAGCGTGAGTCATCAGCTCGCGTTGACTACGT
CCCTGCCCTTTGTACACACCGCCCGTCGCTCCTACCGATTGAATGGTCCGGTGAAGTGCTCGGATC
GTGATGA
>Syringodium isoetifolium
GATAACTTGACGGATCGCATGGCCGTTGTGCTGGCGACGCATCATTCAAATTTCTGCCCTATCAACT
TTCGATGGTAGGATAGGGGCCTACCATGGTGTTGACGGGTGACGGAGAATTAGGGTTCGATTCCGG
AGAGGGAGCCTGAGAAACGGCTACCACATCCAAGGAAGGCAGCAGGCGCGCAAATTACCCAATCCT
GACACGGGGAGGTAGTGACAATAAATAACAATACCGGGCTCTTGGAGTCTGGTAATTGGAATGAGTA
CAATCTAAATCCCTTAACGAGGATCCATTGGAGGGCAAGTCTGGTGCCAGCAGCCGCGGTAATTCCA
GCTCCAATAGCGTATATTTAAGTTGTTGCAGTTAAAAAGCTCGTAGTTGGACCTTGGGTTGGGCCGG
CCGGTCTGCCTTTGGTGTGTATCGGCCGTCTCGTCCCTTCTGCCGGAGACGCGCTCCTGTCCTTCA
CTGGTCGGGTCGTGCTTCTGGCGCTGTTACTTTGAAGAAATTAGAGTGCTTAAAGCAAGCCTATGCT
CTGTATACATCAGCATGGGATAACATCATAGGATTTCGGTCCTATTGTGTTGGCCTTCGGGATCGGA
GTAATGATTAAGAGGGACAGTCGGGGGCATTCGTATTTCATAGTCAGAGGTGAAATTCTTGGATTTAT
GAAAGACGAACAACTGCGAAAGCATTTGCCAAGGATGTTTTCATTAATCAAGAACGAAAGTTGGGGG
CTCGAAGACGATCAGATACCGTCCTAGTCTCAACCATAAACGATGCCGACCAGGGATTGGCGGATG
TTGCTTTTAGGACTCTGCCAGCACCTTATGAGAAATCAAAGTTTTTGGGTTCCGGGGGGAGTATGGT
CGCAAGGCTGAAACTTAAAGGAATTGACGGAAGGGCACCACCAGGAGTGGAGCCTGCGGCTTAATT
TGACTCAACACGGGGAAACTTACCAGGTCCAGACATAGTAAGGATTGACAGATTGAGAGCTCTTTCT
TGATTCTATGGGTGGTGGTGCATGGCCGTTCTTAGTTGGTGGAGCGATTTGTCTGGTTAATTCCGTT
AACGAACGAGACCTCAGCCTGCTAACTAGCTATGCGGAGGTGACCCTTCGTGGCCAGCTTCTTGGA
GGGACTATGGCCGCTTAGGCCACGGAAGTTTGAGGCAATAACAGGTCTGTGATGCCCTTAGATGTT
CTGGGCCGCACGCGCGCTACACTGATGTATTCAACGAGTTTATAACCTGGACCGACAGGTTTGGGT
AATCTTCGAAAATTTCATCRTGATGGGGATAGATCATTGCAATTGTTGGTCTTCAACGAGGAATTCCT
AGTAAGCGTGAGTCATCAGCTCGCGTTGACTACGTCCCTGCCCTTTGTACACACCGCCCGTCGCTC
CTA
>Potamogeton zosteriformis normal grass
CTGGTTGATCCTGCCAGTAGTCATATGCTTGTCTCAAAGATTAAGCCATGCATGTGCAAGTATGAACT
AATTCAACTGTGAAACTGCGAATGGCTCATTAAATCAGTTATAGTTTGTTTGATGGTATACCTTGCTAC
TCGGATAACCGTAGTAATTCTAGAGCTAATACGTGCACCAAATCCCGACTTCTGGAAGGGATGCATT
TGTTAGATAAAAGGCTGACGCGGGTTTTCCCGTTGCTCTGAGGAATCATGATAACTTGACCGATCGC
ATGGTCTTTGTGCCGGCGACACATCATTCAAATTTCTGCCCTATCAACTTTCGACGGTAGGATAGGG
GCCTACCGTGGTTTTGACGGGTGACGGAGAATTAGGGTTCGATTCCGGAGAGGGAGCCTGAGAGAC
GGCTACCACATCCAAGGAAGGCAGCAGGCGCGCAAATTACCCAATCCTGACACGGGGAGGTAGTGA
CAATAAATAACAATACCGGGCTCTTTTGAGTCTGGTAATTGGAATGAGTACAATCTAAATCCCTTAAC
GAGGATCCATTGGAGGGCAAGTCTGGTGCCAGCAGCCGCGGTAATTCCAGCTCCAATAGCGTATAT
TTAAGTTGTTGCAGTTAAAAAGCTCGTAGTTGGACCTTGGGATGGGTCGGTCGGTCTGCCTATGGTG
TGTACCGGCCGTCTCGTCCCTTTTGCTGGTGACGCGTTCCTGTCCTTAGTTGGTCGGGTCGTGCTTC
CGGCGCTGTTACTTTGAAGAAATTAGAGTGCTCAAAGCAGGCCTTTGCTCTGAATATAATTAGCATGG
GATAACGTCATAGGATTTCGGTCCTATTCTGTTGGCCTTCGGGACCGGAGTAATGATTAAGAGGGAC
AGTCGGGGGCATTCGTATTTCATAGTCAGAGGTGAAATTCTTGGATTTATGAAAGACGAACAACTGC
GAAAGCATTTGCCAAGGATGTTTTCATTAATCAAGAACGAAAGTTGGGGGCTCGAAGACGATCAGAT
ACCGTCCTAGTCTCAACCATAAACGATGCCGACCAGGGATTGGCGGATGTTACTTTAAGGACTCCGC
CAGCACCTTATGAGAAATCAAAGTTTTTGGGTTCCGGGGGGAGTATGGTCGCAAGGCTGAAACTTAA
AGGAATTGACGGAAGGGCACCACCAGGAGTGGAGCCTGCGGCTTAATTTGACTCAACACGGGGAAA
CTTACCAGGTCCAGACATAGTAAGGATTGACAGATTGAGAGCTCTTTCTTGATTCTATGGGTGGTGG

TGCATGGCCGTTCTTAGTTGGTGGAGCGATTTGTCTGGTTAATTCCGTTAACGAACGAGACCTCAGC
CTGCTAACTAGCTATGCGGAGGTGATCCTCCGTGGCCAGCTTCTTAGAGGGACTATGGCCGCTTAG
GCCAAGGAAGTTTGAGGCAATAACAGGTCTGTGATGCCCTTAGATGTTCTGGGCCGCACGCGCGCT
ACACTGATGTATTCAACGAGTTTATAACCTGGGCCGACAGGCTTGGGTAATCTTTGAAAATTTCATCG
TGATGGGGATAGATCATTGCAATTGTTGGTCTTCAACGAGGAATTCCTAGTAAGCGTGAGTCATCAG
CTCGCGTTGACTACGTCCCTGCCCTTTGTACACACCGCCCGTCGCTCCTACCGATTGAATGGTCCG
GTGAAGTGCTCGGATCGTGGCGACGTGAGTGGTTTCCCGCTCACGACGTCGTGAGAAGTTCACTGA
ACCTTATCATTTAGAGGAAGGAGAAGTCGTAACAAGGTTTCCGTA
>Halodule wrightii
GATAACTTGACGGATCGCATGGCCTCTGTGCTGGCGACGCATCATTCAAATTTCTGCCCTATCAACT
TTCGATGGTAGGATAGGGGCCTACCATGGTGTTGACGGGTGACGGAGAATTAGGGTTCGATTCCGG
AGAGGGAGCCTGAGAAACGGCTACCACATCCAAGGAAGGCAGCAGGCGCGCAAATTACCCAATCCT
GACACGGGGAGGTAGTGACAATAAATAACAATACCGGGCTCGTTGAGTCTGGTAATTGGAATGAGTA
CAATCTAAATCCCTTAACGAGGATCCATTGGAGGGCAAGTCTGGTGCCAGCAGCCGCGGTAATTCCA
GCTCCAATAGGCGTATATTTAAGTTGTTGCAGTTAAAAAGCTCGTAGTTGGACCTTGGGTTGGGTCG
GCCGGTCTGCCTATAGGTGTGCATCGGCCGTCTCGTCCCTTCTGCTGGTGACGCGTTCCTGTCCTTT
ATTGGTCGGGTCGTGCCTCCGGCGCTGTTACTTTGAAGAAATTAGAGTGCTCAAAGCAGGCCTGTG
CTTGTATACATTAGCATGGGATAACGTCATAGGATTTCGATCCTATTGTGTTGGCCTTCGGGATCGGA
GTAATGATTAAGAGGGACAGTCGGGGGCATTCGTATTTCATAGTCAGAGGTGAAATTCTTGGATTTAT
GAAAGACGAACGACTGCGAAAGCATTTGCCAAGGATGTTTTCATTAATCAAGAACGAAAGTTGGGGG
CTCGAAGACGATCAGATACCGTCCTAGTCTCAACCATAAACGATGCCGACCAGGGATTGGCGGATG
TTGCTTTTAGGACTCTGCCAGCACCTTATGAGAAATCAAAGTTTTTGGGTTCCGGGGGGAGTATGGT
CGCAAGGCTGAAACTTAAAGGAATTGACGGAAGGGCACCACCAGGAGTGGAGCCTGCGGCTTAATT
TGACTCAACACGGGGAAACTTACCAGGTCCAGACATAGTAAGGATTGACAGATTGAGAGCTCTTTCT
TGATTCTATGGGTGGTGGTGCATGGCCGTTCTTAGTTGGTGGAGCGATTTGTCTGGTTAATTCCGTT
AACGAACGAGACCTCAGCCTGCTAACTAGCTATGCGGAGGTGACCCTTCGTGGCCAGCTTCTTAGA
GGGACTATGGCCGCTCAGGCCATGGAAGTTTGAGGCAATAACAGGTCTGTGATGCCCTTAGATGTT
CTGGGCCGCACGCGCGCTACACTGATGTATTCAACGAGTTTATAACCTGGGCCGATAGGCTTGGGT
AATCTTCGAAAATTTCATCGTGATGGGGATAGATCATTGCAATTGTTGGTCTTCAACGAGGAATTCCT
AGTAAGCGTGAGTCATCAGCTCGCGTTGACTACGTCCCTGCCCTTTGTACACACCGCCCGTCGCTC
CTA
>Ruppia cirrhosa
TTTCCGTAGGTGAACCTGCGGAAGGATCATTGTCGAGATGGATAGCAATAGACGAACACGTCACCGA
ATTATTTTGGAAAAGTGTGTTTTTGATACACTATGTCCTAGCAGAAATGCTATGCTCCCTTTGGGCGT
GTGTGCATTTGTGCTCAACAACCAACCCTGGCACAACTTGTGTCAAGCAAAAAGTAGCTTGTGGTTT
GTCTCCTTCATCGTATTGAGAGGATCGCGAGTCTCACAGAATTACTATTAAATGCACGACTCCCGTCA
ACGGATATCTTGGCCCTTGCATCGATGAAGAACGTAGCAAAATGCGATACTTGATGTGAATTGTAGA
ATCCCGTGAACCATCGAGTCTTTGAATGCAAGTTGCGCCCGAAGTTGTTAGACGGACGGCATGCCT
GCCTGGGCGTCATTAATTGAGTCGCTCATTAAGTATGATCTTCATGGTTGATGAAGCGGATTATGGC
CTTCTGGGAATTATCCGGTAGGCTTAAATGGGCGTGACCTGCTGTGTGGAGATGCACGATGGGTGG
TGAACTTTTGTGGATTGTAGTCGATCCCATCATTAGCGAATAGCACGTCGTGCCTCCCTCAACATCTT
CTTTCACGTGCTTACCCTTTGCATAAGGTGTCTCGTTGGTGCCTTAATTGAAAAGTAGAGAATCTGAT
TGGGACCTCAGGTCAGGCAAGACCACCTGCTGAGTTTAA
Halodulepinifolia
GATAACTTGACGGATCGCATGGCCTCTGTGCTGGCGACGCATCATTCAAATTTCTGCCCTATCAACT
TTCGATGGTAGGATAGGGGCCTACCATGGTGTTGACGGGTGACGGAGAATTAGGGTTCGATTCCGG

AGAGGGAGCCTGAGAAACGGCTACCACATCCAAGGAAGGCAGCAGGCGCGCAAATTACCCAATCCT
GACACGGGGAGGTAGTGACAATAAATAACAATACCGGGCTCGTTGAGTCTGGTAATTGGAATGAGTA
CAATCTAAATCCCTTAACGAGGATCCATTGGAGGGCAAGTCTGGTGCCAGCAGCCGCGGTAATTCCA
GCTCCAATAGCGTATATTTAAGTTGTTGCAGTTAAAAAGCTCGTAGTTGGACCTTGGGTTGGGTCGG
CCGGTCTGCCTATAGGTGTGCATCGGCCGTCTCGTCCCTTCTGCTGGTGACGCGTTCCTGTCCTTTA
TTGGTCGGGTCGTGCCTCCGGCGCTGTTACTTTGAAGAAATTAGAGTGCTCAAAGCAGGCCTGTGCT
CGTATACATTAGTATGGGATAACGTCATAGGATTTCGATCCTATTGTGTTGGCCTTCGGGATCGGAGT
AATGATTAAGAGGGACAGTCGGGGGCATTCGTATTTCATAGTCAGAGGTGAAATTCTTGGATTTATGA
AAGACGAACGACTGCGAAAGCATTTGCCAAGGATGTTTTCATTAATCAAGAACGAAAGTTGGGGGCT
CGAAGACGATCAGATACCGTCCTAGTCTCAACCATAAACGATGCCGACCAGGGATTGGCGGATGTT
GCTTTTAGGACTCTGCCAGCACCTTATGAGAAATCAAAGTTTTTGGGTTCCGGGGGGAGTATGGTCG
CAAGGCTGAAACTTAAAGGAATTGACGGAAGGGCACCACCAGGAGTGGAGCCTGCGGCTTAATTTG
ACTCAACACGGGGAAACTTACCAGGTCCAGACATAGTAAGGATTGACAGATTGAGAGCTCTTTCTTG
ATTCTATGGGTGGTGGTGCATGGCCGTTCTTAGTTGGTGGAGCGATTTGTCTGGTTAATTCCGTTAA
CGARCGAGACCTCAGCCTGCTAACTAGCTATGCGGAGGTGACCCTTCGTGGCCAGCTTCTTAGAGG
GACTATGGCCGCTCAGGCCATGGAAGTTTGRGGCAATAACAGGTCTGTGATGCCCTTAGATGTTCTG
GGCCGCACGCGCGCTACACTGATGTATTCAACGAGTTTATAACCTGGGCCGATAGGCTTGGGTAAT
CTTCGAAAATTTCATCGTGATGGGGATAGATCATTGCAATTGTTGGTCTTCAACGAGGAATTCCTAGT
AAGCGTGAGTCATCAGCTCGCGTTGACTACGTCCCTGCCCTTTGTACACACCGCCCGTCGCTCCTA
>Thalassia hemprichii
AATTCAGACTGTGAAACTGCGAATGGCTCATTACATCAGTTATAGTTTGTTTGATGGTACCTACTACT
CGGATAACCGTAGTAATTCTAGAGCTAATACGTGCACCGAACCCCGACTTCTGGAAGGGTTGCATTT
ATTAGATAAAAGGCCAATGTGGGCTCTGCTCACCTTTCGGATGATACATGATAACTCGACGGATCGC
ACGGCCTTCGTGCCGGCGACGCATCATTCAAATTTCTGCCCTATCAACTTTCGATGGTAGGATAGGG
GCCTACCATGGTGGTGACGGGTGACGGAGAATTAGGGTTCGATTCCGGAGAGGGAGCCTGAGAAA
CGGCTACCACATCCAAGGAAGGCAGCAGGCGCGCAAATTACCCAATCCTGACACGGGGAGGTAGT
GACAATAAATAACAATACCGGGCTCTACGAGTCTGGTAATTGGAATGAGTACAATCTAAATCCCTTAA
CGAGGATCCATTGGAGGGCAAGTCTGGTGCCAGCAGCCGCGGTAATTCCAGCTCCAATAGCGTATA
TTTAAGTTGTTGCAGTTAAAAAGCTCGTAGTTGGACTTTGGGTTGGGTCGGCCGGTCCGCCTTTGGT
GTGCACCGGTCGTCTCGTCCCTTTTGCCGGCGACGCGCTCCTGGTCTTAATTGGCCGGGTTCGTGC
CTTCGGCGTTGTTACTTTGAAGAAATTAGAGTGCTCAAAGCAAGCCCAAGCTCTGCATACATTAGCAT
GGGATAACATCACAGGATTTCGGTCCTATTGTGTTGGCCTTCGGGATCGGAGTAATGATTAAGAGGG
ACAGTCGTGGGCATTCGTATTTCATAGTCAGAGGTGAAATTCTTGGATTTATGAAAGACGAACAACTG
CGAAAGCATTTGCCAAGGATGTTTTCATTAATCAAGAACGAAAGTTGGGGGCTCGAAGACGATCAGA
TACCGTCCTAGTCTCAACCATAAACGATGCCGACCAGGGATCGGCGGATGTTGCTTGTGCGACATC
GCCGGCACCTTATGAGAAATCAAAGTTTTTGGGTTCCGGGGGGAGTATGGTCGCAAGGCTGAAACT
TAAAGGAATTGACGGAAGGGCACCACCAGGAGTGGAGCCTGCGGCTTAATTTGACTCAACACGGGG
AAACTTACCAGGTCCAGACATAGTAAGGATTGACAGACTGAGAGCTCTTTCTTGATTCTATGGGTGGT
GGTGCATGGCCGTTCTTAGTTGGTGGAGCGATTTGTCTGGTTAATTCCGTTAACGAACGAGACCTCA
GCCTGCTAACTAGCTATGCGGAGGCGACCCTCCGTGGCCAGCTTCTTAGAGGGACTATGGCCGTTT
AGGCCACGGAAGTTTGAGGCAATAACAGGTCTGTGATGCCCTTAGATGTTCTGGGCCGCACGCGCG
CTACACCGATGTATTCAACGAGTTTATAACCTTGGCTGACAGGCCCGGGTAATCTTGCAAATTTCATC
GTGATGGGGATAGATCATTGCAATTGTTGGTCYTCAACGAGGAATTCCTAGTAAGCGCGAGTCATCA
GCTCGCGTTGACTACGTCCCTGCCCTTTGTACACACCGCCCGTCGCTCCTACCGATTGAATGGTCC
GGTGAAGTGCTCGGATCGCGGC
>Cymodocearotundata

GATAACTTGACGGATCGCATGGCCATCGTGCTGGCGACGCATCATTCAAATTTCTGCCCTATCAACT
TTCGATGGTAGGATAGGGGCCTACCATGGTGTTGACGGGTGACGGAGAATTAGGGTTCGATTCCGG
AGAGGGAGCCTGAGAAACGGCTACCACATCCAAGGAAGGCAGCAGGCGCGCAAATTACCCAATCCT
GACACGGGGAGGTAGTGACAATAAATAACAATACCGGGCTCTTGGAGTCTGGTAATTGGAATGAGTA
CAATCTAAATCCCTTAACGAGGATCCATTGGAGGGCAAGTCTGGTGCCAGCAGCCGCGGTAATTCCA
GCTCCAATAGCGTATATTTAAGTTGTTGCAGTTAAAAAGCTCGTAGTTGGACCTTGGGTTGGGTCGG
CCGGTCCGCCTATGGTGTGCATCGGCCGTCTCGTCCCTTCTGCCGGAGACGCGTTCCTGTCCTTCA
CTGGTCGGGTCGTGCTTCTGGCGCGCTGTTACTTTGAAGAAATTAGAGTGCTTAAAGCAAGCCTATG
CTCTGCATACATCAGCATGGGATAACATCATAGGATTTCGGTCCTATTGTGTTGGCCTTCGGGATCG
GAGTAATGATTAAGAGGGACAGTCGGGGGCATTCGTATTTCATAGTCAGAGGTGAAATTCTTGGATT
TATGAAAGACGAACAACTGCGAAAGCATTTGCCAAGGATGTTTTCATTAATCAAGAACGAAAGTTGGG
GGCTCGAAGACGATCAGATACCGTCCTAGTCTCAACCATAAACGATGCCGACCAGGGATCGGCGGA
TGTTGCTTTTAGGACTCTGCCAGCACCTTATGAGAAATCAAAGTTTTTGGGTTCCGGGGGGGGTATG
GTCGCAAGGCTGAAACTTAAAGGAATTGACGGAAGGGCACCACCAGGAGTGGAGCCTGCGGCTTAA
TTTGACTCAACACGGGGAAACTTACCAGGTCCAGACATAGTAAGGATTGACAGATTGAGAGCTCTTT
CTTGATTCTATGGGTGGTGGTGCATGGCCGTTCTTAGTTGGTGGAGCGATTTGTCTGGTTAATTCCG
TTAACGAACGAGACCTCAGCCTGCTAACTAGCTACGCGGAGGTGACCCTTCGTGGCCAGCTTCTTA
GAGGGACTATGGCCGCTTAGGCCACGGAAGTTTGAGGCAATAACAGGTCTGTGATGCCCTTAGATG
TTCTGGGCCGCACGCGCGCTACACTGATGTATTCAACGAGTTTATAACCTTGACCGATAGGTTTGGG
TAATCTTCGAAAATTTCATCGTGATGGGGATAGATCATTGCAATTGTTGGTCTTCAACGAGGAATTCC
TAGTAAGCGCGAGTCATCAGCTCGCGTTGACTACGTCCCTGCCCTTTGTACACACCGCCCGTCGCT
CCTA
>Halophiladecipiens
AATTCAGACTGTGAAACTGCGAATGGCTCATTAAATCAGTTATAGTTTGTTTGATGGTACTTTCTACTC
GTATAACCGTAGTAATTCTAGAGCTAATACGTGCACCAAACCCCGACTTCTGGAAGGGATGCATTTAT
TAGATAAAAGGCCAATGCGGGCTTCGATCGCTTCTCGGATGATTCATGATAACTCGACGGATCGCAC
GGCCCTCGTGCCGGCGACGCACCATTCAAATTTCTGCCCTATCAACTTTCGATGGTAGGATAGGGG
CCTACCATGGTGGTGACGGGTGACGGAGAATTAGGGTTCGATTCCGGAGAGGGAGCCTGAGAAAC
GGCTACCACATCCAAGGAAGGCAGCAGGCGCGCAAATTACCCAATCCTGACATGGGGAGGTAGTGA
CAATAAATAACGATACCGGGCTCTACGAGTCTGGTAATTGGAATGAGTACAATCTAAATCCCTTAACG
AGGATCCATTGGAGGGCAAGTCTGGTGCCAGCAGCCGCGGTAATTCCAGCTCCAATAGCGTATATTT
AAGTTGTTGCAGTTAAAAAGCTCGTAGTTGGACTTTGGGTTGGGTCGGCCGGTCCGCCTTTGGTGTG
CACCGGTCGTCTCGTCCCTTTTGCCGGTGACGCGCTCCTGGACTTAATTGGCCGGGTCGTGCCTTC
GGCGCTGTTACTTTGAAGAAATTAGAGTGCTCAAAGCAAGCCCAAGCTCTGCATATATTAGCATGGG
ATAACATCACAGGATTTCGGTCCTATTGTGTTGGCCTTCGGGATCGGAGTAATGATTAAGAGGGATA
GTCGTGGGCATTCGTATTTCATAGTCAGAGGTGAAATTCTTGGATTTATGAAAGACGAACAACTGCGA
AAGCATTTGCCAAGGATGTTTTCATTAATCAAGAAACGAAAGTTGGGGGCTCGAAGACGATCAGATA
CCGTCCTAGTCTCAACCATAAACGATGCCGACCAGGGATCGGCGGATGTTGCTTGTACGACATCGC
CGGCACCTTATGAGAAATCAAAGTTTTTGGGTTCCGGGGGGAGTATGGTCGCAAGGCTGAAACTTAA
AGGAATTGACGGAAGGGCACCACCAGGAGTGGAGCCTGCGGCTTAATTTGACTCAACACGGGGAAA
CTTACCAGGTCCAGACATAGTAAGGATTGACAGACTGAGAGCTCTTTCTTGATTCTATGGGTGGTGG
TGCATGGCCGTTCTTAGTTGGTGGAGCGATTTGTCTGGTTAATTCCGTTAACGAACGAGACCTCAGC
CTGCTAACTAGCTATGCGGAGGCAACCCTCCGTGGCCAGCTTCTTAGAGGGACTATGGCCGCTTAG
GCCACGGAAGTTTGAGGCAATAACAGGTCTGTGATGCCCTTAGATGTTCTAGGCCGCACGCGCGCT
ACACTGATGTATTCAACGAGTTTATAACCTTGGCTGACAGGCCCGGGTAATCTTTGAAAATTTCATCG
TGATGGGGATAGATCATTGCAATTGTTGGTCTTCAACGAGGAATTCCTAGTAAGCGCGAGTCATCAG
CTCGCGTTGACTACGTCCCTGCCCTTTGTACACACCGCCCGTCGCTCCTACCGATTGAATGGTCCG
GTGAAGTGCTCGGATCGCGGC

>Halophila minor
CCATAAATTTGGGGCCTGTGGGGAAACCCCAACCCCCGGGTTTTATTGGCCCTCAGGGGGGTCTTT
CCCCCTAAGGCGCGAAATTTGGGAAGGCGACTGGGGGCGCCTTCTTTTTTATCCCACCGTGGGAAG
GGGAGGTTTTCAAAGCGGATTAATTGGTGTACCCCCAGGTTTTCCCAGTTCAGGAGGGTGAAAACG
GAGGCCCAGGAATTGTTAATCGATTCCCTATAGGCGGAATTGGGCCGGAGTTGCAAGTTTCCCGCC
CCCAATGCCGCGGGGTTAATTCAGACTTGGAAACTGGGAAGGGTCCATAAATCCAGTTTAAGTTTGT
TGGAGGTAATTTCTACTCGGATAACCGTAGTAATTCTAGAGCTAATACGTGCACCAAACCCCGACTTC
TGGAAGGGATGCATTTATTAGATAAAAGGCCAATGCGGGCTTCGCTCGSTTYTCGGATGATTCATGA
TAACTCGACGGATCGCACGGCCCTCGTGCCGGCGACGCATCATTCAAATTTCTGCCCTATCAACTTT
CGATGGTAGGATAGGGGCCTACCATGGTGGTGACGGGTGACGGAGAATTAGGGTTCGATTCCGGA
GAGGGAGCCTGAGAAACGGCTACCACATCCAAGGAAGGCAGCAGGCGCGCAAATTACCCAATCCTG
ACACGGGGAGGTAGTGACAATAAATAACGATACCGGGCTCTACGAGTCTGGTAATTGGAATGAGTAC
AATCTGAATCCCTTAACGAGGATCCATTGGAGGGCAAGTCTGGTGCCAGCAGCCGCGGTAATTCCA
GCTCCAATAGCGTATATTTAAGTTGTTGCAGTTAAAAAGCTCGTAGTTGGACTTTGGGTTGGGTCGG
CCGGTCCGCCTTTGGTGTGCACCGGTCGTCTCGTCCCTTTTGCCGGTGACGCGCTCCTGGACTTAA
TTGGCCGGGTCGTGCCTTCGGCGCTGTTACTTTGAAGAAATTAGAGTGCTCAAAGCAAGCCCAAGCT
CTGCATATATTAGCATGGGATAACATCACAGGATTTCGGTCCTATTGTGTTGGCCTTCGGGATCGGA
GTAATGATTAAGAGGGACAGTCGTGGGCATTCGTATTTCATAGTCAGAGGTGAAATTCTTGGATTTAT
GAAAGACGAACAACTGCGAAAGCATTTGCCAAGGATGTTTTCATTAATCAAGAACGAAAGTTGGGGG
CTCGAAGACGATCAGATACCGTCCTAGTCTCAACCATAAACGATGCCGACCAGGGATCGGCGGATG
TTGCTCATACGACATCGCCGGCACCTTATGAGAAATCAAAGTTTTTGGGTTCCGGGGGGAGTATGGT
CGCAAGGCTGAAACTTAAAGGAATTGACGGAAGGGCACCACCAGGAGTGGAGCCTGCGGCTTAATT
TGACTCAACACGGGGAAACTTACCAGGTCCAGACATAGTAAGGATTGACAGACTGAGAGCTCTTTCT
TGATTCTATGGGTGGTGGTGCATGGCCGTTCTTAGTTGGTGGAGCGATTTGTCTGGTTAATTCCGTT
AACGAACGAGACCTCAGCCTGCTAACTAGCTATGCGGAGGCAACCCTCCGTGGCCAGCTTCTTAGA
GGGACTATGGCCGCTTAGGCCACGGAAGTTTGAGGCAATAACAGGTCTGTGATGCCCTTAGATGTT
CTGGGCCGCACGCGCGCTACACTGATGTATTCAACGAGTTTATAACCTTGGCTGACAGGCCCGGGT
AATCTTTGAAAATTTCATCGTGATGGGGATAGATCATTGCAATTGTTGGTCTTCAACGAGGAATTCCT
AGTAAGCGCGAGTCATCAGCTCGCGTTGACTACGTCCCTGCCCTTTGTACACACCGCCCGTCGCTC
CTACCGATTGAATGGTCCGGTGAAGTGCTCGGATCGCGGC
>Halophila ovalis
AATTCAGACTGTGAAACTGCGAATGGCTCATTAAATCAGTTATAGTTTGTTTGATGGTACTTTCTACTC
GGATAACCGTAGTAATTCTAGAGCTAATACGTGCACCAAACCCCGACTTCTGGAAGGGATGCATTTA
TTAGATAAAAGGCCAATGCGGGCTTCGCTCGCTTCTCGGATGATTCATGATAACTCGACGGATCGCA
CGGCCCTCGTGCCGGCGACGCATCATTCAAATTTCTGCCCTATCAACTTTCGATGGTAGGATAGGGG
CCTACCATGGTGGTGACGGGTGACGGAGAATTAGGGTTCGATTCCGGAGAGGGAGCCTGAGAAAC
GGCTACCACATCCAAGGAAGGCAGCAGGCGCGCAAATTACCCAATCCTGACACGGGGAGGTAGTGA
CAATAAATAACGATACCGGGCTCTACGAGTCTGGTAATTGGAATGAGTACAATCTAAATCCCTTAACG
AGGATCCATTGGAGGGCAAGTCTGGTGCCAGCAGCCGCGGTAATTCCAGCTCCAATAGCGTATATTT
AAGTTGTTGCAGTTAAAAAGCTCGTAGTTGGACTTTGGGTTGGGTCGGCCGGTCCGCCTTTGGTGTG

CACCGGTCGTCTCGTCCCTTTTGCCGGTGACGCGCTCCTGGACTTAATTGGCCGGGTCGTGCCTTC
GGCGCTGTTACTTTGAAGAAATTAGAGTGCTCAAAGCAAGCCCAAGCTCTGCATATATTAGCATGGG
ATAACATCACAGGATTTCGGTCCTATTGTGTTGGCCTTCGGGATCGGAGTAATGATTAAGAGGGACA
GTCGTGGGCATTCGTATTTCATAGTCAGAAGGTGAAATTCTTTGGATTTATGAAAGACGAACCAACTG
GCGAAAGCATTTGCCAAGGATGTTTTCATTAATCAAGAACGAAAGTTGGGGGCTCGAAGACGATCAG
ATACCGTCCTAGTCTCAACCATAAACGATGCCGACCAGGGATCGGCGGATGTTGCTCATACGACATC
GCCGGCACCTTATGAGAAATCAAAGTTTTTGGGTTCCGGGGGGAGTATGGTCGCAAGGCTGAAACT
TAAAGGAATTGACGGAAGGGCACCACCAGGAGTGGAGCCTGCGGCTTAATTTGACTCAACACGGGG
AAACTTACCAGGTCCAGACATAGTAAGGATTGACAGACTGAGAGCTCTTTCTTGATTCTATGGGTGGT
GGTGCATGGCCGTTCTTAGTTGGTGGAGCGATTTGTCTGGTTAATTCCGTTAACGAACGAGACCTCA
GCCTGCTAACTAGCTATGCGGAGGCAACCCTCCGTGGCCAGCTTCTTAGAGGGACTATGGCCGCTT
AGGCCACGGAAGTTTGAGGCAATAACAGGTCTGTGATGCCCTTAGATGTTCTGGGTCGCACGCGCG
CTACACTGATGTATTCAACGAGTTTATAACCTTGGCTGACAGGCCCGGGTAATCTTTGAAAATTTCAT
CGTGATGGATAGATCATTGCAATTGTTGGTCTTCAACGAGGAATTCCTAGTAAGCGCGAGTCATCAG
CTCGCGTTGACTACGTCCCTGCCCTTTGTACACACCGCCCGTCGCTCCTACCGATTGAATGGTCCG
GTGAAGTGCTCGGATCGCGGC
>Halophila beccarii
AATTCAGACTGTGAAACTGCGAATGGCTCATTAAATCAGTTATAGTTTGTTTGATGGTACTTTCTACTC
GGATAACCGTAGTAATTCTAGAGCTAATACGTGCACCAAACCCCGACTTCTGGAAGGGATGCATTTA
TTAGATAAAAGGCCAATGCGGGCTTCGCTCGCTTCTCGGATGATTCATGATAACTCGACGGATCGCA
CGGCCCTCGTGCCGGCGACGCATCATTCAAATTTCTGCCCTATCAACTTTCGATGGTAGGATAGGGG
CCTACCATGGTGGTGACGGGTGACGGAGAATTAGGGTTCGATTCCGGAGAGGGAGCCTGAGAAAC
GGCTACCACATCCAAGGAAGGCAGCAGGCGCGCAAATTACCCAATCCTGACACGGGGAGGTAGTGA
CAATAAATAACGATACCGGGCTCTACGAGTCTGGTAATTGGAATGAGTACAATCTAAATCCCTTAACG
AGGATCCATTGGAGGGCAAGTCTGGTGCCAGCAGCCGCGGTAATTCCAGCTCCAATAGCGTATATTT
AAGTTGTTGCAGTTAAAAAGCTCGTAGTTGGACTTTGGGTTGGGTCGGCCGGTCCGCCTTTGGTGTG
CACCGGTCGTCTCGTCCCTTTTGCCGGTGACGCGCTCCTGGACTTAATTGGCCGGGTCGTGCCTTC
GGCGCTGTTACTTTGAAGAAATTAGAGTGCTCAAAGCAAGCCCAAGCTCTGTATATATTAGCATGGG
ATAACATCACAGGATTTCGGTCCTATTGTGTTGGCCTTCGGGATCGGAGTAATGATTAAGAGGGACA
GTCGTGGGCATTCGTATTTCATAGTCAGAGGTGAAATTCTTGGATTTATGAAAGACGAACAACTGCGA
AAGCATTTGCCAAGGATGTTTTCATTAATCAAGAACGAAAGTTGGGGGCTCGAAGACGATCAGATAC
CGTCCTAGTCTCAACCATAAACGATGCCCACCAGGGATCGGCGGATGTTGCTTGTACGACATCGCC
GGCACCTTATGAGAAATCAAAGTTTTTGGGTTCCGGGGGGGAGTATGGTCGCAAGGCTGAAACTTAA
AGGAATTGACGGAAGGGCACCACCAGGAGTGGAGCCTGCGGCTTAATTTGACTCAACACGGGGAAA
CTTACCAGGTCCAGACATAGTAAGGATTGACAGACTGAGAGCTCTTTCTTGATTCTATGGGTGGTGG
TGCATGGCCGTTCTTAGTTGGTGGAGCGATTTGYCTGGTTAATTCCGTTAACGAACGAGACCTCAGC
CTGCTAACTAGCTATGCGGAGGCGACCCTCCGTGGCCAGCTTCTTAGAGGGACTATGGCCGCTTAG
GCCACGGAAGTTTGAGGCAATAACAGGTCTGTGATGCCCTTAGATGTTCTGGGCCGCACGCGCGCY
ACACTGATGTATTCAACGAGTTTATAACCTTGGCTGACAGGCCCGGGTAATCTTTGAAAATTTCATCG
TGATGGGGATAGATCATTGCAATTGTTGGTCTTCAACGAGGAATTCCTAGTAAGCGCGAGTCATCAG

CTCGCGTTGACTACGTCCCTGCCCTTTGTACACACCGCCCGTCGCTCCTACCGATTGAATGGTCCG
GTGAAGTGCTCGGATCGCGGC
>Enhalus acoroides
AATTCAGACTGTGAAACTGCGAATGGCTCATTAAATCAGTTATAGTTTGTTTGATGGTACTTACTACTC
GGATAACCGTAGTAATTCTAGAGCTAATACGTGCACCAAACCCCGACTTCTGGAAGGGATGCATTTA
TTAGATAAAAGGCCAATGCGGGCTTTGCTCGCTTTTCGGATGATACATGATAACTCGACGGATCGCA
CGGCCTTCGTGCTGGCGACGCATCATTCAAAGTTCTGCCCTATCAACTTTCGATGGTAGGATAGGGG
CCTACCATGGTGGTGACGGGTGACGGAGAATTAGGGTTCGATTCCGGAGAGGGAGCCTGAGAAAC
GGCTACCACATCCAAGGAAGGCAGCAGGCGCGCAAATTACCCAATCCTGACACGGGGAGGTAGTGA
CAATAAATAACAATACCGGGCTCTACGAGTCTGGTAATTGGAATGAGTACAATCTAAATCCCTTAACG
AGGATCCATTGGAGGGCAAGTCTGGTGCCAGCAGCCGCGGTAATTCCAGCTCCAATAGCGTATATTT
AAGTTGTTGCAGTTAAAAAGCTCGTAGTTGGACTTTGGGTTGGGTCGGCCGGTCCGCCTTTGGTGTG
CACCGGTCGTCTCGTCCCTTTTGCCGGTGACGCGCTCCTGGACTTAATTGGCCGGGTCGTGCCTTC
GGCGCTGTTACTTTGAAGAAATTAGAGTGCTCAAAGCAAGCCCAAGCTCTGCATACATTAGCATGGG
ATAACATCACAGGATTTCGGTCCTATTGTGTTGGCCTTCGGGATGGGAGTAATGATTAAGAGGGACA
GTCGTGGGCATTCGTATTTCATAGTCAGAGGTGAAATTCTTGGATTTATGAAAGACGAACAACTGCGA
AAGCATTTGCCAAGGATGTTTTCATTAATCAAGAACGAAAGTTGGGGGCTCGAAGACGATCAGATAC
CGTCCTAGTCTCAACCATAAACGATGCCGACCAGGGATCGGCGGATGTTGCTTGTACGACATCGCC
GGCACCTTATGAGAAATCAAAGTTTTTGGGTTCCGGGGGGAGTATGGTCGCAAGGCTGAAACTTAAA
GGAATTGACGGAAGGGCACCACCAGGAGTGGAGCCTGYGGCTTAATTTGACTCAACACGGGGAAAC
TTACCAGGTCCAGACATAGTAAGGATTGACAGACTGAGAGCTCTTTCTTGATTCTATGGGTGGTGGT
GCATGGCCGTTCTTAGTTGGTGGAGCGATTTGTCTGGTTAATTCCGTTAACGAACGAGACCTCAGCC
TGCTAACTAGCTATGCGGAGGCAACCCTCCGTGGCCAGCTTCTTAGAGGGACTATGGCCGTTTAGG
CCACGGAAGTTTGAGGCAATAACAGGTCTGTGATGCCCTTAGATGTTCTGGGCCGCACGCGCGCTA
CACTGATGTATTCAACGAGTTTATAACCTTGGCTGACAGGCCCGGGTAATCTTATAAATTTCATCGTG
ATGGGGATAGATCATTGCAATTGTTGGTCTTCAACGAGGAATTCCTAGTAAGCGCGAGTCATCAGCT
CGCGTTGACTACGTCCCTGCCCTTTGTACACACCGCCCGTCGCTCCTACCGATTGAATGGTCCGGT
GAAGTGCTCGGATCGCGGC

Generation of Microbial Oil PUBLICATIONS FULL TEXT A Process Engineering Approach
M . A . M a s r i , 4
A waste free, microbial oil centered cyclic bio-refinery
approach based on flexible macroalgae biomass

M . A . M a s r i , 5

Contents lists available at ScienceDirect
Applied Energy
journal homepage: www.elsevier.com/locate/apenergy
A waste-free, microbial oil centered cyclic bio-refinery approach based onflexible macroalgae biomass
Mahmoud A. Masri, Wojciech Jurkowski, Pariya Shaigani, Martina Haack, Norbert Mehlmer⁎,Thomas Brück⁎
Department of Chemistry – Chair of Synthetic Biotechnology, Technical University of Munich, Lichtenbergstraße 4, 85748 Garching, Germany
H I G H L I G H T S
• Holistic valorization of unexploitedmarine biomass.
• Integrated production of plant likeyeast lipids, animal feed and biosor-bents.
• Enzymatic macroalgae liquefaction toobtain yeast cultivation media.
• Utilization of hydrolysis residues asprecious metal biosorbent.
• New, simple and rapid analysis toolsfor industrial lipid/ biosorption mon-itoring.
G R A P H I C A L A B S T R A C T
A R T I C L E I N F O
Keywords:Cyclic biorefineryMacroalgaeLaminaria digitataCutaneotrichosporon oleaginosusMicrobial oilBiosorbent
A B S T R A C T
Biofuels and the oleochemical industry are highly dependent on plant oils for the generation of renewableproduct lines. Consequently, production of plant lipids, such as palm and rapeseed oil, for industrial applicationscompetes with agricultural activity and is associated with a negative environmental impact. Additionally, es-tablished chemical routes for upgrading bio-lipids to renewable products depend on metal-containing catalysts.Metal leaching during oil processing results in heavy metal contaminated process wastewater. This water isdifficult to remediate and leads to the loss of precious metals. Therefore, the biofuels and chemical industryrequires sustainable solutions for production and upgrading of bio-lipids. With regard to the former, a promisingapproach is the fermentative conversion of abundant, low-value biomass into microbial, particularly yeast-basedlipids. This study describes the holistic, value-adding conversion of underexploited, macroalgae feedstocks intoyeast oil, animal feed and biosorbents for metal-based detoxification of process wastewater. The initial stepcomprises a selective enzymatic liquefaction step that yields a supernatant containing 62.5% and 59.3%(w/dwbiomass) fermentable sugars from L. digitata and U. lactuca, respectively. By dispensing with chemicalpretreatment constraints, we achieved a 95% (w/w) glucose recovery. Therefore, the supernatant was qualifiedas a cultivation media without any detoxification step or nutrition addition. Additionally, the hydrolysis stepprovided 27–33% (w/dwbiomass) of a solid residue, which was qualified as a metal biosorbent. Cultivation of theoleaginous yeast C. oleaginosus on the unprocessed hydrolysis supernatant provided 44.8 g L−1 yeast biomasscontaining 37.1% (w/dwbiomass) lipids. The remaining yeast biomass after lipid extraction is targeted as a per-formance animal feed additive. Selectivity and capacity of solid macroalgae residues as biosorbents were as-sessed for removal and recycling of rare and heavy metals, such as Ce+3, Pb+2, Cu+2 and Ni+2 from modelwastewater. The biosorption capacity of the macroalgae residues (sorption capacity∼ 0.7 mmol g−1) exceeds
https://doi.org/10.1016/j.apenergy.2018.04.089Received 5 January 2018; Received in revised form 14 April 2018; Accepted 27 April 2018
⁎ Corresponding authors.E-mail address: [email protected] (T. Brück).
Applied Energy 224 (2018) 1–12
Available online 03 May 20180306-2619/ © 2018 The Authors. Published by Elsevier Ltd. This is an open access article under the CC BY-NC-ND license (http://creativecommons.org/licenses/BY-NC-ND/4.0/).
T

that of relevant commercially available adsorption resins and biosorbents. To facilitate the integration of ourtechnology in existing chemical and biotechnological production environments, we have devised simple, rapidand cost-efficient methods for monitoring both lipogenesis and metal sorption processes. The application of thenew optical monitoring tools is essential to determine yeast cell harvesting times and biosorption capacitiesrespectively. For the first time we report on a waste-free bioprocess that combines sustainable, microbial lipidproduction from low value marine biomass with in-process precious metal recycling options. Our data allowedfor a preliminary economic analysis, which indicated that each product could be cost competitive with currentmarket equivalents. Hence, the synaptic nature of the technology platform provides for the economic andecologic viability of the overall process chain.
1. Introduction
The biofuels (i.e. biodiesel and biokerosene), oleochemicals (i.e.lubricants, surfactants and polymers) and the cosmetic sector are highlydependent on plant-derived triglyceride feedstocks to generate renew-able product lines [1]. Due to their high areal yields, favorable chemicalcomposition and low cost, palm and rapeseed oil are most desirablefeedstocks for these processes [2]. However, the production of theseplant-based lipids is associated with a negative ecological impact. Morespecifically, production of these chemical feedstocks competes withfood production, accelerates land use change in sensitive ecosystemsand thereby negatively impacts biodiversity [3]. By contrast, microbialoils generated from waste biomass streams within a bio-refinery settingpotentially enable the generation of a diversified and sustainable pro-duct portfolio that is not associated with a negative environmentalimpact.
More recently, residual marine biomass, such as algae and seagrass,receives increasing attention as feedstock in bio-refinery processes tosubstitute the limited availability of residual terrestrial biomass in
specific regions of the globe with dense populations and limited agri-cultural land (i.e. Germany, UK, Ireland, France, Japan, India, Malaysia,China) [4,5]. In this regard, macroalgae can expeditiously generatebiomass from carbon dioxide, sunlight and inorganic nutrients by effi-cient photosynthesis [6,7]. With their high photon conversion effi-ciency [7], seaweeds like Laminaria japonica can reach a productivity of1300 t ha−1 year−1 biomass, which is 6.5 times higher than the pro-ductivity of sugarcane [8]. Furthermore, macroalgae are able to grow ina wide diversity of environments including fresh-, salt-, temperate- andmunicipal wastewater [9]. However, the use of macroalgae in bio-technological processes – much like terrestrial biomass feedstocks –requires the chemical or biological hydrolysis of polymeric carbohy-drates that constitute the cellular matrix to release fermentable,monomeric carbohydrates. Previously, hydrolysis and liquefaction ofmacroalgae biomass has been demonstrated using chemical hydrolysis[10], chemo-enzymatic hydrolysis [11], biological degradation [12]and anaerobic digestion [13,14]. The resulting liquid hydrolysate hasbeen reported to be enriched in fermentable sugars or volatile fattyacids [13], to be used in bioenergy generation, encompassing biogas
Fig. 1. The cyclic bio-refinery concept based on flexible macroalgae biomass feedstocks. The processes shown within the blue dashed line represent the focus of thisstudy. All other processes are established at industrial scale and referenced throughout the text.
M.A. Masri et al. Applied Energy 224 (2018) 1–12
2

(methane) [14], bio-ethanol [15], acetone and bio-butanol generation[16]. In contrast, there are no value adding applications for the residualbiomass fraction, which remains after biomass hydrolysis. At present,the most widespread application for this hydrolysis residue is applica-tion as fertilizer [9,17].
The utilization of the sugar rich liquid fraction as a fermentationbase for generation of microbial oils has received increasing con-sideration [18,19]. In this application, designer bio-oils can be gener-ated, that depending on the fatty acid profile could provide a sustain-able resource for the production of high value pharmaceuticals, foodadditives, cosmetics, bio-lubricants or biofuels [20,21]. In that respect,microbial oils could directly substitute plant equivalents, such as palmoil, whose production is associated with land use change having a ne-gative impact on biodiversity and food production [22]. Finally, bio-mass-hydrolysate of the marine microalgae Scenedesmus sp. [23] andbeach-cast seagrass [5] have been demonstrated to be suitable fer-mentation substrates for yeast-based lipid production. The suitability ofmacroalgae hydrolysates for the fermentative generation of yeast oilshas not been demonstrated.
This high value outlet of the liquid fraction contrasts the low valueenergetic use of the solid fraction remaining after enzymatic biomasshydrolysis. Therefore, the development of alternative high value ap-plications for the solid residues that can be integrated in the bio-re-finery work flow is highly desirable. One such application is biosorp-tion, defined as passive uptake of molecules by biological matrices suchas non-living cells as opposed to bioaccumulation involving activemetabolism [24]. Marine macroalgae have been among the first bio-mass sources capable of binding high amounts of heavy metals,reaching capacities of 1.5 mmol g−1 [25]. Particularly, brown algaecontaining high amounts of alginate belong to the most studied bio-sorbing organisms [26]. Due to their growth performance and abun-dance (up to 16 million tons per year), brown algae are proposed to be apromising biosorbent [27]. Consequently, the development of biosor-bents has to follow a “low-tech” and “low-price” philosophy, which canonly be achieved by using inexpensive and abundant biomass residues.In a simplified model-process, desorption of biosorbents is not requiredsince the loaded biomass can serve for energy generation as well.
In this context, process water containing heavy metals, found in theelectronic, metal and chemical processing industries, poses a significantchallenge for purification and recycling processes [28]. In general,heavy metal contaminants are difficult to remove by conventionaltechnologies and potentially accumulate in the water column, wherethey are toxic to aquatic life [29]. Therefore, sustainable techniques forthe removal and recycling of heavy metal contaminants that maycontribute value to a bio-refinery set-up are in demand.
As chemo-catalytic processing of yeast triglycerides to end products,such as biolubricant and oleochemicals, potentially results in heavymetal (Ni, Cu, W, Pb, Pt, etc.[30]) contaminated wastewater streams,the solid residue was evaluated for its capacity to bind these metaltoxins. Surprisingly, we could demonstrate that hydrolysis residues areexcellent biosorbents, capable of opening avenues for in-process re-cycling of precious catalytic metals and simultaneous wastewater up-cycling. Moreover, the residual solid fraction could be a separate value-adding product stream, which can be employed in the recovery andrecycling of precious metals from mining waters or municipal wasteleachates respectively (Fig. 1). An important group among these metalsused in modern electronics are the lanthanides. Due to rising demandand unsustainable mining practices, they currently belong to the classof critical materials [31]. Rare earth metal recycling from waste streamsis rather poor amounting to only 1% in 2011 [32]. However, there aresome accessible resources, such as phosphogypsum leachate [33] andred mud [34] as the most prominent examples. As biosorbents areavailable at very low cost, it might be possible to process these residuestreams. To quantify the specific sorption capacity, we use cerium,treated here as a model for the lanthanide group. Our simple and rapidluminescence-based approach also allows to measure kinetics and
competitive biosorption in synthetic multicomponent solutions neces-sary for a reliable scale-up.
This study presents an entirely new cyclic bio-refinery conceptbased on flexible macroalgae biomass feedstocks. The assembly of valueadding unit operations demonstrated herein are highly interconnectedand interdependent, thereby eliminating any waste streams (Fig. 1). Forthe first time, we disclose optimized enzyme systems that enable se-lective, low energy hydrolysis of marine brown (Laminaria digitata) andgreen (Ulva lactuca) macroalgae biomass in the absence of physico-chemical pretreatment steps. The resulting liquid fraction, which isenriched in fermentable, monomeric sugars is applied as a fermentationbase for the high yield production yeast oil triglycerides using theoleaginous yeast Cutaneotrichosporon oleaginosus (ATCC 20509). Fer-mentations carried out in aerated Erlenmeyer flasks (250ml) andcontrolled stirred tank bioreactors (1L), demonstrated that C. oleagi-nosus can efficiently transform the chemically diverse macroalgae-de-rived sugar matrix into triglycerides, when a nutritional stressor wasapplied. In this context, a new staining-free flow cytometry-basedmethod has been developed, which indicates the exact onset and extentof lipogenesis in C. oleaginosus. This method is generally applicable totime onset of lipid biosynthesis in oil-forming yeasts and allows for theexact determination of harvesting times, which are essential for processoptimization in microbial oil-centered bio-refinery settings. While re-sulting yeast triglycerides are a “drop-in” feedstock for generation ofbioactive agents, oleochemical building blocks and biofuels, the re-sidual protein and carbohydrate rich yeast biomass can be used as an-imal feed. To close the mass balance of our cyclic bio-refinery conceptwe developed a new value-adding outlet for the solid residue fractionremaining after enzymatic macroalgae hydrolysis.
In summary, we present a completely new cyclic bio-refinery con-cept based on macroalgae biomass residues that has yeast oils as aprimary outlet coupled with animal feed and biosorbent production.The bio-refinery process does not compete with agricultural activity, isnot associated with land use change, is waste free and allows for in-process wastewater upgrading and metal recycling. Therefore, this set-up significantly contributes to the economic and ecologic efficiency ofoleochemical generation.
2. Martials and methods
2.1. Macroalgae sample sourcing
Two brown algae (Laminaria digitata) and one green algae (Ulvalactuca) sample were harvested from the western cost of Ireland inMarch and June 2013 (North Seaweed Ltd – Netherlands). The sampleswere washed thoroughly (with distilled water) to eliminate salt, sandand contaminants. Subsequently, samples were dried and grind down to≤0.5mm grain size using a Planetary Ball Mill – (Fritsch, Germany).
2.2. Enzymatic liquefaction of brown algae biomass
Enzymatic liquefaction of each L. digitata and U. lactuca samples wasconducted in acetate buffer (50.0mM, pH 5.0) containing 7–8% (w/v)biomass. Hydrolysis parameters were maintained at: 50 °C, stirring at400 rpm for 72 h. Enzymatic hydrolysis was conducted at 1 L for labscale. For technical scale, L. digitata was hydrolyzed at 30 L scale.
In this study, an admixture of the commercial hydrolase enzymepreparations Cellic CTec 2®, Cellic HTec®, Novozymes 188®,(Novozymes, Denmark), exo-Laminarase (Megazyme-France) and α-Amylase® (Sigma, Germany) was used for biomass liquefaction. In thecase of U. lactuca hydrolysis, the optimal enzyme admixture compriseda w/w ratio of 1.2: 0.3: 0.2: 0.0: 0.3 of the above enzyme preparationsrespectively. Analogously, the L. digitata, targeted hydrolase system wasadjusted to a w/w admixture of 0.3:1.3:0.2:0.2:0.0, respectively. Therespective enzyme admixture was dosed at total concentration of 2.0%(w/dwbiomass) for brown and green algae respectively.
M.A. Masri et al. Applied Energy 224 (2018) 1–12
3
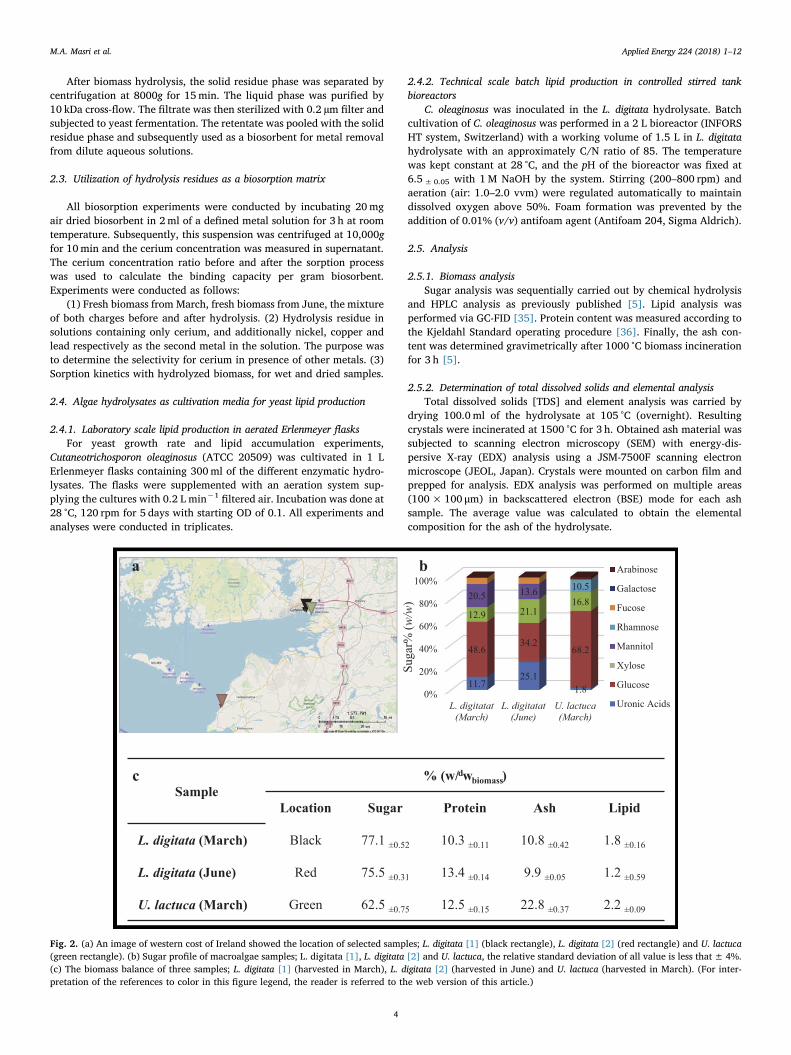
After biomass hydrolysis, the solid residue phase was separated bycentrifugation at 8000g for 15min. The liquid phase was purified by10 kDa cross-flow. The filtrate was then sterilized with 0.2 µm filter andsubjected to yeast fermentation. The retentate was pooled with the solidresidue phase and subsequently used as a biosorbent for metal removalfrom dilute aqueous solutions.
2.3. Utilization of hydrolysis residues as a biosorption matrix
All biosorption experiments were conducted by incubating 20mgair dried biosorbent in 2ml of a defined metal solution for 3 h at roomtemperature. Subsequently, this suspension was centrifuged at 10,000gfor 10min and the cerium concentration was measured in supernatant.The cerium concentration ratio before and after the sorption processwas used to calculate the binding capacity per gram biosorbent.Experiments were conducted as follows:
(1) Fresh biomass from March, fresh biomass from June, the mixtureof both charges before and after hydrolysis. (2) Hydrolysis residue insolutions containing only cerium, and additionally nickel, copper andlead respectively as the second metal in the solution. The purpose wasto determine the selectivity for cerium in presence of other metals. (3)Sorption kinetics with hydrolyzed biomass, for wet and dried samples.
2.4. Algae hydrolysates as cultivation media for yeast lipid production
2.4.1. Laboratory scale lipid production in aerated Erlenmeyer flasksFor yeast growth rate and lipid accumulation experiments,
Cutaneotrichosporon oleaginosus (ATCC 20509) was cultivated in 1 LErlenmeyer flasks containing 300ml of the different enzymatic hydro-lysates. The flasks were supplemented with an aeration system sup-plying the cultures with 0.2 L min−1
filtered air. Incubation was done at28 °C, 120 rpm for 5 days with starting OD of 0.1. All experiments andanalyses were conducted in triplicates.
2.4.2. Technical scale batch lipid production in controlled stirred tankbioreactors
C. oleaginosus was inoculated in the L. digitata hydrolysate. Batchcultivation of C. oleaginosus was performed in a 2 L bioreactor (INFORSHT system, Switzerland) with a working volume of 1.5 L in L. digitatahydrolysate with an approximately C/N ratio of 85. The temperaturewas kept constant at 28 °C, and the pH of the bioreactor was fixed at6.5±0.05 with 1M NaOH by the system. Stirring (200–800 rpm) andaeration (air: 1.0–2.0 vvm) were regulated automatically to maintaindissolved oxygen above 50%. Foam formation was prevented by theaddition of 0.01% (v/v) antifoam agent (Antifoam 204, Sigma Aldrich).
2.5. Analysis
2.5.1. Biomass analysisSugar analysis was sequentially carried out by chemical hydrolysis
and HPLC analysis as previously published [5]. Lipid analysis wasperformed via GC-FID [35]. Protein content was measured according tothe Kjeldahl Standard operating procedure [36]. Finally, the ash con-tent was determined gravimetrically after 1000 °C biomass incinerationfor 3 h [5].
2.5.2. Determination of total dissolved solids and elemental analysisTotal dissolved solids [TDS] and element analysis was carried by
drying 100.0ml of the hydrolysate at 105 °C (overnight). Resultingcrystals were incinerated at 1500 °C for 3 h. Obtained ash material wassubjected to scanning electron microscopy (SEM) with energy-dis-persive X-ray (EDX) analysis using a JSM-7500F scanning electronmicroscope (JEOL, Japan). Crystals were mounted on carbon film andprepped for analysis. EDX analysis was performed on multiple areas(100× 100 μm) in backscattered electron (BSE) mode for each ashsample. The average value was calculated to obtain the elementalcomposition for the ash of the hydrolysate.
0%
20%
40%
60%
80%
100%
L. digitatat(March)
L. digitatat(June)
U. lactuca(March)
11.725.1
1.8
48.634.2
68.2
12.9 21.116.820.5 13.6 10.5
Suga
r% (w
/w)
Arabinose
Galactose
Fucose
Rhamnose
Mannitol
Xylose
Glucose
Uronic Acids
Sample% (w/dwbiomass)
Location Sugar Protein Ash Lipid
L. digitata (March) Black 77.1 ±0.52 10.3 ±0.11 10.8 ±0.42 1.8 ±0.16
L. digitata (June) Red 75.5 ±0.31 13.4 ±0.14 9.9 ±0.05 1.2 ±0.59
U. lactuca (March) Green 62.5 ±0.75 12.5 ±0.15 22.8 ±0.37 2.2 ±0.09
b
c
a
Fig. 2. (a) An image of western cost of Ireland showed the location of selected samples; L. digitata [1] (black rectangle), L. digitata [2] (red rectangle) and U. lactuca(green rectangle). (b) Sugar profile of macroalgae samples; L. digitata [1], L. digitata [2] and U. lactuca, the relative standard deviation of all value is less that± 4%.(c) The biomass balance of three samples; L. digitata [1] (harvested in March), L. digitata [2] (harvested in June) and U. lactuca (harvested in March). (For inter-pretation of the references to color in this figure legend, the reader is referred to the web version of this article.)
M.A. Masri et al. Applied Energy 224 (2018) 1–12
4

2.5.3. Gravimetric analysis of yeast biomass and lipidsLyophilization was used to obtain dried yeast biomass.
Lyophilization was carried out for 2 days at -80 °C and 0.04mbar(Christ alpha 2–4 LD plus). For lipid extraction, cell destruction wasperformed with a high-pressure homogenizer (Mulsiflex C3, Avestine,Canada). After lyophilization, three times solvent extraction with Folchsolution was sequentially carried out. Then gravimetric lipid quantifi-cation was carried out using the Bligh-Dyer method [37]. The lipidprofile was assessed via GC-FID as described previously [5].
2.5.4. Flow cytometry-based cell countingCell counting via flow cytometry was carried out with a Bio-Rad S3
FACS (BioRad, Hercules, USA) equipped with 488 nm/ 100 mW laserbeam. The counting was conducted using 100 µl of sample after 100times dilution. The cell density diagram describes Side scatter [SSC] on“Y” axis and Forward scatter [FSC] on the “X”-axis.
2.5.5. Cerium concentration measurementSamples were first diluted 1:99 by mixing 50 µl with 4.95ml of
deionized water. The measurement was then performed in a multi well
plate with 100 µl diluted sample mixed with 100 µl buffer in each well.The buffer contained 100mM sodium acetate, 10mM copper (II),10mM nickel (II), and 10mM lead (II). The pH was adjusted to 5.0 withglacial acetic acid. For every series of measurements, a calibrationcurve consisting of 4 points (cerium: 2.5mM, 5mM, 7.5mM and10mM) was prepared the same way, as the samples. For measuringluminescence, a black quartz-glass 96-well microtiter plate manu-factured by Hellma Analytics (Germany) and an EnSpire 2 MultimodePlate Reader (Perkin Elmer, USA) were used.
The reliability of the luminescence-based cerium detection methodin presence of other metals has also been evaluated. To that end, tri-plicate samples with known copper concentration (10mM, 20mM and40mM) have been measured in the cerium concentration range 2.5 mMto 10mM. All datasets can be described by a global linear regressioncurve with very good coefficients of determination (R-square) of 0.985(Cu 40mM) 0.987 (Cu 20mM) and 0.992 (Cu 10mM). The data plotwith regression curve is depicted in the supplementary information(Supplementary Fig. 1S). The applicable limit for this method is about1mM cerium if interfering metals are present. For model samplescontaining only cerium the dilution factor can be decreased (until self-quenching occurs) leading to a limit of quantification (LOQ) at about0.62 µM with signals at 308 RFU compared to 193 ± 12 RFU for theblank (Supplementary Table 1S). Notably, all metal chelating/bindingagents should be eliminated from the assay solution. This was achieved,by repeated washing of the sample to eliminate any water-solublecomponents.
3. Results and discussion
3.1. Liquefaction of macroalgae biomass
Samples of brown macroalgae Laminaria digitata were harvestedfrom the western coast of Ireland in March (black rectangle) and June2013 (red rectangle), respectively (Fig. 2a). An additional sample of thegreen the macroalgae (Ulva lactuca) was harvested in March (greenrectangle) from the same location. The overall chemical composition ofthe algal samples was analyzed using a detailed biomass analysis(Fig. 2c).
While the brown algae displayed a carbohydrate content of up to75–77% (w/dwbiomass), the green algae samples showed a 62%(w/dwbiomass) carbohydrate content. Conversely, brown algae have lessinorganic ash in relation to green algae. Protein and lipid content showconvergent values in all samples. In spite of higher total sugar contentin the brown algae, the glucose content was higher in the green algae(Fig. 2.b). It should be taken into consideration, that glucose content isimportant for fermentation since it is the most preferable sugar formicroorganisms.
Seasonal sugar analysis of the L. digitata samples showed that thetotal sugar content is lower in June compared to the March batch.Moreover, the sugar profile showed considerable seasonal changes. InJune the L. digitata batch contains less glucose and mannitol, whichmay be correlated with a decrease in the cellulosic fiber and laminarin.On the contrary, an increase in uronic acids was detected in the Junebatch, which could indicate an increase of alginate in the cell wall(Fig. 2b). Interestingly, the fucose concentration remained constant inboth samples. In the case of U. lactuca glucose and xylose are the majorsugars. In addition, a considerable amount of rhamnose was detectedwhich could originate mainly from ulvan [38].
Independent of seasonal changes, glucose is the major carbohydratemonomer in the macroalgae hydrolysis supernatant. Therefore, glucosewas used as indicator of hydrolysis efficiency. The glucose concentra-tion was convergent in the first day of macroalgae hydrolysis (Fig. 3a).Thereafter, the difference in glucose release between samples is morepronounced. U. lactuca displays the highest glucose concentration fol-lowed by the March batch of L. digitata [1]. The synergistic effect of theoptimized enzyme system facilitates cell wall lysis within the first 24 h,
0
5
10
15
20
25
30
35
40
45
50
Glucose Xyl, Arb Mannitol Total
[Sug
ar] g
L-1
Sugar
L. digitata [1]L. digitata [2]U. lactuca
0
5
10
15
20
25
30
35
0 20 40 60 80
[Glu
cose
] g L
-1
Time [hours]
L. digitata [1]
L. digitata [2]
U. lactuca
a
b
Fig. 3. (a) The proportional increase of glucose over the enzymatic hydrolysistime of L. digitata [1] (blue), L. digitata [1] (red) and U. lactuca (green). (b) Thetotal sugar concentration at the final hydrolysate of L. digitata [1] (blue), L.digitata [1] (Red) and U. lactuca (green). (For interpretation of the references tocolor in this figure legend, the reader is referred to the web version of thisarticle.)
M.A. Masri et al. Applied Energy 224 (2018) 1–12
5

which enhanced the sugar release over the remaining two days of hy-drolysis. However, the total sugar composition showed different trends.The high amount of free mannitol in the brown algae samples, results inan overall higher concentration of total fermentable sugar in the L.digitata hydrolysate (Fig. 3b). The measured glucose and total fermen-table sugar concentrations in the enzymatic hydrolysate were consistentwith the biomass analysis. While, the glucose amount corresponds toalmost 95% (w/w) of theoretical glucose content in the respectivebiomass sample, the total fermentable sugar concentrations indicateyields of 62.5, 47.1 and 59.3% (w/dwbiomass) for dried L. digitata [1], L.digitata [2] and U. lactuca biomass respectively. The cumulative resultsindicate that with the exception of alginate and fucoidan, the sy-nergistic enzyme activities result in an almost holistic lysis of the cel-lulosic and laminarin biomass components.
Our current data on recoverable fermentable sugars exceeds pre-vious reports, where Laminaria japonica and Ulva lactuca were treatedchemically prior to the enzymatic hydrolysis, resulting in relativity lowglucose recovery compared to the theoretical yield [11]. Another reportdescribes a single enzyme treatment that also lead to a low hydrolysisefficiencies and sugar yields with green and brown macroalgae biomass[39]. Most interestingly, our enzymatic hydrolysis process was so effi-cient for recovery of fermentable sugars, that no thermochemical pre-treatment was required. To that end, the addition of laminarase, amy-lase and β-glucosidase significantly increased the sugar release. Moregenerally, macroalgae are more amenable to enzymatic hydrolysiscompared to terrestrial, lignocellulosic biomass resources (i.e. cerealstraw or forestry waste), as they do not contain lignin and most sugarpolymer are present in an amorphous and not a crystalline state [40].The lack of lignin and crystalline polymeric carbohydrates circumventsthe necessity of thermo-chemical pretreatments (i.e. steam explosion),which is associated with high energy expenditure and formation offermentation inhibitors [41].
In addition to the fermentable supernatant, enzymatic hydrolysisalso generates solid residue, which represent 27% and 32.5%(w/dwbiomass) for L. digitata [1] and U. lactuca respectively. The analysisof the solid residue indicated, that it contained significant amounts ofuronic acids, which are the main building blocks of alginate in additionto protein and inorganic components (i.e. CaCO3) (SupplementaryFig. 2S).
Prior to using the liquid hydrolysis phase for fermentation, a 10 kDAcross-filtration step was conducted. The processed liquid phase was alight yellow clear liquid, which was used for downstream yeast fer-mentation without further processing. The highly viscous fraction thatwas retained after the cross-filtration step was subjected to componentanalysis. The resulting data indicated that this retentate was composedof glucose, mannitol and fucose respectively (Supplementary Fig. 2S).Based on the significant concentrations of fucose and glucose, the mainsugar polymer remaining in the retentate was identified as fucoidan,which much like alginate is not accessible by commercial enzyme sys-tems. Hence, alginate-rich solid hydrolysis residue and the fucoidanrich cross-filtration retentate was pooled and subsequently used as abiosorbent for metal removal from dilute aqueous solutions.
3.2. A cyclic biorefinery concept based on macroalgal biomass
3.2.1. Fermentative conversion of the liquid macroalgae hydrolysates toyeast oils
Sustainable bio-oil production from yeast is considered as the nextgeneration source for triglycerides replacing plant-base lipids, in re-newable chemical, cosmetic and pharmaceutical processes [21]. Theapplication of oleaginous yeasts, such as C. oleaginosus, in a biorefinerysetting has significant advantages over alternative microorganisms asthey can rapidly grow to high cell density cultures with a biomassproductivity of 2.18 g L−1 h−1 [42]. Moreover, oleaginous yeasts havethe metabolic capacity to accumulate in excess of 75%(wtriglycerides/dwbiomass) intracellularly, when nitrogen limiting
conditions are applied [43]. The significant advantage of yeast oils overtheir plant equivalents is that they can be produced at the same yieldand quality without seasonal variation. In contrast to industrial palmoil, microbial oil production does not negatively impact agriculturalactivity, food production or biodiversity as it does not induce land usechange [22].
To test the suitability of macroalgae hydrolysates as feedstock, theoleaginous yeast C. oleaginosus was cultivated in each of the macroalgaehydrolysates as the sole fermentation medium. Results were comparedto growth experiments conducted with artificial control media, whosechemical composition resembled the respective macroalgae hydro-lysates.
The artificial control media were classified based on the nitrogencontent into two categories; model complete hydrolysate and nitrogen-limited hydrolysate. The designed complete hydrolysates (model greenalgae and model brown algae hydrolysates) contained the C/N, C/S andC/P ratios as measured in the original brown or green macroalgae hy-drolysates. By contrast, the nitrogen-limited hydrolysates (minimalgreen algae and minimal brown algae hydrolysates) featured a high C/N ratio (130–150) to induce lipogenesis. All components of nitrogen-limited hydrolysates were equivalent to earlier reports [44] with theexception of the sugar content. To ensure comparison of the artificialmedia to the original algae hydrolysates, the sugar profile was com-parable to original algae hydrolysates.
During the first two days, the biomass formation and growth rate inall artificial media was comparable to typical cultivation in minimalmedia [5]. At the same time interval, the growth on real macroalgaehydrolysates was rather low. Unexpectedly by the third day, the growthrate in real hydrolysates showed a sharp increase, which exceeded thatof all other media. At the end of the fermentation, the biomass yield ofthe real hydrolysate was considerably higher than in artificial media(Fig. 4a).
More specifically, L. digitata showed a growth inhibiting activityagainst four various bacterial or fungal species [45,46]. Interestingly,the antimicrobial natural product furaltadone was recently isolatedfrom U. lactuca. To that end, changes in the yeast growth tendency overthe first five day of fermentation using real and model hydrolysatescould be attributed to an adaptive process of C. oleaginosus towardspotentially cytotoxic hydrolysate compounds. The efficient adaptationof C. oleaginosus to these toxic components is then reflected in the rapidexponential growth phase observed from day three onwards. To thatend, it is well documented that microorganism, such as oleaginousyeasts can adapt to toxic compounds contained in fermentation broth ina time dependent manner by switching on expression of detoxifyingenzyme systems [47,48].
Yeast growth in model green algae hydrolysate has shown a slightsuperiority compared to model brown algae hydrolysate. This could beattributed to the high glucose content in model green algae hydrolysate,which is a most preferable sugar source for C. oleaginosus. By contrast,the real L. digitata hydrolysate (March batch, [sample 1]) showed asignificantly higher biomass production (35.4 g L−1) than the corre-sponding U. lactuca hydrolysate (28.9 g L−1). In contrast, the L. digitatahydrolysate [2] (June batch [sample 2]) showed even lower biomassproductivity (25.9 g L−1).
Gravimetric lipid analysis showed 34 and 22% (w/dwbiomass) pro-duced biomass in L. digitata [1] and U. lactuca hydrolysates respectively(Fig. 4.b). It is noteworthy that this difference in lipid accumulation byyeast cells on different algae hydrolysates could additionally be con-firmed by the microscopic imaging (Supplementary Fig. 3S). In thatrespect, intracellular lipids bodies could be detected in cells grown onbrown algae hydrolysates. Specifically, yeast cells grown on originalalgae hydrolysate displayed an enlarged vacuole (SupplementaryFig. 3S). These results display the superiority of L. digitata [1] over U.lactuca hydrolysate as feedstock for oleaginous yeast C. oleaginosus.
With regard to the inhibited lipogenesis on U. lactuca hydrolysate,we suggest that the effect may be due to the presence of biologically
M.A. Masri et al. Applied Energy 224 (2018) 1–12
6

active steroids in the green algae biomass such as 3-O-β-D glucopyr-anosyl-stigmasta-5,25-dien. This compound has been reported to haveantimicrobial activity in the yeasts Saccharomyces cerevisiae andKluyveromyces lactis [49].
In 2014, alginate from Laminaria japonica was fermented underanaerobic conditions to obtain volatile fatty acids [50]. The volatilefatty acids were consequently used as a carbon source for C. oleaginosus,for production of yeast triglycerides. In this set-up, a very low lipidproductivity [Biomass: 4 g L−1, contains lipid 48% (w/w)] was recorded[50]. Therefore, the data obtained in this study supersedes all previousdata for biomass formation and total lipid yield with respect to olea-ginous yeast fermentation. This can be attributed to the direct use ofsugar rich liquid hydrolysates instead of volatile fatty acids as the yeastcarbon source.
Based on the initial flask cultivations, L. digitata hydrolysate wasdeemed the best candidate for biomass and lipid production at 30 Lscale. Hence, the brown algae hydrolysate was produced in scale of 30 Lby enzymatic hydrolysis of L. digitata. The used biomass [2.4 kg–8.0%(w/v)] was a mixture of 1.9 kg from the March batch L. digitata [1] and0.5 kg of June batch L. digitata [2]. After 72 h of incubation with theoptimized enzyme solution, centrifugation followed by 10 KDa cross-flow filtration was performed in order to obtain a clarified liquid hy-drolysate. The remaining solid residues were subjected to downstreambiosorption assays. The resulting brown algae hydrolysate containedtotal 52 g L−1 fermentable sugars and 0.45 g L−1 total nitrogen re-sulting in a C/N ratio of 76.5 (Table 1). This C/N ratio is within the
reported limits for lipid induction in oleaginous yeasts [21,51].Without any nitrogen supplementation or external glucose feeding,
the L. digitata hydrolysate was used in a 2 L scale fermentation of C.oleaginosus. As reported previously, respiration activity represented inpO2 value was used as an indicator for the end of the fermentation. Tothat end, the fermentation was stopped at 120 h, when the pO2 returnedback to the saturation value. Biomass dry weight and cell count wereused to monitor the growth. According to OD600 and dry weight, theexponential phase was terminated after 48 h of fermentation but flowcytometry measurements indicated that the cell saturation phase wasalready reached 20 h earlier (Fig. 5a). Lipid analysis showed an increasein the rate of lipid accumulation in the last two days of the fermentation(Fig. 5b). Under the applied conditions, 44.8 g L−1 yeast biomasscontaining 37.1% (w/dwbiomass) lipids was obtained. Therefore, our totallipid of 16.5 g L−1 obtained with macroalgae hydrolysate is slightlyhigher than lipid yields obtained with Cutaneotrichosporon fermenta-tions using corn cob (12. 3 g L−1 lipids) and rice straw (11.5 g L−1)hydrolysate respectively [52,53]. Moreover, our previous work re-ported an equivalent C. oleaginosus fermentation using a crude hy-drolysate of the seagrass P. oceanica as feedstock. In this context, wecalculated a biomass-to-lipid conversion of 0.20 g g−1, which is exactlythe same as with brown algae in the current study [5].
The yeast triglycerides obtained in the current study have a similarcomposition to plant derived rape and palm oils, with oleic and palmiticacid being the dominant fatty acids (Supplementary Fig. 4S). Therefore,the yeast oil obtained in this study can be regarded as a direct substitutefor plant oils in chemical processes [54]. In contrast to the plantequivalents, the yeast oils would have no impact negative on land usechange, biodiversity or food production per-se. Moreover, they can beproduced at consistent qualities, as their production process is not af-fected by environmental factors.
Detailed biomass analysis indicates that the residual yeast after lipidextraction contains about 15% (w/w) proteins and 85% (w/w) carbo-hydrates. Supplementary Fig. 5S depicts the sugar profile of the yeastresidual biomass, mainly contains glucose and mannose. In addition,rhamnose and glucuronoxylomannan have been reported to be themain carbohydrate polymers of the Cutaneotrichosporon sp. [55]. No-tably, previous studies confirm that mannan oligosaccharides containedbiomass are excellent performance additives in weanling pigs feedformulations. In fact, MOS is considered as an alternative to an anti-microbial agent carbadox [56]. Therefore, we suggest that yeast cellresidues obtained after oil extraction could be used as a performanceadditive in animal feed.
3.2.2. High through put monitoring of yeast lipogenesis by flow cytometryRapid measurements of the onset and extent of yeast lipogenesis is
essential of in-process monitoring of yeast oil production and de-termination of harvesting times. Current methods either rely on gravi-metric measurements or are depend on differential staining of lipid
0
10
20
30
40
50
60
70
80
0 1 2 3 4 5 6 7
OD
600n
m
Time [Day]
L. digitata [1] (real) L. digitata [1] (minimal-N) L. digitata [1] (model)U. lactuca (real)U. lactuca (model)U. lactuca (minimal-N)L. digitata [2]
a
b
0
10
20
30
40
50
60
Lipi
d %
(w/d w
biom
ass)
Hydrolysates
Fig. 4. (a) The increase of the optical density over the fermentation time of RealL. digitata [1], L. digitata [2] and U. lactuca and Model L. digitata [1] and U.lactuca and Minimal L. digitata [1] and U. lactuca. (b) The percentage of accu-mulated lipid by the dry biomass after 120 h of fermentation of real L. digitata[1] and U. lactuca and model L. digitata [1] and U. lactuca and minimal L. di-gitata [1] and U. lactuca.
Table 1The chemical analysis of L. digitata hydrolysate.
Material Concentration (gL−1)
Material Concentration (g L−1)
Glucose 32.1 Nitrogen asNO3/NO2
0.15
Mannitol 12.2 Protein 1.56Xylose 7.6 Phosphate (as
PO3−3)
0.6–2
Total Carbon 34.4 Total Sulfate(as S)
0.23
Total Nitrogen 0.45 Metal Ions Na+, K+, Fe+2, Ca+2,Mg+2, Mn+2, Sr+2
Nitrogen asNH4
0.25
aThe relative standard deviation of all value is less that± 5%.
M.A. Masri et al. Applied Energy 224 (2018) 1–12
7

bodies inside the yeast cells. Both methods are destructive, time con-suming and they do not offer sufficient and information about cellularstate of the culture. Additionally, many factors, such as cell size var-iation with phase of growth (lag, log, stationery), dead cell, shape of thecell, high cell density, chemicals and hydrophobic metabolites, canoverlapped with obtained data causing under- or overestimation ofbiomass and lipids.
Therefore, rapid optical methods that could accurately determinethese critical process parameters without destroying the sample wouldbe a critical advantage when focusing on microbial oil centered bior-efinery settings.
To that end, flow cytometry is an electro-optical-based technologyable to analyze thousands of particles per second. Forward scatter [FSC]and side scatter [SSC] provides analysis of detailed cell features such ascell size and cell granularity respectively [57]. Previously, flow cyto-metry in combination with the Nile Red staining, has been used toquantify the intracellular lipid content of different microalgae [58,59]and the oil forming in some yeast like Rhodotorula glutinis [60]. Prac-tically, we noted that lipid body staining in yeast cells by hydrophobicdyes such as Nile Red or Sudan black can be significantly affected bystaining time, yeast type, lipid content and growth phase. Additionally,this effect significantly increased when the yeast cell has a rigid wall asin the case of C. oleaginosus [61]. Therefore, staining procedures do notoffer reproducible assay results.
It is essential for any fermentative process to have an instantaneousassay method capable of monitoring the biomass, growth and lipidaccumulation to gain instant feedback on the fermentation status.
During our microscopic assessments of the culture progress, we
noted that both size and granularity of the yeast cells increased pro-portionally with the intracellular lipid content. Based these observa-tions, flow cytometry-based parameters FSC and SSC vs lipid contentwere measured at same time intervals.
Fig. 6 shows the cell density plot integrated with the histogram ofthe FSC and SSC on X and Y axes respectively. At the starting point ofthe fermentation, the FSC histogram showed a wide cell distribution. Attime point of 42 h, this distribution increasingly focused and movedtowards a larger cell size. At the same time point, the cell count andbiomass formation reached the saturation phase due to nitrogen de-pletion. Moreover, two populations could be distinguished in our flowcytometry experiments: A small population (P2) which newly appearedat the higher FSC and SSC in addition to the main plot (P1). Withprogressing fermentation, the FSC histogram of P1 was shifted towardshigher size value. Later on, a third population (P3) was generated at thelower FSC and SSC.
With respect to the side scatter [SSC] values started sharp as the C.oleaginosus has an oval cell shape. With time; the SSC values becameprogressively boarder and moved to higher values, which indicated anincrease in the cellular granularity. Most interestingly, this data in-dicated that cell granularity increases proportionally with increasinglipid content. This suggests, that the cell granularity is a direct indicatorof the cellular lipid content.
According to the gravimetric assay, the changes in lipid contentwere about 19% from 18 to 37 (w/dwbiomass)). These changes couldremarkably be measured instantly by monitoring the FSC and SSC inour flow cytometry experiments. Additional experiments have demon-strated, that the FSC and SSC can exceed the value 10+3 of the loga-rithmic FSC, if the lipid content rose to about 75% (w/dwbiomass).Moreover, microscopy confirmed that cells with 75% (w/dwbiomass) lipidhave remarkably larger sizes and almost a spherical shape(Supplementary Fig. 6S). In summary, flow cytometry-based on FSC andSSC data can be used for the rapid, non-invasive determination of theonset and extend of yeast lipogenesis. For the first time, this methodprovides for the rapid in-process monitoring of key parameters con-trolling oleaginous yeast cultivation progress and harvesting points. Inaddition, flow cytometry data provides information about possibleculture contaminations and cell integrity.
In conclusion, flow cytometry presents on-time dynamic informa-tion for the vitality of the yeast. Nevertheless, gravimetric analysis andoptical density are still necessary to quantitatively evaluate the overallfermentation but in conjunction with flow cytometry results and thesedata sets become more accurate and versatile. Moreover, the new flowcytometry-based method presented herein could enhance rapid andnon-invasive lipid quantification. However, this process would requiremore monitoring for the yeast cultures at different conditions. Finally,this flow cytometry method allows fast evaluation in the case of mediaoptimization or screen for best lipid producer from a mutation library.This high throughput methodology for monitoring in-process yeast li-pogenesis is generally transferrable to other oleaginous organisms in-cluding lipid forming bacteria and other yeast species.
3.2.3. Solid residue as metal sorbentTo enable rapid screening of biosorbent metal binding capacities we
developed a new luminescence-based method, which is reported in thecontext of this manuscript for the first time. The new screening meth-odology developed herein is based on the concentration dependentbroadband cerium luminescence at approx. 365 nm when excited at269 nm. The cerium luminescence is quenched when its concentrationis in high concentrations (auto-quenching mechanism) or when someother metal ions are present in the solution. The latter quenching me-chanism depends on the concentration as well as species of the re-spective metals. However, small changes of heavy metal concentrationsdo not have a measurable effect on the cerium luminescence. Themethod developed herein applies this observation. Therefore, dilutedsamples in a buffer containing high and defined concentrations of heavy
0
5
10
15
20
25
30
35
0
10
20
30
40
50
60
0 20 40 60 80 100 120
[Sug
ar] g
L -1
[Bio
mas
s] g
L -1
Cultivation Time (h)
[Biomass] [Glucose]
[Mannitol] [Xylose]
050
100150200250300350400450500
Cel
l Cou
nt x
105
Cell Count
0
5
10
15
20
25
30
35
40
45
0 24 42 48 66 72 90 96 120
Lipi
d %
(w/w
)
Cultivation Time (h)
Lipid [% w/dwbiomass]
[Lipid] g/l
a
bLipid% (w/dwbiomass)[Lipid] g L-1
Fig. 5. Fermentation profile and lipid accumulation during 120 h of cultivationin 2 L bioreactor. (a) The cell count, dry biomass, optical density and con-suming of fermentable sugar of the mixed L. digitata biomass. (b) The percen-tage of accumulated lipid and lipid productivity over the fermentation time inthe mixed L. digitata hydrolysate.
M.A. Masri et al. Applied Energy 224 (2018) 1–12
8

metals are used to gain high fluorescence photo efficiency with con-trolled quenching. The molarities were chosen so, that a slight changeof cerium concentration proportionally affects the luminescence, whilea slight change in the alternative heavy metal concentration (if thesample contains metals other than cerium) only has marginal effects onthe cerium luminescence. Furthermore, buffering with sodium acetateensures a constant pH value for the measurement and stable com-plexation of heavy metal ions independent of the sample. The currentmethodology allows for the first time a rapid determination of the metalsorption capacity of any biological material.
The most important parameter of every sorbent is its loading (orsorption) capacity, indicating how much sorbate can be accumulatedper gram of the sorbent. All four tested samples of L. digitata showed avery similar cerium sorption capacity at a fairly high level of about0.60mmol g−1 (84mg g−1). The raw biomass without hydrolysis per-formed only insignificantly better reaching 0.67mmol g−1 (Table 2a).This suggests that the concept of residue valorization through bio-sorption is valid. In addition to a pooled and standardized brow algaeresidue, charges from different seasonal samples used for the hydrolysiswere tested. In that respect, the batch harvested in March showed lesscerium sorption capacity (sorption capacity: 0.58mmol g−1) than thesecond batch (sorption capacity: 0.67mmol g−1) harvested in June. Asalginate is well characterized metal biosorbent [62] and the alginatewas higher in the June than in the March batch (Fig. 2b), the highercerium sorption capacity of the former may be related to the higheralginate content (Fig. 2b). This was supported by our control experi-ment were we determined the cerium sorption capacity of pure sodiumalginate to be approximately 0.85mmol g−1. The data indicates thatalginate may contribute the majority of sorption capacity in the mac-roalgae residue, while fucoidan has a minor role in this respect.
An ideally selective sorbent would bind its preferred metal up to itsfull sorption capacity regardless of the complexity of the solution it isused for. In reality, other ions generally hold influence on the sorptioncapacity of the metal in question – in this case cerium. A completelyunselective sorbent (i.e. with binding spots suitable for all ions equally)
would sequester metal ions proportionally to their concentration.Therefore, we measured the sorption capacity for cerium in the pre-sence of potentially competing ions, including copper, lead and nickel(Table 2b). Compared to the control (only cerium in solution) a sig-nificant loss of cerium binding capacity was observed, when othermetals were present in solution. Mechanistically, the competing ionsare likely to occupy similar binding positions on the brown algae bio-sorbent thereby limiting the specific cerium sorption. With respect tolead the specific cerium binding capacity decreases to about one half.Interestingly, this situation is observed for the solid brown algae residueas well fresh unhydrolysed brown algae biomass.
However, the unhydrolysed biomass displays a higher selectivity,when nickel or copper instead of lead are present. By contrast, the solidhydrolysis residue appears to be less selective towards cerium sorptionwhen competing metals are present in solution. Considering thatequimolar amounts of both metals were present in each assay, we canconclude, that fresh biomass shows following selectivity:Pb=Ce > Cu > Ni. The hydrolysis residue is less selective having an
18h 24 h 42 h
48 h 72 h 120 h
FSC FSC FSC
SSC
SSC
P2P1
P2P1
P3
Fig. 6. Flow cytometry-based characterization of C. oleaginosus during 120 h of cultivation from samples of the 2 L bioreactor with mixed L. digitata hydrolysate. Thecell density plot diagrams are showing intensity of the forward scatter [FSC] and side scatter [SSC].
Table 2(a) Sorption selectivity: comparison of raw L. digitata and residual biomass afterhydrolysis. Shown is the sorption capacity for Ce when a second metal (Cu, Ni,Pb) is present in the solution (b) Sorption capacity of L. digitata raw biomassfrom both batches and of the hydrolysate.
(a) Sorption selectivity of [Ce+3] as mmol g−1 for L. digitata [Mixed] in the present of:10mmol [Cu+2] [Ni+2] [Pb+2] No AdditionOriginal
Biomass0.36±0.053 0.51±0.019 0.27±0.008 0.68±0.009
Hydrolysisresidues
0.25±0.011 0.38±0.063 0.26±0.019 0.62±0.041
(b) Total sorption capacity of [Ce+2] of Hydrolysis residues:Hydrolysis
residuesMarch Batch June Batch Mixed
BiomassOriginalBiomass
[Ce+3] as mmolg−1
0.59±0.025 0.67±0.005 0.62±0.041 0.68±0.009
M.A. Masri et al. Applied Energy 224 (2018) 1–12
9

apparent metal selectivity series of: Pb=Ce=Cu > Ni. Therefore, thehydrolysis residue is not usable for selective biosorption of cerium orother lanthanides from complex solutions. However, the hydrolysisresidue represents a cost effective biosorbent for the general removal ofmetals from dilute solutions. A performance comparison between purealginate and the brown algae hydrolysis residue (SupplementaryFig. 7S) indicates, that the loss of this component is probably re-sponsible for lower selectivity towards cerium. In that respect, thesorption selectivity of the pure sodium alginate control has been de-termined as: Ce > Cu > Pb > Ni. In conclusion, the brown algaehydrolysis residue may serve as an effective sorption material for thegeneral removal of heavy metals from aqueous solution and thereforecould serve for process water upgrading in a cyclic biorefinery settingdiscussed here.
The second most important parameter to assess biosorption per-formance is the determination of sorption kinetics. This parameterprovides a quantitation of the biomass contact time in metal containingsolutions. From a technical perspective, the sorption kinetics is essentialfor the determination of required size and cost of respective biosorptionreactors. To that end, we have tested both air dried (60 °C) and wetbiomass samples originating directly from the hydrolysis step (Fig. 7).Slight differences in sorption kinetics were observed only within firstthree minutes. After that time the dried biomass completely resembledthe wet samples, and no further points were measured.
The wet biomass bound the metals immediately after submersionand has a lag phase for the subsequent 10min. Thereafter, a more stablebinding period was observed, where the maximum loading capacitywas reached between 30 and 100min. By contrast, the dry brown algaehydrolysate residue required more time for the first phase, while itsoaked with water, and began biosorption. In general the sorption rate(about 9.2 µmol g−1 min−1) is fairly slow, as compared to green mi-croalgae reaching 90% of maximum capacity already after few minutes[63]. Although, the maximum capacity of hydrolysis residue is sig-nificantly higher.
More generally, the cerium-based method for characterizing themetal sorption behavior of macroalgae residues is directly applicable toother bio-based metal sorption materials, such as microalgae biomass[64].
3.3. Economic evaluation of the L. digitata biorefinery system
Currently, the biofuels and oleochemical industry predominantlyrelies on the use of rapeseed and palm oil for biofuels and renewablechemical production. Particularly, production processes of palm oilhave significant negative impact on the ecosystem, leading to defor-estation and an associated reduction in biodiversity. As an alternative,the generation of microbial oils from terrestrial or marine waste bio-mass represents a scalable route for production of renewable oils tar-geted at the biofuels and chemicals industry without impacting theenvironment [65]. In that regard, the fermentative conversion of wastebiomass hydrolysates via oleaginous yeasts, such as C. oleaginosus iseconomically most promising [5]. However, hydrolysis of chemicallycomplex waste biomass often results in solid residues (i.e. lignin orunhydrolyzed sugar polymers) with limited technical applicability,which are either burned to generate process energy or used as simplefertilizer [9,17]. Therefore, these residues do not contribute to theeconomic viability of the bioprocess. Moreover, chemical yeast oil up-grading to fuels and chemicals may result in the environmental releaseof heavy metal contaminated process water, which negatively impactsthe ecological footprint of the process [30]. To address the issue ofeconomic and ecologic viability this study presents a new, waste-free,cyclic bio-refinery process focusing on the holistic conversion of marinemacroalgae biomass for the generation of yeast based lipids and abiological metal sorbent that is capable to extract heavy metals fromprocess water.
We have developed a selective liquefaction of macroalgae biomass
using an optimized enzyme system, which provided a liquid phase thatcontained fermentable sugars. The liquid phase was used for cultivationof the oleaginous yeast C. oleaginosus, which achieved high biomassyields compared to artificial control media. The obtained microbial li-pids can be converted to a variety of high value platform chemicals forthe renewable manufacturing of oleochemicals, bio-lubricant or bio-fuels by established chemical procedures [20]. After lipid extraction,analysis showed that residues yeast biomass can be used as animal feed(Fig. 1).
Most recently, a techno-economic evaluation of a macroalgae-basedbiogas and bioethanol production facility has been reported [17]. Inthis process, the biogas digestate was applied for thermic electricityproduction or it can be used as animal feed. This study demonstratedthat due to the low price for bioethanol and biogas, a scale of680,000 t year−1 of dry macroalgae biomass would be required torender the process economically viable [17]. However, we have appliedour previous calculations that demonstrated that a fermentationmedium based on marine biomass hydrolysates would cost about $0.11L−1 [5]. Whereas, the crude yeast oil product could reach costs$5.5–7.3 kg−1 [5,66] based on the applied process. However, the crudeyeast oil could be processed to high-value products, such as perfor-mance oleochemical ingredients targeting biolubricant, cosmetic andpharmaceutical industries[67]. These applications would justify therelatively high-cost of the fermentative processes. Moreover, this costwill be partially recovered, if the profits generated by utilizing the yeastbiomass as animal feed and solid macroalgae residues as biosorbentsare taken in consideration.
We have demonstrated that the solid macroalgae residue is able torecover about 0.6mmol g−1 of heavy metals per dry biomass. For ex-ample, if lead is used as metal to be removed from wastewater, thebinding capacity would be 124mg g−1 dry biomass. This impressivecapacity exceeds commercially available resins such as Amberlite® IRC-718 with a capacity of only 20mg g−1 [68] at a cost of approx.$92 kg−1 (http://en.chemmerce.com/chemicals/21312-54423/).Nevertheless, a direct comparison might be misleading, because syn-thetic resins offer greater long-term stability and no variability ofbinding capacities as opposed to products of biological origin. All thishas been considered when marketing a similar algae based product, theAlgaSORB®, which is sold for approx. $1.5 kg−1. Although the sorptioncapacity of this product is not published, it is based on Chlorella sp.(eukaryotic green algae) and Arthrospira sp. (cyanobacteria) cells. Tothat end, it is reported, that the biosorption potential of brown algae ismore than double of both green microalgae and cyanobacteria respec-tively. Therefore, brown macroalgae derived biosorbents could bemarketed at an even higher price.
Fig. 7. Sorption kinetics of L. digitata residual biomass after hydrolysis for dryand wet biomass.
M.A. Masri et al. Applied Energy 224 (2018) 1–12
10

4. Conclusion
In this study we have selected marine green (U. lactuca) and brown(L. digitata) macroalgae biomass as process feedstocks, as their pro-duction has no negative impact on agricultural activity or the en-vironment but provides higher biomass yields than the most favorableterrestrial crops. For the first time, we established a highly efficientenzymatic hydrolysis process that converts 62.5% (L. digitata) and59.3% (U. lactuca) of the total biomass into soluble fermentable sugarmonomers. In addition to the total sugar yield, we focused on theoverall glucose yield as this sugar is most effectively metabolized by ouroleaginous yeast strain. To that end, we actually obtained a glucoserecovery of 95% (w/w) with respect to the dry macroalgae biomassfeedstock. The high sugar recovery was essential for qualifying themacroalgae hydrolysis supernatant as a sole fermentation mediumwithout further additives. In contrast to other biomass feedstocks, ourenzymatic liquefaction of macroalgae feedstocks did not require anythermo-chemical pre-treatment, which generally is energy (cost) in-tensive and results in generation fermentation inhibitors, such as fur-fural. Processing of the hydrolysate resulted in a solid residue fractioncontaining both alginate and fucoidan polymers, which were success-fully applied as an efficient metal biosorbent. By contrast, the super-natant served as the sole fermentation base for cultivation of theoleaginous yeast C. oleaginosus. The laboratory process was validated attechnical scale of 30 L in a controlled bioreactor setting. Under theseconditions, a biomass yield of 44.8 g L−1 yeast biomass containing37.1% (wlipids /dwbiomass) was achieved. To enhance the economic via-bility of the process we suggest to use yeast biomass obtained in theprocess of lipid generation as a performance animal feed additive due toits favourable cell wall sugar composition. Moreover, the integratedproduction and use of a macroalgae-based biosorbent significantly en-hances the ecological footprint of chemical process steps conventionallyinvolved in renewable lipid upgrading to biofuels and oleochemicals.Furthermore, the application of biosorbents can be diversified to therecovery and recycling of precious metals (Loading capacity of0.679mmol g−1; with selectivity to Pb=Ce=Cu > Ni), such as lan-thanides, from industrial and mining wastewater sources. To ourknowledge this is the first account of a bioprocess assembly that de-monstrates the production of microbial oil in conjunction with processwater remediation options. To facilitate integration of our technologyplatform in a conventional industrial production setting, we have de-vised simple, rapid and selective optical control methodologies formonitoring lipid productivity and metal sorption efficiencies with cost-efficient equipment. Specifically, we developed a new, flow cytometry-based method for determining the onset and extent of lipid biogenesis,which is essential to optimize harvest timeframes. Analogously, aspectrophotometric, cerium-based for metal sorption monitoringmethodology was developed as a tool to control waste upcycling andremediation within the process chain.
In summary, we devised a zero waste bioprocess where every pro-duct outlet (microbial lipid, biosorbent and animal feed additive) isassigned a significant value in a diversified market scenario. A pre-liminary economic analysis of the reported process chain, indicated thateach product is in the range to be cost competitive with current marketequivalents. This synaptic nature of these biotechnological processesprovides for the economic and ecologic viability of the overall processchain.
Acknowledgements
TB gratefully acknowledges support of the Werner SiemensFoundation for establishing the field of Synthetic Biotechnology at theTechnical University of Munich. MM, MH and TB acknowledge fi-nancial support by the German Federal Ministry of Education andResearch for supporting the “LIPOMAR” [grant number: 031A261] and“Advanced Biomass–Value” [grant number: 03SF0446A] projects.
Information concerning the Advance biomass projects can be obtained:http://www.ibbnetzwerk-gmbh.com/de/service/pressebereich/pm-06052013-advanced-biomass-value/. NM and TB also acknowledge fi-nancial support for the project “Resource efficient production processesfor polyhydroxybutyrate-based biopolymers” of the Bavarian StateMinistry for Environment and Consumer Protection [StMUV, grantnumber TLKO1U-69045]. WJ and TB also acknowledge financial sup-port for the project within the framework of “For Cycle” Project group.
Appendix A. Supplementary material
Supplementary data associated with this article can be found, in theonline version, at http://dx.doi.org/10.1016/j.apenergy.2018.04.089.
References
[1] Mekhilef S, Siga S, Saidur R. A review on palm oil biodiesel as a source of renewablefuel. Renew Sustain Energy Rev 2011;15:1937–49.
[2] Basiron Y. Palm oil production through sustainable plantations. Eur J Lipid SciTechnol 2007;109:289–95.
[3] Wicke B, Sikkema R, Dornburg V, Faaij A. Exploring land use changes and the roleof palm oil production in Indonesia and Malaysia. Land Use Policy2011;28:193–206.
[4] Jung KA, Lim S-R, Kim Y, Park JM. Potentials of macroalgae as feedstocks forbiorefinery. Bioresour Technol 2013;135:182–90.
[5] Masri MA, Younes S, Haack M, Qoura F, Mehlmer N, Brück T. A seagrass basedbiorefinery for generation of single cell oils targeted at biofuel and oleochemicalproduction. Energy Technol 2018.
[6] Wei N, Quarterman J, Jin Y-S. Marine macroalgae: an untapped resource for pro-ducing fuels and chemicals. Trends Biotechnol 2013;31:70–7.
[7] Subhadra B, Edwards M. An integrated renewable energy park approach for algalbiofuel production in United States. Energy Policy 2010;38:4897–902.
[8] Gao K, McKinley KR. Use of macroalgae for marine biomass production and CO2
remediation: a review. J Appl Phycol 1994;6:45–60.[9] John RP, Anisha G, Nampoothiri KM, Pandey A. Micro and macroalgal biomass: a
renewable source for bioethanol. Bioresour Technol 2011;102:186–93.[10] Yeon J-H, Lee S-E, Choi W-Y, Kang D-H, Lee H-Y, Jung K-H. Repeated-batch op-
eration of surface-aerated fermentor for bioethanol production from the hydrolysateof seaweed Sargassum sagamianum. J Microbiol Biotechnol 2011;21:323–31.
[11] Kim N-J, Li H, Jung K, Chang HN, Lee PC. Ethanol production from marine algalhydrolysates using Escherichia coli KO11. Bioresour Technol 2011;102:7466–9.
[12] Jang J-S, Cho Y, Jeong G-T, Kim S-K. Optimization of saccharification and ethanolproduction by simultaneous saccharification and fermentation (SSF) from seaweed,Saccharina japonica. Bioprocess Biosyst Eng 2012;35:11–8.
[13] Pham TN, Nam WJ, Jeon YJ, Yoon HH. Volatile fatty acids production from marinemacroalgae by anaerobic fermentation. Bioresour Technol 2012;124:500–3.
[14] Gupta S, Abu-Ghannam N, Scannell AG. Growth and kinetics of Lactobacillusplantarum in the fermentation of edible Irish brown seaweeds. Food BioprodProcess 2011;89:346–55.
[15] Horn S, Aasen I, Østgaard K. Ethanol production from seaweed extract. J IndMicrobiol Biotechnol 2000;25:249–54.
[16] van der Wal H, Sperber BL, Houweling-Tan B, Bakker RR, Brandenburg W, López-Contreras AM. Production of acetone, butanol, and ethanol from biomass of thegreen seaweed Ulva lactuca. Bioresour Technol 2013;128:431–7.
[17] Soleymani M, Rosentrater KA. Techno-economic analysis of biofuel productionfrom macroalgae (seaweed). Bioengineering. 2017;4:92.
[18] Liang Y, Tang T, Siddaramu T, Choudhary R, Umagiliyage AL. Lipid productionfrom sweet sorghum bagasse through yeast fermentation. Renewable Energy2012;40:130–6.
[19] Yu X, Zheng Y, Dorgan KM, Chen S. Oil production by oleaginous yeasts using thehydrolysate from pretreatment of wheat straw with dilute sulfuric acid. BioresourTechnol 2011;102:6134–40.
[20] McCurdy AT, Higham AJ, Morgan MR, Quinn JC, Seefeldt LC. Two-step process forproduction of biodiesel blends from oleaginous yeast and microalgae. Fuel2014;137:269–76.
[21] Görner C, Redai V, Bracharz F, Schrepfer P, Garbe D, Brück T. Genetic engineeringand production of modified fatty acids by the non-conventional oleaginous yeastTrichosporon oleaginosus ATCC 20509. Green Chem 2016;18:2037–46.
[22] Fitzherbert EB, Struebig MJ, Morel A, Danielsen F, Brühl CA, Donald PF, et al. Howwill oil palm expansion affect biodiversity? Trends Ecol Evolut 2008;23:538–45.
[23] Meo A, Priebe XL, Weuster-Botz D. Lipid production with Trichosporon oleaginosusin a membrane bioreactor using microalgae hydrolysate. J Biotechnol2017;241:1–10.
[24] Volesky B. Biosorbents for metal recovery. Trends Biotechnol 1987;5:96–101.[25] Yu Q, Matheickal JT, Yin P, Kaewsarn P. Heavy metal uptake capacities of common
marine macro algal biomass. Water Res 1999;33:1534–7.[26] Davis TA, Volesky B, Mucci A. A review of the biochemistry of heavy metal bio-
sorption by brown algae. Water Res 2003;37:4311–30.[27] He J, Chen JP. A comprehensive review on biosorption of heavy metals by algal
biomass: materials, performances, chemistry, and modeling simulation tools.Bioresour Technol 2014;160:67–78.
M.A. Masri et al. Applied Energy 224 (2018) 1–12
11

[28] Fu F, Wang Q. Removal of heavy metal ions from wastewaters: a review. J EnvironManage 2011;92:407–18.
[29] Tchounwou PB, Yedjou CG, Patlolla AK, Sutton DJ. Heavy metal toxicity and theenvironment. Molecular, clinical and environmental toxicology: Springer; 2012. p.133–64.
[30] Karmakar G, Ghosh P, Sharma BK. Chemically modifying vegetable oils to preparegreen lubricants. Lubricants 2017;5:44.
[31] McLellan BC, Corder GD, Golev A, Ali SH. Sustainability of the rare earths industry.Procedia Environ Sci 2014;20:280–7.
[32] Binnemans K, Jones PT, Blanpain B, van Gerven T, Yang Y, Walton A, et al.Recycling of rare earths: a critical review. J Cleaner Prod 2013;51:1–22.
[33] Jarosiński A, Kowalczyk J, Mazanek C. Development of the Polish wasteless tech-nology of apatite phosphogypsum utilization with recovery of rare earths. J AlloysCompd 1993;200:147–50.
[34] Ochsenkühn-Petropulu M, Lyberopulu T, Ochsenkühn KM, Parissakis G. Recoveryof lanthanides and yttrium from red mud by selective leaching. Anal Chim Acta1996;319:249–54.
[35] Griffiths M. Hille Rv, Harrison S. Selection of direct transesterification as the pre-ferred method for assay of fatty acid content of microalgae. Lipids2010;45:1053–60.
[36] Chang SK, Zhang Y. Protein analysis. Food analysis. Springer; 2017. p. 315–31.[37] Bligh EG, Dyer WJ. A rapid method of total lipid extraction and purification. Can J
Biochem Physiol 1959;37:911–7.[38] Lahaye M, Robic A. Structure and functional properties of ulvan, a polysaccharide
from green seaweeds. Biomacromolecules 2007;8:1765–74.[39] Yanagisawa M, Nakamura K, Ariga O, Nakasaki K. Production of high concentra-
tions of bioethanol from seaweeds that contain easily hydrolyzable polysaccharides.Process Biochem 2011;46:2111–6.
[40] XU X, Ji-Young K, Min-Woo L, Jong-Moon P. Continuous fermentative butyric acidand acetic acid production from Laminaria japonica using a two-stage fermentationsystem. 한국생물공학회 학술대회 2013:275.
[41] Zhu J, Pan X. Woody biomass pretreatment for cellulosic ethanol production:technology and energy consumption evaluation. Bioresour Technol2010;101:4992–5002.
[42] Pan JG, Kwak MY, Rhee JS. High density cell culture of Rhodotorulaglutinis usingoxygen-enriched air. Biotechnol Lett 1986;8:715–8.
[43] Chi Z, Zheng Y, Ma J, Chen S. Oleaginous yeast Cryptococcus curvatus culture withdark fermentation hydrogen production effluent as feedstock for microbial lipidproduction. Int J Hydrogen Energy 2011;36:9542–50.
[44] Yong-Hong L, Bo L, Zong-Bao Z, Feng-Wu B. Optimization of culture conditions forlipid production by Rhodosporidium toruloides. Chin J Biotechnol 2006;22:650–6.
[45] Hornsey I, Hide D. The production of antimicrobial compounds by British marinealgae I. Antibiotic-producing marine algae. Br Phycol J 1974;9:353–61.
[46] Hornsey I, Hide D. The production of antimicrobial compounds by British marinealgae II. Seasonal variation in production of antibiotics. Brit Phycol J 1976;11:63–7.
[47] Wang J, Gao Q, Zhang H, Bao J. Inhibitor degradation and lipid accumulationpotentials of oleaginous yeast Trichosporon cutaneum using lignocellulose feed-stock. Bioresour Technol 2016;218:892–901.
[48] Chen X, Li Z, Zhang X, Hu F, Ryu DD, Bao J. Screening of oleaginous yeast strainstolerant to lignocellulose degradation compounds. Appl Biochem Biotechnol2009;159:591.
[49] Awad NE. Biologically active steroid from the green alga Ulva lactuca. PhytotherapRes 2000;14:641–3.
[50] Xu X, Kim JY, Oh YR, Park JM. Production of biodiesel from carbon sources ofmacroalgae, Laminaria japonica. Bioresour Technol 2014;169:455–61.
[51] Zhu L, Zong M, Wu H. Efficient lipid production with Trichosporonfermentans andits use for biodiesel preparation. Bioresour Technol 2008;99:7881–5.
[52] Huang C. Zong M-h, Wu H, Liu Q-p. Microbial oil production from rice straw hy-drolysate by Trichosporon fermentans. Bioresour Technol 2009;100:4535–8.
[53] Qin L, Liu L, Zeng A-P, Wei D. From low-cost substrates to single cell oils synthe-sized by oleaginous yeasts. Bioresour Technol 2017.
[54] Salimon J, Salih N, Yousif E. Industrial development and applications of plant oilsand their biobased oleochemicals. Arab J Chem 2012;5:135–45.
[55] Fonseca FL, Frases S, Casadevall A, Fischman-Gompertz O, Nimrichter L, RodriguesML. Structural and functional properties of the Trichosporon asahii glucuronox-ylomannan. Fungal Genet Biol 2009;46:496–505.
[56] White L, Newman M, Cromwell G, Lindemann M. Brewers dried yeast as a source ofmannan oligosaccharides for weanling pigs. J Anim Sci 2002;80:2619–28.
[57] Robinson JP. Handbook of flow cytometry methods. Wiley-Liss; 1993.[58] Da Silva TL, Santos CA, Reis A. Multi-parameter flow cytometry as a tool to monitor
heterotrophic microalgal batch fermentations for oil production towards biodiesel.Biotechnol Bioprocess Eng 2009;14:330–7.
[59] Santos C, Ferreira M, Da Silva TL, Gouveia L, Novais J, Reis A. A symbiotic gasexchange between bioreactors enhances microalgal biomass and lipid productiv-ities: taking advantage of complementary nutritional modes. J Ind MicrobiolBiotechnol 2011;38:909–17.
[60] Da Silva TL, Feijão D, Reis A. Using multi-parameter flow cytometry to monitor theyeast Rhodotorula glutinis CCMI 145 batch growth and oil production towardsbiodiesel. Appl Biochem Biotechnol 2010;162:2166–76.
[61] Ageitos JM, Vallejo JA, Veiga-Crespo P, Villa TG. Oily yeasts as oleaginous cellfactories. Appl Biochem Biotechnol 2011;90:1219–27.
[62] Fourest E, Volesky B. Contribution of sulfonate groups and alginate to heavy metalbiosorption by the dry biomass of Sargassum fluitans. Environ Sci Technol1995;30:277–82.
[63] Bulgariu D, Bulgariu L. Equilibrium and kinetics studies of heavy metal ions bio-sorption on green algae waste biomass. Bioresour Technol 2012;103:489–93.
[64] Heilmann M, Jurkowski W, Buchholz R, Brueck T, Becker AM. Biosorption ofneodymium by selected photoautotrophic and heterotrophic species. J Chem EngProcess Technol 2015;6:1.
[65] Christophe G, Kumar V, Nouaille R, Gaudet G, Fontanille P, Pandey A, et al. Recentdevelopments in microbial oils production: a possible alternative to vegetable oilsfor biodiesel without competition with human food? Braz Archiv Biol Technol2012;55:29–46.
[66] Koutinas AA, Chatzifragkou A, Kopsahelis N, Papanikolaou S, Kookos IK. Designand techno-economic evaluation of microbial oil production as a renewable re-source for biodiesel and oleochemical production. Fuel 2014;116:566–77.
[67] Lorenzen J, Horscht R, Waldow A, Qoura F, Loll B, Brück T. Rhodococcus ery-thropolis oleate hydratase: a new member in the oleate hydratase family tree—-biochemical and structural studies. ChemCatChem 2018.
[68] Malla ME, Alvarez MB, Batistoni DA. Evaluation of sorption and desorption char-acteristics of cadmium, lead and zinc on Amberlite IRC-718 iminodiacetate che-lating ion exchanger. Talanta 2002;57:277–87.
M.A. Masri et al. Applied Energy 224 (2018) 1–12
12

A waste free, microbial oil centered cyclic bio-refinery approach based on flexible macroalgae biomass Mahmoud A. Masri[a], Wojciech Jurkowski[a], Pariya Shaigani[a], Martina Haack[a], Norbert Mehlmer*[a] and Thomas Brück*[a]
[a] M. A. Masri, W. Jurkowski, P. Shaigani, M. Haack, Dr. N. Mehlmer and Prof. Dr. T. Brück Department of Chemistry -Professorship of Industrial Biocatalysis Technical University of Munich E-mail: [email protected]; [email protected]; [email protected]; [email protected]; [email protected]; [email protected]
* Corresponding authors
Supporting information for this article is given via a link at the end of the document
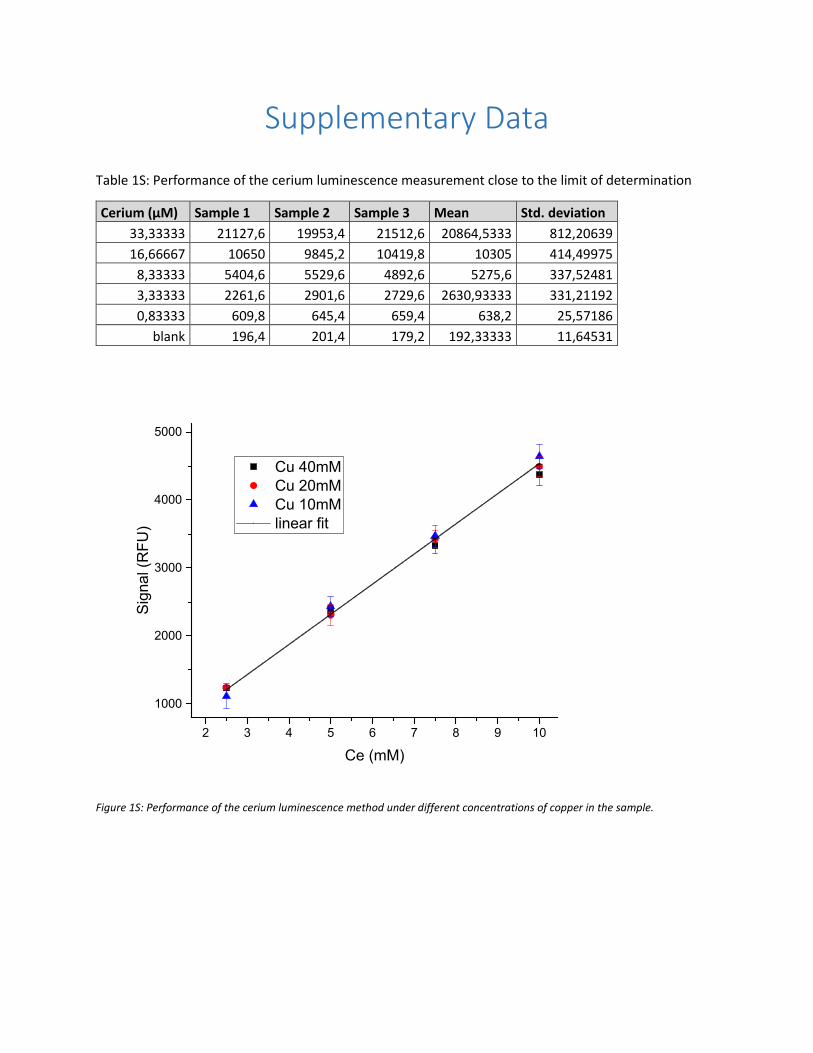
Supplementary Data
Table 1S: Performance of the cerium luminescence measurement close to the limit of determination
Cerium (µM) Sample 1 Sample 2 Sample 3 Mean Std. deviation 33,33333 21127,6 19953,4 21512,6 20864,5333 812,20639 16,66667 10650 9845,2 10419,8 10305 414,49975
8,33333 5404,6 5529,6 4892,6 5275,6 337,52481 3,33333 2261,6 2901,6 2729,6 2630,93333 331,21192 0,83333 609,8 645,4 659,4 638,2 25,57186
blank 196,4 201,4 179,2 192,33333 11,64531
2 3 4 5 6 7 8 9 10
1000
2000
3000
4000
5000
Sign
al (R
FU)
Ce (mM)
Cu 40mM Cu 20mM Cu 10mM linear fit
Figure 1S: Performance of the cerium luminescence method under different concentrations of copper in the sample.

Figure 2S supplementary: a. Sugar Analysis of the Residual biomass after enzymatic hydrolysis and Retentate fraction after cross-flow filtration using 10 KDa filter. B. the EDX-data of the ash analysis of the Residual biomass.
Figure 3S supplementary: Microscope image of Cutaneotrichosporon oleaginosus (ATCC 20509) after 120h fermentation a. in L. digitata hydrolysate b. U. lactuca hydrolysate.
Figure 4S supplementary: The fatty acid profile of C. oleaginosus triglycerides after fermentation in brown algae hydrolysate L. digitata.

Figure 5S supplementary: Sugar profile of yeast Cutaneotrichosporon oleaginosus (ATCC 20509) biomass after lipid extraction.
Figure 6S supplementary: The Increase in the cell density plot diagram and in intensity of the Forward scatter [FSC] and side scatter [SSC] at lipid concentration of 75 % (w/w).

Figure 7S supplementary: Capacity of brown algae samples in comparison to pure sodium alginate.

M . A . M a s r i , 7

Generation of Microbial Oil PUBLICATIONS FULL TEXT A Process Engineering Approach
M . A . M a s r i , 6
A sustainable, high-performance process for the economic
production of waste-free microbial oils that can replace plant-
based equivalents

M . A . M a s r i , 7

Showcasing research from Professor Thomas B. Brück’s
laboratory, Werner Siemens Chair of Synthetic Biotechnology,
Department of Chemistry, Technical University of Munich,
Bavaria, Germany.
A sustainable, high-performance process for the economic
production of waste-free microbial oils that can replace
plant-based equivalents
Plant oil-based biofuel production is associated with land use
change, thereby releasing a massive amount of CO2 while
impacting biodiversity. To date, biofuel based on oleaginous
yeast oil cannot replace plant lipids due to the low productivity
of diauxic lipid formation and its dependence on organic
solvents for intracellular product recovery. Acetic acid and
sugar co-fermentation offers a path to efficient monoauxic lipid
production. In situ hydrolase application facilitated a one-step
and solvent-free lipid recovery method and enabled the recycling
of the nutrient-rich aqueous fermentation phase in subsequent
fermentation cycles.
Registered charity number: 207890
rsc.li/ees
As featured in:
PAPER Su-Il In et al . CO
2 , water, and sunlight to hydrocarbon fuels: a sustained
sunlight to fuel (Joule-to-Joule) photoconversion efficiency of 1%
ISSN 1754-5706
Energy &Environmental Sciencersc.li/ees
Volume 12 Number 9 September 2019 Pages 2595–2850
See Norbert Mehlmer, Thomas B. Brück et al ., Energy Environ . Sci ., 2019, 12 , 2717.

This journal is©The Royal Society of Chemistry 2019 Energy Environ. Sci., 2019, 12, 2717--2732 | 2717
Cite this: Energy Environ. Sci.,
2019, 12, 2717
A sustainable, high-performance process for theeconomic production of waste-free microbial oilsthat can replace plant-based equivalents†
Mahmoud A. Masri, Daniel Garbe, Norbert Mehlmer * andThomas B. Bruck *
Globally, biofuel and oleochemical production based on plant oils negatively affects biodiversity. As an
alternative triglyceride source, lipid production from oleaginous yeasts faces numerous challenges in
feedstock availability, lipid productivity, downstream processing, and waste treatment, prohibiting the
design of a cost-competitive process with regard to plant equivalents. In this study, we present a fully
integrated operation for microbial oil production, which consolidates upstream and downstream
processing with side-stream recycling. Co-fermentation of sugar and acetic acid was successfully
implemented in fed-batch, semi-continuous, and continuous fermentation modes. Process validation
was conducted at a 25 L scale with a lipid productivity of 1.2 g L�1 h�1. Cutaneotrichosporon
oleaginosus cell debris was used as an inducer in Trichoderma reesei fermentation for on-site
generation of yeast-specific cell-wall hydrolases. In situ hydrolase application allowed for efficient
C. oleaginosus cell lysis (85% w/w) and simultaneous lipid release. A subsequent centrifugation step
yielded 90% (w/w) recovery of intracellular lipids without the need for any organic solvent. The nutrient-
rich water phase was applied as an internal sugar source for subsequent yeast fermentation cycles. With
this yeast hydrolysate, the lipid productivity was considerably increased to 2.4 g L�1 h�1. A techno-
economic analysis of the current lipid production processes estimated costs at $1.6 per kg lipid.
Moreover, life cycle assessment analysis indicated an emission of 3.56 kg CO2 equivalents for every 1 kg
produced yeast oil. Accordingly, we established an integrated operation for bioconversion of acetic acid
and sugar to sustainable lipids at maximum productivity coupled with minimal waste generation and
energy consumption.
Broader contextClimate change drives the development of alternative low-carbon energy sources such as biofuels. Plant oil based biofuels promise to reduce greenhouse gases.However, the overhasty large scale plant oil production is responsible for releasing massive amounts of CO2 by deforestation and land use change, whichcompetes with food production and impacts biodiversity. Circumventing these issues, fermentative yeast lipid production is flagged as an alternative feedstock,which can be generated from biogenic waste streams at enhanced areal and space-time productivities. Consequently, it is promoted as an alternative platformfor biofuel production. Currently, conventional yeast lipogenesis is economically and ecologically inefficient, since it is a diauxic process that requires organicsolvents for lipid recovery. In this study, a highly efficient monoauxic biomass and lipid production process provides for an integrated yeast lipid process chain.Yeast cell-wall residues were used as an inducer for on-site yeast cell-wall specific hydrolase production. In situ hydrolase application facilitated a one-step,solvent-free, lipid recovery and enabled the recycling of the nutrient-rich aqueous fermentation phase in subsequent fermentation cycles. The co-conversion ofacetic acid and biomass-derived carbohydrates to sustainable lipids results in product costs and CO2 emissions comparable with plant oils. This improved theoverall ecological footprint of yeast oil production.
Introduction
Globally, the production and use of high-energy biofuels (i.e.,biodiesel, biokerosene) and renewable oleochemicals (i.e., bio-lubricants, cosmetic/pharmaceutical bases) are associated witha negative eco-impact owing to their dependence on plant oil
Department of Chemistry, Werner Siemens Chair of Synthetic Biotechnology,
Technical University of Munich, Germany. E-mail: [email protected],
† Electronic supplementary information (ESI) available. See DOI: 10.1039/c9ee00210c
Received 20th January 2019,Accepted 19th June 2019
DOI: 10.1039/c9ee00210c
rsc.li/ees
Energy &EnvironmentalScience
PAPER

2718 | Energy Environ. Sci., 2019, 12, 2717--2732 This journal is©The Royal Society of Chemistry 2019
feedstocks.1 Plant oil production for generation of biofuels andchemicals competes with food production, accelerates land usechange in sensitive ecosystems, and thereby negatively affectsbiodiversity.2 Moreover, the generation of biofuels from con-verted lands (i.e., rainforests) has even greater effects on green-house gas emission than the fossil fuels that these biofuelsdisplace.2,3 One of the most prominent examples is the clearingof tropical rainforests for palm oil cultivation, which leads tothe ultimate displacement and decline of critically endangeredspecies, such as the orangutan.4,5 Therefore, to enable globaldevelopment of biofuels and oleochemicals without negativelyaffecting the environment, the process of bio-oil productionneeds to be uncoupled from terrestrial plant feedstocks andland use change.
In January 2017, the European Parliament decided to phase-outpalm oil and cap crop-based biofuels by 2021 for all memberstates. However, this will not be achievable without alternativeproduction routes that can satisfy the increased energy demandand biofuel criteria to yield low-carbon energy resources.In contrast to current biofuel options, future processes mustavoid clearing of sensitive ecosystems, such as rainforests,which function as a high-impact and long-term carbon sink.In this regard, microbial oils have long been recognised as thebest alternatives to plant based-oil production,6,7 and the yeastCutaneotrichosporon oleaginosus (C. oleaginosus, ATCC20509)has been flagged as a prime candidate for microbial oil produc-tion over other oleaginous microorganisms owing to its rapidgrowth rates, high cell density cultivation, and catabolism ofvarious biogenic waste streams.7
Economically, feedstock availability and cost, triglyceride oilproductivity, and the number of process steps to achieve oilrecovery are key challenges that block the industrial-scalemanufacturing of yeast-based oils. According to reported produc-tion processes, microbial oil costs are estimated to be around$5.5 per kg.8 In comparison, soybean and palm oil costs arearound $0.5–0.68 per kg (October 2018).9 Therefore, to meetthe economic boundary conditions for microbial oil production,the entire process chain and feedstock utilisation has to bereorganised. Drivers in this process include feedstock selectionand maximising oil productivity while minimising the number ofprocess steps, including value-added exploitation of by-productstreams. Accordingly, the development of an inexpensive andsustainable feedstock is essential for economic process design.In current studies, most resources have been focused on theidentification of sustainable feedstocks, including sugar sourcesobtained from forestry waste and agro-industrial residues, suchas crude glycerol,10 sweet sorghum bagasse,11 and thermally/chemically pretreated sludge,12,13 as potential carbohydratesources. Recent studies have demonstrated that marine feedstocks,including macroalgae,14,15 microalgae,16 and seagrass,17 have addi-tional advantages over terrestrial biomass feedstocks. Specifically,these feedstocks can be harvested sustainably without affectingagricultural activity, inducing land use change or damaging sensi-tive marine ecosystems.18 Moreover, marine biomass feedstockshave a 6–10 fold higher area productivity than terrestrial biomassresources, such as cereal straw.19,20
In addition to complex biomass feedstocks, acetic acid isalso used as a sustainable carbon source because it can begenerated from ecologically sound starting materials, suchas CO, waste gases, and CO2/H2,21–23 using biotechnologicalprocesses (i.e., fermentation of Clostridium aceticum andAcetobacterium woodii).21,22,24,25 Moreover, acetic acid has alow market price,24 which favours economically sound produc-tion routes.
Recently, some reports have demonstrated that acetic acid canserve as the sole feedstock for C. oleaginosus cultivation.26–31
However, although application of acetic acid as the sole carbonsource results in a considerably high intracellular lipid content(60–73%, wlipid/dwbiomass), biomass productivity is inhibited,leading to poor overall oil yields.26,28,29 Moreover, multistep,30
continuous,26 and pH-stat27,29 fermentations have been tested inorder to identify the best implementation of acetic acid as the solecarbon source feedstock. The pH-stat approach shows promisinglipid productivity.27 However, constant feeding of costly yeastextract, peptone, vitamins, and other nutrients in all pH-stat trialsprohibits the economic development of this process. Thus, furtherstudies are needed to achieve optimal integration of acetic acid inthe microbial oil production process.
Typically, oleaginous yeast fermentation is subjected to adiauxic shift from biomass formation to lipid accumulation,which is induced under nutrient limitation. The diauxic shiftincreases the fermentation time, thereby reducing lipid pro-ductivity and adversely increasing operation costs owing to therequirement for excess aeration and cooling.8 These factorsadversely affect the economic and ecologic feasibility of micro-bial lipid production. Therefore, the short fermentation timeenabled by monoauxic biomass and consecutive lipid formationis essential to improve both economic and ecological processparameters.
In addition, lipid recovery from intracellular compartmentsand subsequent downstream processing represent additionalchallenges in the design of an economically relevant microbialoil process. However, conventional lipid extraction proceduresrequire cell wall destruction (e.g., via temperature shock, chemicaltreatment, and high-pressure homogenisation),32 followedby lipid extraction with toxic organic solvents (i.e., chloroformand hexane). The scale up of such mechanically and energy-demanding processes results in additional technical complica-tions and increased cost.33,34 Ecologically, application of organicsolvent results in accumulation of solvent traces in all processoutlets (lipid, water phase, and residual biomass). Thereby,solvent application will reduce the final product quality and yieldside product streams as toxic waste.34
Enzymatic hydrolysis may be an alternative strategy for cellwall destruction. In fact, enzymatic hydrolysis should be aholistic cell lysis route that entirely circumvents the need forsolvent extraction. However, because of the biochemical com-plexity of the yeast cell well, holistic cell lysis requires synergis-tic effects of multi-enzyme activities. To date, there is no singlecommercial enzyme system that comprises all the requiredhydrolase activities. Therefore, on-site hydrolase production isan alternative for tailored hydrolase generation. The filamentous
Paper Energy & Environmental Science

This journal is©The Royal Society of Chemistry 2019 Energy Environ. Sci., 2019, 12, 2717--2732 | 2719
fungus Trichoderma reesei (T. reesei) is considered one of the mostefficient extracellular hydrolase producers and is capable ofcustomized hydrolase production, when fed with appropriateinducer systems. Consequently, T. reesei is a potential host forthe generation of a dedicated enzyme system for targeted yeastcell lysis.
In this study, we established a new process chain for produc-tion of yeast-based lipids, enabling highly efficient monoauxicbiomass and lipid production, one-step lipid recovery withoutsolvent extraction to recover lipids, and complete recycling ofwater and side product streams (Fig. 1). This process permittedoperation in a continuous or batch fermentation mode usingterrestrial or marine carbon sources as well as acetic acid.Additionally, a comprehensive techno-economic analysis (TEA)and life cycle assessment (LCA) of the new yeast lipid productionprocess was performed. We also evaluated the economic feasi-bility of the process to minimise feedstock, energy, and waterconsumption costs. In summary, we developed a newly designedprocess using non-terrestrial biomass hydrolysates that werenot associated with land use change, ecosystem destruction, orbiodiversity reduction.
ExperimentalStrains and preculture
C. oleaginosus (ATCC 20509) was cultivated in Erlenmeyer flaskscontaining YPD media broth (10 g L�1 yeast extract, 20 g L�1
peptone, and 20 g L�1 glucose) containing antibiotics (10 mg L�1
ampicillin, 10 mg L�1 kanamycin, and 12 mg L�1 tetracycline).The yeast was incubated in a rotary shaker at 100 rpm and 28 1Cfor 2 days and was then was used as the inoculum.
T. reesei ATCC 56765 (RUT C-30) and ATCC 13631 wereactivated in LB media (5 g L�1 yeast extract, 10 g L�1 tryptone)and was then used as inoculum for fermentation.
Medium
Different media were applied for each experiment. These mediacontained major nutrient components (carbon and nitrogensources) plus base medium. The composition of the base
medium was as follow: 0.05 g L�1 NH4Cl, 2.4 g L�1 KH2PO4,0.9 g L�1 Na2HPO4�12H2O, 1.5 g L�1 MgSO4�7H2O, 0.025 g L�1
FeCl3�6H2O, 0.001 g L�1 ZnSO4�7H2O, 0.2 g L�1 CaCl2�2H2O,0.024 g L�1 MnSO4�5H2O, 0.025 g L�1 CuSO4�5H2O, and0.003 g L�1 Co(NO3)2�6H2O. The composition of the mainnutrition was as follows: medium A (C/N ratio 125) wascomposed of 30.0 g L�1 glucose and 0.5 g L�1 yeast extract;medium B (C/N ratio 125) was composed of 0.5 g L�1 yeastextract and 4.1 g L�1 CH3COONa; medium C (C/N ratio 130) wascomposed of 30.0 g L�1 glucose, 0.5 g L�1 yeast extract, and4.1 g L�1 CH3COONa; medium D (C/N ratio 34) was composedof 30.0 g L�1 glucose, 0.5 g L�1 yeast extract, and 5.0 g L�1
peptone; medium E was composed of 1.0 g L�1 yeast extract,1.0 g L�1 peptone, and 4.1 g L�1 CH3COONa; and medium G(C/N ratio 28) was composed of 60.0 g L�1 glucose, 5.0 g L�1
yeast extract, 5.0 g L�1 peptone, and 4.1 g L�1 CH3COONa.Brown algae hydrolysate (C/N ratio 85) was prepared by
enzymatic hydrolysis of Laminaria digitata without any chemicalpretreatment. Detailed information for the enzymatic hydrolysis ispresented in our previous publication.15
For T. reesei cultivation, medium F was composed of 10 g L�1
C. oleaginosus cell wall, 10 g L�1 yeast extract, 10.0 g L�1
glucose, 1.4 g L�1 (NH4)2SO4, 2 g L�1 KH2PO4, 0.4 g L�1
CaCl2�2H2O, 0.3 g L�1 MgSO4�7H2O, 0.005 g L�1 FeSO4�7H2O,0.004 g L�1 CoCl2�6H2O, 0.003 g L�1 MnSO4�H2O, and 0.002 g L�1
ZnSO4�7H2O. Glucose was obtained from Roth-Germany (Art.No. 6780.2), yeast extract was obtained from PanReacAppliChem-Germany (A1552,1000), peptone from casein wasobtained from Roth-Germany (Art. No. 8952.2), and otherchemicals were obtained from Merck-Germany.
Bioreactors
For cultivation of C. oleaginosus, the following bioreactorsystems were used: (1) a DASGIP four parallel bioreactor system(Eppendorf, Germany) with a working volume of 1 L (4 � 1 L);(2) INFORS HT three parallel System (Switzerland) with a workingvolume of 3 L (3 � 3 L); and (3) Bio-Engineer fermentation system(Bio-Engineer, USA) with a working volume of 50 L. The tempera-ture was set to 28 1C, and the pH of the bioreactor was adjusted topH 6.5 � 0.02 with 3 M NaOH or 70–100% (w/w) acetic acid.
Fig. 1 Overview of workflow of the study (left) and biomass flow for the developed yeast lipid production process (right).
Energy & Environmental Science Paper

2720 | Energy Environ. Sci., 2019, 12, 2717--2732 This journal is©The Royal Society of Chemistry 2019
Stirring (350–800 rpm), oxygen ratio (21–100%), aeration (8.0–1.5 vvm), and pressure (1.25–1.5 bar) were regulated automati-cally to maintain dissolved oxygen at a pO2 of 50% or more.Foam was prevented by the addition of 0.01% (v/v) of anantifoam agent (Antifoam 204; Merck). To evaluate reproduci-bility, each fermentation was carried out three times. Thevalues are presented as averages, and each point was analysedin triplicate. Error bars represent the standard deviation.
Analysis
Sugar, lipid, and fatty acid profiles; cell counting, and drybiomass analyses. Sugars consumption and release were analysedby high-performance liquid chromatography (HPLC; Agilent1100 series) with a Rezex ROA-Organic Acid (Aminex HPX87H) column. Biomass growth was monitored by measuringthe optical density at 600 nm, using the gravimetric method(lyophilisation of 5 � 2 mL washed culture for 2 days [Christalpha 2-4 LD Plus]), and using cell counting (FACS S3 [Bio-Rad,Germany]). Lipid content was analysed using the Bligh–Dyermethod.35 Detailed procedures are described in our previouswork.15 To evaluate reproducibility, all experiments wererepeated three times. The values are presented as averages,and error bars represent standard deviations. Fatty acid profileswere measured using GC-FID (Shimadzu, Japan) after methylation.The methylation procedure and analysis set up were reportedpreviously.15
On-site production of yeast-specific cell wall hydrolases. Thefermentation of T. reesei ATCC 56765 (RUT C-30) and ATCC13631 was carried out in the Bio-Engineer fermentation system.Fermentation parameters were set according to a previouslyestablished protocol.36 Medium F was applied as the cultivationmedium.
As part of medium F, the partially purified cell wall wasprepared as follows. Briefly, after lipid extraction, residualC. oleaginosus biomass was washed with double distilled waterthree times, dried by lyophilisation for 2 days, ground, and thenused as a hydrolase-inducing system in the T. reesei fermentation.
After fermentation, T. reesei biomass was removed by centri-fugation. The resulting water phase (50 L supernatant) containedall secreted hydrolase enzymes, which were subsequently purifiedand concentrated by cross-flow filtration (10 kDa polyether-sulfone filter; Pall). The final volume of the resulting hydrolaseenzyme system was 1 L.
Hydrolase activity assays. Multiple hydrolase activities weredetected in the on-site generated enzyme system. For yeast cellwall hydrolysis, activities of cellulase, xyloglucanase, b-gluco-sidase, mannanase, xylanase, and laminarinase were evaluated.Therefore, 50.0 mg cellulose, xyloglucan, cellobiose, mannan,xylan, and laminarin was incubated with 1 mL buffer (Naacetate, 50 mM, pH 5.0) and 0.35% (w/wbiomass) enzymesolution. To test the enzyme activity of C. oleaginosus biomass,50.0 mg of partially purified cell wall was incubated with 1 mLbuffer (Na acetate, 50 mM, pH 5.0) and 0.35% (w/wbiomass)enzyme solution. All tests were incubated for 28 h at 50 1C.Gravimetric/sugar analyses (HPLC) were used after hydrolysis.
To evaluate the performance of the on-site generated system, atailored hydrolase system with regard to commercial equivalents,we conducted comparative experiments. The evaluated commer-cial enzyme systems were as follows: mix 1 (mannanase [Clariant,Switzerland], Cellic Ctec2 [Novozymes, Denmark], Cellic Htec[Novozymes], and b-glucosidase [Novozymes]); mix 2 (Liquebeet[Clariant], CLA [Clariant], mannanase [Clariant], 1.3-b-glucanase[Megazyme, France], and b-glucosidase [Novozymes]). To ensurereproducibility, all experiments were conducted in triplicate.The reported values are presented as averages, and error barsrepresent standard deviations.
Techno-economic analysis. Techno-economic analysis (TEA)was carried out to estimate the total capital investment andoperating cost for process flowsheets that could be used for theproduction of lipids from oily yeast.
As there is a lack of major databases (such as NREL) forprocess design related to oleaginous yeasts oil production,process and economic data were collected from current resultsand those reported in the available literature,8,37–39 as wellas integrated mathematical functions in SuperPro Designerversion 10 (Intelligen, Inc., Scotch Plains, NJ, USA).40,41
The in silico process simulation created a production plantwith an annual lipid production capacity of 23 000 metrictonnes. The required feedstock (i.e., acetic acid, glucose, andamino acids) and chemicals were estimated based on currentmedia compositions and the results of the current work. Theindividual yeast biomass, lipid formation, and enzymatichydrolysis are represented by respective equations in the ESI.†The built-in material and energy balance data in SPD were appliedto determine the required equipment sizing and respectivepurchasing prices.
Therefore, the simulated plant consisted of multiple unitoperations, encompassing feed handling, fermentation, hydro-lysis, product recovery, and side-product recycling. Hence, 11fermenters (10 in use, one as standby, 250 m3 each), four stirredtank reactors for C. oleaginosus lysis and lipid mobilization(three in use, one as standby, 250 m3 each), five bending/storage/receiving tanks (250 m3 each), three decanter centri-fuges (two in use, one as standby, 159 920 L h�1 each), acentrifugal compressor, an air filter, and an ultrafiltration unitwere modelled in SPD (see the simplified process flow diagramin Fig. S8, ESI†). The standby units were included to avoidmaintenance-based downtime.
Major process parameters and assumptions applied todevelop the process model and determine the required materials,energy, and costs are presented in Table S2 (ESI†).
As lipid productivity had the highest impact on cost withrespect to all other process parameters, the baseline scenariowas established based on harvesting 4 days after initiation ofthe fermentation process. Thus, baseline lipid productivity wasapproximately 1.4 g L�1 h�1 (biomass: 200 g L�1, lipids: 85%[wlipid/dwbiomass], after 120 h). However, the optimal scenariowas consistent with the best productivity reported in this study,which was 2.4 g L�1 h�1 (biomass: 147 g L�1, lipids: 73%[wlipid/dwbiomass], after 42 h). These productivity values repre-sented the average value of six biological replications with � 5%
Paper Energy & Environmental Science

This journal is©The Royal Society of Chemistry 2019 Energy Environ. Sci., 2019, 12, 2717--2732 | 2721
relative standard deviation (Fig. S13, ESI†). Fig. S9–S11 (ESI†)show data for the sensitivity analysis during lipid productivity.
An internal SPD mathematical function adjusted the equip-ment purchase cost (PC) based on the required process equipmentsizing with respect to the analysis year (2018).42 Relevant installa-tion cost factors of 1.6 and 1.8, derived from the initial PC, wereextracted from a very detailed biomass conversion focused TEAstudy.41,43 Process piping, warehouse and site development wereestimated as 4.5, 4.4 and 9.0% of the inside-battery-limit (ISBL)equipment costs respectively.43 The indirect plant costs, includingengineering and construction, were estimated as 20% and 10% oftotal direct cost (TDC), respectively, where TDC is defined as PCplus installation cost plus process piping.43 A capital interest factorof 6% was added to the total capital investment. The annualoperating cost was estimated by the facility-dependent cost(including maintenance) as 3% of TDC.43 The operator costwas adjusted to German full-cost tariff TV-L 11, 13, and 14.44
Raw material costs were estimated based on the availablewhole-sale market price. The cooperate insurance was calcu-lated as 0.7% of the total capital investment (TCI).43 A detailedcost analysis is presented in Tables S3–S11 (ESI†).
Life-cycle for global warming potential (GWP). The life cycleand environmental analysis (LCA) for the entire process chaindescribed in this study was investigated in order to identifyenvironmental process hotspots that could indicate whetherthe yeast products were a viable alternative to conventionalplant oils. An attributional cradle-to-gate assessment of a fullyintegrated, commercial-scale yeast lipid production unit basedon the data presented in the TEA section was performed.Allocation was not applied. All side product streams wereentirely recycled within a process loop. The underlying modelswere based on experimental data generated within the project(lab-scale) and fed into process simulation models for theinitial TEA analysis; all other required datasets were comple-mented by literature data (e.g., transport). The environmentaldata are based on publicly available LCA databases, such as USLCI45 and the BioEnergieDat46 database. The mass balance forthe functional unit of 1 kg oil is illustrated in Fig. S15 (ESI†).This Sankey diagram of the complete process chain highlightstwo aspects: the large share of acetic acid as a feedstock and theimportance of medium recycling for process efficiency. In papyro,the model reflected a simulated business case in North Germanynear the North Sea coast, designed with minimal land require-ments in order to avoid competition with food production.The model also included all processes from sourcing initialfeedstocks, such as acetic acid and macroalgae carbohydrates,followed by processing steps that encompasses yeast fermentation,side-stream recycling, and subsequent downstream processingfor lipid production. The algae L. digitata could be collected bytractor and subsequently hydrolysed. Transport of feedstocks wasincluded in the analysis. However, like numerous other LCAstudies,47,48 infrastructure, such as fermenters and centrifuges,was not considered. Moreover, chemicals, such as sodiumhydroxide, calcium chloride, magnesium sulfate, and otherinorganic chemical components required for growth mediumand process cleaning activities, were excluded from the LCA
matrix because they were used in minor amounts that did notaffect the overall material flow. The full system boundary isdepicted in Fig. S14c (ESI†). The impact analysis, as defined inthe process flow diagram (Fig. S14c, ESI†), was calculated basedon the CML method (Faculty of Science in Leiden Universitymethod [Centrum voor Milieuwetenschappen, V4.4, 2015]);however, because of its relevance, this publication concentrateson the global warming potential. The life cycle inventory isdocumented in the ESI† (Tables S12–S21).
Results and discussionMaximizing lipid productivity
To identify the best operation mode, various fermentationsetups (only acetic acid, only glucose, and co-fermentation ofacetic acid and glucose) with nitrogen-limited and -rich mediawere investigated. For single-substrate fermentation, glucosefermentation (medium A; Fig. 2a) showed higher biomassproductivity than acetic acid alone (medium B; Fig. 2b). However,acetic acid fermentation yielded slightly higher lipid productivity(Fig. 2f and j) than glucose fermentation (Fig. 2e and i), measuring0.13 g L�1 h�1 (biomass: 22 g L�1, lipids: 72% [wlipid/dwbiomass]) and0.09 g L�1 h�1 (biomass: 34 g L�1, lipids: 45% [wlipid/dwbiomass]),respectively.
In comparison, co-fermentation of glucose and acetic acid innitrogen-limited medium (medium C; Fig. 2c) yielded a bio-mass of 20 g L�1 with a lipid content of 20% (wlipid/dwbiomass) inthe first 24 h (Fig. 2g and k). In contrast, at the same time point,individual glucose and acetic acid fermentation biomassesreached only 10 g L�1 with a lipid content of 12% (wlipid/dwbiomass)and 5 g L�1 with a lipid content of 30% (wlipid/dwbiomass),respectively. This corresponded to a lipid productivity of0.2 g L�1 h�1 from day 1 compared with 0.075 g L�1 h�1 withrespect to individual glucose and acetic acid batch fermentation.
Under nitrogen-limited conditions, lipid productiondecreased to 0.18 g L�1 h�1 (biomass: 43 g L�1, lipids: 73.5%[wlipid/dwbiomass]) by day 5 of fermentation. The calculatedcarbon:carbon efficiency was 0.22 g g�1 lipid per total carbon.This decrease could be attributed to the limited nitrogenresources.
Interestingly, the fermentation based on nitrogen-rich medium(medium D) enhanced lipid productivity, reaching 0.67 g L�1 h�1
by day 1 (Fig. 2d, h, and l). Notably, nitrogen-rich medium-basedco-fermentation resulted in simultaneous formation of both bio-mass and intracellular lipids immediately after the start of fermen-tation. Under these conditions, lipid contents in excess of 70%(wlipid/dwbiomass) were obtained by day 2 of fermentation. Thereafter,the lipid yield increased further, reaching 85% (wlipid/dwbiomass)after 120 h. This was the highest intracellular lipid yieldever observed with oleaginous yeasts. Under these experimentalconditions, the biomass yield also continued to increase linearlywithout levelling out into a plateau phase (Fig. 2d). The appliedacetic acid and sugar co-fermentation protocol improved lipidproductivity up to 0.53 g L�1 h�1 (biomass: 84 g L�1, lipids:84.9% [wlipid/dwbiomass]). However, the carbon:carbon efficiency
Energy & Environmental Science Paper

2722 | Energy Environ. Sci., 2019, 12, 2717--2732 This journal is©The Royal Society of Chemistry 2019
was 0.24 g g�1 lipid per total carbon. Consistent with thesefindings, fluorescence microscopy imaging indicated a remarkableincrease in cell volume and lipid content (Fig. S1, ESI†).
In previous runs, synthetic medium with pure glucose wasapplied. However, to avoid the effects of land use change on ourco-fermentation, the marine brown algae biomass L. digitataserved as a sugar source. A previously reported L. digitatahydrolysate15 was used in co-fermentation with acetic acid. Theco-fermentation of L. digitata hydrolysate with acetic acid resultedin concurrent biomass and lipid formation without nutrientlimitation. In addition, the biomass yield surpassed the intra-cellular lipid formation, and the total lipid productivity increasedto 0.59 g L�1 h�1 (biomass: 114 g L�1, lipids: 64% [wlipid/dwbiomass])owing to the higher biomass yield. In this experimental setup,the carbon efficiency was 0.24 g g�1 lipid per total carbon(Fig. 3a, d and g).
Different operation modes were tested to verify the mosteconomic approach, and semi-continuous and continuous
operation modes were tested with extended run times. First, asemi-continuous operation mode with two harvesting pointswas run for about 12 days. Two partial harvests were conductedat 162 and 234 h, where 40–50% (v/v) of the culture wasremoved from the bioreactor and replaced with fresh mediumE. The initial co-fermentation with nitrogen-rich medium(medium D) and acetic acid over an extended time period isdepicted in Fig. 3b, e and j. As observed previously, biomass andlipid formation yielded a lipid productivity of 0.57 g L�1 h�1
(biomass: 106 g L�1, lipids: 87% [wlipid/dwbiomass]) after 162 h.At this time, the first harvesting point had taken place byharvesting 40% (v/v) of the culture, resulting in decreasedbiomass (69 g L�1).
In the next 42 h of operation, the biomass concentrationincreased rapidly to reach 235 g L�1. Moreover, the lipidcontent could be maintained above 80% (wlipid/dwbiomass), witha lipid productivity of 0.90 g L�1 h�1. This was the highest lipidproductivity observed at this point of process optimisation.
Fig. 2 (a, e and i) Growth rates, substrate consumption, lipid accumulation, and lipid titres with glucose as the only feedstock. (b, f and j) Growth rates,substrate consumption, lipid accumulation, and lipid titres with acetic acid as the only feedstock. (c, g and k) Growth rates, substrate consumption, lipidaccumulation, and lipid titres with co-fermentation of glucose and acetic acid as the feedstock using nitrogen-limited medium. (d, h and l) Growth rates,substrate consumption, lipid accumulation, and lipid titres with co-fermentation of glucose and acetic acid as the feedstock using nitrogen-rich medium.
Paper Energy & Environmental Science

This journal is©The Royal Society of Chemistry 2019 Energy Environ. Sci., 2019, 12, 2717--2732 | 2723
At 234 h, the second harvesting step was performed, wherein50% (v/v) of the culture volume was removed (Fig. 3b). Hence,the biomass concentration was decreased to 158 g L�1. Inter-estingly, the biomass concentration was returned to 240 g L�1
with a lipid content of 87.5% (wlipid/dwbiomass) within the next32 h of fermentation.
At the end of the operation, the total lipid productivity was0.8 g L�1 h�1 (biomass: 240 g L�1; lipids: 87.6% [wlipid/dwbiomass]).However, the carbon efficiency with respect to lipid formation was0.39 g g�1. This productivity figure did not consider the harvested
culture amount, which exceeded 80% (v/v) of the original culturevolume. The comprehensive yeast biomass analysis is shown inTable S1 (ESI†). The extremely high cell density and lipid contentcould be visually observed though the extremely high viscosity andhydrophobicity of the cells when exposed to water (see the videoin the ESI†).
To validate the presented data at technically relevant scales,co-fermentation in nitrogen-rich medium was conducted at ascale of 25 L. The fermentation was operated in continuousmode using 50% (w/w) acetic acid as the continuous dilution.
Fig. 3 (a,d and g) Growth rates, substrate consumption, lipid accumulation, and lipid titres with Laminaria digitata hydrolysate as the only feedstock.(b, e and j) Growth rates, substrate consumption, lipid accumulation, and lipid titres with co-fermentation of glucose and acetic acid as the feedstockusing nitrogen-rich medium with semi-continuous mode. (c, f and k) Growth rates, substrate consumption, lipid accumulation, and lipid titres withco-fermentation of glucose and acetic acid as the feedstock using nitrogen-rich medium with continuous mode (25 L).
Energy & Environmental Science Paper
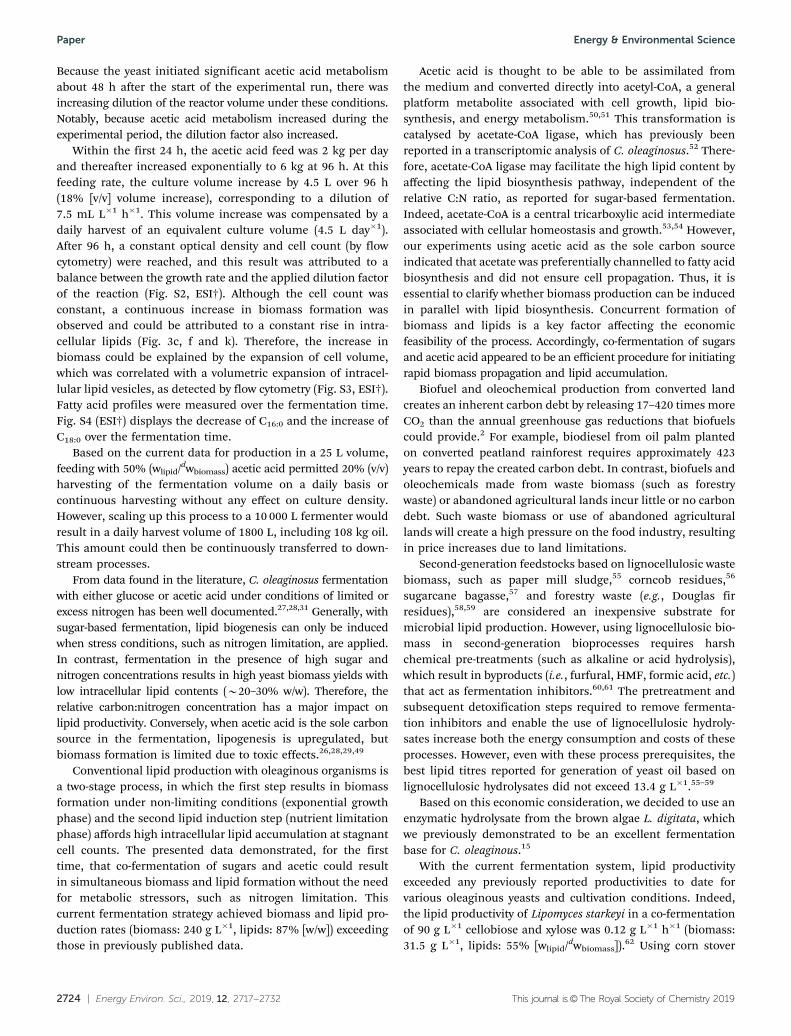
2724 | Energy Environ. Sci., 2019, 12, 2717--2732 This journal is©The Royal Society of Chemistry 2019
Because the yeast initiated significant acetic acid metabolismabout 48 h after the start of the experimental run, there wasincreasing dilution of the reactor volume under these conditions.Notably, because acetic acid metabolism increased during theexperimental period, the dilution factor also increased.
Within the first 24 h, the acetic acid feed was 2 kg per dayand thereafter increased exponentially to 6 kg at 96 h. At thisfeeding rate, the culture volume increase by 4.5 L over 96 h(18% [v/v] volume increase), corresponding to a dilution of7.5 mL L�1 h�1. This volume increase was compensated by adaily harvest of an equivalent culture volume (4.5 L day�1).After 96 h, a constant optical density and cell count (by flowcytometry) were reached, and this result was attributed to abalance between the growth rate and the applied dilution factorof the reaction (Fig. S2, ESI†). Although the cell count wasconstant, a continuous increase in biomass formation wasobserved and could be attributed to a constant rise in intra-cellular lipids (Fig. 3c, f and k). Therefore, the increase inbiomass could be explained by the expansion of cell volume,which was correlated with a volumetric expansion of intracel-lular lipid vesicles, as detected by flow cytometry (Fig. S3, ESI†).Fatty acid profiles were measured over the fermentation time.Fig. S4 (ESI†) displays the decrease of C16:0 and the increase ofC18:0 over the fermentation time.
Based on the current data for production in a 25 L volume,feeding with 50% (wlipid/dwbiomass) acetic acid permitted 20% (v/v)harvesting of the fermentation volume on a daily basis orcontinuous harvesting without any effect on culture density.However, scaling up this process to a 10 000 L fermenter wouldresult in a daily harvest volume of 1800 L, including 108 kg oil.This amount could then be continuously transferred to down-stream processes.
From data found in the literature, C. oleaginosus fermentationwith either glucose or acetic acid under conditions of limited orexcess nitrogen has been well documented.27,28,31 Generally, withsugar-based fermentation, lipid biogenesis can only be inducedwhen stress conditions, such as nitrogen limitation, are applied.In contrast, fermentation in the presence of high sugar andnitrogen concentrations results in high yeast biomass yields withlow intracellular lipid contents (B20–30% w/w). Therefore, therelative carbon:nitrogen concentration has a major impact onlipid productivity. Conversely, when acetic acid is the sole carbonsource in the fermentation, lipogenesis is upregulated, butbiomass formation is limited due to toxic effects.26,28,29,49
Conventional lipid production with oleaginous organisms isa two-stage process, in which the first step results in biomassformation under non-limiting conditions (exponential growthphase) and the second lipid induction step (nutrient limitationphase) affords high intracellular lipid accumulation at stagnantcell counts. The presented data demonstrated, for the firsttime, that co-fermentation of sugars and acetic could resultin simultaneous biomass and lipid formation without the needfor metabolic stressors, such as nitrogen limitation. Thiscurrent fermentation strategy achieved biomass and lipid pro-duction rates (biomass: 240 g L�1, lipids: 87% [w/w]) exceedingthose in previously published data.
Acetic acid is thought to be able to be assimilated fromthe medium and converted directly into acetyl-CoA, a generalplatform metabolite associated with cell growth, lipid bio-synthesis, and energy metabolism.50,51 This transformation iscatalysed by acetate-CoA ligase, which has previously beenreported in a transcriptomic analysis of C. oleaginosus.52 There-fore, acetate-CoA ligase may facilitate the high lipid content byaffecting the lipid biosynthesis pathway, independent of therelative C:N ratio, as reported for sugar-based fermentation.Indeed, acetate-CoA is a central tricarboxylic acid intermediateassociated with cellular homeostasis and growth.53,54 However,our experiments using acetic acid as the sole carbon sourceindicated that acetate was preferentially channelled to fatty acidbiosynthesis and did not ensure cell propagation. Thus, it isessential to clarify whether biomass production can be inducedin parallel with lipid biosynthesis. Concurrent formation ofbiomass and lipids is a key factor affecting the economicfeasibility of the process. Accordingly, co-fermentation of sugarsand acetic acid appeared to be an efficient procedure for initiatingrapid biomass propagation and lipid accumulation.
Biofuel and oleochemical production from converted landcreates an inherent carbon debt by releasing 17–420 times moreCO2 than the annual greenhouse gas reductions that biofuelscould provide.2 For example, biodiesel from oil palm plantedon converted peatland rainforest requires approximately 423years to repay the created carbon debt. In contrast, biofuels andoleochemicals made from waste biomass (such as forestrywaste) or abandoned agricultural lands incur little or no carbondebt. Such waste biomass or use of abandoned agriculturallands will create a high pressure on the food industry, resultingin price increases due to land limitations.
Second-generation feedstocks based on lignocellulosic wastebiomass, such as paper mill sludge,55 corncob residues,56
sugarcane bagasse,57 and forestry waste (e.g., Douglas firresidues),58,59 are considered an inexpensive substrate formicrobial lipid production. However, using lignocellulosic bio-mass in second-generation bioprocesses requires harshchemical pre-treatments (such as alkaline or acid hydrolysis),which result in byproducts (i.e., furfural, HMF, formic acid, etc.)that act as fermentation inhibitors.60,61 The pretreatment andsubsequent detoxification steps required to remove fermenta-tion inhibitors and enable the use of lignocellulosic hydroly-sates increase both the energy consumption and costs of theseprocesses. However, even with these process prerequisites, thebest lipid titres reported for generation of yeast oil based onlignocellulosic hydrolysates did not exceed 13.4 g L�1.55–59
Based on this economic consideration, we decided to use anenzymatic hydrolysate from the brown algae L. digitata, whichwe previously demonstrated to be an excellent fermentationbase for C. oleaginous.15
With the current fermentation system, lipid productivityexceeded any previously reported productivities to date forvarious oleaginous yeasts and cultivation conditions. Indeed,the lipid productivity of Lipomyces starkeyi in a co-fermentationof 90 g L�1 cellobiose and xylose was 0.12 g L�1 h�1 (biomass:31.5 g L�1, lipids: 55% [wlipid/dwbiomass]).62 Using corn stover
Paper Energy & Environmental Science

This journal is©The Royal Society of Chemistry 2019 Energy Environ. Sci., 2019, 12, 2717--2732 | 2725
hydrolysate as the medium, a lipid productivity of 0.23 g L�1 h�1
(biomass: 48 g L�1, lipids: 34% [wlipid/dwbiomass]) was reported withRhodotorula graminis.63 Similarly, Rhodosporidium toruloides Y4cultivated in a 15 L stirred-tank fermenter on glucose affordeda lipid productivity of 0.54 g L�1 h�1 (biomass: 106.5 g L�1,lipids: 67.5% [wlipid/dwbiomass]).
64
With respect to the reported performance of C. oleaginosus,pH-stat fermentation based on acetic acid yielded a productivity of0.66 g L�1 h�1 (biomass: 168 g L�1, lipids: 75% [wlipid/dwbiomass]).
27
Moreover, a genetically optimized strain of Yarrowia lipolyticaNS432 showed a productivity of 0.73 g L�1 h�1 (biomass:110 g L�1, lipids: 77% [wlipid/dwbiomass]) in fed-batch glucosefermentation.65 However, the best yield reported in the litera-ture was obtained in an oxygen-rich batch culture of Rhodotorulaglutinis, with a productivity of 0.87 g L�1 h�1 (biomass: 185 g L�1,lipids: 40% [wlipid/dwbiomass]).
66 In comparison, the current pro-ductivity (1.2 g L�1 h�1) represented a 138% improvement in lipidformation with regard to the best lipid productivity reportedfor Rhodotorula glutinis. Moreover, for Rhodotorula glutinis, thisoleaginous yeast generates abundant triglycerides and significantamounts of b-carotene (terpene-based lipids), which may haveaffected the overall lipid yield in this report. Based on our currentdata and additional literature, various parameters, includingacetic acid concentrations, general medium composition, pH,fermentation time, aeration, and the fermentation system, canmodulate lipid productivity.
Downstream processing and lipid recovery
To generate on-site yeast-specific cell wall hydrolases, twomutant strains of T. reesei, ATCC 56765 and ATCC 13631, wereindividually cultivated in a 50 L fermenter using glucose as theinitial carbon source. The fermentation was operated as previouslydescribed.36 By day 2 of the fermentation, the glucose concen-tration in the medium was almost depleted. Thereafter, thepartially purified C. oleaginosus biomass was added to thefermentation medium at a concentration of 10 g L�1 (mediumF). Visual observation and subsequent sugar analysis wereapplied to measure the decrease of intact C. oleaginosus cellsover time (data not shown). The data indicated that T. reeseicould hydrolyse the C. oleaginosus cells and utilise them as acarbon source. By day 3 of the cultivation, the C. oleaginosus celldebris was completely decomposed. The fermentation contin-ued for another day to stress the fungi and induce maximumhydrolase enzyme secretion. Centrifugation and medium filtra-tion with a 10 kDa crossflow filtration and buffer exchange weresubsequently applied to concentrate, enrich, and purify the tailoredhydrolase system. The final enzyme solution was approximately 1 L,with a protein concentration of 32–35 g L�1 for the enzymesolutions of ATCC 56765 and ATCC 13631, respectively.
Four verification steps were carried out to test the efficiency ofthe generated hydrolase system. The verification steps includedincubation with pure polysaccharides, incubation with the puri-fied yeast biomass and evaluation using a single real culture aswell as scaling to 25 L culture to verify the enzyme activity.
After incubation of the enzyme solution (0.35% [wenzyme/dwsubstrate]) with pure polymeric sugar substrates, cellulase,
xyloglucanase, b-glucosidase, mannanase, xylanase, and lami-narinase enzyme activities were detected in both preparations(data not shown). Subsequently, the resulting enzyme systemswere tested on the purified cell wall preparations of C. oleaginosus.Fig. S5a and b (ESI†) show the decreases in residual biomassweight over the incubation time, where less than 16% and 20%(w/w) biomass remained after 28 h of incubation with the enzymesolutions from ATCC13631 and ATCC56765, respectively.
Next, enzyme solutions were tested using a fresh C. oleaginosusculture. For comparison, two mixtures of the commercial enzymesystems were prepared. These two mixtures, termed Mix 1 and 2,comprised identical enzyme activities as our T. reesei-derivedenzyme system. The final protein concentration in both mixtureswas 14.2–14.5% (wprotein/vsolution). Individually, 100 mL of each ofthe four enzyme systems was incubated with 1.0 g biomass in5.0 mL acetate buffer (50 mM, pH 5.0) for 18 h. Using the samevolume of the enzyme preparation provided different enzyme/biomass ratios (w/w); the enzyme:biomass ratios were approxi-mately 1.4% (wenzyme/dwbiomass) in the commercial mixtures andapproximately 0.35% (wenzyme/dwbiomass) for the T. reesei-generatedenzyme system. For the commercial mixtures, 40–48% (w/w)biomass was solubilized compared with 57–63% (w/w) with theT. reesei-derived enzyme preparation (Fig. S5c, ESI†). However,approximately 40% (w/w) of the generated lipids was released inall preparations (Fig. S5d, ESI†).
After these laboratory-based experiments, we validated ourenzyme-based C. oleaginosus lysis procedure at a 25 L scalefermentation. The initial fermentation was carried out asdescribed previously. Yeast growth was terminated by stoppingaeration. At this point, neither biomass harvest nor any treat-ment was carried out. Instead, the temperature of the fermenterwas increased to 45 1C, the pH was adjusted to 4.5, and thestirring speed was increased to 800 rpm. At this point, thehydrolase system was directly added to the fermenter. Cell lysiswas initiated by adding 0.4% (wenzyme/dwbiomass) of each T. reeseienzyme preparation (total concentration: 0.8% [wenzyme/dwbiomass]).After 20 h of treatment, the reaction conditions were modified; thepH was adjusted to 7.0, and the temperature was changed to 37 1C.Next, 0.5% (wenzyme/dwbiomass) of the commercial protease prepara-tion (Lavergy, BASF) was added to break down cellular proteinsand induce demulsification to assist with lipid release.
The time-dependent cell lysis and lipid release procedureswere analysed by flow cytometry for cell counting and HPLC forassessment of sugar release. Fig. 4a shows the cell density plotas one population located in the intact cell area (R3). Duringhydrolysis, the cell density in area R3 deceased, and a newpopulation in the smaller area (R4) was generated. This newpopulation represented the cell debris. Cell counting (Fig. 4c)confirmed that the cell number dropped from 983� 106 cells mL�1
before the enzymatic hydrolysis to 139 � 106 cells mL�1. Sugaranalysis (Fig. 4b) showed that the sugar content increased withhydrolysis. Furthermore, fluorescence microscopy confirmed thesefindings and allowed visualisation of the lysis process (Fig. 5a).
Thereafter, biomass was subjected to centrifugation, inwhich the upper layer fraction contained the released lipid ina surprisingly pure form. Fig. 5b–d shows the released lipids
Energy & Environmental Science Paper

2726 | Energy Environ. Sci., 2019, 12, 2717--2732 This journal is©The Royal Society of Chemistry 2019
after the enzymatic treatment before and after centrifugation.The data demonstrated that 85% (w/w) of the C. oleaginosusyeast cells were hydrolysed and that approximately 90% (w/w) oftotal intracellular lipids was successfully released.
The downstream process, i.e., lipid extraction, has a significanteffect on economic and ecological process efficiency and onproduct quality with regard to certifiable market sectors, includingthe food industry.34,67 Lipid production is conventionally processed
using five steps: (1) density-based biomass concentration (e.g.,disk-separator32), (2) cell destruction (e.g., high-pressure homo-genisation32), (3) solvent extraction (e.g., hexane or chloroform),(4) solvent separation, and (5) solvent recovery (e.g., a solid/liquid-type separator followed by a single-effect evaporator68,69).In addition to the high cost, many technical obstacles preventthe industrial application of these processes for the commercialgeneration of microbial oils. First, the high lipid content (more
Fig. 4 Evaluation of the produced enzymes from Trichoderma reesei ATCC 13631 and RUT C-30 (ATCC 56765) at a scale of 25 L. (a) Cell density plotdiagrams of C. oleaginosus over the enzymatic hydrolysis time. The cell density plot shows the intensity of the forward scatter (FSC; on the x-axis) andside scatter (SSC; on the y-axis). (b) Increase in sugar concentration over the enzymatic hydrolysis time. (c) Decreased cell counts of C. oleaginosus overthe enzymatic hydrolysis time.
Fig. 5 Lipid extraction after enzymatic hydrolysis. (a) Fluorescence microscope image of yeast cells after 10 h of enzymatic hydrolysis. The lipids werestained with Nile Red (red). (b) Cultures after the enzymatic hydrolysis. The culture was left overnight on the working bench. (c) The culture aftercentrifugation (at 9000 � g for 20 min). (d) Floating lipids after pouring out without any further purification.
Paper Energy & Environmental Science

This journal is©The Royal Society of Chemistry 2019 Energy Environ. Sci., 2019, 12, 2717--2732 | 2727
that 50% [wlipid/dwbiomass]) of cells prevented efficient separa-tion as cells with high lipid contents would remain suspendedin the supernatant or floating as a layer on the top after highg-force centrifugation (approximately 50 000 � g; Fig. S6, ESI†),making the harvesting step inefficient. In the subsequent step,the rigidity of the yeast cells caused the high-pressure homo-genisation to be insufficient. Fig. S7 (ESI†) shows an electronscatter for yeast cells after three cycles of high-pressure homo-genisation (2400 bar). Finally, homogenised cells were extractedusing an organic solvent. However, lipids extracted with organicsolvents are difficult to certify for high-value food and feedapplications. In addition to their effects on product quality,organic solvents will accumulate in process water and cellresidue streams, causing significant environmental issues.
In recent reports, partial enzymatic-assisted lipid extractionwas applied to enhance the lysis of oleaginous yeast cells.32,70–73
However, this process requires various pre-treatments prior toenzymatic cell lysis (i.e., ultrasonic irradiation or heating at95 1C). Despite this, harsh treatments with organic solvents,such as ethyl acetate32 and hexane,70 are required for triglycer-ide recovery.70–73
Thus, it is essential to generate an enzyme system for holisticcell lysis that contains all essential enzyme activities to affordspecific, quantitative lysis of C. oleaginosus cell walls. The fila-mentous fungus T. reesei is considered one of the most efficientextracellular hydrolase producers and harbours various enzymeswith important activities, including cellulase, 1,3-b-glucosidase,b-D-1,3-glucanase, exo-1,3-beta-glucanase, exo-1,3-beta-glucosidase,exo-1,4-b-D-xylosidase, b-xylosidase endo-1,4-b-mannanase, chiti-nases, and cell wall lytic enzymes.36,74,75 This unique inductionsystem was applied in the enzyme production step to promote theproduction of required enzyme activities, and the induction wasevaluated using several verification steps. However, the in-housegenerated enzyme system featured increased activity and specifi-city compared with commercial equivalents, even when a lowertotal protein (enzyme) concentration was applied for hydrolysis.Moreover, our on-site enzyme production will eliminate the neces-sity for external sourcing and transport of commercial enzymesystems, thereby improving cost and the carbon emission footprintof the process chain.
The new, in situ enzymatic treatment process developed inthis study enabled quantitative cell lysis and lipid recovery/purification without the need for biomass pretreatment (suchas harvesting, drying, and high-pressure homogenization) orapplication of an organic solvent to assist the lipid recoverystep. Additionally, the carbohydrate and protein hydrolysisproducts (monomeric sugars and amino acids) could poten-tially be reused in subsequent fermentations because they werenot contaminated with solvent traces.
Recycling biomass and hydrolysate fractions
Initially, 500 mL medium G was used in the first C. oleaginosuscultivation cycle. Fig. 6 shows the initial C. oleaginosus growthrate during the fermentation time. With these experimentalconditions, lipid productivity was 1.23 g L�1 h�1 (biomass:72 g L�1, lipids: 77% [wlipid/dwbiomass]) after 45 h. At the end of thefermentation (at 138 h), lipid productivity was 0.71 g L�1 h�1
(biomass: 115.6 g L�1, lipids: 85% [wlipid/dwbiomass]).C. oleaginosus biomass lysis and lipid release were mediated
by subsequent glucohydrolase and protease treatments, asdescribed previously. The resulting liquid hydrolysate, whichcontained sugars, amino acids, and micronutrients, was filteredusing a 10 kDa cross-filter for sterilisation and to remove theremaining enzyme residues. Thereafter, the hydrolysate wasadjusted to 60 g L�1 glucose and used as the fermentationmedium in an additional cultivation cycle.
Interestingly, with this hydrolysate containing fermentationmedium, the biomass productivity was considerably increasedto 147 g L�1 after 45 h. Concurrently, the lipid productivity wasfound to be 2.4 g L�1 h�1 (biomass: 147 g L�1, lipids: 73%[wlipid/dwbiomass]). These results could be exactly reproduced inthe subsequent third cultivation run (Fig. 6). The biomass andlipid productivities as well as respective total yields, weresuperior to any previous results. Consequently, these valuessignificantly exceeded the highest values for biomass and lipidproductivities reported in the literature by 1.5- and 2.9-fold,respectively64 (Table 1). Moreover, current data indicated thatsuperior biomass and lipid productivities were obtained withinthe first 45 h of the experiment. Therefore, we suggest that forcost efficiency and improved mass production, fermentation
Fig. 6 Biomass growth (via the gravimetric method) over acetic acid and glucose co-fermentation time. In cycle 1, nitrogen-rich medium was used; incycles 2 and 3, medium was the generated yeast cell hydrolysate from the previous cultivation run.
Energy & Environmental Science Paper

2728 | Energy Environ. Sci., 2019, 12, 2717--2732 This journal is©The Royal Society of Chemistry 2019
times as short as 45–72 h may be sufficient to obtain maximumyields.
Techno-economic analysis
To evaluate the economic advantages of the presented processand to determine the best operational set-up, a TEA wasconducted.
The capital investment charged to this project was estimatedto be $133.4 M for commercial-scale realisation. This costincluded equipment installation, engineering, construction,start-up costs, and working capital with a 6% interest factorfor 20-year capital depreciation. Based on the baseline scenario,an annual operation cost of $15.5 M was estimated (Fig. 7c).The raw material cost, based on the wholesale market price,was estimated at $15.3 M (Fig. 7b). The total annual costs weresubsequently estimated at $37.49 M (Fig. 7a). Based on thesefigures, the baseline scenario for microbial lipid cost wasestimated at $1.6 per kg (Tables S3–S11, ESI†).
Fig. S9–S11 (ESI†) represent a sensitivity analysis for thelipid costs based on the most influential process input para-meters. Based on this analysis, lipid productivity, acetic acidcost, electric tariffs, and consumption had the highest impacton lipid cost.
More specifically, the lipid productivity in turn correlatedvery well with the biomass harvesting time and data reprodu-cibility. Within the six represented biological replica (Fig. S13,ESI†), the lipid productivity could vary between 1.33 and1.47 g L�1 h�1 (with a relative standard deviation of �5%),which corresponded to a lipid cost variation between $1.67 and$1.53 per kg. Interestingly, the fermentation time had thehighest influence on the lipid cost; harvesting times of 24, 48,72, and 120 h after fermentation initiation corresponded tolipid productivities of 1.13, 1.93, 2.4, and 1.4 g L�1 h�1,respectively, which translated to lipid costs of $2.0, $0.96,$1.1 and $1.6 per kg, respectively (Fig. S11, ESI†).
The raw materials cost was driven by the cost of acetic acid,which accounted for 85% of the total raw materials cost.Accordingly, because acetic acid was the main cost driver inthe process chain, the lipid cost varied between $1.06 and $1.97per kg when the acetic acid cost varied from $0.1 to $0.3 per kg.
Aeration (centrifugal compressor) consumed about 70% ofthe total electricity required for the entire plant operation(Fig. S12, ESI†). Therefore, the plant electricity consumptionwas controlled mainly by compressor efficiency (with 70% inthe baseline scenario) and aeration required (at 0.8 vvm in thebaseline scenario). Please see Fig. S10 and S11 (ESI†) forsensitivity cost analysis of compressor efficiency, and aeration.Hence, a fermentation carried out at 1.25–1.5 bar is preferableto maintain the aeration at lower vvm values. Notably, theelectricity costs vary with local conditions and pricing regi-mens. In that regard, Germany has one of the highest electrictariffs in the EU. In contrast, other EU countries, such asSweden, have significantly lower electric tariffs ($0.053 kW h).Consequently, the lipid cost can be varied from $1.42 to $1.6per kg when alternative electric tariff scenarios are assumed(Fig. S10 and S11, ESI†).T
able
1O
vera
llsu
mm
ary
of
lipid
pro
du
ctiv
ity
ob
tain
ed
inth
isw
ork
inco
mp
aris
on
wit
hth
eb
est
reco
rds
for
diff
ere
nt
ole
agin
ou
sye
asts
Ope
rati
onm
ode
Ferm
enta
tion
base
dM
ediu
mO
leag
inou
sye
asts
Lipi
dpr
odu
ctiv
ity
(gL�
1h�
1)
Bio
mas
sco
nce
ntr
atio
n(g
L�1)
Lipi
dco
nte
nt
wli
pid
/dw
bio
mas
sR
ef.
Bat
ch-f
erm
enta
tion
Glu
cose
N-li
mit
edm
ediu
m(A
)C
.ol
eagi
nosu
s0.
0934
45C
urr
ent
wor
kB
atch
-fer
men
tati
onA
ceti
cac
idN
-ric
hm
ediu
m(B
)C
.ol
eagi
nosu
s0.
1322
72C
urr
ent
wor
kB
atch
-fer
men
tati
onC
o-fe
rmen
tati
onN
-lim
ited
med
ium
(C)
C.
olea
gino
sus
0.18
4373
.5C
urr
ent
wor
kB
atch
-fer
men
tati
onC
o-fe
rmen
tati
onN
-ric
hm
ediu
m(D
)C
.ol
eagi
nosu
s0.
5384
85C
urr
ent
wor
kB
atch
-fer
men
tati
onC
o-fe
rmen
tati
onLa
min
aria
digi
tata
hyd
roly
sate
C.
olea
gino
sus
0.59
114
64C
urr
ent
wor
kSe
mi-
con
tin
uou
sC
o-fe
rmen
tati
onN
-ric
hm
ediu
m(D
)C
.ol
eagi
nosu
s0.
923
585
Cu
rren
tw
ork
Con
tin
uou
sC
o-fe
rmen
tati
onN
-ric
hm
ediu
m(D
)C
.ol
eagi
nosu
s1.
224
084
Cu
rren
tw
ork
Bat
ch-f
erm
enta
tion
Co-
ferm
enta
tion
C.
olea
gino
sus
hyd
roly
sate
C.
olea
gino
sus
2.4
147
73C
urr
ent
wor
k
Bat
ch-f
erm
enta
tion
Co-
ferm
enta
tion
wit
hce
llob
iose
and
xylo
seN
-lim
ited
L.st
arke
yi0.
1231
.555
41
Bat
ch-f
erm
enta
tion
Glu
cose
Cor
nst
over
hyd
roly
sate
R.
gram
inis
0.23
4834
42B
atch
-fer
men
tati
onG
luco
seN
-lim
ited
R.
toru
loid
esY
40.
5410
6.5
67.5
43pH
-Sta
tfe
rmen
tati
onA
ceti
cac
idN
-ric
hC
.ol
eagi
nosu
s0.
6616
875
18Fe
d-b
atch
ferm
enta
tion
Glu
cose
N-li
mit
edY.
lipo
lyti
caN
S432
0.73
110
7744
Oxy
gen
-ric
hba
tch
ferm
enta
tion
Glu
cose
N-li
mit
edR
.gl
utin
is0.
8718
540
45
Paper Energy & Environmental Science

This journal is©The Royal Society of Chemistry 2019 Energy Environ. Sci., 2019, 12, 2717--2732 | 2729
A literature glucose-based TEA of yeast oil production pre-viously proposed $5.5 per kg as the estimated yeast lipid cost.8
The designed production plant had 12 fermenters (250 m3
each), with a total capacity of 10 000 megatons year�1. However,plant construction as part of the capital cost and maintenanceas part of the operational cost were not considered in thisreport. Moreover, labour and electricity costs were estimated tobe $25 000 year�1 worker�1 and $0.06 kW h, respectively; thesecosts have doubled since 2014.
The price of conventional palm oil is still quite low($0.50 per kg).9 However, eco-certified products, implying theuse of organic-certified oils in the matrix, are significantly moreexpensive ($2.1 per kg).76 Thus, the cost of the yeast-based oil issimilar to or less than that of eco-certified palm oil.
LCA for global warming potential GWP
Although we conducted a comprehensive LCA (see Table S22,ESI†) of the presented process chain for yeast oil production, wewere particularly interested in the GWP of the process comparedwith that of plant oil production. This focus was implemented inthe context of LCA analysis, in which GWP is the largest factoraffecting production of plant oil versus yeast oil.
The LCA indicated an overall global warming potential of3.56 kg CO2 equivalents to be emitted for every 1 kg yeast oilproduced. Yeast fermentation and electricity production contributed30% and 25% of the total CO2 emission, respectively (Fig. 8).
According to our defined model, procurement of the aceticacid generated 45% of the total CO2 emission. More specifically,in this acetic acid procurement chain, initial methanol production
Fig. 7 Comprehensive techno-economic cost analysis. (a) The contribution of capital cost (CAPEX), operation cost (OPEX), and raw material (RM) cost tothe overall MO lipid cost. (b) The contribution of major chemicals to the total raw material cost. (c) The contribution of operation cost sectors to the totaloperation cost.
Energy & Environmental Science Paper

2730 | Energy Environ. Sci., 2019, 12, 2717--2732 This journal is©The Royal Society of Chemistry 2019
from natural gas and acetic acid transport from China to Germanyvia diesel-powered train (approximately 12 500 km) were the mainelements responsible for significant CO2 emission. Therefore,obtaining the acetic acid in our defined process model wouldhave the most negative impact on the environment. Although ourdefined model represented the conventional route for procure-ment of acetic acid, alternative methods for procuring this feed-stock using existing bio-based acetic acid production processeswould significantly improve the environmental impact of thepresented process chain.21–23 In this context, acetate productionusing both carbon dioxide and hydrogen (generated by waterelectrolysis with sustainable energy) as fermentation substratescould significantly enhance the climate potential in the LCA.21–23
This particular scenario would reduce the reported 45% CO2
emission contribution and offer an indirect recycling methodfor the generated CO2 during fermentation and electricity produc-tion. Alternatively, oxidation of bio-ethanol to yield acetic acidmay be used and has already been established at an industrialscale in Sweden.77 This scenario could considerably reduce theclimate impact because it is based on bio-ethanol, which isgenerated by fermentative conversion of forestry waste streams.Alternatively, the use of an acetic acid supplier in Europe wouldsignificantly reduce the distance required for acetic acid trans-portation. However, in the current model, petrochemical aceticacid was used as a main feedstock for the yeast because ofeconomic reasons and a lack of commercial-scale LCA data.In order to obtain fully renewable oils, future work will focus onthe use of bio-based acetic acid.
A literature-based LCA of five plant-based oil productionprocesses indicated that generation of 1 kg palm oil, soybeanoil, rapeseed oil, sunflower oil, and peanut oil will generate 4.2,4.5, 2.9, 3.5, and 7.5 kg CO2 equivalents, respectively.48 Theseresults were similar to those obtained for current yeast oilproduction processes. Moreover, the CO2 emissions for yeastoil production were lower than those reported for the conven-tional palm oil production process. While palm oil is the most
industrially relevant plant oil, current yeast oil processes mayrepresent a favourable alternative. Indeed, the presented yeastoil production process has several inherent advantages overplant-based oils; in particular, it does not induce land usechange or negatively impact agricultural activity. Consequently,it does not compete with food production. Since fermentationcan be carried out in conventional stirred tank fermenters,it also has no negative impact on biodiversity.
In addition to these LCA results, the new process is com-pletely free of organic solvents, whereas conventional yeastlipid production and some plant oil processing requires toxicsolvent extraction.78 A previous TEA of conventional yeast oilproduction estimated an annual hexane need of about 444 tonsyear�1.8 By accepting the assumption that 98% of that hexanecan be recovered, a mean fugitive hexane emission of 2%during the storage, handling, distillation, and purificationwould result in emission of 8.9 tons year�1 hexane.
Conclusions
The production of plant-based oil-derived biofuels and sustain-able oleochemicals negatively affects biodiversity. This compe-tition results in increased food prices and accelerates changesin land use. The scenario intensifies, when the food demand ofa globally increasing population is taken into account, furtherdamaging sensitive ecosystems. Accordingly, it is important toidentify sustainable triglyceride production routes independentof terrestrial plant biomass. Yeasts have advantages over othersingle-cell lipid producers, such as microalgae or bacteria,because yeasts can grow rapidly to a relatively high cell density,facilitating their applications in single-cell lipid production.However, the carbon source, productivity, downstream proces-sing, and waste treatment may cause yeast oil production to becostly, creating a great price gap compared with plant-basedlipids.
Fig. 8 GHG emission from yeast lipid production during the production steps, starting from raw material procurement to the final product.
Paper Energy & Environmental Science

This journal is©The Royal Society of Chemistry 2019 Energy Environ. Sci., 2019, 12, 2717--2732 | 2731
In this study, we established an integrated operation forbioconversion of acetic acid and sugar to sustainable lipids atmaximum productivity with minimal waste generation andenergy consumption; the cost gap compared with plant-basedlipids was considerably reduced.
Microalgae are also promising lipid producers, and theprocess loop may be closed by direct fixation of the fermentativeCO2 during biomass and lipid formation. Additionally, yeast canutilise the O2 and sugars generated from microalgae biomass, andfermentative production of acetic acid, whether from bioethanol(based on microalgae biomass as feedstock) or CO2 and H2, canimprove the cycle sustainability. Application of such potentialfuture-state integrated autotrophic processes may help satisfyglobal demand for triglycerides while maintaining environmentalecosystems. We are currently performing studies to enhance anddiversify the productivity and applicability of the technology plat-form with respect to bio-based feedstocks and the generation oftailored lipid products for the food and pharmaceuticals markets.The latter will be achieved by combining both process- andgenetic engineering-related aspects associated with the microbialproduction host.79
The approach established in this report links previous effortsto a forward-thinking optimised approach. Thus, we believe thereare still many possible parameters to be optimised and meta-bolic modifications that can be implemented to further improveproductivity. Moreover, proteomic and metabolomic analysescould further guide process development.
Conflicts of interest
There are no conflicts of interest to report.
Acknowledgements
MM, DG, NM, and TB gratefully acknowledge the support of theWerner Siemens Foundation for establishing the Department ofSynthetic Biotechnology at the Technical University of Munich.MM and TB gratefully acknowledge financial support from theGerman Federal Ministry of Education and Research for the‘‘LIPOMAR’’ (grant number: 031A261) and ‘‘CO2 Lubricants’’(grant number: 033RC012B) projects. DG and TB would like toacknowledge the financial support of the ChiBio project (grantnumber: 289284) by the EU. We would like to gratefully acknow-ledge the expert opinion and consultation of Prof. Dr Uwe Arnold,managing director of AHP Group GmbH that allowed for signifi-cant improvements in our techno-economic analysis layout.Moreover, we gratefully acknowledge the expertise and assistanceof Mrs Elke Breitmayer (MSc) in improving our LCA assessment ofthe presented yeast oil production process.
References
1 US Energy Information Administration, Monthly EnergyReview July 2017, U.S. Department of Energy, USA, 2017.
2 J. Fargione, J. Hill, D. Tilman, S. Polasky and P. J. S.Hawthorne, Science, 2008, 319, 1235–1238.
3 T. Searchinger, R. Heimlich, R. A. Houghton, F. Dong,A. Elobeid, J. Fabiosa, S. Tokgoz, D. Hayes and T.-H. J. S. Yu,Science, 2008, 319, 1238–1240.
4 E. B. Fitzherbert, M. J. Struebig, A. Morel, F. Danielsen,C. A. Bruhl, P. F. Donald and B. Phalan, Trends Ecol. Evol.,2008, 23, 538–545.
5 B. Wicke, R. Sikkema, V. Dornburg and A. Faaij, Land UsePolicy, 2011, 28, 193–206.
6 A. T. McCurdy, A. J. Higham, M. R. Morgan, J. C. Quinn andL. C. Seefeldt, Fuel, 2014, 137, 269–276.
7 S. Pinzi, D. Leiva, I. Lopez-Garcıa, M. D. Redel-Macıas andM. P. Dorado, Biofuels, Bioprod. Biorefin., 2014, 8, 126–143.
8 A. A. Koutinas, A. Chatzifragkou, N. Kopsahelis,S. Papanikolaou and I. K. Kookos, Fuel, 2014, 116, 566–577.
9 Q. Gao, D. D. Binns, L. N. Kinch, N. V. Grishin, N. Ortiz,X. Chen and J. M. Goodman, J. Cell Biol., 2017, 216, 3199–3217.
10 P. Meesters, G. Huijberts and G. Eggink, Appl. Microbiol.Biotechnol., 1996, 45, 575–579.
11 Y. Liang, T. Tang, T. Siddaramu, R. Choudhary and A. L.Umagiliyage, Renewable Energy, 2012, 40, 130–136.
12 Y. Hwan Seo, I. Gyu Lee and J. In Han, Bioresour. Technol.,2013, 135, 304–308.
13 X. Zhang, S. Yan, R. D. Tyagi, R. Y. Surampalli and J. R.Valero, Fuel, 2014, 134, 274–282.
14 X. Xu, J. Y. Kim, Y. R. Oh and J. M. Park, Bioresour. Technol.,2014, 169, 455–461.
15 M. A. Masri, W. Jurkowski, P. Shaigani, M. Haack, N. Mehlmerand T. Bruck, Appl. Energy, 2018, 224, 1–12.
16 A. Meo, X. L. Priebe and D. Weuster-Botz, J. Biotechnol.,2017, 241, 1–10.
17 M. A. Masri, S. Younes, M. Haack, F. Qoura, N. Mehlmerand T. Bruck, Energy Technol., 2018, 6, 1026–1038.
18 L. Lardon, A. Helias, B. Sialve, J.-P. Steyer and O. Bernard,Environ. Sci. Technol., 2009, 43, 6475–6481.
19 K. A. Jung, S.-R. Lim, Y. Kim and J. M. Park, Bioresour.Technol., 2013, 135, 182–190.
20 K. Gao and K. R. McKinley, J. Appl. Phycol., 1994, 6, 45–60.21 J. H. Sim, A. H. Kamaruddin, W. S. Long and G. Najafpour,
Enzyme Microb. Technol., 2007, 40, 1234–1243.22 J. L. Gaddy, US Pat., US5593886A, 1997.23 M. Straub, M. Demler, D. Weuster-Botz and P. Durre,
J. Biotechnol., 2014, 178, 67–72.24 P. Pal and J. Nayak, Sep. Purif. Rev., 2017, 46, 44–61.25 E. V. LaBelle and H. D. May, Front. Microbiol., 2017, 8, 756.26 Z. Gong, H. Shen, W. Zhou, Y. Wang, X. Yang and
Z. K. Zhao, Biotechnol. Biofuels, 2015, 8, 189.27 Z. Chi, Y. Zheng, J. Ma and S. Chen, Int. J. Hydrogen Energy,
2011, 36, 9542–9550.28 X. Xu, J. Y. Kim, H. U. Cho, H. R. Park and J. M. Park, Chem.
Eng. J., 2015, 264, 735–743.29 V. Beligon, L. Poughon, G. Christophe, A. Lebert, C. Larroche
and P. Fontanille, Bioresour. Technol., 2015, 192, 582–591.30 P. Fontanille, V. Kumar, G. Christophe, R. Nouaille and
C. Larroche, Bioresour. Technol., 2012, 114, 443–449.
Energy & Environmental Science Paper

2732 | Energy Environ. Sci., 2019, 12, 2717--2732 This journal is©The Royal Society of Chemistry 2019
31 Z. Gong, W. Zhou, H. Shen, Z. Yang, G. Wang, Z. Zuo, Y. Houand Z. K. Zhao, Bioresour. Technol., 2016, 207, 102–108.
32 Z. Li, L. Zhang, X. Shen, B. Lai and S. Sun, WeishengwuxueTongbao, 2000, 28, 72–75.
33 A. L. Colombo, A. C. B. Padovan and G. M. Chaves, Clin.Microbiol. Rev., 2011, 24, 682–700.
34 J. M. Ageitos, J. A. Vallejo, P. Veiga-Crespo and T. G. Villa,Appl. Microbiol. Biotechnol., 2011, 90, 1219–1227.
35 E. G. Bligh and W. J. Dyer, Can. J. Biochem. Physiol., 1959, 37,911–917.
36 A. Ahamed and P. Vermette, Biochem. Eng. J., 2008, 40, 399–407.37 N. R. Baral, O. Kavvada, D. Mendez-Perez, A. Mukhopadhyay,
T. S. Lee, B. A. Simmons and C. D. Scown, Energy Environ. Sci.,2019, 12, 807–824.
38 F. Xu, J. Sun, N. Konda, J. Shi, T. Dutta, C. D. Scown, B. A.Simmons and S. Singh, Energy Environ. Sci., 2016, 9, 1042.
39 J. Sun, N. M. Konda, J. Shi, R. Parthasarathi, T. Dutta, F. Xu,C. D. Scown, B. A. Simmons and S. Singh, Energy Environ.Sci., 2016, 9, 2822–2834.
40 D. P. Petrides, Comput. Chem. Eng., 1994, 18, S621–S625.41 D. Petrides, Bioseparations Science and Engineering, 2000.42 SuperPro Designer, User’s Guide V10, http://www.intelligen.
com/downloads/SuperPro_ManualForPrinting_v10.pdf,accessed 2019.
43 D. Humbird, R. Davis, L. Tao, C. Kinchin, D. Hsu, A. Aden,P. Schoen, J. Lukas, B. Olthof and M. Worley, Process designand economics for biochemical conversion of lignocellulosicbiomass to ethanol: dilute-acid pretreatment and enzymatichydrolysis of corn stover, National Renewable Energy Lab.(NREL), Golden, CO (United States), 2011.
44 F. government, public service information, https://oeffentlicher-dienst.info/tv-l/west/.
45 National Renewable Energy Laboratory (NREL), U.S. LifeCycle Inventory Database, https://www.nrel.gov/lci/.
46 L. Schebek, The open source data platform for bio-energy inGermany, http://www.bioenergiedat.de/, accessed 2018.
47 C. Liptow, A.-M. Tillman, M. Janssen, O. Wallberg and G. A.Taylor, Int. J. Life Cycle Assess., 2013, 18, 1071–1081.
48 J. H. Schmidt, J. Cleaner Prod., 2015, 87, 130–138.49 S. Giannattasio, N. Guaragnella, M. Zdralevic and E. Marra,
Front. Microbiol., 2013, 4, 33.50 S. Papanikolaou and G. Aggelis, Eur. J. Lipid Sci. Technol.,
2011, 113, 1031–1051.51 Z. Ruan, W. Hollinshead, C. Isaguirre, Y. J. Tang, W. Liao
and Y. Liu, Bioresour. Technol., 2015, 183, 18–24.52 R. Kourist, F. Bracharz, J. Lorenzen, O. N. Kracht, M. Chovatia,
C. Daum, S. Deshpande, A. Lipzen, M. Nolan and R. A. Ohm,mBio, 2015, 6, e00918.
53 L. Liu, H. Redden and H. S. Alper, Curr. Opin. Biotechnol.,2013, 24, 1023–1030.
54 Z. Zhu, S. Zhang, H. Liu, H. Shen, X. Lin, F. Yang, Y. J. Zhou,G. Jin, M. Ye and H. Zou, Nat. Commun., 2012, 3, 1112.
55 F. Deeba, V. Pruthi and Y. S. Negi, Bioresour. Technol., 2016,213, 96–102.
56 Q. Gao, Z. Cui, J. Zhang and J. Bao, Bioresour. Technol., 2014,152, 552–556.
57 M. Xavier, A. Coradini, A. Deckmann and T. Franco, Biochem.Eng. J., 2017, 118, 11–19.
58 B. S. Dien, J. Zhu, P. J. Slininger, C. P. Kurtzman, B. R.Moser, P. J. O’Bryan, R. Gleisner and M. A. Cotta, RSC Adv.,2016, 6, 20695–20705.
59 S. Harde, Z. Wang, M. Horne, J. Zhu and X. Pan, Fuel, 2016,175, 64–74.
60 E. Palmqvist and B. Hahn-Hagerdal, Bioresour. Technol.,2000, 74, 17–24.
61 E. Palmqvist and B. Hahn-Hagerdal, Bioresour. Technol.,2000, 74, 25–33.
62 Z. Gong, Q. Wang, H. Shen, C. Hu, G. Jin and Z. K. Zhao,Bioresour. Technol., 2012, 117, 20–24.
63 S. Galafassi, D. Cucchetti, F. Pizza, G. Franzosi, D. Bianchiand C. Compagno, Bioresour. Technol., 2012, 111, 398–403.
64 Y. Li, Z. K. Zhao and F. Bai, Enzyme Microb. Technol., 2007,41, 312–317.
65 J. Friedlander, V. Tsakraklides, A. Kamineni, E. H.Greenhagen, A. L. Consiglio, K. MacEwen, D. V. Crabtree,J. Afshar, R. L. Nugent and M. A. Hamilton, Biotechnol.Biofuels, 2016, 9, 77.
66 J. G. Pan, M. Y. Kwak and J. S. Rhee, Biotechnol. Lett., 1986,8, 715–718.
67 K. V. Probst, L. R. Schulte, T. P. Durrett, M. E. Rezac andP. V. Vadlani, Crit. Rev. Biotechnol., 2016, 36, 942–955.
68 E. M. Grima, E.-H. Belarbi, F. A. Fernandez, A. R. Medinaand Y. Chisti, Biotechnol. Adv., 2003, 20, 491–515.
69 A. L. Stephenson, E. Kazamia, J. S. Dennis, C. J. Howe,S. A. Scott and A. G. Smith, Energy Fuels, 2010, 24,4062–4077.
70 J.-Y. You, C. Peng, X. Liu, X.-J. Ji, J. Lu, Q. Tong, P. Wei,L. Cong, Z. Li and H. Huang, Bioresour. Technol., 2011, 102,6088–6094.
71 K. Liang, Q. Zhang and W. Cong, J. Agric. Food Chem., 2012,60, 11771–11776.
72 C.-C. Fu, T.-C. Hung, J.-Y. Chen, C.-H. Su and W.-T. Wu,Bioresour. Technol., 2010, 101, 8750–8754.
73 G. Jin, F. Yang, C. Hu, H. Shen and Z. K. Zhao, Bioresour.Technol., 2012, 111, 378–382.
74 I. Herpoel-Gimbert, A. Margeot, A. Dolla, G. Jan, D. Molle,S. Lignon, H. Mathis, J.-C. Sigoillot, F. Monot and M. Asther,Biotechnol. Biofuels, 2008, 1, 18.
75 V. G. Gupta, M. Schmoll, A. Herrera-Estrella, R. Upadhyay,I. Druzhinina and M. Tuohy, Biotechnol. Biol. Trichoderma,Newnes, 2014.
76 Whole sell Alibaba, https://www.alibaba.com/product-detail/Best-Quality-cheap-organic-refined-Crude_60360488487.html?spm=a2700.7724838.2017115.32.19e47183hnS6af&s=p.
77 SEKAB, a chemical & cleantech company, http://www.sekab.com/.
78 S. Bemesson, Life cycle assessment of rapeseed oil, rapemethyl ester and ethanol as fuels – a comparison betweenlarge- and smallscale production, 2004, https://www.osti.gov/etdeweb/servlets/purl/20567425.
79 C. Gorner, V. Redai, F. Bracharz, P. Schrepfer, D. Garbe andT. Bruck, Green Chem., 2016, 18, 2037–2046.
Paper Energy & Environmental Science

Nature Reviews Chemistry | https://doi.org/10.1038/s41570-019-0118-y | Published online 2 July 2019
www.nature.com/natrevchem
Palm oil is useful because its low unsaturation confers oxidative stability desirable in kitchens and energy density desirable in fuels. The economic cost of palm oil is low, but the same cannot be said for its environmental cost, which includes habitat destruction and a net release of greenhouse gases. Triglycerides comparable to palm oil can be found in yeast grown on sugars produced from waste biomass and acetic acid from bacterial fermentation of CO/H2 or CO2/H2 mixtures. Although sustainable, these feedstocks can be expensive, and yeast oils form in low abundance and must be extracted with an organic solvent. In view of this, Mahmoud Masri, Daniel Garbe, Norbert Mehlmer and Thomas Brück describe in Energy & Environmental Science a sustainable and economical process in which yeast cells, cultured in a nitrogen-rich medium, are enzymatically digested to liberate high yields of biodiesel-ready oils.
When yeast has plenty of C, N, P and S, it readily produces nucleic acids, proteins and polysaccharides, the latter two constituting a large fraction of the biomass of what is a
rapidly growing culture. When the heteroatoms are in short supply, yeast instead expresses fatty acid synthases to store C, via acetyl coenzyme A, as triglycerides that can be converted into other biomass when heteroatoms are available. To produce biomass quickly but not at the expense of triglycerides, Brück’s team studied Cutaneotrichosporon oleaginosus, an oleaginous yeast that can comprise 80–90% triglyceride by dry weight (for reference, baker’s yeast is <10% triglyceride). Culturing C. oleaginosus with different concentrations of sugars, acetic acid and yeast extract (a source of nitrogen) gave different profiles of total biomass and lipid mass fraction over time. Although some conditions result in diauxic yeast growth (phases of low and high triglyceride production), using glucose and acetic acid with nitrogen in abundance results in high monoauxic growth, a desirable regime in which lipid and biomass production are decoupled. This high-yielding fermentation in aerated, stirred tanks has a smaller spatial footprint than a palm plantation and is not subject to seasonal variability.
A fraction of the C. oleaginosus culture was periodically harvested and the cell walls (comprising chitin, glucans and proteins) digested using extracellular hydrolases expressed in Trichoderma reesei, grown in a separate vessel. The C. oleaginosus lysate comprises a biomass phase used to feed T. reesei and an aqueous phase that is recycled to sustain the remaining C. oleaginosus, which can be further supported with a brown-algae-derived feed instead of glucose. A third gravimetrically separable oil phase (a mixture similar to palm oil), rich in triglycerides of oleic (C18, monounsaturated) and palmitic acid (C16, saturated), is produced that can be hydrolysed to produce fatty acids for biodiesel use. “The short fermentation time (enabled by simultaneous lipid and biomass production) and solvent-free lipid recovery improve economic and ecological process parameters,” notes Masri. Techno-economic analyses predict that the yeast oil (US$1.6 kg−1) would be cheaper than eco-certified palm oil (US$2.1 kg−1) and result in lower CO2 emissions.
It is remarkable how monoauxic growth with continually high triglyceride production can occur even in media with high N:C ratios. Brück and colleagues note that, regardless of the N:C ratio, C. oleaginosus expresses acetate coenzyme A ligase to directly convert acetic acid into acetyl coenzyme A. This enables fast and selective triglyceride production because fatty acid synthases from C. oleaginosus are particularly active. “We are working on a full proteomic and genomic analysis to identify these enzymes,” concludes Masri. A deeper understanding of the cellular systems biology would help improve an already promising system.
David Schilter
B I O F U E L S
Palms make way for oleaginous yeast
OrIgInaL artIcLE Masri, M. A. et al. A sustainable, high-performance process for the economic production of waste-free microbial oils that can replace plant-based equivalents. Energy Environ. Sci. https://doi.org/10.1039/C9EE00210C (2019)
The short fermentation time … and solvent-free lipid recovery improve economic and ecological process parameters
Cre
dit:
Dav
id S
chilt
er/S
prin
ger N
atur
e Li
mit
ed
R e s e a R c h h i g h l i g h t s
464 | August 2019 | volume 3

1 | P a g e
A sustainable, high-performance process for the economic production of waste-free microbial oils that can replace plant-based equivalents
Mahmoud A. Masria, Daniel Garbea, Norbert Mehlmer*a, and Thomas Brück*a
aDepartment of Chemistry, Werner Siemens Chair of Synthetic Biotechnology, Technical University of
Munich
*Corresponding authors ([email protected]; [email protected])
Supplementary Data
Electronic Supplementary Material (ESI) for Energy & Environmental Science.This journal is © The Royal Society of Chemistry 2019

2 | P a g e
1.1. Maximizing lipid productivity
Figure S1: fluorescence microscope imaging shows a remarkable increase in the cell volume and lipid content for: Glucose-based fermentation in minimal nitrogen media (on the lift) and co-fermentation in rich nitrogen media (on the right).
Figure S2: Growth rates and lipid accumulation during acetic acid and glucose co-fermentation in nitrogen-rich medium applying continuous fermentation mode. (a) Growth rates determined via the optical density. (b) Growth rates determined via the cell count. (c) Growth rates determined via the gravimetric method. (d) Lipid accumulation and productivity determined via the gravimetric method.

3 | P a g e
Figure S3: The increase in intensity of the forward scatter [FSC] (on x axis) and side scatter [SSC] (on y axis) over the acetic acid and glucose co-fermentation time in rich nitrogen media. The fermentation was carried out at: 25-liters, temp.: 28°C, pH 6.5 and
pO2≥ 50%.
Figure S4: The changes in fatty acid profile over the acetic acid and glucose co-fermentation time in rich nitrogen media. The fermentation was carried out at: 251-liters, temp.: 28°C, pH 6.5 and pO2≥ 50%.

4 | P a g e
Table S1: Yeast biomass analysis at the end of the semi-continuous run%(w/w) Method
Sugar 8.3 Chemical hydrolysis with H2SO4 at 1% and 3%Lipid 87.6 3 times extraction with Folch solution
(chloroform : methanol, in a 2:1 (vol/vol) ratioprotein 3.5 Kjeldahl method, Kjeldahl factor 6.25Ash 0.6 Incineration at 1200°C, 3h
1.2. Downstream processing and lipid recovery
Figure S5: Evaluation of produced enzymes from T. reesei ATCC 13631 and RUT C-30 (ATCC 56765) on purified C. oleaginosus-processed biomass (a b) and fresh culture (c d). (a) Relative decrease in the C. oleaginosus biomass weight over the enzymatic hydrolysis time using T. reesei (ATCC 13631). (b) Relative decrease in the biomass weight over the enzymatic hydrolysis time using T. reesei RUT C-30 (ATCC 56765). (c) Relative residual biomass weight after 12 and 18 h of incubation with the following enzyme systems: mixes 1 and 2 (commercial mixtures), T. reesei ATCC 13631, and T. reesei RUT C-30 (ATCC 56765). (d) Relative released lipid weight after 12 and 18 h of incubation with the following enzyme systems: mixes 1 and 2 (commercial mixtures), T. reesei ATCC 13631, and T. reesei RUT C-30 (ATCC 56765).Controls: Control1(negative control): the biomass amount before treatment. Control2(positive control): Samples are incubated at same pH, tempreture and time but without addting enzyme. Solvent extreacton: amout of lipid which abtained after 3 times extraction with Folch solution (chloroform : methanol, in a 2:1 (vol/vol) ratio.

5 | P a g e
Figure S6: Yeast culture with high lipid content (75% w/w) after centrifugation at 15,000g for 30 min.
Figure S7: Electron microscope image for C. oleaginosus cells after treatment with high pressure homogenizer for 3 times at 2400 bar.
1.3. Recycling biomass and hydrolysate fractions

6 | P a g e
1.4. TEA
The TEA was carried out to estimate the total capital investment and operating cost for process flowsheets
that could be used for the production of lipids from oleaginous yeast.
Due to the lack of major databases (such as NREL) in process design related to the oil production from
oleaginous yeasts, process and economic data were collected from data generated in this study.
Additionally, parameters extracted from available literature sources1-3, 4 and intgrated mathematical
function in SuperPro Designer version 10 - Intelligen, Inc. (SPD) were applied.
The Techno-Economic Analysis (TEA) was carried out for the estimation of the total capital investment and
operating cost for process flowsheets that can be used for the production of yeast lipids. The industrial
plant is required to operate 24 h daily, 7 days per week, which amounts to 8300 h y-1. A standby fermenter
and centrifuge are used to avoid maintenance-based operation downtime. With these prerequisites, the
production capacity is of 23,000 t y-1. The mass and energy balances as well as equipment sizing were
determined using Excel spreadsheets and validated by SuperPro Designer V10 (Intelligen, Inc.).Instilation
factors, additional direct and indirect capital costs were estimated as presentage based on a Provoius NREL
publication about bioethanol production.5
Raw materials amounts were estimated based on the final lipid yield. A built-in mathematical function in
SPD adjusts the equipment purchase price based on the required size of process equipment and the
analysis year (2018). All the capital and operating data extracted from SPD are used to determine the
minimum selling price.
A simplified process flow diagram (fig. S8) was generated based on the data presented in the paragraphs
(2.1, 2.2 and 2.3). Thus, the co-fermentation in rich nitrogen media was carried out in consuming base
feeding mode. The applied lipid productivity was of 1.4 g L-1 h-1 [biomass: 200 g L-1 with lipid content of
83% (w/w), after 120 h]. The applied lipid productivity considers a basline productivity value that was
determined in the current study current for generation of a conservative TEA scenario.
As co-fermentation enables concurrent biomass growth and the lipid accumulation the mass balances
were calculated by a single stoichiometric equation during the fermentation. The stoichiometric
coefficients were appropriately calculated based on applied media and feed composition as well as the
recoded biomass and lipid yields respectively. Lipid-biomass (biomass including the lipid, C61H110.5O9.8N1.55)
was formulated based on the element analysis of C, H, N, and O. Amino acids formula C5.35 H9.8O2.45N1.5 is
the average molecular of amino acid and it taken form Koutinas et al1:

7 | P a g e
(1) 0.1875 C5.35 H9.8O2.45N1.5 + 7.496 CH3COOH + 0.27778 C6H12O6 + 2.2536 O2 →
→ 0.18633 C61H110.5O9.8N1.55 + 6.25 CO2 + 7.33 H2O
By enzymatic hydrolysis, lipid-biomass is converted to glucose, amino acid, released lipid (C57 H104 O6), and
non-lipid biomass (C4 H6.5 O1.9 N0.7). Glyceryl trioleate (C57 H104 O6) has been used representatively for the
lipid formula since the C18:1 fatty acid comprises 53% (w/w) of total fatty acid profile (Based on FAMEs
analysis). The non lipid-biomass formula (C4H6.5O1.9N0.7) was extracted from Babel and Muller.6
(2) 0.18633 C61H110.5O9.8N1.55 + 6.25 CO2 + 0.23340 H2O →
→ 0.08066 C6H12O6 + 0.14998 C5.35 H9.8O2.45N1.5 +0.17200 C57 H104 O6 + 0.0804 C4H6.5O1.9N0.7
Figure S8 shows the process flow diagram for the yeast lipid production. Water, glucose and nitrogen
sources (such as peptone and yeast extracts) are fed to the bioreactor (FR-101) (estimated process
duration:6 h). Acetic acid is used as a feed during the fermentation time. In-situ sterilization is
performed for 20 min at 121°C. After cooling, the fermentation starts by adding the inoculum at
OD:0.1. The fermentation is controlled at 28°C, pH 6.5 (process duration:120h). The whole culture is
transferred out to the enzymatic hydrolysis reactor (R-101). Transferring out, and transferring in are
connected processes, running in parallel (estimated process duration:8 h). The enzymatic hydrolysis
starts by adding the enzyme (process duration:20h). The final centrifugation (CD-101) will start in
parallel to transferring the culture out from R-101 (estimated process duration:8 h). After
centrifugation, 3 phases are generated. The upper phase contains pure lipid. The middle phase
contains residual biomass. The lower phase contains the hydrolysate which is transferred (in parallel
to centrifugation) into a cross-flow filtration unit (UF-101). The filtration results in a retentate fraction
estimated to be 10% (v/v), the remaining filtrate will be about 90% (v/v). The filtrate will be mixed
with additional amount of sugar and nutrition (in MX-103) and used for subsequent fermentation
processes. Major operating and process parameters used to develop the process model and
determine the required material are listed in the Table2.

8 | P a g e
Table S2: Major operating and process parameters used to develop the process model and determine the required materialProcess parameters Unite Baseline Optimal Process parameters Unite Baseline Optimal
Feed stock Enzymatic hydrolysis
Acetic acid $ per kg 0.2 0.1 hydrolysis time h 24 20
Sugar $ per kg 0.3 0.2 Lipid release % w/w 86 86
Peptone/ yeast extract $ per kg 0.3 0.2non-lipid biomass conversion to nutrition*
% w/w 80 95
Enzyme load* % (w/wbiomass) 1.4 -
Centrifugal gas compressor Enzyme price5 $ per kg 4 2
volumetric throughput7, 8 m3 min-1 380 - Power consumption kw m-3 0.05 -
Pressure change4 bar 5 - hydrolysis temperature* °C 45/37 50/37
Steam flow rate kg h-1 1300 -
Power consumption9, 10 kw 6348 - Heat transfer efficiency % 98 100
Efficiency % 70 90 Power dissipation to heat % 100 -
Fermentation Centrifugation
RM loading time1 h 8 6 volumetric throughput m3 h-1 160 -
Sterilization1 h 1.5 1.5Lipid separation efficiency7, 8 % w/w 90 95
Lipid Productivity* g L-1 h-1 1.4 2.4 water contain in the non-lipid biomass 7 % w/w 50 -
Fermentation time* h 120 72 Centrifugation time h contentious
Biomass content* g L-1 200 190 Power consumption9 kw m-2 0.2 -
Lipid content* % (w/w) 83 85Sedimentation efficiency7, 8 % 30 50
transfer out to reactor1 h 8 6
Power consumption9, 10 kw m-3 3 - Filtration
Aeration rate1, 11 vvm 0.8 0.5Rejection co-efficient for protein7, 8 % w/w 95 -
Power dissipation to heat12 % 50 - Filtration time h 10 8
Pressure inside fermenter** bar 1.25 - 1.5 Recovery
(filtrate/feed)*** % w/w 90 95
Yeast Hydrolysate Power consumption kw 156 -
Sugar content* g L-1 18 24 Power dissipation to heat12 % 10 -
Nitrogen content* g L-1 8 15 Filtrate flux L m-2 h 32
*Based on the current process paramneters and current results. ** Based on the fermentation paramenters at 25-L to red. ***Based on the recycling experiments.

9 | P a g e
Figure S8: The simplified process flow diagram for the lipid production from yeast.

10 | P a g e
Table S3: Capital cost-list of equipment specification and PC cost according to market analysis in 2018-SuperPro designer V10.
Quantity
# ItemUnite
Purchased Cost(PC)
In process
Standby
Total
Total Purchased Cost
(PC)
Installation factor* Installed cost Ref.
1 Fermenter, Vessel Volume = 250.00 m3 2,333,000 10 1 11 25,663,000 1.60 41,060,800
SuperPro Designer (V10)
Built-in cost model (Year analysis 2018)
2 Stirred Reactor Vessel Volume = 248.76 m3 1,773,000 3 1 4 7,092,000 1.60 11,347,200
SuperPro Designer (V10)
Built-in cost model (Year analysis 2018)
3 Bending Tank, Vessel Volume = 150.00 m3 178,000 2 - 2 356,000 1.60 569,600
SuperPro Designer (V10)
Built-in cost model (Year analysis 2018)
4 Storage/ Receiving Tank, Vessel Volume = 250.00 m3 78,000 3 - 3 234,000 1.70 397,800
SuperPro Designer (V10)
Built-in cost model (Year analysis 2018)
5 Decanter Centrifuge, Throughput = 159919.85 L/h 243,000 1 1 2 486,000 1.60 777,600
SuperPro Designer (V10)
Built-in cost model (Year analysis 2018)
7Centrifugal Compressor Compressor Power = 2115.79 kW
2,212,000 3 - 3 6,636,000 1.60 10,617,600
SuperPro Designer (V10)
Built-in cost model (Year analysis 2018)
8Ultrafilter Membrane Area = 77.69 m2, shell & tube, stainless steel
124,000 27 - 27 3,348,000 1.8 6,026,400
SuperPro Designer (V10)
Built-in cost model (Year analysis 2018)
9
Air Filter Rated Throughput = 12112043.16 L/h, shell & tube, stainless steel
43,000 1 1 2 86,000 1.80 154,800
SuperPro Designer (V10)
Built-in cost model (Year analysis 2018)
Total cost 43,901,000 70,951,800
Interest 4,257,108 Estimated as: 6% of the PC
EQU
IPM
ENT
SPEC
IFIC
ATIO
N A
ND
FOB
COST
(201
8 pr
ices
)
Total Installed Costs 75,208,908
*The installation Factor is obtained from Provoius NREL publication about bioethanol production.5

11 | P a g e
Table S4: Capital cost-list of additional direct capital cost.
# Item Description Installed Cost Factor Cost Ref.
1 Warehouse , On-site storage of equipment and supplies. 70,951,800 0.04 2,838,072 Estimated as: 4.0%%
of the ISBL
2 Site development
Includes fencing, curbing, parking lot, roads, well drainage, rail system, soil borings, and general paving. This factor allows for minimum site development assuming a clear site with no unusual problems such as right-of-way, difficult land clearing, or unusual environmental problems.
70,951,800 0.090 6,385,662 Estimated as: 9%% of the ISBL
3 Additional pipingTo connect ISBL equipment to storage and utilities outside the battery limits
70,951,800 0.045 3,192,831 Estimated as: 4.5%% of the ISBL
Total 12,416,565
Addi
tiona
ll di
rect
cap
ital c
ost
Total Direct Costs (TDC) 83,368,365

12 | P a g e
Table 5: Capital cost-list of additional indirect capital cost.
# Item DescriptionTotal Direct Costs
Factor Cost Ref.
1 Prorateable costs This includes fringe benefits, burdens, and insurance of the construction contractor.
83,368,365 0.10 8,336,837
Estimated as: 10% of total direct cost
(TDC)
2 Field expenses
Consumables, small tool and equipment rental, field services, temporary construction facilities, and field construction supervision.
83,368,365 0.10 8,336,837
Estimated as: 10% of total direct cost
(TDC)
3 Home office andconstruction
Engineering plus incidentals, purchasing, and construction 83,368,365 0.20 16,673,673
Estimated as: 20% of total direct cost
(TDC)
4 Project contingency
Extra cash on hand for unforeseen issues during construction. 83,368,365 0.10 8,336,837
Estimated as: 10% of total direct cost
(TDC)
5 Other costs
Start-up and commissioning costs. Land, rights-of-way, permits, surveys, and fees. Piling, soil compaction/dewatering, unusual foundations. Sales, use, and other taxes. Freight, insurance in transit, and import duties on equipment, piping, steel, instrumentation, etc. Overtime pay during construction. Field insurance. Project team. Transportation equipment, bulk shipping containers, plant vehicles, etc.
8,336,837 0.10 8,336,837
Estimated as: 10% of total direct cost
(TDC)
Indi
rect
cap
ital c
ost
Total Indirect Costs 50,021,019
Total Capital Investment (TCI) Total Direct Costs (TDC) + Indirect costs 133,389,384
Table S6: Operation cost-list of labor cost according to German TV-L tariff.
# ItemAnnual cost per person Amount Cost Ref.
1 Operator (Full Cost) E10 83,305 30
2,499,150 Official service, full-cost list based on TV-L E10
2 QC Analyst (Full Cost) E13
114,599 9
1,031,391 Official service, full-cost list based on TV-L E13
3Management/ Administration (Full Cost) E14
119,415 3
358,245 Official service, full-cost list based on TV-L E14
LABO
R CO
ST
Total 3,888,786

13 | P a g e
Table S7: Operation cost-list of Facility-dependent cost.
# Item Annual cost Factor Cost Ref.
1 Maintenance 83,368,365 0.03 2,128,554 Estimated as 3% of total direct fixed capital.
2 Property insurance 133,389,384 0.007 496,663 Estimated as 0.7% of total capital investment (TCI).
Facility-dependent Total 2,625,217
FACI
LITY
-DEP
ENDE
NT
COST
Total fixed operating costs
Labor cost + facility-dependent 6,514,003
Table S8: Operation cost-list of Utility cost, Ref.: SuperPro designer V10
# Item Unite cost Quantity Ref. Units Total Cost Ref.
1 Std Power 0.1 81,588,099 kW-h/year 81,588,099 8,158,809.90
The consumption amount based on SuperPro Designer
(V10). The cost of kW-h is based on German price of Std power
2 Steam 5.0 101,320 MT/year 101,320 506,600
3 Cooling water 0.05 11,356,146 MT/year 11,356,146 567,807 SuperPro Designer (V10)
4 Chilled water 0.40 5,693,853 MT/year 5,693,853 2,277,541
5
Saving (Exist in the process due
to heat recovery)
1.00 1,573,600 - 1,573,600 1,573,600 uperPro Designer (V10)
6 Saving (Steam Recycling) 5.00 99,588 MT/year 99,588 497,940 uperPro Designer
(V10)
7Saving (Cooling
water Recycling)
0.05 8,327,840 MT/year 8,327,840 416,392 SuperPro Designer (V10)
UTI
LITI
ES C
OST
(Ger
man
y 20
18 p
rices
in $
)
Total 9,022,826

14 | P a g e
Table S9: RM cost according to market analysis in 2018.
# Item Unite cost Quantity Cost Ref.
1 Acetic acid 0.2 68,588,400 13,031,796 Whole sell market "Alibaba website"
2 Glucose 0.3 5,517,770 1,655,331 Whole sell market "Alibaba website"
3 Enzyme 4 103,700 414,800 Novozymes company.
4 Amino acid 0.2 915,398 183,080 Source like yeast extract or peptone. Whole sell market
"Alibaba website"
RAW
MAT
RIAL
S
Total 15,285,007
Table S10: Revenues- the annual productivity of lipid, biomass and animal feed based on designee process.
# Item Unit cost Quantity Total Cost
1 Lipid 1.60 23,163,170 37,061,072 Estimated
2 Biomass 0.35 1,159,905 405,967 Market cost
3 Animal Feed (concentrated protein after cross-flow) 0.35 439,787 153,925 Market cost
REVE
NU
ES
Total 37,620,964
Table S11: The cost summary of Capital cost (CAPX), Operation cost (OPEX) and Raw Martials cost (RM) against the revenues.
# Items Description Cost
1 CAPEX Total / 20 years depreciation 6,669,469.20
2 OPEX Including: Lab, maintenance and utility 15,536,828.78
3 RM All chemicals are included 15,285,006.60
Total cost 37,491,305
SUM
MAR
Y
Revenues 37,620,964

15 | P a g e
Figure S9: Lipid cost sensitivity to acetic acid and glucose cost.
Figure 10:Lipid cost sensitivity to aerations need, electric power tariffs and compressor efficiency.

16 | P a g e
Figure S11: Lipid cost sensitivity to the main process input parameters.

17 | P a g e
Figure S12: Eclectic power usage in the plant
0 20 40 60 80 100 120 1400
50
100
150
200
250
B1 B2 B3 B4 B5 B6
Cultivation time (h)
[Bio
mas
s] g
L-1
Figure S13: Six biological replication to validate the reproducibility of achieved lipid productivity.

18 | P a g e
1.5 LCA
Figure S14: (a) Map showing the proposed location for the production plant. The brown algae collection area is shadowed in red. (b) Map showing the train route for acetic acid transportation from China. (c) The production system used in this study.
Figure S15: The Sankey diagram of the mass balance for the functional unit 1 kg Oil.

19 | P a g e
Table S12: Inventory of yeast fermentation according to the chosen productivity and current process design (This work).
InputFlow Amount Unit Description
Acetic acid, at fermentation plant,2.96 kg
According to the SuperPro Designer, based on amount of acetic acid consumed during the fermentation
Calcium chloride, CaCl2, at regional storage
5.48E-06 kgMedium formula
Yeast hydrolysate 4.16 kg According the current process design
Digitata hydrolysate8.2E-05 m3
According to the SuperPro Designer, based on amount of sugar consumed during the fermentation
Magnesium sulphate, at plant 1.64E-05 kg Medium formula
Electricity, biogas CHP, at plant
1.547 kWh
According to the SuperPro Designer, the total Electricity consuming by Air compressor, Air filtration, fermenter 250m3, and centrifuge is813496 m3 , the no. of batches per year 63, mass of biomass per batch 50000 kg
Water, process and cooling, surface
0.258 m3
According to the SuperPro Designer, the total cooling water consuming by Air compressor, Air filtration, fermenter 250m3, and centrifuge is813496 m3 , the no. of batches per year 63, mass of biomass per batch 50000 kg
Output Flow Amount Unit Description
Acetic acid/ emission to air 1.14E-10 kg According to the SuperPro Designer,Carbon dioxide/emission to air 1.11 kg According to the SuperPro Designer,
Oily-yeast biomass (200 g/L) culture
5 kgBased on the biomass productivity 1.7 g L-1 h-1 [biomass: 200 g L-1 with lipid content of 85% (wlipid/dwbiomass), after 120 h]

20 | P a g e
Table S13: Inventory of the enzymatic hydrolysis of the yeast culture after the fermentation (This work).
InputFlow Amount Unit Description
Cell hydrolase0.027 kg
Based on the enzyme dose hydrolase: 0.8% (w/dwbiomass) & Protease: 0.5% (w/dw) Enzyme/ biomass
Oily-yeast biomass (200 g/L) culture 5 kg Resulted from fermentation
Electricity, biogas CHP, at plant 1.13 kWh
According to the SuperPro Designer, the total Electricity consuming by 5 times reactor 250m3, and steam generator for (20 h at 50°C & (8 h at 37°C), then centrifuge is 813496 m3 , the no. of batches per year 63, mass of biomass per batch 50000 kg
OutputFlow Amount Unit Description
C. oleaginosus hydrolysate 4.16 kg According the current process design
Non-lipid biomass 0.04 kg Based on the enzyme hydrolysis yield: 80% (w/w)
Oil, from oily yeast, TAG 1 kg Based on the lipid productivity 1.4 g L-1 h-1 [biomass: 200 g L-1 with lipid content of 85% (wlipid/dwbiomass), after 120 h]

21 | P a g e
Table S14: Inventory of the enzymatic hydrolysis of L.Digitata (This work).
InputFlow Amount Unit Description
Acetic acid, at Fermentation plant, 4 kg Used As buffer solution (50mM)
Cell hydrolase 1.05 kgBased on the enzyme dose hydrolase: 1.3 % (w/dw). (Masri et al, 2018)
L.digitata, at plant, truck 70 kg form The previous inventory (Table xx)
Sodium hydroxide 2 kg Used As buffer solution (50mM)
Electricity, biogas CHP, at plant1.325 kWh
According to the SuperPro Designer, the total Electricity consuming by 5 times reactor 250m3, and steam generator for 72h, 50°C.
Water, unspecified natural origin/m30.9 m3 According to the SuperPro Designer, the total
water consuming steam generator for 72h, 50°C.
OutputFlow Amount Unit Description
L.digitata Hydrolysate 1 m3 Based on results presented in (Masri et al, 2018)
Residual L.digitata biomass 21.05 kgBased on results presented in (Masri et al, 2018)
Table S15: Inventory of hydrolase production from T. reesei (This work).
InputFlow Amount Unit Description
L.digitata Hydrolysate 0.02 m3 Based on the media composition according to(Aftab et al 2008)
Non-Lipid Biomass 10 kg Based on the media composition 10g L-1
Strom, Biogas BHKW, ab Anlage 1.12 kWh According to the SuperPro Designer, the total Electricity consuming by fermenter 250m3, and steam generator for 120h, 28°C.
OutputFlow Amount Unit
Carbon dioxide 1.40 kg According to the SuperPro Designer, estimated CO2 released.
Enzyme, Mixed activities, T. reesei 1 kg Based on the results presented in the work
Table S16: Inventory of L. digitata growth (This work).
Input

22 | P a g e
Flow Amount Unit Description
Carbon dioxide/ absorption from air
1.47 kg A theoretical calculation based on the C content in the produced biomass
Nitrate/ absorption from soil 0.031 kg A theoretical calculation based on the N content in the produced biomass
OutputFlow Amount Unit
L.digitata 1 kg
Table S17: Inventory of truck (>32 ton) operation (BioEnergieDat Database).
InputFlow Amount Unit Description
Diesel, low-Sulphur, at regional storage
0.042 kg
OutputFlow Amount Unit
Operation Truck >32t, EURO3_ei/Tremod
1 t*km
Acetaldehyde /emission to air 1.32E-05 kg
Ammonia /emission to air 0.15 kg
Benzene /emission to air 1.28E-06 kg
Cadmium /emission to air 6.05E-06 kg
Cadmium /emission to soil 3.61E-06 kg
Cadmium, ion /emission to water 3.61E-06 kg
Carbon dioxide /emission to air 0.14 kg
Carbon monoxide /emission to air 0.0003 kg
Chromium /emission to air 0.000064 kg
Chromium /emission to soil 1.71E-05 kg
Chromium VI /emission to air 5.12E-09 kg
Chromium, ion /emission to water 1.71E-05 kg
Copper /emission to soil 0.0002 kg
Copper /emission to air 0.004 kg
Copper, ion /emission to water 0.0002 kg
Dinitrogen monoxide /emission to air 0.22 kg
Ethane, 1,1,1,2-tetrafluoro-, HFC-134a /emission to air
3.92E-07 kg

23 | P a g e
Formaldehyde /emission to air 2.43E-05 kg
Heat, waste /emission to air 2326.92 MJ
Hydrocarbons, halogenated, unspecified /emission to air
6.75E-05 kg
Lead /emission to soil 0.0002 kg
Lead /emission to water 0.0002 kg
Lead /emission to air 0.0002 kg
Mercury /emission to air 1.03E-08 kg
Methane, fossil /emission to air 1.62E-06 kg
Nickel/emission to air 6.39E-05 kg
Nickel /emission to soil 4.66E-05 kg
Nickel, ion /emission to water 4.66E-05 kg
Nitrogen oxides /emission to air 0.001 kg
NMVOC, non-methane volatile organic compounds, unspecified
origin /emission to air
6.59E-05 kg
PAH, polycyclic aromatic hydrocarbons /emission to air
1.71E-10 kg
Particulates, < 10 um /emission to air 9.45E-07 kg
Particulates, < 2.5 um /emission to air
2.97E-05 kg
Particulates, > 2.5 um, and < 10um /emission to air
8.58E-07 kg
Selenium /emission to air 5.12E-07 kg
Sulfur dioxide /emission to air 7.06E-07 kg
Toluene /emission to air 5.40E-07 kg
Xylene /emission to air 5.40E-07 kg
Zinc /emission to air 0.002 kg
Zinc /emission to soil 0.01 kg
Zinc, ion /emission to water 0.01 kg
Table 18: Inventory of tractor operation (BioEnergieDat Database).
InputFlow Amount Unit Description
Diesel, low-Sulphur, at regional storage
1 kg
Output

24 | P a g e
Flow Amount UnitOperation Tractor 1 kg
Carbon dioxide /emission to air 3.12 kgCarbon monoxide /emission to air 0.003 kg
Dinitrogen monoxide /emission to air 0.22 kgMethane, fossil /emission to air 0.000128 kg
Sulfur dioxide /emission to air 0.001 kgNitrogen dioxide 0.0001 kgNitrogen oxides 0.04 kg
Table S19: Inventory of acetic acid production and transportation from China (US LCI database).
InputFlow Amount Unit Description
CUTOFF Disposal, solid waste, unspecified, to sanitary landfill
0.001kg
Electricity, at cogent, for natural gas turbine
0.002kWh
Electricity, at grid, US, 2000 0.02 kWhMethanol, at plant 0.54 kg
Natural gas, combusted in industrial boiler
0.22m3
Natural gas, processed, at plant 0.44 m3Transport, barge, diesel powered 0.01 t*kmTransport, barge, residual fuel oil
powered0.03
t*km
Transport, combination truck, diesel powered
0.005t*km
Transport, pipeline, natural gas 0.49246 t*kmTransport, pipeline, unspecified
petroleum products0.000867
t*km
Transport, train, diesel powered 0.004925 t*kmTransport, train, diesel powered 12.5
t*kmBased on the suggested train way from China to Hamburg (about 12, 000 km)
OutputFlow Amount Unit
Acetic acid, at plant in Hamburg 1 kgAcids, unspecified /emission to water 0.00096 kg

25 | P a g e
Ammonia/emission to air 0.00057 kgAmmonia /emission to water 0.000052 kg
Carbon dioxide /emission to air 0.00176 kgCarbon monoxide /emission to air 0.00397 kg
Methanol /emission to air 0.00004 kgRecovered energy, at acetic acid
production0.18841
MJ
TOC, Total Organic Carbon /emission to air
0.00217kg
Table 20: Inventory of methanol production in China (US LCI database).
InputFlow Amount Unit Description
CUTOFF Disposal, solid waste, unspecified, to sanitary landfill
0.0005 kg
Electricity, at grid, US, 2008 0.0081 kWhNatural gas, combusted in industrial
boiler0.13 m3
Natural gas, processed, for olefins production, at plant
0.62 kg
Oxygen, in air 0.38 kgTransport, combination truck, diesel
powered0.01 t*km
Transport, pipeline, natural gas 0.998 t*kmTransport, train, diesel powered 0.00997 t*km
Water, process, unspecified natural origin/m3
0.00054 m3
OutputFlow Amount Unit
BOD5, Biological Oxygen Demand /emission to water
0.000058 kg
Carbon dioxide /emission to air 0.53 kgMethanol, at plant 1 kg
NMVOC, non-methane volatile organic compounds, unspecified
/emission to air0.005 kg
Suspended solids, unspecified /emission to water
0.000088 kg

26 | P a g e
Table 21: Inventory of natural gas combusted in industrial equipment (US LCI database).
InputFlow Amount Unit Description
Natural gas, processed, at plant 1 m3Transport, combination truck,
average fuel mix0.20 t*km
Transport, pipeline, natural gas 1.19 t*kmTransport, train, diesel powered 0.01 t*km
OutputFlow Amount Unit Description
Acetaldehyde /emission to air 6.54E-07 kgAcrolein /emission to air 1.05E-07 kgBenzene /emission to air 1.96E-07 kg
Benzene, ethyl- /emission to air 5.23E-07 kgButadiene /emission to air 7.03E-09 kg
Carbon dioxide, fossil /emission to air
1.96 kg
Carbon monoxide, fossil /emission to air
0.00024 kg
Formaldehyde /emission to air 0.000012 kgMethane, fossil /emission to air 0.00014 kg
Naphthalene /emission to air 2.124E-08 kgNatural gas, combusted in industrial
equipment1 m3
Nitrogen oxides /emission to air 0.0017 kgPAH, polycyclic aromatic
hydrocarbons /emission to air3.5945E-08 kg
Particulates, > 2.5 um, and < 10um /emission to air
0.00011 kg
Propylene oxide /emission to air 4.7383E-07 kgSulfur oxides /emission to air 0.00001 kg
Toluene /emission to air 0.000002 kgVOC, volatile organic compounds
/emission to air0.00003 kg
Xylene /emission to air 1.0457E-06 kg

27 | P a g e
Table 22: Life cycle assessment and impact analysis for 1 kg yeast lipid production.
Name Inventory result Unit Impact factor Impact
result Impact co-factor
1 Eutrophication - generic 0.00339 kg PO4--- eq.
1.1 Transport, train, diesel powered - DE
0.00241 kg PO4--- eq.
Nitrogen oxides 0.018 kg 0.13 0.0024 kg PO4--- eq.
1.2 Acetic acid, at plant - CN 0.00065 kg PO4--- eq.
Ammonia 0.002 kg 0.35 0.00059 kg PO4--- eq.
Ammonia 0.0001 kg 0.35 5.39E-05 kg PO4--- eq.
1.3 Natural gas, combusted in industrial boiler - RNA
0.00019 kg PO4--- eq.
Nitrogen oxides 0.001 kg 0.13 0.00018 kg PO4--- eq.
Dinitrogen monoxide 3.13E-05 kg 0.27 8.46E-06 kg PO4--- eq.
1.4 L.digitata Growth 0.00013 kg PO4--- eq.
Nitrate 0.001 kg 0.1 0.00013 kg PO4--- eq.
2 Photochemical oxidation - high Nox
0.00043 kg ethylene eq.
2.1 Acetic acid, at plant - CN 0.00033 kg ethylene eq.
Carbon monoxide 0.01 kg 0.027 0.00032 kg ethylene eq.
Methanol 0.00012 kg 0.14 1.66E-05 kg ethylene eq.
2.2 Transport, train, diesel powered - DE
4.93E-05 kg ethylene eq.
Carbon monoxide 0.002 kg 0.027 4.91E-05 kg ethylene eq.
2.3 CHP (gas engine) 500 kWel Mais (90), cattle manure
(10), DE
4.52E-05 kg ethylene eq.
Methane, biogenic 0.007 kg 0.006 4.52E-05 kg ethylene eq.
3 Terrestrial ecotoxicity - TETP inf 0.00026 kg 1,4-dichlorobenzene eq.
3.1 Natural gas, combusted in industrial boiler - RNA
0.00017 kg 1,4-dichlorobenzene eq.
Mercury 3.62E-09 kg 2.83E+04 0.0001 kg 1,4-dichlorobenzene eq.
Chromium 1.95E-08 kg 3031.11 5.91E-05 kg 1,4-dichlorobenzene eq.
Nickel 2.93E-08 kg 116.04 3.40E-06 kg 1,4-dichlorobenzene eq.
3.2 Operation truck >32t, EURO3
9.42E-05 kg 1,4-dichlorobenzene eq.
Zinc 1.52E-06 kg 24.59 3.74E-05 kg 1,4-dichlorobenzene eq.
Chromium 9.70E-09 kg 3031.12 2.94E-05 kg 1,4-dichlorobenzene eq.
Chromium 2.56E-09 kg 6302.86 1.61E-05 kg 1,4-dichlorobenzene eq.
Copper 5.50E-07 kg 6.99 3.85E-06 kg 1,4-dichlorobenzene eq.
Zinc 2.32E-07 kg 11.96 2.78E-06 kg 1,4-dichlorobenzene eq.

28 | P a g e
Nickel 6.96E-09 kg 238.55 1.66E-06 kg 1,4-dichlorobenzene eq.
Nickel 9.55E-09 kg 116.04 1.11E-06 kg 1,4-dichlorobenzene eq.
4 Climate change - GWP100 3.56179 kg CO2 eq.
4.1 Yeast Biomass production, Fermentation - DE
1.10924 kg CO2 eq.
Carbon dioxide 1.10 kg 1 1.10924 kg CO2 eq.
4.2 CHP (gas engine) 500 kWel Mais (90), cattle manure
(10), DE
0.87251 kg CO2 eq.
Carbon dioxide 0.68 kg 1 0.68407 kg CO2 eq.
Methane, biogenic 0.007 kg 25 0.18843 kg CO2 eq.
4.3 Methanol, at plant - CN 0.8466 kg CO2 eq.
Carbon dioxide 0.84 kg 1 0.8466 kg CO2 eq.
4.4 Transport, train, diesel powered - DE
0.71149 kg CO2 eq.
Carbon dioxide 0.70 kg 1 0.70195 kg CO2 eq.
4.5 Enzyme, Mixed activities, T. reesei
0.03711 kg CO2 eq.
Carbon dioxide 0.04 kg 1 0.03711 kg CO2 eq.
4.6 L.digitata_Growth -0.06262 kg CO2 eq.
Carbon dioxide -0.06 kg 1 -0.06262 kg CO2 eq.
5 Acidification potential - average Europe
0.01267 kg SO2 eq.
5.1 Transport, train, diesel powered - DE
0.00923 kg SO2 eq.
Nitrogen oxides 0.02 kg 0.5 0.00923 kg SO2 eq.
5.2 Acetic acid, at plant - CN 0.0027 kg SO2 eq.
Ammonia 0.00169 kg 1.6 0.0027 kg SO2 eq.
5.3 Natural gas, combusted in industrial boiler - RNA
0.0007 kg SO2 eq.
Nitrogen oxides 0.001 kg 0.5 0.0007 kg SO2 eq.
6 Depletion of abiotic resources - fossil fuels
0 MJ
7 Depletion of abiotic resources - elements, ultimate reserves
0 kg antimony eq.
8 Human toxicity - HTP inf 0.03056 kg 1,4-dichlorobenzene eq.
8.1 Transport, train, diesel powered - DE
0.02254 kg 1,4-dichlorobenzene eq.
Nitrogen oxides 0.02 kg 1.2 0.02216 kg 1,4-dichlorobenzene eq.
Particulates, < 10 um 0.0005 kg 0.82 0.00038 kg 1,4-dichlorobenzene eq.
8.2 Natural gas, combusted in industrial boiler - RNA
0.00496 kg 1,4-dichlorobenzene eq.
Cadmium 1.53E-08 kg 1.45E+05 0.00222 kg 1,4-

29 | P a g e
dichlorobenzene eq.
Nitrogen oxides 0.00139 kg 1.2 0.00167 kg 1,4-dichlorobenzene eq.
Nickel 2.93E-08 kg 3.50E+04 0.00103 kg 1,4-dichlorobenzene eq.
8.3 Operation truck >32t, EURO3
0.00289 kg 1,4-dichlorobenzene eq.
Copper 5.50E-07 kg 4295.03 0.00236 kg 1,4-dichlorobenzene eq.
Nickel 9.55E-09 kg 3.50E+04 0.00033 kg 1,4-dichlorobenzene eq.
Cadmium 9.03E-10 kg 1.45E+05 0.00013 kg 1,4-dichlorobenzene eq.
9 Ozone layer depletion - ODP steady state
0 kg CFC-11 eq.
10 Marine aquatic ecotoxicity - MAETP inf
0.74621 kg 1,4-dichlorobenzene eq.
10.1 Operation truck >32t, EURO3
0.61477 kg 1,4-dichlorobenzene eq.
Copper 5.50E-07 kg 8.93E+05 0.49159 kg 1,4-dichlorobenzene eq.
Nickel 9.55E-09 kg 3.76E+06 0.03587 kg 1,4-dichlorobenzene eq.
Zinc, ion 1.52E-06 kg 1.38E+04 0.02108 kg 1,4-dichlorobenzene eq.
Nickel, ion 6.96E-09 kg 2.25E+06 0.01566 kg 1,4-dichlorobenzene eq.
Zinc 2.32E-07 kg 6.73E+04 0.01561 kg 1,4-dichlorobenzene eq.
Zinc 1.52E-06 kg 7208.56 0.01098 kg 1,4-dichlorobenzene eq.
Copper, ion 3.61E-08 kg 2.33E+05 0.0084 kg 1,4-dichlorobenzene eq.
Nickel 6.96E-09 kg 1.17E+06 0.00818 kg 1,4-dichlorobenzene eq.
10.2 Natural gas, combusted in industrial boiler - RNA
0.13144 kg 1,4-dichlorobenzene eq.
Nickel 2.93E-08 kg 3.76E+06 0.10999 kg 1,4-dichlorobenzene eq.
Cadmium 1.53E-08 kg 1.11E+06 0.01695 kg 1,4-dichlorobenzene eq.
Mercury 3.62E-09 kg 1.20E+06 0.00435 kg 1,4-dichlorobenzene eq.
11 Freshwater aquatic ecotoxicity - FAETP inf
0.00047 kg 1,4-dichlorobenzene eq.
11.1 Operation truck >32t, EURO3
0.00044 kg 1,4-dichlorobenzene eq.
Zinc, ion 1.52E-06 kg 91.71 0.00014 kg 1,4-dichlorobenzene eq.
Copper 5.50E-07 kg 221.65 0.00012 kg 1,4-dichlorobenzene eq.
Zinc 1.52E-06 kg 47.745 7.27E-05 kg 1,4-dichlorobenzene eq.
Copper, ion 3.61E-08 kg 1157.30 4.18E-05 kg 1,4-dichlorobenzene eq.

30 | P a g e
Nickel, ion 6.96E-09 kg 3237.61 2.25E-05 kg 1,4-dichlorobenzene eq.
Copper 3.61E-08 kg 594.65 2.15E-05 kg 1,4-dichlorobenzene eq.
Nickel 6.96E-09 kg 1690.25 1.18E-05 kg 1,4-dichlorobenzene eq.
Nickel 9.55E-09 kg 629.47 6.01E-06 kg 1,4-dichlorobenzene eq.
11.2 Natural gas, combusted in industrial boiler - RNA
2.41E-05 kg 1,4-dichlorobenzene eq.
Nickel 2.93E-08 kg 629.47 1.84E-05 kg 1,4-dichlorobenzene eq.
Cadmium 1.53E-08 kg 289.43 4.44E-06 kg 1,4-dichlorobenzene eq.
Mercury 3.62E-09 kg 316.78 1.15E-06 kg 1,4-dichlorobenzene eq.
Referances
1. A. A. Koutinas, A. Chatzifragkou, N. Kopsahelis, S. Papanikolaou and I. K. Kookos, Fuel, 2014, 116, 566-577.
2. N. R. Baral, O. Kavvada, D. Mendez-Perez, A. Mukhopadhyay, T. S. Lee, B. A. Simmons and C. D. Scown, Energy & Environmental Science, 2019, 12, 807-824.
3. F. Xu, J. Sun, N. Konda, J. Shi, T. Dutta, C. D. Scown, B. A. Simmons and S. Singh, 2015.4. J. Sun, N. M. Konda, J. Shi, R. Parthasarathi, T. Dutta, F. Xu, C. D. Scown, B. A. Simmons and S.
Singh, Energy & Environmental Science, 2016, 9, 2822-2834.5. D. Humbird, R. Davis, L. Tao, C. Kinchin, D. Hsu, A. Aden, P. Schoen, J. Lukas, B. Olthof and M.
Worley, Process design and economics for biochemical conversion of lignocellulosic biomass to ethanol: dilute-acid pretreatment and enzymatic hydrolysis of corn stover, National Renewable Energy Lab.(NREL), Golden, CO (United States), 2011.
6. W. Babel and R. H. Müller, Applied microbiology and biotechnology, 1985, 22, 201-207.7. D. P. Petrides, Computers & chemical engineering, 1994, 18, S621-S625.8. D. Petrides, Bioseparations science and engineering, 2000.9. S. Y. Lee, J. Nielsen and G. Stephanopoulos, Industrial Biotechnology: Products and Processes,
John Wiley & Sons, 2016.10. H.-P. Meyer, W. Minas and D. Schmidhalter, Industrial Biotechnology: Products and Processes,
2016, 3-53.11. A. Meo, X. L. Priebe and D. Weuster-Botz, Journal of biotechnology, 2017, 241, 1-10.12. J. Hannon, A. Bakker, L. Lynd and C. Wyman, 2007.

Generation of Microbial Oil PUBLICATIONS FULL TEXT A Process Engineering Approach
M . A . M a s r i , 8
Chemisorption of CO2 by chitosan oligosaccharide/DMSO:
organic carbamato–carbonato bond formation

M . A . M a s r i , 9
GreenChemistryCutting-edge research for a greener sustainable futurersc.li/greenchem
ISSN 1463-9262
PAPER Abdussalam K. Qaroush, Ala'a F. Eftaiha et al. Chemisorption of CO
2 by chitosan oligosaccharide/DMSO:
organic carbamato–carbonato bond formation
Volume 19 Number 18 21 September 2017 Pages 4189–4458

Green Chemistry
PAPER
Cite this: Green Chem., 2017, 19,4305
Received 19th June 2017,Accepted 15th August 2017
DOI: 10.1039/c7gc01830d
rsc.li/greenchem
Chemisorption of CO2 by chitosan oligosacchar-ide/DMSO: organic carbamato–carbonato bondformation†
Abdussalam K. Qaroush, *a Khaleel I. Assaf, b Sanaa K. Bardaweel, c
Ala’a Al-Khateeb,d Fatima Alsoubani,d Esraa Al-Ramahi,d Mahmoud Masri, e
Thomas Brück, e Carsten Troll,f Bernhard Rieger f and Ala’a F. Eftaiha *d
A newly formed bond of organic carbamato–carbonato emerged upon bubbling CO2 in a low molecular
weight chitosan hydrochloride oligosaccharide CS·HCl/DMSO binary mixture. The aforementioned bond
was detected and confirmed using attenuated total reflectance-Fourier transform Infrared (ATR-FTIR)
spectroscopy, with two prominent peaks at 1551 cm−1 and 1709 cm−1 corresponding to ionic organic
alkylcarbonate (RCO3−) and carbamate (RNH–CO2
− NH3+–R), respectively. 1H–, 13C–, and 1H–15N hetero-
nuclear single quantum coherence (HSQC) NMR experiments were also employed. According to 13C
NMR, two newly emerged peaks at 157.4 ppm and 161.5 ppm attributed for the carbonyl carbon within
the sequestered species RCO3− and RNH–CO2
− NH3+–R, respectively. Upon CO2 bubbling, cross peaks
obtained from 1H–15N HSQC at 84.7 and 6.8 ppm correlated to the ammonium counterpart chemical
shift bound to the proton resonances. Volumetric uptake of CO2 was measured using an ATR-FTIR auto-
clave equipped with a silicon probe. The equilibrium sorption capacity was 0.6 and 0.2 bars through the
formation of RCO3− and RNH–CO2
− NH3+–R, respectively. Moreover, physisorption by the dried DMSO
contributed to additional 0.4 bars. Density functional theory (DFT) calculations supported the occurrence
of the suggested dual mechanisms and confirmed the formation of carbonate at C-6 of the glucosamine
co-monomer. Moreover, CS·HCl/DMSO showed a slight impact on cell proliferation after 48 hours; this
was a clear evidence of its non-toxicity. The biodegradation test revealed that a degradation of about 80%
of CS·HCl/DMSO was achieved after 33 days; these results indicated that this method is suitable for green
industry. CS·HCl/DMSO showed modest activities against Staphylococcus aureus and Escherichia coli. In
addition, CS·HCl/DMSO demonstrated a significant antifungal activity against Aspergillus flavus in com-
parison with Fluconazole.
1. Introduction
One of the efficient approaches for climate change mitigationis carbon capture and sequestration (CCS). It is considered asan important technology to minimize CO2 emission from fluegas in order to adhere to emission regulations imposed byseveral governmental agencies in leading industrial countries,viz., China, USA, and countries in the EU. To overcome pro-blems associated with the mature technology of monoethanol-amine (MEA) wet scrubbing agent, ‘Green sorbents for carbondioxide (CO2) capturing’ is a new addition in sustainablechemistry that was introduced very recently by our researchgroup,1–3 although others have also reported significantcontributions.4–10
These reports are focused on the synthesis/use of eco-friendly materials, viz., cellulose11,12 and chitin4–7 bio-feed-stocks, metal organic frameworks (MOFs)8–10 and synthetic
†Electronic supplementary information (ESI) available. See DOI: 10.1039/c7gc01830d
aDepartment of Chemistry, Faculty of Science, The University of Jordan,
Amman 11942, Jordan. E-mail: [email protected] of Life Sciences and Chemistry, Jacobs University Bremen,
Campus Ring 1, 28759 Bremen, GermanycDepartment of Pharmaceutical Sciences, Faculty of Pharmacy,
The University of Jordan, Amman 11942, JordandDepartment of Chemistry, the Hashemite University, P.O. Box 150459, Zarqa 13115,
Jordan. E-mail: [email protected] of Industrial Biocatalysis, Department of Chemistry,
Technische Universität München, Lichtenbergstraße 4, 85748 Garching, GermanyfWACKER-Lehrstuhl für Makromolekulare Chemie, Technische Universität München,
Lichtenbergstraße 4, 85747 Garching bei München, Germany
This journal is © The Royal Society of Chemistry 2017 Green Chem., 2017, 19, 4305–4314 | 4305
Publ
ishe
d on
15
Aug
ust 2
017.
Dow
nloa
ded
by T
echn
ical
Uni
vers
ity o
f M
unic
h on
4/1
3/20
19 8
:44:
48 P
M.
View Article OnlineView Journal | View Issue

oligomers.1 Moreover, developing less hazardous materials interms of energy efficiency through the use of benign solventsfor sustainable purposes is a highly demanding task.13
Polymers have attracted great interest as CO2 sorbents due totheir mechanical and thermal stability, ease of modificationand casting into membranes,14 and their use in engineeringporous/non-porous solids,15 liquids, and solution forms.16 Solidpolymeric sorbents require a sorption temperature as low as0 °C due to physical adsorption of CO2 unless impregnated withpendant groups.17 The latter point is of major concern due tothe leaching of the functionalized material(s). Such unsolvedobstacles will persist unless chemisorption with both built-infunctional group(s) and fast sorption kinetics are broughtinto the solution without any crosslinking, decomposition, orevaporative losses that are characteristic of solvents.18
Apart from synthetic polymers, bio-feedstocks such aschitin (the second most naturally-occurring polymer after cell-ulose) and its derivatives (primarily chitosan) are strong candi-dates that might serve as green sorbents (chemical structure isshown in Scheme 1).2–6 From an economical point of view, theproduction of 100 billion tons per annum19 of chitin was esti-mated to have a revenue of 63 billion US dollars in 201520 inthe global market. For example, chitosan is used in wastewatertreatment and plasters in the Mt and kt scale per year, respect-ively. The growing market of chitosan industry will pave theway towards worldwide awareness into a prosperous bio-economy that forms a strong pillar for a more sustainablefuture.
One inherent limitation associated with the use of thesemotifs is the lack of solubility that hinders their processability.The use of solvent mixtures,21 ionic liquids (ILs)22 or evenusing oligomers2,3 might serve as a proper choice to under-stand the chemistry of macromolecules in solution. The use ofILs is problematic, as shown by Tom Welton.23 Their high vis-cosity, high cost, extreme care needed during purification andpotential environmental hazards to aquatic and terrestrial eco-systems24 are considered as major disadvantages. In thiscontext, oligomeric sorbents provide a useful platform to actas an attractive tool that combines the parent properties withenhanced processability features by maintaining theunexploited supramolecular interactions that are betterresolved.
The chemistry of CO2 capturing takes place throughout bychemisorption and/or physisorption. The former is attainedvia two well-known approaches: carbonates (whether inorganic
or organic) and carbamates (RNH–CO2− NH3
+–R), which followthe 1 : 1 and 1 : 2 mechanisms, respectively. The latter has asignificant drawback due to the use of sacrificial basestogether with its instability in aqueous solutions whenforming bicarbonate (HCO3
−)/carbonate (CO32−) depending on
the pH of the respective solution.25 In addition, inorganic car-bonates require high temperature for regeneration in the post-combustion capture, viz. 100–150 °C, which leads to additionalenergy expenditure for the industrial sector. Therefore, organicionic alkylcarbonates (RCO3
−) are considered to be a promis-ing approach in terms of regeneration temperature, stability inaqueous media, and reducing additional expenditure associ-ated with highly expensive additives.26,27
In this respect, following the concept of switchable solventsproposed by the Jessop group,14,15 several literature reportsdemonstrated that the usage of superbases is necessary to acti-vate the alcohols, which results in the formation of ionicorganic carbonate species upon CO2 bubbling.28–31 Similarly,Sir J. Stoddart8,32–34 and co-workers reported that hydroxylgroups located at the rim of γ-cyclodextrin-rubidium basedMOFs are capable of reacting with CO2 reversibly to form ametal-stabilized RCO3
−. The chemisorption of CO2 was con-firmed by high-resolution solid-state 13C nuclear magnetic reso-nance (13C NMR) that indicated the emergence of a peak at158 ppm upon CO2 bubbling. Jessop’s breakthrough combinedwith Stoddart’s piece of artistic work led to the solubilizationof naturally occurring polymers.28 In 2016, a combination ofpolymer scission2,3 and acetate effect35 resulted in task-specificoligomers for CO2 capturing. Our research group reported theformation of RCO3
− through “supramolecular chemisorption”by reacting chitin-acetate oligomers dissolved in dimethyl sulf-oxide (DMSO) at ambient CO2 conditions without the use offurther additives,2,3 such as activators or stabilizers(superbases26 and metals,8 respectively). In terms of sustain-ability and greenness, the use of DMSO coincides with theguidelines set by the father of green chemistry Paul Anastas.13
DMSO is not only considered as a non-volatile organic com-pound due to its high boiling point,36 but also a naturalproduct that exists in beverages, fruits and vegetables at themicromolar level.37–39 Furthermore, DMSO is also used as apenetration enhancer in topical pharmaceutical formu-lations.40 Together with its use as a polar aprotic solvent withextra merits such as ease of purification and low costs of pro-duction compared to ILs, DMSO is a potential greener candi-date compared to polar aprotic solvents such as N-methyl-2-pyrrolidone (NMP), N,N-dimethylformamide (DMF), and N,N-dimethylacetamide (DMAc) as reviewed by J. H. Clark.41
Biodegradability is one of the key characteristic features inthe field of green chemistry. To fulfill this need, theInternational Organization for Standardization (ISO) hasissued nine standards42 for biodegradation testing in aqueous,compost, disintegration, soil or anaerobic based media.43 ISO14855-2:2007/Cor.:2009 or BS EN ISO/DIS 14855-2:2009, havebeen widely reported for many polymers like poly(lacticacid)43,44 and poly(butylene succinate).45 Based on thismethod, the degradation was conducted within closed bio-
Scheme 1 Chemical structure of chitin (n > m) and its deacetylatedform, chitosan (m > n). The numbers designate the carbon atoms acrossthe constitutional repeating units.
Paper Green Chemistry
4306 | Green Chem., 2017, 19, 4305–4314 This journal is © The Royal Society of Chemistry 2017
Publ
ishe
d on
15
Aug
ust 2
017.
Dow
nloa
ded
by T
echn
ical
Uni
vers
ity o
f M
unic
h on
4/1
3/20
19 8
:44:
48 P
M.
View Article Online

reactors using a controlled composite to simulate an acceler-ated environmental decomposition. The reaction vessels wereaerated with CO2-free air. The degree of biodegradation is apercentage of the evolved CO2 (captured with an alkaline trap)to the theoretical evolved CO2.
Herein, a sustainable oligochitosan hydrochloride (CS·HCl)dissolved in DMSO (CS·HCl/DMSO) as a green sorbent for CO2
capturing is exploited. A qualitative and quantitative determi-nation of CO2-chemisorbed species is determined through theformation of novel organic carbonato–carbamato motifs fol-lowing the 1 : 1 and 1 : 2 mechanisms, respectively. The titledspecies are well characterized and analyzed via 1H-, 13C-, and15N-NMR spectroscopy, ex situ and in situ attenuated totalreflectance-Fourier transform infrared (ATR-FTIR) spec-troscopy, as well as density functional theory (DFT). Thisapproach gives a straightforward approach towards the use ofsustainable green sorbents for CO2 capturing adapting abenign-by-design approach. To further explore the impact ofusing DMSO on the greenness/toxicity of the applied binarysystem, ISO/DIS 14855-2:2007 is chosen to evaluate the com-patibility of the described CO2 capturing system using theconcept of green chemistry. In addition, the anti-bacterial, aswell as anti-fungal activities are further tested for the CS·HCl/DMSO green sorbent.
2. Results and discussion
The main objective of this study was to show the possibility ofobtaining a double sequestered species of CO2 using a com-mercially available, sustainable, and renewable material,namely chitosan hydrochloride (CS·HCl) oligosaccharide. Asreported elsewhere, CO2 capture is achieved either by carbon-ate (organic and inorganic) or carbamate (RNH–CO2
− NH3+–R)
formation. RCO3− is thermodynamically more stable than
RNH–CO2− NH3
+–R,3 which is less energy demanding to regen-erate compared to inorganic carbonates;25 hence, we anticipatethat organic carbonato–carbamato sorbents will show a promi-nent collaborative performance. In order to enhance the likeli-hood of RNH–CO2
− NH3+–R formation throughout the bio-
renewables we used earlier, viz. chitin oligosaccharide,2,3 wefocused our attention towards oligochitosan that can be pro-duced from chitin by hydrolysis to increase the number ofamine groups per sorbent. Herein, the degree of deacetylation(DDA) of the used chitosan oligomer was ca. 95% as verified byboth proton nuclear magnetic resonance (1H NMR) spectraand elemental analysis (EA) (see ESI, Fig. S1 and Table S1†).
2.1. Spectroscopic investigations
The absorption spectra of CS·HCl/NaOH pellet/DMSO beforeand after bubbling CO2 measured by attenuated total reflec-tance-Fourier transform infrared (ATR-FTIR) spectroscopy (A)and the absorption profiles of CO2 by neat DMSO (B), CS·HCl/DMSO (C), DMSO/NaOH pellet (D), and CS·HCl/NaOH pellet/DMSO (E) obtained using an in situ ATR-FTIR autoclave (4.0bars, 25 °C, 10 mL dry DMSO) are shown in Fig. 1. In these
experiments, the water content of DMSO utilized was 6.1 ppmas measured using a Karl-Fischer titrator.
CS·HCl/DMSO solution absorbed 0.6 bar CO2 through theformation of organic carbonate via supramolecular chemisorp-tion2,3 (1551 cm−1, Fig. 1A). In this context, the pH of CS·HClaqueous solution was ca. 5.6, which implies that the materialis fully protonated; therefore, NaOH was added to deproto-nate the ammonium group in order to be prone to thenucleophilic attack of CO2. The absorption profile of neatDMSO indicated that the absorption capacity was 0.4 bar.NaOH pellets were used due to its ease of filtration, whichdid not interfere with the overall effect on sorption capacitybecause of the elimination of water needed to make the sidereaction to form sodium bicarbonate. CS·HCl/NaOH/DMSOsolution absorbed 0.8 bar of CO2 through the formation oforganic carbonate together with an extra contribution of theRNH–CO2
− NH3+–R ion (1709 cm−1, Fig. 1A) (0.2 bar of CO2
absorbed as RNH–CO2− NH3
+–R upon correcting the DMSOand CS·HCl values from the overall drop in pressure). Thesorption capacity of 10% w/v solution through chemisorp-tion was 1.60 mmol CO2 per g of sorbent. Taking intoaccount an additional 0.81 mmol CO2 due to physisorption,the total CO2 absorbed was 2.41 mmol. In comparison withthe sorption capacity of MEA aqueous solution (30% inwater) reported in the literature, it absorbed 1.59 mmol CO2
per g of sorbent,46 which makes our material a potential can-didate to compete with other commercially available com-pounds in the market.
As inferred from the sorption profiles, two presumedmechanisms (chemisorption and physiosorption, vide supra)were involved during the capturing process. The chemisorp-tion takes place through two independent pathways. The firstone is the formation of RCO3
− through supramolecular chemi-sorption via a 1 : 1 reaction mechanism, where DMSO activatesthe primary hydroxyl group of the amino pyranose ringtowards nucleophilic attack.2,3 The organic carbonate adductis stabilized through non-bonding interactions along the oligo-mer backbone. The second pathway results in the formation ofRNH–CO2
− NH3+–R following a 1 : 2 reaction mechanism,
through the nucleophilic attack of CO2 by the amine’s nitro-gen.47 The latter does not proceed unless sodium hydroxide isused to activate the glucopyranose amine groups towardsnucleophilic attack through deprotonation. It is noteworthythat the faster kinetics of carbamate formation compared toorganic carbonate is explained by the higher nucleophilicity ofnitrogen compared to oxygen. Chemisorption was the princi-pal competitor to the physisorption process (blue trace, Fig. 1)as demonstrated in both C and E where the kinetic profilesshowed a slower sorption for the latter. Scheme 2 summarizesthe two suggested chemisorption mechanisms of CO2 captureby CS·HCl dissolved in DMSO; path A and B represent the for-mation of the RCO3
− and RNH–CO2− NH3
+–R via the 1 : 1 and1 : 2 mechanisms, respectively.
Nuclear magnetic resonance (NMR) was used to confirmthe formation of carbonato–carbamato sequestered species inthe CS·HCl/NaOH/DMSO solution. 13C NMR (Fig. 2A) showed
Green Chemistry Paper
This journal is © The Royal Society of Chemistry 2017 Green Chem., 2017, 19, 4305–4314 | 4307
Publ
ishe
d on
15
Aug
ust 2
017.
Dow
nloa
ded
by T
echn
ical
Uni
vers
ity o
f M
unic
h on
4/1
3/20
19 8
:44:
48 P
M.
View Article Online

the formation of two new peaks arising at 157.4 and161.5 ppm, which correspond to the quaternary carbon ofRCO3
− and RNH–CO2− NH3
+–R ions, respectively. Further,
1H NMR (Fig. 2B) shows noticeable changes at two differentchemical shift regions. First, a new peak evolved at 6.81 ppm,which corresponds to the ammonium counterpart of the car-
Scheme 2 Schematic diagram illustrating the proposed chemisorption mechanisms for CO2 capturing upon CS·HCl dissolution in DMSO. Ionicorganic alkylcarbonate (RCO3
−) (Path A) represents a 1 : 1 mechanism. Ionic carbamates (RNH–CO2− NH3
+–R) (Path B) show a 1 : 2 mechanism.
Fig. 1 A. ATR-FTIR Spectra of CS·HCl/NaOH/DMSO before (red) and after bubbling (black) with CO2. Absorption profiles of physisorbed carbondioxide (blue), organic carbonate (green) and carbamate (gray) as a function of time of B. Neat DMSO. C. CS·HCl/DMSO. D. DMSO/NaOHpellet. E. CS·HCl/NaOH pellet/DMSO, obtained from in situ ATR-FTIR.
Paper Green Chemistry
4308 | Green Chem., 2017, 19, 4305–4314 This journal is © The Royal Society of Chemistry 2017
Publ
ishe
d on
15
Aug
ust 2
017.
Dow
nloa
ded
by T
echn
ical
Uni
vers
ity o
f M
unic
h on
4/1
3/20
19 8
:44:
48 P
M.
View Article Online
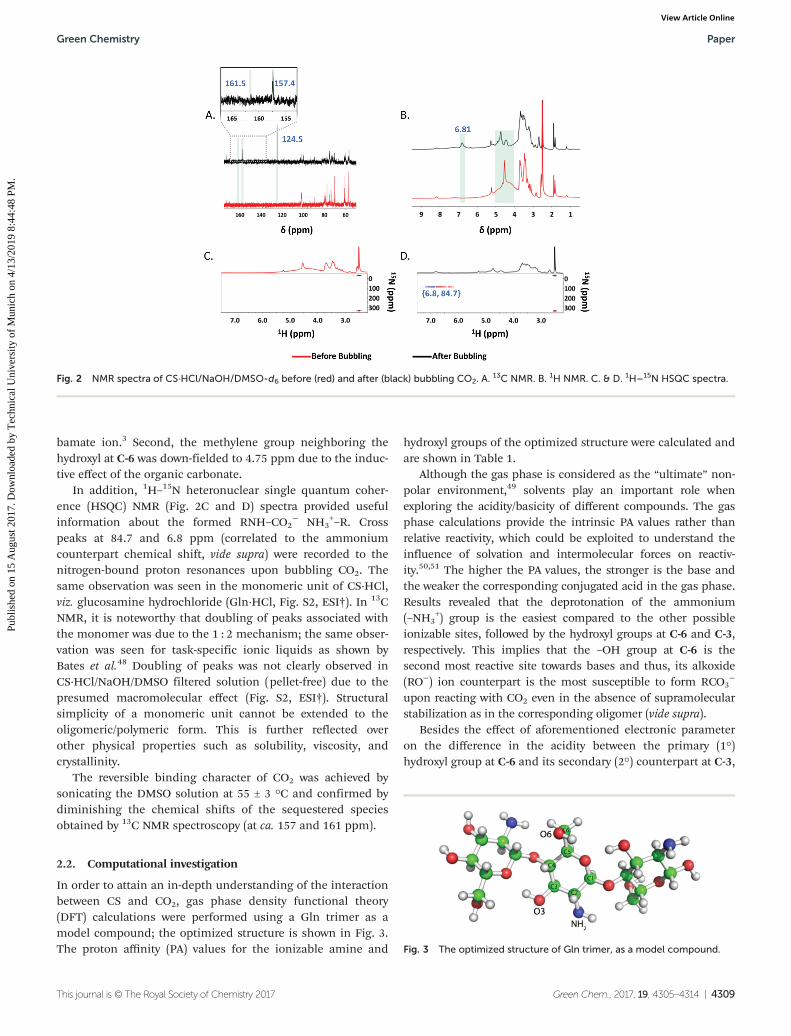
bamate ion.3 Second, the methylene group neighboring thehydroxyl at C-6 was down-fielded to 4.75 ppm due to the induc-tive effect of the organic carbonate.
In addition, 1H–15N heteronuclear single quantum coher-ence (HSQC) NMR (Fig. 2C and D) spectra provided usefulinformation about the formed RNH–CO2
− NH3+–R. Cross
peaks at 84.7 and 6.8 ppm (correlated to the ammoniumcounterpart chemical shift, vide supra) were recorded to thenitrogen-bound proton resonances upon bubbling CO2. Thesame observation was seen in the monomeric unit of CS·HCl,viz. glucosamine hydrochloride (Gln·HCl, Fig. S2, ESI†). In 13CNMR, it is noteworthy that doubling of peaks associated withthe monomer was due to the 1 : 2 mechanism; the same obser-vation was seen for task-specific ionic liquids as shown byBates et al.48 Doubling of peaks was not clearly observed inCS·HCl/NaOH/DMSO filtered solution (pellet-free) due to thepresumed macromolecular effect (Fig. S2, ESI†). Structuralsimplicity of a monomeric unit cannot be extended to theoligomeric/polymeric form. This is further reflected overother physical properties such as solubility, viscosity, andcrystallinity.
The reversible binding character of CO2 was achieved bysonicating the DMSO solution at 55 ± 3 °C and confirmed bydiminishing the chemical shifts of the sequestered speciesobtained by 13C NMR spectroscopy (at ca. 157 and 161 ppm).
2.2. Computational investigation
In order to attain an in-depth understanding of the interactionbetween CS and CO2, gas phase density functional theory(DFT) calculations were performed using a Gln trimer as amodel compound; the optimized structure is shown in Fig. 3.The proton affinity (PA) values for the ionizable amine and
hydroxyl groups of the optimized structure were calculated andare shown in Table 1.
Although the gas phase is considered as the “ultimate” non-polar environment,49 solvents play an important role whenexploring the acidity/basicity of different compounds. The gasphase calculations provide the intrinsic PA values rather thanrelative reactivity, which could be exploited to understand theinfluence of solvation and intermolecular forces on reactiv-ity.50,51 The higher the PA values, the stronger is the base andthe weaker the corresponding conjugated acid in the gas phase.Results revealed that the deprotonation of the ammonium(–NH3
+) group is the easiest compared to the other possibleionizable sites, followed by the hydroxyl groups at C-6 and C-3,respectively. This implies that the –OH group at C-6 is thesecond most reactive site towards bases and thus, its alkoxide(RO−) ion counterpart is the most susceptible to form RCO3
−
upon reacting with CO2 even in the absence of supramolecularstabilization as in the corresponding oligomer (vide supra).
Besides the effect of aforementioned electronic parameteron the difference in the acidity between the primary (1°)hydroxyl group at C-6 and its secondary (2°) counterpart at C-3,
Fig. 2 NMR spectra of CS·HCl/NaOH/DMSO-d6 before (red) and after (black) bubbling CO2. A.13C NMR. B. 1H NMR. C. & D. 1H–15N HSQC spectra.
Fig. 3 The optimized structure of Gln trimer, as a model compound.
Green Chemistry Paper
This journal is © The Royal Society of Chemistry 2017 Green Chem., 2017, 19, 4305–4314 | 4309
Publ
ishe
d on
15
Aug
ust 2
017.
Dow
nloa
ded
by T
echn
ical
Uni
vers
ity o
f M
unic
h on
4/1
3/20
19 8
:44:
48 P
M.
View Article Online

the solvation effect might also contribute to higher PA values.It seems that DMSO molecules can easily solvate, and hencestabilize the unhindered RO− anion at C-6 compared to C-3once formed. This is consistent with the NMR data obtainedfor Gln·HCl/NaOH/DMSO-d6 upon bubbling CO2 (Fig. S2 A,ESI†), where 13C NMR spectra indicated the emergence of twopeaks at 157.7 and 159.2 ppm, corresponding to formation ofRCO3
− and RNH–CO2− NH3
+–R, respectively. The complexity ofthe 13C NMR of Gln·HCl due to the different organic carbon-ate/carbamate assemblies, which resulted in peak doubling(vide supra), was better resolved by using glucose as an analo-gous chemical structure (Fig. S3, ESI†). The 13C-NMR ofglucose/NaOH/DMSO indicated that the chemical shift of C-6was down-fielded from 61.7 ppm to a set of split peaks rangingfrom (63.4 to 64.8) ppm due to the RCO3
− formation and pre-sumably the inter- and intramolecular interactions after bub-bling CO2. Other hydroxyl groups from C-1 to C-4 were notshifted in the spectrum due to their lower reactivity (2°alcohols).
To fully understand the stability of two possible CO2
adducts (if present), the optimized structures of RCO3− (either
at C-6 or C-3) and RNH–CO2− NH3
+–R (at C-2) at the centralunit of the trimer are shown in Fig. 4. The calculated relativeenergy values showed that the formation of carbamate andorganic carbonate at C-3 (Fig. 4A) is less favorable by 15kcal mol−1 compared to that formed at C-6 (Fig. 4B), as aresult of the strong repulsion between the carbonate at C-3and the carbamate. This is verified by 13C NMR experiments(no C-3 carbonate was observed, vide supra). The optimized
structures (Fig. S4, ESI†) and the calculated relative energyvalues for the hypothetically formed single CO2 species, i.e.,either carbonate or carbamate, are presented in Table S2, ESI.†
2.3. Biodegradation study
The biodegradation of the chitosan oligosaccharide in a con-trolled compost was measured in a 1 L stirred tank bioreactoraccompanied with the CO2 unit (washing, drying and captur-ing). Fig. 5 shows the biodegradation diagram as a function ofincubation time maintained at 58 °C. Within the first 10 days,results showed that less than 10% of CS·HCl was degraded asseen from the minor differences in the amount of evolved CO2
from the blank and sample vessels. On day 11, the degradationappeared to be more intense until it reached about 80% after33 days. The high degree of degradation in the relatively shorttime (according to the ISO protocol, see section 4.1.4) clearlyindicated that CS·HCl is well-suited as sustainable and degrad-able in the presence of DMSO. It also fortified the usage ofthis solvent and formed a clear-cut evidence that it has noinfluence on the biodegradation of CS, which encounteredconcerns presented recently by Clark and coworkers41 on theguidelines of selecting green solvents. This finding could be ofgreat importance for both the academic and industrial sectors.
2.4. Cytotoxicity results
Fig. 6 presents the percentage cell proliferation determined as(Absorbance of experimental well/Absorbance of negativecontrol well) × 100 as a function of concentration. Statisticalanalysis was performed by applying the Student’s t-test usingSPSS 10.0 statistical software package (SPSSFW, SPSS Inc.,Chicago, IL. USA). A p-value <0.05 was considered statisticallysignificant. Each experiment represented the average of aseries of three replicates. Notably, cell viability was not signifi-cantly changed after exposure of human fibroblasts to CS·HClusing the MTS assay. Cell growth of fibroblast cell cultures wasevaluated using the MTS assay after 24 h and 48 h exposureperiods. As demonstrated in Fig. 6, there is no statistically sig-nificant difference between the cell proliferation rates in wells
Table 1 Calculated proton affinitiesa (PA) of the amino and the hydroxylgroup at the central Gln unit in the trimer; the structure is shown inFig. 3
Possible protonation active sites PA (kcal mol−1)
Gln-Gln(NH2)-Gln + H+ → Gln-Gln(NH3+)-Gln 293.4
Gln-Gln(NH2)(O−-6)-Gln + H+ → Gln-Gln(NH2)
(OH-6)-Gln329.4
Gln-Gln(NH2)(O−-3)-Gln + H+ → Gln-Gln(NH2)
(OH-3)-Gln331.2
a PA values were calculated using the Gaussian 09 software (B3LYP/6-31+G* level of theory) as the negative of the enthalpy change (ΔH) ofthe gas phase reaction, A(g) + H+
(g) → AH+(g). Under standard con-
ditions, the value of the enthalpy of the gas-phase proton was taken as1.48 kcal mol−1.52
Fig. 4 DFT-optimized structures of carbamato-together with organiccarbonato-adducts formed at A. C-3 and B. C-6 of the central unit ofthe glucosamine trimer.
Fig. 5 Biodegradation evaluation method by gravimetric measurementof CO2 evolved via a laboratory-scale test using DASGIP® benchtop bio-reactor in a controlled compost at 58 °C following the standard proto-col, ISO/DIS 14855-2:2007/Cor.:2009.
Paper Green Chemistry
4310 | Green Chem., 2017, 19, 4305–4314 This journal is © The Royal Society of Chemistry 2017
Publ
ishe
d on
15
Aug
ust 2
017.
Dow
nloa
ded
by T
echn
ical
Uni
vers
ity o
f M
unic
h on
4/1
3/20
19 8
:44:
48 P
M.
View Article Online

treated with CS·HCl/DMSO at the concentration ranges usedrelative to control cells (untreated well) after both exposureperiods, indicating a reasonable safety margin of CS·HCl/DMSO.
As shown in Table 2, upon comparison with the antibacterialactivity of Norfloxacin, CS·HCl/DMSO exhibited pronouncedactivities against Staphylococcus aureus and Escherichia coli. Inaddition, CS·HCl/DMSO demonstrated a significant antifungalactivity against Aspergillus flavus relative to Fluconazole.
3. Conclusions
Briefly, a sustainable oligochitosan hydrochloride dissolved inDMSO as a green sorbent for CO2 capturing is reported. Twodifferent mechanisms are described: the formation of organiccarbonate through the 1 : 1 mechanism in the absence ofNaOH, and the formation of novel organic carbonato–carba-mato species following a 1 : 2 mechanism. NMR and ATR-FTIRsupport the formation of carbonato–carbamato species in theCS·HCl/NaOH/DMSO solution. Absorption profiles indicatethat the carbamate is formed faster than carbonate in NaOH/DMSO solution. Further, DFT calculations confirm the for-mation of the carbonate at the C-6 position together with car-bamate formation. Further testing showed that CS·HCl/DMSOhad a minor effect (non-toxicity) on cell proliferation after twodays of the exposure. Moreover, it was shown to be a bio-degradable binary mixture. Also, the CS·HCl/DMSO binarysorbent showed both antibacterial and antifungal character-istics with good activities. This confirms that DMSO usage
within the sorbent system is eco-friendly and it does not havea negative impact on CS·HCl as a non-toxic/biodegradablegreen sorbent for CO2 capture. Explicitly, this makes the appli-cation of CS·HCl/DMSO to be more suited towards academicand industrial interests upon implementation, which willopen new horizons in sustainable green technology.Furthermore, greater focus should be directed towards the dis-solution of high molecular weight bio-feedstocks that are ableto sequester CO2 as organic ionic alkycarbonates and/orcarbamates.
4. Experimental4.1. Materials and methods
4.1.1. Chemicals. Unless otherwise stated, all chemicalswere used without further purification. Low molecular weightchitosan hydrochloride (CS·HCl) was prepared by G.T.C. BioCorporation (1.5 kDa), Qingdao, China. For experimentalmanipulations, CS·HCl was dried overnight in a Schlenk tubeat 50 °C (oil bath, in vacuuo). CO2 (99.95%, Food Grade) waspurchased from Advanced Technical Gases Co. (Amman,Jordan). Glucosamine hydrochloride (Gln·HCl), DMSO-d6,D2O, sodium hydroxide (NaOH) and hydrochloric acid (HCl,37%) were purchased from Sigma-Aldrich and DMSO was pur-chased from TEDIA.
4.1.2. Instruments. Solution 1H, 13C, and 1H–15N hetero-nuclear single quantum coherence (HSQC -nuclear magneticresonance (NMR)) spectra were collected at room temperatureusing (AVANCE-III 400 MHz (1H: 400.13 MHz, 13C: 100.61 MHz,15N: 40.560 MHz)) FT-NMR NanoBay spectrometer (Bruker,Switzerland) in either DMSO-d6 or D2O. Elemental Analysis(EA) was performed using a EURO EA 3000 instrument (EuroVector, Italy). In situ attenuated total reflectance-Fourier trans-form infrared (ATR-FTIR) measurements were carried outusing an MMIR45 m RB04-50 (Mettler-Toledo, Switzerland)with an MCT Detector, with a silicon windows probe con-nected via a pressure vessel. Sampling was done from 3500 to650 cm−1 at 8 wavenumber resolution; scan option: 64; gain:1×. Ex situ ATR-FTIR spectra were recorded on a Bruker Vertex70-FT-IR spectrometer at room temperature coupled with aVertex Pt-ATR accessory. Water content was measured using aKarl-Fischer titrator (TZ 1753 with Diaphragma, KF1100,TitroLine KF). pH measurements were obtained via an RL150-Russel pH meter.
4.1.3. Computational method. Calculations wereperformed within Gaussian 09.53 The full optimization wasperformed using the DFT method (B3LYP/6-31+G*). Minimawere characterized by the absence of imaginary frequencies.
4.1.4. Biodegradability study. The biodegradability test wasconducted in accordance with the standard operating pro-cedure of ISO/DIS 14855-2:2007/Cor.:2009. The controlled com-posite was collected from a soil of chicken farms in Munich-Germany. The incubation was continued at 58 °C in 1 L stirredtank glass bioreactors (DASGIP® Benchtop Bioreactors,Eppendorf, Germany). Bioreactors were connected to a
Fig. 6 Percentage of cell proliferation after 24 and 48 hours exposureperiods.
Table 2 Antimicrobial activity measured by a zone of inhibition (mm).Results represent the means of three independent readings
Microorganism CS·HCl/DMSO Control
Staphylococcus aureus 9 ± 0.7 14 ± 0.9Escherichia coli 12 ± 0.5 18 ± 1.0Aspergillus flavus 13 ± 0.9 25 ± 1.0
Green Chemistry Paper
This journal is © The Royal Society of Chemistry 2017 Green Chem., 2017, 19, 4305–4314 | 4311
Publ
ishe
d on
15
Aug
ust 2
017.
Dow
nloa
ded
by T
echn
ical
Uni
vers
ity o
f M
unic
h on
4/1
3/20
19 8
:44:
48 P
M.
View Article Online

designed unit for effective CO2 washing, drying and capture.The evolved CO2 was measured gravimetrically using an elec-tronic balance (Sartorius, Germany) with a display readingdown to ±1 mg. According to of ISO14855-2:2007, the polymershould reach a 75% degradation ratio after 45 days to be con-sidered as a biodegradable polymer.
4.1.5. Cytotoxicity study. Human skin fibroblasts weremaintained in a phenol red-free culture medium DMEM/F12(Dulbecco’s modified essential medium/Ham’s 12 nutrientmixture, Gibco), supplemented with 5% (v/v) fetal calf serum(JS Bioscience, Australia), and 1% (v/v) antibiotic (2 mML-glutamine, 100 U mL−1 penicillin and 0.1 mg mL−1 strepto-mycin; Gibco). Cultured cells were incubated at 37 °C in ahumidified 5% CO2 incubator. The confluent cell layers wereenzymatically removed, using Trypsin/EDTA (Gibco, USA), andresuspended in the culture medium. Cell viability was assessedby vital staining with trypan blue (0.4% (w/v); Sigma, USA),and cell number was determined using a light microscope.
In vitro evaluation of the cytotoxicity was performed usingthe Promega CellTiter 96® AQueous Non-Radioactive CellProliferation (MTS) assay to determine the number of viablecells in the culture (Promega, 2005). CS·HCl/DMSO was addedto the culture media at concentrations of 2.5, 5, 10, 20, and40% (w/v DMSO) and incubated at 37 °C with 5% CO2. Twosets of exposure times were carried out. These included 24 hand 48 h exposure periods. At the end of each exposure time,an MTS mixture (20 μL per well) was added. The absorbance ofthe formazan product was read at 492 nm using a microplateenzyme-linked immunoassay (ELISA) reader. Each experimentwas repeated on three independent occasions. Two internalcontrols were used for each experiment; a negative control con-sisting of cells only without any treatment; and a positivecontrol consisting of cells treated with vincristine, a microtu-bulin polymerization inhibitor.
4.1.6. Anti-microbial activity assays. Antibacterial activity ofCS·HCl/DMSO was studied against Staphylococcus aureus ATCC6538, and Escherichia coli ATCC 29425. Antifungal activity ofCS·HCl/DMSO was examined against mycelial fungi(Aspergillus flavus). Overnight cultures of microorganisms werefreshly prepared for each assay.
The agar diffusion method was used to assess the anti-microbial activities of CS·HCl/DMSO, with a minor modifi-cation. Briefly, Trypticase Soy agar (Difco) medium was asepti-cally inoculated with the bacterial or fungal suspension of themicroorganism under examination. Wells were drilled andfilled with 25 μL of CS·HCl/DMSO. Bacterial plates were incu-bated at 37 °C for 24 h whereas fungal plates were incubated at25 °C for 48 h. After completion of the incubation period, theinhibition zones were observed and measured in mm. A posi-tive control, Norfloxacin 1 mg mL−1 for bacteria andFluconazole 1 mg mL−1 for fungi, and a negative control of thevehicle (DMSO) were employed. Each assay was repeated intriplicate.
4.1.7. Experimental procedure4.1.7.1. NMR. In an NMR tube, 30 mg of the substrate was
dissolved in 0.5 mL DMSO-d6. Upon dissolution, CO2 was
bubbled into the NMR tube via a long cannula for 20 minutes.CO2 Saturation was ensured using NMR spectroscopy.
4.1.7.2. In situ ATR-FTIR. – Formation of carbonato-termi-nated oligosaccharide
The addition of 1.0 g CS·HCl together with 10 mL dryDMSO (6.1 ppm H2O, Karl-Fischer titrator) in a Schlenk flaskwas performed, and was sonicated till it completely dissolved.This solution was transferred into the IR autoclave, with para-meters set at 25 °C, 4 bar CO2, and then the reaction was runfor 4 hours (intervals of 15 seconds, initial and end pressureare to be reported). Initial pressure: 4.0 bar, final pressure: 3.0bar, organic alkyl carbonate contribution through sorptionwas 0.6 bar.
– Formation of carbonato–carbamato-terminated oligo-saccharide
One gram of CS·HCl together was added to 10 mL dryDMSO (6.1 ppm H2O, Karl-Fischer titrator) in a Schlenk flaskand sonicated till it completely dissolved. Further, 1.0 g ofsodium hydroxide pellets was added and stirred for a minuteand the solution was filtered in order to prevent any side reac-tions with the base used. Upon completion, the constituentswere transferred into the IR autoclave using the same previousparameters (vide supra). Initial pressure: 4.2 bar, final pressure:2.8 bar; carbamates contribution through sorption process: 0.2bar; organic alkyl carbonate contribution through sorptionwas 0.6 bar.
For correction purposes, 10 mL DMSO was added into theIR autoclave; the solvent contribution was 0.4 bar as a result ofphysisorption (13C NMR peak identified at 124 ppm, togetherwith ATR-FTIR peak centered at 2337 cm−1).
Conflicts of interest
There are no conflicts to declare.
Acknowledgements
AFE acknowledges the Deanship of Scientific Research at theHashemite University. Marina Reiter (TUM, Germany) isacknowledged for performing the volumetric uptake measure-ments using the in situ ATR-FTIR autoclaves. Thanks toMr Basem R. Nassrallah (HU, Jordan) for performing the EAexperiments.
References
1 A. K. Qaroush, D. A. Castillo-Molina, C. Troll, M. A. Abu-Daabes, H. M. Alsyouri, A. S. Abu-Surrah and B. Rieger,ChemSusChem, 2015, 8, 1618–1626.
2 A. F. Eftaiha, F. Alsoubani, K. I. Assaf, W. M. Nau, C. Trolland A. K. Qaroush, RSC Adv., 2016, 6, 22090–22093.
3 A. F. Eftaiha, F. Alsoubani, K. I. Assaf, C. Troll, B. Rieger,A. H. Khaled and A. K. Qaroush, Carbohydr. Polym., 2016,152, 163–169.
Paper Green Chemistry
4312 | Green Chem., 2017, 19, 4305–4314 This journal is © The Royal Society of Chemistry 2017
Publ
ishe
d on
15
Aug
ust 2
017.
Dow
nloa
ded
by T
echn
ical
Uni
vers
ity o
f M
unic
h on
4/1
3/20
19 8
:44:
48 P
M.
View Article Online

4 H. Xie, S. Zhang and S. Li, Green Chem., 2006, 8, 630–633.5 X. Sun, C. Huang, Z. Xue and T. Mu, Energy Fuels, 2015, 29,
1923–1930.6 P. S. Barber, C. S. Griggs, G. Gurau, Z. Liu, S. Li, Z. Li,
X. Lu, S. Zhang and R. D. Rogers, Angew. Chem., Int. Ed.,2013, 52, 12350–12353.
7 K. Pohako-Esko, M. Bahlmann, P. S. Schulz andP. Wasserscheid, Ind. Eng. Chem. Res., 2016, 55, 7052–7059.
8 J. J. Gassensmith, H. Furukawa, R. A. Smaldone,R. S. Forgan, Y. Y. Botros, O. M. Yaghi and J. F. Stoddart,J. Am. Chem. Soc., 2011, 133, 15312–15315.
9 Y. Lin, Q. Yan, C. Kong and L. Chen, Sci. Rep., 2013, 3, 1859.10 Z. Hu, M. Khurana, Y. H. Seah, M. Zhang, Z. Guo and
D. Zhao, Met.-Org. Framew. Emerg. Chem. Technol., 2015,124, 61–69.
11 Q. Zhang, N. S. Oztekin, J. Barrault, K. De Oliveira Vigierand F. Jérôme, ChemSusChem, 2013, 6, 593–596.
12 Y. Yang, L. Song, C. Peng, E. Liu and H. Xie, Green Chem.,2015, 17, 2758–2763.
13 P. Anastas and N. Eghbali, Chem. Soc. Rev., 2010, 39, 301–312.
14 C. E. Powell and G. G. Qiao, J. Membr. Sci., 2006, 279, 1–49.15 N. Du, H. B. Park, G. P. Robertson, M. M. Dal-Cin,
T. Visser, L. Scoles and M. D. Guiver, Nat. Mater., 2011, 10,372–375.
16 S. Supasitmongkol and P. Styring, Energy Environ. Sci, 2010,3, 1961–1972.
17 R. Dawson, A. I. Cooper and D. J. Adams, Polym. Int., 2013,62, 345–352.
18 S. Choi, J. H. Drese and C. W. Jones, ChemSusChem, 2009,2, 796–854.
19 N. Yan and X. Chen, Nature, 2015, 542, 155–157.20 E. Stoye, Chitin, Chemistry World Podcast, August 2013,
Chitin-Biopolymer-Chitosan.21 T. Heinze and A. Koschella, Polim.: Cienc. Tecnol., 2005, 15,
84–90.22 A. Pinkert, K. N. Marsh and S. Pang, Ind. Eng. Chem. Res.,
2010, 49, 11121–11130.23 M. T. Clough, K. Geyer, P. A. Hunt, S. Son, U. Vagt and
T. Welton, Green Chem., 2015, 17, 231–243.24 T. P. Thuy Pham, C.-W. Cho and Y.-S. Yun, Water Res., 2010,
44, 352–372.25 M. Pera-Titus, Chem. Rev., 2014, 114, 1413–1492.26 P. G. Jessop, D. J. Heldebrant, X. Li, C. A. Eckert and
C. L. Liotta, Nature, 2005, 436, 1102–1102.27 P. G. Jessop, S. M. Mercer and D. J. Heldebrant, Energy
Environ. Sci, 2012, 5, 7240–7253.28 Q. Zhang, N. S. Oztekin, J. Barrault, K. De Oliveira Vigier
and F. Jérôme, ChemSusChem, 2013, 6, 593–596.29 G. V. S. M. Carrera, N. Jordao, L. C. Branco and M. Nunes
da Ponte, Faraday Discuss., 2015, 183, 429–444.30 K. I. Assaf, A. K. Qaroush and A. F. Eftaiha, Phys. Chem.
Chem. Phys., 2017, 19, 15403–15411.31 A. K. Qaroush, K. I. Assaf, A. Al-Khateeb, F. Alsoubani,
E. Nabih, C. Troll, B. Rieger and A. F. Eftaiha, Energy Fuels,2017, 31(8), 8407–8414.
32 D. Wu, J. J. Gassensmith, D. Gouvêa, S. Ushakov,J. F. Stoddart and A. Navrotsky, J. Am. Chem. Soc., 2013,135, 6790–6793.
33 J. J. Gassensmith, J. Y. Kim, J. M. Holcroft, O. K. Farha,J. F. Stoddart, J. T. Hupp and N. C. Jeong, J. Am. Chem. Soc.,2014, 136, 8277–8282.
34 K. J. Hartlieb, J. M. Holcroft, P. Z. Moghadam,N. A. Vermeulen, M. M. Algaradah, M. S. Nassar,Y. Y. Botros, R. Q. Snurr and J. F. Stoddart, J. Am. Chem.Soc., 2016, 138, 2292–2301.
35 Y. Qin, X. Lu, N. Sun and R. D. Rogers, Green Chem., 2010,12, 968–971.
36 D. Stoye, in Ullmann’s Encyclopedia of Industrial Chemistry,Wiley-VCH Verlag GmbH & Co. KGaA, 2000.
37 T. W. Pearson, H. J. Dawson and H. B. Lackey, J. Agric. FoodChem., 1981, 29, 1089–1091.
38 Dimethyl Sulfoxide Producers Association, United StatesEnvironmental Protection Agency, 2003.
39 M. Ganguly, C. Mondal, J. Jana, A. Pal and T. Pal, Langmuir,2014, 30, 348–357.
40 M. L. McPherson and N. M. Cimino, Pain Med., 2013, 14,S35–S39.
41 F. P. Byrne, S. Jin, G. Paggiola, T. H. M. Petchey, J. H. Clark,T. J. Farmer, A. J. Hunt, C. Robert McElroy andJ. Sherwood, Sustainable Chem. Processes, 2016, 4, 7.
42 A Handbook of Applied Biopolymer Technology: Synthesis,Degradation and Applications, ed. S. K. Sharma andA. Mudhoo, The Royal Society of Chemistry, 2011.
43 Determination of the Ultimate Aerobic Biodegradability of PlasticMaterials under Controlled Composting Conditions-Method byAnalysis of Evolved Carbon Dioxide-Part 2: GravimetricMeasurement of Carbon Dioxide Evolved In a Laboratory-ScaleTest, ed. International Organization for Standardization, ISO14855-2, ISO, Geneva, Switzerland, 2007, https://www.iso.org/obp/ui/#iso:std:iso:14855:-2:ed-1:v1:cor:1:v1:en.
44 M. Funabashi, F. Ninomiya and M. Kunioka, J. Polym.Environ., 2007, 15, 245–250.
45 M. Kunioka, F. Ninomiya and M. Funabashi, Int. J. Mol.Sci., 2009, 10, 4267–4283.
46 D. J. Heldebrant, C. R. Yonker, P. G. Jessop and L. Phan,Energy Environ. Sci, 2008, 1, 487–493.
47 P. V. Kortunov, M. Siskin, L. S. Baugh and D. C. Calabro,Energy Fuels, 2015, 29, 5940–5966.
48 E. D. Bates, R. D. Mayton, I. Ntai and J. H. Davis, J. Am.Chem. Soc., 2002, 124, 926–927.
49 X. Sun and J. K. Lee, J. Org. Chem., 2007, 72, 6548–6555.50 J. I. Brauman and L. K. Blair, J. Am. Chem. Soc., 1968, 90,
6561–6562.51 C. A. Deakyne, Thermochem. Solvation Gas Phase Ions, 2003,
227, 601–616.52 A. Moser, K. Range and D. M. York, J. Phys. Chem. B, 2010,
114, 13911–13921.53 M. J. Frisch, G. W. Trucks, H. B. Schlegel, G. E. Scuseria,
M. A. Robb, J. R. Cheeseman, G. Scalmani, V. Barone,B. Mennucci, G. A. Petersson, H. Nakatsuji, M. Caricato,X. Li, H. P. Hratchian, A. F. Izmaylov, J. Bloino, G. Zheng,
Green Chemistry Paper
This journal is © The Royal Society of Chemistry 2017 Green Chem., 2017, 19, 4305–4314 | 4313
Publ
ishe
d on
15
Aug
ust 2
017.
Dow
nloa
ded
by T
echn
ical
Uni
vers
ity o
f M
unic
h on
4/1
3/20
19 8
:44:
48 P
M.
View Article Online

J. L. Sonnenberg, M. Hada, M. Ehara, K. Toyota, R. Fukuda,J. Hasegawa, M. Ishida, T. Nakajima, Y. Honda, O. Kitao,H. Nakai, T. Vreven, J. A. Montgomery, Jr., J. E. Peralta,F. Ogliaro, M. Bearpark, J. J. Heyd, E. Brothers, K. N. Kudin,V. N. Staroverov, T. Keith, R. Kobayashi, J. Normand,K. Raghavachari, A. Rendell, J. C. Burant, S. S. Iyengar,J. Tomasi, M. Cossi, N. Rega, J. M. Millam, M. Klene,
J. E. Knox, J. B. Cross, V. Bakken, C. Adamo, J. Jaramillo,R. Gomperts, R. E. Stratmann, O. Yazyev, A. J. Austin,R. Cammi, C. Pomelli, J. W. Ochterski, R. L. Martin,K. Morokuma, V. G. Zakrzewski, G. A. Voth, P. Salvador,J. J. Dannenberg, S. Dapprich, A. D. Daniels, O. Farkas,J. B. Foresman, J. V. Ortiz, J. Cioslowski and D. J. Fox,Gaussian 09, Gaussian, Inc., Wallingford CT, 2010.
Paper Green Chemistry
4314 | Green Chem., 2017, 19, 4305–4314 This journal is © The Royal Society of Chemistry 2017
Publ
ishe
d on
15
Aug
ust 2
017.
Dow
nloa
ded
by T
echn
ical
Uni
vers
ity o
f M
unic
h on
4/1
3/20
19 8
:44:
48 P
M.
View Article Online

1
Chemisorption of CO2 by Chitosan Oligosaccharide/DMSO:
Organic Carbamato-Carbonato Bond Formation
Abdussalam K. Qarousha* Khaleel I. Assaf,b Sanaa K. Bardaweel,c Ala’a Al-Khateeb,d Fatima
Alsoubani,d Esraa Al-Ramahi,d Mahmoud Masri,e Thomas Brück,e Carsten Troll,f Bernhard
Rieger,f Ala’a F. Eftaiha,d*
aDepartment of Chemistry, Faculty of Science, The University of Jordan, Amman 11942, Jordan. bDepartment of Life Sciences and Chemistry, Jacobs University Bremen, Campus Ring 1, 28759
Bremen, Germany. cDepartment of Pharmaceutical Sciences, Faculty of Pharmacy, The University of Jordan, Amman
11942, Jordan. dDepartment of Chemistry, the Hashemite University, P.O. Box 150459, Zarqa 13115, Jordan. eDivision of Industrial Biocatalysis, Department of Chemistry, Technische Universität
München, Lichtenbergstraße 4, 85748 Garching, Germany. f WACKER-Lehrstuhl für Makromolekulare Chemie, Technische Universität München,
Lichtenbergstraße 4, 85747 Garching bei München, Germany.
* Corresponding Authors: [email protected] (AKQ)
[email protected] (AFE)
Electronic Supporting Information (ESI) Figure S1. Partial 1H NMR spectrum of CS•HCl dissolved in D2O and its proposed chemical
structure. The degree of deacetylation (DDA) was determined using the integration of the acetyl
protons (H-Ac) and the sum of the protons attached to C-2, till C-6 according to the following
equation1: 𝐷𝐷𝐴 = (1 − [(H-Ac/3) (H-((C-2)-(C-6))/6)]) X 100%⁄ ≈ 94.8%
H-Ac
)6C-3(C-H
H-C2
123
45
6
123
45
6
δ (ppm)
Electronic Supplementary Material (ESI) for Green Chemistry.This journal is © The Royal Society of Chemistry 2017
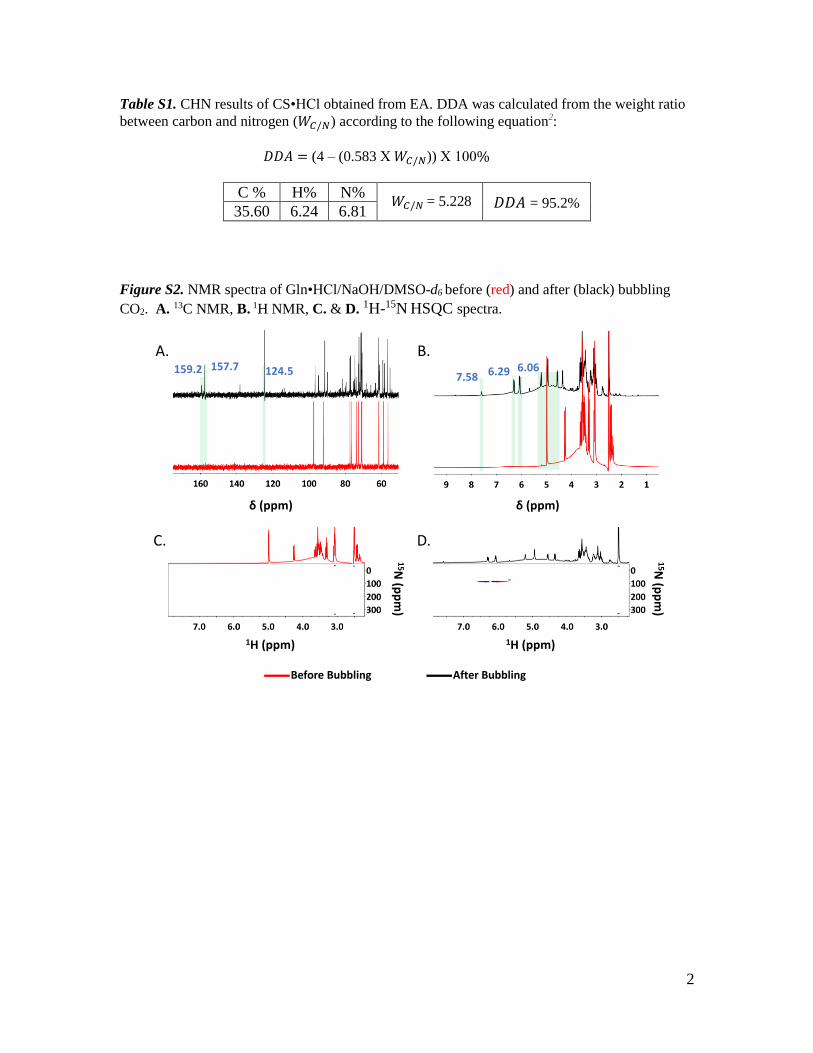
2
Table S1. CHN results of CS•HCl obtained from EA. DDA was calculated from the weight ratio
between carbon and nitrogen (𝑊𝐶/𝑁) according to the following equation2:
𝐷𝐷𝐴 = (4 – (0.583 X 𝑊𝐶/𝑁)) X 100%
C % H% N% 𝑊𝐶/𝑁 = 5.228 𝐷𝐷𝐴 = 95.2%
35.60 6.24 6.81
Figure S2. NMR spectra of Gln•HCl/NaOH/DMSO-d6 before (red) and after (black) bubbling
CO2. A. 13C NMR, B. 1H NMR, C. & D. 1H-15N HSQC spectra.
Before Bubbling After Bubbling
δ (ppm)
7.58
B.
δ (ppm)
6.066.29
pp
m)
N (
15
ppm)H (1
D.
ppm)H (1
C.
pp
m)
N (
15
124.5157.7159.2
A.

3
Figure S3. Partial 13C NMR spectra of glucose/NaOH pellet/in DMSO-d6 obtained before (red)
and after bubbling of CO2 (black). The peak emerged at 167.5 ppm corresponds to inorganic
bicarbonate as a result of the side reaction of the NaOH with CO2.
Figure S4. DFT optimized structures of hypothetically-formed single CO2 species at the central
glucosamine unit: A. Carbamate. B. Ionic organic alkylcarbonate at C-3. C. Ionic organic
alkylcarbonate at C-6.
δ (ppm)
Before Bubbling After Bubbling
124.8
157.7167.5
123
4 56
124.8
B.A.
C.
2.06 Å 1.73 Å 2.05 Å1.76 Å
1.88 Å 2.22 Å

4
In an earlier report, we displayed that the interaction between a CO2 molecule and the
amino group using a glucoseamine trimer was more favorable compared to the interaction
with the hydroxyl group at C-6 by ~2 kcal mol1.3 In terms of stability, the obtained energy
values (Table S2) showed that the formed ionic organic alkylcarbonate product is
thermodynamically more favorable. For all cases, the optimized structures (Figure S4)
indicated that the organic carbonate/carbamate anion is stabilized through hydrogen
bonding with the adjacent hydroxyl and amino groups, in agreement with our previous
finding for the carbonate formation in chitin-acetate/DMSO binary system.2,3 The
calculated relative energy values for the three possible structures showed that the formation
of organic carbonate at C-6 is more favorable over C-3 by ~ 3 kcal mol1, which support
the reactivity of the alkoxide ions toward CO2 as anticipated from the proton affinity data
(vide supra).
Table S1. Relative stability (kcal mol1) of carbonate and carbamate at the central unit of the
gluocoseamine trimer. The more negative value, the higher stability.
ΔE ΔH ΔG
Carbamate 0.00 0.00 0.00
Carbonate (C-3) 0.03 0.82 0.09
Carbonate (C-6) 3.93 4.07 2.97
References:
1 A. Hirai, H. Odani and A. Nakajima, Polym. Bull., 1991, 26, 87–94.
2 Z. M. dos Santos, A. L. P. F. Caroni, M. R. Pereira, D. R. da Silva and J. L. C. Fonseca,
Carbohydr. Res., 2009, 344, 2591–2595.
3 A. F. Eftaiha, F. Alsoubani, K. I. Assaf, C. Troll, B. Rieger, A. H. Khaled and A. K. Qaroush,
Carbohydr. Polym., 2016, 152, 163–169.
Copyright © 2022 FDOKUMEN