SIZE SCALE UP OF PASTA DRYING PROCESS: MODELLING APPROACH
25
SIZE SCALE UP OF PASTA DRYING PROCESS: MODELLING APPROACH Bruno de Cindio ♦ , Massimo Migliori, Domenico Gabriele, Claudio M. Pollini 1 ABSTRACT The use of Very High Temperature (VHT) treatments in high quality pasta production has been the most relevant innovation in pasta technologies since twenty years. This technology allows to increase the plants productivity because of its reduced process time but, using a VHT a good process control is required in order to reduce the thermal damage on pasta due to the severe process conditions. This paper aims to show the use of a simulative drying model in order to adapt the process conditions when the pasta size is changed. Using either long or short pasta shape (spaghetti and rigatoni) the optimisation of drying curves is carried out in order to guarantee for different pasta size a right fixed final pasta humidity. As main result all the drying profiles overlap each other when plotted against the dimensionless treatment time. This suggests that a “master curve” may be obtained for any pasta shape and this curve can be used as reference in scaling-up total process time when the pasta size has to be changed. The results have been also compared in terms of furosine content, assumed as an index of thermal damage, and it appears that the thermal damage is still acceptable also for longer treatment time in agreement with the expectations of pasta makers. KEYWORDS: Pasta production, Drying process modelling, Process Scale-up. ♦ Corresponding author
Transcript of SIZE SCALE UP OF PASTA DRYING PROCESS: MODELLING APPROACH

SIZE SCALE UP OF PASTA DRYING PROCESS: MODELLING APPROACH
Bruno de Cindio♦, Massimo Migliori, Domenico Gabriele, Claudio M. Pollini1
ABSTRACT
The use of Very High Temperature (VHT) treatments in high quality pasta production has been the
most relevant innovation in pasta technologies since twenty years. This technology allows to
increase the plants productivity because of its reduced process time but, using a VHT a good
process control is required in order to reduce the thermal damage on pasta due to the severe
process conditions. This paper aims to show the use of a simulative drying model in order to adapt
the process conditions when the pasta size is changed. Using either long or short pasta shape
(spaghetti and rigatoni) the optimisation of drying curves is carried out in order to guarantee for
different pasta size a right fixed final pasta humidity. As main result all the drying profiles overlap
each other when plotted against the dimensionless treatment time. This suggests that a “master
curve” may be obtained for any pasta shape and this curve can be used as reference in scaling-up
total process time when the pasta size has to be changed. The results have been also compared in
terms of furosine content, assumed as an index of thermal damage, and it appears that the thermal
damage is still acceptable also for longer treatment time in agreement with the expectations of
pasta makers.
KEYWORDS: Pasta production, Drying process modelling, Process Scale-up.
♦ Corresponding author

INTRODUCTION
During pasta drying, due to the inherent difficulty to directly access to the processing material, the
process control is completely demanded to models that act according to the imposed set conditions
of temperature and humidity of the drying wet air. How to choose these latter is often the result of
trial and error tests that are rather time consuming, and even do not ascertain the goodness of the
result. Recently a predictive model of the pasta drying has been proposed (Migliori et al., 2002),
with the aim to avoid these problems through a deeper understanding of the transport phenomena
occurring during water removal, coupled with constitutive equation describing pasta dough
behaviour. Steps characterized by high temperature and low moisture, alternated with low
temperatures and high moisture, seemed to ensure contemporary high quality product and process
optimisation, as found by industrial tests run with TAS – Thermo Active System plant (Pavan,
Italy). The predictive models play a crucial role to transfer the external conditions to internal value
of the main variables that are temperature and water content, maintaining the desired quality
characteristics. Generally speaking, the validation of such models is done for a given shape and a
given size. Thus to make very effective their use, it is necessary to establish simple rules to make
them applicable to different geometrical conditions, with a minimum additional validation test. It is
worthy to notice that typical industrial productions show a wide range of different pasta shape and
size. As concerning with shape, because its importance on the fluid dynamic and in turn on the heat
and mass transport coefficients, it is possible to approximate most of the produced pasta cylinder
like formats, to filled cylinders or cylindrical hollows by a proper fluid dynamic equivalence. Once
obtained an optimized drying profile for these two shapes but for only one size, the problem of the
effect of size change is expected that should be solved by the model, and not pursued by manually
adjusting the process conditions. If the drying profiles are assumed to be still a good choice, the
2
total process time can be obtained from simulation. In the following the results of this approach are
presented by taking as target variable the average final humidity of the pasta.
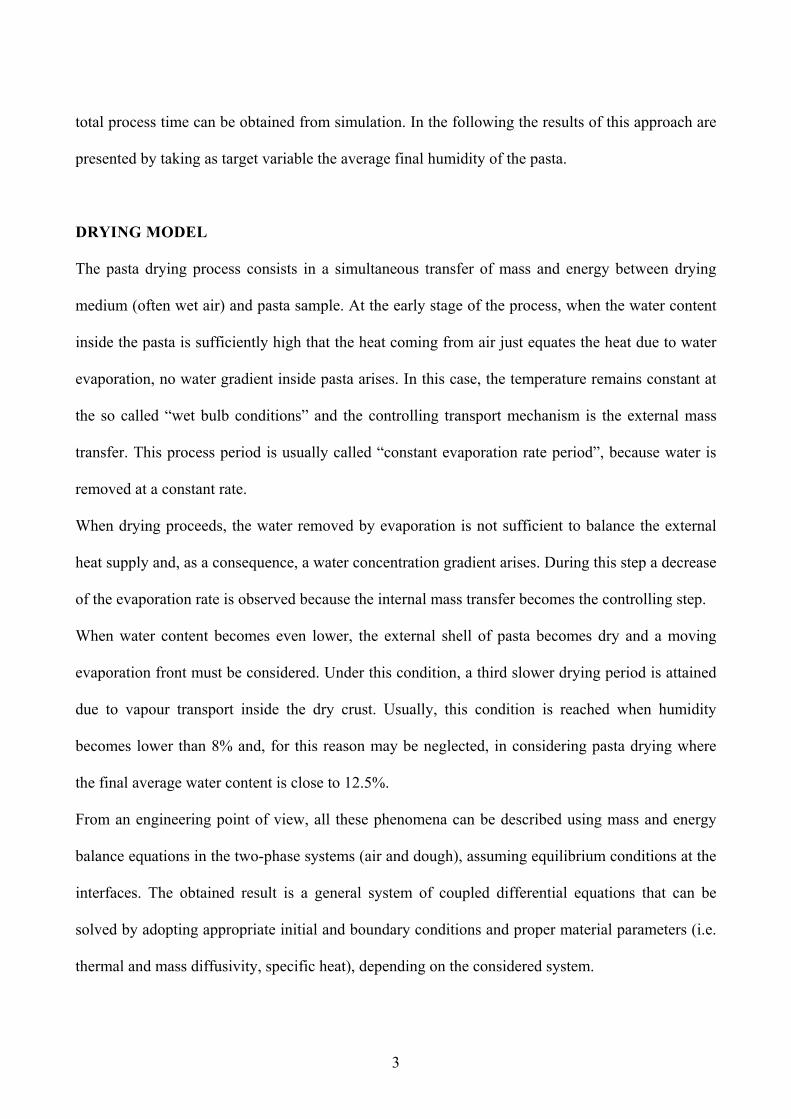
DRYING MODEL
The pasta drying process consists in a simultaneous transfer of mass and energy between drying
medium (often wet air) and pasta sample. At the early stage of the process, when the water content
inside the pasta is sufficiently high that the heat coming from air just equates the heat due to water
evaporation, no water gradient inside pasta arises. In this case, the temperature remains constant at
the so called “wet bulb conditions” and the controlling transport mechanism is the external mass
transfer. This process period is usually called “constant evaporation rate period”, because water is
removed at a constant rate.
When drying proceeds, the water removed by evaporation is not sufficient to balance the external
heat supply and, as a consequence, a water concentration gradient arises. During this step a decrease
of the evaporation rate is observed because the internal mass transfer becomes the controlling step.
When water content becomes even lower, the external shell of pasta becomes dry and a moving
evaporation front must be considered. Under this condition, a third slower drying period is attained
due to vapour transport inside the dry crust. Usually, this condition is reached when humidity
becomes lower than 8% and, for this reason may be neglected, in considering pasta drying where
the final average water content is close to 12.5%.
From an engineering point of view, all these phenomena can be described using mass and energy
balance equations in the two-phase systems (air and dough), assuming equilibrium conditions at the
interfaces. The obtained result is a general system of coupled differential equations that can be
solved by adopting appropriate initial and boundary conditions and proper material parameters (i.e.
thermal and mass diffusivity, specific heat), depending on the considered system.
3

As concerning to geometry, the most diffused pasta shape may be distinguished as short and long
pasta (fig.1). Therefore for the model approach the first one was modelled as a long fulfilled
cylinder (Fig. 1a), reminding the classic “spaghetto” with:
1LD
S
S << (1)
and the second one (Fig. 1b), was considered as a classic “rigatone” format, assumed equivalent to a
hollow cylinder with:
1L
DD
R
iR
eR <<
− (2)
Both samples were considered fully submerged in the flowing wet air and a pure diffusive
mechanism of water in dough was assumed for the internal transport. It is worthy to remind that the
most of the used pasta geometries may be reduced to one of those, by a fluid dynamic equivalence
(Migliori et al., 2003).
Following the approach elsewhere described in more detail (Migliori, 2002), in a cylindrical co-
ordinate system, under the geometrical assumption (1) and (2), only a radial variation may be
considered:
∂∂
⋅∂∂
⋅=∂∂
⋅⋅rTkr
rr1
tTC dddρ
(3)
∂∂
⋅∂∂
⋅=∂
∂rUDr
rr1
tU
d (4)
where U is the wet basis pasta humidity and T the sample temperature. The material properties, kd
thermal conductivity, ρd mass density, Cd specific heat, Dd Fick’s diffusivity of water in dough, are
considered as temperature and humidity functions (de Cindio et al., 1992).
4

As explained above, the boundary conditions describing the particular geometry are different for the
two systems. Therefore, for the short pasta sample the heat and mass flux continuity, at dough and
air interface, was imposed on both internal and external surfaces:
( ) wD
dDN
rTkTTh
RR
⋅+∂∂
−=−⋅ ∞ λ (5)
( ) wDwxD
dd NyyMsrUD
RR
=−=∂∂
∞ρ (6)
where sx and h are the external molar mass and thermal transport coefficients respectively; λ is
the evaporation latent heat of water and y the water molar fraction in air.
For long pasta, the same continuity equation holds on the external surface, while the second
condition imposes finite mass and heat flux on the symmetry axis (r=0):
0rTk
0rd =
∂∂
−=
(7)
0rUD
0rd =
∂∂
−=
(8)
For both geometries, the initial conditions are uniform temperature (T0) and humidity (U0) inside
the samples. The thermodynamic equilibrium at the dough air interface is ensured by:
(9) wweq
w apPy 0=
where P is the external air pressure, pw0 the water vapour pressure and aw the water activity in dough.
The model may be applied for different external conditions, in terms of T, U and air velocity and it supplies, as
output, the transient temperature and moisture content of pasta during the treatment. The model was completely
validated elsewhere either with a pilot plant (Migliori et al., 2002) or with industrial plant production (Migliori et
al., 2003).
In the industrial practice, two different objectives have to be reached: the process time has to be as short as
possible and, on the other hand, a high quality level of the production is required. In order to increase the plant
productivity, it is needed to accelerate the drying, by increasing temperature and by reducing humidity of air. It is
5

well known, that these conditions may lead to both thermal and mechanical damage of pasta, reducing the final
quality of the product. Aiming to reach both the objectives, processes alternating drastic and soft drying
conditions may be used. Concerning to thermal damage, it is well known that furosine production rate may be
assumed as quality parameter (Peressini et al., 2003). In the following the mechanical damage was not considered.
Once the optimal drying profile has been founded out for a fixed geometry, if it would be desired to
change the dimension of sample, a new optimisation process should be required, using expensive
trial and error procedures. On the contrary, in the following, it is reported a simulative procedure
that allows to scale up the process, following a modelling approach, with the aim to obtain either
the desired final pasta water content (12.5%) or a good quality of the product.
SIMULATIONS SET UP
The simulation set up requires the definition of two main parameters:
− The main geometrical parameter of both geometries i.e. the diameter of the cylinder DS for
spaghetti and the internal diameter DRi for rigatoni;
− The drying profiles for both geometries.
As for the first parameter a classical dimension was chosen, respectively for spaghetti (DS= 2.5
mm) and rigatoni (DRi=1.4 mm), and the optimised drying profile have been determined, as a
consequence, from industrial experience. The adopted drying process applies an alternating
profile and in fig. 2-3 the two drying curves are reported, in terms of air temperature and
humidity, versus the dimensionless process time t* defined as:
p
*
ttt = (9)
where tp is the total drying time (for spaghetti tp =110 min; rigatoni tp=100 min). The air
velocity was assumed to be, for all the considered cases equal to 1 m·s-1. This kind of plot
allows individuating easily the percentage of each treatment zone with respect to the total
6

treatment time. It clearly appears that, according to the industrial process trend (Pollini, 1996),
both profiles are characterised by the presence, at the beginning of the process, of a drastic
drying conditions followed by a rest period (2nd drying period) and eventually by a 3rd drying
period. A correct balance between the first and second period allows to maintain the sample
humidity sufficient to avoid mechanical damage due to unrelaxed viscoelastic stresses (de
Cindio et al., 2003)
It is worthy to remind also that for short pasta, the drying conditions are smoother due to the
presence of two evaporating surfaces. Therefore the drying efficiency is greater than the case of
spaghetti, where the filled cylinder offers a higher resistance to the internal water diffusion. As
a consequence, for the rigatoni shape, the severe conditions period is 10% of the entire
treatment, whilst for spaghetti is 30% of the drying profile.
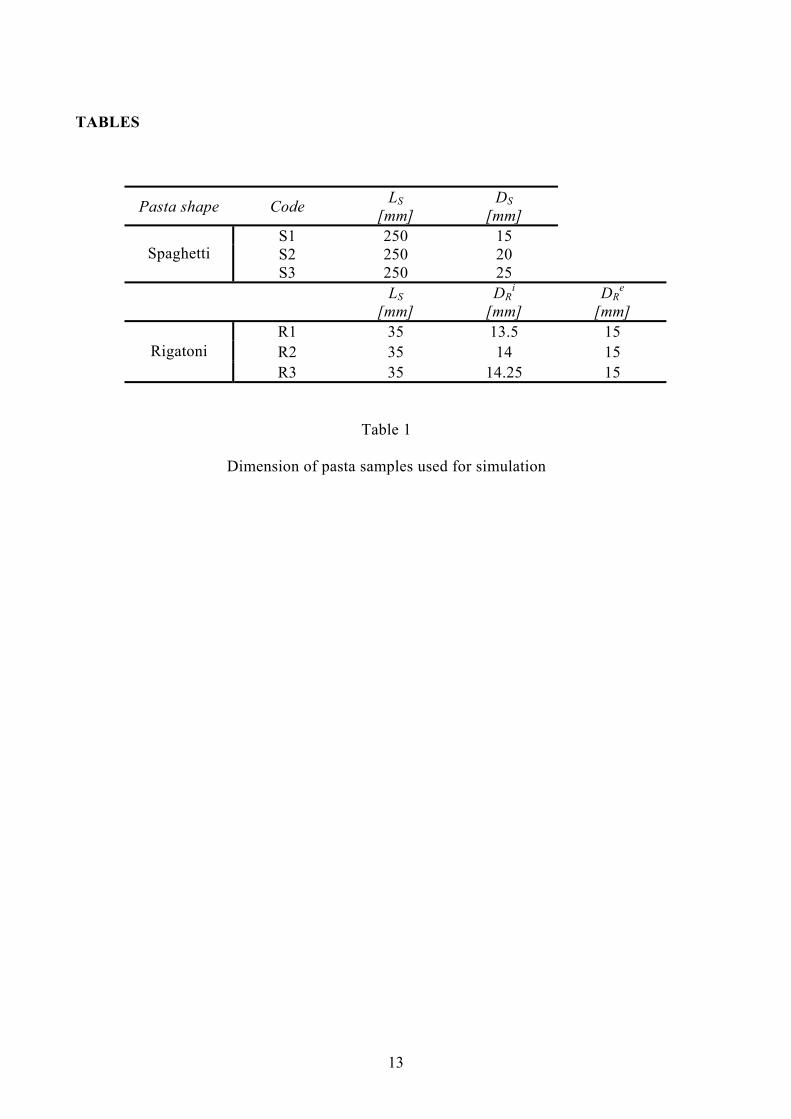
In order to show the scale up procedure, different pasta size have been individuated by changing
DS and DRi as reported in Tab.1.
It was assumed as scale up criterion the constancy of the percentage distribution of the different
zones whilst the total process time, at witch the final pasta moisture content is 12.5%, obviously
must change.
RESULTS AND DISCUSSION
Spaghetti format
Simulations have been performed with different values of DS, in order to fit the proposed
criterion. Consequently different values of tp were found as shown in Fig.4, where the reported
black line represents the target moisture content of 12.5%. In Tab.2 the total process time for
each size is reported and, as expected, the process time increases when the spaghetti diameter
increases too. But if the water content is reported versus the dimensionless time t*, as shown in
7

Fig.5, the three curves overlap generating a sort of “master curve”. This may be used as good
manufacturing guideline for choosing drying profiles. In facts because the drying curve slope is
the same, this implies that all the pasta sizes tend to follow the same drying mechanism at any
time t*, even though they look completely different at any time t. This result gives an useful tool
when changing pasta size because gives directly the required process time tp. In fact, whatever
is the spaghetti size, a good estimation of the process time may be obtained by simply imposing
that the adopted drying curve should be as close as possible to the “master curve”. In such a
way a sort of quasi-optimization is obtained for every dimension, starting from a single
optimized condition. The model gives as output also the values of the quality indices of the final
product, and in Fig.6 is reported the furosine evolution during the treatment for all the samples.
This index is a measure of the thermal damage and it clearly appears that, even though the
process conditions are the same in terms of applied thermal and humidity profiles of the drying
wet air, nevertheless it was found that greater are the dimensions greater will be the furosine
content, as a consequence of the longer treatment time.
Rigatoni format
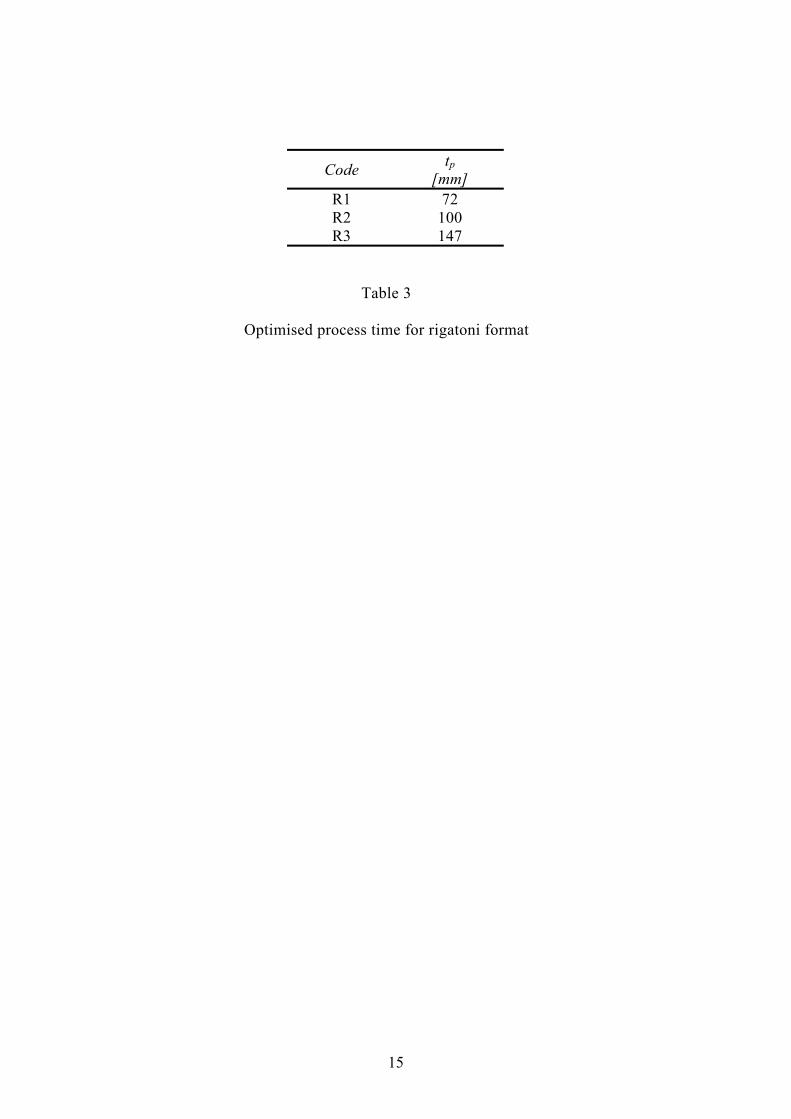
The same approach described above was used for the rigatoni shape, and the simulations were
performed for different DRi (Tab.3). The results of this simulated process are shown in Fig.7,
and again different values of tp were found. Even in this case the drying curves were reported
versus t*, as shown in Fig.8. It clearly appears as for the above case of spaghetti that the three
curves overlap each other, even though the pasta format has changed, and therefore the
suggested criterion of the “master curve” still applies.
8

As already done for spaghetti format, the furosine content was computed and the results are
shown in Fig.9. Also in this case it was found that the final quality of pasta strongly depends on
the total process time, when the drying profile is fixed.
From the furosine diagrams, it clearly appears that, for both formats, the final quality of pasta
strongly depends on the characteristics of the setted drying profile. In fact, a more aggressive
drying profile as in the case of spaghetti, increases the final furosine content (about 150 mg⋅100
g of proteins-1), more than the case of a mild process such as the case of rigatoni (about 40
mg⋅100 g of proteins-1). Anyway, from all the simulation results the final pasta quality may be
considered satisfactory, in terms of furosine content if compared to the industrial expectations
(Peressini et al., 2003) the highest value being 150 mg⋅100 g of proteins-1.
Finally it should be remarked that if the two master curves are compared (Fig.10), it obviously
appears that drying conditions for cylindrical pasta format, shows a resulting drying rate higher
than the case of the hollowed format, as expected being due to the different imposed external
conditions.
CONCLUSIONS
The use of physical based predictive models once again resulted to be very important in
conducting process were the only possibility of control stands on the external conditions. Even
if these are strictly fixed, then a simple change of shape or size of the pasta format, can give
drastic changes in the products, resulting in loss of quality. Often this requires a marked change
of the process conditions and particularly of the total process time.
The main issue of this work was the possibility to have a rather helpful criterion to determine
the processing time directly, from a single optimized validated process corresponding to a given
size. Because the result is demonstrated to extend to different shapes, in principle it is possible
9
to apply the suggested scale up criterion, to any size and shape. Owing to the fact that several
shapes are industrially produced, a reduction of any shape to the two above considered by
means of a fluid dynamic equivalence, allows to apply the method to a wide range of products
just as a tool capable to avoid expensive and often useless trial and error tests.
ACNOWLEDGEMENTS
This work was developed in the frame of PNR TEMA 8 Industrial Research, granted by
MURST that is acknowledged. The authors would also acknowledge Mr. Francesco Carbone for
software preparation and set up.
10

REFERENCES
− de Cindio, B., Brancato,B., Saggese, A., (1992). Modellazione del processo di essiccamento
di Paste Alimentari (Modelling of pasta drying process). University of Naples, IMI-PAVAN
Project - Final report (Italian language).
− de Cindio B., Gabriele D., Migliori M., Pollini C.M. (2003), Modelling of drying for high quality pasta
production.Proceedings of “International Symposium of Rheology and Food Structure. Eurorheo 2003-01”
10th-13th February 2003 Zurich (CH), 635-636.
− Migliori, M. (2002). Rheological modelling of drying process of high quality pasta (Italian
language), PhD dissertation University of Calabria, Italy
− Migliori, M., Gabriele, D., de Cindio, B., & Pollini, C.M. (2002). Modelling and Simulation
of High Quality Pasta Driyng. Proceedings of II International Workshop “Durum Wheat and
Pasta Quality: Recent Achievements. November 19th – 20th 2003, Rome (Italy), 163-169.
− Migliori M., Gabriele D., de Cindio B., Pollini C.M. (2003). Mathematical Modelling of
High Quality Short Pasta Drying. International Workshop “Finite Element Modelling in
Chemical and Food Engineering FEM’03”, 9-10 October 2003, Salerno (Italy), 111-120
− Pollini, C.M. (1996). Pasta drying: consolidation of VHT technology. In Kruger, J.E.,
Matsuo, R.B., Dick, J.W. (Eds.), Pasta and Noodle Technology (pp. 19-37), American
Association of Cereal Chemistry, St. Paul (USA).
− Sensidoni, A., Peressini, D., & Pollini, C.M. (2003). Management of non-enzymatic browning in
pasta processing. Tecnica Molitoria International. 54 2/A, 99-110.
11

LEGEND OF FIGURES
Figure 1 Pasta shape geometry
Figure 2 Drying profile for spaghetti format
Figure 3 Drying profile for rigatoni format
Figure 4: Drying profiles for spaghetti format
Figure 5 Drying profiles master curve for spaghetti format
Figure 6 Furosine content for spaghetti format
Figure 7 Drying profiles for rigatoni format
Figure 8 Drying profiles master curve for rigatoni format
Figure 9 Furosine content for rigatoni format
Figure 10 Master curve comparison for different pasta format
12
TABLES
Pasta shape Code LS [mm]
DS [mm]
S1 250 15 S2 250 20 Spaghetti S3 250 25
LS [mm]
DRi
[mm] DR
e
[mm] R1 35 13.5 15 R2 35 14 15 Rigatoni R3 35 14.25 15
Table 1
Dimension of pasta samples used for simulation
13

Code tp [mm]
S1 74 S2 110 S3 150
Table 2
Optimised process time for spaghetti format
14
Code tp [mm]
R1 72 R2 100 R3 147
Table 3
Optimised process time for rigatoni format
15

LS
DS
r
LR
DRi
DRe
r
(a) (b)LS
DS
r
LR
DRi
DRe
r
(a) (b)LS
DS
r
LR
DRi
DRe
r
(a) (b)
Figure 1
16

60
70
80
90
100
0 0.2 0.4 0.6 0.8 1
t*, -
Tem
pera
ture
, °C
50
60
70
80
90
100
Air
hum
idity
, %
Temperature Air humidity
Figure 2
17

50
60
70
80
90
100
0 0.2 0.4 0.6 0.8 1
t*, -
Tem
pera
ture
, °C
50
60
70
80
90
100
Air
hum
idity
, %
Temperature Air humidity
Figure 3
18

10
15
20
25
30
35
0 20 40 60 80 100 120 140 160
time, min
Past
a w
ater
con
tent
, %
S1 S2 S3
Figure 4
19

10
15
20
25
30
35
0 0.2 0.4 0.6 0.8 1
t*, -
Past
a w
ater
con
tent
, %
S1 S2 S3
Figure 5
20

0
20
40
60
80
100
120
140
160
0 0.2 0.4 0.6 0.8 1 1.2
t*, -
Furo
sine
, mg/
(100
g o
f pro
tein
s)
S1
S2
S3
Figure 6
21

10
15
20
25
30
35
0 20 40 60 80 100 120 140 160
time, min
Past
a w
ater
con
tent
, %
R1 R2 R3
Figure 7
22

10
15
20
25
30
35
0 0.2 0.4 0.6 0.8 1
time, min
Past
a w
ater
con
tent
, %
R1 R2 R3
Figure 8
23

0
10
20
30
40
50
0 0.2 0.4 0.6 0.8 1
t*, -
Furo
sine
, mg/
(100
g o
f pro
tein
s)
R1 R2 R3
Figure 9
24

10
15
20
25
30
35
0 0.2 0.4 0.6 0.8 1
time, min
Past
a w
ater
con
tent
, %
Rigatoni Spaghetti
Figure 10
25