Beyond Nuclear Pasta: Phase Transitions and Neutrino Opacity of Non-Traditional Pasta
12
Beyond Nuclear Pasta: Phase Transitions and Neutrino Opacity of Non-Traditional Pasta P. N. Alcain, P. A. Gim´ enez Molinelli and C. O. Dorso Departamento de F´ ısica, FCEyN, UBA and IFIBA, Conicet, Pabell´ on 1, Ciudad Universitaria, 1428 Buenos Aires, Argentina and IFIBA-CONICET (Dated: June 11, 2014) In this work, we focus on different length scales within the dynamics of nucleons in conditions according to the neutron star crust, with a semiclassical molecular dynamics model, studying isospin symmetric matter at subsaturation densities. While varying the temperature, we find that a solid- liquid phase transition exists, that can be also characterized with a morphology transition. For higher temperatures, above this phase transition, we study the neutrino opacity, and find that in the liquid phase, the scattering of low momenta neutrinos remain high, even though the morphology of the structures differ significatively from those of the traditional nuclear pasta. PACS numbers: PACS 24.10.Lx, 02.70.Ns, 26.60.Gj, 21.30.Fe I. INTRODUCTION A neutron star has a radius of approximately 10 km and a mass of a few solar masses. According to current models [1], the structure neutron star can be roughly de- scribed as composed in two parts: the crust, of 1.5 km thick and a density of up to half the normal nuclear den- sity ρ 0 , with the structures known as nuclear pasta [2]; and the core, where the structure is still unknown and remains highly speculative [3]. Most neutron stars are remanents of core collapse supernovae. This kind of su- pernovae happen when the hot and dense Fe core of a dying massive star (known as proto-neutron star) col- lapses. During the collapse, several nuclear processes take place in the inner core of the star — electron cap- ture, photodisintegration, URCA, etc. These processes, apart from increasing the overall neutron number of the system, produce a large amount of neutrinos which flow outwards. The interaction between the neutrinos stream- ing from the core of the proto-neutron star and its outer layers play an important role in reversing the collapse that causes the supernova. On the other hand, neutron stars are born hot, but cool down by means of neutrino emission. Therefore, the interaction between the neutrinos and neutron star matter is key to comprehend two aspects of a neutron star history: its genesis and its thermal evolution. The neutron stars’ crust is composed of neutrons and protons embedded in a degenerate electron gas. Pro- tons and neutrons in the crust are supposedly arranged in structures that differ substantially from the “normal” nuclei — the non-homogeneous phases collectively known as nuclear pasta. The structure of this nuclear pasta is related to the neutrino opacity of neutron stars’ crust, neutron star quakes, and pulsar glitches. Specifically, the neutron star quakes and pulsar glitches are related to the mechanical properties of the crust matter [4], while the neutrino opacity is enhanced by coherent scattering. This enhancement of the crust’s opacity is related to the static structure factor of nuclear pasta [5]: dσ dΩ = dσ dΩ uniform × S(q). And since neutron stars cooling is associated with neu- trino emission from the core, the interaction between the neutrinos and the particular structure of the crust would dramatically affect the thermal history of young neutron stars. Several models have been developed to study nuclear pasta, and they have shown that these structures arise due to the interplay between nuclear and Coulomb forces in an infinite medium. Nevertheless, the dependence of the thermodynamic observables has not been studied in depth. The original works of Ravenhall et al. [2] and Hashimoto et al. [6] used a compressible liquid drop model, and proposed the now known as pasta phases – lasagna, spaghetti and gnocchi –. Further works [7–12] an- alyzed only these phases, with mean field models. Other authors [13–16] used dynamical models, but focusing mainly on the phases already mentioned. The work by Nakazato et al. [18], inspired by polymer systems, found also gyroid and double-diamond structures, with a com- pressible liquid drop model. Dorso et al. [17] arrived to pasta phases different from those already mentioned with molecular dynamics, studying mostly its characterization at very low temperatures. In this work, we study the neutron stars with molecular dynamics, using the CMD model [22]. We use morpho- logic and thermodynamic tools to characterize symmet- ric neutron star matter at different temperatures, focus- ing on the static structure factor. We characterize the morphology of the emerging structures with the pair dis- tribution function and the Minkowski functionals [15], a complete set of morphological measures. The possible existence of a solid-liquid phase transition is explored via the Lindemann coefficient [19]. With these tools at very low temperatures, we found a phase transition that is both morphologic and thermo- arXiv:1406.1550v1 [nucl-th] 5 Jun 2014
-
Upload
independent -
Category
Documents
-
view
2 -
download
0
Transcript of Beyond Nuclear Pasta: Phase Transitions and Neutrino Opacity of Non-Traditional Pasta
Beyond Nuclear Pasta: Phase Transitions and Neutrino Opacity of Non-TraditionalPasta
P. N. Alcain, P. A. Gimenez Molinelli and C. O. DorsoDepartamento de Fısica, FCEyN, UBA and IFIBA, Conicet,
Pabellon 1, Ciudad Universitaria, 1428 Buenos Aires, Argentina andIFIBA-CONICET
(Dated: June 11, 2014)
In this work, we focus on different length scales within the dynamics of nucleons in conditionsaccording to the neutron star crust, with a semiclassical molecular dynamics model, studying isospinsymmetric matter at subsaturation densities. While varying the temperature, we find that a solid-liquid phase transition exists, that can be also characterized with a morphology transition. Forhigher temperatures, above this phase transition, we study the neutrino opacity, and find that inthe liquid phase, the scattering of low momenta neutrinos remain high, even though the morphologyof the structures differ significatively from those of the traditional nuclear pasta.
PACS numbers: PACS 24.10.Lx, 02.70.Ns, 26.60.Gj, 21.30.Fe
I. INTRODUCTION
A neutron star has a radius of approximately 10 kmand a mass of a few solar masses. According to currentmodels [1], the structure neutron star can be roughly de-scribed as composed in two parts: the crust, of 1.5 kmthick and a density of up to half the normal nuclear den-sity ρ0, with the structures known as nuclear pasta [2];and the core, where the structure is still unknown andremains highly speculative [3]. Most neutron stars areremanents of core collapse supernovae. This kind of su-pernovae happen when the hot and dense Fe core of adying massive star (known as proto-neutron star) col-lapses. During the collapse, several nuclear processestake place in the inner core of the star — electron cap-ture, photodisintegration, URCA, etc. These processes,apart from increasing the overall neutron number of thesystem, produce a large amount of neutrinos which flowoutwards. The interaction between the neutrinos stream-ing from the core of the proto-neutron star and its outerlayers play an important role in reversing the collapsethat causes the supernova.
On the other hand, neutron stars are born hot, butcool down by means of neutrino emission. Therefore,the interaction between the neutrinos and neutron starmatter is key to comprehend two aspects of a neutronstar history: its genesis and its thermal evolution.
The neutron stars’ crust is composed of neutrons andprotons embedded in a degenerate electron gas. Pro-tons and neutrons in the crust are supposedly arrangedin structures that differ substantially from the “normal”nuclei — the non-homogeneous phases collectively knownas nuclear pasta. The structure of this nuclear pasta isrelated to the neutrino opacity of neutron stars’ crust,neutron star quakes, and pulsar glitches. Specifically,the neutron star quakes and pulsar glitches are related tothe mechanical properties of the crust matter [4], whilethe neutrino opacity is enhanced by coherent scattering.This enhancement of the crust’s opacity is related to the
static structure factor of nuclear pasta [5]:
dσ
dΩ=
(dσ
dΩ
)uniform
× S(q).
And since neutron stars cooling is associated with neu-trino emission from the core, the interaction between theneutrinos and the particular structure of the crust woulddramatically affect the thermal history of young neutronstars.
Several models have been developed to study nuclearpasta, and they have shown that these structures arisedue to the interplay between nuclear and Coulomb forcesin an infinite medium. Nevertheless, the dependence ofthe thermodynamic observables has not been studied indepth.
The original works of Ravenhall et al. [2] andHashimoto et al. [6] used a compressible liquid dropmodel, and proposed the now known as pasta phases –lasagna, spaghetti and gnocchi–. Further works [7–12] an-alyzed only these phases, with mean field models. Otherauthors [13–16] used dynamical models, but focusingmainly on the phases already mentioned. The work byNakazato et al. [18], inspired by polymer systems, foundalso gyroid and double-diamond structures, with a com-pressible liquid drop model. Dorso et al. [17] arrived topasta phases different from those already mentioned withmolecular dynamics, studying mostly its characterizationat very low temperatures.
In this work, we study the neutron stars with moleculardynamics, using the CMD model [22]. We use morpho-logic and thermodynamic tools to characterize symmet-ric neutron star matter at different temperatures, focus-ing on the static structure factor. We characterize themorphology of the emerging structures with the pair dis-tribution function and the Minkowski functionals [15],a complete set of morphological measures. The possibleexistence of a solid-liquid phase transition is explored viathe Lindemann coefficient [19].
With these tools at very low temperatures, we founda phase transition that is both morphologic and thermo-
arX
iv:1
406.
1550
v1 [
nucl
-th]
5 J
un 2
014

2
dynamic: a discontinuity in the Minkowski functionalsshows the morphologic transition, while a coincident dis-continuity in both energy and the Lindemann coefficientshow a thermodynamic solid-liquid transition. At tem-peratures slightly higher, we found stable structures thatdo not belong to usual pasta menu. Moreover, these un-usual shapes absorb neutrinos more efficiently than thetypical nuclear pasta.
This work is structured as follows. In section II wereview the interaction model, along with the tools usedto analyze the results we obtained. In section III A wepresent and characterize the solid-liquid phase transitionin nuclear pasta. Then, in sections III B and III C westudy the very-long range order of the pasta phases, fo-cusing on its influence on the opacity of the crust tolow-momentum neutrinos. We discuss the appearanceof some unusual pasta shapes, and how these newfoundstructures may enhance the opacity of the crust morethan traditional pasta in section III D. Finally, in sec-tion IV we draw conclusions about the results presented.
II. CLASSICAL MOLECULAR DYNAMICSMODEL
Of the many models used to study nuclear pasta, theadvantage of classical or semiclassical models is the ac-cessibility to position and momentum of all particles atall times. This allows the study of the structure of thenuclear medium from a particle-wise point of view. Manymodels exist with this goal, like simple-semiclassical po-tential [16], quantum molecular dynamics [21] and clas-sical molecular dynamics [22]. In these models the Paulirepulsion between nucleons of equal isospin is either hard-coded in the interaction or as a separate term [23].
In this work, we model the interaction between nucle-ons with a classical molecular dynamics (CMD) model tostudy nuclear reactions. Dorso et al. provided justifica-tion for its use in the stellar crust environment [17].
The classical molecular dynamics model CMD, as in-troduced in Ref. [24], has been successfully used in heavy-ion reaction studies to: help understand experimentaldata [25]; identify phase-transition signals and other crit-ical phenomena [26–29]; and explore the caloric curve [30]and isoscaling [31, 32]. CMD uses two two-body poten-tials to describe the interaction of nucleons, which are acombination of Yukawa potentials:
Vnp(r) = vr exp(−µrr)/r − va exp(−µar)/rVnn(r) = v0 exp(−µ0r)/r
where Vnp is the potential between a neutron and a pro-ton, and Vnn is the repulsive interaction between eithernn or pp. The cutoff radius is rc = 5.4 fm and forr > rc both potentials are set to zero. The Yukawaparameters µr, µa and µ0 were determined to yield anequilibrium density of ρ0 = 0.16 fm−3, a binding en-ergy E(ρ0) = 16 MeV/nucleon and a compressibility of250 MeV [22].
To simulate an infinite medium, we used CMD underperiodic boundary conditions, symmetric in isospin (i.e.with x = Z/A = 0.5, 2500 protons and 2500 neutrons)in cubical boxes with sizes adjusted to have densities be-tween ρ = 0.03 fm−3 ≤ ρ ≤ 0.13 fm−3. Although in theactual neutron stars the proton fraction is low (x < 0.5),we chose to work with symmetric matter because thatway we could study the neutron stars without having asymmetry term in the energy.
A. Coulomb interaction in the Model
Since a neutralizing electron gas embeds the nucleonsin the neutron star crust, the Coulomb forces betweenprotons are screened. One of the many ways to modelthis screening effect is the Thomas–Fermi approximation,used with various nuclear models [5, 13, 17]. Accordingto this approximation, protons interact via a Yukawa-likepotential, with a screening length λ:
VTF (r) = q2e−r/λ
r.
Theoretical estimations for the screening length λ areλ ∼ 100 fm [33], but we set the screening length toλ = 20 fm. This choice was based on previous stud-ies [34], where we have shown that this value is enough toadequately reproduce the expected length scale of densityfluctuations for this model.
B. Simulation procedure
The trajectories of the nucleons are then governed bythe Pandharipande and the screened Coulomb poten-tials. The nuclear system is cooled from T = 0.8 MeVto T = 0.2 MeV using isothermal molecular dynamicswith the Nose–Hoover thermostat procedure [35], in theLAMMPS package [36]. Systems are cooled in small tem-perature steps (∆T = 0.01), decreasing the temperatureonce both the energy and the temperature, as well astheir fluctuations, are stable.
C. Other tools
1. Minkowski functionals
The Minkowski functionals [37] are a set of indepen-dent functionals that satisfy three properties: motion in-variance, additivity and continuity. The morphologicaland topological properties of any given closed and ori-ented surface can be completely characterized by theseMikowski functionals [34, 38]. According to Hadwiger’stheorem [39], for a body in a d -dimensional Euclideanspace, there are d + 1 Minkowski functionals. For threedimensional bodies, these four functionals are: volume V ,
3
surface area S, Euler characteristic χ and integral meancurvature B.
While the volume and surface area have an easy intu-itive interpretation, we will explain further the other twofunctionals. The Euler characteristic χ is a topologicalmeasure that can be interpreted as:
χ = (isolated regions) + (cavities) - (tunnels)
. The integral mean curvature, known as mean breadth,is a measure of the typical width of the body.
Using these functionals, we proposed a classificationfor the structures obtained in simulations of Neutron StarMatter within the CMD framework that is summarizedin table I [17].
TABLE I: Classification of NSM shapes based onMinkowski functionals
B < 0 B ∼ 0 B > 0
χ > 0 Anti-Gnocchi Gnocchi
χ ∼ 0 Anti-Spaghetti Lasagna Spaghetti
χ < 0 Anti-Jungle Gym Jungle Gym
2. Lindemann coefficient
The Lindemann coefficient [19] is based on the ideaof particle “disorder”, used mostly to study solid-liquidtransitions in infinite systems like crystals [40] and is de-fined from the standard deviation of the positions of theparticles ∆r2i as follows :
∆L =
√∑i〈∆r2i /N〉a
where a is the lattice constant of the crystal and N isthe total number of particles. In our case, we set a =(V/N)1/3, the typical length of each particle.
III. RESULTS AND DISCUSSION
In what follows, we present the results obtained coolingdown a system of approximately 5000 particles.
A. Phase transition
1. Thermodinamical Phase Transition
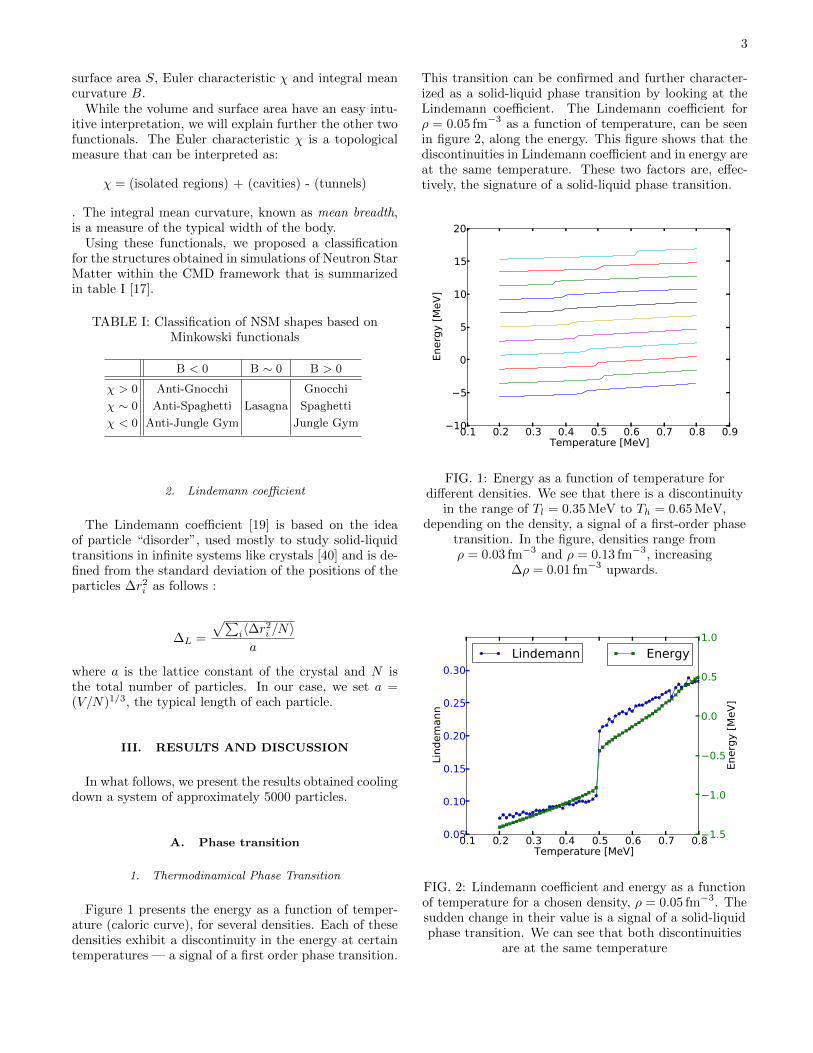
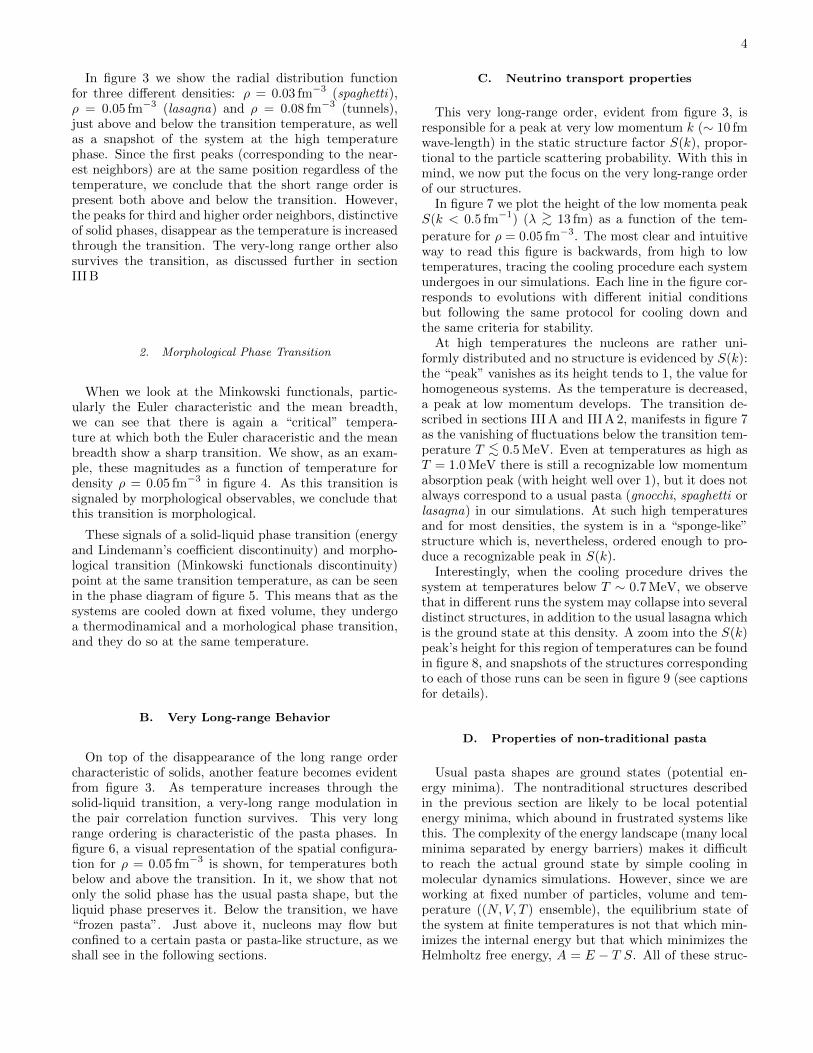
Figure 1 presents the energy as a function of temper-ature (caloric curve), for several densities. Each of thesedensities exhibit a discontinuity in the energy at certaintemperatures — a signal of a first order phase transition.
This transition can be confirmed and further character-ized as a solid-liquid phase transition by looking at theLindemann coefficient. The Lindemann coefficient forρ = 0.05 fm−3 as a function of temperature, can be seenin figure 2, along the energy. This figure shows that thediscontinuities in Lindemann coefficient and in energy areat the same temperature. These two factors are, effec-tively, the signature of a solid-liquid phase transition.
0.1 0.2 0.3 0.4 0.5 0.6 0.7 0.8 0.9Temperature [MeV]
10
5
0
5
10
15
20
Ener
gy [M
eV]
FIG. 1: Energy as a function of temperature fordifferent densities. We see that there is a discontinuity
in the range of Tl = 0.35 MeV to Th = 0.65 MeV,depending on the density, a signal of a first-order phase
transition. In the figure, densities range fromρ = 0.03 fm−3 and ρ = 0.13 fm−3, increasing
∆ρ = 0.01 fm−3 upwards.
0.1 0.2 0.3 0.4 0.5 0.6 0.7 0.8Temperature [MeV]
0.05
0.10
0.15
0.20
0.25
0.30
Lind
eman
n
Lindemann
1.5
1.0
0.5
0.0
0.5
1.0
Ener
gy [M
eV]
Energy
FIG. 2: Lindemann coefficient and energy as a functionof temperature for a chosen density, ρ = 0.05 fm−3. Thesudden change in their value is a signal of a solid-liquidphase transition. We can see that both discontinuities
are at the same temperature
4
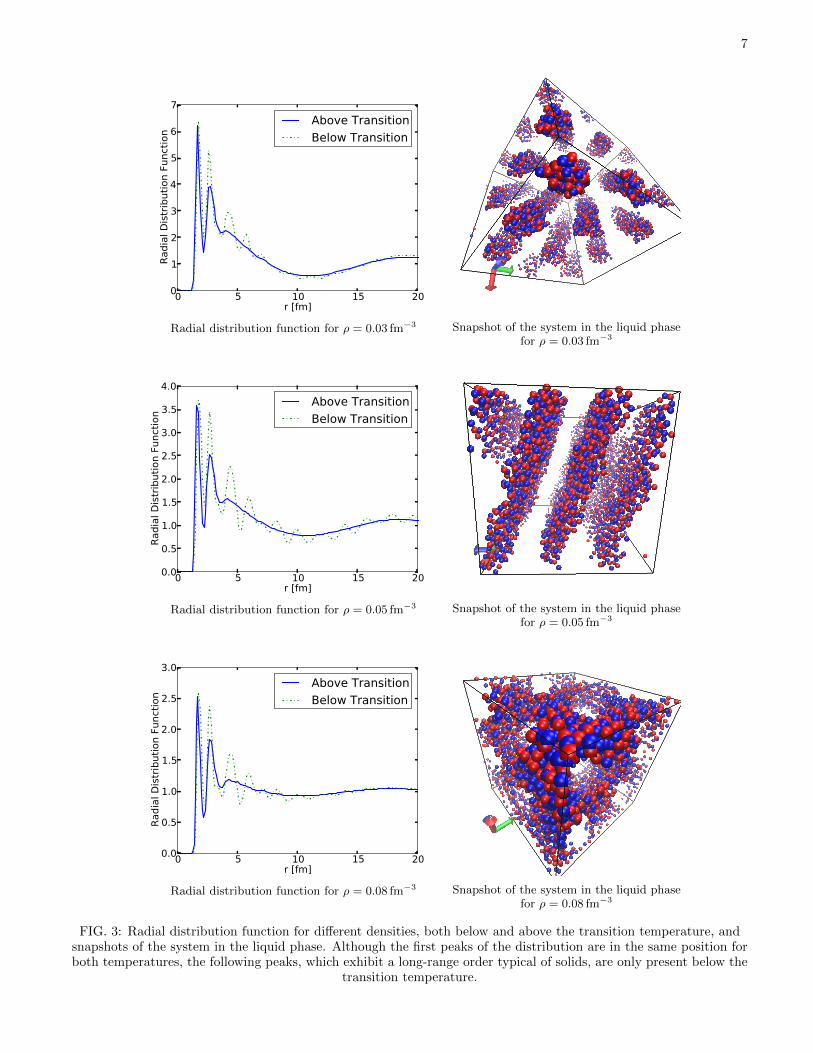
In figure 3 we show the radial distribution functionfor three different densities: ρ = 0.03 fm−3 (spaghetti),ρ = 0.05 fm−3 (lasagna) and ρ = 0.08 fm−3 (tunnels),just above and below the transition temperature, as wellas a snapshot of the system at the high temperaturephase. Since the first peaks (corresponding to the near-est neighbors) are at the same position regardless of thetemperature, we conclude that the short range order ispresent both above and below the transition. However,the peaks for third and higher order neighbors, distinctiveof solid phases, disappear as the temperature is increasedthrough the transition. The very-long range orther alsosurvives the transition, as discussed further in sectionIII B
2. Morphological Phase Transition
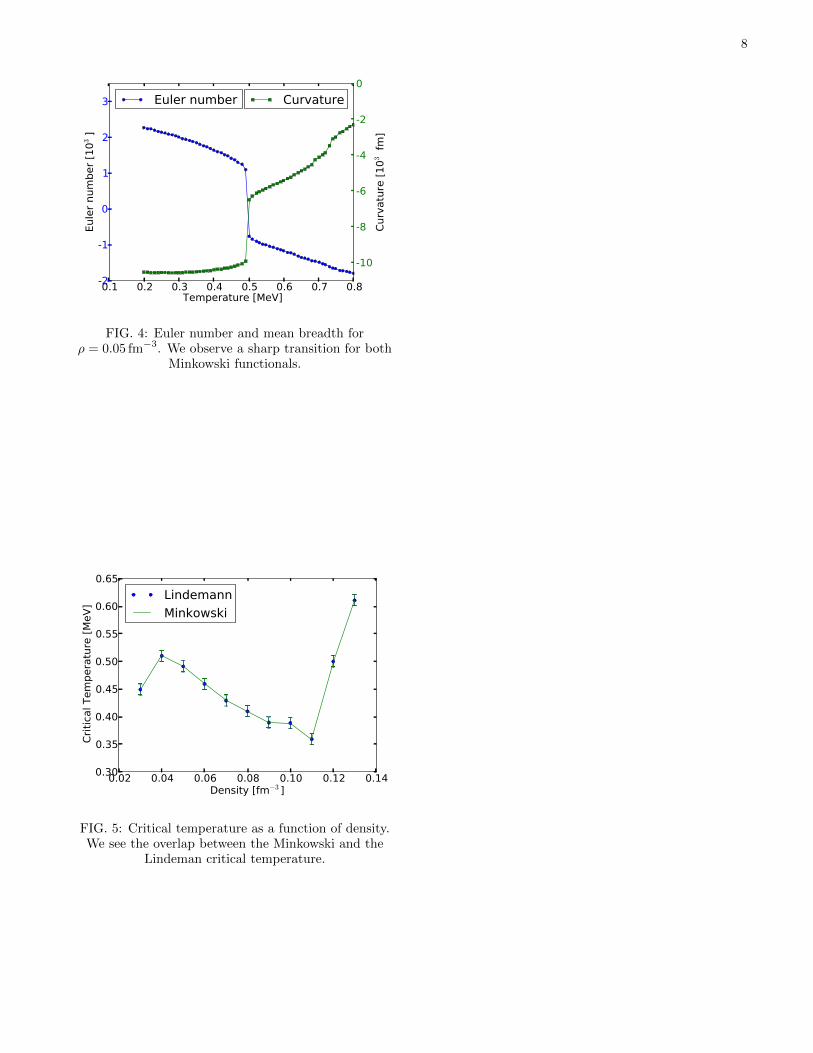
When we look at the Minkowski functionals, partic-ularly the Euler characteristic and the mean breadth,we can see that there is again a “critical” tempera-ture at which both the Euler characeristic and the meanbreadth show a sharp transition. We show, as an exam-ple, these magnitudes as a function of temperature fordensity ρ = 0.05 fm−3 in figure 4. As this transition issignaled by morphological observables, we conclude thatthis transition is morphological.
These signals of a solid-liquid phase transition (energyand Lindemann’s coefficient discontinuity) and morpho-logical transition (Minkowski functionals discontinuity)point at the same transition temperature, as can be seenin the phase diagram of figure 5. This means that as thesystems are cooled down at fixed volume, they undergoa thermodinamical and a morhological phase transition,and they do so at the same temperature.
B. Very Long-range Behavior
On top of the disappearance of the long range ordercharacteristic of solids, another feature becomes evidentfrom figure 3. As temperature increases through thesolid-liquid transition, a very-long range modulation inthe pair correlation function survives. This very longrange ordering is characteristic of the pasta phases. Infigure 6, a visual representation of the spatial configura-tion for ρ = 0.05 fm−3 is shown, for temperatures bothbelow and above the transition. In it, we show that notonly the solid phase has the usual pasta shape, but theliquid phase preserves it. Below the transition, we have“frozen pasta”. Just above it, nucleons may flow butconfined to a certain pasta or pasta-like structure, as weshall see in the following sections.
C. Neutrino transport properties
This very long-range order, evident from figure 3, isresponsible for a peak at very low momentum k (∼ 10 fmwave-length) in the static structure factor S(k), propor-tional to the particle scattering probability. With this inmind, we now put the focus on the very long-range orderof our structures.
In figure 7 we plot the height of the low momenta peakS(k < 0.5 fm−1) (λ >∼ 13 fm) as a function of the tem-
perature for ρ = 0.05 fm−3. The most clear and intuitiveway to read this figure is backwards, from high to lowtemperatures, tracing the cooling procedure each systemundergoes in our simulations. Each line in the figure cor-responds to evolutions with different initial conditionsbut following the same protocol for cooling down andthe same criteria for stability.
At high temperatures the nucleons are rather uni-formly distributed and no structure is evidenced by S(k):the “peak” vanishes as its height tends to 1, the value forhomogeneous systems. As the temperature is decreased,a peak at low momentum develops. The transition de-scribed in sections III A and III A 2, manifests in figure 7as the vanishing of fluctuations below the transition tem-perature T <∼ 0.5 MeV. Even at temperatures as high asT = 1.0 MeV there is still a recognizable low momentumabsorption peak (with height well over 1), but it does notalways correspond to a usual pasta (gnocchi, spaghetti orlasagna) in our simulations. At such high temperaturesand for most densities, the system is in a “sponge-like”structure which is, nevertheless, ordered enough to pro-duce a recognizable peak in S(k).
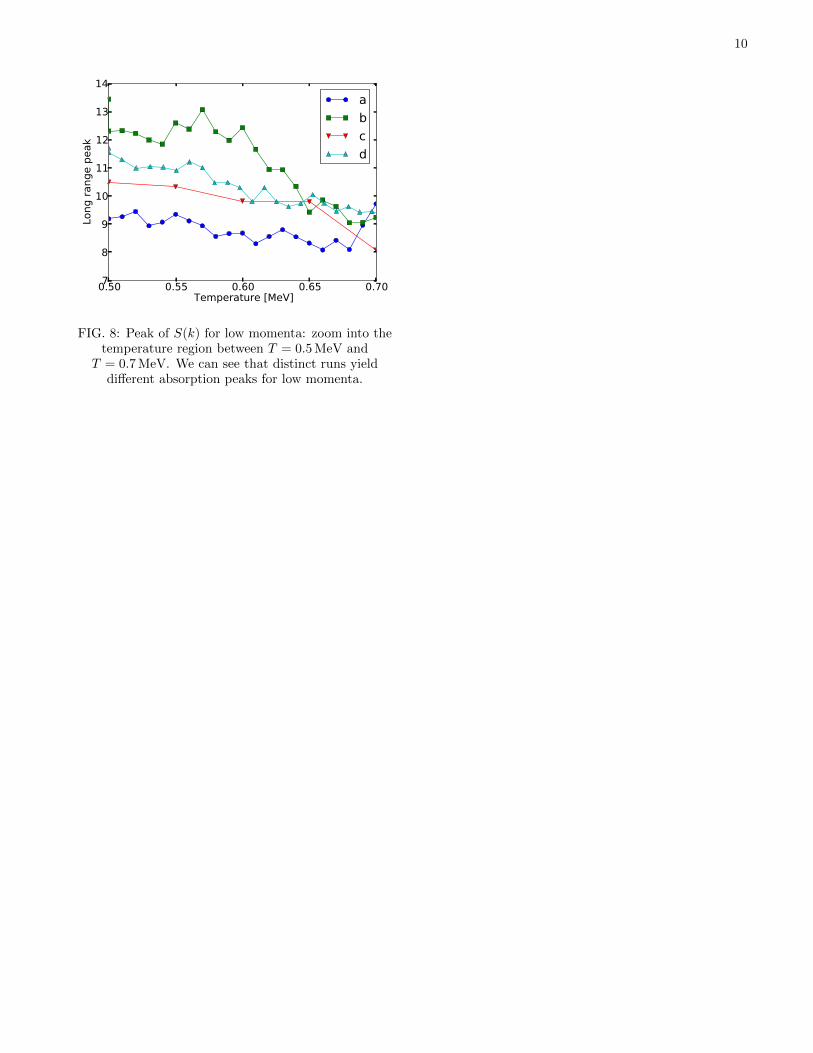
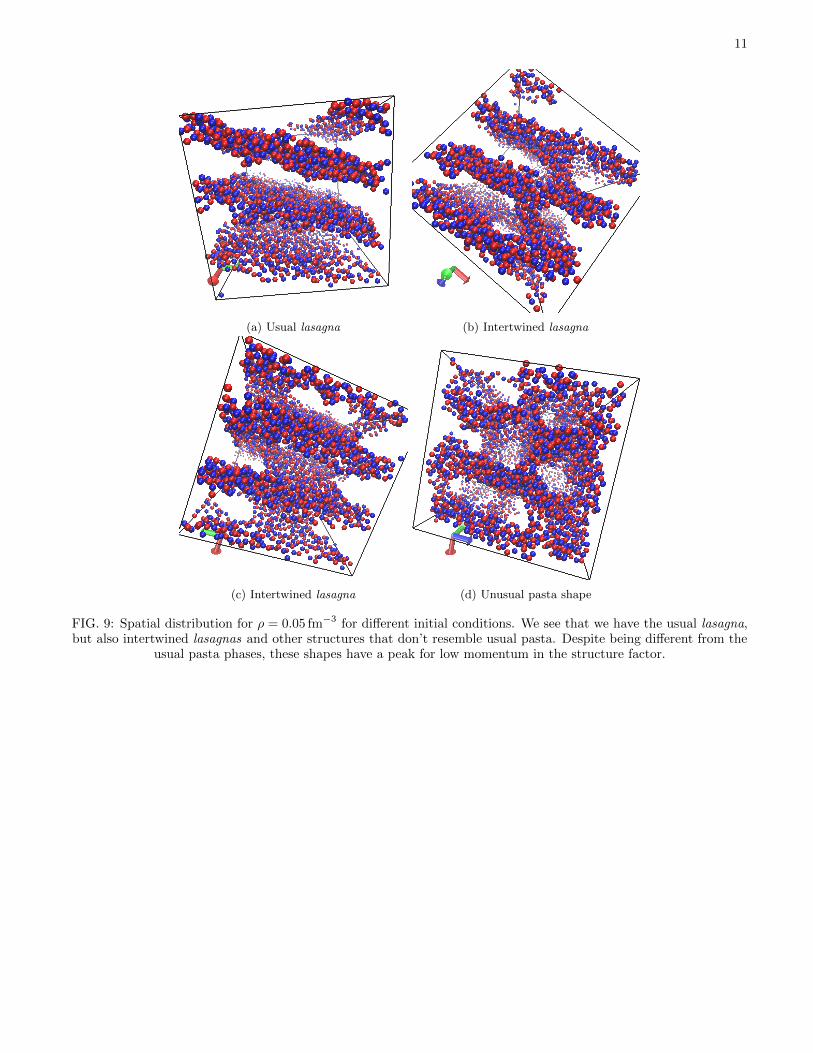
Interestingly, when the cooling procedure drives thesystem at temperatures below T ∼ 0.7 MeV, we observethat in different runs the system may collapse into severaldistinct structures, in addition to the usual lasagna whichis the ground state at this density. A zoom into the S(k)peak’s height for this region of temperatures can be foundin figure 8, and snapshots of the structures correspondingto each of those runs can be seen in figure 9 (see captionsfor details).
D. Properties of non-traditional pasta
Usual pasta shapes are ground states (potential en-ergy minima). The nontraditional structures describedin the previous section are likely to be local potentialenergy minima, which abound in frustrated systems likethis. The complexity of the energy landscape (many localminima separated by energy barriers) makes it difficultto reach the actual ground state by simple cooling inmolecular dynamics simulations. However, since we areworking at fixed number of particles, volume and tem-perature ((N,V, T ) ensemble), the equilibrium state ofthe system at finite temperatures is not that which min-imizes the internal energy but that which minimizes theHelmholtz free energy, A = E − T S. All of these struc-
5
tures may then be actual equilibrium solutions, as longas they are free energy minima.
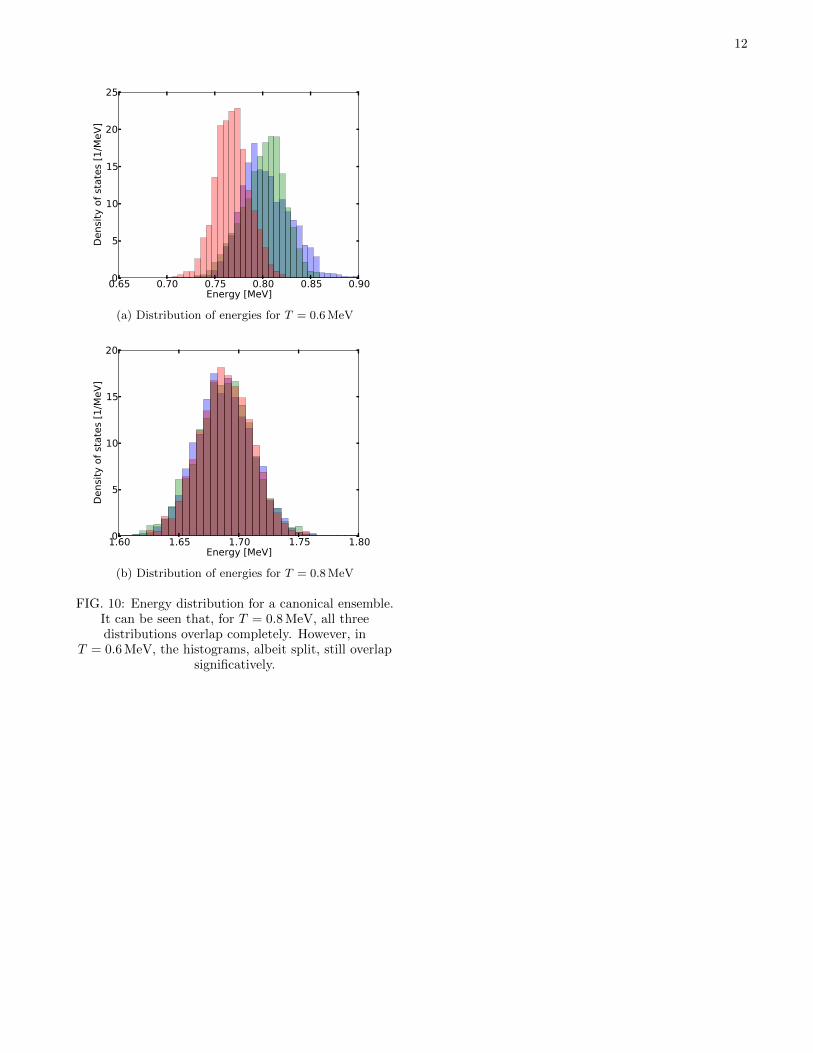
Accurate calculation of free energies from MD simula-tions is computationally very expensive [20, pp. 167-200],specially at low temperatures when overcoming energybarriers become very improbable events. However, wecan easily compute the internal energy distributions overa long evolution at constant temperature. In figure 10 weshow internal energy histograms constructed from verylong thermalized evolutions at T = 0.6 MeV using threeof the systems shown in 9 as initial conditions. We seethat, although the histograms clearly differ, they overlapsignificantly. This fact indicates that the full ensemble ofequilibrium configurations at T = 0.6 MeV contains allof these structures, not only lasagna. In light of this wepropose that at low but finite temperatures, the state ofthe system should be described as an ensemble of bothtraditional and nontraditional structures rather than bya single one.
When we heat up the system to T = 0.8 MeV, thesethree histograms become indistinguishable, hinting that,for this temperature, the free energy barriers can be over-come, and the system is more likely to be ergodic.
These observations are relevant because all of thesestructures show peaks in S(k) at the same wavelenght(within the uncertainty), although of different heights.And more importantly, we find from our calculations thatthe seemingly amorphous, sponge-like structures can bemore efficient in scattering neutrinos of the same momen-tum that any usual pasta (i.e. have higher peaks), usuallyinvoked as a necessity for coherent neutrino scattering.This result shows that unusual pasta shapes should alsobe considered when studying the structure of a neutronstar’s crust.
IV. DISCUSSION AND CONCLUDINGREMARKS
In this work we used a classical molecular dynamicsmodel to study symmetric neutron star matter for dif-ferent temperatures. We found a solid-liquid phase tran-sition takes place for every density at very low temper-atures. This transition was characterized with the Lin-
demann coefficient and by a discontinuity in the caloriccurves. The transition is also signaled by a discontinuityin the Minkowski functionals as a function of the tem-perature, and all three indicators gave the same tran-sitions temperature. This phase transition doesn’t al-ter the typical pasta shape (lasagna and spaghetti in thecases shown): the liquid phase preserves the pasta shapefound in the solid phase (the ground state).
As we increase the temperature beyond T = 0.7 MeV,the typical pasta shapes become unstable and the sys-tem adopts slightly less ordered but still inhomogeneousstructures. However, the low momentum absorption peakof this structures remains quite high. This implies thatthe existence of traditional pasta shapes –which are onlyobtained at extremely low temperatures– is not a neces-sary condition for the enhancement of the neutrino ab-sorption in a neutron star’s crust.
Furthermore, we also found that at T ∼ 0.7,MeV thesystem can exist in various stable states, all of them withdifferent morphology –and, consequently, different struc-ture factor–, but very close in internal energy. Fromour simulations at fixed (N,V, T ), these states appearto be separated by relatively high energy barriers whichmake the spontaneous transition between them a veryimprobable event, and unlikely to be observed within asingle simulation run. However, the energy distributionsobtained from long enough runs starting from differentstates overlap significantly, indicating that all of themare members of the full ensemble of equilibrium states atthat temperature. At T ∼ 0.8 MeV the energy barriersbecome surmountable and the energy histograms com-pletely overlap.
All of this suggests that the actual state of these sys-tems at low, but finite temperatures, is better describedas an ensemble of shapes rather than by a single pasta-like structure.
ACKNOWLEDGMENTS
C.O.D. is a member of the Carrera de InvestigadorCONICET, work partially supported by CONICETGrant PIP0871. P.G.M. and P.N.A. by a CONICETgrant. The three-dimensional figures were prepared usingVisual Molecular Dynamics [41].
[1] D. Page, J. M. Lattimer, M. Prakash and A. W. Steiner,Astrophys. J. Supp. 155, 623 (204)
[2] D. G. Ravenhall, C. J. Pethick and J. R. Wilson, Phys.Rev. Lett. 50, 2066 (1983).
[3] S. Woosley and T. Janka, Nature Phys. 1, 147 (2005)[4] Y. Mochizuki and T. Izuyama, Astrophys. J. 440, 263
(1995).[5] C.J. Horowitz, M.A. Perez-Garcia, and J. Piekarewicz,
Phys. Rev. C69, 045804 (2004).[6] M. Hashimoto, H. Seki and M. Yamada, Prog. Theor.
Phys. 71, 320 (1984).[7] R. D. Williams and S. E. Koonin, Nucl. Phys. A435, 844
(1985).[8] K. Oyamatsu, Nucl. Phys. A561, 431 (1993).[9] C. P. Lorenz, D. G. Ravenhall and C. J. Pethick,
Phys.Rev. Lett. 70, 379 (1993).[10] K. S. Cheng, C. C. Yao and Z. G. Dai, Phys. Rev. C55,
2092 (1997).[11] G. Watanabe, K. Iida and K. Sato, Nucl. Phys. A676,
445 (2000).
6
[12] G. Watanabe and K. Iida, Phys. Rev. C68, 045801(2003).
[13] T. Maruyama, K. Niita, K. Oyamatsu, T. Maruyama, S.Chiba and A. Iwamoto, Phys. Rev. C57, 655 (1998).
[14] T. Kido, Toshiki Maruyama, K. Niita and S. Chiba, Nucl.Phys. A663-664, 877 (2000).
[15] G. Watanabe, K. Sato, K. Yasuoka and T. Ebisuzaki,Phys. Rev. C66, 012801 (2002).
[16] C. J. Horowitz, M. A. Perez-Garcia, J. Carriere, D.K. Berry, and J. Piekarewicz, Phys. Rev. C70, 065806(2004).
[17] C.O. Dorso, P.A. Gimenez Molinelli and J.A. Lopez,Phys. Rev. C86, 055805 (2012).
[18] K.I. Nakazato, K. Oyamatsu and S. Yamada, Phys. Rev.Lett. 103 132501 (2009)
[19] F.A. Lindemann, Physik. Z. 11, 609 (1910).[20] D. Frenkel and B. Smit, “Understanding Molecular Sim-
ulations”, 2nd Ed.,Academic Press (2002).[21] T. Maruyama, K. Niita, K. Oyamatsu, T. Maruyama, S.
Chiba, A. Iwamoto, Phys. Rev. C57, 655 (1998)[22] A. Vicentini, G. Jacucci and V. R. Pandharipande, Phys.
Rev. C31, 1783 (1985); R. J. Lenk and V. R. Pand-haripande, Phys. Rev. C34, 177 (1986); R.J. Lenk, T.J.Schlagel and V. R. Pandharipande, Phys. Rev. C42, 372(1990).
[23] C.O. Dorso and J. Randrup, Phys. Lett. B215, 611(1988)
[24] A. Barranon, C.O. Dorso, J.A. Lopez and J. Morales,Rev. Mex. Fıs. 45, 110 (1999).
[25] A. Chernomoretz, L. Gingras, Y. Larochelle, L. Beaulieu,R. Roy, C. St-Pierre and C. O. Dorso, Phys. Rev. C65,
054613 (2002).[26] A. Barranon, C.O. Dorso and J.A. Lopez, Rev. Mex. Fıs.
47-Sup. 2, 93 (2001).[27] A. Barranon, C.O. Dorso, and J.A. Lopez, Nuclear Phys.
A791, 222 (2007).[28] A. Barranon, R. Cardenas, C.O. Dorso, and J.A. Lopez,
Heavy Ion Phys. 17, 59 (2003).[29] C.O. Dorso and J.A. Lopez, Phys. Rev. C64, 027602
(2001).[30] A. Barranon, J. Escamilla Roa and J.A. Lopez, Phys.
Rev. C69, 014601 (2004).[31] C.O. Dorso, C.R. Escudero, M. Ison and J.A. Lopez,
Phys. Rev. C73, 044601 (2006).[32] C.O. Dorso, P.A. Gimenez Molinelli and J.A. Lopez, J.
Phys. G: Nucl. Part. Phys. 38, 115101 (2011); ibid, Rev.Mex. Phys., S 57 (1), 14 (2011).
[33] A. L. Fetter and J. D. Wallecka, Quantum Theory ofMany-Particle Systems, McGraw-Hill (1971)
[34] P. N. Alcain, P. A. Gimenez Molinelli, J. I. Nichols, C.O. Dorso, Phys. Rev. C89, 055801 (2014)
[35] S. Nose, J. Chem. Phys. 81, 511 (1984)[36] S. Plimpton, J. Comp. Phys., 117, 1-19 (1995)[37] K. Michielsen and H. De Raedt, Phys. Reports 347, 461
(2001).[38] G. Watanabe, K. Sato, K. Yasuoka and T. Ebisuzaki,
Phys. Rev. C68, 035806 (2003)[39] Klain, D.A.; Rota, G.-C. (1997). Introduction to geomet-
ric probability. Cambridge: Cambridge University Press.[40] J. H. Bilgram, Phys. Rep. 153, 1 (1987)[41] Humphrey, W., Dalke, A. and Schulten, K., ‘VMD - Vi-
sual Molecular Dynamics’, J. Molec. Graphics 14.1, 33(1996).
7
0 5 10 15 20r [fm]
0
1
2
3
4
5
6
7
Radi
al D
istr
ibut
ion
Func
tion
Above TransitionBelow Transition
Radial distribution function for ρ = 0.03 fm−3 Snapshot of the system in the liquid phasefor ρ = 0.03 fm−3
0 5 10 15 20r [fm]
0.0
0.5
1.0
1.5
2.0
2.5
3.0
3.5
4.0
Radi
al D
istr
ibut
ion
Func
tion
Above TransitionBelow Transition
Radial distribution function for ρ = 0.05 fm−3 Snapshot of the system in the liquid phasefor ρ = 0.05 fm−3
0 5 10 15 20r [fm]
0.0
0.5
1.0
1.5
2.0
2.5
3.0
Radi
al D
istr
ibut
ion
Func
tion
Above TransitionBelow Transition
Radial distribution function for ρ = 0.08 fm−3 Snapshot of the system in the liquid phasefor ρ = 0.08 fm−3
FIG. 3: Radial distribution function for different densities, both below and above the transition temperature, andsnapshots of the system in the liquid phase. Although the first peaks of the distribution are in the same position forboth temperatures, the following peaks, which exhibit a long-range order typical of solids, are only present below the
transition temperature.
8
0.1 0.2 0.3 0.4 0.5 0.6 0.7 0.8Temperature [MeV]
-2
-1
0
1
2
3Eu
ler n
umbe
r [10
3]
Euler number
-10
-8
-6
-4
-2
0
Curv
atur
e [1
03 fm
]
Curvature
FIG. 4: Euler number and mean breadth forρ = 0.05 fm−3. We observe a sharp transition for both
Minkowski functionals.
0.02 0.04 0.06 0.08 0.10 0.12 0.14Density [fm−3 ]
0.30
0.35
0.40
0.45
0.50
0.55
0.60
0.65
Criti
cal T
empe
ratu
re [M
eV]
LindemannMinkowski
FIG. 5: Critical temperature as a function of density.We see the overlap between the Minkowski and the
Lindeman critical temperature.

9
Below the transition Above the transition
FIG. 6: Spatial distribution for ρ = 0.05 fm−3, both above and below the transition temperature. The structures aresimilar, but much more disordered above the transition.
0.0 0.5 1.0 1.5 2.0 2.5 3.0Temperature [MeV]
0
2
4
6
8
10
12
14
16
Long
rang
e pe
ak
FIG. 7: Peak of S(k) for low momenta as a function ofthe temperature, for ρ = 0.05 fm−3. We see twobehaviors, for T < 0.5 MeV and T > 0.5 MeV.
10
0.50 0.55 0.60 0.65 0.70Temperature [MeV]
7
8
9
10
11
12
13
14Lo
ng ra
nge
peak
abcd
FIG. 8: Peak of S(k) for low momenta: zoom into thetemperature region between T = 0.5 MeV and
T = 0.7 MeV. We can see that distinct runs yielddifferent absorption peaks for low momenta.
11
(a) Usual lasagna (b) Intertwined lasagna
(c) Intertwined lasagna (d) Unusual pasta shape
FIG. 9: Spatial distribution for ρ = 0.05 fm−3 for different initial conditions. We see that we have the usual lasagna,but also intertwined lasagnas and other structures that don’t resemble usual pasta. Despite being different from the
usual pasta phases, these shapes have a peak for low momentum in the structure factor.
12
0.65 0.70 0.75 0.80 0.85 0.90Energy [MeV]
0
5
10
15
20
25De
nsity
of s
tate
s [1
/MeV
]
(a) Distribution of energies for T = 0.6 MeV
1.60 1.65 1.70 1.75 1.80Energy [MeV]
0
5
10
15
20
Dens
ity o
f sta
tes
[1/M
eV]
(b) Distribution of energies for T = 0.8 MeV
FIG. 10: Energy distribution for a canonical ensemble.It can be seen that, for T = 0.8 MeV, all threedistributions overlap completely. However, in
T = 0.6 MeV, the histograms, albeit split, still overlapsignificatively.