Perceptions of Socio-economic Drought as causes of Hydrological Drought mismanagement
Upload
khangminh22Category
view
1download
0
remote sensing
Article
Integrated Drought Monitoring and Evaluation throughMulti-Sensor Satellite-Based Statistical Simulation
Jong-Suk Kim 1 , Seo-Yeon Park 2,*, Joo-Heon Lee 2 , Jie Chen 1 , Si Chen 3 and Tae-Woong Kim 4
�����������������
Citation: Kim, J.-S.; Park, S.-Y.; Lee,
J.-H.; Chen, J.; Chen, S.; Kim, T.-W.
Integrated Drought Monitoring and
Evaluation through Multi-Sensor
Satellite-Based Statistical Simulation.
Remote Sens. 2021, 13, 272.
https://doi.org/10.3390/rs13020272
Received: 20 November 2020
Accepted: 11 January 2021
Published: 14 January 2021
Publisher’s Note: MDPI stays neu-
tral with regard to jurisdictional clai-
ms in published maps and institutio-
nal affiliations.
Copyright: © 2021 by the authors. Li-
censee MDPI, Basel, Switzerland.
This article is an open access article
distributed under the terms and con-
ditions of the Creative Commons At-
tribution (CC BY) license (https://
creativecommons.org/licenses/by/
4.0/).
1 State Key Laboratory of Water Resources and Hydropower Engineering Science, Wuhan University,Wuhan 430072, China; [email protected] (J.-S.K.); [email protected] (J.C.)
2 Department of Civil Engineering, Joongbu University, Gyeonggi-do 10279, Korea; [email protected] School of Resources and Environment, Hubei University, Wuhan 430062, China; [email protected] Department of Civil and Environmental Engineering, Hanyang University (ERICA),
Gyeonggi-do 15588, Korea; [email protected]* Correspondence: [email protected]
Abstract: To proactively respond to changes in droughts, technologies are needed to properlydiagnose and predict the magnitude of droughts. Drought monitoring using satellite data is essentialwhen local hydrogeological information is not available. The characteristics of meteorological,agricultural, and hydrological droughts can be monitored with an accurate spatial resolution. In thisstudy, a remote sensing-based integrated drought index was extracted from 849 sub-basins in Korea’sfive major river basins using multi-sensor collaborative approaches and multivariate dimensionalreduction models that were calculated using monthly satellite data from 2001 to 2019. Droughtsthat occurred in 2001 and 2014, which are representative years of severe drought since the 2000s,were evaluated using the integrated drought index. The Bayesian principal component analysis(BPCA)-based integrated drought index proposed in this study was analyzed to reflect the timing,severity, and evolutionary pattern of meteorological, agricultural, and hydrological droughts, therebyenabling a comprehensive delivery of drought information.
Keywords: remote sensing; integrated drought monitoring; meteorological drought; hydrologicaldrought; agricultural drought; Bayesian principal component analysis (BPCA); statistical simulation
1. Introduction
Droughts, along with floods, are some of the most common and inevitable naturaldisasters faced by human beings [1–4]. Therefore, many researchers have been trying tomonitor and predict droughts accurately, and the development of drought monitoringtechniques based on satellite remote sensing (RS) data (as a representative method) hasgarnered special interest in recent years [4–9]. The onset and magnitude of drought inthe region is still a challenge for researchers because of a lack of ground meteorologicalobservatories [4]. However, satellite-based RS data partially solve the problem by provid-ing information in a fast and cost-effective way. The advantage of RS-based monitoringusing satellite data is that it is possible to monitor droughts in large areas and ungaugedbasins, and we can utilize multiple satellite imagery data to have accurate results; there-fore, monitoring drought by using satellites has proven to be an efficient and reliabletool [6,10–13].
There are four kinds of droughts in the academic sense: meteorological, agricul-tural, hydrological droughts, and their socioeconomic impacts [2,14–16]. A meteorologicaldrought is caused by a deficit through the shortage of rainfall and is mainly a short-termdrought event [6]. An agricultural drought is determined based on the vitality of vegetationand the pattern of quantitative changes in soil moisture; it indicates short or medium-termdrought situations [6,13]. A hydrological drought is commonly a mid or long-term droughtcondition; this drought identification is made based on a shortage of water resources
Remote Sens. 2021, 13, 272. https://doi.org/10.3390/rs13020272 https://www.mdpi.com/journal/remotesensing

Remote Sens. 2021, 13, 272 2 of 18
required by human-environmental systems, such as river discharge, efficient water levelsof dams, and reservoir storage [17]. A socioeconomic drought consists of a wide rangethat takes meteorological, agricultural, and hydrological droughts into account and ischaracterized by the temporal and spatial processes of water demand and supply [18].
A variety of drought indicators that help prevent disasters and reduce and allocatewater resources have been developed to quantify different drought conditions, such asseverity, duration, and frequency [3,5,17,19–25]. The standardized precipitation index(SPI; [19]) and the Palmer drought severity index (PDSI; [26]) are the most commonly usedmeteorological drought indices. The SPI standardization concept was also applied to otherdrought indices, such as the standardized runoff index (SRI; [20]) and standardized soilmoisture index (SSI [22]).
Because RS technology provides an alternative approach for analyzing drought eventsacross a wide range of regions, many studies have introduced RS-based drought in-dices [5,7,23,24,27]. Zhang and Jia [27] proposed the microwave integrated drought index(MIDI) to monitor meteorological drought over semi-arid regions and the continentalUnited States of America. Cunha et al. [23] calculated the normalized differences vege-tation index (NDVI) and land surface temperature (LST) data to monitor the effects ofdrought on vegetation in real-time. Sur et al. [24] analyzed Korea’s drought conditionsthrough a comparative analysis of the existing drought indices (SPI and PDSI) based on asatellite image-based drought index from 2004 to 2013. It was confirmed that the resultsof the evaporative stress index (ESI), and the energy-based water definition index (EWDI)showed high applicability for severe drought situations since 2010. Cong et al. [5] selectedthree widely used satellite drought indices as indicators suitable for drought monitoring innortheastern China and investigated the spatiotemporal patterns and trends of rainfall anddrought; the indices were normalized monthly precipitation anomaly percentage (NPA),vegetation health index (VHI), and normalized vegetation supply water index (NVSWI).Zhang et al. [28] combined the global land data assimilation system version 2 (GLDAS-2)soil moisture data and NDVI with crop phenology data and assessed drought evolutionand crop growth. Sur et al. [7] developed a new agricultural drought index called the agri-cultural dry condition index (ADCI) by combining various hydrometeorological variablesand verified the applicability of the ADCI on the yield of paddy and arable crops in Korea.
Through the review of previous studies, we can assume that information can beintegrated from multi-sensor satellite data and multivariate analyses to effectively achievecomprehensive drought assessment goals. In addition to providing information basedon different drought conditions (meteorological, agricultural, and hydrological), it isnecessary to develop and apply an integrated drought index that considers complex factorsthat can provide comprehensive information about droughts and the required proactiveresponse to drought situations. Inspired by this idea, our study seeks to diagnose complexdroughts by using multi-sensor collaborative approaches and multivariate dimensionalreduction models. In this study, we proposed an integrated drought assessment methodto comprehensively convey drought information to the public and conducted statisticalsimulations to determine spatial sensitivity to various types of droughts to provide tailoredinformation on local drought responses in a changing climate.
2. Materials and Methods2.1. Multi-Sensor Drought Indices2.1.1. Standardized Precipitation Index (SPI)
The SPI is a drought index developed with the idea that it is initiated by a decrease inprecipitation, thereby causing water shortage (compared to the relative water demand).In other words, it was developed from the above assumption that decreased precipitationhas different effects on groundwater, reservoir storage, soil moisture, and river runoff. TheSPI is an efficient way to calculate the impact of individual water sources on droughts bysetting time units accumulated over a given period of time (over 1, 3, 6, and 12 months), andcalculating the drought index by using the amount of precipitation on a time basis [19,28].

Remote Sens. 2021, 13, 272 3 of 18
The SPI is also recommended by the World Meteorological Organization (WMO) fortracking meteorological droughts [21,25].
2.1.2. Agricultural Dry Condition Index (ADCI)
The ADCI is an agricultural drought index that takes into account the vegetationconditions, soil moisture, and LST of the affected region. First, the vegetation conditionindex (VCI) is applied for vegetation analysis. Sur et al. [7] proposed the ADCI as a newagricultural drought index, which is a combination of the three indices mentioned above(SMSI, VCI, and TCI). The cause of the agricultural drought was developed based onthe concept of reducing the vitality of vegetation due to the lack of soil moisture andoverheating of the surface temperature caused by high temperatures, developing intoagricultural drought as this phenomenon continues. The ADCI can be calculated by usingthe Equation (1) given below:
ADCI = 0.6 ∗ SMSI + 0.2 ∗VCI + 0.2 ∗ TCI. (1)
The VCI is a suitable index for agricultural drought monitoring, such as temporaland spatial vegetation changes and the onset and intensity of drought [29,30]. Kogan [29]developed the VCI, which was standardized using the maximum and minimum valuesof the NDVI developed based on the notion that droughts do not provide normal watersupply to plants (Equation (2)).
VCI =NDVI − NDVImin
NDVImax − NDVImin, (2)
where NDVImin and NDVImax represent the minimum and maximum values of NDVI forthe entire period of the pixel. The following is the LST-related index, called the temperaturecondition index (TCI), which is an index developed by Kogan [29] based on the fact thatLST affects the stress of vegetation and is one of the drought factors that affect soil moisture.The TCI is a standard LST that uses the maximum and minimum LST values and as shownin the following equation (Equation (3)).
TCI =LSTmax − LST
LSTmax − LSTmin(3)
Finally, soil moisture needs to be considered for determining the ADCI. The soilmoisture saturation index (SMSI) assumes that soil moisture is directly proportional tothermal inertia (TI). One of TI’s simple approximations is the apparent thermal inertia(ATI), which can be derived in Equation (4); note that we assume that the solar energyis uniform.
ATI =(1− α)
LSTday − LSTnight, (4)
where α is the land surface albedo and LSTday and LSTnight are the surface temperaturesduring day and night, respectively. The SMSI can be calculated using the ATI, as shown inthe following equation (Equation (5)).
SMSI =ATI − ATImin
ATImax − ATImin(5)
2.1.3. Water Budget-Based Drought Index (WBDI)
The water budget-based drought index (WBDI), which was proposed by Sur et al. [18],was developed by adopting the water balance perspective and by using precipitation andevaporation as input variables. The evaporation of water balance is caused primarily bychanging the state of water, which is achieved by changing the temperature [31]. The WBDI

Remote Sens. 2021, 13, 272 4 of 18
is defined as the difference between precipitation and evaporation as surface runoff andsub-surface runoff in the water budget equation, as given below (Equation (6)):
P− E = dS + R, (6)
where P is the precipitation (mm), E is actual evaporation (mm), dS is soil moisture change(mm), and R is the potential runoff (mm). The above results are treated as possible runoffin the basin and expressed in an index, as given below (Equation (6)):
WBDI = z(P− E), (7)
where z denotes the standardization. Instead of monitoring the current precipitation anddrought conditions through evaporation, the WBDI, estimated by using the water balanceformula, defines a hydrological drought through potential (near future) runoff, therebyadopting a short-term prognosis approach.
2.2. Study Area and Remote Sensing Data
In this study, we used the moderate resolution imaging spectroradiometer (MODIS),precipitation estimation from remotely sensed information using an artificial neural net-work climate data record (PERSIANN-CDR), and global precipitation measurement (GPM)integrated multi-satellite retrievals for GPM (GPM IMERG) to calculate various droughtindices. Through the MODIS satellite, the LST (MOD11A1), NDVI (MOD13A3), actualevapotranspiration (AET; MOD16A2), and albedo (MCD43B2) data from 2001 to 2019 werecollected (Table 1). To obtain the precipitation data, we used the PERSIANN-CDR datafrom 1983 to 1997 that was generated by the center for hydrometeorology and remotesensing (CHRS) at the University of California in Irvine; the data were obtained before thetropical rainfall measuring mission (TRMM). The TRMM data from 1998 were utilized, andamong many data, the gridded TRMM3B42 data were collected until 2014 (at the end ofTRMM’s life), which was provided by the National Aeronautics and Space Administration(NASA) [32]. Following 2014, we used data from GPM IMERG that obtained data until2019 to calculate the meteorological drought index [33]. Among the GPM IMERG data,the data after the last four months of the calibration were used to enhance the reliabilityof the precipitation data. Due to the different spatial and time resolutions of the collecteddata, the spatial resolution was set at 1 × 1 km and the time resolution was considered tobe monthly, which is consistently reprocessed. The main areas of this study were the fivemajor rivers of the Korean Peninsula, and we analyzed 849 sub-basins (Figure 1).
Table 1. Remote sensing (RS) data used in this study.
Product Resolution Data Period
MODIS
MOD11A1 Land SurfaceTemperature 1 km, daily
2001–2019MOD13A3 Vegetation Indices 1 km, monthly
MOD16A2 Evapotranspiration 0.5 km, 8 days
MCD43B2 Albedo 1 km, 8 days
PERSIANN-CDR PERSIANN-CDR Precipitation 25◦, daily 1983–1997
TRMM TRMM3B42 Precipitation 25◦, 3 h 1998–2014
GPM GPM IMERG Precipitation 10◦, 30 min 2015–2019

Remote Sens. 2021, 13, 272 5 of 18Remote Sens. 2021, 13, x FOR PEER REVIEW 5 of 18
Figure 1. Geographical location of the five major river basins and the 849 sub-basins in Korea.
2.3. Integrated Drought Monitoring with Multi-Sensor Based Statistical Simulations The types of RS data, mainly used for drought monitoring, depend on the type of
satellite used; however, data such as precipitation, vegetation, surface temperature, soil moisture, and evaporation are mostly used. The data can be used individually. However, drought phenomena may not be sufficient for drought analysis based on a single indicator because it is related to a number of variables [34]. However, it may be more useful to combine information in the form of an appropriate drought index for more accurate mon-itoring of complex drought phenomena.
Hao and AghKouchak [23,34] proposed the multivariate standardized drought index (MSDI) based on a copula distribution or nonparametric joint distribution for a bivariate model of precipitation and soil moisture. However, with recent advances in technology, the size and complexity of data tend to increase. Such complexity makes it difficult to detect the dependence between the response variable and covariates because of the enor-mous number of available covariates [35]. To resolve these problems, an approach to re-ducing the number of covariates (through dimension reduction) is being used. Principal component analysis (PCA) is a tool that is commonly used for dimension reduction [36] and is a feature transformation method that directly transforms the variables (in di-mension reduction methods) without losing much of the data’s inherent attribution information. In this study, for the three different multi-variables acquired from the sat-ellite data, an integrated drought index is calculated through the application of the Bayesian PCA (BPCA; [37,38]) and intentionally biased bootstrap (IBB; [39]) simulation for characterizing three aspects of meteorological (using SPI), agricultural (using ADCI), and hydrological (using WBDI) droughts. The BPCA approach can estimate the intrinsic dimensionality of the multi-dimensional dataset with missing data, which is suitable for application to satellite data, and has been evaluated as an accurate and
Figure 1. Geographical location of the five major river basins and the 849 sub-basins in Korea.
2.3. Integrated Drought Monitoring with Multi-Sensor Based Statistical Simulations
The types of RS data, mainly used for drought monitoring, depend on the type ofsatellite used; however, data such as precipitation, vegetation, surface temperature, soilmoisture, and evaporation are mostly used. The data can be used individually. However,drought phenomena may not be sufficient for drought analysis based on a single indicatorbecause it is related to a number of variables [34]. However, it may be more useful tocombine information in the form of an appropriate drought index for more accuratemonitoring of complex drought phenomena.
Hao and AghKouchak [23,34] proposed the multivariate standardized drought index(MSDI) based on a copula distribution or nonparametric joint distribution for a bivariatemodel of precipitation and soil moisture. However, with recent advances in technology, thesize and complexity of data tend to increase. Such complexity makes it difficult to detectthe dependence between the response variable and covariates because of the enormousnumber of available covariates [35]. To resolve these problems, an approach to reducing thenumber of covariates (through dimension reduction) is being used. Principal componentanalysis (PCA) is a tool that is commonly used for dimension reduction [36] and is a featuretransformation method that directly transforms the variables (in dimension reductionmethods) without losing much of the data’s inherent attribution information. In thisstudy, for the three different multi-variables acquired from the satellite data, an integrateddrought index is calculated through the application of the Bayesian PCA (BPCA; [37,38])and intentionally biased bootstrap (IBB; [39]) simulation for characterizing three aspectsof meteorological (using SPI), agricultural (using ADCI), and hydrological (using WBDI)droughts. The BPCA approach can estimate the intrinsic dimensionality of the multi-dimensional dataset with missing data, which is suitable for application to satellite data,and has been evaluated as an accurate and robust model [37,38,40]. The BPCA analysis isperformed by using the following three procedures: principal component (PC) regression,Bayesian estimation, and an expectation-maximization (EM)-like repetitive algorithm [38].

Remote Sens. 2021, 13, 272 6 of 18
The IBB applied for statistical simulation of drought indices is a kind of weightedbootstrap that follows constraints that are designed to select resampling probabilitiesand conditionally applied to data; this helps to improve the statistical performance andminimizes the distance of weighted distributions [39,41]. This study employed the IBBto evaluate regional drought changes in meteorological (SPI), agricultural (ADCI), andhydrological (WBDI) droughts and analyzed the relative sensitivity of each drought indexto the RS-based integrated drought index (RSIDI) calculated by using the BPCA (Figure 2).The IBB applied in this study is described as follows.
Remote Sens. 2021, 13, x FOR PEER REVIEW 6 of 18
robust model [37,38,40]. The BPCA analysis is performed by using the following three procedures: principal component (PC) regression, Bayesian estimation, and an expec-tation-maximization (EM)-like repetitive algorithm [38].
The IBB applied for statistical simulation of drought indices is a kind of weighted bootstrap that follows constraints that are designed to select resampling probabilities and conditionally applied to data; this helps to improve the statistical performance and mini-mizes the distance of weighted distributions [39,41]. This study employed the IBB to eval-uate regional drought changes in meteorological (SPI), agricultural (ADCI), and hydro-logical (WBDI) droughts and analyzed the relative sensitivity of each drought index to the RS-based integrated drought index (RSIDI) calculated by using the BPCA (Figure 2). The IBB applied in this study is described as follows.
Figure 2. Procedure of intentionally biased bootstrap (IBB) analysis for integrated drought management.
The IBB simulation re-samples the observations Xi to n replacement (e.g., bootstrap-ping) by intentionally increasing or decreasing the data by as much as δμ. The data Xi are increasingly ordered by assigning different weights Wi,n according to the magnitudes of the observations, as given below: 𝑊 , = 𝑖/𝑛, (8)
where i = 1, 2, 3, …, n, and the data matrix is rearranged in the same order as the ordered Xi. The assigned weight Wi,n represents the probability of selection for Xi data in the IBB simulation. The intentional change of increase or decrease (δ ) can be calculated as given in Equation (9).
Figure 2. Procedure of intentionally biased bootstrap (IBB) analysis for integrated drought management.
The IBB simulation re-samples the observations Xi to n replacement (e.g., bootstrap-ping) by intentionally increasing or decreasing the data by as much as δµ. The data Xi areincreasingly ordered by assigning different weights Wi,n according to the magnitudes ofthe observations, as given below:
Wi,n = i/n, (8)
where i = 1, 2, 3, . . . , n, and the data matrix is rearranged in the same order as the orderedXi. The assigned weight Wi,n represents the probability of selection for Xi data in the IBBsimulation. The intentional change of increase or decrease (δµ) can be calculated as givenin Equation (9).
δµ = µ̃− µ̂ =1ψ
n
∑i=1
Wi,nXi −1n
n
∑i=1
Xi, (9)
ψ =n
∑i=1
Wi,n. (10)

Remote Sens. 2021, 13, 272 7 of 18
Equation (9) can be generalized with a weight order (r) as Equation (11).
δµ(r) = µ̃(r)− µ̂ =1ψr
n
∑i=1
Wri,nXi −
1n
n
∑i=1
Xi (11)
The selection of the weight order (r) can be performed by using the self-organizingmigrating algorithm (SOMA; [42]) with the following objective function (Equation (12)):
minimize[δµ − δµ(r)
]2. (12)
Note that if r < 0, then δµ(r) < 0, which implies a drier state, and if r > 0, then δµ(r)> 0, which implies a wetter state. When r < 0, lower values indicating the dry state areresampled more frequently than higher values indicating the humid state, causing δµ(r)to decrease. In addition, to objectively determine the accuracy of drought monitoringusing three satellite-based drought indices, this study conducted a receiver operationcharacteristics (ROC) analysis. The ROC analysis was performed to evaluate the validity ofthe RSIDI calculations using the three drought indices (SPI, ADCI, and WBDI). The rangeof drought indices used in this study is given in Table 2.
Table 2. Range of the drought indices used in this study.
Drought Condition SPI ADCI WBDI RSIDI
Normal >0 >40 >0 >0
Attention −1.0–0 30–40 0–−0.5 −1.0–0
Caution −1.0–−1.5 20–30 −0.5–−1.0 −1.0–−1.5
Alert −1.5–−2.0 10–20 −1.0–−1.5 −1.5–−2.0
Serious <−2.0 0~10 <−1.5 <−2.0
3. Results
In this study, the RSIDI was extracted for 849 sub-basins over the five major Koreanriver basins using a BPCA-based combination model for the three drought indices for2001–2019. As a result of the evaluation of the proportion of variation (POV) of the threedrought indices by region, the BPCA-based RSIDI explained the average POV (68.9%) ofthe 849 sub-basins (Han River basin: 68.1%, Nakdong River basin: 68.7%, Geum Riverbasin: 71.3%, Youngsang River basin: 71.7%, and Sumjin River basin: 71.0%), showing ahigh POV, especially in the southern part of the country. In addition, the calculated RSIDIshowed a relatively high correlation with SPI (median: 0.96) and WBDI (median: 0.96).In the case of the ADCI (maximum: 0.91, median: 0.53), the correlation with RSIDI wasbroad in the region and showed a relatively weak correlation in some areas of the Han andNadkong River basins; however, on an average, the correlation was 0.53 (p-value < 0.001) in849 sub-basins, indicating that the RSIDI can provide robust and comprehensive integrateddrought information by maintaining the inherent characteristics of the three drought indices(Figure 3). By resolving the system equations for each drought index, it has been shownthat the relative contribution of the RSIDI to each time-series can be assessed. Figure 4illustrates the relative contribution of each drought index to the Gojicheon stream (#10011)of the Han River basin.
In the following section, the droughts in 2001 and 2014, which are the representativesevere drought years of severe droughts that have occurred since the 2000s, were assessedusing the RSIDI produced by multi-sensor satellite data and multivariate analysis. Theapplication of integrated drought monitoring based on satellite data was evaluated throughspatial-temporal variability analysis between the RSIDI and other drought indices usingthe ROC analysis to test the accuracy of the models. In addition, the onset, intensity, andevolution patterns of droughts were compared to each drought index, and the applicabilityof the RSIDI was evaluated through an IBB simulation.

Remote Sens. 2021, 13, 272 8 of 18
Remote Sens. 2021, 13, x FOR PEER REVIEW 8 of 18
using the RSIDI produced by multi-sensor satellite data and multivariate analysis. The application of integrated drought monitoring based on satellite data was evaluated through spatial-temporal variability analysis between the RSIDI and other drought indi-ces using the ROC analysis to test the accuracy of the models. In addition, the onset, in-tensity, and evolution patterns of droughts were compared to each drought index, and the applicability of the RSIDI was evaluated through an IBB simulation.
Figure 3. Results of correlation analysis with RS-based integrated drought index (RSIDI) through Bayesian PCA (BPCA); (a) SPI (standardized precipitation index), (b) ADCI (agricultural dry condition index), and (c) WBDI (water budget-based drought index). The lower panel in the figure results from the analysis of the correlation of 849 sub-basins summarized in the boxplot and is illustrated by each applied drought index namely, SPI, ADCI, and WBDI.
Figure 3. Results of correlation analysis with RS-based integrated drought index (RSIDI) through Bayesian PCA (BPCA); (a)SPI (standardized precipitation index), (b) ADCI (agricultural dry condition index), and (c) WBDI (water budget-baseddrought index). The lower panel in the figure results from the analysis of the correlation of 849 sub-basins summarized inthe boxplot and is illustrated by each applied drought index namely, SPI, ADCI, and WBDI.
Remote Sens. 2021, 13, 272 9 of 18Remote Sens. 2021, 13, x FOR PEER REVIEW 9 of 18
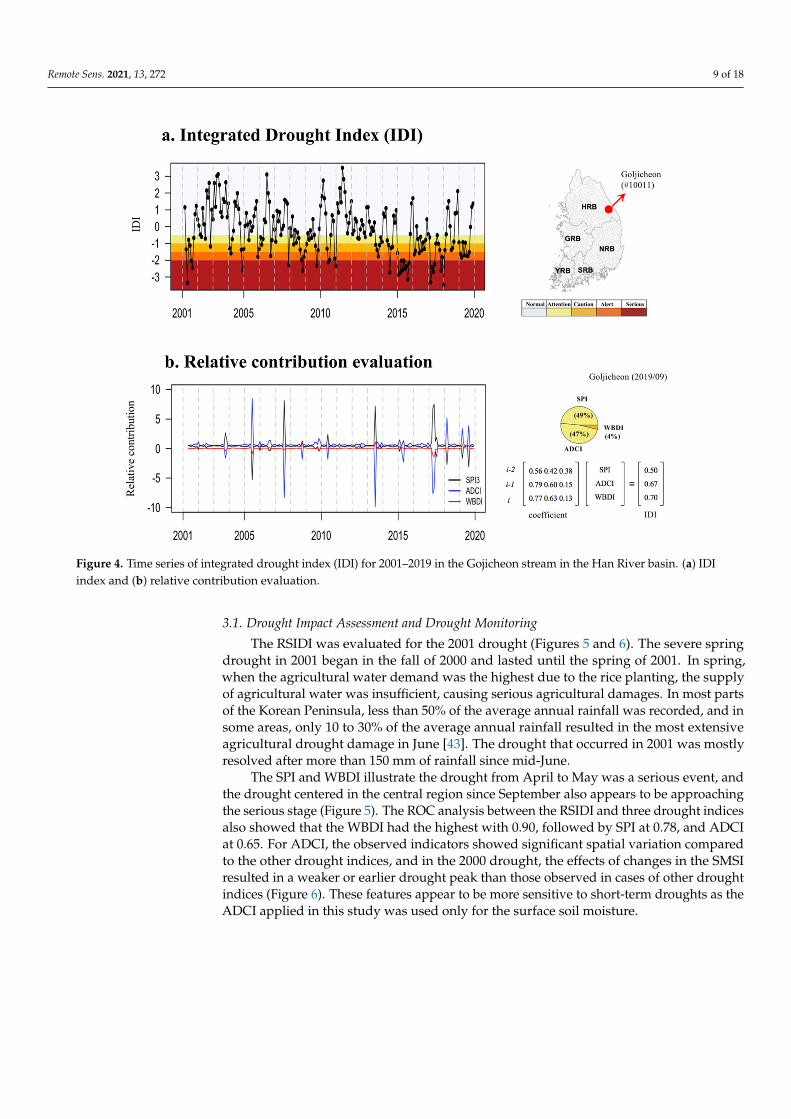
Figure 4. Time series of integrated drought index (IDI) for 2001–2019 in the Gojicheon stream in the Han River basin. (a) IDI index and (b) relative contribution evaluation.
3.1. Drought Impact Assessment and Drought Monitoring The RSIDI was evaluated for the 2001 drought (Figures 5 and 6). The severe spring
drought in 2001 began in the fall of 2000 and lasted until the spring of 2001. In spring, when the agricultural water demand was the highest due to the rice planting, the supply of agricultural water was insufficient, causing serious agricultural damages. In most parts of the Korean Peninsula, less than 50% of the average annual rainfall was recorded, and in some areas, only 10 to 30% of the average annual rainfall resulted in the most extensive agricultural drought damage in June [43,44]. The drought that occurred in 2001 was mostly resolved after more than 150 mm of rainfall since mid-June.
The SPI and WBDI illustrate the drought from April to May was a serious event, and the drought centered in the central region since September also appears to be approaching the serious stage (Figure 5). The ROC analysis between the RSIDI and three drought indi-ces also showed that the WBDI had the highest with 0.90, followed by SPI at 0.78, and ADCI at 0.65. For ADCI, the observed indicators showed significant spatial variation com-pared to the other drought indices, and in the 2000 drought, the effects of changes in the SMSI resulted in a weaker or earlier drought peak than those observed in cases of other drought indices (Figure 6). These features appear to be more sensitive to short-term droughts as the ADCI applied in this study was used only for the surface soil moisture.
Figure 4. Time series of integrated drought index (IDI) for 2001–2019 in the Gojicheon stream in the Han River basin. (a) IDIindex and (b) relative contribution evaluation.
3.1. Drought Impact Assessment and Drought Monitoring
The RSIDI was evaluated for the 2001 drought (Figures 5 and 6). The severe springdrought in 2001 began in the fall of 2000 and lasted until the spring of 2001. In spring,when the agricultural water demand was the highest due to the rice planting, the supplyof agricultural water was insufficient, causing serious agricultural damages. In most partsof the Korean Peninsula, less than 50% of the average annual rainfall was recorded, and insome areas, only 10 to 30% of the average annual rainfall resulted in the most extensiveagricultural drought damage in June [43]. The drought that occurred in 2001 was mostlyresolved after more than 150 mm of rainfall since mid-June.
The SPI and WBDI illustrate the drought from April to May was a serious event, andthe drought centered in the central region since September also appears to be approachingthe serious stage (Figure 5). The ROC analysis between the RSIDI and three drought indicesalso showed that the WBDI had the highest with 0.90, followed by SPI at 0.78, and ADCIat 0.65. For ADCI, the observed indicators showed significant spatial variation comparedto the other drought indices, and in the 2000 drought, the effects of changes in the SMSIresulted in a weaker or earlier drought peak than those observed in cases of other droughtindices (Figure 6). These features appear to be more sensitive to short-term droughts as theADCI applied in this study was used only for the surface soil moisture.

Remote Sens. 2021, 13, 272 10 of 18Remote Sens. 2021, 13, x FOR PEER REVIEW 10 of 18
Figure 5. Spatial change of each drought index: SPI, ADCI, WBDI, and IDI (integrated drought index) for the 2001 drought.
Figure 6. Spatial change of each drought index: SMSI (soil moisture saturation index), VCI (vege-tation condition index), TCI (temperature condition index), and ADCI for the 2001 drought.
Figure 5. Spatial change of each drought index: SPI, ADCI, WBDI, and IDI (integrated drought index)for the 2001 drought.
Remote Sens. 2021, 13, x FOR PEER REVIEW 10 of 18
Figure 5. Spatial change of each drought index: SPI, ADCI, WBDI, and IDI (integrated drought index) for the 2001 drought.
Figure 6. Spatial change of each drought index: SMSI (soil moisture saturation index), VCI (vege-tation condition index), TCI (temperature condition index), and ADCI for the 2001 drought.
Figure 6. Spatial change of each drought index: SMSI (soil moisture saturation index), VCI (vegetationcondition index), TCI (temperature condition index), and ADCI for the 2001 drought.
Figures 7 and 8 show the results of the evaluation of the 2014 drought. In 2014, adrought occurred around the Han River basin; in the same year, the Gangwon Province had70% of the average annual rainfall and the Gyeonggi Province area around Seoul had 59%,

Remote Sens. 2021, 13, 272 11 of 18
which was less compared to the previous years’ average annual rainfall. In particular, in2014, a dry monsoon phenomenon occurred in which a drought that began in spring (dueto the El Niño phenomenon) continued to cause no rainfall or a significantly lower amountof rainfall [44]. The rainfall between June 2014 and July 2014 was 48% (compared to theaverage in the past years), and the national water storage level also dropped significantlyto 64% over the previous year. In August, the average water level of multi-purpose damsin Korea was only 36.1%. The droughts lasted until 2015, resulting in less than 70% of theaverage rainfall, and the hydrological droughts, with reservoirs in many multipurposedams, reached dangerous levels [45]. Similar to the results of 2001, the RSIDI obtainedcould effectively describe the time and spatial occurrence patterns of the SPI and the WBDI,while the ADCI was analyzed to have delayed drought due to changes in SMSI. The ROCstatistical analysis also confirmed that WBDI was highest and ADCI was relatively low in2014 (SPI: 0.81, ADCI: 0.61, WBDI: 0.88). Through evaluation of past droughts, the RSIDIexplained the three drought characteristics (meteorological, agricultural, and hydrological)well and confirmed the applicability of the integrated drought index through ROC analysis.
Remote Sens. 2021, 13, x FOR PEER REVIEW 11 of 18
Figures 7 and 8 show the results of the evaluation of the 2014 drought. In 2014, a drought occurred around the Han River basin; in the same year, the Gangwon Province had 70% of the average annual rainfall and the Gyeonggi Province area around Seoul had 59%, which was less compared to the previous years’ average annual rainfall. In particu-lar, in 2014, a dry monsoon phenomenon occurred in which a drought that began in spring (due to the El Niño phenomenon) continued to cause no rainfall or a significantly lower amount of rainfall [45]. The rainfall between June 2014 and July 2014 was 48% (compared to the average in the past years), and the national water storage level also dropped signif-icantly to 64% over the previous year. In August, the average water level of multi-purpose dams in Korea was only 36.1%. The droughts lasted until 2015, resulting in less than 70% of the average rainfall, and the hydrological droughts, with reservoirs in many multipur-pose dams, reached dangerous levels [46]. Similar to the results of 2001, the RSIDI ob-tained could effectively describe the time and spatial occurrence patterns of the SPI and the WBDI, while the ADCI was analyzed to have delayed drought due to changes in SMSI. The ROC statistical analysis also confirmed that WBDI was highest and ADCI was rela-tively low in 2014 (SPI: 0.81, ADCI: 0.61, WBDI: 0.88). Through evaluation of past droughts, the RSIDI explained the three drought characteristics (meteorological, agricul-tural, and hydrological) well and confirmed the applicability of the integrated drought index through ROC analysis.
Figure 7. Spatial change of each drought index: SPI (standardized precipitation index), ADCI (agricultural dry condition index), WBDI (water budget-based drought index), and IDI (integrated drought index) for the 2014 drought.
Figure 7. Spatial change of each drought index: SPI (standardized precipitation index), ADCI(agricultural dry condition index), WBDI (water budget-based drought index), and IDI (integrateddrought index) for the 2014 drought.

Remote Sens. 2021, 13, 272 12 of 18Remote Sens. 2021, 13, x FOR PEER REVIEW 12 of 18
Figure 8. Spatial change of each drought index: SMSI, VCI, TCI, and ADCI for the 2014 drought.
3.2. Drought Transition Evaluation by Statistical Simulations This study simulated the impact on the spatiotemporal distribution of different
drought conditions, such as agricultural and hydrological perspectives, by altering the intended difference of δμ (r) (Equation (11)) of the meteorological drought index (SPI) 1000 times to represent the changes in SPI. As δμ (r) was intentionally changed, all the sub-basins experienced various changes in their ADCI and WBDI. Figure 9 shows that statis-tical simulations indicate that the changes in the state of agricultural (ADCI) and hydro-logical (WBDI) droughts correspond to the changes in meteorological drought (SPI). In addition, the results of the IBB simulation for up to three months of a lagged analysis were shown in Figure 10. Natural disasters, including droughts, are managed in four stages (Attention, Caution, Alert, and Serious) in Korea. In this study, the changes in other drought conditions were identified by intentionally changing the meteorological drought condition by using a IBB simulation.
First, when the meteorological drought (SPI) conditions were simulated from a stage of Normal to a stage of Attention (Figures 9a and 10a), the ADCI conditions, except for some parts of the Han River basin, showed a stage of Attention (96.6%, 820 out of 849 sub-basins). According to the results of the one-month delay, the ADCI status in parts of the Han and Nakdong River basins changed to Normal; however, 77.1% of the entire basin (45.8% of the two-month delay) was still in a stage of Attention. Over time, the ADCI conditions have shifted from a state of Attention to Normal in the southwestern part of the Han, Youngsang River, and Sumjin River basins. Even if the SPI conditions are simu-lated from the Normal stage to a stage of Attention, the results of the SPI are similar to those of time and space, and there are many sub-basins that are converted to the Normal
Figure 8. Spatial change of each drought index: SMSI, VCI, TCI, and ADCI for the 2014 drought.
3.2. Drought Transition Evaluation by Statistical Simulations
This study simulated the impact on the spatiotemporal distribution of differentdrought conditions, such as agricultural and hydrological perspectives, by altering theintended difference of δµ(r) (Equation (11)) of the meteorological drought index (SPI)1000 times to represent the changes in SPI. As δµ(r) was intentionally changed, all thesub-basins experienced various changes in their ADCI and WBDI. Figure 9 shows thatstatistical simulations indicate that the changes in the state of agricultural (ADCI) andhydrological (WBDI) droughts correspond to the changes in meteorological drought (SPI).In addition, the results of the IBB simulation for up to three months of a lagged analysiswere shown in Figure 10. Natural disasters, including droughts, are managed in fourstages (Attention, Caution, Alert, and Serious) in Korea. In this study, the changes in otherdrought conditions were identified by intentionally changing the meteorological droughtcondition by using a IBB simulation.
First, when the meteorological drought (SPI) conditions were simulated from a stageof Normal to a stage of Attention (Figures 9a and 10a), the ADCI conditions, except forsome parts of the Han River basin, showed a stage of Attention (96.6%, 820 out of 849 sub-basins). According to the results of the one-month delay, the ADCI status in parts of theHan and Nakdong River basins changed to Normal; however, 77.1% of the entire basin(45.8% of the two-month delay) was still in a stage of Attention. Over time, the ADCIconditions have shifted from a state of Attention to Normal in the southwestern part of theHan, Youngsang River, and Sumjin River basins. Even if the SPI conditions are simulatedfrom the Normal stage to a stage of Attention, the results of the SPI are similar to thoseof time and space, and there are many sub-basins that are converted to the Normal stageover time. When the meteorological drought (SPI) conditions were simulated from theNormal stage to a stage of Caution (Figures 9b and 10b), excluding the parts of the HanRiver basin, more than 98.6% showed the ADCI to be in the Attention stage and 15.9%showed a stage of Caution. According to the results of the one-month delay, the ADCI inthe northern parts of the Han River was still in a state of Caution; however, 88.5% of the

Remote Sens. 2021, 13, 272 13 of 18
entire basin was in the stage of Attention. Over time, the ADCI conditions shifted from astate of Attention to Normal in the southwestern parts of the Han, Youngsan, and SumjinRiver basins. Although the mid-term drought (SPI6) was simulated from a Normal stageto a stage of Attention, changes in the spatiotemporal pattern of the ADCI were similar tothe results obtained for SPI3, in which the scope of Attention conditions was reduced, andthe number of sub-basins converted to “Normal” over time increased in the southern partsof the country.
Remote Sens. 2021, 13, x FOR PEER REVIEW 13 of 18
stage over time. When the meteorological drought (SPI) conditions were simulated from the Normal stage to a stage of Caution (Figures 9b and 10b), excluding the parts of the Han River basin, more than 98.6% showed the ADCI to be in the Attention stage and 15.9% showed a stage of Caution. According to the results of the one-month delay, the ADCI in the northern parts of the Han River was still in a state of Caution; however, 88.5% of the entire basin was in the stage of Attention. Over time, the ADCI conditions shifted from a state of Attention to Normal in the southwestern parts of the Han, Youngsan, and Sumjin River basins. Although the mid-term drought (SPI6) was simulated from a Normal stage to a stage of Attention, changes in the spatiotemporal pattern of the ADCI were similar to the results obtained for SPI3, in which the scope of Attention conditions was reduced, and the number of sub-basins converted to “Normal” over time increased in the southern parts of the country.
Figure 9. Drought condition changes in intentionally biased bootstrap (IBB) simulation. (a) Case I (SPInormal → SPIAttention) and (b) Case II (SPInormal → SPICaution). The simulation results for the five basin areas are provided in the boxplot, and the results for the change in drought conditions are indicated in color in the map.
For WBDI, when the SPI drought conditions were simulated from Normal to a stage of Attention, the WBDI conditions, excluding the Han River basins, showed a stage of Alert (99.2%, 842 out of 849 sub-basins). As a result of the one-month delay, the WBDI status shifted from 75.7% of the total basin to a state of Attention, but 50.7% of the Han River basin and some areas of the Geum and Youngsan River basins were still in Caution levels. Over time, the WBDI conditions tended to shift from a state of Attention to Normal in the southwestern parts of the Han and Geum River basins. The SPI drought conditions were simulated from Normal to Caution; more than 93.8% of the total basins showed their WBDI in a stage of Caution. Over time, the WBDI status shifted to a Normal state around the southwestern Han and Geum River basins.
Figure 9. Drought condition changes in intentionally biased bootstrap (IBB) simulation. (a) Case I (SPInormal → SPIAttention)and (b) Case II (SPInormal → SPICaution). The simulation results for the five basin areas are provided in the boxplot, and theresults for the change in drought conditions are indicated in color in the map.
For WBDI, when the SPI drought conditions were simulated from Normal to a stageof Attention, the WBDI conditions, excluding the Han River basins, showed a stage ofAlert (99.2%, 842 out of 849 sub-basins). As a result of the one-month delay, the WBDIstatus shifted from 75.7% of the total basin to a state of Attention, but 50.7% of the HanRiver basin and some areas of the Geum and Youngsan River basins were still in Cautionlevels. Over time, the WBDI conditions tended to shift from a state of Attention to Normalin the southwestern parts of the Han and Geum River basins. The SPI drought conditionswere simulated from Normal to Caution; more than 93.8% of the total basins showed theirWBDI in a stage of Caution. Over time, the WBDI status shifted to a Normal state aroundthe southwestern Han and Geum River basins.
When the drought conditions of the RSIDI were simulated from Normal to Attention(Figure 11a), in all three drought indices (SPI, ADCI, and WBDI), the drought conditionsshifted to a state of Attention, confirming that the RSIDI expressed the overall drought inspace effectively. If drought conditions were simulated from Normal to Caution, the SPIresults showed that 78.6% of the total basins were in the same state as drought conditionsin the RSIDI. However, we inferred that the Han River basin was relatively insensitivedue to its status of Attention. Compared to the drought conditions of the SPI, the droughtconditions of the ADCI and WBDI were shown to be mitigated by one level in the HanRiver and some areas of the Nakdong River, and the spatial conditions changed in the twodrought indices (ADCI and WBDI) were similar.

Remote Sens. 2021, 13, 272 14 of 18Remote Sens. 2021, 13, x FOR PEER REVIEW 14 of 18
Figure 10. Drought condition changes in IBB simulation of ADCI and WBDI. (a) Case I (SPInormal → SPIAttention) and (b) Case II (SPInormal → SPICaution). The simulation results for the five basin areas for up to three months are colored in the map.
When the drought conditions of the RSIDI were simulated from Normal to Attention (Figure 11a), in all three drought indices (SPI, ADCI, and WBDI), the drought conditions shifted to a state of Attention, confirming that the RSIDI expressed the overall drought in space effectively. If drought conditions were simulated from Normal to Caution, the SPI results showed that 78.6% of the total basins were in the same state as drought conditions in the RSIDI. However, we inferred that the Han River basin was relatively insensitive due to its status of Attention. Compared to the drought conditions of the SPI, the drought conditions of the ADCI and WBDI were shown to be mitigated by one level in the Han
Figure 10. Drought condition changes in IBB simulation of ADCI and WBDI. (a) Case I (SPInormal → SPIAttention) and (b)Case II (SPInormal→ SPICaution). The simulation results for the five basin areas for up to three months are colored in the map.

Remote Sens. 2021, 13, 272 15 of 18
Remote Sens. 2021, 13, x FOR PEER REVIEW 15 of 18
River and some areas of the Nakdong River, and the spatial conditions changed in the two drought indices (ADCI and WBDI) were similar.
Figure 11. Drought condition changes in IBB simulation. (a) Case I (IDInormal → IDIAttention) and (b) Case II (IDInormal → IDICaution). The simulation results for the five basin areas for up to three months are colored in the map.
4. Discussion and Conclusions As climate change accelerates due to global warming, changes in hydrological cycles
occur significantly, and water use and prediction of water resources may become difficult. In particular, in Korea, chronic drought has occurred continuously since the 1990s during the transition from winter to spring [47]. To cope with these droughts, technologies to identify and predict the magnitude of spatiotemporal droughts are required. Drought monitoring using satellite data will be essential to secure spatial resolution for accurate and spatial droughts when ground-based hydrometeorological data are not available, as well as monitoring the different characteristics of meteorological, agricultural, and hydro-logical droughts.
Korea’s drought-related affairs are mainly handled by the Korea Meteorological Ad-ministration (KMA), Ministry of Agriculture, Food and Rural Affairs (MAFRA), Ministry of Environment (MOE), Ministry of Land, Infrastructure, and Transport (MOLIT), and the Ministry of Public Safety and Security (MPSS) [48]. The KMA diagnoses precipitation and drought in drought areas by assessing the SPI and PDSI and provides this information to the local governments. The MAFRA analyzes agricultural water through the soil moisture index (SMI), reservoir drought index (RDI), and integrated agricultural drought index. The MOLIT monitors dam water; the MOE monitors emergency water resources and wa-
Figure 11. Drought condition changes in IBB simulation. (a) Case I (IDInormal → IDIAttention) and (b) Case II (IDInormal →IDICaution). The simulation results for the five basin areas for up to three months are colored in the map.
4. Discussion and Conclusions
As climate change accelerates due to global warming, changes in hydrological cyclesoccur significantly, and water use and prediction of water resources may become difficult.In particular, in Korea, chronic drought has occurred continuously since the 1990s duringthe transition from winter to spring [46]. To cope with these droughts, technologies toidentify and predict the magnitude of spatiotemporal droughts are required. Droughtmonitoring using satellite data will be essential to secure spatial resolution for accurateand spatial droughts when ground-based hydrometeorological data are not available,as well as monitoring the different characteristics of meteorological, agricultural, andhydrological droughts.
Korea’s drought-related affairs are mainly handled by the Korea Meteorological Ad-ministration (KMA), Ministry of Agriculture, Food and Rural Affairs (MAFRA), Ministryof Environment (MOE), Ministry of Land, Infrastructure, and Transport (MOLIT), and theMinistry of Public Safety and Security (MPSS) [47]. The KMA diagnoses precipitation anddrought in drought areas by assessing the SPI and PDSI and provides this information tothe local governments. The MAFRA analyzes agricultural water through the soil moistureindex (SMI), reservoir drought index (RDI), and integrated agricultural drought index. TheMOLIT monitors dam water; the MOE monitors emergency water resources and waterquality according to the drought stage and implements the appropriate countermeasures.The MPSS oversees the drought situation when it becomes extreme. However, some pointout that the current drought measurement indices of different agencies are different indrought management, causing confusion and making it difficult to respond to drought

Remote Sens. 2021, 13, 272 16 of 18
proactively. Different ministries have different standards for determining the degree ofdrought. Additionally, it is not sufficient for a single drought indicator to characterize allthe complex drought evolution processes [22]. The development and application of anintegrated drought index are necessary to take into account the complex factors related towater use, such as the meteorological, agricultural, and hydrological perspectives. Thus,this study proposed an RS-based integrated drought index that was extracted from 849 sub-basins in Korea’s five major river basins using multi-sensor collaborative approaches andmultivariate dimensional reduction models, calculated through monthly satellite data.Droughts in 2001 and 2014, representative years of severe drought since the 2000s, wereevaluated using the integrated drought index, and statistical simulations were used todiagnose the sensitivity and transition of drought. The BPCA-based integrated droughtindex proposed in this study was analyzed to reflect the timing, severity, and evolutionarypattern of meteorological, agricultural and hydrological droughts, enabling comprehensivedelivery of drought information. Although the results relied on limited observations, it isexpected that drought hotspot analyses and statistical simulations using IBB and BPCA-based RSIDI will identify the drought characteristics of the sub-basin, thereby promotingtheir use in preemptive drought response through drought prediction and early warning.
Drought monitoring and accurate drought forecasting are still the main challengesin a relatively changing environment that has a long lead-time and natural and artificialfactors. Therefore, future works to improve drought monitoring and prediction requirefurther research, such as high-quality data assimilation, improving model developmentthrough major processes related to droughts, selecting or predicting optimal ensembles,and hybrid drought forecasting.
Author Contributions: Conceptualization, Resources, Formal analysis, Writing—original draft, J.-S.K.and S.-Y.P.; Conceptualization, Methodology, Writing—review & editing, J.-H.L.; Writing—review& editing, J.C., S.C. and T.-W.K. All authors have read and agreed to the published version of themanuscript.
Funding: This research was supported by the Korea Environment Industry & Technology Institute(KEITI) through the Water Management Research Program, which is funded by the Korea Ministry ofEnvironment (MOE) (Grant No. 79616). We also appreciate the support of the State Key Laboratoryof Water Resources and Hydropower Engineering Science, Wuhan University.
Conflicts of Interest: The authors declare no conflict of interest.
References1. Zarafshani, K.; Sharafi, L.; Azadi, H.; Van Passel, S. Vulnerability Assessment Models to Drought: Toward a Conceptual
Framework. Sustainability 2016, 8, 588. [CrossRef]2. Kim, J.S.; Seo, G.S.; Jang, H.W.; Lee, J.H. Correlation analysis between Korean spring drought and large-scale teleconnection
patterns for drought forecasting. KSCE J. Civ. Eng. 2017, 21, 458–466. [CrossRef]3. Yue, Y.; Shen, S.; Wang, Q. Trend and variability in droughts in Northeast China based on the reconnaissance drought index.
Water 2018, 10, 318. [CrossRef]4. Qaiser, G.; Tariq, S.; Adnan, S.; Latif, M. Evaluation of a composite drought index to identify seasonal drought and its associated
atmospheric dynamics in Northern Punjab, Pakistan. J. Arid Environ. 2021, 185, 104332. [CrossRef]5. Cong, D.; Zhao, S.; Chen, C.; Duan, Z. Characterization of droughts during 2001–2014 based on remote sensing: A case study of
Northeast China. Ecol. Inf. 2017, 39, 56–67. [CrossRef]6. Park, S.Y.; Sur, C.; Kim, J.S.; Lee, J.H. Evaluation of multi-sensor satellite data for monitoring different drought impacts. Stoch.
Environ. Res. Risk Assess. 2018, 32, 2551–2563. [CrossRef]7. Sur, C.; Park, S.Y.; Kim, T.W.; Lee, J.H. Remote sensing-based agricultural drought monitoring using hydrometeorological
variables. KSCE J. Civ. Eng. 2019, 23, 5244–5256. [CrossRef]8. Abuzar, M.K.; Shafiq, M.; Mahmood, S.A.; Irfan, M.; Khalil, T.; Khubaib, N. Drought risk assessment in the khushab region of
Pakistan using satellite remote sensing and geospatial methods. Int. J. Econ. Environ. Geol. 2019, 10, 48–56. [CrossRef]9. Zhong, R.; Chen, X.; Lai, C.; Wang, Z.; Lian, Y.; Yu, H.; Wu, X. Drought monitoring utility of satellite-based precipitation products
across mainland China. J. Hydrol. 2019, 568, 343–359. [CrossRef]10. Carlson, T.N.; Gillies, R.R.; Perry, E.M. A method to make use of thermal infrared temperatureand NDVI measurements to infer
surface soil water content and fractional vegetation cover. Remote Sens. Rev. 1994, 9, 161–173. [CrossRef]

Remote Sens. 2021, 13, 272 17 of 18
11. Tadesse, T.; Demisse, G.B.; Zaitchik, B.; Dinku, T. Satellite-based hybrid drought monitoring tool for prediction of vegetationcondition in Eastern Africa: A case study for Ethiopia. Water Resour. Res. 2014, 50, 2176–2190. [CrossRef]
12. Enenkel, M.; Steiner, C.; Mistelbauer, T.; Dorigo, W.; Wagner, W.; See, L. A combined satellite-derived drought indicator to supporthumanitarian aid organizations. Rem. Sens. 2016, 8, 340. [CrossRef]
13. Wang, J.; Xu, X.; Ding, S.; Zeng, J.; Spurr, R.; Liu, X.; Chance, K.; Mishchenko, M. A numerical testbed for remote sensing ofaerosols, and its demonstration for evaluating retrieval synergy from a geostationary satellite constellation of GEO-CAPE andGOES-R. J. Quant. Spectrosc. Radiat. Transfer. 2014, 146, 510–528. [CrossRef]
14. Wilhite, D.A. Drought Monitoring and Early Warning: Concepts, Progress and Future Challenges; World Meteorological Organization:Geneva, Switzerland, 2006; p. 1006.
15. Huang, S.; Huang, Q.; Leng, G.; Liu, S. A nonparametric multivariate standardized drought index for characterizing socioeco-nomic drought: A case study in the Heihe River Basin. J. Hydrol. 2016, 542, 875–883. [CrossRef]
16. Wu, Z.; Mao, Y.; Li, X.; Lu, G.; Lin, Q.; Xu, H. Exploring spatiotemporal relationships among meteorological, agricultural, andhydrological droughts in Southwest China. Stoch Environ. Res. Risk Assess. 2016, 30, 1033–1044. [CrossRef]
17. Sur, C.; Park, S.Y.; Kim, J.S.; Lee, J.H. Prognostic and diagnostic assessment of hydrological drought using water and energybudget-based indices. J. Hydrol. 2020, 591, 125549. [CrossRef]
18. Guo, Y.; Huang, S.; Huang, Q.; Wang, H.; Fang, W.; Yang, Y.; Wang, L. Assessing socioeconomic drought based on an improvedmultivariate standardized reliability and resilience index. J. Hydrol. 2019, 568, 904–918. [CrossRef]
19. McKee, T.B.; Doesken, N.J.; Kleist, J. The relationship of drought frequency and duration to time scales. In Proceedings of the 8thConference on Applied Climatology, Anaheim, CA, USA, 17–22 January 1993; Volume 17, pp. 179–183.
20. Shukla, S.; Wood, A.W. Use of a standardized runoff index for characterizing hydrologic drought. Geophys. Res. Lett. 2008,35, 1100. [CrossRef]
21. Hayes, M.; Svoboda, M.; Wall, N.; Widhalm, M. The Lincoln declaration on drought indices: Universal meteorological droughtindex recommended. Bull. Am. Meteorol. Soc. 2011, 92, 485–488. [CrossRef]
22. Hao, Z.; AghaKouchak, A. A nonparametric multivariate multi-index drought monitoring framework. J. Hydrometeor. 2014, 15,89–101. [CrossRef]
23. Cunha, A.P.M.; Alvalá, R.C.; Nobre, C.A.; Carvalho, M. A Monitoring vegetative drought dynamics in the Brazilian semiaridregion. Agric. Meteorol. 2015, 2014, 494–505. [CrossRef]
24. Sur, C.; Hur, J.; Kim, K.; Choi, W.; Choi, M. An evaluation of satellite-based drought indices on a regional scale. Int. J. Remote Sens.2015, 36, 5593–5612. [CrossRef]
25. Li, J.; Zhou, S.; Hu, R. Hydrological drought class transition using SPI and SRI time series by loglinear regression. Water Resour.Manage. 2016, 30, 669–684. [CrossRef]
26. Palmer, W. Meteorological Drought, Weather Bureau Research Paper 45; U.S. Weather Bureau: Washington, DC, USA, 1965; p. 58.27. Zhang, A.; Jia, G. Monitoring meteorological drought in semiarid regions using multi-sensor microwave remote sensing data.
Remote Sens. Environ. 2013, 134, 12–23. [CrossRef]28. Zhang, X.; Chen, N.; Li, J.; Chen, Z.; Niyogi, D. Multi-sensor integrated framework and index for agricultural drought monitoring.
Remote Sens. Environ. 2017, 188, 141–163. [CrossRef]29. Kogan, F.N. Application of vegetation index and brightness temperature for drought detection. Adv. Space Res. 1995, 15, 91–100.
[CrossRef]30. Kogan, F.N. Operational space technology for global vegetation assessment. Bull. Am. Meteorol. Soc. 2001, 82, 1949–1964.
[CrossRef]31. Oki, T.; Kanae, S. Global hydrological cycles and world water resources. Science 2006, 313, 1068–1072. [CrossRef]32. Huffman, G.J.; Adler, R.F.; Bolvin, D.T.; Gu, G.; Nelkin, E.J.; Bowman, K.P.; Hong, Y.; Stocker, E.F.; Wolff, D.B. The TRMM Multi-
Satellite Precipitation Analysis: Quasi-Global, Multi-Year, Combined-Sensor Precipitation Estimates at Fine Scale. J. Hydrometeor.2007, 8, 38–55. [CrossRef]
33. McKee, T.B. Drought monitoring with multiple time scales. In Proceedings of the 9th Conference, Applied Climatology, Dallas,TX, USA, 15–20 January 1995; pp. 233–236.
34. Hao, Z.; AghaKouchak, A. Multivariate Standarized Drought Index: A prametric multi-index model. Adv. Water Resour. 2013, 57,12–18. [CrossRef]
35. Ma, Y.Y.; Zhu, L.P. A Review on Dimension Reduction. Int. Stat. Rev. 2012, 81, 134–150. [CrossRef] [PubMed]36. Jolliffe, I.T. Principal Component Analysis, 2nd ed.; Springer Science Business Media: Berlin, Germany, 2002.37. Oba, S.; Sato, M.A.; Takemasa, I.; Monden, M.; Matsubara, K.I.; Ishii, S. A Bayesian missing value estimation method for gene
expression profile data. Bioinformatics 2003, 19, 2088–2096. [CrossRef] [PubMed]38. Lai, W.Y.; Kuok, K.K. A Study on Bayesian Principal Component Analysis for Addressing Missing Rainfall Data. Water Resour.
Manag. 2019, 33, 2615–2628. [CrossRef]39. Lee, T. Climate change inspector with intentionally biased bootstrapping (CCIIBB ver. 1.0)–methodology development. Geosci.
Model. Dev. 2017, 10, 525–536. [CrossRef]40. Bouveyron, C.; Latouche, P.; Mattei, P.A. Exact dimensinality selection for Bayesian PCA. Scand. J. Statist. 2020, 47, 196–211.
[CrossRef]

Remote Sens. 2021, 13, 272 18 of 18
41. Heng, C.; Lee, T.; Kim, J.-S.; Xiong, L. Influence analysis of central and Eastern Pacific El Niños to seasonal rainfall patterns overChina using the intentional statistical simulations. Atmos. Res. 2020, 233, 104706. [CrossRef]
42. Zelinka, I. SOMA—self-organizing migrating algorithm. In New Optimization Techniques in Engineering; Springer: Berlin/Heidelberg,Germany, 2004; pp. 167–217.
43. Baek, S.G.; Jang, H.W.; Kim, J.S.; Lee, J.H. Agricultural drought monitoring using the satellite-based vegetation index, KoreaWater Resources Association. J. Korea Water Resour. Assoc. 2016, 49, 305–314. (In Korean) [CrossRef]
44. Lee, J.H.; Jang, H.W. Comparison on Characteristics and Historical Drought Events of summer drought in 2014. Korea DisasterPrevention Association. J. Disaster Prev. 2014, 16, 46–56. (In Korean)
45. Ministry of Land, Infrastructure and Transport (MLIT). 2015 Drought Impact Investigation Report; Korea Ministry of Land,Infrastructure and Transport (MLIT): Sejong City, Korea, 2015. (In Korean)
46. Bae, H.; Ji, H.; Lim, Y. Characteristics of drought propagation in South Korea: Relationship between meteorological, agricultural,and hydrological droughts. Nat. Hazards. 2019, 99, 1–16. [CrossRef]
47. Hong, I.P.; Lee, J.H.; Cho, H.S. National drought management framework for drought preparedness in Korea (lessons from the2014–2015 drought). Water Policy 2016, 18, 89–106. [CrossRef]
Copyright © 2022 FDOKUMEN