BIM Visual Programming Tools Applications in Infrastructure ...
Upload
khangminh22Category
view
1download
0
sustainability
Article
BIM for Healthy Buildings: An Integrated Approachof Architectural Design Based on IAQ Prediction
Alessandro D’Amico 1,* , Giacomo Bergonzoni 2, Agnese Pini 1 and Edoardo Currà 1
1 Department of Civil, Building and Environmental Engineering, Sapienza University of Rome, 00184 Rome,Italy; [email protected] (A.P.); [email protected] (E.C.)
2 Department of Architecture, Alma Mater Studiorum University of Bologna, 40141 Bologna, Italy;[email protected]
* Correspondence: [email protected]; Tel.: +39-064-458-5665
Received: 20 November 2020; Accepted: 9 December 2020; Published: 12 December 2020 �����������������
Abstract: The relationship between users and the built environment represents a fundamental aspectof health. The factors that define the properties linked to health and well-being are increasinglybecoming part of building design. In these terms, building information modelling (BIM) andBIM-based performance simulation take on a priority role. Among the key features for the design ofHealthy Buildings, indoor air quality (IAQ) plays a central role. There are numerous indoor pollutantswith significant health effects; volatile organic compounds (VOCs) are to be mentioned among these.The paper presents the proposal of an integrated workflow in the BIM process for the check andcontrol of VOC emissions from building materials and their concentration in confined environments.The workflow is developed through the systematisation of IAQ parameters for the open BIM standard,the integration in the BIM process of a numerical model for the prediction of the VOCs concentrationin the indoor environment, and the development of model checkers for performance verification.The results show a good adhesion between the numerical model and the implementation in BIM,providing the designer with a rapid control instrument of IAQ in the various phases of the buildingdesign. The present study is the first development focused on TVOC, but implementable concerningother aspects of IAQ, as needed for the effectiveness of performance building-based design for healthand wellness issues.
Keywords: design and health; BIM; materials; interior design; salutogenesis; wellbeing; VOCemission; IAQ; building design
1. Introduction
Architectural design in health management is assuming an increasingly central role. In thiscontext, the issue of building quality requires the development of models for verifying the feasibility ofthe building project and the optimal compliance of the works with the requirements. This objectiveneeds an interdisciplinary approach as the technological and construction solutions must be basedon the maximum interrelation between the building organism, the environmental system, and thebuilding-plant system [1].
Considering the humankind–built environment relationship, determined in every situationdelimited by the confined environment, the main requirements to be met refer to a series of technological,environmental, and functional aspects directly and indirectly connected to the quality intended toconfer on the built environment. The management of these interrelations requires the adoption ofbuilding information models that govern the complexity of the building organism [2,3] by simulating itsreal behaviour in the aspects of a constructive, functional, and formal nature, and the system hierarchies.For this reason, research on the translation of the building system in terms of assisted design assumes
Sustainability 2020, 12, 10417; doi:10.3390/su122410417 www.mdpi.com/journal/sustainability

Sustainability 2020, 12, 10417 2 of 31
a priority role. The coding of BIM grows on the trend of research regarding the decomposition ofthe building system [4] into technological-functional elements and their consequent organisation inhierarchies of systems, defined and structured according to their mutual relationships [5].
The World Health Organization (WHO) has recognised the influence of the indoor and outdoor builtenvironment on public health, with particular attention to densely built-up contexts [6]. Adequate livingconditions require a healthy built environment, as much as individual and collective health is affectedby the environmental context [7].
As highlighted by the EPA [8], the reduction of health risks must be achieved through better design,construction, and management of buildings, improvements in the development and use of interiormaterial, and mitigation of existing exposures inside a building or in its immediate vicinity. Numerouscurrent researches deal with the quality of indoor environments and their impact on health [8–11],to achieve the definition of the “Healthy Buildings” concept [12]. Through a complete set of scientificevidence drawn from a substantial review of the scientific literature, the study conducted by theHarvard School of Public Health [12] identifies the nine fundamental elements for “Healthy Buildings”:Ventilation; indoor air quality (IAQ); thermal health; humidity; dust and parasites; security andprotection; water quality; noise pollution; lighting and view.
In recent decades, numerous studies have focused on IAQ [13,14], documenting profoundqualitative changes in indoor air, with a progressive increase in the absolute number of pollutants [15],many of which have significant effects on health [8]. The pollutants detectable in indoor environmentsare numerous and range from biological ones (mites, fungal spores) to chemical ones (i.e., NO2, CO,polycyclic aromatic hydrocarbons—PAH, benzene, volatile organic compounds—VOC, formaldehyde,PM10, PM2.5), often showing higher concentrations than those detectable outsides [16]. In particular,VOCs are widely diffused in indoor environments as they can be emitted by construction and finishingmaterials, furniture and equipment, and cleaning products.
In Italy, as in the rest of the world, following the energy resources crisis, new technical-designcriteria have been imposed for buildings for civil use. The need to contain consumption for heatingand ventilation has imposed better thermal insulation of buildings, with a consequent trend to seal theindoor environments, and to replace the natural methods of ventilation and lighting with artificialmeans [17]. This approach has made the architectural design more involved in indoor air quality.
We are entering the Third Era of Health, where the figures involved in the construction processhave a real opportunity to provide salutogenic as well as healthy environments, not only concerninghospital construction but also to the whole built environment. The goal is to create optimal livingenvironments that seriously support well-being and health in both private and public settings [18].While the First Era focused on communicable diseases, and the Second Era, which began in themid-20th century, converged attention on chronic diseases, the current one is centred on the conceptsof “healthy” and “salutogenesis”, i.e., quantitative issues of health “as the ability to maintain andimprove health as a resource for living” [19].
The concept of salutogenic design originates from Aaron Antonovsky′s theory of “salutogenesis”,developed in 1979. The term translates to “origins of health”, focusing on actively promoting theconcept of health and well-being, rather than the pathogenic approach that deals exclusively withresulting diseases and injuries. Several studies, integrated between scientific research and designpractice, are taking an interest in the topic. Among these is the work of the TH!NK group, researchand development team dedicated to healthcare design within the IBI Group, and responsible for the“Salutogenic Home of Tomorrow” project [18].
The theme of salutogenic design has also pervaded the design of workplaces, which, like allindoor environments, can contain numerous factors dangerous to health [13], and this is also relatedto the cost reduction paradigm, in which space efficiency takes priority over users requirements [20].The mitigation of pathogenic environmental components is a necessary, but not sufficient step towardsthe goal of providing genuinely healthy workplaces. According to Roskams and Haynes [20],two main strategies for improvement in workplaces are possible: Making physical alterations to

Sustainability 2020, 12, 10417 3 of 31
the site aimed at reducing the presence of requests (for example increasing the ventilation rate toimprove air quality) and increasing the presence of resources (for example bringing plants into theindoor environment). The recent certification schemes for the optimisation of health and well-beingin the built environment (i.e., the WELL Building standard [21]) focus largely on improving indoorenvironmental quality through strategies such as minimising air pollutants and reducing varioussources of environmental distress.
The distinction between harmful and health-promoting factors echoes the World HealthOrganization′s definition of health (1948) as “ state of complete physical, mental and social well-beingand not merely the absence of disease or infirmity” [11].
Thus, architectural design in health management is playing a new role and, as written at thebeginning, the system of requirements to be met refers to the aspects of the technological and theenvironmental systems directly or indirectly connected to the quality of the indoor built environment.
The management of these interrelations through building information models [2,3] follows arequirement-performance approach aimed to define the technical intervention methods on buildingconstruction to respond to the demands of the functional programming, and of the currentlegislation with compliant technical solutions, characterised more or less by high performance [22,23],and specifically for health and well-being requirements.
Not coincidentally, scientific literature in the field had already highlighted the importance ofthese needs by grouping them into a specific class [UNI 11277:2006 withdrawn March 2017—andpartly assimilated by the enactment of the Minimum Environmental Criteria—Criteri Ambientali MinimiCAM—Italian Ministerial Decree 11 October 2017], given that the population spends on averageover 90% of their time inside built spaces [8,17]. From this point of view, it is in the completedevelopment of the concept of performance-based building design (PBBD) [24] that it is possible tothink of significant results.
From an operational point of view, the issue to be overcome as a difficulty is to associate aperformance specification (threshold value) to each element of the environmental and technologicalsystem [25] by filling in data fields or using automated calculation procedures [26]. One of the mainproblems appears to be the incomplete definition of the performance specifications in the regulatoryenvironment concerning specific topics.
With specific reference to IAQ, the need to regulate exposure levels has led internationalorganisations, such as the WHO, to define guide values (indoor air guide values—IAGVs) [27] for theconcentration of various pollutants in an indoor environment, and which scientific knowledge regardingthe effects on humans has been judged sufficiently reliable. The substances considered are benzene,nitrogen dioxide, polycyclic aromatic hydrocarbons (especially benzo[a]pyrene), naphthalene, carbonmonoxide, radon, trichloroethylene, and tetrachlorethylene. Many countries have then developedtheir own standards defining the limits of numerous VOCs. In most countries, in line with the WHO,the guide values refer to individual substances. Only in a limited number of countries (e.g., Portugal,the Netherlands, Belgium) has an acceptability limit been defined for total VOCs [11,28]. In Italy, aspecific standard that incorporates WHO guidelines has not been drawn up [8], while MinisterialDecree of 11 October 2017 dictates the minimum environmental criteria (CAM) for construction andexclusively defines the limits of emissions from materials, but not those to concentrations in theindoor environment.
To overcome the incomplete definition of performance specifications in the regulatory field, it isnecessary to rely on an evidence-based approach, addressing the possibility of attributing, and aboveall extrapolating, quantitative assessments from the information models for design. [29].
As highlighted by Zanchetta [1], the objective of this approach is currently linked to the coordinationof the different disciplinary contributions, which must lead to a coherent set of design choices andcalculation approaches.
The field of research that deals with BIM and GreenBuildings, in the broadest sense of the term, isexpanding to these aspects [30] and the use of model checking software is now widespread, to verify

Sustainability 2020, 12, 10417 4 of 31
the correctness of the design. The interest in research and application of BIM now has a broad andshared development concerning the issues of the energy performance of the building, while there areshortcomings for issues relating to health and well-being, such as IAQ [31,32]. Starting from a digitalclassification of the building elements based on the development and adoption of the buildingSMART®
standards, namely the IFC (Industry Foundation Classes) standard for openBIM, it is possible to verifythe relationships established between them to set rules, check, and verify the correctness of the designchoices [33–35]. For example, Cofaigh et al. configured the shape and orientation of a low-energybuilding using BIM-based analysis, achieving a 40% reduction in the environmental and financialburden compared to a conventional building [36]. Wang et al. used a BIM-based energy analysissimulation tool to analyse different building materials and set parameters optimised for environmentalimpact assessment [37]. Getuli et al. developed a model checking for the safety aspects of theconstruction site [38]. In particular, there are numerous applications relating to the seventh dimensionof BIM, the one of sustainability, such as the one carried out by Open Project on the integration betweenBIM and LEED certification, specifically of indoor environmental quality (IEQ) [39], and related to thelife cycle assessment (LCA) [40].
The paper presents the proposal for an applicative workflow and a tool integrated into the BIMprocess for the check and control of VOC emissions from building materials and their concentrationin confined environments, referred to national and international standards, and to guide valuesfor IAQ (IAGVs). What presented here is part of broader research “BIM4H&W: BIM for Healthand Wellbeing” (POR FESR LAZIO 2014/2020- Integrated projects) developed in partnership ofeffective collaboration between the company RI.EL.CO IMPIANTI S.R.L. and the University of Rome“La Sapienza”, CRITEVAT.
2. Materials and Methods
The methodology developed in the research followed the workflow represented in Figure 1.
Sustainability 2020, 12, x FOR PEER REVIEW 4 of 32
buildingSMART® standards, namely the IFC (Industry Foundation Classes) standard for openBIM, it
is possible to verify the relationships established between them to set rules, check, and verify the
correctness of the design choices [33–35]. For example, Cofaigh et al. configured the shape and
orientation of a low‐energy building using BIM‐based analysis, achieving a 40% reduction in the
environmental and financial burden compared to a conventional building [36]. Wang et al. used a
BIM‐based energy analysis simulation tool to analyse different building materials and set parameters
optimised for environmental impact assessment [37]. Getuli et al. developed a model checking for
the safety aspects of the construction site [38]. In particular, there are numerous applications relating
to the seventh dimension of BIM, the one of sustainability, such as the one carried out by Open Project
on the integration between BIM and LEED certification, specifically of indoor environmental quality
(IEQ) [39], and related to the life cycle assessment (LCA) [40].
The paper presents the proposal for an applicative workflow and a tool integrated into the BIM
process for the check and control of VOC emissions from building materials and their concentration
in confined environments, referred to national and international standards, and to guide values for
IAQ (IAGVs). What presented here is part of broader research “BIM4H&W: BIM for Health and
Wellbeing” (POR FESR LAZIO 2014/2020‐ Integrated projects) developed in partnership of effective
collaboration between the company RI.EL.CO IMPIANTI S.R.L. and the University of Rome “La
Sapienza”, CRITEVAT.
2. Materials and Methods
The methodology developed in the research followed the workflow represented in Figure 1.
The four main sections, in which the methodology is divided, are set out below: (i) Definition of
IAQ parameters to be implemented in BIM process and IFC standard; (ii) development of an
automatised process to apply parameters to BIM elements; (iii) use of BIM to integrate the VOC
prediction model; (iv) development of model checker in the BIM process to verify indoor TVOC
concentration related to IAGVs to address design choices. The research was developed on the case
study: the new expansion of CNR in Pisa, Italy.
Figure 1. Integration of indoor air quality (IAQ) issues and volatile organic compound (VOC)
prediction model within the building information modelling (BIM) process workflow.
Figure 1. Integration of indoor air quality (IAQ) issues and volatile organic compound (VOC) predictionmodel within the building information modelling (BIM) process workflow.
The four main sections, in which the methodology is divided, are set out below: (i) Definitionof IAQ parameters to be implemented in BIM process and IFC standard; (ii) development of anautomatised process to apply parameters to BIM elements; (iii) use of BIM to integrate the VOC

Sustainability 2020, 12, 10417 5 of 31
prediction model; (iv) development of model checker in the BIM process to verify indoor TVOCconcentration related to IAGVs to address design choices. The research was developed on the casestudy: the new expansion of CNR in Pisa, Italy.
2.1. IAQ Parameters to Be Implemented in the BIM Process and IFC Standard
The IFC standard is continually evolving and provides for the change and addition of newstandard property sets for objects from one version to another; for this reason, we want to propose anew property set useful for containing all the information concerning the indoor air quality (IAQ).
Methodologically, the research starts from the review of the parameters for the control of IAQfound in the property sets already provided in the IFC 4.1 schema [41].
Property sets already containing parameters that can be used for the model use of this researchhave been identified: Analysis of indoor air quality. Starting from the “common property sets”,the following specific property sets were also analysed in-depth:
• IfcMaterial: Pset_MaterialThermal, Pset_MaterialCombustion.• IfcWall, IfcSlab, IfcCeiling, IfcCovering: Pset_EnvironmentalImpactIndicators, Pset_Environ
mentalImpactValues.• IfcSpace: Pset_SpaceThermalRequirements, Pset_SpaceThermalDesign, Pset_SpaceCovering
Requirements, Qto_SpaceBaseQuantities.
The survey shows that only some parameters, referring to the IfcSpace entity belonging to thePset_SpaceThermalRequirements and Qto_SpaceBaseQuantities, can be used for the workflow aimedat managing VOC emissions (Table 1).
Table 1. Parameters for managing VOC emissions already provided for in the IFC 4.1 schema.
ParameterName Parameter Description Assigned
ItemsPropertySet or
QuantitySet Reference
NetWallArea
Sum of all wall (and other verticallybounding elements, like columns) areas
bounded by the space. It excludes the areacovered by elements inside the wall area(doors, windows, other openings, etc.).
IfcSpace IFC 4.1Qto_SpaceBaseQuantities
NetFloorArea
Sum of all usable floor areas covered by thespace. It excludes the area covered by
elements inside the space (columns, innerwalls, built-in’s etc.), slab openings, or otherprotruding elements. Varying heights are not
taking into account (i.e. no reduction forareas under a minimum headroom).
IfcSpace IFC 4.1Qto_SpaceBaseQuantities
NetCeilingArea
Sum of all ceiling areas of the space. Itexcludes the area covered by elements insidespace (columns, inner walls, etc.). The ceiling
area is the real (and not the projected) area(e.g. in case of sloped ceilings).
IfcSpace IFC 4.1Qto_SpaceBaseQuantities
NetVolumeNet volume enclosed by the space, excludingthe volume of construction elements inside
the space.IfcSpace IFC 4.1
Qto_SpaceBaseQuantities
MechanicalVentilationRate
Indication of the requirement of a particularmechanical air ventilation rate, given in air
changes per hour.IfcSpace IFC 4.1
Pset_SpaceThermalRequirements
For this reason, it needs to identify and propose additional parameters in addition to those alreadyprovided for by the IFC 4.1 schema, necessary for the analysis of the IAQ.
The identification of these parameters is an instrumental result to achieve the broader objectivesof the research. For this reason, it is necessary to have selection criteria proportionate to the finalpurpose. First of all, to make the use of new/implemented property sets in BIM by operators easy

Sustainability 2020, 12, 10417 6 of 31
and widespread, it is good practice not to excessively multiply the number of them, for effectiveassimilation of the search results in the design/professional practice.
Therefore, to achieve these objectives, two fundamental criteria stay at the basis of the definitionof the new parameters:
1. Enter as few parameters as possible, using a parameter with the same name for different IFCentities. For example, “VOCsEmission” is assigned to both the materials and objects of the model(i.e., walls, floors, false ceilings), obviously, in the first case the value will express the emissivityof the VOCs of the single material, while in the second case it will express the emissivity of all thematerials that make up the object;
2. Use a composition of the name as consistent as possible with that of the international standardIFC 4.1, currently the official schema.
Thus it is possible to propose the two new property sets “Pset_IndoorAirQualityRequirements”and “Pset_SpaceIndoorAirQualityRequirements” and Tables 2 and 3 show, respectively, the proposedparameters that will compose them. This procedure aims to increase the LOD (level of development)of the information model, in detail of the non-geometric aspects, i.e., the LOI (level of information).
Table 2. “Pset_IndoorAirQualityRequirements” and the parameters that compose it.
Parameter Name Parameter Description Entities to Which It Is Assigned
VOCsEmission Quantity of VOCs emissions for elements.Unit of measure µg/m3
IfcMaterial, IfcWall, IfcSlab,IfcCeiling
VOCsEmissionCAMCAM limit of the quantity of VOCs
emissions for elements. Unit of measureµg/m3
IfcMaterial, IfcWall, IfcSlab,IfcCeiling
Table 3. “Pset_SpaceIndoorAirQualityRequirements” and the parameters that compose it.
Parameter Name Parameter Description Entities
SpaceVOCs VOCs presence inside the space. Unit of measure µg/m3 IfcSpace
WallCoveringVOCsTestChamber VOCs Test Chamber Concentration of wall finish inside thespace. Unit of measure µg/m3 IfcSpace
FloorCoveringVOCsTestChamber VOCs Test Chamber Concentration of floor finish insidethe space. Unit of measure µg/m3 IfcSpace
CeilingCoveringVOCsTestChamber VOCs Test Chamber Concentration of ceiling finish insidethe space. Unit of measure µg/m3 IfcSpace
WallCoveringVOCs VOCs Concentration of wall finish inside the space.Unit of measure µg/m3 IfcSpace
FloorCoveringVOCs VOCs Concentration of floor finish inside the space.Unit of measure µg/m3 IfcSpace
CeilingCoveringVOCs VOCs Concentration of ceiling finish inside the space.Unit of measure µg/m3 IfcSpace
2.2. Automatized Process to Apply the Parameters to BIM Elements
The parameters are inserted into the BIM model, developed in the Autodesk Revit environment,through the use of “Shared Parameters”. To speed up and automate the process as much as possible,the free add-in “ParaManager” developed by DiRoots was used [42].
ParaManager is an add-in for Revit that allows the management of the parameters from the modelfor individual families. It allows to create, modify, connect, transfer, export, and standardise all Revitparameters for reuse on current and future projects. It is chosen to operate with this tool because itallows assigning several parameters to multiple categories of BIM elements simultaneously whileusing the Revit basic commands can be assigned only one shared parameter at a time making this avery long, repetitive, and error-prone work.

Sustainability 2020, 12, 10417 7 of 31
After creating the information structure of all the parameters necessary for the analysis of theVOC emission within the BIM model, they must be filled in with the appropriate values. Therefore,a shared spreadsheet was set up in the cloud with all project stakeholders thanks to the use of GoogleSpreadsheet. The spreadsheet was created by extrapolating the information directly from the BIMmodel by creating two separate sheets for compiling the values. To extract the information from themodel and insert it into a spreadsheet, schedules have been set up within Autodesk Revit and thenexported in “.txt” format with the “Export-> Report” command. The .txt file created was then openedin Excel for a table view and subsequently uploaded to the Google Spreadsheet cloud sharing platform.
Two levels of definition have been created:
1. Parameters to assign to the materials.2. Parameters to assign to the rooms/spaces.
After the creation of the parameters and their compilation with the project values, there is thecheck of the correct insertion. Control takes place in three steps:
1. Checking the current presence of the shared parameters assigned to the correct category.2. Check for the presence of a compiled value within the shared parameters created.3. Checking the validity of the compiled values with the threshold values expressed by the CAM for
the materials and a guide value, deriving from the analysis and critical reading of the IAGVs,for the rooms/spaces.
To implement this triple check, the free add-in “Autodesk BIM Interoperability Tools for Revit”and in particular the commands of the “Autodesk Model Checker for Revit” are used [43].
By creating a CheckSet in Autodesk Revit Model Checker specifically for the analysis of VOCemissions it is possible to save it in XML format and make it available to the whole scientific communityas certain institutions did, such as “The Ohio State University” [44].
2.3. BIM to Integrate VOC Prediction Model
Estimating the concentration of pollutants in a confined environment can be achieved withdifferent types of numerical models generically capable of considering the sources of the pollutant andthe fluid dynamic conditions of the environment. This work considers and integrates a box-modelusing a mass balance approach within the BIM process. This type of model, often used for indoorenvironments [45–47], can calculate the concentration of a pollutant in the volume represented by theroom under examination starting from a hypothesis of complete mixing (box-model), namely assuminga homogeneous distribution of the concentration in the volume itself.
For the purposes of this work, a specific numerical model, capable of estimating the concentrationof VOC established in indoor environments as a result of the emissions due to building materials,has been developed ad-hoc. The numerical model developed as part of the Project “BIM4H&W:BIM for Health and Wellbeing” (POR FESR LAZIO 2014/2020—Integrated projects) and presented inanother contribution by the authors in this special issue, it calculates the temporal variation of VOCconcentration as a function of ventilation conditions.
To provide designers with a tool for analysing and comparing design solutions, in a firstinstance, relationships suitable for integration into the BIM process were also extrapolated fromthe aforementioned numerical model. The criterion used for this operation was that of maximumsimplification of the relationships themselves and the use of parameters available in BIM modelling.The developed numerical model estimates the concentration of VOC in the indoor environment throughEquation (1):
VdCind
dt= AER ·V·Cvent −AER ·V·Cind + S (1)
where V [m3] represents the volume of the room considered, Cind [µg/m3] represents the VOCconcentrations in the indoor environment, AER [h−1] represents the air exchange rate, Cvent [µg/m3]

Sustainability 2020, 12, 10417 8 of 31
represents the VOC concentration in the ventilation air, and S [µg/h] represents the hourly VOC flowrate of the sources inside the room.
Wanting to estimate only the contribution to the concentration due to the materials and consideringthe emissions due to them to be constant over time, a hypothesis that can be considered plausible formaterials laid for more than 28 days, the (1) becomes:
dCinddt
=SV−AER·Cind (2)
The (2) allows to obtain the asymptotic value of the concentration that is reached in the indoorenvironment for certain ventilation conditions, that is:
Cind =S
V·AER(3)
This Equation (3) expresses the relationship between the VOC flow rate released into the roomand the ventilation flow rate. The hourly flow thus considered is equivalent to the emission capacity ofthe material over time (ER), defined by the EN16515 standard [48,49].
The aforementioned standard defines the method for estimating the emissions of the variousmaterials following tests carried out in the “chamber test”. In particular, the emissive capacity of thematerial, the emission rate (ER) [µg/h], is expressed as a function of the concentration, CCH [mg/m3],that is established in the air inside the “chamber” with a volume equal to 1 m3 with an Air ExchangeRate, AER [1/h] equal to 0.5 considering 1 m2 of material surface (4):
ER[µg/h] = CCH[µg/m3] · 1 [m3
]· 0.5 [1/h] (4)
Starting from this parameter (4) it is possible to define the area-specific emission capacity orarea-specific emission rate, SER:
SER[µg/
(m2 h
)] = ER [µg/h]/1 [m2
](5)
Using this last parameter (5), the Equation (6) was defined as capable of estimating the concentrationof VOC, Ca, which is reached in a room volume Va, under steady ventilation conditions determined bythe AERa, due to the emissions of an internal source of VOC, consisting of a material, characterised bySERa, and distributed over the surface area As:
Ca =SERa · As
AERa · Va(6)
This report (6) applies what is defined in the EN 16,515 standard relating to ideal reference room,to a real room, in which it is considered a loading factor, La, defined by the ratio between the m2 onwhich the material is present and the m3 of the volume of the room considered, that is (7):
La =As
Va(7)
The Equation (6) can be rewritten as (8):
Ca =SERa·La
AERa(8)
where:
• SERa: area-specific emission rate of the considered material.• As: areal extension of the source characterised by the specific SER.• Va: volume of the room.

Sustainability 2020, 12, 10417 9 of 31
• AERa: air exchange rate.
The Equation (8) can also be written as follows (9):
Ca[µg/m3
]=
(CCH[µg/m3] · 1 [m3]· 0.5 [1/h]/1 [m2
]) · As
[m2
]AERa[1/h] · Va[m3 ]
(9)
This last relationship allows us to calculate the concentration in the room, with defined ventilation,with the emission data of the material as estimated in the test chamber available.
The numerical model thus developed was implemented within the BIM model, and applied to allthe finishes of the rooms/spaces. All the parameters used in the Equation (9) can be obtained from aBIM modelling developed for this purpose.
In Table 4, the parameters of Equation (9) and its transposition in the formulas (10) for inclusionin the BIM environment are explained.
WallCoveringVOCs = WallCoveringVOCsTestChamber·0.5·NetWallAreaMechanicalVentilationRate·NetVolume
FloorCoveringVOCs = FloorCoveringVOCsTestChamber·0.5·NetFloorAreaMechanicalVentilationRate·NetVolume
CeilingCoveringVOCs = CeilingCoveringVOCsTestChamber·0.5·NetCeilingAreaMechanicalVentilationRate·NetVolume
(10)
Table 4. Explanation of parameters and transposition of the Equation (9) within the BIM model.
Parameter Name Parameter Explanation
WallCoveringVOCs CaVOC concentration that is reached in the room due to the
contribution of the wall finishes.
FloorCoveringVOCs CaVOC concentration that is reached in the room due to the
contribution of floor finishes.
CeilingCoveringVOCs CaVOC concentration that is reached in the room due to the
contribution of the false ceiling finishes.
WallCoveringVOCsTestChamber CCH
the concentration of VOCs emitted by the finishing material of thewalls of the room calculated in the test chamber according to
EN16515 standard. 1
FloorCoveringVOCsTestChamber CCH
the concentration of VOCs emitted by the finishing material of thefloors of the room calculated in the test chamber according to
EN16515 standard. 1
CeilingCoveringVOCsTestChamber CCH
the concentration of VOCs emitted by the finishing material of theceilings of the room calculated in the test chamber according to
EN16515 standard. 1
0.5 air exchange rate of the test chamber.
NetWallArea As
the net area of the walls in the room where the emissive material ispresent, characterised by the specific CCH. This value does notinclude the area of windows, doors, glass walls and all finishes
that are composed of non-emissive material. 2
NetFloorArea Asthe net area of the floors present in the room where the emissive
material is present, characterised by the specific CCH. 2
NetCeilingArea Asthe net area of the ceilings present in the room where the emissive
material is present, characterised by the specific CCH. 2
MechanicalVentilationRate AERathe volumes of air changes expressed in 1/h which are established
by the designer for each room based on the intended use.
NetVolume Va
net volume of the room, without considering the thickness of thewalls and the volumes of any structures within the room such as
pillars or shafts.1 This is a value that must be obtained from the technical data sheets provided by the manufacturer; 2 To obtain thisarea, the designer must refer to the quantities that are automatically calculated through the free add-in “RoombookAreabook Buildingbook for Revit” or, only in the case of floors and ceilings, simply using the floor area of the roomautomatically calculated in Autodesk Revit.

Sustainability 2020, 12, 10417 10 of 31
Summing the VOC concentration due to the contribution of all the finishes relating to a room isobtained:
SpaceVOCs = WallCoveringVOCs + FloorCoveringVOCs + CeilingCoveringVOCs (11)
where SpaceVOCs (Ca) represents VOC concentration that is reached in the room due to the contributionof all the present finishes.
A Revit schedule was created to use the numerical model for calculating the VOC concentrationdue to the emission of materials directly within the BIM design software, in this case, Autodesk Revit.
2.4. Model Checker in the BIM Process to Verify Indoor TVOC Emission Related to IAGVs
For the verification of the threshold values of the VOC concentrations due to the materials forevery single room/space of the BIM model, the following formula must be verified:
SpaceVOCs < 50 µg/m3 (12)
The limit value 50 µg/m3 was set based on simulations carried out with the box-model using threetypes of low-emissivity materials: One used in the case study and two others selected from scientificliterature [50]. The emission values of these materials are, respectively: 7.1 µg/m3; 50 µg/m3; 240 µg/m3.These values were compared with the threshold values established by the environmental sustainabilitycertification protocol BREEAM [51] (Basic level 1000 µg/m3; Exemplary Level 300 µg/m3) and withthe limit value defined by the Italian CAM (1500 µg/m3). These emission values were applied in thenumerical mass balance model developed and considering the reference room defined by the EN 16,515standard to evaluate the concertation of TVOC in an indoor environment. The concentration valuesthus obtained were compared with the IAGVs defined by Portugal, equal to the value of 600 µg/m3.In light of the results obtained, it was decided to set the limit on the value of 50 µg/m3 as a precautionarythreshold. This reasoning is because this threshold only considers the concentration of TVOC due tobuilding materials and therefore useful for design purposes, to which the contributions of outdoor air,people, furniture, and cleaning products are added. It was therefore decided to settle on a value ofapproximately 10% of the considered IAGV.
The verification of the parameter, and therefore of the VOC emission to the defined thresholdvalue, is implemented through the creation of a check rule (CheckSet) with “Autodesk Model Checker”.
2.5. Case Study: New Expansion of CNR in Pisa, Italy
The case study selected to develop the proposed workflow and the integration between IAQ andBIM is a recent project by RI.EL.CO IMPIANTI SRL, with which the “Sapienza” University of Romecarried out the research project in partnership of effective collaboration. The building chosen is the newheadquarters of the Institute of Informatics and Telematics (IIT), which is part of the Research Area ofthe C.N.R., in Pisa (IT). The project developed with the raising of a portion of an existing building,defined on a regular modular grid and with a “T”-shaped planimetric development, is divided intothree buildings for a total of about 1400 m2: A (the west wing of the “T”); B (central building), and C(the east wing of “T”). The research project and the contents of this paper focus on building A as acase study (Figure 2). Construction of the building was completed in 2020, and it was inauguratedin February of this year. The preliminary design of the building is by Eng. Ottavio Zirilli (CNR),the executive project was handled by RIELCO Srl (Project Leader Eng. Carmine Rinaldi).
The structure is set on a single floor and built-in CLT (cross laminated timber). The buildinghas a height of about 5.13 m on average compared to the elevation of the existing building roof(quote +9.00 m), with a roof slope of 5%. The design choices were strongly directed towards ahigh level of prefabrication and quality control, particularly attentive to both individual buildingcomponents and overall performance. The internal non-load-bearing divisions are made of doubleplasterboard plate with interposed insulating material. Low-emissivity materials have been chosen for

Sustainability 2020, 12, 10417 11 of 31
the gypsum panels, thermal and acoustic insulators, and all components. The stoneware floors andmetal ceilings also comply with the ISO 14,021 standard and the sustainability principles of the absenceof hazardous emissions and also comply with the requirements of the LEED, BREEAM, and ITACAenvironmental certification protocols. The window frames are thermal break and in wood-aluminiumwith mechanical corner joint without the use of adhesives; other seals are made with neutral silicone.In all three buildings, the central distribution is achieved through the main corridor divided from theoffices by a glass partition wall. In general, all finishing materials such as paints, fillers, and sealantswere chosen according to the sustainability principles suggested by the CAM.
Sustainability 2020, 12, x FOR PEER REVIEW 11 of 32
The HVAC system contains all‐air and is separated for each of the three buildings where heating,
cooling, humidity, and air quality control are carried out through a centralised aeraulic system with
variable flow and heat recovery. Even the air distribution channels have been designed with
particular attention to IAQ and made with sandwich panels consisting of an insulating layer of rigid
polyurethane foam covered on the outside with embossed aluminium sheets and on the inside with
smooth aluminium sheets for better thermal insulation and good hygiene. Inside each room, the air
is introduced through a plenum and then reaches the indoor environment through micro‐perforated
panels in the false ceiling; while the air intake is performed by a series of outlet vents placed on
technical shafts on the side of the entrance doors. The air recovery takes place according to two
configurations: In the summer, the air is drawn in by vents located at 2.6 m from the floor, while in
winter, by those placed at 0.15 m. The technological solutions implemented within the mechanical
systems aim to improve IAQ and have specifically been increased by the installation of additional
class G4 and class F7 filters, by a plasma reactor in the upstream section of the distribution channels
and by UVc germicidal lamp inside each air diffusion plenum.
Figure 2. (a) Axonometry of the existing building and of the elevation; (b) perspective section with
construction details; (c) isometric section with construction details; (d) sections of building A; (e)
photos of the building: an area view from google maps, the interior of an office, and the main corridor.
Figure 2. (a) Axonometry of the existing building and of the elevation; (b) perspective section withconstruction details; (c) isometric section with construction details; (d) sections of building A; (e) photosof the building: an area view from google maps, the interior of an office, and the main corridor.
The HVAC system contains all-air and is separated for each of the three buildings where heating,cooling, humidity, and air quality control are carried out through a centralised aeraulic systemwith variable flow and heat recovery. Even the air distribution channels have been designed with

Sustainability 2020, 12, 10417 12 of 31
particular attention to IAQ and made with sandwich panels consisting of an insulating layer of rigidpolyurethane foam covered on the outside with embossed aluminium sheets and on the inside withsmooth aluminium sheets for better thermal insulation and good hygiene. Inside each room, the air isintroduced through a plenum and then reaches the indoor environment through micro-perforatedpanels in the false ceiling; while the air intake is performed by a series of outlet vents placed ontechnical shafts on the side of the entrance doors. The air recovery takes place according to twoconfigurations: In the summer, the air is drawn in by vents located at 2.6 m from the floor, while inwinter, by those placed at 0.15 m. The technological solutions implemented within the mechanicalsystems aim to improve IAQ and have specifically been increased by the installation of additional classG4 and class F7 filters, by a plasma reactor in the upstream section of the distribution channels and byUVc germicidal lamp inside each air diffusion plenum.
In particular, building A, chosen as a case study, consists of eight offices, a meeting and conferenceroom, a storage room, an archive, and the toilets (Figure 3). The graphic drawings shown weredeveloped by RIELCO IMPIANTI S.r.l. and extracts from the BIM model of the building.
Sustainability 2020, 12, x FOR PEER REVIEW 12 of 32
In particular, building A, chosen as a case study, consists of eight offices, a meeting and
conference room, a storage room, an archive, and the toilets (Figure 3). The graphic drawings shown
were developed by RIELCO IMPIANTI S.r.l. and extracts from the BIM model of the building.
Figure 3. Plan of the case study: Building A, the new expansion of the CNR of Pisa.
3. Results
The following section shows the results of research, divided into four areas: (i) IAQ parameters
to be implemented in BIM process Revit‐based and compliant with IFC schema; (ii) automatised
process to apply the shared parameters to BIM elements; (iii) BIM to integrate VOC prediction model
for BIM elements in rooms category; (iv) model checker in BIM process to verify indoor VOC emission
related to IAGVs.
3.1. IAQ Parameters to be Implemented in the BIM Process Revit‐Based and Compliant with IFC Schema
Once the parameters necessary for the implementation of the analysis of VOC emission
workflow have been elaborated, as consistent as possible with the IFC scheme as explained in the
methods section, we proceeded with their implementation in the BIM environment, within the model
developed with BIM Authoring Autodesk Revit. In Autodesk Revit, the procedure for inserting
parameters to BIM elements that can be reused on different projects involves the use of the “shared
parameters” command. It is possible to create a list of “shared parameters” written within a file in
.txt format that can subsequently be used to insert the same parameter structure within a BIM model
or a BIM element (parametric family).
Autodesk provides free to its users an already pre‐compiled .txt file of “shared parameters”,
containing all the IFC standard parameters, called “Shared Parameters IFC‐RevitIFCBuiltIn_ALL.txt”
[52]. It is also possible to create a self‐customised .txt file but following the formatting specifications
of the IFC parameters. By subsequently assigning these “shared parameters” to the correct Revit
family categories within the “IFC parameters” parameter group, it is possible to export a file in IFC
format from Autodesk Revit that has the parameter consistent with the IFC scheme. However, it is
necessary to underline that two “shared parameters” that have been inserted in a BIM model
developed in Autodesk Revit using two .txt files created by two different authors cannot be
considered the same by the Revit software even if they have exactly the same name.
Then, the research deals with the creation of a new “shared parameters” .txt file specific for the
VOC emission analysis workflow; this file will be named “Shared Parameters‐BIM4H&W.txt” (Figure
4). The following corrective actions have been implemented to resolve some critical issues relating to
the entry of parameters for the openBIM standard in the Revit environment:
Figure 3. Plan of the case study: Building A, the new expansion of the CNR of Pisa.
3. Results
The following section shows the results of research, divided into four areas: (i) IAQ parameters tobe implemented in BIM process Revit-based and compliant with IFC schema; (ii) automatised processto apply the shared parameters to BIM elements; (iii) BIM to integrate VOC prediction model for BIMelements in rooms category; (iv) model checker in BIM process to verify indoor VOC emission relatedto IAGVs.
3.1. IAQ Parameters to Be Implemented in the BIM Process Revit-Based and Compliant with IFC Schema
Once the parameters necessary for the implementation of the analysis of VOC emission workflowhave been elaborated, as consistent as possible with the IFC scheme as explained in the methodssection, we proceeded with their implementation in the BIM environment, within the model developedwith BIM Authoring Autodesk Revit. In Autodesk Revit, the procedure for inserting parameters toBIM elements that can be reused on different projects involves the use of the “shared parameters”command. It is possible to create a list of “shared parameters” written within a file in .txt format thatcan subsequently be used to insert the same parameter structure within a BIM model or a BIM element(parametric family).

Sustainability 2020, 12, 10417 13 of 31
Autodesk provides free to its users an already pre-compiled .txt file of “sharedparameters”, containing all the IFC standard parameters, called “Shared ParametersIFC-RevitIFCBuiltIn_ALL.txt” [52]. It is also possible to create a self-customised .txt file but following theformatting specifications of the IFC parameters. By subsequently assigning these “shared parameters”to the correct Revit family categories within the “IFC parameters” parameter group, it is possible toexport a file in IFC format from Autodesk Revit that has the parameter consistent with the IFC scheme.However, it is necessary to underline that two “shared parameters” that have been inserted in a BIMmodel developed in Autodesk Revit using two .txt files created by two different authors cannot beconsidered the same by the Revit software even if they have exactly the same name.
Then, the research deals with the creation of a new “shared parameters” .txt file specific forthe VOC emission analysis workflow; this file will be named “Shared Parameters-BIM4H&W.txt”(Figure 4). The following corrective actions have been implemented to resolve some critical issuesrelating to the entry of parameters for the openBIM standard in the Revit environment:
1. A new “shared parameter” is created with the name “MechanicalVentilationRate” and set as thedata type “Number”;
2. The “IfcQtyNetWallArea”, “IfcQtyNetCeilingArea” and “IfcQtyNetVolume” parameters in theofficial txt file “IFC Shared Parameters-RevitIFCBuiltIn_ALL.txt” are copied into the new file“Shared Parameters-BIM4H & W.txt” paying particular attention to copy the same GUID code(the unique ID consisting of 36 characters) of the official “shared parameter”;
3. No further “shared parameter” called “NetFloorArea” will be added, but the “Area” parameterof the “Rooms” category already present by default in Autodesk Revit will be used.
Sustainability 2020, 12, x FOR PEER REVIEW 14 of 32
Figure 4. File “Shared Parameters‐BIM4H&W.txt”.
3.2. Automatised Process to Apply the Shared Parameters to BIM Elements
3.2.1. Automated Parameter Entry
The process of entering the shared parameters was automated through the use of the
ParaManager add‐in. The use of this tool has brought the advantage of assigning numerous
parameters to multiple categories of BIM elements simultaneously (Figure 5), reducing the risk of
error in a manual procedure made by the operator. Furthermore, it was possible to create and save
groups of categories of BIM elements to which shared parameters can be assigned (Figure 6).
Figure 5. Creating multiple shared parameters at the same time within ParaManager add‐in.
Figure 6. Creation of the “BIM4H&W_Materials” category group that allows us to assign the shared
parameters relating to the categories of Materials more quickly within ParaManager add‐in.
Figure 4. File “Shared Parameters-BIM4H&W.txt”.
The above critical issues are dealt with in detail in the discussion section (see Section 4.2). The .txtfile of the “shared parameters” “Shared Parameters-BIM4H & W.txt” is therefore composed of theparameters listed in Table 5.
Table 5. Shared parameters present in the “Shared Parameters-BIM4H&W.txt” file.
Parameter Name DataType
GroupName Description Already Present in
“RevitIFCBuiltIn_ALL.txt”
VOCsEmission Number Materials Quantity of VOCs emissions forelements. Unit of measure µg/m3 No
VOCsEmissionCAM Number MaterialsCAM limit of the quantity of VOCs
emissions for elements. Unit ofmeasure µg/m3
No
SpaceVOCs Number Spaces VOCs presence inside the space.Unit of measure µg/m3 No
WallCoveringVOCsTestChamber Number SpacesVOCs Test Chamber Concentrationof wall finish inside the space. Unit
of measure µg/m3No
FloorCoveringVOCsTestChamber Number SpacesVOCs Test Chamber Concentrationof floor finish inside the space. Unit
of measure µg/m3No
CeilingCoveringVOCsTestChamber Number SpacesVOCs Test Chamber Concentration
of ceiling finish inside the space.Unit of measure µg/m3
No

Sustainability 2020, 12, 10417 14 of 31
Table 5. Cont.
Parameter Name DataType
GroupName Description Already Present in
“RevitIFCBuiltIn_ALL.txt”
WallCoveringVOCs Number SpacesVOCs Concentration of wall finishinside the space. Unit of measure
µg/m3No
FloorCoveringVOCs Number SpacesVOCs Concentration of floor finishinside the space. Unit of measure
µg/m3No
CeilingCoveringVOCs Number SpacesVOCs Concentration of ceiling finish
inside the space. Unit of measureµg/m3
No
MechanicalVentilationRate Number SpacesIndication of the requirement of a
particular mechanical air ventilationrate, given in air changes per hour
No
IfcQtyNetWallArea Area Spaces
Sum of all wall (and other verticallybounding elements, like columns)
areas bounded by the space. Itexcludes the area covered by
elements inside the wall area (doors,windows, other openings, etc.).
Yes
IfcQtyNetCeilingArea Area Spaces
Sum of all ceiling areas of the space.It excludes the area covered by
elements inside the space (columns,inner walls, etc.). The ceiling area isthe real (and not the projected) area
(e.g., in case of sloped ceilings).
Yes
IfcQtyNetVolume Volume SpacesNet volume enclosed by the space,
excluding the volume of constructionelements inside the space.
Yes
3.2. Automatised Process to Apply the Shared Parameters to BIM Elements
3.2.1. Automated Parameter Entry
The process of entering the shared parameters was automated through the use of the ParaManageradd-in. The use of this tool has brought the advantage of assigning numerous parameters to multiplecategories of BIM elements simultaneously (Figure 5), reducing the risk of error in a manual proceduremade by the operator. Furthermore, it was possible to create and save groups of categories of BIMelements to which shared parameters can be assigned (Figure 6).
A spreadsheet was created to optimise the process and to better manage the insertion ofparameters. This sheet can then be reused to automatically recreate the same mapping in a futureproject. The parameters entered in the spreadsheet (Table 6) are the same that are also present in the“Shared Parameters-BIM4H&W.txt” file (Figure 4).
Sustainability 2020, 12, x FOR PEER REVIEW 14 of 32
Figure 4. File “Shared Parameters‐BIM4H&W.txt”.
3.2. Automatised Process to Apply the Shared Parameters to BIM Elements
3.2.1. Automated Parameter Entry
The process of entering the shared parameters was automated through the use of the
ParaManager add‐in. The use of this tool has brought the advantage of assigning numerous
parameters to multiple categories of BIM elements simultaneously (Figure 5), reducing the risk of
error in a manual procedure made by the operator. Furthermore, it was possible to create and save
groups of categories of BIM elements to which shared parameters can be assigned (Figure 6).
Figure 5. Creating multiple shared parameters at the same time within ParaManager add‐in.
Figure 6. Creation of the “BIM4H&W_Materials” category group that allows us to assign the shared
parameters relating to the categories of Materials more quickly within ParaManager add‐in.
Figure 5. Creating multiple shared parameters at the same time within ParaManager add-in.

Sustainability 2020, 12, 10417 15 of 31
Sustainability 2020, 12, x FOR PEER REVIEW 14 of 32
Figure 4. File “Shared Parameters‐BIM4H&W.txt”.
3.2. Automatised Process to Apply the Shared Parameters to BIM Elements
3.2.1. Automated Parameter Entry
The process of entering the shared parameters was automated through the use of the
ParaManager add‐in. The use of this tool has brought the advantage of assigning numerous
parameters to multiple categories of BIM elements simultaneously (Figure 5), reducing the risk of
error in a manual procedure made by the operator. Furthermore, it was possible to create and save
groups of categories of BIM elements to which shared parameters can be assigned (Figure 6).
Figure 5. Creating multiple shared parameters at the same time within ParaManager add‐in.
Figure 6. Creation of the “BIM4H&W_Materials” category group that allows us to assign the shared
parameters relating to the categories of Materials more quickly within ParaManager add‐in.
Figure 6. Creation of the “BIM4H&W_Materials” category group that allows us to assign the sharedparameters relating to the categories of Materials more quickly within ParaManager add-in.
Table 6. Parameters included in the Autodesk Revit BIM model through ParaManager.
Parameter Name Discipline Type of Parameter Group Instance/Type Categories
VOCsEmission Common Number IFC Parameters Instance (2)VOCsEmissionCAM Common Number IFC Parameters Instance (2)
MechanicalVentilationRate Common Integer IFC Parameters Instance (1)SpaceVOCs Common Number IFC Parameters Instance (1)
WallCoveringVOCsTestChamber Common Number IFC Parameters Instance (1)FloorCoveringVOCsTestChamber Common Number IFC Parameters Instance (1)CeilingCoveringVOCsTestChamber Common Number IFC Parameters Instance (1)
WallCoveringVOCs Common Number IFC Parameters Instance (1)FloorCoveringVOCs Common Number IFC Parameters Instance (1)
CeilingCoveringVOCs Common Number IFC Parameters Instance (1)MechanicalVentilationRate Common Integer IFC Parameters Instance (1)
IfcQtyNetWallArea Common Area IFC Parameters Instance (1)IfcQtyNetCeilingArea Common Area IFC Parameters Instance (1)
IfcQtyNetVolume Common Volume IFC Parameters Instance (1)
(1) Areas, Rooms, Spaces, System-Zones; (2) Casework, Ceilings, Columns, Curtain Panels, Curtain Wall Mullions,Doors, Floors, Furniture, Furniture Systems, Generic Models, Materials, Railings, Roofs, Stairs, Structural Columns,Structural Framing, Walls, Windows.
3.2.2. Model Checking for the Material Parameters
Thus, after the filling of the proper parameters, it is possible to apply the triple check, exposed inmethodology (§ 2.2). A “Checkset” for appropriate presence, filling, and value in parameters (Figure 7)has been created in .xml format, a set of control rules, specific for the VOC emission analysis workflow.
The “BIM4H&W.xml” file contains Checksets that can be used in all BIM modelsdeveloped in Autodesk Revit and that have previously entered the shared parameters of the“Shared Parameters-BIM4H&W.txt” file.
Containing all the necessary rules for the BIM4H&W workflow, the Checkset is organised insections, so the user can activate the controls step by step.
Sets of rules have been created within the section called “Materials” to control the parametersrelated to materials, so the user can click on the “Setup” command and decide to activate only thechecks on materials (Figure 8).

Sustainability 2020, 12, 10417 16 of 31
Sustainability 2020, 12, x FOR PEER REVIEW 16 of 32
Figure 7. General settings of the checkset created specifically for the verification of the BIM4H&W
parameters.
Figure 8. Activation of the control rules relating to the materials of the BIM model only.
The first rule verifies the actual existence in the model of the BIM4H&W parameters assigned to
the materials. The parameters that must be assigned to the materials are VOCsEmission and
VOCsEmissionCAM. The second rule verifies the compilation with a value of the BIM4H&W
parameters assigned to the materials. The third rule verifies that the values of the pollutants emitted
by the materials are within the limit established by the CAM (Criteri Ambientali Minimi).
Precisely for this reason, specific parameters have been included within the model that indicates
the maximum emission limit of that material according to the CAM (VOCsEmissionCAM).
In this specific case, the TVOC emission for each material must be less than 1500 μg/m3 (Italian
Ministerial Decree of 11 October 2017). Figure 9 shows, by way of example, the syntax of the control
rule for the “VOCsEmission” parameter.
Figure 7. General settings of the checkset created specifically for the verification of the BIM4H&W parameters.
Sustainability 2020, 12, x FOR PEER REVIEW 16 of 32
Figure 7. General settings of the checkset created specifically for the verification of the BIM4H&W
parameters.
Figure 8. Activation of the control rules relating to the materials of the BIM model only.
The first rule verifies the actual existence in the model of the BIM4H&W parameters assigned to
the materials. The parameters that must be assigned to the materials are VOCsEmission and
VOCsEmissionCAM. The second rule verifies the compilation with a value of the BIM4H&W
parameters assigned to the materials. The third rule verifies that the values of the pollutants emitted
by the materials are within the limit established by the CAM (Criteri Ambientali Minimi).
Precisely for this reason, specific parameters have been included within the model that indicates
the maximum emission limit of that material according to the CAM (VOCsEmissionCAM).
In this specific case, the TVOC emission for each material must be less than 1500 μg/m3 (Italian
Ministerial Decree of 11 October 2017). Figure 9 shows, by way of example, the syntax of the control
rule for the “VOCsEmission” parameter.
Figure 8. Activation of the control rules relating to the materials of the BIM model only.
The first rule verifies the actual existence in the model of the BIM4H&W parameters assignedto the materials. The parameters that must be assigned to the materials are VOCsEmission andVOCsEmissionCAM. The second rule verifies the compilation with a value of the BIM4H&W parametersassigned to the materials. The third rule verifies that the values of the pollutants emitted by thematerials are within the limit established by the CAM (Criteri Ambientali Minimi).
Precisely for this reason, specific parameters have been included within the model that indicatesthe maximum emission limit of that material according to the CAM (VOCsEmissionCAM).

Sustainability 2020, 12, 10417 17 of 31
In this specific case, the TVOC emission for each material must be less than 1500 µg/m3(Italian Ministerial Decree of 11 October 2017). Figure 9 shows, by way of example, the syntaxof the control rule for the “VOCsEmission” parameter.Sustainability 2020, 12, x FOR PEER REVIEW 17 of 32
Figure 9. “Advanced Check Builder” screen for the “Materials: VOCsEmission Exist” rule (above).
“Advanced Check Builder” screen for the “Materials: VOCsEmission Have Value” rule (centre).
“Advanced Check Builder” screen for the “Materials: VOCsEmission CAM Compliant” rule (below).
Through the use of the Model Checking and the rules settled (Figure 10), it is possible to have
immediate feedback not only on the correct insertion and compilation of the parameters but also on
the design choices regarding the materials used that may not be consistent with the performance
required by the CAM concerning polluting emissions.
Figure 9. “Advanced Check Builder” screen for the “Materials: VOCsEmission Exist” rule (above).“Advanced Check Builder” screen for the “Materials: VOCsEmission Have Value” rule (centre).“Advanced Check Builder” screen for the “Materials: VOCsEmission CAM Compliant” rule (below).

Sustainability 2020, 12, 10417 18 of 31
Through the use of the Model Checking and the rules settled (Figure 10), it is possible to haveimmediate feedback not only on the correct insertion and compilation of the parameters but also on thedesign choices regarding the materials used that may not be consistent with the performance requiredby the CAM concerning polluting emissions.Sustainability 2020, 12, x FOR PEER REVIEW 18 of 32
Figure 10. Screenshot of the report implemented on the BIM model in which all materials have VOC
emission values below the limit identified in the CAM (a); Screenshot of the report implemented on
the BIM model in which an example material exceeds the limit identified in the minimum
environmental criteria (CAM) (b).
3.3. BIM to Integrate VOC Prediction Model for BIM Elements in Rooms Category
3.3.1. Box‐Model Using a Mass Balance Approach
The box‐model was applied to all the rooms in Building A, considering only the finishing
material as an internal source, and estimating the asymptotic concentration that is reached for
nominal or project ventilation conditions. Table 7 shows the values calculated with the box‐model for
the different rooms considered.
Table 7. VOC parameters and concentrations in the different rooms calculated with the box‐model.
Room Volume Air
Flow
Air
Changes
Emissive
Surface
Loading
Factor SER
VOC
Concentration
m3 m3/h 1/h m2 m2/m3 μg/m2
h μg/m3
B2A2‐1 office 3 60 205 3.4 38.06 0.634 3.55 0.65909
B2A2‐2 meeting
room 280 950 3.4 65.72 0.235 3.55 0.24559
B2A2‐3 closet 15 68 4.5 25.41 1.694 3.55 1.32655
B2A2‐4 office 5 28 115 4.1 27.13 0.969 3.55 0.83749
B2A2‐5 office 6 42 185 4.4 31.27 0.745 3.55 0.60005
B2A2‐6 office 7 33 115 3.5 28.45 0.862 3.55 0.87824
B2A2‐7 office
8‐9 70 270 3.9 37.25 0.532 3.55 0.48977
B2A2‐8 office
10 35 135 3.9 29.19 0.834 3.55 0.76759
B2A2‐9 office
11 46 160 3.5 32.21 0.700 3.55 0.71466
B2A2‐
10 archive 16 68 4.3 25.91 1.619 3.55 1.35265
corrido
r
corrido
r 140 313 2.2 27.51 0.197 3.55 0.31201
Figure 10. Screenshot of the report implemented on the BIM model in which all materials have VOCemission values below the limit identified in the CAM (a); Screenshot of the report implemented on theBIM model in which an example material exceeds the limit identified in the minimum environmentalcriteria (CAM) (b).
3.3. BIM to Integrate VOC Prediction Model for BIM Elements in Rooms Category
3.3.1. Box-Model Using a Mass Balance Approach
The box-model was applied to all the rooms in Building A, considering only the finishing materialas an internal source, and estimating the asymptotic concentration that is reached for nominal orproject ventilation conditions. Table 7 shows the values calculated with the box-model for the differentrooms considered.
Table 7. VOC parameters and concentrations in the different rooms calculated with the box-model.
Room Volume Air Flow AirChanges
EmissiveSurface
LoadingFactor SER VOC
Concentration
m3 m3/h 1/h m2 m2/m3 µg/m2h µg/m3
B2A2-1 office 3 60 205 3.4 38.06 0.634 3.55 0.65909B2A2-2 meeting room 280 950 3.4 65.72 0.235 3.55 0.24559B2A2-3 closet 15 68 4.5 25.41 1.694 3.55 1.32655B2A2-4 office 5 28 115 4.1 27.13 0.969 3.55 0.83749B2A2-5 office 6 42 185 4.4 31.27 0.745 3.55 0.60005B2A2-6 office 7 33 115 3.5 28.45 0.862 3.55 0.87824B2A2-7 office 8-9 70 270 3.9 37.25 0.532 3.55 0.48977B2A2-8 office 10 35 135 3.9 29.19 0.834 3.55 0.76759B2A2-9 office 11 46 160 3.5 32.21 0.700 3.55 0.71466
B2A2-10 archive 16 68 4.3 25.91 1.619 3.55 1.35265corridor corridor 140 313 2.2 27.51 0.197 3.55 0.31201

Sustainability 2020, 12, 10417 19 of 31
3.3.2. Integration of the Box-Model in a BIM Environment
To set up an automatic calculation within the BIM authoring Autodesk Revit, a schedule (Figure 11)was set up of all the BIM elements in the Rooms category with a succession of “calculated parameters”also called “calculated values”.
Sustainability 2020, 12, x FOR PEER REVIEW 19 of 32
3.3.2. Integration of the Box‐Model in a BIM Environment
To set up an automatic calculation within the BIM authoring Autodesk Revit, a schedule (Figure
11) was set up of all the BIM elements in the Rooms category with a succession of “calculated
parameters” also called “calculated values”.
Figure 11. Schedule within Autodesk Revit that allows the application of the box‐model to calculate
the concentration of VOCs present in a room due to the presence of emissive finishing materials.
Above the complete schedule with walls, floors, ceilings, and rooms VOCs parameters, below the part
with only the wall and room VOCs parameters.
First, it was necessary to fill the parameters that must contain project values:
MechanicalVentilationRate: The number of air changes required in the mechanical ventilation
design.
WallConveringVOCsTestChamber, FloorConveringVOCsTestChamber, Ceiling‐
ConveringVOCsTestChamber: The concentration value, CCH [μg/m3], in the air inside the “test
chamber”, which can be found in the technical data sheets of the material.
In the case study, the only finish that has an emissive material is that of the walls, while floors
and false ceilings have no emissive materials and their CCH [μg/m3] is zero.
Subsequently, the net finishing area of the walls of all the rooms was entered in the
“IfcQtyNetWallArea” parameter using the free add‐in “Roombook Areabook Buildingbook for
Revit”, which allows us to extrapolate the side surfaces of the rooms by subtracting the area of doors
and windows.
Finally, the calculated parameters are added using the Equations (10) explained in the method
section. Figure 12 shows the syntax used for the formulation must be compiled within the calculated
value “WallCoveringVOCs. The suffix “_C” indicates that they are calculated values.
Figure 11. Schedule within Autodesk Revit that allows the application of the box-model to calculate theconcentration of VOCs present in a room due to the presence of emissive finishing materials. Above thecomplete schedule with walls, floors, ceilings, and rooms VOCs parameters, below the part with onlythe wall and room VOCs parameters.
First, it was necessary to fill the parameters that must contain project values:
• MechanicalVentilationRate: The number of air changes required in the mechanicalventilation design.
• WallConveringVOCsTestChamber, FloorConveringVOCsTestChamber, Ceiling-ConveringVOCsTestChamber: The concentration value, CCH [µg/m3], in the air inside the “test chamber”, which canbe found in the technical data sheets of the material.
In the case study, the only finish that has an emissive material is that of the walls, while floors andfalse ceilings have no emissive materials and their CCH [µg/m3] is zero.
Subsequently, the net finishing area of the walls of all the rooms was entered in the“IfcQtyNetWallArea” parameter using the free add-in “Roombook Areabook Buildingbook for Revit”,which allows us to extrapolate the side surfaces of the rooms by subtracting the area of doorsand windows.
Finally, the calculated parameters are added using the Equations (10) explained in the methodsection. Figure 12 shows the syntax used for the formulation must be compiled within the calculatedvalue “WallCoveringVOCs. The suffix “_C” indicates that they are calculated values.

Sustainability 2020, 12, 10417 20 of 31Sustainability 2020, 12, x FOR PEER REVIEW 20 of 32
Figure 12. Setting for the calculated parameter “WallCoveringVOCs_C” in a Revit schedule.
We are forced to use calculated parameters because in Autodesk Revit it is not possible to create
a calculated parameter starting from a shared parameter.
We can then copy the values of the calculated parameters within the respective shared
parameters and the BuiltIn Revit parameters in the corresponding shared parameters with the IFC
standard nomenclature (13):
𝑊𝑎𝑙𝑙𝐶𝑜𝑣𝑒𝑟𝑖𝑛𝑔𝑉𝑂𝐶𝑠_𝐶 𝑊𝑎𝑙𝑙𝐶𝑜𝑣𝑒𝑟𝑖𝑛𝑔𝑉𝑂𝐶𝑠
𝐹𝑙𝑜𝑜𝑟𝐶𝑜𝑣𝑒𝑟𝑖𝑛𝑔𝑉𝑂𝐶𝑠_𝐶 𝐹𝑙𝑜𝑜𝑟𝐶𝑜𝑣𝑒𝑟𝑖𝑛𝑔𝑉𝑂𝐶𝑠
𝐶𝑒𝑖𝑙𝑖𝑛𝑔𝐶𝑜𝑣𝑒𝑟𝑖𝑛𝑔𝑉𝑂𝐶𝑠_𝐶 𝐶𝑒𝑖𝑙𝑖𝑛𝑔𝐶𝑜𝑣𝑒𝑟𝑖𝑛𝑔𝑉𝑂𝐶𝑠
𝑆𝑝𝑎𝑐𝑒𝑉𝑂𝐶𝑠_𝐶 𝑆𝑝𝑎𝑐𝑒𝑉𝑂𝐶𝑠
𝑉𝑜𝑙𝑢𝑚𝑒 𝐼𝑓𝑐𝑄𝑡𝑦𝑁𝑒𝑡𝑉𝑜𝑙𝑢𝑚𝑒
(13)
The BuiltIn Revit “Area” parameter is automatically written to the standard of “NetFloorArea”
parameter. This last activity of copy/paste values has the sole purpose of being able to export an IFC
file from Revit containing the parameters of the BIMH&W workflow and consistent with the IFC4.1
international schema.
To copy the values from one parameter to another, a script was developed in Dynamo (Figure
13) to automate the process and avoid possible user distraction errors. The IFC export settings from
Revit that guarantee the correct writing of the parameters are the following: IFC4 Reference View;
Export IFC common property sets; Export base quantities. Table 8 shows the calculated values for the
rooms of the BIM model developed in Autodesk Revit.
Figure 13. Dynamo script to copy the calculated values “SpaceVOCs_C” present in a schedule in the
corresponding shared parameters “SpaceVOCs” assigned to the project rooms.
Figure 12. Setting for the calculated parameter “WallCoveringVOCs_C” in a Revit schedule.
We are forced to use calculated parameters because in Autodesk Revit it is not possible to create acalculated parameter starting from a shared parameter.
We can then copy the values of the calculated parameters within the respective shared parametersand the BuiltIn Revit parameters in the corresponding shared parameters with the IFC standardnomenclature (13):
WallCoveringVOCs_C = WallCoveringVOCs
FloorCoveringVOCs_C = FloorCoveringVOCs
CeilingCoveringVOCs_C = CeilingCoveringVOCs
SpaceVOCs_C = SpaceVOCs
Volume = I f cQtyNetVolume
(13)
The BuiltIn Revit “Area” parameter is automatically written to the standard of “NetFloorArea”parameter. This last activity of copy/paste values has the sole purpose of being able to export an IFCfile from Revit containing the parameters of the BIMH&W workflow and consistent with the IFC4.1international schema.
To copy the values from one parameter to another, a script was developed in Dynamo (Figure 13)to automate the process and avoid possible user distraction errors. The IFC export settings from Revitthat guarantee the correct writing of the parameters are the following: IFC4 Reference View; Export IFCcommon property sets; Export base quantities. Table 8 shows the calculated values for the rooms of theBIM model developed in Autodesk Revit.
Sustainability 2020, 12, x FOR PEER REVIEW 20 of 32
Figure 12. Setting for the calculated parameter “WallCoveringVOCs_C” in a Revit schedule.
We are forced to use calculated parameters because in Autodesk Revit it is not possible to create
a calculated parameter starting from a shared parameter.
We can then copy the values of the calculated parameters within the respective shared
parameters and the BuiltIn Revit parameters in the corresponding shared parameters with the IFC
standard nomenclature (13):
𝑊𝑎𝑙𝑙𝐶𝑜𝑣𝑒𝑟𝑖𝑛𝑔𝑉𝑂𝐶𝑠_𝐶 𝑊𝑎𝑙𝑙𝐶𝑜𝑣𝑒𝑟𝑖𝑛𝑔𝑉𝑂𝐶𝑠
𝐹𝑙𝑜𝑜𝑟𝐶𝑜𝑣𝑒𝑟𝑖𝑛𝑔𝑉𝑂𝐶𝑠_𝐶 𝐹𝑙𝑜𝑜𝑟𝐶𝑜𝑣𝑒𝑟𝑖𝑛𝑔𝑉𝑂𝐶𝑠
𝐶𝑒𝑖𝑙𝑖𝑛𝑔𝐶𝑜𝑣𝑒𝑟𝑖𝑛𝑔𝑉𝑂𝐶𝑠_𝐶 𝐶𝑒𝑖𝑙𝑖𝑛𝑔𝐶𝑜𝑣𝑒𝑟𝑖𝑛𝑔𝑉𝑂𝐶𝑠
𝑆𝑝𝑎𝑐𝑒𝑉𝑂𝐶𝑠_𝐶 𝑆𝑝𝑎𝑐𝑒𝑉𝑂𝐶𝑠
𝑉𝑜𝑙𝑢𝑚𝑒 𝐼𝑓𝑐𝑄𝑡𝑦𝑁𝑒𝑡𝑉𝑜𝑙𝑢𝑚𝑒
(13)
The BuiltIn Revit “Area” parameter is automatically written to the standard of “NetFloorArea”
parameter. This last activity of copy/paste values has the sole purpose of being able to export an IFC
file from Revit containing the parameters of the BIMH&W workflow and consistent with the IFC4.1
international schema.
To copy the values from one parameter to another, a script was developed in Dynamo (Figure
13) to automate the process and avoid possible user distraction errors. The IFC export settings from
Revit that guarantee the correct writing of the parameters are the following: IFC4 Reference View;
Export IFC common property sets; Export base quantities. Table 8 shows the calculated values for the
rooms of the BIM model developed in Autodesk Revit.
Figure 13. Dynamo script to copy the calculated values “SpaceVOCs_C” present in a schedule in the
corresponding shared parameters “SpaceVOCs” assigned to the project rooms.
Figure 13. Dynamo script to copy the calculated values “SpaceVOCs_C” present in a schedule in thecorresponding shared parameters “SpaceVOCs” assigned to the project rooms.

Sustainability 2020, 12, 10417 21 of 31
Table 8. VOC concentrations calculated with the box-model implemented within the BIM authoring Autodesk Revit.
Room NetVolume
MechanicalVentilation
RateNetWallArea
WallCoveringVOCs
TestChamber
WallCoveringVOCs SpaceVOCs
m3 1/h m2 µg/m3 µg/m3 µg/m3
B2A2-1 office 3 60.097 3.4 40.76 7.1 0.708155 0.708155B2A2-2 meeting 276.426 3.6 97.29 7.1 0.347069 0.347069B2A2-3 closet 14.245 4.3 25.41 7.1 1.47268 1.47268B2A2-4 office 5 28.390 4 28.61 7.1 0.894365 0.894365B2A2-5 office 6 42.156 4.3 33.60 7.1 0.658017 0.658017B2A2-6 office 7 32.548 3.4 30.19 7.1 0.968483 0.968483B2A2-7 office 8-9 70.843 3.9 40.98 7.1 0.526552 0.526552B2A2-8 office 10 34.828 3.9 31.07 7.1 0.81204 0.81204B2A2-9 office 11 44.811 3.5 34.70 7.1 0.785434 0.785434B2A2-10 archive 14.969 3.8 25.91 7.1 1.616995 1.616995corridor corridor 140.690 3.2 51.71 7.1 0.407746 0.407746
3.3.3. Comparison between Box-Model and Its Application in BIM
The graph in Figure 14 compares the concentration values obtained using box-model and theBIM process. The values are evidently in excellent agreement as proof of the correct implementationof box-model in the BIM process. It is possible to notice that the concentration values automaticallycalculated within the BIM are slightly higher. This depends on the ability of this modelling to considerin a more detailed and precise way the constructive characteristics of the environments, such asthe surfaces, which contribute to determining the emissions and therefore the concentration in theenvironments themselves.
Sustainability 2020, 12, x FOR PEER REVIEW 21 of 32
Table 8. VOC concentrations calculated with the box‐model implemented within the BIM authoring
Autodesk Revit.
Room Net
Volume
Mechanical
Ventilation
Rate
NetWallArea
WallCovering
VOCs
TestChamber
WallCovering
VOCs SpaceVOCs
m3 1/h m2 μg/m3 μg/m3 μg/m3
B2A2‐1 office 3 60.097 3.4 40.76 7.1 0.708155 0.708155
B2A2‐2 meeting 276.426 3.6 97.29 7.1 0.347069 0.347069
B2A2‐3 closet 14.245 4.3 25.41 7.1 1.47268 1.47268
B2A2‐4 office 5 28.390 4 28.61 7.1 0.894365 0.894365
B2A2‐5 office 6 42.156 4.3 33.60 7.1 0.658017 0.658017
B2A2‐6 office 7 32.548 3.4 30.19 7.1 0.968483 0.968483
B2A2‐7 office 8‐9 70.843 3.9 40.98 7.1 0.526552 0.526552
B2A2‐8 office 10 34.828 3.9 31.07 7.1 0.81204 0.81204
B2A2‐9 office 11 44.811 3.5 34.70 7.1 0.785434 0.785434
B2A2‐10 archive 14.969 3.8 25.91 7.1 1.616995 1.616995
corridor corridor 140.690 3.2 51.71 7.1 0.407746 0.407746
3.3.3. Comparison between Box‐Model and Its Application in BIM
The graph in Figure 14 compares the concentration values obtained using box‐model and the
BIM process. The values are evidently in excellent agreement as proof of the correct implementation
of box‐model in the BIM process. It is possible to notice that the concentration values automatically
calculated within the BIM are slightly higher. This depends on the ability of this modelling to consider
in a more detailed and precise way the constructive characteristics of the environments, such as the
surfaces, which contribute to determining the emissions and therefore the concentration in the
environments themselves.
Figure 14. VOC concentrations simulated with the box‐model using mass balance approach (MB‐
model—in yellow) and by implementing it in the BIM process (BIM‐model—in black).
3.4. Model Checker in the BIM Process to Verify Indoor VOC Concentration Related to IAGVs
Similarly to the check procedure implemented for the parameters assigned to the materials of
the BIM model, the correct insertion of the parameters assigned to the rooms/spaces of the BIM model
is carried out.
0.0
0.2
0.4
0.6
0.8
1.0
1.2
1.4
1.6
1.8
VOC Concentration [μg/m
3 ]
VOC_MB‐model VOC_BIM‐model
Figure 14. VOC concentrations simulated with the box-model using mass balance approach(MB-model—in yellow) and by implementing it in the BIM process (BIM-model—in black).
3.4. Model Checker in the BIM Process to Verify Indoor VOC Concentration Related to IAGVs
Similarly to the check procedure implemented for the parameters assigned to the materials of theBIM model, the correct insertion of the parameters assigned to the rooms/spaces of the BIM model iscarried out.
The verification that the parameter SpaceVOCs is < 50 µg/m3 is implemented, as shown inFigure 15, through the code of a check rule with “Autodesk Model Checker”, similarly to the previouscases (see Section 3.2.1).

Sustainability 2020, 12, 10417 22 of 31
Sustainability 2020, 12, x FOR PEER REVIEW 22 of 32
The verification that the parameter SpaceVOCs is 50 𝜇𝑔/𝑚 is implemented, as shown in
Figure 15, through the code of a check rule with “Autodesk Model Checker”, similarly to the previous
cases (see Section 3.2.1).
Figure 15. CheckSet to check the value of the SpaceVOCs parameter.
Figure 16 (right) shows the “Autodesk Model Checker” screen if the value of the SpaceVOCs
parameter exceeds the pre‐established threshold. In this case, more in‐depth checks are suggested to
the designer and possible alternative solutions proposed are:
‐ Make sure to consider the substitution with low‐emissivity materials.
‐ Make sure to consider variations in ventilation rate.
‐ Make sure to consider occupancy number.
‐ Make sure to evaluate more in‐depth detailed IAQ simulation with CFD software.
Figure 16. Report implemented on the BIM model in which all the rooms have VOC emission values
below the identified limit (a); or in which two rooms have VOC emission values higher than the
identified limit (b).
Figure 15. CheckSet to check the value of the SpaceVOCs parameter.
Figure 16 (right) shows the “Autodesk Model Checker” screen if the value of the SpaceVOCsparameter exceeds the pre-established threshold. In this case, more in-depth checks are suggested tothe designer and possible alternative solutions proposed are:
- Make sure to consider the substitution with low-emissivity materials.- Make sure to consider variations in ventilation rate.- Make sure to consider occupancy number.- Make sure to evaluate more in-depth detailed IAQ simulation with CFD software.
Sustainability 2020, 12, x FOR PEER REVIEW 22 of 32
The verification that the parameter SpaceVOCs is 50 𝜇𝑔/𝑚 is implemented, as shown in
Figure 15, through the code of a check rule with “Autodesk Model Checker”, similarly to the previous
cases (see Section 3.2.1).
Figure 15. CheckSet to check the value of the SpaceVOCs parameter.
Figure 16 (right) shows the “Autodesk Model Checker” screen if the value of the SpaceVOCs
parameter exceeds the pre‐established threshold. In this case, more in‐depth checks are suggested to
the designer and possible alternative solutions proposed are:
‐ Make sure to consider the substitution with low‐emissivity materials.
‐ Make sure to consider variations in ventilation rate.
‐ Make sure to consider occupancy number.
‐ Make sure to evaluate more in‐depth detailed IAQ simulation with CFD software.
Figure 16. Report implemented on the BIM model in which all the rooms have VOC emission values
below the identified limit (a); or in which two rooms have VOC emission values higher than the
identified limit (b).
Figure 16. Report implemented on the BIM model in which all the rooms have VOC emission valuesbelow the identified limit (a); or in which two rooms have VOC emission values higher than theidentified limit (b).
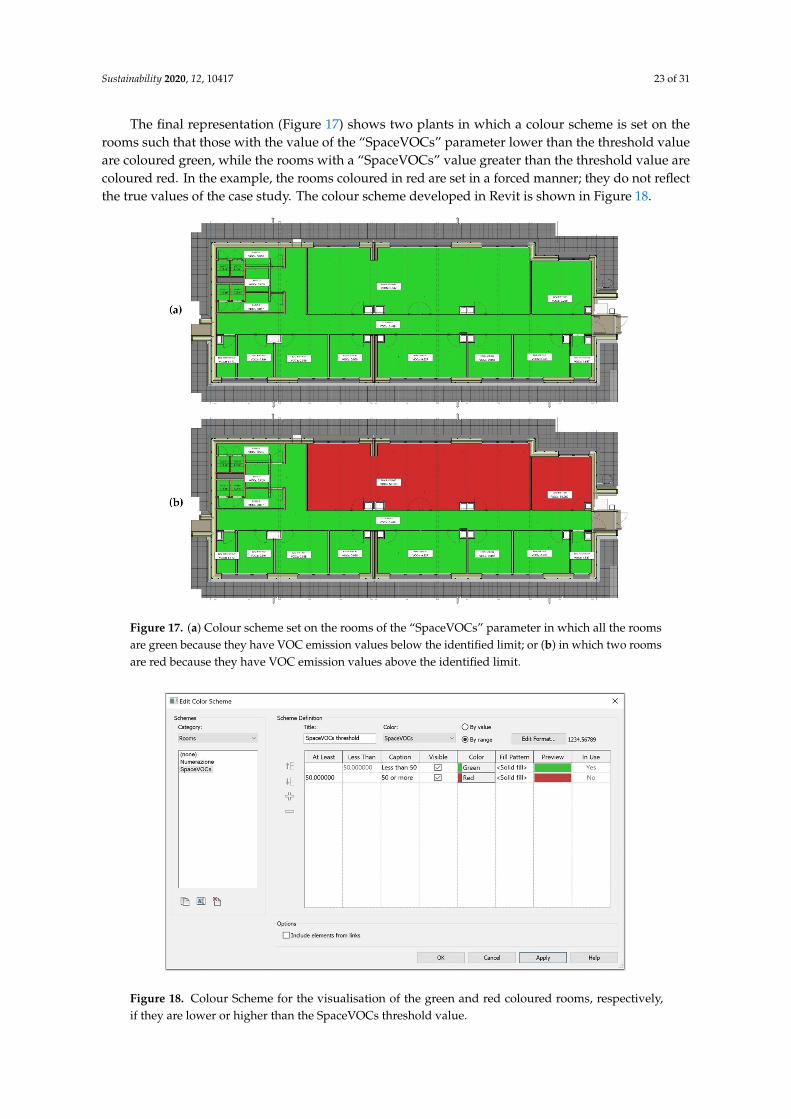
Sustainability 2020, 12, 10417 23 of 31
The final representation (Figure 17) shows two plants in which a colour scheme is set on therooms such that those with the value of the “SpaceVOCs” parameter lower than the threshold valueare coloured green, while the rooms with a “SpaceVOCs” value greater than the threshold value arecoloured red. In the example, the rooms coloured in red are set in a forced manner; they do not reflectthe true values of the case study. The colour scheme developed in Revit is shown in Figure 18.
Sustainability 2020, 12, x FOR PEER REVIEW 23 of 32
The final representation (Figure 17) shows two plants in which a colour scheme is set on the
rooms such that those with the value of the “SpaceVOCs” parameter lower than the threshold value
are coloured green, while the rooms with a “SpaceVOCs” value greater than the threshold value are
coloured red. In the example, the rooms coloured in red are set in a forced manner; they do not reflect
the true values of the case study. The colour scheme developed in Revit is shown in Figure 18.
Figure 17. (a) Colour scheme set on the rooms of the “SpaceVOCs” parameter in which all the rooms
are green because they have VOC emission values below the identified limit; or (b) in which two
rooms are red because they have VOC emission values above the identified limit.
Figure 18. Colour Scheme for the visualisation of the green and red coloured rooms, respectively, if
they are lower or higher than the SpaceVOCs threshold value.
Figure 17. (a) Colour scheme set on the rooms of the “SpaceVOCs” parameter in which all the roomsare green because they have VOC emission values below the identified limit; or (b) in which two roomsare red because they have VOC emission values above the identified limit.
Sustainability 2020, 12, x FOR PEER REVIEW 23 of 32
The final representation (Figure 17) shows two plants in which a colour scheme is set on the
rooms such that those with the value of the “SpaceVOCs” parameter lower than the threshold value
are coloured green, while the rooms with a “SpaceVOCs” value greater than the threshold value are
coloured red. In the example, the rooms coloured in red are set in a forced manner; they do not reflect
the true values of the case study. The colour scheme developed in Revit is shown in Figure 18.
Figure 17. (a) Colour scheme set on the rooms of the “SpaceVOCs” parameter in which all the rooms
are green because they have VOC emission values below the identified limit; or (b) in which two
rooms are red because they have VOC emission values above the identified limit.
Figure 18. Colour Scheme for the visualisation of the green and red coloured rooms, respectively, if
they are lower or higher than the SpaceVOCs threshold value. Figure 18. Colour Scheme for the visualisation of the green and red coloured rooms, respectively,if they are lower or higher than the SpaceVOCs threshold value.

Sustainability 2020, 12, 10417 24 of 31
4. Discussion
4.1. Use of Digital Design and BIM Process toward Healthy Buildings
In design practice, the process can now systematically make use of digital tools, such as BIM,for the analysis of environmental performance. Information modelling is an integral part of theproject, characterised by an iterative process, whereby a design choice is followed by a simulation andperformance evaluation to quantitatively measure its effectiveness (Figure 19).
Sustainability 2020, 12, x FOR PEER REVIEW 24 of 32
4. Discussion
4.1. Use of Digital Design and BIM Process toward Healthy Buildings
In design practice, the process can now systematically make use of digital tools, such as BIM, for
the analysis of environmental performance. Information modelling is an integral part of the project,
characterised by an iterative process, whereby a design choice is followed by a simulation and
performance evaluation to quantitatively measure its effectiveness (Figure 19).
Figure 19. The BIM Workflow for Indoor Environmental Performance Analysis. Based on the
presented BIM workflow on the Technical report “BUILDING INFORMATION MODELING (BIM)
for Indoor Environmental Performance Analysis” by University of Aarhus [31].
In this context, the term “Green BIM” is increasingly widespread, meaning the application of the
BIM process to the assessment of energy performance and sustainability of buildings. The ability of
BIM to manage information relating to the various disciplines of the project can also speed up and
optimise the verification of protocols for assessing sustainability. BIM process could respond to the
need to automatically manage the check of the satisfaction of the credit for the GBRS (Green Buildings
Rating Systems). These have become more complex due to a differentiated demand, which has led
the responsible institutions (i.e., LEED, BREEAM) to develop diversified versions for the different
types of interventions/buildings (new constructions, and renovations, for residential or office use).
This complexity, therefore, requires tools that can automatically manage the verification of the
characteristic requirements of each type of intervention, and BIM can respond to this need.
However, the drafting of protocols for sustainability is an activity that is integrated into the
design phase but is currently difficult to automate, although the scientific community is moving to
optimise some credit verification processes with BIM‐based methodologies [39].
The field of investigation of energy performance is certainly the most advanced, so even the BIM
application to protocols for sustainability has focused almost exclusively on the development of tools
and plug‐ins applied to the study of energy issues [53], while the topics relating to the aspects of
health and well‐being appear still little investigated. Among the most interesting applications
currently in use are to be mentioned: Autodesk Green Building Studio; IES VE‐Toolkit for LEED and
BREEAM certification, and Autodesk Insight for Revit.
Cheng and Nguyen identify two main problems regarding the integration between BIM
software functions and certification processes [54]:
BIM is above all enabled for the analysis of building performance and not applicable to many of
the other categories that contribute to the output of rating systems;
Manual operations are still required to switch from one application to another with file export
and import.
However, BIM software is databases from which it is possible to extract information, useful in
association with other applications to calculate the credits of many categories of rating systems or to
communicate with applications that have difficulty exchanging open file formats to date. At the basis
of these exchanges are the two mainly used open formats, the IFC, already discussed in the previous
sections, and the gbXml (green building XML). The main limitations highlighted in the processes
present in the literature are related to the definition of all attributes, of which the new ones conform
to the current IFC scheme, to satisfy the criteria calculation procedures [55]. Furthermore, not all the
Figure 19. The BIM Workflow for Indoor Environmental Performance Analysis. Based on the presentedBIM workflow on the Technical report “BUILDING INFORMATION MODELING (BIM) for IndoorEnvironmental Performance Analysis” by University of Aarhus [31].
In this context, the term “Green BIM” is increasingly widespread, meaning the application of theBIM process to the assessment of energy performance and sustainability of buildings. The ability ofBIM to manage information relating to the various disciplines of the project can also speed up andoptimise the verification of protocols for assessing sustainability. BIM process could respond to theneed to automatically manage the check of the satisfaction of the credit for the GBRS (Green BuildingsRating Systems). These have become more complex due to a differentiated demand, which has ledthe responsible institutions (i.e., LEED, BREEAM) to develop diversified versions for the differenttypes of interventions/buildings (new constructions, and renovations, for residential or office use).This complexity, therefore, requires tools that can automatically manage the verification of thecharacteristic requirements of each type of intervention, and BIM can respond to this need.
However, the drafting of protocols for sustainability is an activity that is integrated into the designphase but is currently difficult to automate, although the scientific community is moving to optimisesome credit verification processes with BIM-based methodologies [39].
The field of investigation of energy performance is certainly the most advanced, so even the BIMapplication to protocols for sustainability has focused almost exclusively on the development of toolsand plug-ins applied to the study of energy issues [53], while the topics relating to the aspects of healthand well-being appear still little investigated. Among the most interesting applications currently inuse are to be mentioned: Autodesk Green Building Studio; IES VE-Toolkit for LEED and BREEAMcertification, and Autodesk Insight for Revit.
Cheng and Nguyen identify two main problems regarding the integration between BIM softwarefunctions and certification processes [54]:
• BIM is above all enabled for the analysis of building performance and not applicable to many ofthe other categories that contribute to the output of rating systems;
• Manual operations are still required to switch from one application to another with file exportand import.
However, BIM software is databases from which it is possible to extract information, useful inassociation with other applications to calculate the credits of many categories of rating systems or tocommunicate with applications that have difficulty exchanging open file formats to date. At the basisof these exchanges are the two mainly used open formats, the IFC, already discussed in the previous

Sustainability 2020, 12, 10417 25 of 31
sections, and the gbXml (green building XML). The main limitations highlighted in the processespresent in the literature are related to the definition of all attributes, of which the new ones conformto the current IFC scheme, to satisfy the criteria calculation procedures [55]. Furthermore, not all theattributes necessary for the calculation of the score are included in the list of IFC properties, so some ofthese (in particular the output data) must be created.
Precisely in light of these reflections, the presented contribution is concentrated on IndoorEnvironment Quality, and in particular on IAQ, directing research on integration with BIM systems, asdirectly as possible within the selected Authoring Software, avoiding export and import steps on onehand, while proposing integration of the openBIM (IFC) format on the other.
Although the workflow presented is not aimed directly at the management of GBRS credits,this constitutes the first step of an in-depth study of a research field still under development and it couldallow to fulfil the credits related to the issue of the materials of some sustainability protocols already inthe presented stage, as well as demonstrating the CAM satisfaction for Italian legislation and movingtowards the purpose of the salutogenic aim. Given the discussion on display, the strategy in which thedeveloped tool is adopted is broader and aims to increase the awareness of designers on the issues ofhealth and wellness needs. The main purposes of the methodology presented are the verification of theemission requirements of the individual materials and the control of the concentrations of pollutants inan indoor environment, two concepts linked together, even if different.
4.2. Criticalities in the Open BIM Process and Definition of “Shared Parameters”
To be as consistent as possible with the procedure recommended by Autodesk for inserting standardIFC parameters, the “Shared parameters” present in the official .txt file “IFC Shared Parameters-Revit”were analysed, and three critical issues were found:
1. The “MechanicalVentilationRate” parameter is present but it is set as “Integer” data type,while we need to be able to enter decimal numbers as required by the IFC diagram in the“Pset_SpaceThermalRequirements”;
2. The “NetWallArea”, “NetCeilingArea” and “NetVolume” parameters are not present, but intheir place, there are the “IfcQtyNetWallArea”, “IfcQtyNetCeilingArea” and “IfcQtyNetVolume”parameters, because in Autodesk Revit, only for the IfcSpace class, it is possible to overwrite theQuantitySet parameters “Qto_SpaceBaseQuantities” by inserting the suffix “IfcQty” to the nameof the IFC schema parameter. If we export a Revit model in IFC format, the standard parameters“NetWallArea”, “NetCeilingArea” and “NetVolume” are not written automatically (Figure 20);
3. The “NetFloorArea” and “IfcQtyNetFloorArea” parameters are not present even if providedfor in the IFC 4.1 diagram within the “Qto_SpaceBaseQuantities”. If we export a Revitmodel in IFC format, the standard parameter “NetFloorArea” is automatically written in the“Qto_SpaceBaseQuantities” (Figure 20) with the same value that is present in Autodesk Revit inthe “Area” parameter of the “ Rooms”.
The critical issues exposed represent a limitation to the openBIM process through an open formatsuch as IFC, forcing the operator to set a different path depending on the chosen BIM Authoringsoftware. In the case described, the criticality was overcome as described in the relevant section of theresults (see Section 3.1).

Sustainability 2020, 12, 10417 26 of 31
Sustainability 2020, 12, x FOR PEER REVIEW 26 of 32
Figure 20. Analysis of the parameters of an IfcSpace present in the QuantitySet
“Qto_SpaceBaseQuantities” of an IFC model exported from Revit without the inclusion of any
“shared parameters”. IFC viewer used: ACCA usBIM.viewer+ [56].
3. The “NetFloorArea” and “IfcQtyNetFloorArea” parameters are not present even if provided for
in the IFC 4.1 diagram within the “Qto_SpaceBaseQuantities”. If we export a Revit model in IFC
format, the standard parameter “NetFloorArea” is automatically written in the
“Qto_SpaceBaseQuantities” (Figure 20) with the same value that is present in Autodesk Revit in
the “Area” parameter of the “ Rooms”.
The critical issues exposed represent a limitation to the openBIM process through an open
format such as IFC, forcing the operator to set a different path depending on the chosen BIM
Authoring software. In the case described, the criticality was overcome as described in the relevant
section of the results (see Section 3.1).
4.3. Technical Requirements of Building Components for IAQ Control
The results of the analyses showed that the satisfaction of the emission threshold values (i.e., for
the LEED and BREEAM protocols) and the regulatory limits (CAM), do not have a direct
correspondence with high indoor air quality. The upper limit imposed by the CAM (1500 μg/m3)
must be contextualised concerning the actual air changes of the environment being analysed.
Considering a minimum turnover of 0.5 volumes/hour, as described by the regulations for the
evaluation of individual materials, the correspondent indoor concentration value obtained is far
above the IAGVs elaborated in the scientific literature.
A fundamental role in the evaluation of IAQ is therefore linked to air changes and the design of
the HVAC system. The greater the ventilation rate the system is designed with, the greater the
dilution of the substances present in the air and, therefore, the lowering of their concentration. The
considerations set out here have taken into account the minimum air change (a value of 0.5
volumes/hour) for two main reasons:
It is not always possible to know the air changes of the HVAC system, in the early stages of the
development of the architectural project, or it is not certain that there are air changes higher than
the minimum in the absence in mechanised ventilation (i.e., in residential buildings);
Figure 20. Analysis of the parameters of an IfcSpace present in the QuantitySet“Qto_SpaceBaseQuantities” of an IFC model exported from Revit without the inclusion of any “sharedparameters”. IFC viewer used: ACCA usBIM.viewer+ [56].
4.3. Technical Requirements of Building Components for IAQ Control
The results of the analyses showed that the satisfaction of the emission threshold values (i.e., for theLEED and BREEAM protocols) and the regulatory limits (CAM), do not have a direct correspondencewith high indoor air quality. The upper limit imposed by the CAM (1500 µg/m3) must be contextualisedconcerning the actual air changes of the environment being analysed. Considering a minimumturnover of 0.5 volumes/hour, as described by the regulations for the evaluation of individual materials,the correspondent indoor concentration value obtained is far above the IAGVs elaborated in thescientific literature.
A fundamental role in the evaluation of IAQ is therefore linked to air changes and the design of theHVAC system. The greater the ventilation rate the system is designed with, the greater the dilution ofthe substances present in the air and, therefore, the lowering of their concentration. The considerationsset out here have taken into account the minimum air change (a value of 0.5 volumes/hour) for twomain reasons:
• It is not always possible to know the air changes of the HVAC system, in the early stages of thedevelopment of the architectural project, or it is not certain that there are air changes higher thanthe minimum in the absence in mechanised ventilation (i.e., in residential buildings);
• In the case of the HVAC system with ventilation rates higher than 0.5, a malfunction could occur,which would lead to an accumulation of VOCs in an indoor environment.
The method presented here is intended to be a first verification tool for the designer on the IAQperformance of the building organism. This tool focuses on the performance of the building box,precisely to allow the evaluation of design choices, and the proposed threshold value is precautionarybecause the contributions of users, furnishings, and cleaning systems must be considered in the realsituation, in addition to the ones of the construction elements. All these other contributions are morecomplex simulation in the early stages of the project.
A critical issue that emerged during the development of the research project relates to the topicknowledge by the technicians and manufacturers of building materials. Although it is true that to date

Sustainability 2020, 12, 10417 27 of 31
the majority of construction products are certified and report emission data, these data still appear tobe incomplete or not correctly disseminated.
The issues can be summarised in the following list:
• Materials with technical data sheets containing incomplete emission data: Not always all the mainindoor pollutants are present (i.e., Formaldehyde, VOC, Benzene);
• Unclear understanding of the VOC emission data: When the data are present, it is often notspecified with which procedures and tests the value was obtained, how many days after applicationit refers to, and whether the declared data refer to the VOCs contained in internal material orthose emitted.
In most cases, when present, the VOC emission data referred to the TVOCs and not to aspecification, at least to the main ones. However, it should be noted that there were also manufacturerswho provided complete data of certifications and indications on the methods of testing the emissivityof materials, and which allowed the analyses carried out.
These considerations have directed the project to focus on the TVOC data, which therefore appearsto be the one actually easier to find even for architectural designers.
It is certainly necessary to work for greater awareness of the IAQ theme and an increase in thetechnical knowledge of both the designers, who must request the information, and the manufacturerswho must provide it, to make the design towards Healthy Buildings and the simulation of significativeperformances more effective.
4.4. Limitations and Future Research Directions
In the present work, the methodology described for the estimation of VOC concentration in indoorenvironments, box-model, and its implementation in the BIM process, has been applied consideringsimplifying conditions. We decided to simulate the emission of VOCs in the rooms as coming from asingle type of material: the internal finishing paint applied to the walls. This choice, while offering alimited estimate of the real concentration in the environments, allowed to highlight the contributionfrom the materials in the indoor concentrations’ assessment. The choice is also simplifying from thepoint of view of the actual composition of the materials present in the rooms. The material chargedwith the emission of VOC is in fact with this hypothesis considered as composed solely of the finishinglayer, thus not considering the presence of the underlying layers.
We decided to make this simplification since it is known from the literature that the emissionsfrom multilayer materials are comparable with those of the outermost top-layer material [57]. At thesame time, because over the years the phenomena of diffusion within multilayer materials have beenextensively investigated [58], the integration of this modelling into the BIM process represents a fieldof sure interest and possible future development.
The choice of the TVOC parameter only has been discussed in Section 4.1., but the elaboratedworkflow was designed to be implementable concerning other indoor pollutants, and in the test phase,the shared parameters relating to Formaldehyde, Benzene, and CO2, have already been evaluatedand entered.
A final aspect to be addressed in the discussion is relating to the integration between BIM andCFD simulation. To date, file exchange is still difficult and not direct, and among the many simulationsoftware (i.e., CONTAM, COMIS, IAQx, ANSYS, and Autocad CFD) few manage the IFC format [32].Among these, the latter is the only one that allows exchange with the files processed within the BIMAuthoring Revit, being from the same software house.
The input data required for IAQ modelling can be classified into:
• Boundary conditions necessary for the fluid-dynamics: Indoor/outdoor momentum exchanges tothe indoor domain, geometric characteristics of the indoor domain, thermal forcing (external andinternal temperatures);

Sustainability 2020, 12, 10417 28 of 31
• Information to simulate transport and diffusion of contaminants: Initial conditions (source position,introduced flow rates) and chemical characteristics of the contaminants.
The IAQ assessment requires information on indoor pollutants as input data and many of thesedata depend on the activities carried out in the building during the occupation, which are difficultto acquire from the BIM model. However, IAQ is very complex due to a large number of boundaryconditions necessary for the simulation, that results too detailed to be captured by an IFC model andlinked to a specific dynamic calculation tool. Research efforts in this direction are needed, as IAQshould not be neglected and applied only during the “use phase” of buildings. The part of the inputdata required for the IAQ assessment during the early design stages such as geometric details, intendedoccupation, HVAC details, and technical specifications of the building materials can be obtained byquerying the BIM model [32].
Future research may envisage the possibility of linking BIM design variables and computationaldata needed to use CFDs and their integration. For now, the large amounts of input data required forCFD simulations still make the software more applicable in the later stages of the detailed design phase.However, the time and resources required will be reduced with the advancement of more powerfulhardware and hopefully future BIM implementations.
5. Conclusions
The concept of “Healthy Building” thus asserts itself as a new paradigm of environmentalsustainability. The studies cited in the contribution highlight the centrality of the topic for theperformance analysis of the built environment, specifically concerning the construction practice that inrecent decades have focused on energy performance to the detriment of users′ health. The profoundqualitative changes of indoor air and the progressive increase in the absolute number of pollutants,combined with the scientific awareness of the health impacts deriving from spending more than 90%of one′s time inside confined spaces, has therefore increased the attention to the needs of well-being,hygiene, and health of the users. This scientific attention has produced studies and analyses aimedat an evidence-based investigation for deepening the performance aspects of the building system,demonstrating the importance of the interdisciplinary nature of architectural engineering.
Although from a theoretical point of view, what is reported highlights the need to deepen theresearch topic, from an operational point of view the question is certainly more complex. Associatinga performance value with each element of the environmental and technological system throughthe compilation of data fields or automated calculation procedures, exploiting the potential of BIMprocesses, is a new challenge.
The limitation of the topic results, on the one hand, the definition of performance specifications,based not only on the regulatory environment as in actual practice but on an evidenced-based approach;and on the other hand the possibility of attributing and extrapolating evaluations and requirementsfrom the models in a quantitative format.
The contribution demonstrates how it is possible to integrate performance-based analysis into BIMprocesses aimed at assessing IAQ, for Healthy Buildings design, operating through a multidisciplinaryapproach and numerical simulations outside of the consolidated information modelling in theconstruction sector. The results of the contribution show a good fit between the numerical model andthe implementation in BIM, providing the designer with a quick control tool for IAQ in the variousphases of the architectural project. The design choices concerning mechanical ventilation systems andbuilding materials are certainly fundamental and must be analysed in the whole process of design andconstruction of the building.
The research presented here is a first development, currently focused on TVOC, but implementableconcerning other aspects of IAQ, a direction necessary for the effectiveness of performancebuilding-based design for health and wellness issues. Further insights and analyses will allowto better set the workflow and the tool, testing it on a higher number of case studies.

Sustainability 2020, 12, 10417 29 of 31
Author Contributions: Conceptualisation, A.D. and E.C.; methodology, A.D.; software, G.B.; BIM model analysisA.D. and G.B., numerical model analysis A.P.; investigation, A.D., G.B. and A.P.; architectural engineering A.D. andE.C.; writing—original draft preparation, A.D.; writing—review and editing, A.D., G.B., A.P., E.C.; visualisation,A.D., G.B.; supervision, E.C.; funding acquisition, E.C. All authors have read and agreed to the published versionof the manuscript.
Funding: The research project is funded by the Lazio Region (Det. N. G12783 of 20/09/2017) POR FESRLAZIO 2014/2020—Integrated projects—Public notice 6 “Creativity 2020” CUP Code B16C18001020007 n.prot. A0128-2017-17209. The research, entitled “BIM4H&W: BIM for Health and Wellbeing” is developed inpartnership of effective collaboration between RI.EL.CO IMPIANTI S.R.L. and the University of Rome “Sapienza”,CRITEVAT—Reatine Research Center in Engineering for the Protection and Enhancement of the Environment.
Acknowledgments: Thanks to RIELCO IMPIANTI S.R.L. for the support during the development of the researchand the material provided on the case study of the New expansion of CNR in Pisa, Italy. We also thank all thetechnicians of the company who contributed to the achievement of the research objectives.
Conflicts of Interest: The authors declare no conflict of interest.
References
1. Zanchetta, C.; Croatto, G.; Paparella, R.; Turrini, U. Performance based building design to ensure buildingquality: From standardization to LEAN construction. TECHNE 2014, 8, 62–69. [CrossRef]
2. Sanguinetti, P. BIM in academia: Shifting our attention from product to process. In Joining Languages,Cultures and Visions: CAADFutures 2009; Tidafi, T., Dorta, T., Eds.; PU Montreal: Montreal, QC, Canada, 2009;pp. 395–409.
3. Penttilä, H. Describing the Changes in Architectural Information Technology to Understand DesignComplexity and Free-form Architectural Expression. J. Inf. Technol. Constr. Itcon 2006, 11, 395–408.
4. Howard, R.; Björk, B.C. Building information modelling—Experts’ views on standardisation and industrydeployment. Adv. Eng. Inform. 2008, 22, 271–280. [CrossRef]
5. Eastman, C.M. The Representation of Design Problems and Maintenance of Their Structure. In ArtificialIntelligence and Pattern Recognition in Computer Aided Design; Latombe, J.C., Ed.; North-Holland Press:New York, NY, USA, 1979.
6. World Health Organization (WHO). Health as the Pulse of the New Urban Agenda: United Nations conferenceon Housing and Sustainable Urban Development; WHO Library Cataloguing-in-Publication Data: Quito,Ecuador, 2016.
7. Capolongo, S.; Rebecchi, A.; Dettori, M.; Appolloni, L.; Azara, A.; Buffoli, M.; Capasso, L.; Casuccio, A.;Oliveri Conti, G.; D’Amico, A.; et al. Healthy design and urban planning strategies, actions, and policy toachieve salutogenic cities. Int. J. Environ. Res. Public Health 2018, 15, 2698. [CrossRef]
8. EPA. Healthy Buildings, Healthy People; United States Environmental Protection Agency: Washington, DC,USA, 2001.
9. Annesi-Maesano, I.; Baiz, N.; Banerjee, S.; Rudnai, P.; Rive, S. On behalf of the SINPHONIE Group. Indoorair quality and sources in schools and related health effects. J. Toxicol. Environ. Health Part B 2013, 16, 491–550.[CrossRef]
10. Codinhoto, R.; Tzortzopoulos, P.; Kagioglou, M.; Aouad, G.; Cooper, R. The impacts of the built environmenton health outcomes. Facilities 2009, 27, 138–151. [CrossRef]
11. D’Alessandro, D.; Capolongo, S. Ambiente Costruito e Salute: Linee d’Indirizzo di Igiene e Sicurezza in AmbitoResidenziale; Franco Angeli: Milano, Italy, 2015; ISBN 9788891725783.
12. Allen, J.; Bernstein, A.; Cao, X.; Eitland, E.S.; Flanigan, S.; Gokhale, M.; Goodman, J.M.; Klager, S.;Klingensmith, L.; Laurent, J.G.C.; et al. Building Evidence for Health. The 9 Foundations of a Healthy Building;Harvard T.H. Chan School of Public Health: Boston, MA, USA, 2017.
13. Al horr, Y.; Arif, M.; Katafygiotou, M.; Mazroei, A.; Kaushik, A.; Elsarrag, E. Impact of indoor environmentalquality on occupant well-being and comfort: A review of the literature. Int. J. Sustain. Built Environ. 2016, 5,1–11. [CrossRef]
14. Pini, A.; Grandoni, L.; Leuzzi, G.; Monti, P.; Di Bernardino, A.; Pelliccioni, A.; Gherardi, M.; Cattani, G.; DiMenno Di Bucchianico, A. A simplified analytical model of ultrafine particle concentration within an indoorenvironment. IOP Conf. Ser. Earth Environ. Sci. 2020, 489. [CrossRef]

Sustainability 2020, 12, 10417 30 of 31
15. De Martino, A. Linee-guida per la tutela e la promozione della salute negli ambienti confinati. Ig. SanitaPubbl. 2014.
16. EPA; OAR. Introduction to Indoor Air Quality. United States Environmental Protection Agency: Washington,DC, USA, 2016.
17. Settimo, G.; D’Alessandro, D. European community guidelines and standards in indoor air quality:What proposals for Italy. Epidemiol. Prev. 2014, 38, 36–41.
18. Mazuch, R. Salutogenic and biophilic design as therapeutic approaches to sustainable architecture. Archit. Des.2017, 87, 42–47. [CrossRef]
19. Breslow, L. Health measurement in the third era of health. Am. J. Public Health 2006, 96, 17–19. [CrossRef] [PubMed]20. Roskams, M.; Haynes, B. Salutogenic workplace design: A conceptual framework for supporting sense of
coherence through environmental resources. J. Corp. Real Estate 2019, 22, 139–153. [CrossRef]21. International Well Building Institute. 2018 Report The International Well Building Institute Major Takeaways
From 2018; The International WELL Building Institute: New York, NY, USA, 2018.22. Davis, G.; Szigeti, F. Are Facilities Measuring up? Matching Building Capabilities to Functional Needs
using the Serviceability Tools and Methods. In Durability of Building Materials and Components 8; Institute forResearch in Construction: Ottawa, ON, Canada, 1999; pp. 1856–1866.
23. Davis, G.; Ventre, F.T. Performance of Buildings and Serviceability of Facilities; American Society for Testing andMaterials: West Conshohocken, PA, USA, 1990; ISBN 0803112920.
24. Becker, R. Fundamentals of performance-based building design. Build. Simul. 2008, 1, 356–371. [CrossRef]25. Foliente, G.C. Performance Based Building R&D Roadmap; Performance Based Building Network (PeBBu):
Rotterdam, The Netherlands, 2005; ISBN 90-6363-048-4.26. Geyer, P. Component-oriented decomposition for multidisciplinary design optimization in building design.
Adv. Eng. Informatics 2009, 23, 12–31. [CrossRef]27. WHO Regional Office for Europe. WHO Guidelines for Indoor Air Quality: Selected Pollutants; WHO:
Copenhagen, Denmark, 2010; Volume 35.28. Cony Renaud Salis, L.; Abadie, M.; Wargocki, P.; Rode, C. Towards the definition of indicators for assessment
of indoor air quality and energy performance in low-energy residential buildings. Energy Build. 2017, 152,492–502. [CrossRef]
29. Sanguinetti, P.; Abdelmohsen, S.; Lee, J.; Lee, J.; Sheward, H.; Eastman, C. General system architecture forBIM: An integrated approach for design and analysis. Adv. Eng. Inform. 2012, 26, 317–333. [CrossRef]
30. Lu, Y.; Wu, Z.; Chang, R.; Li, Y. Building Information Modeling (BIM) for green buildings: A critical reviewand future directions. Autom. Constr. 2017, 83, 134–148. [CrossRef]
31. Kirkegaard, P.H.; Kamari, A. Building Information Modeling (BIM) for Indoor Environmental Performance Analysis;Aarhus University: Aarhus, Denmark, 2017.
32. Jung, N.; Häkkinen, T.; Rekola, M. Extending capabilities of bim to support performance based design. J. Inf.Technol. Constr. 2018, 23, 16–52.
33. Hjelseth, E. BIM-based Model Checking (BMC). In Building Information Modeling; Issa, R.R.A., Olbina, S., Eds.;American Society of Civil Engineers: Reston, VA, USA, 2015; pp. 33–61. ISBN 9780784479131. [CrossRef]
34. Hjelseth, E. Converting performance based regulations into computable rules in BIM based model checkingsoftware. In eWork and eBusiness in Architecture, Engineering and Construction: Proceedings of the European Conferenceon Product and Process Modelling (ECPPM 2012); CRC Press: Boca Raton, FL, USA, 2012; pp. 461–469. [CrossRef]
35. Lee, S.; Tae, S.; Roh, S.; Kim, T. Green template for life cycle assessment of buildings based on building informationmodeling: Focus on embodied environmental impact. Sustainability 2015, 7, 16498–16512. [CrossRef]
36. Cofaigh, E.O.; Fitzgerald, E.; Alcock, R.; McNicholl, A.; Peltonen, V.; Marucco, A. A Green Vitruvius: Principlesand Practice of Sustainable Architectural Design; James & James: London, UK, 1999.
37. Wang, W.; Zmeureanu, R.; Rivard, H. Applying multi-objective genetic algorithms in green building designoptimization. Build. Environ. 2005, 40, 1512–1525. [CrossRef]
38. Getuli, V.; Ventura, S.M.; Capone, P.; Ciribini, A.L.C. BIM-based code checking for construction health andsafety. Procedia Eng. 2017, 196, 454–461. [CrossRef]
39. Bergonzoni, G.; Capelli, M.; Drudi, G.; Viani, S.; Conserva, F. Building information modeling (BIM) forLEED® IEQ category prerequisites and credits calculations. In eWork and eBusiness in Architecture, Engineeringand Construction: Proceedings of the 11th European Conference on Product and Process Modelling (ECPPM 2016),Limassol, Cyprus, 7–9 September 2016; CRC Press: Boca Raton, FL, USA, 2016; pp. 75–79.

Sustainability 2020, 12, 10417 31 of 31
40. Politi, S.; Bergonzoni, G.; Cincotta, I.W.J.; Sampietro, F. LCA analysis through a Visual Programming tool:Workflow on a BIM model case study. in_Bo 2018, 9, 104–115.
41. buildingSMART IFC Standard. Available online: https://standards.buildingsmart.org/IFC/RELEASE/IFC4_1/FINAL/HTML/ (accessed on 1 May 2020).
42. Diroots Manage Revit Paramaters in Project and Family Environments. Available online: https://diroots.com/plugins/paramanager-manage-revit-parameters/ (accessed on 1 May 2020).
43. Autodesk Autodesk Model Checker for Revit. Available online: https://biminteroperabilitytools.com/modelchecker.php (accessed on 10 May 2020).
44. The Ohio State University Building Information Modeling | Planning, Architecture and Real Estate.Available online: https://pare.osu.edu/services/facilities-information-and-technology-services/building-information-modeling (accessed on 10 May 2020).
45. Huang, H.; Haghighat, F. Modelling of volatile organic compounds emission from dry building materials.Build. Environ. 2002, 37, 1349–1360. [CrossRef]
46. Liang, W.; Gao, P.; Guan, J.; Yang, X. Modeling volatile organic compound (VOC) concentrations due tomaterial emissions in a real residential unit. Part I: Methodology and a preliminary case study. Build. Simul.2012, 5, 351–357. [CrossRef]
47. Persily, A.; Howard-Reed, C.; Nabinger, S.J. Transient analysis of volatile organic compound concentrationsfor estimating emission rates. Atmos. Environ. 2003, 37, 5505–5516. [CrossRef]
48. The Building Information Foundation. RTS M1 Emission Classification of Building Materials: Protocol forChemical and Sensory Testing of Building Materials; The Building Information Foundation RTS: Helsinki,Finland, 2017.
49. Wilke, O.; Jann, O. Comparison of formaldehyde concentrations in emission test chambers using EN 717-1and EN 16516. In Proceedings of the Indoor Air Conference 2018, the 15th Conference of the InternationalSociety of Indoor Air Quality & Climate (ISIAQ), Herndon, VA, USA, 22–27 July 2018.
50. Schieweck, A.; Bock, M.C. Emissions from low-VOC and zero-VOC paints—Valuable alternatives toconventional formulations also for use in sensitive environments? Build. Environ. 2015, 85, 243–252.[CrossRef]
51. Building Research Establishment Environmental Assessment Method BREEAM Certification—Hea 02 IndoorAir Quality. Available online: https://www.breeam.com/BREEAMIntNDR2016SchemeDocument/content/05_health/hea_02.htm#Exemplary_level_emission_criteria_byproduct_type (accessed on 10 November 2020).
52. Autodesk Useful IFC links, Revit Products, Autodesk Knowledge Network. Available online:https://knowledge.autodesk.com/support/revit-products/learn-explore/caas/simplecontent/content/useful-useful-ifc-links.html (accessed on 10 May 2020).
53. Azhar, S.; Carlton, W.A.; Olsen, D.; Ahmad, I. Building information modeling for sustainable design andLEED® rating analysis. Autom. Constr. 2011, 20, 217–224. [CrossRef]
54. Chen, P.-H.; Nguyen, T.C. Integrating web map service and building information modeling for location andtransportation analysis in green building certification process. Autom. Constr. 2017. [CrossRef]
55. Maltese, S.; Tagliabue, L.C.; Re Cecconi, F.; Pasini, D.; Manfren, M.; Ciribini, A.L. Sustainability Assessmentthrough Green BIM for Environmental, Social and Economic Efficiency. Procedia Eng. 2017, 180, 520–530.[CrossRef]
56. ACCA Software IFC Viewer—usBIM.viewer+—ACCA Software. Available online: https://www.acca.it/ifc-bim-viewer (accessed on 1 June 2020).
57. Haghighat, F.; Huang, H. Integrated IAQ model for prediction of VOC emissions from building material.Build. Environ. 2003, 38, 1007–1017. [CrossRef]
58. Liu, Z.; Ye, W.; Little, J.C. Predicting emissions of volatile and semivolatile organic compounds from buildingmaterials: A review. Build. Environ. 2013, 64, 7–25. [CrossRef]
Publisher’s Note: MDPI stays neutral with regard to jurisdictional claims in published maps and institutionalaffiliations.
© 2020 by the authors. Licensee MDPI, Basel, Switzerland. This article is an open accessarticle distributed under the terms and conditions of the Creative Commons Attribution(CC BY) license (http://creativecommons.org/licenses/by/4.0/).
Copyright © 2022 FDOKUMEN