IMPLEMENTING BIM TECHNIQUES FOR ENERGY ANALYSIS: A CASE STUDY OF BUILDINGS AT UNIVERSITY OF LA...
233
Juan Carlos Santamarta Cerezal, Luis E. Hernández Gutiérrez (eds.) ENVIRONMENTAL SECURITY, GEOLOGICAL HAZARDS AND MANAGEMENT
Transcript of IMPLEMENTING BIM TECHNIQUES FOR ENERGY ANALYSIS: A CASE STUDY OF BUILDINGS AT UNIVERSITY OF LA...
Juan Carlos Santamarta Cerezal, Luis E. Hernández Gutiérrez (eds.)
ENVIRONMENTAL SECURITY, GEOLOGICAL HAZARDS AND MANAGEMENT

ENVIRONMENTAL SECURITY, GEOLOGICAL HAZARDS AND
MANAGEMENTProceedings from the 1st International Workshop, San Cristobal
de La Laguna, Tenerife (Canary Islands), Spain, 10-12 April 2013
Editors
Juan Carlos Santamarta-Cerezaluniversidad de la laguna, tenerife, spain
Luis E. Hernández Gutiérrezárea de laboratorios y calidad de la construcción, gobierno de canarias,
tenerife, spain
ENVIRONMENTAL SECURITY,GEOLOGICAL HAZARDS AND MANAGEMENTProceedings from the 1st International Workshop, San Cristobal de La Laguna, Tenerife (Canary Islands), Spain, 10-12 April 2013
This project/work has been funded by the Education, Audiovisual and Culture Executive Agency (EACEA), as an Erasmus Multilateral Project through project number 517629-LLP-1-2011-UK-ER-ASMUS-EMCR
This book was peer reviewed
EDITING BYJuan Carlos Santamarta CerezalLuis E. Hernández Gutiérrez
DESIGN BYAlba Fuentes [email protected]
SPONSORED BY
HOW TO CITE THIS BOOK;Santamarta-Cerezal,J.C.,Hernández Gutiérrez,L.E. ed.(2013); Environmental security, geological hazards and management.Universidad de La laguna.Tenerife
All rights reserved. No part of this publication may be reproduced, stored in a retrieval system, or transmitted in any form or by any means, electronic, mechanical, photocopying, recording or otherwise, without either the prior written permission of the publisher.
DEPÓSITO LEGAL: TF-202-2013
ISBN 978-84-616-2005-0

5
Contents
IntroductIon 7
commIttee 9
ProceedIngs 11
Part 1: Environmental Security and Sustainability 13
Environmental security threats in the UK context: Climate change and forest plants diseases. Florin Ioras. Pág.15
The EU targets for reducing greenhouse gas emissions from Polish economic perspective. Jakub Piecuch. Pág.27
Corporate Environmental Performance Evaluation under Conditions of Sustainability. A. Polgár; J. Pájer. Pág.35
Modeling for decision-making: the construction of an air quality integrated assessment model for Spain. M. Vedrenne; R. Borge; J. Lumbreras & M.E. Rodríguez. Pág.53
Implementing BIM Techniques for Energy Analysis: A Case Study of buildings at University of La Laguna. N. Martin-Dorta, P. González de Chaves Assef, J. De la Torre Cantero, G. Rodríguez Rufino. Pág.61
Ecological Foundation for Sustainable Land Use. A. Polgár & Á. Drüszler, F. Lakatos & V. Takács, T. Bazsó. Pág.69
A pedagogy on sustainable architecture: hacking Solar Decathlon. E. Roig, M.I. Alba, J. Claver & R. Álvarez. Pág.79
Reacting and Recycling. M. San Millán Escribano; A. Muñoz Miranda; S. Martínez Cuevas; B. Horta Rial. Pág.85
Environmental Security and Solid Waste Management. Aerobic degradation of bioplastic materials. M. P. Arraiza, J. V. López & A. Fernando. Pág.93
Specialized training in Environmental Security, Climate Change and Land Restoration. Masters Eras-mus, Europe Lifelong Learning Programme. J.C. Santamarta-Cerezal; P. Arraiza Bermúdez-Cañete; Florin Ioras. Pág.99
Sustainable re-thinking of the city concept. M.I. Alba, E. Roig, J. Claver & R. Álvarez. Pág.105
Environmental security, geological hazards and management© 2013 ISBN 978-84-616-2005-0
6
Part 2: Water Management and Protection 111
Water availability and management in the Pyrenees under projected scenarios of climate and land use change. J.I. López-Moreno; E. Morán-Tejeda; J. Revuelto; M. Gilaberte; J. Zabalza; S.M. Vicente-Serrano. Pág.113
Mountain Areas Safety. Torrent control in a Pyrenean basin. García Rodríguez, José L., Giménez Suárez, M.C. Pág.119
Protection perimeters for natural mineral water catchment in volcanic aquifers in the Canary Islands. R. Poncela, E. Skupien, R. Lario, Á. Morales. Pág.125
Protecting and Restoring Gran Canaria island’s Watershed. Laurel Forest Reforestation in Los Tilos de Moya. Naranjo Borges, J. Pág.131
Changes of the Environmental Conditions at Lake Fertő, Hungary. T. Bazsó, G. Király & I. Márkus. Pág.137
Heavy metal content in Sewage Sludge: A management strategy for an ocean island. C. Hernández-Sánchez, A. Burgos , JM. Galindo, A. Gutiérrez, C. Rubio, A. Hardisson. Pág.147
Changing Climate Impacting on Water and Energy Needs for Millions. Yusuf Serengil, İbrahim Yurtse-ven, Hakan Erden. Pág.155
Effect of vineyard management on the soil quality, ‘Vino de Toro’ district, Western Spain. M. Isabel González, José A. Egido, Juan F. Gallardo. Pág.163
Introduction to water problems in Canary Islands. J.C. Santamarta-Cerezal, J. Rodríguez-Martín. Pág.169
Part 3: Geological Hazards 179
Study of L´Aquila earthqueake sentence. Some legal aspects of the environmental security. Luis-Javier Capote-Pérez. Pág.181
Geological hazards in sensitive infrastructures of the Canary Islands: the case of large astronomical telescopes. A. Eff-Darwich; J. de León; B. García-Lorenzo; R. Viñas; J.A. Rodriguez-Losada; L. Hernández-Gutiérrez; J.C. Santamarta. Pág.187
Environmental Impacts of Opencast Mining, Hungary. J. Pájer, I. Berki, A. Polgár & K. Szabó, Z. Gri-bovszki, P. Kalicz. Pág.193
The use of DInSAR as a complementary tool for forensic analysis in subsiding areas. Tomás, R, Cano, M., Sanabria, M., Herrera, G, Vicente, F. , Lopez-Sanchez, J.M. Pág.201
Morphology and distribution of volcanic bombs in Caldera Quemada de Arriba (Lanzarote, Canary Islands): implications for volcanic hazard analysis. I. Galindo, M.C. Romero, N. Sánchez, J. Dóniz, J. Yepes, J.M. Morales & L. Becerril, I. Galindo, N. Sánchez, J.M. Morales & L. Becerril, M.C. Romero & J. Dóniz, J. Yepes. Pág.207
Disaster Risk Reduction, an overview. J.C. Santamarta-Cerezal, J. Neris-Tomé, L.E. Hernández Gutiérrez, A. Eff-Darwich. Pág.215
Volcanic cliff instability in Playa de La Arena, Tacoronte, Tenerife, Spain. M.C. López-Felipe, L.E. Hernández, I.N. Álvarez-Pérez, A. Hernández-Sanz, J.C. Santamarta-Cerezal. Pág.221
7
Europe is facing an accelerated climate change as a result of global warming and as a result population departure and consequent abandon of rural areas due to the increase floods, for-est fire, lack of water, land slide, etc, and there is a need to find ways to support management of such hazards by providing adequate training on environmental security and management. The 2010 Climate Agreement in Cancun, Mexico, identified as of matter of urgency the need for training on managing environment security and preventing occurrence by providing.
The Environment and Security International Workshop is intended to provide a forum to explore the connections between environment and security issues, their common underlying scientific threads, and the policy and governance needed to address security risks posed by a rapidly changing environment.
Topics;
1. Climate Change and Security
2. Changing Climate Impacting on Water and Energy Needs for Millions
3. Science and Innovation for Energy Safety
4. Sustainable Environment, Occupational, and Public Health for Livelihood
5. The Rio+20 Summit: Green Economy and Global Governance
6. Safe, Resilient, and Sustainable Communities
7. Geologycal Hazards
8. Threats to Water Resources
Introduction

9
Committee
Organizing committee chair
Juan Carlos Santamarta-Cerezal, ULL, Spain
Organizing committee co-chairs
Florin Ioras, Bucks New University, UK
Luis E. Hernandez Gutiérrez, Canary Islands Goverment-INVOLCAN, Spain
SpainIoan Vasile Abrudan, Brasov University, Romania
Paz Arraiza Bermúdez Cañete, UPM, Spain
Henn Korjus, EMU, Estonia
Viktor Takasz, EFE, Hungary
Roberto Tomás Jover, Universidad de Alicante, Spain
Organization committee
Jonay Neris Tomé , ULL, Spain
Lidia Carrillo, ULL, Spain
Alba Fuentes Porto, UPV, Spain
Scientific committee
Florin Ioras, Bucks New University, UK
Luis E. Hernández Gutiérrez, Canary Islands Goverment-INVOLCAN, Spain
Ioan Vasile Abrudan , Brasov University, Romania
Paz Arraiza Bermúdez Cañete, UPM, Spain
Juan Carlos Santamarta-Cerezal, ULL, Spain
Henn Korjus, EMU, Estonia
Environmental security, geological hazards and management© 2013 ISBN 978-84-616-2005-0
10
Viktor Takasz, EFE, Hungary
Jonay Neris Tomé, ULL, Spain
Inés Galindo Jiménez, IGME, Spain
Fernando García Robrero, UPM, Spain
José Luis García Rodríguez, UPM, Spain
José Carlos Goulart Fontes, Universidade dos Açores, Portugal
Roberto Tomás Jover, Universidad de Alicante, Spain
Gerardo Herrera García, IGME, Spain
Antonio Abellán Fernández, Université de Lausanne, Switzerland
Miguel Cano González, Universidad de Alicante, Spain
Roberto Poncela Poncela, ICOG, Spain
Nemesio Pérez, ITER-INVOLCAN, Spain
Javier García Barba, Universidad de Alicante, Spain
Antonio Eff-Darwich Peña, ULL-INVOLCAN, Spain
Elzbieta Skupien, Professional, Spain
Luis Capote Pérez, ULL, Spain
Joaquín Sotelo García, UCM, Spain
Roberto Álvarez Fernández, Antonio Nebrija University, Spain
Alfonso Méndez Cecilia, Universidad de León, Spain
Encarnación Rodríguez Hurtado, UPM, Spain
Humberto Gutiérrez García, Gobierno de Canarias, Spain
Norena Martín Dorta, ULL, Spain
Axel Ritter Rodríguez, ULL, Spain
11
•Proceedings


PART 1
Environmental Security and Sustainability

15
Part 1 Environmental Security and Sustainability
ENVIRONMENTAL SECURITY THREATS IN THE UK CONTEXT: CLIMATE CHANGE AND FOREST PLANTS DISEASES
Florin IorasInstitute for Conservation, Sustainability and Innovation, Buckinghamshire New University,
Queen Alexandra Road, High Wycombe, Bucks HP11 2JZ, United Kingdom
ABSTRACT: Native plant communities, woodlands and landscapes in the UK and across the world are suffering from pathogens introduced by human activities as a result of climate change and are perceived as environmental security threats for national sustainable development . Many of these pathogens arrive on or with living plants. The potential for damage in the future may be large, but current international regulations aimed at reducing the risks take insufficient account of scientific evi-dence and, in practice, are often highly inadequate. In this article is outlined the problems and discuss some possible approaches to reducing the environmental security threats.
1. INTRODUCTION
Considering national security as the key part of national interest, and if the former means freedom from external threat, it is obvious that resources are key determinants. Environmental insecurity is caused by resource shortage, excessive demand and/or by the introduction of an imbalance in resource availability by conflict or natural effects. Humans causes a scarcity of renewable resources in three ways: (i) decreased quality and quantity of renewable resources at higher rates than they are naturally renewed (supply-induced scarcity), (ii) increased population growth or per capita consumption (demand-induced scarcity) and (iii) unequal resource access (structural scarcity) (Homer-Dixon, 1994). The alliance of these three comprises environmen-tal scarcity. The impact of resource scarcity can be resultant of decreased agricultural produc-tion, decreased economic productivity, population displacement and disrupted institutions and social relations. Given the relationship between conflict and resource scarcity, it is clear that environmental security is an important feature of current social, economic and political trends (Dimitrov, 2002). Environmental disruptions determined by conflict-oriented disturbances, such as to destroy food crops as a war tactic and the use of landmines in fields and forests which people depend on for their livelihoods, pose a risk to people health and wellbeing. All of this can diminish the capacity of state survival and national economic viability The idea of directly linking the environment to security concerns was stated by Peter Gleick (1991), who identified what could be primary environmental threats to security, all relevant to resource studies. Resource acquisitions are strategic goals in themselves. Mainly environmental security means national sustainable development (Ioras et all, 2010)
16
Environmental security, geological hazards and management© 2013 ISBN 978-84-616-2005-0
2. CLIMATE CHANGE IN 21ST CENTURY
The earth’s climate has always changed in response to changes in the cryosphere, hydro-sphere, biosphere and other atmospheric and interacting factors. It is widely accepted that human activities are now increasingly influencing changes in global climate (Pachauri & Re-isinger, 2007). Since 1750, global emissions of radiatively active gases, including CO2, have increased rapidly, a trend that is likely to accelerate if increase in global emissions cannot be curbed effectively. Man-made increases in CO2 emissions have come from industry, particu-larly as a result of the use of carbon-based fuels. Over the last 100 years, the global mean temperature has increased by 0.74°C and atmospheric CO2 concentration has increased from 280 p.p.m. in 1750 to 368 p.p.m. in 2000 (Watson, 2001). Temperature is projected to increase by 3.4°C and CO2 concentration to increase to 1250 p.p.m. by ∼2095 under the A2 scenario, accompanied by much greater variability in climate and more extreme weather related events (Pachauri & Reisinger, 2007). Underlying these trends is much spatial and temporal hetero-geneity, with projections of climate change impacts differing among various regions on the globe. Some of this is clear in the outputs from models that take into account geographic geographic criteria such as land mass distribution, topography, ocean currents and water masses, and known meteorological features such as air streams. Nevertheless, historic data show seasonal and regional variation not accounted for in model processes (e.g. Barnett et al., 2006) that have major implications for practical processes such as crop sowing, harvest or pest and pathogen infection and therefore all the activities that derive from these effects.
Defining uncertainty is important in all areas of climate change research, not only in assump-tions for stochastic or deterministic models, but also in biological processes where knowl-edge or understanding is lacking. To understand how best to control plant diseases to in the context of climate change, plant protection professionals must work with societal change, defining its key processes and influencers to effect change.
Major problems may arise if a pathogen escapes – or is introduced – to another region of the world where the native plants have little resistance and the pathogen has eluded its natural enemies. Such events can trigger damaging disease episodes that may also have long-term negative impacts on the environment, economy and cultural heritage.
Movement of plants and plant products between bio-geographical zones by human activities is now generally accepted to be the primary mode of introduction of exotic pathogens and pests. There is therefore a tension, in terms of risk to the cultural and natural environment, between the conservation and environmental responsibilities of horticulturalists, foresters, garden designers and landscape architects and their desire for novel material or (these days) cheaper plants and instant trees.
Since the 1990s a stream of invasive pathogens potentially damaging to trees, natural ecosys-tems and horticulture has been entering the UK. Notable examples include the alder dieback pathogen P. alni ; the ‘sudden oak death’ (SOD) pathogen P. ramorum ; the similar P. ker-
17
Part 1 Environmental Security and Sustainability
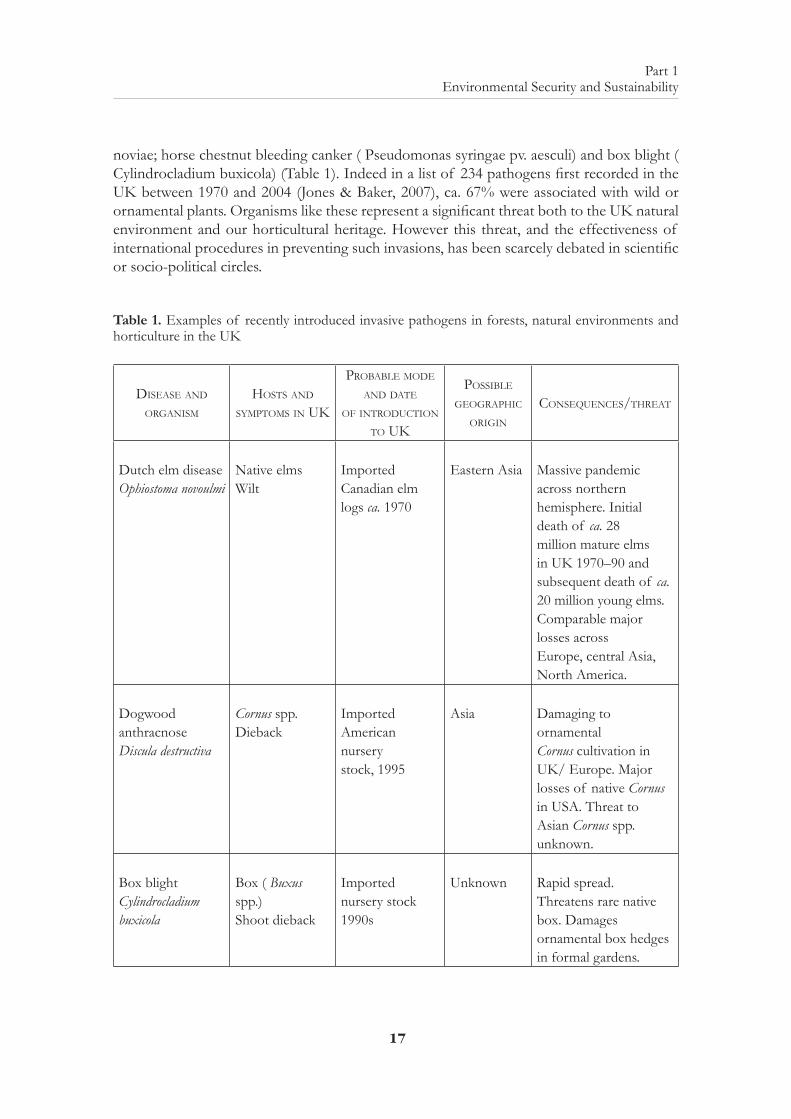
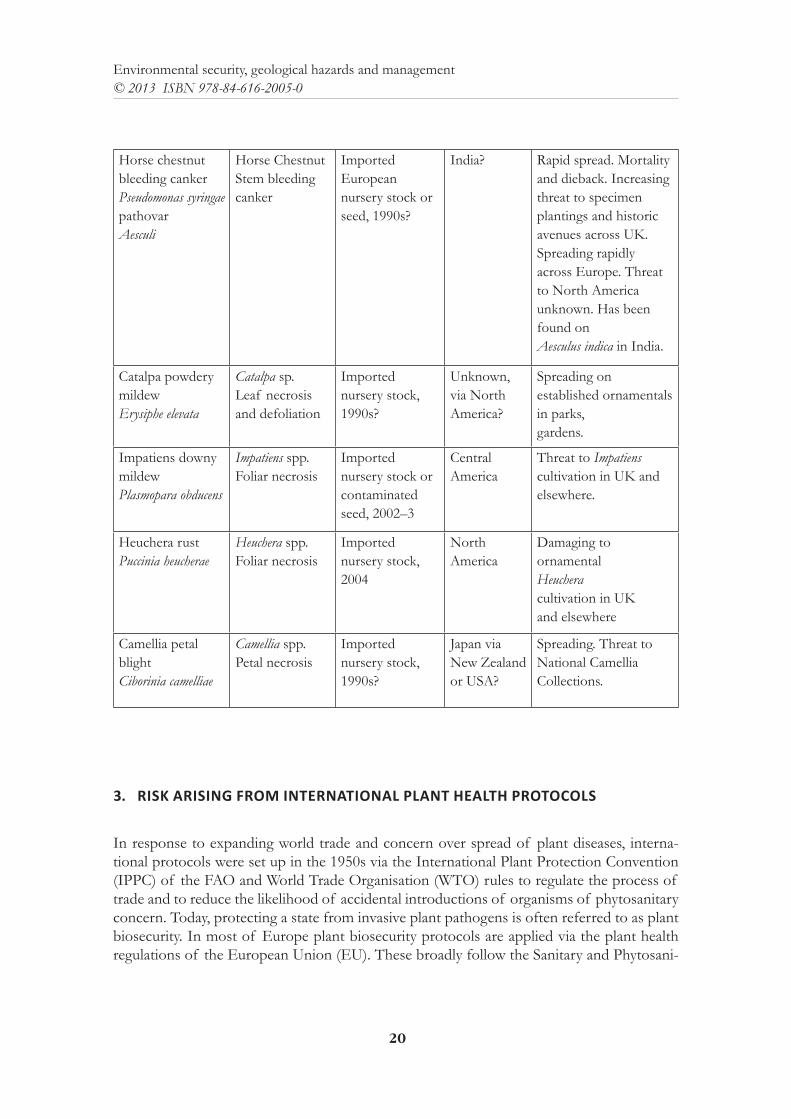
noviae; horse chestnut bleeding canker ( Pseudomonas syringae pv. aesculi) and box blight ( Cylindrocladium buxicola) (Table 1). Indeed in a list of 234 pathogens first recorded in the UK between 1970 and 2004 (Jones & Baker, 2007), ca. 67% were associated with wild or ornamental plants. Organisms like these represent a significant threat both to the UK natural environment and our horticultural heritage. However this threat, and the effectiveness of international procedures in preventing such invasions, has been scarcely debated in scientific or socio-political circles.
Table 1. Examples of recently introduced invasive pathogens in forests, natural environments and horticulture in the UK
disease and organism
Hosts and symptoms in uK
probable mode and date
of introduction to uK
possible geograpHic
origin
consequences/tHreat
Dutch elm diseaseOphiostoma novoulmi
Native elmsWilt
Imported Canadian elmlogs ca. 1970
Eastern Asia Massive pandemic across northern hemisphere. Initial death of ca. 28 million mature elms in UK 1970–90 and subsequent death of ca. 20 million young elms. Comparable major losses acrossEurope, central Asia, North America.
Dogwood anthracnoseDiscula destructiva
Cornus spp.Dieback
Imported American nurserystock, 1995
Asia Damaging to ornamentalCornus cultivation in UK/ Europe. Major losses of native Cornusin USA. Threat to Asian Cornus spp. unknown.
Box blightCylindrocladium buxicola
Box ( Buxus spp.)Shoot dieback
Imported nursery stock 1990s
Unknown Rapid spread. Threatens rare native box. Damagesornamental box hedges in formal gardens.
18
Environmental security, geological hazards and management© 2013 ISBN 978-84-616-2005-0
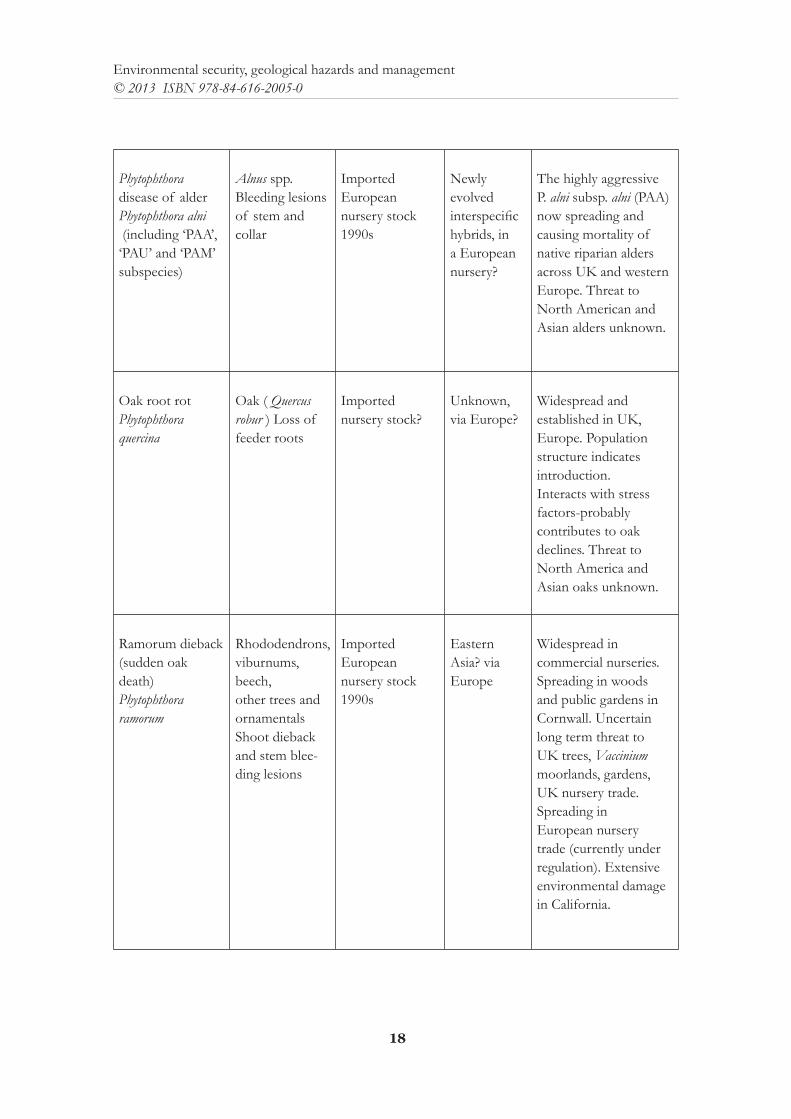
Phytophthoradisease of alderPhytophthora alni (including ‘PAA’,‘PAU’ and ‘PAM’ subspecies)
Alnus spp.Bleeding lesions of stem and collar
Imported European nursery stock 1990s
Newly evolved interspecifichybrids, in a European nursery?
The highly aggressiveP. alni subsp. alni (PAA) now spreading and causing mortality of native riparian alders across UK and western Europe. Threat toNorth American and Asian alders unknown.
Oak root rotPhytophthora quercina
Oak ( Quercus robur ) Loss of feeder roots
Imported nursery stock?
Unknown, via Europe?
Widespread and established in UK, Europe. Population structure indicates introduction.Interacts with stress factors-probably contributes to oak declines. Threat to North America and Asian oaks unknown.
Ramorum dieback(sudden oak death)Phytophthora ramorum
Rhododendrons, viburnums, beech,other trees and ornamentalsShoot dieback and stem blee-ding lesions
Imported European nursery stock 1990s
Eastern Asia? via Europe
Widespread in commercial nurseries. Spreading in woods and public gardens in Cornwall. Uncertainlong term threat to UK trees, Vaccinium moorlands, gardens, UK nursery trade. Spreading in European nursery trade (currently under regulation). Extensive environmental damage in California.
19
Part 1 Environmental Security and Sustainability
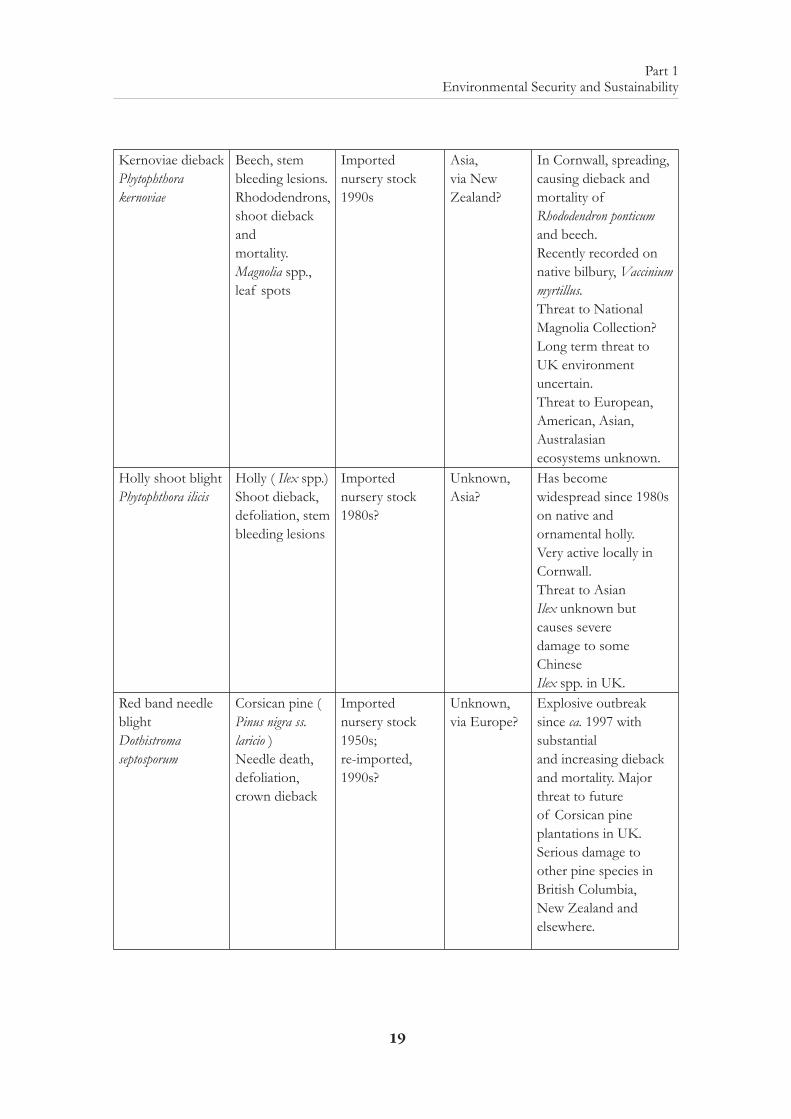
Kernoviae diebackPhytophthora kernoviae
Beech, stem bleeding lesions. Rhododendrons, shoot dieback andmortality.Magnolia spp., leaf spots
Imported nursery stock 1990s
Asia, via New Zealand?
In Cornwall, spreading, causing dieback andmortality of Rhododendron ponticum and beech.Recently recorded on native bilbury, Vaccinium myrtillus.Threat to National Magnolia Collection?Long term threat to UK environment uncertain.Threat to European, American, Asian, Australasianecosystems unknown.
Holly shoot blightPhytophthora ilicis
Holly ( Ilex spp.)Shoot dieback, defoliation, stem bleeding lesions
Imported nursery stock 1980s?
Unknown, Asia?
Has become widespread since 1980s on native andornamental holly. Very active locally in Cornwall.Threat to AsianIlex unknown but causes severedamage to some ChineseIlex spp. in UK.
Red band needle blightDothistroma septosporum
Corsican pine (Pinus nigra ss. laricio )Needle death, defoliation, crown dieback
Imported nursery stock 1950s;re-imported, 1990s?
Unknown, via Europe?
Explosive outbreak since ca. 1997 with substantialand increasing dieback and mortality. Major threat to future of Corsican pine plantations in UK. Serious damage to other pine species in British Columbia,New Zealand and elsewhere.
20
Environmental security, geological hazards and management© 2013 ISBN 978-84-616-2005-0
Horse chestnut bleeding cankerPseudomonas syringae pathovarAesculi
Horse ChestnutStem bleeding canker
Imported European nursery stock or seed, 1990s?
India? Rapid spread. Mortality and dieback. Increasingthreat to specimen plantings and historic avenues across UK. Spreading rapidly across Europe. Threatto North America unknown. Has been found onAesculus indica in India.
Catalpa powdery mildewErysiphe elevata
Catalpa sp.Leaf necrosis and defoliation
Imported nursery stock, 1990s?
Unknown, via North America?
Spreading on established ornamentals in parks,gardens.
Impatiens downy mildewPlasmopara obducens
Impatiens spp.Foliar necrosis
Imported nursery stock or contaminated seed, 2002–3
Central America
Threat to Impatienscultivation in UK and elsewhere.
Heuchera rustPuccinia heucherae
Heuchera spp.Foliar necrosis
Imported nursery stock, 2004
North America
Damaging to ornamentalHeucheracultivation in UKand elsewhere
Camellia petal blightCiborinia camelliae
Camellia spp.Petal necrosis
Imported nursery stock, 1990s?
Japan via New Zealand or USA?
Spreading. Threat to National Camellia Collections.
3. RISK ARISING FROM INTERNATIONAL PLANT HEALTH PROTOCOLS
In response to expanding world trade and concern over spread of plant diseases, interna-tional protocols were set up in the 1950s via the International Plant Protection Convention (IPPC) of the FAO and World Trade Organisation (WTO) rules to regulate the process of trade and to reduce the likelihood of accidental introductions of organisms of phytosanitary concern. Today, protecting a state from invasive plant pathogens is often referred to as plant biosecurity. In most of Europe plant biosecurity protocols are applied via the plant health regulations of the European Union (EU). These broadly follow the Sanitary and Phytosani-
21
Part 1 Environmental Security and Sustainability
tary Agreement (SPS) of the World Trade Organisation as consolidated in the 1990s. In the UK, EU regulations are usually regulated and operated to a high standard (plant health teams within the Department for Environment, Food and Rural Affairs (Defra) and the UK Forestry Commission (FC) have many skilled officers and scientists). Equally, many involved in the UK plant trade aim to adhere to the protocols and to minimise the risks involved. However, in the light of recent developments in the plant trade itself and of regular breaches of UK plant biosecurity ( cf. Table 1; and Jones & Baker, 2007), some tenets underlying the protocols must now be viewed as outdated and seriously flawed.
4. PROBLEMS WITH IDENTIFYING THE RISK
The SPS Agreement of the World Trade Organisation aims to minimise any disruption to trade that plant health regulation might impose. The intention is to ensure that global com-mercial trade in plants is not unduly hindered by artificial barriers; apparently without ques-tion as to whether such international trade is a fundamentally sound or unsound process based on scientific and global environmental grounds.
The protocols principally involve the production of lists of named harmful organisms. These tend to concentrate on organisms likely to affect widely grown agricultural commodities and timber. The case for inclusion of each organism must be founded in ‘sound science’. By defi-nition, all ‘unlisted’ organisms remain unregulated. However, the lists principally comprise pathogens that have already escaped from their geographical centres of origin and started to cause overt disease in another part of the globe. Many of these ‘newly escaped’ organisms were previously unknown to science and were not therefore on any international list before they escaped (Brasier, 2005). Dutch elm disease, sudden oak death, phytophthora disease of alder, and box blight in the UK (Table 1) are all examples of major disease episodes caused by previously unknown pathogens.
Based on these and similar examples, and on estimates that only 7–10% of all fungal species having so far been identified (Hawksworth, 2001; Crous & Groenwald, 2005), some 90% of pathogens may be unknown to science. The number of unknown species of Phytophthora , for example, arguably the world’s most destructive group of plant pathogens, may be between 100 and 500 (Brasier, 2008).
Darwinian evolution predicts that, being adapted to and co-evolved with their hosts, many of these pathogens are unlikely to do noticeable damage in their native ecosystems, and so are less likely to be detected. Thus a previous survey in the Himalayas led to the discovery of a third species of Dutch elm disease fungus, unknown to science, highly aggressive to European elms, yet apparently benign on Himalayan elm species (Brasier & Mehrotra, 1995). Both practical experience and predictive science, therefore, dictate that current SPS proto-cols are flawed. First, because they tend to concentrate on only the most noticeable escapees and so come into effect only after a problem is identified. Second, because they may cover
22
Environmental security, geological hazards and management© 2013 ISBN 978-84-616-2005-0
only a minority of the organisms which pose a threat. Moreover, since they largely ignore the risk from benign, co-evolved, un escaped organisms, the protocols may ignore the risk from 90% of potential pathogens. In this sense, therefore, they are non-Darwinian. Rather than focus on already escaped organisms, it is paramount to concentrate on scientific facts and principles which indicate that pathogens need to be contained within their centres of origin; not distributed around the world and subject to regulation only when causing visible damage beyond their natural range.
5. CONSEQUENCES FOR THE UK ENVIRONMENT HERITAGE
Many of the examples of recently invasive pathogens listed in Table 1 are organisms previ-ously unknown to science; and most were probably introduced via nursery stock or a similar import pathway. Sometimes their initial impact on the UK ‘natural environment’ is severe and rapid, as with Dutch elm disease. Often it is more gradual, as with the current mortal-ity and decline of native alder caused by P. alni (Table 1). Some incursions may remain un-detected or may not be noticed for decades, especially if they are weak pathogens such as the oak rootlet pathogen P. quercina (Table 1). Nonetheless weak pathogens can, over time, contribute to chronic disease complexes or declines (such as the current oak decline across Europe) that may become acute if exacerbated by climatic or other environmental stress on the host (Jönsson, 2004). This potential for longer term damage is one reason why the arrival of any alien plant pathogen, however initially benign, should be considered a biosecurity risk.
Often, the resulting damage extends well beyond the effect on an individual host species. Invasive pathogens may destabilise entire local ecosystems (e.g. P. cinnamomi, Table 1); and affect associated factors such as dependent wildlife, hydrology, fire control, recreation and public amenity (see Waage et al. 2005). To this must sometimes be added the costs of at-tempted eradication, damage to rural economies, loss of tourism and loss of carbon storage value. The present sudden oak death outbreak in California is negatively affecting wildlife food chains, fire control, native tribal traditions and land values. The current death of alders along UK and European rivers is damaging riparian ecosystems, destabilizing river banks and affecting shelter for fish, birds and other wildlife.
The loss of some 28 million elms in the UK between 1970 and 1990 resulted in habitat loss for insects, birds, fungi and microbes. It also involved the loss of a characteristic English lowland landscape (cf. the ‘elmscapes’ in some of the artist John Constable’s Dedham-area paintings or his views of Salisbury Cathedral); and the impoverishment of upland woodland communities in Scotland and Wales. Simple economic formulae are sometimes applied to such landscape-scale losses, based mainly on visual and shade impact of the trees. For ex-ample in the 1980s, US landscape assessors put the net value of a high value amenity elm at about $2000 per annum; and a modern formula estimates the net value of a small, 6·4 cm diameter disease resistant elm sapling with a potential life of 50 years at ca. £23 000 or £460 p.a. (Scott & Betters, 2000; Anon, 2007). However, in many ways such landscape-scale losses
23
Part 1 Environmental Security and Sustainability
are irreplaceable, and the formulae, while providing a guide, also seem redolent of ‘knowing the price of everything and value of nothing’. Can we truly put a price on the possible loss of native box (Table 1) from the popular amenity area, Box Hill, Surrey; or the loss of London Plane from the capital’s streets and parks to C. platani? How does one ‘value’ evolutionary his-tory or cultural heritage? Invasive pathogens also damage our horticultural heritage, affecting arboreta, specialist collections and historic gardens. One current example is horse chestnut bleeding canker caused by the bacterium Pseudomonas syringae pv. aesculi (Table 1). This has all the hallmarks of an introduced organism. Spreading rapidly, it has already infected tens of thousands of individual trees and many heritage avenues. Another is P. ramorum. This is not only affecting native woodland beech and understory rhododendron in the south west. It is damaging exotic trees (e.g. Nothofagus, Magnolia, Drymis), historic specimen rhododendrons and shrubs in famous gardens such as those of the National Trust. Its arrival represents a potential threat to the National Council for the Conservation of Plants and Gardens (NC-CPG) National Camellia and Pieris collections and to Vaccinium moor-land across Britain. Its ‘co-arrivee’, P. kernoviae (Table 1), is now present on, and must therefore be considered a threat to, the NCCPG National Magnolia Collection. It has also been found recently on Vac-cinium in semi-natural ancient oak woodland. Phytophthora ilicis (Table 1), in addition to causing dieback and defoliation of native holly, is killing specimen Chinese holly trees coming from early collections (e.g. those of E.H. Wilson) and damaging ornamental holly in public gar-dens. Susceptible species in the NCCPG National Collection of Cornus have been affected by dogwood anthracnose; while box blight not only threatens native box but causes serious damage to formal box hedges in historic gardens.
6. ADDRESSING THE ISSUE: INITIATING SYSTEM REFORM
The protocol weaknesses outlined above, together with the steady procession of invasive, clearly indicate that the movement of living plants, especially rooted nursery stock, between vegetation zones or continents is a high-risk process. Further major episodes in the UK, such as a loss of Plane trees across London to C. platani or a loss of oaks on a scale comparable to Dutch elm disease, may seem unthinkable. Yet, in view of the frequency and character of recent incursions, I would suggest that none of our amenity plantings or native ecosystems, from oak forests to grouse moors, can now be considered sufficiently biologically secure.
Surprisingly, there is a general lack of awareness about the extent of the invasive pathogen problem among trade professionals such as horticulturalists and foresters, conservationists and environmental scientists and even among some plant pathologists. Furthermore, inter-national regulatory protocols appear to be conducted in much of the world as if there were no fundamental flaws, the application of the protocols sometimes giving the impression of being institutionalized and ‘box ticking’. There is also little serious international debate on the issue either at a scientific or at a political level. Equally, there is little awareness of the issues among the buying public. Rather, there is a serious gap in public education regarding disease risk from imported plants, the geographic origins of the plants they purchase and the
24
Environmental security, geological hazards and management© 2013 ISBN 978-84-616-2005-0
chemical treatments that have been applied to them. In this regard, there has been virtually no public debate in the UK and little serious attempt by government agencies, horticultural journalists, nature conservation bodies or the trade to heighten public awareness. In contrast to the level of public debate on other risk issues such as climate change, genetically modified organisms or ‘bird flu’, the question of plant biosecurity has tended to be overlooked.
As indicated above, the Phytophthora-nursery situation developing in the EU is perhaps best described as one of bio-insecurity, rather than biosecurity. In terms of the consumer’s right to be informed, therefore, there must also be a strong case for the EU and the trade to thor-oughly investigate, and to publicize, the quarantine and non quarantine Phytophthora species (and other pathogens?) infesting nursery stock within the Community, and the frequency of their movement between EU states
7. CONCLUSION
Given that the detection of the early spread of many tree diseases remains difficult, the best policy appears to be to adopt a precautionary approach, taking steps at national borders to ensure that diseases similar to Dutch elm disease do not enter the country in the first place . However, whilst increasing quarantine measures or rates of inspection will certainly help in preventing the entry of known pests and diseases, this has to be founded on a sound knowledge of all potential invasive organisms, which in itself relies on knowing what all the potential threats are.
Clearly there will be introductions of pests and diseases that are unknown, or of unknown threat, where the development of management plans (e.g. whether to control or not) will benefit from modelling such as this as soon as sufficient data is available to build a reliable model. Indeed the current Dutch elm disease epidemic on the Isle of Man is being investi-gated using a fine scale spatial agent-based model to prioritize management effort.
REFERENCES
ANON (2007). Cavat (Capital asset value for amenity trees). In: Risk Limitation Strategy for T r e e Root Claims, Appendix B. http://www.ltoa.org.uk/docs/LTOA_Risk_Limitation_Strategy.pdf
BARNETT C., HOSSELL J., PERRY M., PROCTER C., HUGHES G. (2006). A Hand book of Climate Trends Across Scotland. Scotland: Scotland & Northern Ireland
Forum for Environmental Research (SNIFFER): SNIFFER project CC03.BRASIER C. M., (2005). Preventing invasive pathogens: deficiencies in the system. The Plants-
man (4), 54–7.BRASIER C.M. (2008). Phytophthora ramorum + Phytophthora kernoviae = interna tional biosecurity failure. In: Frankel SJ, Kliejunas T, Palmieri KM, eds. Proceedings of the Sudden
Oak Death Third Science Symposium. USDA Forest Service General Technical Report P S W-GTR-214. Albany, CA,
25
Part 1 Environmental Security and Sustainability
BRASIER C.M., MEHROTRA M.D. (1995). Ophiostoma himalulmi sp.nov. a new species of Dutch elm disease fungus endemic to the Himalayas. Mycological Research 99, 205–15.
CHAKRABORTY S., NEWTON A.C.(2011). Climate change, plant diseases and food security: an overview. Plant Pathology 60, 2-14.
CROUS P.W., GROENEWALD J.Z. (2005). Hosts, species and genotypes: opinions versus d a t a . Australasian Plant Pathology 34, 463– 70.
DIMITROV, R. (2002). Water, Conflict, and Security: a Conceptual Minefield. Society and Natural Resources. 15, p. 313-334. 2002.GLEICK P. (1991). Environment and Security: the Clear Connections. Bulletin of Atomic Scientists. 47:3. p. 16-21. 1991.HAWKSWORTH D.L. (2001). The magnitude of fungal diversity: the 1.5 million species estimate revisited. Mycological Research 105, 1422–32.HOMER-DIXON T.F. (1994). Environmental Scarcity and Violent Conflict: Evidence from Cases. International Security. 19:2, p.4-40. 1994.IORAS F., DAUTBASIC M., WOOD P., RATNASINGAM J. (2010). Environmental security
in post war Bosnia and Herzegovina.. In Proceedings of the Biennial International Symposium, Forest and Sustainable Development, Bras ̧ov, Romania, 15-16th October 2010,
755- 760.JONES D.R., BAKER R.H.A. (2007). Introductions of non-native pathogens into Great Briain,
1970–2004. Plant Pathology 56, 891–910.JÖNSSON U. (2004). Phytophthora species and oak decline – can a weak competitor cause signifi-
cant damage in nonsterilized acidic soil. New Phytologist 162, 211–22.PACHAURI R.K., REISINGER A. (2007). Climate Change 2007: Synthesis Report. Contribution of Working Groups I, II and III to the Fourth Assessment Report of the Inter
governmental Panel on Climate Change. Geneva, Switzerland: IPCC.SCOTT J.L., BETTERS D.R. (2000). Economic analyses of urban tree replacement decisions. Journal of Arboriculture 26, 69–77.WAAGE J.K., MUMFORD J.D., FRASER R.D. (2005). Non-native pest species: changing patterns mean changing policy issues. Proceedings of the British Crop Protection Council International Congress – Crop Science and Technology 2005, 725–32.WATSON R.T. (2001). Climate Change 2001: Synthesis Report. A Contribution of Working
Groups I, II, and III to the Third Assessment Report of the Intergovernmental Panel on Cli mate Change. Cambridge, UK: Cambridge.

27
Part 1 Environmental Security and Sustainability
THE EU TARGETS FOR REDUCING GREENHOUSE GAS EMISSIONS FROM POLISH ECONOMIC PERSPECTIVE
Jakub PiecuchInstitute of Economic and Social Sciences, University of Agriculture in Krakow,
A. Mickiewicza 21, 31-120, Krakow, Poland
ABSTRACT: Member States of the European Union, in order to become more competitive and ad-vanced in the research and development process, launched in 2010 a strategy for sustainable growth, called the Europe 2020. Out of the five ambitious objectives – on employment, innovation, educa-tion, social inclusion and climate challenges, the last one seems to be the most controversial. In the countries where energy production is mostly based on fossils fuels, the use of renewable energy sources has just started and the way to developed economy sill lies ahead of them, strategy 2020 seems to stop economic progress. The perfect example of such a country is Poland. This publication provides an overview of the consequences of the EU climate and energy policy upon the economic situation in Poland.
1. INTRODUCTION
During the Lisbon Council in 2000, the European Community set itself a new strategic goal – to become the most competitive and dynamic knowledge-based economy in the world, capable of sustainable economic growth with more and better jobs and greater social cohe-sion. The major part of this strategy was focused on creating conditions for full employment and strengthened cohesion by the end of the year 2010 [European Commission 2005]. But even before the year 2010, it became clear that the EU would not be able to achieve the desire objectives. In the new economic environment formed by global financial crisis, the European Union had to rethink its strategy. Much like most other countries across the world, Western European economies are going through a period of recession. The global financial crisis has reduced decades of economic progress and emphasized important structural weaknesses in the European economy. Even in times of crisis long-standing challenges connected with the globalization process, a lack of natural resources and pressure on the effective use of the remaining ones and an ageing population have become even more urgent problems. The new situation forced the European Commission to change its attitude and try to adapt to this new social and economic environment. The structural disadvantages in the Euro zone and other EU member countries underline by the crisis can be solved through introducing a wide range of structural reforms adapted to a completely new economic climate. All the changes the Eu-ropean Community suggested are based on EU common policies. To survive, the European Union needs to become far more competitive and advanced in the research and development
28
Environmental security, geological hazards and management© 2013 ISBN 978-84-616-2005-0
process. In order to undertake these issues, in 2010 all Member States of the European Un-ion launched a strategy for sustainable growth, called the Europe 2020 strategy. This strategy should deal both with the current gigantic economic and social problems closely linked to the financial crisis and the need for structural reforms guaranteeing a dynamic economic growth in the long term perspective. Out of the five ambitious objectives – on employment, innovation, education, social inclusion and climate challenges - to be reached by 2020, the last one seems to be the most controversial. As it is set in Europe 2020, by the end of the strategy greenhouse gas emis-sions should be limited by 20 % or even 30 % compared to the 1990 levels, renewable energy sources should create 20 % of energy needs and the European energy efficiency should be higher by 20 % [European Union 2013]. Additionally, in July 2009, the countries of the European Union and the G8 announced an objective to reduce greenhouse gas emissions by at least 80% below the 1990 levels by 2050. In October 2009 the European Council set the goal for its developed economies at 80-95% below the 1990 levels by 2050 [Faber 2012]. These goals are controversial especially in the countries where energy production is mostly based on fossils fuels, the use of renew-able energy sources has just started and the way to developed economy sill lies ahead of them. The perfect example of such a country is Poland.
This publication provides an overview of the consequences of the EU climate and energy policy upon the economic situation in Poland. European structural funds have been among the most important instruments of determining positive changes in Polish economy since the integration with the EC but only a small part of them was used to reduce dependence on energy production from fossil fuels. Currently, with much stronger tendency to reduce CO2 emission to the atmosphere, industrial manufacturing costs are becoming much higher with all the consequences of this fact: lower production levels, unemployment and a growing development gap between Polish and West-European economies. From this perspective of Central European countries, the changes which took place in the climate policy are impor-tant, because the necessity of welfare increase in less developed economies is understandable but the current tendency in political attitude puts more restrictions on this process. This pa-per focuses on the national level. The research is based on the analysis of reports prepared by the European Commission as well as national studies. Data collected or estimated by the Central statistical Office in Poland (GUS), EUROSTAT, OECD and AMECO have also been used.
The first part of the paper demonstrates economic changes in Poland since the accession to the European Union. The second part is focused on the consequences of the EU climate and energy policy upon the economic situation of Poland. The chronological range covers the period from the early 21st century tothe current programming period ending in 2013.
29
Part 1 Environmental Security and Sustainability
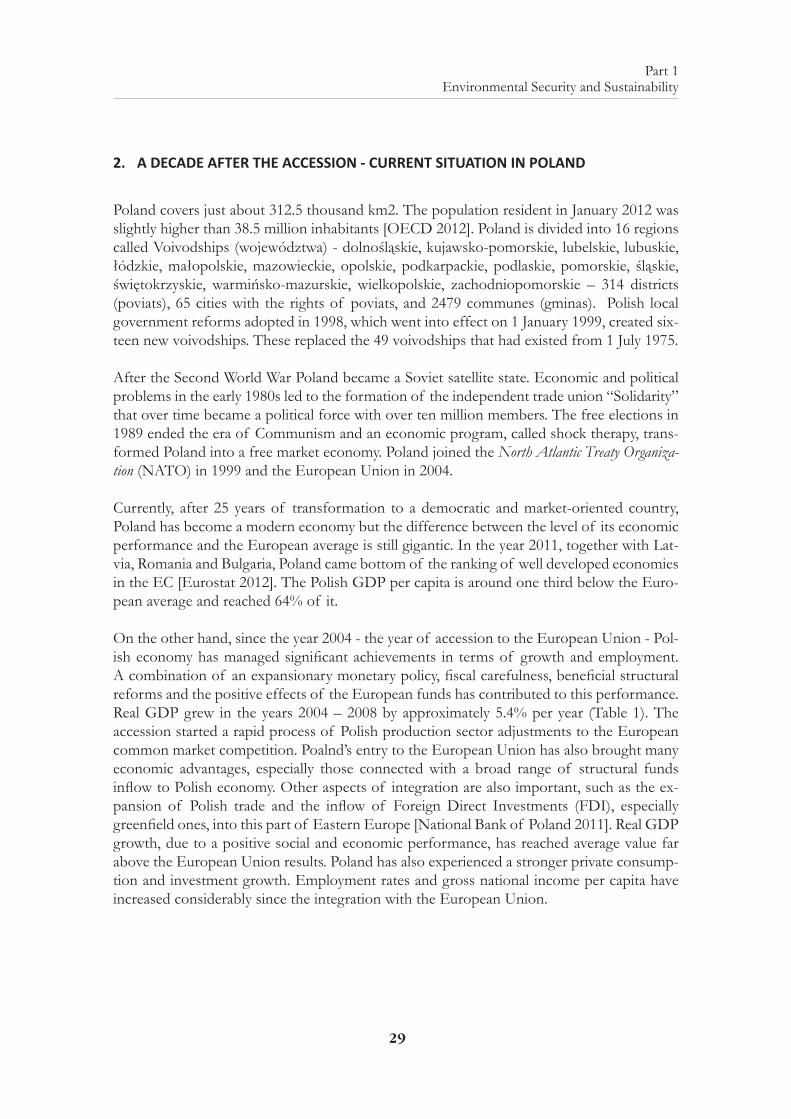
2. A DECADE AFTER THE ACCESSION - CURRENT SITUATION IN POLAND
Poland covers just about 312.5 thousand km2. The population resident in January 2012 was slightly higher than 38.5 million inhabitants [OECD 2012]. Poland is divided into 16 regions called Voivodships (województwa) - dolnośląskie, kujawsko-pomorskie, lubelskie, lubuskie, łódzkie, małopolskie, mazowieckie, opolskie, podkarpackie, podlaskie, pomorskie, śląskie, świętokrzyskie, warmińsko-mazurskie, wielkopolskie, zachodniopomorskie – 314 districts (poviats), 65 cities with the rights of poviats, and 2479 communes (gminas). Polish local government reforms adopted in 1998, which went into effect on 1 January 1999, created six-teen new voivodships. These replaced the 49 voivodships that had existed from 1 July 1975.
After the Second World War Poland became a Soviet satellite state. Economic and political problems in the early 1980s led to the formation of the independent trade union “Solidarity” that over time became a political force with over ten million members. The free elections in 1989 ended the era of Communism and an economic program, called shock therapy, trans-formed Poland into a free market economy. Poland joined the North Atlantic Treaty Organiza-tion (NATO) in 1999 and the European Union in 2004.
Currently, after 25 years of transformation to a democratic and market-oriented country, Poland has become a modern economy but the difference between the level of its economic performance and the European average is still gigantic. In the year 2011, together with Lat-via, Romania and Bulgaria, Poland came bottom of the ranking of well developed economies in the EC [Eurostat 2012]. The Polish GDP per capita is around one third below the Euro-pean average and reached 64% of it.
On the other hand, since the year 2004 - the year of accession to the European Union - Pol-ish economy has managed significant achievements in terms of growth and employment. A combination of an expansionary monetary policy, fiscal carefulness, beneficial structural reforms and the positive effects of the European funds has contributed to this performance. Real GDP grew in the years 2004 – 2008 by approximately 5.4% per year (Table 1). The accession started a rapid process of Polish production sector adjustments to the European common market competition. Poalnd’s entry to the European Union has also brought many economic advantages, especially those connected with a broad range of structural funds inflow to Polish economy. Other aspects of integration are also important, such as the ex-pansion of Polish trade and the inflow of Foreign Direct Investments (FDI), especially greenfield ones, into this part of Eastern Europe [National Bank of Poland 2011]. Real GDP growth, due to a positive social and economic performance, has reached average value far above the European Union results. Poland has also experienced a stronger private consump-tion and investment growth. Employment rates and gross national income per capita have increased considerably since the integration with the European Union.
30
Environmental security, geological hazards and management© 2013 ISBN 978-84-616-2005-0
Table 1. Polish economy main indicators (2000 – 2011)
2000 2001 2002 2003 2004 2005 2006 2007 2008 2009 2010 2011
Total population (1000) 38256 38254 38242 38219 38191 38174 38157 38125 38116 38136 38167 38530
Employment rates1) 55.0 53.5 51.7 51.4 51.9 53.0 54.5 57.0 59.2 59.3 59.3 59.7
Unemployment rates 16.1 18.3 20.0 19.7 19.1 17.9 13.9 9.6 7.0 8.1 9.6 9.6
Gross domestic expenditure on R&D2) 0.64 0.62 0.56 0.54 0.56 0.57 0.56 0.57 0.60 0.68 0.74 0.77
Inflows of foreign direct investment3) 10.3 6.4 4.4 4.1 10.2 8.3 15.7 17.2 10.1 9.9 6.7 10.9
HICP-Inflation rate4) 10.1 5.3 1.9 0.7 3.6 2.2 1.3 2.6 4.2 4.0 2.7 3.9
Government deficit5) -3 -5.3 -5 -6.2 -5.4 -4.1 -3.6 -1.9 -3.7 -7.4 -7.9 -5
Gross national income per capita6) 10529 10924 11524 11869 12655 13523 14685 16161 17699 18256 19240 20480
Real GDP growth 4.3 1.2 1.4 3.9 5.3 3.6 6.2 6.8 5.1 1.6 3.9 4.3
Real labour productivity per person employed7) 5.9 3.5 4.6 5.1 4.2 1.4 3.0 2.2 1.2 1.2 3.4 3.3
General government gross debt8) 36.8 37.6 42.2 47.1 45.7 47.1 47.7 45 47.1 50.9 54.8 56.4
1) Share of persons of working age (15 to 64 years) in employment. 2) As a percentage of GDP. 3) Billions of euros 4) Annual average rate of change (%). 5) As a percentage of GDP. 6)
US dollars. Current prices and PPPs. 7) Percentage change on previous period. 8) As a percentage of GDP
Source: OECD, Factbook 2011-2012: Economic. Environmental and Social Statistics, OECD Publications, Paris 2012. Teichgraber M., European Union Labour Force Survey – Annual results 2011, Eurostat, Statistics in focus 40/2012.
Despite these positive changes, Poland is one of the least developed economies among all the 27 Members States. Its location outside the main European economic centers causes considerable problems with reducing the development gap between Poland and the group of well developed European Union members. Economic growth is limited by weaknesses in certain areas: in the year 2011 the inflation rate was high – close to 4% as compared to the year 2010; recession is possible in 2013; unemployment exceeds 14% of the labour force and labour productivity is lower than the average level in the EU area.
31
Part 1 Environmental Security and Sustainability
3. ECONOMIC AND SOCIAL PERSPECTIVE OF EUROPEAN CLIMATE POLICY IN POLAND
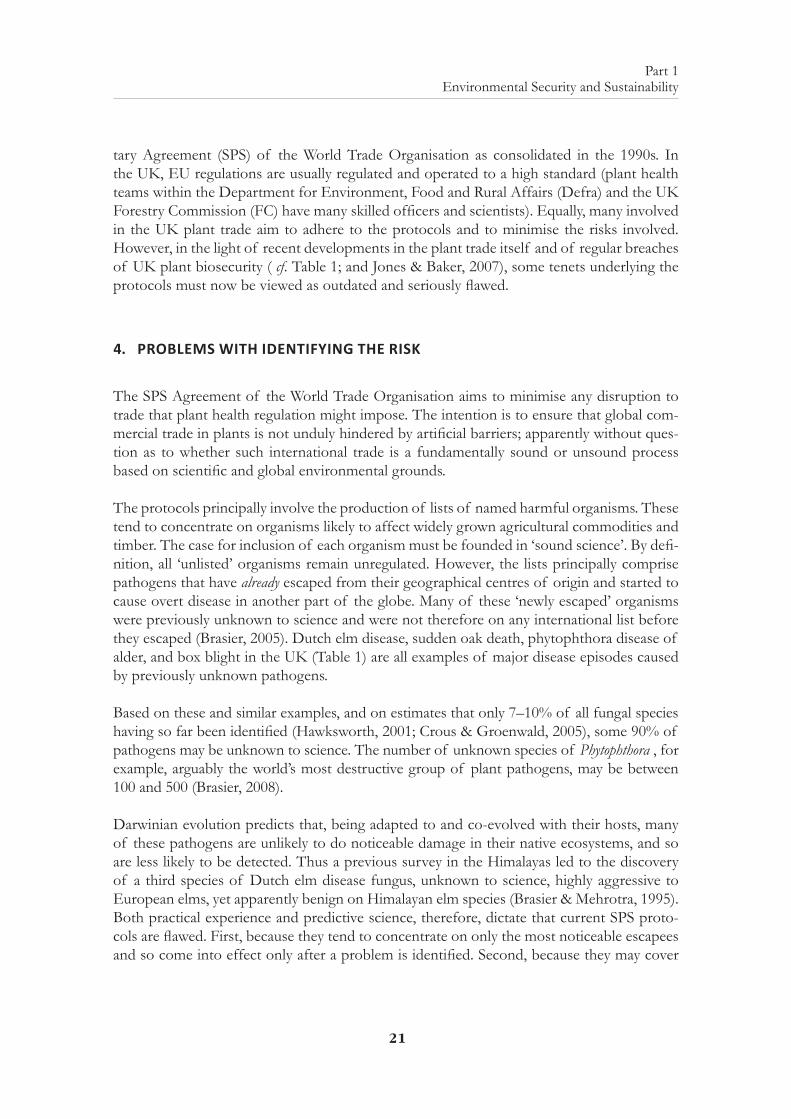
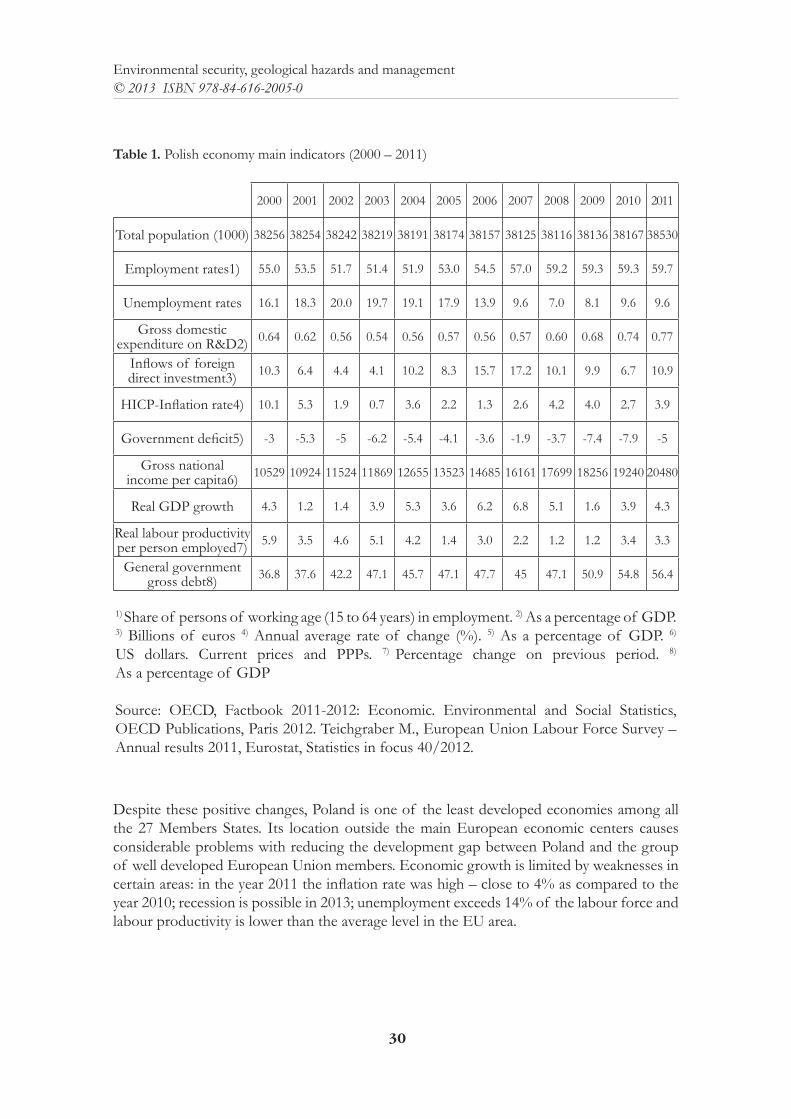
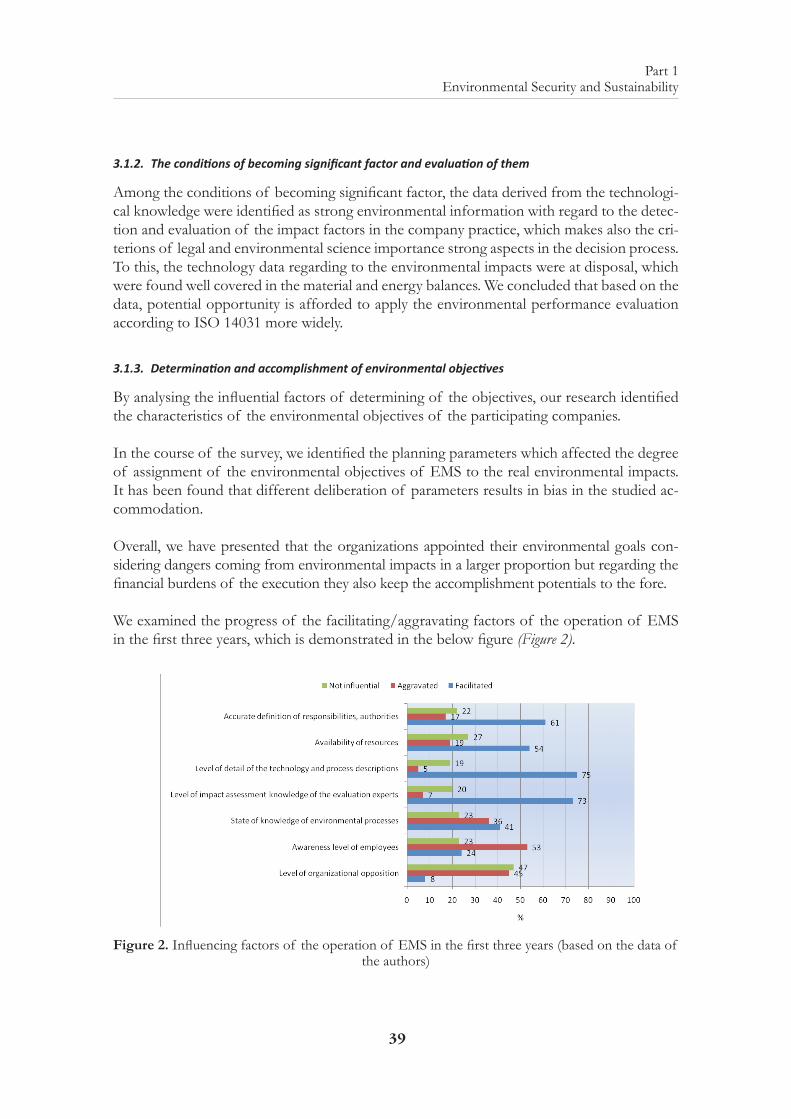
After centuries of fast economic development, it become more and more clear that impor-tant changes in the global climate which can be seen in the surrounding environment are the results of human activity. Global temperature has increased as an effect of greenhouse gas emission and causes more than a few major problems: a decrease of water availability in many regions, a reduction of crop yields in most of tropical areas, an increase in human exposure to different types of diseases, an increase in the probability of flooding (sea-level rise), a lower labour productivity (heat stress) or higher energy consumption (summer cool-ing) [Common and Stagl 2005]. Even though one can find counterarguments, it became evi-dent that global warming has very serious and universal consequences. The question is who should bear the costs of the reduction of CO2 emission to the atmosphere. Is it an obliga-tion of rich and well developed economies or undeveloped ones with out-of-date technolo-gies and a huge appetite for energy – just like Poland? Nowadays, undeveloped and middle-income countries account for more than half of the total carbon emissions and developed economies for only 47% (Figure 1).
2
3
6
34
50
56
64
47
38
0 20 40 60 80
CO2 emissions 1850 -2005*
CO2 emissions 2005*
Greenhouse-gasemissions from all sectors
2005
(%)
Low-income countries Middle-income countries High-income countries
Figure 1. Global carbon-dioxide and greenhouse-gas emissions by group of countries, 1850 – 2005 (%). Source: The World Bank, World Development Report 2010. Development and Climate Change,
Washington 2010.
High-income and low and middle-income countries perceive climate-change problems in a completely different light. For well-developed countries the basic problem is an unpolluted environment. For developing countries like Poland, the problem is economy and justice. Today’s wealth of Western countries cost the devastation of the environment in the
32
Environmental security, geological hazards and management© 2013 ISBN 978-84-616-2005-0
past. Currently rich countries were responsible for two-thirds of the carbon put into the atmosphere since 1850, and their current requests to reduce emissions appear to be simply unfair.
75
80
85
90
95
100
105
1990
1991
1992
1993
1994
1995
1996
1997
1998
1999
2000
2001
2002
2003
2004
2005
2006
2007
2008
2009
2010
Years
Mto
e
0
100
200
300
400
500
600
700
800
Bln
US
$, c
urre
nt p
rices
, PP
Ps
Primary energy consumption GDP
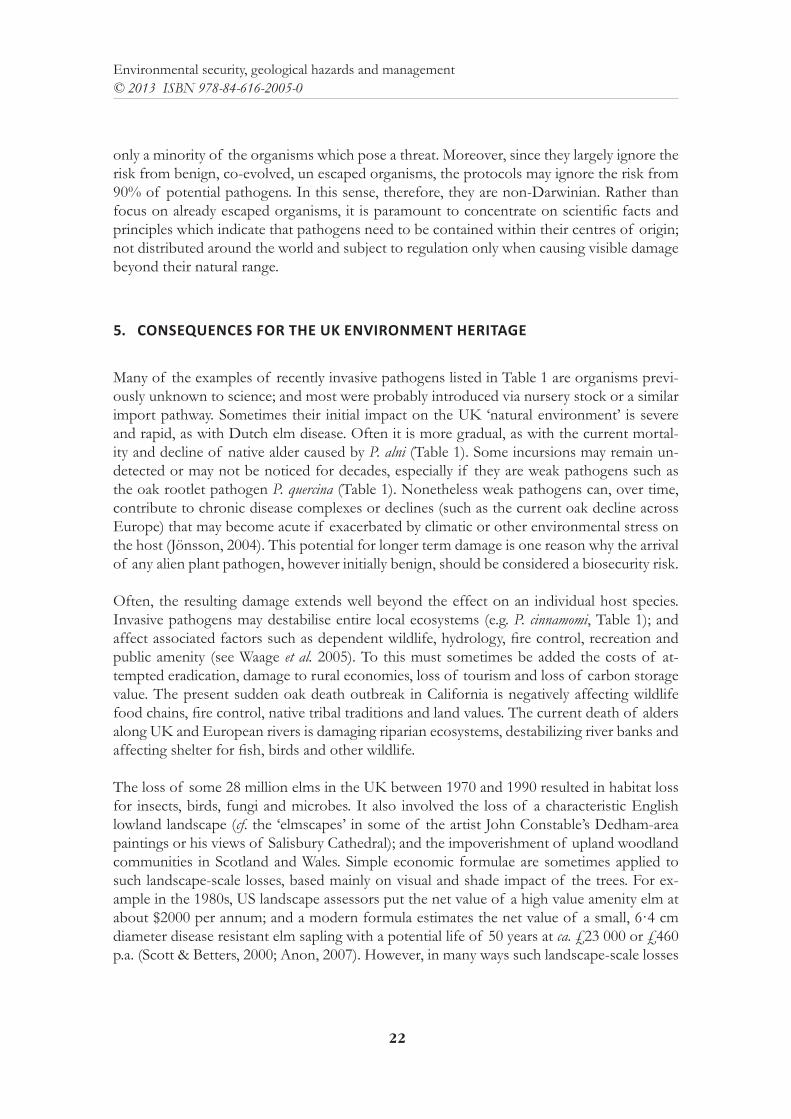
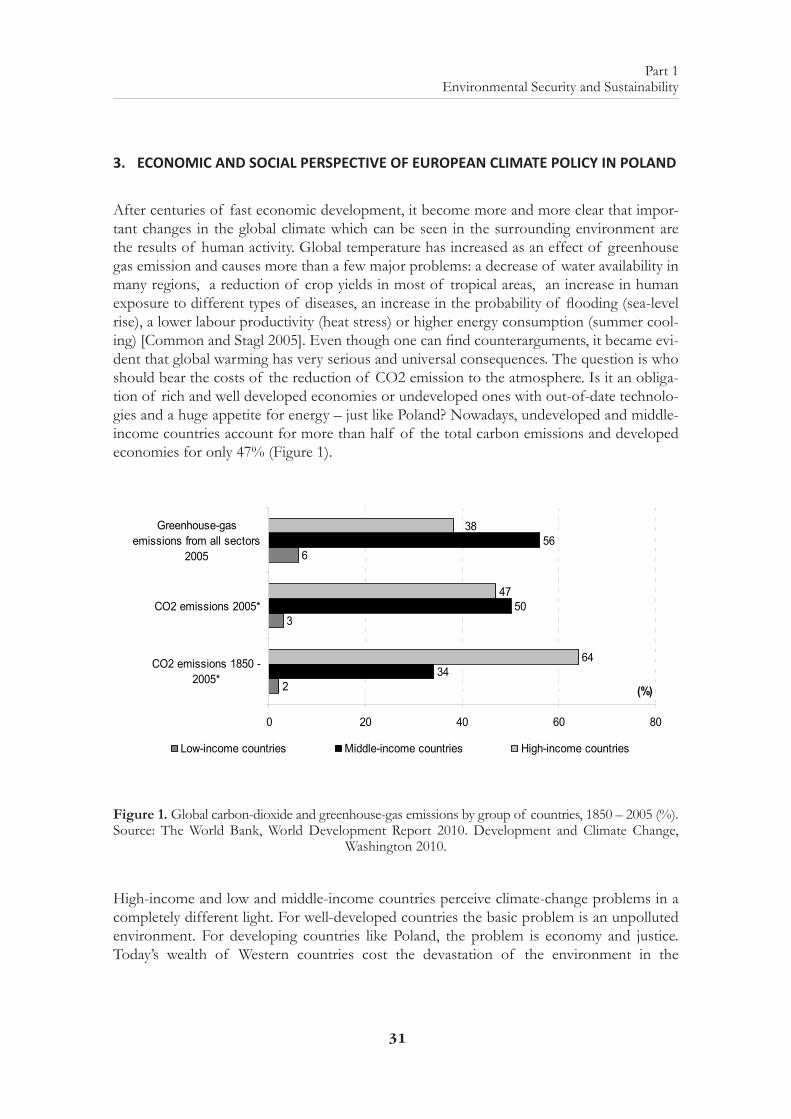
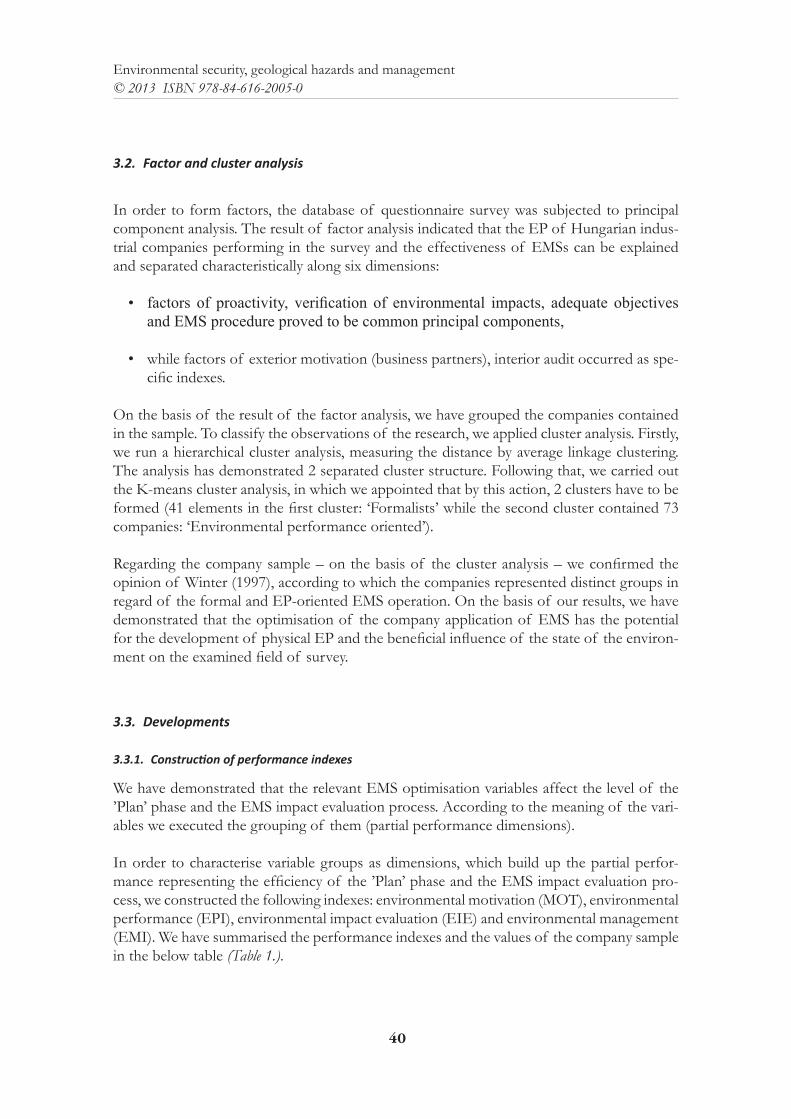
Figure 2. Primary energy demand and changes in GDP level in Poland, 1990-2010. Source: Eurostat, Primary energy consumption, Code: t2020_33, OECD. Factbook 2011-2012: Economic, Environ-
mental and Social Statistics, OECD Publications. Paris 2012.
Poland’s energy intensity has fallen by more than a half since the period of transformation in the early 1990s, along with economic structure changes and the modernization of capital stock in the industry, constructing and power generation sectors, but still the energy intensity of the Polish economy is around double that of the European Union average. What is even more important, the average rate of energy demand growth in Poland has nearly doubled that observed in OECD countries and the European Union since the beginning of the cen-tury (figure 2).
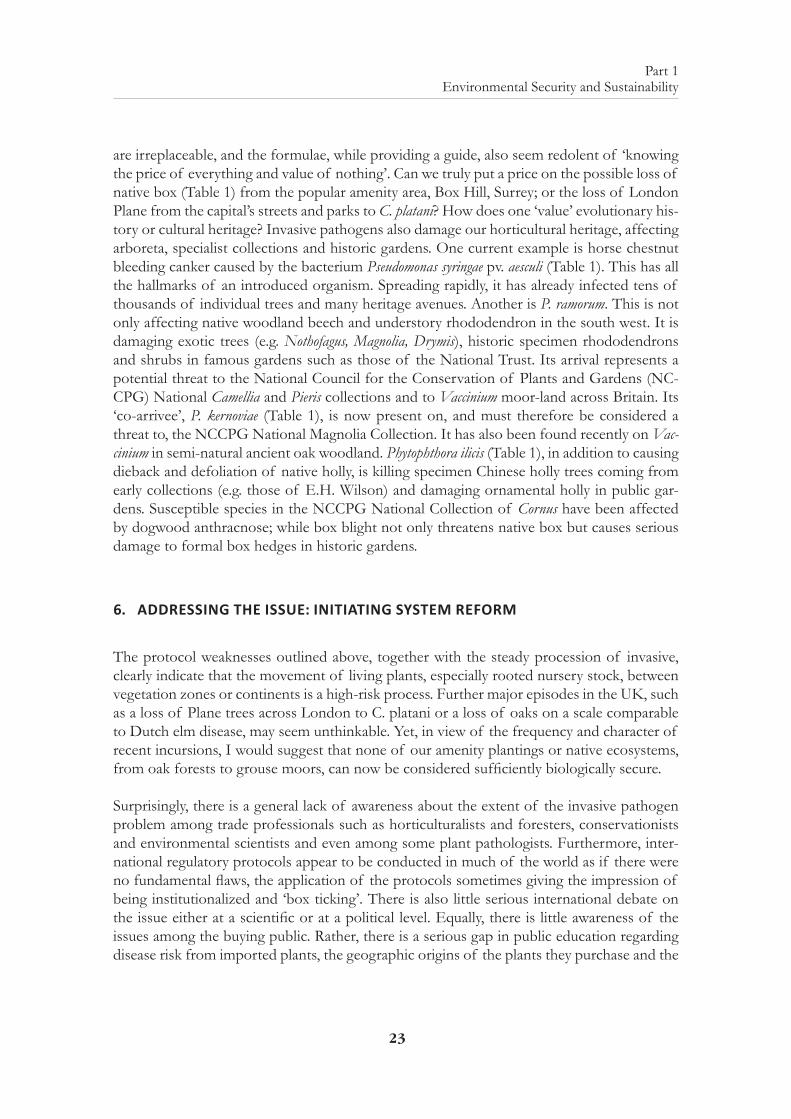
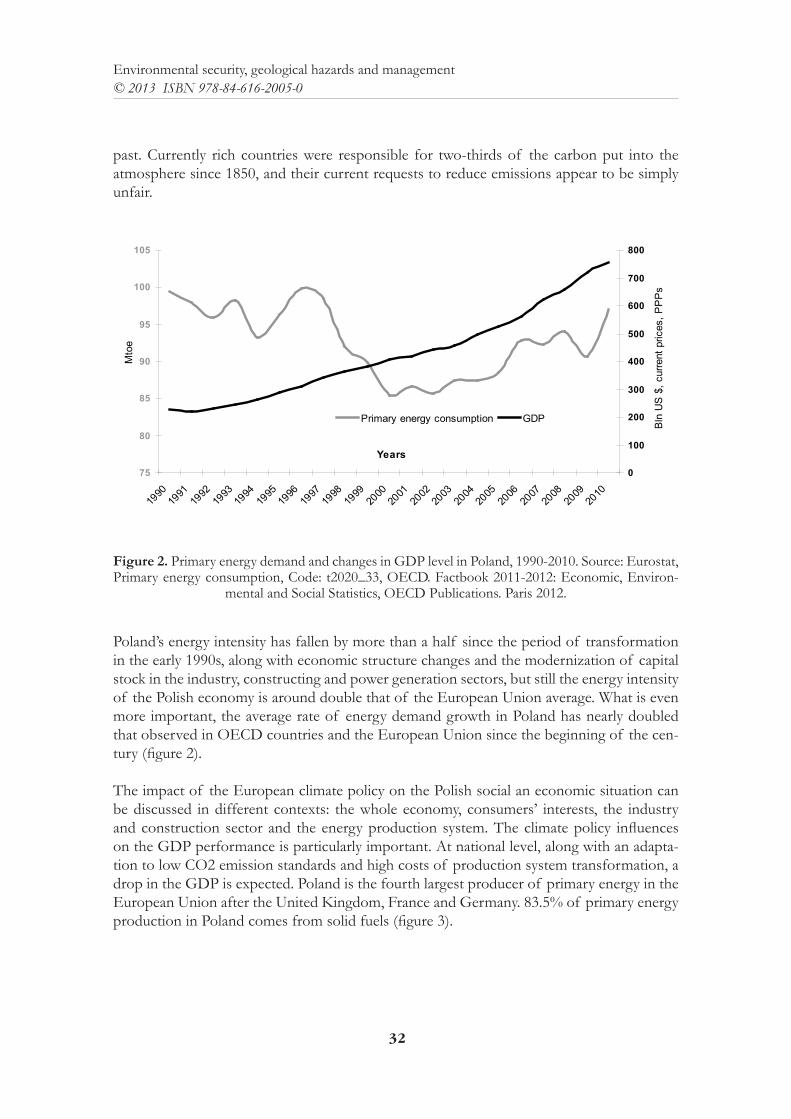
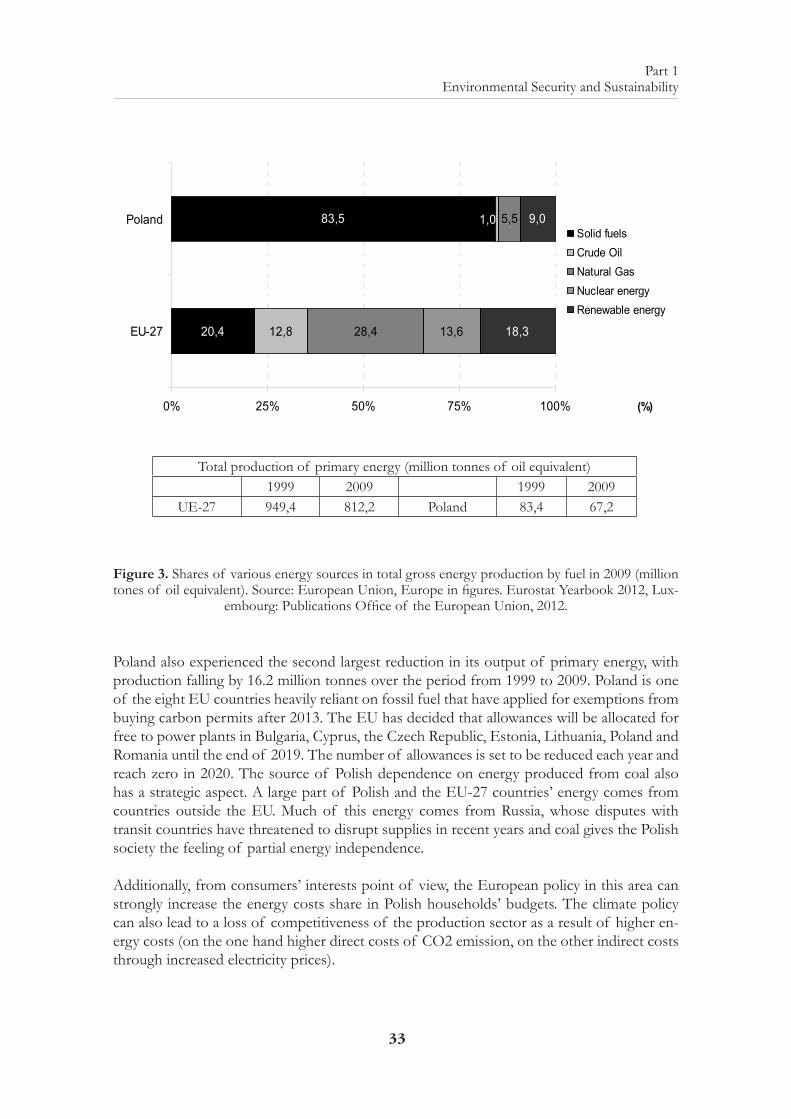
The impact of the European climate policy on the Polish social an economic situation can be discussed in different contexts: the whole economy, consumers’ interests, the industry and construction sector and the energy production system. The climate policy influences on the GDP performance is particularly important. At national level, along with an adapta-tion to low CO2 emission standards and high costs of production system transformation, a drop in the GDP is expected. Poland is the fourth largest producer of primary energy in the European Union after the United Kingdom, France and Germany. 83.5% of primary energy production in Poland comes from solid fuels (figure 3).
33
Part 1 Environmental Security and Sustainability
20,4
83,5
12,8 28,4
5,5
13,6 18,3
9,01,0
0% 25% 50% 75% 100%
EU-27
Poland
(%)
Solid fuelsCrude OilNatural GasNuclear energyRenewable energy
Total production of primary energy (million tonnes of oil equivalent) 1999 2009 1999 2009
UE-27 949,4 812,2 Poland 83,4 67,2
Figure 3. Shares of various energy sources in total gross energy production by fuel in 2009 (million tones of oil equivalent). Source: European Union, Europe in figures. Eurostat Yearbook 2012, Lux-
embourg: Publications Office of the European Union, 2012.
Poland also experienced the second largest reduction in its output of primary energy, with production falling by 16.2 million tonnes over the period from 1999 to 2009. Poland is one of the eight EU countries heavily reliant on fossil fuel that have applied for exemptions from buying carbon permits after 2013. The EU has decided that allowances will be allocated for free to power plants in Bulgaria, Cyprus, the Czech Republic, Estonia, Lithuania, Poland and Romania until the end of 2019. The number of allowances is set to be reduced each year and reach zero in 2020. The source of Polish dependence on energy produced from coal also has a strategic aspect. A large part of Polish and the EU-27 countries’ energy comes from countries outside the EU. Much of this energy comes from Russia, whose disputes with transit countries have threatened to disrupt supplies in recent years and coal gives the Polish society the feeling of partial energy independence.
Additionally, from consumers’ interests point of view, the European policy in this area can strongly increase the energy costs share in Polish households’ budgets. The climate policy can also lead to a loss of competitiveness of the production sector as a result of higher en-ergy costs (on the one hand higher direct costs of CO2 emission, on the other indirect costs through increased electricity prices).
34
Environmental security, geological hazards and management© 2013 ISBN 978-84-616-2005-0
4. COCLUSIONS
The impact of the climate policy on Poland is much higher than the average for the EU countries, especially those well-developed. The resulting costs seem to be much higher than potential benefits. Poland is even today affected by increasing energy prices and other negative factors. The main danger for economic development will come during the next decades. The climate policy proposed by European institutions generates threats to energy security for the Polish society and stimulates an increase of gas import dependence on the monopolistic position of the largest extractor of natural gas and one of the largest companies in the world - Gazprom. Currently it is still too early to say if Poland can afford to implement the climate package. A faurther discussion on compensation mechanisms is necessary, especially at this time of global financial crisis. Recession and dynamic unemployment rate increase, along with public debt and budget deficit, stress the necessity of economic growth and workplaces preservation. European Union strategies in the field of climate changes create hard-to-pay costs and from Poland’s point of view do not take into consideration the real conditions of its economy.
REFERENCES:
1. COMMON M., STAGL S., (2005); Ecological Economics. An Introduction, Cambridge University Press, p. 493-495, New York.
2. FABER J., et alli, (2012); Behavioral Climate Change Mitigation Options and Their Appropriate Inclusion in Quantitative Longer Term Policy Scenarios. Main Report, Delft, CE Delft, April 2012, p. 11-12.
3. EUROPEAN COMMISSION, (2005); Working together for growth and jobs. A new start for the Lisbon Strategy, COM (2005) 24, p 7-8, Brussels.
4. EUROPEAN UNION, (2013); Europe 2020: Europe’s growth strategy, p. 3, Luxembourg.5. EUROPEAN UNION, (2012); Europe in figures. Eurostat Yearbook 2012, Publications Office of the
European Union, p. 542, Luxembourg.6. EUROSTAT (2012); GDP per capita in purchasing power standards. News Release 180/2012 – 13 De-
cember 2012, p. 1-3.7. NATIONAL BANK OF POLAND (2011); Foreign Direct Investment in Poland 2010. Annex, Octo-
ber 2011, p 5-22, Warsaw.8. OECD, (2012); Factbook 2011-2012: Economic, Environmental and Social Statistics, OECD Publica-
tions, p. 31-32, Paris.9. THE WORLD BANK (2010); World Development Report 2010. Development and Climate Change,
p. 3, Washington.
35
Part 1 Environmental Security and Sustainability
CORPORATE ENVIRONMENTAL PERFORMANCE EVALUATION UNDER CONDITIONS OF SUSTAINABILITY
A. Polgár & J. PájerInstitute of Environmental and Earth Sciences, The University of West Hungary Faculty of Forestry, Sopron, Hungary
ABSTRACT: In the interest of the real environmental performance (EP) behind the environmental management system (EMS), in the course of ’Plan’ phase it is a high priority to explore and analyse the environmental aspects and impacts and to select the relevant environmental aspects in the course of the implementation of the system. According to the experiences the applied processes are often specific, formal and defined by the self-interest of a company. The purpose of our work was the uniformly interpretable evaluation of the varied processes, and the creation of an EMS development model by which the physical EP can be improved. The quantitative empirical research (2010-2011) has been conducted by using questionnaires within home companies (114 pcs) applying EMS accord-ing to the standard ISO 14001. In the created database, by descriptive and multivariable statistical survey, we have determined the variables which are relevant and adjustable in the process, thereby potentially applicable for optimization, the correlations of variable pairs and the variable groups meaning the main performance dimensions of the topic. On the basis of the identified perfor-mance dimensions, corporate performance indexes (4+1 pcs) have been created: the environmental motivation (MOT), environmental performance (EPI), environmental impact evaluation (EIE) and environmental management (EMI) as well as the aggregative index (AGG). Through their values, the evaluation of the surveyed corporate performance, describing the specified level, can be executed uniformly, in a relative, quantifiable way, without any intervention in the varied corporate processes. Along the outliers of EMS optimization variables, we have identified development points (36 pcs) and their impact and field by the sensitivity analysis of the indexes, and on the basis of the meaning of the variables causing significant differences. By this method, the self-evaluation based EMS devel-opment model has been created.
1. INTRODUCTION
Environmental management system (EMS) is part of the management system of an organi-zation with the task to develop and establish, operate and continuously improve the envi-ronmental policy of the organization and manage the environmental aspects. The advantage of these systems standardised by international organizations is that they may be certified by specialised certifying authorities (e.g. ISO 14001, EMAS). Standardized processes providing authoritative (certified) information for competitors and society are being applied worldwide today. At the same time it is observable - probably just on the ground of the market com-petition - that the processes are often specific, formal and defined by the self-interest of the company (Polgár 2012).
36
Environmental security, geological hazards and management© 2013 ISBN 978-84-616-2005-0
The change in the properties of the environmental elements and systems resulting due to hu-man activity is the environmental impact (Pájer 1998). The evaluation of the environmental impact purposes to express the consequence of the change, by which it prepares and estab-lishes measurements and decisions withal. The evaluation of environmental impacts can be a base on which the different activities can be compared according to environmental aspects (Polgár 2012).
The identification, the continuous evaluation and the rating of the environmental impacts can be considered as the important interest of a company, and at the same time, it is also a social interest by the co-operation in environmental protection.
Because of the interrelationships in the complex environmental system, the corporate envi-ronmental impacts have to be studied as an integral part of this system (Bulla & Buruzs 2008).
Due to the rapid spreading of ISO 14001 more and more companies are applying underlying EMS evaluation methods (Savage 2000).
In the interest of the real environmental performance (EP) behind the EMS, in the course of the ’Plan’ phase, it is a high priority to explore and analyse the environmental aspects and impacts and to select the relevant environmental aspects in the course of the implementation of the EMS.
The survey, cognition and comprehension of environmental aspects and impacts of the organization is the element of the ’Plan’ phase, but also the most essential element of the whole system implementation. It requires particular consideration, as well as, during its ex-amination, engineering and technical accuracy is needed and it is of course the biggest crea-tivity requiring step (Nagy et al. 2006).
The purpose of our survey was the uniformly interpretable evaluation of the varied Hungarian processes, and the creation of an EMS development model concept which aimed the function-al utilization of the results and the improvement of the parameters concerning the physical EP.
2. MATERIAL AND METHOD
During our work we tried to find the answers to the following questions: What is the role of the ’Plan’ phase in the improvement of the efficiency of EMS? Which parameters do play a role in its optimization? Which are the determinant dimensions of environmental perfor-mance in the ’Plan’ phase? How and at what level can the EMS practice of home companies be assessed? In what ways can the efficiency of EMS be improved in practice?
According to our approach, the cardinal point of the sufficient operation is the more accu-rate, environmental science based identification and evaluation of the pairs of environmental factor – environmental impact adjunct to the activity, which is followed by the integration of
37
Part 1 Environmental Security and Sustainability
this environmental information in the process of the determination of the environmental objectives.
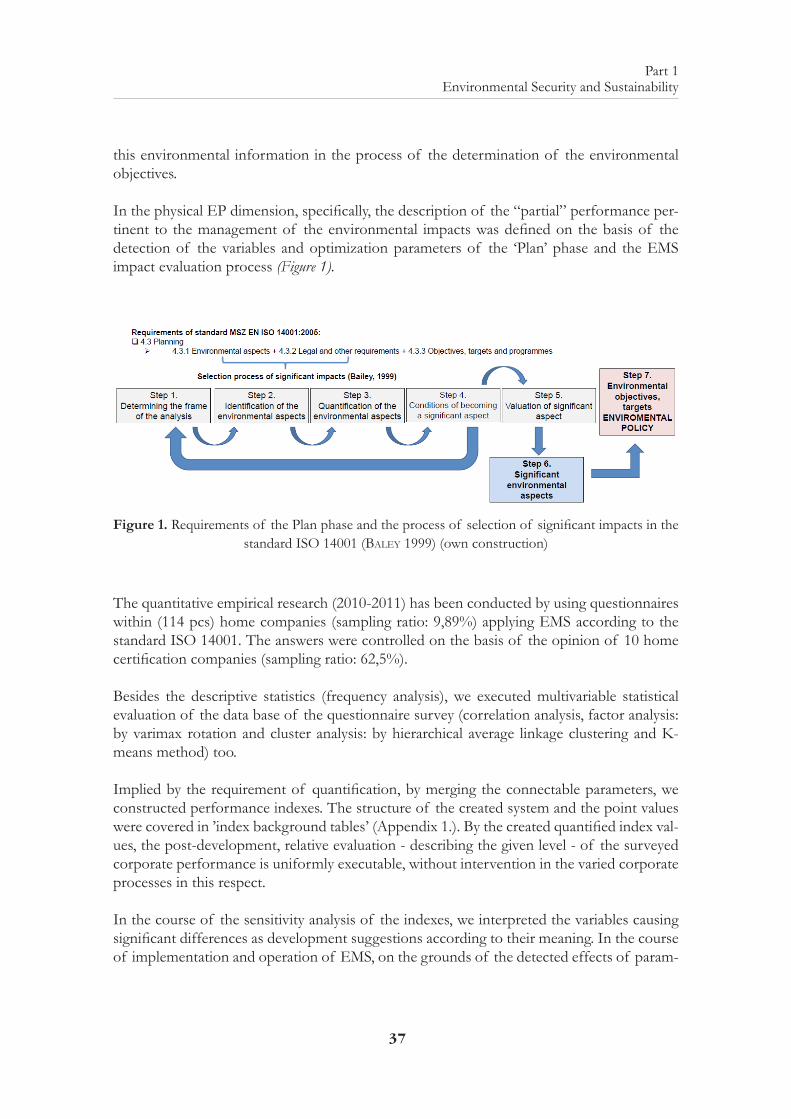
In the physical EP dimension, specifically, the description of the “partial” performance per-tinent to the management of the environmental impacts was defined on the basis of the detection of the variables and optimization parameters of the ‘Plan’ phase and the EMS impact evaluation process (Figure 1).
Figure 1. Requirements of the Plan phase and the process of selection of significant impacts in the standard ISO 14001 (baley 1999) (own construction)
The quantitative empirical research (2010-2011) has been conducted by using questionnaires within (114 pcs) home companies (sampling ratio: 9,89%) applying EMS according to the standard ISO 14001. The answers were controlled on the basis of the opinion of 10 home certification companies (sampling ratio: 62,5%).
Besides the descriptive statistics (frequency analysis), we executed multivariable statistical evaluation of the data base of the questionnaire survey (correlation analysis, factor analysis: by varimax rotation and cluster analysis: by hierarchical average linkage clustering and K-means method) too.
Implied by the requirement of quantification, by merging the connectable parameters, we constructed performance indexes. The structure of the created system and the point values were covered in ’index background tables’ (Appendix 1.). By the created quantified index val-ues, the post-development, relative evaluation - describing the given level - of the surveyed corporate performance is uniformly executable, without intervention in the varied corporate processes in this respect.
In the course of the sensitivity analysis of the indexes, we interpreted the variables causing significant differences as development suggestions according to their meaning. In the course of implementation and operation of EMS, on the grounds of the detected effects of param-
38
Environmental security, geological hazards and management© 2013 ISBN 978-84-616-2005-0
eters and the arrangements made for their improvement, the fields of corporate develop-ment could be estimated for the sake of improvement of EP.
The summary of the influences of the identified development opportunities (36 pcs) by dimensions can be found in ’Auxiliary Table’ (Appendix 2).
By the systematic application of the developed background and auxiliary tables of indexes appropriate for self-evaluation, opens up the opportunity for the expedient development of the performance and efficiency of the EMS ‘Plan’ phase. In order to support this, we elaborated a self-evaluation based EMS development model for the determination of most appropriate developments by organizations (Appendix 3.). On the basis of the performance indexes, the efforts can be expressed in a numerable way. The evaluation method provides a basis to identify the weak and strong points, and to determine the appropriate and effective developments (decision support).
3. RESULTS
3.1. The results of frequency analysis.
In order to specify the steps of the EMS impact evaluation process (Figure 1), we demon-strate the main statements of the research results of the frequency analysis, essential with respect to environmental management.
3.1.1. Identification and quantification of the environmental factors
We have demonstrated that concerning the characteristics of the methodologies applied in environmental impact assessment, in the analysed sample, own company methodology (82%) was adopted which meant underlying level methodology to a significantly demonstrable ex-tent. In case of the majority (70%) of the organizations the revisal of factors was required.
This fact suggested that these methods required the minimum effort from the companies to fulfil the requirements of the standard. Therefore the quality of the initial survey is signifi-cant, but the permanent maintenance of the impact register is also essential, even in the case of constant technology.
In the course of the research we have found that the certain corporate methodologies are beyond the minimal regulations of the requirements of the standard, they only provide environmental information at underlying level. They merely take steps toward the optional alternatives and those being proposed by the standard ISO 14001. It was demonstrated that development of these processes and involving further means of the environmentally aware corporate management are key points in the course of improvement of physical EP of the EMS.
39
Part 1 Environmental Security and Sustainability
3.1.2. The conditions of becoming significant factor and evaluation of them
Among the conditions of becoming significant factor, the data derived from the technologi-cal knowledge were identified as strong environmental information with regard to the detec-tion and evaluation of the impact factors in the company practice, which makes also the cri-terions of legal and environmental science importance strong aspects in the decision process. To this, the technology data regarding to the environmental impacts were at disposal, which were found well covered in the material and energy balances. We concluded that based on the data, potential opportunity is afforded to apply the environmental performance evaluation according to ISO 14031 more widely.
3.1.3. Determination and accomplishment of environmental objectives
By analysing the influential factors of determining of the objectives, our research identified the characteristics of the environmental objectives of the participating companies.
In the course of the survey, we identified the planning parameters which affected the degree of assignment of the environmental objectives of EMS to the real environmental impacts. It has been found that different deliberation of parameters results in bias in the studied ac-commodation.
Overall, we have presented that the organizations appointed their environmental goals con-sidering dangers coming from environmental impacts in a larger proportion but regarding the financial burdens of the execution they also keep the accomplishment potentials to the fore.
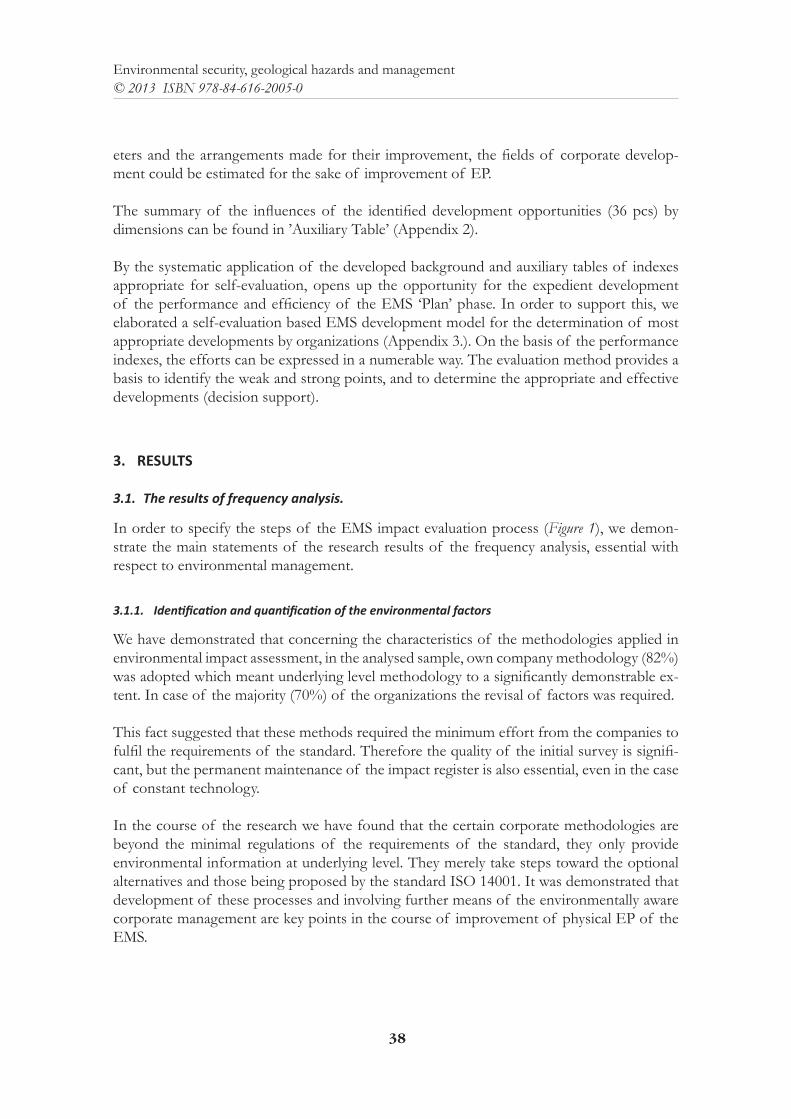
We examined the progress of the facilitating/aggravating factors of the operation of EMS in the first three years, which is demonstrated in the below figure (Figure 2).
Figure 2. Influencing factors of the operation of EMS in the first three years (based on the data of the authors)
40
Environmental security, geological hazards and management© 2013 ISBN 978-84-616-2005-0
3.2. Factor and cluster analysis
In order to form factors, the database of questionnaire survey was subjected to principal component analysis. The result of factor analysis indicated that the EP of Hungarian indus-trial companies performing in the survey and the effectiveness of EMSs can be explained and separated characteristically along six dimensions:
• factors of proactivity, verification of environmental impacts, adequate objectivesandEMSprocedureprovedtobecommonprincipalcomponents,
• while factors of exterior motivation (business partners), interior audit occurred as spe-cific indexes.
On the basis of the result of the factor analysis, we have grouped the companies contained in the sample. To classify the observations of the research, we applied cluster analysis. Firstly, we run a hierarchical cluster analysis, measuring the distance by average linkage clustering. The analysis has demonstrated 2 separated cluster structure. Following that, we carried out the K-means cluster analysis, in which we appointed that by this action, 2 clusters have to be formed (41 elements in the first cluster: ‘Formalists’ while the second cluster contained 73 companies: ‘Environmental performance oriented’).
Regarding the company sample – on the basis of the cluster analysis – we confirmed the opinion of Winter (1997), according to which the companies represented distinct groups in regard of the formal and EP-oriented EMS operation. On the basis of our results, we have demonstrated that the optimisation of the company application of EMS has the potential for the development of physical EP and the beneficial influence of the state of the environ-ment on the examined field of survey.
3.3. Developments
3.3.1. Construction of performance indexes
We have demonstrated that the relevant EMS optimisation variables affect the level of the ’Plan’ phase and the EMS impact evaluation process. According to the meaning of the vari-ables we executed the grouping of them (partial performance dimensions).
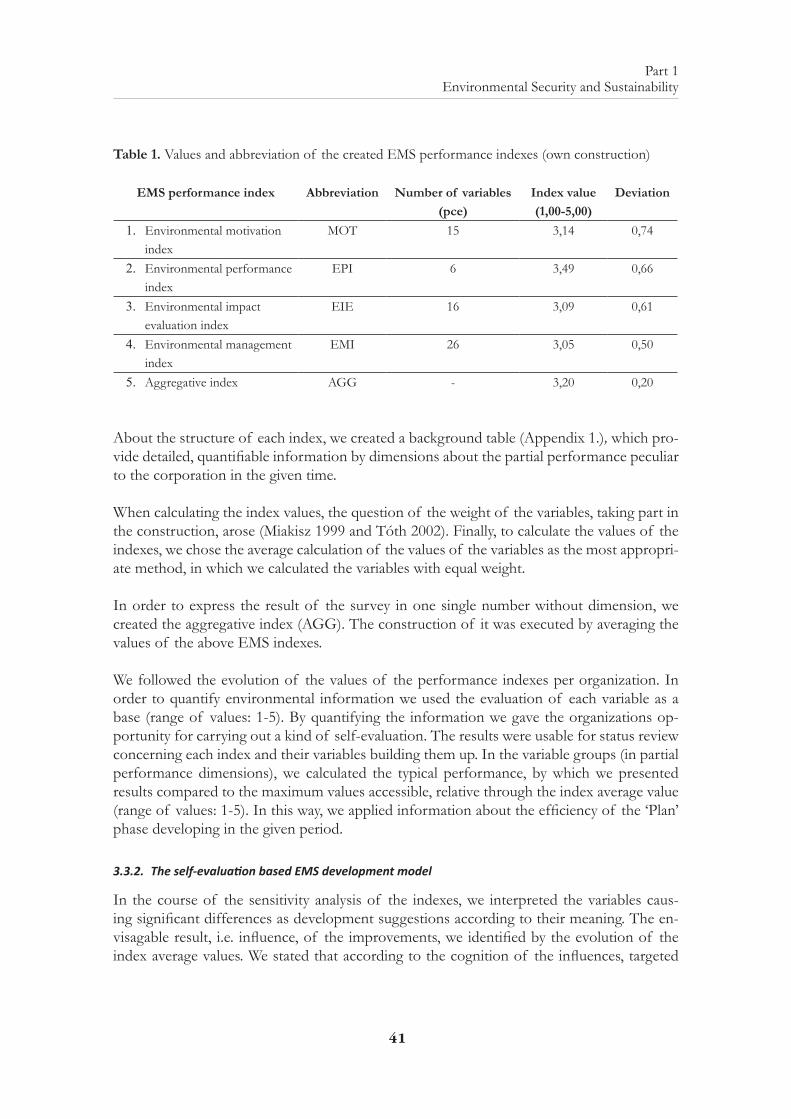
In order to characterise variable groups as dimensions, which build up the partial perfor-mance representing the efficiency of the ’Plan’ phase and the EMS impact evaluation pro-cess, we constructed the following indexes: environmental motivation (MOT), environmental performance (EPI), environmental impact evaluation (EIE) and environmental management (EMI). We have summarised the performance indexes and the values of the company sample in the below table (Table 1.).
41
Part 1 Environmental Security and Sustainability
Table 1. Values and abbreviation of the created EMS performance indexes (own construction)
EMS performance index Abbreviation Number of variables (pce)
Index value (1,00-5,00)
Deviation
1. Environmental motivation index
MOT 15 3,14 0,74
2. Environmental performance index
EPI 6 3,49 0,66
3. Environmental impact evaluation index
EIE 16 3,09 0,61
4. Environmental management index
EMI 26 3,05 0,50
5. Aggregative index AGG - 3,20 0,20
About the structure of each index, we created a background table (Appendix 1.), which pro-vide detailed, quantifiable information by dimensions about the partial performance peculiar to the corporation in the given time.
When calculating the index values, the question of the weight of the variables, taking part in the construction, arose (Miakisz 1999 and Tóth 2002). Finally, to calculate the values of the indexes, we chose the average calculation of the values of the variables as the most appropri-ate method, in which we calculated the variables with equal weight.
In order to express the result of the survey in one single number without dimension, we created the aggregative index (AGG). The construction of it was executed by averaging the values of the above EMS indexes.
We followed the evolution of the values of the performance indexes per organization. In order to quantify environmental information we used the evaluation of each variable as a base (range of values: 1-5). By quantifying the information we gave the organizations op-portunity for carrying out a kind of self-evaluation. The results were usable for status review concerning each index and their variables building them up. In the variable groups (in partial performance dimensions), we calculated the typical performance, by which we presented results compared to the maximum values accessible, relative through the index average value (range of values: 1-5). In this way, we applied information about the efficiency of the ‘Plan’ phase developing in the given period.
3.3.2. The self-evaluation based EMS development model
In the course of the sensitivity analysis of the indexes, we interpreted the variables caus-ing significant differences as development suggestions according to their meaning. The en-visagable result, i.e. influence, of the improvements, we identified by the evolution of the index average values. We stated that according to the cognition of the influences, targeted
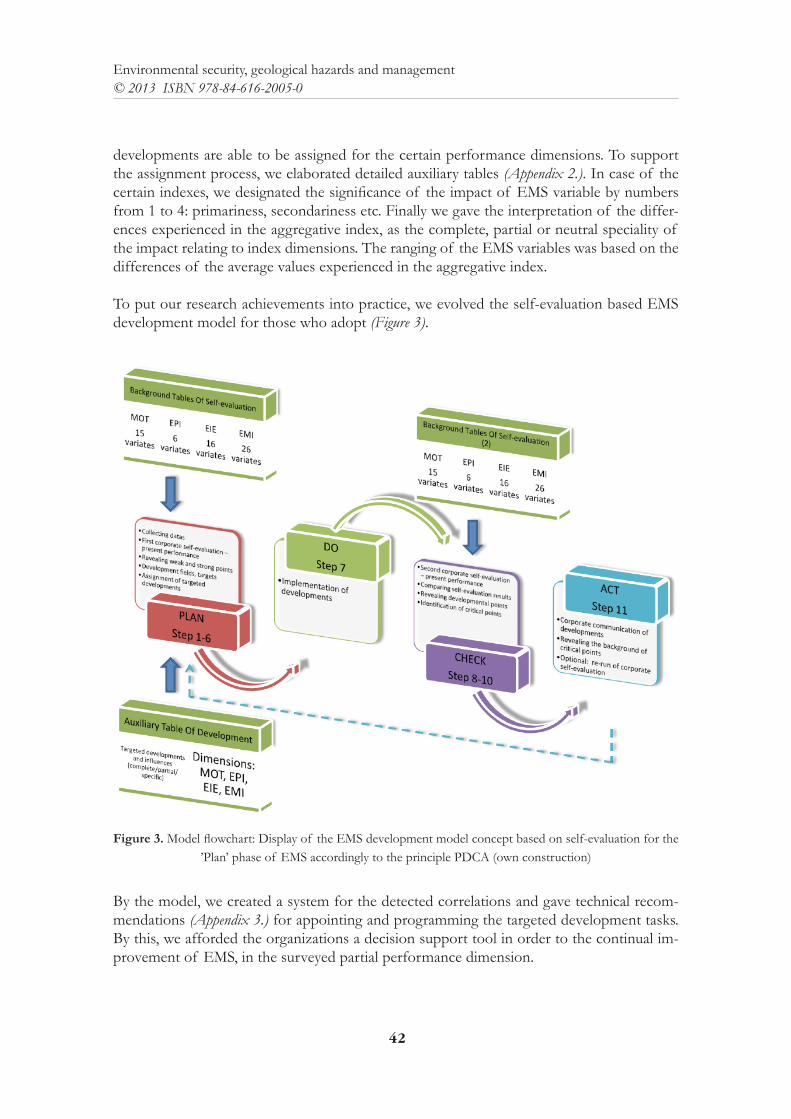
42
Environmental security, geological hazards and management© 2013 ISBN 978-84-616-2005-0
developments are able to be assigned for the certain performance dimensions. To support the assignment process, we elaborated detailed auxiliary tables (Appendix 2.). In case of the certain indexes, we designated the significance of the impact of EMS variable by numbers from 1 to 4: primariness, secondariness etc. Finally we gave the interpretation of the differ-ences experienced in the aggregative index, as the complete, partial or neutral speciality of the impact relating to index dimensions. The ranging of the EMS variables was based on the differences of the average values experienced in the aggregative index.
To put our research achievements into practice, we evolved the self-evaluation based EMS development model for those who adopt (Figure 3).
Figure 3. Model flowchart: Display of the EMS development model concept based on self-evaluation for the ’Plan’ phase of EMS accordingly to the principle PDCA (own construction)
By the model, we created a system for the detected correlations and gave technical recom-mendations (Appendix 3.) for appointing and programming the targeted development tasks. By this, we afforded the organizations a decision support tool in order to the continual im-provement of EMS, in the surveyed partial performance dimension.
43
Part 1 Environmental Security and Sustainability
4. CONCLUSIONS
In the course of our methodological research, we have achieved the potential indirect devel-opment of the physical EP. The identified, envisageable development efforts affected those planning parameters, which pertain to the treatment of the environmental aspects and im-pacts. We ensured the uniform evaluation of different organizations, which does not require the modification of the varied corporate processes, additionally provides the opportunity for comparison. The developed model is a development and decision support tool. The organi-zations applying the model, will be able to improve the efficiency of the ’Plan’ phase directly and of their environmental management system indirectly, on the surveyed field.
Acknowledgement
We express our sincere thanks to Dr. Botond Héjj CSc associate professor, Dr. László Tamaska PhD director, Dr. Olivér Bogdán PhD director and János Nagy head auditor, who all assisted us with useful advices conducive to our research. Without the participation of the companies and certifica-tion authorities in the survey, this work could not have been achieved. Thanks for their support-ing approach. We wish to thank for the Programme in Environmental Security and Management (517629-LLP-1-2011-1-UK-ERASMUS-EMCR).
REFERENCES
bailey, a. (1999): Environmental audit [Környezeti auditálás]. In: bailey, a. – bezegH, a. – frigy-er, a. – bándi, gy. – galli, m. – KereKes, s. – tótH, g. (1999): Training for Environmental Leaders and Auditors [Környezeti vezető és auditor képzés – Tankönyv], Magyar Szabványügyi Testület (MSZT), Budapest. pp. 79-88.
bulla, m. & buruzs, a. (2008): Indicators of Sustainability of Regional Developments in the EU [Regionális fejlesztések fenntarthatósági indikátorai az EU-ban. In: nagy, g. – pestiné, r. é. v. - torma, a. (Szerk.): 8th Symposium of Environmental Sciences, Sustainable Use of Environman-tal Resources. Proceedings [VIII. Környezettudományi Tanácskozás, A környezeti erőforrások fenntartható használata. Konferencia kiadvány], SZE, Győr: 135-144.
ISO 14001: MSZ EN ISO 14001:2005 Environmental management systems. Specification with guid-ance for use (ISO 14001:2004) [Környezetközpontú irányítási rendszerek. Követelmények és al-kalmazási irányelvek (ISO 14001:2004)], Magyar Szabványügyi Testület, Budapest, 2005
ISO 14031: MSZ EN ISO 14031:2001 Environmental management. Environmental performance evaluation. Guidelines (ISO 14031:1999) [Környezetközpontú irányítás. A környezeti teljesítmény értékelése. Útmutató (ISO 14031:1999)]. Magyar Szabványügyi Testület, Budapest, 2001.
miaKisz, J. (1999): Measuring and Benchmarking Environmental Performance in the Electric Utility Sector: The Experience of Niagara Mohawk. In: bennett, m. – James, p. (eds.): Sustainable Mea-sures, Greenleaf Publishing, Sheffield, p. 221-245.
nagy, g., torma, a. & vagdalt, l. (2006): Evaluation and Development of the Environmental Performance [A környezeti teljesítmény javítása és értékelése] Universitas-Győr Nonprofit Kft., Győr, pp: 11-13., 15-16., p. 24., 25., 35., 38., 60
páJer, J. (1998): Environmental impact assessments [Környezeti hatásvizsgálatok]. Soproni Egyetem, Sopron
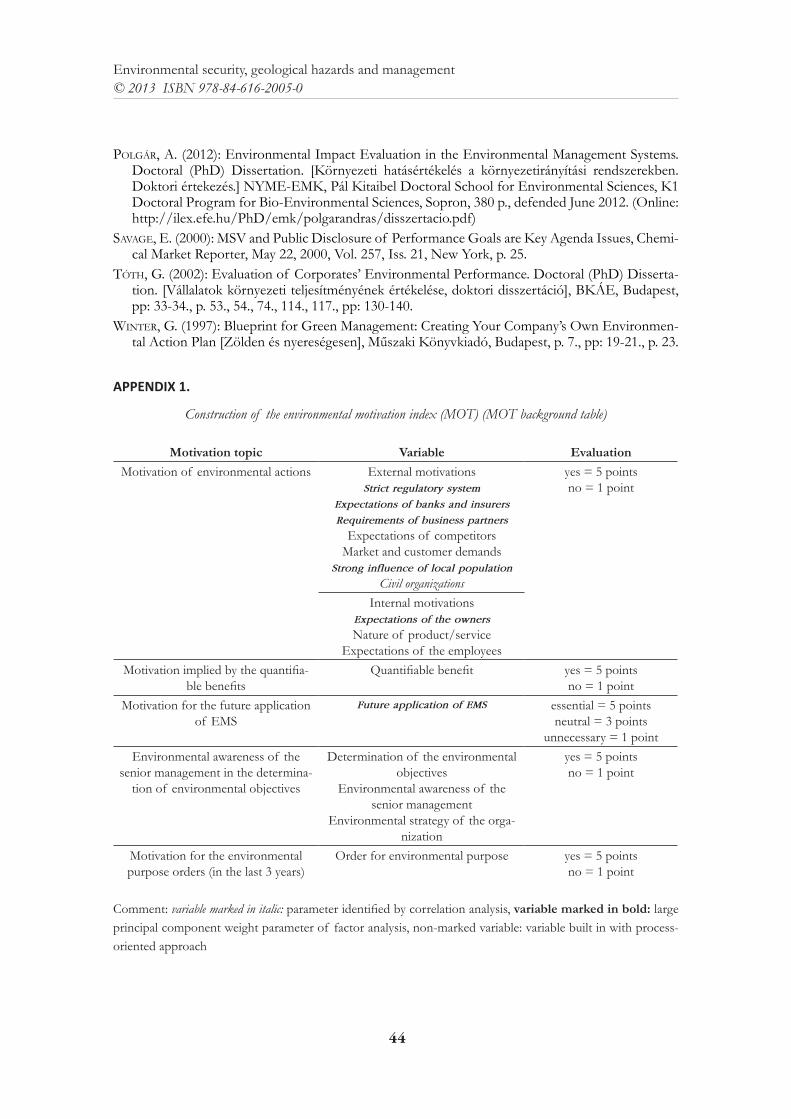
44
Environmental security, geological hazards and management© 2013 ISBN 978-84-616-2005-0
polgár, a. (2012): Environmental Impact Evaluation in the Environmental Management Systems. Doctoral (PhD) Dissertation. [Környezeti hatásértékelés a környezetirányítási rendszerekben. Doktori értekezés.] NYME-EMK, Pál Kitaibel Doctoral School for Environmental Sciences, K1 Doctoral Program for Bio-Environmental Sciences, Sopron, 380 p., defended June 2012. (Online: http://ilex.efe.hu/PhD/emk/polgarandras/disszertacio.pdf)
savage, e. (2000): MSV and Public Disclosure of Performance Goals are Key Agenda Issues, Chemi-cal Market Reporter, May 22, 2000, Vol. 257, Iss. 21, New York, p. 25.
tótH, G. (2002): Evaluation of Corporates’ Environmental Performance. Doctoral (PhD) Disserta-tion. [Vállalatok környezeti teljesítményének értékelése, doktori disszertáció], BKÁE, Budapest, pp: 33-34., p. 53., 54., 74., 114., 117., pp: 130-140.
Winter, G. (1997): Blueprint for Green Management: Creating Your Company’s Own Environmen-tal Action Plan [Zölden és nyereségesen], Műszaki Könyvkiadó, Budapest, p. 7., pp: 19-21., p. 23.
APPENDIX 1.
Construction of the environmental motivation index (MOT) (MOT background table)
Motivation topic Variable EvaluationMotivation of environmental actions External motivations
Strict regulatory system
Expectations of banks and insurers
Requirements of business partners
Expectations of competitorsMarket and customer demands
Strong influence of local population
Civil organizations
yes = 5 pointsno = 1 point
Internal motivationsExpectations of the owners
Nature of product/serviceExpectations of the employees
Motivation implied by the quantifia-ble benefits
Quantifiable benefit yes = 5 pointsno = 1 point
Motivation for the future application of EMS
Future application of EMS essential = 5 pointsneutral = 3 points
unnecessary = 1 pointEnvironmental awareness of the
senior management in the determina-tion of environmental objectives
Determination of the environmental objectives
Environmental awareness of the senior management
Environmental strategy of the orga-nization
yes = 5 pointsno = 1 point
Motivation for the environmental purpose orders (in the last 3 years)
Order for environmental purpose yes = 5 pointsno = 1 point
Comment: variable marked in italic: parameter identified by correlation analysis, variable marked in bold: large principal component weight parameter of factor analysis, non-marked variable: variable built in with process-oriented approach
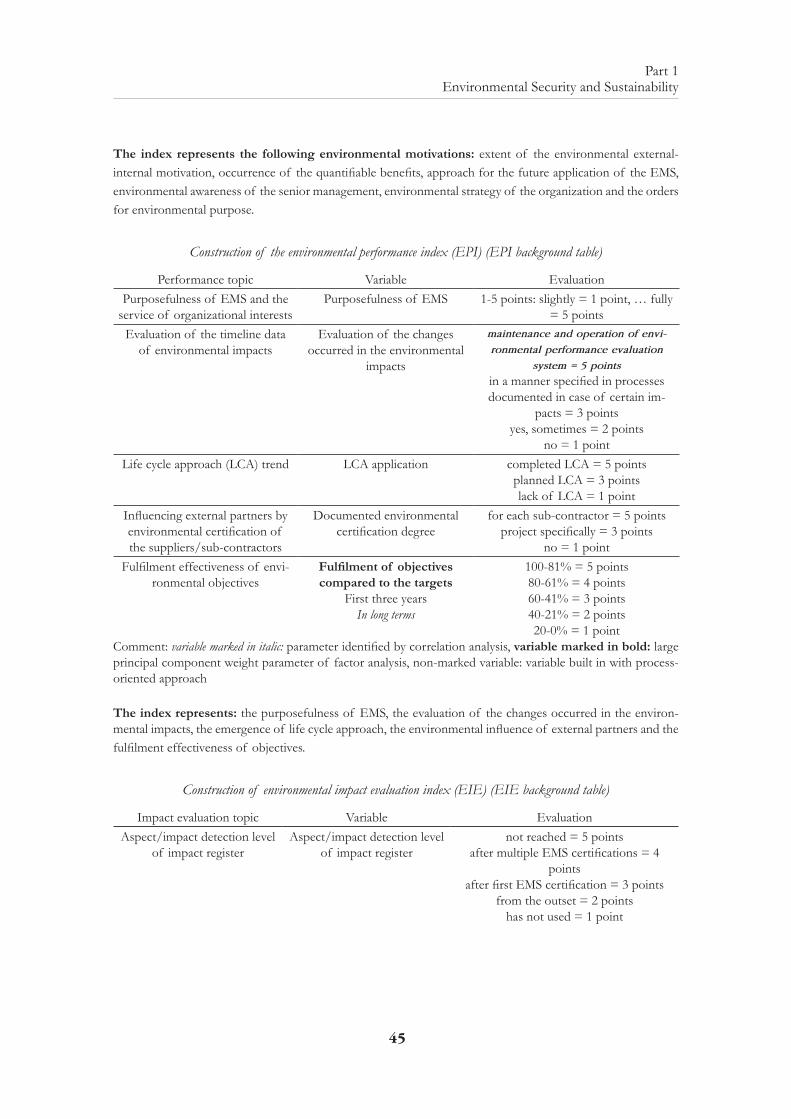
45
Part 1 Environmental Security and Sustainability
The index represents the following environmental motivations: extent of the environmental external-internal motivation, occurrence of the quantifiable benefits, approach for the future application of the EMS, environmental awareness of the senior management, environmental strategy of the organization and the orders for environmental purpose.
Construction of the environmental performance index (EPI) (EPI background table)
Performance topic Variable EvaluationPurposefulness of EMS and the
service of organizational interests Purposefulness of EMS 1-5 points: slightly = 1 point, … fully
= 5 pointsEvaluation of the timeline data
of environmental impactsEvaluation of the changes
occurred in the environmental impacts
maintenance and operation of envi-
ronmental performance evaluation
system = 5 points
in a manner specified in processes documented in case of certain im-
pacts = 3 pointsyes, sometimes = 2 points
no = 1 pointLife cycle approach (LCA) trend LCA application completed LCA = 5 points
planned LCA = 3 pointslack of LCA = 1 point
Influencing external partners by environmental certification of the suppliers/sub-contractors
Documented environmental certification degree
for each sub-contractor = 5 pointsproject specifically = 3 points
no = 1 pointFulfilment effectiveness of envi-
ronmental objectivesFulfilment of objectives compared to the targets
First three yearsIn long terms
100-81% = 5 points80-61% = 4 points60-41% = 3 points40-21% = 2 points20-0% = 1 point
Comment: variable marked in italic: parameter identified by correlation analysis, variable marked in bold: large principal component weight parameter of factor analysis, non-marked variable: variable built in with process-oriented approach
The index represents: the purposefulness of EMS, the evaluation of the changes occurred in the environ-mental impacts, the emergence of life cycle approach, the environmental influence of external partners and the fulfilment effectiveness of objectives.
Construction of environmental impact evaluation index (EIE) (EIE background table)
Impact evaluation topic Variable EvaluationAspect/impact detection level
of impact registerAspect/impact detection level
of impact registernot reached = 5 points
after multiple EMS certifications = 4 points
after first EMS certification = 3 pointsfrom the outset = 2 points
has not used = 1 point
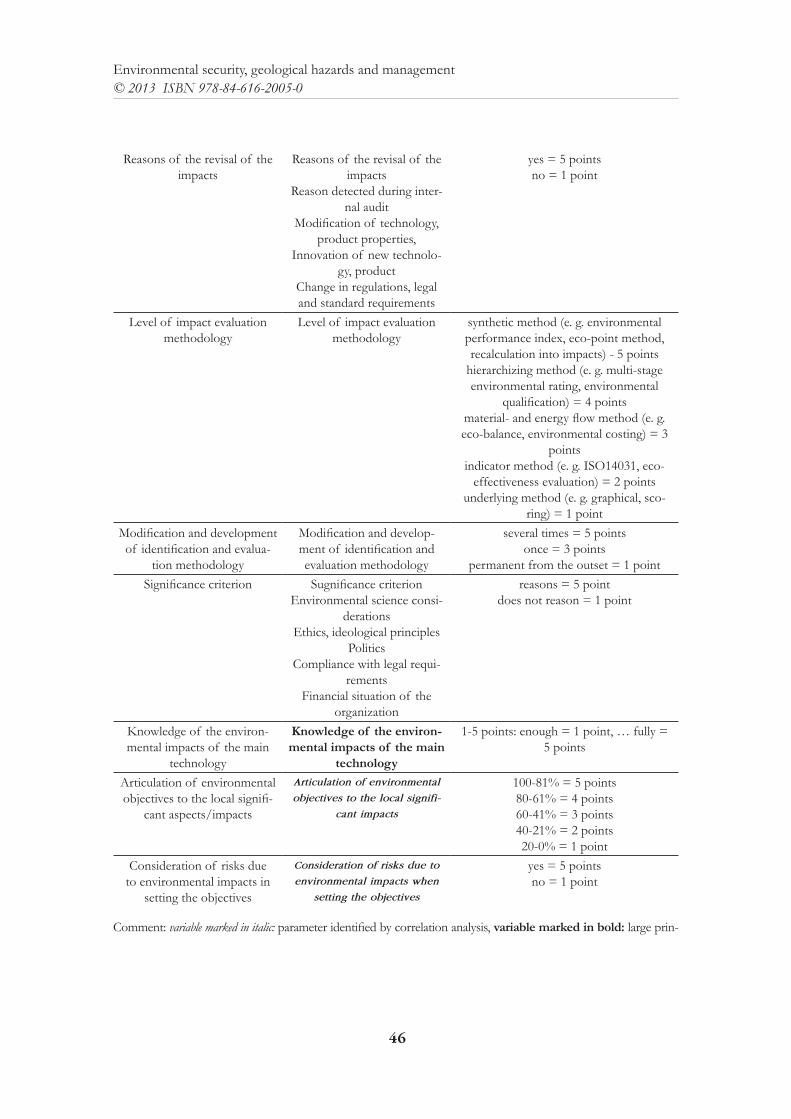
46
Environmental security, geological hazards and management© 2013 ISBN 978-84-616-2005-0
Reasons of the revisal of the impacts
Reasons of the revisal of the impacts
Reason detected during inter-nal audit
Modification of technology, product properties,
Innovation of new technolo-gy, product
Change in regulations, legal and standard requirements
yes = 5 pointsno = 1 point
Level of impact evaluation methodology
Level of impact evaluation methodology
synthetic method (e. g. environmental performance index, eco-point method, recalculation into impacts) - 5 points
hierarchizing method (e. g. multi-stage environmental rating, environmental
qualification) = 4 pointsmaterial- and energy flow method (e. g. eco-balance, environmental costing) = 3
pointsindicator method (e. g. ISO14031, eco-
effectiveness evaluation) = 2 pointsunderlying method (e. g. graphical, sco-
ring) = 1 pointModification and development of identification and evalua-
tion methodology
Modification and develop-ment of identification and evaluation methodology
several times = 5 pointsonce = 3 points
permanent from the outset = 1 pointSignificance criterion Sugnificance criterion
Environmental science consi-derations
Ethics, ideological principlesPolitics
Compliance with legal requi-rements
Financial situation of the organization
reasons = 5 pointdoes not reason = 1 point
Knowledge of the environ-mental impacts of the main
technology
Knowledge of the environ-mental impacts of the main
technology
1-5 points: enough = 1 point, … fully = 5 points
Articulation of environmental objectives to the local signifi-
cant aspects/impacts
Articulation of environmental
objectives to the local signifi-
cant impacts
100-81% = 5 points80-61% = 4 points60-41% = 3 points40-21% = 2 points20-0% = 1 point
Consideration of risks due to environmental impacts in
setting the objectives
Consideration of risks due to
environmental impacts when
setting the objectives
yes = 5 pointsno = 1 point
Comment: variable marked in italic: parameter identified by correlation analysis, variable marked in bold: large prin-
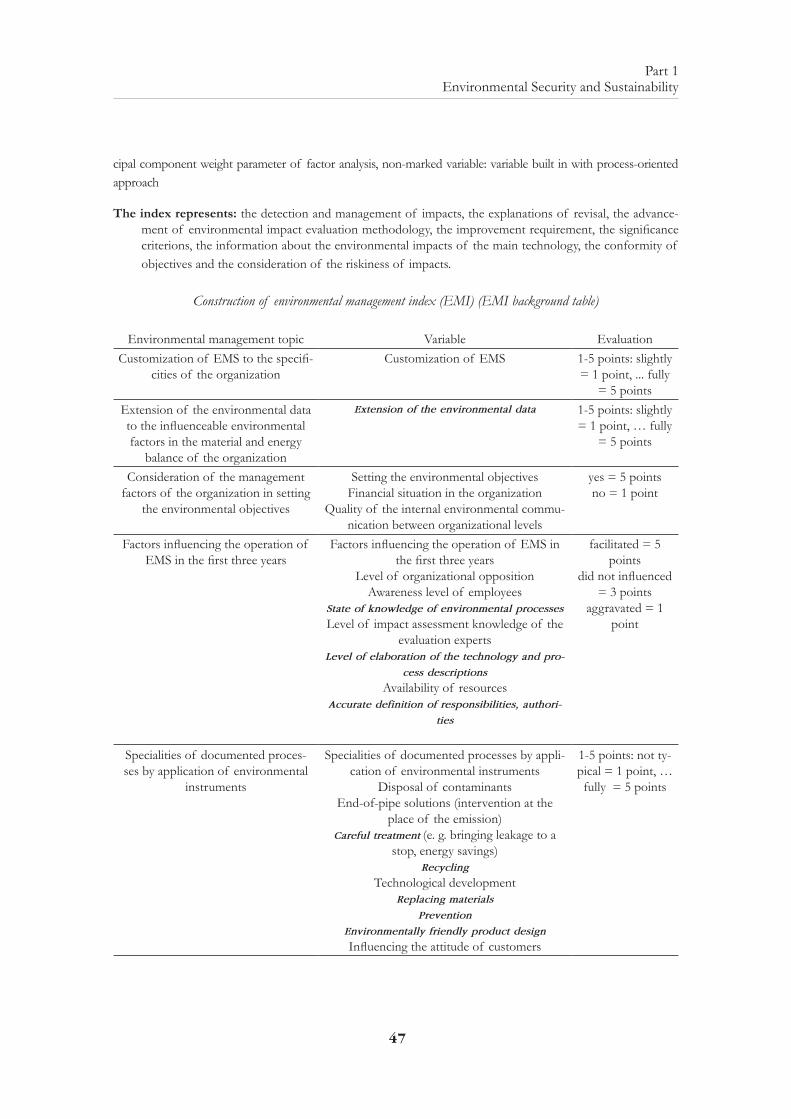
47
Part 1 Environmental Security and Sustainability
cipal component weight parameter of factor analysis, non-marked variable: variable built in with process-oriented approach
The index represents: the detection and management of impacts, the explanations of revisal, the advance-ment of environmental impact evaluation methodology, the improvement requirement, the significance criterions, the information about the environmental impacts of the main technology, the conformity of objectives and the consideration of the riskiness of impacts.
Construction of environmental management index (EMI) (EMI background table)
Environmental management topic Variable EvaluationCustomization of EMS to the specifi-
cities of the organizationCustomization of EMS 1-5 points: slightly
= 1 point, ... fully = 5 points
Extension of the environmental data to the influenceable environmental factors in the material and energy
balance of the organization
Extension of the environmental data 1-5 points: slightly = 1 point, … fully
= 5 points
Consideration of the management factors of the organization in setting
the environmental objectives
Setting the environmental objectivesFinancial situation in the organization
Quality of the internal environmental commu-nication between organizational levels
yes = 5 pointsno = 1 point
Factors influencing the operation of EMS in the first three years
Factors influencing the operation of EMS in the first three years
Level of organizational oppositionAwareness level of employees
State of knowledge of environmental processes
Level of impact assessment knowledge of the evaluation experts
Level of elaboration of the technology and pro-
cess descriptions
Availability of resourcesAccurate definition of responsibilities, authori-
ties
facilitated = 5 points
did not influenced = 3 points
aggravated = 1 point
Specialities of documented proces-ses by application of environmental
instruments
Specialities of documented processes by appli-cation of environmental instruments
Disposal of contaminantsEnd-of-pipe solutions (intervention at the
place of the emission)Careful treatment (e. g. bringing leakage to a
stop, energy savings)Recycling
Technological developmentReplacing materials
Prevention
Environmentally friendly product design
Influencing the attitude of customers
1-5 points: not ty-pical = 1 point, … fully = 5 points
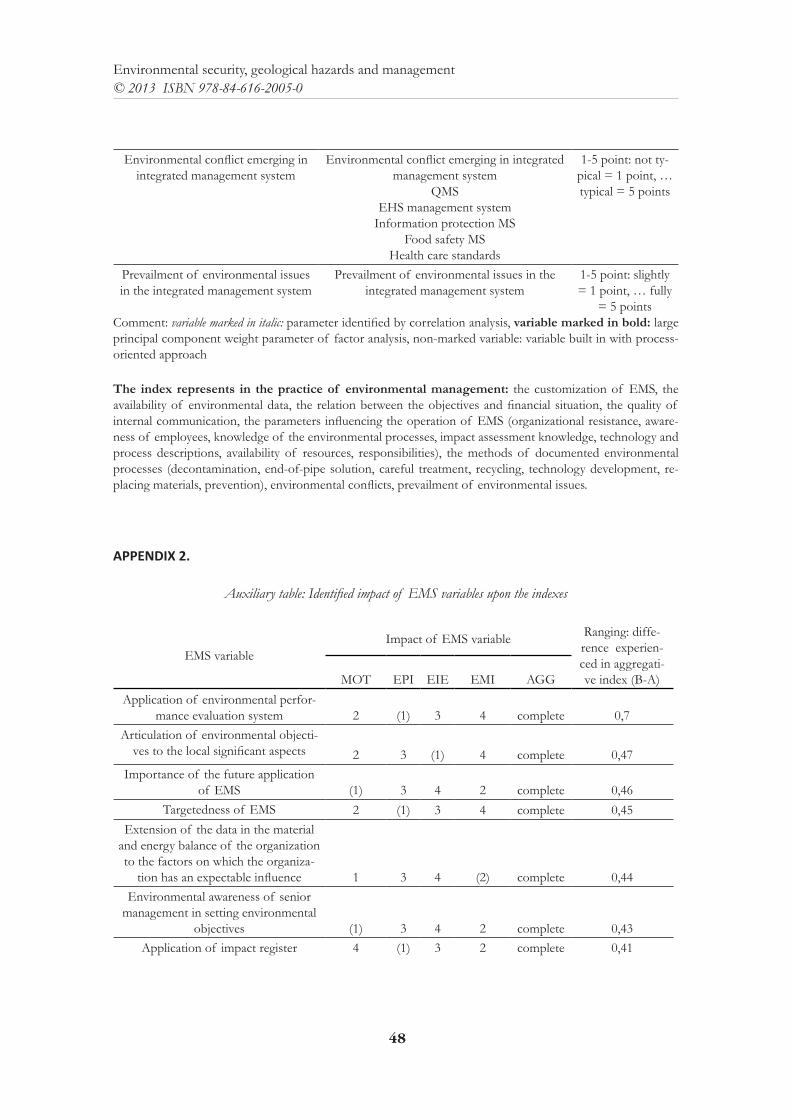
48
Environmental security, geological hazards and management© 2013 ISBN 978-84-616-2005-0
Environmental conflict emerging in integrated management system
Environmental conflict emerging in integrated management system
QMSEHS management system
Information protection MSFood safety MS
Health care standards
1-5 point: not ty-pical = 1 point, … typical = 5 points
Prevailment of environmental issues in the integrated management system
Prevailment of environmental issues in the integrated management system
1-5 point: slightly = 1 point, … fully
= 5 pointsComment: variable marked in italic: parameter identified by correlation analysis, variable marked in bold: large principal component weight parameter of factor analysis, non-marked variable: variable built in with process-oriented approach
The index represents in the practice of environmental management: the customization of EMS, the availability of environmental data, the relation between the objectives and financial situation, the quality of internal communication, the parameters influencing the operation of EMS (organizational resistance, aware-ness of employees, knowledge of the environmental processes, impact assessment knowledge, technology and process descriptions, availability of resources, responsibilities), the methods of documented environmental processes (decontamination, end-of-pipe solution, careful treatment, recycling, technology development, re-placing materials, prevention), environmental conflicts, prevailment of environmental issues.
APPENDIX 2.
Auxiliary table: Identified impact of EMS variables upon the indexes
EMS variableImpact of EMS variable Ranging: diffe-
rence experien-ced in aggregati-ve index (B-A)MOT EPI EIE EMI AGG
Application of environmental perfor-mance evaluation system 2 (1) 3 4 complete 0,7
Articulation of environmental objecti-ves to the local significant aspects 2 3 (1) 4 complete 0,47
Importance of the future application of EMS (1) 3 4 2 complete 0,46
Targetedness of EMS 2 (1) 3 4 complete 0,45Extension of the data in the material
and energy balance of the organization to the factors on which the organiza-
tion has an expectable influence 1 3 4 (2) complete 0,44Environmental awareness of senior
management in setting environmental objectives (1) 3 4 2 complete 0,43
Application of impact register 4 (1) 3 2 complete 0,41
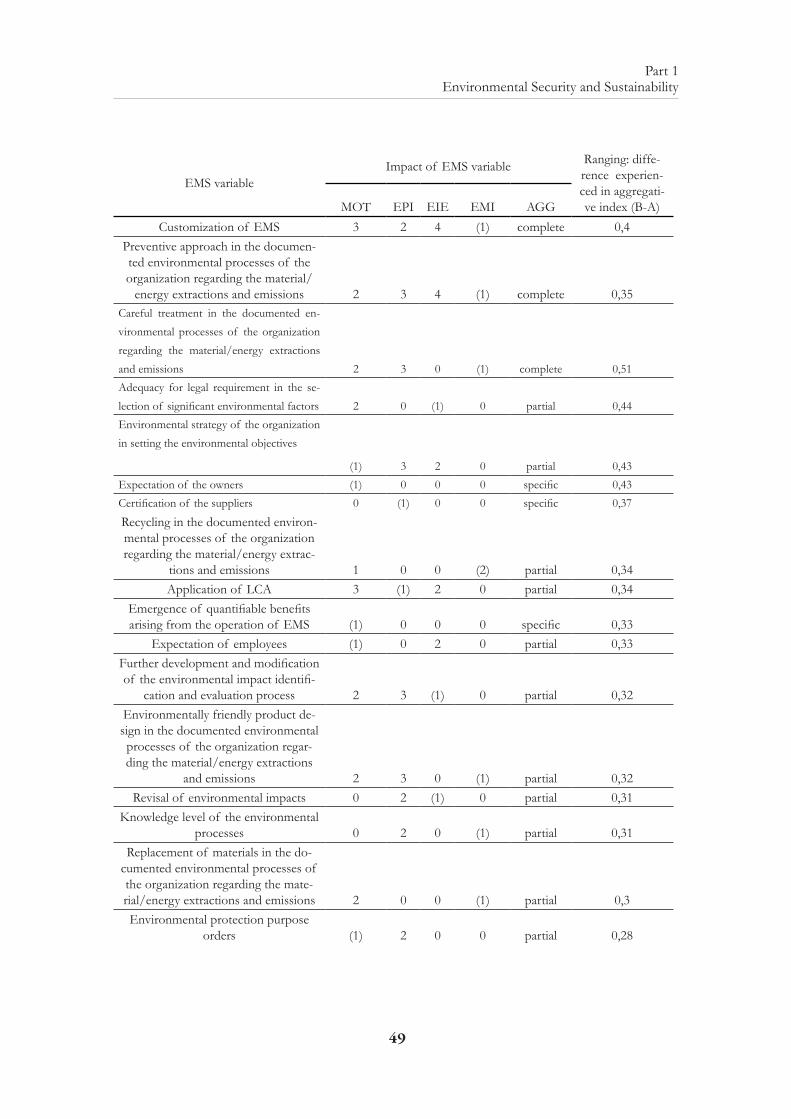
49
Part 1 Environmental Security and Sustainability
EMS variableImpact of EMS variable Ranging: diffe-
rence experien-ced in aggregati-ve index (B-A)MOT EPI EIE EMI AGG
Customization of EMS 3 2 4 (1) complete 0,4Preventive approach in the documen-ted environmental processes of the organization regarding the material/
energy extractions and emissions 2 3 4 (1) complete 0,35Careful treatment in the documented en-vironmental processes of the organization regarding the material/energy extractions and emissions 2 3 0 (1) complete 0,51Adequacy for legal requirement in the se-lection of significant environmental factors 2 0 (1) 0 partial 0,44Environmental strategy of the organization in setting the environmental objectives
(1) 3 2 0 partial 0,43Expectation of the owners (1) 0 0 0 specific 0,43Certification of the suppliers 0 (1) 0 0 specific 0,37
Recycling in the documented environ-mental processes of the organization regarding the material/energy extrac-
tions and emissions 1 0 0 (2) partial 0,34Application of LCA 3 (1) 2 0 partial 0,34
Emergence of quantifiable benefits arising from the operation of EMS (1) 0 0 0 specific 0,33
Expectation of employees (1) 0 2 0 partial 0,33Further development and modification of the environmental impact identifi-
cation and evaluation process 2 3 (1) 0 partial 0,32Environmentally friendly product de-sign in the documented environmental processes of the organization regar-ding the material/energy extractions
and emissions 2 3 0 (1) partial 0,32Revisal of environmental impacts 0 2 (1) 0 partial 0,31
Knowledge level of the environmental processes 0 2 0 (1) partial 0,31
Replacement of materials in the do-cumented environmental processes of the organization regarding the mate-rial/energy extractions and emissions 2 0 0 (1) partial 0,3Environmental protection purpose
orders (1) 2 0 0 partial 0,28
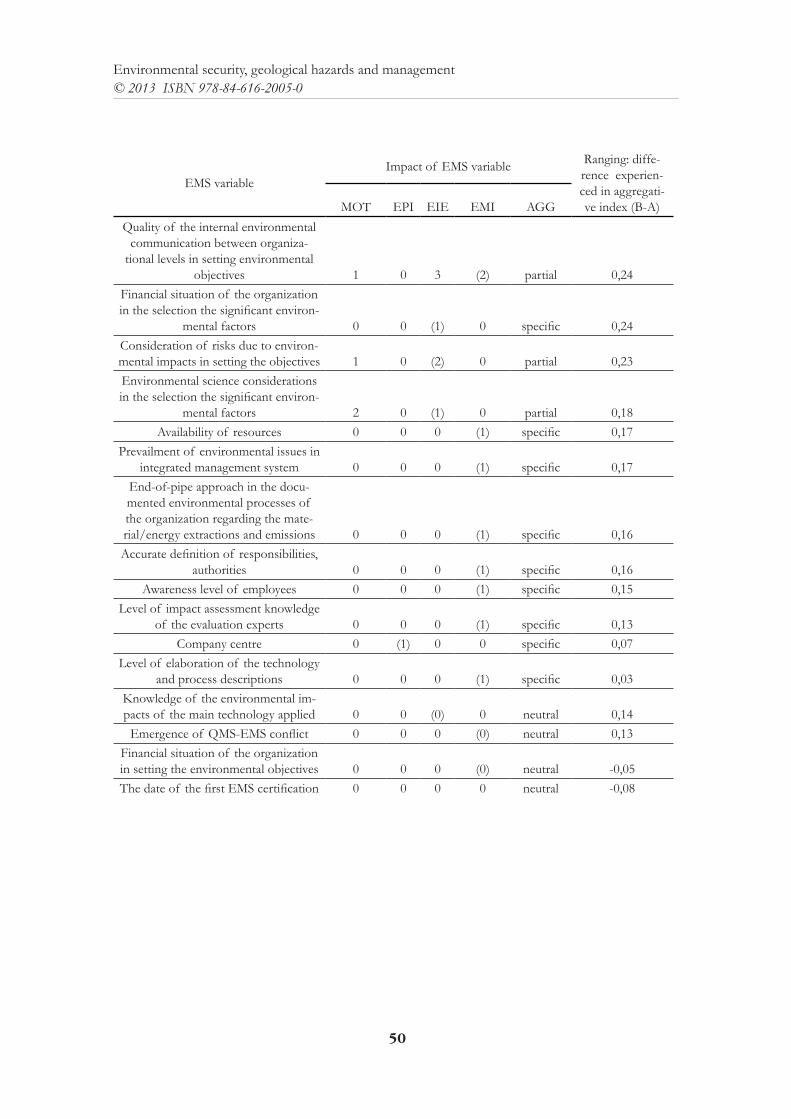
50
Environmental security, geological hazards and management© 2013 ISBN 978-84-616-2005-0
EMS variableImpact of EMS variable Ranging: diffe-
rence experien-ced in aggregati-ve index (B-A)MOT EPI EIE EMI AGG
Quality of the internal environmental communication between organiza-
tional levels in setting environmental objectives 1 0 3 (2) partial 0,24
Financial situation of the organization in the selection the significant environ-
mental factors 0 0 (1) 0 specific 0,24Consideration of risks due to environ-mental impacts in setting the objectives 1 0 (2) 0 partial 0,23Environmental science considerations in the selection the significant environ-
mental factors 2 0 (1) 0 partial 0,18Availability of resources 0 0 0 (1) specific 0,17
Prevailment of environmental issues in integrated management system 0 0 0 (1) specific 0,17
End-of-pipe approach in the docu-mented environmental processes of the organization regarding the mate-rial/energy extractions and emissions 0 0 0 (1) specific 0,16Accurate definition of responsibilities,
authorities 0 0 0 (1) specific 0,16Awareness level of employees 0 0 0 (1) specific 0,15
Level of impact assessment knowledge of the evaluation experts 0 0 0 (1) specific 0,13
Company centre 0 (1) 0 0 specific 0,07Level of elaboration of the technology
and process descriptions 0 0 0 (1) specific 0,03Knowledge of the environmental im-pacts of the main technology applied 0 0 (0) 0 neutral 0,14
Emergence of QMS-EMS conflict 0 0 0 (0) neutral 0,13Financial situation of the organization in setting the environmental objectives 0 0 0 (0) neutral -0,05The date of the first EMS certification 0 0 0 0 neutral -0,08
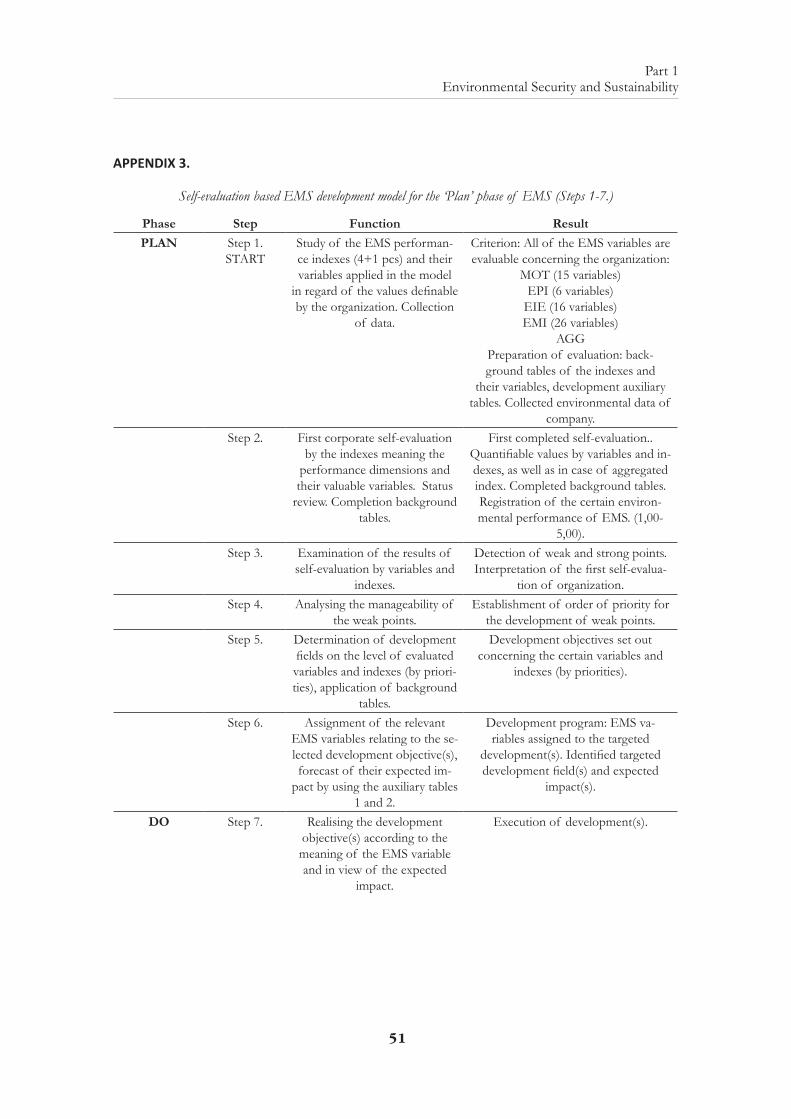
51
Part 1 Environmental Security and Sustainability
APPENDIX 3.
Self-evaluation based EMS development model for the ‘Plan’ phase of EMS (Steps 1-7.)
Phase Step Function ResultPLAN Step 1.
STARTStudy of the EMS performan-ce indexes (4+1 pcs) and their variables applied in the model
in regard of the values definable by the organization. Collection
of data.
Criterion: All of the EMS variables are evaluable concerning the organization:
MOT (15 variables)EPI (6 variables)
EIE (16 variables)EMI (26 variables)
AGGPreparation of evaluation: back-ground tables of the indexes and
their variables, development auxiliary tables. Collected environmental data of
company.Step 2. First corporate self-evaluation
by the indexes meaning the performance dimensions and their valuable variables. Status
review. Completion background tables.
First completed self-evaluation..Quantifiable values by variables and in-dexes, as well as in case of aggregated index. Completed background tables.Registration of the certain environ-mental performance of EMS. (1,00-
5,00).Step 3. Examination of the results of
self-evaluation by variables and indexes.
Detection of weak and strong points. Interpretation of the first self-evalua-
tion of organization.Step 4. Analysing the manageability of
the weak points.Establishment of order of priority for
the development of weak points.Step 5. Determination of development
fields on the level of evaluated variables and indexes (by priori-ties), application of background
tables.
Development objectives set out concerning the certain variables and
indexes (by priorities).
Step 6. Assignment of the relevant EMS variables relating to the se-lected development objective(s), forecast of their expected im-
pact by using the auxiliary tables 1 and 2.
Development program: EMS va-riables assigned to the targeted
development(s). Identified targeted development field(s) and expected
impact(s).
DO Step 7. Realising the development objective(s) according to the meaning of the EMS variable and in view of the expected
impact.
Execution of development(s).
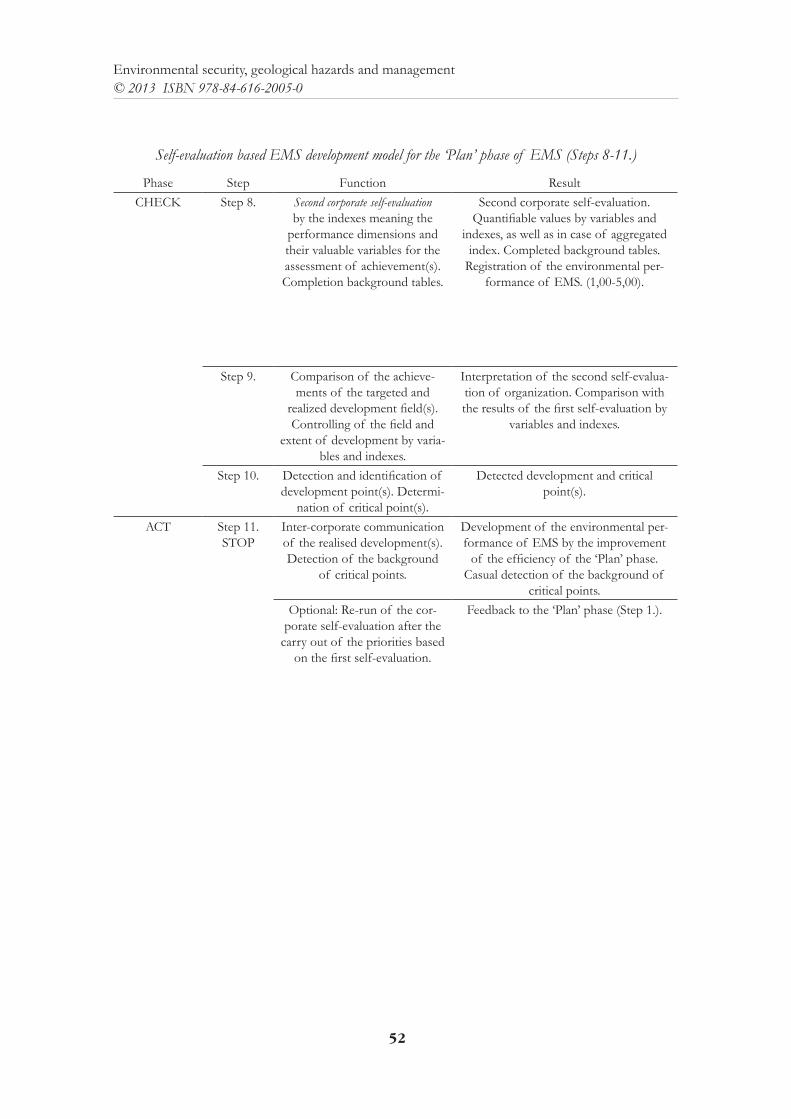
52
Environmental security, geological hazards and management© 2013 ISBN 978-84-616-2005-0
Self-evaluation based EMS development model for the ‘Plan’ phase of EMS (Steps 8-11.)
Phase Step Function ResultCHECK Step 8. Second corporate self-evaluation
by the indexes meaning the performance dimensions and their valuable variables for the assessment of achievement(s). Completion background tables.
Second corporate self-evaluation.Quantifiable values by variables and
indexes, as well as in case of aggregated index. Completed background tables.
Registration of the environmental per-formance of EMS. (1,00-5,00).
Step 9. Comparison of the achieve-ments of the targeted and
realized development field(s). Controlling of the field and
extent of development by varia-bles and indexes.
Interpretation of the second self-evalua-tion of organization. Comparison with the results of the first self-evaluation by
variables and indexes.
Step 10. Detection and identification of development point(s). Determi-
nation of critical point(s).
Detected development and critical point(s).
ACT Step 11. STOP
Inter-corporate communication of the realised development(s).Detection of the background
of critical points.
Development of the environmental per-formance of EMS by the improvement
of the efficiency of the ‘Plan’ phase.Casual detection of the background of
critical points.Optional: Re-run of the cor-
porate self-evaluation after the carry out of the priorities based
on the first self-evaluation.
Feedback to the ‘Plan’ phase (Step 1.).
53
Part 1 Environmental Security and Sustainability
MODELING FOR DECISION-MAKING: THE CONSTRUCTION OF AN AIR QUALITY INTEGRATED ASSESSMENT MODEL
FOR SPAIN
M. Vedrenne, R. Borge, J. Lumbreras & M.E. RodríguezEnvironmental Modeling Laboratory, Technical University of Madrid (UPM). Escuela Técnica Superior
de Ingenieros Industriales. c/ José Gutiérrez Abascal, 2. 28006. Madrid, Spain.
ABSTRACT: Integrated Assessment Modeling is an interesting approach for describing the complex interrelations existing between the elements that constitute the air quality problem: emissions, atmos-pheric processes and related impacts. The purpose of this paper is to describe the actual developments in the construction and design of a generic Integrated Assessment Model (IAM) applied to Spain. Currently, this IAM has been designed to describe the concentration profiles of two criteria pollutants subject to regulations: NO2 and SO2. The computation of such profiles is possible through the applica-tion of percentual variations to a number of transfer matrices (TM) for policy-relevant emissions sec-tors. These TM act as a parameterization of an Eulerian air quality model (AQM). In order to validate its performance, an evaluation of the IAM against the ordinary AQM for a given emission scenario has been carried out. Finally, a brief discussion on the potentialities and limitations of the IAM is addressed.
1. INTRODUCTION
Integrated Assessment Models (IAM) are tools that aim to describe quantitatively and as much as possible the cause-effect relationship of events, cross-linkages and interactions be-tween issues for a given problem. Since these models do not seek to offer a comprehensive picture of all the processes that are involved in this problem, they are simply used as inter-pretative rather than predictive tools (Quesnel et al., 2009). To this respect, constructing an IAM for describing the air pollution problem is very useful for studying the interrelations that exist between the processes that describe the emissions of a given pollutant, its atmos-pheric dispersion and chemical transformation, as well as the impacts to ecosystems or hu-man health that it produces (Oxley & ApSimon, 2007).
The development and application of IAMs is usually not a scientific-driven activity, but rather an effort to facilitate interaction between scientists, policymakers and stakeholders in environmental problems. As a result, an air-pollution IAM seeks to provide answers that are both scientifically rigorous and policy-relevant within a comprehensive framework. The tra-ditional approach for the description of the complex processes that compose the air-quality problem has been its simulation with computational air-quality models (AQM). However, the exploitation of such models requires a high degree of technical expertise as well as a robust
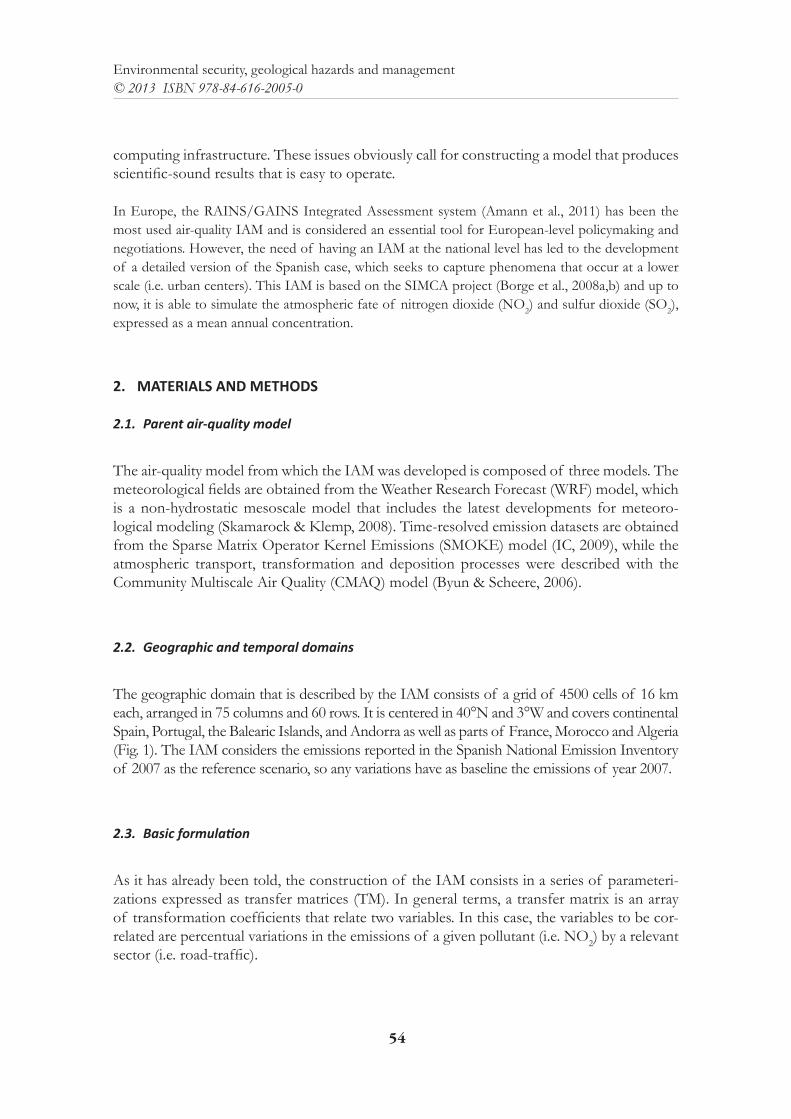
54
Environmental security, geological hazards and management© 2013 ISBN 978-84-616-2005-0
computing infrastructure. These issues obviously call for constructing a model that produces scientific-sound results that is easy to operate.
In Europe, the RAINS/GAINS Integrated Assessment system (Amann et al., 2011) has been the most used air-quality IAM and is considered an essential tool for European-level policymaking and negotiations. However, the need of having an IAM at the national level has led to the development of a detailed version of the Spanish case, which seeks to capture phenomena that occur at a lower scale (i.e. urban centers). This IAM is based on the SIMCA project (Borge et al., 2008a,b) and up to now, it is able to simulate the atmospheric fate of nitrogen dioxide (NO2) and sulfur dioxide (SO2), expressed as a mean annual concentration.
2. MATERIALS AND METHODS
2.1. Parent air-quality model
The air-quality model from which the IAM was developed is composed of three models. The meteorological fields are obtained from the Weather Research Forecast (WRF) model, which is a non-hydrostatic mesoscale model that includes the latest developments for meteoro-logical modeling (Skamarock & Klemp, 2008). Time-resolved emission datasets are obtained from the Sparse Matrix Operator Kernel Emissions (SMOKE) model (IC, 2009), while the atmospheric transport, transformation and deposition processes were described with the Community Multiscale Air Quality (CMAQ) model (Byun & Scheere, 2006).
2.2. Geographic and temporal domains
The geographic domain that is described by the IAM consists of a grid of 4500 cells of 16 km each, arranged in 75 columns and 60 rows. It is centered in 40°N and 3°W and covers continental Spain, Portugal, the Balearic Islands, and Andorra as well as parts of France, Morocco and Algeria (Fig. 1). The IAM considers the emissions reported in the Spanish National Emission Inventory of 2007 as the reference scenario, so any variations have as baseline the emissions of year 2007.
2.3. Basic formulation
As it has already been told, the construction of the IAM consists in a series of parameteri-zations expressed as transfer matrices (TM). In general terms, a transfer matrix is an array of transformation coefficients that relate two variables. In this case, the variables to be cor-related are percentual variations in the emissions of a given pollutant (i.e. NO2) by a relevant sector (i.e. road-traffic).
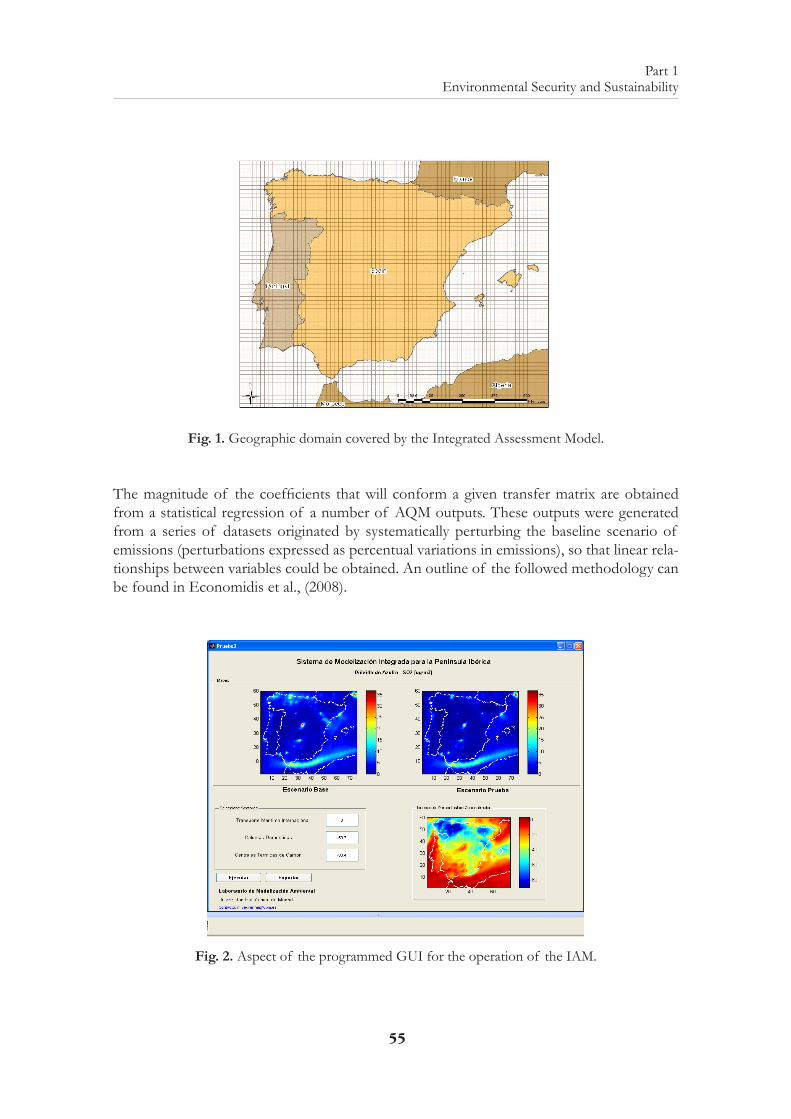
55
Part 1 Environmental Security and Sustainability
Fig. 1. Geographic domain covered by the Integrated Assessment Model.
The magnitude of the coefficients that will conform a given transfer matrix are obtained from a statistical regression of a number of AQM outputs. These outputs were generated from a series of datasets originated by systematically perturbing the baseline scenario of emissions (perturbations expressed as percentual variations in emissions), so that linear rela-tionships between variables could be obtained. An outline of the followed methodology can be found in Economidis et al., (2008).
Fig. 2. Aspect of the programmed GUI for the operation of the IAM.
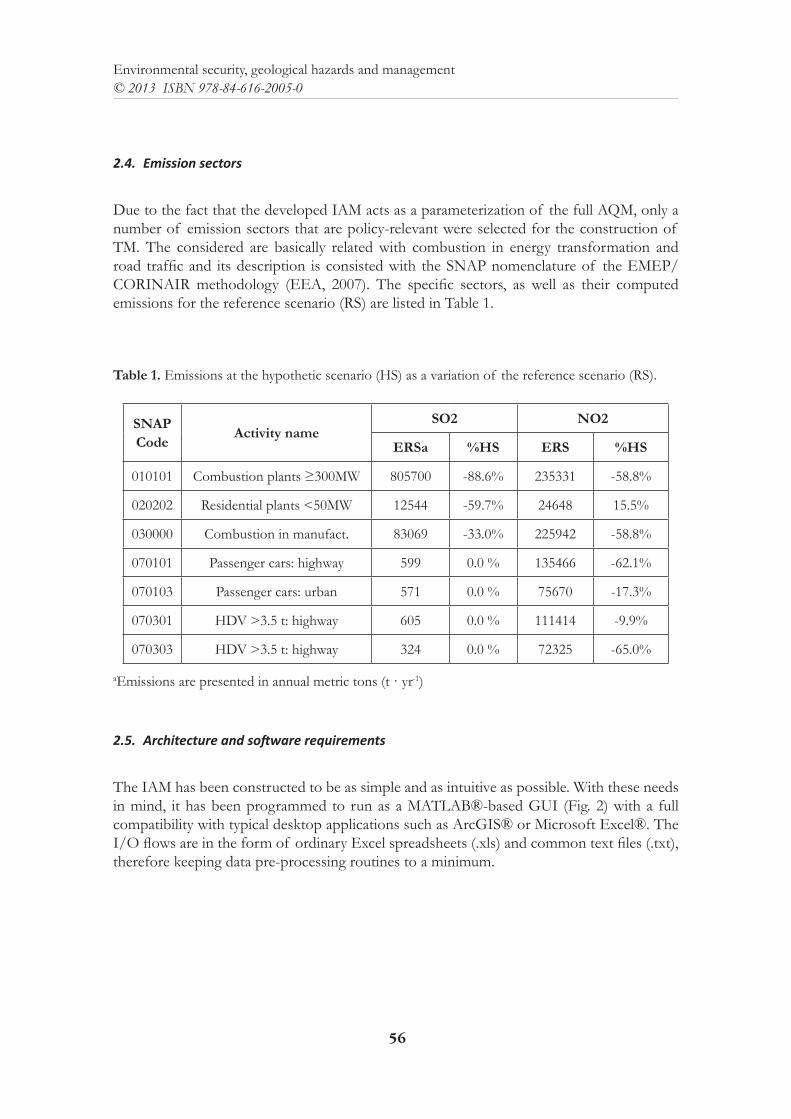
Environmental security, geological hazards and management© 2013 ISBN 978-84-616-2005-0
56
2.4. Emission sectors
Due to the fact that the developed IAM acts as a parameterization of the full AQM, only a number of emission sectors that are policy-relevant were selected for the construction of TM. The considered are basically related with combustion in energy transformation and road traffic and its description is consisted with the SNAP nomenclature of the EMEP/CORINAIR methodology (EEA, 2007). The specific sectors, as well as their computed emissions for the reference scenario (RS) are listed in Table 1.
Table 1. Emissions at the hypothetic scenario (HS) as a variation of the reference scenario (RS).
SNAP Code Activity name
SO2 NO2
ERSa %HS ERS %HS
010101 Combustion plants ≥300MW 805700 -88.6% 235331 -58.8%
020202 Residential plants <50MW 12544 -59.7% 24648 15.5%
030000 Combustion in manufact. 83069 -33.0% 225942 -58.8%
070101 Passenger cars: highway 599 0.0 % 135466 -62.1%
070103 Passenger cars: urban 571 0.0 % 75670 -17.3%
070301 HDV >3.5 t: highway 605 0.0 % 111414 -9.9%
070303 HDV >3.5 t: highway 324 0.0 % 72325 -65.0%
aEmissions are presented in annual metric tons (t · yr-1)
2.5. Architecture and software requirements
The IAM has been constructed to be as simple and as intuitive as possible. With these needs in mind, it has been programmed to run as a MATLAB®-based GUI (Fig. 2) with a full compatibility with typical desktop applications such as ArcGIS® or Microsoft Excel®. The I/O flows are in the form of ordinary Excel spreadsheets (.xls) and common text files (.txt), therefore keeping data pre-processing routines to a minimum.
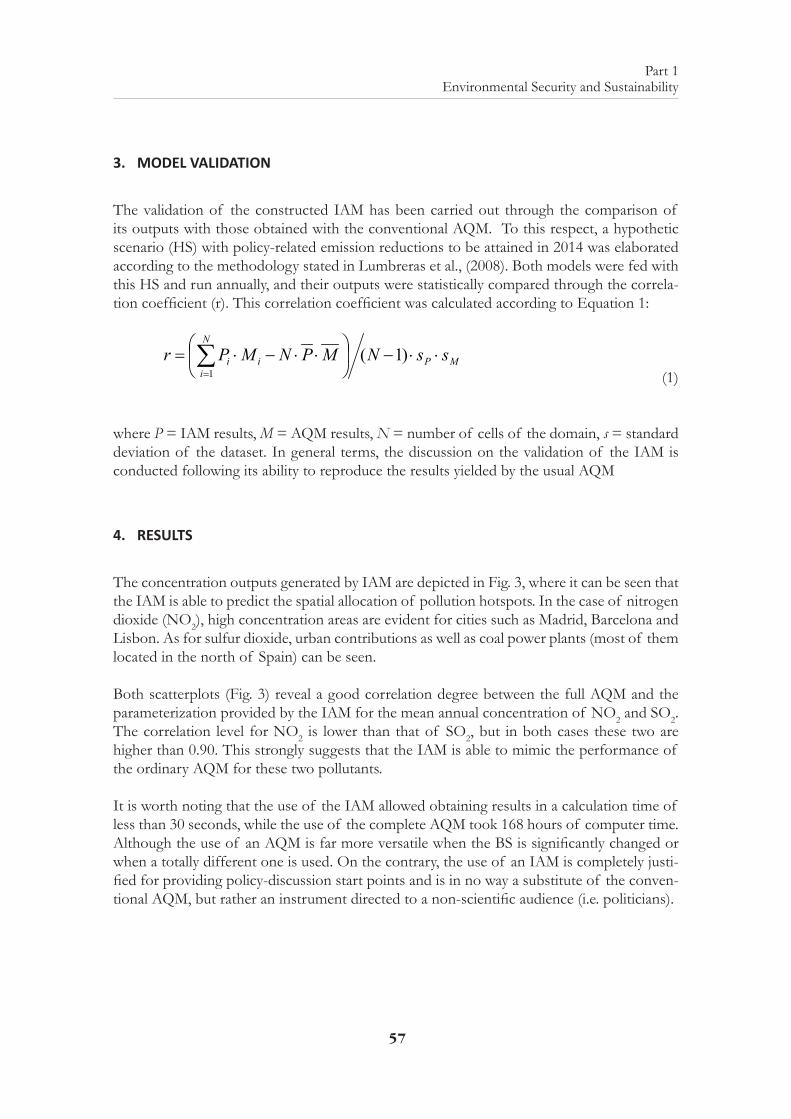
57
Part 1 Environmental Security and Sustainability
3. MODEL VALIDATION
The validation of the constructed IAM has been carried out through the comparison of its outputs with those obtained with the conventional AQM. To this respect, a hypothetic scenario (HS) with policy-related emission reductions to be attained in 2014 was elaborated according to the methodology stated in Lumbreras et al., (2008). Both models were fed with this HS and run annually, and their outputs were statistically compared through the correla-tion coefficient (r). This correlation coefficient was calculated according to Equation 1:
MP
N
iii ssNMPNMPr ⋅⋅−
⋅⋅−⋅= ∑
=
)1(1 (1)
where P = IAM results, M = AQM results, N = number of cells of the domain, s = standard deviation of the dataset. In general terms, the discussion on the validation of the IAM is conducted following its ability to reproduce the results yielded by the usual AQM
4. RESULTS
The concentration outputs generated by IAM are depicted in Fig. 3, where it can be seen that the IAM is able to predict the spatial allocation of pollution hotspots. In the case of nitrogen dioxide (NO2), high concentration areas are evident for cities such as Madrid, Barcelona and Lisbon. As for sulfur dioxide, urban contributions as well as coal power plants (most of them located in the north of Spain) can be seen.
Both scatterplots (Fig. 3) reveal a good correlation degree between the full AQM and the parameterization provided by the IAM for the mean annual concentration of NO2 and SO2. The correlation level for NO2 is lower than that of SO2, but in both cases these two are higher than 0.90. This strongly suggests that the IAM is able to mimic the performance of the ordinary AQM for these two pollutants.
It is worth noting that the use of the IAM allowed obtaining results in a calculation time of less than 30 seconds, while the use of the complete AQM took 168 hours of computer time. Although the use of an AQM is far more versatile when the BS is significantly changed or when a totally different one is used. On the contrary, the use of an IAM is completely justi-fied for providing policy-discussion start points and is in no way a substitute of the conven-tional AQM, but rather an instrument directed to a non-scientific audience (i.e. politicians).
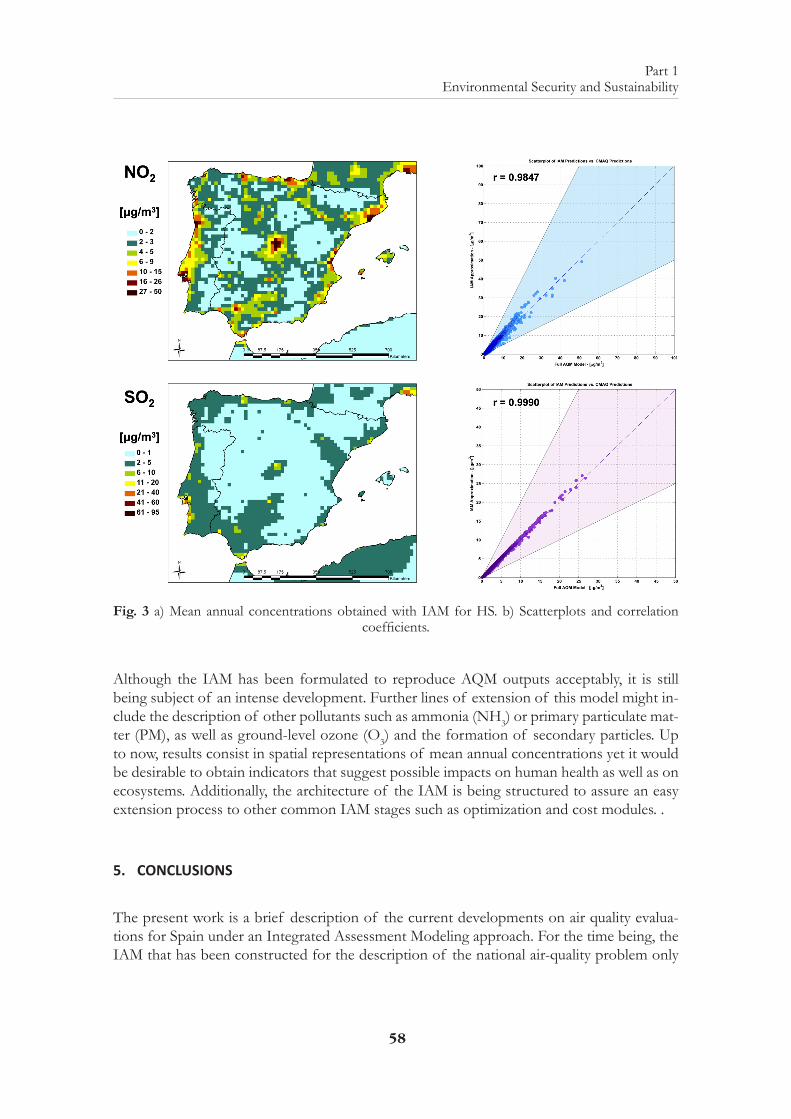
58
Part 1 Environmental Security and Sustainability
Fig. 3 a) Mean annual concentrations obtained with IAM for HS. b) Scatterplots and correlation coefficients.
Although the IAM has been formulated to reproduce AQM outputs acceptably, it is still being subject of an intense development. Further lines of extension of this model might in-clude the description of other pollutants such as ammonia (NH3) or primary particulate mat-ter (PM), as well as ground-level ozone (O3) and the formation of secondary particles. Up to now, results consist in spatial representations of mean annual concentrations yet it would be desirable to obtain indicators that suggest possible impacts on human health as well as on ecosystems. Additionally, the architecture of the IAM is being structured to assure an easy extension process to other common IAM stages such as optimization and cost modules. .
5. CONCLUSIONS
The present work is a brief description of the current developments on air quality evalua-tions for Spain under an Integrated Assessment Modeling approach. For the time being, the IAM that has been constructed for the description of the national air-quality problem only
59
Part 1 Environmental Security and Sustainability
describes a minimal part of it (two pollutants and seven emission sectors), producing annual mean concentrations as a result. However, the ultimate goal of this project is the consecution of a fully-operative model that can deal with more pollutants and more sectors, as well as to extend its scope to the quantification of impacts and costs. Although still under develop-ment, the core methodology for the description of other sectors and pollutants, and much more importantly, a modeling framework has been outlined. Up to now, the results that are being obtained look promising and further research will be done applying the knowledge gained during the first modeling stages.
REFERENCES
AMANN, M., BERTOK, I., BORKEN-KLEEFELD, J., COFALA, J., HEYES, C., HOGLUND ISAKSSON, L., KLIMONT, Z., NGUYEN, B., POSCH, M., RAFAJ, P., SANDLER, R., SCHOPP, W., WAGNER, F., & WINIWARTER, W. (2011); Cost-effective control of air qual-ity and greenhouse gases in Europe: Modeling and policy applications. Environmental Modelling & Software, 26, 1489-1501.
BORGE, R., LUMBRERAS, J. & RODRIGUEZ, M.E., 2008a: Development of a high resolution emission inventory for Spain using the SMOKE modelling system: A case study for the years 2000 and 2010. Environmental Modelling & Software 23, 1026-1044.
BORGE, R., ALEXANDROV, V., DEL VAS, J.J., LUMBRERAS, J. & RODRIGUEZ, M.E., 2008b. A comprehensive sensitivity analysis of the WRF model for air quality applications over the Ibe-rian Peninsula. Atmospheric Environment 42, 8560-8574.
BYUN, D.W. & SCHERE, K.L. (2006); Review of the governing equations, computational algo-rithms, and other components of the Models - 3 Community Multiscale Air Quality (CMAQ) Modeling System. Appl. Mechs. Rev. 59, 51-77.
ECONOMIDIS, CH., KERAMIDAS, D., DEMERTZI, A., STROMPLOS, N., SFETSOS, A., VLACHOGIANNIS, D. (2008); The compilation of a Greek Environmental Input Output ma-trix for 2005, and its application as a methodological framework for assessing emission reduction options. In: International Input Output Meeting on Managing the Environment (IIOMME). Se-ville, Spain. July 9-11.
EEA – EUROPEAN ENVIRONMENT AGENCY (2007); EMEP/CORINAIR Inventory Guide-book - 2007. EEA Technical report 16/2007. Available online at: http://www.eea.europa.eu/publications/
IC – INSTITUTE FOR THE ENVIRONMENT. (2009). SMOKE v2.6 User’s Manual. University of North Carolina. Chapel Hill, NC. USA.
LUMBRERAS, J., BORGE, R., DE ANDRÉS, J.M., & RODRIGUEZ, M.E. (2008); A model to calculate consistent atmospheric emission projections and its application to Spain. Atmos. Environ., 42, 5251-5266.
OXLEY, T. & APSIMON, H.M. (2007); Space, time and nesting Integrated Assessment Models, Environmental Modelling & Software 22, 1732 - 1749.
QUESNEL, G., DUBOZ, R. & RAMAT, E. (2009); The Virtual Laboratory Environment – An op-The Virtual Laboratory Environment – An op-erational framework for multi-modelling, simulation and analysis of complex dynamical systems. Simulation Modelling Practice & Theory 17, 641 - 653.
SKAMAROCK, W.C. & KLEMP, J.B. (2008); A time-split nonhydrostatic atmospheric model. J Comp. Phys., 227, 3465-3485.

61
Part 1 Environmental Security and Sustainability
IMPLEMENTING BIM TECHNIQUES FOR ENERGY ANALYSIS: A CASE STUDY OF BUILDINGS AT UNIVERSITY
OF LA LAGUNA
N. Martin-Dorta, P. González de Chaves Assef, J. De la Torre Cantero, G. Rodríguez Rufino, Escuela de Ingeniería Civil e Industrial, Universidad de La Laguna
ABSTRACT: This paper presents the strengths and weaknesses found during the execution of the research project of the Higher School of Agricultural Engineering, using BIM technology to calculating energy efficiency savings. The integration of energy and environmental issues during the design, construction and remodeling, in order to get adapt to the energy needs that arise through new techniques or technologies, requires new methodologies that allow us to manage infrastructure throughout its lifecycle. In recent years, there has been produced incorporating BIM technology for the realization of a project thus can be life cycle information of this, improving cooperation between disciplines and reducing duplication of information.
1. BUILDING INFORMATION MODELING (BIM)
Building Information Modeling (BIM) is a broad concept that has been defined in several ways in the literature. The acronym BIM can be used to refer to a product (building informa-tion model, meaning a structured dataset describing a building), an activity (building infor-mation modeling, meaning the act of creating a building information model), or a system (building information management, meaning the business structures of work and commu-nication that increase quality and efficiency) (NIBS, 2007). Building Information Modeling is defined broadly as being “a set of interacting policies, processes technologies generating a methodology to manage the essential building design and project data in digital format throughout the building’s life-cycle” (PENTTILÄ, 2006; SUCCAR, 2009). Project planning and execution depends on the valuing and trading-off of the scope, time, and cost of the project (WINCH, 2010; SEARS, SEARS, & CLOUGH, 2000). Scope defines the work that is required to complete the project successfully.
The introduction of BIM tools for the building supposes the integration of various disci-plines as architecture, building engineering, civil engineering, construction, facilities, renew-able energies, among others. All the professionals involved in the project can manage from the same technological platform the information of the project lifecycle, allowing the reuse of data in a coordinated, coherent and more efficient manner, thus reducing data loss oc-curring during the exchange between the different disciplines, facilitating workflow, reducing
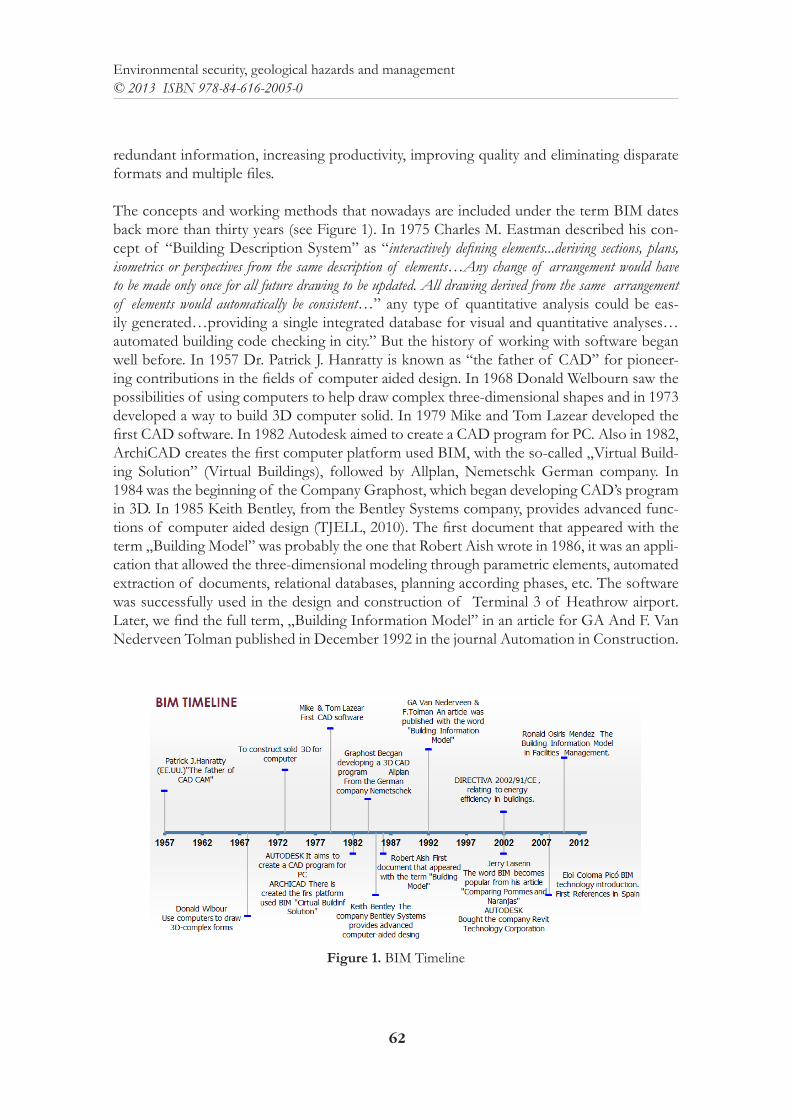
62
Environmental security, geological hazards and management© 2013 ISBN 978-84-616-2005-0
redundant information, increasing productivity, improving quality and eliminating disparate formats and multiple files.
The concepts and working methods that nowadays are included under the term BIM dates back more than thirty years (see Figure 1). In 1975 Charles M. Eastman described his con-cept of “Building Description System” as “interactively defining elements...deriving sections, plans, isometrics or perspectives from the same description of elements…Any change of arrangement would have to be made only once for all future drawing to be updated. All drawing derived from the same arrangement of elements would automatically be consistent…” any type of quantitative analysis could be eas-ily generated…providing a single integrated database for visual and quantitative analyses…automated building code checking in city.” But the history of working with software began well before. In 1957 Dr. Patrick J. Hanratty is known as “the father of CAD” for pioneer-ing contributions in the fields of computer aided design. In 1968 Donald Welbourn saw the possibilities of using computers to help draw complex three-dimensional shapes and in 1973 developed a way to build 3D computer solid. In 1979 Mike and Tom Lazear developed the first CAD software. In 1982 Autodesk aimed to create a CAD program for PC. Also in 1982, ArchiCAD creates the first computer platform used BIM, with the so-called „Virtual Build-ing Solution” (Virtual Buildings), followed by Allplan, Nemetschk German company. In 1984 was the beginning of the Company Graphost, which began developing CAD’s program in 3D. In 1985 Keith Bentley, from the Bentley Systems company, provides advanced func-tions of computer aided design (TJELL, 2010). The first document that appeared with the term „Building Model” was probably the one that Robert Aish wrote in 1986, it was an appli-cation that allowed the three-dimensional modeling through parametric elements, automated extraction of documents, relational databases, planning according phases, etc. The software was successfully used in the design and construction of Terminal 3 of Heathrow airport. Later, we find the full term, „Building Information Model” in an article for GA And F. Van Nederveen Tolman published in December 1992 in the journal Automation in Construction.
Figure 1. BIM Timeline
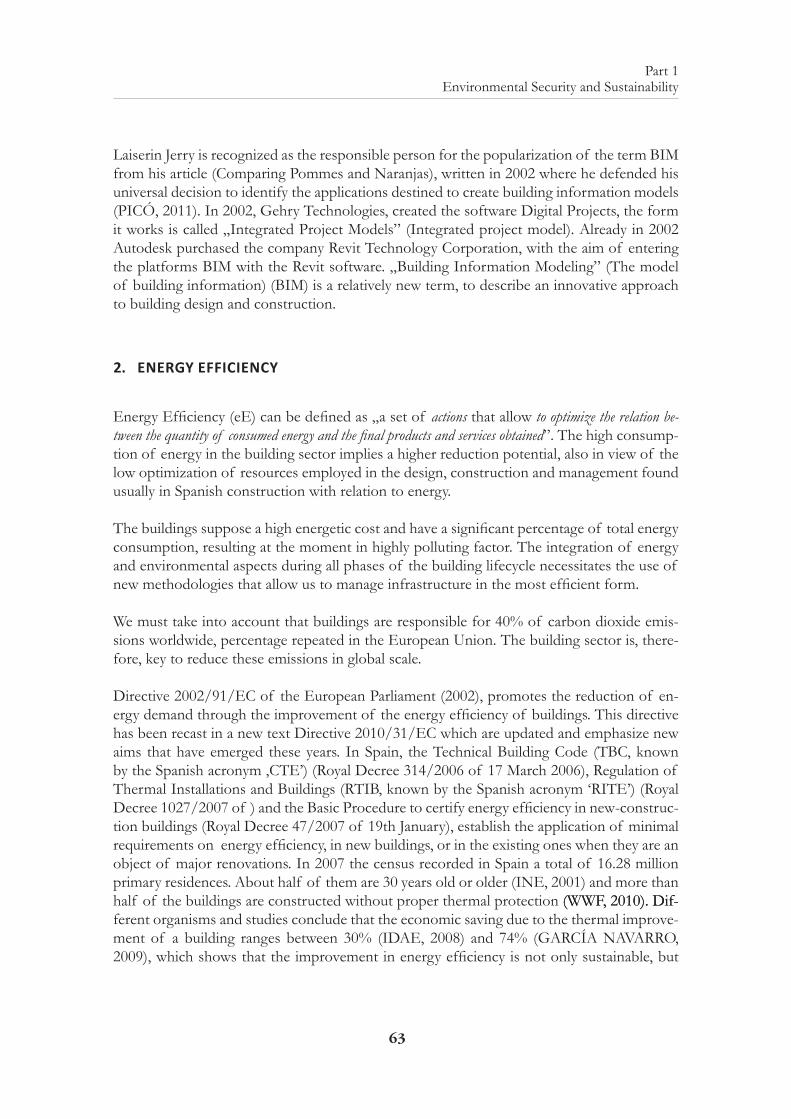
63
Part 1 Environmental Security and Sustainability
Laiserin Jerry is recognized as the responsible person for the popularization of the term BIM from his article (Comparing Pommes and Naranjas), written in 2002 where he defended his universal decision to identify the applications destined to create building information models (PICÓ, 2011). In 2002, Gehry Technologies, created the software Digital Projects, the form it works is called „Integrated Project Models” (Integrated project model). Already in 2002 Autodesk purchased the company Revit Technology Corporation, with the aim of entering the platforms BIM with the Revit software. „Building Information Modeling” (The model of building information) (BIM) is a relatively new term, to describe an innovative approach to building design and construction.
2. ENERGY EFFICIENCY
Energy Efficiency (eE) can be defined as „a set of actions that allow to optimize the relation be-tween the quantity of consumed energy and the final products and services obtained”. The high consump-tion of energy in the building sector implies a higher reduction potential, also in view of the low optimization of resources employed in the design, construction and management found usually in Spanish construction with relation to energy.
The buildings suppose a high energetic cost and have a significant percentage of total energy consumption, resulting at the moment in highly polluting factor. The integration of energy and environmental aspects during all phases of the building lifecycle necessitates the use of new methodologies that allow us to manage infrastructure in the most efficient form.
We must take into account that buildings are responsible for 40% of carbon dioxide emis-sions worldwide, percentage repeated in the European Union. The building sector is, there-fore, key to reduce these emissions in global scale.
Directive 2002/91/EC of the European Parliament (2002), promotes the reduction of en-ergy demand through the improvement of the energy efficiency of buildings. This directive has been recast in a new text Directive 2010/31/EC which are updated and emphasize new aims that have emerged these years. In Spain, the Technical Building Code (TBC, known by the Spanish acronym ‚CTE’) (Royal Decree 314/2006 of 17 March 2006), Regulation of Thermal Installations and Buildings (RTIB, known by the Spanish acronym ‘RITE’) (Royal Decree 1027/2007 of ) and the Basic Procedure to certify energy efficiency in new-construc-tion buildings (Royal Decree 47/2007 of 19th January), establish the application of minimal requirements on energy efficiency, in new buildings, or in the existing ones when they are an object of major renovations. In 2007 the census recorded in Spain a total of 16.28 million primary residences. About half of them are 30 years old or older (INE, 2001) and more than half of the buildings are constructed without proper thermal protection (WWF, 2010). Dif-(WWF, 2010). Dif-ferent organisms and studies conclude that the economic saving due to the thermal improve-ment of a building ranges between 30% (IDAE, 2008) and 74% (GARCÍA NAVARRO, 2009), which shows that the improvement in energy efficiency is not only sustainable, but
64
Environmental security, geological hazards and management© 2013 ISBN 978-84-616-2005-0
profitable. The improvements to the properties can be classified into three main groups: Im-provement in the building envelope, improvement in the air conditioning, and improvement in the performance of the lighting.
Currently, the law on certification of existing buildings is in phase of approval, changing the national scene and giving an important step towards the national and European aims for En-ergy efficiency (eE). The Public Administrative buildings will be the first ones in adapting to this legislation. This study tries to be an element of approximation for the future obligatory nature of the energy label qualification certification. Currently, the University of La Laguna lacks a management methodology that includes the energy efficiency of their facilities, ser-vices and resources.
3. CASE STUDY
The objective of this work is to detect the strengths and weaknesses in the use of BIM technology in the calculation of energy efficiency. In order to do this, we create a building information model of the Higher Technical School of Agricultural Engineering to meet the requirements contemplated in The Basic Document HE Energy Savings 2010 (Documento Básico Ahorro de Eenrgía – BDHE) of the Technical Building Code of Spain (see Figure 2).
Figura 2: An Energy-Savings Calculation Methodology using BIM Technology.
The problem is approached by a new methodology based on an information model of the school mentioned. The aim objective was to create an information model of a building from the University of La Laguna that will be used for our experimental prototype to adopt a reference methodology with the use of BIM technology, analyzing their strengths and weak-nesses. This study has the support of ApliCAD, company of programming services special-ized in the implementation of graphical environments and databases management.
65
Part 1 Environmental Security and Sustainability
We use the building of the Higher Technical School of Agricultural Engineering of La La-guna (Tenerife). It has four floors, ninety rooms and a total area of approximately 5300m2, with a U-shaped geometry. We used commercial software Autodesk Revit and created a library of constructive systems based on the own database Lider materials.
In this paper we want to emphasize the strengths and weaknesses detected making the model of the Superior Technical School of Agricultural Engineering with BIM technology. The fol-lowing table details an analysis summarized of the most important items (see Table 1):
Table 1. BIM Technology: Strengths and Weaknesses
StrengthsPromotes the integration of designs in context / environment.Allows the analysis of different alternatives of the design.Rectifies errors in real time.Faster project definition. Better speed in the analysis of the limitation of energy demand.Increase in productivity as less time is devoted to the project.Reuse of the information of the different analyses based on the same model. To analyze the struc-tural behavior in real systems, concentration of gases, analysis of shades.Ease of generating the graphic documentation of the project.Virtual Simulation allows project assessment and decision making at earlier stages.Control of the project lifecycle. The elements can be defined as built, reformed, being built or to be built, which allows us, besides having more accurate and realistic database (DB), to have control of a project, whether at design stage, the construction phase, total or partial remodeling, or the management of the completed infrastructure.Allows the junction between design control/construction and economic factor. Work planning analysis. We have instant data of the volume and surface of materials to be used, and at the same time, we can associate to each element other technical characteristics.Promotes collaborative and multidisciplinary work. The modifications are realized, coordinated and are reflected in all relations, highlighting the interferences detected in the designed model.WeaknessesInterferences between constructional elements. Solving connections between elements to export the model to other applications (see Figure 3). Level of complexity of the information model. For calculation applications (for example: energy efficiency) the model needed can be simpler, with minor detail.Data Exchange StandardsThe need for a plug-in to export the project and use it with other software, for example Exporter Revit-LIDER.Implementation of BIM technology. The percentage of professional architects and engineers using BIM is still low, but is increasing.In Spain only a very low percentage of university centers offer training in BIM.
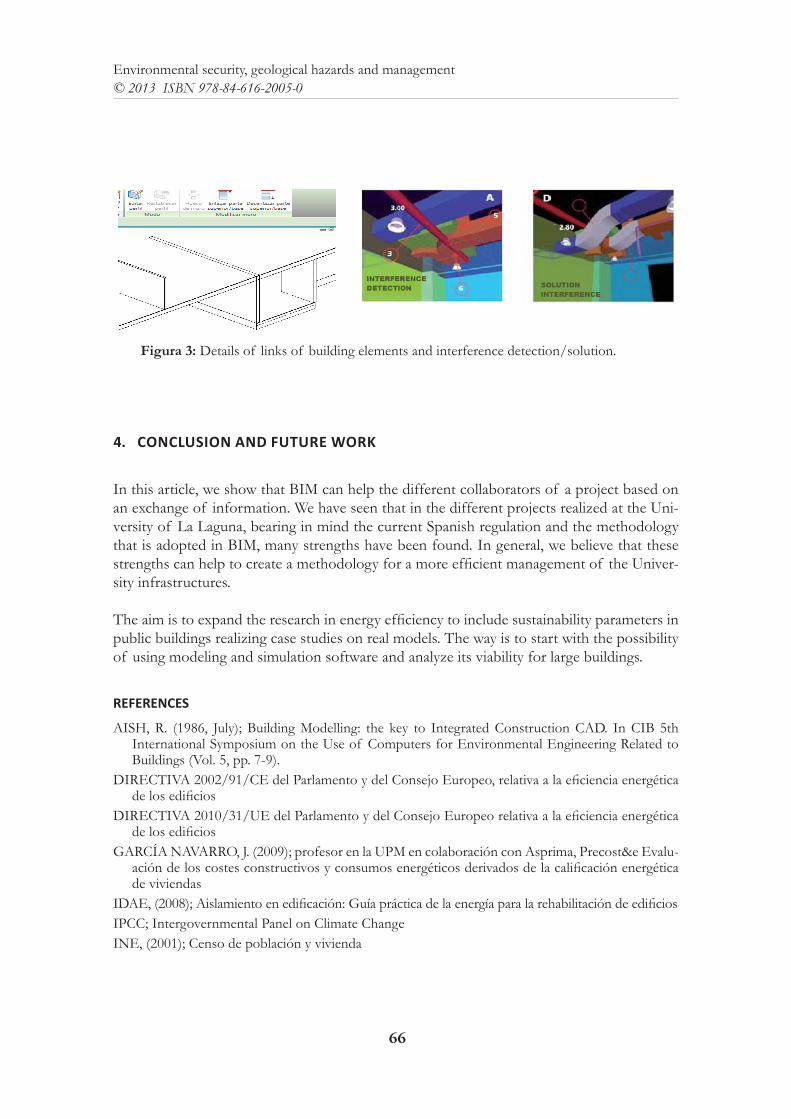
66
Environmental security, geological hazards and management© 2013 ISBN 978-84-616-2005-0
Figura 3: Details of links of building elements and interference detection/solution.
4. CONCLUSION AND FUTURE WORK
In this article, we show that BIM can help the different collaborators of a project based on an exchange of information. We have seen that in the different projects realized at the Uni-versity of La Laguna, bearing in mind the current Spanish regulation and the methodology that is adopted in BIM, many strengths have been found. In general, we believe that these strengths can help to create a methodology for a more efficient management of the Univer-sity infrastructures.
The aim is to expand the research in energy efficiency to include sustainability parameters in public buildings realizing case studies on real models. The way is to start with the possibility of using modeling and simulation software and analyze its viability for large buildings.
REFERENCES
AISH, R. (1986, July); Building Modelling: the key to Integrated Construction CAD. In CIB 5th International Symposium on the Use of Computers for Environmental Engineering Related to Buildings (Vol. 5, pp. 7-9).
DIRECTIVA 2002/91/CE del Parlamento y del Consejo Europeo, relativa a la eficiencia energética de los edificios
DIRECTIVA 2010/31/UE del Parlamento y del Consejo Europeo relativa a la eficiencia energética de los edificios
GARCÍA NAVARRO, J. (2009); profesor en la UPM en colaboración con Asprima, Precost&e Evalu-ación de los costes constructivos y consumos energéticos derivados de la calificación energética de viviendas
IDAE, (2008); Aislamiento en edificación: Guía práctica de la energía para la rehabilitación de edificios IPCC; Intergovernmental Panel on Climate ChangeINE, (2001); Censo de población y vivienda
67
Part 1 Environmental Security and Sustainability
LAISERIN, J., & XIN, W. (2002); Comparing pommes and naranjas.LEHTINEN, T. (2010); Advantages and disadvantages of vertical integration in the implementation
of systemic process innovations: Case studies on implementing building information modeling (BIM) in the Finnish construction industry.
MÉNDEZ, R. O. (2006); The Building Information Model in Facilities Management (Doctoral dis-sertation, Worcester Polytechnic Institute.).
NIBS, NATIONAL BIM STANDARD, PART 1 2007; Overview, Principles, and Methodologies, National Institute for Building Sciences(NIBS), Washington, DC, USA. 182 p
PENTTILÄ, H. (2006); Describing the changes in architectural information technology to under-stand design complexity and free-form architectural expression.
PETERSON, F., HARTMANN, T., FRUCHTER, R., & FISCHER, M. (2011); Teaching construc-tion project management with BIM support: Experience and lessons learned. Automation in Con-struction, 20(2), 115-125.
PEREYRA, I. J. R. B., GRIFÉ, I. N. Z., & LEDESMA, M. I. G. F. S.; INTEROPERABILIDAD ENTRE SISTEMAS COMPUTACIONALES BIM Y DE PRECIOS UNITARIOS ORIENTA-DOS A LA CONSTRUCCIÓN.
PICÓ, E. C. (2008); Introducción a la tecnología BIM.PICÓ, E. C. (2011). Visualització d’informació en un model BIM.REAL DECRETO 314/2006, de 17 de marzo, por el que se aprueba el Código Técnico de la Edi-
ficación.REAL DECRETO 47/2007, de 19 de enero, por el que se aprueba el Procedimiento básico para la
certificación de eficiencia energética de edificios de nueva construcción.REAL DECRETO 1027/2007, de 20 de julio, por el que se aprueba el Reglamento de Instalaciones
Térmicas en los Edificios.SEARS, S. K., SEARS, G. A., & CLOUGH, R. H. (2000); Construction project management. WileySUCCAR, B. (2009); Building information modelling framework: A research and delivery foundation
for industry stakeholders. Automation in Construction, 18(3), 357-375.TAYLOR, J. E., & BERNSTEIN, P. G. (2009); Paradigm trajectories of building information model-
ing practice in project networks. Journal of Management in Engineering, 25(2), 69-76.TJELL, A. J.(2010); Building Information Modeling (BIM) in Design Detailing with Focus on Interior Wall Systems.VAN NEDERVEEN, G. A., & TOLMAN, F. P. (1992); Modelling multiple views on buildings. Au-
tomation in Construction, 1(3), 215-224.WINCH, G. M. (2010); Managing construction projects. Wiley-Blackwell.WWF, (2010), Potencial de ahorro energético y de reducción de emisiones de CO2 del parque residen-
cial existente en España en 2020

69
Part 1 Environmental Security and Sustainability
ECOLOGICAL FOUNDATION FOR SUSTAINABLE LAND USE
A. Polgár & Á. DrüszlerInstitute of Environmental and Earth Sciences, The University of West Hungary Faculty of Forestry, Sopron,
Hungary
F. Lakatos & V. TakácsInstitute of Silviculture and Forest Protection, The University of West Hungary Faculty of Forestry,
Sopron, Hungary
T. BazsóInstitute of Geomatics and Civil Engineering, The University of West Hungary Faculty of Forestry,
Sopron, Hungary
ABSTRACT: The 2010 Climate Agreement in Cancun, Mexico, identified as of matter of urgency the need for training on managing environment security and preventing occurrence by providing.
The Earth’s land areas are dominated by human usage. In Europe, as in other industrialized regions, a large proportion of the area is used for forestry, agriculture, cities and infrastructure. Only a rather small remaining proportion is occupied by natural ecosystems, which are not in use at all. Irreversible consequences of such intensive land use include soil degradation and erosion, shifts in ground water availability, loss of biodiversity, and load with nutrients and ecotoxical chemicals. For that reason, land use is taken into account in Life-Cycle Assessment (LCA) and represents an impact category (Heijungs et al. 1997, Udo de Haes et al. 1999). The impact category land use groups together all intentional activities necessary to make land usable as a resource in economic sectors such as agricul-ture, forestry, and the building industry (Köllner & Scholz 2007). Land use has large impacts on the natural environment. Despite this, the attention for this type of impacts within LCA circles has been lagging behind. Recently, some methods have been developed (IVAM method, Köllner’s method, LCAGAPS method etc.) or rather are still in development to include land use impacts in the LCA framework (Voet 2001).
Land cover changes over time are one of the less successfully reconstructed anthropogenic influ-ences on climate. After the analysis of MM5 dynamic model simulations, we found that the Hungar-ian land cover changes in the last 100 years caused an increase of +0.15 ° C daily temperature and +0.18 ° C dew-point depression during the vegetation period. This means that the near-surface air over Hungary is now warmer and drier than before due to the land cover change.
1. INTRODUCTION
1.1. Programme in Environmental Security and Management
Europe is facing an accelerated climate change as a result of global warming and as a result population departure and consequent abandon of rural areas due to the increase floods, for-
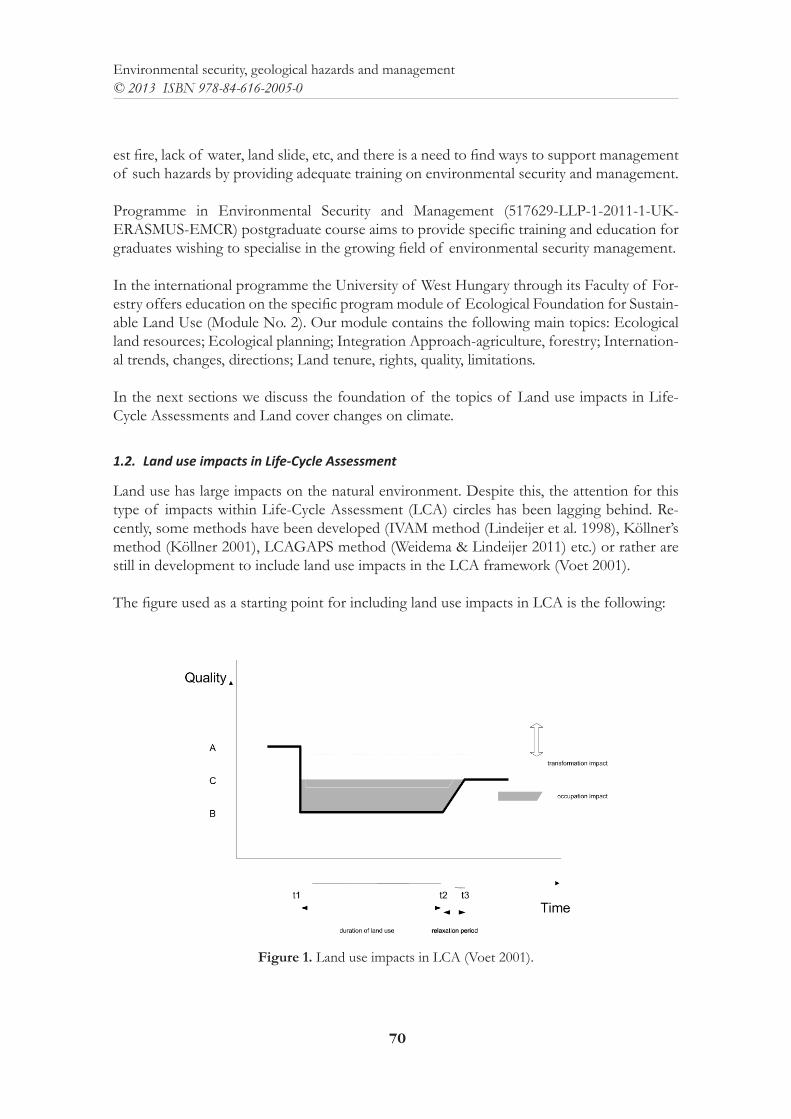
70
Environmental security, geological hazards and management© 2013 ISBN 978-84-616-2005-0
est fire, lack of water, land slide, etc, and there is a need to find ways to support management of such hazards by providing adequate training on environmental security and management.
Programme in Environmental Security and Management (517629-LLP-1-2011-1-UK-ERASMUS-EMCR) postgraduate course aims to provide specific training and education for graduates wishing to specialise in the growing field of environmental security management.
In the international programme the University of West Hungary through its Faculty of For-estry offers education on the specific program module of Ecological Foundation for Sustain-able Land Use (Module No. 2). Our module contains the following main topics: Ecological land resources; Ecological planning; Integration Approach-agriculture, forestry; Internation-al trends, changes, directions; Land tenure, rights, quality, limitations.
In the next sections we discuss the foundation of the topics of Land use impacts in Life-Cycle Assessments and Land cover changes on climate.
1.2. Land use impacts in Life-Cycle Assessment
Land use has large impacts on the natural environment. Despite this, the attention for this type of impacts within Life-Cycle Assessment (LCA) circles has been lagging behind. Re-cently, some methods have been developed (IVAM method (Lindeijer et al. 1998), Köllner’s method (Köllner 2001), LCAGAPS method (Weidema & Lindeijer 2011) etc.) or rather are still in development to include land use impacts in the LCA framework (Voet 2001).
The figure used as a starting point for including land use impacts in LCA is the following:
Figure 1. Land use impacts in LCA (Voet 2001).
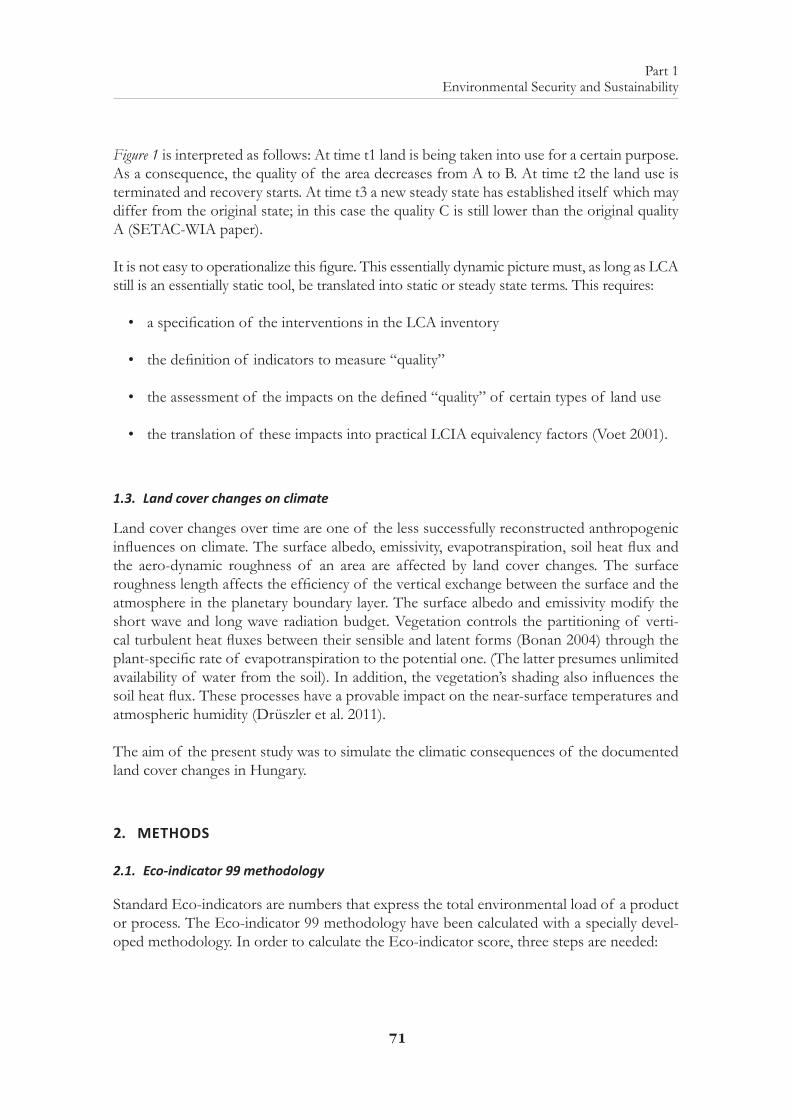
71
Part 1 Environmental Security and Sustainability
Figure 1 is interpreted as follows: At time t1 land is being taken into use for a certain purpose. As a consequence, the quality of the area decreases from A to B. At time t2 the land use is terminated and recovery starts. At time t3 a new steady state has established itself which may differ from the original state; in this case the quality C is still lower than the original quality A (SETAC-WIA paper).
It is not easy to operationalize this figure. This essentially dynamic picture must, as long as LCA still is an essentially static tool, be translated into static or steady state terms. This requires:
• a specification of the interventions in the LCA inventory
• the definition of indicators to measure “quality”
• the assessment of the impacts on the defined “quality” of certain types of land use
• the translation of these impacts into practical LCIA equivalency factors (Voet 2001).
1.3. Land cover changes on climate
Land cover changes over time are one of the less successfully reconstructed anthropogenic influences on climate. The surface albedo, emissivity, evapotranspiration, soil heat flux and the aero-dynamic roughness of an area are affected by land cover changes. The surface roughness length affects the efficiency of the vertical exchange between the surface and the atmosphere in the planetary boundary layer. The surface albedo and emissivity modify the short wave and long wave radiation budget. Vegetation controls the partitioning of verti-cal turbulent heat fluxes between their sensible and latent forms (Bonan 2004) through the plant-specific rate of evapotranspiration to the potential one. (The latter presumes unlimited availability of water from the soil). In addition, the vegetation’s shading also influences the soil heat flux. These processes have a provable impact on the near-surface temperatures and atmospheric humidity (Drüszler et al. 2011).
The aim of the present study was to simulate the climatic consequences of the documented land cover changes in Hungary.
2. METHODS
2.1. Eco-indicator 99 methodology
Standard Eco-indicators are numbers that express the total environmental load of a product or process. The Eco-indicator 99 methodology have been calculated with a specially devel-oped methodology. In order to calculate the Eco-indicator score, three steps are needed:
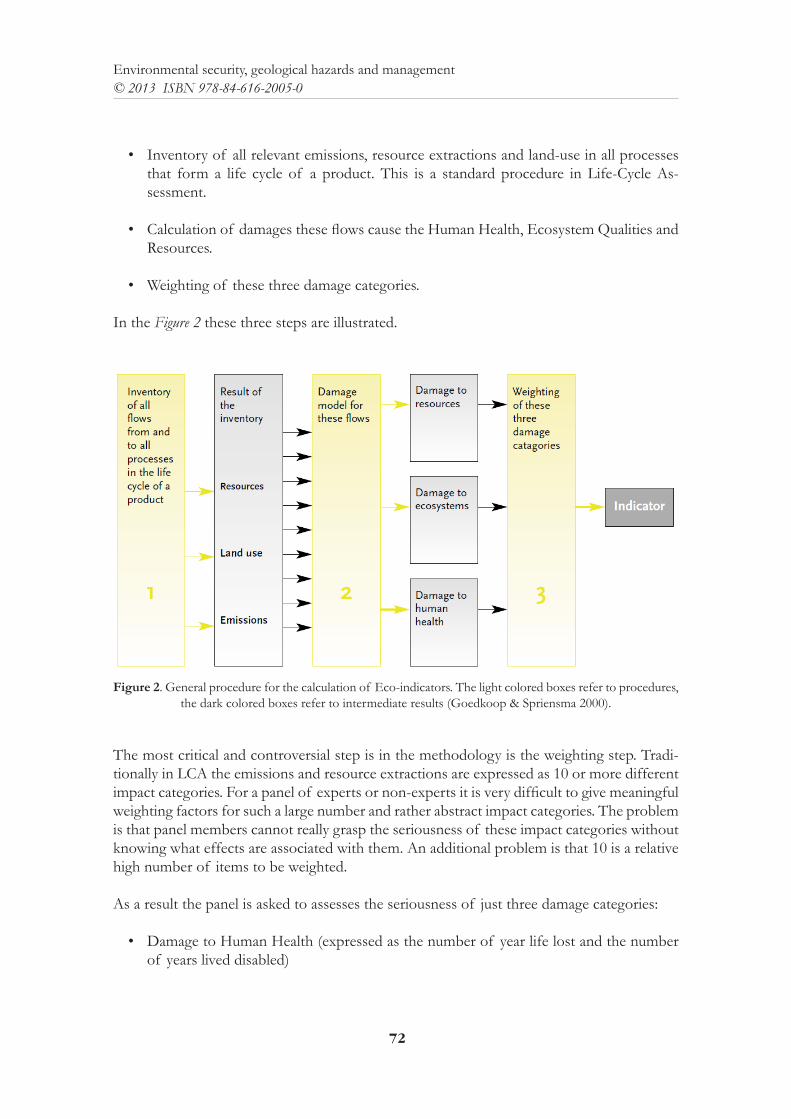
72
Environmental security, geological hazards and management© 2013 ISBN 978-84-616-2005-0
• Inventory of all relevant emissions, resource extractions and land-use in all processes that form a life cycle of a product. This is a standard procedure in Life-Cycle As-sessment.
• Calculation of damages these flows cause the Human Health, Ecosystem Qualities and Resources.
• Weighting of these three damage categories.
In the Figure 2 these three steps are illustrated.
Figure 2. General procedure for the calculation of Eco-indicators. The light colored boxes refer to procedures, the dark colored boxes refer to intermediate results (Goedkoop & Spriensma 2000).
The most critical and controversial step is in the methodology is the weighting step. Tradi-tionally in LCA the emissions and resource extractions are expressed as 10 or more different impact categories. For a panel of experts or non-experts it is very difficult to give meaningful weighting factors for such a large number and rather abstract impact categories. The problem is that panel members cannot really grasp the seriousness of these impact categories without knowing what effects are associated with them. An additional problem is that 10 is a relative high number of items to be weighted.
As a result the panel is asked to assesses the seriousness of just three damage categories:
• Damage to Human Health (expressed as the number of year life lost and the number of years lived disabled)
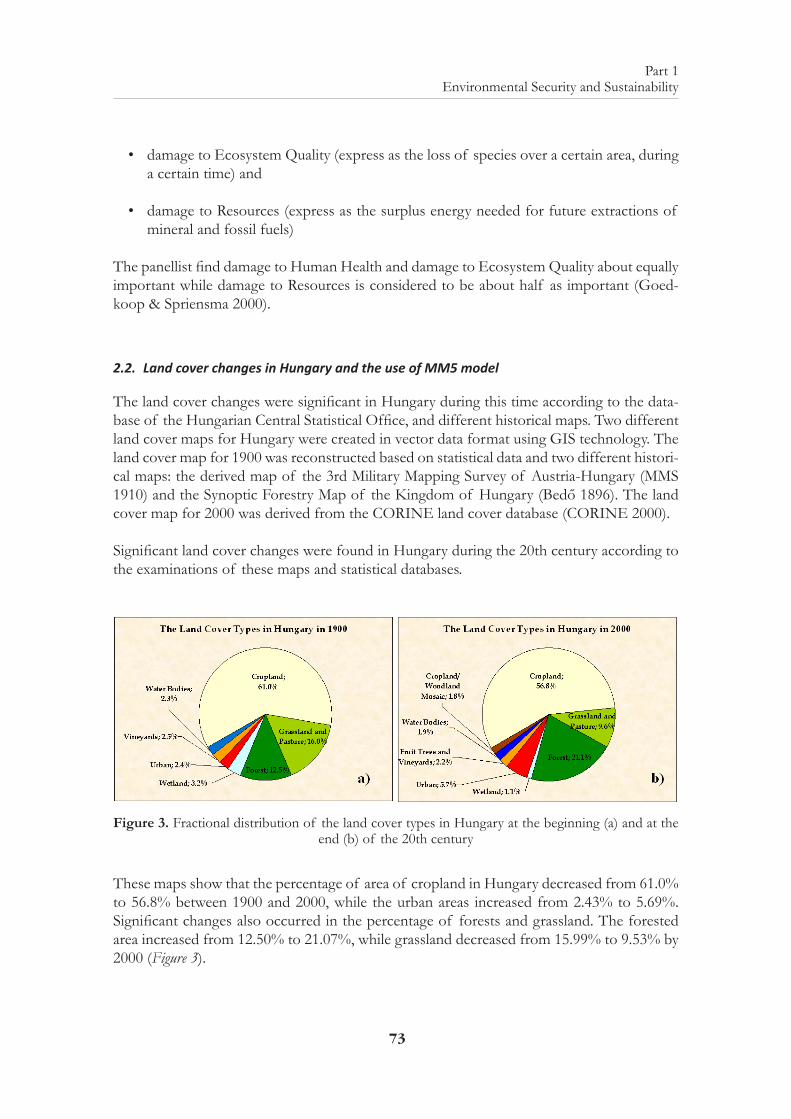
73
Part 1 Environmental Security and Sustainability
• damage to Ecosystem Quality (express as the loss of species over a certain area, during a certain time) and
• damage to Resources (express as the surplus energy needed for future extractions of mineral and fossil fuels)
The panellist find damage to Human Health and damage to Ecosystem Quality about equally important while damage to Resources is considered to be about half as important (Goed-koop & Spriensma 2000).
2.2. Land cover changes in Hungary and the use of MM5 model
The land cover changes were significant in Hungary during this time according to the data-base of the Hungarian Central Statistical Office, and different historical maps. Two different land cover maps for Hungary were created in vector data format using GIS technology. The land cover map for 1900 was reconstructed based on statistical data and two different histori-cal maps: the derived map of the 3rd Military Mapping Survey of Austria-Hungary (MMS 1910) and the Synoptic Forestry Map of the Kingdom of Hungary (Bedő 1896). The land cover map for 2000 was derived from the CORINE land cover database (CORINE 2000).
Significant land cover changes were found in Hungary during the 20th century according to the examinations of these maps and statistical databases.
Figure 3. Fractional distribution of the land cover types in Hungary at the beginning (a) and at the end (b) of the 20th century
These maps show that the percentage of area of cropland in Hungary decreased from 61.0% to 56.8% between 1900 and 2000, while the urban areas increased from 2.43% to 5.69%. Significant changes also occurred in the percentage of forests and grassland. The forested area increased from 12.50% to 21.07%, while grassland decreased from 15.99% to 9.53% by 2000 (Figure 3).
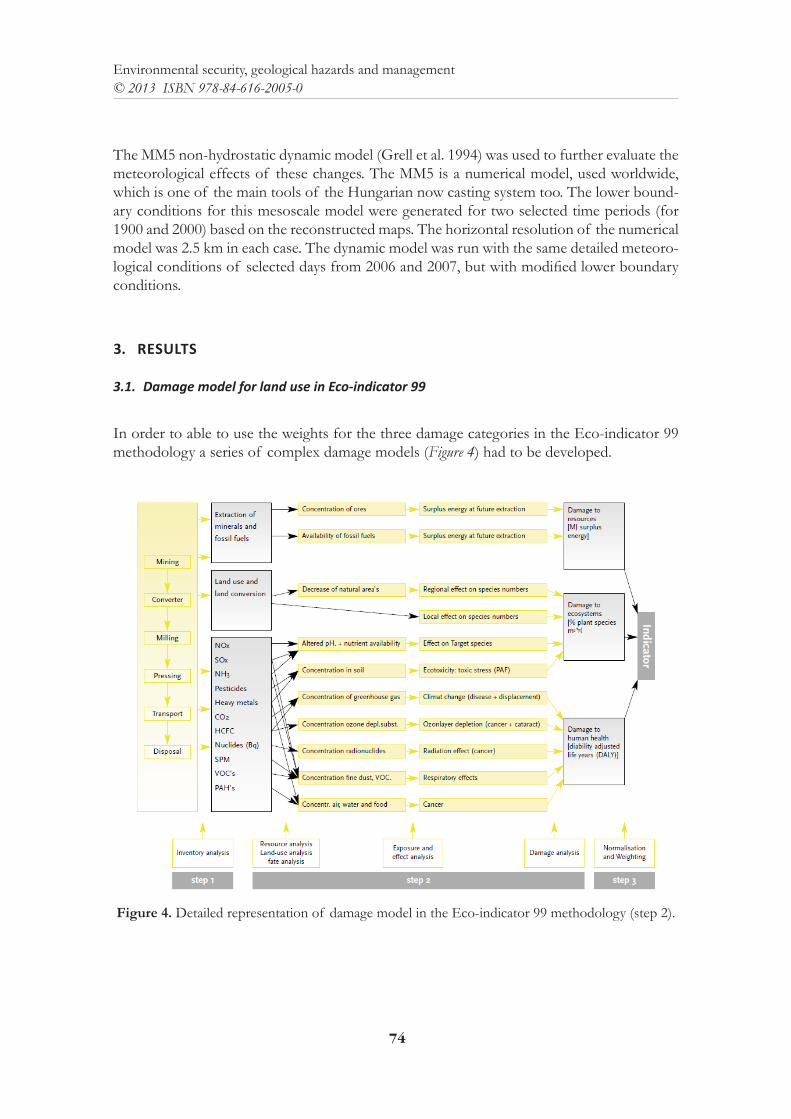
74
Environmental security, geological hazards and management© 2013 ISBN 978-84-616-2005-0
The MM5 non-hydrostatic dynamic model (Grell et al. 1994) was used to further evaluate the meteorological effects of these changes. The MM5 is a numerical model, used worldwide, which is one of the main tools of the Hungarian now casting system too. The lower bound-ary conditions for this mesoscale model were generated for two selected time periods (for 1900 and 2000) based on the reconstructed maps. The horizontal resolution of the numerical model was 2.5 km in each case. The dynamic model was run with the same detailed meteoro-logical conditions of selected days from 2006 and 2007, but with modified lower boundary conditions.
3. RESULTS
3.1. Damage model for land use in Eco-indicator 99
In order to able to use the weights for the three damage categories in the Eco-indicator 99 methodology a series of complex damage models (Figure 4) had to be developed.
Figure 4. Detailed representation of damage model in the Eco-indicator 99 methodology (step 2).
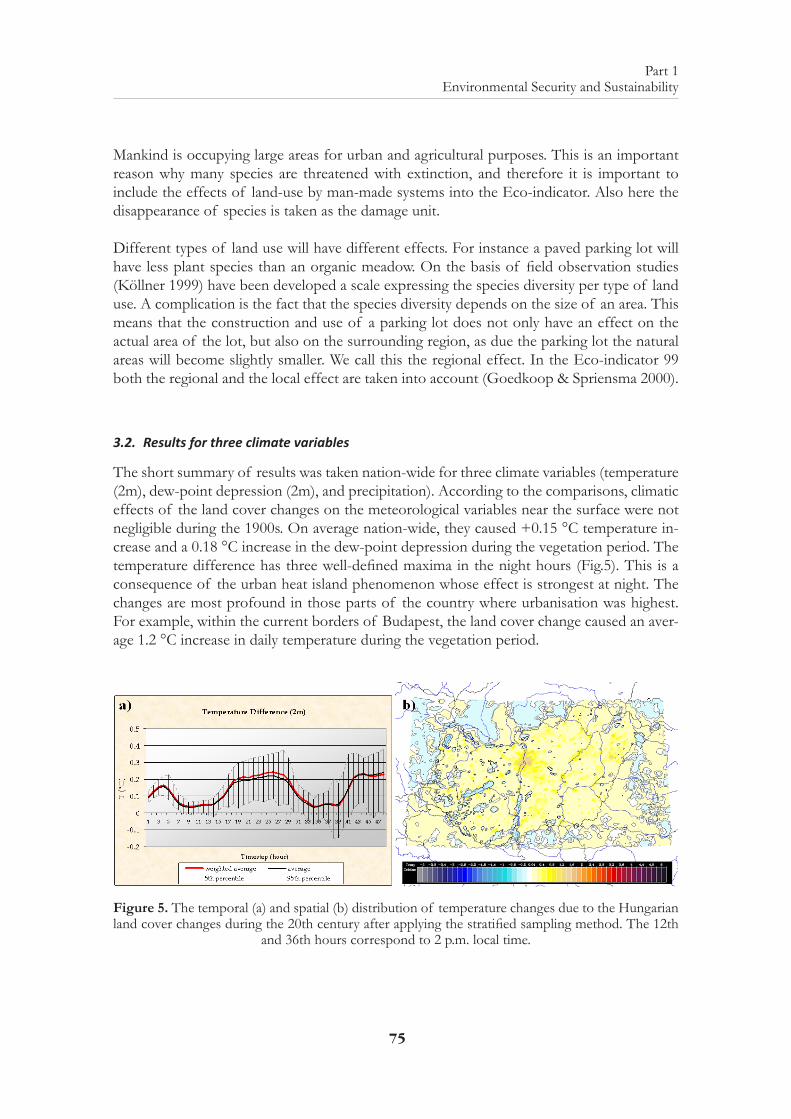
75
Part 1 Environmental Security and Sustainability
Mankind is occupying large areas for urban and agricultural purposes. This is an important reason why many species are threatened with extinction, and therefore it is important to include the effects of land-use by man-made systems into the Eco-indicator. Also here the disappearance of species is taken as the damage unit.
Different types of land use will have different effects. For instance a paved parking lot will have less plant species than an organic meadow. On the basis of field observation studies (Köllner 1999) have been developed a scale expressing the species diversity per type of land use. A complication is the fact that the species diversity depends on the size of an area. This means that the construction and use of a parking lot does not only have an effect on the actual area of the lot, but also on the surrounding region, as due the parking lot the natural areas will become slightly smaller. We call this the regional effect. In the Eco-indicator 99 both the regional and the local effect are taken into account (Goedkoop & Spriensma 2000).
3.2. Results for three climate variables
The short summary of results was taken nation-wide for three climate variables (temperature (2m), dew-point depression (2m), and precipitation). According to the comparisons, climatic effects of the land cover changes on the meteorological variables near the surface were not negligible during the 1900s. On average nation-wide, they caused +0.15 °C temperature in-crease and a 0.18 °C increase in the dew-point depression during the vegetation period. The temperature difference has three well-defined maxima in the night hours (Fig.5). This is a consequence of the urban heat island phenomenon whose effect is strongest at night. The changes are most profound in those parts of the country where urbanisation was highest. For example, within the current borders of Budapest, the land cover change caused an aver-age 1.2 °C increase in daily temperature during the vegetation period.
Figure 5. The temporal (a) and spatial (b) distribution of temperature changes due to the Hungarian land cover changes during the 20th century after applying the stratified sampling method. The 12th
and 36th hours correspond to 2 p.m. local time.
76
Environmental security, geological hazards and management© 2013 ISBN 978-84-616-2005-0
Figure 5b also shows that in a few places in the country, contrary trends were found from the national mean. Both the temperature and the dew-point changes (not shown) are the most expressed within the country’s borders, because only the land cover changes within the coun-try were available. Nevertheless, some effects of these changes within the country are also obvious outside the borders. Similar changes in the neighboring countries, not involved into our simulations, could also affect the climate of Hungary.
4. CONCLUSIONS
4.1. Land use impacts in Life-Cycle Assessment
In the framework of LCA, land use is broadly accepted as an impact category. However, the methodology for the assessment of damages on the natural environment was and still is the subject of discussion. It is possible to calculate the damages from complex series of land transformation, land occupation, and land restoration. An impact assessment method for land use with generic characterization factors improves the basis for decision-making in industry and other organizations (Köllner & Scholz 2007).
4.2. Land cover changes on climate
After the analysis of MM5 dynamic model simulations, we found that the Hungarian land cover changes in the last 100 years caused an increase of +0.15 ° C daily temperature and +0.18 ° C dew-point depression during the vegetation period. This means that the near-surface air over Hungary is now warmer and drier than before due to the land cover change. It is also plausible, that the computed results show the maximum warming and drying over the urban areas. After the comparison of the warming effect of the land cover change with the documented warming in Hungary we concluded that the climatic effects of land cover changes are not negligible. Consequently, beyond other climate forcing processes, it is neces-sary to take land cover change into account by the interpretation of climate change in the past and for making scenarios for the future.
ACKNOWLEDGEMENTS
We wish to thank for TÁMOP 4.2.2.A-11/1/KONV-2012-0013 and the Programme in En-vironmental Security and Management (517629-LLP-1-2011-1-UK-ERASMUS-EMCR).
REFERENCES
drüszler, á., vig, p. & csirmaz, K. (2011): Impacts of Hungarian Land Cover Changes on the Regional Climate during the 20th Century; XXVth Conference of the Danubian Countries, Bu-dapest, Hungary, 16-17 June 2011
Bedő, A. (1896): Synoptic Forestry Map of the Kingdom of Hungary, Bp. 1896.
77
Part 1 Environmental Security and Sustainability
bonan, g. b. (2004): Biogeophysical feedbacks between land cover and climate, Ecosystem and Land Use Change: 61-72
CORINE (2000): Corine land cover 2000 (CLC2000) seamless vector database, http://www.eea.eu-ropa.eu/data-and-maps/data/corine-land-cover-2000-clc2000-seamless-vector-database
goedKoop, m. & r. spriensma (2000): The eco-indicator 99. A damage-oriented method for Life Cycle Impact Assessment. Methodology report, 2nd edition, 17 arpil 2000. Pré Consultants, Amersfoort.
grell, g.a., J. dudHia & d.r. stauffer (1994): A description of the 5th generation Penn State/ NCAR Mesoscale model (MM5). NCAR technical note, NCAR/TN-398+STR, 117 pp, 122.
HeiJungs r., guinée J. & Huppes, g. (1997): Impact Categories for Natural. Resources and Land Use. Centre of Environmental Science (CML), Leiden
Koellner, t. & scHolz, r. W. (2007): Assessment of Land Use Impacts on the Natural Environ-ment. In Land Use in LCA. Impacts on the Natural Environment. Int J LCA 12 (1): 16-23 (2007), ecomed publishers (Verlagsgruppe Hüthig Jehle Rehm GmbH), D-86899 Landsberg and Tokyo, Mumbai, Seoul, Melbourne, Paris
Köllner, tH. (2001): Land use in Product Life Cycles and its Consequences for Ecosystem Quality. Dissertation der Univ. St. Gallen, defended March 2001.
lindeiJer, e.W., m. van Kampen, p.J. fraanJe, H.f. van dobben, g.J. nabuurs, e.p.a.g. scHouWen-berg, a.H. prins, n. danKers & m.f. leopold (1998): Biodiversity and land use indicators for land use impacts in LCA. Ministerie V&W. Publicatiereeks Grondstoffen 1998/07, rapportno. W-DWW-98-059.
MMS (1910): 3rd Military Mapping Survey of Austria-Hungary, published about 1910, http://laza-rus.elte.hu/hun/digkonyv/topo/3felmeres.htm
programme in environmental security and management (517629-LLP-1-2011-1-UK-ERAS-MUS-EMCR: http://www.environmentalsecurity.eu
udo de Haes H., Jolliet o., finnveden g., HausscHild m., KreWitt W. & müller-WenK, r. (1999): Best available practice regarding impact categories and category indicators in Life Cycle Impact Assessment. Background document for the second working group on Life Cycle Impact Assessment of SETAC-Europe (WIA-2) Part A. Int J LCA 4, 66–74
van der voet, E. (2001): Land use in LCA. CML-SSP Working Paper 02.002. Leiden, July 2001. Centre of Environmental Science (CML), Leiden University
Weidema, b.p. & e. lindeiJer (2001): Physical impacts of land use in product life cycle assessment. Final report of the Eurenviron-LCAGAPS sub-project on land use. Dpt of Manufacturing, En-gineering & Management, Technical University of Denmark.

79
Part 1 Environmental Security and Sustainability
A PEDAGOGY ON SUSTAINABLE ARCHITECTURE: HACKING SOLAR DECATHLON
E. Roig, M.I. Alba, J. Claver & R. ÁlvarezPolytechnic School, Antonio de Nebrija University, Madrid, Spain
ABSTRACT: This paper proposes a multi-typological residential program. Dispose an enclosure where placing the Western ‘top’ architects proposals. Finally: a residential laboratory with prototypes of modern architecture at 1:1 scale. The Weissenhof Siedlung, built near Stuttgart in Germany in 1927 and the residential housing complex for the International Building Exhibition “Interbau” in Hansaviertel neighborhood, east of the city of Berlin inaugurated in 1957 were both born as a solid manifesto of modern movement architects, a demonstration of their abilities in the field of housing. In our contemporaneity, these appointments for domestic program research are restricted to two events: the design of Olympic Villages, linked to professional expertise, and the Villa Solar (Solar Decathlon), related to amateur academia. The pedagogic action described below reflects the intention of hacking (Himanen 2009) the proposals at Villa Solar, Solar Decathlon Europe (SDE) 2012. This academic action took place in Sustainable Architecture I, Bachelor in Architecture Degree during the Nebrija University academic year 2012-2013.
1. DISRUPTIVE PEDAGOGY
Herreros (2007) holds that teaching design studio is not to teaching ‘architecture’, but a particular practice in permanent evolution that has its own methodological framework, tools and evaluation system. In this sense, the proposed methodology looks for a disruptive innova-tion from the prototypes exposed in Madrid at Villa Solar, a competition that took place in 2012 focused in a house that consumes the least amount of natural resources, and produce a minimum of waste during its life cycle, obtaining its energy from the sun.
The necessary design tools will respond to a twin assignment: the written publication (Neila, 2004) and the built prototypes. The evaluation system also integrates a double criteria. In one hand, an external and independent feedback; on the other hand, a peer reviewed practice.
The pedagogy places the student in an environment where theory and practice of archi-tecture coexist. It tries to explore specific examples of professional practice that underline relevant bioclimatic aspects, as much for project ideation as for its constructive morphology.
The concept of sustainable development, coined at Our Common Future report (Brundtland, 1987) encourages the search for the generative principles of an Artificial Nature (Abalos & Herreros, 1999) stabilizing Our Common Future. Since then, architectural discipline revises the
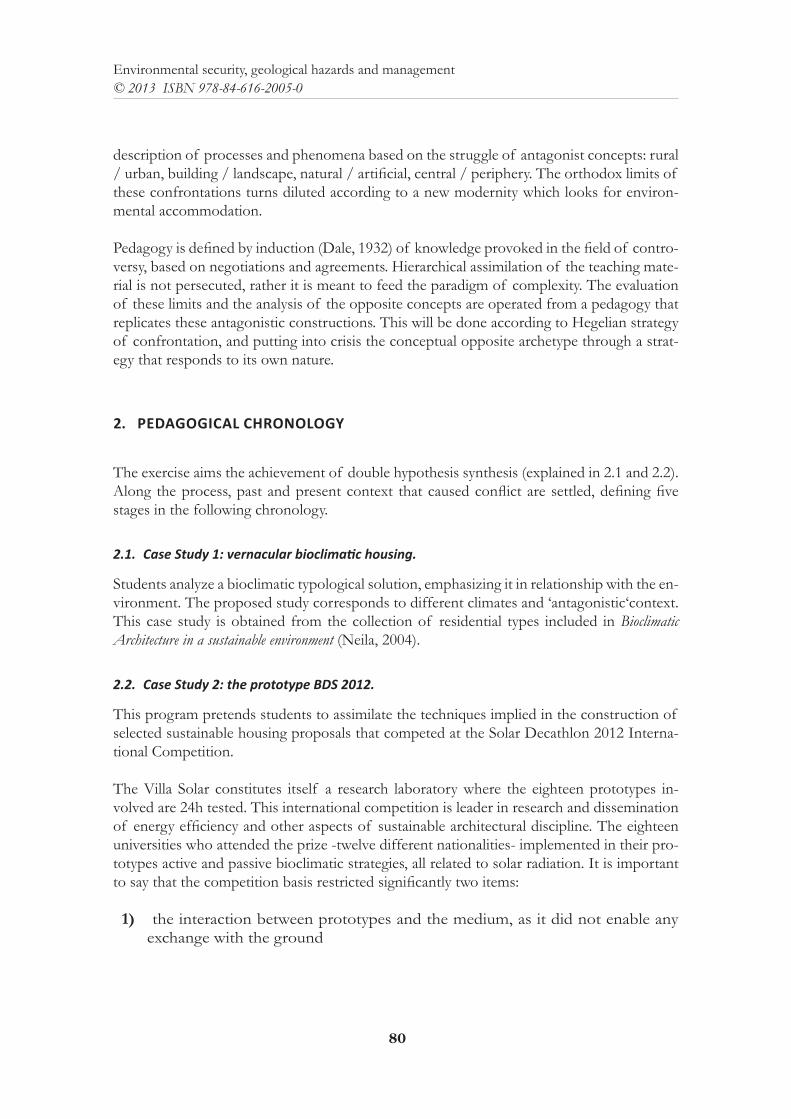
80
Environmental security, geological hazards and management© 2013 ISBN 978-84-616-2005-0
description of processes and phenomena based on the struggle of antagonist concepts: rural / urban, building / landscape, natural / artificial, central / periphery. The orthodox limits of these confrontations turns diluted according to a new modernity which looks for environ-mental accommodation.
Pedagogy is defined by induction (Dale, 1932) of knowledge provoked in the field of contro-versy, based on negotiations and agreements. Hierarchical assimilation of the teaching mate-rial is not persecuted, rather it is meant to feed the paradigm of complexity. The evaluation of these limits and the analysis of the opposite concepts are operated from a pedagogy that replicates these antagonistic constructions. This will be done according to Hegelian strategy of confrontation, and putting into crisis the conceptual opposite archetype through a strat-egy that responds to its own nature.
2. PEDAGOGICAL CHRONOLOGY
The exercise aims the achievement of double hypothesis synthesis (explained in 2.1 and 2.2). Along the process, past and present context that caused conflict are settled, defining five stages in the following chronology.
2.1. Case Study 1: vernacular bioclimatic housing.
Students analyze a bioclimatic typological solution, emphasizing it in relationship with the en-vironment. The proposed study corresponds to different climates and ‘antagonistic‘context. This case study is obtained from the collection of residential types included in Bioclimatic Architecture in a sustainable environment (Neila, 2004).
2.2. Case Study 2: the prototype BDS 2012.
This program pretends students to assimilate the techniques implied in the construction of selected sustainable housing proposals that competed at the Solar Decathlon 2012 Interna-tional Competition.
The Villa Solar constitutes itself a research laboratory where the eighteen prototypes in-volved are 24h tested. This international competition is leader in research and dissemination of energy efficiency and other aspects of sustainable architectural discipline. The eighteen universities who attended the prize -twelve different nationalities- implemented in their pro-totypes active and passive bioclimatic strategies, all related to solar radiation. It is important to say that the competition basis restricted significantly two items:
1) the interaction between prototypes and the medium, as it did not enable any exchange with the ground
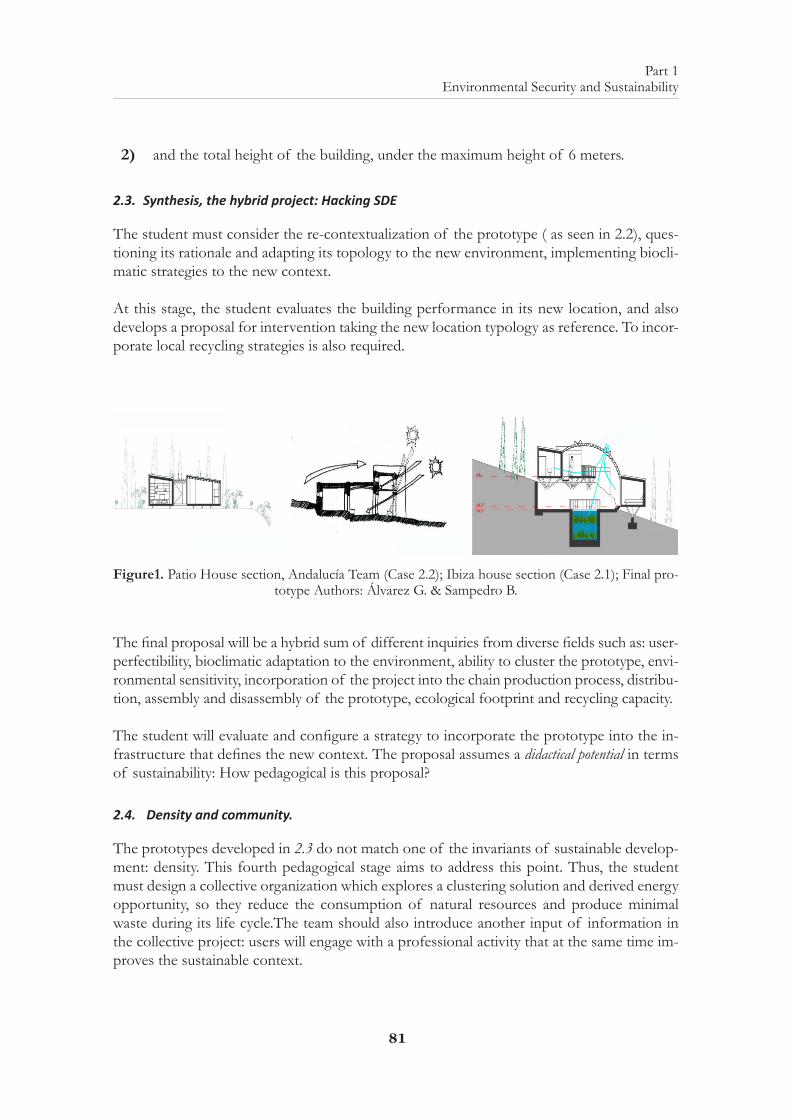
81
Part 1 Environmental Security and Sustainability
2) and the total height of the building, under the maximum height of 6 meters.
2.3. Synthesis, the hybrid project: Hacking SDE
The student must consider the re-contextualization of the prototype ( as seen in 2.2), ques-tioning its rationale and adapting its topology to the new environment, implementing biocli-matic strategies to the new context.
At this stage, the student evaluates the building performance in its new location, and also develops a proposal for intervention taking the new location typology as reference. To incor-porate local recycling strategies is also required.
Figure1. Patio House section, Andalucía Team (Case 2.2); Ibiza house section (Case 2.1); Final pro-totype Authors: Álvarez G. & Sampedro B.
The final proposal will be a hybrid sum of different inquiries from diverse fields such as: user-perfectibility, bioclimatic adaptation to the environment, ability to cluster the prototype, envi-ronmental sensitivity, incorporation of the project into the chain production process, distribu-tion, assembly and disassembly of the prototype, ecological footprint and recycling capacity.
The student will evaluate and configure a strategy to incorporate the prototype into the in-frastructure that defines the new context. The proposal assumes a didactical potential in terms of sustainability: How pedagogical is this proposal?
2.4. Density and community.
The prototypes developed in 2.3 do not match one of the invariants of sustainable develop-ment: density. This fourth pedagogical stage aims to address this point. Thus, the student must design a collective organization which explores a clustering solution and derived energy opportunity, so they reduce the consumption of natural resources and produce minimal waste during its life cycle.The team should also introduce another input of information in the collective project: users will engage with a professional activity that at the same time im-proves the sustainable context.
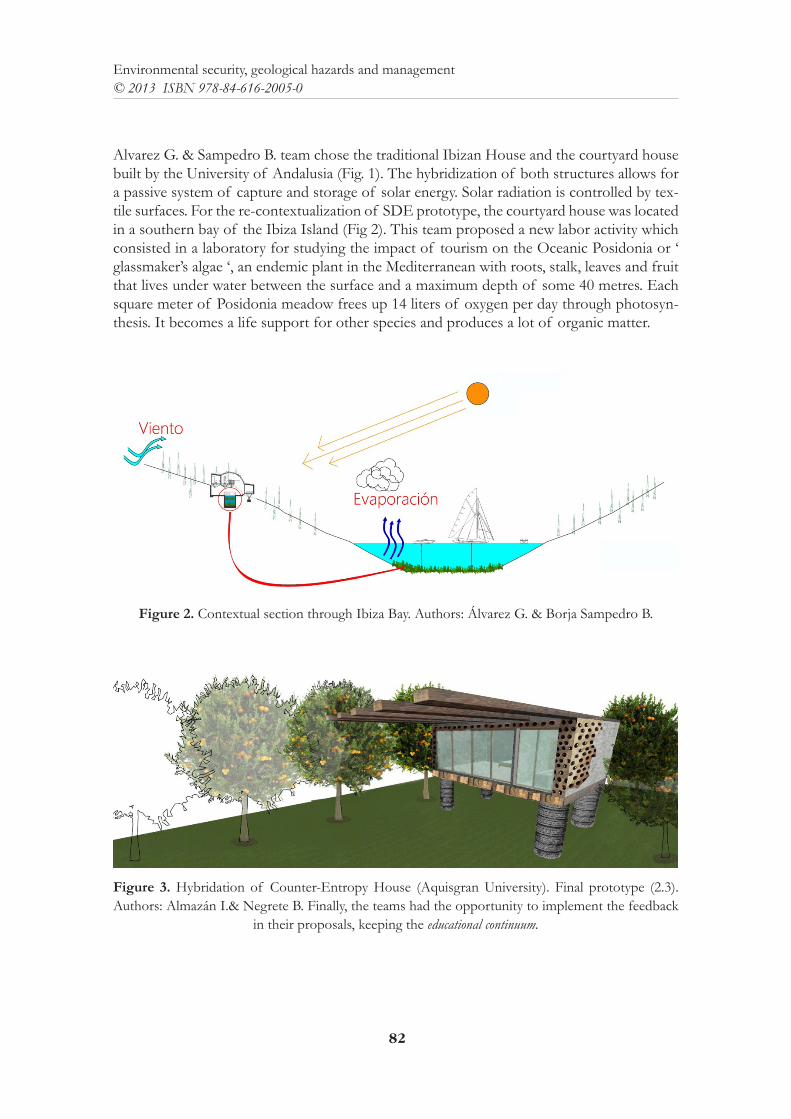
82
Environmental security, geological hazards and management© 2013 ISBN 978-84-616-2005-0
Alvarez G. & Sampedro B. team chose the traditional Ibizan House and the courtyard house built by the University of Andalusia (Fig. 1). The hybridization of both structures allows for a passive system of capture and storage of solar energy. Solar radiation is controlled by tex-tile surfaces. For the re-contextualization of SDE prototype, the courtyard house was located in a southern bay of the Ibiza Island (Fig 2). This team proposed a new labor activity which consisted in a laboratory for studying the impact of tourism on the Oceanic Posidonia or ‘ glassmaker’s algae ‘, an endemic plant in the Mediterranean with roots, stalk, leaves and fruit that lives under water between the surface and a maximum depth of some 40 metres. Each square meter of Posidonia meadow frees up 14 liters of oxygen per day through photosyn-thesis. It becomes a life support for other species and produces a lot of organic matter.
Figure 2. Contextual section through Ibiza Bay. Authors: Álvarez G. & Borja Sampedro B.
Figure 3. Hybridation of Counter-Entropy House (Aquisgran University). Final prototype (2.3). Authors: Almazán I.& Negrete B. Finally, the teams had the opportunity to implement the feedback
in their proposals, keeping the educational continuum.
83
Part 1 Environmental Security and Sustainability
Almazan I. & Negrete B. team chose the prototype developed by the University of Aachen. According to the assignment, the Counter-Entropy House (Case 2.2) was placed in an al-ternative context: the Valencian orchard. The new settlement for colonization was located around an orange tree plantation. The exploitation of derivative products into a post-pro-duction process was associated with recycling protocols which integrates artificial and bio-logical recycling (McDonough & Braungart, 2004). The strategies that minimize the ecologi-cal footprint on the immediate landscape define the topology and constructive systems of the proposals (See Fig 3).
2.5. Evaluation criteria.
The evaluation system involves, on one hand, a critical analysis of the entries, with the feed-back of an external panel (León 11 Office), and on the other, a peer reviewed made by students based on the Life Styles sheets developed by the laboratory of Theory and Criticism of Ar-chitecture ARKRIT, to analyzed the outcome of the VIVA Housing Competition (Amann & Roig 2009).
This proposal is part of a cross academic methodology that links undergraduate and gradu-ate programs. The results of hacking Solar Decathlon Europe will be implemented in other pedagogical activities held at the Master of Sustainable Building Technologies at Nebrija University.
REFERENCES
ÁBALOS, I. & HERREROS, J. (1999); Naturaleza artificial. Madrid: ExitLMIAMANN, A. & ROIG, E. (2009); Modos de vida, Instrumentos de proyecto, Madrid: SEPES, pp. 42-69.BRAUNGART, M. & MCDONOUGH, W. (2004); Cradle to cradle: Remaking the way we make things.
Madrid: McGraw-Hill. BRUNTLAND, G. (ed.), (1987); Our common future: The World Commission on Environment and Develop-
ment, United Nations, Oxford: University Press.DALE, E. (1932); Methods for analyzing the content of Motion Pictures, Journal of Educational Sociology
6, p.p.244-250.HERREROS, J. (2007); Tópicos, obviedades y otras cosas siempre olvidadas, Arquitectos (1) 180, pp.
90-92. HIMANEN, P. (2001); La ética del hacker y el espíritu de la era de la información. London: VintageNEILA, F. (2004); Arquitectura Bioclimática en un entorno sostenible. Madrid: Munilla Lería

85
Part 1 Environmental Security and Sustainability
REACTING AND RECYCLING
M. San Millán Escribano; A. Muñoz MirandaPhDs in Architecture. Nebrija University. Madrid. Spain.
S. Martínez CuevasArchitect and Earthquake Engineering Researcher. Polytechnic University. Madrid. Spain.
B. Horta RialArchitect and Structural Researcher . Polytechnic University. Madrid. Spain.
ABSTRACT: To a certain extent what this research is proposing is a return to local principles or to regionalism, which is able to employ place-specific tools and craftsmanship (local arts and their virtues) promoting and being innovative with traditional elements which belong to a particular place, and using tectonic and stereotomic logic.
You can observe this, in the face of a destructive natural event. An immediate architectural reaction is produced in cooperation with the rest of the not affected territory. The cooperation of certain non-governmental organizations with other groups in the same collaborative cycle improves the recycling of ideas and city planning forms. These organizations cooperate in the development and implemen-tation of cities and settlements that need a fast reaction when facing an unexpected disaster.
1. INTRODUCTION
For Colavidas, the most important problem is not the environment. He proclaims the impor-tance of basic habitability in this way:
[…] Come on, citizens, one last effort, universalise basic habitability! 1
And, further on, he explains why inhabiting is more important than environmental problems:
[…] Why climate change is not the first problem, neither the most decisive one humankind is facing now? It is purely and simply because, without getting out the immanent material dimension –therefore, from an exclusively instrumental point of view that omits motu proprio any kind of metaphysics- the decisive factor for Humankind is and always will be –for better or worse, in a straightforward way, and point blank- Hu-mankind itself. 2
International cooperation occurs in a double recycling process. On the one hand, knowledge is recycled. Cooperating organizations give those who have been affected their knowledge about emergency habitability, and, in turn, the inhabitants of the disaster area provide local construction systems, in particular, regionalist, traditional, safe, low-cost and easy to execute systems. It is intended both a quick assembly and resilience in time. These proceedings, as shown in the attached Table 1 are fast to build and most of them are finished in less than six
86
Environmental security, geological hazards and management© 2013 ISBN 978-84-616-2005-0
months. Therefore, these actions have three goals: 1.-integration in the local building culture and customs, 2.-low-cost due to the use of recycled materials, and 3.-a quick building of the shelter; these characteristics are the common denominators of an architecture that reacts in a cooperative way in the aftermath of a catastrophe.
The experience resolving situations in which the inhabitants need a home immediately has led non-governmental organisations to provide progressive shelters. The families affected by different disasters –climatic, geologic, war conflicts- are given spaces that allow them to live in a place resembling a home. The cooperation organizations provide immediate facili-ties called progressive shelters because they create the transition between the temporary and permanent housing, and they are susceptible to get improved. They meet the spatial needs in the lapse of time between camp tents and permanent homes.
The goal of recycling the affected buildings is to restore as soon as possible the unfavourable state of their habitat after a disaster, and to return the settlement to its situation before the catastrophe; that is why they have the minimum components needed to give shelter, that is, vertical walls and installations.
Among those cases analysed where recycling is essential to build quickly, we can find actions carried out after earthquakes, cyclones and volcano eruptions. All these phenomena have devastating effects due to the destructive energy released and the enormous extent of the damage. These are places with minimum facilities. Size is also minimum, because a minimum size reduces both building time and cost. There is certain diversity in size, from the smallest 9m2 one used in Peru in 2007 to the 74 m2 one installed in Italy in 2009. The standard nº3 of the Sphere Project states the indicator of 3.5 m2 per person as the minimum threshold.
In those places where disasters were more important, materials are usually recycled. Those that are not directly recycled during the catastrophes themselves, like the plastic sheets pro-vided by the NGOs, come from a closed transformation cycle which in turn generates an-other cycle in which they will be recycled as components of other shelters. Iron boards, plastic sheets and shelter repairing kits are the most frequent ones.
In the following examples, the high number of displaced homeless population created an urgent need for shelters due to the total lack of housing.
Haiti has been suffering an economic crisis for the last 20 years, repeated hurricanes, political instability and social violence. The NGOs have been working there for 20 years helping to ensure a minimum of stability to generate a process of social change and economic devel-opment. On the 12th of January, 2010, at 16.53 p.m., the earth in Haiti shook violently for 34 seconds measuring 7.0 on the Richter Scale. Several cities were razed to the ground. The 80% of the schools and more than 1,000 dwellings were destroyed, 220,000 people died and 2,500,000 lost their homes in a country that is considered to be one of the poorest nations in the world. In response to the destruction caused by the quake, there was an immediate mass
87
Part 1 Environmental Security and Sustainability
reaction of the international agencies: 1,300 camps were developed and shelters were built for 1,500,000 survivors.
In Afghanistan, (2009) shelters provided an additional protection against the country’s harsh weather conditions; moreover, they can be built by any kind of person in a very short time. These shelters do not include materials that can be considered as permanent to transmit the message they are only temporary lodgings. Agreements were reached with farmers in order to set up camps: they ceded land and the camps could be established. From 2002 to 2010, more than five million people returned to Afghanistan. The needs of 379 families were cov-ered and a 94% of them used the 38.7 m2 shelter. Each of these cost $300 and consisted of a model built with 2410 m. long bamboo pieces and 5x4 m. plastic sheets.
Since 1991, Somalia has been suffering the struggles caused by contending political factions. Since then, there has not been a central government in the country. In 2009, 1.3 million peo-ple were displaced due to the chronic insecurity in the cities. Here, plans have been carried out to distribute tents and plastic sheets among displaced families. The most vulnerable ones living in crowded places received progressive or transition shelters. Those families staying for long periods of time in those shelters were given repair materials that, sometimes, were added to some other recycled materials to enlarge the dwellings in an improvised way.
The traditional notion of the Somali Buul house was recycled by PTW Architects3 at the exhibition Emergency Shelter held in Sydney, was a fund-rising initiative in aid to the areas devastated by the 11 March, 2010, tsunami in Japan. The exhibition presented different con-struction models that not only gave shelter to people in situations of natural disasters but also provided them a private and safe space during the reconstruction period.. This shelter is built with big sheets of plastic bubble packing material that wrap walls made with carafes of water. The whole shelter is made of plastic that not only prevents water from getting into the building but also accumulates it in the walls. It is not only water-proof, but also the shelter becomes a sort of a big drinking-water tank, something really necessary in places where a water supply infrastructure does not exist. At this very exhibition, Cox4 subverted the use of hangers, a very common element at home, low-cost and necessary at shelters where there are no closets. He recycled the hanger elements and dispersed them all through the inner façade of the building. In this case, a number of hangers are re-used with two different aims: first as a storing system and for laundry drying, and secondly to provide shadow in those areas where the clothes are hung.
Creating enlargements by repeating components in the case of reaction recycling may be an efficient strategy. Pieces can be transported in small packages which, once assembled, will be-come habitable spaces. The prototype presented by LAVA5 at the Emergency Shelter Exhibi-tion, in 2011 showed a reaction space built by transporting wooden boards that are assem-bled one over the other. Every piece changes its section creating a space slightly adapted to the basic needs of its dwellers. The separation of pieces enables a utterly ventilated façade. In this very exhibition Green Leaf Engineers6 proposed an agglomerated of three-dimensional patterns. Each pattern is a hollow box whose faces compose a motive, recycling a geometric
88
Environmental security, geological hazards and management© 2013 ISBN 978-84-616-2005-0
tessellation used by the Islamic culture. Each box is piled and attached to another one creat-ing the perimeter walls of the shelter, which works as a great latticework of recycled plastic and, like the previous model7, allows airing the building without opening windows.
After the disasters in Bangladesh, Republic of Congo, Andhar Pradesh and Managua, citi-zens began to improvise with the materials they found in the streets and many of them built their own shelters.
In 2007, two years before the Alla, the cyclone Sidr hit the south-west coast of Bangladesh destroying more than 400,000 buildings. In the most affected districts, more than the 50% of the dwellings were damaged. Most families but the most vulnerable ones built their shelters in less than four weeks. A total of 160 local and international NGOs got involved building shelters immediately. The aid programme included the distribution of basic components for the shelters and a tutorial on assembly and do-it-yourself building. Four weeks after, the number of shelters supplied to protect people from the rain and the cold turned out to be insufficient. Those whose homes were completely destroyed built temporary shelters using materials they found in the neighbourhood. Those whose homes were damaged, repaired them the best they could re-using their own materials and those they found in the surround-ings. The construction quality and the structural stability of most of these buildings were poor and the damages caused by the cyclone severe. Therefore, it was imperative to repair the affected housing as soon as possible so that it could hold the following cyclone strike. The supply programme of constructive resources included blankets and repair components, tents, asphalt cloth, folded iron plates and tools. To substitute the destroyed houses for in-habitable ones, some transition shelters were built.
In 2002, the volcano Goma in the Republic of Congo began erupting: 15,000 homes were destroyed and 87,000 people were left homeless. Shelters of 24 m2 for $180 were built and distributed altogether with technical support and monitorization.
The cyclone that destroyed Andhra Pradesh in 1977 caused 250,000 displaced people and the damage or destruction of 150,000 homes. As it did not happen during the monsoon season and the weather was warm, shelter building was not considered very urgent and the Govern-ment stored tons of bamboo to build improvised shelters and to repair or re-build homes. In 90 days, 7,000 shelters were built.
All these shelters included some sort of customized recycling. Small enlargements, new rooms for other uses or tuned spaces were part of the catalogue of hybrid shelters half prefabricated half self-constructed. Those spaces were of a vernacular typology with or-thogonal closings and a sloping roof with an eave to avoid the accumulation of rainwater. At the Emergency Shelter Exhibition in 2011, Fujimori8 presented a light, prefabricated shelter made of recycled plywood boards and raised above the terrain, recycling the domestic ver-nacular language and optimizing it for a potential emergency response.
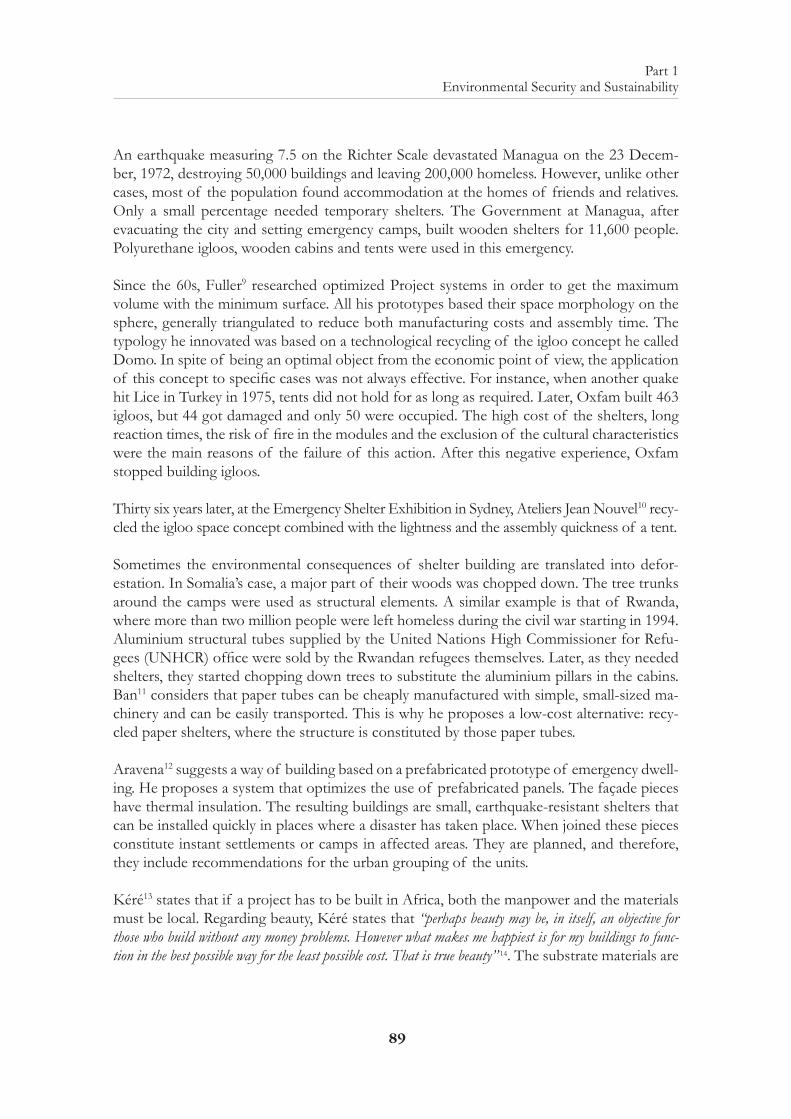
89
Part 1 Environmental Security and Sustainability
An earthquake measuring 7.5 on the Richter Scale devastated Managua on the 23 Decem-ber, 1972, destroying 50,000 buildings and leaving 200,000 homeless. However, unlike other cases, most of the population found accommodation at the homes of friends and relatives. Only a small percentage needed temporary shelters. The Government at Managua, after evacuating the city and setting emergency camps, built wooden shelters for 11,600 people. Polyurethane igloos, wooden cabins and tents were used in this emergency.
Since the 60s, Fuller9 researched optimized Project systems in order to get the maximum volume with the minimum surface. All his prototypes based their space morphology on the sphere, generally triangulated to reduce both manufacturing costs and assembly time. The typology he innovated was based on a technological recycling of the igloo concept he called Domo. In spite of being an optimal object from the economic point of view, the application of this concept to specific cases was not always effective. For instance, when another quake hit Lice in Turkey in 1975, tents did not hold for as long as required. Later, Oxfam built 463 igloos, but 44 got damaged and only 50 were occupied. The high cost of the shelters, long reaction times, the risk of fire in the modules and the exclusion of the cultural characteristics were the main reasons of the failure of this action. After this negative experience, Oxfam stopped building igloos.
Thirty six years later, at the Emergency Shelter Exhibition in Sydney, Ateliers Jean Nouvel10 recy-cled the igloo space concept combined with the lightness and the assembly quickness of a tent.
Sometimes the environmental consequences of shelter building are translated into defor-estation. In Somalia’s case, a major part of their woods was chopped down. The tree trunks around the camps were used as structural elements. A similar example is that of Rwanda, where more than two million people were left homeless during the civil war starting in 1994. Aluminium structural tubes supplied by the United Nations High Commissioner for Refu-gees (UNHCR) office were sold by the Rwandan refugees themselves. Later, as they needed shelters, they started chopping down trees to substitute the aluminium pillars in the cabins. Ban11 considers that paper tubes can be cheaply manufactured with simple, small-sized ma-chinery and can be easily transported. This is why he proposes a low-cost alternative: recy-cled paper shelters, where the structure is constituted by those paper tubes.
Aravena12 suggests a way of building based on a prefabricated prototype of emergency dwell-ing. He proposes a system that optimizes the use of prefabricated panels. The façade pieces have thermal insulation. The resulting buildings are small, earthquake-resistant shelters that can be installed quickly in places where a disaster has taken place. When joined these pieces constitute instant settlements or camps in affected areas. They are planned, and therefore, they include recommendations for the urban grouping of the units.
Kéré13 states that if a project has to be built in Africa, both the manpower and the materials must be local. Regarding beauty, Kéré states that “perhaps beauty may be, in itself, an objective for those who build without any money problems. However what makes me happiest is for my buildings to func-tion in the best possible way for the least possible cost. That is true beauty” 14. The substrate materials are
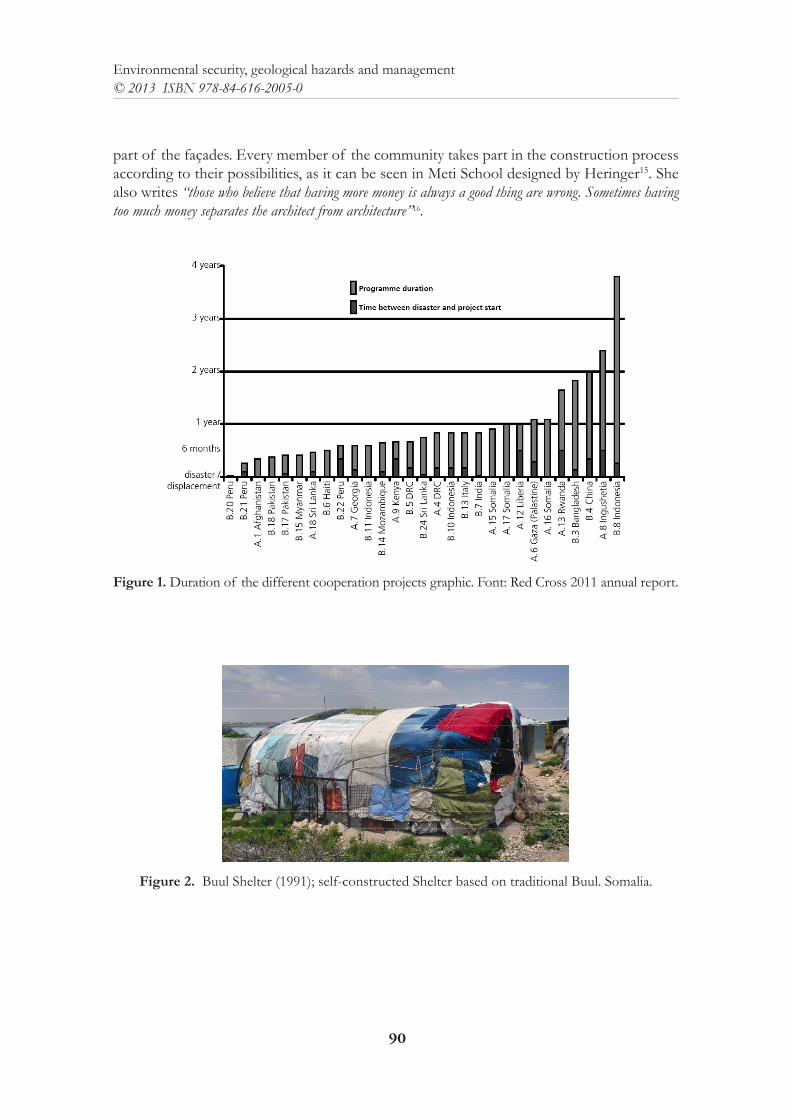
90
Environmental security, geological hazards and management© 2013 ISBN 978-84-616-2005-0
part of the façades. Every member of the community takes part in the construction process according to their possibilities, as it can be seen in Meti School designed by Heringer15. She also writes “those who believe that having more money is always a good thing are wrong. Sometimes having too much money separates the architect from architecture”16.
Figure 1. Duration of the different cooperation projects graphic. Font: Red Cross 2011 annual report.
Figure 2. Buul Shelter (1991); self-constructed Shelter based on traditional Buul. Somalia.
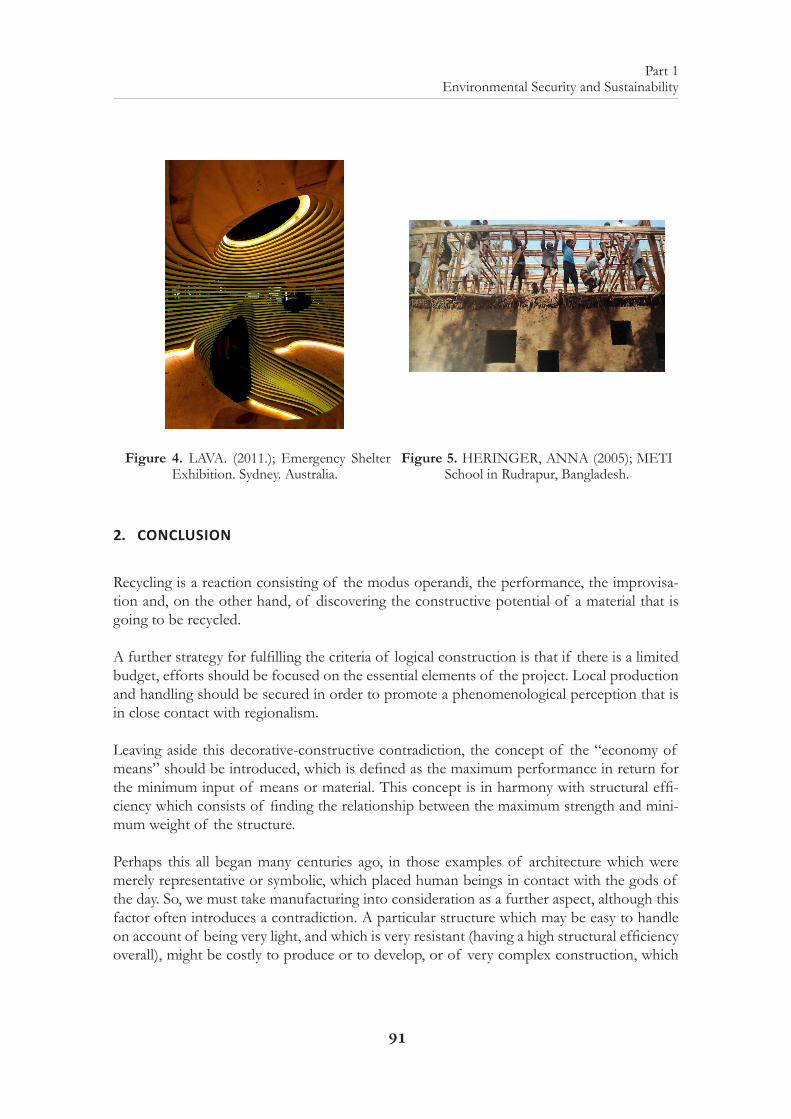
91
Part 1 Environmental Security and Sustainability
Figure 4. LAVA. (2011.); Emergency Shelter Exhibition. Sydney. Australia.
Figure 5. HERINGER, ANNA (2005); METI School in Rudrapur, Bangladesh.
2. CONCLUSION
Recycling is a reaction consisting of the modus operandi, the performance, the improvisa-tion and, on the other hand, of discovering the constructive potential of a material that is going to be recycled.
A further strategy for fulfilling the criteria of logical construction is that if there is a limited budget, efforts should be focused on the essential elements of the project. Local production and handling should be secured in order to promote a phenomenological perception that is in close contact with regionalism.
Leaving aside this decorative-constructive contradiction, the concept of the “economy of means” should be introduced, which is defined as the maximum performance in return for the minimum input of means or material. This concept is in harmony with structural effi-ciency which consists of finding the relationship between the maximum strength and mini-mum weight of the structure.
Perhaps this all began many centuries ago, in those examples of architecture which were merely representative or symbolic, which placed human beings in contact with the gods of the day. So, we must take manufacturing into consideration as a further aspect, although this factor often introduces a contradiction. A particular structure which may be easy to handle on account of being very light, and which is very resistant (having a high structural efficiency overall), might be costly to produce or to develop, or of very complex construction, which
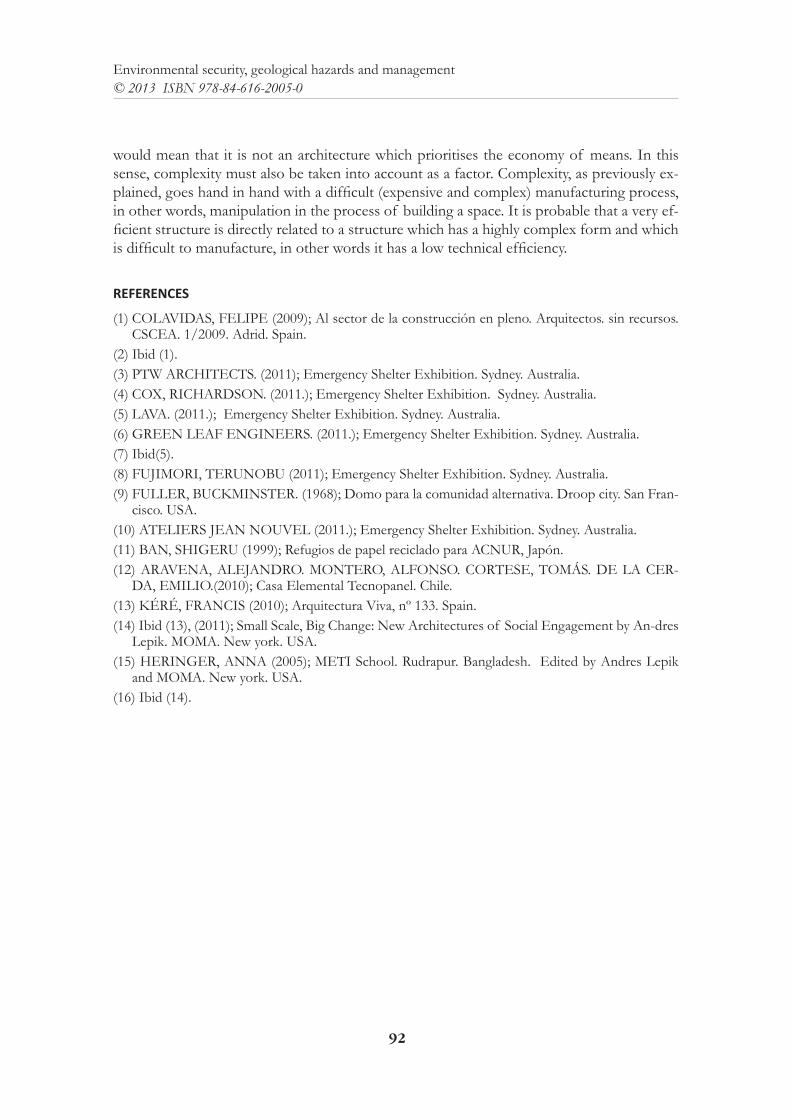
92
Environmental security, geological hazards and management© 2013 ISBN 978-84-616-2005-0
would mean that it is not an architecture which prioritises the economy of means. In this sense, complexity must also be taken into account as a factor. Complexity, as previously ex-plained, goes hand in hand with a difficult (expensive and complex) manufacturing process, in other words, manipulation in the process of building a space. It is probable that a very ef-ficient structure is directly related to a structure which has a highly complex form and which is difficult to manufacture, in other words it has a low technical efficiency.
REFERENCES
(1) COLAVIDAS, FELIPE (2009); Al sector de la construcción en pleno. Arquitectos. sin recursos. CSCEA. 1/2009. Adrid. Spain.
(2) Ibid (1).(3) PTW ARCHITECTS. (2011); Emergency Shelter Exhibition. Sydney. Australia. (4) COX, RICHARDSON. (2011.); Emergency Shelter Exhibition. Sydney. Australia. (5) LAVA. (2011.); Emergency Shelter Exhibition. Sydney. Australia.(6) GREEN LEAF ENGINEERS. (2011.); Emergency Shelter Exhibition. Sydney. Australia. (7) Ibid(5).(8) FUJIMORI, TERUNOBU (2011); Emergency Shelter Exhibition. Sydney. Australia.(9) FULLER, BUCKMINSTER. (1968); Domo para la comunidad alternativa. Droop city. San Fran-
cisco. USA.(10) ATELIERS JEAN NOUVEL (2011.); Emergency Shelter Exhibition. Sydney. Australia. (11) BAN, SHIGERU (1999); Refugios de papel reciclado para ACNUR, Japón.(12) ARAVENA, ALEJANDRO. MONTERO, ALFONSO. CORTESE, TOMÁS. DE LA CER-
DA, EMILIO.(2010); Casa Elemental Tecnopanel. Chile.(13) KÉRÉ, FRANCIS (2010); Arquitectura Viva, nº 133. Spain.(14) Ibid (13), (2011); Small Scale, Big Change: New Architectures of Social Engagement by An-dres
Lepik. MOMA. New york. USA.(15) HERINGER, ANNA (2005); METI School. Rudrapur. Bangladesh. Edited by Andres Lepik
and MOMA. New york. USA.(16) Ibid (14).
93
Part 1 Environmental Security and Sustainability
ENVIRONMENTAL SECURITY AND SOLID WASTE MANAGEMENT. AEROBIC DEGRADATION OF BIOPLASTIC
MATERIALS
M. P. Arraiza, J. V. López & A. Fernando Forest Engineering Department, ETSI Montes, Technical University of Madrid, Spain.
ABSTRACT: In accordance with European standard EN 13432, the biodegradability of three plas-tic materials (BIOPLAST, PHB, PLA) was determined as well as a positive control or under aerobic composting conditions.
At the end of the test (90 days), cellulose had reached 91.22% of biodegradation, BIOPLAST, 75.41% of biodegradation; PHB, 67.65% of biodegradation and PLA, 52.76% of biodegradation all estimated by the CO2 produced.
1. INTRODUCTION
In this paper, the biodegradability and compostability of plastic containers, in accordance with European standard EN 13432 was determined, besides those requirements to certify that a product is made of biodegradable compostable plastics. Analyzed the standard appli-cation, were conducted tests of biodegradability on different types of polymers, in particular biopolymers from BIOPLAST, PHB, PLA.
2. OBJECTIVE
The aim of the study was the determination of final aerobic biodegradability and disintegra-tion of plastic materials under controlled composting, after 90 days.
3. METHODS AND MATERIAL
There are international standards governing and measuring the rate of degradation and bio-degradation of plastic packaging as biopolymers in general. Basically these standards derived from American ASTM standard, with minor modifications, have become internationally as ISO standards.
The test methods determine the total biodegradability, and the degree of disintegration of the degraded material. These tests are performed simulating an intensive aerobic composting process.
The inoculum used consists of stabilized, mature compost derived from composting the organic fraction of solid municipal waste. The test material is mixed with the inoculum in a ratio of 6 to 1 and is introduced into a static container under optimal conditions of oxygen, temperature and humidity during a test period of not more than 6 months.
Therefore, this method is designed to simulate conditions for aerobic composting from the organic fraction of municipal solid waste mixed.
The biodegradation rate is measured by the ratio of carbon dioxide generated from the test material and the maximum theoretical amount of carbon dioxide that can be produced from the test material. For example, a 75% of biodegradation means that 75% of the carbon at-oms (C) present in the container are converted to carbon dioxide (CO2). The method also determines the converting process speed, that is, how much time does it need to achieve the specified percentage of biodegradation. Incubation should be carried out at a constant tem-perature of approximately 58 °C.
According to requirements set by EN 13432, to obtain a plastic container labeled as “com-postable”, must accomplishes the following requirements:
• Biodegradability: 90% within six months
• Disintegrability: fragmentation and loss of visibility of the residue in the final compost (absence of visual pollution).The material has to be disintegrated before 3 months, with a size less than 2 mm and reaches 90% of the initial mass.
The certificate of «compostable», next to the label which guarantees, also distinguishes be-tween bioplastics and conventional plastics, even when they are biodegradable.
3.1. Test description
An inoculum rich in microorganisms is used, derived from mature compost from the stabi-lized composting organic fraction of municipal solid waste (Valdemingomez, Madrid, Spain).
As reference material of positive control is employed TLC (thin layer chromatography) of cellulose grade with a particle size less than 20 mm of diameter.
As nutrient source, the samples used for the tests, are listed below.
Table 1. Samples tested.
SAMPLE ORIGINBIOPLAST Sphere Spain
PHB GoodfellowPLA Toledo
95
Part 1 Environmental Security and Sustainability
The test method determines the total biodegradability, and the degree of disintegration of a test material under an aerobic intensive process simulation.
Incubation should be carried out under a darkness or diffuse light, with oxygen saturation, constant temperature (58 ± 2 ° C) and an approximate humidity of 50%. The maximum test duration is 6 months.
3.1.1. Inoculum preparation
The inoculum used was well aerated compost from an aerobic composting plant from a municipal solid waste, from 2 to 4 months old. Must be uniform and free of objects (removed by hand).
Sample was sieved through a sieve with a square mesh of 0.5 to 1 cm side mesh. Total dry solids (TSS), which should be approximately 50%, and volatile solids (VS), which must be 15% or 30% of TSS, were determined. Moisture was adjusted by adding water or drying.
In the ratio of one part of inoculum to five parts of deionized H 2 O were mixed. Later was stirred and found that pH was within the range established by the standard (7-9).
During the test, as specified by the standard, positive control activity was verified (cellulose), checking that was degraded at least 70%, and that the compost (negative control) produced 50 to 150 mg of CO2 per g of total solids in the first 10 days of the test.
3.1.2. Preparation of test and reference material
For each test and reference material (cellulose), total organic carbon (TOC), equivalent to g (TOC) / g (total dry solids) and total solids (TSS) and volatile (SV) was determined.
3.1.3. Test procedure
The following containers were prepared, of 3-liter capacity each:
• 3 for each test material
• 3 for reference material (cellulose)
• 3 for negative control (compost)
Dry mass of inoculum was well mixed with dry mass of test in a ratio of 6 to 1 and placing the same quantity of compost in each container which is filled approximately three quarters of its volume.
96
Environmental security, geological hazards and management© 2013 ISBN 978-84-616-2005-0
The result was that the material should have at least 50% moisture or be sticky and with water when is pressed by hand.
The containers were placed in baths at 58 ° C and aerated with air free of CO 2 and water (passing through air bottles with a 0.1 M NaOH solution).
Reference and test material received the same treatment.
3.1.4. Data collection
The CO2 generated was measured at regular intervals of time, once a day. The containers were stirred weekly. Humidity was controlled in order to maintain it around 50%. PH was measured at regular intervals, checking that PH ranging between 7 and 9.
The complete absorption method, in a basic solution, was applied in order to determine the CO2 generated, based on the reaction of free water CO2 with sodium hydroxide to form sodium bicarbonate. To make this possible, the gas from each container was treated with 200 ml solution of NaOH 1 M, able to retain all of CO 2 generated each day by each of the test materials.
Daily, was collected 10 ml of the sample and treated with 0.05 M HCl and FNA until the color change .The ml of HCl consumed were recorded.
Also, it was checked that the compost has not dried nor has mold. Deionized water is added if compost is dried, if it is mold, dry air is applied.
3.1.5. End of test
After 90 days of test, the containers with their contents were weighed, determining total dry solids and volatiles. Visual findings were recorded in relation to the appearance of the test material determining their degree of disintegration. Likewise, data from the CO 2 produced, the biodegradability was calculated for each of the materials tested.
4. RESULTS
4.1. Calculation
From SST and TOC data, the theoretical amount of CO2 in grams per container (ThCO2) was calculated, which can be produced by the test material using the next equation:
ThCO2 = MTOT·CTOT·44/12
97
Part 1 Environmental Security and Sustainability
From the cumulative amount of CO 2 released from each container, we calculated the per-centage of biodegradation DT, of each test material, using the equation:
DT=((CO2 )T-(CO2 )B)/ThCO2
Finally,thepercentageofdegradationbylossofweightandthedegreeofdisintegrationofeachofthematerialstestedwascalculated.
4.2. Validity of the results
The validity of the test according to the parameters established by the International Standard ISO 14855 was confirmed. The test is considered valid if:
• The degree of biodegradation of the reference material is more than 70% after 45 days.
• The difference between the percentage of biodegradation of the reference material from the composting container is less than 20% at the end of the test.
• The inoculum in compost (negative control) has generated more than 50 mg and less than 150 g of CO2 per gram of solids after 10 days of incubation.
4.3. Expression of results
The results in terms of percentage of biodegradability and disintegration degree are as follows:
Cellulose or positive control reached 70% of biodegradation in 45 days, as established by the standard for the test in order to be considered valid.
At the end of the test (90 days), cellulose had reached 91.22% of degradation, calculated by the CO2 produced coincident with the value obtained by the method of mass loss (91.72%).
At the end of the test were indistinguishable cellulose fragments, above 2 mm, in the remains of the mixture.
The test material BIOPLAST reached, in one testing period, 75.41% of biodegradation, calculated by the CO2 produced, coincident with the value obtained by the method of mass loss (75.71%).
At the end of the test few fragments, higher than 2 mm, were visible in the remains of the mixture.
The test material PHB reached, in the testing period, 67.65% of biodegradation, calculated by the CO2 produced, coincident with the value obtained by the method of mass loss (68.98%).
At the end of the test few fragments, higher than 2 mm, were visible in the remains of the mixture.
98
Environmental security, geological hazards and management© 2013 ISBN 978-84-616-2005-0
The test material PLA reached, in the testing period, 52.76% of biodegradation, calculated by the CO2 produced, coincident with the value obtained by the method of mass loss (53.71%).
5. CONCLUSIONS
In this paper we have determined the biodegradability of plastic containers in accordance with EN 13432, and its disintegration. The tests were carried out on different types of bio-degradable polymers, in particular biopolymers BIOPLAST, PHB, PLA.
At the end of the test (90 days), the principal conclusion is that BIOPLAST reaches the high-est value of biodegradation and PLA the lowest.
REFERENCES
CALMON, A. (2000). An automated test for measuring polymer degradation. Chemosphere 41 645 – 651.
GAURAV, K., AURAS, R., SINGH, S. & NARAYAN, R. (2007). Biodegradabilidad de las botellas de ácido poliláctico en situación real y simuladas las condiciones de compostaje.
IOVINOA, R., ZULLOA, R., RAOBM, A., CASSARA, L. & GIANFREDAB, L. (2007). Biodegra-dación de poli (ácido láctico) / almidón / coco biocomposites bajo condiciones de compostaje controlado.
ITRIA, R., LUPPI, L. & TULLIO, L. (2002). Estudio comparativo de ensayos de biodegradabilidad. Recursos Naturales y Ambiente, 4º Jornadas de Desarrollo e Innovación.
MOHEE, R. (2007). Biodegradability of biodegradable/degradable plastic material. Waste Manage-ment (2007), doi: 10.1016/ j.wasman. 2007.07.003.
MOHEE, R., UNMAR, G.(2007). Determining biodegradability of plastic materials under con-trolled and natural composting environments. Waste Management 27, 1486 – 1493.
RUDEEKIT Y. (2003). Comparative degradation of biodegradable plastics by aerobic microorgan-ism using ASTM 5338-98 (03) and ASTM D 5988-03 as Standard Methods.
VÁZQUEZ G. (2006). Effect of the innoculation level in aerobic biodegradability tests of polymeric materials. International Biodeterioration & Biodegradation 58 44 – 47.
99
Part 1 Environmental Security and Sustainability
SPECIALIZED TRAINING IN ENVIRONMENTAL SECURITY, CLIMATE CHANGE AND LAND RESTORATION. MASTERS ERASMUS, EUROPE LIFELONG LEARNING PROGRAMME.
J.C. Santamarta-CerezalEscuela de Ingeniería Civil e Industrial, Universidad de La Laguna
P. Arraiza Bermúdez-CañeteDepartamento de Ingeniería Forestal, ETSI Montes, Universidad Politécnica de Madrid
Florin IorasInstitute for Conservation, Sustainability and Innovation, Buckinghamshire New University
ABSTRACT: Erasmus 2009-2013 is a cooperation and mobility programme in the field of higher education that aims to enhance the quality of European higher education. Several European Univer-sities have partnered to jointly undertake training initiatives in a Master Erasmus format (MSc), the subjects are Environmental Security and the Climate Change. Enviromental Security programme ex-amines the threat posed by environmental events and trends to individuals, communities or nations. It may focus on the impact of human conflict and international relations on the environment, or on how environmental problems cross state borders. The other programe is about climate change and land restoration is an innovative educational product based on recent research, which indicates that there are significant benefits of enhanced technology collaboration on climate change and degraded land web based application that is now in progress.This paper shows the objetives and the method-ologies for teaching both international programmes.
1. INTRODUCTION
The United Nations Climate Change Conference, Durban 2011, delivered a breakthrough on the international community’s response to climate change. In the second largest meet-ing of its kind, the negotiations advanced, in a balanced fashion, the implementation of the Convention and the Kyoto Protocol, the Bali Action Plan, and the Cancun Agreements. The outcomes included a decision by Parties to adopt a universal legal agreement on climate change as soon as possible, and no later than 2015.One of the decisions adopted by COP 17 and CMP 7 regard to the land use, land-use change and forestry, and invites the Inter-governmental Panel on Climate Change to review and, if necessary, update supplementary methodologies for estimating anthropogenic greenhouse gas emissions by sources and re-movals by sinks resulting from land use, land-use change and forestry activities under Article 3, paragraphs 3 and 4, of the Kyoto Protocol.
100
Environmental security, geological hazards and management© 2013 ISBN 978-84-616-2005-0
Land degradation is a human-induced or natural process which negatively affects the pro-ductivity of land within an ecosystem. The direct causes of land degradation are geographi-cally specific. Climate change, including changes in short-term variation, as well as long-term gradual changes in temperature and precipitation, is expected to be an additional stress on rates of land degradation.
• Climate change-induced land degradation is expected through;
• Changes in the length of days and/or seasons;
• Recurrence of droughts, floods, and other extreme climatic events;
• Changes in temperature and precipitation which in turn reduces vegetation cover, water resource availability, and soil quality;
• Changes in land-use practices, such as conversion of lands, pollution, and depletion of soil nutrients.
Adaptation-related projects on land degradation should apply incremental reasoning during the design and preparatory phase. The focus of projects should be on reducing the impacts of climate change on land degradation over and beyond measures that would normally be undertaken as a land degradation focal area activity. In line with the adaptation funding win-dow that applies in this case (see below), maintaining and/or strengthening the resilience of ecosystems and communities to climate change by reducing the rates of land degradation (caused by climate change) is a priority. Projects should reflect dynamic, long-term response measures that can effectively contribute towards the reduction of climate change-induced land degradation.
2. PROPOSED MASTERS
2.1. Environmental Security
The MSc Programe in Environmental Security is a second cycle programme of higher edu-cation that follows a first degree or an equivalent level of learning leading to masters level offered by a higher education institution. The target groups are Graduates of Business and Planning faculties who intend to work in the infrastructure projects, graduates of environ-mental faculties who intend to specialise in environment disasters management, fire fighters who intend to specialise in wildfire prevention, graduates who intend to set up firms special-ised in equipment production.
The goal of environmental security is to protect people from the immediate and long term ravages of nature, human-induced threats to nature, and deterioration of then natural envi-ronment (Barbu et al., 2007). It encompasses concerns about the negative impact of human
101
Part 1 Environmental Security and Sustainability
activities on the environment, direct and indirect effects of environmental scarcity and deg-radation, and the insecurity individuals and groups experience due to environmental change such as water scarcity, air pollution, and global warming. The field of environmental security gained little attention following its emergence in the mid-1970s. The largest knowledge gap is in how to approach complex environmental problems. 21st century environmental challenges requires that university graduates possess a broad range of skills that cannot be delivered by traditional university curricula based on the concept of the environment as a subject of ‘hard’ natural science. Many learning programmes in Europe see the role of en-vironmental education as a means to provide a platform for sound scientific research rather than to introduce decision-making concepts and tools.
This postgraduate course aims to provide specific training and education for graduates wish-ing to specialise in the growing field of environmental security management.
The course is intended to prepare graduates for the employment markets they are likely to face. The MSc Environmental Security and Management is designed to meet the changing needs of employers as well as the changing nature of the employment market. The pro-posed programme addresses a need for further study opportunities in the environmental security field at postgraduate level. It provides a progression route for graduates of any related BSc programmes (e.g. those concerned with envoronment, management, security management) would benefit from completing this programme in preparation for a career in environmental security. Graduates will enhance their progression prospect within the organi-sations they work for due to the high competencies acquired.
The main educational aims of the MSc Environmental Security are to:
• Facilitate an integrated and critically aware understanding of the advanced study of en-vironmental security and the changing context within the field.
• Prepare students for a career in the environmental security and management profession by developing analytical skills at a professional or equivalent level, or for further study in the area.
• Develop in students the ability to apply theoretical knowledge and understanding of en-vironmental security and management to practice within the field, both systematically and creatively, to improve effectiveness and performance.
• Enhance students’ lifelong learning skills and personal development so as to be able to work with self-direction and originality and to contribute to the field as a whole.
• In this Master, the target group are Graduates of Business and Planning faculties who intend to work in the infrastructure projects, graduates of environmental faculties who intend to specialise in environment disasters management, fire fighters who intend to specialise in wildfire prevention, graduates who intend to set up firms specialised in equipment production.
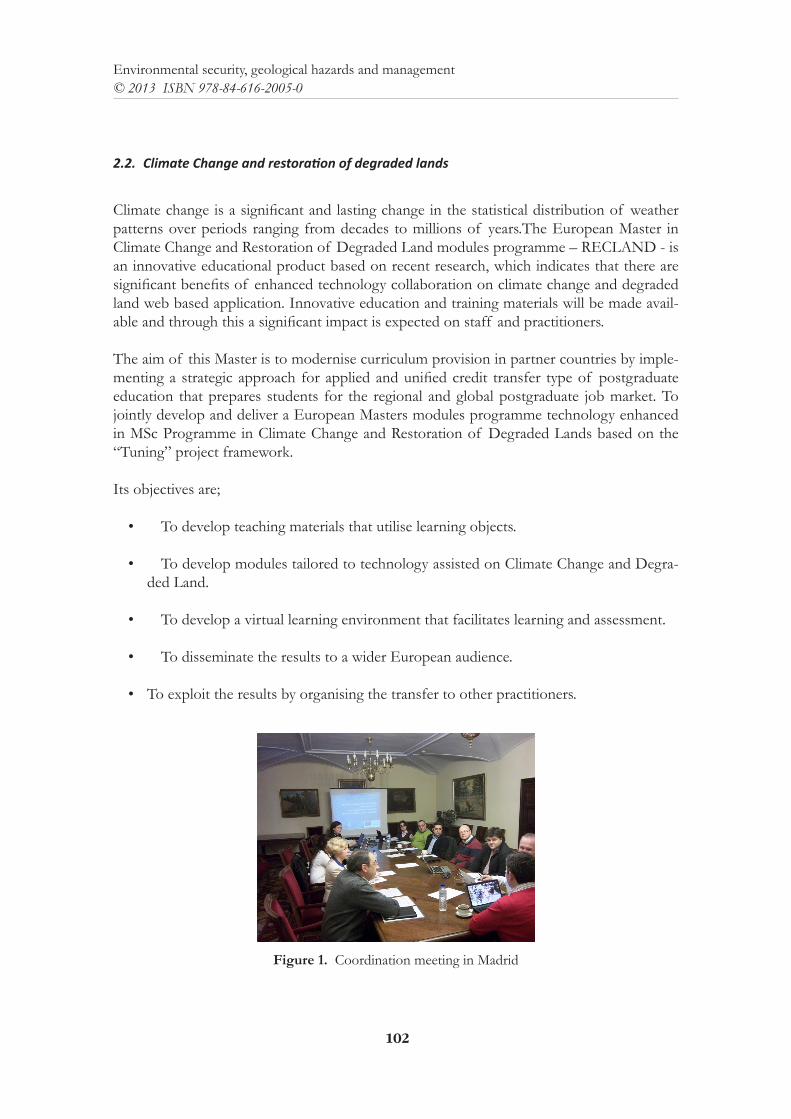
102
Environmental security, geological hazards and management© 2013 ISBN 978-84-616-2005-0
2.2. Climate Change and restoration of degraded lands
Climate change is a significant and lasting change in the statistical distribution of weather patterns over periods ranging from decades to millions of years.The European Master in Climate Change and Restoration of Degraded Land modules programme – RECLAND - is an innovative educational product based on recent research, which indicates that there are significant benefits of enhanced technology collaboration on climate change and degraded land web based application. Innovative education and training materials will be made avail-able and through this a significant impact is expected on staff and practitioners.
The aim of this Master is to modernise curriculum provision in partner countries by imple-menting a strategic approach for applied and unified credit transfer type of postgraduate education that prepares students for the regional and global postgraduate job market. To jointly develop and deliver a European Masters modules programme technology enhanced in MSc Programme in Climate Change and Restoration of Degraded Lands based on the “Tuning” project framework.
Its objectives are;
• To develop teaching materials that utilise learning objects.
• To develop modules tailored to technology assisted on Climate Change and Degra-ded Land.
• To develop a virtual learning environment that facilitates learning and assessment.
• To disseminate the results to a wider European audience.
• To exploit the results by organising the transfer to other practitioners.
Figure 1. Coordination meeting in Madrid
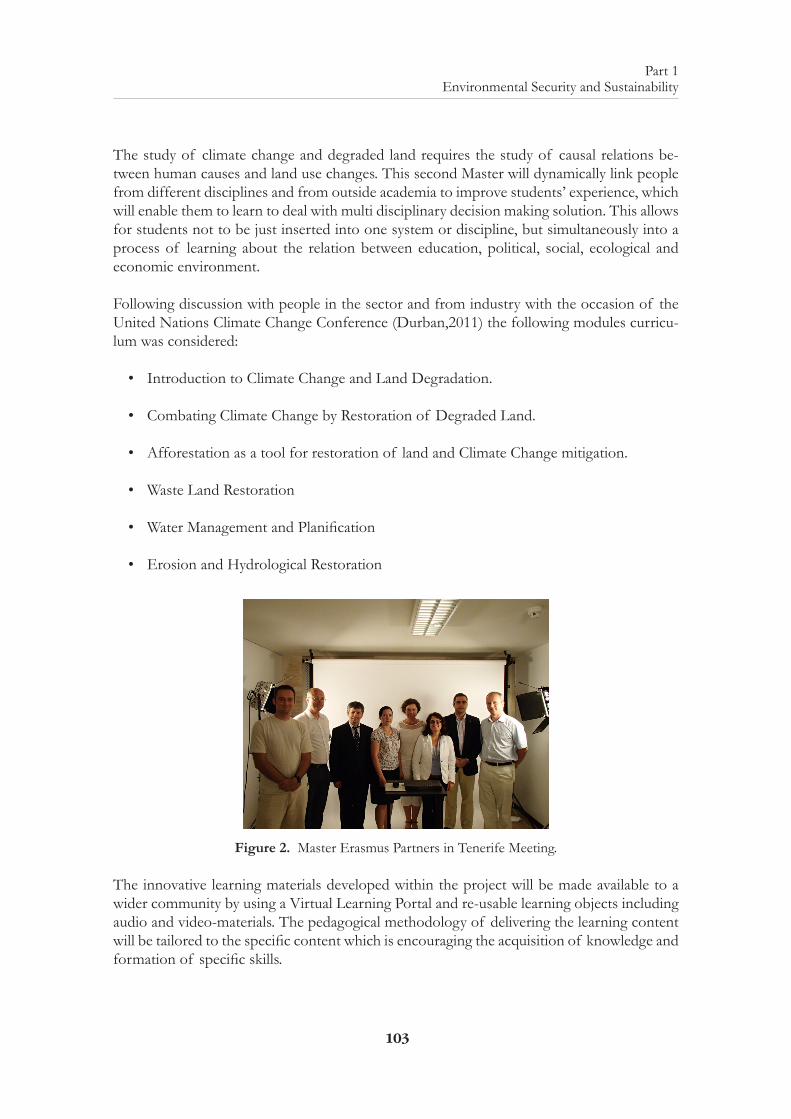
103
Part 1 Environmental Security and Sustainability
The study of climate change and degraded land requires the study of causal relations be-tween human causes and land use changes. This second Master will dynamically link people from different disciplines and from outside academia to improve students’ experience, which will enable them to learn to deal with multi disciplinary decision making solution. This allows for students not to be just inserted into one system or discipline, but simultaneously into a process of learning about the relation between education, political, social, ecological and economic environment.
Following discussion with people in the sector and from industry with the occasion of the United Nations Climate Change Conference (Durban,2011) the following modules curricu-lum was considered:
• Introduction to Climate Change and Land Degradation.
• Combating Climate Change by Restoration of Degraded Land.
• Afforestation as a tool for restoration of land and Climate Change mitigation.
• Waste Land Restoration
• Water Management and Planification
• Erosion and Hydrological Restoration
Figure 2. Master Erasmus Partners in Tenerife Meeting.
The innovative learning materials developed within the project will be made available to a wider community by using a Virtual Learning Portal and re-usable learning objects including audio and video-materials. The pedagogical methodology of delivering the learning content will be tailored to the specific content which is encouraging the acquisition of knowledge and formation of specific skills.
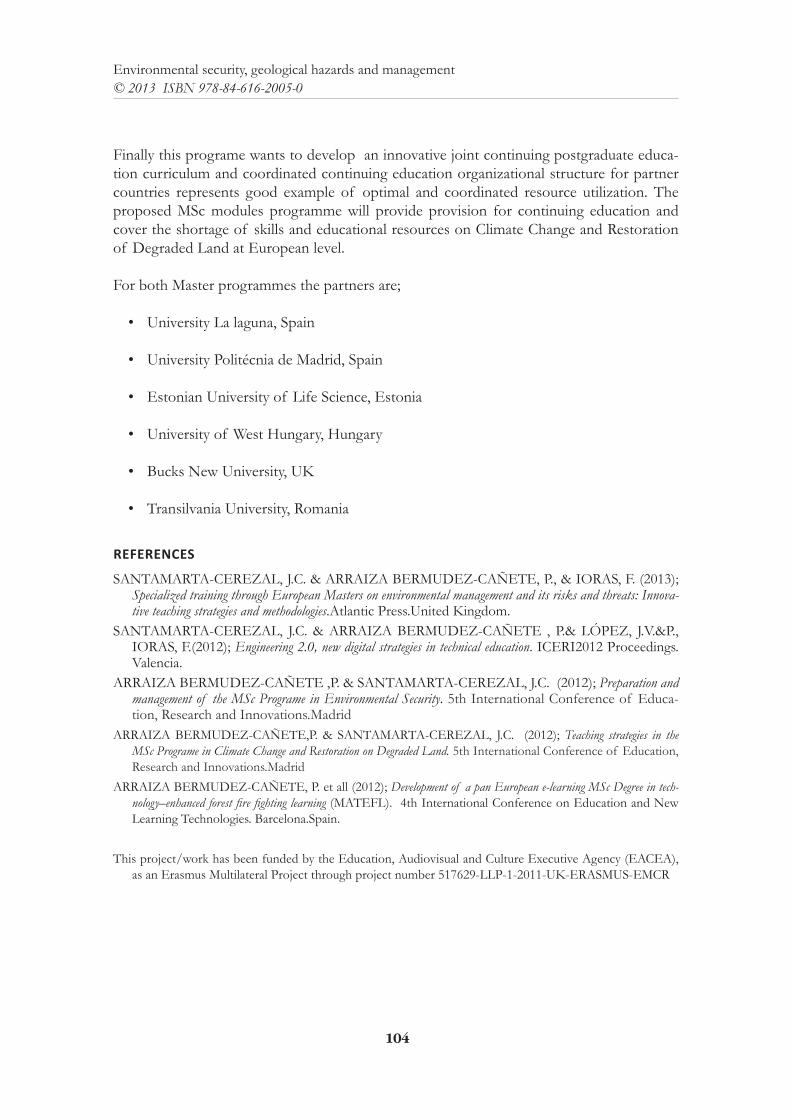
104
Environmental security, geological hazards and management© 2013 ISBN 978-84-616-2005-0
Finally this programe wants to develop an innovative joint continuing postgraduate educa-tion curriculum and coordinated continuing education organizational structure for partner countries represents good example of optimal and coordinated resource utilization. The proposed MSc modules programme will provide provision for continuing education and cover the shortage of skills and educational resources on Climate Change and Restoration of Degraded Land at European level.
For both Master programmes the partners are;
• University La laguna, Spain
• University Politécnia de Madrid, Spain
• Estonian University of Life Science, Estonia
• University of West Hungary, Hungary
• Bucks New University, UK
• Transilvania University, Romania
REFERENCES
SANTAMARTA-CEREZAL, J.C. & ARRAIZA BERMUDEZ-CAÑETE, P., & IORAS, F. (2013); Specialized training through European Masters on environmental management and its risks and threats: Innova-tive teaching strategies and methodologies.Atlantic Press.United Kingdom.
SANTAMARTA-CEREZAL, J.C. & ARRAIZA BERMUDEZ-CAÑETE , P.& LÓPEZ, J.V.&P., IORAS, F.(2012); Engineering 2.0, new digital strategies in technical education. ICERI2012 Proceedings.Valencia.
ARRAIZA BERMUDEZ-CAÑETE ,P. & SANTAMARTA-CEREZAL, J.C. (2012); Preparation and management of the MSc Programe in Environmental Security. 5th International Conference of Educa-tion, Research and Innovations.Madrid
ARRAIZA BERMUDEZ-CAÑETE,P. & SANTAMARTA-CEREZAL, J.C. (2012); Teaching strategies in the MSc Programe in Climate Change and Restoration on Degraded Land. 5th International Conference of Education, Research and Innovations.Madrid
ARRAIZA BERMUDEZ-CAÑETE, P. et all (2012); Development of a pan European e-learning MSc Degree in tech-nology–enhanced forest fire fighting learning (MATEFL). 4th International Conference on Education and New Learning Technologies. Barcelona.Spain.
This project/work has been funded by the Education, Audiovisual and Culture Executive Agency (EACEA), as an Erasmus Multilateral Project through project number 517629-LLP-1-2011-UK-ERASMUS-EMCR
105
Part 1 Environmental Security and Sustainability
SUSTAINABLE RE-THINKING OF THE CITY CONCEPT
M.I. Alba, E. Roig, J. Claver & R. ÁlvarezPolytechnic School, Antonio de Nebrija University, Madrid, Spain
Nowadays we can see how “sustainability”1 has become a key word. We can see it increasingly often not only in scientific magazines, but also in the media, in political programs… This leads us, most of the times, to adopt this term as it is, without pondering its real meaning. However, under the umbrella of “sustainability” IT hides such a broad reality that it is neces-sary to think about it.
In many cases we find the word “sustainability” associated in general terms to a trivializa-tion of concepts such as Nature, artifice, ecology, urban, rural… We can also see how this is happening in a society like ours, which names the sustainable as a sort of spell that deletes automatically all the contradictions of an economic system that, in the case of our country, bases its growth on the construction speculation and meanwhile, it enacts laws and regula-tions in order to improve more “sustainable” building methods.
Behind that rhetoric echoed by current architecture and technology, this situation raises the need to look for that other idea of sustainability that lies behind. Where architecture does not bow to so much hi-tech, formal extravagancies, contradictory regulations… in order to ask itself in what it is really interested about this concept, which is the true architectural and cultural nature of sustainability. Maybe it is because, as Iñaki Ábalos states, “a credible map of sustainability has yet to be built as there is no doubt that other dimensions already tested have exhausted their credibility”.2
Moreover, and in the times we live in, in which we can see how meanings and architectures centered in the old continuance tradition are irremediably destabilized in a city marked by the digital networks, acceleration, massive infrastructures of interconnections… that make up a reality that neither the city nor architecture must overlook; a reality in which transport, telecommunications, natural spaces within the cities… are key elements of the urban experi-ence and, therefore, they must be thought from a sustainable re-thinking of the city in order to build, as Iñaki Ábalos would say, that credible map of sustainability, map which also would need, as Felix Guattari suggests in his book Las tres ecologías, a revolution because “the true answer to the ecological crisis can only be given worldwide on condition that an authentic
1 According to the Brundland Report issued by the United Nations World Committee on Environment and Development, the concept of sustainable development consists of meeting the needs of the present generation without compromising the ability of future generations to meet their own needs.2 ÁBALOS, Iñaki: “Bartleby, el arquitecto”, El Pais (10/03/ 2007).
106
Environmental security, geological hazards and management© 2013 ISBN 978-84-616-2005-0
political, social, and cultural revolution is carried out to redefine the aims of the production of both material and immaterial goods”.3
Therefore, defining new instruments and mechanisms which do not consider the design of a city as finished, demanding and imagining spaces and development frameworks in a non-stop change and evolution for a city considered as definitely unfinished, mutable and in transforma-tion, studying new forms of relationships with both natural and artificial environments, are thoughts that make the key questions according to the “sustainable thinking” of the city.
Nowadays we can see how the cities’ growth tends to create a land that could be qualified as “generally urban” and does not differentiate between city and nature. Today, more than ever, when facing a worldwide ecological crisis, this kind of growth is questioned. Ecosystems are extremely fragile and threatened by wide real estates that are unfriendly with that important and necessary balance between the artificial city environment and Nature.
In his last works, Peter Hall has pointed out the novelty and radicalism of urban phenomena in the last thirty years. In this new millennium, we acknowledge the city boom and its quick growth as a widespread phenomenon. These great accretions do not have a physical struc-ture, neither centralized nor concentrated, but deeply interconnected. They make up a reality that tends to spread limitless without any other form than that provided by some geographi-cal elements or huge infrastructures.
Vehicle traffic in contemporary cities is an indicator of the need and desire of mobility and ac-cess. That is the reason of the proliferation of automobiles. People longs for using the private, easy and fast transport provided by cars, the most effective land transport invented so far.
The consequence of this can be found in city areas isolated from the rest by insurmountable transport infrastructures, to which the increasing trend to build single-family houses (ter-raced, semi-detached) can be added… the consequences are alarming. Residential fragments are built in very low densities, identified as “quality of life” densities lacking any other activity different from that pertaining to dwellings and, at best, some primary facilities. This scenario not only involves territorial dispersion, an indefinite and a very fast growth of the city limits, but also it leads to the consumption of infrastructures: water, fuel, maintenance and conser-vation expenses, etc. Private transport and consumption at residential buildings account for almost half of the total energy consumption in developed countries.
This accelerated city growth brings to the table many problematic issues that concern us:
• Cities acknowledge they do not fully control multiplicity and the overlapping of distri-bution and fluctuation channels that run, weave and organize the city.
• Current urban systems can no longer be thought according to the architecture concepts and methods valid until now. These megacities, as Lewis Munford liked to call them,
3 GUATTARI, Felix: Las tres ecologías. Valencia: Pre-Textos, 2000.
107
Part 1 Environmental Security and Sustainability
represent some new characteristics and challenges for architecture, especially for a type of architecture that wants to include a new way of sustainable-thinking the city.
• Current urban processes are fragmentary practices lacking reflection and critical enga-gement but organizing life in the existing cities.
Nowadays, concepts like highways, airports, interchanges, integrated transport systems, shopping malls, theme parks, leisure areas, tourism resources, self-built residential areas, mobile homes as an alternative for users different to those of the traditional family, renovation operations, recovery of heritage according to ideological demands and for massive consumption, parks, protected or obsolete pre-industrial areas seem to get along badly, in many occasions they sound strange when not conflictive, regarding the ways of thinking and intervention of an architecture rooted in ad-vance planning rigour, typological standardization or stylistic definition.
All these facts lead to questions that, regarding a “sustainable-thinking” of the city, inevitably have to re-think the whole of the current urban planning logics, most of them anchored in advance planning rigour or in typological standardization as a result of a standard, rigid and homogenizer urban planning that does not take into account today’s city conditions. There-fore, it involves:
• Paying attention to the new temporalities and mobilities of the contemporary city.
• Reflecting about new logics able to connect our cities and their citizens and allowing stopping the energy waste of recent years.
• Looking for new proposals able to set relationships, encourage new links and connec-tions which reactivate and connect our land.
• Facilitating through architectural structures both the interchange and the easy transit among different networks, so that those places may become especially receptive to any sort of interchange.
• Working with a definitely unfinished terrain, continuously mutating, evolving, transfor-ming, recycling, and changing, far from the apparently “harmonic”, unchanged conti-nuity of the classical city, of its rigidity and permanency.
• Re-thinking the coordinating dimension of infrastructures, where things intersect and intertwine, more from the efficiency of relationships than from the proliferation of layouts often turned into absurd tangles.
All this only serves to question the stable, aesthetic and permanent concept of the city, claiming an architecture that considers this mobility to hold a series of networks where any kind of objects and products flow allowing a proper relationship with a natural or artificial environment.
108
Environmental security, geological hazards and management© 2013 ISBN 978-84-616-2005-0
This situation suggests the need to address the complex and definitely hybrid condition of current urban structures that define our background, and raise meeting scenarios in them among old watertight categories, both natural and artificial, architecture and landscape, city and land… in a new “naturartificial” repertoire more connected to irregular configurations than to old, compact building volumeters. A unitary and crossed conception of both archi-tecture and nature in a double approach movement that implies entering the realm of the hybrid, the “mestizo”… amalgams of natural, traditional and high-tech elements.
As Francisco Jarauta considers in the Prologue to Artefactos. Ecología del ambiente artificial (Ar-tifacts. Ecology of the Artificial Environment in English):
“Whatever the current orientations are, the next culture will be above all a culture dominated by the artificial… the generalization of new systems of knowledge, diverted to powerful technologies, capable of absolutely unknown transformation and innovation processes, have made possible new object systems that, as a whole, configure human environment, their hab-itat, their relationships… It is necessary to connect what is technically possible to everything culturally desirable in the context of an increasing environmental awareness”.4
To define this relationship between the natural and the artificial we can draw on:
• A concept that allows deleting the limits between the object and the land. These dis-solving limits are an ideological vein: the idea of architecture as landscape. An approach that considers the configuration of architecture as indissoluble from the configuration of land. According to FOA, a relationship is created in which “the emerging landscape is characterized by developments already produced in biotechnology, artificial intelligen-ce, design and lifestyle, where the natural and the artificial have become virtually indis-tinguishable.” Projects like FOA’s at Yokohama’s maritime terminal, Peter Eiseman’s in Santiago de Compostela or The Netherlands’ Pavilion by MVRDV for Expo 2000 illustrate this concept in which the interesting thing is the subversion of Nature, the production of instruments to judge the suitability of a mountain, of a river (…). Ani-mating the artificial and building the natural are two aims that go in the same direction”.
• The establishing of the Natural Contract Michel Serres talks about:
“How to express today the beauty of the world, the fragile splendor of the whole Earth but as an old glory of such a local landscape? Sciences make up models for the Globe we sometimes watch: our techniques act on it. Does the Earth react? How does it do it? We have become global actors, but as a counterpart, Does the Earth answer back to our actions? Combat, dialogue or agreement? Taking into account the risk of a fight to the death, a contract must be anticipated. In the hope of a common life, we witness the birth of a Nature. Once more, How to express the Earth’s fragile beauty?”5
4 MANZINI, Ezio: Artefactos: hacia una nueva ecología del ambiente artificial. Madrid: Celeste, 1996.5 SERRES, Michel: El contrato natural. Valencia: Pre-textos, 2004.
109
Part 1 Environmental Security and Sustainability
• A Natural Contract that acknowledges some bases that not only understand the conver-sation but also the dialogue with the environment about coexistence, but also unders-tand Human Beings as part of the land and not as adversaries.
REFERENCES
ÁBALOS, I. (2007); “Bartleby, el arquitecto”, El Pais (10/03/ 2007).BRAUNGART, M. & MCDONOUGH, W. (2004); Cradle to cradle: Remaking the way we make things.
Madrid: McGraw-Hill. BRUNTLAND, G. (ed.), (1987); Our common future: The World Commis-
sion on Environment and Development, United Nations, Oxford: University Press. GUATTARI, F. (2000); Las tres ecologías. Valencia: Pre-Texto.
MANZINI, E. (1996); Artefactos: hacia una nueva ecología del ambiente artificial. Madrid: Celeste.SERRES, M.(2004); El contrato natural. Valencia: Pre-textos.


PART 2
Water Management and Protection

113
Part 2Water Management and Protection
WATER AVAILABILITY AND MANAGEMENT IN THE PYRENEES UNDER PROJECTED SCENARIOS OF CLIMATE
AND LAND USE CHANGE
J.I. López-Moreno; E. Morán-Tejeda; J. Revuelto; M. Gilaberte; J. Zabalza; S.M. Vicente-Serrano
Instituto Pirenaico de Ecología, Consejo Superior de Investigaciones Científicas (CSIC)
ABSTRACT: There are strong evidences that environmental changes observed in the last decades in the southern Pyrenees have seriously affected the hydrology and water management in the region. Moreover, the projected evolution of climate and vegetation in the region suggest and uncertain future in the possibility to supply the water demand under very likely water scarce conditions. In this study, the hydrological response of a Mediterranean mountain basin has been simulated under ob-served environmental conditions and under different scenarios of future climate and land use change. Runoff series projected for the time slice 2021-2050 have been used to simulate the management of the Yesa reservoir. The combined effect of land use and climate change is expected to cause a fall in annual runoff of 29.6%, affecting with intensity all months of the year expect winter when the re-duction is more moderate. Under these water availability scenarios, the Yesa reservoir with its current storage capacity (476 hm3) is expected to face serious problems to satisfy the current water demand.
1. INTRODUCTION
The Spanish Pyrenees produce most of the surface water resources in the Ebro basin and they are regulated by many medium and large sized reservoirs to ensure the water supply for agriculture, hydropower production, industry, tourism and domestic uses of the semiarid low-lands of the Ebro basin (LÓPEZ-MORENO et al., 2008). In the Pyrenees, temperature has increased in a significant fashion (EL KENAWY et al., 2011), precipitation has decreased in winter (LÓPEZ-MORENO ET AL., 2010) and snow pack has declined in winter and spring time. In addition, almost the 90% of the mountain agriculture lands have been abandoned in the last decades, and natural revegetation has been accelerated by systematic afforestation campaigns aiming to prevent erosion in highly degraded headwaters. The result has been a significant decrease of the river discharges and runoff coefficients (LÓPEZ-MORENO et al., 2011), that has forced to reservoirs managers to reduce outflows downstream the dams during most of the year. It has allowed maintaining stationary or even increase, the amount of water diverted toward irrigation channels and hydropower.
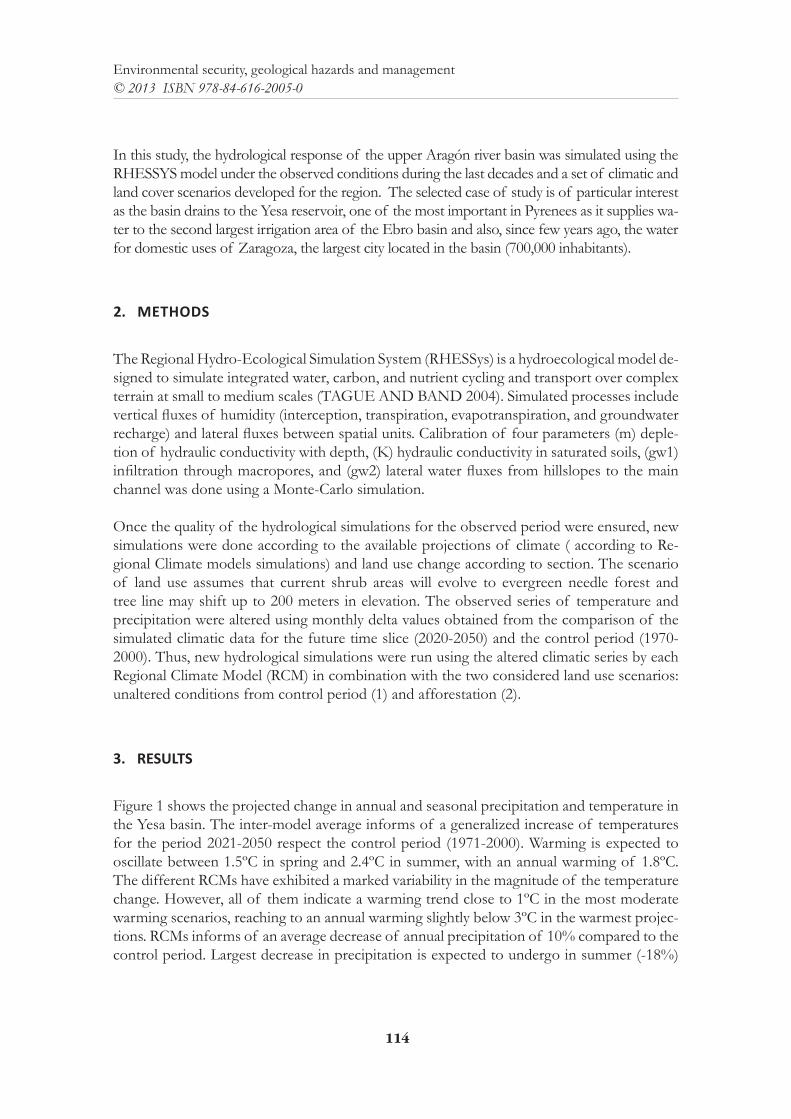
114
Environmental security, geological hazards and management© 2013 ISBN 978-84-616-2005-0
In this study, the hydrological response of the upper Aragón river basin was simulated using the RHESSYS model under the observed conditions during the last decades and a set of climatic and land cover scenarios developed for the region. The selected case of study is of particular interest as the basin drains to the Yesa reservoir, one of the most important in Pyrenees as it supplies wa-ter to the second largest irrigation area of the Ebro basin and also, since few years ago, the water for domestic uses of Zaragoza, the largest city located in the basin (700,000 inhabitants).
2. METHODS
The Regional Hydro-Ecological Simulation System (RHESSys) is a hydroecological model de-signed to simulate integrated water, carbon, and nutrient cycling and transport over complex terrain at small to medium scales (TAGUE AND BAND 2004). Simulated processes include vertical fluxes of humidity (interception, transpiration, evapotranspiration, and groundwater recharge) and lateral fluxes between spatial units. Calibration of four parameters (m) deple-tion of hydraulic conductivity with depth, (K) hydraulic conductivity in saturated soils, (gw1) infiltration through macropores, and (gw2) lateral water fluxes from hillslopes to the main channel was done using a Monte-Carlo simulation.
Once the quality of the hydrological simulations for the observed period were ensured, new simulations were done according to the available projections of climate ( according to Re-gional Climate models simulations) and land use change according to section. The scenario of land use assumes that current shrub areas will evolve to evergreen needle forest and tree line may shift up to 200 meters in elevation. The observed series of temperature and precipitation were altered using monthly delta values obtained from the comparison of the simulated climatic data for the future time slice (2020-2050) and the control period (1970-2000). Thus, new hydrological simulations were run using the altered climatic series by each Regional Climate Model (RCM) in combination with the two considered land use scenarios: unaltered conditions from control period (1) and afforestation (2).
3. RESULTS
Figure 1 shows the projected change in annual and seasonal precipitation and temperature in the Yesa basin. The inter-model average informs of a generalized increase of temperatures for the period 2021-2050 respect the control period (1971-2000). Warming is expected to oscillate between 1.5ºC in spring and 2.4ºC in summer, with an annual warming of 1.8ºC. The different RCMs have exhibited a marked variability in the magnitude of the temperature change. However, all of them indicate a warming trend close to 1ºC in the most moderate warming scenarios, reaching to an annual warming slightly below 3ºC in the warmest projec-tions. RCMs informs of an average decrease of annual precipitation of 10% compared to the control period. Largest decrease in precipitation is expected to undergo in summer (-18%)
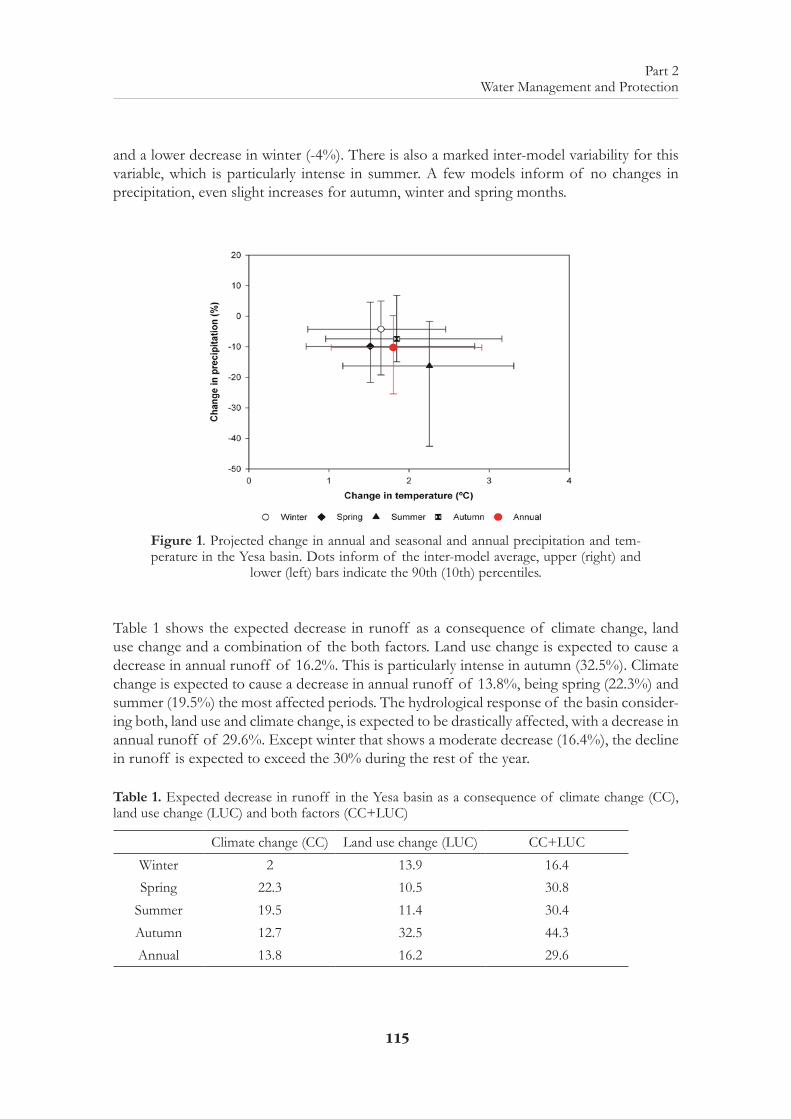
115
Part 2Water Management and Protection
and a lower decrease in winter (-4%). There is also a marked inter-model variability for this variable, which is particularly intense in summer. A few models inform of no changes in precipitation, even slight increases for autumn, winter and spring months.
Figure 1. Projected change in annual and seasonal and annual precipitation and tem-perature in the Yesa basin. Dots inform of the inter-model average, upper (right) and
lower (left) bars indicate the 90th (10th) percentiles.
Table 1 shows the expected decrease in runoff as a consequence of climate change, land use change and a combination of the both factors. Land use change is expected to cause a decrease in annual runoff of 16.2%. This is particularly intense in autumn (32.5%). Climate change is expected to cause a decrease in annual runoff of 13.8%, being spring (22.3%) and summer (19.5%) the most affected periods. The hydrological response of the basin consider-ing both, land use and climate change, is expected to be drastically affected, with a decrease in annual runoff of 29.6%. Except winter that shows a moderate decrease (16.4%), the decline in runoff is expected to exceed the 30% during the rest of the year.
Table 1. Expected decrease in runoff in the Yesa basin as a consequence of climate change (CC), land use change (LUC) and both factors (CC+LUC)
Climate change (CC) Land use change (LUC) CC+LUCWinter 2 13.9 16.4Spring 22.3 10.5 30.8
Summer 19.5 11.4 30.4Autumn 12.7 32.5 44.3Annual 13.8 16.2 29.6
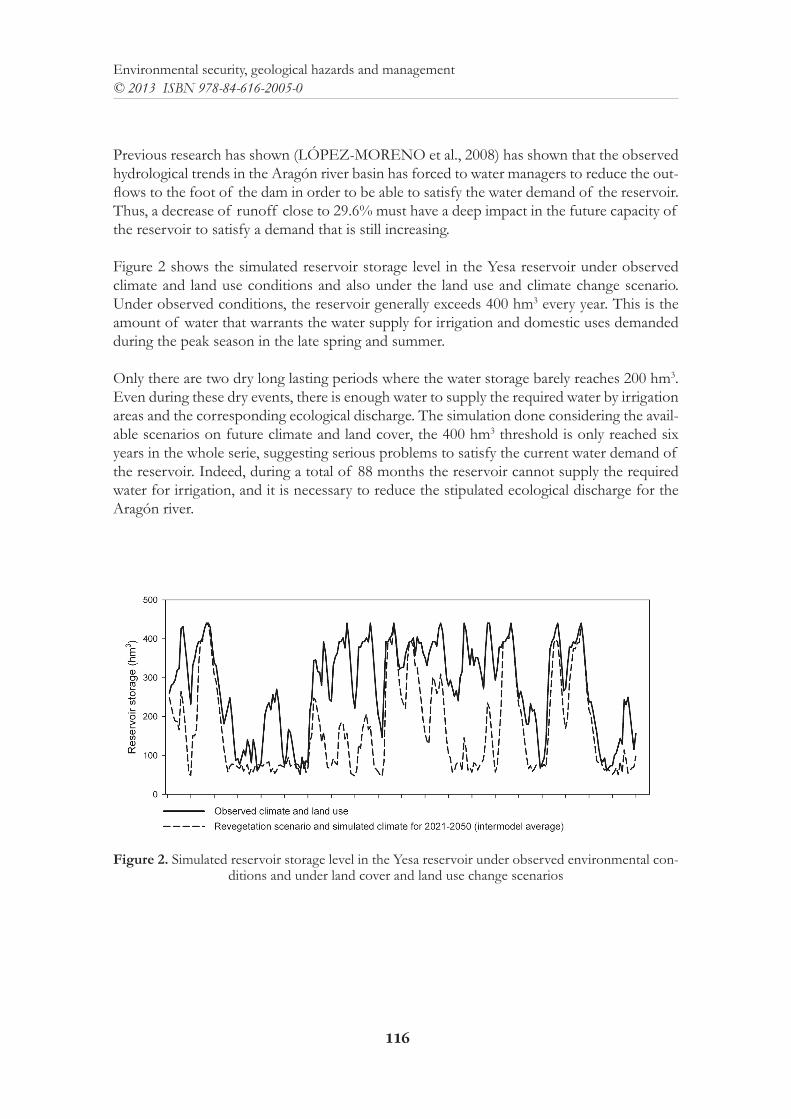
116
Environmental security, geological hazards and management© 2013 ISBN 978-84-616-2005-0
Previous research has shown (LÓPEZ-MORENO et al., 2008) has shown that the observed hydrological trends in the Aragón river basin has forced to water managers to reduce the out-flows to the foot of the dam in order to be able to satisfy the water demand of the reservoir. Thus, a decrease of runoff close to 29.6% must have a deep impact in the future capacity of the reservoir to satisfy a demand that is still increasing.
Figure 2 shows the simulated reservoir storage level in the Yesa reservoir under observed climate and land use conditions and also under the land use and climate change scenario. Under observed conditions, the reservoir generally exceeds 400 hm3 every year. This is the amount of water that warrants the water supply for irrigation and domestic uses demanded during the peak season in the late spring and summer.
Only there are two dry long lasting periods where the water storage barely reaches 200 hm3. Even during these dry events, there is enough water to supply the required water by irrigation areas and the corresponding ecological discharge. The simulation done considering the avail-able scenarios on future climate and land cover, the 400 hm3 threshold is only reached six years in the whole serie, suggesting serious problems to satisfy the current water demand of the reservoir. Indeed, during a total of 88 months the reservoir cannot supply the required water for irrigation, and it is necessary to reduce the stipulated ecological discharge for the Aragón river.
Figure 2. Simulated reservoir storage level in the Yesa reservoir under observed environmental con-ditions and under land cover and land use change scenarios
117
Part 2Water Management and Protection
4. CONCLUSIONS
Results have shown that land use change may have a similar effect than climate change for reducing available water resources in the Aragón river basin. The combined effect of climate change and the increase of vegetation is expected to cause a decrease in runoff of 29.6%. A reduction in the inflows to the Yesa reservoir may lead to problems to reach the maximum storage capacity in spring, which is needed to supply the water demand for irrigation and domestic uses in large areas of the Ebro basin. Thus, the water supply for an increasing demand results a challenging issue that requires of appropriate coordination amongst politi-cians, managers and scientists.
REFERENCES
KENAWY, A., LÓPEZ-MORENO, J.I., VICENTE-SERRANO, S.M. (2011): Recent changes in daily temperature extremes in Northeastern Spain: 1960 ‐2006. Natural Hazards and Earth sys-tem Sciences 11, pp. 1-21.
LÓPEZ-MORENO, J.I., VICENTE-SERRANO, S.M., MORAN-TEJEDA, GARCÍA-RUIZ, J.M. (2011): Impact of climate evolution and land use changes on water yield in the Ebro basin. Hy-Impact of climate evolution and land use changes on water yield in the Ebro basin. Hy-drology and Earth System Science 15, pp. 311-322.
LÓPEZ-MORENO, J.I., VICENTE-SERRANO, S.M., BEGUERÍA, S., EL KENAWY, A.M., AN-GULO M. (2010): Trends in daily precipitation on the north-eastern Iberian Peninsula, 1955-2006. International Journal of Climatology 120, pp. 248-257.
LÓPEZ-MORENO, J.I., GARCÍA-RUIZ, J.M. AND BENISTON, M. (2008): Environmental Change and water management in the Pyrenees. Facts and future perspectives for Mediterranean mountains. Globlal and Planeary Change 66 (3-4), pp. 300-312.
LÓPEZ-MORENO, J.I., BEGUERÍA, S. AND GARCÍA-RUIZ, J.M. (2004): The management of a large mediterranean reservoir: storage regimes of the Yesa reservoir, Upper Aragón River basin, Central Spanish Pyrenees. Environmental Management 34 (4), pp. 508-515.
TAGUE C, BAND L (2004): RHESSys: Regional Hydro-ecologic simulation system: An object-oriented approach to spatially distributed modelling of carbon, water and nutrient cycling. Earth Interactions 8, pp. 1-42.

119
Part 2Water Management and Protection
MOUNTAIN AREAS SAFETY. TORRENT CONTROL IN A PYRENEAN BASIN
García Rodríguez, José L., Giménez Suárez, M.C.Hydraulics and Hydrology Laboratory, Forest Engineering Department, ETSI Montes, Technical Univer-
sity of Madrid, Ciudad Universitaria s/n, 28040, Madrid, Spain
ABSTRACT: The study area was a torrent basin called “Los Meses” located in the Pyrenees of Huesca province (Spain). Canfranc, nowadays known as Canfranc-village, is a small village situated on the alluvial cone of “Los Meses”. The village lies on the highway to France (N 330), along the right bank of the Aragon River, into the torrent discharges. The progressive deforestation of the basin due to agriculture, pastures and firewood, a common circumstance for many Pyrenean valleys, caused tor-rent become dangerous for the village during the 18th and 19th centuries. In fact, it was so dangerous that the local people were forced to work building a defensive stone wall every time there was a flood. The wall once stood at a height of more than 5 m, and a width of almost 4 m. Finally, at the beginning of the 20th century, the forest engineers Ayerbe and Azpeitia started with the stream control works, but they died before their completion. The stream control works were an object of admiration for other professionals. There is indeed, a considerable bibliography preserved from that time in which the dangers of the torrent and the magnificent works were described. Nev-ertheless, inexplicably no administration has preserved any trace of the original documents.
1. STREAM CONTROL WORKS OF BENITO AYERBE
“Los Meses” is a small torrent basin, with a surface of 163.55 ha, very steep slopes. Its high-est altitude is 1,991 metres above sea level, while the altitude at the outlet section is 1,090 metres above sea level, with a longitude of 2 km. The mean stream discharge into the River Aragon, after crossing the alluvial cone, at 1,015 metres above sea level (Figure 1). The av-erage gradient of the riverbed, before the works, was 30%. The torrent, in the higher area, has two branches of similar longitude united at approximately 1370 metres above sea level, descending together until reaches the Aragon River. The common area was called “the lower tract” (including the ravine); the area with two branches was called the “middle tract”; and the higher part of the basin, without a riverbed, “the upper tract”. At the time of the works, the basin was almost completely deforested (Figure 2).
The following stream control works were carried out: In the lower tract a hydraulic chan-nel of tracts and four check-dams. The channel, of 11 steps, 95 m length and 6.5 m width, consisted of 11 grills varying between 1.5 and 2 m height, accompanied by longitudinal walls.
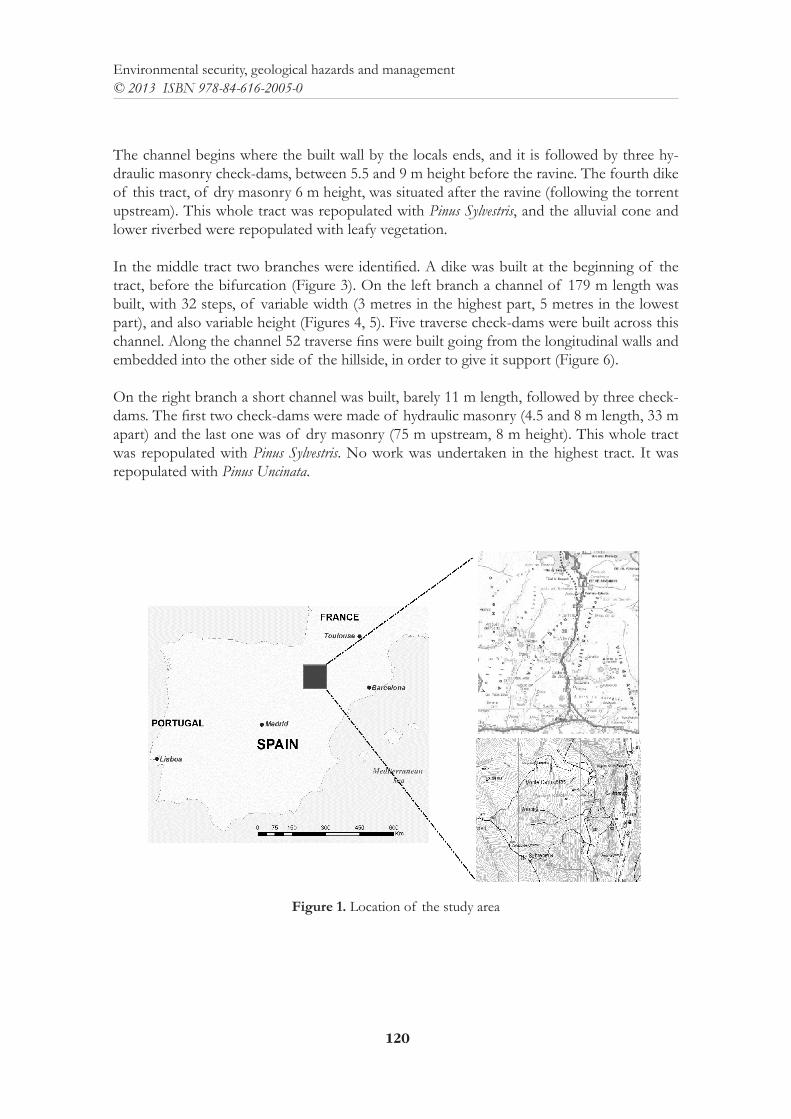
120
Environmental security, geological hazards and management© 2013 ISBN 978-84-616-2005-0
The channel begins where the built wall by the locals ends, and it is followed by three hy-draulic masonry check-dams, between 5.5 and 9 m height before the ravine. The fourth dike of this tract, of dry masonry 6 m height, was situated after the ravine (following the torrent upstream). This whole tract was repopulated with Pinus Sylvestris, and the alluvial cone and lower riverbed were repopulated with leafy vegetation.
In the middle tract two branches were identified. A dike was built at the beginning of the tract, before the bifurcation (Figure 3). On the left branch a channel of 179 m length was built, with 32 steps, of variable width (3 metres in the highest part, 5 metres in the lowest part), and also variable height (Figures 4, 5). Five traverse check-dams were built across this channel. Along the channel 52 traverse fins were built going from the longitudinal walls and embedded into the other side of the hillside, in order to give it support (Figure 6).
On the right branch a short channel was built, barely 11 m length, followed by three check-dams. The first two check-dams were made of hydraulic masonry (4.5 and 8 m length, 33 m apart) and the last one was of dry masonry (75 m upstream, 8 m height). This whole tract was repopulated with Pinus Sylvestris. No work was undertaken in the highest tract. It was repopulated with Pinus Uncinata.
Figure 1. Location of the study area
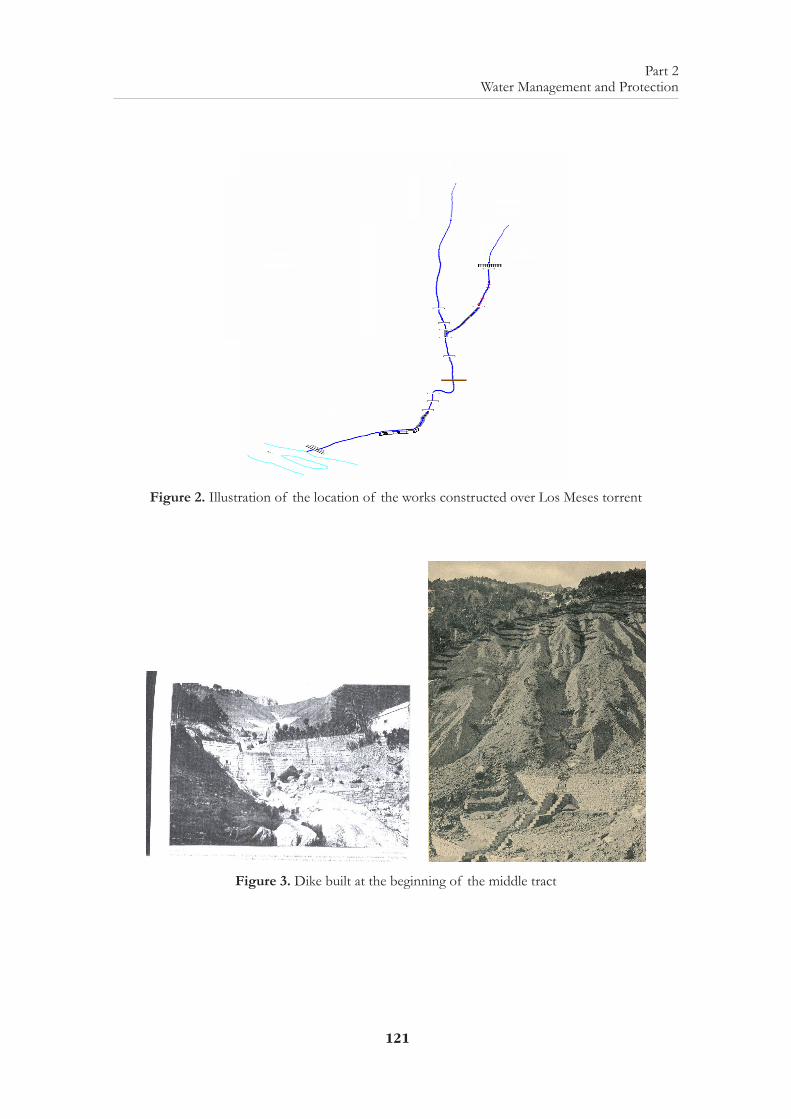
121
Part 2Water Management and Protection
Figure 2. Illustration of the location of the works constructed over Los Meses torrent
Figure 3. Dike built at the beginning of the middle tract
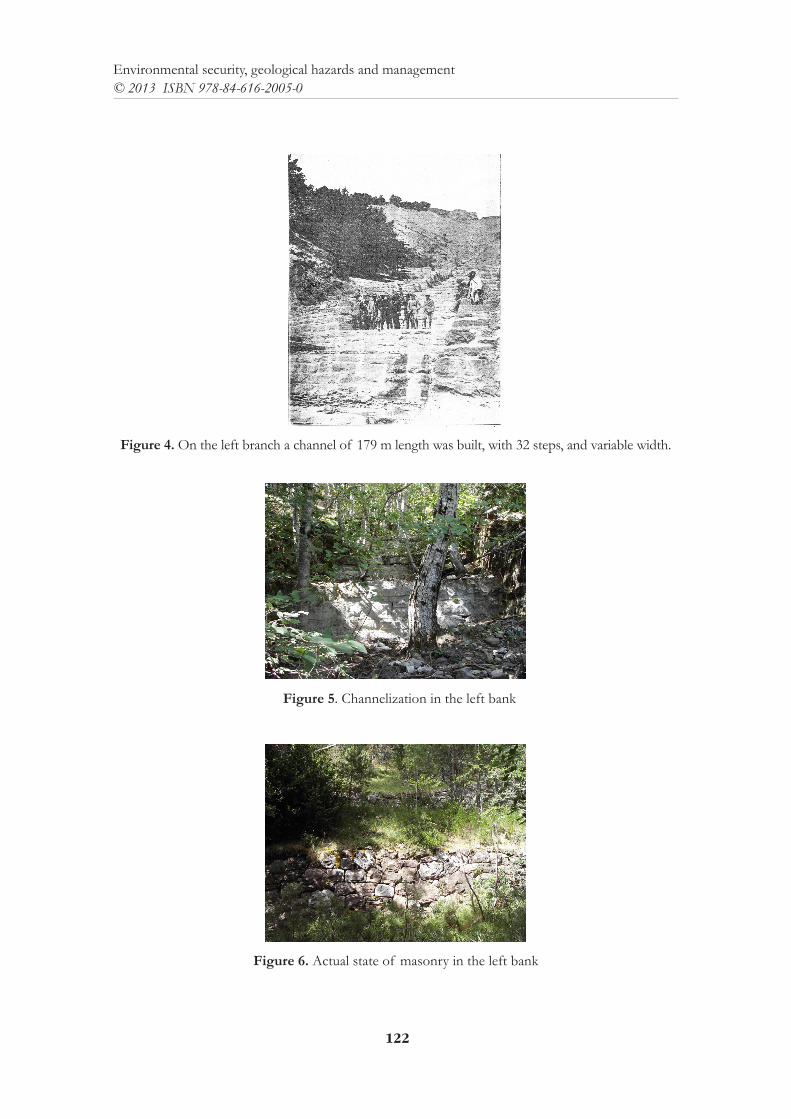
122
Environmental security, geological hazards and management© 2013 ISBN 978-84-616-2005-0
Figure 4. On the left branch a channel of 179 m length was built, with 32 steps, and variable width.
Figure 5. Channelization in the left bank
Figure 6. Actual state of masonry in the left bank
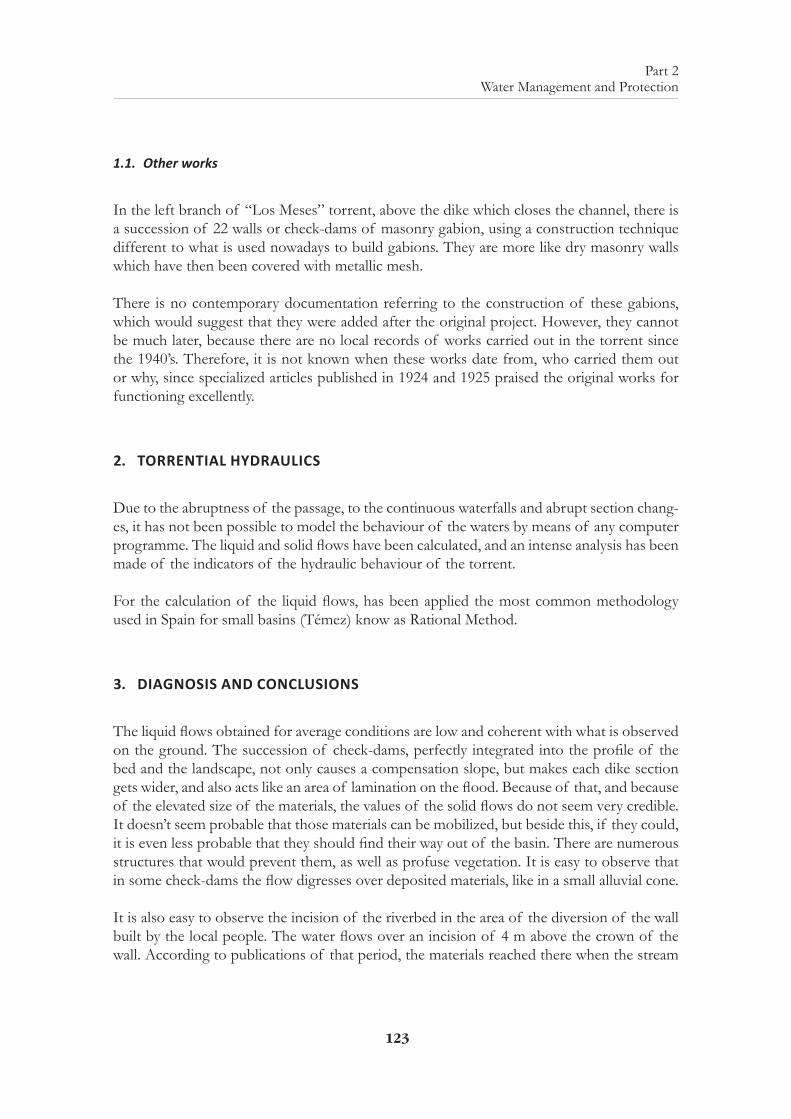
123
Part 2Water Management and Protection
1.1. Other works
In the left branch of “Los Meses” torrent, above the dike which closes the channel, there is a succession of 22 walls or check-dams of masonry gabion, using a construction technique different to what is used nowadays to build gabions. They are more like dry masonry walls which have then been covered with metallic mesh.
There is no contemporary documentation referring to the construction of these gabions, which would suggest that they were added after the original project. However, they cannot be much later, because there are no local records of works carried out in the torrent since the 1940’s. Therefore, it is not known when these works date from, who carried them out or why, since specialized articles published in 1924 and 1925 praised the original works for functioning excellently.
2. TORRENTIAL HYDRAULICS
Due to the abruptness of the passage, to the continuous waterfalls and abrupt section chang-es, it has not been possible to model the behaviour of the waters by means of any computer programme. The liquid and solid flows have been calculated, and an intense analysis has been made of the indicators of the hydraulic behaviour of the torrent.
For the calculation of the liquid flows, has been applied the most common methodology used in Spain for small basins (Témez) know as Rational Method.
3. DIAGNOSIS AND CONCLUSIONS
The liquid flows obtained for average conditions are low and coherent with what is observed on the ground. The succession of check-dams, perfectly integrated into the profile of the bed and the landscape, not only causes a compensation slope, but makes each dike section gets wider, and also acts like an area of lamination on the flood. Because of that, and because of the elevated size of the materials, the values of the solid flows do not seem very credible. It doesn’t seem probable that those materials can be mobilized, but beside this, if they could, it is even less probable that they should find their way out of the basin. There are numerous structures that would prevent them, as well as profuse vegetation. It is easy to observe that in some check-dams the flow digresses over deposited materials, like in a small alluvial cone.
It is also easy to observe the incision of the riverbed in the area of the diversion of the wall built by the local people. The water flows over an incision of 4 m above the crown of the wall. According to publications of that period, the materials reached there when the stream
Environmental security, geological hazards and management© 2013 ISBN 978-84-616-2005-0
124
control works began, and in 1925 the water had already impacted 2 metres. That would mean that in 80 years it has only impacted other 2 times, which indicates that the water which has been coming down since then, it has done without bedload transport of importance, and in little quantity.
Therefore, the conclusion is that 80 year later, the great restoration which was carried out (the combination of repopulation and stream control works) not only keeps the torrent in its inactive state, preventing it from creating problems for the village again, but also maintains the beautiful and purely Pyrenean landscape, in which it is impossible to imagine either the state it was in less than a century ago, or the intelligent engineering needed to achieved it.
References
AZPEITIA, F., 1924. “El torrente Los Meses y su corrección hidrológico-forestal” España Forestal, nº 95, pp. 46-47.
AZPEITIA, F., 1924. “El torrente Los Meses y su corrección hidrológico-forestal (Conclusión)” España Forestal, nº 97, pp. 69-72.
CHAUVELIER, F., 1990. La repoblación forestal en la provincia de Huesca y sus impactos geográficos. Instituto de Estudios Altoaragoneses, Huesca.
DEYMIER, C.; TACNET, J.M. y MATHYS, N., 1995. Equipaments pour l’eau et l’environnenment. Études de Ceagref, Série Équipaments pour l’eau et l’environnement nº 18. Grenoble.
DVORÁK, J. y NOVÁCK, L. (Eds.), 1994. Soil Conservation and Silvicultura. Development in Soil Science 23. Elsevier Science Publishers. Praga
ERGENZINGER, P. y SCHMIDT, K.H. (Eds.), 1994. Dynamics and Geomorphology of Mountain Rivers. Springer-Verlag. Berlin
GARCÍA NÁJERA, J.M. y AYERBE VALLÉS, J.M., 1962 Principios de hidráulica torrencial: su aplicación a la corrección de torrentes. Corrección de aludes. Ministerio de Agricultura. Dirección General de Montes, Caza y Pesca Fluvial. Instituto forestal de Investigaciones y Experiencias. Madrid.
GARCÍA, J., 2001. Manual de cálculo de diques de corrección torrencial. Servicio de publicaciones de la E.T.S.I Montes. Madrid.
MEUNIER, M., 1991. Elements d’hydraulique torrententialle. Études de Cemagref, Série Montagne, nº 1. Grenoble.
SALAS, L. de, 2004. Regionalización de leyes IDF para el uso de modelos hidrometereológicos de estimaciones de caudales. Tesis Doctoral. Universidad Politécnica de Madrid.
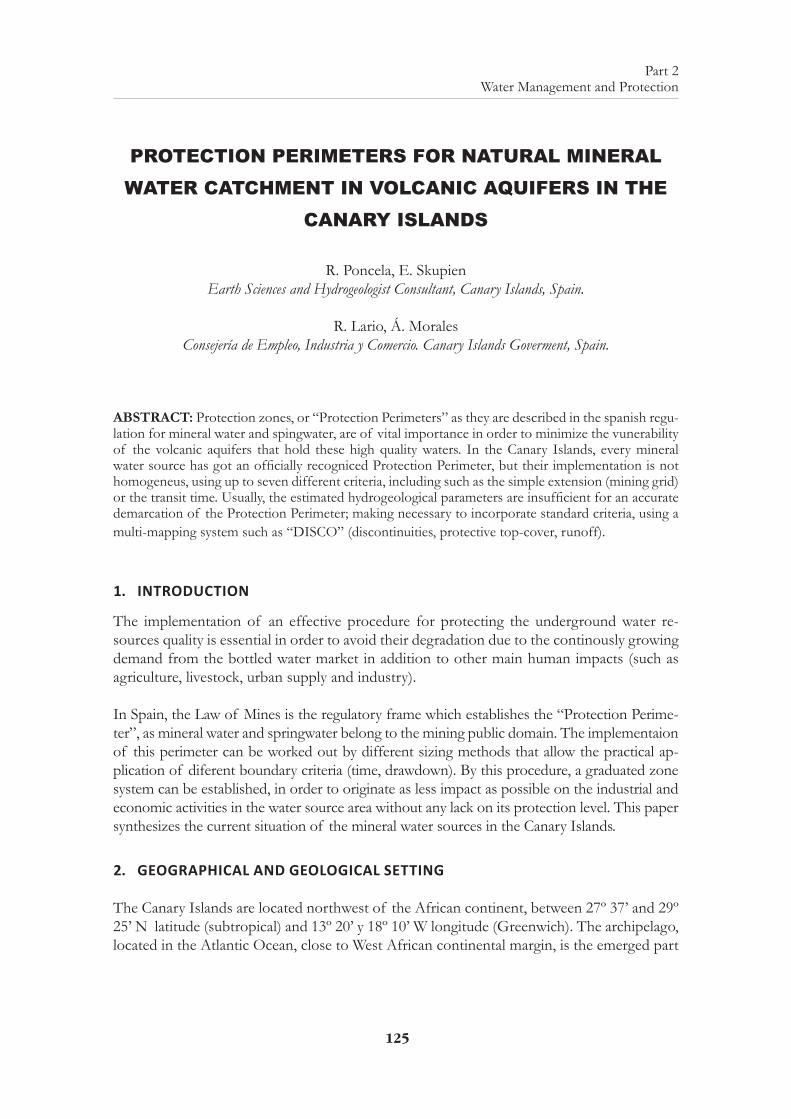
125
Part 2Water Management and Protection
PROTECTION PERIMETERS FOR NATURAL MINERAL WATER CATCHMENT IN VOLCANIC AQUIFERS IN THE
CANARY ISLANDS
R. Poncela, E. SkupienEarth Sciences and Hydrogeologist Consultant, Canary Islands, Spain.
R. Lario, Á. MoralesConsejería de Empleo, Industria y Comercio. Canary Islands Goverment, Spain.
ABSTRACT: Protection zones, or “Protection Perimeters” as they are described in the spanish regu-lation for mineral water and spingwater, are of vital importance in order to minimize the vunerability of the volcanic aquifers that hold these high quality waters. In the Canary Islands, every mineral water source has got an officially recogniced Protection Perimeter, but their implementation is not homogeneus, using up to seven different criteria, including such as the simple extension (mining grid) or the transit time. Usually, the estimated hydrogeological parameters are insufficient for an accurate demarcation of the Protection Perimeter; making necessary to incorporate standard criteria, using a multi-mapping system such as “DISCO” (discontinuities, protective top-cover, runoff).
1. INTRODUCTION
The implementation of an effective procedure for protecting the underground water re-sources quality is essential in order to avoid their degradation due to the continously growing demand from the bottled water market in addition to other main human impacts (such as agriculture, livestock, urban supply and industry).
In Spain, the Law of Mines is the regulatory frame which establishes the “Protection Perime-ter”, as mineral water and springwater belong to the mining public domain. The implementaion of this perimeter can be worked out by different sizing methods that allow the practical ap-plication of diferent boundary criteria (time, drawdown). By this procedure, a graduated zone system can be established, in order to originate as less impact as possible on the industrial and economic activities in the water source area without any lack on its protection level. This paper synthesizes the current situation of the mineral water sources in the Canary Islands.
2. GEOGRAPHICAL AND GEOLOGICAL SETTING
The Canary Islands are located northwest of the African continent, between 27º 37’ and 29º 25’ N latitude (subtropical) and 13º 20’ y 18º 10’ W longitude (Greenwich). The archipelago, located in the Atlantic Ocean, close to West African continental margin, is the emerged part
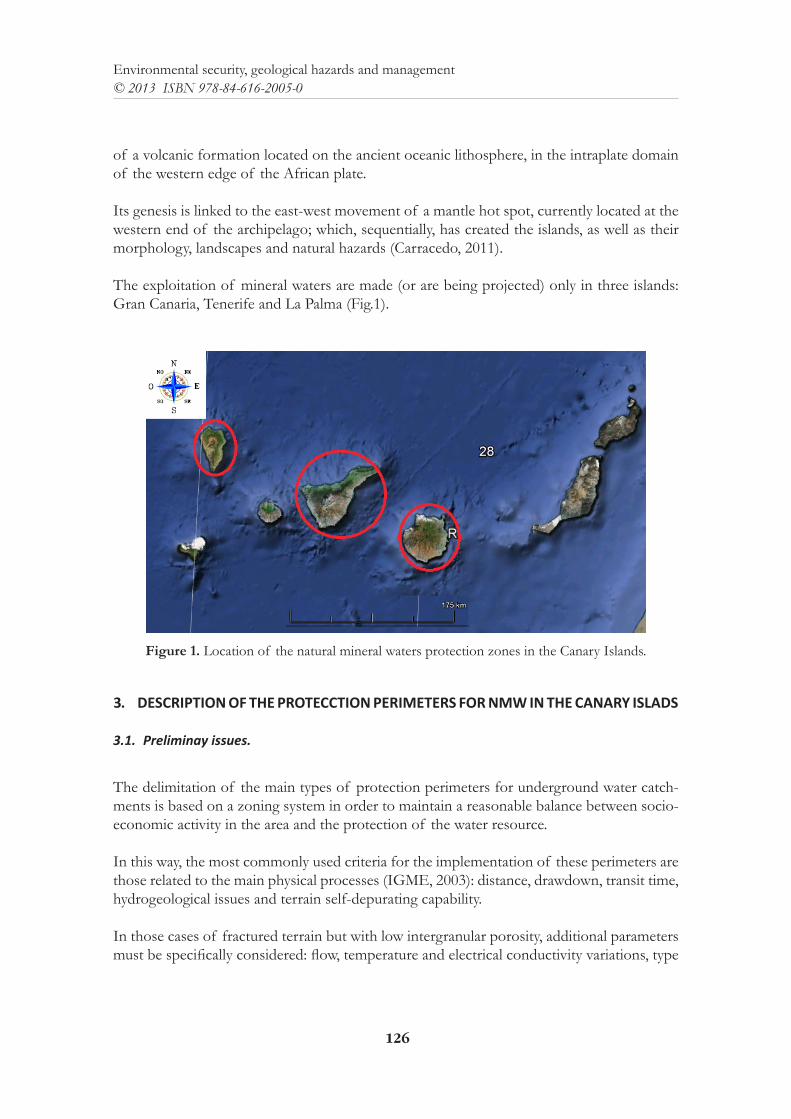
126
Environmental security, geological hazards and management© 2013 ISBN 978-84-616-2005-0
of a volcanic formation located on the ancient oceanic lithosphere, in the intraplate domain of the western edge of the African plate.
Its genesis is linked to the east-west movement of a mantle hot spot, currently located at the western end of the archipelago; which, sequentially, has created the islands, as well as their morphology, landscapes and natural hazards (Carracedo, 2011).
The exploitation of mineral waters are made (or are being projected) only in three islands: Gran Canaria, Tenerife and La Palma (Fig.1).
Figure 1. Location of the natural mineral waters protection zones in the Canary Islands.
3. DESCRIPTION OF THE PROTECCTION PERIMETERS FOR NMW IN THE CANARY ISLADS
3.1. Preliminay issues.
The delimitation of the main types of protection perimeters for underground water catch-ments is based on a zoning system in order to maintain a reasonable balance between socio-economic activity in the area and the protection of the water resource.
In this way, the most commonly used criteria for the implementation of these perimeters are those related to the main physical processes (IGME, 2003): distance, drawdown, transit time, hydrogeological issues and terrain self-depurating capability.
In those cases of fractured terrain but with low intergranular porosity, additional parameters must be specifically considered: flow, temperature and electrical conductivity variations, type
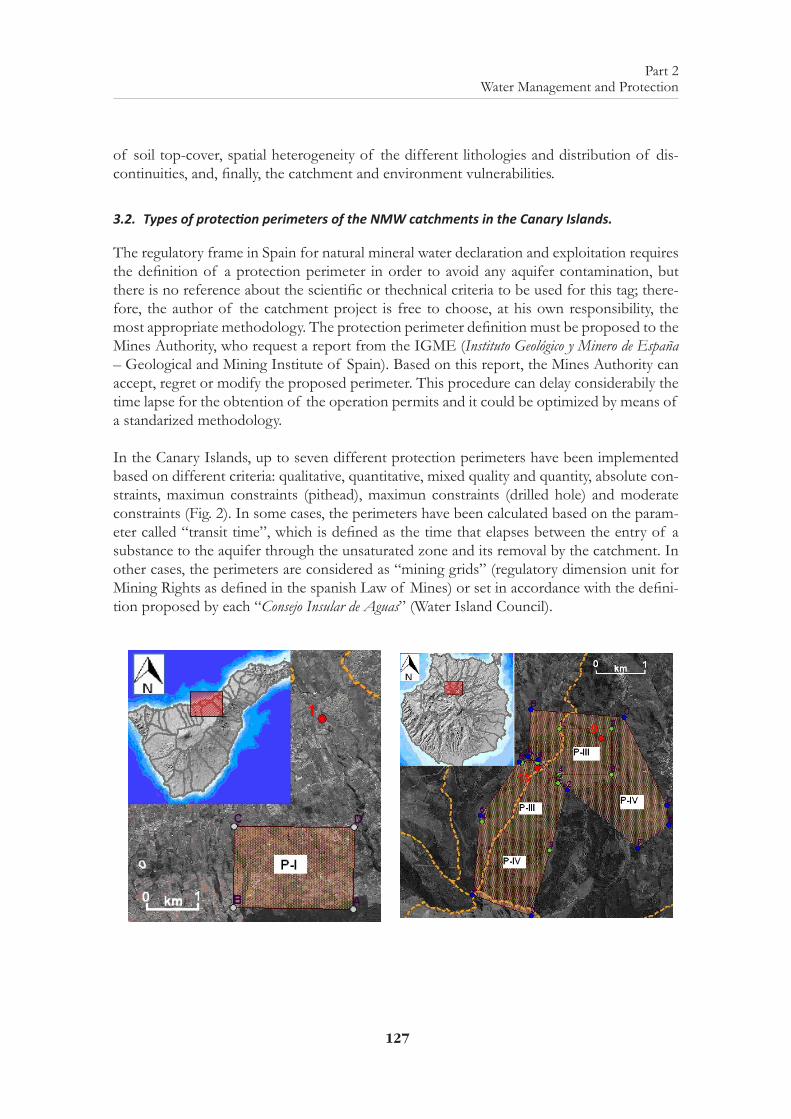
127
Part 2Water Management and Protection
of soil top-cover, spatial heterogeneity of the different lithologies and distribution of dis-continuities, and, finally, the catchment and environment vulnerabilities.
3.2. Types of protection perimeters of the NMW catchments in the Canary Islands.
The regulatory frame in Spain for natural mineral water declaration and exploitation requires the definition of a protection perimeter in order to avoid any aquifer contamination, but there is no reference about the scientific or thechnical criteria to be used for this tag; there-fore, the author of the catchment project is free to choose, at his own responsibility, the most appropriate methodology. The protection perimeter definition must be proposed to the Mines Authority, who request a report from the IGME (Instituto Geológico y Minero de España – Geological and Mining Institute of Spain). Based on this report, the Mines Authority can accept, regret or modify the proposed perimeter. This procedure can delay considerabily the time lapse for the obtention of the operation permits and it could be optimized by means of a standarized methodology.
In the Canary Islands, up to seven different protection perimeters have been implemented based on different criteria: qualitative, quantitative, mixed quality and quantity, absolute con-straints, maximun constraints (pithead), maximun constraints (drilled hole) and moderate constraints (Fig. 2). In some cases, the perimeters have been calculated based on the param-eter called “transit time”, which is defined as the time that elapses between the entry of a substance to the aquifer through the unsaturated zone and its removal by the catchment. In other cases, the perimeters are considered as “mining grids” (regulatory dimension unit for Mining Rights as defined in the spanish Law of Mines) or set in accordance with the defini-tion proposed by each “Consejo Insular de Aguas” (Water Island Council).
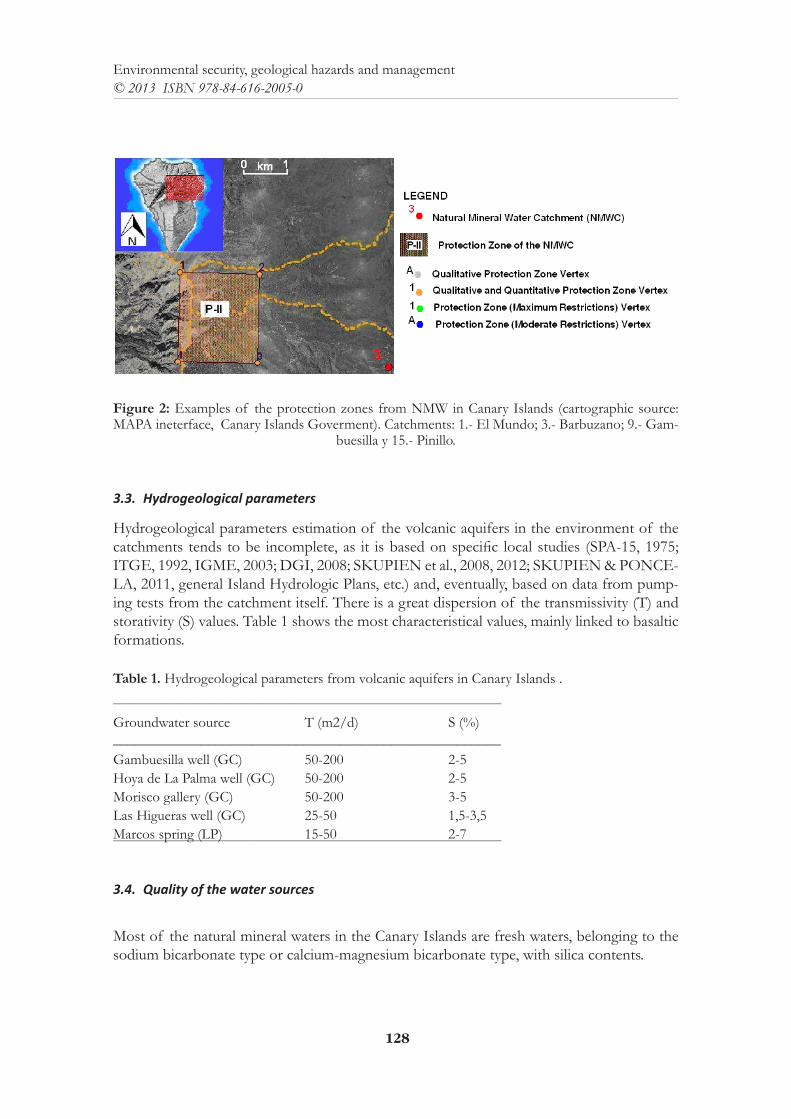
128
Environmental security, geological hazards and management© 2013 ISBN 978-84-616-2005-0
Figure 2: Examples of the protection zones from NMW in Canary Islands (cartographic source: MAPA ineterface, Canary Islands Goverment). Catchments: 1.- El Mundo; 3.- Barbuzano; 9.- Gam-
buesilla y 15.- Pinillo.
3.3. Hydrogeological parameters
Hydrogeological parameters estimation of the volcanic aquifers in the environment of the catchments tends to be incomplete, as it is based on specific local studies (SPA-15, 1975; ITGE, 1992, IGME, 2003; DGI, 2008; SKUPIEN et al., 2008, 2012; SKUPIEN & PONCE-LA, 2011, general Island Hydrologic Plans, etc.) and, eventually, based on data from pump-ing tests from the catchment itself. There is a great dispersion of the transmissivity (T) and storativity (S) values. Table 1 shows the most characteristical values, mainly linked to basaltic formations.
Table 1. Hydrogeological parameters from volcanic aquifers in Canary Islands ._________________________________________________________________________
Groundwater source T (m2/d) S (%) _____________________________________________________Gambuesilla well (GC) 50-200 2-5Hoya de La Palma well (GC) 50-200 2-5 Morisco gallery (GC) 50-200 3-5Las Higueras well (GC) 25-50 1,5-3,5Marcos spring (LP) 15-50 2-7_________________________________________________________________________
3.4. Quality of the water sources
Most of the natural mineral waters in the Canary Islands are fresh waters, belonging to the sodium bicarbonate type or calcium-magnesium bicarbonate type, with silica contents.
129
Part 2Water Management and Protection
3.5. Data bases
The local Goverment of the Canary Islands, through the Consejería de Empleo, Industria y Com-ercio (Department of Employment, Industry and Commerce), has implemented a GIS data base system in order to guarantee the integrity of the natural mineral waters exploited in its territory. This control system includes all the administrative and technical data for every catchment.
4. CONCLUSIONS
Each one of the 16 natural mineral water catchments in the Canary Islands has got its own protection perimeter, defined using scientifical but unhomogeneous methods.
In general, the chemical quality of the Canary natural mineral waters is excellent but hydro-geological parameters estimation is low, so highe detailed hydrogeological studies should be developed in the future.
All the collected information, added to the new studies should allow to overhaul the defini-tion and sizing of the present protection perimeters of volcanic aquifers in the Canary Is-lands, by means of a new multicriteria mapping model, “DISCO” (discontinuities, protective top-cover and runoff), based on homogeneus criteria.
BIBLIOGRAPHY
CARRACEDO, J.C. (2011). Geología de Canarias I: origen, evolución, edad y volcanismo. 398 pp. Madrid: Editorial Rueda, S.L.
DGI (2008). Caracterización hidrogeológica e hidrogeoquímica de las aguas minerales naturales de Canarias. 64 pp + anejo de fichas. Santa Cruz de Tenerife: Dirección General de Industria y Energía. Consejería de Industria y Nuevas Tecnologías. Internal report.
ITGE (1992). Jornadas de Aguas Minerales y Mineromedicinales en España. Colección Temas Ge-ológico-Mineros. 139 pp. Madrid.
IGME (2003). Perímetros de protección para captaciones de agua subterránea destinada al consumo humano. Metodología y aplicación al territorio. Autores: Martínez, C. y García, A. Serie: Hidroge-ología y Aguas subterráneas, nº 10. 273 pp. Madrid: Ed. IGME.
SPA-15 (1975). Estudio científico de los recursos de agua en las Islas Canarias. SPA/69/515. Minist. Obr. Públ. Dir. Gral. Obr. Hidrául. UNESCO. Madrid-Las Palmas.
Skupien Balon, E., Morales González-Moro, A. & Poncela Poncela, R. (2008). Caracterización hi-drogeológica e hidroquímica de las aguas minerales naturales de Canarias. In López Geta, J.A.; Loredo Pérez, J.; Fernández Ruiz, L. y Pernia Llera, J.Mª. (Eds.), Investigación y gestión de los recursos del subsuelo. Libro homenaje al Profesor Fernando Pendás Fernández. Publicaciones del instituto Geológico y Minero de España. Serie Hidrogeología y Aguas subterráneas (27): 865-880. ISBN: 978-84-7840-773-6. Madrid.
Skupien Balon, E.; Poncela Poncela, R. (2011). Características hidrogeológicas, químicas e isotópicas del agua subterránea del acuífero volcánico de las vertientes en el entorno de los nacientes Marcos y Cordero (La Palma, Islas Canarias). In Cabrera, M.C.; Jiménez, J. y Custodio, E. (eds.), El cono-

130
Environmental security, geological hazards and management© 2013 ISBN 978-84-616-2005-0
cimiento de los recursos hídricos en Canarias cuatro décadas después del proyecto SPA-15. Homenaje póstumo al Dr. Ingeniero D. José Sáenz de Oiza, 87-92. ISBN: 978-84-938-46-0-2. Madrid.
Skupien Balon, E., Poncela Poncela, R., Morales González-Moro, A. & Lario Báscones, R. (2012). Aguas minerales naturales en terrenos volcánicos del Archipiélago de canarias. Proc. Workshop: estudio, gestión y aprovechamiento del agua en islas y terrenos volcánicos. Tenerife, 28 y 29 de noviembre. Santa Cruz de Tenerife. In press.
131
Part 2Water Management and Protection
PROTECTING AND RESTORING GRAN CANARIA ISLAND’S WATERSHED. LAUREL FOREST REFORESTATION IN LOS
TILOS DE MOYA
Naranjo Borges, J.Dirección General de Ordenación del Territorio. Consejería de Obras Públicas, Transporte y Ordenación
del Territorio. Gobierno de Canairas.
ABSTRACT: The Special Nature Reserve Los Tilos de Moya represents the most important relic of laurel forest in Gran Canaria. With an area of 91.5 hectares, it occupies a stretch of about two kilome-tres of a ravine with steep slopes and narrow bottom. The most important species of this space is the stinkwood (Ocotea foetens). Other tree species of the laurel forest, present in this protected area, are the Canary laurel (Laurus novocanariensis), the heather (Erica arborea) and the Canary holly (Ilex canariensis). We find a typical Mediterranean climate with the rainy season during autumn and winter in it. In the laurel forest, the occurrence of dew and mist is necessary for the survival of plants.
In 2008 and 2009, there were 2.5 hectares planted and 1.8 km of new forest paths reconditioned. The foresters were hired over the employment scheme “Environmental activities in the north of Gran Canaria”, promoted by the City Council of Villa de Moya, and which provided a year training and em-ployment for 30 local people each year. Not only specimens of 12 different native tree species were planted, but also specimens of the endangered flora as Isoplexis chalcantha, Sideritis discolor, Scrophularia calliantha or Solanum vespertilio ssp. doramae
1. SPECIAL NATURE RESERVE
The Special Nature Reserve Los Tilos de Moya is located in the Doramas Rural Park in the north of Gran Canaria. This protected area represents the most important relic of laurel forest in Gran Canaria, vestige of the called Doramas Forest which, 500 years ago, extended across the north side of the island. With an area of 91.5 hectares, it occupies a stretch of about two kilometers of the Barranco del Laurel. This is a ravine with steep slopes and narrow bottom, extending roughly between 500 and 800 metres above sea level (Figure 1). In this area there is a strong influence of the cloud layer which clashes directly with the covering vegetation of the hillsides, causing the horizontal rainfall, it becomes an important source of water in the area. Thirty years ago, water flowed through the ravine in the form of stream, but now the course is piped, with the consequent loss of the willow forest that formed on the banks of the stream.
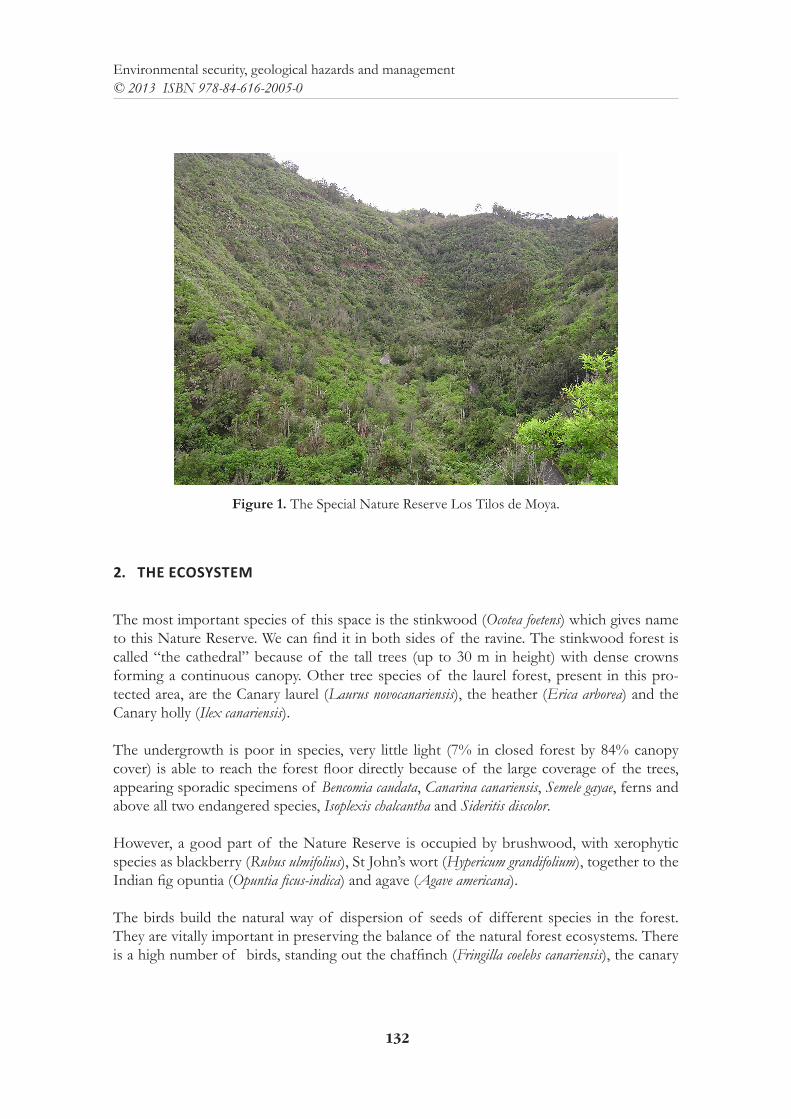
132
Environmental security, geological hazards and management© 2013 ISBN 978-84-616-2005-0
Figure 1. The Special Nature Reserve Los Tilos de Moya.
2. THE ECOSYSTEM
The most important species of this space is the stinkwood (Ocotea foetens) which gives name to this Nature Reserve. We can find it in both sides of the ravine. The stinkwood forest is called “the cathedral” because of the tall trees (up to 30 m in height) with dense crowns forming a continuous canopy. Other tree species of the laurel forest, present in this pro-tected area, are the Canary laurel (Laurus novocanariensis), the heather (Erica arborea) and the Canary holly (Ilex canariensis).
The undergrowth is poor in species, very little light (7% in closed forest by 84% canopy cover) is able to reach the forest floor directly because of the large coverage of the trees, appearing sporadic specimens of Bencomia caudata, Canarina canariensis, Semele gayae, ferns and above all two endangered species, Isoplexis chalcantha and Sideritis discolor.
However, a good part of the Nature Reserve is occupied by brushwood, with xerophytic species as blackberry (Rubus ulmifolius), St John’s wort (Hypericum grandifolium), together to the Indian fig opuntia (Opuntia ficus-indica) and agave (Agave americana).
The birds build the natural way of dispersion of seeds of different species in the forest. They are vitally important in preserving the balance of the natural forest ecosystems. There is a high number of birds, standing out the chaffinch (Fringilla coelebs canariensis), the canary
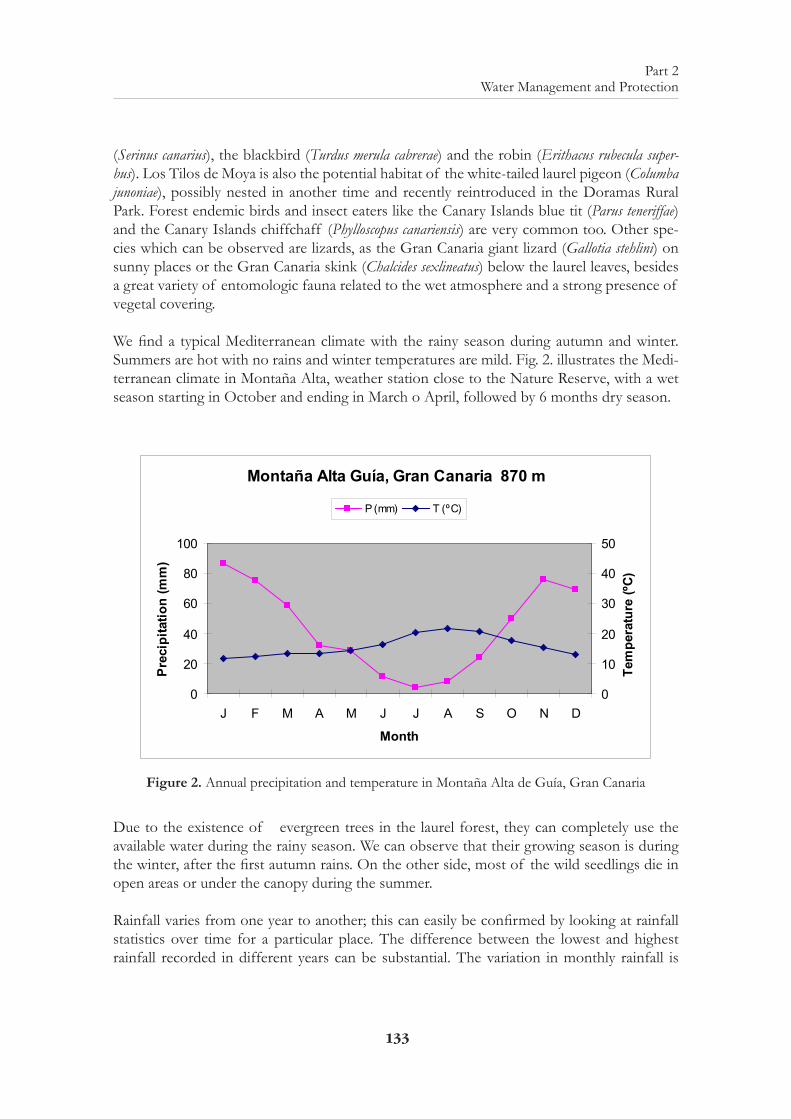
133
Part 2Water Management and Protection
(Serinus canarius), the blackbird (Turdus merula cabrerae) and the robin (Erithacus rubecula super-bus). Los Tilos de Moya is also the potential habitat of the white-tailed laurel pigeon (Columba junoniae), possibly nested in another time and recently reintroduced in the Doramas Rural Park. Forest endemic birds and insect eaters like the Canary Islands blue tit (Parus teneriffae) and the Canary Islands chiffchaff (Phylloscopus canariensis) are very common too. Other spe-cies which can be observed are lizards, as the Gran Canaria giant lizard (Gallotia stehlini) on sunny places or the Gran Canaria skink (Chalcides sexlineatus) below the laurel leaves, besides a great variety of entomologic fauna related to the wet atmosphere and a strong presence of vegetal covering.
We find a typical Mediterranean climate with the rainy season during autumn and winter. Summers are hot with no rains and winter temperatures are mild. Fig. 2. illustrates the Medi-terranean climate in Montaña Alta, weather station close to the Nature Reserve, with a wet season starting in October and ending in March o April, followed by 6 months dry season.
Montaña Alta Guía, Gran Canaria 870 m
0
20
40
60
80
100
J F M A M J J A S O N D
Month
Prec
ipita
tion
(mm
)
0
10
20
30
40
50
Tem
pera
ture
(ºC)
P (mm) T (ºC)
Figure 2. Annual precipitation and temperature in Montaña Alta de Guía, Gran Canaria
Due to the existence of evergreen trees in the laurel forest, they can completely use the available water during the rainy season. We can observe that their growing season is during the winter, after the first autumn rains. On the other side, most of the wild seedlings die in open areas or under the canopy during the summer.
Rainfall varies from one year to another; this can easily be confirmed by looking at rainfall statistics over time for a particular place. The difference between the lowest and highest rainfall recorded in different years can be substantial. The variation in monthly rainfall is
134
Environmental security, geological hazards and management© 2013 ISBN 978-84-616-2005-0
even greater. Variation in rainfall is important to forestry activities, because when the rains fail, newly-established forest plantations suffer. The planting season coincides with the rainy season. Usually, planting is started as soon as a specified quantity of rain has fallen. Plant-ing can also be initiated when the soil is wet to a specified depth (approximately 20 cm). If planting is started too late, the plants will lose the maximum benefit of rains, and this can be a serious problem where the rainfall is low and erratic. October seems to be the best month for the beginning of plantations, nevertheless some watering may be necessary if the rains haven’t started.
Although rainfall and temperature are the primary factors upon which aridity is based, other factors have an influence. The moisture in the air has importance for the water balance in the soil. When the moisture content in the soil is higher than in the air, there is a tendency for water to evaporate into the air. In the laurel forest, the occurrence of dew and mist is neces-sary for the survival of plants. Dew is the result of condensation of water vapor from the air onto surfaces during the night. Water that is collected on the leaves of plants in the form of dew can fall onto the ground and contribute to soil moisture. The presence of dew and mist leads to higher humidity in the air and reduce evapotranspiration.
3. REFORESTATION AND OTHER ACTIVITIES
The Regional Government of the Canary Islands planted about 15 hectares in the 80s; a third of them have created a new forest nowadays. It planted on some lower slopes, in canopy gaps and in the last public agricultural areas existing in the reserve. The plants came first from La Gomera. After that, the forest department established a small temporary nurs-ery near the planting site to produce good quality seedlings at a reasonable cost. The seeds were collected by the foresters in the nature reserve or in some other areas of Gran Canaria. Thirty years ago, there was not enough specific knowledge about quality, collection, storage, treatment and viability of tree seeds. Nevertheless, specimens of Erica arborea, Morella faya, Ilex canariensis, Arbutus canariensis (Canary strawberry tree), Picconia excelsa, Laurus novocanar-iensis, Apollonias barbujana (Canary ebony), Persea indica (Canary mahogany), Ocotea foetens and Rhamnus glandulosa were planted. At present we can find trees up to 15 m tall.
The Nature Reserve has a land use regulation since 2005, when the management plan was approved. The regional government prepares management plans to guide how a protected area will be managed at least over the next five years. The plan sets out objectives and strate-gies for conservation, development and operation of a protected area. A management plan relies on current information relating such subjects as natural values, cultural values and recreation opportunities. The process for preparing a management plan involves a careful analysis of the overall goals of the protected area, use patterns, management objectives, and possible sources of conflict among protected area policies. Through the planning process, various options for managing the protected area are developed and assessed. In choosing the most appropriate option, the intent is to reach a balance between protecting natural values
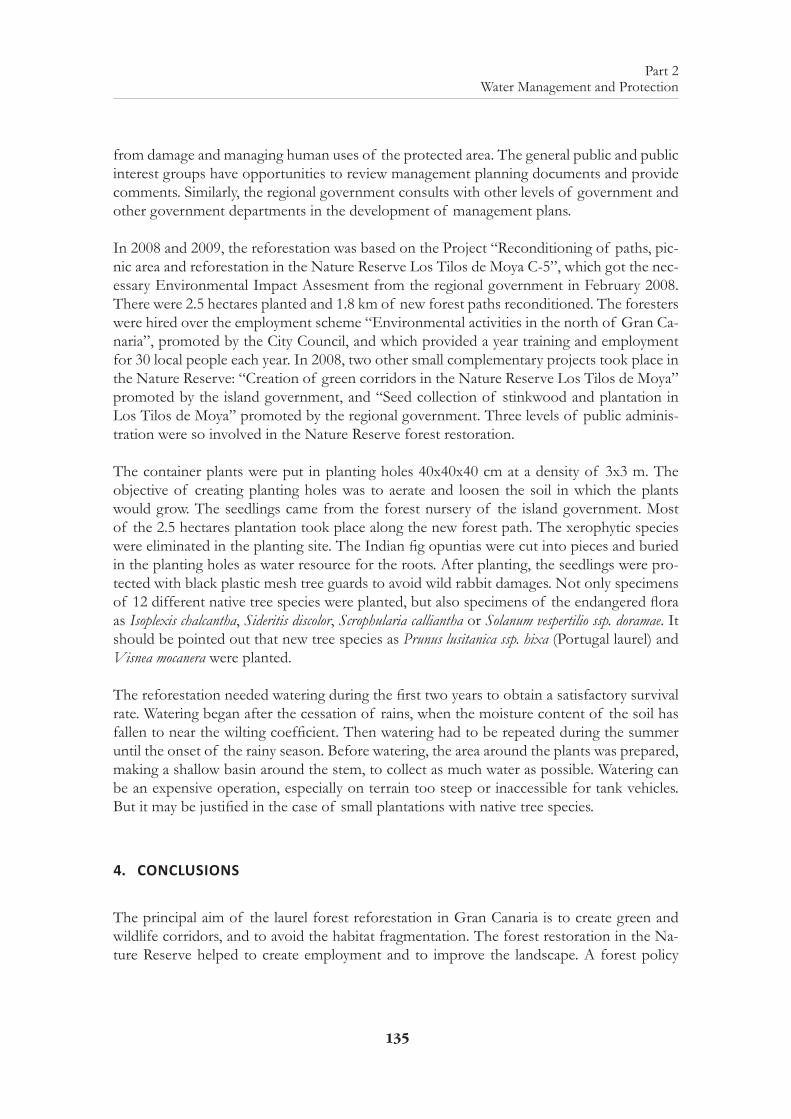
135
Part 2Water Management and Protection
from damage and managing human uses of the protected area. The general public and public interest groups have opportunities to review management planning documents and provide comments. Similarly, the regional government consults with other levels of government and other government departments in the development of management plans.
In 2008 and 2009, the reforestation was based on the Project “Reconditioning of paths, pic-nic area and reforestation in the Nature Reserve Los Tilos de Moya C-5”, which got the nec-essary Environmental Impact Assesment from the regional government in February 2008. There were 2.5 hectares planted and 1.8 km of new forest paths reconditioned. The foresters were hired over the employment scheme “Environmental activities in the north of Gran Ca-naria”, promoted by the City Council, and which provided a year training and employment for 30 local people each year. In 2008, two other small complementary projects took place in the Nature Reserve: “Creation of green corridors in the Nature Reserve Los Tilos de Moya” promoted by the island government, and “Seed collection of stinkwood and plantation in Los Tilos de Moya” promoted by the regional government. Three levels of public adminis-tration were so involved in the Nature Reserve forest restoration.
The container plants were put in planting holes 40x40x40 cm at a density of 3x3 m. The objective of creating planting holes was to aerate and loosen the soil in which the plants would grow. The seedlings came from the forest nursery of the island government. Most of the 2.5 hectares plantation took place along the new forest path. The xerophytic species were eliminated in the planting site. The Indian fig opuntias were cut into pieces and buried in the planting holes as water resource for the roots. After planting, the seedlings were pro-tected with black plastic mesh tree guards to avoid wild rabbit damages. Not only specimens of 12 different native tree species were planted, but also specimens of the endangered flora as Isoplexis chalcantha, Sideritis discolor, Scrophularia calliantha or Solanum vespertilio ssp. doramae. It should be pointed out that new tree species as Prunus lusitanica ssp. hixa (Portugal laurel) and Visnea mocanera were planted.
The reforestation needed watering during the first two years to obtain a satisfactory survival rate. Watering began after the cessation of rains, when the moisture content of the soil has fallen to near the wilting coefficient. Then watering had to be repeated during the summer until the onset of the rainy season. Before watering, the area around the plants was prepared, making a shallow basin around the stem, to collect as much water as possible. Watering can be an expensive operation, especially on terrain too steep or inaccessible for tank vehicles. But it may be justified in the case of small plantations with native tree species.
4. CONCLUSIONS
The principal aim of the laurel forest reforestation in Gran Canaria is to create green and wildlife corridors, and to avoid the habitat fragmentation. The forest restoration in the Na-ture Reserve helped to create employment and to improve the landscape. A forest policy
Environmental security, geological hazards and management© 2013 ISBN 978-84-616-2005-0
136
seems to be necessary for the maintenance of the plantations and paths in order to contrib-ute to expand the habitat, to increase the numbers of visitors and to help the local economy in the future.
REFERENCES
AGRESTA S.L. 2006. Acondicionamiento de senderos, merendero y repoblación forestal en la Reserva Natural Especial Los Tilos de Moya (C-5). Proyecto Interreg IIIB Açores-Madeira-Canarias Sostenp 03/Mac/1.2/C2. Islas Canarias. Gobierno de Canarias.
ARÉVALO, J.R. & FERNÁNDEZ-PALACIOS, J.M. 1999. Tree regeneration and future dynamics of the laurel forest on Tenerife, Canary Islands. Journal of Vegetation Science 10: 861-868.
ARÉVALO, J.R. & FERNÁNDEZ-PALACIOS, J.M. 2007. Treefall gaps and regeneration composition in the laurel foresto f Anaga (Tenerife): a matter of size? Plant Ecol 188: 133-143.
CABILDO DE GRAN CANARIA 2009. Special Nature Reserve Los Tilos de Moya. Way to The laurisilva. Information brochure.
FOOD AND AGRICULTURE ORGANIZATION OF THE UNITED NATIONS (FAO). 1989. Arid zone forestry. A guide for field technicians. FAO Conservation Guide 20. Rome, Italy.
GOBIERNO DE CANARIAS 2005. Plan Director de la Reserva Natural Especial de los Tilos de Moya. (BOC Nº 160, miércoles 17 de agosto de 2005).
GREIG, D. 1997. The little green dictionary of the language of forests. Kangaroo Press Pty Ltd. Australia. NARANJO BORGES, J. 1994. Die Entwicklung von jungen Lauraceen bei unterschiedlichen Wuchsbedingungen
auf der Insel Gran Canaria. Göttinger Beiträge zur Land- und Forstwirtschaft in den Tropen und Subtropen. Heft 91.
137
Part 2Water Management and Protection
CHANGES OF THE ENVIRONMENTAL CONDITIONS AT LAKE FERTŐ, HUNGARY
T. Bazsó, G. Király & I. MárkusDepartment of Surveying and Remote Sensing, Institute of Geomatics and Civil Engineering, Faculty of
Forestry, University of West Hungary, Sopron, Hungary
ABSTRACT: The Lake Fertő is spreading along the border between Hungary and Austria. The lake basin covers a total area of 321 km² at the boundary line of 116,00 m above Adriatic Sea level(Bácsatyai et al. 1997). It is valuable nature conservation area and its cultural history is also sig-nificant. The Lake Fertő is a shallow continental steppe lake. The unique feature of Lake Fertő is its wide reedbelt, which significantly impacts the water balance and the water quality of the lake. The area occupied by the reed was impacted by the changes of the water level of the lake over the past centuries. In the 20th century the lake bed became heavily covered with reed, mostly because of the regulation works with the building of dams and the construction of channels. It is important for the future to measure and document the changes of the land cover at the lake and the water level-volume ratio. Historical maps and exact measurements of the past decades provide assistance and informa-tion for the researchers. The project GENESEE (New surveying of Lake Fertő and Hanság channel) started in 2011 with the cooperation of Hungary and Austria. The aim of the project is to create a uniform map database which will be a base for future researches and provide guidance for environ-mental protection, sustainable tourism and reed production. The project uses modern techniques (airborne laser scanning, ultrasonic surveys) for an accurate terrain model. Beside these techniques the traditional surveying methods are very important for the data collection. In this project we have made the field surveying of the lake bank and the cross-sections of the channels, which are unsolv-able with the modern technics.
1. INTRODUCTION
Lake Fertő (Hungarian: Fertő tó, German: Neusiedler See) is spreading along the border between Hungary and Austria. It is located where two larger geological formations (Alpines and Little Hungarian Plain belonging to the Pannonian Basin) meet. From north to south, the lake is about 36 km long, and it varies between 6 km and 12 km in widths from east to west (Figure 1).
Lake Fertő is the most westerly located continental steppe lake. In the past 100 years the lake bed has become heavily covered with reed. More than three quarter of the area in Hungary is covered by thick reed. In between the reed there are so called internal lakes, which are isolated from the open water. The water quality of the open water and the water among the reed are markedly different.
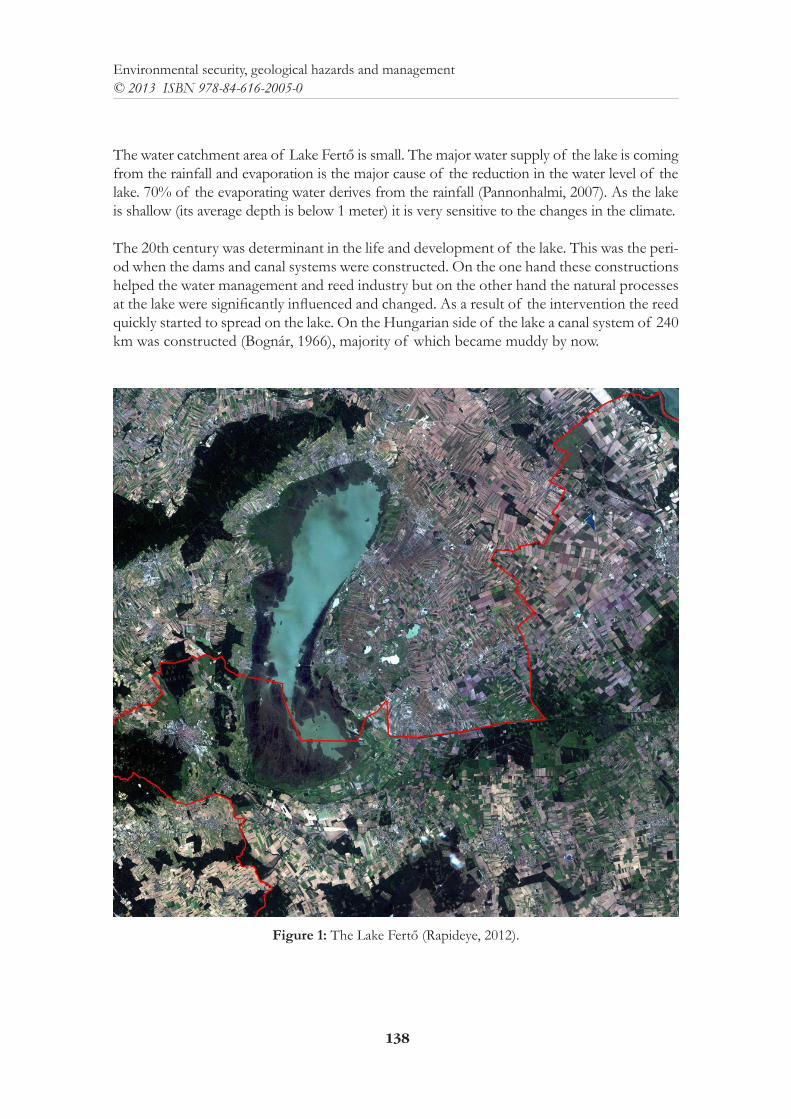
138
Environmental security, geological hazards and management© 2013 ISBN 978-84-616-2005-0
The water catchment area of Lake Fertő is small. The major water supply of the lake is coming from the rainfall and evaporation is the major cause of the reduction in the water level of the lake. 70% of the evaporating water derives from the rainfall (Pannonhalmi, 2007). As the lake is shallow (its average depth is below 1 meter) it is very sensitive to the changes in the climate.
The 20th century was determinant in the life and development of the lake. This was the peri-od when the dams and canal systems were constructed. On the one hand these constructions helped the water management and reed industry but on the other hand the natural processes at the lake were significantly influenced and changed. As a result of the intervention the reed quickly started to spread on the lake. On the Hungarian side of the lake a canal system of 240 km was constructed (Bognár, 1966), majority of which became muddy by now.
Figure 1: The Lake Fertő (Rapideye, 2012).
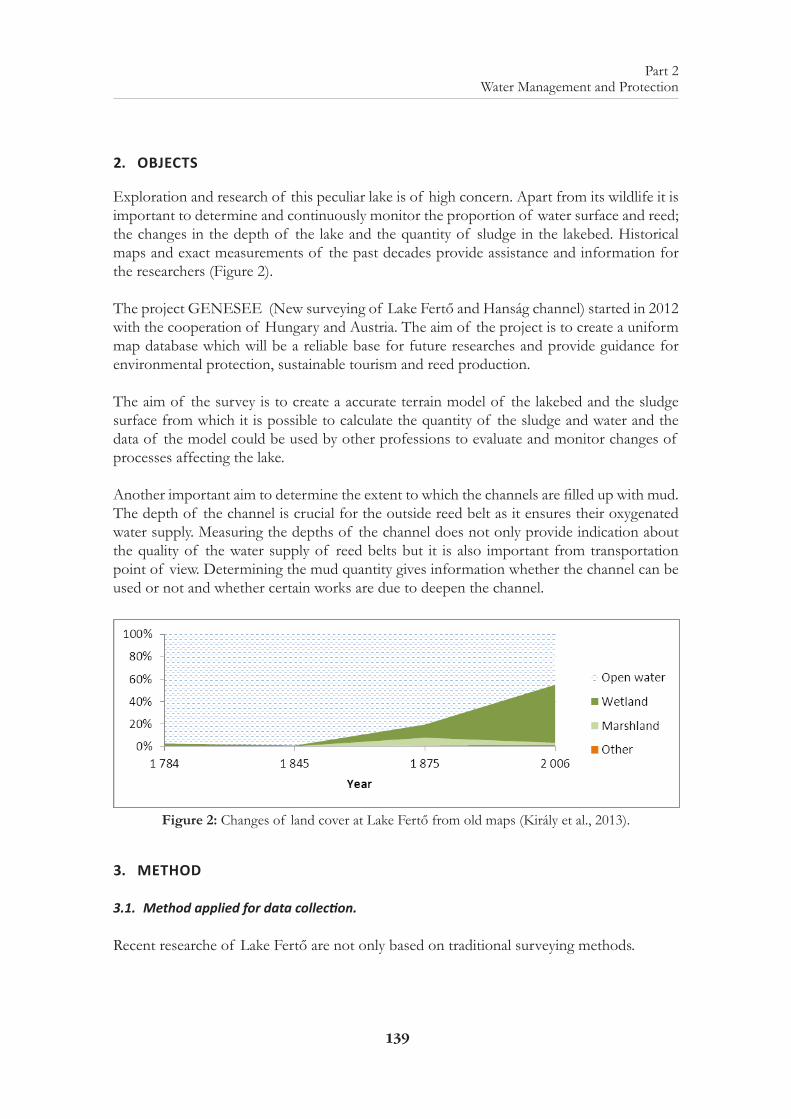
139
Part 2Water Management and Protection
2. OBJECTS
Exploration and research of this peculiar lake is of high concern. Apart from its wildlife it is important to determine and continuously monitor the proportion of water surface and reed; the changes in the depth of the lake and the quantity of sludge in the lakebed. Historical maps and exact measurements of the past decades provide assistance and information for the researchers (Figure 2).
The project GENESEE (New surveying of Lake Fertő and Hanság channel) started in 2012 with the cooperation of Hungary and Austria. The aim of the project is to create a uniform map database which will be a reliable base for future researches and provide guidance for environmental protection, sustainable tourism and reed production.
The aim of the survey is to create a accurate terrain model of the lakebed and the sludge surface from which it is possible to calculate the quantity of the sludge and water and the data of the model could be used by other professions to evaluate and monitor changes of processes affecting the lake.
Another important aim to determine the extent to which the channels are filled up with mud. The depth of the channel is crucial for the outside reed belt as it ensures their oxygenated water supply. Measuring the depths of the channel does not only provide indication about the quality of the water supply of reed belts but it is also important from transportation point of view. Determining the mud quantity gives information whether the channel can be used or not and whether certain works are due to deepen the channel.
Figure 2: Changes of land cover at Lake Fertő from old maps (Király et al., 2013).
3. METHOD
3.1. Method applied for data collection.
Recent researche of Lake Fertő are not only based on traditional surveying methods.
140
Environmental security, geological hazards and management© 2013 ISBN 978-84-616-2005-0
The unique feature of mapping is performed by using different techniques, on the same areas, hence at the end the result of the different techniques can be compared. There are modern technologies such as laser scanning and ultrasonic surveys, which are advanced tech-nologies, but it is still required to have control measurements performed by field surveys. Survey with the modern techniques will result in significantly more data, from which a more precise surface model can be derived.
Using airborne laser scanning (ALS) we can obtain high precision data quickly, covering large ar-eas but only about the surface of the land. This technique cannot be used below the water surface.
Effective mapping of the lakebed and the mud surface can be done from a boat using ultra-sonic surveys.
These techniques might not be used appropriately on certain terrains due to obstacles (e.g.: reed boarders, channels) and due to the difficulty in physically getting to the area.
Due to these reasons and due to the importance of reference measurements, field surveys still play an important role even if carrying out these surveys are very time consuming.
3.2. Single points measurements
Our department at the university use an equipment for the single point measurements which was first used in the former project (Bácsatyai et al. 1997). The equipment was further devel-oped to suit even more our purposes.
The base structure of the equipment used for measuring the lakebed and the mud surface, was not changed, only the reading and registration of data became automatic using a signal system based on magnetic principle.
The operation of the equipment is as follows: the operator pushes the equipment (basically a pole) into the mud layer till the solid mineral surface is reached.
With the help of a disc sliding on the pole it is possible to measure the thickness of the mud layer by lowering the disc to the surface of the mud (this is the distance between the mineral surface and the mud surface).
We integrated an RTK GPS receiver to the instrument which provides the vertical and hori-zontal coordinates of the mineral surface.
Due to the nature of the technique it is more appropriate to call the measured thickness as penetrable thickness instead of absolute mud thickness as we might not reach the very bot-tom of the lakebed. The penetrable thickness is proved to be close to the absolute mud thick-ness based on control measurements (soil sampling). The difference is below 10 cm. With the help of a disc we can read the thickness of the mud layer and the depth of the water.
141
Part 2Water Management and Protection
3.3. Instruments used during the measurements
• RTK receiver pair that belong to the Leica GPS1200 instrument family (3D position)
• SATELLINE-EASy Pro 35W URH modem (communication between the instruments)
• THALES MobileMapper CE (navigation)
• Equipment for measuring the mud thickness – MUD POLE (measurement of the mi-neral surface, the mud thickness and the depth of the water)
3.4. Calibration
Due to the fact that we have not used a certified equipment, we considered it important to perform calibrating measurements of the equipment before the commencement of the fi-nal/real measurements.
With the calibrating measurements we tried to get an answer whether the equipment (pole) can be pushed down to the actual mineral lakebed and whether the disc can be lowered down to the very surface of the mud. The accuracy of pushing the equipment till the actual mineral surface depends on the diameter and sharpness of the rod. The punctuality of lowering the disc to the mud surface depends on the size of the disc.
During the calibration process we took a soil sample and determined the thickness of the mud layer then we compared this to the measurement of our equipment.
Apart from this we repeated the measurement with a thinner and sharper pole (stake out pole) as well.
We could check the sinking of the disc by hand.
3.5. Surveying
Our survey covered the 51 km long channel system and 65 km section along the border of the water and reed area. Measurements needed to be made in every 100-200 meter.
When analysing the sections of the channels we have considered the shape of the channel, the sediment previously deposited to the bank.
The channels were constructed with a trapezoidal shape. The sediment deposited on the banks of the channel which represents a small dam built between the channel and the adja-cent area. We have measured minimum 9 points in every section.
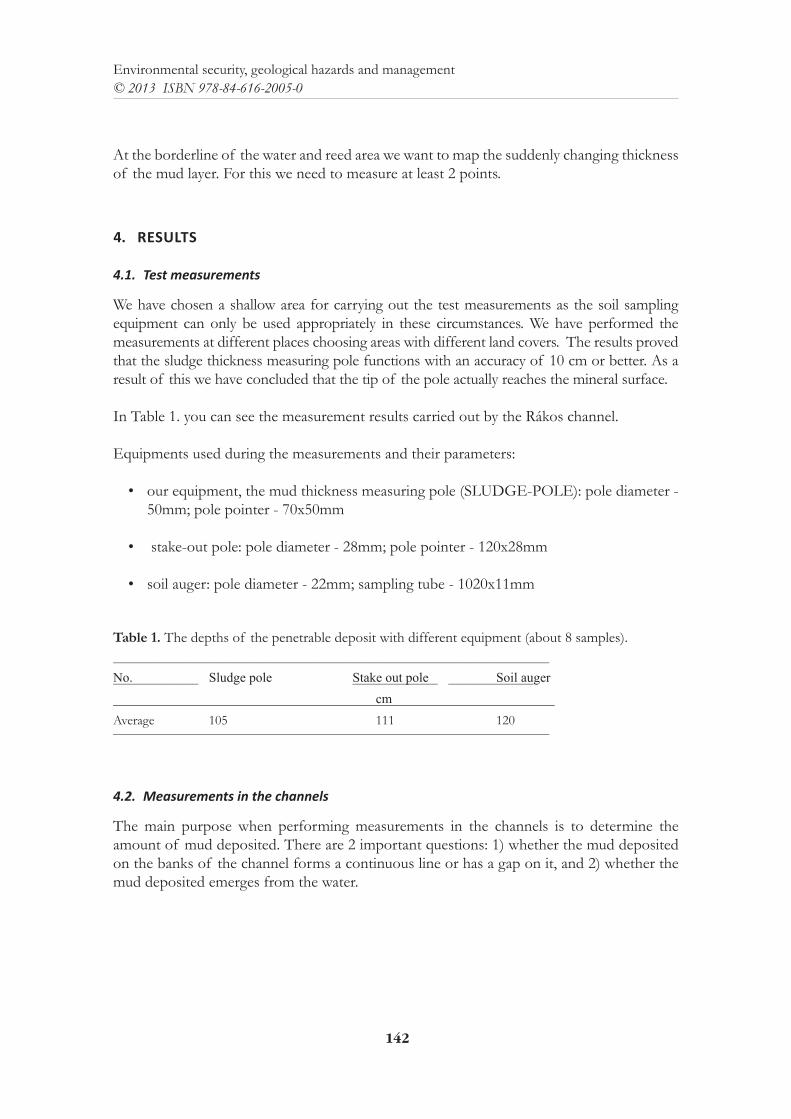
142
Environmental security, geological hazards and management© 2013 ISBN 978-84-616-2005-0
At the borderline of the water and reed area we want to map the suddenly changing thickness of the mud layer. For this we need to measure at least 2 points.
4. RESULTS
4.1. Test measurements
We have chosen a shallow area for carrying out the test measurements as the soil sampling equipment can only be used appropriately in these circumstances. We have performed the measurements at different places choosing areas with different land covers. The results proved that the sludge thickness measuring pole functions with an accuracy of 10 cm or better. As a result of this we have concluded that the tip of the pole actually reaches the mineral surface.
In Table 1. you can see the measurement results carried out by the Rákos channel.
Equipments used during the measurements and their parameters:
• our equipment, the mud thickness measuring pole (SLUDGE-POLE): pole diameter - 50mm; pole pointer - 70x50mm
• stake-out pole: pole diameter - 28mm; pole pointer - 120x28mm
• soil auger: pole diameter - 22mm; sampling tube - 1020x11mm
Table 1. The depths of the penetrable deposit with different equipment (about 8 samples).__________________________________________________________________________________
No. Sludgepole Stakeoutpole Soilauger________________ ________________ ________________
cm ___________________________________________________________________________________
Average 105 111 120 __________________________________________________________________________________
4.2. Measurements in the channels
The main purpose when performing measurements in the channels is to determine the amount of mud deposited. There are 2 important questions: 1) whether the mud deposited on the banks of the channel forms a continuous line or has a gap on it, and 2) whether the mud deposited emerges from the water.
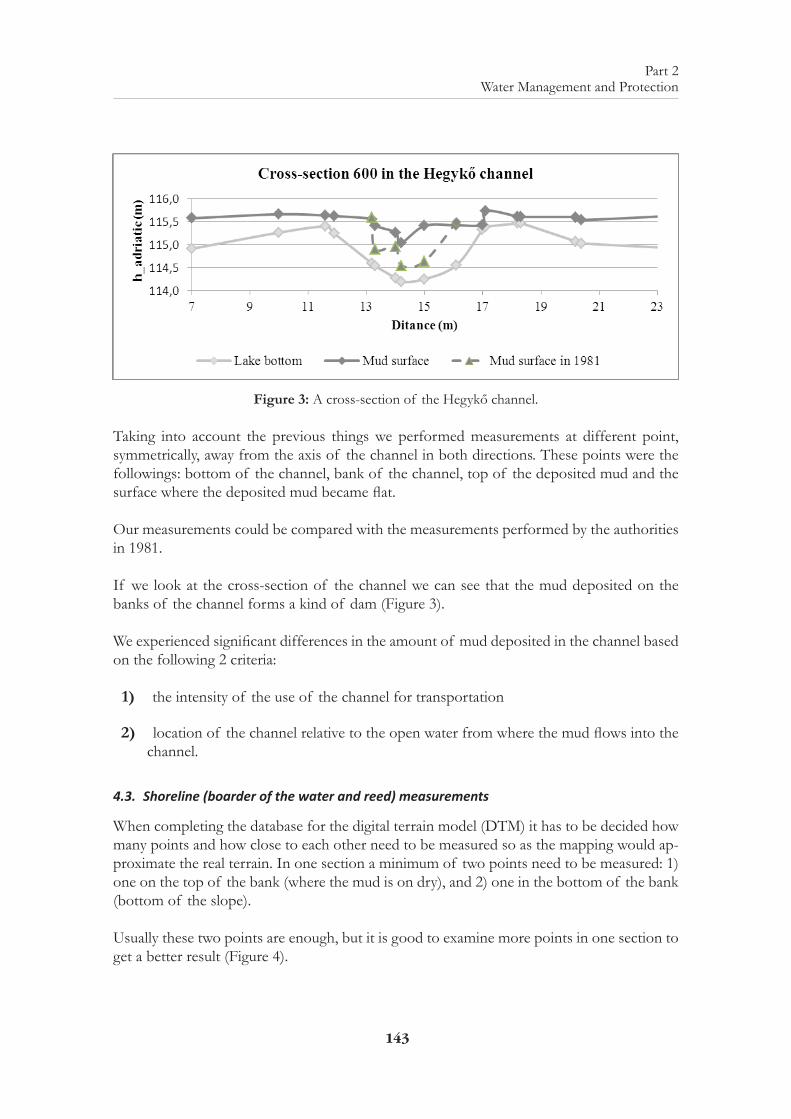
143
Part 2Water Management and Protection
Figure 3: A cross-section of the Hegykő channel.
Taking into account the previous things we performed measurements at different point, symmetrically, away from the axis of the channel in both directions. These points were the followings: bottom of the channel, bank of the channel, top of the deposited mud and the surface where the deposited mud became flat.
Our measurements could be compared with the measurements performed by the authorities in 1981.
If we look at the cross-section of the channel we can see that the mud deposited on the banks of the channel forms a kind of dam (Figure 3).
We experienced significant differences in the amount of mud deposited in the channel based on the following 2 criteria:
1) the intensity of the use of the channel for transportation
2) location of the channel relative to the open water from where the mud flows into the channel.
4.3. Shoreline (boarder of the water and reed) measurements
When completing the database for the digital terrain model (DTM) it has to be decided how many points and how close to each other need to be measured so as the mapping would ap-proximate the real terrain. In one section a minimum of two points need to be measured: 1) one on the top of the bank (where the mud is on dry), and 2) one in the bottom of the bank (bottom of the slope).
Usually these two points are enough, but it is good to examine more points in one section to get a better result (Figure 4).
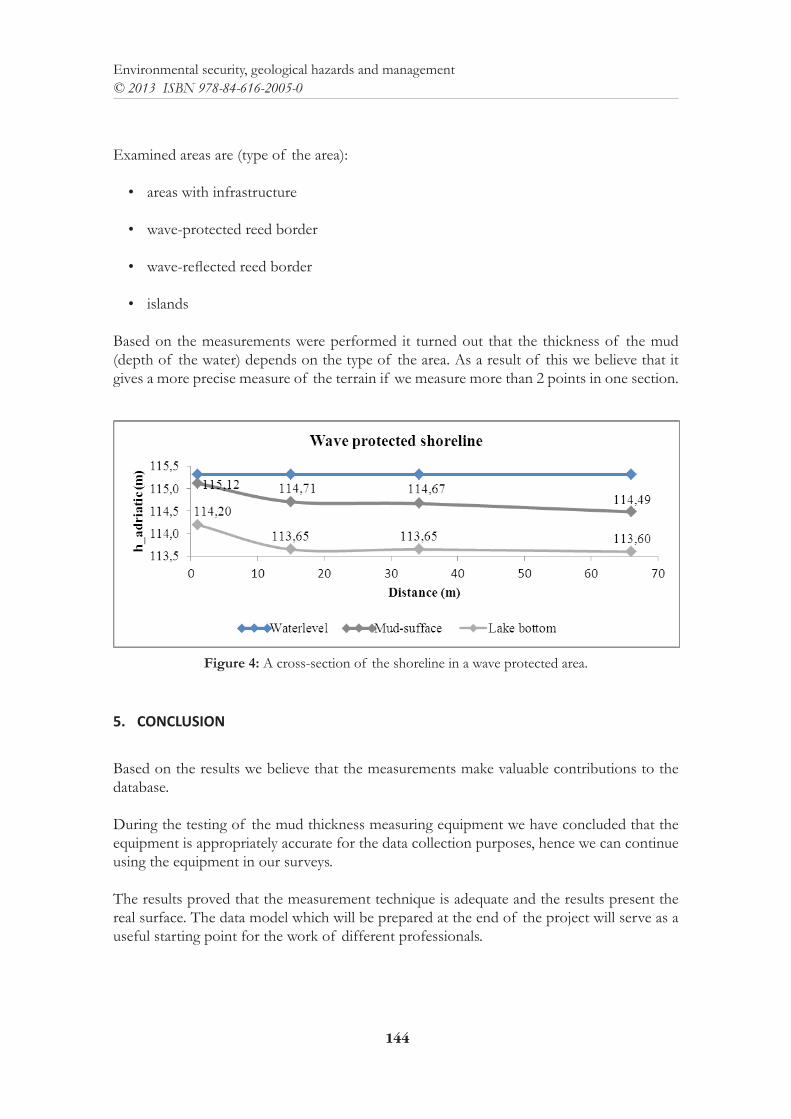
144
Environmental security, geological hazards and management© 2013 ISBN 978-84-616-2005-0
Examined areas are (type of the area):
• areas with infrastructure
• wave-protected reed border
• wave-reflected reed border
• islands
Based on the measurements were performed it turned out that the thickness of the mud (depth of the water) depends on the type of the area. As a result of this we believe that it gives a more precise measure of the terrain if we measure more than 2 points in one section.
Figure 4: A cross-section of the shoreline in a wave protected area.
5. CONCLUSION
Based on the results we believe that the measurements make valuable contributions to the database.
During the testing of the mud thickness measuring equipment we have concluded that the equipment is appropriately accurate for the data collection purposes, hence we can continue using the equipment in our surveys.
The results proved that the measurement technique is adequate and the results present the real surface. The data model which will be prepared at the end of the project will serve as a useful starting point for the work of different professionals.
145
Part 2Water Management and Protection
Our aim is to monitor the succession process and document the changes and try to ensure that human interventions are in line with the norms of sustainable development. These is-sues cannot be resolved and the tasks cannot be handled by a single profession, hence co-operation between the organisations and coordination of the environmental authorities are necessary
ACKNOWLEDGEMENTS
Thanks for GENESEE Project (ATMOS L00130) what is implemented through Cross-border Cooperation Programme Austria - Hungary 2007-2013, co-financed by the European Regional
Development Fund (ERDF).
References
BÁCSATYAI, L. & CSAPLOVICS, E. & MÁRKUS, I. & SINDHUBER, A. (1997); Digitale Geländemodelle des Neusiedler See-Beckens, Burgenländisches Landesmuseum, Eisenstadt, pp. 53a.
BOGNÁR, D. (1966); The reed harvesting in the Lake Fertő [A fertői nádgazdálkodás] in. Soproni szemle XX/2, Sopron, Hungary
KIRÁLY, G. & KONKOLY-GYÚRÓ, É. & MÁRKUS, I. & NAGY, D. & SÁGI, É. (2013); Land cover changes of the Lake Fertő and its surroundings based on archive maps [A Fertő tónak és környékének felszínborítás-változásai régi térképek alapján] Proceedings book of the 5. Hungarian Landscape-ecology Conference
KUTRUCZ, Gy. & PANNONHALMI, M. & NÉMETHNÉ DEÁK, I. & KOVÁCS, R. & KESERÜ, B. & TÓTH, I. (2011); The present and the future of the research at the Lake Fertő[A Fertő tó vizsgálatának jelene és jövője] ÉDUKÖVIZIG, Győr, Hungary
PANNONHALMI, M. & SÜTHEÖ, L. (2007); The past, the present and the future at Lake Fertő [A Fertő tó múltja jelene és jövője] ÉDUKÖVIZIG, Győr, Hungary.

147
Part 2Water Management and Protection
HEAVY METAL CONTENT IN SEWAGE SLUDGE: A MANAGEMENT STRATEGY FOR AN OCEAN ISLAND
C. Hernández-Sánchez1, A. Burgos2 , JM. Galindo, A. Gutiérrez, C. Rubio1, A. Hardisson1.1. Área de Toxicología, Universidad de La Laguna
2. Área de Medicina Preventiva, Universidad de La Laguna
ABSTRACT: In recent years, the generation of sewage sludge has increased worldwide. Correct processing and management of this waste concerns all countries. The reuse of sewage sludge as a fertilizer on farmland could reduce the exponentially growing need to manage it as waste matter. This work presents a study of metal contents, i.e. Cd, Pb, Zn, Cr, Cu, and Ni, in sewage sludge from a wastewater treatment plant in the northeast of the island of Tenerife. The study aimed at examining the sludge for potential suitability as a farmland fertilizer. Detected metal levels for Pb, Zn, Cr, Cu, and Ni were extremely low (26.44, 544.01, 24.10, 37.05, and 8.04 mg/kg dm [dry matter], respec-tively). Cadmium levels were under the quantification limit. Consequently, the application of sewage sludge to fertilize agricultural, nutrient deficient soils and soils degraded by human activity represents a fast and straightforward solution to the deficiency of such resources, particularly in remote living spaces like oceanic islands.
Keywords: heavy metals, oceanic island, sewage-sludge waste management.
1. INTRODUCTION
Wastewater Treatment Plants (WWTPs) generate millions of tons of sewage sludge globally every year (Cuevas and Walter, 2004; Heras, 2005; Pasuello et al., 2012). After enactment of the Directive 97/271/CEE, which regulates the treatment of urban waste water, the produc-tion of sewage sludge as a by-product of water treatment has increased (Heras et al., 2005; Babel and del Mundo Dacera, 2006; Meglei et al., 2006; Domenech et al., 2007; Egiarte et al., 2008; Moreira et al., 2008).
To date, there are three alternatives to handle wastewater sludge within the European Com-munity: incineration, land burial, and application as a farmland fertilizer. Each European country employs the options in a different way. Thus, in Spain, law prohibits burying of the sludge not to affect the groundwater (Heras et al., 2005). Incineration of sewage sludge cre-ates an important problem, as the ash contains toxic metals such as lead, cadmium, copper, and zinc as well as dioxins and furans, which could pass into the atmosphere (Sakamoto et al., 2001; Hong et al., 2009). In the European Community, 30 % of the sewage sludge is reused as fertilizer in agriculture (Wang et al., 2008). Other countries like the US, New Zealand, and Australia not only apply wastewater sludge in agriculture but also legislate the reuse in forests, mountain and other soils (Goven and Langer, 2009).
148
Environmental security, geological hazards and management© 2013 ISBN 978-84-616-2005-0
Waste water derived sludge is high in nutrients and organic matter contents, especially nitro-gen and phosphorus, which could convert it into an attractive fertilizer (Andjei and Rech-cigl, 2002; Heras et al., 2005; Sigua et al., 2005; Fernández et al., 2008; Mattenberger et al., 2008). Multiple studies demonstrated that sewage sludge, applied as an organic supplement on farmland, produces a substantial increase in soil fertility and hence crop yield (Fernández et al., 2008, Hargreaves et al., 2008). On the whole, water treatments concentrate pollutants from the waste water in the sewage sludge (Mattenberger et al., 2008, Hong et al., 2009). Therefore, this sludge must be reused in environmentally safe conditions (Hong et al., 2009).
Since 1990, Spanish law permits the reuse of sludge in agriculture, stipulating concentrations of heavy metals below the provisions of the Royal Decree (RD) 1310/1990 (which imple-ments the European Directive 86/278/EEC). Both, the EU Directive and the Spanish RD establish limits of sewage sludge application on soil for 7 metals: Cd, Cr, Cu, Pb, Hg, Ni, and Zn. The US Environmental Protection Agency (USEPA) regulates 10 metals (Cd, Cr, Cu, Pb, Hg, Ni, Zn, As, Mo, and Se). Several European countries impose additional limits for pollut-ants other than metals (Moreira et al. 2008).
EU legislation and USEPA differ in the annual pollutant loading rate limits (kg/ha/year) set for the different heavy metals, being the European Directive much more restrictive and thus limiting.
Studies of metal concentrations in sewage sludge from around the world (Acosta et al., 2003; Manios et al., 2003; Cuevas and Walter, 2004; Kandpal et al., 2004; Beltrán et al., 2005; Heras et al., 2005; Hernández-Herrera et al., 2005; Ahlberg et al., 2006; García et al., 2006; Goi et al., 2006; Sager, 2007; Salcedo-Pérez et al., 2007; Chen et al., 2008; Egiarte et al., 2008; Morei-ra et al., 2008; Oleszczuk, 2008; Wang et al., 2008; Haroun et al., 2009; Mosquera-Lozada et al., 2009; Roca-Pérez et al., 2009; Rigueiro-Rodríguez et al., 2010) present much variation, largely due to the characteristics of the waste water. Therefore, each WWTP requires a study that determines its condition to generate sewage sludge for fertilizing, as the pollution load varies with the location. Obviously, completion of appropriate sludge management entails substantial efforts and economic costs (Babel and del Mundo Dacera, 2006; Dima et al., 2006: Kollikkathara et al., 2009).
The Canary Islands are considered an outermost region for lying in the most southern point of Europe, at a distance of more than 1000 km from the Iberian Peninsula. Elevated trans-port expenses, due to the isolated location of the Canary Islands, condition and raise the cost of all import products. The Island of Tenerife, with an area of 2,058 km2 and 852,945 in-habitants, is the largest of the seven Canary Islands (ISTAC 2007) and presents an economy primarily based on tourism and agriculture. Therefore, agricultural production will be more costly due to high transport expenses. Agriculture should not be the only sector to take ad-vantage of this high-quality sludge for fertilization. It could also be applied to other types of nutrient deficient soils or soils degraded by human activity.
The Plan Territorial Especial de Ordenación de Residuos de Tenerife (specific territorial regulation for the waste management in Tenerife), decreed by the Canary Islands’ Government (BOC
149
Part 2Water Management and Protection
199/2011), proposes composting of all sewage sludge generated in the island, but only a small portion is used for gardening purposes. In summary, the use and proper manage-ment of sludge from sewage treatment plants would shift waste from a landfill problem to a high quality resource. Moreover, preventing disposal of sewage sludge in landfills could help avoiding added space problems, which are always a critical point in the limited territory of an island.
The aim of this study was to evaluate the annual distribution pattern of metals (Cd, Pb, Zn, Cr, Cu, and Ni) in sewage sludge from the WWTP in the northeast of Tenerife.
2. EXPERIMENTAL
The regional wastewater system in the northeast of Tenerife has a WWTP for secondary treatment of waste water from the area. The slurry in this WWTP goes through a primary decanter, a clarifier, a thickener, and finally passes through a band filter. 60 samples of sew-age sludge were taken in this WWTP between August 2009 and July 2010, split up into 5 samplings per month.
Homogenized samples were weighed into 1 g aliquots and oven-dried at 80 °C for 20-24 h. Then, samples were incinerated in a muffle furnace by increasing the temperature 2 hourly in 30 °C steps until 450 °C ± 25 and for a total of 30 h. After a cool-down period, the result-ing white ash was dissolved in 1.5 % nitric acid and completed to a volume of 50 mL. The processed samples were stored in antiseptic polyethylene bottles until analysis.
Metal contents were analyzed by atomic absorption spectrophotometry (AAS), a reference technique for metal determination, characterized by its high sensitivity and reproducibility. A flame spectrophotometer, Model 2100 (Perkin Elmer, MA) was used.
The detection and quantification limits were estimated based in the instrumental response of the equipment. Specificity was confirmed by analyzing 15 white/blank samples in repro-repro-ducible conditions conditions (IUPAC, 1995). The instrumental detection and quantification limits were 47.54 μg/L and 158.47 μg/L, respectively, for Cd, 37.61 μg/L and 125.36 μg/L, respectively, for Pb, 19.03 μg/L and 63.43 μg /L, respectively, for Zn, 40.86 μg/L and 136.21 μg/L, respectively for Cr, 26.76 μg/L and 89.18 μg/L, respectively for Cu, and 33.68 μg/L and 112.28 μg/L, respectively for Ni.
For statistical analysis, data was processed with SPSS software (19.0 version for Windows). Normal Data distribution was tested with the Kolmogorov-Smirnov model (Xu et al., 2002), and Levene’s test was applied to determine variance homogeneity (Pan, 2002). For inferential statistics, an ANOVA (post-hoc Tukey test) was applied as parametric test and the Mann-Whitney and Kruskal-Wallis as non-parametric tests (Choy et al., 2001). Correlation between variables was determined by Spearman and Pearson tests.
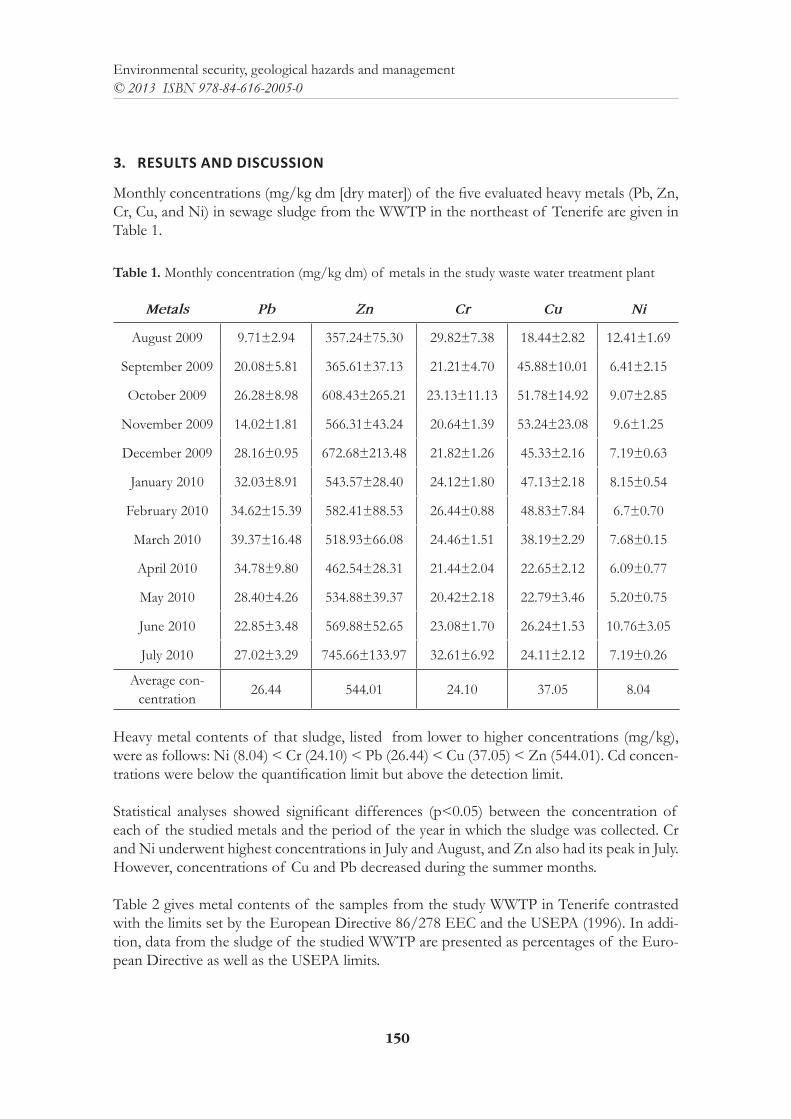
150
Environmental security, geological hazards and management© 2013 ISBN 978-84-616-2005-0
3. RESULTS AND DISCUSSION
Monthly concentrations (mg/kg dm [dry mater]) of the five evaluated heavy metals (Pb, Zn, Cr, Cu, and Ni) in sewage sludge from the WWTP in the northeast of Tenerife are given in Table 1.
Table 1. Monthly concentration (mg/kg dm) of metals in the study waste water treatment plant
Metals Pb Zn Cr Cu Ni
August 2009 9.71±2.94 357.24±75.30 29.82±7.38 18.44±2.82 12.41±1.69
September 2009 20.08±5.81 365.61±37.13 21.21±4.70 45.88±10.01 6.41±2.15
October 2009 26.28±8.98 608.43±265.21 23.13±11.13 51.78±14.92 9.07±2.85
November 2009 14.02±1.81 566.31±43.24 20.64±1.39 53.24±23.08 9.6±1.25
December 2009 28.16±0.95 672.68±213.48 21.82±1.26 45.33±2.16 7.19±0.63
January 2010 32.03±8.91 543.57±28.40 24.12±1.80 47.13±2.18 8.15±0.54
February 2010 34.62±15.39 582.41±88.53 26.44±0.88 48.83±7.84 6.7±0.70
March 2010 39.37±16.48 518.93±66.08 24.46±1.51 38.19±2.29 7.68±0.15
April 2010 34.78±9.80 462.54±28.31 21.44±2.04 22.65±2.12 6.09±0.77
May 2010 28.40±4.26 534.88±39.37 20.42±2.18 22.79±3.46 5.20±0.75
June 2010 22.85±3.48 569.88±52.65 23.08±1.70 26.24±1.53 10.76±3.05
July 2010 27.02±3.29 745.66±133.97 32.61±6.92 24.11±2.12 7.19±0.26
Average con-centration
26.44 544.01 24.10 37.05 8.04
Heavy metal contents of that sludge, listed from lower to higher concentrations (mg/kg), were as follows: Ni (8.04) < Cr (24.10) < Pb (26.44) < Cu (37.05) < Zn (544.01). Cd concen-trations were below the quantification limit but above the detection limit.
Statistical analyses showed significant differences (p<0.05) between the concentration of each of the studied metals and the period of the year in which the sludge was collected. Cr and Ni underwent highest concentrations in July and August, and Zn also had its peak in July. However, concentrations of Cu and Pb decreased during the summer months.
Table 2 gives metal contents of the samples from the study WWTP in Tenerife contrasted with the limits set by the European Directive 86/278 EEC and the USEPA (1996). In addi-tion, data from the sludge of the studied WWTP are presented as percentages of the Euro-pean Directive as well as the USEPA limits.
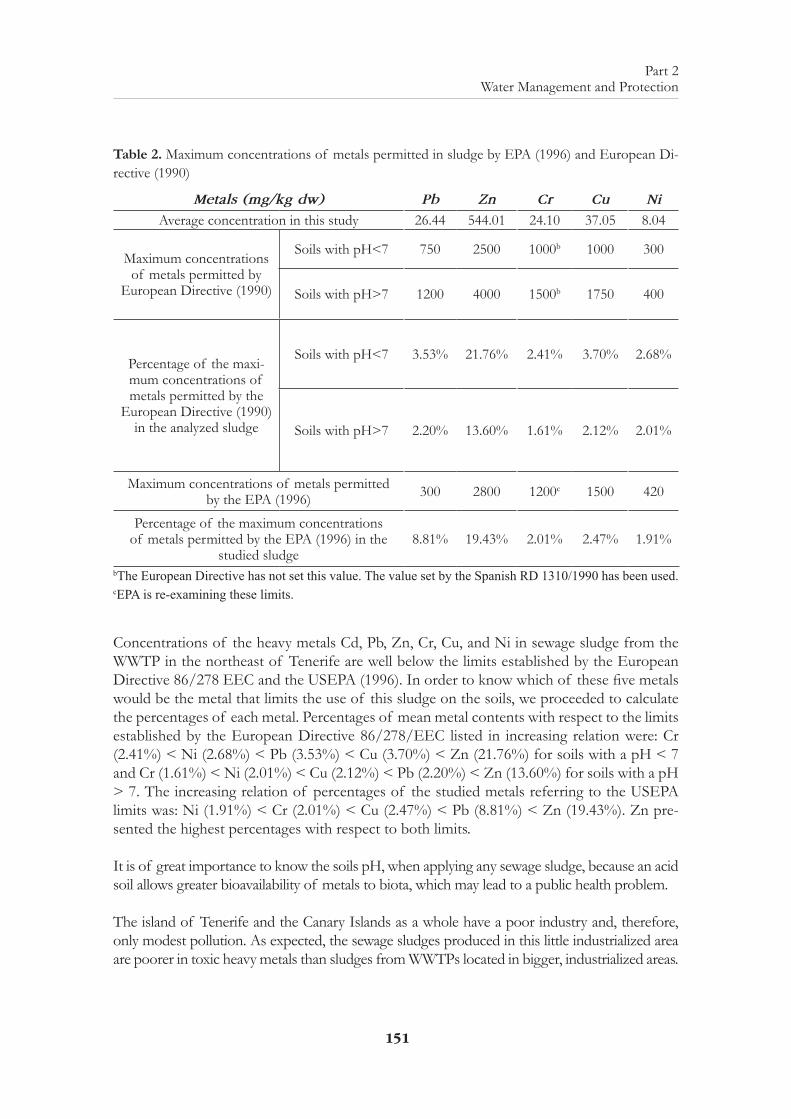
151
Part 2Water Management and Protection
Table 2. Maximum concentrations of metals permitted in sludge by EPA (1996) and European Di-rective (1990)
Metals (mg/kg dw) Pb Zn Cr Cu Ni
Average concentration in this study 26.44 544.01 24.10 37.05 8.04
Maximum concentrations of metals permitted by
European Directive (1990)
Soils with pH<7 750 2500 1000b 1000 300
Soils with pH>7 1200 4000 1500b 1750 400
Percentage of the maxi-mum concentrations of metals permitted by the
European Directive (1990) in the analyzed sludge
Soils with pH<7 3.53% 21.76% 2.41% 3.70% 2.68%
Soils with pH>7 2.20% 13.60% 1.61% 2.12% 2.01%
Maximum concentrations of metals permitted by the EPA (1996) 300 2800 1200c 1500 420
Percentage of the maximum concentrations of metals permitted by the EPA (1996) in the
studied sludge8.81% 19.43% 2.01% 2.47% 1.91%
bTheEuropeanDirectivehasnotsetthisvalue.ThevaluesetbytheSpanishRD1310/1990hasbeenused.cEPAisre-examiningtheselimits.
Concentrations of the heavy metals Cd, Pb, Zn, Cr, Cu, and Ni in sewage sludge from the WWTP in the northeast of Tenerife are well below the limits established by the European Directive 86/278 EEC and the USEPA (1996). In order to know which of these five metals would be the metal that limits the use of this sludge on the soils, we proceeded to calculate the percentages of each metal. Percentages of mean metal contents with respect to the limits established by the European Directive 86/278/EEC listed in increasing relation were: Cr (2.41%) < Ni (2.68%) < Pb (3.53%) < Cu (3.70%) < Zn (21.76%) for soils with a pH < 7 and Cr (1.61%) < Ni (2.01%) < Cu (2.12%) < Pb (2.20%) < Zn (13.60%) for soils with a pH > 7. The increasing relation of percentages of the studied metals referring to the USEPA limits was: Ni (1.91%) < Cr (2.01%) < Cu (2.47%) < Pb (8.81%) < Zn (19.43%). Zn pre-sented the highest percentages with respect to both limits.
It is of great importance to know the soils pH, when applying any sewage sludge, because an acid soil allows greater bioavailability of metals to biota, which may lead to a public health problem.
The island of Tenerife and the Canary Islands as a whole have a poor industry and, therefore, only modest pollution. As expected, the sewage sludges produced in this little industrialized area are poorer in toxic heavy metals than sludges from WWTPs located in bigger, industrialized areas.
152
Environmental security, geological hazards and management© 2013 ISBN 978-84-616-2005-0
4. CONCLUSIONS
It is proposed the use of this high quality sewage sludge as a fertilizer matter for agricultural soils in the island, what would lead to cost reduction by eliminating needs for imported fer-tilizer and its transport costs.
Moreover, preventing disposal of sewage sludge in landfills could help avoiding added space problems, which are always a critical point in the limited territory of an island. Therefore, reuse of this waste would create a resource and an economic advantage for farming on the island. Finally, the USEPA about sewage sludge should consider the introduction of soil acidity categories following the style of the European legislation.
ACKNOWLEDGEMENTS
The authors are deeply indebted to the Consejo Insular de Aguas de Tenerife and specifically the Área de Infraestructura Hidráulica for facilitating sampling in the WWTP of the northeast of Tenerife.
REFERENCES
ACOSTA W., GABTENI N., LAKHDAR A., DU LAING G., VERLOO M., JEDIDI N., GALLA-LI. T.,(2003), Effects of 5 year application of municipal solid waste compost on the distribution and mobility of heavy metals in a Tunisian calcareous soil, Agriculture Ecosystem and Environ-ment, 130: 156-163.
ADJEI M., RECHCIGL J., (2002), Bahia grass production and nutritive value as affected by domestic wastewater residuals, Agronomy Journal, 94: 1400-1410.
AHLBERG G., GUSTAFSSON O., WEDEL P., (2006), Leaching of metals from sewage sludge dur-ing one year and their relationship to particle size, Environmental Pollution, 144: 545-553.
BABEL S., DEL MUNDODACERA D., (2006), Heavy metal removal from contaminated sludge for land application: A review, Waste Management, 26: 988-1004.
BELTRÁN E.M., MILLARES DE IMPERIAL R., PORCEL M., VALERO-MARTÍN J., BERIN-GOLA M., CALVO R., DELGADO M., (2005), Influencia de la fertilización con lodos de depu-radora compostados en las propiedades químicas del suelo de dos olivares, Revista Internacional de Contaminación Ambiental, 21: 143-150.
BOC, (2011), BOC 199/2011 del 7 de octubre de 2011 relativo a la aprobación por el Pleno en sesión celebrada el día 29 de julio de 2011, del Texto Refundido del Plan Territorial Especial de Orde-nación de Residuos de la isla de Tenerife.
CHEN M., LI X-M., YANG Q., ZENG G., SHANG Y., LIAO D., LIU J., HU J., GUO L., (2008), Total concentrations and speciation of heavy metals in municipal sludge from Changsha Zhuzhou and Xiangtan in middle-south region of China. Journal Hazardous Material, 160: 324-329.
CHOY E., SCOTT C., KINGSLEY G., THOMAS S., MURPHY A., STAIMOS N., PANAYI G., (2001), Control of rheumatoid arthritis by oral tolerance, Arthritis and Rhematism, 44: 1993-1997.
CUEVAS G., WALTER I., (2004), Metales pesados en maíz (Sea maysL.) cultivado en un suelo enmen-dado con diferentes dosis de compost de lodo residual, Revista internacional de Contaminación Ambiental, 20: 59-68.
DIMA M., DORU C., DANIELA M., (2006), Wastewater treatment plant-common filtration and flotation unit-design aspects, Environmental Engineering and Management Journal, 6, 1255-1261.
153
Part 2Water Management and Protection
DIRECTIVA CE, (1986) 86/278/CEE del Consejo de 12 de junio de 1986 relativa a la protección del medio ambiente y, en particular, de los suelos, en la utilización de los lodos de depuradora en agricultura
DIRECTIVA CE, (1991) 97/271/CEE del Consejo de 21 de mayo de 1991 sobre el tratamiento de las aguas residuales urbanas.
DOMENECH X., ALCAÑIZ J., ANDRÉS P., (2007), Ecotoxicological assessment of organic wastes using the soil collembolan Folsomiacandida, Applied Soil Ecology, 35: 461-472.
EGIARTE G., PINTO M., RUÍZ-ROMERA E., CAMPS M., (2008), Monitoring heavy metal con-centrations in leachates from a forest soil subjected to repeated applications of sewage sludge, Environmental Pollution, 156: 840-848.
FERNÁNDEZ J.M., HOCKADAY W.C., PLAZA C., POLO A., HATCHER P.G., (2008), Effects of long-term soil amendment with sewage sludges on soil humic acid thermal and molecular properties, Chemosphere, 73: 1838-1844.
GARCÍA H., EL ZAUAHRE M., MORÁN H., ACOSTA Y., SENIOR A., FERNÁNDEZ N., (2006), Comparative analysis of two digestion techniques for the determination of heavy metals in sewage sludge, Multiciencias 6: 234-243
GOI D., TUBARO F., DOLCETTI G., (2006), Analysis of metals and EOX in sludge from munici-pal wastewater treatment plants: a case study, Waste Manage, 26: 167-175.
GOVEN J., LANGER E., (2009), The potential of public engagement in sustainable waste manage-ment: Designing the future for biosolids in New Zealand, Journal of Environmental Manage-ment, 90: 921-930.
HARGREAVES C., ADL M., WARMAN P., (2008), A review of the use of composted municipal solid waste in agriculture, Agriculture Ecosystems and Environment, 123: 1-14.
HAROUN M., IDRI A., OMAR S., (2009), Analysis of heavy metals during composting of the tan-nery sludge using physicochemical and spectroscopic techniques, Journal Hazardous Material, 165: 111-119.
HERAS J., MAÑAS P., LABRADOR J., (2005), Effects of Several Applications of Digested Sewage Sludge on Soil and Plants, Journal of Environmental Science and Health A, 40: 437-451.
HERNÁNDEZ-HERRERA J., OLIVARES-SÁENZ E., VILLANUEVA-FIERRO I., RODRÍ-GUEZ-FUENTES H., VÁZQUEZ-ALVARADO R., PISSANI-ZÚÑIGA J.,(2005), Aplicación de lodos residuales, estiércol bovino y fertilizante químico en el cultivo de sorgo forrajero (Sor-ghumvulgarepers), Revista Internacional de Contaminación Ambiental, 21: 31-36.
HONG J., HONG J., OTAKI M, JOLLIET O., (2009), Environmental and economic life cycle as-sessment for sewage sludge treatment in Japan, Waste Management, 29: 696-703.
INSTITUTO CANARIO DE ESTADÍSTICA (ISTAC). Estadística de Exportación de Productos Agrarios año 2009, www.gobiernodecanarias.org/istac. Consultado en octubre 2011.
IUPAC (International Union of Pure and Applied Chemistry), (1995), Nomenclature in Evaluation of Analytical Methods including Detection and Quantificaction Capabilities, Pure and Applied Chemistry, 67:1699-1723.
KANDPAL G., RAM B., SRIVASTAVA P., SING S., (2004), Effect of metal spiking on different chemical pools and chemically extractable fractions of heavy metals in sewage sludge, Journal Hazardous Material, 106: 133-137.
KOLLIKKATHARA N., FENG H., STERN E., (2009), A pure view of waste management evolu-tion: Special emphasis on USA, Waste Management, 29: 974-985.
MANIOS T., STENTIFORD E., MILLNER P., (2003), The effect of heavy metals accumulation on the chlorophyll concentration of Thyphalatifolia plants, growing in a substrate containing sewage sludge compost and watered with metaliferus water, Ecological Engineering, 20: 65-74.
154
Environmental security, geological hazards and management© 2013 ISBN 978-84-616-2005-0
MATTENBERGER H., FRAISSLER G., BRUNNER T., HERK P., HERMANN L., OBERN-BERGER O., (2008), Sewage sludge ash to phosphorus fertilizer: Variables influencing heavy metal removal during thermochemical treatment, Waste management, 28: 2709-2722.
MEGLEI V., GHIORGHITA A., ARMEANU M., (2006), Contributions to desigh and safe exploi-tation of wastewater treatment plants for small communities, Environmental Engineering and Management Journal, 6: 1269-1272.
MOSQUERA-LOSADA M., LÓPEZ-DÍAZ M., RIGUEIRO-RODRÍGUEZ A., (2009), Zinc and copper availability in herbage and soil of a Pinus radiates silvopastoral system in Northwest Spain after sewage-sludge and lime application, Journal of Plant Nutrition and Soil Science, 172: 843–850.
MOREIRA R., SOUSA J., CANHOTO C., (2008), Biological testing of a digested sewage sludge and derived composts, Bioresource Technology, 99: 8382-8389.
OLESZCZUK P., (2008), Phytotoxicity of municipal sewage sludge composts related to physico-chemical properties, PAHs and heavy metals, Ecotoxicology and Environmental Safety, 69: 496-505.
PAN G., (2002), Confidence intervals for comparing two scale parameters based on Levene’s statis-tics. Journal of Nonparametric Statistics, 4: 459-476.
PASUELLO A., CADIACH O., PÉREZ Y., SCHUHMACHER M., (2012), A spatial multicriteria decision making tool to define the best agricultural areas for sewage sludge amendment, Environ-mental International, 38: 1-9.
RD 1310/1990 de 29 de octubre, por el que se regula la utilización de los lodos de depuración en el sector agrario.
RIGUEIRO-RODRÍGUEZ A., FERREIRO-DOMÍNGUEZ N., MOSQUERA-LOSADA M., (2010), The effects of fertilization with anaerobic, composted and pelletized sewage sludge on soil, tree growth, pasture production and biodiversity in a silvopastoral system under ash (Fraxinus excelsior L), Grass and Forage Science, 65: 248-259.
ROCA-PÉREZ L., MARTÍNEZ C., MARCILLA P., BOLUDA R., (2009), Composting rice Straw with sewage sludge and compost effects on the soul-plant system, Chemosphere, 75: 781-787.
SAGER M., (2007), Trace and nutrient elements in manure, dung and compost samples in Austria, Soil Biology and Biochemistry, 39:1383-1390.
SAKAMOTO K., KUNII K., KUSAMICHI T., MURAKOSHI K., KAWABATA H., KOKADO M., (2001), Evaporation behavior of heavy metals in municipal incinerator melting fly ash, Kobe Steel Engineering Reports, 51: 19-22.
SALCEDO-PÉREZ E., VÁZQUEZ-ALARCÓN A., KRISHNAMURTHY L., ZAMORA-NA-TERA F., HERNÁNDEZ-ÁLVAREZ E., RODRÍGUEZ MACIAS R., (2007), Evaluation of sewage sludge as organic fertilizer in volcanic soils used for agricultural and forestry in Jalisco, Mexico, INCI 32: 115-120.
SIGUA G., ADJEI M., RECHCIGL J., (2005), Cumulative and Residual Effects of Repeated Sewage Sludge Applications: Forage Productivity and Soil Quality Implications in South Florida, USA, Environmental Science and Pollution Research, 12: 80-88.
US EPA, (1996), Land application of biosolids, Chapter 3: Overview of the Part 503 Regulatory Requirements for Land Application of Sewage Sludge, Process Design Manual, Technomic Pub-lishing Co.
XU P., HUANG S., ZHUE R., HAN X., ZHOU H., (2002), Phenotrophic polymormorphism of CYP2A6 activity in a Chinese population, European Journal of Clinical Pharmacology, 58:333-337.
WANG X., CHEN T., GE Y., JIA Y., (2008), Studies on land application of sewage sludge and its limiting factors, Journal of Hazardous Materials, 160: 554-558.
155
Part 2Water Management and Protection
CHANGING CLIMATE IMPACTING ON WATER AND ENERGY NEEDS FOR MILLIONS
İbrahim Yurtseven, Ph.D.1
Hakan Erden, Ph.D.2
Yusuf Serengil, Assoc.Prof.Dr. 1
1 Istanbul University, Faculty of Forestry2 General Directorate of Agriculture Reform under Ministry of Food, Agriculture, and Livestock
ABSTRACT: Urbanization is a reality of our times. Living conditions in the cities become more appealing to promote migration from rural areas. There are many positive consequences of urbani-zation (i.e. public transportation, energy savings, and decrease pressure on rural lands) but there are also negative ones too. Water, food and energy supply are the most vital needs of large populations. In this paper we discuss these issues and give examples from Istanbul, the largest city of Turkey. The almost 14 million inhabitants use an average of 2.6 million cubic meters of water per day which can be supplied from more than ten reservoirs. One third of this water is transported from 200 km dis-tance to the city. The climate change adds up more stress to this supply-demand relationship in terma of water and energy because around 98 percent of the water used in the city comes from surface water resources. The precipitation is variable and dry cycles have the capacity to cause water deficit. To make this more complicated, another 2-3 million population is planned to the northern side of the city that used to be less human impacted.
1. INTRODUCTION
The continuity of life and energy takes place in a delicate balance on earth (ODUM & BAR-REETT 2005). Lives of organisms including humans depend on the continuation of the energy in this balance (SPENCER 1884). The sensitivity is due to the fact that balance of the necessary elements for life in the sphere, the biosphere and the atmosphere are fragile. The earth actually supported the task of creating the optimal physical and chemical environ-ment for necessary of life is a cybernetic system (LOVELOCK 1995). Within this system, the insensible actions of advanced organisms to the nature against buffering the effects of micro-organisms and plants prevent the continuity of the natural balance. This balance can be organized within the system or organism with simulated expression but human interfere this regulatory mechanism (LOVELOCK 1995). So, living organism keep under control the environment by interfering with balance elements in the physical environment. The human that depend on natural environment can contribute to the further development of the tech-nology while at the same time interfere with the basic dynamics of nature. This dependence is considered to be crushed along with the advancement of technology. The human also changes environmental factors with the development of technology associated with basic re-
156
Environmental security, geological hazards and management© 2013 ISBN 978-84-616-2005-0
quirements and change the consumption habits. Here, the concept of global climate change comes to the forefront.
Climate change is an outcome of global warming and now it has been very clear that the reason behind this is the human development in an unsustainable manner.
2. CLIMATE CHANGE AND EFFECTS ON WATER
The increased greenhouse effect due to consumption of fossil fuels is the basic reason be-hind climate change (LAL 2004). The result of fossil fuels usage increased concentrations of some gases especially carbon dioxide, methane, and nitrogen oxides in the atmosphere (RODHE 1990). The process of global warming is a consequence of the industrial revolu-tion, because the concentration of carbon dioxide increased up to 30% in the atmosphere (FLEMING 1998). The earth surface temperature increased by 0.6 0C from 1900 to 2000 (IPCC 2007). There are also some indicators of this warming around the world. The sea-level rise due to glacier melt down is one of the proofs of global warming. MEEHL et al. (2005) reported that a temperature rise of 0.30C until 2200 will bring about increase of sea level up to 17 and 21 cm. This is not only affecting the polar glaciers. According to a study that takes into account changes Alpine glaciers since 1850, volume of the glaciers were los-ing almost half of its volume and surface area of the glaciers were losing 30%-40% of their areas (HAEBERLI & BENISTON 1998). As can be seen, the climate change is reason for the global warming in specific areas. The warming has proven to change the climate by long-term observations (KNORR et al. 2005). For example, this situation could be understood by examining the long-term trend in the annual rings of trees and can be determined by investigating the status of plant and animal species behavior (Hughes, 2000). Living organ-isms are influenced by global warming as living within the limits of temperature tolerance is essential. The most dramatically example can be seen in aquatic organisms. Accumulation of atmospheric CO2 and ocean acidification will result a slowdown in coral calcification (HOEGH-GULDBERG et al. 2007). CO2 concentration of 500 ppm may cause with an increase in water temperature of 30C is enough to deterioration on the ecosystem of coral reefs (HOEGH-GULDBERG et al. 2007). Except for this type of the effects to marine and ocean fresh water sources, the global warming has also an impact on lakes and rivers. The amount of dissolved oxygen is balanced due to the permanent snow masses which melt at the end of the winter balance water temperature in stream and lake (VITOUSEK 1994). Therefore, trout species that living in the stream and lake ecosystem will be affected to deteriorated temperature-oxygen balance (WELCH et al. 1998). In another study, water level has found to increase based on 150 years of water level measurements in Lake Ladoga, Russia and this level were determined to increase 17 cm in the last 25 years (LEMESHKO & BORZENKOVA 2001). Temperature and precipitation interacts with freshwater resources (Erwin, 2009). The increase in temperature and the decrease in precipitation lead to decrease of fresh water sources and lead to the destruction of the ecosystems (BARNETT 2005). The examples given in the results of this research reveals the negative effects of global warming on water and aquatic organisms.
157
Part 2Water Management and Protection
One significant point is that these impacts on precipitation and temperature affects water re-sources in various ways around the globe. Some regions are predicted to suffer from drought while some expected to be affected from severe floods. The acceleration of the hydrologic cycle may have various outcomes for different regions.
3. CLIMATE CHANGE PREDICTIONS FOR TURKEY
The researchers have used mathematical models and product of scenarios about determina-tion of climate change and the future situations (IPCC 2007). According to IPCC (2007), developed models for the scenarios were predicted to increase of 10C (most optimistic) and 5,50C (most pessimistic) of the surface temperature. When the warming considered in the evaluation of regional scales instead of global scales, there isn’t always certain situations as temperatures increase and rainfall will decrease (DOUVILLE 2006). When the temperature data were statistically evaluated from the last fifty years, temperatures showed tendency to increase and precipitation tended to decrease in the Eastern Mediterranean and Middle East region, including Turkey (Giannakopoulos et al, 2009; Evans, 2009). According the A2 sce-nario of IPCC which is one of four different scenarios (A1, A2, B1 and B2), the rainfall will increase %10-%25 towards the end of this century (2100) in the northern regions of Turkey and will decrease %20 -%60 in southern region of Turkey. However, during the summer the temperature increases 6 0C in the western region and 4 0C in the eastern region of Turkey (IPCC 2007, GAO & GIORGI 2008). So the A2 scenario is expected to decrease in rainfall in areas except for the Eastern Black Sea region.
4. WATER AND ENERGY ISSUES IN ISTANBUL
The amount of water consumed in the city of Istanbul around 2.6 million square meters per day and this amount increases every year. There are several dam reservoirs around the city (Figure 1) to provide this amount. These dams are under the stress of pollution due to expanding settlements and the policy of the government to benefit from dam reservoirs as settlement areas. New roads, bridges and another airport are planned together with new population areas of many millions. These additional settlement areas not only attracts people from rural regions but also puts further pressure on water and energy demands of the city.
The energy consumption which increases the concentration of CO2 in the atmosphere is the major factor causing climate change (MANABE & STOUFFER 1980). The energy used for housing, industry, and transport is interaction with climate change in cities (DODMAN 2010). For example, the fossil fuels used for transport or the use of coal in thermal power plants to produce electrical energy increase the concentration of CO2 emitted to the at-mosphere (SATTERTHWAITE 2009). CO2 emission rates also changes according to usage conditions in big cities. The industrial activities together with the transport are important in the cities for energy consumption and climate change. Istanbul is dominated by the industri-alization, the residential energy consumption and the transport.
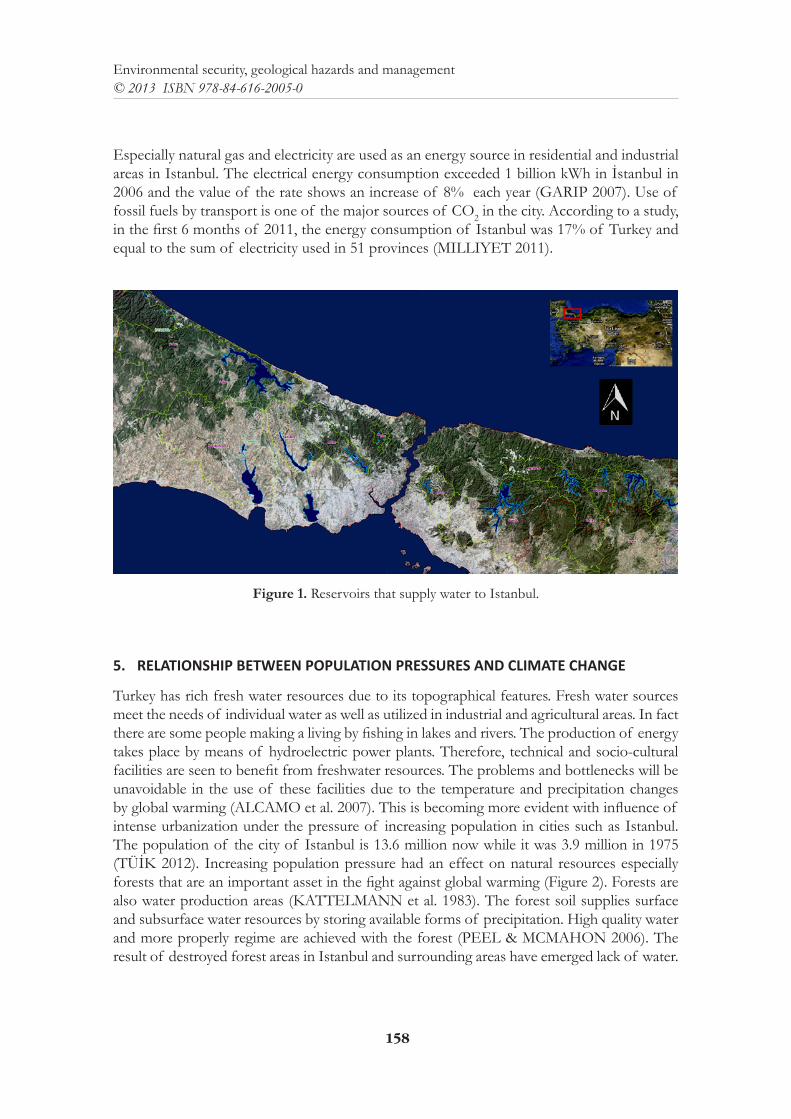
158
Environmental security, geological hazards and management© 2013 ISBN 978-84-616-2005-0
Especially natural gas and electricity are used as an energy source in residential and industrial areas in Istanbul. The electrical energy consumption exceeded 1 billion kWh in İstanbul in 2006 and the value of the rate shows an increase of 8% each year (GARIP 2007). Use of fossil fuels by transport is one of the major sources of CO2 in the city. According to a study, in the first 6 months of 2011, the energy consumption of Istanbul was 17% of Turkey and equal to the sum of electricity used in 51 provinces (MILLIYET 2011).
Figure 1. Reservoirs that supply water to Istanbul.
5. RELATIONSHIP BETWEEN POPULATION PRESSURES AND CLIMATE CHANGE
Turkey has rich fresh water resources due to its topographical features. Fresh water sources meet the needs of individual water as well as utilized in industrial and agricultural areas. In fact there are some people making a living by fishing in lakes and rivers. The production of energy takes place by means of hydroelectric power plants. Therefore, technical and socio-cultural facilities are seen to benefit from freshwater resources. The problems and bottlenecks will be unavoidable in the use of these facilities due to the temperature and precipitation changes by global warming (ALCAMO et al. 2007). This is becoming more evident with influence of intense urbanization under the pressure of increasing population in cities such as Istanbul. The population of the city of Istanbul is 13.6 million now while it was 3.9 million in 1975 (TÜİK 2012). Increasing population pressure had an effect on natural resources especially forests that are an important asset in the fight against global warming (Figure 2). Forests are also water production areas (KATTELMANN et al. 1983). The forest soil supplies surface and subsurface water resources by storing available forms of precipitation. High quality water and more properly regime are achieved with the forest (PEEL & MCMAHON 2006). The result of destroyed forest areas in Istanbul and surrounding areas have emerged lack of water.
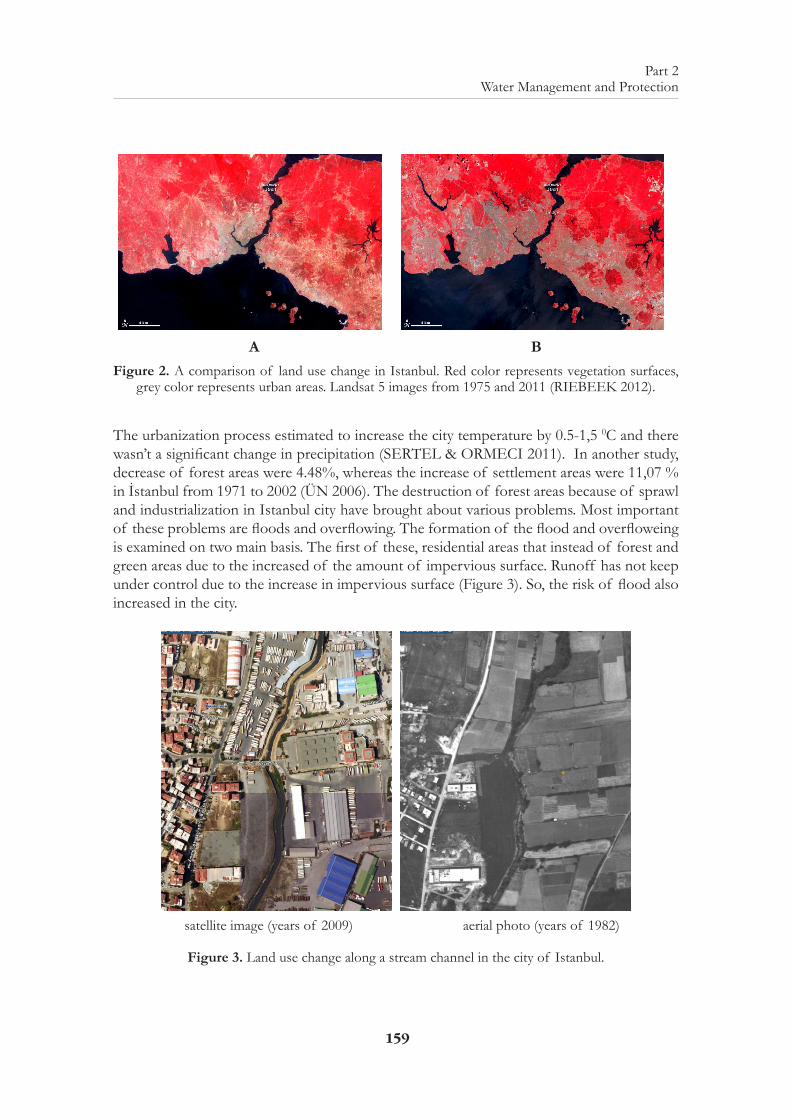
159
Part 2Water Management and Protection
A BFigure 2. A comparison of land use change in Istanbul. Red color represents vegetation surfaces,
grey color represents urban areas. Landsat 5 images from 1975 and 2011 (RIEBEEK 2012).
The urbanization process estimated to increase the city temperature by 0.5-1,5 0C and there wasn’t a significant change in precipitation (SERTEL & ORMECI 2011). In another study, decrease of forest areas were 4.48%, whereas the increase of settlement areas were 11,07 % in İstanbul from 1971 to 2002 (ÜN 2006). The destruction of forest areas because of sprawl and industrialization in Istanbul city have brought about various problems. Most important of these problems are floods and overflowing. The formation of the flood and overfloweing is examined on two main basis. The first of these, residential areas that instead of forest and green areas due to the increased of the amount of impervious surface. Runoff has not keep under control due to the increase in impervious surface (Figure 3). So, the risk of flood also increased in the city.
satellite image (years of 2009) aerial photo (years of 1982)
Figure 3. Land use change along a stream channel in the city of Istanbul.
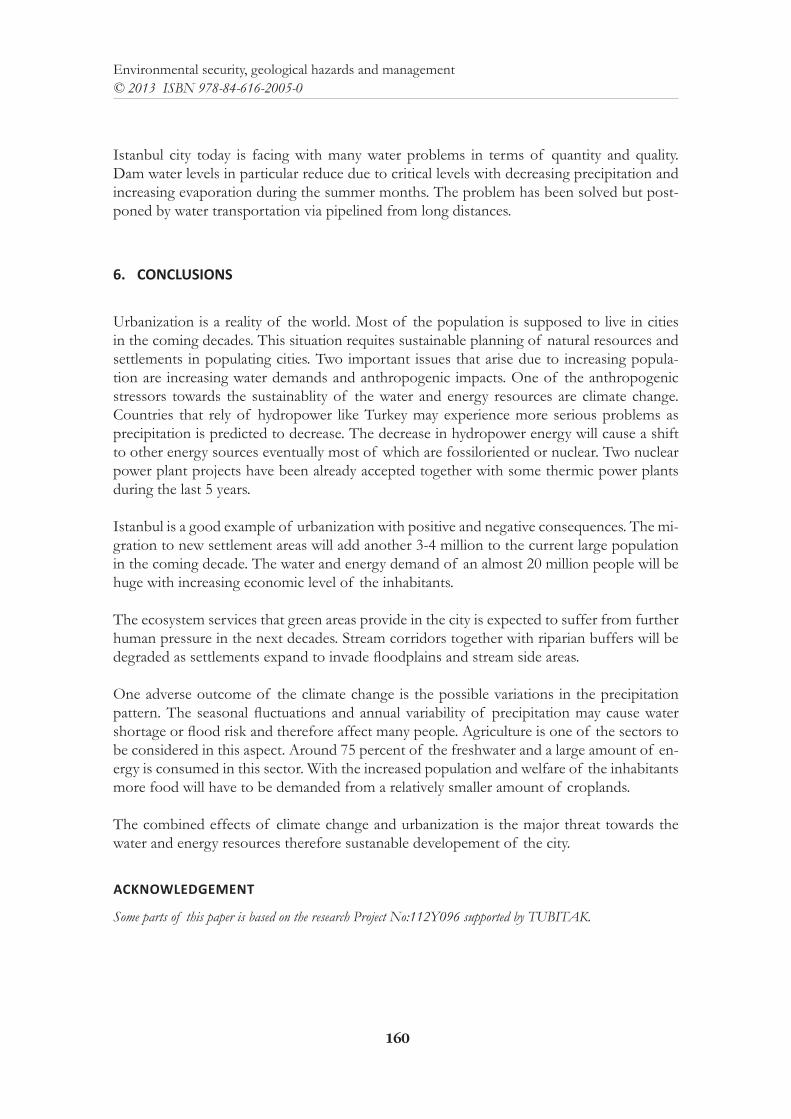
160
Environmental security, geological hazards and management© 2013 ISBN 978-84-616-2005-0
Istanbul city today is facing with many water problems in terms of quantity and quality. Dam water levels in particular reduce due to critical levels with decreasing precipitation and increasing evaporation during the summer months. The problem has been solved but post-poned by water transportation via pipelined from long distances.
6. CONCLUSIONS
Urbanization is a reality of the world. Most of the population is supposed to live in cities in the coming decades. This situation requites sustainable planning of natural resources and settlements in populating cities. Two important issues that arise due to increasing popula-tion are increasing water demands and anthropogenic impacts. One of the anthropogenic stressors towards the sustainablity of the water and energy resources are climate change. Countries that rely of hydropower like Turkey may experience more serious problems as precipitation is predicted to decrease. The decrease in hydropower energy will cause a shift to other energy sources eventually most of which are fossiloriented or nuclear. Two nuclear power plant projects have been already accepted together with some thermic power plants during the last 5 years.
Istanbul is a good example of urbanization with positive and negative consequences. The mi-gration to new settlement areas will add another 3-4 million to the current large population in the coming decade. The water and energy demand of an almost 20 million people will be huge with increasing economic level of the inhabitants.
The ecosystem services that green areas provide in the city is expected to suffer from further human pressure in the next decades. Stream corridors together with riparian buffers will be degraded as settlements expand to invade floodplains and stream side areas.
One adverse outcome of the climate change is the possible variations in the precipitation pattern. The seasonal fluctuations and annual variability of precipitation may cause water shortage or flood risk and therefore affect many people. Agriculture is one of the sectors to be considered in this aspect. Around 75 percent of the freshwater and a large amount of en-ergy is consumed in this sector. With the increased population and welfare of the inhabitants more food will have to be demanded from a relatively smaller amount of croplands.
The combined effects of climate change and urbanization is the major threat towards the water and energy resources therefore sustanable developement of the city.
ACKNOWLEDGEMENT
Some parts of this paper is based on the research Project No:112Y096 supported by TUBITAK.
161
Part 2Water Management and Protection
REFERENCES
ALCAMO, J., FLÖRKE, M. & MÄRKER, M. (2007); Future long-term changes in global water re-sources driven by socio-economic and climatic change. Hydrol. Sci. J. 52(2), pp. 247–275.
BARNETT, T. P., ADAM, J. C. & LETTENMAIER, D. P. (2005); Potential impacts of a warming climate on water availability in snowdominated regions. Nature 438, pp. 303–309.
DODMAN, D. (2010); Blaming cities for climate change? An analysis of urban greenhouse gas emis-sions inventories. Environment & Urbanization 21(1), pp. 185–201.
DOUVILLE, H. (2006); Detection-attribution of global warming at the regional scale: How to deal with precipitation variability? Geophysıcal Research Letters, vol. 33, l02701, doi:10.1029/2005gl024967
ERWIN, K.L. (2009); Wetlands and global climate change: the role of wetland restoration in a chang-ing world. Wetlands Ecol Manage 17, pp. 71–84.
EVANS, J.P. (2009); 21st century climate change in the MiddleEast. Climatic Change, 92, pp. 417-432.FLEMING, J.R. (1998); Historical Perspectives on Climate Change. Oxford University Press, NewYork. GARIP, M. (2007). Energy Efficiency on Municipality Management. Energy Efficiency, Ankara, 2007GAO, X. & GIORGI, F. (2008); Increased aridity in the Mediterranean region under greenhouse
gas forcing estimated from high resolution simulations with regional climate model. Global and Planetary Change 62, pp. 195-209.
GIANNAKOPOULOS, C, LE SAGER, P., BINDI, M.. MORIONDO, M., KOSOPOULOU, E., GOODESS, C.M. (2009); Climatic changes and associated impacts in the Mediterranean resulting from a 2°C global warming. Global and Planetary Change 68, pp. 209-224.
MCPHERSON, G.R. & WELTZIN, J.F. (2003); Changing Precipitation Regimes and Terrestrial Ecosystems, A North American Perspective. The University of Arizona Press, 237 pp.
HAEBERLI, W. & BENISTON, M., (1998). Climate change and its impacts on glaciers and perma-frost in the Alps. Ambio 27, pp. 258-265.
HOEGH-GULDBERG, O., MUMBY, P.J., HOOTEN, A.J., STENECK, R.S., GREENFIELD, P., GOMEZ, E., HARVELL, C.D., SALE, P.F., EDWARDS, A.J., CALDEIRA, K., KNOWLTON, N., EAKIN, C.M., IGLESIAS-PRIETO, R., MUTHIGA, N., BRADBURY, R.H., DUBI, A., HATZIOLOS, M.E. (2007); Coral Reefs Under Rapid Climate Change and Ocean Acidification. Science 318, pp. 1737-1742.
HUGHES, L. (2000); Biological consequences of global warming: is the signal already apparent? 15 (2), pp. 56–61.
IPCC, (2007); Fourth Assessment Report. Intergovernmental Panel on Climate Change.KATTELMANN, R.C., BERG, N.H., & RECTOR, J. (1983); The Potential for Increasing Stream-
flow from Sierra Nevada Watersheds. Water Resources Bulletin 19(3), pp. 395-402.KNORR, W., PRENTICE, I.C., HOUSE, J.I., HOLLAND, E.A. (2005); Long-term sensitivity of
soil carbon turnover to warming. Nature 433, pp. 298-301.LAL, R. (2004); Soil Carbon Sequestration Impacts on Global Climate Change and Food Security.
Science 304, pp. 1623-1627. LOVELOCK, J. (1995); Gaia, A New Look At Life on Earth. Oxford University Press. 171 pp. LEMESHKO, N.A. & BORZENKOVA I.I. (2001); Hydrological regime of the largest Russian
Freshwater Lakes by 2°C global warming. 9-th International Conference on the Conservation and Man-agement of Lakes. 11-15 November 2001. Japan, pp. 13-16.
MANABE, S. & STOUFFER, R.J., (1980); Sensitivity of a Global Climate Model to an Increase of CO2 Concentration in the Atmosphere. Journal of Geophysıcal Research 85 (C10), pp. 5529-5554.
162
Environmental security, geological hazards and management© 2013 ISBN 978-84-616-2005-0
MEEHL, G.A. & WASHINGTON, W.M., COLLINS, W.D., ARBLASTER, J.M., HU, A., BUJA, L.E., STRAND, W.G., TENG, H. (2005); How Much More Global Warming and Sea Level Rise? Science, 307, pp. 1769-1772.
MILLIYET (Newspaper) (2012); İstanbul 51 Ilin Toplami Kadar Elektrik Tüketti. http://eko-nomi.milliyet.com.tr/istanbul-51-ilin-toplami-kadar-elektriktuketti/ekonomi/ekonomide-tay/31.07.2011/1420930/default.htm (18.03.2013).
ODUM, E.P. & BARRETT. G.W. (2005); Fundamentals of Ecology. Fifth Edition. Thomson Brooks/Cole, Belmont, California: 598 pp.
PEEL, M.C. & MCMAHON, T.A. (2006); A quality-controlled global runoff data set. Nature 444, pp. E14-E15
PETER, M. & VITOUSEK, P.M. (1994); Beyond Global Warming: Ecology and Global Change. Ecology 75 (7), pp. 1861-1876.
PETERSON, G., DE LEO, G.A., HELLMANN, J.J., JANSSEN, M.A., KINZIG, A., MALCOLM, J.R., O’BRIEN, K.L., POPE, S.E., ROTHMAN, D.S., SHEVLIAKOVA, E., TINCH, R.R.T. (1997); Uncertainty, Climate Change, and Adaptive Management. Conservation Ecology 1(2): 4.
RIEBEEK, H. (2012); 1975′den 2011′e İstanbul, çev. Güler, B., İstanbul.RODHE, H. (1990); A comparison of the contributions of various gases to the greenhouse effect.
Science 248, pp. 1217-1219.SATTERTHWAITE, D. (2009); “The Implications of Population Growth and Urbaniza-
tion for Climate Change.” Pp 45-63 in: Population Dynamics and Climate Change, edited by J.M.Guzmán, G. Martine, G. McGran han, D. Schensul and C. Tacoli. New York: UNFPA; London: IIED.
SERTEL, E. & ORMECI, C. (2011); Modelling land cover change impact on the summer climate of the Marmara Region, Turkey. Int. J. Global Warming 3(1/2), pp. 194-202.
SPENCER, H. (1884); Principles of Biology Vol II.,. D. Appleton & Company, 1866, 578 pp.TÜRKIYE İSTATISTIK KURUMU (TÜİK), (2012); Adrese Dayalı Nüfus Kayıt Sistemi Sonuçları -
Dönemi: 2012. http://www.tuik.gov.tr (17.03.2012).ÜN, C. (2006); İstanbul İli Orman Kaynaklarında Meydana Gelen Zamansal Değişimin Uzaktan Algılama ve
CBS ile belirlenmesi, Karedeniz Teknik Üniversitesi, Fen Bilimleri Enstitüsü, Yüksek Lisans Tezi, 104 pp.
WELCH, D.W., ISHIDA, Y., NAGASAWA, K. (1998). Thermal limits and ocean migrations of sockeye salmon (Oncorhynchus nerka): long-term consequences of global warming. Can. J. Fish. Aquat. Sci.55, pp. 937-948.
VITOUSEK, P.M. (1994); Beyond Global Warming: Ecology and Global Change. Ecology 75(7), pp. 1861-1876.
163
Part 2Water Management and Protection
EFFECT OF VINEYARD MANAGEMENT ON THE SOIL QUALITY, ‘VINO DE TORO’ DISTRICT, WESTERN SPAIN
M. Isabel González, *José A. EgidoFaculty of Agricultural and Environmental Sciences. University of Salamanca, Salamanca 37080
(Spain). <[email protected]>.
Juan F. Gallardo C.S.I.C., IRNASa, Salamanca 37071 (Spain). <[email protected]>.
1. INTRODUCTION
In recent years the surface dedicated to vineyards has significantly increased in areas with designations of origin (with high added value). This entails new managements, eliminating some measures of conservation because costs, affecting the physical and chemical proper-ties of the soil. There are few references to the effect of the cultivation (shallow ploughing) and the chemicals addition on the vineyards, especially in relation to soil compaction and contamination during the annual cycle of the vine (Van Dyck & Van Asch, 2002; Ferrero et al., 2005) and, moreover, specifically related to vineyards of Western Spain. Five areas have appellation of origin for wines in the Castilla y León Plateau; for that reason, there is strong pressure for expansion and increasing production of vineyards, especially close to the village of Toro (Province of Zamora); furthermore, there is a marked improvement of the quality of the wines in recent years.
Additions of chemicals for preventing emergency or removing parasites are common in vineyards. Among most common parasites should be highlight the fungi including: downy mildew (Plasmopara viticola), powdery mildew (Uncinula necator), and tinder (Stereum hirsutum Per. and Phellinus igniarius Fr.). The use of inorganic pesticides, such as the ‘Bordeaux broth’ (Cu sulphate with lime), is very common for the treatment of mildew; in some cases S is also added for preventing the powdery mildew. Then, a substantial amount of Cu added annually as sulphate and should remain in the soil, where it is often adsorbed on the soil epipedons (Deluisa et al., 1996; Florez-Vélez et al., 1996; Brun et al., 1998), either in the subsurface (de-pending on the soil clay and SOM contents). Therefore, there is a risk of environmental pol-lution that affects the quality of the soil (Besnard et al., 2001), but the behaviour of Cu in soil differs depending on the soil characteristics. The Cu is adsorbed by soils, according to their pH and texture; its soil accumulation is favoured by recurrent annual treatments. Thus, in calcareous soils an important part of the Cu is retained by the CaCO3, although this retention is also influenced by the presence of SOM or clay (with capacity of adsorption or complexa-tion). Likewise, the presence of organic compounds added (such as manures or fungicides) alters the chemical balance of the soil, causing differences in the type of contamination.
164
Environmental security, geological hazards and management© 2013 ISBN 978-84-616-2005-0
The objective of this study was to assess the soil changes produced by the vineyard man-agement in the area of appellation of origin ‘Vino de Toro’ (province of Zamora, Western Spain). Physicochemical and biochemical properties of vineyard soils were determinate and compared with those from a site with natural vegetation as reference, were performed to check the possible soil changes.
2. MATERIALS AND METHODS
The study area is located to the South of the province of Zamora, being comprised between the Douro River to the South and West of the province of Valladolid and having as central to the city of Toro (Western Spain). The region is nearly flat (Castilla y León Plateau), with gentle slopes and small mounds; mean altitude is 700 m a.s.l. The climate is typically continental semiarid character, with Atlantic influences. The annual rainfall ranges from 350 to 400 mm yr-1. Temperatures are extreme (hot summers and very cold winters, with a thermal oscilla-tion from +42 °C to -15 °C). Helio-thermic index is 4.23 and the number of effective hours of sunshine is 2,600 h (up to 3,000 h). Vineyards sit on several materials (gravel, gravel or sandy-clayey sediments) of Quaternary terraces, Pliocene sediments (sandstones, clays, and limestone) or Miocene unconsolidated materials (silty sediments, sandstones, and sometimes levels of limestone or marls). Dominant soils are calcareous Cambisols, calcic Luvisols (more developed North of the area), and Arenosols (on low terraces of the rivers) or Fluvisols (ap-proaching to the Douro River or one of its tributaries). The natural vegetation is Pinus pin-aster or P. pinea in sandy areas and Quercus rotundifolia in limestone areas. In the wine-growing areas extend the Vitis vinifera L. dominating the native variety ‘tinta de Toro’ planted in pots or frames, depending on the quality desired. Within the cultivated areas were considered three different vineyard ages: (a) less than 10 years; (b) between 10 and 40 years; and (c) more than 40 years. Twenty soil composed samples were collected from the most superficial part of the soil floor (0-20 cm). One soil sampled has natural vegetation (reference) and the other three soils (always with similar soil characteristics) belong each one to the three different areas of culture indicated (according the vineyard age). Soil samples collected in the field were ana-lyzed in the ‘Laboratory of Soil Science’ of the Faculty of Agrarian & Environmental Sci-ences (University of Salamanca). The methodology followed was the usual for soil analysis; an Analyzer LECO 2000 was used for analyzing soil C, N and S. Acid digestion proposed by Harstein et al. (1973) was followed for determination of total metals; and for available nutrient determination, EDTA extraction was performed. The final determinations were done using atomic absorption Spectrotometry and I.C.P. For statistical analysis of the data the Kolmogorov-Smirnov test was performed and for comparative data analysis between the areas of natural vegetation and vineyards an ANOVA was applied, looking for differences between the different ages of the vineyards, and between them and the natural vegetation. These treatments have been carried out with the program SPSS 17.0 (level of significance: P <0.05).
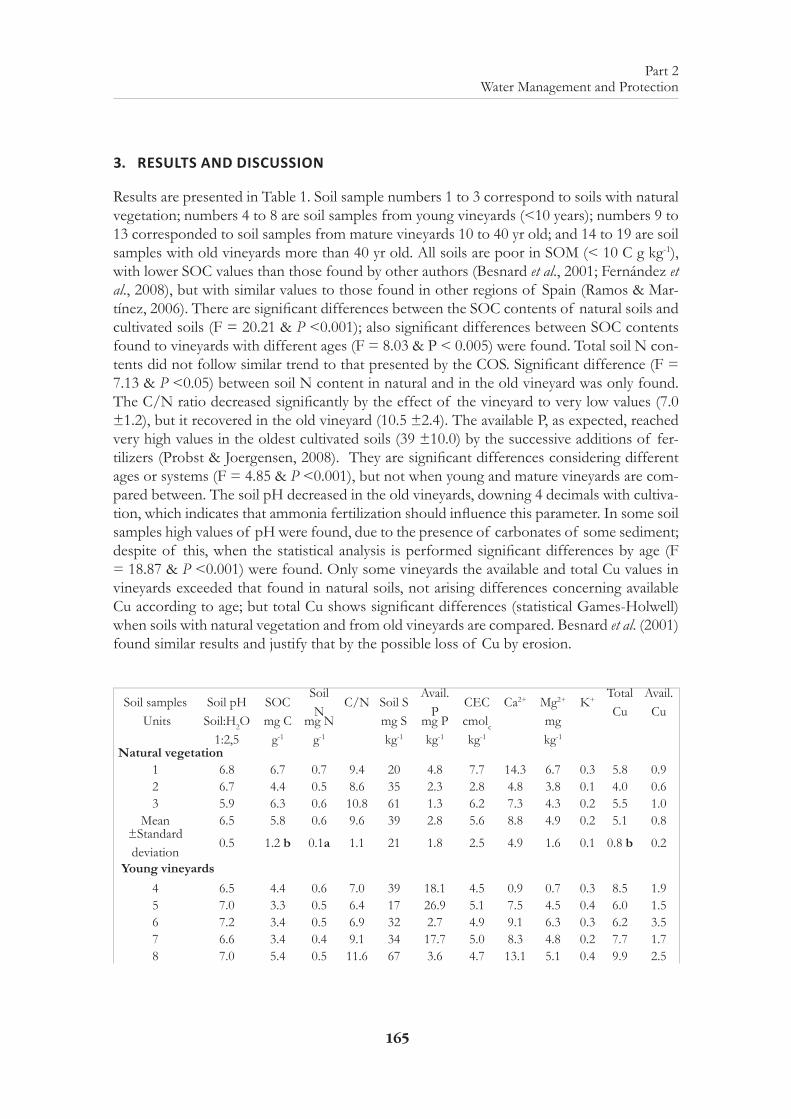
165
Part 2Water Management and Protection
3. RESULTS AND DISCUSSION
Results are presented in Table 1. Soil sample numbers 1 to 3 correspond to soils with natural vegetation; numbers 4 to 8 are soil samples from young vineyards (<10 years); numbers 9 to 13 corresponded to soil samples from mature vineyards 10 to 40 yr old; and 14 to 19 are soil samples with old vineyards more than 40 yr old. All soils are poor in SOM (< 10 C g kg-1), with lower SOC values than those found by other authors (Besnard et al., 2001; Fernández et al., 2008), but with similar values to those found in other regions of Spain (Ramos & Mar-tínez, 2006). There are significant differences between the SOC contents of natural soils and cultivated soils (F = 20.21 & P <0.001); also significant differences between SOC contents found to vineyards with different ages (F = 8.03 & P < 0.005) were found. Total soil N con-tents did not follow similar trend to that presented by the COS. Significant difference (F = 7.13 & P <0.05) between soil N content in natural and in the old vineyard was only found. The C/N ratio decreased significantly by the effect of the vineyard to very low values (7.0 ±1.2), but it recovered in the old vineyard (10.5 ±2.4). The available P, as expected, reached very high values in the oldest cultivated soils (39 ±10.0) by the successive additions of fer-tilizers (Probst & Joergensen, 2008). They are significant differences considering different ages or systems (F = 4.85 & P <0.001), but not when young and mature vineyards are com-pared between. The soil pH decreased in the old vineyards, downing 4 decimals with cultiva-tion, which indicates that ammonia fertilization should influence this parameter. In some soil samples high values of pH were found, due to the presence of carbonates of some sediment; despite of this, when the statistical analysis is performed significant differences by age (F = 18.87 & P <0.001) were found. Only some vineyards the available and total Cu values in vineyards exceeded that found in natural soils, not arising differences concerning available Cu according to age; but total Cu shows significant differences (statistical Games-Holwell) when soils with natural vegetation and from old vineyards are compared. Besnard et al. (2001) found similar results and justify that by the possible loss of Cu by erosion.
Soil samples Soil pH SOCSoil N
C/N Soil SAvail.
P CEC Ca2+ Mg2+ K+
Total Cu
Avail. Cu
Units Soil:H2O 1:2,5
mg C g-1
mg N g-1
mg S kg-1
mg P kg-1
cmolc kg-1
mg kg-1
Natural vegetation1 6.8 6.7 0.7 9.4 20 4.8 7.7 14.3 6.7 0.3 5.8 0.92 6.7 4.4 0.5 8.6 35 2.3 2.8 4.8 3.8 0.1 4.0 0.63 5.9 6.3 0.6 10.8 61 1.3 6.2 7.3 4.3 0.2 5.5 1.0
Mean 6.5 5.8 0.6 9.6 39 2.8 5.6 8.8 4.9 0.2 5.1 0.8±Standard deviation
0.5 1.2 b 0.1a 1.1 21 1.8 2.5 4.9 1.6 0.1 0.8 b 0.2
Young vineyards4 6.5 4.4 0.6 7.0 39 18.1 4.5 0.9 0.7 0.3 8.5 1.95 7.0 3.3 0.5 6.4 17 26.9 5.1 7.5 4.5 0.4 6.0 1.56 7.2 3.4 0.5 6.9 32 2.7 4.9 9.1 6.3 0.3 6.2 3.57 6.6 3.4 0.4 9.1 34 17.7 5.0 8.3 4.8 0.2 7.7 1.78 7.0 5.4 0.5 11.6 67 3.6 4.7 13.1 5.1 0.4 9.9 2.5
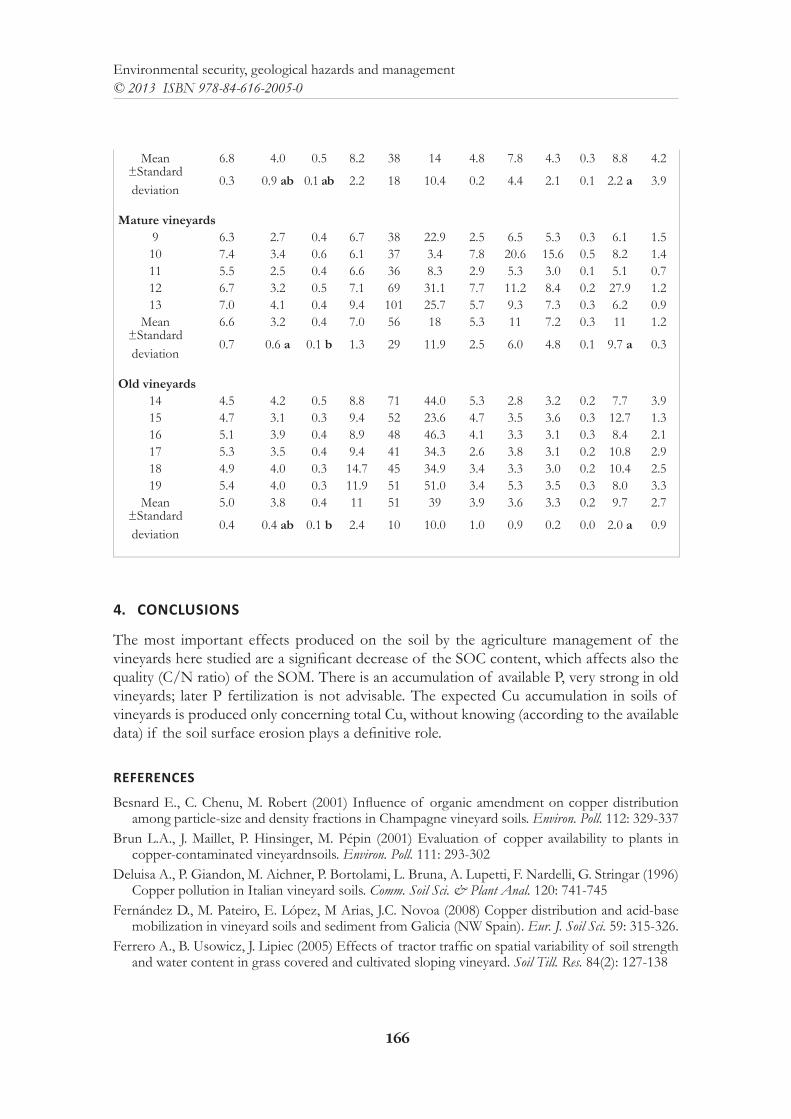
166
Environmental security, geological hazards and management© 2013 ISBN 978-84-616-2005-0
Mean 6.8 4.0 0.5 8.2 38 14 4.8 7.8 4.3 0.3 8.8 4.2±Standard deviation
0.3 0.9 ab 0.1 ab 2.2 18 10.4 0.2 4.4 2.1 0.1 2.2 a 3.9
Mature vineyards
9 6.3 2.7 0.4 6.7 38 22.9 2.5 6.5 5.3 0.3 6.1 1.510 7.4 3.4 0.6 6.1 37 3.4 7.8 20.6 15.6 0.5 8.2 1.411 5.5 2.5 0.4 6.6 36 8.3 2.9 5.3 3.0 0.1 5.1 0.712 6.7 3.2 0.5 7.1 69 31.1 7.7 11.2 8.4 0.2 27.9 1.213 7.0 4.1 0.4 9.4 101 25.7 5.7 9.3 7.3 0.3 6.2 0.9
Mean 6.6 3.2 0.4 7.0 56 18 5.3 11 7.2 0.3 11 1.2±Standard deviation
0.7 0.6 a 0.1 b 1.3 29 11.9 2.5 6.0 4.8 0.1 9.7 a 0.3
Old vineyards
14 4.5 4.2 0.5 8.8 71 44.0 5.3 2.8 3.2 0.2 7.7 3.915 4.7 3.1 0.3 9.4 52 23.6 4.7 3.5 3.6 0.3 12.7 1.316 5.1 3.9 0.4 8.9 48 46.3 4.1 3.3 3.1 0.3 8.4 2.117 5.3 3.5 0.4 9.4 41 34.3 2.6 3.8 3.1 0.2 10.8 2.918 4.9 4.0 0.3 14.7 45 34.9 3.4 3.3 3.0 0.2 10.4 2.519 5.4 4.0 0.3 11.9 51 51.0 3.4 5.3 3.5 0.3 8.0 3.3
Mean 5.0 3.8 0.4 11 51 39 3.9 3.6 3.3 0.2 9.7 2.7±Standard deviation
0.4 0.4 ab 0.1 b 2.4 10 10.0 1.0 0.9 0.2 0.0 2.0 a 0.9
4. CONCLUSIONS
The most important effects produced on the soil by the agriculture management of the vineyards here studied are a significant decrease of the SOC content, which affects also the quality (C/N ratio) of the SOM. There is an accumulation of available P, very strong in old vineyards; later P fertilization is not advisable. The expected Cu accumulation in soils of vineyards is produced only concerning total Cu, without knowing (according to the available data) if the soil surface erosion plays a definitive role.
REFERENCES
Besnard E., C. Chenu, M. Robert (2001) Influence of organic amendment on copper distribution among particle-size and density fractions in Champagne vineyard soils. Environ. Poll. 112: 329-337
Brun L.A., J. Maillet, P. Hinsinger, M. Pépin (2001) Evaluation of copper availability to plants in copper-contaminated vineyardnsoils. Environ. Poll. 111: 293-302
Deluisa A., P. Giandon, M. Aichner, P. Bortolami, L. Bruna, A. Lupetti, F. Nardelli, G. Stringar (1996) Copper pollution in Italian vineyard soils. Comm. Soil Sci. & Plant Anal. 120: 741-745
Fernández D., M. Pateiro, E. López, M Arias, J.C. Novoa (2008) Copper distribution and acid-base mobilization in vineyard soils and sediment from Galicia (NW Spain). Eur. J. Soil Sci. 59: 315-326.
Ferrero A., B. Usowicz, J. Lipiec (2005) Effects of tractor traffic on spatial variability of soil strength and water content in grass covered and cultivated sloping vineyard. Soil Till. Res. 84(2): 127-138

167
Part 2Water Management and Protection
Florez-Vélez L., J. Ducaroir, A.M. Jaunet, M. Robert (1996) Study of the distribution of copper in an acid Sandy vineyard soil by three different methods. Eur. J. Soil Sci. 47: 523-532
Hartstein M., R.W. Freedman, D.W. Platter (1973) Novel wet-digestion procedure for trace-metal analysis of coal by atomic absorption. Anal. Chem., 45(3): 611–614
Probst B.R., G. Joergensen (2008) Vineyard soils under organic and conventional management- mi-crobial biomass and activity indices and their relation to soil chemical properties. Biol. Fert. Soils 44: 443-450
Ramos M.C., J.A. Martínez (2006) Nutrient losses by runoff in vineyard s of the Mediterranean Alt Penedès region (NE Spain). Agri. Ecosyst. & Environ.113: 356-363
Van Dijck S.J.E., T.W.J. Van Asch, 2002 Compactation of loamy soils due to tractor traffic in vine-yards and orchards and its effect on infiltration in Southern France. Soil Till. Res. 63: 141-145.

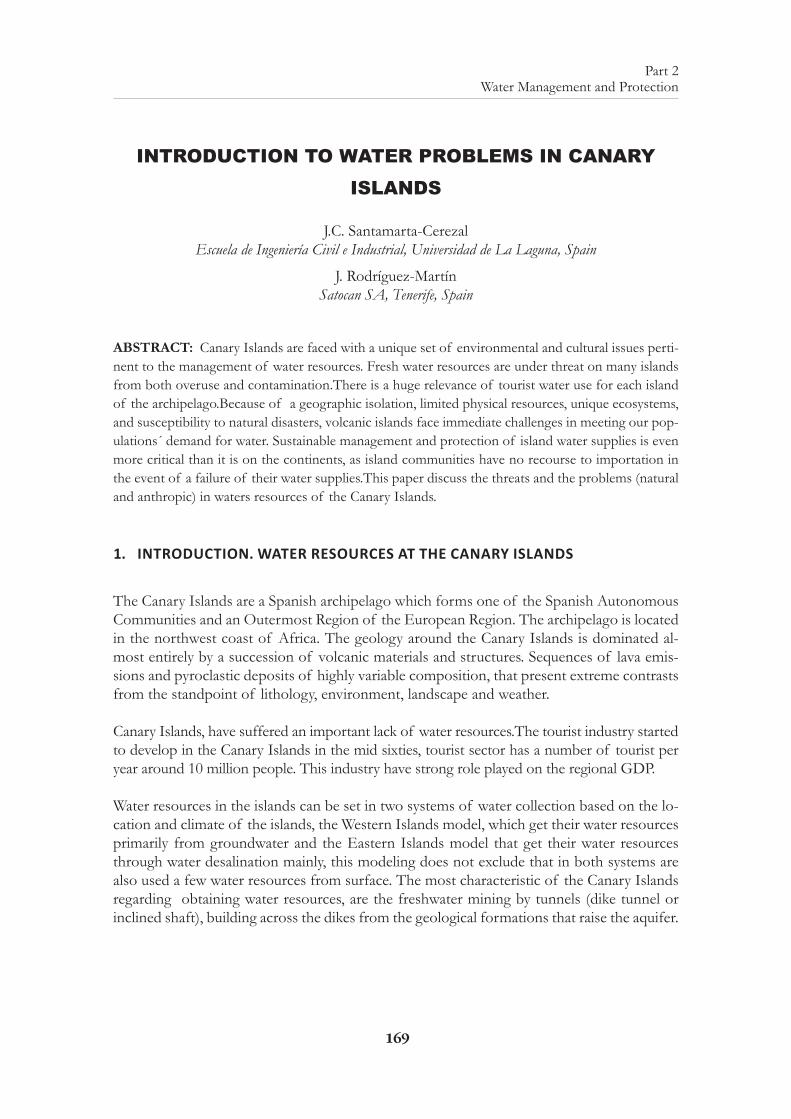
169
Part 2Water Management and Protection
INTRODUCTION TO WATER PROBLEMS IN CANARY ISLANDS
J.C. Santamarta-CerezalEscuela de Ingeniería Civil e Industrial, Universidad de La Laguna, Spain
J. Rodríguez-MartínSatocan SA, Tenerife, Spain
ABSTRACT: Canary Islands are faced with a unique set of environmental and cultural issues perti-nent to the management of water resources. Fresh water resources are under threat on many islands from both overuse and contamination.There is a huge relevance of tourist water use for each island of the archipelago.Because of a geographic isolation, limited physical resources, unique ecosystems, and susceptibility to natural disasters, volcanic islands face immediate challenges in meeting our pop-ulations´ demand for water. Sustainable management and protection of island water supplies is even more critical than it is on the continents, as island communities have no recourse to importation in the event of a failure of their water supplies.This paper discuss the threats and the problems (natural and anthropic) in waters resources of the Canary Islands.
1. INTRODUCTION. WATER RESOURCES AT THE CANARY ISLANDS
The Canary Islands are a Spanish archipelago which forms one of the Spanish Autonomous Communities and an Outermost Region of the European Region. The archipelago is located in the northwest coast of Africa. The geology around the Canary Islands is dominated al-most entirely by a succession of volcanic materials and structures. Sequences of lava emis-sions and pyroclastic deposits of highly variable composition, that present extreme contrasts from the standpoint of lithology, environment, landscape and weather.
Canary Islands, have suffered an important lack of water resources.The tourist industry started to develop in the Canary Islands in the mid sixties, tourist sector has a number of tourist per year around 10 million people. This industry have strong role played on the regional GDP.
Water resources in the islands can be set in two systems of water collection based on the lo-cation and climate of the islands, the Western Islands model, which get their water resources primarily from groundwater and the Eastern Islands model that get their water resources through water desalination mainly, this modeling does not exclude that in both systems are also used a few water resources from surface. The most characteristic of the Canary Islands regarding obtaining water resources, are the freshwater mining by tunnels (dike tunnel or inclined shaft), building across the dikes from the geological formations that raise the aquifer.
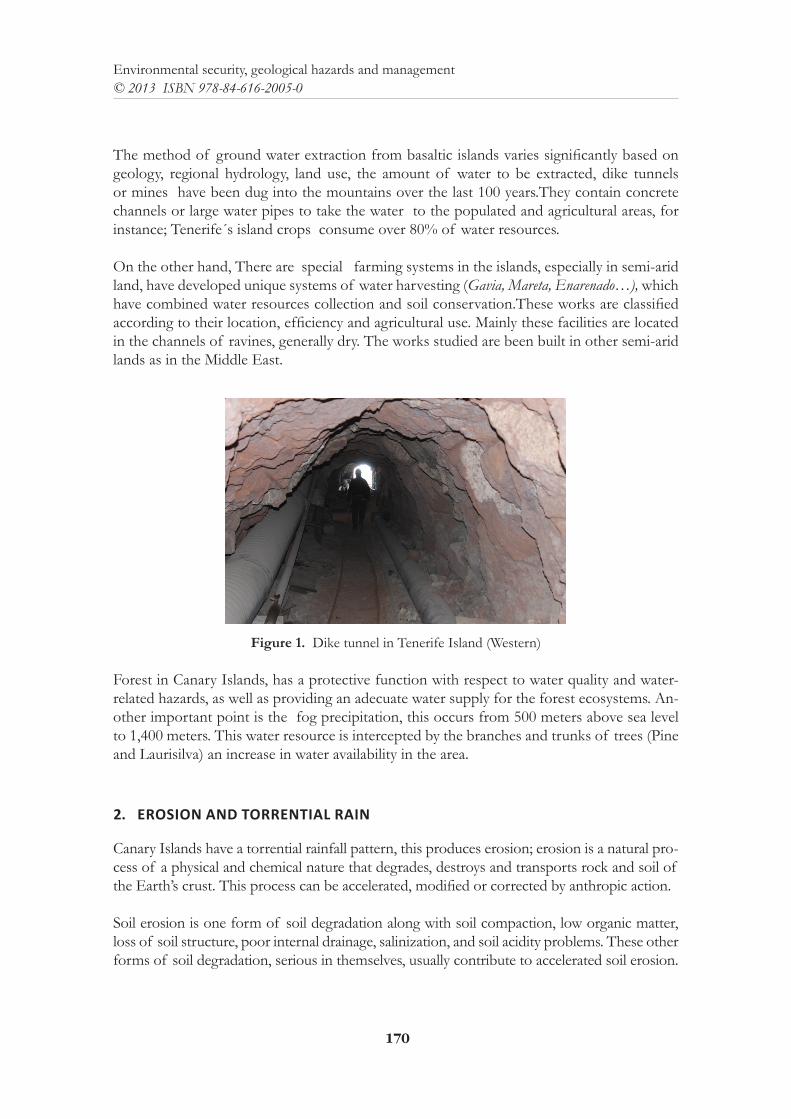
170
Environmental security, geological hazards and management© 2013 ISBN 978-84-616-2005-0
The method of ground water extraction from basaltic islands varies significantly based on geology, regional hydrology, land use, the amount of water to be extracted, dike tunnels or mines have been dug into the mountains over the last 100 years.They contain concrete channels or large water pipes to take the water to the populated and agricultural areas, for instance; Tenerife´s island crops consume over 80% of water resources.
On the other hand, There are special farming systems in the islands, especially in semi-arid land, have developed unique systems of water harvesting (Gavia, Mareta, Enarenado…), which have combined water resources collection and soil conservation.These works are classified according to their location, efficiency and agricultural use. Mainly these facilities are located in the channels of ravines, generally dry. The works studied are been built in other semi-arid lands as in the Middle East.
Figure 1. Dike tunnel in Tenerife Island (Western)
Forest in Canary Islands, has a protective function with respect to water quality and water-related hazards, as well as providing an adecuate water supply for the forest ecosystems. An-other important point is the fog precipitation, this occurs from 500 meters above sea level to 1,400 meters. This water resource is intercepted by the branches and trunks of trees (Pine and Laurisilva) an increase in water availability in the area.
2. EROSION AND TORRENTIAL RAIN
Canary Islands have a torrential rainfall pattern, this produces erosion; erosion is a natural pro-cess of a physical and chemical nature that degrades, destroys and transports rock and soil of the Earth’s crust. This process can be accelerated, modified or corrected by anthropic action.
Soil erosion is one form of soil degradation along with soil compaction, low organic matter, loss of soil structure, poor internal drainage, salinization, and soil acidity problems. These other forms of soil degradation, serious in themselves, usually contribute to accelerated soil erosion.
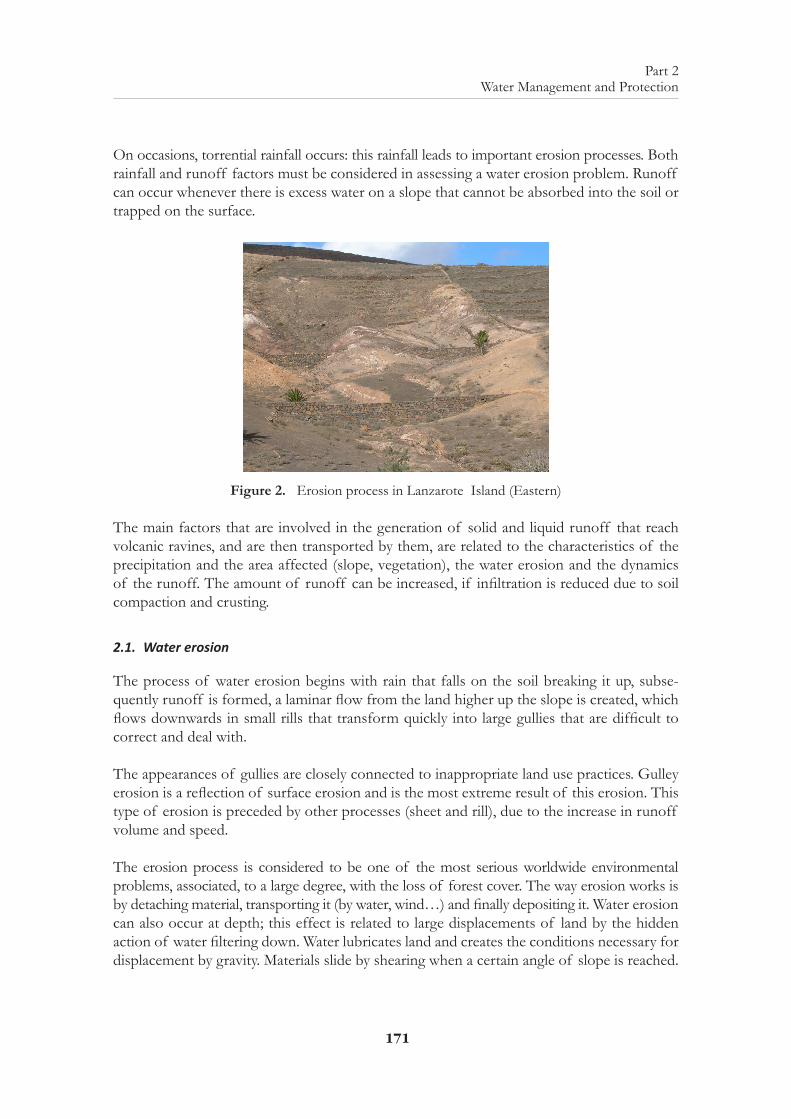
171
Part 2Water Management and Protection
On occasions, torrential rainfall occurs: this rainfall leads to important erosion processes. Both rainfall and runoff factors must be considered in assessing a water erosion problem. Runoff can occur whenever there is excess water on a slope that cannot be absorbed into the soil or trapped on the surface.
Figure 2. Erosion process in Lanzarote Island (Eastern)
The main factors that are involved in the generation of solid and liquid runoff that reach volcanic ravines, and are then transported by them, are related to the characteristics of the precipitation and the area affected (slope, vegetation), the water erosion and the dynamics of the runoff. The amount of runoff can be increased, if infiltration is reduced due to soil compaction and crusting.
2.1. Water erosion
The process of water erosion begins with rain that falls on the soil breaking it up, subse-quently runoff is formed, a laminar flow from the land higher up the slope is created, which flows downwards in small rills that transform quickly into large gullies that are difficult to correct and deal with.
The appearances of gullies are closely connected to inappropriate land use practices. Gulley erosion is a reflection of surface erosion and is the most extreme result of this erosion. This type of erosion is preceded by other processes (sheet and rill), due to the increase in runoff volume and speed.
The erosion process is considered to be one of the most serious worldwide environmental problems, associated, to a large degree, with the loss of forest cover. The way erosion works is by detaching material, transporting it (by water, wind…) and finally depositing it. Water erosion can also occur at depth; this effect is related to large displacements of land by the hidden action of water filtering down. Water lubricates land and creates the conditions necessary for displacement by gravity. Materials slide by shearing when a certain angle of slope is reached.
172
Environmental security, geological hazards and management© 2013 ISBN 978-84-616-2005-0
Figure 3. Dam of sediments in a ravine at Gran Canaria Island (Eastern)
Another effect of water erosion, especially when caused by torrential rainfall, is when the soil becomes saturated with water after many days of rain. This ends up provoking landslides on slopes: the consequences and size of these depend on the angle of the slope on which they occur.
2.2. Wind erosion
Wind erosion is the loss of the soil surface layer by the wind action. This is a selective process because it affects only particles on the soil surface and depends on grain diameter. Wind ero-sion is a major geomorphological process in arid and semi-arid areas. The rate and magnitude of soil erosion by wind is determined by factors such as particle sizes: very fine particles can be suspended by the wind and then transported great distances; fine and medium-size particles can be lifted and deposited. Other factors are regional climate and wind. The speed and duration of the wind has a direct relationship with the extent of soil erosion. Vegetation cover is also important, as the lack of permanent vegetation cover in certain locations has resulted in extensive erosion by wind, is usually at the Eastern Islands.
3. FLOOD EFECTS
The dictionary defines a flood as a great flowing or overflowing of water, especially over land not usually submerged. Floods are caused by sudden changes in water level, so the level exceeds its natural confinement and covers a portion of land not previously covered.
Heavy rains along the south-western zone of the Canary Islands are common during a few days most of the years,the destructive power of a flood is mainly due to two factors. First, there is the power of erosion and transport of material by the water when a rise in its level occurs. Secondly, there is the fact that floodplains in their morphology and natural wealth provide very favourable conditions for human settlements,With higher velocities, streams
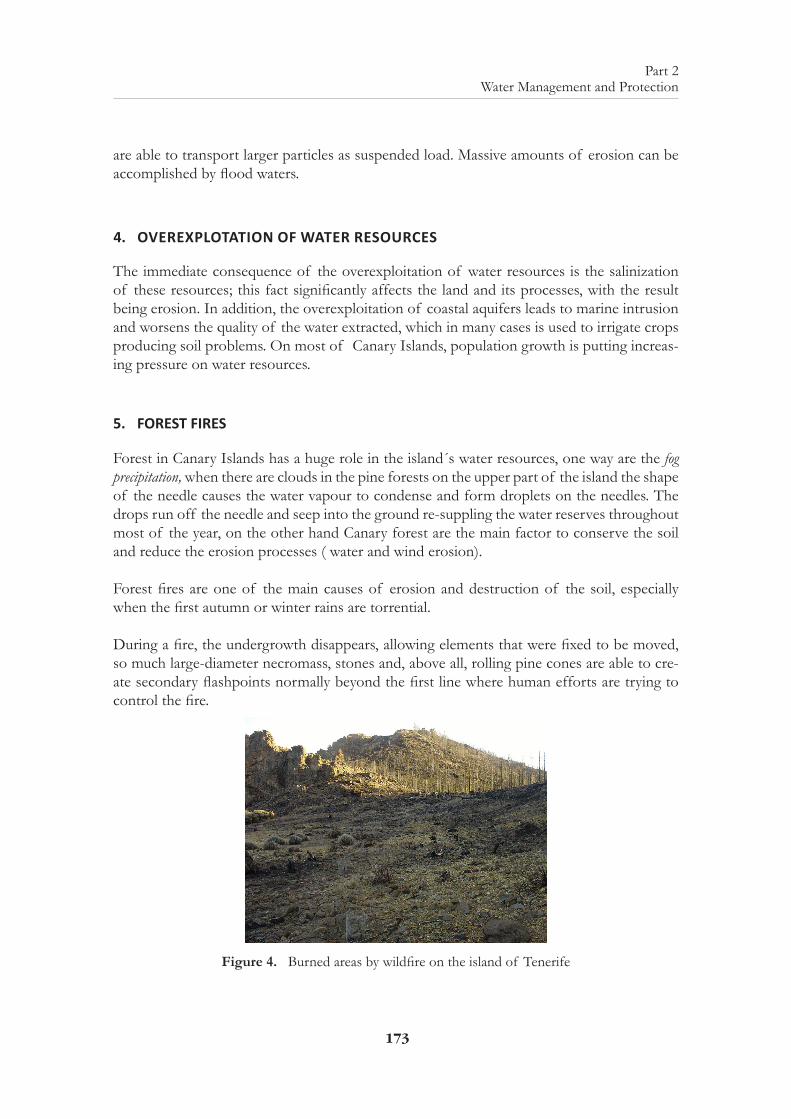
173
Part 2Water Management and Protection
are able to transport larger particles as suspended load. Massive amounts of erosion can be accomplished by flood waters.
4. OVEREXPLOTATION OF WATER RESOURCES
The immediate consequence of the overexploitation of water resources is the salinization of these resources; this fact significantly affects the land and its processes, with the result being erosion. In addition, the overexploitation of coastal aquifers leads to marine intrusion and worsens the quality of the water extracted, which in many cases is used to irrigate crops producing soil problems. On most of Canary Islands, population growth is putting increas-ing pressure on water resources.
5. FOREST FIRES
Forest in Canary Islands has a huge role in the island´s water resources, one way are the fog precipitation, when there are clouds in the pine forests on the upper part of the island the shape of the needle causes the water vapour to condense and form droplets on the needles. The drops run off the needle and seep into the ground re-suppling the water reserves throughout most of the year, on the other hand Canary forest are the main factor to conserve the soil and reduce the erosion processes ( water and wind erosion).
Forest fires are one of the main causes of erosion and destruction of the soil, especially when the first autumn or winter rains are torrential.
During a fire, the undergrowth disappears, allowing elements that were fixed to be moved, so much large-diameter necromass, stones and, above all, rolling pine cones are able to cre-ate secondary flashpoints normally beyond the first line where human efforts are trying to control the fire.
Figure 4. Burned areas by wildfire on the island of Tenerife
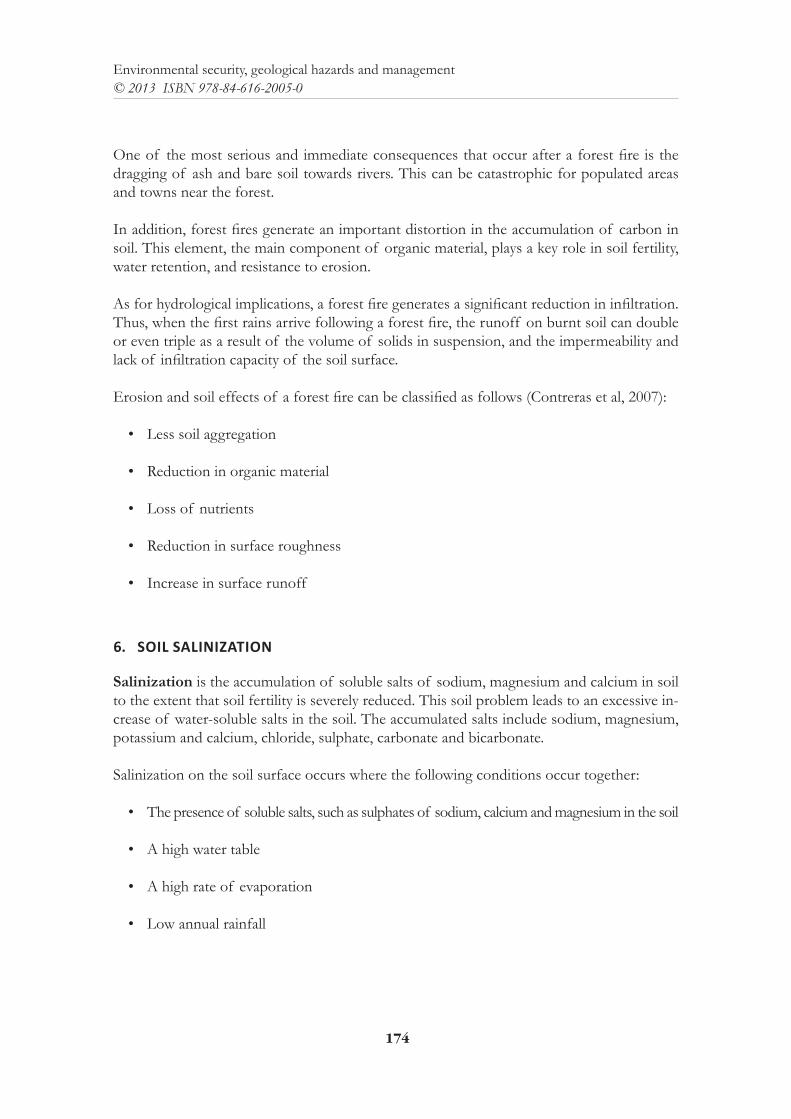
174
Environmental security, geological hazards and management© 2013 ISBN 978-84-616-2005-0
One of the most serious and immediate consequences that occur after a forest fire is the dragging of ash and bare soil towards rivers. This can be catastrophic for populated areas and towns near the forest.
In addition, forest fires generate an important distortion in the accumulation of carbon in soil. This element, the main component of organic material, plays a key role in soil fertility, water retention, and resistance to erosion.
As for hydrological implications, a forest fire generates a significant reduction in infiltration. Thus, when the first rains arrive following a forest fire, the runoff on burnt soil can double or even triple as a result of the volume of solids in suspension, and the impermeability and lack of infiltration capacity of the soil surface.
Erosion and soil effects of a forest fire can be classified as follows (Contreras et al, 2007):
• Less soil aggregation
• Reduction in organic material
• Loss of nutrients
• Reduction in surface roughness
• Increase in surface runoff
6. SOIL SALINIZATION
Salinization is the accumulation of soluble salts of sodium, magnesium and calcium in soil to the extent that soil fertility is severely reduced. This soil problem leads to an excessive in-crease of water-soluble salts in the soil. The accumulated salts include sodium, magnesium, potassium and calcium, chloride, sulphate, carbonate and bicarbonate.
Salinization on the soil surface occurs where the following conditions occur together:
• The presence of soluble salts, such as sulphates of sodium, calcium and magnesium in the soil
• A high water table
• A high rate of evaporation
• Low annual rainfall
175
Part 2Water Management and Protection
One of the effects of salinization is that salts in the soil increase the efforts required by plant roots to take in water. High levels of salt in the soil have a similar effect as droughts by mak-ing water less available for uptake by plant roots. Salty groundwater may also contribute to salinization. When the water table rises, the salty groundwater may reach the upper soil layers and, thus, supply salts to the rootzone.
The control of sodium and salinity hazard is required for irrigation.
7. HYDROCHEMICAL CHARACTERISTICS AND WATER QUALITY
Water quality is the critical factor that influence on human health and quantity and quality. fluoride are naturally present in deep parts of the islands´s aquifer. This natural fluoride comes from the geological formations.Excess fluorine is recognized as the most hazardous leachate in water supplies.In parallel with the progressive decline in groundwater levels we have seen a worsening in the quality of groundwater. The factors that influence this degrada-tion can be naturally occurring, such as the exploitation of fossil water with more mineraliza-tion and dissolved CO2, or anthropogenic: saltwater intrusion, pollution and contamination by irrigation returns. The presence of increasingly saline waters, sometimes with evidence of seawater intrusion in coastal aquifers or nitrate concentrations that sometimes reach and exceed 400 mg / L and pesticide residues, all of these are clear indications that these phe-nomena are occurring in the islands, although in each case must be studied in detail to be characterized. Recent eruptions generally have caused few water-quality problems also.
Figure 5. Carbonates in a mine of water
176
Environmental security, geological hazards and management© 2013 ISBN 978-84-616-2005-0
8. ENERGY FOR PRODUCING WATER. DESALINATION PLANTS
Desalination is the process of creating fresh water by removing salt from the sea. Reverse osmosis is currently the most commonly found type of desalination, and multistage flash distillation is the method that currently produces the most amount of desalinated water in Canary Islands, This process requires large amounts of energy. In the eastern islands up to 1965 was an water stress situation, extreme aridity and scarcity of water resources are the main problem in the water planning, in this case, due to the very arid climate, water is ex-tremely limited on this islands, these islands Lanzarote and Fuerteventura have also shown the viability of using desalination as a sole source for water, generally desalination introduces a new variable in the limits of development, expandability of natural resources, and carrying capacity of the environment. In the Canary Islands desalination represents more than 30%; for Lanzarote Island, this figure is around 80%. The increment of desalination has meant ad-ditional energy consumption; currently de salination represents in the islands approximately 10% of electricity consumption, in some islands this percentage raises up to 25%. This situ-ation, in the future, could be unsustainable.
9. DISCUSSION AND CONCLUSIONS
Western Islands generally rely on ground water for community and domestic supply as the surface water sources are not reliable due to fluctuating stream flows and difficulty of build-ing reservoirs because of land area constraints. Water and its use have special characteristics in the Canary Islands when compared with the mainland. The water supply is not unlimited so measures are taken to ensure continuity of supply throughout the dry summer months. In the Western Islands intensive groundwater exploitation for more than a century, and es-pecially in the last half century, has produced a deep change in groundwater flow, the drying up of springs and the depletion of aquifer reserves.
Water quality is increased in quantity of salts and volcanic gases, mainly Fluor (4-8 mg/L), we noticed a decline in groundwater levels. The mining of water is replaced by the desalination of water although this is much more expensive and less sustainable due to rising cost of oil.
The integrated management of surface water and groundwater for drinking and irrigation is to solve the water issues. Canary Islands couldn´t recourse to water importation.The Canary Islands are totally dependent on the resources that nature provides. Increasing populations, tourism and changeability of rainfall regimes require a greater degree of preparedness than that needed in most continental regions. Western Islands, such as Tenerife, Gomera y La Palma are benefited with substantial groundwater storage while on Eastern Islands geological conditions and rainfall severely limit groundwater availability. On some islands, mostly in the Eastern, de-salination powered by expensive imported fuel, provides the drinking water at a high cost. In some areas residents perforce rely mostly on rainwater catchment like for fog rain collectors.
177
Part 2Water Management and Protection
10. POSSIBLE TOPICS FOR FUTURE RESEARCH
This paper set out to investigate the role of water resources in the Canary Islands such as management, threats and protection. The volcanic islands are a global laboratory due to the large number of wells and mines that exist in the subsurface; this knowledge could be trans-ferred to other volcanic regions. There are many topics opened for future research, we could summarize in;
• Groundwater availability for water supply and irrigation
• Submarine groundwater discharge
• Groundwater quality affected by natural and anthropogenic contaminants
• Groundwater recharge
• Orography and precipitation variations
• Mass (erosion) loss due to heavy rainfall
• Flooding due to heavy rains & storm surge
• Rainwater harvesting
• Seawater intrusion into sewer systems
• Water for energy production on islands
• Efficiency of desalination plants
REFERENCES
Web of Civil Defense, Ministry of Civil defense & Emergency Management, New Zealand Govern-ment: http://wwwcivildefense.govt.nz
SANTAMARTA-CEREZAL, J.C. et al.(2013); Hidrología y Recursos Hídricos en Islas y Terrenos Volcánicos. Colegio de Ingenieros de Montes. Tenerife. Spain.
SANTAMARTA-CEREZAL, J.C. & NARANJO BORGES, J., Ed. (2013); Ingeniería Forestal y Ambi-ental en Medios Insulares. Técnicas y Experiencias en las Islas Canarias. Colegio de Ingenieros de Montes. Tenerife. Spain.
SANTAMARTA-CEREZAL, J.C. & HERNÁNDEZ.GUTIÉRREZ, L.E., & RODRÍGUEZ LOSADA, J.A.,(2010);Volcanic dikes engineering properties for storing and regulation of the underground water resources in volcanic islands.CRC Press.The Netherlands.
SANTAMARTA-CEREZAL, J.C.& RODRIGUEZ MARTÍN, J.(2011); Advances in explotation of un-derground water resources in volcanic islands. Experiences and methods in the Canary Islands. Water Resource Sustainability Issues on Tropical Islands. Honolulu, Hawaii, USA.
SANTAMARTA-CEREZAL, J.C. & RODRIGUEZ MARTÍN, J.(2011); Traditional systems for water harvesting and soil conservation in volvanic islands.Case study.The Canary Islands.Spain.Europe. Water Re-source Sustainability Issues on Tropical Islands. Honolulu, Hawaii, USA.
SANTAMARTA-CEREZAL, J.C. (2012);Study of Techniques to Increase Water Resources and Run-Off in Semiarid Regions. The Case of The Canary Islands and Israel.Journal of the Faculty of Forestry,Istanbul University. Vol.62. Turkey.

178
Environmental security, geological hazards and management© 2013 ISBN 978-84-616-2005-0
SANTAMARTA-CEREZAL, J.C. & GUZMAN, J. & NERIS, J.et al. (2012); Forest Hydrology, Soil Conservation and Green Barriers in Canary Islands.Notulae Botanicae. Vol.40.Romania.
PART 3
Geological Hazards

181
Part 3 Geological Hazards
STUDY OF L´AQUILA EARTHQUEAKE SENTENCE. SOME LEGAL ASPECTS OF THE ENVIRONMENTAL SECURITY
Luis-Javier Capote-PérezDepartamento de Disciplinas Jurídicas Básicas. Universidad de La Laguna. [email protected]
ABSTRACT: The paper introduces a little analysis of right to access and know the environmental information, utilising the sentenza 22 ottobre 2012 as an example of legal relevance of geological risks. This paper is part of an investigation in project DER2011-23321. El Registro de la Propiedad como instru-mento vertebrador de la información territorial; datos espaciales, metadatos y Directiva INSPIRE (II). Head of the project: Dra. María Elena Sánchez Jordán
1. INTRODUCTION
This paper pretends to draw an image of relations between Law and environmental sciences, explaining examples related as the civil liability rules (with L´Aquila case) or the spatial data infrastructures applied to geological hazards information.
L’Aquila case establishes an interesting –and maybe disturbing- concept about the responsi-bility of scientists in the treatment of information when there are consequences converted in damages that could be economical, moral or personal. L’Aquila earthquake occurred in the region of Abruzzo, in central Italy. The main shock occurred on 6 April 2009, and was rated 5.8 on the Richter scale and 6.3 on the moment magnitude scale. Its epicentre was near L’Aquila, the capital of Abruzzo, which together with surrounding villages suffered most damage. Two hundred ninety seven people (three hundred nine, according with other sources) are known to have died. In a subsequent inquiry of the handling of the disaster, seven members of the Italian National Commission for the Forecast and Prevention of Major Risks were accused of giving “inexact, incomplete and contradictory” information about the danger of the tremors prior to the main quake. On 22 October 2012, six scientists and one ex-government official were convicted of multiple manslaughter for downplaying the likelihood of a major earthquake six days before it took place. They were each sentenced to six years’ imprisonment. According to newspapers, the verdicts jolted the international scientific community, which feared they might open the way to an onslaught of legal actions against scientists who evaluate the risks of natural hazards.
Could a scientist be demanded with the accusation of a wrong evaluation of natural haz-ards? The sentence of the Italian judge gives a positive answer but that resolution has been appealed and we´ll have to expect for the second instance decision, but it´s obvious that the first verdict introduces a worrying precedent for the scientific community.
182
Environmental security, geological hazards and management© 2013 ISBN 978-84-616-2005-0
2. LEGAL ASPECTS OF GEOLOGICAL HAZARDS
According to sáncHez Jordán and maioli there is a right of the public to access environ-mental information is recognised since ONU / ECE Convention of 25 June 1998 in Aarhus. The European Union adhered to with proclamation 2005 / 370 / EC of 17 February 2005 and many of ONU Convention were transposed with decree 203 / 4 / EC and European Parlament and Council´s regulation EC 1367 / 2006, issued on 6 September 2006. The prin-ciples set in the Aarhus Convention are:
• Full access to environmental data
• Participation of citizen in decision-making processes of environmental policies
One way to access to environmental information is established by INSPIRE Directive and the use spatial data infrastructures. INSPIRE Directive is the abbreviated name for Directive 2007/2/EC of the European Parliament and of the Council of 14 March 2007 establishing an Infrastructure for Spatial Information in the European Community (INSPIRE). Accord-ing to INSPIRE EU Directive, a spatial data infrastructure is means metadata, spatial data sets and spatial data services; network services and technologies; agreements on sharing, access and use; and coordination and monitoring mechanisms, processes and procedures, established, operated or made available in accordance with this Directive (art. 3.1). Basic objective of INSPIRE are the establishment of the Infrastructure for Spatial Information in the European Community (hereinafter referred to as Inspire), for the purposes of Community environmental policies and policies or activities which may have an impact on the environment (art. 1.1). According with that EU establishes that Member States shall ensure that metadata are created for the spatial data sets and services corresponding to the themes listed in Annexes I, II and III, and that those metadata are kept up to date (art. 5.1). The annexes contain lists of spatial data and in ANNEX II.4 we can find geology characterised according to composition and structure. Includes bedrock, aquifers and geomorphology and in ANNEX III.12 appears vulnerable areas char-acterised according to natural hazards (all atmospheric, hydrologic, seismic, volcanic and wildfire phenomena that, because of their location, severity, and frequency, have the potential to seriously affect society), e.g. floods, landslides and subsidence, avalanches, forest fires, earthquakes, volcanic eruptions.
In this moment the Spanish State is working in its own spatial data infrastructure, Infraes-tructura de Datos Espaciales de España (IDEE) depends on Development Ministry. We can find information about seism and earthquakes in the IGN (Instituto Geográfico Nacional) web, at Sismic Information Service. INSPIRE Directive has been incorporated into Spanish Law in the Ley 14/2010, de 5 de julio, sobre las infraestructuras y los servicios de infor-mación geográfica en España.
Determined the existence of a public right to access and know environmental information and specifically data about seismic and volcanic phenomena and potential of earthquakes, we could make a short analysis of the Sentenza 22 ottobre 2012, Barberi e. a., Giud. Billi, that condemned six scientists considering that they were guilty of multiple and negligent man-slaughter.
183
Part 3 Geological Hazards
3. L´AQUILA EARTHQUAKE SENTENCE
The sentence of 22 October 2012 declares convicted six scientists and one ex-government official and condemned them to six years of imprisonment. The Judge based the decision in a wrong evaluation of risks with the information obtained in the days previous to the earth-quake and in an incorrect use of that information and its valuation to protect population.
Principal points of sentence fundaments are:
• The earthquake of 6th April 2009 was not and could not be considered as exceptional, anomalous or atypical.
• The scientists were part of the Commisione Nazionale per la Previsione e la Prevenzione dei “Grandi Rischi”, a consultant organism with capacity to make propositions in the civil protection area.
• The existence of a negligent and neglecting conduct as first point of a criminal liability.
• A wrong evaluation of seismic risks.
• An infraction of legal rules about analysis, previsions and preventions in “Grandi Rischi” area.
• A relation cause-effect between the information brought by scientists and the decisions of population remaining at home.
• The existence of damage as a consequence of the omission and the birth of a compen-sation obligation according to rules of civil liability.
The sentence concludes that the scientists were guilty of the negligent manslaughter because they didn´t evaluate correctly the risks of a big earthquake by analysing the data of previous seismic activities. They transmitted information about the possibilities of that geological activity that moved population of the region to stay at home.
4. CONCLUSIONS
According to international and European laws there is a right to access and know environ-mental information, that includes geological data, specially about seismic and volcanic risks. The judicial resolution of 22 October 2012 focuses on the “right to know” and the conse-quences of a wrong management of circumstantial proofs and an incorrect evaluation of risks. The Judge considered that scientists didn´t respect the duty of care implied in their functions as part of an organism with a consultant faculty in civil protection area.

184
Environmental security, geological hazards and management© 2013 ISBN 978-84-616-2005-0
REFERENCES
sáncHez Jordán, M. E. & maioli, C. (2010): Spatial planning and natural risks zones: Access and interoperability in compliance with the INSPIRE Directive, in Globale Sicherheit und proaktive Staat – Die Rolle der Rechsinformatik, Tagunsband der 13. Internationalen Rechsinformatik Symposions, IRIS, Gewidmet Roland Traunmüllmer, Austrian Computer Society, pp. 487-494
185
Part 3 Geological Hazards
GEOLOGICAL HAZARDS IN SENSITIVE INFRASTRUCTURES OF THE CANARY ISLANDS: THE CASE OF LARGE
ASTRONOMICAL TELESCOPES
A. Eff-Darwich; J. de LeónDepartamento de Edafología y Geología, Universidad de La Laguna; Instituto de Astrofísica de Canari-
as; Instituto Volcanológico de Canarias
B. García-LorenzoInstituto de Astrofísica de Canarias
R. ViñasDepartamento de Edafología y Geología, Universidad de La Laguna
J.A. Rodriguez-LosadaDepartamento de Edafología y Geología, Universidad de La Laguna; Instituto Volcanológico de Canarias
L. Hernández-GutiérrezConsejería Obras Públicas, Gobierno de Canarias; Departamento de Edafología y Geología, Universidad
de La Laguna; Instituto Volcanológico de Canarias
J.C. SantamartaEscuela de Ingeniería Civil e Industrial, Universidad de La Laguna
ABSTRACT: A probabilistic approach to the analysis of geological hazards at a highly sensitive infrastructure, namely an astronomical observatory, was applied to the case of El Teide Observatory in the volcanic island of Tenerife, Canary Islands. Among all possible hazards that may affect the El Teide observatory, namely earthquakes, lava flows, ash-fall and ground deformation, we conclude that the only significant hazard corresponds to tephra deposition due to an explosive eruption from the nearby El Teide-Pico Viejo volcano, recalling it is not possible to establish the actual recurrence period for this kind of eruptions.
1. INTRODUCTION
Some of the best astrophysical observatories in the world, namely the Canarian, Chilean and Hawaiian observatories, are located within active geological regions. This is not a coin-cidence, since the sky transparency that defines good astronomical sites is the result of the combination of factors, directly or indirectly related to geological activity, such as altitude, local topography and/or atmospheric stabilization induced by the presence of water bodies (e.g. ocean). The structures of large telescopes have and will have to withstand the effects associated with seismic and/or volcanic activity, but they also have to minimize the loss of operational time, recalling the extreme precision in the alignment of mechanical and optical components.
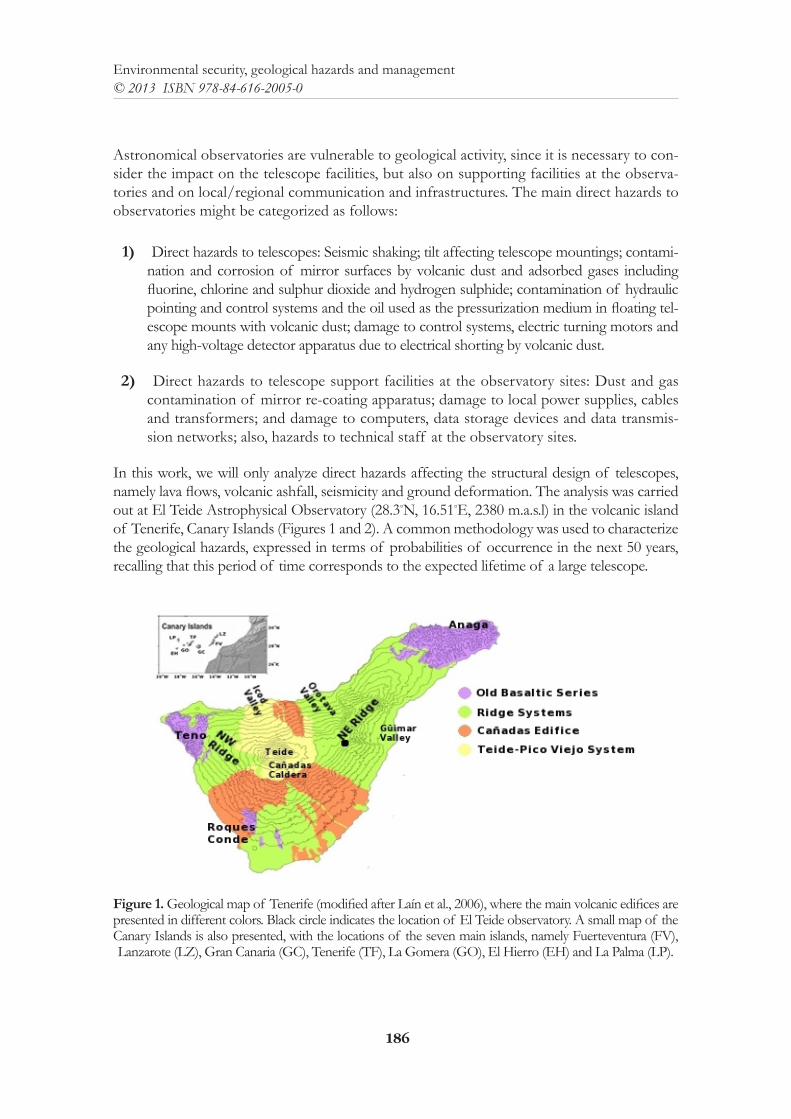
186
Environmental security, geological hazards and management© 2013 ISBN 978-84-616-2005-0
Astronomical observatories are vulnerable to geological activity, since it is necessary to con-sider the impact on the telescope facilities, but also on supporting facilities at the observa-tories and on local/regional communication and infrastructures. The main direct hazards to observatories might be categorized as follows:
1) Direct hazards to telescopes: Seismic shaking; tilt affecting telescope mountings; contami-nation and corrosion of mirror surfaces by volcanic dust and adsorbed gases including fluorine, chlorine and sulphur dioxide and hydrogen sulphide; contamination of hydraulic pointing and control systems and the oil used as the pressurization medium in floating tel-escope mounts with volcanic dust; damage to control systems, electric turning motors and any high-voltage detector apparatus due to electrical shorting by volcanic dust.
2) Direct hazards to telescope support facilities at the observatory sites: Dust and gas contamination of mirror re-coating apparatus; damage to local power supplies, cables and transformers; and damage to computers, data storage devices and data transmis-sion networks; also, hazards to technical staff at the observatory sites.
In this work, we will only analyze direct hazards affecting the structural design of telescopes, namely lava flows, volcanic ashfall, seismicity and ground deformation. The analysis was carried out at El Teide Astrophysical Observatory (28.3◦N, 16.51◦E, 2380 m.a.s.l) in the volcanic island of Tenerife, Canary Islands (Figures 1 and 2). A common methodology was used to characterize the geological hazards, expressed in terms of probabilities of occurrence in the next 50 years, recalling that this period of time corresponds to the expected lifetime of a large telescope.
Figure 1. Geological map of Tenerife (modified after Laín et al., 2006), where the main volcanic edifices are presented in different colors. Black circle indicates the location of El Teide observatory. A small map of the Canary Islands is also presented, with the locations of the seven main islands, namely Fuerteventura (FV), Lanzarote (LZ), Gran Canaria (GC), Tenerife (TF), La Gomera (GO), El Hierro (EH) and La Palma (LP).
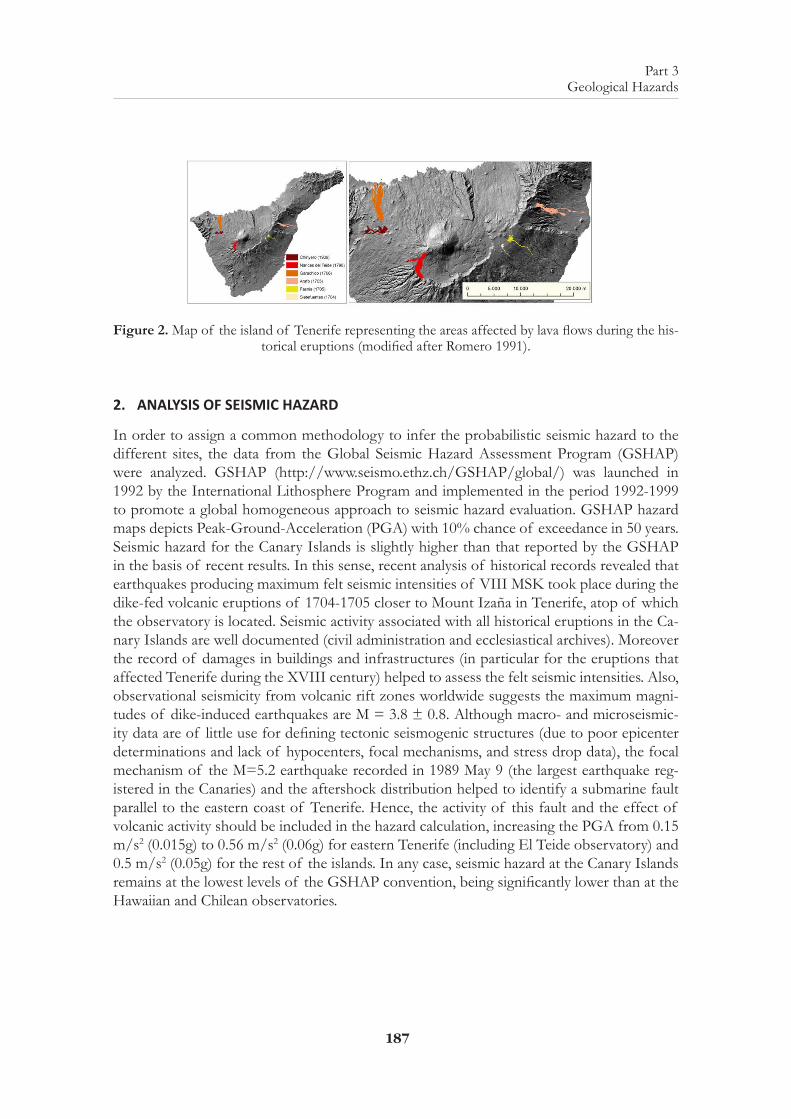
187
Part 3 Geological Hazards
Figure 2. Map of the island of Tenerife representing the areas affected by lava flows during the his-torical eruptions (modified after Romero 1991).
2. ANALYSIS OF SEISMIC HAZARD
In order to assign a common methodology to infer the probabilistic seismic hazard to the different sites, the data from the Global Seismic Hazard Assessment Program (GSHAP) were analyzed. GSHAP (http://www.seismo.ethz.ch/GSHAP/global/) was launched in 1992 by the International Lithosphere Program and implemented in the period 1992-1999 to promote a global homogeneous approach to seismic hazard evaluation. GSHAP hazard maps depicts Peak-Ground-Acceleration (PGA) with 10% chance of exceedance in 50 years. Seismic hazard for the Canary Islands is slightly higher than that reported by the GSHAP in the basis of recent results. In this sense, recent analysis of historical records revealed that earthquakes producing maximum felt seismic intensities of VIII MSK took place during the dike-fed volcanic eruptions of 1704-1705 closer to Mount Izaña in Tenerife, atop of which the observatory is located. Seismic activity associated with all historical eruptions in the Ca-nary Islands are well documented (civil administration and ecclesiastical archives). Moreover the record of damages in buildings and infrastructures (in particular for the eruptions that affected Tenerife during the XVIII century) helped to assess the felt seismic intensities. Also, observational seismicity from volcanic rift zones worldwide suggests the maximum magni-tudes of dike-induced earthquakes are M = 3.8 ± 0.8. Although macro- and microseismic-ity data are of little use for defining tectonic seismogenic structures (due to poor epicenter determinations and lack of hypocenters, focal mechanisms, and stress drop data), the focal mechanism of the M=5.2 earthquake recorded in 1989 May 9 (the largest earthquake reg-istered in the Canaries) and the aftershock distribution helped to identify a submarine fault parallel to the eastern coast of Tenerife. Hence, the activity of this fault and the effect of volcanic activity should be included in the hazard calculation, increasing the PGA from 0.15 m/s2 (0.015g) to 0.56 m/s2 (0.06g) for eastern Tenerife (including El Teide observatory) and 0.5 m/s2 (0.05g) for the rest of the islands. In any case, seismic hazard at the Canary Islands remains at the lowest levels of the GSHAP convention, being significantly lower than at the Hawaiian and Chilean observatories.
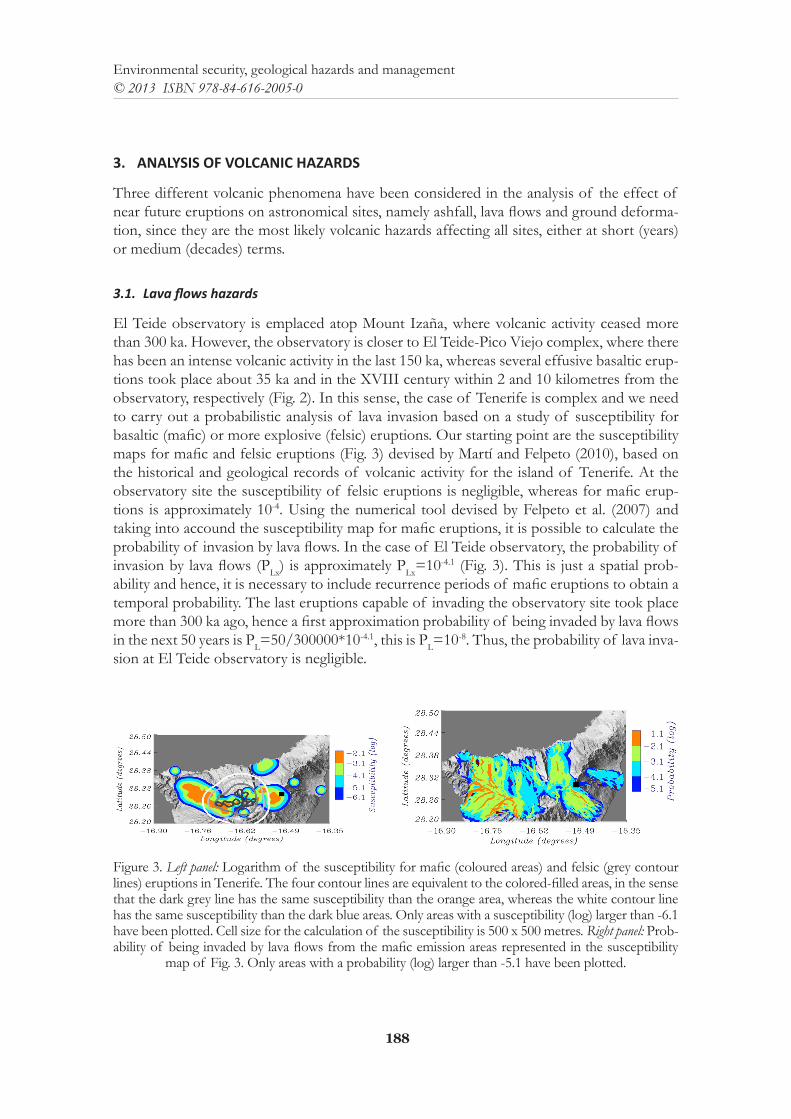
188
Environmental security, geological hazards and management© 2013 ISBN 978-84-616-2005-0
3. ANALYSIS OF VOLCANIC HAZARDS
Three different volcanic phenomena have been considered in the analysis of the effect of near future eruptions on astronomical sites, namely ashfall, lava flows and ground deforma-tion, since they are the most likely volcanic hazards affecting all sites, either at short (years) or medium (decades) terms.
3.1. Lava flows hazards
El Teide observatory is emplaced atop Mount Izaña, where volcanic activity ceased more than 300 ka. However, the observatory is closer to El Teide-Pico Viejo complex, where there has been an intense volcanic activity in the last 150 ka, whereas several effusive basaltic erup-tions took place about 35 ka and in the XVIII century within 2 and 10 kilometres from the observatory, respectively (Fig. 2). In this sense, the case of Tenerife is complex and we need to carry out a probabilistic analysis of lava invasion based on a study of susceptibility for basaltic (mafic) or more explosive (felsic) eruptions. Our starting point are the susceptibility maps for mafic and felsic eruptions (Fig. 3) devised by Martí and Felpeto (2010), based on the historical and geological records of volcanic activity for the island of Tenerife. At the observatory site the susceptibility of felsic eruptions is negligible, whereas for mafic erup-tions is approximately 10-4. Using the numerical tool devised by Felpeto et al. (2007) and taking into accound the susceptibility map for mafic eruptions, it is possible to calculate the probability of invasion by lava flows. In the case of El Teide observatory, the probability of invasion by lava flows (PLx) is approximately PLx=10-4.1 (Fig. 3). This is just a spatial prob-ability and hence, it is necessary to include recurrence periods of mafic eruptions to obtain a temporal probability. The last eruptions capable of invading the observatory site took place more than 300 ka ago, hence a first approximation probability of being invaded by lava flows in the next 50 years is PL=50/300000*10-4.1, this is PL=10-8. Thus, the probability of lava inva-sion at El Teide observatory is negligible.
Figure 3. Left panel: Logarithm of the susceptibility for mafic (coloured areas) and felsic (grey contour lines) eruptions in Tenerife. The four contour lines are equivalent to the colored-filled areas, in the sense that the dark grey line has the same susceptibility than the orange area, whereas the white contour line has the same susceptibility than the dark blue areas. Only areas with a susceptibility (log) larger than -6.1 have been plotted. Cell size for the calculation of the susceptibility is 500 x 500 metres. Right panel: Prob-ability of being invaded by lava flows from the mafic emission areas represented in the susceptibility
map of Fig. 3. Only areas with a probability (log) larger than -5.1 have been plotted.
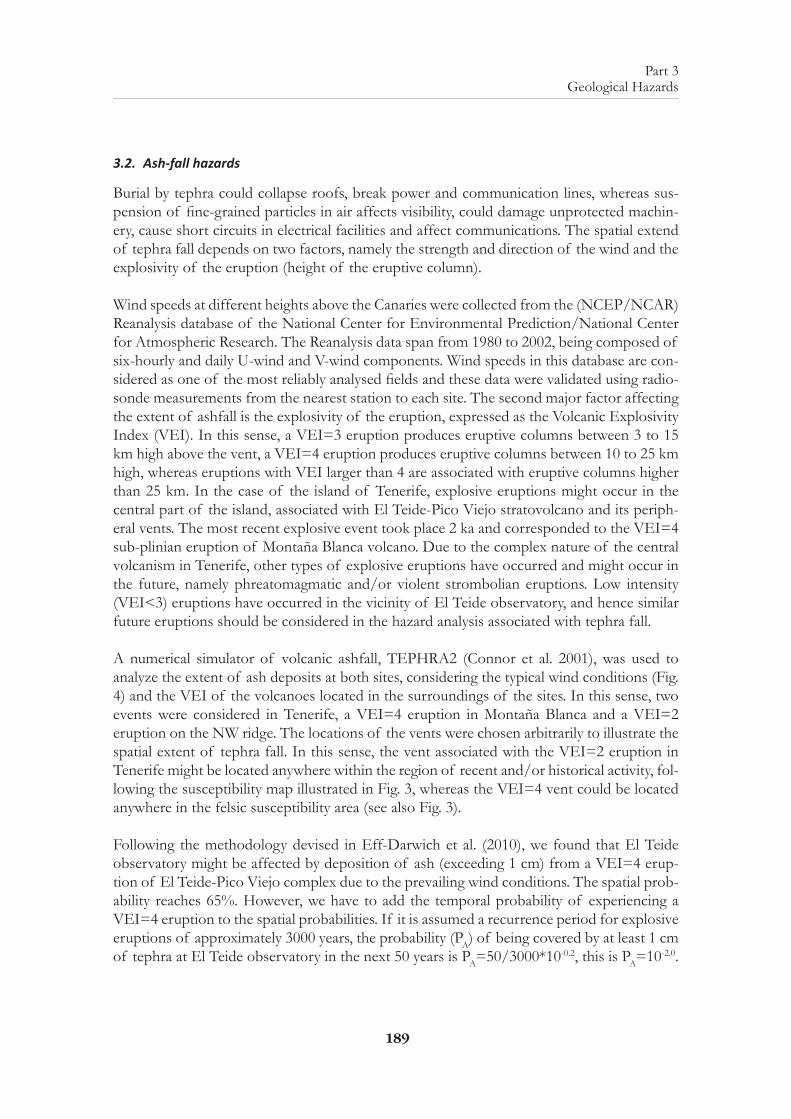
189
Part 3 Geological Hazards
3.2. Ash-fall hazards
Burial by tephra could collapse roofs, break power and communication lines, whereas sus-pension of fine-grained particles in air affects visibility, could damage unprotected machin-ery, cause short circuits in electrical facilities and affect communications. The spatial extend of tephra fall depends on two factors, namely the strength and direction of the wind and the explosivity of the eruption (height of the eruptive column).
Wind speeds at different heights above the Canaries were collected from the (NCEP/NCAR) Reanalysis database of the National Center for Environmental Prediction/National Center for Atmospheric Research. The Reanalysis data span from 1980 to 2002, being composed of six-hourly and daily U-wind and V-wind components. Wind speeds in this database are con-sidered as one of the most reliably analysed fields and these data were validated using radio-sonde measurements from the nearest station to each site. The second major factor affecting the extent of ashfall is the explosivity of the eruption, expressed as the Volcanic Explosivity Index (VEI). In this sense, a VEI=3 eruption produces eruptive columns between 3 to 15 km high above the vent, a VEI=4 eruption produces eruptive columns between 10 to 25 km high, whereas eruptions with VEI larger than 4 are associated with eruptive columns higher than 25 km. In the case of the island of Tenerife, explosive eruptions might occur in the central part of the island, associated with El Teide-Pico Viejo stratovolcano and its periph-eral vents. The most recent explosive event took place 2 ka and corresponded to the VEI=4 sub-plinian eruption of Montaña Blanca volcano. Due to the complex nature of the central volcanism in Tenerife, other types of explosive eruptions have occurred and might occur in the future, namely phreatomagmatic and/or violent strombolian eruptions. Low intensity (VEI<3) eruptions have occurred in the vicinity of El Teide observatory, and hence similar future eruptions should be considered in the hazard analysis associated with tephra fall.
A numerical simulator of volcanic ashfall, TEPHRA2 (Connor et al. 2001), was used to analyze the extent of ash deposits at both sites, considering the typical wind conditions (Fig. 4) and the VEI of the volcanoes located in the surroundings of the sites. In this sense, two events were considered in Tenerife, a VEI=4 eruption in Montaña Blanca and a VEI=2 eruption on the NW ridge. The locations of the vents were chosen arbitrarily to illustrate the spatial extent of tephra fall. In this sense, the vent associated with the VEI=2 eruption in Tenerife might be located anywhere within the region of recent and/or historical activity, fol-lowing the susceptibility map illustrated in Fig. 3, whereas the VEI=4 vent could be located anywhere in the felsic susceptibility area (see also Fig. 3).
Following the methodology devised in Eff-Darwich et al. (2010), we found that El Teide observatory might be affected by deposition of ash (exceeding 1 cm) from a VEI=4 erup-tion of El Teide-Pico Viejo complex due to the prevailing wind conditions. The spatial prob-ability reaches 65%. However, we have to add the temporal probability of experiencing a VEI=4 eruption to the spatial probabilities. If it is assumed a recurrence period for explosive eruptions of approximately 3000 years, the probability (PA) of being covered by at least 1 cm of tephra at El Teide observatory in the next 50 years is PA=50/3000*10-0.2, this is PA=10-2.0.
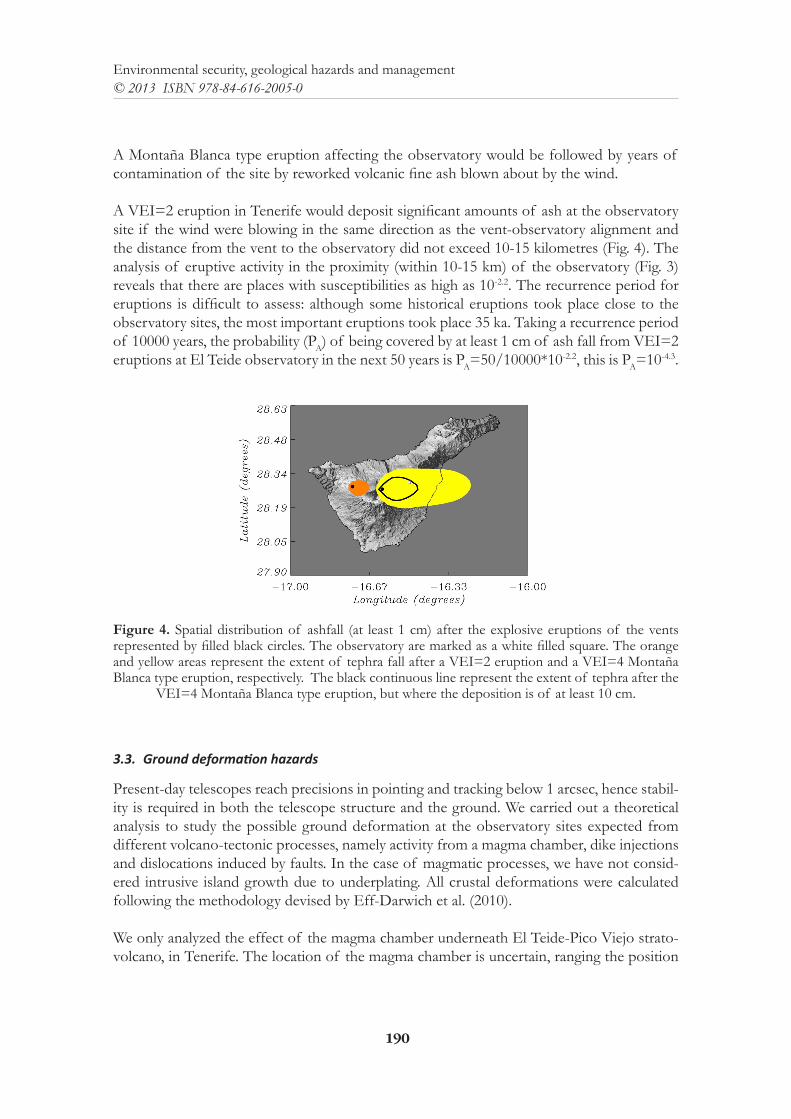
190
Environmental security, geological hazards and management© 2013 ISBN 978-84-616-2005-0
A Montaña Blanca type eruption affecting the observatory would be followed by years of contamination of the site by reworked volcanic fine ash blown about by the wind.
A VEI=2 eruption in Tenerife would deposit significant amounts of ash at the observatory site if the wind were blowing in the same direction as the vent-observatory alignment and the distance from the vent to the observatory did not exceed 10-15 kilometres (Fig. 4). The analysis of eruptive activity in the proximity (within 10-15 km) of the observatory (Fig. 3) reveals that there are places with susceptibilities as high as 10-2.2. The recurrence period for eruptions is difficult to assess: although some historical eruptions took place close to the observatory sites, the most important eruptions took place 35 ka. Taking a recurrence period of 10000 years, the probability (PA) of being covered by at least 1 cm of ash fall from VEI=2 eruptions at El Teide observatory in the next 50 years is PA=50/10000*10-2.2, this is PA=10-4.3.
Figure 4. Spatial distribution of ashfall (at least 1 cm) after the explosive eruptions of the vents represented by filled black circles. The observatory are marked as a white filled square. The orange and yellow areas represent the extent of tephra fall after a VEI=2 eruption and a VEI=4 Montaña Blanca type eruption, respectively. The black continuous line represent the extent of tephra after the
VEI=4 Montaña Blanca type eruption, but where the deposition is of at least 10 cm.
3.3. Ground deformation hazards
Present-day telescopes reach precisions in pointing and tracking below 1 arcsec, hence stabil-ity is required in both the telescope structure and the ground. We carried out a theoretical analysis to study the possible ground deformation at the observatory sites expected from different volcano-tectonic processes, namely activity from a magma chamber, dike injections and dislocations induced by faults. In the case of magmatic processes, we have not consid-ered intrusive island growth due to underplating. All crustal deformations were calculated following the methodology devised by Eff-Darwich et al. (2010).
We only analyzed the effect of the magma chamber underneath El Teide-Pico Viejo strato-volcano, in Tenerife. The location of the magma chamber is uncertain, ranging the position
191
Part 3 Geological Hazards
of the top of the chamber from approximately sea level to 6 kilometres below sea level. In this sense, several calculations were carried out for different cases of spherical intrusion, varying its depth, radius and pressure. Even in the most favorable cases, where the top of the magma chamber is above 6 kilometres depth, the tilt induced by the ground vertical sub-sidence does not reach 20 arcsec (see case A in Fig. 5) at the observatory site, and hence the telescopes would only require simple pointing and tracking realignments. The effects of dike intrusions on ground stability were analyzed assuming that dikes are nearly vertical (δ=80◦), have a thickness of 1 meter and reach a depth of 200 meters below the topographic surface; the Canarian dikes are approximately 25 kilometers wide. As it was discussed in the analysis of tephra fall, the locations of the dike injections were chosen arbitrarily. In this sense, the dike intrusion in Tenerife might be located anywhere within the region of recent and/or historical activity (Fig. 2). The El Teide observatory could be affected by ground tilt associ-ated with a dike injection, assuming that the dike intrusion takes place in the proximity of the observatory (Fig. 5). As it was mentioned for VEI=2 eruptions in Tenerife, the analysis of eruptive activity in the proximity of the observatory (Fig. 3) reveals that there are places with susceptibilities as high as 10-2.2. Taking a recurrence period of 10000 years, the probability (PD) of being affected by at least 20 arcsec of ground tilt due to dike injection in the next 50 years is PD=50/10000*10-2.2, this is PD=10-4.3.
The effects of fault dislocations were analyzed at Tenerife. Following the probabilistic hazard maps calculated by GSHAP, likely earthquakes and the corresponding fault parameters were defined. Faults associated with mantle earthquakes in Tenerife (fault C in Fig. 5) will not produce significant ground tilt.
Figure 5. Spatial distribution of ground deformation in terms of absolute tilt induced by vertical uplift. Regions where there is at least 20 arcsec and 2 arcmin of absolute tilt are represented either by yellow and orange areas or by dark and light blue areas, respectively. The observatory is marked as a white filled square, whereas the surface projections of the fault dislocations are represented by thick white lines. Three types of subsidences are presented for the island of Tenerife (see text for details), namely those induced by activity in a magma chamber (A in dark and light blue colors), a dike injec-
tion (B) and a fault dislocation (C).
192
Environmental security, geological hazards and management© 2013 ISBN 978-84-616-2005-0
4. CONCLUSIONS
We conclude that the only significant hazard at El Teide observatory corresponds to tephra deposition due to an explosive eruption from El Teide-Pico Viejo volcano, recalling it is not possible to establish the actual recurrence period for this kind of eruptions. Future work includes the installation of a geophysical monitoring station at the observatory and compari-sons of geophysical surveys at different world-class astronomical observatories.
REFERENCES
LAIN, L., PEREZ, F., MANCEBO, M.J., BELLIDO, F., GALINDO, I., GOMEZ, F., REAL, F. (2006) Cartografía de peligrosidad volcánica de la isla de Tenerife.
ROMERO, C. (1991) Las manifestaciones volcánicas históricas del Archipiélago Canario. S/C Tener-ife, Consejería de Política Territorial. Gobierno de Canarias. Sta. Cruz de Tenerife. 1407 pp.
MARTI J., FELPETO, A. (2010) Methodology for the computation of volcanic susceptibility An example for mafic and felsic eruptions on Tenerife (Canary Islands), Journal Volcanology and Geothermal Research, Volume: 195 Issue: 1 Pages: 69-77
FELPETO, A., MARTI, J., ORTIZ, R. (2007) Automatic GIS-based system for volcanic hazard as-sessment, Journal Volcanology and Geothermal Research, Volume: 166 Issue: 1 Pages: 106-16
CONNOR, C.B., B.E. HILL, B. WINFREY, N.M. FRANKLIN, AND P.C. LAFEMINA (2001) Es-timation of volcanic hazards from tephra fallout, Natural Hazards Review, 2: 33-42
EFF-DARWICH, A., GARCIA-LORENZO, B., RODRIGUEZ-LOSADA, J.A., DE LA NUEZ, J., HERNANDEZ-GUTIERREZ, L., ROMERO-RUIZ, M.C. (2010) Comparative analysis of the impact of geological activity on the structural design of telescope facilities in the Canary Islands, Hawaii and Chile, MNRAS, Volume 407, Issue 3, pp. 1361-1375
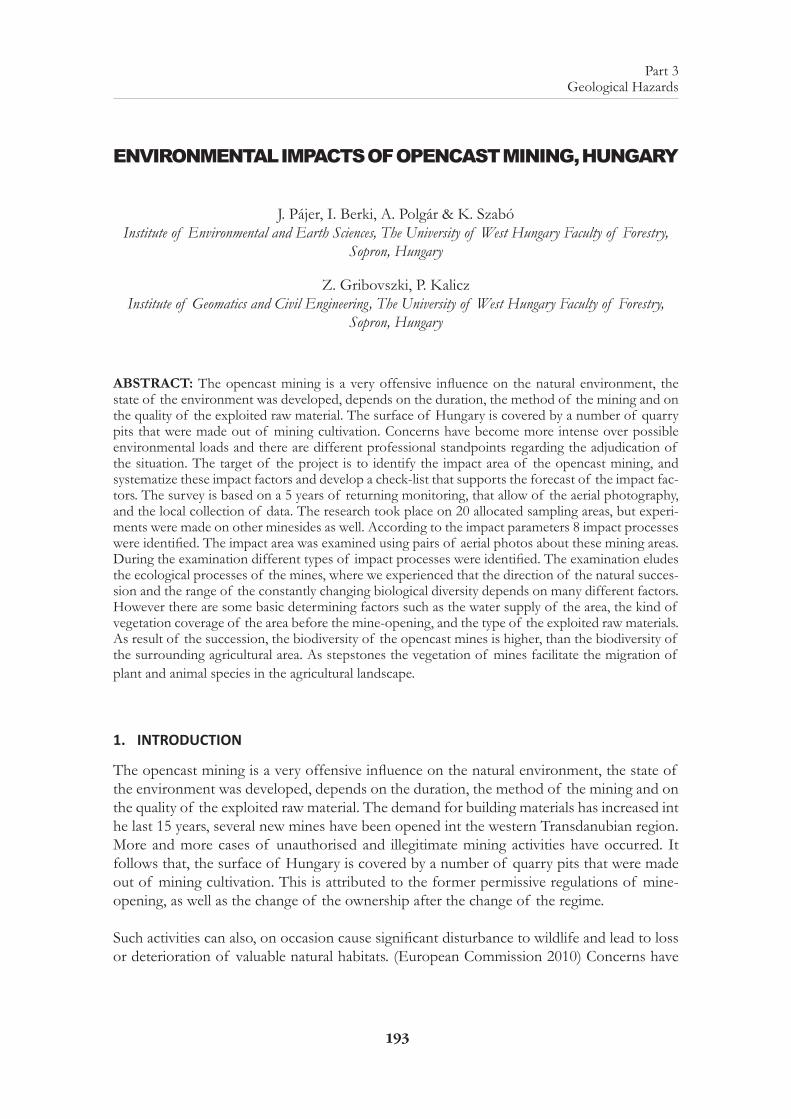
193
Part 3 Geological Hazards
ENVIRONMENTAL IMPACTS OF OPENCAST MINING, HUNGARY
J. Pájer, I. Berki, A. Polgár & K. SzabóInstitute of Environmental and Earth Sciences, The University of West Hungary Faculty of Forestry,
Sopron, Hungary
Z. Gribovszki, P. KaliczInstitute of Geomatics and Civil Engineering, The University of West Hungary Faculty of Forestry,
Sopron, Hungary
ABSTRACT: The opencast mining is a very offensive influence on the natural environment, the state of the environment was developed, depends on the duration, the method of the mining and on the quality of the exploited raw material. The surface of Hungary is covered by a number of quarry pits that were made out of mining cultivation. Concerns have become more intense over possible environmental loads and there are different professional standpoints regarding the adjudication of the situation. The target of the project is to identify the impact area of the opencast mining, and systematize these impact factors and develop a check-list that supports the forecast of the impact fac-tors. The survey is based on a 5 years of returning monitoring, that allow of the aerial photography, and the local collection of data. The research took place on 20 allocated sampling areas, but experi-ments were made on other minesides as well. According to the impact parameters 8 impact processes were identified. The impact area was examined using pairs of aerial photos about these mining areas. During the examination different types of impact processes were identified. The examination eludes the ecological processes of the mines, where we experienced that the direction of the natural succes-sion and the range of the constantly changing biological diversity depends on many different factors. However there are some basic determining factors such as the water supply of the area, the kind of vegetation coverage of the area before the mine-opening, and the type of the exploited raw materials. As result of the succession, the biodiversity of the opencast mines is higher, than the biodiversity of the surrounding agricultural area. As stepstones the vegetation of mines facilitate the migration of plant and animal species in the agricultural landscape.
1. INTRODUCTION
The opencast mining is a very offensive influence on the natural environment, the state of the environment was developed, depends on the duration, the method of the mining and on the quality of the exploited raw material. The demand for building materials has increased int he last 15 years, several new mines have been opened int the western Transdanubian region. More and more cases of unauthorised and illegitimate mining activities have occurred. It follows that, the surface of Hungary is covered by a number of quarry pits that were made out of mining cultivation. This is attributed to the former permissive regulations of mine-opening, as well as the change of the ownership after the change of the regime.
Such activities can also, on occasion cause significant disturbance to wildlife and lead to loss or deterioration of valuable natural habitats. (European Commission 2010) Concerns have
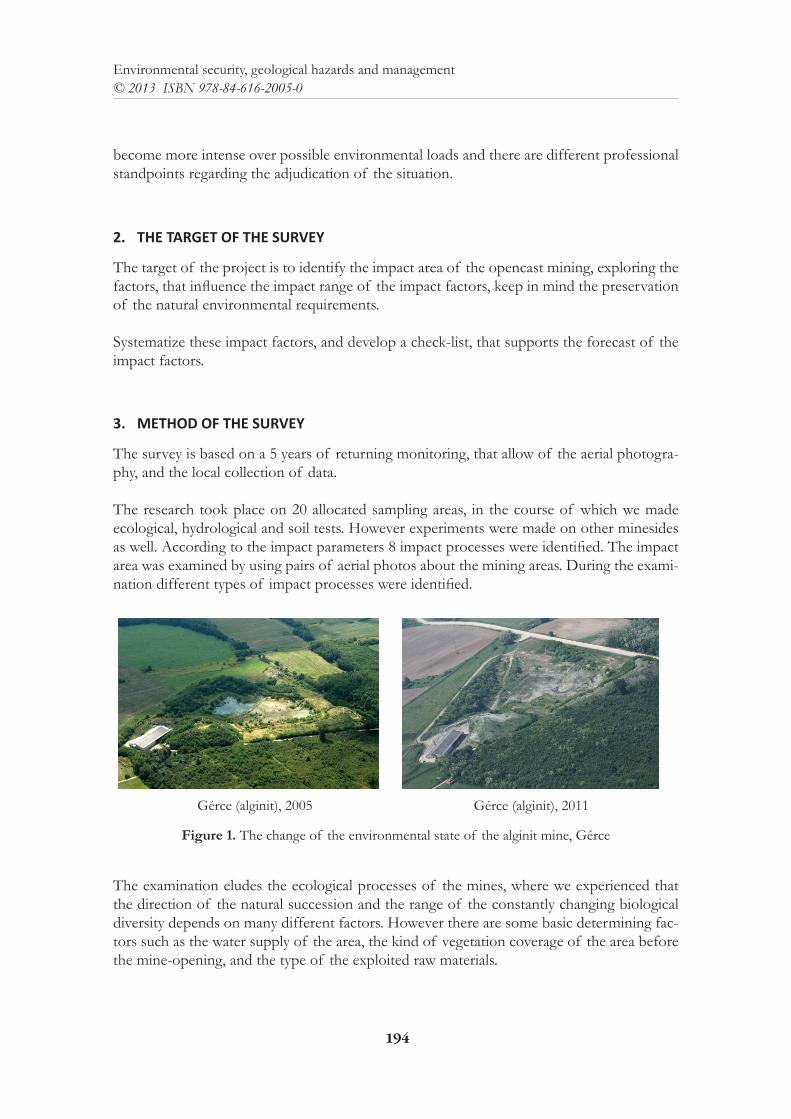
194
Environmental security, geological hazards and management© 2013 ISBN 978-84-616-2005-0
become more intense over possible environmental loads and there are different professional standpoints regarding the adjudication of the situation.
2. THE TARGET OF THE SURVEY
The target of the project is to identify the impact area of the opencast mining, exploring the factors, that influence the impact range of the impact factors, keep in mind the preservation of the natural environmental requirements.
Systematize these impact factors, and develop a check-list, that supports the forecast of the impact factors.
3. METHOD OF THE SURVEY
The survey is based on a 5 years of returning monitoring, that allow of the aerial photogra-phy, and the local collection of data.
The research took place on 20 allocated sampling areas, in the course of which we made ecological, hydrological and soil tests. However experiments were made on other minesides as well. According to the impact parameters 8 impact processes were identified. The impact area was examined by using pairs of aerial photos about the mining areas. During the exami-nation different types of impact processes were identified.
Gérce (alginit), 2005 Gérce (alginit), 2011
Figure 1. The change of the environmental state of the alginit mine, Gérce
The examination eludes the ecological processes of the mines, where we experienced that the direction of the natural succession and the range of the constantly changing biological diversity depends on many different factors. However there are some basic determining fac-tors such as the water supply of the area, the kind of vegetation coverage of the area before the mine-opening, and the type of the exploited raw materials.
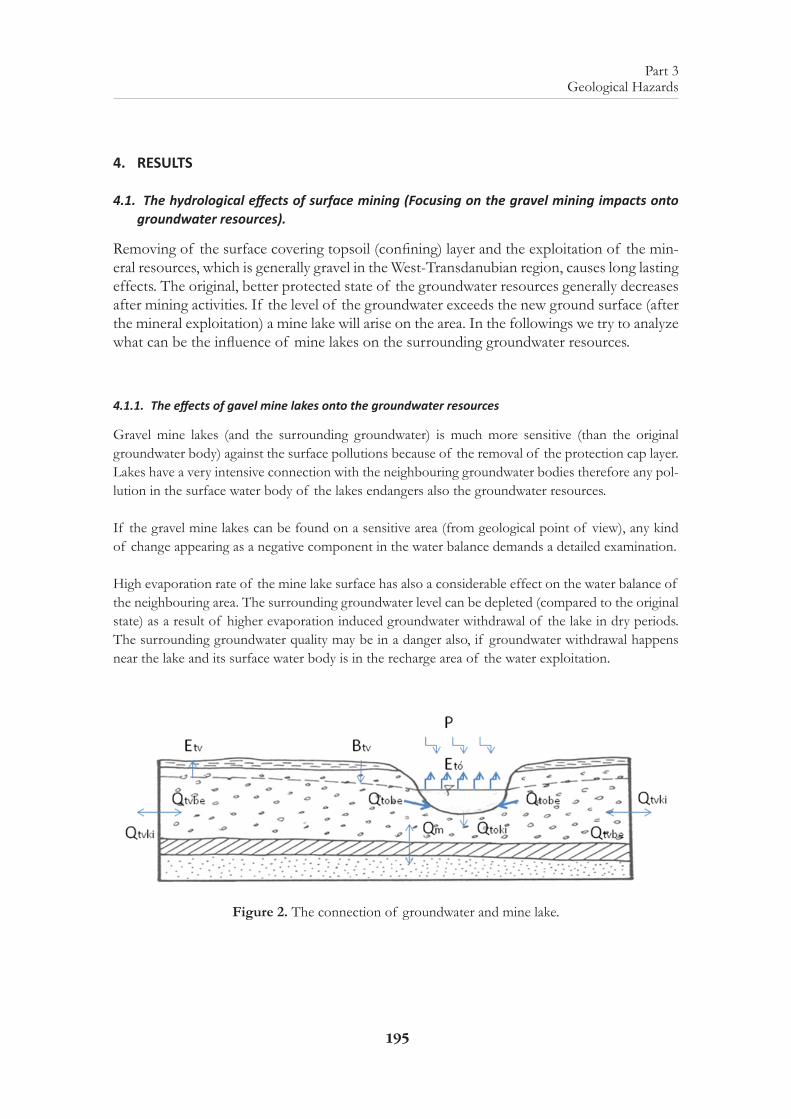
195
Part 3 Geological Hazards
4. RESULTS
4.1. The hydrological effects of surface mining (Focusing on the gravel mining impacts onto groundwater resources).
Removing of the surface covering topsoil (confining) layer and the exploitation of the min-eral resources, which is generally gravel in the West-Transdanubian region, causes long lasting effects. The original, better protected state of the groundwater resources generally decreases after mining activities. If the level of the groundwater exceeds the new ground surface (after the mineral exploitation) a mine lake will arise on the area. In the followings we try to analyze what can be the influence of mine lakes on the surrounding groundwater resources.
4.1.1. The effects of gavel mine lakes onto the groundwater resources
Gravel mine lakes (and the surrounding groundwater) is much more sensitive (than the original groundwater body) against the surface pollutions because of the removal of the protection cap layer. Lakes have a very intensive connection with the neighbouring groundwater bodies therefore any pol-lution in the surface water body of the lakes endangers also the groundwater resources.
If the gravel mine lakes can be found on a sensitive area (from geological point of view), any kind of change appearing as a negative component in the water balance demands a detailed examination.
High evaporation rate of the mine lake surface has also a considerable effect on the water balance of the neighbouring area. The surrounding groundwater level can be depleted (compared to the original state) as a result of higher evaporation induced groundwater withdrawal of the lake in dry periods. The surrounding groundwater quality may be in a danger also, if groundwater withdrawal happens near the lake and its surface water body is in the recharge area of the water exploitation.
Figure 2. The connection of groundwater and mine lake.
196
Environmental security, geological hazards and management© 2013 ISBN 978-84-616-2005-0
The water balance equations of the lake and surrounding groundwater in permanent case:
Lake: P + Qtobe = Etó + Qtoki
Groundwater: B - Etv ± Qtv ± Qto ± Qm = 0 (±Qto = Qtoki - Qtobe)
Total Water Balance: B - Etv + Cs - Eto ± Qtv ± Qm = 0 (Eq. 1.)
Where: P: precipitation; B: infiltration; Eto: evaporation from the surface of the lake; Etv: evaporation from the groundwater; Qtv: groundwater (in the aquifer) input and output across the border of the area; Qtobe: groundwater input into the lake; Qtoki: lake water out-put into the aquifer (in case of humid climate can be the case); Qm: groundwater exchange with deeper layers.
4.1.2. Numerical modeling
Because of the complexity of the problem the analytical solutions (the lake is handled as a long channel or a well) give only approximate results. So as to get more accurate solution we have to use the method of numerical modeling (Kovács 2004). In case of mine lake (Bükk I.) was examined as an example of numerical modeling. We used Processing Modflow model environment for calculations.
4.1.3. The building of the numerical model and the results of the analysis
The numerical model aquifer was a homogeneous gravel layer. We used permanent model. The evaporation was taken into consideration as 400 mm/years (0,001 m3/m2/day). In case of the cells of the free water surface an enormous hydraulic conductivity (100 000 m/days) was used, that makes easier to handle the lake region (Savanyú 1996). For the surrounding gravel layer cells with more orders of magnitude lower hydraulic conductivity (100 m/days) was given (Léczfalvy 2004). So as to handle the magnitude differences in the neighbouring cells on the lake shore region (to ensure the numeric stability of the model), hydraulic con-ductivities were changed gradually in two steps (in two cell rows) in that area.
With the above described geometry and parameter set of the numerical model about 2 km from the lake the groundwater depletion becomes insignificant. Near the lake (about 2-300 m distance) the maximum groundwater level depletion was estimated about five centimeters by Modflow. This value is less than the depletion estimation of the analytical solutions in case of the same mine lake: the lake is handled as a long channel: more than 15 cm depletion in 3100 m wide region along the channel; or as a well (according to geometry more realistic): more than 15 cm depletion around in a 140 m wide zone the lake. It has to be note that us-ing non permanent model in a dry summer periods the groundwater depletion can be more significant than the above mentioned ones.
197
Part 3 Geological Hazards
4.2. Succession in opencast mines
The area of the gravel mines are increasing every year whith 600 hectares in Bavaria. Most of this mines are opened in lowlands (Jürging 2003).
Opencast mining is an intensive disturbation which eliminates the living world for a certain time. As result of opencast mining a more diverse abiotic conditions has been established compared to the earlier surface. The bigger the surface of the opencast mines, the more in-tensive are its effect on the living world of the surrounding landscape.
4.2.1. Seeds from outside
As seedsources of the succession in the opencast mines mainly exist the surrounding vegeta-tion. The distance of the seedsources are very different depending on the plant species. Al-though no robinia exist in the surroundings forest of mines still it could colonise numerous of the disused mines from (a) long distance.
The weeds (vegetation) growing up on the soil gangue are developed from the seedbank of the soil gangue and as the nearest seed sources play an important role in the succession in the mine basin.
There are fallows in many case in the space surrounding the minebasin. This fallows are cov-ered mainly by weeds with numerous alien species. There is a desirable situation, if the mine is bordered by a nature closed forest. In this case the disused mine were colonised with no only weeds, invasive herb species, but the autochton trees have a good colonisig success also, and the succession reach the shrub-forest climax in a short time.
4.2.2. Succession in the different minetypes
The succession is developing toward the rock-grass, or scrub-forest depending on the differ-ent drier site condition in the rock mines than in the surrounding areas.
Sandmines were opened not in lowlands, therefore can not form lakes in it. The biodiversity of this sandmines can not reach the biodiversity of the gravel mines due to lack of mine lakes. There are in sandmines are moisture and nutrient deficiency therefore not only the high stalk of weeds, but the grass species exist in the early phase of the succession. Only a few native tree species can colonise the sandmines due to pure site condition, on the other hand the robinia having a high tolerance to moisture- and nutrient deficiency covering big parts of the sand surface.
The crumbling process of the minevall to slope is occouring gradully relative quick in the sand mines. The succession of the plant and animal species attached to the mine wall and slope is determined and influenced by this crumbling process of the wall. There are in the relative young part of wall in sandmines with brooding holes of some protected birds.
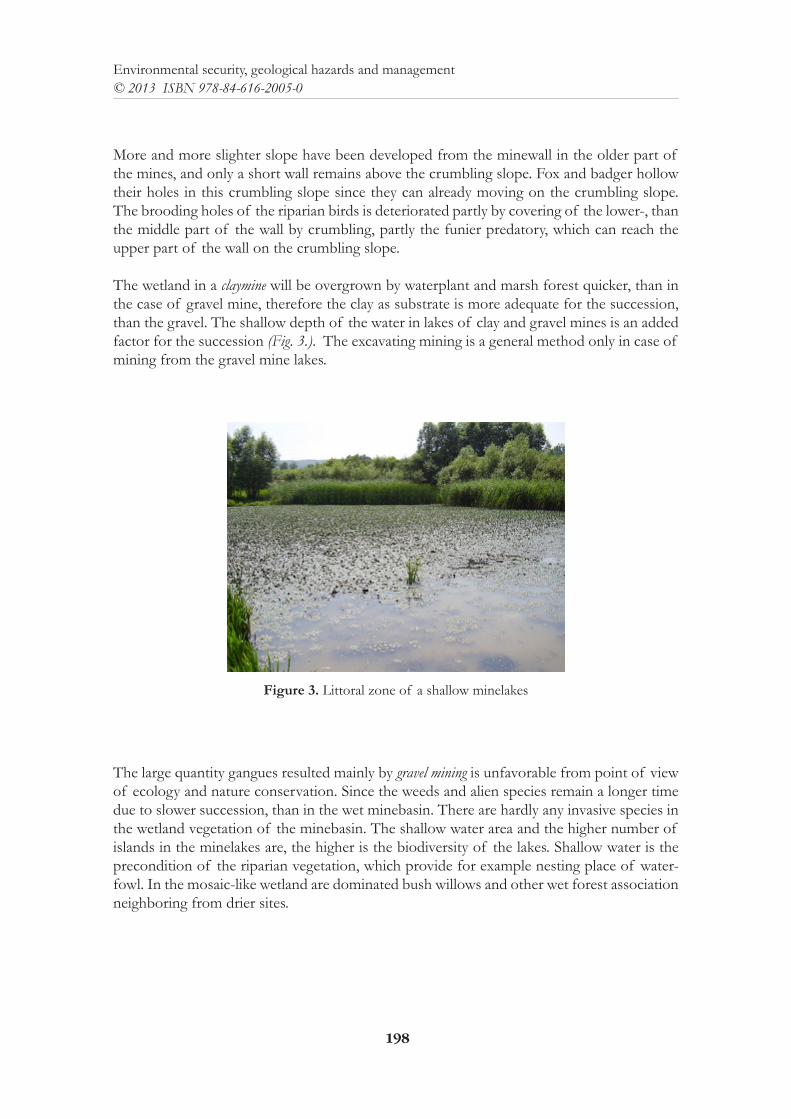
198
Environmental security, geological hazards and management© 2013 ISBN 978-84-616-2005-0
More and more slighter slope have been developed from the minewall in the older part of the mines, and only a short wall remains above the crumbling slope. Fox and badger hollow their holes in this crumbling slope since they can already moving on the crumbling slope. The brooding holes of the riparian birds is deteriorated partly by covering of the lower-, than the middle part of the wall by crumbling, partly the funier predatory, which can reach the upper part of the wall on the crumbling slope.
The wetland in a claymine will be overgrown by waterplant and marsh forest quicker, than in the case of gravel mine, therefore the clay as substrate is more adequate for the succession, than the gravel. The shallow depth of the water in lakes of clay and gravel mines is an added factor for the succession (Fig. 3.). The excavating mining is a general method only in case of mining from the gravel mine lakes.
Figure 3. Littoral zone of a shallow minelakes
The large quantity gangues resulted mainly by gravel mining is unfavorable from point of view of ecology and nature conservation. Since the weeds and alien species remain a longer time due to slower succession, than in the wet minebasin. There are hardly any invasive species in the wetland vegetation of the minebasin. The shallow water area and the higher number of islands in the minelakes are, the higher is the biodiversity of the lakes. Shallow water is the precondition of the riparian vegetation, which provide for example nesting place of water-fowl. In the mosaic-like wetland are dominated bush willows and other wet forest association neighboring from drier sites.
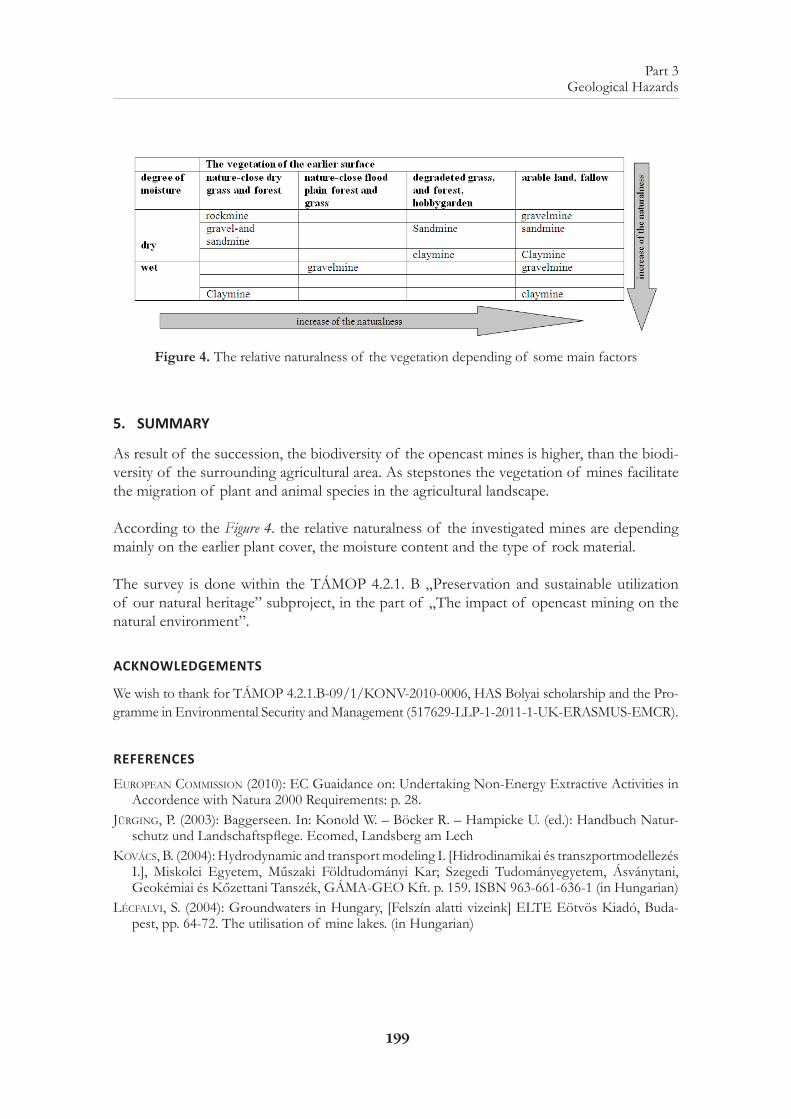
199
Part 3 Geological Hazards
Figure 4. The relative naturalness of the vegetation depending of some main factors
5. SUMMARY
As result of the succession, the biodiversity of the opencast mines is higher, than the biodi-versity of the surrounding agricultural area. As stepstones the vegetation of mines facilitate the migration of plant and animal species in the agricultural landscape.
According to the Figure 4. the relative naturalness of the investigated mines are depending mainly on the earlier plant cover, the moisture content and the type of rock material.
The survey is done within the TÁMOP 4.2.1. B „Preservation and sustainable utilization of our natural heritage” subproject, in the part of „The impact of opencast mining on the natural environment”.
ACKNOWLEDGEMENTS
We wish to thank for TÁMOP 4.2.1.B-09/1/KONV-2010-0006, HAS Bolyai scholarship and the Pro-gramme in Environmental Security and Management (517629-LLP-1-2011-1-UK-ERASMUS-EMCR).
REFERENCES
european commission (2010): EC Guaidance on: Undertaking Non-Energy Extractive Activities in Accordence with Natura 2000 Requirements: p. 28.
Jürging, P. (2003): Baggerseen. In: Konold W. – Böcker R. – Hampicke U. (ed.): Handbuch Natur-schutz und Landschaftspflege. Ecomed, Landsberg am Lech
Kovács, B. (2004): Hydrodynamic and transport modeling I. [Hidrodinamikai és transzportmodellezés I.], Miskolci Egyetem, Műszaki Földtudományi Kar; Szegedi Tudományegyetem, Ásványtani, Geokémiai és Kőzettani Tanszék, GÁMA-GEO Kft. p. 159. ISBN 963-661-636-1 (in Hungarian)
lécfalvi, S. (2004): Groundwaters in Hungary, [Felszín alatti vizeink] ELTE Eötvös Kiadó, Buda-pest, pp. 64-72. The utilisation of mine lakes. (in Hungarian)

200
Environmental security, geological hazards and management© 2013 ISBN 978-84-616-2005-0
savanyú, K. (1996): The effect of mining lakes onto the quality of the groundwater. [A kavicsbányat-avak hatása a felszín alatti vízminőségre.] MS thesis, BME, Department of Water management, 1996. (in Hungarian)
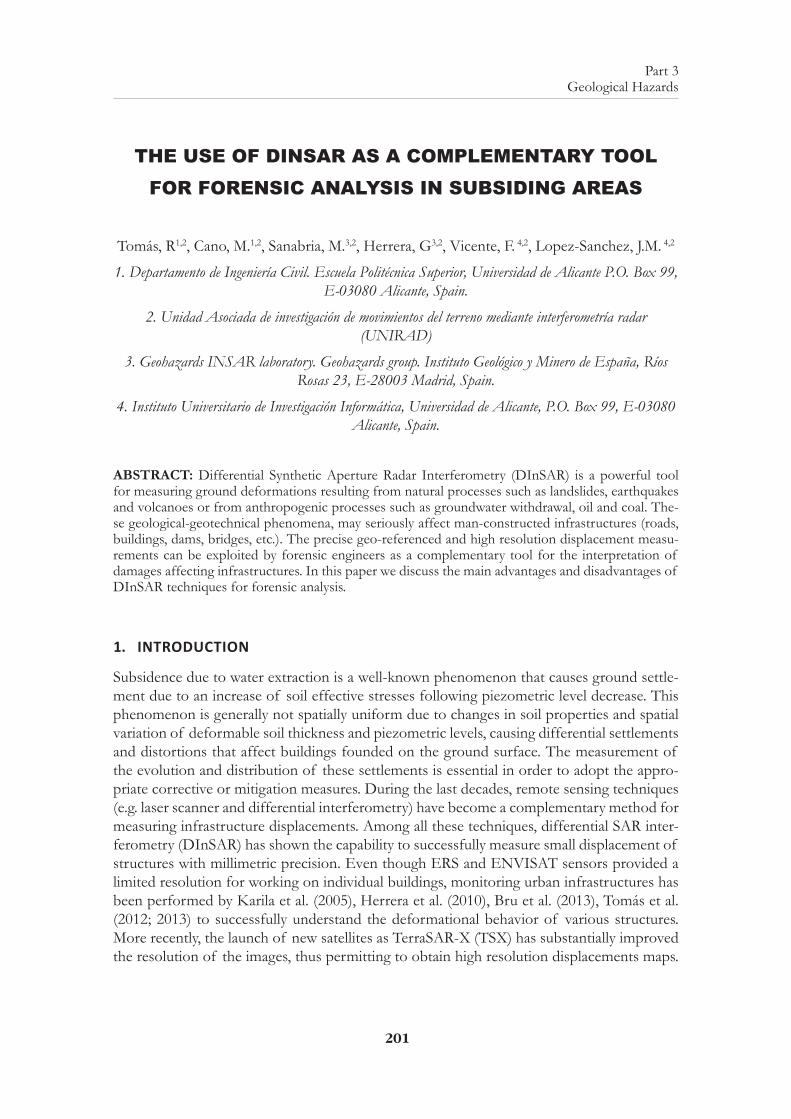
201
Part 3 Geological Hazards
THE USE OF DINSAR AS A COMPLEMENTARY TOOL FOR FORENSIC ANALYSIS IN SUBSIDING AREAS
Tomás, R1,2, Cano, M.1,2, Sanabria, M.3,2, Herrera, G3,2, Vicente, F. 4,2, Lopez-Sanchez, J.M. 4,2
1. Departamento de Ingeniería Civil. Escuela Politécnica Superior, Universidad de Alicante P.O. Box 99, E-03080 Alicante, Spain.
2. Unidad Asociada de investigación de movimientos del terreno mediante interferometría radar (UNIRAD)
3. Geohazards INSAR laboratory. Geohazards group. Instituto Geológico y Minero de España, Ríos Rosas 23, E-28003 Madrid, Spain.
4. Instituto Universitario de Investigación Informática, Universidad de Alicante, P.O. Box 99, E-03080 Alicante, Spain.
ABSTRACT: Differential Synthetic Aperture Radar Interferometry (DInSAR) is a powerful tool for measuring ground deformations resulting from natural processes such as landslides, earthquakes and volcanoes or from anthropogenic processes such as groundwater withdrawal, oil and coal. The-se geological-geotechnical phenomena, may seriously affect man-constructed infrastructures (roads, buildings, dams, bridges, etc.). The precise geo-referenced and high resolution displacement measu-rements can be exploited by forensic engineers as a complementary tool for the interpretation of damages affecting infrastructures. In this paper we discuss the main advantages and disadvantages of DInSAR techniques for forensic analysis.
1. INTRODUCTION
Subsidence due to water extraction is a well-known phenomenon that causes ground settle-ment due to an increase of soil effective stresses following piezometric level decrease. This phenomenon is generally not spatially uniform due to changes in soil properties and spatial variation of deformable soil thickness and piezometric levels, causing differential settlements and distortions that affect buildings founded on the ground surface. The measurement of the evolution and distribution of these settlements is essential in order to adopt the appro-priate corrective or mitigation measures. During the last decades, remote sensing techniques (e.g. laser scanner and differential interferometry) have become a complementary method for measuring infrastructure displacements. Among all these techniques, differential SAR inter-ferometry (DInSAR) has shown the capability to successfully measure small displacement of structures with millimetric precision. Even though ERS and ENVISAT sensors provided a limited resolution for working on individual buildings, monitoring urban infrastructures has been performed by Karila et al. (2005), Herrera et al. (2010), Bru et al. (2013), Tomás et al. (2012; 2013) to successfully understand the deformational behavior of various structures. More recently, the launch of new satellites as TerraSAR-X (TSX) has substantially improved the resolution of the images, thus permitting to obtain high resolution displacements maps.
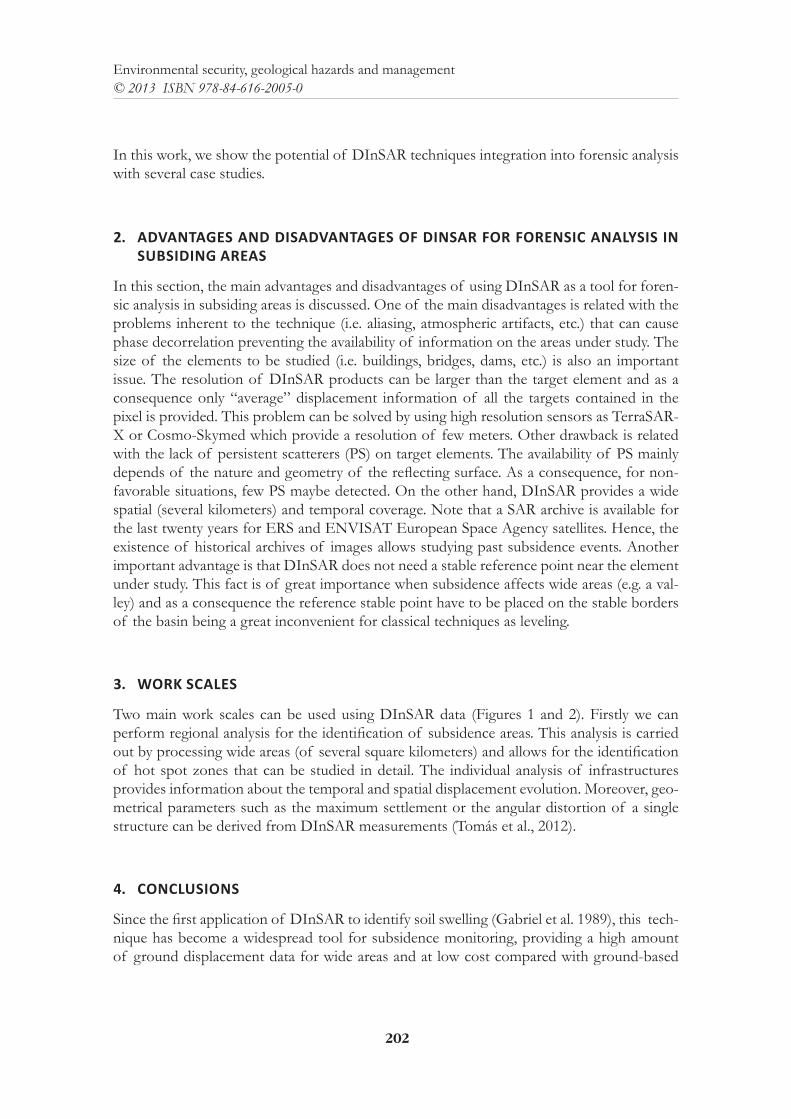
202
Environmental security, geological hazards and management© 2013 ISBN 978-84-616-2005-0
In this work, we show the potential of DInSAR techniques integration into forensic analysis with several case studies.
2. ADVANTAGES AND DISADVANTAGES OF DINSAR FOR FORENSIC ANALYSIS IN SUBSIDING AREAS
In this section, the main advantages and disadvantages of using DInSAR as a tool for foren-sic analysis in subsiding areas is discussed. One of the main disadvantages is related with the problems inherent to the technique (i.e. aliasing, atmospheric artifacts, etc.) that can cause phase decorrelation preventing the availability of information on the areas under study. The size of the elements to be studied (i.e. buildings, bridges, dams, etc.) is also an important issue. The resolution of DInSAR products can be larger than the target element and as a consequence only “average” displacement information of all the targets contained in the pixel is provided. This problem can be solved by using high resolution sensors as TerraSAR-X or Cosmo-Skymed which provide a resolution of few meters. Other drawback is related with the lack of persistent scatterers (PS) on target elements. The availability of PS mainly depends of the nature and geometry of the reflecting surface. As a consequence, for non-favorable situations, few PS maybe detected. On the other hand, DInSAR provides a wide spatial (several kilometers) and temporal coverage. Note that a SAR archive is available for the last twenty years for ERS and ENVISAT European Space Agency satellites. Hence, the existence of historical archives of images allows studying past subsidence events. Another important advantage is that DInSAR does not need a stable reference point near the element under study. This fact is of great importance when subsidence affects wide areas (e.g. a val-ley) and as a consequence the reference stable point have to be placed on the stable borders of the basin being a great inconvenient for classical techniques as leveling.
3. WORK SCALES
Two main work scales can be used using DInSAR data (Figures 1 and 2). Firstly we can perform regional analysis for the identification of subsidence areas. This analysis is carried out by processing wide areas (of several square kilometers) and allows for the identification of hot spot zones that can be studied in detail. The individual analysis of infrastructures provides information about the temporal and spatial displacement evolution. Moreover, geo-metrical parameters such as the maximum settlement or the angular distortion of a single structure can be derived from DInSAR measurements (Tomás et al., 2012).
4. CONCLUSIONS
Since the first application of DInSAR to identify soil swelling (Gabriel et al. 1989), this tech-nique has become a widespread tool for subsidence monitoring, providing a high amount of ground displacement data for wide areas and at low cost compared with ground-based
203
Part 3 Geological Hazards
techniques. High resolution sensors provide a general vision of the displacements affecting wide areas allowing the identification of those zones more affected by subsidence which are “susceptible” of suffering damages in wide urban areas. Furthermore, the improvement of the satellite resolution provides a new opportunity for actively exploiting InSAR data as a complementary tool for forensic analysis of infrastructures and structures. These data may be used to compute geotechnical parameters used for evaluating the probability of damage or a structure/infrastructure. However, despite the usefulness of DInSAR data supplemen-tary information (i.e., field data/measures and laboratory test) is necessary to perform the forensic analysis of single structures and infrastructures.
Figure 1. (Above) 1993-2009 displacement map derived from ERS and ENVISAT high resolution images (regional analysis). Note the deformations detected on the lower-right corner of the map corresponding to La Pedrera Dam. (Below) Individual analysis of La Pedrera Dam using very high
resolution TSX images from 2008 to 2010.
204
Environmental security, geological hazards and management© 2013 ISBN 978-84-616-2005-0
Figure 2. (Above) Subsidence rate map of a highway bridge derived from X-band and C-band satel-lite images. (Below) Bridge scheme and subsidence profile along the bridge axis (adapted from Her-
rera et al., 2010).
ACKNOWLEDGEMENTS
All ERS and Envisat images were provided by the European Space Agency (ESA) in the framework of the category 1 project ref. 2494. All TerraSAR-X images were provided by the German Aerospace Center (DLR) in the framework of project GEO0389 of the TerraSAR-X Scientific Program. This work has been supported by the Spanish Government under project TEC2011-28201-C02, by the University of Alicante under projects VIGROB-157 and VIGROB-114, by the Generalitat Valenciana under project BEST-2011/225 and by the Agencia de Ciencia y Tecnología de la Región de Murcia project 15224/PI/10.
205
Part 3 Geological Hazards
REFERENCES
Bru, G., Herrera, G., Tomás, R., Duro, J., De la Vega, R., Mulas, J. (2013). Control of deformation of buildings affected by subsidence using persistent scatterer interferometry. Structure and Infra-structure Engineering 9, 188-200.
Gabriel, A.K., Goldstein, R.M., Zebker, H.A. (1989) Mapping Small Elevation Changes Over Large Areas: Differential Radar Interferometry. J Geophys Res 94 (B7):9183-9191. doi:10.1029/JB094iB07p09183
Herrera, G., Tomas, R., Monells, D., Centolanza, G., Mallorqui, J.J., Vicente, F., Navarro, V.D., Lopez-Sanchez, J.M, Cano, M., Mulas, J. and Sanabria, M. (2010). Analysis of subsidence using Ter-raSAR-X data: Murcia case study, Engineering Geology, 116(3-4): 284-295.
Herrera, G., Tomás, R., Monells, D., Centolanza, G., Mallorquí, J.J., Vicente, F., Navarro, V.D., Lopez-Sanchez, J.M., Sanabria, M., Cano, M., Mulas, J., 2010. Analysis of subsidence using TerraSAR-X data: Murcia case study. Engineering Geology 116, 284-295.
Karila, K., Karjalainen, M., Hyyppä, J. (2005). Urban land subsidence studies in Finland using syn-thetic aperture radar images and coherent targets, the Photogrammetric Journal of Finland, 19(2), 43-53.
Tomás, R., García-Barba, J., Cano, M., Sanabria, M.P., Ivorra, S., Duro, J., Herrera, G. (2012). Sub-sidence damage assessment of a gothic church using Differential Interferometry and field data. Structural Health Monitoring Accepted, 11, 751-762.
Tomás, R., Cano, M., García-Barba, J., Vicente, F., Herrera, G., Lopez-Sanchez, J.M., Mallorquí, J.J. (2013). Monitoring an earthfill dam using Differential SAR Interferometry: La Pedrera dam, Ali-cante, Spain. Engineering Geology. Accepted, in press.

207
Part 3 Geological Hazards
MORPHOLOGY AND DISTRIBUTION OF VOLCANIC BOMBS IN CALDERA QUEMADA DE ARRIBA (LANZAROTE, CANARY ISLANDS): IMPLICATIONS FOR VOLCANIC HAZARD
ANALYSIS.
I. Galindo, M.C. Romero, N. Sánchez, J. Dóniz, J. Yepes, J.M. Morales & L. Becerril
I. Galindo, N. Sánchez, J.M. Morales & L. BecerrilUnit of Canary Islands, Geological Survey of Spain, Spain
M.C. Romero & J. DónizDepartment of Geography, University of La Laguna, Spain
J. YepesDepartment of Civil Engineering. University of Las Palmas de Gran Canaria, Spain
ABSTRACT: We show the preliminary results of the study of 561 volcanic bombs ejected from a pyroclastic cone during the 1730-1736 Timanfaya eruption (Lanzarote, Canary Islands). This cone displays the highest concentration of big bombs (major axis higher than 1 m) of Timanfaya. More than 560 bombs have been studied to calculate their reach. The results suggest that bombs of 1t have a reach of 409 m, while bombs up to 28 t have a reach of 248 m. These data may be used to define a security area once a vent has been opened, but also to calculate other data such the initial velocity of ejection. The geomorphological analysis and the study of the deposits also contribute to better understand an undocumented episode of the Timanfaya eruption and also provide important data for volcanic bombs modeling for volcanic hazard analysis.
1. INTRODUCTION
Volcanic bombs ejection is a common process during volcanic eruptions, but usually affects only those areas close to the vent. In fact, this is a short range hazard in relation with other primary volcanic hazards such as pyroclastic density currents or lava flows. The radius of damage due to bombs ejection can be estimated only up to few hundred meters from the vent causing damages by impacts and fires. The risk is always higher when the vent is located at or near of a populated area.
The analysis of volcanic bombs has been mainly focused on the observation of actual erup-tions to model the process (Vanderkluysen et al. 2012 and references therein). Scenarios of volcanic bombs ejection were developed for Tenerife (Lain et al. 2008). However, the param-eters used in these models were not tested with field observations, but taken from other vol-canoes located in different volcano-tectonic settings and with different eruptive mechanisms.
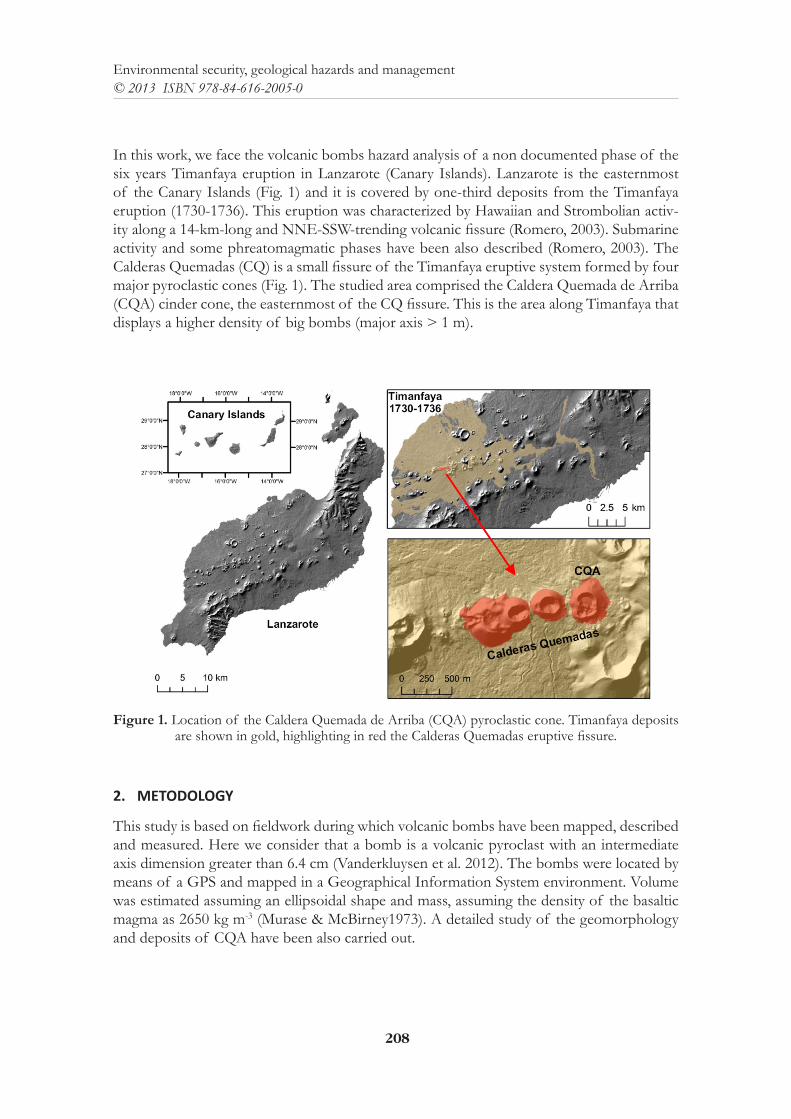
208
Environmental security, geological hazards and management© 2013 ISBN 978-84-616-2005-0
In this work, we face the volcanic bombs hazard analysis of a non documented phase of the six years Timanfaya eruption in Lanzarote (Canary Islands). Lanzarote is the easternmost of the Canary Islands (Fig. 1) and it is covered by one-third deposits from the Timanfaya eruption (1730-1736). This eruption was characterized by Hawaiian and Strombolian activ-ity along a 14-km-long and NNE-SSW-trending volcanic fissure (Romero, 2003). Submarine activity and some phreatomagmatic phases have been also described (Romero, 2003). The Calderas Quemadas (CQ) is a small fissure of the Timanfaya eruptive system formed by four major pyroclastic cones (Fig. 1). The studied area comprised the Caldera Quemada de Arriba (CQA) cinder cone, the easternmost of the CQ fissure. This is the area along Timanfaya that displays a higher density of big bombs (major axis > 1 m).
Figure 1. Location of the Caldera Quemada de Arriba (CQA) pyroclastic cone. Timanfaya deposits are shown in gold, highlighting in red the Calderas Quemadas eruptive fissure.
2. METODOLOGY
This study is based on fieldwork during which volcanic bombs have been mapped, described and measured. Here we consider that a bomb is a volcanic pyroclast with an intermediate axis dimension greater than 6.4 cm (Vanderkluysen et al. 2012). The bombs were located by means of a GPS and mapped in a Geographical Information System environment. Volume was estimated assuming an ellipsoidal shape and mass, assuming the density of the basaltic magma as 2650 kg m-3 (Murase & McBirney1973). A detailed study of the geomorphology and deposits of CQA have been also carried out.
209
Part 3 Geological Hazards
To estimate the location of the source vent of the bombs we have used the K-means algo-rithm (MacQueen 1967). This method of cluster analysis classifies a given data set based on their attributes through a k number of predefined clusters. The algorithm defines a random centroid by cluster, examines each data and assigns it to one of the clusters depending on the minimum distance. Finally, the position of the centroid is recalculated iteratively to minimize the sum of distances from each object to its cluster centroid. When the algorithm finishes, each centroid is closely related (in terms of similarity function) to all objects of that cluster. In this case, we have assumed that the present field of bombs was generated in an explosive phase (one cluster).
3. THE CQA ERUPTION
3.1. Geomorphology and physical volcanology of the CQA
The CQA volcanic cone consists mainly of welded scoria (spatter), and occasionally lava and lapilli. It is an asymmetric cone (Fig. 2) with a slightly elliptical plant with a major axis trending NNE-SSW (455x353 m) and a northern flank that is 20 m higher than the southern flank. The crater consists of three depressions: one main crater at the north and two second-ary ones at the southern part of the edifice. Each crater is related to a vent. The main crater walls show striations related to the partial slide of scoria. Another vent (a small spatter cone) is located at the eastern part of the crater and issued lavas that partially filled the crater. Vents forming several aligned spatter cones have been also mapped at the eastern flank. These vents were formed later than the main pyroclastic cone, but before the bombs emission, since some bombs were found inside the spatter cones crater. Lava flows were issued from the main vent towards the south during the initial phases of the eruption and later through the base of the pyroclastic cone.
3.2. The field of volcanic bombs
We mapped up to 561 bombs and studied in detail up to 101 bombs along the CQA area (Fig. 3). The volcanic bombs emitted during the CQA eruption are very varied regarding location, size and morphology. They can be found on the flanks of the CQA cinder cone as well as on the nearest single cones and lapilli field. However, no bombs can be observed inside the CQA crater and over the surrounding lava flows. Some of these bombs are partially covered by spatter on the side oriented towards the vent (Fig. 4a). The highest concentration of bombs is located on the ENE flank of the CQA cinder cone. Some bombs are clearly in situ, but most of them are forming a ring at the base of the cone (Fig. 3). The statistical analysis of the bombs spatial distribution suggest that, assuming all projectiles were ejected from a single vent, the vent from where all the bombs were ejected (centroid) is located to the east of the main vent (Fig. 3). Thus, the main vent can be assumed as the source of the bombs.
Most of the bombs have an ellipsoidal morphology (Fig 4), appearing sometimes fractured (Fig. 4d). Some bombs are flattened probably due to they rolled down the flank (Fig. 4c, d).
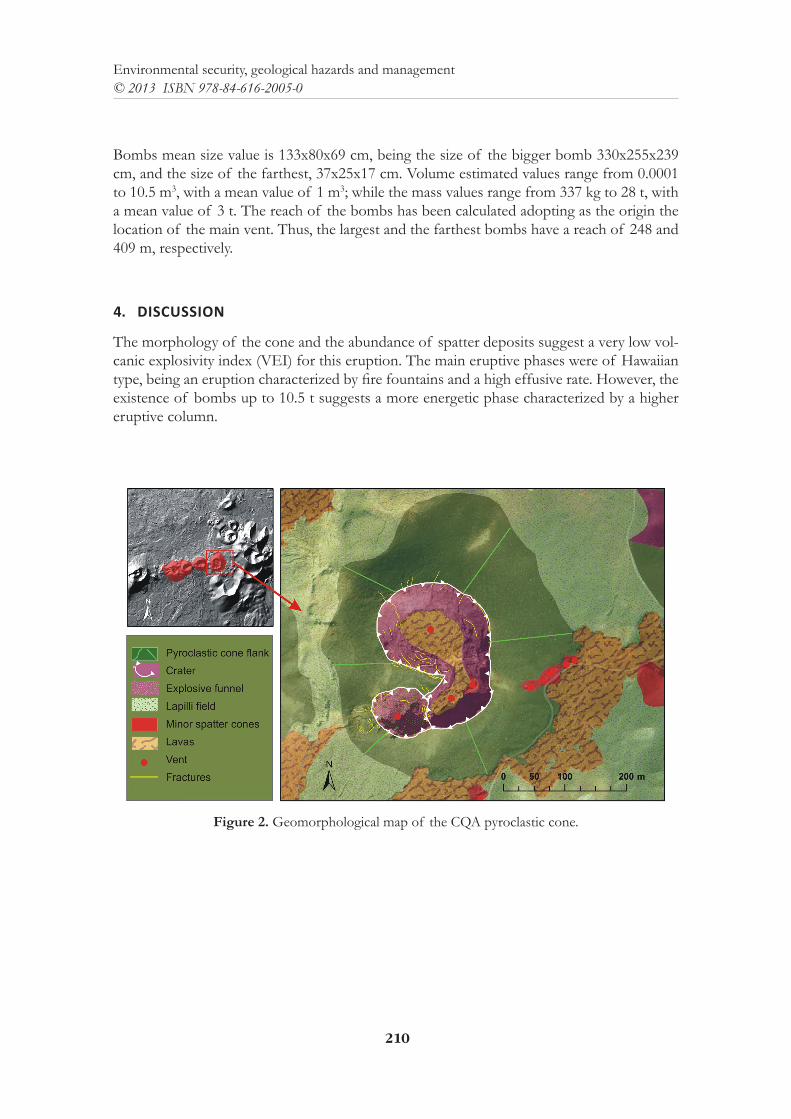
210
Environmental security, geological hazards and management© 2013 ISBN 978-84-616-2005-0
Bombs mean size value is 133x80x69 cm, being the size of the bigger bomb 330x255x239 cm, and the size of the farthest, 37x25x17 cm. Volume estimated values range from 0.0001 to 10.5 m3, with a mean value of 1 m3; while the mass values range from 337 kg to 28 t, with a mean value of 3 t. The reach of the bombs has been calculated adopting as the origin the location of the main vent. Thus, the largest and the farthest bombs have a reach of 248 and 409 m, respectively.
4. DISCUSSION
The morphology of the cone and the abundance of spatter deposits suggest a very low vol-canic explosivity index (VEI) for this eruption. The main eruptive phases were of Hawaiian type, being an eruption characterized by fire fountains and a high effusive rate. However, the existence of bombs up to 10.5 t suggests a more energetic phase characterized by a higher eruptive column.
Figure 2. Geomorphological map of the CQA pyroclastic cone.
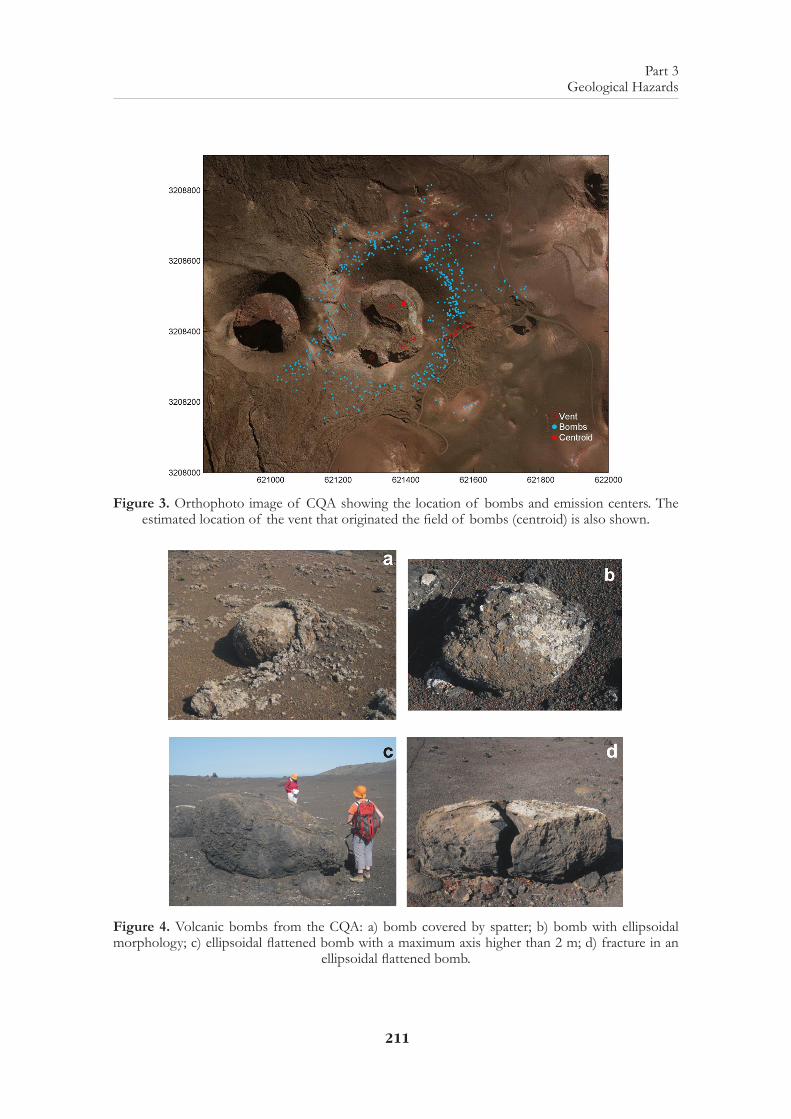
211
Part 3 Geological Hazards
Figure 3. Orthophoto image of CQA showing the location of bombs and emission centers. The estimated location of the vent that originated the field of bombs (centroid) is also shown.
Figure 4. Volcanic bombs from the CQA: a) bomb covered by spatter; b) bomb with ellipsoidal morphology; c) ellipsoidal flattened bomb with a maximum axis higher than 2 m; d) fracture in an
ellipsoidal flattened bomb.
212
Environmental security, geological hazards and management© 2013 ISBN 978-84-616-2005-0
Based on the study of the deposits, we proposed the following eruptive sequence for MQA: (1) the eruption started with a fire fountain phase from the vents located inside the crater forming the main cone; (2) lava flows were issued from the main vent and from the basal area of the pyroclastic cone; (3) a fissure was formed in the E flank with Hawaiian activity forming small spatter cones; (4) a more energetic phase associated to the main vent gave rise to the ejection of bombs; (5) new emission of spatter took place; (6) a new vent was opened in the eastern side of the crater forming a spatter cone from where lava flows were issued partially filling the crater. The existence of a high energetic phase is not consistent with the low explosivity of the MQA eruption. It could be related with the increase of pressure inside the main vent tube conduit due to its occlusion caused by slides of partially molten spatter from the crater walls.
The mismatch between the location of the main vent and the calculated centroid may be related to the different processes that may alter the initial ballistic trajectory of the bombs such as cooling, collisions, spinning and tearing (Vanderkluysen et al. 2012). For this reason, we have calculated the maximum reached distance from the main vent and not from the cen-troid. However, the results confirm the usefulness of the K-means algorithm since it allows discerning which of the vents inside the crater was the origin of the bombs.
5. CONCLUSIONS
This is the first study carried out regarding ejection of volcanic bombs and its implication for the volcanic bombs hazard analysis in the Canary Islands. It provides data of size, volume, mass and maximum reaches of volcanic bombs from the biggest field of volcanic bombs from the Timanfaya historic eruption. These data allow determining a diameter of probable damage from a vent of 200 to 400 m for the biggest bombs. However, during the high en-ergetic phase that originated the field of volcanic bombs smaller pyroclasts were probably ejected at distances higher than 1 km. Thus, during an effusive volcanic eruption, higher explosive phase can occasionally occur. This factor should be taken into account during low explosive volcanic eruptions that are usually considered as non dangerous.
This methodology can be applied to other fields of volcanic bombs in the Canary Islands to better constrain the influence of the size on the maximum distance reached by volcanic bombs. The results may be used to infer the bombs initial velocity by means of the ballistic trajectories formula, thus providing a parameter that has been previously assumed from oth-ers calculated for volcanoes located in different geodynamic settings.
REFERENCES
LAÍN, L., BELLIDO, F., GALINDO, I., PÉREZ, F., MANCEBO, M.J. & LLORENTE, M. (2008); Cartografía de Peligrosidad Volcánica de Tenerife a escala 1:25.000. In I.Galindo, L. Laín & M. Llorente (eds). El estudio y la gestión de los riesgos geológicos. pp. 175-186. Madrid: Instituto Geológico y Minero de España.

213
Part 3 Geological Hazards
MACQUEEN, J. B. (1967); Some Methods for classification and Analysis of Multivariate Observa-tions, Proceedings of 5-th Berkeley Symposium on Mathematical Statistics and Probability, Berke-ley, University of California Press, 1:281-297
MURASE, T. & MCBIRNEY, A. (1973); Properties of some common igneous rocks and their melts at high temperatures. Geoogical Society of America Buletin, 84, 3563-3592.
ROMERO, C. (2003); El relieve de Lanzarote. Tenerife: Servicio de Publicaciones del Cabildo Insular de Lanzarote.
VANDERKLUYSEN, L., HARRIS, A.J.L., KELFOUN, K., BONADONNA, C. & RIPEPE, M. (2012); Bombs behaving badly: unexpected trajectories and cooling of volcanic projectiles, Bulletin of Volcanology, 74, 1849-1858.

215
Part 3 Geological Hazards
DISASTER RISK REDUCTION, AN OVERVIEW
J.C. Santamarta-CerezalEscuela de Ingeniería Civil e Industrial, Universidad de La Laguna
J. Neris-ToméDepartamento de Edafología y Geología, Universidad de La Laguna
L.E. Hernández GutiérrezÁrea de Laboratorios y Calidad de la Construcción, Gobierno de Canarias; Instituto Volcanológico de Canarias
A. Eff-DarwichDepartamento de Edafología y Geología, Universidad de La Laguna; Instituto de Astrofísica de Canari-
as; Instituto Volcanológico de Canarias
ABSTRACT: The rapid economic and social development in recent decades has created new forms of vulnerability to natural hazards and increased existing ones. In recent years, more than half of the world’s population has established residence in cities and urban centres. This process of popula-tion concentration, coupled with the increasing number of inhabitants of the planet has led in many parts of the world to an unprecedented urban development. Under these conditions, new population centres are characterised in many parts of the world by a lack of proper planning and therefore the generation of new risks to people. According to the International Strategy for Disaster Reduction (UNISDR), in addition to traditional natural hazards, others have been generated by the increasing number of informal settlements, social inequality, environmental degradation and the process of global climate change. This paper is focus on those problems with the aim to provide a introduction on the Disaster Risk Reduction.
1. INTRODUCTION
The rapid economic and social development in recent decades has created new forms of vul-nerability to natural hazards and increased existing ones. In recent years, more than half of the world’s population has established residence in cities and urban centres. The population concentration, coupled with the increasing number of inhabitants of the planet has led in some parts of the world to an exceptional urban development. Under these conditions, new population centres are characterised by a lack of proper planning and therefore the genera-tion of new risks to people. According to the International Strategy for Disaster Reduction (UNISDR), in addition to traditional natural hazards, others have been generated by the increasing number of informal settlements, social inequality, environmental degradation and the process of global climate change.
Economic losses related to natural disasters have increased considerably in recent decades. While in the 60s, losses were around 57,500 million euros, in the 70s, they amounted to 105,300 million, 162,800 million in the 80s and 502,200 million euros in the 90s, according to
216
Environmental security, geological hazards and management© 2013 ISBN 978-84-616-2005-0
Munich RE (2002). Although most of these losses are concentrated in developed countries, it is obvious that the estimates do not take into account the economic effects of disasters on the poorest countries, where costs in terms of human lives, livelihoods and reconstruction of shattered infrastructure are higher. Currently, 85 % of people exposed to earthquakes, tropical cyclones, floods and droughts live in countries where human development is me-dium or low. By contrast, the countries with high human development contain 15% of the exposed population, but suffer only 1.8% of deaths from disasters.
The effects of natural disasters have a high degree of dependence on prior development policies. The problems arising from disorganized economic growth can lead to a lack of planning in urban development and increased risk of disaster. However, this need not neces-sarily be so. Human development can also help us reduce disaster risk. Therefore, the present challenge to the international community is to mainstream disaster risk reduction in devel-opment planning in order to anticipate and prevent disaster risk by integrating the potential threats in the design and implementation of development policies.
2. DISASTER RISK REDUCTION
According to the terminology of UNISDR (2009), Disaster Risk Reduction (DRR) is the con-cept and practice of reducing disaster risk through systematic efforts aimed at the analysis and management of the causal factors of disasters, including the reduction of the level of exposure to threats, the reduction of vulnerability of people and property, the wise management of soil and environment, and the improvement of preparedness for adverse events.
Disaster Risk Reduction is a comprehensive approach that includes identification, evaluation, and of course reducing disaster risk. The nature of these actions is very wide including politi-cal, technical, social and economic tasks. These practices fall within the definition of advice on policies, legislation, disaster preparedness plans, agricultural, insurance plans, etc. This is achieved according to UNISDR by the following actions:
• Incorporating Disaster Risk Reduction into the plans and programmes of socio-eco-nomic development through the transfer of funds, technology and knowledge to vul-nerable communities.
• Including DRR strategies and programmes to reduce poverty to increase their resilien-ce to disasters.
• Increasing resistance to disasters of basic infrastructure to ensure universal access to education, primary care and emergency health.
• Taking into account the key role of women in DRR especially for community develo-pment, natural resource management, prevention of drought, water management and subsistence agriculture.
217
Part 3 Geological Hazards
• Managing urban growth and planning to reduce risks and prevent disasters and mitigate their effects. Risk assessments should be incorporated into building codes and planning to avoid economic and personal losses.
2.1. Topic one; casualties by type of natural disaster
UNISDR (2004) made the above estimate of casualties by type of natural disaster. According to the FAO, the main natural hazards are tropical cyclones, earthquakes, floods and droughts. These four are responsible for 94% of those killed by natural disasters.
• Earthquakes: An annual average of 130 million people are exposed to seismic risk. Countries like the Islamic Republic of Iran, Afghanistan and India account for the greatest relative vulnerability (percentage of people who died over those exposed). Other countries with intermediate development and high populations in urban areas, such as Turkey and the Russian Federation, also show a high relative vulnerability. Fina-lly, countries such as Armenia and Guinea have suffered exceptional disasters in recent years.
• Tropical cyclones: An average of 119 million people are exposed to tropical cyclones annually, some of whom experience more than four hurricanes per year. Bangladesh, Honduras and Nicaragua show a high relative vulnerability. These countries have su-ffered disasters of this kind in recent years. Other countries with very high population concentrations in coastal areas are also highly vulnerable. This is the case of India, the Philippines and Vietnam. Small Island Developing States (SIDs) are also high-risk countries but with great differences between them.
• Floods: On average, each year, 196 million people, in over 90 countries, are vulnerable to catastrophic flooding. Predictably, vulnerability to such disasters will increase in co-ming years due to climate change. Countries with high vulnerability to floods include Somalia, Morocco and Yemen. Venezuela also belongs to this group but due to a single event. In addition, a larger number of people are exposed to floods of lesser magnitu-de. Normally, these losses are not taken into account in estimates of damage because they are of low severity. However, they do hinder the development of the affected areas.
• Drought: Approximately 220 million people are exposed to drought annually. African countries are those with the greatest vulnerability to drought. However, methodological difficulties prevent a complete study and the publishing of solid conclusions about this risk and specific to any country.
218
Environmental security, geological hazards and management© 2013 ISBN 978-84-616-2005-0
2.2. Topic two; Economics losses
According to the UNISDR (2009) terminology, disaster losses are traditionally classified into:
•Direct costs are the damage, including damage to the productive capital stock (industrial plants, standing crops, stock, etc.), Damage to economic infrastructure (transport, energy supply, etc.) and damage to social infrastructure (housing, schools, etc.).
• Indirect costs are secondary disorders that affect the supply of goods and services, such as reduced performance due to destruction or damage of facilities or infrastructure, and loss of earnings due to lower revenue opportunities. Cuts in basic services can have serious consequences, such as disruption of telecommunications or a lack of drinking water. The indirect costs also include health expenditures and lost productivity due to illness, disability and death. However, the gross indirect cost is also partially offset by positive effects related to the rehabilitation and reconstruction, such as reviving the construction sector.
• Side effects are the short and long-term impacts of a disaster throughout the economy and socio-economic conditions. These include effects on, for instance, fiscal and monetary performance, the amount of housing and the external debt, income distribution and the magnitude and incidence of poverty, the consequences of removal or restructuring of certain elements of the economy and the labour force.
3. CONCLUSIONS AND DISASTER RISK REDUCTION IMPORTANCE
According to the UNISDR, it is estimated that between 1980 and 2000 about 75% of the world’s population was affected by a natural disaster at least once. These forces affect both infrastructure and people. The losses resulting from natural disasters have increased by ten in the last 5 decades. Furthermore, the effects of disasters are most pronounced in develop-ing areas, where the population is more exposed to them. In fact, it is estimated that 85% of people exposed to natural hazards live in developing countries. The costs for recovery from disasters in these areas delay their development, which in turn affects development of prevention or mitigation policies to reduce future costs and disaster risks. Moreover, The direct cost for recovery has rocketed in the last ten years (Munich RE, 2002). Furthermore, these costs are an underestimate because they do not include the long-term cost of the future prospects of development of the populations affected. Disasters also endanger food security in affected areas.
The distribution of human losses and victims of natural disasters shows that most are con-centrated in underdeveloped areas of Asia, Africa and South America. According to UNIS-DR, the Asia-Pacific is the most affected area regarding the number of fatalities. It is also the region with the highest proportion of casualties from earthquakes, tropical cyclones, floods. The exception is the high concentration of deaths caused by droughts in Africa. The losses in Latin America and the Caribbean are generally due to disasters related to tropical cyclones and floods. Africa and East Asia also suffer huge losses due to flooding. Europe and North
219
Part 3 Geological Hazards
America present lower levels, both in absolute and relative death mortality for any type of disaster, although earthquakes in Europe cause the largest relative losses.
Similar to assessing the effects on the population, the analysis of the economic losses from disasters is complex. This is mainly due to the information on economic losses and deterio-ration of livelihoods often being incomplete or inaccurate. When quantifying such losses, insurance companies often ignore both indirect economic losses, such as side effects, so the databases with information on this aspect are biased.
According to available data, it is estimated that the costs of disasters have increased con-siderably in recent decades. One of the largest insurance companies in the world, Munich RE (2002) estimated that the real annual economic losses have increased tenfold in the last 50 years. It also indicates that at least two thirds of these losses correspond to developed countries. Unlike in loss of life, Europe and North America lead in terms of economic losses from natural disasters. The low loss estimates for underdeveloped regions, like Africa, are because the forecasts do not take into account the impact on the development potential of countries. Furthermore, the reduced material losses are due to the infrastructure deficit that characterizes these countries. However, we must take into account that a small financial loss can have devastating consequences in countries with a very low GDP.
REFERENCES
Munich RE, 2002. Topics: Annual review, natural catastrophes 2002. http://www.munichre.co.jp/public/PDF/Topics_2002_NaturalHazardIndex.pdf.
UNISDR, 2004. Reducing disaster risk: A challenge for development. http://www.un.org/special-rep/ohrlls/ldc/Global-Reports/UNDP%20Reducing%20Disaster%20Risk.pdf.
UNISDR, 2009. Terminology on disaster risk reduction. http://www.unisdr.org/we/inform/publi-cations/7817.

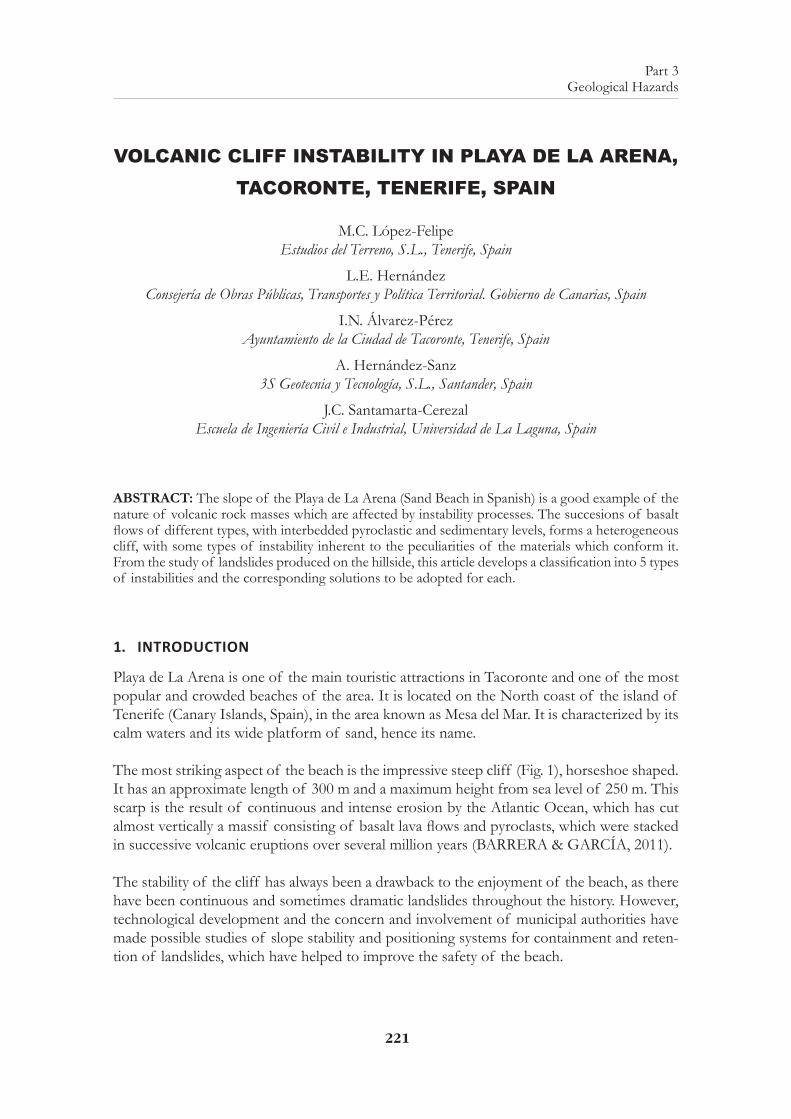
221
Part 3 Geological Hazards
VOLCANIC CLIFF INSTABILITY IN PLAYA DE LA ARENA, TACORONTE, TENERIFE, SPAIN
M.C. López-FelipeEstudios del Terreno, S.L., Tenerife, Spain
L.E. HernándezConsejería de Obras Públicas, Transportes y Política Territorial. Gobierno de Canarias, Spain
I.N. Álvarez-PérezAyuntamiento de la Ciudad de Tacoronte, Tenerife, Spain
A. Hernández-Sanz3S Geotecnia y Tecnología, S.L., Santander, Spain
J.C. Santamarta-CerezalEscuela de Ingeniería Civil e Industrial, Universidad de La Laguna, Spain
ABSTRACT: The slope of the Playa de La Arena (Sand Beach in Spanish) is a good example of the nature of volcanic rock masses which are affected by instability processes. The succesions of basalt flows of different types, with interbedded pyroclastic and sedimentary levels, forms a heterogeneous cliff, with some types of instability inherent to the peculiarities of the materials which conform it. From the study of landslides produced on the hillside, this article develops a classification into 5 types of instabilities and the corresponding solutions to be adopted for each.
1. INTRODUCTION
Playa de La Arena is one of the main touristic attractions in Tacoronte and one of the most popular and crowded beaches of the area. It is located on the North coast of the island of Tenerife (Canary Islands, Spain), in the area known as Mesa del Mar. It is characterized by its calm waters and its wide platform of sand, hence its name.
The most striking aspect of the beach is the impressive steep cliff (Fig. 1), horseshoe shaped. It has an approximate length of 300 m and a maximum height from sea level of 250 m. This scarp is the result of continuous and intense erosion by the Atlantic Ocean, which has cut almost vertically a massif consisting of basalt lava flows and pyroclasts, which were stacked in successive volcanic eruptions over several million years (BARRERA & GARCÍA, 2011).
The stability of the cliff has always been a drawback to the enjoyment of the beach, as there have been continuous and sometimes dramatic landslides throughout the history. However, technological development and the concern and involvement of municipal authorities have made possible studies of slope stability and positioning systems for containment and reten-tion of landslides, which have helped to improve the safety of the beach.
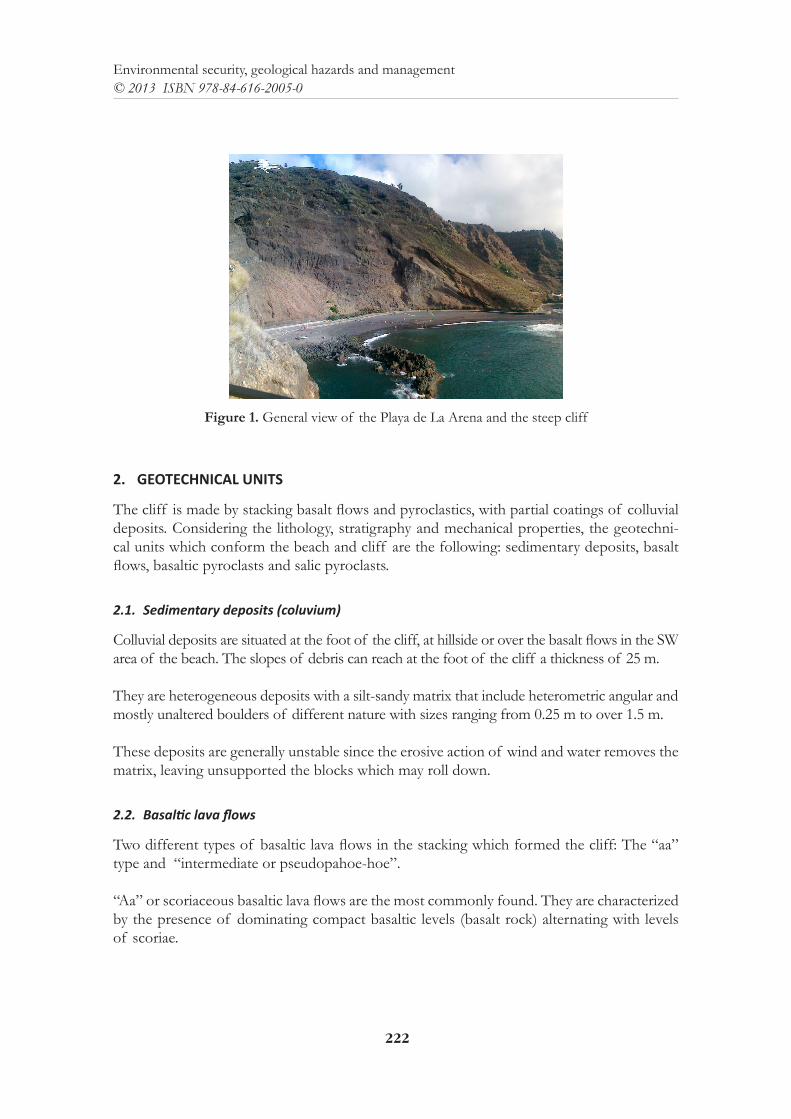
222
Environmental security, geological hazards and management© 2013 ISBN 978-84-616-2005-0
Figure 1. General view of the Playa de La Arena and the steep cliff
2. GEOTECHNICAL UNITS
The cliff is made by stacking basalt flows and pyroclastics, with partial coatings of colluvial deposits. Considering the lithology, stratigraphy and mechanical properties, the geotechni-cal units which conform the beach and cliff are the following: sedimentary deposits, basalt flows, basaltic pyroclasts and salic pyroclasts.
2.1. Sedimentary deposits (coluvium)
Colluvial deposits are situated at the foot of the cliff, at hillside or over the basalt flows in the SW area of the beach. The slopes of debris can reach at the foot of the cliff a thickness of 25 m.
They are heterogeneous deposits with a silt-sandy matrix that include heterometric angular and mostly unaltered boulders of different nature with sizes ranging from 0.25 m to over 1.5 m.
These deposits are generally unstable since the erosive action of wind and water removes the matrix, leaving unsupported the blocks which may roll down.
2.2. Basaltic lava flows
Two different types of basaltic lava flows in the stacking which formed the cliff: The “aa” type and “intermediate or pseudopahoe-hoe”.
“Aa” or scoriaceous basaltic lava flows are the most commonly found. They are characterized by the presence of dominating compact basaltic levels (basalt rock) alternating with levels of scoriae.
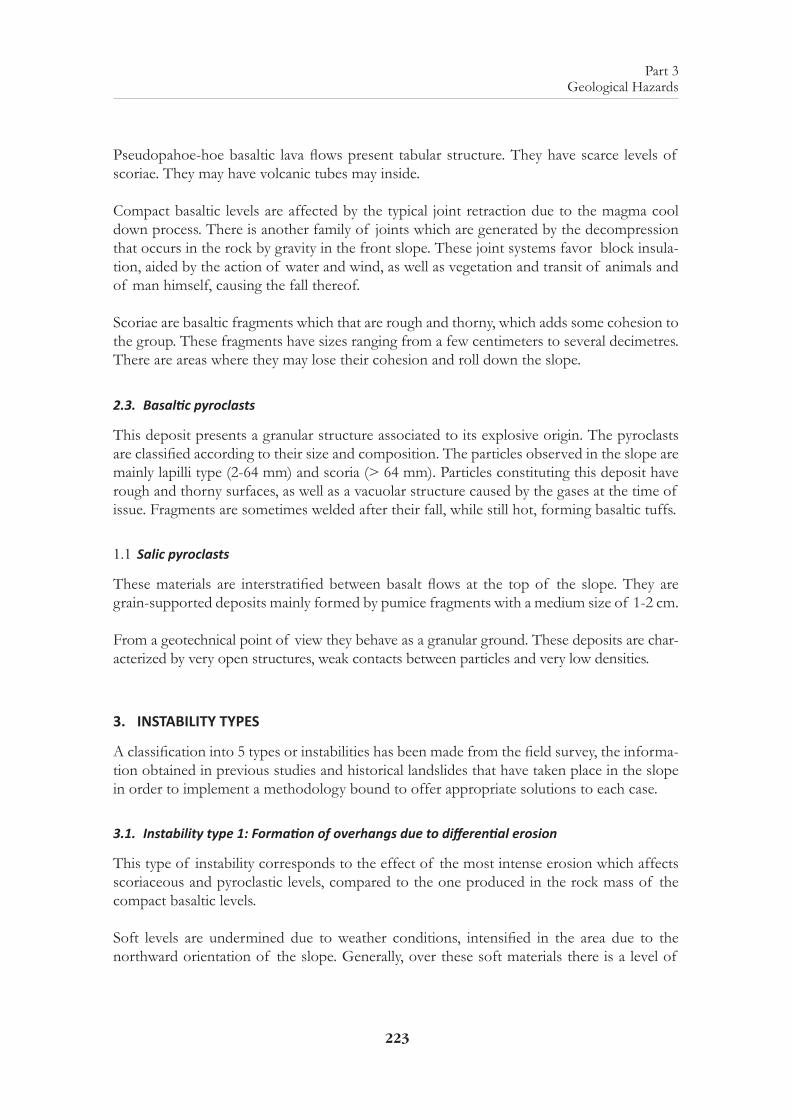
223
Part 3 Geological Hazards
Pseudopahoe-hoe basaltic lava flows present tabular structure. They have scarce levels of scoriae. They may have volcanic tubes may inside.
Compact basaltic levels are affected by the typical joint retraction due to the magma cool down process. There is another family of joints which are generated by the decompression that occurs in the rock by gravity in the front slope. These joint systems favor block insula-tion, aided by the action of water and wind, as well as vegetation and transit of animals and of man himself, causing the fall thereof.
Scoriae are basaltic fragments which that are rough and thorny, which adds some cohesion to the group. These fragments have sizes ranging from a few centimeters to several decimetres. There are areas where they may lose their cohesion and roll down the slope.
2.3. Basaltic pyroclasts
This deposit presents a granular structure associated to its explosive origin. The pyroclasts are classified according to their size and composition. The particles observed in the slope are mainly lapilli type (2-64 mm) and scoria (> 64 mm). Particles constituting this deposit have rough and thorny surfaces, as well as a vacuolar structure caused by the gases at the time of issue. Fragments are sometimes welded after their fall, while still hot, forming basaltic tuffs.
1.1Salic pyroclasts
These materials are interstratified between basalt flows at the top of the slope. They are grain-supported deposits mainly formed by pumice fragments with a medium size of 1-2 cm.
From a geotechnical point of view they behave as a granular ground. These deposits are char-acterized by very open structures, weak contacts between particles and very low densities.
3. INSTABILITY TYPES
A classification into 5 types or instabilities has been made from the field survey, the informa-tion obtained in previous studies and historical landslides that have taken place in the slope in order to implement a methodology bound to offer appropriate solutions to each case.
3.1. Instability type 1: Formation of overhangs due to differential erosion
This type of instability corresponds to the effect of the most intense erosion which affects scoriaceous and pyroclastic levels, compared to the one produced in the rock mass of the compact basaltic levels.
Soft levels are undermined due to weather conditions, intensified in the area due to the northward orientation of the slope. Generally, over these soft materials there is a level of
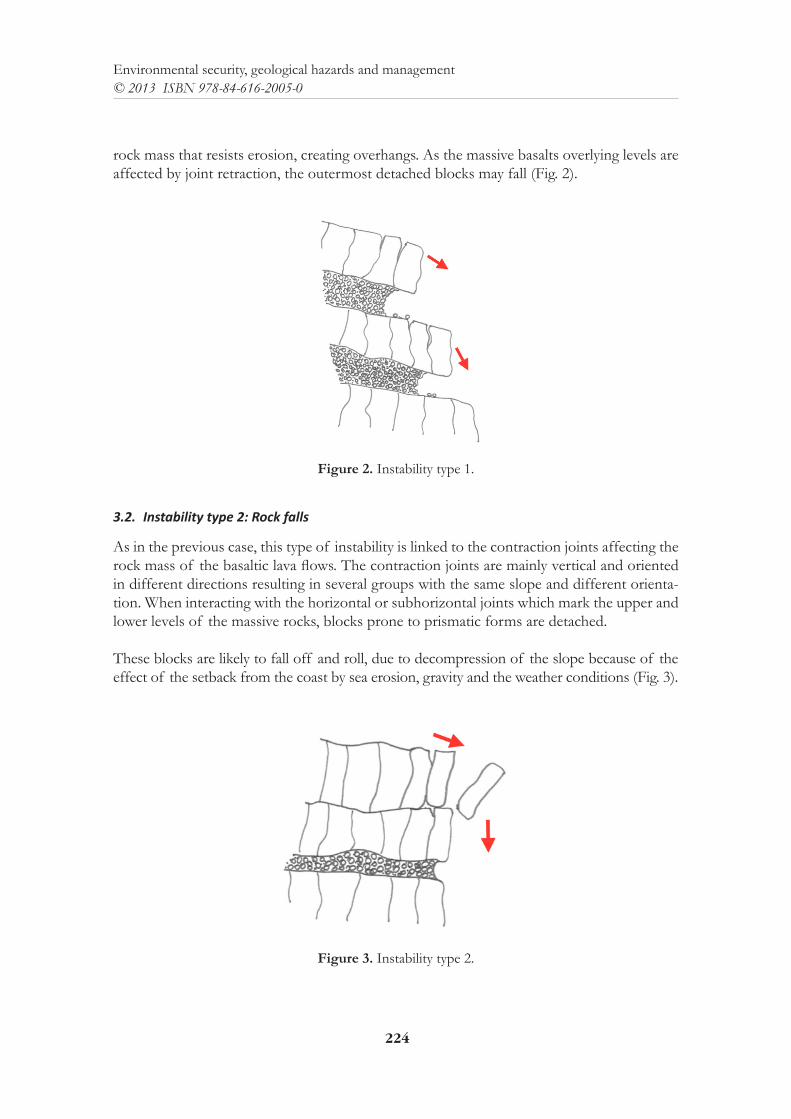
224
Environmental security, geological hazards and management© 2013 ISBN 978-84-616-2005-0
rock mass that resists erosion, creating overhangs. As the massive basalts overlying levels are affected by joint retraction, the outermost detached blocks may fall (Fig. 2).
Figure 2. Instability type 1.
3.2. Instability type 2: Rock falls
As in the previous case, this type of instability is linked to the contraction joints affecting the rock mass of the basaltic lava flows. The contraction joints are mainly vertical and oriented in different directions resulting in several groups with the same slope and different orienta-tion. When interacting with the horizontal or subhorizontal joints which mark the upper and lower levels of the massive rocks, blocks prone to prismatic forms are detached.
These blocks are likely to fall off and roll, due to decompression of the slope because of the effect of the setback from the coast by sea erosion, gravity and the weather conditions (Fig. 3).
Figure 3. Instability type 2.
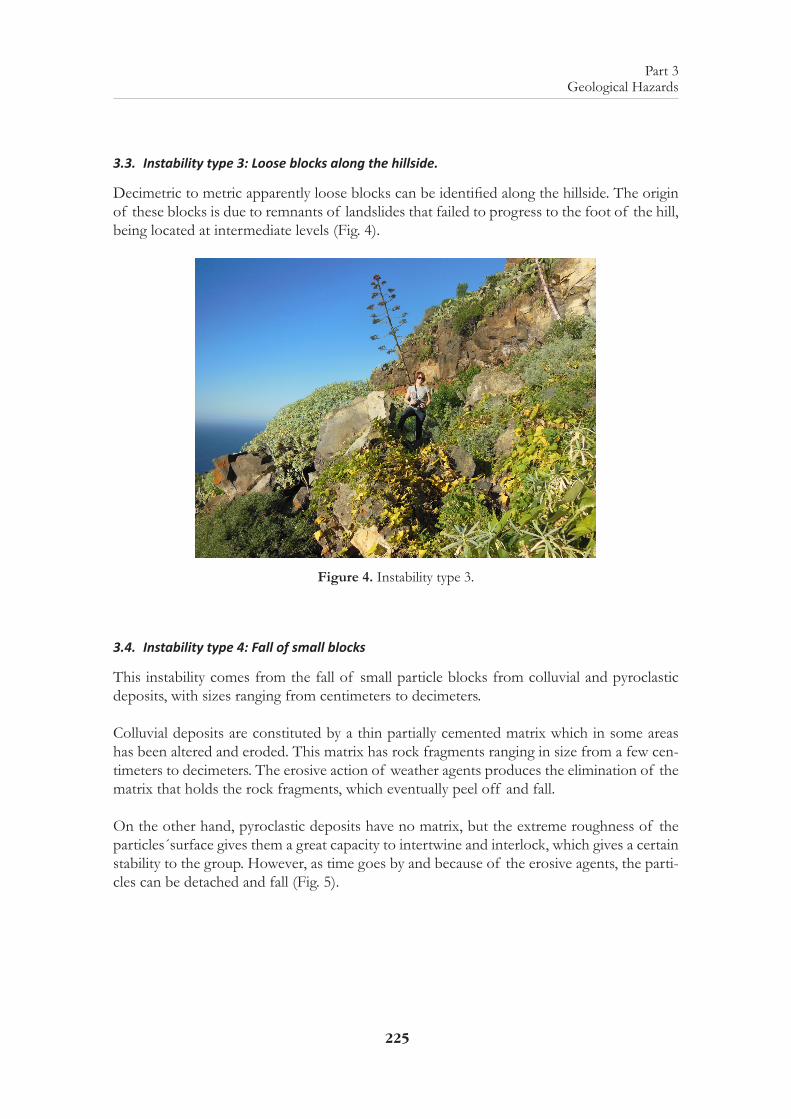
225
Part 3 Geological Hazards
3.3. Instability type 3: Loose blocks along the hillside.
Decimetric to metric apparently loose blocks can be identified along the hillside. The origin of these blocks is due to remnants of landslides that failed to progress to the foot of the hill, being located at intermediate levels (Fig. 4).
Figure 4. Instability type 3.
3.4. Instability type 4: Fall of small blocks
This instability comes from the fall of small particle blocks from colluvial and pyroclastic deposits, with sizes ranging from centimeters to decimeters.
Colluvial deposits are constituted by a thin partially cemented matrix which in some areas has been altered and eroded. This matrix has rock fragments ranging in size from a few cen-timeters to decimeters. The erosive action of weather agents produces the elimination of the matrix that holds the rock fragments, which eventually peel off and fall.
On the other hand, pyroclastic deposits have no matrix, but the extreme roughness of the particles´surface gives them a great capacity to intertwine and interlock, which gives a certain stability to the group. However, as time goes by and because of the erosive agents, the parti-cles can be detached and fall (Fig. 5).
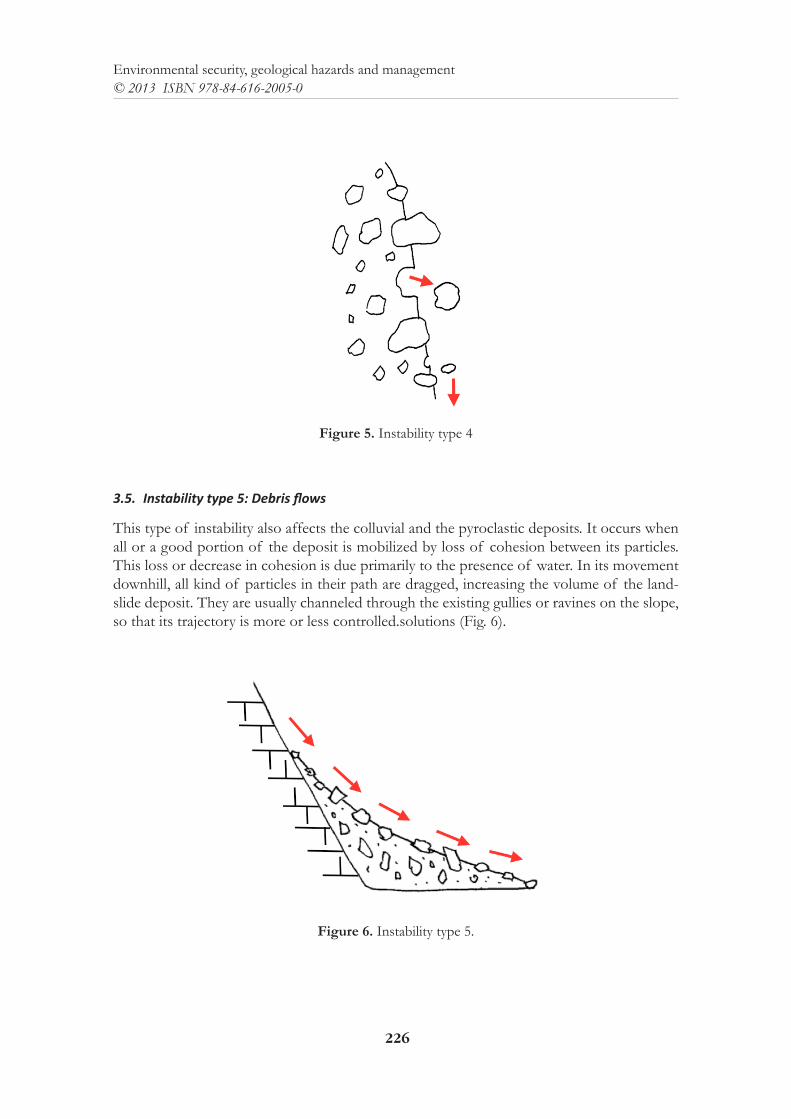
226
Environmental security, geological hazards and management© 2013 ISBN 978-84-616-2005-0
Figure 5. Instability type 4
3.5. Instability type 5: Debris flows
This type of instability also affects the colluvial and the pyroclastic deposits. It occurs when all or a good portion of the deposit is mobilized by loss of cohesion between its particles. This loss or decrease in cohesion is due primarily to the presence of water. In its movement downhill, all kind of particles in their path are dragged, increasing the volume of the land-slide deposit. They are usually channeled through the existing gullies or ravines on the slope, so that its trajectory is more or less controlled.solutions (Fig. 6).
Figure 6. Instability type 5.
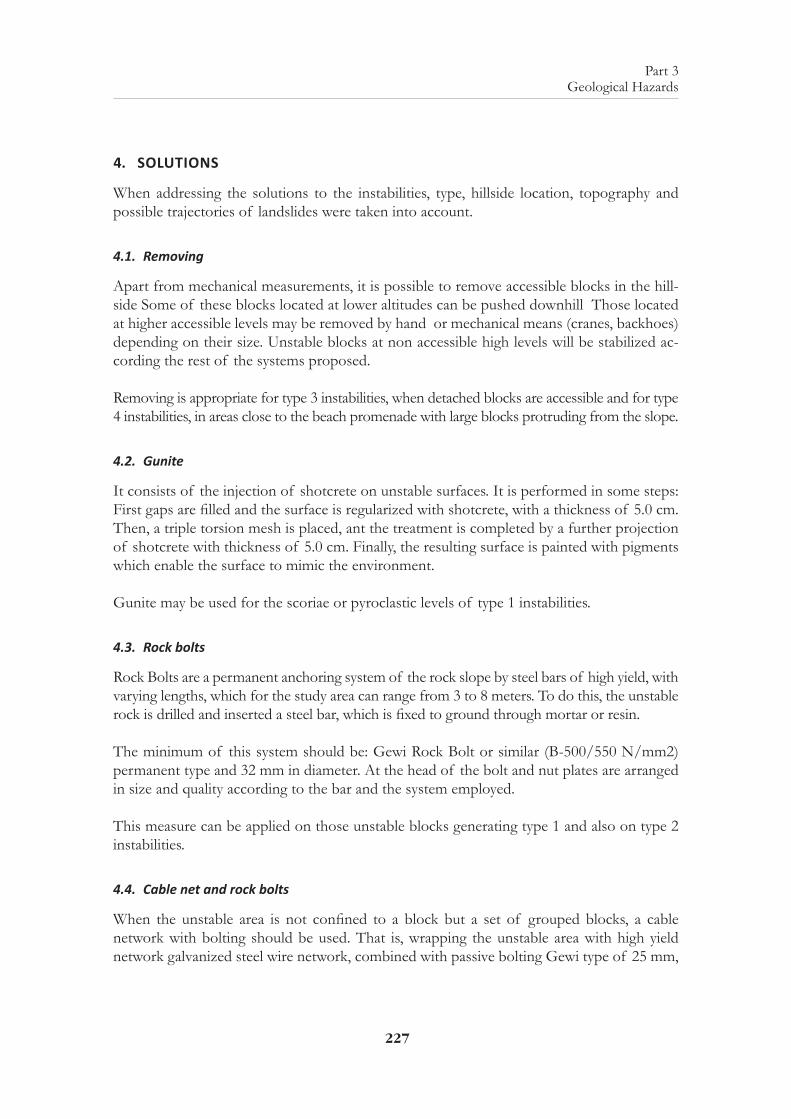
227
Part 3 Geological Hazards
4. SOLUTIONS
When addressing the solutions to the instabilities, type, hillside location, topography and possible trajectories of landslides were taken into account.
4.1. Removing
Apart from mechanical measurements, it is possible to remove accessible blocks in the hill-side Some of these blocks located at lower altitudes can be pushed downhill Those located at higher accessible levels may be removed by hand or mechanical means (cranes, backhoes) depending on their size. Unstable blocks at non accessible high levels will be stabilized ac-cording the rest of the systems proposed.
Removing is appropriate for type 3 instabilities, when detached blocks are accessible and for type 4 instabilities, in areas close to the beach promenade with large blocks protruding from the slope.
4.2. Gunite
It consists of the injection of shotcrete on unstable surfaces. It is performed in some steps: First gaps are filled and the surface is regularized with shotcrete, with a thickness of 5.0 cm. Then, a triple torsion mesh is placed, ant the treatment is completed by a further projection of shotcrete with thickness of 5.0 cm. Finally, the resulting surface is painted with pigments which enable the surface to mimic the environment.
Gunite may be used for the scoriae or pyroclastic levels of type 1 instabilities.
4.3. Rock bolts
Rock Bolts are a permanent anchoring system of the rock slope by steel bars of high yield, with varying lengths, which for the study area can range from 3 to 8 meters. To do this, the unstable rock is drilled and inserted a steel bar, which is fixed to ground through mortar or resin.
The minimum of this system should be: Gewi Rock Bolt or similar (B-500/550 N/mm2) permanent type and 32 mm in diameter. At the head of the bolt and nut plates are arranged in size and quality according to the bar and the system employed.
This measure can be applied on those unstable blocks generating type 1 and also on type 2 instabilities.
4.4. Cable net and rock bolts
When the unstable area is not confined to a block but a set of grouped blocks, a cable network with bolting should be used. That is, wrapping the unstable area with high yield network galvanized steel wire network, combined with passive bolting Gewi type of 25 mm,
228
Environmental security, geological hazards and management© 2013 ISBN 978-84-616-2005-0
2.0 m long, with staggered distribution at 3.0 x 3.5 m (one bolt each 10.5 m2) and horizontal reinforcement steel cable with dual 16 mm, installed under unidirectional model, which pro-vides a support unit of up to 15 kN/m2 for operating voltages of all elements components. This protection must apply to the instabilities of type 2, when the unstable area is not con-fined to a block but a set of grouped blocks, and the instabilities of type 3, when the block can not be removed because of its size.
4.5. Triple torsion net
To control shallow rock fall a triple torsion net is used. It is a hexagonal hole net, woven with two galvanized wires that are joined together into three zones coiled torsion in reverse. They are fixed by 1 and 1,5 m bolts in the header of the slope, and allow high resistance to breakage. This mesh cover prevents instability and avoids surface rocks from falling, speed-ing stumbling over an overhang, flying and falling directly on the promenade or the beach.
It is an effective solution to cover the colluvial deposits that are close to the beach walk, often affected by instabilities of type 4.
4.6. Debris flows barriers
To contain this type of instability flexible barriers against the flow of detritus (debris flows) are used. They are flexible systems consisting of a network of rings that are anchored to the rock, without poles, in a groove or small channel of the slope, through which a massive debris flow is channeled.
The barrier is fixed without support on the flanks of the channel by anchoring or self-drilling bolts with flexible head. The ring network hangs through shackles the upper and lower sup-porting cables, which are equipped with brake rings. This type of retention system is suitable in cases of channel widths up to 15 meters and a network up to 6 meters high.
They are useful to control the instabilities of type 5.
4.7. Dynamic barriers
They are flexible systems capable of absorbing the energy of rock fall. The lowest mesh placed at the foot of the slope is designed to absorb the energy of 500kJ. It consists of a cable network with high yield steel wires closed rings. The ring diameter is 350 mm. It is sup-ported by 4 meters high steel poles, placed 10 meters away from each other.
This measure allows controlling the detached blocks from type 1 and type 2 instabilities.
229
Part 3 Geological Hazards
4.8. Drape mesh and bag
This is a protective, fall guided mesh drape type. It consists of a wire mesh of high strength and low creep, suspended by crowning by posts with a retrieval bag and at the foot of the slope.
It is considered a combined system of prevention and correction. On the one hand, the mesh holds and fixes materials to the slope. On the other hand, the poles placed crowned act as a barrier that retains and leads the falls from higher levels.
This system is suitable for type 1, 2 and 3 instabilities.
ACKNOWLEDGMENTS
The authors wish to extend their thanks to the City Council of Tacoronte, for the support provided for the drafting of this article.
REFERENCES
BARRERA MORATE, J.L. & GARCÍA MORAL, R. (2011); Mapa Geológico de Canarias. GRAF-CAN. Santa Cruz de Tenerife.

ENVIRONMENTAL SECURITY, GEOLOGICAL HAZARDS AND MANAGEMENT
Environmental security, geological hazards and management includes pro-ceedings of the 1st international workshop which was held in Tenerife 17 april-19 april 2013, within the framework of the european project 517629-LLP-1-2011-1-UK-ERASMUS-EMCR, Master in Environmental Security and Management. The book is a comprehensive collection of the most relevant topics related to environmental secu-rity, including:
• Climate change and security
• Changing climate impacting on water and energy needs for millions
• Science and innovation for energy safety
• Sustainable environment, occupational, and public health for livelihood
• The rio+20 summit: green economy and global governance
• Safe, resilient, and sustainable communities
• Geological hazards
• Threats to water resources
Environmental security, geological hazards and management is of interest academics, engineers, consultants involved in environmental security
ISBN 978-84-616-2005-0