BIM Visual Programming Tools Applications in Infrastructure ...
24
applied sciences Review BIM Visual Programming Tools Applications in Infrastructure Projects: A State-of-the-Art Review Jorge Collao 1 , Fidel Lozano-Galant 2 , José Antonio Lozano-Galant 2 and Jose Turmo 1, * Citation: Collao, J.; Lozano-Galant, F.; Lozano-Galant, J.A.; Turmo, J. BIM Visual Programming Tools Applications in Infrastructure Projects: A State-of-the-Art Review. Appl. Sci. 2021, 11, 8343. https:// doi.org/10.3390/app11188343 Academic Editor: Francesco Colangelo Received: 15 July 2021 Accepted: 3 September 2021 Published: 8 September 2021 Publisher’s Note: MDPI stays neutral with regard to jurisdictional claims in published maps and institutional affil- iations. Copyright: © 2021 by the authors. Licensee MDPI, Basel, Switzerland. This article is an open access article distributed under the terms and conditions of the Creative Commons Attribution (CC BY) license (https:// creativecommons.org/licenses/by/ 4.0/). 1 Department of Civil and Environmental Engineering, Universitat Politècnica de Catalunya Barcelona TECH, 08034 Barcelona, Spain; [email protected] 2 Department of Civil Engineering, Universidad of Castilla-La Mancha, 13003 Ciudad Real, Spain; fi[email protected] (F.L.-G.); [email protected] (J.A.L.-G.) * Correspondence: [email protected] Featured Application: This study aims to review the state of the art of visual programming algo- rithm applications in BIM infrastructure projects. Abstract: The Building Information Modeling (BIM) methodology improves architectural and in- frastructure projects by digitizing their processes throughout their life cycle stages, such as design, construction, management, monitoring, and operation. In recent years, the automation of these processes has been favored by the use of visual programming (VP) tools that have replaced conven- tional programming languages for visual schemes. The use of these tools in architectural projects is becoming increasing popular. However, this is not the case in infrastructure projects, for which the use of VP algorithms remains scarce. The aim of this work is to encourage both scholars and engineers to implement VP tools in infrastructure projects. For this purpose, this work reviews, for the first time in the literature, the state-of-the-art and future research trends of VP tools in infrastructure projects. Keywords: Building Information Modeling (BIM); infrastructure projects; visual programming; dynamo; grasshopper; python 1. Introduction The Architecture, Engineering, and Construction and Operation (AECO) projects industry is characterized by its dynamic and evolutionary nature [1,2]. This dynamic spirit has been reflected mainly by the technological developments made by the AECO industry [3,4], which has undergone a revolution in the traditional manner of developing projects [5,6]. This technological growth is mainly focused on the following three trends: (1) Constructive element prefabrication [7–9]—the physical components of construction projects are assembled in specialized workshops and then delivered to construction sites for their placement. (2) Projects’ carbon footprint reduction [10–12]—AECO projects have significantly contributed to the current climate crisis due to the environmental impact of their construction stages [13]. Therefore, the aim of regulation is to reduce the emissions of the projects undertaken by this industry. [14,15]. (3) Project digitalization [16–18]—this trend simulates different scenarios during the project life cycle to optimize the resources from early stages [19], and is considered the most important trend in the AECO industry from an information technology perspective [20]. Currently, project digitalization is strongly connected with the development of the Building Information Modeling (BIM) methodology [21]. BIM refers to a collaborative environment that generates information models of all stages of a projects’ life cycle [22,23]. A number of scholars (see, e.g., [24–37]) have discussed the benefits of implementing this approach in different AECO projects. However, these works are mainly focused on building projects [38,39]. Analyses of the benefits of BIM for infrastructure projects (such as bridges, tunnels, and roads) are relatively scarce in the literature. This difference is particularly Appl. Sci. 2021, 11, 8343. https://doi.org/10.3390/app11188343 https://www.mdpi.com/journal/applsci
-
Upload
khangminh22 -
Category
Documents
-
view
3 -
download
0
Transcript of BIM Visual Programming Tools Applications in Infrastructure ...
applied sciences
Review
BIM Visual Programming Tools Applications in InfrastructureProjects: A State-of-the-Art Review
Jorge Collao 1, Fidel Lozano-Galant 2, José Antonio Lozano-Galant 2 and Jose Turmo 1,*
�����������������
Citation: Collao, J.; Lozano-Galant,
F.; Lozano-Galant, J.A.; Turmo, J. BIM
Visual Programming Tools
Applications in Infrastructure
Projects: A State-of-the-Art Review.
Appl. Sci. 2021, 11, 8343. https://
doi.org/10.3390/app11188343
Academic Editor: Francesco
Colangelo
Received: 15 July 2021
Accepted: 3 September 2021
Published: 8 September 2021
Publisher’s Note: MDPI stays neutral
with regard to jurisdictional claims in
published maps and institutional affil-
iations.
Copyright: © 2021 by the authors.
Licensee MDPI, Basel, Switzerland.
This article is an open access article
distributed under the terms and
conditions of the Creative Commons
Attribution (CC BY) license (https://
creativecommons.org/licenses/by/
4.0/).
1 Department of Civil and Environmental Engineering, Universitat Politècnica de Catalunya Barcelona TECH,08034 Barcelona, Spain; [email protected]
2 Department of Civil Engineering, Universidad of Castilla-La Mancha, 13003 Ciudad Real, Spain;[email protected] (F.L.-G.); [email protected] (J.A.L.-G.)
* Correspondence: [email protected]
Featured Application: This study aims to review the state of the art of visual programming algo-rithm applications in BIM infrastructure projects.
Abstract: The Building Information Modeling (BIM) methodology improves architectural and in-frastructure projects by digitizing their processes throughout their life cycle stages, such as design,construction, management, monitoring, and operation. In recent years, the automation of theseprocesses has been favored by the use of visual programming (VP) tools that have replaced conven-tional programming languages for visual schemes. The use of these tools in architectural projects isbecoming increasing popular. However, this is not the case in infrastructure projects, for which theuse of VP algorithms remains scarce. The aim of this work is to encourage both scholars and engineersto implement VP tools in infrastructure projects. For this purpose, this work reviews, for the first timein the literature, the state-of-the-art and future research trends of VP tools in infrastructure projects.
Keywords: Building Information Modeling (BIM); infrastructure projects; visual programming;dynamo; grasshopper; python
1. Introduction
The Architecture, Engineering, and Construction and Operation (AECO) projectsindustry is characterized by its dynamic and evolutionary nature [1,2]. This dynamicspirit has been reflected mainly by the technological developments made by the AECOindustry [3,4], which has undergone a revolution in the traditional manner of developingprojects [5,6]. This technological growth is mainly focused on the following three trends:(1) Constructive element prefabrication [7–9]—the physical components of constructionprojects are assembled in specialized workshops and then delivered to construction sitesfor their placement. (2) Projects’ carbon footprint reduction [10–12]—AECO projects havesignificantly contributed to the current climate crisis due to the environmental impact oftheir construction stages [13]. Therefore, the aim of regulation is to reduce the emissionsof the projects undertaken by this industry. [14,15]. (3) Project digitalization [16–18]—thistrend simulates different scenarios during the project life cycle to optimize the resourcesfrom early stages [19], and is considered the most important trend in the AECO industryfrom an information technology perspective [20].
Currently, project digitalization is strongly connected with the development of theBuilding Information Modeling (BIM) methodology [21]. BIM refers to a collaborativeenvironment that generates information models of all stages of a projects’ life cycle [22,23].A number of scholars (see, e.g., [24–37]) have discussed the benefits of implementing thisapproach in different AECO projects. However, these works are mainly focused on buildingprojects [38,39]. Analyses of the benefits of BIM for infrastructure projects (such as bridges,tunnels, and roads) are relatively scarce in the literature. This difference is particularly
Appl. Sci. 2021, 11, 8343. https://doi.org/10.3390/app11188343 https://www.mdpi.com/journal/applsci

Appl. Sci. 2021, 11, 8343 2 of 24
highlighted in works that have studied these benefits for the digitalization of infrastructureprojects [40,41]. This gap is explained by infrastructure projects’ characteristics, such as theirunique geometry and high design requirements [42]. Due to these unique characteristics,the implementation of the BIM methodology is more difficult.
Computer programming has contributed by developing different BIM applications,which are used to digitize projects in the AECO industry [43]. However, these applicationshave only covered the main BIM applications [44], such as (1) modeling, (2) generationof documentation, and (3) visualization. Other BIM applications, such as (1) parametricdesign, (2) generation of analysis graphs, and (3) emission estimation, have not yet beenencompassed. To address this gap, the AECO industry initially developed specific linecode programming applications [45], which were incorporated into BIM software. Theseprogramming applications generate algorithms that define different process sequences bydefining command lines of instructions [46]. However, the work interface and the highprogramming skills required by these applications are both challenging for AECO industryprofessionals [47]. To resolve these issues, BIM software development companies havegenerated VP tools.
These tools generate algorithms based on visual expressions for creating processsequence scripts [48]. Hence, these algorithms are represented as process charts rather thanthe code lines of conventional programming. The most common VP tools in the AECOproject industry are the following:
(1) Dynamo; This VP tool is associated with Autodesk Revit software and is the mostcommonly used by the AECO project industry [49]. A number of scholars haveused this VP tool; for example, Valinejadshoubi et al. [50] developed an algorithm torecord data from a set of facilities to BIM models. This platform was used to recordreal-time data of facilities of a residential building in the city of Ottawa (Canada).Santoni et al. [51] applied an algorithm that optimizes the visualization of BIM modelelements in a heritage project in the city of León (Spain).
(2) Grasshopper: This is a plug-in developed by Robert McNeel & Associates for theRhinoceros 3D modeling software [52,53]. Among the scholars that have used thisVP tool, the following can be highlighted. Abbasi et al. [54] developed a parametricsimulation platform to study the energetic performance in projects. The proposedplatform was used to measure the energy relationships in an industrial assemblyproject in Shiraz (Iran). Freitas et al. [55] proposed an algorithm for estimating solarenergy capture for photovoltaic projects in the city of Brasilia (Brazil). Massafraet al. [56] studied the behavior of wooden structures of various heritage projects inBologna (Italy) through 3D surface scanning. Then, the scanned data was connectedto BIM models using interoperable VP scripts.
(3) Python; It is a programming language developed by Van Rossum [57]. Initially, thislanguage was as open source. Then, it was integrated with the BIM environment viathe development of application programming interfaces (APIs). APIs are applicationsthat create algorithms that allow the communication of two or more software pack-ages [58]. Authors working with APIs include Kensek (2018) [59], who developeda VP educational module for BIM energy development projects. This module wasapplied in architecture courses in the city of Los Angeles (US). Martinez et al. [60]proposed an automated control algorithm to inspect modular units on industrialassembly projects. This algorithm was used in various residential projects in Canada.Andriamamonjy et al. [61] created an automated deployment of an air treatment sys-tem for construction sites using an integrated platform between building performancesimulation (BPS) and BIM models. Then, this platform was implemented in severalfacilities’ management projects in Belgium.

Appl. Sci. 2021, 11, 8343 3 of 24
All VP tools are composed of the following elements [58]: (1) Input; initial informationrequired by the VP algorithms to develop the information flows. (2) Nodes; these elementsare operators that generate the algorithm’s information flows by subjecting the input datato specific functions. (3) Output; Final information delivered by the nodes during theexecution of the algorithm. (4) Connectors; these digital lines join the different nodes togenerate the algorithms.
Figure 1 presents the basic structure of the VP nodes of the state-of-the-art toolsreviewed in this paper. Figure 1a presents an algorithm developed using the Dynamotool. This algorithm represents a simple mathematical multiplication operation [62]. Inthis case, the inputs representing the numerical factors required to execute this operationare associated with this type of element, the nodes are the multiplication operation ofthe present example, and the output corresponds with the results of the mathematicaloperation. Figure 1b presents a script made using Grasshopper tool. This visual scriptdescribes the generation of parametric vector planes within a spatial interface [63]. Inthis case, the input corresponds with the range of values that each axis can adopt tobuild the plane of the vector, the nodes define the construction of a vector plane as thecentral operation of the algorithm, and the outputs provide the coordinates and specificvariables of the parametric plane. Finally, Figure 1c presents a VP algorithm developedusing the Python tool. This application shows how to record the time [64]. The input data isrepresented by a stopwatch that records the real time at each instant, the nodes correspondwith functions that the algorithm requires to extract and separately represent the differentmeasurements of the chronometer (hour, minute, second), and the outputs are a list of thedifferent variables extracted by the nodes to be associated with other elements of the BIMmodel. In each of these figures, the inputs are represented in red, the nodes in blue, andthe outputs in green.
The work of Korus et al. [65] was selected as a motivating case to illustrate themethodology and benefits of applying VP algorithms. The aim of this study was toimprove the conventional process of designing arch bridges. This process is based on aniterative optimization combining structural and geometrical design, which has a largecomponent of manual labor. To link the BIM model with the structural model (FiniteElement Method, FEM) of the bridge, a VP algorithm was created in Dynamo. To illustratethe flow of information followed by this study, a fragment of the developed algorithmis presented in Figure 2. This figure is divided into the following elements: (1) Inputs;These elements represent the information required to generate parameterized structuralbars, such as geometric vectors defining the longitudinal geometry of each structuralmember, structural properties (area and moments of inertia), and physical properties(Young’s module, Poisson ratio, and the specific weight of the steel bars). (2) Nodes; Theseelements connect the information extracted from the input and process it to optimize thecross- section and geometry of the bridge elements. This optimization is carried out by aniterative process that analyses the geometrical response of the structure for a set of givenloading cases. (3) Outputs; These elements include the results of the optimization process(geometry and cross-section of the bridge elements) in the BIM model.

Appl. Sci. 2021, 11, 8343 4 of 24
Appl. Sci. 2021, 11, x FOR PEER REVIEW 3 of 25
input data to specific functions. (3) Output; Final information delivered by the nodes dur-ing the execution of the algorithm. (4) Connectors; these digital lines join the different nodes to generate the algorithms.
Figure 1 presents the basic structure of the VP nodes of the state-of-the-art tools re-viewed in this paper. Figure 1a presents an algorithm developed using the Dynamo tool. This algorithm represents a simple mathematical multiplication operation [62]. In this case, the inputs representing the numerical factors required to execute this operation are associated with this type of element, the nodes are the multiplication operation of the pre-sent example, and the output corresponds with the results of the mathematical operation. Figure 1b presents a script made using Grasshopper tool. This visual script describes the generation of parametric vector planes within a spatial interface [63]. In this case, the input corresponds with the range of values that each axis can adopt to build the plane of the vector, the nodes define the construction of a vector plane as the central operation of the algorithm, and the outputs provide the coordinates and specific variables of the paramet-ric plane. Finally, Figure 1c presents a VP algorithm developed using the Python tool. This application shows how to record the time [64]. The input data is represented by a stop-watch that records the real time at each instant, the nodes correspond with functions that the algorithm requires to extract and separately represent the different measurements of the chronometer (hour, minute, second), and the outputs are a list of the different varia-bles extracted by the nodes to be associated with other elements of the BIM model. In each of these figures, the inputs are represented in red, the nodes in blue, and the outputs in green.
Appl. Sci. 2021, 11, x FOR PEER REVIEW 4 of 25
Figure 1. Basic structure of VP scripts. (a) VP script of the Dynamo tool, (b) VP algorithm of the Grasshopper tool, and (c) VP script of the Python language tool.
The work of Korus et al. [65] was selected as a motivating case to illustrate the meth-odology and benefits of applying VP algorithms. The aim of this study was to improve the conventional process of designing arch bridges. This process is based on an iterative optimization combining structural and geometrical design, which has a large component of manual labor. To link the BIM model with the structural model (Finite Element Method, FEM) of the bridge, a VP algorithm was created in Dynamo. To illustrate the flow of in-formation followed by this study, a fragment of the developed algorithm is presented in Figure 2. This figure is divided into the following elements: (1) Inputs; These elements represent the information required to generate parameterized structural bars, such as ge-ometric vectors defining the longitudinal geometry of each structural member, structural properties (area and moments of inertia), and physical properties (Young’s module, Pois-son ratio, and the specific weight of the steel bars). (2) Nodes; These elements connect the information extracted from the input and process it to optimize the cross- section and ge-ometry of the bridge elements. This optimization is carried out by an iterative process that analyses the geometrical response of the structure for a set of given loading cases. (3) Out-puts; These elements include the results of the optimization process (geometry and cross-section of the bridge elements) in the BIM model.
Figure 1. Basic structure of VP scripts. (a) VP script of the Dynamo tool, (b) VP algorithm of theGrasshopper tool, and (c) VP script of the Python language tool.

Appl. Sci. 2021, 11, 8343 5 of 24Appl. Sci. 2021, 11, x FOR PEER REVIEW 5 of 25
Figure 2. Fragment of the VP algorithm developed by Korus et al. [65].
The application of this VP algorithm was validated based on the S3 high-speed road project located in the central-western region of Poland.
The VP algorithms are executed automatically due to the direct communication be-tween their nodes [66]. This automation has created essential advantages in the digitali-zation of AECO projects through BIM methodology because different BIM software can communicate through these VP algorithms. In the literature, the following benefits of VP algorithms can be highlighted:
(1) Friendly interface [66]; This technological tool offers an interactive interface for AECO professionals without advanced knowledge in programming. This advantage has been studied by Saito et al. [67], who compared both visual and line-of-text (conventional) programming languages for beginning students. The methodology proposed in this study used programming operations in video games of basic mathematical operations and logic processes to study students’ responses. This study showed that VP offered a more intui-tive interface for beginning students due to the positive impact that visual schemas had on programming learning.
(2) Reducing modeling time [68]; VP tools can create parametric figures through dif-ferent scripts to associate model design information with automatic geometry generation processes, thus reducing modeling time. This benefit was illustrated by Kensek [69], who studied the interoperability of BIM model information flows in solar façade projects by comparing the following two methodologies: (1) Using VP algorithms; These scripts were used as a bridge to allow the transfer of information between BIM and energy models, which were developed independently. (2) Using Industry Foundation Class (IFC) files; These data packages are the most popular interoperability format in the BIM environ-ment. These files were used to update both BIM and energy models through IFC native files. Both methodologies were applied in building projects in California (US), showing that visual algorithms were more efficient in transferring information between BIM and energetic models.
(3) Automation of repetitive processes [70]; Such as naming project drawings with a specific nomenclature. This advantage was illustrated by Nezalmaldin [71], who studied
Figure 2. Fragment of the VP algorithm developed by Korus et al. [65].
The application of this VP algorithm was validated based on the S3 high-speed roadproject located in the central-western region of Poland.
The VP algorithms are executed automatically due to the direct communication be-tween their nodes [66]. This automation has created essential advantages in the digital-ization of AECO projects through BIM methodology because different BIM software cancommunicate through these VP algorithms. In the literature, the following benefits of VPalgorithms can be highlighted:
(1) Friendly interface [66]; This technological tool offers an interactive interface for AECOprofessionals without advanced knowledge in programming. This advantage has beenstudied by Saito et al. [67], who compared both visual and line-of-text (conventional)programming languages for beginning students. The methodology proposed in thisstudy used programming operations in video games of basic mathematical operationsand logic processes to study students’ responses. This study showed that VP offered amore intuitive interface for beginning students due to the positive impact that visualschemas had on programming learning.
(2) Reducing modeling time [68]; VP tools can create parametric figures through differentscripts to associate model design information with automatic geometry generationprocesses, thus reducing modeling time. This benefit was illustrated by Kensek [69],who studied the interoperability of BIM model information flows in solar façadeprojects by comparing the following two methodologies: (1) Using VP algorithms;These scripts were used as a bridge to allow the transfer of information betweenBIM and energy models, which were developed independently. (2) Using IndustryFoundation Class (IFC) files; These data packages are the most popular interoperabil-ity format in the BIM environment. These files were used to update both BIM andenergy models through IFC native files. Both methodologies were applied in buildingprojects in California (US), showing that visual algorithms were more efficient intransferring information between BIM and energetic models.
(3) Automation of repetitive processes [70]; Such as naming project drawings with aspecific nomenclature. This advantage was illustrated by Nezalmaldin [71], who

Appl. Sci. 2021, 11, 8343 6 of 24
studied the automation provided by the VP algorithms of the Dynamo tool in theconversion of CAD drawings to BIM models. For this purpose, he compared hisresults with those of the conventional CAD-BIM manual conversion methodology.This benefit was validated using different buildings in the city of Stockholm (Sweden).
(4) Providing connectivity with non-BIM software [72]; VP tools provide a bridge be-tween a variety of software types (such as Microsoft Excel and Access) and BIMmodels. This advantage is illustrated in Boeykens et al. [73], who evaluated theinteroperability between CAD and BIM models in architectural projects. In this study,a Python algorithm was developed to connect the information of the BIM model withExcel spreadsheets, extracting the information of urban surfaces and spaces. Thisevaluation was applied to a digital reconstruction project of a synagogue in the city ofVienna (Austria).
The advantages of the VP tools in the automation of the AECO industry may beimplemented in various project types due to the versatility of their applications. However,reality indicates that the AECO industry has favored using these tools in architectureprojects rather than infrastructure projects [73]. This is due to the following reasons:(1) Lack of standardization [74]; Infrastructure projects have unique typologies that aredifficult to model with parametric design. (2) Complexity of projects [75]; The life cycle ofthese projects requires information models with a high degree of technical data. Therefore,the interoperability of these projects is challenging. (3) Delayed BIM implementation [76];The BIM methodology has focused on the architecture sector because most countries havefocused their implementation plans on this type of project.
The visual algorithms developed by the main VP tools in the literature are interpreta-tive, because each function within the script is associated with a visual object. Therefore,the execution of the algorithm requires the recognition of the visual object associated withthe script and the execution of the algorithm process sequence. This operational dualityincreases the computational time with respect to traditional non-VP codes. Due to thislimitation, it is more challenging for these tools to execute the reading of visual objectsand the processes in parallel. Another common limitation of the VP algorithms relates totheir slower interoperability with the web operators due to the preference of Web develop-ers to work with traditional coding. Connecting VP scripts with Web operators requiresdisassembling the visual algorithm into different lines of text. This characteristic reducesits practicability. At present, it remains a challenge to develop Web design tools that canefficiently connect with VP algorithms.
In summary, two gaps were detected. Firstly, the automation of infrastructure projectsthrough VP algorithms is not as frequent as in building projects. Secondly, the relationshipbetween VP tools and infrastructure projects has not been reviewed in the literature. Tofill these gaps, the aims of this study were to undertake a literature review of the use ofVP algorithms in infrastructure projects to show the trending research, encourage scholarsand engineers to use these tools, and present new potential applications for VP tools ininfrastructure projects. Therefore, the scientific contribution of this work is to present thestate of the art of the current applications of VP tools in infrastructure projects, in additionto its future research trends.
The aim of this paper is to present the first literature review of the use of VP tools ininfrastructure projects to show the trending research and motivate the use of new potentialapplications. The applied search methodology consists of a series of filters associated withspecific keywords. Each filter allows the analysis of different scenarios, both the study ofthe state-of-the-art applications and the trends.
This paper is organized as follows: Section 2 describes the literature search method-ology applied in this study. Section 3 presents the results and analysis of the literatureresearch. Finally, this bibliographic review’s conclusions are presented in Section 4, togetherwith a description of the future research trends identified.

Appl. Sci. 2021, 11, 8343 7 of 24
2. Materials and Methods
In this section, the methodology, keywords, and filters that were applied in thebibliographic review are presented. This study used the system presented by Navarroet al. [77], who applied this search methodology in the review of the state-of-the-artdecision-making techniques in sustainable bridge design, and which has been appliedextensively since then [78–80]. This review system was selected due to its organizedmanner of searching the literature. Figure 3 presents the flowchart that describes theliterature search methodology. This figure is divided into the following three search filters:(1) Keywords—defines the words that describe the methods, techniques, tools, and projecttypes necessary to establish the review scope. (2) Category—the disciplines or specificareas of knowledge in which the search is defined; for instance, architecture, engineering,and construction. (3) Language of the papers.
Appl. Sci. 2021, 11, x FOR PEER REVIEW 7 of 25
2. Materials and Methods In this section, the methodology, keywords, and filters that were applied in the bib-
liographic review are presented. This study used the system presented by Navarro et al. [77], who applied this search methodology in the review of the state-of-the-art decision-making techniques in sustainable bridge design, and which has been applied extensively since then [78–80]. This review system was selected due to its organized manner of search-ing the literature. Figure 3 presents the flowchart that describes the literature search meth-odology. This figure is divided into the following three search filters: (1) Keywords—de-fines the words that describe the methods, techniques, tools, and project types necessary to establish the review scope. (2) Category—the disciplines or specific areas of knowledge in which the search is defined; for instance, architecture, engineering, and construction. (3) Language of the papers.
Figure 3. Flowchart of the literature review methodology presented by Navarro et al. [77].
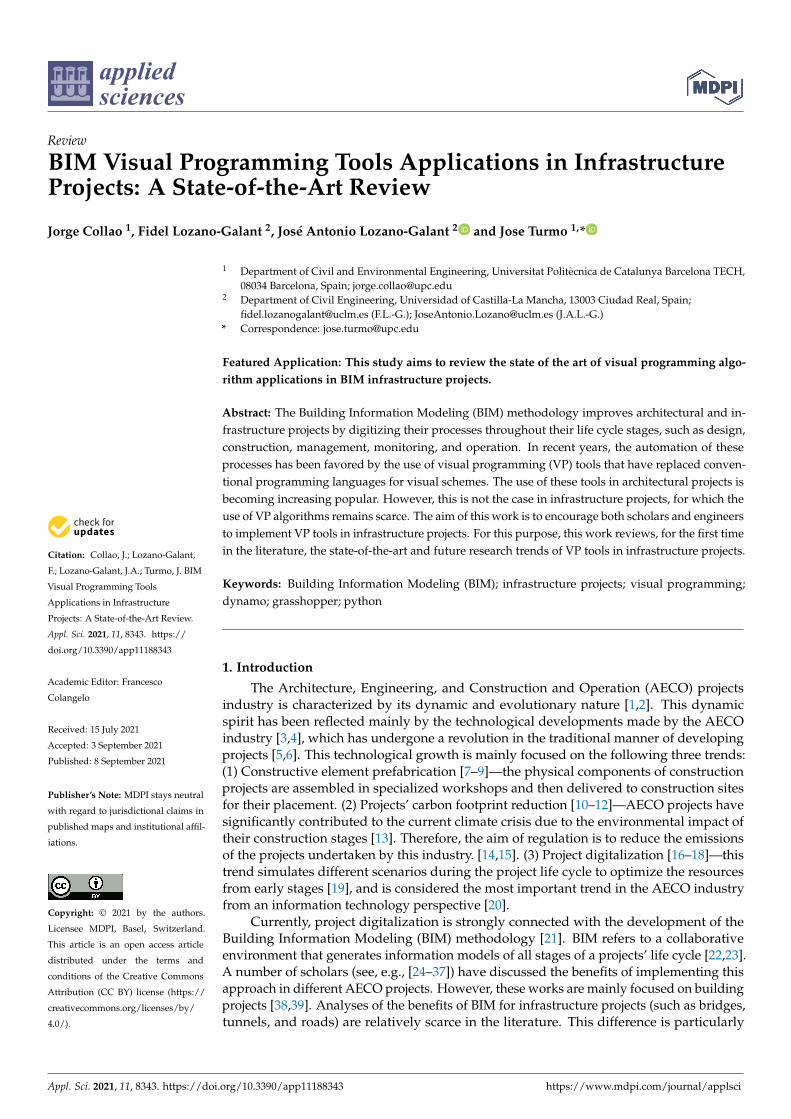
This bibliographic search considered the following databases: (1) Web of science [81], to search academic papers, and (2) Derwent Innovations Index [82], to review patents. Table 1 represents the keywords, filters, and other conditions that were used to generate this review. The figure is divided into three rectangles. Each rectangle represents each filter of Figure 2. The bibliographic search filters were: (1) Keywords—this filter was the most extensive in terms of content. Therefore, the keywords were classified into the fol-lowing groups: (1.1) Project type; bridges(s), roads(s), highways(s), tunnels(s), architec-tural project(s) and infrastructure(s). (1.2) BIM concepts; BIM, building information mod-eling (US), building information modelling (UK), building information model(s), bridge information modeling, and tunnel information modeling (1.3) VP tools; VP, Dynamo, Grasshopper, and Python. Boolean generators of the OR type connected the words of each group. In contrast, Boolean generators of the AND type connected each filter group. (2) Category—the disciplines selected for this review were engineering, instrumentation, computer science, construction building technology, transportation, and automation con-trol systems. (3) Language—this review only considered works in English.
Figure 3. Flowchart of the literature review methodology presented by Navarro et al. [77].
This bibliographic search considered the following databases: (1) Web of science [81],to search academic papers, and (2) Derwent Innovations Index [82], to review patents.Table 1 represents the keywords, filters, and other conditions that were used to generatethis review. The figure is divided into three rectangles. Each rectangle represents eachfilter of Figure 2. The bibliographic search filters were: (1) Keywords—this filter wasthe most extensive in terms of content. Therefore, the keywords were classified intothe following groups: (1.1) Project type; bridges(s), roads(s), highways(s), tunnels(s),architectural project(s) and infrastructure(s). (1.2) BIM concepts; BIM, building informationmodeling (US), building information modelling (UK), building information model(s),bridge information modeling, and tunnel information modeling (1.3) VP tools; VP, Dynamo,Grasshopper, and Python. Boolean generators of the OR type connected the words of eachgroup. In contrast, Boolean generators of the AND type connected each filter group.(2) Category—the disciplines selected for this review were engineering, instrumentation,computer science, construction building technology, transportation, and automation controlsystems. (3) Language—this review only considered works in English.
Appl. Sci. 2021, 11, 8343 8 of 24
Table 1. Keywords and filters considered in this bibliographic review.
First Filter Second Filter Third Filter
1.1 Project type 1.2 BIM Concepts 1.3 VP tools 2. Category 3. Language
Bridge(s) BIM VP Engineering
Only works inEnglish
Road(s) Building information modeling Dynamo Instrumentation
Highway(s) Building information modelling Grasshopper Computer science
Tunnel(s) Building information model(s) Python Construction building technology
Architecture Bridge information modeling Transportation
Architectural Bridge information model(s) Automation Control
Infrastructure(s) Tunnel information modeling
Building(s) Tunnel information model(s)
Road information modeling
Road information model(s)
In the next section, the results of the bibliographic search of Table 1 are presentedand analyzed. The analysis included both a bibliographic review analysis and a topicbreakdown of the found studies.
3. Results and Discussion
This section presents the results of the literature review methodology in Section 2.Section 3.1 presents a general quantitative analysis of the results. Section 3.2 presentsan analysis that mainly considers the topics studied and the VP tools used by the re-viewed studies.
3.1. General Results Analysis
This section presents and analyzes the following scenarios: (1) general search results,(2) results by document type, (3) contributions’ geographical distribution, and (4) institutiontypes that supported the reviewed publications.
In general terms, this bibliographic review found a total of 153 studies. Of these,127 studies were associated with architecture and buildings projects (83%) and 26 withinfrastructure projects (17%). Both types of projects presented their first contributionin 2014.
Figure 4 presents the temporal distribution of the studies reviewed in the followingscenarios: (1) Figure 4a represents the papers’ distribution between architecture projects(red bars) and infrastructure (green bars) projects. (2) Figure 4b shows the distributionbetween the number of studies that applied VP tools in BIM infrastructure projects (greenbars) and those that applied BIM in infrastructure projects without VP tools (red bars).IN addition, this figure incorporates a column called the percentage ratio that indicatesthe relationship between the number of papers of infrastructure projects and architecturalprojects. The X and Y axes of the figures represent the number of papers and the year,respectively. (3) Figure 4c presents the distribution of publications found for each keywordin Table 1.
Figure 4a shows that from 2014 to 2018, the number of papers that applied VP tools inarchitecture and buildings projects was higher than that in infrastructure projects. However,this trend was considerably reduced in 2019 and reversed in 2020. This change indicatesthat the interest in the research of VP tool applications in civil engineering projects isgrowing. Therefore, these applications offer an essential research focus for the future.

Appl. Sci. 2021, 11, 8343 9 of 24Appl. Sci. 2021, 11, x FOR PEER REVIEW 9 of 25
0
50
100
150
200
250
300
350
400
450
Before2014
2014 2015 2016 2017 2018 2019 2020
With VP tools [papers] 0 1 0 0 1 2 8 14NO VP tools [papers] 0 68 89 134 201 283 370 394Percentage ratio [%] 0 0.01% 0% 0% 0.00% 0.01% 0.02% 0.04%
Num
ber o
f Pub
licat
ions
Year
NO VP tools [papers] With VP tools [papers]
(a)
010203040506070
Before2014
2014 2015 2016 2017 2018 2019 2020
Infrastruture projects[publications] 0 1 0 0 1 2 8 14
Architecture and buildingsprojects [publications] 0 5 6 7 9 21 32 47
Num
ber o
f Pub
licat
ions
Year
Infrastruture projects [publications]
(b)
Figure 4. Cont.

Appl. Sci. 2021, 11, 8343 10 of 24Appl. Sci. 2021, 11, x FOR PEER REVIEW 10 of 25
Figure 4. Comparative scenarios of the reviewed publications. (a) Comparison between the groups of papers associated with architecture and infrastructure projects, (b) comparison between papers’ groups of the VP applications and No VP applications in infrastructure projects, and (c) distribution of publications found by associated keywords.
Figure 4a shows that from 2014 to 2018, the number of papers that applied VP tools in architecture and buildings projects was higher than that in infrastructure projects. However, this trend was considerably reduced in 2019 and reversed in 2020. This change indicates that the interest in the research of VP tool applications in civil engineering pro-jects is growing. Therefore, these applications offer an essential research focus for the fu-ture.
The data in Figure 4b show that the interest in applying BIM methodology in infra-structure projects is growing. This trend is consistent, as indicated by the literature review studies of BIM applications for civil engineering projects [83–89]. In addition, this growth is also observed in Figure 4a. However, during the 2018–2020 period, the growth rate of VP tool applications in infrastructure was higher than that presented in Figure 4b, which only registers a growth peak of 3.55% in 2020; that is, although the research interest in these tools has steadied concerning architecture projects, these applications still have a reduced presence in the field of BIM infrastructure projects. This is explained because the main BIM applications in the civil engineering sector are already standardized by default in the leading BIM software [90,91]. Therefore, they do not require automation by VP
(c)
Figure 4. Comparative scenarios of the reviewed publications. (a) Comparison between the groups of papers associatedwith architecture and infrastructure projects, (b) comparison between papers’ groups of the VP applications and No VPapplications in infrastructure projects, and (c) distribution of publications found by associated keywords.
The data in Figure 4b show that the interest in applying BIM methodology in infras-tructure projects is growing. This trend is consistent, as indicated by the literature reviewstudies of BIM applications for civil engineering projects [83–89]. In addition, this growthis also observed in Figure 4a. However, during the 2018–2020 period, the growth rate ofVP tool applications in infrastructure was higher than that presented in Figure 4b, whichonly registers a growth peak of 3.55% in 2020; that is, although the research interest inthese tools has steadied concerning architecture projects, these applications still have areduced presence in the field of BIM infrastructure projects. This is explained because themain BIM applications in the civil engineering sector are already standardized by defaultin the leading BIM software [90,91]. Therefore, they do not require automation by VP tools.However, overcoming these limitations has been the main reason for the growing interestin the application of VP tools in civil engineering projects.
Figure 4c shows that the keywords of buildings, building information modeling/models,VP, and Dynamo are associated with most of the keywords in Table 1. These words also

Appl. Sci. 2021, 11, 8343 11 of 24
show that the specific research towards the development or study of algorithms of VP inBIM projects is growing, as presented in Figure 4.
Table 2 presents the classifications by the document type of the infrastructure projectsreviewed in this study. These types are patents, papers, reviews, and conferences. The tablecolumns are document type, the number of papers by document type, and the percentagevalues for each document type relative to the total number of reviewed papers.
Table 2. Distribution of reviewed articles by document type.
Document Type Number of Works Percentage [%]
Patent 13 50.00%Paper 9 34.61%Meeting 3 11.54%Review 1 3.85%Total works 26
Table 2 shows that 50% of the reviewed works are patents. These are focused onprotecting the property of created algorithms. Some examples of these patents are: (1) Shiet al. [92], who developed an integrated platform in Dynamo that parameterizes geometriesof roads and bridges. The invention was focused on the design, quantification, andcontrol of public projects. (2) Wu et al. [93], who generated a Dynamo algorithm to createparametric models for tunnels. This invention integrated data from specialized geologicalsoftware into BIM models. (3) Ma et al. [94,95], who developed a parametric model inDynamo to generate beams for bridges. This platform integrated the topographic data,design processes, and assembly of construction elements. Academic papers contributed33.33% of the reviewed contributions. Among these studies are: (1) O’Shea et al. [96],who developed a sensor integration method using VP scripts to assess existing projects’structural health. This platform was implemented in road infrastructure projects in the cityof Dublin (Ireland). (2) Biancardo et al. [97], who created a parametric model to generatethe roadway of highway projects. Then, they evaluated its interoperability with Civil3Dand Rhinoceros software to study the loss of information. The platform was used in aroad project in Italy, evaluating different design alternatives. (3) Khan et al. [98], whoevaluated the safety conditions in excavation works using an automated environment ofVP algorithms. The platform was used in an example project of Autodesk Revit software.In the case of meetings, the following studies are highlighted: (1) Qin et al. [99], whointegrated a network of sensors to inspect bridges using algorithms created in Python.This network allowed the interoperability of databases to be cleaned based on sensors.(2) Karóczkai (2018) [100], who developed parametric models in Grasshopper for BIMmodels from ArchiCad software. (3) Briscoe et al. [101], who studied the applications ofparametric models in Dynamo to manage green habitats. This study applied VP toolsto study BIM infrastructure projects’ sustainability. However, it was undertaken using anon-energy approach. The study developed by Haubler et al. [102] is of particular interestbecause it is the only review study found in the search. Therefore, it is the only effort toreview the applications of VP tools in infrastructure projects. This study reviewed the VPchecking tool applications in railway design projects in Germany.
Table 3 presents the distribution by geographic region of the principal authors’ works.This table includes the following columns: countries, the number of publications percountry, and the percentage that each country contributed to this bibliographic review.Countries that each contributed only one study to this review are grouped in a cell called“Other countries”. These countries are Germany, Hungary, Ireland, Italy, Poland, Slove-nia, South Korea, Taiwan, and Turkey. As a visual complement, Figure 5 represents thegeographical distribution map of the publications.

Appl. Sci. 2021, 11, 8343 12 of 24
Table 3. Geographical distribution of reviewed publications—Web of Science database [81].
Country Number of Publications Percentage (%)
China 13 50.00%United States 3 11.54%England 2 7.69%Other countries 8 30.77%
Appl. Sci. 2021, 11, x FOR PEER REVIEW 12 of 25
Slovenia, South Korea, Taiwan, and Turkey. As a visual complement, Figure 5 represents the geographical distribution map of the publications.
Table 3. Geographical distribution of reviewed publications—Web of Science database [81].
Country Number of Publications Percentage (%) China 13 50.00% United States 3 11.54% England 2 7.69% Other countries 8 30.77%
Figure 5. Geographical distribution map of publications.
Table 3 shows China is the country making the greatest contribution to the revised publications (50%) and has generated all the reviewed patents. This is explained as fol-lows: (1) BIM implementation [103]—Civil engineering projects are priority development objectives in the national BIM implementation plan. (2) Investment in infrastructure de-velopment [104]—The high economic growth that the country has experienced in the past 15 years is due in part to the high investment in the development of infrastructure. This investment has enormously strengthened the AECO industry and the technological de-velopment of the BIM environment. The cases of the United States and England, which represent 17.24% of the publications reviewed, show a decisive difference with China. The lower presence of these English-speaking countries in this bibliographic review can be explained as follows. The United States’ case is explained mainly by the following two reasons: (1) Absence of a federal BIM implementation law [105]; Which reduces the devel-opment of a VP tool standard for the infrastructure sector. (2) The private sector has fo-cused its BIM implementation on building projects [106]; This reason also explains the case of England, which has not been able to achieve its BIM implementation plan’s objec-tives [107].
The category of other countries in Table 3 presents the following results: (1) Conti-nental Europe: seven countries developed studies (Germany, Hungary, Ireland, Italy, Po-land, Slovenia, and Turkey). Therefore, this group of countries contributed 24.14% of the reviewed publications, and is the geographic region with the second-highest number of reviewed publications. (2) South Korea: This country contributed one study to the review.
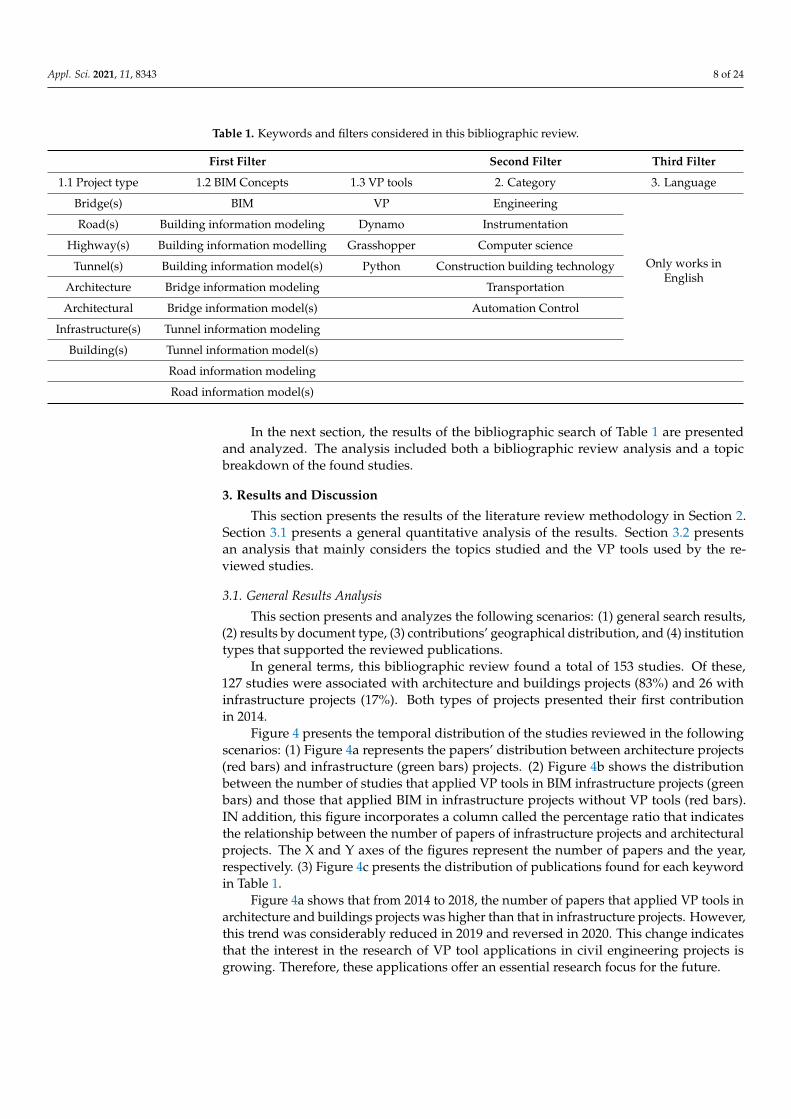
Table 4 presents the institutions that supported the reviewed publications. This table includes institution type (higher education institutions, public entities, or companies), in-stitution name, and associated country.
Figure 5. Geographical distribution map of publications.
Table 3 shows China is the country making the greatest contribution to the revisedpublications (50%) and has generated all the reviewed patents. This is explained as fol-lows: (1) BIM implementation [103]—Civil engineering projects are priority developmentobjectives in the national BIM implementation plan. (2) Investment in infrastructure de-velopment [104]—The high economic growth that the country has experienced in thepast 15 years is due in part to the high investment in the development of infrastructure.This investment has enormously strengthened the AECO industry and the technologicaldevelopment of the BIM environment. The cases of the United States and England, whichrepresent 17.24% of the publications reviewed, show a decisive difference with China.The lower presence of these English-speaking countries in this bibliographic review canbe explained as follows. The United States’ case is explained mainly by the followingtwo reasons: (1) Absence of a federal BIM implementation law [105]; Which reduces thedevelopment of a VP tool standard for the infrastructure sector. (2) The private sectorhas focused its BIM implementation on building projects [106]; This reason also explainsthe case of England, which has not been able to achieve its BIM implementation plan’sobjectives [107].
The category of other countries in Table 3 presents the following results: (1) Con-tinental Europe: seven countries developed studies (Germany, Hungary, Ireland, Italy,Poland, Slovenia, and Turkey). Therefore, this group of countries contributed 24.14% of thereviewed publications, and is the geographic region with the second-highest number ofreviewed publications. (2) South Korea: This country contributed one study to the review.
Table 4 presents the institutions that supported the reviewed publications. This tableincludes institution type (higher education institutions, public entities, or companies),institution name, and associated country.
Appl. Sci. 2021, 11, 8343 13 of 24
Table 4. Classification of reviewed publications according to associated supporting institution.
Institution Type Institution Name Country Reference
Higher educationinstitutions
Technical University of Munich Germany [102]
Mardin Article University Turkey [108]
University College Cork Ireland [96]
University of Naples Federico II Federico Italy [97]
University of Portsmouth England [109]
Chung Ang University South Korea [98]
University of Texas Austin United States [101]
Hohai University China [110]
Southeast University China [111]
Tongji University China [99]
Beijing University of Civil Engineering & Architecture China [112]
Fuzhou University China [113]
Changzhou Planning and Design Institute China [114]
Zhejiang University China [115]
Public entitiesHenan provincial communications planning China [93]
Beijing municipal road and bridge-building China [116]
Companies
Shangai baoye group corporation Ltd. China [117]
Kumming atide software Ltd. China [118]
China communications Shangai sanhang TE China [119]
Shanghai pudong road and bridge bituminous Ltd. China [92]
SGIDI engineering consulting group Ltd. China [120]
Sichuan wenchuan maerkang highway LLC China
[121]Chengdu engineering management Ltd. China
Sichuan gaolu construction consulting Ltd. China
Sinohydro Bureau 11 Zhenzhou Ltd. China [122]
CCCC first highway engineering Ltd. China [94]
China railway engineering group 4 Ltd. China[123]
China tiesiju civil engineering group 5 Ltd. China
Graphisoft SE Hungary [100]
Sambo Engineering Ltd. South Korea [124]
The data in Table 4 show that the contributions made by institution type of thereviewed publications are higher education institutions with 48.28% (14 publications),public entities with 6.89% (2 papers), and companies 44.83% (13 publications). Theseresults show the academic–public sector has led the research effort of VP tool applications ininfrastructure projects (55.17%). This difference between public–private agents is explainedbecause both academia (mainly) and governments have led the BIM implementation in theirAECO industries [125]. However, when the higher education institutions and companies’contribution percentages are compared, it is possible to observe a slight difference. Inaddition, 87% of the reviewed patents (13 works) have been registered by companies. Thisindicates that the private sector is considering the benefits of the infrastructure projects’automation through VP tools. This trend is essential to increase the VP tool applicationsbecause the presence of the private sector is most significant within the AECO projectindustry [126].

Appl. Sci. 2021, 11, 8343 14 of 24
Table 4 indicates that no specific institutions lead the VP tool research in infrastructurebecause the institutions have each contributed one study. This decentralized distributionof the research is due to the fact that VP algorithms are focused on the projects’ specificneeds [127] and not on the application of VP tools throughout the life cycle of infrastruc-ture projects.
Table 4 also shows that China has developed 50% of the academic sector publications,100% of the public sector publications, and 85.71% of the reviewed patents. By comparison,Europe, the US, and Asia (not China) have contributed 50% of the academic studies. Thisreflects the fact that China is firmly leading the transition in VP applications’ research effortbetween academia and the private sector. Therefore, in the future, it is expected that thiscountry will continue to lead these VP applications.
3.2. Analysis of Results by Topic of the Papers
This section presents and analyzes the results of this bibliographic review considering:(1) type of VP tool used, (2) type of infrastructure project, and (3) life cycle stage ofthe projects. Figures in this section represent the temporal distribution of the reviewedcontributions. The X and Y axes of these figures represent the number of works and theyear, respectively. The percentages presented in the analysis of the figures relate to thenumber of reviewed papers.
Figure 6 presents the distribution of the reviewed papers considering the VP toolsand BIM software used by these studies. These figure groups the reviewed publications asfollows: (1) Publications that used Autodesk Revit-Dynamo software (red bars). (2) Studiesthat applied Rhinoceros-Grasshopper software (blue bars). (3) Works that used the API-Python platform (green bars).
Appl. Sci. 2021, 11, x FOR PEER REVIEW 14 of 25
jects’ automation through VP tools. This trend is essential to increase the VP tool applica-tions because the presence of the private sector is most significant within the AECO pro-ject industry [126].
Table 4 indicates that no specific institutions lead the VP tool research in infrastruc-ture because the institutions have each contributed one study. This decentralized distri-bution of the research is due to the fact that VP algorithms are focused on the projects’ specific needs [127] and not on the application of VP tools throughout the life cycle of infrastructure projects.
Table 4 also shows that China has developed 50% of the academic sector publications, 100% of the public sector publications, and 85.71% of the reviewed patents. By compari-son, Europe, the US, and Asia (not China) have contributed 50% of the academic studies. This reflects the fact that China is firmly leading the transition in VP applications’ research effort between academia and the private sector. Therefore, in the future, it is expected that this country will continue to lead these VP applications.
3.2. Analysis of Results by Topic of the Papers This section presents and analyzes the results of this bibliographic review consider-
ing: (1) type of VP tool used, (2) type of infrastructure project, and (3) life cycle stage of the projects. Figures in this section represent the temporal distribution of the reviewed contributions. The X and Y axes of these figures represent the number of works and the year, respectively. The percentages presented in the analysis of the figures relate to the number of reviewed papers.
Figure 6 presents the distribution of the reviewed papers considering the VP tools and BIM software used by these studies. These figure groups the reviewed publications as follows: (1) Publications that used Autodesk Revit-Dynamo software (red bars). (2) Studies that applied Rhinoceros-Grasshopper software (blue bars). (3) Works that used the API-Python platform (green bars).
Figure 6. Distribution by type of VP tool and BIM software used in the reviewed works.
0
2
4
6
8
10
12
14
16
Before2014
2014 2015 2016 2017 2018 2019 2020
Python - API [papers] 0 0 0 0 0 0 1 1Grasshopper - Rhinoceros3d [papers] 0 0 0 0 0 1 0 2Dynamo - Revit [papers] 0 1 0 0 1 1 7 11
Num
ber o
f Pub
licat
ions
Year
Dynamo - Revit [papers] Grasshopper - Rhinoceros3d [papers] Python - API [papers]
Figure 6. Distribution by type of VP tool and BIM software used in the reviewed works.
The data in Figure 6 show that the contributions of the VP tools to this review are:(1) Dynamo, 21 works (80.77%); (2) Grasshopper, 3 publications (11.54%); and Pythonwith 1 study (7.69%). These statistics indicate that the Dynamo tool was the most usedby the reviewed publications. Another trend associated with this VP tool is that theannual production in 2018 and 2019 was 2.33- and 3.67-fold more than the total numberof works associated with this tool in the 2014–2018 period (three papers). Therefore,an increase in these annual production rates is expected in the future. However, thepublications associated with Dynamo indicate that the BIM models used Autodesk Revit

Appl. Sci. 2021, 11, 8343 15 of 24
as host software, which is not focused on civil engineering projects. This suggests thatthe interoperability among VP tools has undergone less development compared with thatpresented by BIM software such as AllPlan Bridge, Autodesk Infraworks, Tekla structures,and Bentley Systems. Further research into this gap would improve the decentralization ofthe VP tool market for civil engineering by increasing technology transfer among VP tooldevelopment companies.
Figure 7 presents the distribution of the reviewed publications by type of infrastructureproject. This figure classifies the publications into the following categories: (1) bridges(red bars), (2) tunnels (blue bars), (3) roads (green bars), and (4) other infrastructure(yellow bars). This last project category groups those studies that only contribute withpublications that are not part of the leading groups of infrastructure reviewed (bridges,tunnels, and roads).
Appl. Sci. 2021, 11, x FOR PEER REVIEW 15 of 25
The data in Figure 6 show that the contributions of the VP tools to this review are: (1) Dynamo, 21 works (80.77%); (2) Grasshopper, 3 publications (11.54%); and Python with 1 study (7.69%). These statistics indicate that the Dynamo tool was the most used by the reviewed publications. Another trend associated with this VP tool is that the annual pro-duction in 2018 and 2019 was 2.33- and 3.67-fold more than the total number of works associated with this tool in the 2014–2018 period (three papers). Therefore, an increase in these annual production rates is expected in the future. However, the publications associ-ated with Dynamo indicate that the BIM models used Autodesk Revit as host software, which is not focused on civil engineering projects. This suggests that the interoperability among VP tools has undergone less development compared with that presented by BIM software such as AllPlan Bridge, Autodesk Infraworks, Tekla structures, and Bentley Sys-tems. Further research into this gap would improve the decentralization of the VP tool market for civil engineering by increasing technology transfer among VP tool develop-ment companies.
Figure 7 presents the distribution of the reviewed publications by type of infrastruc-ture project. This figure classifies the publications into the following categories: (1) bridges (red bars), (2) tunnels (blue bars), (3) roads (green bars), and (4) other infrastructure (yel-low bars). This last project category groups those studies that only contribute with publi-cations that are not part of the leading groups of infrastructure reviewed (bridges, tunnels, and roads).
Figure 7. Distribution of publications reviewed by type of infrastructure project.
The data in Figure 7 show the following statistics by infrastructure category: (1) Bridges; the leading discipline with nine publications (34.62%). These statistics may be explained because bridges are infrastructure with elements of very complex geometry [128,129], such as abutments, piers, and girder sections, which are challenging to model. VP algorithms have optimized these difficulties by reducing the complexity of their mod-eling. The studies focused on the application of VP tools to bridges include that of Zhang et al. [115], who modeled the bridge pier design using Dynamo scripts to automate the
02468
10121416
Before2014
2014 2015 2016 2017 2018 2019 2020
Bridges [publications] 0 0 0 0 1 1 4 3Tunnels [publications] 0 1 0 0 0 0 2 3Roads [publications] 0 0 0 0 0 0 0 3Other infrastructures [publications] 0 0 0 0 0 1 2 5
Num
ber o
f Pub
licat
ions
Year
Other infrastructures [publications] Roads [publications]
Tunnels [publications] Bridges [publications]
Figure 7. Distribution of publications reviewed by type of infrastructure project.
The data in Figure 7 show the following statistics by infrastructure category: (1) Bridges;the leading discipline with nine publications (34.62%). These statistics may be explainedbecause bridges are infrastructure with elements of very complex geometry [128,129], suchas abutments, piers, and girder sections, which are challenging to model. VP algorithmshave optimized these difficulties by reducing the complexity of their modeling. The studiesfocused on the application of VP tools to bridges include that of Zhang et al. [115], whomodeled the bridge pier design using Dynamo scripts to automate the geometry modeling.Then, the 3D model of the structure was modeled through an extrusion command. Wanget al. [123] generated a BIM parametric model to design railway bridge platforms usingDynamo algorithms. This parametric model reduced the geometric uncertainty duringthe transversal layout of this bridge typology. Sha et al. [114] designed an algorithm forparametrizing highway-type bridge pedestrian platforms considering both the geometryand possible construction scenarios. (2) Tunnels; These infrastructures made the third-highest contribution with six papers (23.08%), and included that of Zhu et al. [110], whodesigned a parametric model in Dynamo to study the central axis deviations in tunnelsduring their transversal construction. This model was applied during the design andconstruction of a Ningbo province subway (China). Mu et al. [121] developed a Dynamoalgorithm that parameterizes tunnel structural support geometry by exporting topographicpoints and structural values to a BIM model. This algorithm had the main advantage

Appl. Sci. 2021, 11, 8343 16 of 24
of automating the generation of integral model tunnel design. Liu et al. [130] designeda parametric multi-modeling method for mining tunnels. This invention enables thecentralization of the information from several BIM models using Dynamo algorithmsand a local data server. (3) Roads; These were the type of infrastructure with the lowestcontribution to this review, with three publications (11.54%). This is explained because all ofthis group’s reviewed papers correspond to the year 2020. Therefore, VP tool applicationson road projects are still in an early development stage. These applications will dependon the degree of automation that this type of infrastructure requires in the future. Thefollowing road project studies are highlighted: Tang et al. [111] generated a parametricmodel in Dynamo to design the geometry of the roads and for pavement deformationanalysis. This parametric model was applied in a road project that connected the citiesof Phnom Penh and Sihanoukville (Cambodia). Zhang et al. [115] designed a parametricmodel in Dynamo to automate the generation of construction platforms during roaddesign. In this manner, the connection in the early stages between construction and designprojects was studied simultaneously. (4) Other infrastructures; This infrastructure categorymade the second-highest contribution to this bibliographic review, with eight publications(30.77%). According to Figure 6, this type of infrastructure experienced constant growth inthe number of papers during 2017–2018. VP applications are expanding towards a moresignificant number of infrastructure types, which has improved the versatility of thesetools. The types of infrastructure associated with this category were historical remodelingprojects (two studies), energy development (two studies), structural analysis (two studies),construction project excavation works (one study), and parametric modeling of urbanelectrical networks (one study). The comparison between Figures 6 and 7 shows that in2018 and 2019, the distribution of publications was not focused on any type of infrastructureproject. However, this development was mainly undertaken in the Dynamo tool. This factdemonstrates the versatility that this VP tool offers to civil engineering projects. Therefore,future development of other VP tools should consider both the interface and the executionmode of Dynamo scripts.
Figure 8 presents the reviewed studies’ distribution detail considering the stage of thelife cycle in which the VP tools were studied. In this figure, the publications are groupedinto the following stages: (1) Design of projects (red bars), (2) Analysis of constructionprojects (blue bars), and (3) Infrastructure operation assessment (green bars).
Appl. Sci. 2021, 11, x FOR PEER REVIEW 17 of 25
Figure 8. Distribution of the reviewed studies by life cycle stage of the infrastructures.
The analysis of Figure 8 shows that 80.77% (21 studies) of the reviewed publications developed applications in the design stages, 11.54% (three studies) in infrastructure’ op-eration, and 7.69% (two studies) in construction projects. These results indicate that the parametric longitudinal design of BIM projects through VP tools is the main application found in this review. However, these tools have limited scope in developing applications to reduce repetitive processes or generate data bridges between sensor networks and BIM models. Therefore, BIM research should focus on increasing the effort applied to these limited applications to improve infrastructure projects’ automation. The topics covered in the papers associated with the operation and construction of infrastructure projects were the development of inspection systems, for both bridges [99,131] and roads [96], and the evaluation of construction work scenarios [70,116]. Although these applications covered many scenarios, as expected from the operation of these infrastructures, they was not found in other VP applications such as: (1) automated estimation of operational road emis-sions using VP algorithms that transfer real information on traffic and the vehicle fleet; (2) measurement of control variables in bridge assembly using low-cost sensors with subse-quent reading and updating of BIM models [132,133]; and (3) automated review and checking of infrastructure multi-models during proposal evaluation stages [134,135].
Table 5 presents a summary of the reviewed publications indicating the type of pro-ject, the life cycle of the infrastructures studied by the publications, and the VP tool–BIM software used. The purpose of this table is to facilitate the bibliographic search of future investigations of VP applications on civil engineering.
0
2
4
6
8
10
12
14
16
Before2014
2014 2015 2016 2017 2018 2019 2020
Operation [papers] 0 0 0 0 0 0 1 2Construction [papers] 0 0 0 0 0 0 2 0Design [papers] 0 1 0 0 1 2 5 12
Num
ber o
f Pub
licat
ions
Year
Design [papers] Construction [papers] Operation [papers]
Figure 8. Distribution of the reviewed studies by life cycle stage of the infrastructures.

Appl. Sci. 2021, 11, 8343 17 of 24
The analysis of Figure 8 shows that 80.77% (21 studies) of the reviewed publicationsdeveloped applications in the design stages, 11.54% (three studies) in infrastructure’ op-eration, and 7.69% (two studies) in construction projects. These results indicate that theparametric longitudinal design of BIM projects through VP tools is the main applicationfound in this review. However, these tools have limited scope in developing applicationsto reduce repetitive processes or generate data bridges between sensor networks and BIMmodels. Therefore, BIM research should focus on increasing the effort applied to theselimited applications to improve infrastructure projects’ automation. The topics coveredin the papers associated with the operation and construction of infrastructure projectswere the development of inspection systems, for both bridges [99,131] and roads [96],and the evaluation of construction work scenarios [70,116]. Although these applicationscovered many scenarios, as expected from the operation of these infrastructures, they wasnot found in other VP applications such as: (1) automated estimation of operational roademissions using VP algorithms that transfer real information on traffic and the vehiclefleet; (2) measurement of control variables in bridge assembly using low-cost sensors withsubsequent reading and updating of BIM models [132,133]; and (3) automated review andchecking of infrastructure multi-models during proposal evaluation stages [134,135].
Table 5 presents a summary of the reviewed publications indicating the type of project,the life cycle of the infrastructures studied by the publications, and the VP tool–BIMsoftware used. The purpose of this table is to facilitate the bibliographic search of futureinvestigations of VP applications on civil engineering.
Table 5. Classification of reviewed publications according to project type, tool used, and the lifecycle stage.
Project Type Life Cycle Stage VP Tool-BIM Software Reference
Bridge
Operation Python-API [99]Operation Autodesk Dynamo-Revit [131]
Design Autodesk Dynamo-Revit [23]Design Autodesk Dynamo-Revit [118]
Construction Autodesk Dynamo-Revit [116]Design Autodesk Dynamo-Revit [92]Design Autodesk Dynamo-Revit [122]Design Autodesk Dynamo-Revit [94]Design Autodesk Dynamo-Revit [123]
Other infrastructures
Design Grasshopper-Rhinoceros [108]Operation Autodesk Dynamo-Revit [132]
Design Autodesk Dynamo-Revit [109]Construction Grasshopper-Rhinoceros [98]
Design Autodesk Dynamo-Revit [112]Design Grasshopper-Rhinoceros [113]Design Grasshopper-ArchiCad [100]Design Autodesk Dynamo-Revit [124]
Tunnels
Design Autodesk Dynamo-Revit [101]Design Autodesk Dynamo-Revit [110]Design Autodesk Dynamo-Revit [93]Design Autodesk Dynamo-Revit [130]Design Autodesk Dynamo-Revit [120]Design Autodesk Dynamo-Revit [121]
RoadsDesign Grasshopper-Dynamo [97]Design Dynamo-Python [111]Design Python-API [116]
The results of this review show that the potential research lines (trends) of VP toolsin infrastructure projects are as follows: (1) Automation of the design of infrastructures:Parametric design is clearly the main application of VP algorithms in the literature. VP tools

Appl. Sci. 2021, 11, 8343 18 of 24
have been used for the automation of the design of a number of infrastructure elementsin the literature (such as bridges, roads, and tunnels). In the future, it is expected thatthese tools will be also applied for the parametric automation of the design of a growingnumber of infrastructure projects. Nevertheless, these publications have focused on theautomation of the longitudinal design of bridges, roads, and tunnels. This situation hasgenerated a critical gap in the design of specific elements, such as abutments, foundations,or reaction frames for tunnel boring machines. (2) Interoperability with Web applications:The generation of virtual clouds that support BIM information models will be an importanttrend in projects’ digitization because this can be used to manage and generate automaticinformation for evaluating and assessing BIM processes. Therefore, it is highly likely thatVP algorithms will improve the compatibility of their VP language with that of Web servers.(3) Monitoring of infrastructure operation: Due to the advantages of VP related to includinginformation in BIM Models, it is likely that these tools will be further developed to enablean easier and more efficient communication with the monitoring of the infrastructureon site.
4. Conclusions
This paper studied the application of visual programming tools in infrastructureprojects. For this purpose, the state of the art of these algorithms is systematically reviewed.To encourage engineers and scholars to use VP algorithms, the benefits and the futureresearch trends of these tools are also detailed.
This bibliographic search verified that VP tool applications have been focused onarchitecture projects rather than infrastructure. However, the application of these tools incivil engineering projects is growing. Therefore, the automation gap between building andinfrastructure projects is being reduced.
This bibliographic search reviewed 26 publications with a distribution of 13 registeredpatents and 13 academic papers. The most-used VP tools were Dynamo for Autodesk(21 publications), followed by Grasshopper (three publications) and Python, with two pub-lications. This suggests that the interoperability among the studied VP tools has undergoneless development than the connectivity between different BIM software packages. In otherwords, although the market for BIM software offers better infrastructure modeling toolsthan the Autodesk Revit software, VP tool applications have continued to be developedpredominantly in Dynamo.
Regarding country contributions to this review, China was the largest contributor.Moreover, all the reviewed patents and the majority of academic articles were also producedby China. However, a significant contribution was also made by European publications.These results suggest that the current research on VP tool applications in infrastructure hasstrong potential in both geographic zones.
The parametric design of bridges and other infrastructure projects is the main researchtopic. Furthermore, companies have concentrated their research efforts on developingregistered patents for bridge design projects due to their economic potential. However, asignificant research gap is the application of VP tools in road and tunnel projects, becausethe number of works that studied these infrastructures projects is limited.
The parametric design of infrastructure projects was found to be the leading ap-plication of the VP tools. However, the operation and construction stages also presentinteresting applications. The number of associated publications is much lower than thatfor parameterization. The topics of analysis of emissions, control of variables by sensors,and validation of BIM infrastructure models are proposed as potential applications of VPtools for the future.
Author Contributions: J.C. conceived, designed, and has written this study. F.L.-G. has reviewedthis study. J.A.L.-G. has reviewed, edited and conceptualized this draft and J.T. has also reviewed,edited and conceptualized this draft. All authors have read and agreed to the published version ofthe manuscript.

Appl. Sci. 2021, 11, 8343 19 of 24
Funding: This work was funded by the National Agency for Research and Development (ANID) forthe Scholarship Program “DOCTORADO BECAS CHILE/2019”–Folio n◦72200098 and by the SpanishMinistry of Economy and Competitiveness and the FEDER fund through the projects BIA2017-86811-C2-1-R directed by José Turmo and BIA2017-86811-C2-2-R. Authors are also indebted to the Secretariad’ Universitats i Recerca of the Generalitat de Catalunya for the funding provided through Agaur(2017 SGR 1481).
Institutional Review Board Statement: Not applicable.
Informed Consent Statement: Not applicable.
Data Availability Statement: Not applicable.
Conflicts of Interest: The authors declare no conflict of interest.
References1. Carvalho, J.P.; Bragança, L.; Mateus, R. Sustainable building design: Analysing the feasibility of BIM platforms to support
practical building sustainability assessment. Comput. Ind. 2021, 127, 103400. [CrossRef]2. Sidani, A.; Dinis, F.M.; Sanhudo, L.; Duarte, J.; Santos Baptista, J.; Poças Martins, J.; Soeiro, A. Recent Tools and Techniques of
BIM-Based Virtual Reality: A Systematic Review. Arch. Comput. Methods Eng. 2019, 28, 449–462. [CrossRef]3. Santos, M.C.F.; Costa, D.B.; Ferreira, E.D.A.M. Information workflow proposal for integrating cost estimating, scheduling, and
monitoring with BIM in SMEs. Ambiente Construído 2021, 21, 113–129. [CrossRef]4. Bellido-Montesinos, P.; Lozano-Galant, F.; Castilla, F.J.; Lozano-Galant, J.A. Experiences learned from an international BIM contest:
Software use and information workflow analysis to be published in: Journal of Building Engineering. J. Build. Eng. 2019, 21,149–157. [CrossRef]
5. Hong, S.-H.; Lee, S.-K.; Kim, I.-H.; Yu, J.-H.; Hong, L.; Kim, Y. Acceptance model for mobile building information modeling (BIM).Appl. Sci. 2019, 9, 3668. [CrossRef]
6. Martins, S.S.; Evangelista, A.C.J.; Hammad, A.W.A.; Tam, V.W.Y.; Haddad, A. Evaluation of 4D BIM tools applicability inconstruction planning efficiency. Int. J. Constr. Manag. 2020, 1–14. [CrossRef]
7. Staub-French, S.; Pilon, A.; Poirier, E.; Fallahi, A.; Kasbar, M.; Calderon, F.; Teshnizi, Z.; Froese, T. Construction process innovationon brock commons tallwood house. Constr. Innov. 2021, 8, 1471–4175. [CrossRef]
8. Jang, J.; Ahn, S.; Cha, S.H.; Cho, K.; Koo, C.; Kim, T.W. Toward productivity in future construction: Mapping knowledge andfinding insights for achieving successful offsite construction projects. J. Comput. Des. Eng. 2021, 8, 1–14. [CrossRef]
9. He, R.; Li, M.; Gan, V.J.; Ma, J. BIM-enabled computerized design and digital fabrication of industrialized buildings: A case study.J. Clean. Prod. 2021, 278, 123505. [CrossRef]
10. Lamptey, T.; Owusu-Manu, D.-G.; Acheampong, A.; Adesi, M.; Ghansah, F.A. A framework for the adoption of green businessmodels in the Ghanaian construction industry. Smart Sustain. Built Environ. 2020. [CrossRef]
11. Li, X.-J.; Lai, J.-Y.; Ma, C.-Y.; Wang, C. Using BIM to research carbon footprint during the materialization phase of prefabricatedconcrete buildings: A China study. J. Clean. Prod. 2021, 279, 123454. [CrossRef]
12. Tushar, Q.; Bhuiyan, M.A.; Zhang, G.; Maqsood, T. An integrated approach of BIM-enabled LCA and energy simulation: Theoptimized solution towards sustainable development. J. Clean. Prod. 2021, 289, 125622. [CrossRef]
13. Nguyen, D.K.; Huynh, T.L.D.; Nasir, M.A. Carbon emissions determinants and forecasting: Evidence from G6 countries. J.Environ. Manag. 2021, 285, 111988. [CrossRef] [PubMed]
14. Harvey, N.; Pearce, I. At what cost is collagenase clostridium histolyticum viable for treating Peyronie’s disease in a publichealthcare system? Andrology 2020, 8, 1304–1311. [CrossRef]
15. Toepfer, S.; Zhang, T.; Wang, B.; Qiao, Y.; Peng, H.; Luo, H.; Wan, X.; Gu, R.; Zhang, Y.; Ji, H.; et al. Sustainable pest managementthrough improved advice in agricultural extension. Sustainability 2020, 12, 6767. [CrossRef]
16. Lee, W.-I.; Chiang, N.-C. An investigation of the methods of logicalizing the code-checking system for architectural design reviewin New Taipei city. Appl. Sci. 2016, 6, 407. [CrossRef]
17. Lee, Y.; Kim, I.; Choi, J. Development of BIM-based risk rating estimation automation and a design-for-safety review system.Appl. Sci. 2020, 10, 3902. [CrossRef]
18. Prizeman, O.; Pezzica, C.; Taher, A.; Boughanmi, M. Networking historic environmental standards to address modern challengesfor sustainable conservation in HBIM. Appl. Sci. 2020, 10, 1283. [CrossRef]
19. Macher, H.; Landes, T.; Grussenmeyer, P. From point clouds to building information models: 3D semi-automatic reconstruction ofindoors of existing buildings. Appl. Sci. 2017, 7, 1030. [CrossRef]
20. Maskuriy, R.; Selamat, A.; Ali, K.N.; Maresova, P.; Krejcar, O. Industry 4.0 for the construction industry—How ready is theindustry? Appl. Sci. 2019, 9, 2819. [CrossRef]
21. Jiang, S.; Jiang, L.; Han, Y.; Wu, Z.; Wang, N. OpenBIM: An Enabling Solution for Information Interoperability. Appl. Sci. 2019, 9,5358. [CrossRef]
22. Miano, A.; Fiorillo, A.; Salzano, A.; Prota, A.; Jacobsson, R. The structural design of the decay volume for the search for hiddenparticles (SHIP) project. Arch. Civ. Mech. Eng. 2021, 21, 3. [CrossRef]
Appl. Sci. 2021, 11, 8343 20 of 24
23. Viana, V.L.B.; Carvalho, M.T.M. Prioritization of risks related to BIM implementation in brazilian public agencies using fuzzylogic. J. Build. Eng. 2021, 36, 102104. [CrossRef]
24. Lee, Y.-J.; Jun, H.-J. Development of a BIM-based carbon dioxide emission estimation system-focus on an apartment in Korea-.Arch. Res. 2016, 18, 145–149. [CrossRef]
25. Liu, S.; Meng, X.; Tam, C.M. Building information modeling based building design optimization for sustainability. Energy Build.2015, 105, 139–153. [CrossRef]
26. Jun, H.; Lim, N.; Kim, M. BIM-based Carbon Dioxide Emission Quantity Assessment Method in Korea. J. Asian Arch. Build. Eng.2015, 14, 569–576. [CrossRef]
27. Zhou, H.; Azar, E.R. BIM-based energy consumption assessment of the on-site construction of building structural systems. BuiltEnviron. Proj. Asset Manag. 2019, 9, 2–14. [CrossRef]
28. Wu, P.; Xia, B.; Zhao, X. The importance of use and end-of-life phases to the life cycle greenhouse gas (GHG) emissions ofconcrete—A review. Renew. Sustain. Energy Rev. 2014, 37, 360–369. [CrossRef]
29. Xu, J.; Shi, Y.; Xie, Y.; Zhao, S. A BIM-Based construction and demolition waste information management system for greenhousegas quantification and reduction. J. Clean. Prod. 2019, 229, 308–324. [CrossRef]
30. Chhatwani, M.; Golparvar-Fard, M. Model-driven management a of construction carbon footprint: Case study. In Proceedings ofthe Construction Research Congress 2016, San Juan, PR, USA, 31 May–2 June 2016; pp. 1202–1212.
31. Marzouk, M.; Abdelkader, E.M.; Al-Gahtani, K. Building information modeling-based model for calculating direct and indirectemissions in construction projects. J. Clean. Prod. 2017, 152, 351–363. [CrossRef]
32. Sánchez, A.; González-Gaya, C.; Zulueta, P.; Sampaio, Z.; Torre, B. Academic proposal for heritage intervention in a BIMenvironment for a 19th century flour factory. Appl. Sci. 2019, 9, 4134. [CrossRef]
33. Xie, L.; Wang, R.; Ming, Z.; Chen, D. A layer-wise strategy for indoor as-built modeling using point clouds. Appl. Sci. 2019, 9,2904. [CrossRef]
34. Adibfar, A.; Costin, A.; Issa, R.R.A. Design copyright in architecture, engineering, and construction industry: Review of history,pitfalls, and lessons learned. J. Leg. Aff. Disput. Resolut. Eng. Constr. 2020, 12, 04520032. [CrossRef]
35. Ivson, P.; Moreira, A.; Queiroz, F.; Santos, W.; Celes, W. A systematic review of visualization in building information modeling.IEEE Trans. Vis. Comput. Graph. 2019, 26, 3109–3127. [CrossRef]
36. Panah, R.; Kioumarsi, M. Application of building information modelling (BIM) in the health monitoring and maintenance process:A systematic review. Sensors 2021, 21, 837. [CrossRef]
37. Boton, C.; Rivest, L.; Ghnaya, O.; Chouchen, M. What is at the Root of Construction 4.0: A Systematic Review of the RecentResearch Effort. Arch. Comput. Methods Eng. 2021, 28, 2331–2350. [CrossRef]
38. Liu, Z.; Chi, Z.; Osmani, M.; Demian, P. Blockchain and building information management (BIM) for sustainable buildingdevelopment within the context of smart cities. Sustainability 2021, 13, 2090. [CrossRef]
39. Sepasgozar, S.M.E.; Shi, A.; Yang, L.; Shirowzhan, S.; Edwards, D.J. Additive manufacturing applications for industry 4.0: Asystematic critical review. Buildings 2020, 10, 231. [CrossRef]
40. Artus, M.; Koch, C. State of the art in damage information modeling for RC bridges—A literature review. Adv. Eng. Inform. 2020,46, 101171. [CrossRef]
41. Zhang, J.; Zhao, L.; Ren, G.; Li, H.; Li, X. Special issue “digital twin technology in the AEC industry”. Adv. Civ. Eng. 2020, 2020,1–18. [CrossRef]
42. Samimpay, R.; Saghatforoush, E. Benefits of implementing building information modeling (BIM) in infrastructure projects. J. Eng.Proj. Prod. Manag. 2020, 10, 123–140. [CrossRef]
43. Yang, T.; Liao, L. Research on building information model (BIM) technology. World Constr. 2016, 5, 1. [CrossRef]44. Jay, G.; Hale, J.E.; Smith, R.K.; Hale, D.; Kraft, N.A.; Ward, C. Cyclomatic complexity and lines of code: Empirical evidence of a
stable linear relationship. J. Softw. Eng. Appl. 2009, 2, 137–143. [CrossRef]45. Farooq, M.S.; Khan, S.A.; Ahmad, F.; Islam, S.; Abid, A. An evaluation framework and comparative analysis of the widely used
first programming languages. PLoS ONE 2014, 9, e88941. [CrossRef]46. Zamora-Polo, F.; Sánchez-Cortés, M.M.; Reyes-Rodríguez, A.M.; Sanz-Calcedo, J.G. Developing project managers’ transversal
competences using building information modeling. Appl. Sci. 2019, 9, 4006. [CrossRef]47. Autodesk ¿What Is Visual Programming? Available online: https://primer.dynamobim.org/en/01_Introduction/1-1_what_is_
visual_programming.html (accessed on 22 May 2020).48. Seghier, T.E.; Lim, Y.W.; Ahmad, M.H.; Samuel, W.O. Building envelope thermal performance assessment using visual pro-
gramming and BIM, based on ETTV requirement of green mark and GreenRE. Int. J. Built Environ. Sustain. 2017, 4, 227–235.[CrossRef]
49. Kensek, K.; Ding, Y.; Longcore, T. Green building and biodiversity: Facilitating bird friendly design with building informationmodels. J. Green Build. 2016, 11, 116–130. [CrossRef]
50. Valinejadshoubi, M.; Moselhi, O.; Bagchi, A. Integrating BIM into sensor-based facilities management operations. J. Facil. Manag.2021. [CrossRef]
51. Santoni, A.; Martín-Talaverano, R.; Quattrini, R.; Murillo-Fragero, J.I. HBIM approach to implement the historical and constructiveknowledge. The case of the real colegiata of San Isidoro (León, Spain). Virtual Archaeol. Rev. 2021, 12, 49–65. [CrossRef]

Appl. Sci. 2021, 11, 8343 21 of 24
52. Chen, Z.; Hammad, A.W.A.; Kamardeen, I.; Akbarnezhad, A. Optimising embodied energy and thermal performance of thermalinsulation in building envelopes via an automated building information modelling (BIM) Tool. Buildings 2020, 10, 218. [CrossRef]
53. Larsson, M.; Wålinder, M.; Falk, A. Teleodynamic timber façades. Front. Built Environ. 2018, 4, 37. [CrossRef]54. Abbasi, S.; Noorzai, E. The BIM-based multi-optimization approach in order to determine the trade-off between embodied and
operation energy focused on renewable energy use. J. Clean. Prod. 2021, 281, 125359. [CrossRef]55. Freitas, J.D.S.; Cronemberger, J.; Soares, R.M.; Amorim, C.N.D. Modeling and assessing BIPV envelopes using parametric
rhinoceros plugins grasshopper and ladybug. Renew. Energy 2020, 160, 1468–1479. [CrossRef]56. Massafra, A.; Prati, D.; Predari, G.; Gulli, R. Wooden truss analysis, preservation strategies, and digital documentation through
parametric 3D modeling and HBIM workflow. Sustainability 2020, 12, 4975. [CrossRef]57. Mladenovic, M.; Žanko, Ž.; Cuvic, M.A. The impact of using program visualization techniques on learning basic programming
concepts at the K–12 level. Comput. Appl. Eng. Educ. 2021, 29, 145–159. [CrossRef]58. Pacevic, R.; Kaceniauskas, A. The development of VisLT visualization service in Openstack cloud infrastructure. Adv. Eng. Softw.
2017, 103, 46–56. [CrossRef]59. Kensek, K.M. Teaching visual scripting in BIM: A case study using a panel controlled by solar angles. J. Green Build. 2018, 13,
113–138. [CrossRef]60. Martinez, P.; Ahmad, R.; Al-Hussein, M. A vision-based system for pre-inspection of steel frame manufacturing. Autom. Constr.
2019, 97, 151–163. [CrossRef]61. Andriamamonjy, A.; Saelens, D.; Klein, R. An auto-deployed model-based fault detection and diagnosis approach for Air handling
units using BIM and modelica. Autom. Constr. 2018, 96, 508–526. [CrossRef]62. Autodesk DYMANO: Open Source Graphical Programming for Design. Available online: https://dynamobim.org/ (accessed on
19 May 2020).63. Google Program Learn to Code for Free—Grasshopper. Available online: https://grasshopper.app/ (accessed on 14 April 2021).64. Python. Available online: https://www.python.org/ (accessed on 8 February 2021).65. Korus, K.; Salamak, M.; Jasinski, M. Optimization of geometric parameters of arch bridges using visual programming FEM
components and genetic algorithm. Eng. Struct. 2021, 241, 112465. [CrossRef]66. Diao, P.-H.; Shih, N.-J. Trends and research issues of augmented reality studies in architectural and civil engineering education—a
review of academic journal publications. Appl. Sci. 2019, 9, 1840. [CrossRef]67. Saito, D.; Washizaki, H.; Fukazawa, Y. Comparison of text-based and visual-based programming input methods for first-time
learners. J. Inf. Technol. Educ. Res. 2017, 16, 209–226. [CrossRef]68. Salimzadeh, N.; Vahdatikhaki, F.; Hammad, A. Parametric modeling and surface-specific sensitivity analysis of PV module layout
on building skin using BIM. Energy Build. 2020, 216, 109953. [CrossRef]69. Kensek, K. Visual programming for building information modeling: Energy and shading analysis case studies. J. Green Build.
2015, 10, 28–43. [CrossRef]70. Kiamili, C.; Hollberg, A.; Habert, G. Detailed assessment of embodied carbon of HVAC systems for a new office building based
on BIM. Sustainability 2020, 12, 3372. [CrossRef]71. Nezamaldin, D. Parametric Design with Visual Programming in Dynamo with Revit: The Conversion from CAD Models to BIM and the
Design of Analytical Applications; Royal Institute of Technology: Stockolm, Sweden, 2019.72. Khan, N.; Ali, A.K.; Tran, S.V.-T.; Lee, D.; Park, C. Visual language-aided construction fire safety planning approach in building
information modeling. Appl. Sci. 2020, 10, 1704. [CrossRef]73. Boeykens, S.; Himpe, C.; Martens, B. A Case Study of Using BIM in Historical Reconstruction. In Proceedings of the 30th eCAADe
Conference, Prague, Czech Republic, 12–14 September 2012; Volume 1, pp. 729–737. [CrossRef]74. Moreno Bazán, Á.; Alberti, M.G.; Álvarez, A.; Trigueros, J.A. New perspectives for BIM usage in transportation infrastructure
projects. Appl. Sci. 2020, 10, 7072. [CrossRef]75. Herbers, P.; König, M. Indoor localization for augmented reality devices using BIM, point clouds, and template matching. Appl.
Sci. 2019, 9, 4260. [CrossRef]76. Shou, W.; Wang, J.; Wang, X.; Chong, H.Y. A comparative review of building information modelling implementation in building
and infrastructure industries. Arch. Comput. Methods Eng. 2015, 22, 291–308. [CrossRef]77. Navarro, I.J.; Penadés-Plà, V.; Martínez-Muñoz, D.; Rempling, R.; Yepes, V. Life cycle sustainability assessment for multi-criteria
decision making in bridge design: A review. J. Civ. Eng. Manag. 2020, 26, 690–704. [CrossRef]78. Zhou, W.; Qin, H.; Qiu, J.; Fan, H.; Lai, J.; Wang, K.; Wang, L. Building information modelling review with potential applications
in tunnel engineering of China. R. Soc. Open Sci. 2017, 4, 170174. [CrossRef]79. Sierra, L.A.; Yepes, V.; Pellicer, E. A review of multi-criteria assessment of the social sustainability of infrastructures. J. Clean. Prod.
2018, 187, 496–513. [CrossRef]80. Salas, J.; Yepes, V. Urban vulnerability assessment: Advances from the strategic planning outlook. J. Clean. Prod. 2018, 179,
544–558. [CrossRef]81. Ministry of Science and Innovation of Spain. Fecyt: Scientific Resources. Available online: https://www.recursoscientificos.fecyt.
es/ (accessed on 3 May 2020). (In Spanish).82. Derwent Innovations Index—Web of Science platform—LibGuides at Clarivate Analytics. Available online: https://clarivate.
libguides.com/webofscienceplatform/dii (accessed on 22 April 2021).

Appl. Sci. 2021, 11, 8343 22 of 24
83. Juan, Y.-K.; Hsing, N.-P. BIM-based approach to simulate building adaptive performance and life cycle costs for an open buildingdesign. Appl. Sci. 2017, 7, 837. [CrossRef]
84. Volk, R.; Stengel, J.; Schultmann, F. Building information modeling (BIM) for existing buildings—literature review and futureneeds. Autom. Constr. 2014, 38, 109–127. [CrossRef]
85. Abdirad, H.; Dossick, C.S. BIM curriculum design in architecture, engineering, and construction education: A systematic review.J. Inf. Technol. Constr. 2016, 21, 250–271.
86. Lu, W.; Webster, C.; Chen, K.; Zhang, X.; Chen, X. Computational building information modelling for construction wastemanagement: Moving from rhetoric to reality. Renew. Sustain. Energy Rev. 2017, 68, 587–595. [CrossRef]
87. Bruno, S.; de Fino, M.; Fatiguso, F. Historic building information modelling: Performance assessment for diagnosis-aidedinformation modelling and management. Autom. Constr. 2018, 86, 256–276. [CrossRef]
88. Costin, A.; Adibfar, A.; Hu, H.; Chen, S.S. Building information modeling (BIM) for transportation infrastructure—literaturereview, applications, challenges, and recommendations. Autom. Constr. 2018, 94, 257–281. [CrossRef]
89. Nawari, O.; Nawari, K.B.; Ravindran, S. Blockchain technology and BIM process: Review and potential applications. J. Inf.Technol. Constr. 2019, 24, 209–238.
90. Gao, H.; Koch, C.; Wu, Y. Building information modelling based building energy modelling: A review. Appl. Energy 2019, 238,320–343. [CrossRef]
91. Parn, E.A.; Edwards, D. Cyber threats confronting the digital built environment: Common data environment vulnerabilities andblock chain deterrence. Eng. Constr. Arch. Manag. 2019, 26, 245–266. [CrossRef]
92. Shi, S.; Yue, G.; Li, J.; Zhang, W.; Shi, J.; Qiu, Y.; Deng, G.; Yao, K.; Liu, Y.; Yuan, S. Dynamo-Based BIM (Building InformationModeling) Parameterized Modeling Method and Device. Chinese Patent N◦ CN111063030-A; Derwent Innovations Index, 2020.Available online: https://patents.google.com/patent/CN111063030A/en?oq=CN111063030-A (accessed on 30 August 2021).
93. Wu, J.; Du, Z.; Huang, R.; Zhang, G.; Wang, X.; Liu, F.; Chen, G.; Duan, M.; Yang, X.; Lin, X. Tunnel Model Creation MethodBased on Revit+Dynamo. Chinese Patent N◦ CN109711052-A; Derwent Innovations Index, 2019. Available online: https://patents.google.com/patent/CN109711052A/en?oq=CN109711052-A (accessed on 30 August 2021).
94. Ma, M.; Dang, L.; Yu, L.; Yue, Z.; Li, Y.; Han, Y.; Yin, H.; Chang, D.; Zhang, L.; Pang, L.; et al. The Method Established HighwayAssembling Type Beam Bridge Disease Using Dynamo and Reinforce Model-Part A. Chinese Patent N◦ CN108842640-A;Derwent Innovations Index, 2018. Available online: https://patents.google.com/patent/CN108842640A/en?oq=CN108842640-A(accessed on 30 August 2021).
95. Ma, M.; Dang, L.; Yu, L.; Yue, Z.; Li, Y.; Han, Y.; Yin, H.; Chang, D.; Zhang, L.; Pang, L.; et al. The Method EstablishedHighway Assembling Type Beam Bridge Disease Using Dynamo and Reinforce Model-Part B. Chinese Patent N◦ CN108842640-B;Derwent Innovations Index, 2019. Available online: https://patents.google.com/patent/CN108842640B/en?oq=CN108842640-B(accessed on 30 August 2021).
96. O’Shea, M.; Murphy, J. Design of a BIM Integrated structural health monitoring system for a historic offshore lighthouse. Buildings2020, 10, 131. [CrossRef]
97. Biancardo, S.A.; Capano, A.; de Oliveira, S.G.; Tibaut, A. Integration of BIM and procedural modeling tools for road design.Infrastructures 2020, 5, 37. [CrossRef]
98. Khan, N.; Ali, A.K.; Skibniewski, M.J.; Lee, D.Y.; Park, C. Excavation safety modeling approach using BIM and VPL. Adv. Civ.Eng. 2019, 2019. [CrossRef]
99. Qin, Y.; Xiao, R.; Wang, Y.; Law, K.H. A bridge information modeling framework for model interoperability. In Proceedings of theComputing in Civil Engineering 2019, Atlanta, GA, USA, 17–19 June 2019; pp. 447–454.
100. Karóczkai, Á. Parametric BIM models in ARCHICAD the grasshopper-ARCHICAD live connection. In Proceedings ofthe 36th eCAADe Education and research in Computer Aided Architectural Design in Europe Conference, Lodz, Poland,19–21 September 2018.
101. Briscoe, D. Parametric planting green system research plus design using BIM. In Proceedings of the 34th Annual Conference of theAssociation-for-Computer-Aided-Design-in-Architecture (ACADIA), Los Angeles, CA, USA, 20–26 October 2014; pp. 333–338.
102. Häußler, M.; Esser, S.; Borrmann, A. Code compliance checking of railway designs by integrating BIM, BPMN and DMN. Autom.Constr. 2021, 121, 103427. [CrossRef]
103. Liu, B.; Wang, M.; Zhang, Y.; Liu, R.; Wang, A. Review and prospect of BIM policy in China. In Proceedings of the IOP ConferenceSeries: Materials Science and Engineering, Prague, Czech Republic, 12–16 June 2017; Volume 245, p. 22021.
104. Zhou, Y.; Yang, Y.; Yang, J.-B. Barriers to BIM implementation strategies in China. Eng. Constr. Arch. Manag. 2019, 26, 554–574.[CrossRef]
105. Wong, A.K.; Wong, F.K.; Nadeem, A. Government roles in implementing building information modelling systems: Comparisonbetween Hong Kong and the United States. Constr. Innov. 2011, 11, 61–76. [CrossRef]
106. Smith, P. BIM implementation—global strategies. In Procedia Engineering; Elsevier: Amsterdam, The Netherlands, 2014; Volume85, pp. 482–492. [CrossRef]
107. Hamma-Adama, M.; Kouider, T. Comparative analysis of BIM adoption efforts by developed countries as precedent for newadopter countries. Curr. J. Appl. Sci. Technol. 2019, 2019, 1–15. [CrossRef]
108. Aydin, S.; Aktas, B. Developing an integrated VR infrastructure in architectural design education. Front. Robot. AI 2020, 7, 495468.[CrossRef] [PubMed]

Appl. Sci. 2021, 11, 8343 23 of 24
109. Hamidavi, T.; Abrishami, S.; Ponterosso, P.; Begg, D.; Nanos, N. OSD: A framework for the early stage parametric optimisation ofthe structural design in BIM-based platform. Constr. Innov. 2020, 20, 149–169. [CrossRef]
110. Zhu, X.; Bao, T.; Yu, H.; Zhao, J. Utilizing building information modeling and visual programming for segment design andcomposition. J. Comput. Civ. Eng. 2020, 34, 04020024. [CrossRef]
111. Tang, F.; Ma, T.; Guan, Y.; Zhang, Z. Parametric modeling and structure verification of asphalt pavement based on BIM-ABAQUS.Autom. Constr. 2020, 111, 103066. [CrossRef]
112. Jiang, Y.; Li, A.; Xie, L.; Hou, M.; Qi, Y.; Liu, Y.Q.A.H. Development and application of an intelligent modeling method for ancientwooden architecture. ISPRS Int. J. Geo Inf. 2020, 9, 167. [CrossRef]
113. Wang, Y.; Chen, Q.; Zhu, Q.; Liu, L.; Li, C.; Zheng, D. A survey of mobile laser scanning applications and key techniques overurban areas. Remote. Sens. 2019, 11, 1540. [CrossRef]
114. Sha, K.; Lu, D. Corridor Visual Modeling Method Based on BIM Technology. Chinese Patent N◦ CN111709078-A; Derwent Inno-vations Index, 2020. Available online: https://patents.google.com/patent/CN111709078A/en?oq=CN111709078-A (accessed on30 August 2021).
115. Zhang, Z.; Liang, Z.; He, L.; Xiong, Y.; Duan, B.; Zhu, D. Construction Method of BIM (Building Information Modeling) Parame-terized Modeling Platform for Highway Engineering. Chinese Patent N◦ CN111274632-A; Derwent Innovations Index, 2020.Available online: https://patents.google.com/patent/CN111274632A/en?oq=CN111274632-A (accessed on 30 August 2021).
116. Jia, H.; Wang, L.; Zhang, T.; Gu, W.; Deng, B.; Hu, J.; Wang, X.; Xu, C. Science of Bridge Building Substructure Parameterizes theOne-Touch Accurate Assemble Method of BIM Model. Chinese Patent N◦ CN109614699-A; Derwent Innovations Index, 2019.Available online: https://patents.google.com/patent/CN109614699A/en?oq=CN109614699-A (accessed on 30 August 2021).
117. Wang, M.; Li, Q.; Wang, J.; Zha, X. Method for Realizing Rapid Modeling Dynamic Modification of High-Speed RailwayBridge by Utilizing Dynamoo. Chinese Patent N◦ CN107103158-B; Derwent Innovations Index, 2017. Available online: https://patents.google.com/patent/CN107103158B/en?oq=CN107103158-B (accessed on 30 August 2021).
118. Zhang, L.; Shen, Y. Revit and Dynamo-Based Pile Foundation Model Creation Method. Chinese Patent N◦ CN110580376-A;Derwent Innovations Index, 2019. Available online: https://patents.google.com/patent/CN110580376A/en?oq=CN110580376-A(accessed on 30 August 2021).
119. Liu, Z.; Lu, Y.; Peh, L.C. A Review and scientometric analysis of global building information modeling (BIM) research in thearchitecture, engineering and construction (AEC) industry. Buildings 2019, 9, 210. [CrossRef]
120. Cai, G.; Tai, J.; Xu, J.; Huang, Y.; Yang, S.; Shang, Y.; Peng, A.; Xu, L. Tunnel Structure Model Modeling Method Based on Dynamo.Chinese Patent N◦ CN110688701-A; Derwent Innovations Index, 2020. Available online: https://patents.google.com/patent/CN110688701A/en?oq=CN110688701-A (accessed on 30 August 2021).
121. Mu, L.; Wei, H.; Zhang, W.; Peng, S.; Sun, J.; Fan, C.; Mo, F.; Li, B.; Xu, Z.; Sun, Y.; et al. One Kind Parameterizing Tunnel ModelFast Modeling Method Based on Revit and Dynamo. Chinese Patent N◦ CN109800536-A; Derwent Innovations Index, 2019.Available online: https://patents.google.com/patent/CN109800536A/en?oq=CN109800536-A (accessed on 30 August 2021).
122. Gao, C. A Method of Bridge BIM Model is Established Using Dynamo Software. Chinese Patent N◦ CN109766581-A; Derwent In-novations Index, 2019. Available online: https://patents.google.com/patent/CN109766581A/en?oq=CN109766581-A (accessedon 30 August 2021).
123. Wang, M.; Li, Q.; Wang, J.; Zha, X. The Method That High-Speed Rail Bridge Rapid Modeling is Dynamically Changed isRealized Using Dynamo. Chinese Patent N◦ CN107103158-A; Derwent Innovations Index, 2017. Available online: https://patents.google.com/patent/CN107103158A/en?oq=CN107103158-A (accessed on 30 August 2021).
124. Choi, H.; Jang, K.; Kyung, S.; Kim, H.; Lee, M.; Park, M. BIM Algorithm-based railway tunnel BIM design considering railwayalignment. J. KIBIM 2019, 9, 1–10. [CrossRef]
125. Migilinskas, D.; Popov, V.; Juocevicius, V.; Ustinovichius, L. The benefits, obstacles and problems of practical bim implementation.In Procedia Engineering; Elsevier: Amsterdam, The Netherlands, 2013; Volume 57, pp. 767–774. [CrossRef]
126. Saltarén, S.A.; Buchelí, L.G.; Tienda, J.L.P.; Aparicio, M.S. Implementation of BIM in infrastructure: The need to address it fromthe public sector = Implementación de BIM en infraestructura: La necesidad de abordarlo desde el sector público. Build. Manag.2019, 2, 62–72. [CrossRef]
127. Hall, C.; Standley, T.; Hollerer, T. Infra: Structure all the way down: Structured data as a visual programming language. InProceedings of the 2017 ACM SIGPLAN International Symposium on Memory Management, Barcelona, Spain, 26 February 2017;pp. 180–197.
128. Lozano-Galant, J.; Turmo, J. An algorithm for simulation of concrete cable-stayed bridges built on temporary supports andconsidering time dependent effects. Eng. Struct. 2014, 79, 341–353. [CrossRef]
129. Lozano-Galant, J.A.; Turmo, J. Creep and shrinkage effects in service stresses of concrete cable-stayed bridges. Comput. Concr.2014, 13, 483–499. [CrossRef]
130. Liu, X.; Gong, J.; Hiu, X.; Wu, X.; Li, S.; Wang, L.; Jia, T. Mine Method Tunnel Parametric Modeling Method and DeviceBased on Revit and Dynamo. China Patent N◦ CN111159808-A; Derwent Innovations Index, 2020. Available online: https://patents.google.com/patent/CN111159808A/en?oq=CN111159808-A (accessed on 30 August 2021).
131. Wang, L.; Gong, X.; Su, J.; Maimaiti, Y.; Chen, L. Bim-Based Bridge Auxiliary Facility Operation Maintenance ManagementSystem. China Patent N◦ CN111860895-A, 82; Derwent Innovations Index, 2020. Available online: https://patents.google.com/patent/CN111860895A/en?oq=CN111860895-A (accessed on 30 August 2021).

Appl. Sci. 2021, 11, 8343 24 of 24
132. Hou, S.; Wu, G. A low-cost IoT-based wireless sensor system for bridge displacement monitoring. Smart Mater. Struct. 2019, 28,085047. [CrossRef]
133. Khudhair, A.; Li, H.; Ren, G.; Liu, S. Towards future BIM technology innovations: A bibliometric analysis of the literature. Appl.Sci. 2021, 11, 1232. [CrossRef]
134. Saka, A.B.; Chan, D.W.M. A scientometric review and metasynthesis of building information modelling (BIM) research in Africa.Buildings 2019, 9, 85. [CrossRef]
135. Xue, K.; Hossain, U.; Liu, M.; Ma, M.; Zhang, Y.; Hu, M.; Chen, X.; Cao, G. BIM integrated LCA for promoting circular economytowards sustainable construction: An analytical review. Sustainbility 2021, 13, 1310. [CrossRef]