Interaction of a “nido”-ruthenium terpyridylamine complex with charged elongated micellar scaffolds

Soft Matter
PAPER
Publ
ishe
d on
02
Sept
embe
r 20
13. D
ownl
oade
d by
Tex
as A
& M
Uni
vers
ity o
n 14
/08/
2014
15:
47:2
0.
View Article OnlineView Journal | View Issue
Artie McFerrin Department of Chemical Eng
E. Brown Engineering Building, 77843-31
[email protected]; Fax: +1 979 845 6446
† Electronic supplementary information (with respect to time, calculation of thcalculation of mass transport due to diffuvariables and abbreviations. See DOI: 10.1
Cite this: Soft Matter, 2013, 9, 10155
Received 20th June 2013Accepted 31st August 2013
DOI: 10.1039/c3sm51692j
www.rsc.org/softmatter
This journal is ª The Royal Society of
Adsorption and removal dynamics of polymeric micellarnanocarriers loaded with a therapeutic agent on silicasurfaces†
Ming Zhang, Jessica Soto-Rodrıguez, I-Cheng Chen and Mustafa Akbulut*
Obtaining a better understanding of the adsorption behavior of polymeric nanomedicines is important to
properly assess their distribution and fate and to develop successful strategies for minimizing their
distribution in the environment. In this study, the adsorption and removal dynamics of a model
polymeric nanomedicine of systematically varied sizes – levofloxacin loaded poly(ethyleneglycol-b-3-
caprolactone) – on and from silica surfaces are investigated using a quartz crystal microbalance with
dissipation (QCM-D). For all the sizes of the nanomedicine investigated (90 nm, 110 nm, 149 nm,
174 nm, 207 nm, and 305 nm), the adsorbate mass on the silica followed a roughly exponential trend
with respect to time during the exposure stage, suggesting first-order adsorption kinetics. The
adsorption rate constant decreased with the increasing particle size. Furthermore, we have developed a
modified Leveque equation to describe the mass transport and adsorption behavior of the
nanoparticulate dispersion inside the QCM-D chamber. The derivation involved the application of a
bipolar coordinate system to the continuity, Navier–Stokes, and convective–diffusion equations. The
adsorption rate constants calculated using the derived equation were found to match the experimental
results well. The derived equation is important not only in the field of environmental science but also in
many other fields as QCM-D is heavily used to characterize the dynamic adsorption behavior of various
types of materials including polymers, proteins, and nanoparticles.
Introduction
There are 247 nanomedicines that have been approved for use,are under clinical trials or on the verge of clinical studies,according to a recent study relying on a detailed search of theliterature, clinical trial data, and theWeb.1 Another recent studyhas reported that the global market value of nanomedicinereached $72.8 billion in 2011.2 With the increasing consump-tion, production, and number of clinical trials of nano-medicines, their occurrence and fate in the environment, andtheir potential consequences for human health have beenincreasingly recognized as issues requiring consideration.3–9
Nanomedicines are an environmental concern becauserecent in vivo studies have indicated that some administerednanomedicines can be excreted from the body intact throughthe kidneys or the liver/bile duct.10–13 For instance, Singh et al.12
dynamically tracked in vivo intravenously (iv) administered
ineering, Texas A&M University, 230 Jack
22 College Station, TX, USA. E-mail:
; Tel: +1 979 847 8766
ESI) available: Particle size distributione average adsorption rate constant,sion at different directions, and list of039/c3sm51692j
Chemistry 2013
multi-walled carbon nanotubes (having a diameter of 20–30 nmand a length of 500 nm) functionalized with diethylene-triaminepentaacetic dianhydride (DTPA-MWNT) and radio-labeled with indium-111 (111In) using a micro Single PhotonEmission Tomography scanner. Urinary excretion of DTPA-MWNT was conrmed at 24 h post-administration. He et al.10
have investigated the biodistribution and urinary excretion ofdifferent surface-modied silica nanoparticles (SiNPs) in micein situ using an in vivo optical imaging system. Their studieshave demonstrated that three types of iv-injected 45 nm silicananoparticles, including polymer (PEG)-coated ones, werepartly excreted through the renal route. Souris et al.13 havedemonstrated that administered 80 nm mesoporous silicananoparticles enter the hepatobiliary system to be excreted inthe feces within 24 h of the nanoparticle injection. In essence,these studies indicate that a fraction of the administerednanomedicine is excreted from the body through the kidneys orhepatobiliary system.11
Aer excretion, nanomedicines are expected to reach thesewer system, and then go through a waste treatment facilitybefore nding their way into receiving waters or lands throughsewage sludge. However, recent studies have shown that stan-dard wastewater treatments do not completely capture mostnanomaterials,14,15 and such nanomaterials are probablyalready distributed in the environment.15 Thus, nanomedicines
Soft Matter, 2013, 9, 10155–10164 | 10155
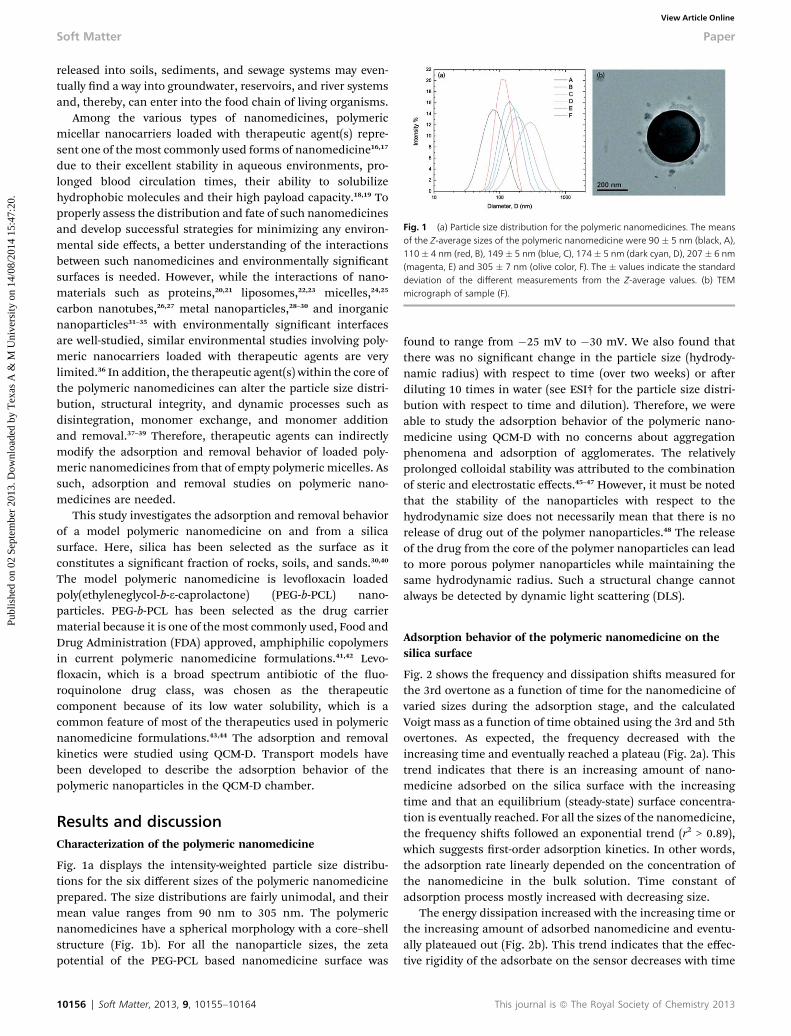
Fig. 1 (a) Particle size distribution for the polymeric nanomedicines. The meansof the Z-average sizes of the polymeric nanomedicine were 90 � 5 nm (black, A),110 � 4 nm (red, B), 149 � 5 nm (blue, C), 174 � 5 nm (dark cyan, D), 207 � 6 nm(magenta, E) and 305 � 7 nm (olive color, F). The � values indicate the standarddeviation of the different measurements from the Z-average values. (b) TEMmicrograph of sample (F).
Soft Matter Paper
Publ
ishe
d on
02
Sept
embe
r 20
13. D
ownl
oade
d by
Tex
as A
& M
Uni
vers
ity o
n 14
/08/
2014
15:
47:2
0.
View Article Online
released into soils, sediments, and sewage systems may even-tually nd a way into groundwater, reservoirs, and river systemsand, thereby, can enter into the food chain of living organisms.
Among the various types of nanomedicines, polymericmicellar nanocarriers loaded with therapeutic agent(s) repre-sent one of themost commonly used forms of nanomedicine16,17
due to their excellent stability in aqueous environments, pro-longed blood circulation times, their ability to solubilizehydrophobic molecules and their high payload capacity.18,19 Toproperly assess the distribution and fate of such nanomedicinesand develop successful strategies for minimizing any environ-mental side effects, a better understanding of the interactionsbetween such nanomedicines and environmentally signicantsurfaces is needed. However, while the interactions of nano-materials such as proteins,20,21 liposomes,22,23 micelles,24,25
carbon nanotubes,26,27 metal nanoparticles,28–30 and inorganicnanoparticles31–35 with environmentally signicant interfacesare well-studied, similar environmental studies involving poly-meric nanocarriers loaded with therapeutic agents are verylimited.36 In addition, the therapeutic agent(s) within the core ofthe polymeric nanomedicines can alter the particle size distri-bution, structural integrity, and dynamic processes such asdisintegration, monomer exchange, and monomer additionand removal.37–39 Therefore, therapeutic agents can indirectlymodify the adsorption and removal behavior of loaded poly-meric nanomedicines from that of empty polymeric micelles. Assuch, adsorption and removal studies on polymeric nano-medicines are needed.
This study investigates the adsorption and removal behaviorof a model polymeric nanomedicine on and from a silicasurface. Here, silica has been selected as the surface as itconstitutes a signicant fraction of rocks, soils, and sands.30,40
The model polymeric nanomedicine is levooxacin loadedpoly(ethyleneglycol-b-3-caprolactone) (PEG-b-PCL) nano-particles. PEG-b-PCL has been selected as the drug carriermaterial because it is one of themost commonly used, Food andDrug Administration (FDA) approved, amphiphilic copolymersin current polymeric nanomedicine formulations.41,42 Levo-oxacin, which is a broad spectrum antibiotic of the uo-roquinolone drug class, was chosen as the therapeuticcomponent because of its low water solubility, which is acommon feature of most of the therapeutics used in polymericnanomedicine formulations.43,44 The adsorption and removalkinetics were studied using QCM-D. Transport models havebeen developed to describe the adsorption behavior of thepolymeric nanoparticles in the QCM-D chamber.
Results and discussionCharacterization of the polymeric nanomedicine
Fig. 1a displays the intensity-weighted particle size distribu-tions for the six different sizes of the polymeric nanomedicineprepared. The size distributions are fairly unimodal, and theirmean value ranges from 90 nm to 305 nm. The polymericnanomedicines have a spherical morphology with a core–shellstructure (Fig. 1b). For all the nanoparticle sizes, the zetapotential of the PEG-PCL based nanomedicine surface was
10156 | Soft Matter, 2013, 9, 10155–10164
found to range from �25 mV to �30 mV. We also found thatthere was no signicant change in the particle size (hydrody-namic radius) with respect to time (over two weeks) or aerdiluting 10 times in water (see ESI† for the particle size distri-bution with respect to time and dilution). Therefore, we wereable to study the adsorption behavior of the polymeric nano-medicine using QCM-D with no concerns about aggregationphenomena and adsorption of agglomerates. The relativelyprolonged colloidal stability was attributed to the combinationof steric and electrostatic effects.45–47 However, it must be notedthat the stability of the nanoparticles with respect to thehydrodynamic size does not necessarily mean that there is norelease of drug out of the polymer nanoparticles.48 The releaseof the drug from the core of the polymer nanoparticles can leadto more porous polymer nanoparticles while maintaining thesame hydrodynamic radius. Such a structural change cannotalways be detected by dynamic light scattering (DLS).
Adsorption behavior of the polymeric nanomedicine on thesilica surface
Fig. 2 shows the frequency and dissipation shis measured forthe 3rd overtone as a function of time for the nanomedicine ofvaried sizes during the adsorption stage, and the calculatedVoigt mass as a function of time obtained using the 3rd and 5thovertones. As expected, the frequency decreased with theincreasing time and eventually reached a plateau (Fig. 2a). Thistrend indicates that there is an increasing amount of nano-medicine adsorbed on the silica surface with the increasingtime and that an equilibrium (steady-state) surface concentra-tion is eventually reached. For all the sizes of the nanomedicine,the frequency shis followed an exponential trend (r2 > 0.89),which suggests rst-order adsorption kinetics. In other words,the adsorption rate linearly depended on the concentration ofthe nanomedicine in the bulk solution. Time constant ofadsorption process mostly increased with decreasing size.
The energy dissipation increased with the increasing time orthe increasing amount of adsorbed nanomedicine and eventu-ally plateaued out (Fig. 2b). This trend indicates that the effec-tive rigidity of the adsorbate on the sensor decreases with time
This journal is ª The Royal Society of Chemistry 2013
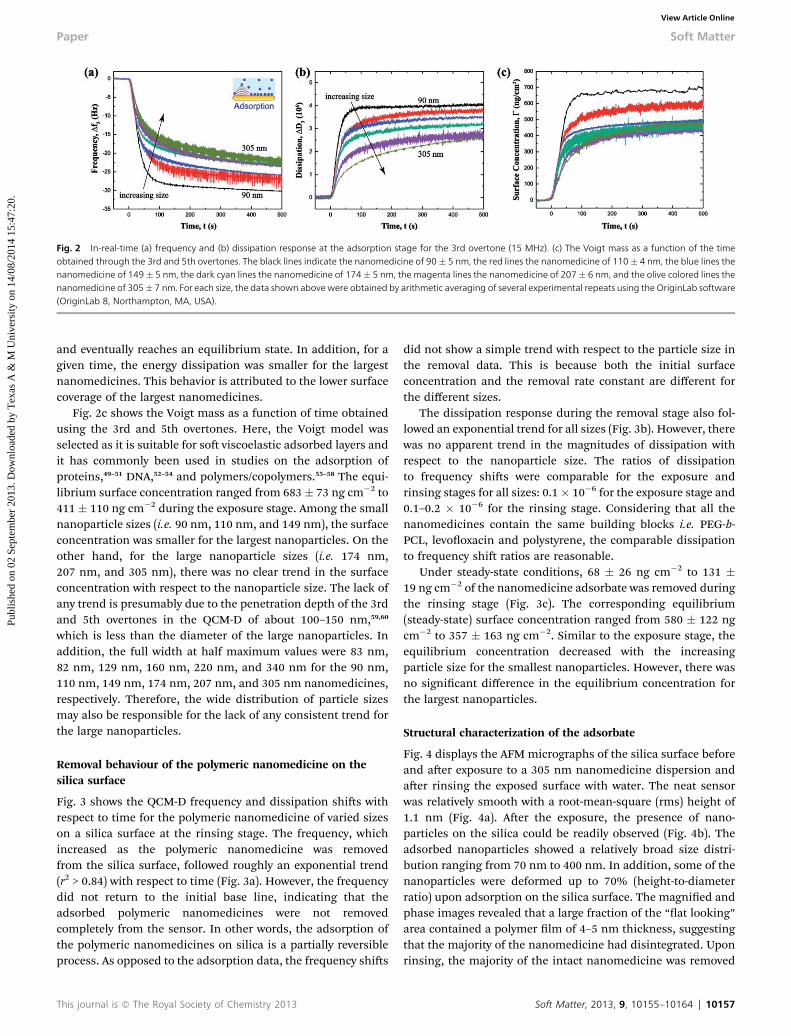
Fig. 2 In-real-time (a) frequency and (b) dissipation response at the adsorption stage for the 3rd overtone (15 MHz). (c) The Voigt mass as a function of the timeobtained through the 3rd and 5th overtones. The black lines indicate the nanomedicine of 90� 5 nm, the red lines the nanomedicine of 110� 4 nm, the blue lines thenanomedicine of 149� 5 nm, the dark cyan lines the nanomedicine of 174� 5 nm, the magenta lines the nanomedicine of 207� 6 nm, and the olive colored lines thenanomedicine of 305� 7 nm. For each size, the data shown above were obtained by arithmetic averaging of several experimental repeats using the OriginLab software(OriginLab 8, Northampton, MA, USA).
Paper Soft Matter
Publ
ishe
d on
02
Sept
embe
r 20
13. D
ownl
oade
d by
Tex
as A
& M
Uni
vers
ity o
n 14
/08/
2014
15:
47:2
0.
View Article Online
and eventually reaches an equilibrium state. In addition, for agiven time, the energy dissipation was smaller for the largestnanomedicines. This behavior is attributed to the lower surfacecoverage of the largest nanomedicines.
Fig. 2c shows the Voigt mass as a function of time obtainedusing the 3rd and 5th overtones. Here, the Voigt model wasselected as it is suitable for so viscoelastic adsorbed layers andit has commonly been used in studies on the adsorption ofproteins,49–51 DNA,52–54 and polymers/copolymers.55–58 The equi-librium surface concentration ranged from 683� 73 ng cm�2 to411 � 110 ng cm�2 during the exposure stage. Among the smallnanoparticle sizes (i.e. 90 nm, 110 nm, and 149 nm), the surfaceconcentration was smaller for the largest nanoparticles. On theother hand, for the large nanoparticle sizes (i.e. 174 nm,207 nm, and 305 nm), there was no clear trend in the surfaceconcentration with respect to the nanoparticle size. The lack ofany trend is presumably due to the penetration depth of the 3rdand 5th overtones in the QCM-D of about 100–150 nm,59,60
which is less than the diameter of the large nanoparticles. Inaddition, the full width at half maximum values were 83 nm,82 nm, 129 nm, 160 nm, 220 nm, and 340 nm for the 90 nm,110 nm, 149 nm, 174 nm, 207 nm, and 305 nm nanomedicines,respectively. Therefore, the wide distribution of particle sizesmay also be responsible for the lack of any consistent trend forthe large nanoparticles.
Removal behaviour of the polymeric nanomedicine on thesilica surface
Fig. 3 shows the QCM-D frequency and dissipation shis withrespect to time for the polymeric nanomedicine of varied sizeson a silica surface at the rinsing stage. The frequency, whichincreased as the polymeric nanomedicine was removedfrom the silica surface, followed roughly an exponential trend(r2 > 0.84) with respect to time (Fig. 3a). However, the frequencydid not return to the initial base line, indicating that theadsorbed polymeric nanomedicines were not removedcompletely from the sensor. In other words, the adsorption ofthe polymeric nanomedicines on silica is a partially reversibleprocess. As opposed to the adsorption data, the frequency shis
This journal is ª The Royal Society of Chemistry 2013
did not show a simple trend with respect to the particle size inthe removal data. This is because both the initial surfaceconcentration and the removal rate constant are different forthe different sizes.
The dissipation response during the removal stage also fol-lowed an exponential trend for all sizes (Fig. 3b). However, therewas no apparent trend in the magnitudes of dissipation withrespect to the nanoparticle size. The ratios of dissipationto frequency shis were comparable for the exposure andrinsing stages for all sizes: 0.1� 10�6 for the exposure stage and0.1–0.2 � 10�6 for the rinsing stage. Considering that all thenanomedicines contain the same building blocks i.e. PEG-b-PCL, levooxacin and polystyrene, the comparable dissipationto frequency shi ratios are reasonable.
Under steady-state conditions, 68 � 26 ng cm�2 to 131 �19 ng cm�2 of the nanomedicine adsorbate was removed duringthe rinsing stage (Fig. 3c). The corresponding equilibrium(steady-state) surface concentration ranged from 580 � 122 ngcm�2 to 357 � 163 ng cm�2. Similar to the exposure stage, theequilibrium concentration decreased with the increasingparticle size for the smallest nanoparticles. However, there wasno signicant difference in the equilibrium concentration forthe largest nanoparticles.
Structural characterization of the adsorbate
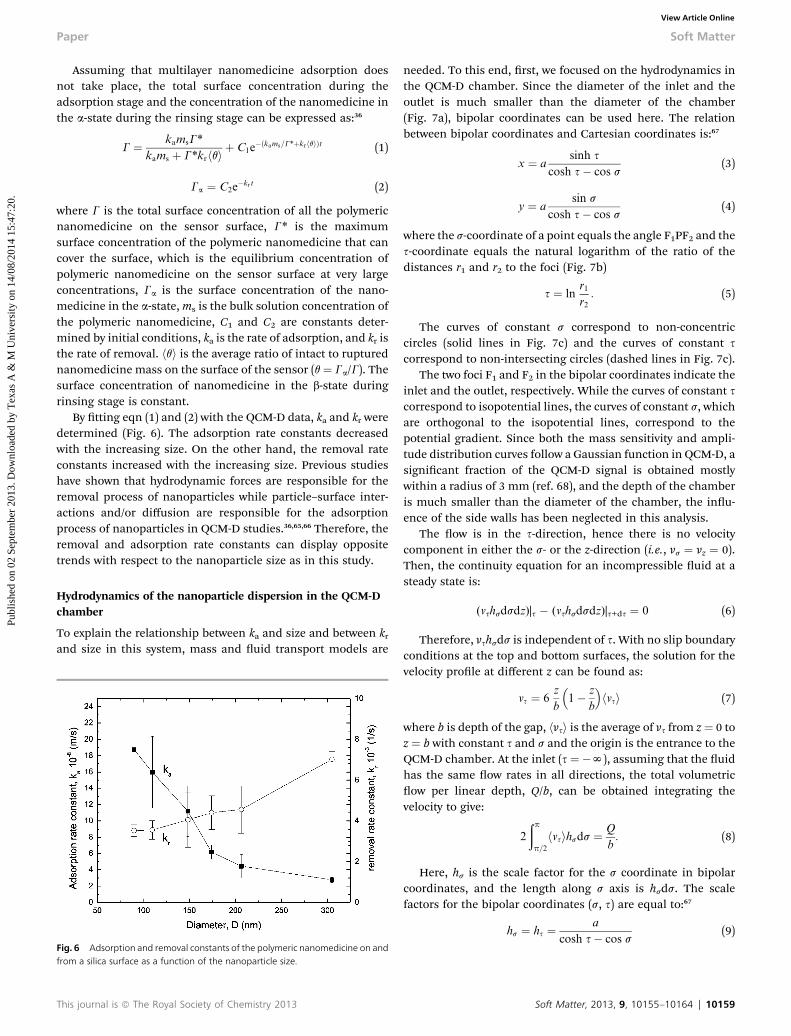
Fig. 4 displays the AFM micrographs of the silica surface beforeand aer exposure to a 305 nm nanomedicine dispersion andaer rinsing the exposed surface with water. The neat sensorwas relatively smooth with a root-mean-square (rms) height of1.1 nm (Fig. 4a). Aer the exposure, the presence of nano-particles on the silica could be readily observed (Fig. 4b). Theadsorbed nanoparticles showed a relatively broad size distri-bution ranging from 70 nm to 400 nm. In addition, some of thenanoparticles were deformed up to 70% (height-to-diameterratio) upon adsorption on the silica surface. The magnied andphase images revealed that a large fraction of the “at looking”area contained a polymer lm of 4–5 nm thickness, suggestingthat the majority of the nanomedicine had disintegrated. Uponrinsing, the majority of the intact nanomedicine was removed
Soft Matter, 2013, 9, 10155–10164 | 10157
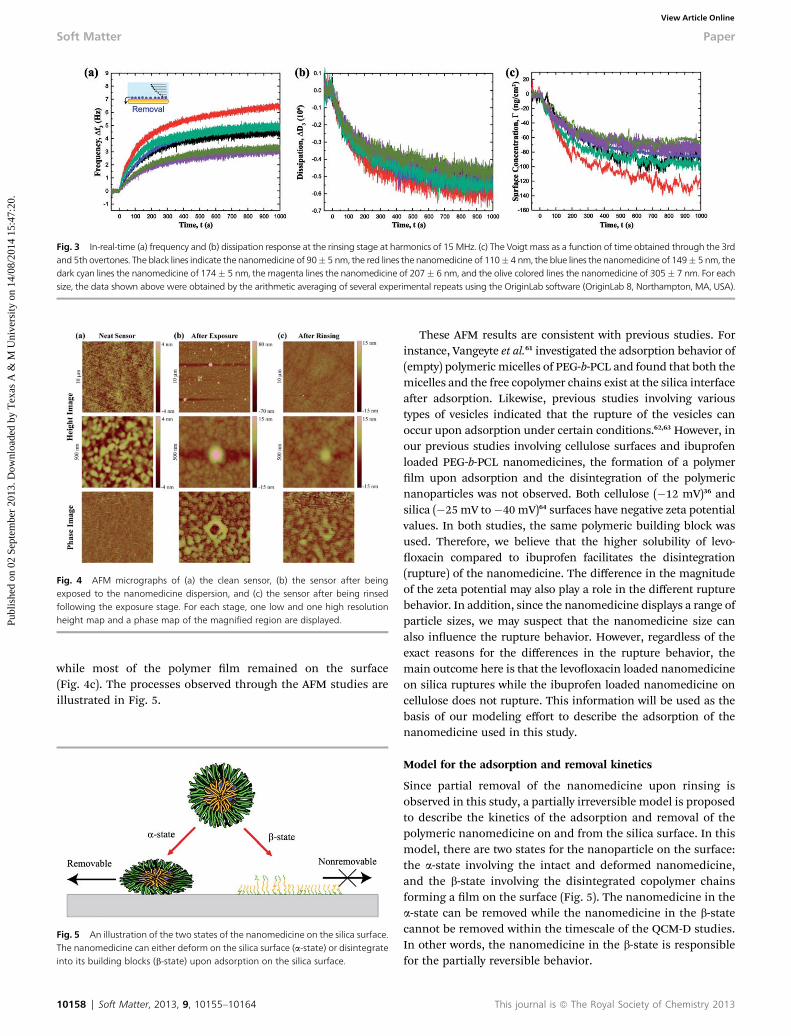
Fig. 3 In-real-time (a) frequency and (b) dissipation response at the rinsing stage at harmonics of 15 MHz. (c) The Voigt mass as a function of time obtained through the 3rdand 5th overtones. The black lines indicate the nanomedicine of 90� 5 nm, the red lines the nanomedicine of 110� 4 nm, the blue lines the nanomedicine of 149� 5 nm, thedark cyan lines the nanomedicine of 174� 5 nm, the magenta lines the nanomedicine of 207� 6 nm, and the olive colored lines the nanomedicine of 305� 7 nm. For eachsize, the data shown above were obtained by the arithmetic averaging of several experimental repeats using the OriginLab software (OriginLab 8, Northampton, MA, USA).
Fig. 4 AFM micrographs of (a) the clean sensor, (b) the sensor after beingexposed to the nanomedicine dispersion, and (c) the sensor after being rinsedfollowing the exposure stage. For each stage, one low and one high resolutionheight map and a phase map of the magnified region are displayed.
Soft Matter Paper
Publ
ishe
d on
02
Sept
embe
r 20
13. D
ownl
oade
d by
Tex
as A
& M
Uni
vers
ity o
n 14
/08/
2014
15:
47:2
0.
View Article Online
while most of the polymer lm remained on the surface(Fig. 4c). The processes observed through the AFM studies areillustrated in Fig. 5.
Fig. 5 An illustration of the two states of the nanomedicine on the silica surface.The nanomedicine can either deform on the silica surface (a-state) or disintegrateinto its building blocks (b-state) upon adsorption on the silica surface.
10158 | Soft Matter, 2013, 9, 10155–10164
These AFM results are consistent with previous studies. Forinstance, Vangeyte et al.61 investigated the adsorption behavior of(empty) polymeric micelles of PEG-b-PCL and found that both themicelles and the free copolymer chains exist at the silica interfaceaer adsorption. Likewise, previous studies involving varioustypes of vesicles indicated that the rupture of the vesicles canoccur upon adsorption under certain conditions.62,63 However, inour previous studies involving cellulose surfaces and ibuprofenloaded PEG-b-PCL nanomedicines, the formation of a polymerlm upon adsorption and the disintegration of the polymericnanoparticles was not observed. Both cellulose (�12 mV)36 andsilica (�25mV to�40 mV)64 surfaces have negative zeta potentialvalues. In both studies, the same polymeric building block wasused. Therefore, we believe that the higher solubility of levo-oxacin compared to ibuprofen facilitates the disintegration(rupture) of the nanomedicine. The difference in the magnitudeof the zeta potential may also play a role in the different rupturebehavior. In addition, since the nanomedicine displays a range ofparticle sizes, we may suspect that the nanomedicine size canalso inuence the rupture behavior. However, regardless of theexact reasons for the differences in the rupture behavior, themain outcome here is that the levooxacin loaded nanomedicineon silica ruptures while the ibuprofen loaded nanomedicine oncellulose does not rupture. This information will be used as thebasis of our modeling effort to describe the adsorption of thenanomedicine used in this study.
Model for the adsorption and removal kinetics
Since partial removal of the nanomedicine upon rinsing isobserved in this study, a partially irreversible model is proposedto describe the kinetics of the adsorption and removal of thepolymeric nanomedicine on and from the silica surface. In thismodel, there are two states for the nanoparticle on the surface:the a-state involving the intact and deformed nanomedicine,and the b-state involving the disintegrated copolymer chainsforming a lm on the surface (Fig. 5). The nanomedicine in thea-state can be removed while the nanomedicine in the b-statecannot be removed within the timescale of the QCM-D studies.In other words, the nanomedicine in the b-state is responsiblefor the partially reversible behavior.
This journal is ª The Royal Society of Chemistry 2013
Paper Soft Matter
Publ
ishe
d on
02
Sept
embe
r 20
13. D
ownl
oade
d by
Tex
as A
& M
Uni
vers
ity o
n 14
/08/
2014
15:
47:2
0.
View Article Online
Assuming that multilayer nanomedicine adsorption doesnot take place, the total surface concentration during theadsorption stage and the concentration of the nanomedicine inthe a-state during the rinsing stage can be expressed as:36
G ¼ kamsG*
kams þ G*krhqi þ C1e�ðkams=G*þkrhqiÞt (1)
Ga ¼ C2e�krt (2)
where G is the total surface concentration of all the polymericnanomedicine on the sensor surface, G* is the maximumsurface concentration of the polymeric nanomedicine that cancover the surface, which is the equilibrium concentration ofpolymeric nanomedicine on the sensor surface at very largeconcentrations, Ga is the surface concentration of the nano-medicine in the a-state,ms is the bulk solution concentration ofthe polymeric nanomedicine, C1 and C2 are constants deter-mined by initial conditions, ka is the rate of adsorption, and kr isthe rate of removal. hqi is the average ratio of intact to rupturednanomedicine mass on the surface of the sensor (q¼ Ga/G). Thesurface concentration of nanomedicine in the b-state duringrinsing stage is constant.
By tting eqn (1) and (2) with the QCM-D data, ka and kr weredetermined (Fig. 6). The adsorption rate constants decreasedwith the increasing size. On the other hand, the removal rateconstants increased with the increasing size. Previous studieshave shown that hydrodynamic forces are responsible for theremoval process of nanoparticles while particle–surface inter-actions and/or diffusion are responsible for the adsorptionprocess of nanoparticles in QCM-D studies.36,65,66 Therefore, theremoval and adsorption rate constants can display oppositetrends with respect to the nanoparticle size as in this study.
Hydrodynamics of the nanoparticle dispersion in the QCM-Dchamber
To explain the relationship between ka and size and between krand size in this system, mass and uid transport models are
Fig. 6 Adsorption and removal constants of the polymeric nanomedicine on andfrom a silica surface as a function of the nanoparticle size.
This journal is ª The Royal Society of Chemistry 2013
needed. To this end, rst, we focused on the hydrodynamics inthe QCM-D chamber. Since the diameter of the inlet and theoutlet is much smaller than the diameter of the chamber(Fig. 7a), bipolar coordinates can be used here. The relationbetween bipolar coordinates and Cartesian coordinates is:67
x ¼ asinh s
cosh s� cos s(3)
y ¼ asin s
cosh s� cos s(4)
where the s-coordinate of a point equals the angle F1PF2 and thes-coordinate equals the natural logarithm of the ratio of thedistances r1 and r2 to the foci (Fig. 7b)
s ¼ lnr1
r2: (5)
The curves of constant s correspond to non-concentriccircles (solid lines in Fig. 7c) and the curves of constant scorrespond to non-intersecting circles (dashed lines in Fig. 7c).
The two foci F1 and F2 in the bipolar coordinates indicate theinlet and the outlet, respectively. While the curves of constant scorrespond to isopotential lines, the curves of constant s, whichare orthogonal to the isopotential lines, correspond to thepotential gradient. Since both the mass sensitivity and ampli-tude distribution curves follow a Gaussian function in QCM-D, asignicant fraction of the QCM-D signal is obtained mostlywithin a radius of 3 mm (ref. 68), and the depth of the chamberis much smaller than the diameter of the chamber, the inu-ence of the side walls has been neglected in this analysis.
The ow is in the s-direction, hence there is no velocitycomponent in either the s- or the z-direction (i.e., vs ¼ vz ¼ 0).Then, the continuity equation for an incompressible uid at asteady state is:
(vshsdsdz)|s � (vshsdsdz)|s+ds ¼ 0 (6)
Therefore, vshsds is independent of s. With no slip boundaryconditions at the top and bottom surfaces, the solution for thevelocity prole at different z can be found as:
vs ¼ 6z
b
�1� z
b
�hvsi (7)
where b is depth of the gap, hvsi is the average of vs from z¼ 0 toz ¼ b with constant s and s and the origin is the entrance to theQCM-D chamber. At the inlet (s ¼ �N), assuming that the uidhas the same ow rates in all directions, the total volumetricow per linear depth, Q/b, can be obtained integrating thevelocity to give:
2
ðpp=2
hvsihsds ¼ Q
b: (8)
Here, hs is the scale factor for the s coordinate in bipolarcoordinates, and the length along s axis is hsds. The scalefactors for the bipolar coordinates (s, s) are equal to:67
hs ¼ hs ¼ a
cosh s� cos s(9)
Soft Matter, 2013, 9, 10155–10164 | 10159
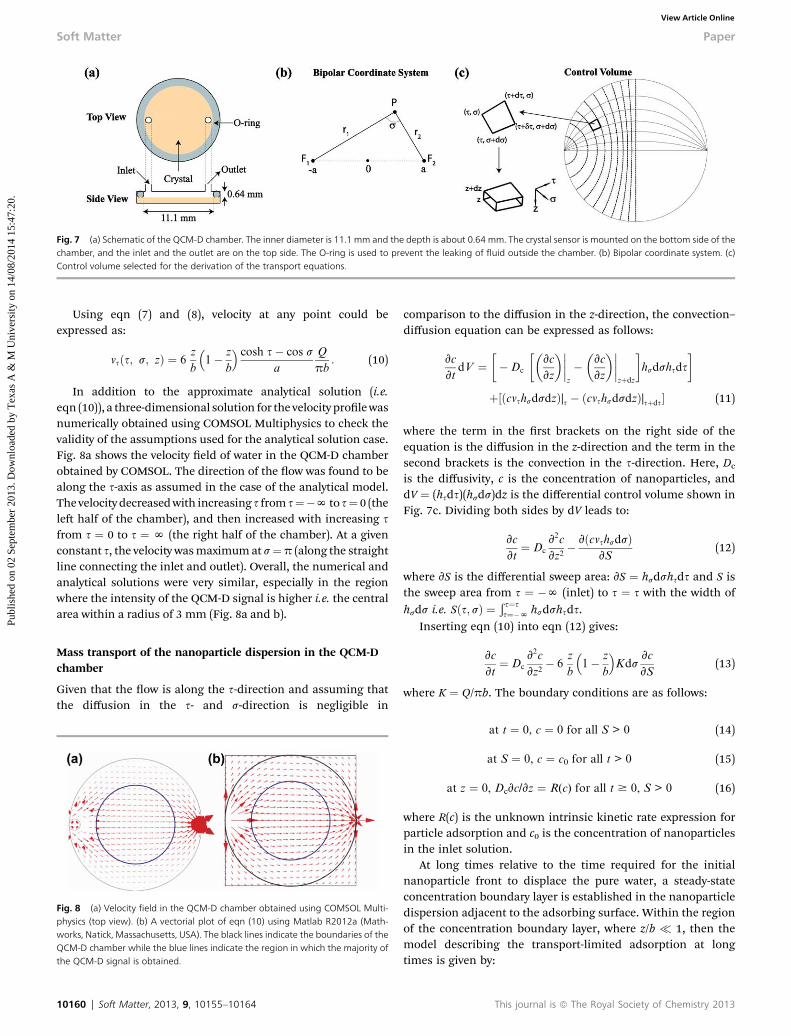
Fig. 7 (a) Schematic of the QCM-D chamber. The inner diameter is 11.1 mm and the depth is about 0.64 mm. The crystal sensor is mounted on the bottom side of thechamber, and the inlet and the outlet are on the top side. The O-ring is used to prevent the leaking of fluid outside the chamber. (b) Bipolar coordinate system. (c)Control volume selected for the derivation of the transport equations.
Soft Matter Paper
Publ
ishe
d on
02
Sept
embe
r 20
13. D
ownl
oade
d by
Tex
as A
& M
Uni
vers
ity o
n 14
/08/
2014
15:
47:2
0.
View Article Online
Using eqn (7) and (8), velocity at any point could beexpressed as:
vsðs; s; zÞ ¼ 6z
b
�1� z
b
� cosh s� cos s
a
Q
pb: (10)
In addition to the approximate analytical solution (i.e.eqn (10)), a three-dimensional solution for the velocity prolewasnumerically obtained using COMSOL Multiphysics to check thevalidity of the assumptions used for the analytical solution case.Fig. 8a shows the velocity eld of water in the QCM-D chamberobtained by COMSOL. The direction of the ow was found to bealong the s-axis as assumed in the case of the analytical model.The velocity decreasedwith increasing s from s¼�N to s¼ 0 (thele half of the chamber), and then increased with increasing sfrom s ¼ 0 to s ¼ N (the right half of the chamber). At a givenconstant s, the velocity wasmaximumat s¼p (along the straightline connecting the inlet and outlet). Overall, the numerical andanalytical solutions were very similar, especially in the regionwhere the intensity of the QCM-D signal is higher i.e. the centralarea within a radius of 3 mm (Fig. 8a and b).
Mass transport of the nanoparticle dispersion in the QCM-Dchamber
Given that the ow is along the s-direction and assuming thatthe diffusion in the s- and s-direction is negligible in
Fig. 8 (a) Velocity field in the QCM-D chamber obtained using COMSOL Multi-physics (top view). (b) A vectorial plot of eqn (10) using Matlab R2012a (Math-works, Natick, Massachusetts, USA). The black lines indicate the boundaries of theQCM-D chamber while the blue lines indicate the region in which the majority ofthe QCM-D signal is obtained.
10160 | Soft Matter, 2013, 9, 10155–10164
comparison to the diffusion in the z-direction, the convection–diffusion equation can be expressed as follows:
vc
vtdV ¼
��Dc
��vc
vz
�����z
��vc
vz
�����zþdz
�hsdshsds
�
þ½ðcvshsdsdzÞ|s � ðcvshsdsdzÞ|sþds� (11)
where the term in the rst brackets on the right side of theequation is the diffusion in the z-direction and the term in thesecond brackets is the convection in the s-direction. Here, Dc
is the diffusivity, c is the concentration of nanoparticles, anddV ¼ (hsds)(hsds)dz is the differential control volume shown inFig. 7c. Dividing both sides by dV leads to:
vc
vt¼ Dc
v2c
vz2� vðcvshsdsÞ
vS(12)
where vS is the differential sweep area: vS ¼ hsdshsds and S isthe sweep area from s ¼ �N (inlet) to s ¼ s with the width ofhsds i.e. Sðs; sÞ ¼ Ð s¼s
s¼�N hsdshsds.Inserting eqn (10) into eqn (12) gives:
vc
vt¼ Dc
v2c
vz2� 6
z
b
�1� z
b
�Kds
vc
vS(13)
where K ¼ Q/pb. The boundary conditions are as follows:
at t ¼ 0, c ¼ 0 for all S > 0 (14)
at S ¼ 0, c ¼ c0 for all t > 0 (15)
at z ¼ 0, Dcvc/vz ¼ R(c) for all t $ 0, S > 0 (16)
where R(c) is the unknown intrinsic kinetic rate expression forparticle adsorption and c0 is the concentration of nanoparticlesin the inlet solution.
At long times relative to the time required for the initialnanoparticle front to displace the pure water, a steady-stateconcentration boundary layer is established in the nanoparticledispersion adjacent to the adsorbing surface. Within the regionof the concentration boundary layer, where z/b � 1, then themodel describing the transport-limited adsorption at longtimes is given by:
This journal is ª The Royal Society of Chemistry 2013
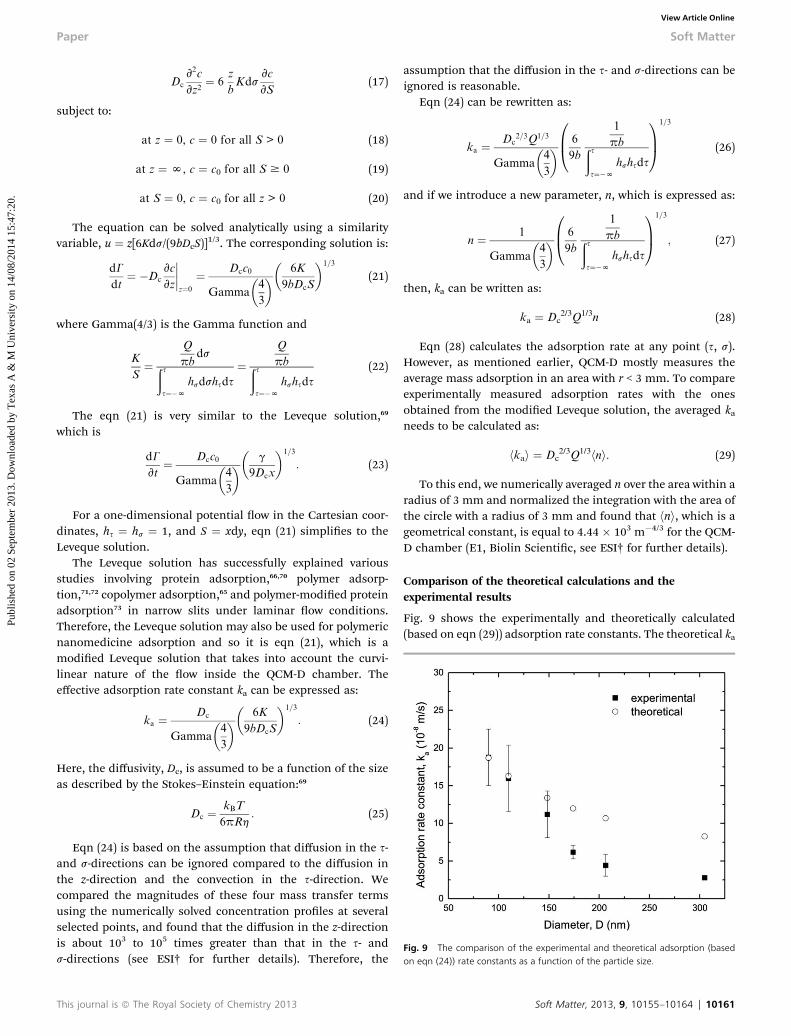
Fig. 9 The comparison of the experimental and theoretical adsorption (basedon eqn (24)) rate constants as a function of the particle size.
Paper Soft Matter
Publ
ishe
d on
02
Sept
embe
r 20
13. D
ownl
oade
d by
Tex
as A
& M
Uni
vers
ity o
n 14
/08/
2014
15:
47:2
0.
View Article Online
Dc
v2c
vz2¼ 6
z
bKds
vc
vS(17)
subject to:
at z ¼ 0, c ¼ 0 for all S > 0 (18)
at z ¼ N, c ¼ c0 for all S $ 0 (19)
at S ¼ 0, c ¼ c0 for all z > 0 (20)
The equation can be solved analytically using a similarityvariable, u ¼ z[6Kds/(9bDcS)]
1/3. The corresponding solution is:
dG
dt¼ �Dc
vc
vz
����z¼0
¼ Dcc0
Gamma4
3
� ��
6K
9bDcS
�1=3
(21)
where Gamma(4/3) is the Gamma function and
K
S¼
Q
pbdsðs
s¼�N
hsdshsds¼
Q
pbðss¼�N
hshsds(22)
The eqn (21) is very similar to the Leveque solution,69
which is
dG
vt¼ Dcc0
Gamma4
3
� ��
g
9Dcx
�1=3
: (23)
For a one-dimensional potential ow in the Cartesian coor-dinates, hs ¼ hs ¼ 1, and S ¼ xdy, eqn (21) simplies to theLeveque solution.
The Leveque solution has successfully explained variousstudies involving protein adsorption,66,70 polymer adsorp-tion,71,72 copolymer adsorption,65 and polymer-modied proteinadsorption73 in narrow slits under laminar ow conditions.Therefore, the Leveque solution may also be used for polymericnanomedicine adsorption and so it is eqn (21), which is amodied Leveque solution that takes into account the curvi-linear nature of the ow inside the QCM-D chamber. Theeffective adsorption rate constant ka can be expressed as:
ka ¼ Dc
Gamma4
3
� ��
6K
9bDcS
�1=3
: (24)
Here, the diffusivity, Dc, is assumed to be a function of the sizeas described by the Stokes–Einstein equation:69
Dc ¼ kBT
6pRh: (25)
Eqn (24) is based on the assumption that diffusion in the s-and s-directions can be ignored compared to the diffusion inthe z-direction and the convection in the s-direction. Wecompared the magnitudes of these four mass transfer termsusing the numerically solved concentration proles at severalselected points, and found that the diffusion in the z-directionis about 103 to 105 times greater than that in the s- ands-directions (see ESI† for further details). Therefore, the
This journal is ª The Royal Society of Chemistry 2013
assumption that the diffusion in the s- and s-directions can beignored is reasonable.
Eqn (24) can be rewritten as:
ka ¼ Dc2=3Q1=3
Gamma4
3
� �0B@ 6
9b
1
pbðss¼�N
hshsds
1CA
1=3
(26)
and if we introduce a new parameter, n, which is expressed as:
n ¼ 1
Gamma4
3
� �0B@ 6
9b
1
pbðss¼�N
hshsds
1CA
1=3
; (27)
then, ka can be written as:
ka ¼ Dc2/3Q1/3n (28)
Eqn (28) calculates the adsorption rate at any point (s, s).However, as mentioned earlier, QCM-D mostly measures theaverage mass adsorption in an area with r < 3 mm. To compareexperimentally measured adsorption rates with the onesobtained from the modied Leveque solution, the averaged kaneeds to be calculated as:
hkai ¼ Dc2/3Q1/3hni. (29)
To this end, we numerically averaged n over the area within aradius of 3 mm and normalized the integration with the area ofthe circle with a radius of 3 mm and found that hni, which is ageometrical constant, is equal to 4.44 � 103 m�4/3 for the QCM-D chamber (E1, Biolin Scientic, see ESI† for further details).
Comparison of the theoretical calculations and theexperimental results
Fig. 9 shows the experimentally and theoretically calculated(based on eqn (29)) adsorption rate constants. The theoretical ka
Soft Matter, 2013, 9, 10155–10164 | 10161
Soft Matter Paper
Publ
ishe
d on
02
Sept
embe
r 20
13. D
ownl
oade
d by
Tex
as A
& M
Uni
vers
ity o
n 14
/08/
2014
15:
47:2
0.
View Article Online
matched the experimental ka both in trend and magnitude, inparticular for particles smaller than 150 nm. The small differ-ence between the theoretical and the experimental ka values forlarger particles (D > 150 nm) could be due to several factors.First, the inuence of gravitational forces may become impor-tant as the particles get larger.48,74 Therefore, we carried outadditional experiments where the QCM-D experiments wereconducted aer changing the orientation of the chamberupside-down. We found that there was no signicant differencein the adsorption behavior, thereby concluding that the gravi-tational forces are not responsible for the above mentioneddifferences for larger particles. Second, the particles have a sizedistribution (Fig. 1) as opposed to the single uniform size usedin the theoretical model. As discussed earlier, the fact that thesize distribution is wider for larger nanoparticles can also beresponsible for the lack of any consistent trend for the largernanoparticles. Third, the penetration depths of the 3rd and 5thovertones in the QCM-D is about 100–150 nm.59,60 In otherwords, the decaying oscillatory waves only partially sense themass of the particles above this range and underestimatethe experimentally measured rate constants.
Regarding the removal rate constant, kr, it was shown in Fig. 6that kr increases with the increasing particle size. If particleremoval is governed by diffusion or desorption, the removal rateconstant would decrease with the particle size since the diffusioncoefficient decreases with the particle size and the desorptionenergy barrier increases with the particle size.69,75 Hence, thenanomedicines were not removed through diffusion or desorp-tion; and were mostly likely to be removed by the hydrodynamicforces acting parallel to the surfaces.36,76–78 Hydrodynamic forcesare proportional to the uid viscosity, particle size, and uidvelocity at the middle of the particle. Considering that the uidvelocity at themiddle of the particle increases with the increasingparticle size for no slip boundary or partial slip boundaryconditions, it is reasonable that the removal rate constantsincrease as the particle size increases.
To better understand the adsorption and removal behaviorof materials and to determine whether the diffusion or phys-isorption reactions are controlling the adsorption process in theQCM-D chamber, accurate transport models describing thehydrodynamics and mass transport of the material of interestare needed. In this study, we have developed such a model thatcan be used for the analysis of diffusion-limited adsorption
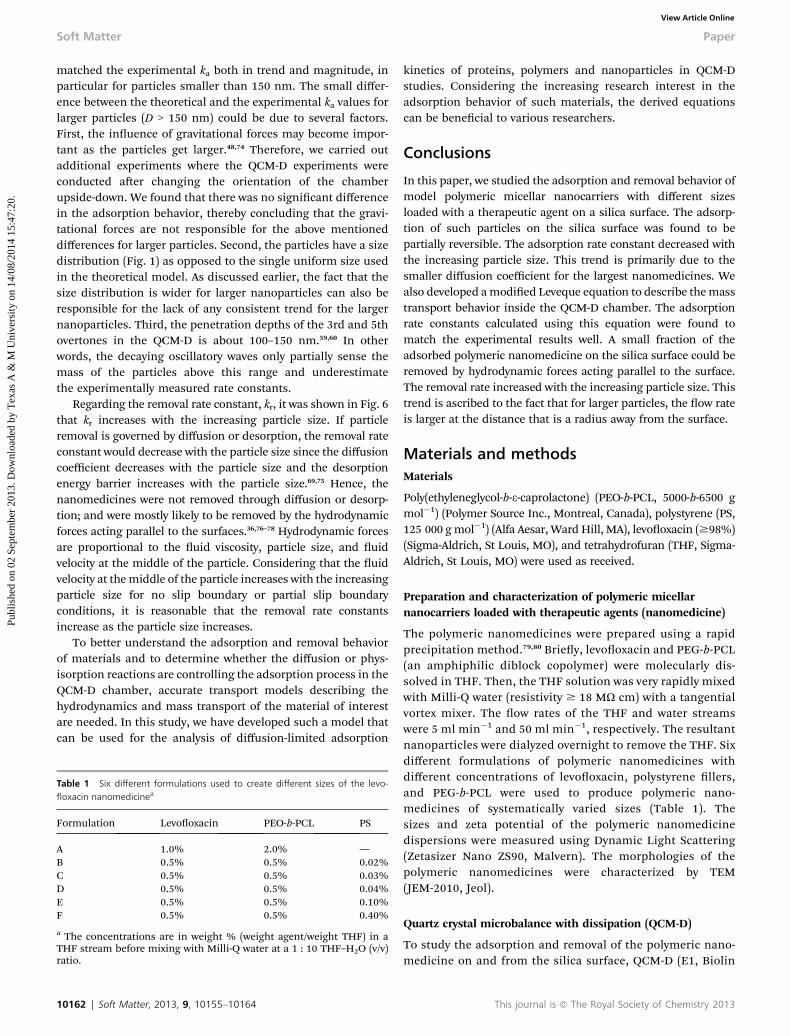
Table 1 Six different formulations used to create different sizes of the levo-floxacin nanomedicinea
Formulation Levooxacin PEO-b-PCL PS
A 1.0% 2.0% —B 0.5% 0.5% 0.02%C 0.5% 0.5% 0.03%D 0.5% 0.5% 0.04%E 0.5% 0.5% 0.10%F 0.5% 0.5% 0.40%
a The concentrations are in weight % (weight agent/weight THF) in aTHF stream before mixing with Milli-Q water at a 1 : 10 THF–H2O (v/v)ratio.
10162 | Soft Matter, 2013, 9, 10155–10164
kinetics of proteins, polymers and nanoparticles in QCM-Dstudies. Considering the increasing research interest in theadsorption behavior of such materials, the derived equationscan be benecial to various researchers.
Conclusions
In this paper, we studied the adsorption and removal behavior ofmodel polymeric micellar nanocarriers with different sizesloaded with a therapeutic agent on a silica surface. The adsorp-tion of such particles on the silica surface was found to bepartially reversible. The adsorption rate constant decreased withthe increasing particle size. This trend is primarily due to thesmaller diffusion coefficient for the largest nanomedicines. Wealso developed amodied Leveque equation to describe themasstransport behavior inside the QCM-D chamber. The adsorptionrate constants calculated using this equation were found tomatch the experimental results well. A small fraction of theadsorbed polymeric nanomedicine on the silica surface could beremoved by hydrodynamic forces acting parallel to the surface.The removal rate increased with the increasing particle size. Thistrend is ascribed to the fact that for larger particles, the ow rateis larger at the distance that is a radius away from the surface.
Materials and methodsMaterials
Poly(ethyleneglycol-b-3-caprolactone) (PEO-b-PCL, 5000-b-6500 gmol�1) (Polymer Source Inc., Montreal, Canada), polystyrene (PS,125 000 gmol�1) (Alfa Aesar, Ward Hill, MA), levooxacin ($98%)(Sigma-Aldrich, St Louis, MO), and tetrahydrofuran (THF, Sigma-Aldrich, St Louis, MO) were used as received.
Preparation and characterization of polymeric micellarnanocarriers loaded with therapeutic agents (nanomedicine)
The polymeric nanomedicines were prepared using a rapidprecipitation method.79,80 Briey, levooxacin and PEG-b-PCL(an amphiphilic diblock copolymer) were molecularly dis-solved in THF. Then, the THF solution was very rapidly mixedwith Milli-Q water (resistivity $ 18 MU cm) with a tangentialvortex mixer. The ow rates of the THF and water streamswere 5 ml min�1 and 50 ml min�1, respectively. The resultantnanoparticles were dialyzed overnight to remove the THF. Sixdifferent formulations of polymeric nanomedicines withdifferent concentrations of levooxacin, polystyrene llers,and PEG-b-PCL were used to produce polymeric nano-medicines of systematically varied sizes (Table 1). Thesizes and zeta potential of the polymeric nanomedicinedispersions were measured using Dynamic Light Scattering(Zetasizer Nano ZS90, Malvern). The morphologies of thepolymeric nanomedicines were characterized by TEM(JEM-2010, Jeol).
Quartz crystal microbalance with dissipation (QCM-D)
To study the adsorption and removal of the polymeric nano-medicine on and from the silica surface, QCM-D (E1, Biolin
This journal is ª The Royal Society of Chemistry 2013
Paper Soft Matter
Publ
ishe
d on
02
Sept
embe
r 20
13. D
ownl
oade
d by
Tex
as A
& M
Uni
vers
ity o
n 14
/08/
2014
15:
47:2
0.
View Article Online
Scientic) and a silica-coated QCM sensor (QSX 303, BiolinScientic) were used. The sensor crystal and the O-ring thatseals the cell–sensor assembly were cleaned as described byHook et al.81 Aer cleaning and mounting the QCM-D, a Milli-Q (18.2 MU cm @ 25 �C) solution was injected into thechamber, and the system was allowed to equilibrate for atleast 0.5 h and then, a base line was obtained. Aerwards, theMilli-Q water was replaced with the polymeric nanomedicinedispersion to measure the dynamics of the polymeric nano-medicine adsorption on the silica surface (exposure stage).Finally, the polymeric nanomedicine solution was replacedwith Milli-Q water to study the desorption and removalbehavior of the nanomedicine from the surface (rinsingstage). In all the experiments, the concentration of the poly-meric nanomedicine solution and the ow rates were keptconstant at 0.5 mg ml�1 and 2.5 ml s�1, respectively. Allmeasurements were performed at a temperature of 25 �C andat several overtone numbers (n ¼ 3, 5, 7, 9, 11, and 13). Eachexperiment was repeated at least three times for each nano-medicine size (formulation).
The recorded frequency, Df, and dissipation, DD, curves wereevaluated with the QTools soware (Biolin Scientic). Theadsorbed nanomedicine mass on the silica sensor was obtainedby applying the Voigt model to Df and DD measured at twoovertones (3rd and 5th).81,82 The xed parameters were thesolvent density, set to 1000 kg m�3, and the solvent viscosity, setto 0.009 Pa s. This calculation gave rise to the viscoelastic loadon the sensor, i.e., the Voigt mass, which is due both to theadsorbed nanomedicine and the water.22
Atomic Force Microscopy (AFM)
AFM measurements were collected aer the adsorption equi-librium and rinsing using a Dimension Icon AFM microscope(Bruker, Santa Barbara, CA). The AFM measurements wereconducted using a tip radius of less than 10 nm. Measurementswere performed at 0� scan angle at a x scan rate of 1 Hz. Allscans were done in tapping mode.
Computational analysis of the ow behavior
The simulation model described in this paper was constructedusing COMSOL Multiphysics v4.2a. The analysis consisted of 3-Dlaminar ow in the steady state and the QCM-D geometry isshown in Fig. 6a. The diameter of the chamber was 11.1 mm andthe depth was 0.64 mm. The inlet and outlet were 1 mm indiameter and 1 mm in height, and their center points [x, y] werelocated at [�5, 0] (in mm) and [5, 0] (in mm), respectively. Theuid was water and the temperature was 298.15 K. The chamberwas dividedwith a physics-controlledmesh of normal size. No slipboundary conditions were used in the simulation. At the inlet,uniform velocity distribution was 3.18 � 10�3 m s�1, which wasobtained by taking the ratio of the ow rate over the inlet area.
Acknowledgements
This material is based upon work supported by the NationalScience Foundation under Grant no. 1236532.
This journal is ª The Royal Society of Chemistry 2013
References
1 M. L. Etheridge, S. A. Campbell, A. G. Erdman, C. L. Haynes,S. M. Wolf and J. McCullough, Nanomed.: Nanotechnol., Biol.Med., 2013, 9, 1–14.
2 I. Mahapatra, J. Clark, P. J. Dobson, R. Owen and J. R. Lead,Environ. Sci.: Processes Impacts, 2013, 15, 123–144.
3 A. Maynard, D. Bowman and G. Hodge, Nat. Mater., 2011, 10,554–557.
4 V. L. Colvin, Nat. Biotechnol., 2003, 21, 1166–1170.5 S. J. Klaine, P. J. J. Alvarez, G. E. Batley, T. F. Fernandes,R. D. Handy, D. Y. Lyon, S. Mahendra, M. J. McLaughlinand J. R. Lead, Environ. Toxicol. Chem., 2008, 27, 1825–1851.
6 M. R. Wiesner, G. V. Lowry, K. L. Jones, M. F. Hochella,R. T. Di Giulio, E. Casman and E. S. Bernhardt, Environ.Sci. Technol., 2009, 43, 6458–6462.
7 P. J. A. Borm and D. Muller-Schulte, Nanomedicine, 2006, 1,235–249.
8 H. Kim, A. A. Abdala and C. W. Macosko, Macromolecules,2010, 43, 6515–6530.
9 V. S. W. Chan, Regul. Toxicol. Pharmacol., 2006, 46, 218–224.10 X. He, H. Nie, K. Wang, W. Tan, X. Wu and P. Zhang, Anal.
Chem., 2008, 80, 9597–9603.11 M. Longmire, P. L. Choyke and H. Kobayashi, Nanomedicine,
2008, 3, 703–717.12 R. Singh, D. Pantarotto, L. Lacerda, G. Pastorin, C. Klumpp,
M. Prato, A. Bianco and K. Kostarelos, Proc. Natl. Acad. Sci.U. S. A., 2006, 103, 3357–3362.
13 J. S. Souris, C.-H. Lee, S.-H. Cheng, C.-T. Chen, C.-S. Yang,J.-a. A. Ho, C.-Y. Mou and L.-W. Lo, Biomaterials, 2010, 31,5564–5574.
14 L. Reijnders, J. Clean. Prod., 2006, 14, 124–133.15 M. A. Kiser, P. Westerhoff, T. Benn, Y. Wang, J. Perez-Rivera
and K. Hristovski, Environ. Sci. Technol., 2009, 43, 6757–6763.
16 J. H. Park, S. Lee, J. H. Kim, K. Park, K. Kim and I. C. Kwon,Prog. Polym. Sci., 2008, 33, 113–137.
17 P. K. Dhal, S. C. Polomoscanik, L. Z. Avila, S. R. Holmes-Farley and R. J. Miller, Adv. Drug Delivery Rev., 2009, 61,1121–1130.
18 A. Rosler, G. W. M. Vandermeulen and H. A. Klok, Adv. DrugDelivery Rev., 2012, 64, 270–279.
19 O. C. Farokhzad and R. Langer, ACS Nano, 2009, 3, 16–20.20 J. E. Tomaszewski, R. P. Schwarzenbach and M. Sander,
Environ. Sci. Technol., 2011, 45, 6003–6010.21 R. M. Flynn, X. Y. Yang, T. Hofmann and F. von der Kammer,
Environ. Sci. Technol., 2012, 46, 2583–2591.22 E. Reimhult, M. Zach, F. Hook and B. Kasemo, Langmuir,
2006, 22, 3313–3319.23 J. J. R. Stalgren, P. M. Claesson and T. Warnheim, Adv.
Colloid Interface Sci., 2001, 89, 383–394.24 M. Davezza, D. Fabbri, E. Pramauro and A. B. Prevot, Environ.
Sci. Pollut. Res., 2013, 20, 3224–3231.25 Z. Grenoble and S. Baldelli, J. Phys. Chem. B, 2013, 117, 259–
272.26 N. B. Saleh, L. D. Pfefferle and M. Elimelech, Environ. Sci.
Technol., 2008, 42, 7963–7969.
Soft Matter, 2013, 9, 10155–10164 | 10163
Soft Matter Paper
Publ
ishe
d on
02
Sept
embe
r 20
13. D
ownl
oade
d by
Tex
as A
& M
Uni
vers
ity o
n 14
/08/
2014
15:
47:2
0.
View Article Online
27 D. P. Jaisi and M. Elimelech, Environ. Sci. Technol., 2009, 43,9161–9166.
28 K. Kim, H. Ryoo and K. S. Shin, Langmuir, 2010, 26, 10827–10832.
29 C. Levard, E. M. Hotze, G. V. Lowry and G. E. Brown, Environ.Sci. Technol., 2012, 46, 6900–6914.
30 K. M. Sirk, N. B. Saleh, T. Phenrat, H. J. Kim, B. Dufour, J. Ok,P. L. Golas, K. Matyjaszewski, G. V. Lowry and R. D. Tilton,Environ. Sci. Technol., 2009, 43, 3803–3808.
31 A. A. Keller, H. T. Wang, D. X. Zhou, H. S. Lenihan, G. Cherr,B. J. Cardinale, R. Miller and Z. X. Ji, Environ. Sci. Technol.,2010, 44, 1962–1967.
32 G. X. Chen, X. Y. Liu and C. M. Su, Environ. Sci. Technol.,2012, 46, 7142–7150.
33 M. Auffan, J. Rose, J. Y. Bottero, G. V. Lowry, J. P. Jolivet andM. R. Wiesner, Nat. Nanotechnol., 2009, 4, 634–641.
34 I. R. Quevedo, A. L. J. Olsson and N. Tufenkji, Environ. Sci.Technol., 2013, 47, 2212–2220.
35 D. Xu, C. Hodges, Y. Ding, S. Biggs, A. Brooker and D. York,Langmuir, 2010, 26, 18105–18112.
36 M. Zhang and M. Akbulut, Langmuir, 2011, 27, 12550–12559.37 Y. N. Ahn, G. Mohan and D. I. Kopelevich, J. Chem. Phys.,
2012, 137, 164902.38 K. Kataoka, A. Harada and Y. Nagasaki, Adv. Drug Delivery
Rev., 2012, 64, 37–48.39 V. P. Torchilin, J. Controlled Release, 2001, 73, 137–172.40 T. G. Spiro, K. Purvis-Roberts and W. M. Stigliani, Chemistry
of the environment, University Science Books, 3rd edn, MillValley, Calif, 2012.
41 A. S. Hoffman, Adv. Drug Delivery Rev., 2012, 64, 18–23.42 Z. L. Tyrrell, Y. Q. Shen and M. Radosz, Prog. Polym. Sci.,
2010, 35, 1128–1143.43 H. Gupta, M. Aqil, R. K. Khar, A. Ali, A. Bhatnagar and
G. Mittal, J. Drug Targeting, 2011, 19, 409–417.44 W. S. Cheow, M. W. Chang and K. Hadinoto, Pharm. Res.,
2010, 27, 1597–1609.45 Y. J. Min, M. Akbulut, K. Kristiansen, Y. Golan and
J. Israelachvili, Nat. Mater., 2008, 7, 527–538.46 A. Hajdu, E. Illes, E. Tombacz and I. Borbath, Colloids Surf.,
A, 2009, 347, 104–108.47 M. Nayeri, R. Karlsson and J. Bergenholtz, Colloids Surf., A,
2010, 368, 84–90.48 M. Zhang, E. A. Ellis, L. Cisneros-Zevallos and M. Akbulut,
RSC Adv., 2012, 2, 9679–9686.49 J. Malmstrom, H. Agheli, P. Kingshott and D. S. Sutherland,
Langmuir, 2007, 23, 9760–9768.50 G. Olanya, E. Thormann, I. Varga, R. Makuska and
P. M. Claesson, J. Colloid Interface Sci., 2010, 349, 265–274.51 A. E. Lopez, D. Pum, U. B. Sleytr and J. L. Toca-Herrera, Phys.
Chem. Chem. Phys., 2011, 13, 11905–11913.52 N. Lu, J. L. Zilles and T. H. Nguyen, Appl. Environ. Microbiol.,
2010, 76, 4179–4184.53 W.-L. Kao, H.-Y. Chang, G.-J. Yen, D.-Y. Kuo, Y.-W. You,
C.-C. Huang, Y.-T. Kuo, J.-H. Lin and J.-J. Shyue, J. ColloidInterface Sci., 2012, 382, 97–104.
54 R. Ziołkowski, Ł. Gorski, S. Oszwałdowski andE. Malinowska, Anal. Bioanal. Chem., 2012, 402, 2259–2266.
10164 | Soft Matter, 2013, 9, 10155–10164
55 E. F. Irwin, J. E. Ho, S. R. Kane and K. E. Healy, Langmuir,2005, 21, 5529–5536.
56 S. V. Orski, S. Kundu, R. Gross and K. L. Beers,Biomacromolecules, 2013, 14, 377–386.
57 S. Slavin and D. M. Haddleton, So Matter, 2012, 8, 10388–10393.
58 G. Olanya, E. Thormann, I. Varga, R. Makuska andP. M. Claesson, J. Colloid Interface Sci., 2010, 349, 265–274.
59 C. Kosslinger, E. Uttenthaler, S. Drost, F. Aberl, H. Wolf,G. Brink, A. Stanglmaier and E. Sackmann, Sens. Actuators,B, 1995, 24, 107–112.
60 A. L. J. Olsson, H. C. van der Mei, H. J. Busscher andP. K. Sharma, Langmuir, 2009, 25, 1627–1632.
61 P. Vangeyte, B. Leyh, O. J. Rojas, P. M. Claesson, M. Heinrich,L. Auvray, N. Willet and R. Jerome, Langmuir, 2005, 21, 2930–2940.
62 Y. Liu and S. L. Regen, J. Am. Chem. Soc., 1993, 115, 708–713.63 M. A. Idiart and Y. Levin, Phys. Rev. E: Stat., Nonlinear, So
Matter Phys., 2004, 69, 061922.64 B. J. Kirby and E. F. Hasselbrink, Electrophoresis, 2004, 25,
187–202.65 B. Zdyrko, P. B. Y. Or, A. M. Alb, W. F. Reed and
M. M. Santore, J. Colloid Interface Sci., 2008, 322, 365–374.66 D. Kim, W. Cha and R. L. Beissinger, J. Colloid Interface Sci.,
1993, 159, 1–8.67 A. D. Polyanin, Handbook of linear partial differential
equations for engineers and scientists, Chapman & Hall/CRC,Boca Raton, London, 2002.
68 A. C. Hillier and M. D. Ward, Anal. Chem., 1992, 64, 2539–2554.69 R. B. Bird, W. E. Stewart and E. N. Lightfoot, Transport
phenomena, J. Wiley, 2nd edn, New York, Chichester, 2007.70 B. K. Lok, Y. L. Cheng and C. R. Robertson, J. Colloid Interface
Sci., 1983, 91, 104–116.71 Z. G. Fu and M. M. Santore, Colloids Surf., A, 1998, 135, 63–75.72 E. Mubarekyan and M. M. Santore, J. Colloid Interface Sci.,
2000, 227, 334–344.73 S. M. Daly, T. M. Przybycien and R. D. Tilton, Biotechnol.
Bioeng., 2005, 90, 856–868.74 E. C. Cho, Q. Zhang and Y. N. Xia, Nat. Nanotechnol., 2011, 6,
385–391.75 P. Somasundaran, Encyclopedia of surface and colloid science,
Taylor & Francis, 2nd edn, New York, 2006.76 M. M. Sharma, H. Chamoun, D. S. H. S. R. Sarma and
R. S. Schechter, J. Colloid Interface Sci., 1992, 149, 121–134.77 S. K. Das, M. M. Sharma and R. S. Schechter, Part. Sci.
Technol., 1995, 13, 227–247.78 G. M. Burdick, N. S. Berman and S. P. Beaudoin, Thin Solid
Films, 2005, 488, 116–123.79 M. Akbulut, S. M. D'Addio, M. E. Gindy and R. K. Prud'homme,
Expert Rev. Clin. Pharmacol., 2009, 2, 265–282.80 M. Akbulut, P. Ginart, M. E. Gindy, C. Theriault, K. H. Chin,
W. Soboyejo and R. K. Prud'homme, Adv. Funct. Mater., 2009,19, 718–725.
81 F. Hook, B. Kasemo, T. Nylander, C. Fant, K. Sott andH. Elwing, Anal. Chem., 2001, 73, 5796–5804.
82 M. V. Voinova, M. Rodahl, M. Jonson and B. Kasemo, Phys.Scr., 1999, 59, 391–396.
This journal is ª The Royal Society of Chemistry 2013
Copyright © 2022 FDOKUMEN