Multiscale Evolutionary Perturbation Attack on Community ...
Upload
independentCategory
view
0download
0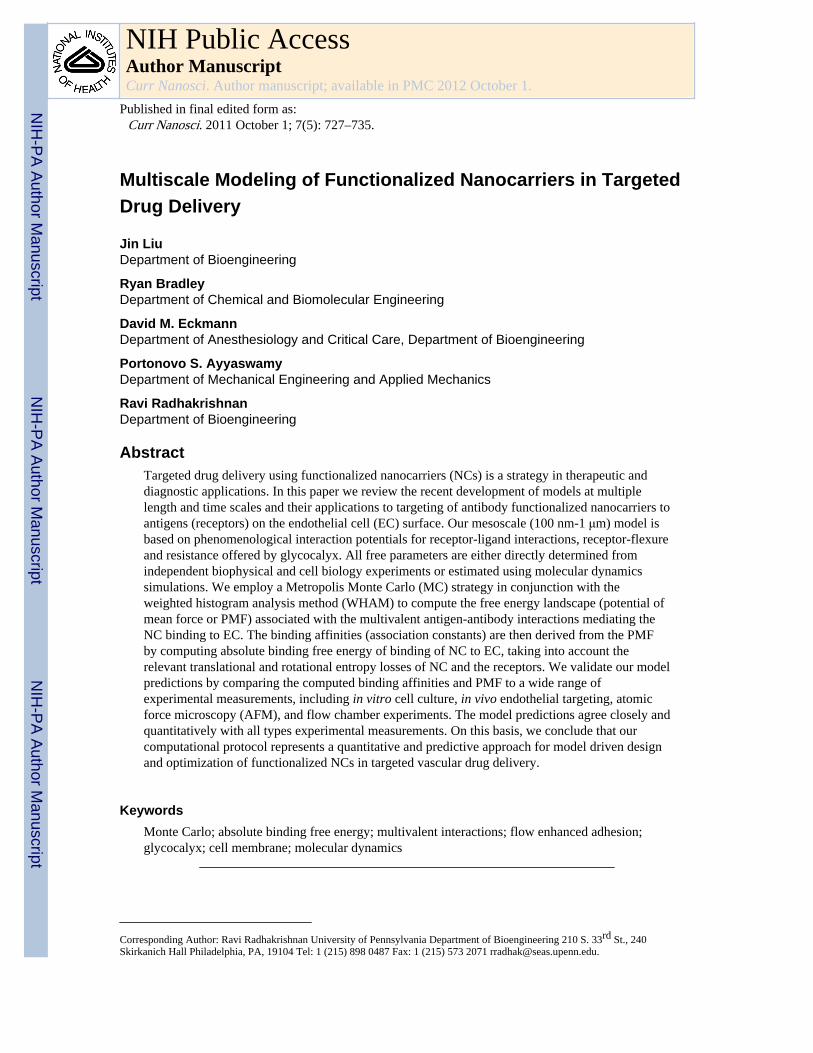
Multiscale Modeling of Functionalized Nanocarriers in TargetedDrug Delivery
Jin LiuDepartment of Bioengineering
Ryan BradleyDepartment of Chemical and Biomolecular Engineering
David M. EckmannDepartment of Anesthesiology and Critical Care, Department of Bioengineering
Portonovo S. AyyaswamyDepartment of Mechanical Engineering and Applied Mechanics
Ravi RadhakrishnanDepartment of Bioengineering
AbstractTargeted drug delivery using functionalized nanocarriers (NCs) is a strategy in therapeutic anddiagnostic applications. In this paper we review the recent development of models at multiplelength and time scales and their applications to targeting of antibody functionalized nanocarriers toantigens (receptors) on the endothelial cell (EC) surface. Our mesoscale (100 nm-1 μm) model isbased on phenomenological interaction potentials for receptor-ligand interactions, receptor-flexureand resistance offered by glycocalyx. All free parameters are either directly determined fromindependent biophysical and cell biology experiments or estimated using molecular dynamicssimulations. We employ a Metropolis Monte Carlo (MC) strategy in conjunction with theweighted histogram analysis method (WHAM) to compute the free energy landscape (potential ofmean force or PMF) associated with the multivalent antigen-antibody interactions mediating theNC binding to EC. The binding affinities (association constants) are then derived from the PMFby computing absolute binding free energy of binding of NC to EC, taking into account therelevant translational and rotational entropy losses of NC and the receptors. We validate our modelpredictions by comparing the computed binding affinities and PMF to a wide range ofexperimental measurements, including in vitro cell culture, in vivo endothelial targeting, atomicforce microscopy (AFM), and flow chamber experiments. The model predictions agree closely andquantitatively with all types experimental measurements. On this basis, we conclude that ourcomputational protocol represents a quantitative and predictive approach for model driven designand optimization of functionalized NCs in targeted vascular drug delivery.
KeywordsMonte Carlo; absolute binding free energy; multivalent interactions; flow enhanced adhesion;glycocalyx; cell membrane; molecular dynamics
Corresponding Author: Ravi Radhakrishnan University of Pennsylvania Department of Bioengineering 210 S. 33rd St., 240Skirkanich Hall Philadelphia, PA, 19104 Tel: 1 (215) 898 0487 Fax: 1 (215) 573 2071 [email protected].
NIH Public AccessAuthor ManuscriptCurr Nanosci. Author manuscript; available in PMC 2012 October 1.
Published in final edited form as:Curr Nanosci. 2011 October 1; 7(5): 727–735.
NIH
-PA Author Manuscript
NIH
-PA Author Manuscript
NIH
-PA Author Manuscript
1. INTRODUCTIONAccording to a recent report [1], around 10 million people in the world were newlydiagnosed with cancer in 2009. Targeted drug delivery using functionalized nanocarriers(i.e., NCs coated with specific targeting ligands) has been clinically identified as apromising approach in both therapeutic and diagnostic applications in cancer treatments.However, targeting of NCs to endothelium remains an important design challenge inpharmacological and biomedical sciences. The use of functionalized NCs offers a widerange of tunable design parameters (size, shape, type, method of functionalization, etc.). Inprinciple, massive experimentation in a high-dimensional tunable parameter space is neededto achieve optimal treatment in drug delivery applications [2]. Therefore a physiologicallysound and computationally tractable model, which is both quantitative and predictive, canprove to be crucial in the rational design of the drug delivery using functionalized NCs.
However, the design of functionalized NCs faces many challenges due to several inherentcomplexities of the underlying interactions: (i) molecular and geometric parameterssurrounding receptor-ligand interactions and NCs; (ii) lack of accurate characterization ofhydrodynamics; (iii) physico-chemical barriers for NC uptake/arrest; (iv) uncertainty intargeting environment. Binding affinity (Ka) is a direct measure of the efficiency oftargeting. Recently Muro et al. [3] have experimentally studied the binding affinity offunctionalized NCs to ICAM-1expressing EC surface in which they report that the bindingaffinity of anti-ICAM-1 coated NC to EC could be two orders of magnitude higher than thatof anti-ICAM-1 binding to ICAM-1. Haun and Hammer [4] have investigated the kineticrate constants of attachment and detachment of 210 nm NCs as a function of receptordensity, ligand density on surface, and flow shear rate, and identified a time dependence ofthe detachment rate due to multivalent binding. Ho et al. [5] studied the effect of antibodysurface coverage on equilibrium binding constants by measuring fractional coverage ofbound NCs (80 nm in diameter) as a function of NC concentrations; by fitting theirexperimental data, they observed linear dependence of Ka on antibody surface coverage,leading them to conclude that the system was dominated by monovalent interactions.Despite such previous studies on NC binding, a comprehensive understanding of thedeterminants of NC binding to EC is still limited.
From a modeling perspective, numerical estimation of the binding affinities (or the absolutefree energy of binding) is a significant challenge. First, the characterization of theunderlying parameters of the model from independent experiments is non-trivial due to thecomplexity of the system; some parameters are even unavailable in the literature, thereforecalling for their de-novo estimation using molecular dynamics simulations. Secondly, thecalculation of binding affinities necessarily involves the determination of absolute bindingfree energies, which requires extensive sampling over conformational degrees of freedom aswell as the determination of various (translational and rotational) entropy changes uponbinding. Recently, inspired by the framework of Woo and Roux [6] on calculation bindingaffinity between a flexible ligand and a receptor, we have developed a mesoscale model tocompute the absolute binding free energy of binding of NC to EC. The mesoscale modelpertains to spherical NC functionalized with antibodies and binding to antigens on ECsurface amidst fluid flow and glycocalyx (see Fig. 1). We discuss in the following sections,how the physical and geometrical parameters for the mesoscale model and interactions arederived from the independent experiments; this includes the properties of the flow, NC sizeand shape, antibody surface coverage on NC, glycocalyx resistance, and antigen-antibodyinteraction. In order to estimate de novo the only parameter unavailable in the literature,namely the flexural rigidity of the antigen, we perform detailed molecular dynamics (MD)simulations and fluctuation analysis. Then, using the parameters derived from experimentsand MD in our mesoscale model, we compute the binding affinities of NC to EC (described
Liu et al. Page 2
Curr Nanosci. Author manuscript; available in PMC 2012 October 1.
NIH
-PA Author Manuscript
NIH
-PA Author Manuscript
NIH
-PA Author Manuscript
below) and compare the model predictions with experimental data. Using this model, wehave investigated the effects from various tunable and design parameters underphysiological conditions and compared model predictions quantitatively with correspondingexperimental measurements. In all cases investigated, the quantitative model predictionsagreed remarkably well with experiments, which provide a comprehensive validation of ourapproach. In closing, we describe some new experiments are designed based on our modelpredictions as well as promising avenues for extending the model as a promising numericaltool for optimal design of functionalized NCs in targeted drug delivery.
2. MODELING METHODS2.1. Mesoscale Model Implementation
As shown in Fig. 1, we model the NC as a rigid sphere with uniformly distributed antibodieson its surface. The interactions between NC and cell surface are mimicked by theinteractions between antibodies and antigens (ICAM-1s) on a flat surface. The interactionsare considered through the Bell model [7], i.e., through the reaction free energy: ΔGr (d) =ΔG0 + 0.5kd2, where d represents the distance between the reaction sites of the interactingantibody and antigen, ΔG0 is the free energy change at equilibrium state (d = 0) and k is theinteraction bond force constant.
We also account for the antigens' flexure by allowing them to bend and rotate in θ and ϕspace (see Fig. 1). Under the assumption of small flexural deformations, we model theflexure of an antigen as bending a beam from equilibrium (upright) position, thus thebending energy due to flexure can be calculated as (see Ref. [8] for details):
(1)
where EI is the flexural rigidity of antigens, L represents the antigen length and yL is thedistance of the antigen tip from its equilibrium upright position. For small deformations, yL≈ Lθ, therefore the bending energy can be expressed as:
(2)
Clearly the antigen flexural movement is highly orientation dependent. Hence, aconfigurational-biased sampling technique [9] is implemented in our model to improve theefficiency of sampling of the configurations of flexural movement. This sampling procedureobeys detailed balance and can be described in five steps as:
(i) We first randomly select one antibody and one antigen, which are close enoughto form a bond.
(ii) Then we randomly generate 100 trial orientations {t1,t2,…, t100}, in which ti =(θi, ϕi,bi), θi = acos (ri) is a random angle between 0 and π/2 and ri is auniformly distributed random number between 0 and 1, ϕi is a random angleuniformly distributed between 0 and 2π, bi is a random integer between 0 (breaka bond) and 1 (form a bond). For each trial ti, we calculate the bond energy Uor
(ti) = bi (ΔGr (di) + ΔGf (θi)).
(iii) The Rosenbluth factor[9] is then calculated as:
Liu et al. Page 3
Curr Nanosci. Author manuscript; available in PMC 2012 October 1.
NIH
-PA Author Manuscript
NIH
-PA Author Manuscript
NIH
-PA Author Manuscript
(3)
and then we select one trial tn out of the 100 trialstrials with probability
.
(iv) We then calculate the old bond energy or Uor (to) and generate another 99 trialorientations, based on which we determine:
(4)
(v)Finally we accept the selection of tn with the probability of min
To include the effect of flow, a simple one-dimensional shear flow with shear rate of S isintroduced as shown in Fig. 1. We also account for the glycocalyx, which usually exists in invivo environments, by adding a layer of height h above the cell surface (see Fig. 1). Theflow inside the glycocalyx layer is obtained by solving the Brinkman's equation without anypressure gradient, i.e.,
(5)
in which the glycocalyx is modeled as a porous medium and Kp is its Darcy permeability.Following the procedures in Ref. [10], Kp is determined by solving two-dimensional Stokesflow past an array of cylindrical fibers. The approximate expression is
(6)
where the fiber volume fraction , the fiber radius rf = 6 nm and fibergap Δ = 8 nm. By solving the Brinkman equation with the resulting value of Kp we foundthat the flow inside the glycocalyx layer is very small, which is consistent with theobservations of in vivo experiments [11, 12]. Therefore, as indicated in Fig. 1, we neglectthe flow inside the glycocalyx (u = 0 at z ≤ h). The flow induced drag Fx and torque Ty arecalculated by solving the steady-state Stokes equation for the shear flow past a sphere near asurface:
(7)
with the no-slip boundary conditions and inlet flow condition of u = S (z – h, where μ is thedynamic viscosity of the fluid and S is the shear rate. In our simulations, we set μ = 0.001
Liu et al. Page 4
Curr Nanosci. Author manuscript; available in PMC 2012 October 1.
NIH
-PA Author Manuscript
NIH
-PA Author Manuscript
NIH
-PA Author Manuscript
kgm−1s−1 (dynamic viscosity of water). The Stokes equations are solved using thecommercial software COMSOL and the flow induced drag Fx and torque Ty at discretevertical points are computed through integration of the force and torque on NC surface. Thecalculated drag and torque are consistent with theoretical data from Goldmann et al. [13]when the sphere is close to the surface.
When the NC approaches to the cell surface, the binding is significantly impacted by thepresence of the glycocalyx layer, especially in in vivo conditions. The glycocalyx layerusually extends hundreds of nanometers above the cell surface as described in manydifferent experiments [12]. To account for the normal resistance of the glycocalyx, we add aharmonic potential 1/ 2kglyxH2 per unit differential area, where H is the penetration depth ofthe NC into glycocalyx as indicated in Fig. 1 and kglyx is the glycocalyx stiffness. Based ondifferent models, the kglyx can be assumed constant or linearly increasing with H and thevalues are extracted by fitting NC binding data with and without glycocalyx obtained in invivo experiments [14].
Regular Metropolis Monte Carlo (MC) steps are employed for: (i) bond formation/breaking,(ii) NC translation and rotation, and (iii) and antigen translation. Move (i) is selectedrandomly with a probability of 50%, and in the remaining 50%, the NC translation, rotation,and antigen translation are selected randomly with probability of 0.5Nab/Nt, 0.5Nab/Nt and(Nt – Nab)/Nt respectively; Nt is the combined total number of antibodies (Nab) and antigenmolecules. The simulations are run in parallel on four processors with different realizationsof the same physical system. An adaptive step size for NC translation/rotation and antigendiffusion is implemented to ensure a Metropolis acceptance rate of 50%.
2.2. Calculation of the Absolute Binding Free EnergyGenerally for binding of ligands (L) (or NC) to receptors (R) the binding process can bedescribed as: L+R↔LR, where LR is the ligand and receptor in binding state. Atthermodynamic equilibrium, the binding affinity (or association constant) Ka is defined as:
(8)
Here [L], [R] and [LR] as the fraction of receptors with no ligand and one ligand boundrespectively, so that [R] and [LR] can be expressed as [R] = p0 [Rtot and [L] = [R]tot, where[Rtot is the total receptor concentration in the whole system. We relate the fraction in Eq. (8)to the ratio of the integral of configurational degrees of freedoms in the bound state to theunbound state [6]:
(9)
where Ubound and Uunbound are the total potential energies of the system at bound andunbound states, β = 1/kBT in which kB is the Boltzmann constant and T is the absolutetemperature. 1 represents all the degrees of freedom associated with the ligand (NC) and Xis the degrees of freedom for the remaining molecules (receptors). On a per ligand basis, theligand concentration is [L] = 1/Vunbound, where the denominator is the volume accessible toan unbound ligand. The integral associated with the unbound state (Uunbound = 0) in Eq. (9)is determined over translational degrees of freedom (yielding the volume Vunbound), androtational degrees of freedom (yielding a factor of 8π2 in 3-dimensions).
Liu et al. Page 5
Curr Nanosci. Author manuscript; available in PMC 2012 October 1.
NIH
-PA Author Manuscript
NIH
-PA Author Manuscript
NIH
-PA Author Manuscript

The final form of the binding affinity for interactions between NC and cell surface can beexpressed as (see Refs. [15, 16] for detailed derivations):
(10)
where T1 represents the entropy loss from the bounded receptors and it can be calculated as:
(11)
Here is the accessible surface area to the nth receptor in the bound state and is thearea in the unbound state. Term T2 accounts for the NC rotational entropy loss due tobinding:
(12)
where Nab is the number of antibodies per NC, Nb is the total number of bonds inequilibrium state, Δω is the rotational volume of the NC in the bound state which can bedetermined from the distributions of Euler angles as described in Ref. [17]. The term T3accounts for NC translational entropy loss,
(13)
where ANCb, is the area for the NC translational movement in the bound state, ANC,ub andANCubzlz are the area and volume accessible to the NC in the unbound state, and W (z) is thepotential of mean force (PMF).
To calculate the PMF W (z), we choose a reaction coordinate z along which we performumbrella sampling with harmonic biasing potentials. The umbrella sampling is performedwith window size of Δz = 0.05 nm and the harmonic biasing potential in each window ischosen to be 0.5ku (z – z0,i)2, where 0 ku (Δz)2 = 1.0×10⁻²⁰ J, ku is the harmonic forceconstant and z0,i is the location of the center of window i. The NC is slowly moved to thecell surface by updating z0,i. A total of 200 million Monte Carlo steps are performed in eachwindow and the histogram is stored only when there exists at least one bond. All the relevantparameters including the window size Δz, strength of the biasing potential ku and thesampling size in each window have been tested to ensure convergence. The WHAMalgorithm [18] is used to unbias and combine the histograms in different windows to form acomplete PMF (W(z)) profile using a tolerance factor of 10−6. PMF profiles for each systemare averaged over four independent realizations.
2.3. Parameter EstimationThe simulation parameters are chosen to make direct contact with the experimental systemin Ref. [3], the receptor (antigen) parameters are chosen to mimic ICAM-1. The ligand(antibody) parameters are chosen to mimic the murine anti-ICAM-1 antibody which bindsspecifically to ICAM-1. For the interactions between antibody and ICAM-1, Muro et al. [3]
Liu et al. Page 6
Curr Nanosci. Author manuscript; available in PMC 2012 October 1.
NIH
-PA Author Manuscript
NIH
-PA Author Manuscript
NIH
-PA Author Manuscript
reported the equilibrium free energy change between antibody and ICAM-1 to be−7.98×10− J at 4°C, which we set as ΔG0 in the Bell model of our simulations. We obtainthe bond spring constant k = 1000 dyn/cm by fitting rupture force distribution data reportedfrom single-molecule force spectroscopy [8, 19]. Both ΔG0 and k are assumed to betemperature independent based on which we derive the value of the reactive compliance γ(distance along the reaction coordinate to reach the transition state or point of rupture) to be~0.4 nm, which agrees very well with experimental evaluations [19, 20]. The saturationantibody coverage has been experimentally determined [3] to be 220 per NC with a diameterof 100 nm. The ICAM-1 surface density on endothelial cell is set at 2000ICAM-1molecules/μm2 to be consistent with experimental report [3] of the availablebinding sites per endothelial cell. In the cases including the presence of glycocalyx, wefollow the procedures outlined our earlier study [8] in which we assume a glycocalyx heightof 100 nm. The glycocalyx stiffness is estimated as kglyx =3.4×10⁹ J/m4 to be consistent withthe experimental observation [14] of a 500-fold decrease in binding for 100 nm NCs in thepresence of glycocalyx compared to when it is absent. Finally, we also account for theflexure of ICAM-1 (see Fig. 1); since the exact flexural rigidity EI for ICAM-1 proteins isunavailable in the literature, we estimate this value de novo by performing MD simulationsand fluctuation analysis, which is described in the following section. A summary of modelparameters is provided in Table 1.
2.4. Molecular Dynamics (MD) and Fluctuation Analysis for FlexureFlexural rigidity (flexure) describes the receptor's resistance to bending forces, and thereforeimpacts both the conformational sampling of the flexible receptor as well as the binding freeenergy between ICAM-1 and antibody. The flexure of ICAM-1 has not been directlymeasured by experiment, so we turn to molecular dynamics simulation to provide amicroscopic description of its fluctuations. Coarse-grained molecular dynamics (CGMD) isthe preferred method for studying these fluctuations because it provides efficient means forconformational sampling and direct estimation of physical properties. We have employedMARTINI, a coarse-grained (CG) molecular dynamics force field developed by Marrinkand coworkers [24, 25] to access time and length scales which would be prohibitively costlywith all-atom MD. MARTINI was parameterized in a “top-down” manner designed to semi-quantitatively reproduce the structural and thermodynamic properties of lipid and alkane testsystems. It has also been recently extended to include proteins [26], carbohydrates [27] andpolarizable water [28]. The CG methodology used in MARTINI retains relevant degrees offreedom with a minimal set of tunable parameters and common chemical building blocks.This provides orders-of-magnitude improvements in computational efficiency without theneed to re-parameterize the model for novel systems.
In MARTINI, groups of four heavy atoms are mapped to one interaction site or “bead” witha standardized mass of four water molecules and an effective size of 0.47 nm. Ring-likestructures have a finer mapping that retains their natural geometry. There are four types ofbeads: polar, apolar, nonpolar, and charged. These are further divided into classes based onhydrogen bonding propensity. Van der Waals interactions are modeled by a Lennard-Jones(LJ) potential. Differential LJ interactions between bead types produce the necessaryattractive and repulsive forces between phases; this partitioning behavior is the key point ofcontact with experiments. The LJ potential is shifted to zero from 0.9 nm to the cutoffdistance of 1.2 nm. Additionally, charged beads interact according to the Coulombicpotential. Bonded interactions include a weak harmonic spring between neighbors and aharmonic angle potential between next-nearest neighbors. Neighbors are bonded by a weakharmonic spring without LJ interactions, while next-nearest neighbors interact with aharmonic angle potential. Bonded parameters for amino acids are derived from bond, angle,and dihedral distributions surveyed in the Protein Data Bank. Using the same bead types as
Liu et al. Page 7
Curr Nanosci. Author manuscript; available in PMC 2012 October 1.
NIH
-PA Author Manuscript
NIH
-PA Author Manuscript
NIH
-PA Author Manuscript
the lipid model, non-bonded parameters were tuned to match the partitioning free energy ofamino acid analogs between water and oil phases as well as a host of all-atom model results.MARTINI has been used to study several different protein systems, including the self-assembly of G Protein-coupled receptors on a bilayer [29], the lateral diffusion of peptidesin membranes [30] and membrane poration by peptides [31, 32]. Moreover, the CGmethodology plays an important role in multiscale simulation methods [33]. GivenMARTINI's ability to semi-quantitatively describe the properties of larger biomolecularsystems, it is the method of choice for estimating ICAM-1 flexure.
Simulations were performed in GROMACS 4.5.3 [34] using the standard simulationparameters outlined above and described in detail by Monticelli et al. [26]. A homologymodel of ICAM-1 (450 residues) was constructed from PDB structures of both the D1–D2[35] and D3–D5 domains of ICAM-1 reported by Yang et al. [36]. Given that thephysiological dimerization state is unknown or at best ambiguous [37] we have simulatedthe monomer as well as dimer systems. Harmonic restraints replaced the missing dimerinterface loops in the dimer simulation, but this loop was explicitly modeled (usingMODELLER [38]) for the monomer simulation.
Each model was solvated in a water box with periodic boundary conditions and at least 4 nmbetween the protein and the box edge (200,000 water beads for the dimer and 50,000 for themonomer). Counter-ions were added to create a physiological concentration of 0.150 nM.To mimic attachment to a membrane, the C-terminal amino acids were position-restrained.All simulations were conducted in position-restrained NVT, followed by unrestrained NPTensembles using the standard (maximum) MARTINI time step of 40 fs and the Berendsenthermostat with a pressure of 1 atm, a time constant of 1 ps, and a compressibility of4.5×10−5 bar−1. The neighbor list was cut off at 1.2 nm and the LINCS algorithm was usedto constrain bond angles. Simulations were run for 100 ns after an initial 10 ns equilibrationperiod. As per recommendations by Monticelli et al. [26], an elastic network model (ENM)with a force constant of 500 kJ/molnm was applied to all CG beads within 0.5–0.9 nm tosupport/stabilize higher-order protein structure.
In order to extract flexural rigidity from CGMD simulations, we model ICAM-1 as anelastic rod represented by a parametric curve with tangent angle θ(s), where s is the contourlength. For an elastic rod with small fluctuations, flexure is given by Hooke's law, such thatthe total bending energy is given by:
(14)
We remove any contributions to the bending energy by the mean curvature of the elastic rod,θ0 (s), to allow for bent native conformations. According to the analysis by Gittes et al. [39],we decompose the rod shape into Fourier modes (with coefficients an and ) and rewrite thebending energy term as Eq. (15):
(15)
The equipartition theorem states that each mode contributes kT/2 to the energy, where k isthe Boltzmann's constant and T is the temperature; therefore we can calculate EI from thevariance of each Fourier mode according to Eq. (16):
Liu et al. Page 8
Curr Nanosci. Author manuscript; available in PMC 2012 October 1.
NIH
-PA Author Manuscript
NIH
-PA Author Manuscript
NIH
-PA Author Manuscript
(16)
Eq. (17) relates flexure to the persistence length, the distance at which tangent-tangentangles become uncorrelated. Both the flexure and persistence length describe the sameproperty: the receptor's resistance to bending.
(17)
These definitions are valid as long as the protein is elastic and experiences only thermally-driven fluctuations which are small relative to the mean curvature.
ICAM-1 is composed of five ordered protein domains denoted D1–D5, which suggest asimple discretization in which six key residues that bookend these domains can provide auseful approximation of its contours. We selected the most intuitive candidates: 26N, 83Y,185F, 281Y, 366L, and 450P. This yielded the best approximation of the receptor shape. Wecalculated flexure via Fourier mode analysis and the tangent correlation method. For thelatter, the contour lengths were defined from a single reference point at the C-terminalresidue to the midpoint between residues forming the bending angle.
3. RESULTS AND DISCUSSION3.1. Calculation of Flexure from CGMD
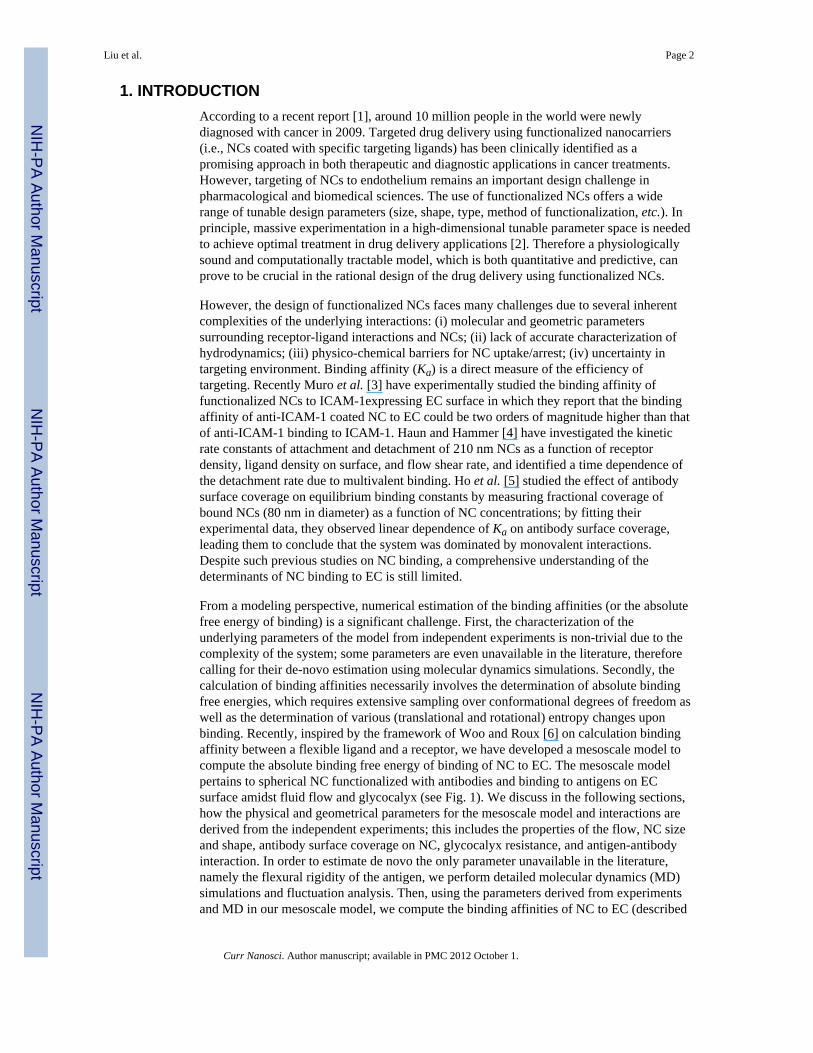
Fig. 2 depicts the CG monomer and dimer structures with elastic network bonds. Flexureestimates are summarized in Table 2. We used both the Fourier mode analysis from Eq. (15)and tangent-tangent correlation methods from Eq. (17) to estimate flexure from 100 nssegments of ICAM-1 monomer and dimer CGMD trajectories. Not surprisingly, the dimer ismore rigid than the monomer, owing to the harmonic restraints used to mimic poorly-resolved dimer interface loops; in particular, we estimate a monomer flexure of 800 pN•nm2
and dimer flexure of 20,000 pN•nm2. In addition to the systems described here, we testedthe sensitivity of these results by simulating similar systems with additional restraints,different ENM parameters, and different loop-modeling methods.
There is up to 10-fold disagreement between flexure calculated via the tangent correlationmethod and the first mode of Fourier decomposition. We can attribute this to theapproximations inherent to both the calculation method and the ICAM-1 model itself. In thetangent correlation calculation, the errors are relatively large, indicating large variation inΔθ(s) = [θ(s) −θ0 (s)], and the receptor was discretized by only five angles. The Fouriermode analysis does not have this limitation, and each mode should provide an independentestimate of flexure. However, due to the limited resolution and sampling of our discretizedcurves, only the lowest modes are reliable.
Our model could be improved by using a fitted, heterogeneous elastic network model whichhas been parameterized to match finer, all-atom MD simulation as per methods developedby Lyman et al. [41] Since the dimerized structure was used as a template for both themonomer and dimer starting structures, it is also likely that our model does not accuratelycapture the true conformation of the monomeric form. The equilibrium between monomerand dimer has also not been resolved by our model. Despite these approximations, ourCGMD calculations provide a useful de novo estimation of the flexural rigidity and
Liu et al. Page 9
Curr Nanosci. Author manuscript; available in PMC 2012 October 1.
NIH
-PA Author Manuscript
NIH
-PA Author Manuscript
NIH
-PA Author Manuscript
persistence length. To place our calculation in the biological context, we compare thecomputed value of persistence length for ICAM-1 (current study) to those for common rod-like biomolecules estimated from experiments and simulations, see Table 3.
3.2. Calculation of Potential of Mean Force (PMF) of NC Binding to ECFollowing Ref. [15], here we calculate the PMF profiles for NCs with diameter of 100 nmand the number of antibody Nab=162 (which corresponds to 74% of saturation coverage).Due to the large experimental uncertainties in flexural rigidity of ICAM-1 receptors, weexplore three values of ICAM-1 flexural rigidities at 1400, 7000 and 35000 pN•nm2, whichlie in between that of glyco-proteins (700 pN•nm2) and actin filaments (15–70×103
pN•nm2), see Table 3. These values also span range of the ICAM-1 flexural rigiditiesevaluated using CGMD described in the previous section.
Fig. 4(a) shows the calculated PMF profiles with different ICAM-1 flexural rigidities attemperature of 27 °C, as clearly indicated, for all three cases three firm bonds form (Nb = 3)with a similar characteristic free energy well of around - 32 kBT in equilibrium state whenprojected along the reaction coordinate z. Fig. 4(b) shows the spatially averaged distributionof the bound ICAM-1 relative to the center of NC for the case with EI = 7000 pN•nm2, andthis is basically an annulus distribution, based on which the outer (ro) and inner radius (ri) isestimated; all the area terms in Eq. (11) are directly related to r0 and ri. In particular,AR,ub
(1)=AR,ub(2) =…=AR,ub
(5) =π ro2, AR,b
(1)=πro2, AR,b
(2)=π(ro2−ri
2),AR,b
(3)=AR,b(4)=AR,b
(5)=ANC,b=(ro−ri)2. As indicated in Fig. 4(d), the ICAM-1 distributionsare nearly the same for different flexural rigidities. Fig. 4(c) shows the distribution of theflexure angle (θ) at equilibrium state for different flexural rigidities. As expected, theaverage flexure angle increases with decreasing EI. Based on the PMF profile in Fig. 4(a),the NC translational entropy loss (Eq. (13)) is calculated and as stated above the rotationalentropy loss can be evaluated based on the Euler angle distributions. Finally the bindingaffinities (Ka) and the dissociation constants (Kd=1/Ka) is determined and listed in Fig. 4(d).There is a slight increase in binding with smaller EI; but the effect is small and within thestatistical errorbars. In a similar fashion [16], the binding affinity between single antibodyand ICAM-1 is also be calculated and as listed in Table 4, both the interactions of NC-cellsurface (for 100 nm NCs) and antibody-ICAM-1 and found consistent with correspondingexperimental measurements under similar conditions.
3.3. Effects of Glycocalyx and FlowIn Ref. [16], we investigated the effects of glycocalyx and shear flow (hydrodynamics) onbinding between NC and cell surface. The numerical implementations are described insection 2.1. The PMF profiles for different values of the glycocalyx thickness werecomputed, based on which the binding affinities were also calculated. Then we reported theratio of the binding affinity without glycocalyx to that with glycocalyx as a function ofglycocalyx thickness. The results indicated an exponential dependence. In other words,glycocalyx with thickness of 55~70 nm only reduces the binding by about 2 fold althoughthat with a thickness of 100 nm can actually reduce the binding by a factor of 500. Thisexponential dependence was confirmed in our simulations with different particle sizes (100nm vs. 200 nm particles) and different glycocalyx models (constant kglyx vs. linearincreasing kglyx), and helps to rationalize the large differences between in vitro [47] and invivo [14] experimental results of glycocalyx-mediated NC binding.
In Ref. [16], the effect of flow was also discussed by introducing a 1-dimensional shear flowwith a shear rate S (see Fig. 1). From the PMF profiles at different shear rates, it was foundthat the free energy first decreases below a threshold S then increases. As a result, thecorresponding dissociation constant (Kd) shows a biphasic trend with shear rate, in other
Liu et al. Page 10
Curr Nanosci. Author manuscript; available in PMC 2012 October 1.
NIH
-PA Author Manuscript
NIH
-PA Author Manuscript
NIH
-PA Author Manuscript

words, below a threshold shear rate the flow actually enhances NC binding by reducing Kd,while above the threshold the flow reduces the binding by promoting NC detachment.Consistent with experimental measurements of particle rolling [48], we have shown that thisbehavior was insensitive to the particle size. Through inspection of the numerical details, wefound the multivalent interactions were the key to this shear enhanced NC bindingphenomenon, which has been extensively studied experimentally due to its importantimplications in many disease related processes [49]. In summary, we have shown that theshear enhanced binding arises solely due to multivalent interactions. This effect is hencedistinct from the so-called “catch” bonds which are thought to be based on a two-stateconformational change in the receptors caused by shear, see Whitfield et al. [50].
We note that in considering the binding of 100 nm NC under in vivo conditions, our modelin the presence of glycocalyx (Equation 7) predicts that the flow is practically zero. In thissituation, the flow does not have any effect on the binding of 100 nm NCs which are fullyimmersed within the glycocalyx layer. Hence, the PMF in the presence of glycocalyx can berecovered from PMF in the absence of the glycocayx through an analytical correction:W(z)glyx,h=W(z)glyx,h=0 + ∫ 1/2kglyxH2dA, where H=z−h.
3.4. Comparison with ExperimentsIn Table 3, we compared the dissociation constants (Kd) computed from our model with invitro measurements [3] under similar conditions for both interactions of NC-cell and singleantibody-ICAM-1. Both interactions agree within reasonable uncertainties. We then studiedthe effect of the antibody surface coverage (σs) on NC [15], and interestingly we observed athreshold at about 45% coverage, below which the NC binding precipitously dropped belowthat of single antibody-ICAM-1 interactions. Intriguingly, this threshold was almost exactlyreproduced in in vivo measurements of the endothelial targeting of NCs in the lung of miceat different antibody coverages; detailed description of the comparison can be found in Ref.[15]. The individual PMF profiles at different σs revealed an integer reduction in themultivalency (from three to two) at the threshold, and as a consequence, the binding freeenergy reduced by about 6 kBT. The significance of this result is that for 100 nm NCs, thereis an optimal antibody coverage (at ~45%), above which the NCs can effectively bind toendothelial cells. We further demonstrated the accuracy of our model by comparing ourmodel predictions with AFM force measurements. The AFM rupture force measurements ofNC unbinding yielded a mean rupture force of 316 pN over 89 trials. We predict a meanrupture force of ~215–230 pN derived from our computed PMF profiles, which is again inclose agreement with experiments (see Ref. [15] for details). Furthermore, our most recentreports of the effects of particle size, glycocalyx and shear flow [16], have all yielded modelpredictions in close agreement with experimental observations [47, 48, 51].
4. FUTURE OUTLOOKIn conclusion, using a general multiscale framework, a powerful mesoscale model has beendeveloped to study the targeting of functionalized NCs to cell surfaces. The model and thesimulation methodology uniquely yield the absolute binding free energy of binding betweenNC and cell surface and has been rigorously validated through comparison with broad andindependent experiments, namely, in vitro, AFM, and in vivo endothelial targeting in mice;the three-level agreement between modeling results and experimental measurementsestablishes the thermodynamic, mechanical and physiological consistency of the model,which we believe can now be employed for predictive simulations or as a guide for futureexperiments. The coarse-grained MD simulations, while subject to the well appreciatedlimitations provides crucial constraints on the allowable parameter values of flexuralrigidity, thereby providing important structural insight as well as molecular input to themesoscale model. Scenarios we envision for the near future include the effect of ICAM-1
Liu et al. Page 11
Curr Nanosci. Author manuscript; available in PMC 2012 October 1.
NIH
-PA Author Manuscript
NIH
-PA Author Manuscript
NIH
-PA Author Manuscript
density on targeting in normal vs. inflamed endothelium in cardiovascular disease models,nanocarrier internalization subsequent to binding mediated by membrane mechanics, and theeffect of particle size and shape in binding and internalization, and targeting NC to complexdisease states such as cancer. With further improvements to our model (such as theincorporation of membrane microenvironment and mechanics [52–56]), we believe that ourcurrent multiscale platform can be further enhanced to guide pharmacological design.
AcknowledgmentsWe acknowledge financial support from NSF grants CBET-0853389, CBET-0853539, and NIH grantsNIBIB-1R01EB006818, NHLBI-1R01HL087036. Computational resources were provided in part by the NationalPartnership for Advanced Computational Infrastructure (NPACI) under the allocation grant MRAC MCB060006.
REFERENCES[1]. Jemal A, Siegel R, Ward E, Hao Y, Xu J, Thun MJ. Cancer statistics, 2009. CA Cancer J. Clin.
2009; 59(4):225–249. [PubMed: 19474385][2]. Khademhosseini A, Langer R. Nanobiotechnolgy for tissue engineering and drug delivery. Chem.
Eng. Prog. 2006; 102:38–42.[3]. Muro S, Dziubla T, Qiu W, Leferovich J, Cui X, Berk E, Muzykantov VR. Endothelial targeting
of high-affinity multivalent polymer nanocarriers directed to intercellular adhesion molecule 1. J.Pharmacol. Exp. Ther. 2006; 317:1161–1169. [PubMed: 16505161]
[4]. Haun JB, Hammer DA. Quantifying nanoparticle adhesion mediated by specific molecularinteractions. Langmuir. 2008; 24:8821–8832. [PubMed: 18630976]
[5]. Ho K, Lapitsky Y, Shi M, Shoichet MS. Tunable immunonanoparticle binding to cancer cells:thermodynamic analysis of targeted drug delivery vehicles. Soft Matter. 2009; 5:1074–1080.
[6]. Woo H, Roux B. Calculation of absolute protein-ligand binding free energy from computersimulations. Proc. Natl. Acad. Sci. USA. 2005; 102:6825–6830. [PubMed: 15867154]
[7]. Bell GI, Dembo M, Bongrand P. Cell adhesion. Competition between nonspecific repulsion andspecific bonding. Biophys. J. 1984; 45(6):1051–1064. [PubMed: 6743742]
[8]. Agrawal NJ, Radhakrishnan R. Role of glycocalyx in mediating nanocarrier cell adhesion exploredusing a thermodynamic model and Monte Carlo simulation. J. Phys. Chem. C. 2007; 111:15848–15856.
[9]. Frenkel, D.; Smit, B. Molecular simulation: from algorithms to applications. Academic; Orlando,FL: 2001.
[10]. Weinbaum S, Zhang X, Han Y, Vink H, Cowin C. Mechanotransduction and flow across theendothelial glycocalyx. Proc. Natl. Acad. Sci. USA. 2003; 100:7988–7995. [PubMed: 12810946]
[11]. Smith ML, Long DS, Damiano ER, Ley K. Near-wall micro-PIV reveals a hydrodynamicallyrelevant endothelial surface layer in venules in vivo. Annu. Biophys. J. 2003; 85:637–645.
[12]. Damiano ER, Long DS, Smith ML. Estimation of viscosity profiles using velocimetry data fromparallel flows of linearly viscous fluids: application to microvascular haemodynamics. J. FluidMech. 2004; 512:1–19.
[13]. Goldman AJ, Cox RG, Brenner H. Slow viscous motion of a sphere parallel to a phane wall. II.Couette flow. Chem. Engn. Sci. 1967; 22:653–660.
[14]. Mulivor AW, Lipowsky HH. Role of glycocalyx in leukocyte-endothelial cell adhesion. Am. J.Physiol. Heart Circ. Physiol. 2002; 283:H1282–H1291. [PubMed: 12234777]
[15]. Liu J, Weller G, Zern B, Ayyaswamy PS, Eckmann DM, Muzykantov VR, Radhakrishnan R.Computational model for nanocarrier binding to endothelium validated using in vivo, in vitro andatomic force microscopy experiments. Proc. Natl. Acad. Sci. USA. 2010; 107(38):16530–16535.[PubMed: 20823256]
[16]. Liu J, Agrawal NJ, Calderon A, Ayyaswamy PS, Eckmann DM, Radhakrishnan R. Multivalentnature of nanocarrier binding to endothelial cells is sufficient to induce shear enhanced adhesion.Biophys. J. 2011 in press.
Liu et al. Page 12
Curr Nanosci. Author manuscript; available in PMC 2012 October 1.
NIH
-PA Author Manuscript
NIH
-PA Author Manuscript
NIH
-PA Author Manuscript

[17]. Carlsson J, Aqvist J. Absolute and relative entropies from computer simulation with applicationsto ligand binding. J. Phys. Chem. B. 2005; 109:6448–6456. [PubMed: 16851719]
[18]. Roux B. The calculation of the potential of mean force using computer simulations. Comput.Phys. Commun. 1995; 91:275–282.
[19]. Zhang X, Wojcikiewicz E, Moy VT. Force spectroscopy of the leukocyte function-associatedantigen-1/intercellular adhesion molecule-1 interaction. Biophys. J. 2002; 83:2270–2279.[PubMed: 12324444]
[20]. Hanley W, McCarty O, Jadhav S, Tseng Y, Wirtz D, Konstantopoulos K. Single moleculecharacterization of P-selectin/ligand binding. J. Biol. Chem. 2003; 278:10556–10561. [PubMed:12522146]
[21]. Kirchhausen T, Staunton DE, Springer TA. Location of the domains of ICAM-1 byimmunolabeling and single-molecule electron microscopy. J. Leukocyte Biol. 1993; 53:342–346.[PubMed: 8095966]
[22]. Berman HM, Westbrook J, Feng Z, Gilliland G, Bhat TN, Weissig H, Shindyalov I, Bourne P.The protein data bank. Nucl. Acids Res. 2000; 28:235–242. [PubMed: 10592235]
[23]. Squire JM, Chew M, Nneji G, Neal C, Barry J, Michel C. Quasi-periodic substructure in themicrovessel endothelial glycocalyx: a possible explanation for molecular filtering? J. Struct. Biol.2001; 136:239–255. [PubMed: 12051903]
[24]. Marrink SJ, de Vries AH, Mark AE. Coarse grained model for semiquantitative lipid simulations.J. Phys. Chem. B. 2004; 108(2):750–760.
[25]. Marrink SJ, Risselada HJ, Yefimov S, Tieleman DP, de Vries AH. The MARTINI force field:coarse grained model for biomolecular simulations. J. Phys. Chem. B. 2007; 111(27):7812–7824.[PubMed: 17569554]
[26]. Monticelli L, Kandasamy SK, Periole X, Larson RG, Tieleman DP, Marrink SJ. The MARTINIcoarse-grained force field: extension to proteins. J. Chem. Theory and Comput. 2008; 4(5):819–834.
[27]. López CA, Rzepiela AJ, de Vries AH, Dijkhuizen L, Huänenberger PH, Marrink SJ. Martinicoarse-grained force field: extension to carbohydrates. J. Chem. Theory and Comput. 2009;5(12):3195–3210.
[28]. Yesylevskyy SO, Schäfer LV, Sengupta D, Marrink SJ. Polarizable water model for the coarse-grained MARTINI force field. PLoS Comput. Biol. 2010; 6(6):e1000810. [PubMed: 20548957]
[29]. Periole X, Huber T, Marrink SJ, Sakmar TP. G protein-coupled receptors self-assemble indynamics simulations of model bilayers. J. Am. Chem. Soc. 2007; 129(33):10126–10132.[PubMed: 17658882]
[30]. Ramadurai S, Holt A, Schäfer LV, Krasnikov VV, Rijkers DTS, Marrink SJ, Killian JA, PoolmanB. Influence of hydrophobic mismatch and amino acid composition on the lateral diffusion oftransmembrane peptides. Biophys. J. 2010; 99(5):1447–1454. [PubMed: 20816056]
[31]. Rzepiela AJ, Sengupta D, Goga N, Marrink SJ. Membrane poration by antimicrobial peptidescombining atomistic and coarse-grained descriptions. Faraday Discuss. 2010; 144:431–443.[PubMed: 20158042]
[32]. Thøgersen L, Schiøtt B, Vosegaard T, Nielsen NC, Tajkhorshid E. Peptide aggregation and poreformation in a lipid bilayer: a combined coarse-grained and all atom molecular dynamics study.Biophys. J. 2008; 95(9):4337–4347. [PubMed: 18676652]
[33]. Ayton GS, Voth GA. Systematic multiscale simulation of membrane protein systems. Curr. Opin.Struc. Biol. 2009; 19(2):138–144.
[34]. Hess B, Kutzner C, van der Spoel D, Lindahl E. GROMACS 4: algorithms for highly efficient,load-balanced, and scalable molecular simulation. J. Chem. Theory and Comput. 2008; 4(3):435–447.
[35]. Casasnovas JM, Stehle T, Liu JH, Wang JH, Springer TA. A dimeric crystal structure for the N-terminal two domains of intercellular adhesion molecule-1. Proc. Natl. Acad. Sci. USA. 1998;95(8):4134–4139. [PubMed: 9539702]
[36]. Yang Y, Jun CD, Liu JH, Zhang R, Joachimiak A, Springer TA, Wang JH. Structural basis fordimerization of ICAM-1 on the cell surface. Mol. Cell. 2004; 14(2):269–276. [PubMed:15099525]
Liu et al. Page 13
Curr Nanosci. Author manuscript; available in PMC 2012 October 1.
NIH
-PA Author Manuscript
NIH
-PA Author Manuscript
NIH
-PA Author Manuscript
[37]. Oh HM, Kwon MS, Kim HJ, Jeon BH, Kim HR, Choi HO, Na BR, Eom SH, Song NW, Jun CD.Intermediate monomer-dimer equilibrium structure of native ICAM-1: implication for enhancedcell adhesion. Exp. Cell Res. 2011; 317(2):163–172. [PubMed: 20955696]
[38]. Sali A, Blundell TL. Comparative protein modelling by satisfaction of spatial restraints. J. Mol.Biol. 1993; 234(3):779–815. [PubMed: 8254673]
[39]. Gittes F, Mickey B, Nettleton J, Howard J. Flexural rigidity of microtubules and actin filamentsmeasured from thermal fluctuations in shape. J. Cell Biol. 1993; 120(4):923–934. [PubMed:8432732]
[40]. Humphrey W, Dalke A, Schulten K. VMD: Visual molecular dynamics. J. Mol. Graph. 1996;14(1):33–38. [PubMed: 8744570]
[41]. Lyman E, Pfaendtner J, Voth GA. Systematic multiscale parameterization of heterogeneouselastic network models of proteins. Biophys. J. 2008; 95(9):4183–4192. [PubMed: 18658214]
[42]. Rechendorff K, Witz G, Adamcik J, Dietler G. Persistence length and scaling properties ofsingle-stranded DNA adsorbed on modified graphite. J. Chem. Phys. 2009; 131(9):095103.[PubMed: 19739875]
[43]. Rivetti C, Guthold M, Bustamante C. Scanning force microscopy of DNA deposited onto mica:EquilibrationversusKinetic trapping studied by statistical polymer chain analysis. J. Mol. Biol.1996; 264(5):919–932. [PubMed: 9000621]
[44]. Fang Y, Wu J, McEver RP, Zhu C. Bending rigidities of cell surface molecules P-selectin andPSGL-1. J. Biomech. 2009; 42(3):303–307. [PubMed: 19144337]
[45]. Gautieri A, Russo A, Vesentini S, Redaelli A, Buehler MJ. Coarse-grained model of collagenmolecules using an extended MARTINI force field. J. Chem. Theory and Comput. 2010; 6(4):1210–1218.
[46]. Pampaloni F, Lattanzi G, Jonáš A, Surrey T, Frey E, Florin EL. Thermal fluctuations of graftedmicrotubules provide evidence of a length-dependent persistence length. Proc. Natl. Acad. Sci.USA. 2006; 103(27):10248–10253. [PubMed: 16801537]
[47]. Calderon AJ, Bhowmich T, Leferovich J, Burman B, Pichette B, Muzykantov VR, Eckmann DM,Muro S. Optimizing endothelial targeting by modulating the antibody density and particleconcentration of anti-ICAM coated carriers. J Control. Release. 2011; 150(1):37–44. [PubMed:21047540]
[48]. Yago T, Wu J, Wey CD, Klopocki AG, Zhu C, McEver RP. Catch bonds govern adhesionthrough L-selectin at threshold shear. J. Cell Biol. 2004; 166(6):913–923. [PubMed: 15364963]
[49]. Finger EB, Puri KD, Alon R, Lawrence MB, von Andrian UH, Springer TA. Adhesion throughL-selectin requires a threshold hydrodynamic shear. Nature. 1996; 379:266–269. [PubMed:8538793]
[50]. Whitfield M, Ghose T, Thomas W. Shear-stabilized rolling behavior of E. coli examined withsimulations. Biophys. J. 2010; 99:2470–2478. [PubMed: 20959087]
[51]. Calderon AJ, Muzykantov VR, Muro S, Eckmann DM. Flow dynamics, binding and detachmentof spherical carriers targeted to ICAM-1 on endothelial cells. Biorheology. 2009; 46:323–341.[PubMed: 19721193]
[52]. Ramanan V, Agrawal NJ, Liu J, Engles S, Toy R, Radhakrishnan R. Systems biology andphysical biology of clathrin-mediated endocytosis: an integrative experimental and theoreticalperspective. under review. 2010
[53]. McMahon HT, Gallop JL. Membrane curvature and mechanisms of dynamic cell membraneremodelling. Nature. 2005; 438:590–596. [PubMed: 16319878]
[54]. Liu J, Agrawal NJ, Ramanan V, Radhakrishnan R. Migration of curvature inducing proteins inresponse to mean curvature gradients: comparison of linear versus curvilinear models. underreview. 2010
[55]. Ramakrishnan N, Sunil Kumar PB, Ipsen JH. Monte Carlo simulations of fluid vesicles with in-plane orientational ordering. Phys. Rev. E. 2010; 81:041922.
[56]. Agrawal NJ, Nukpezah J, Radhakrishnan R. Minimal mesoscale model for protein-mediatedvesiculation in clathrin-dependent endocytosis. PLoS Comput. Biol. 2010; 6(9):e1000926.
Liu et al. Page 14
Curr Nanosci. Author manuscript; available in PMC 2012 October 1.
NIH
-PA Author Manuscript
NIH
-PA Author Manuscript
NIH
-PA Author Manuscript
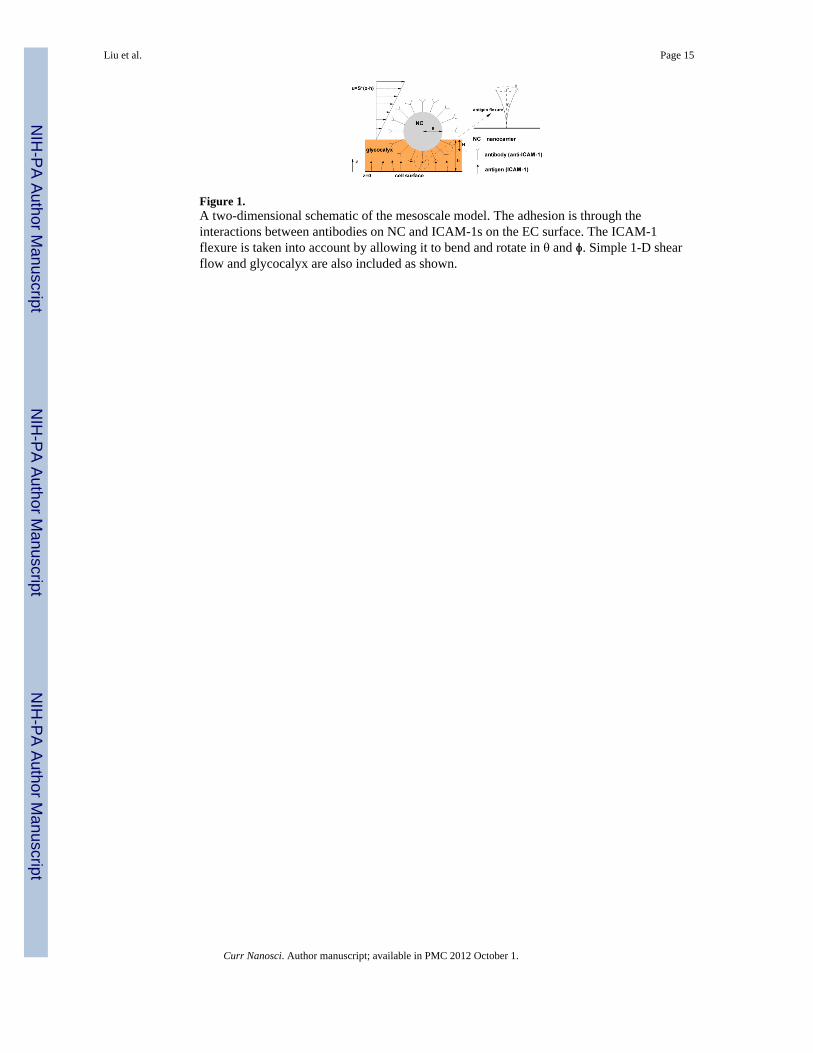
Figure 1.A two-dimensional schematic of the mesoscale model. The adhesion is through theinteractions between antibodies on NC and ICAM-1s on the EC surface. The ICAM-1flexure is taken into account by allowing it to bend and rotate in θ and ϕ. Simple 1-D shearflow and glycocalyx are also included as shown.
Liu et al. Page 15
Curr Nanosci. Author manuscript; available in PMC 2012 October 1.
NIH
-PA Author Manuscript
NIH
-PA Author Manuscript
NIH
-PA Author Manuscript
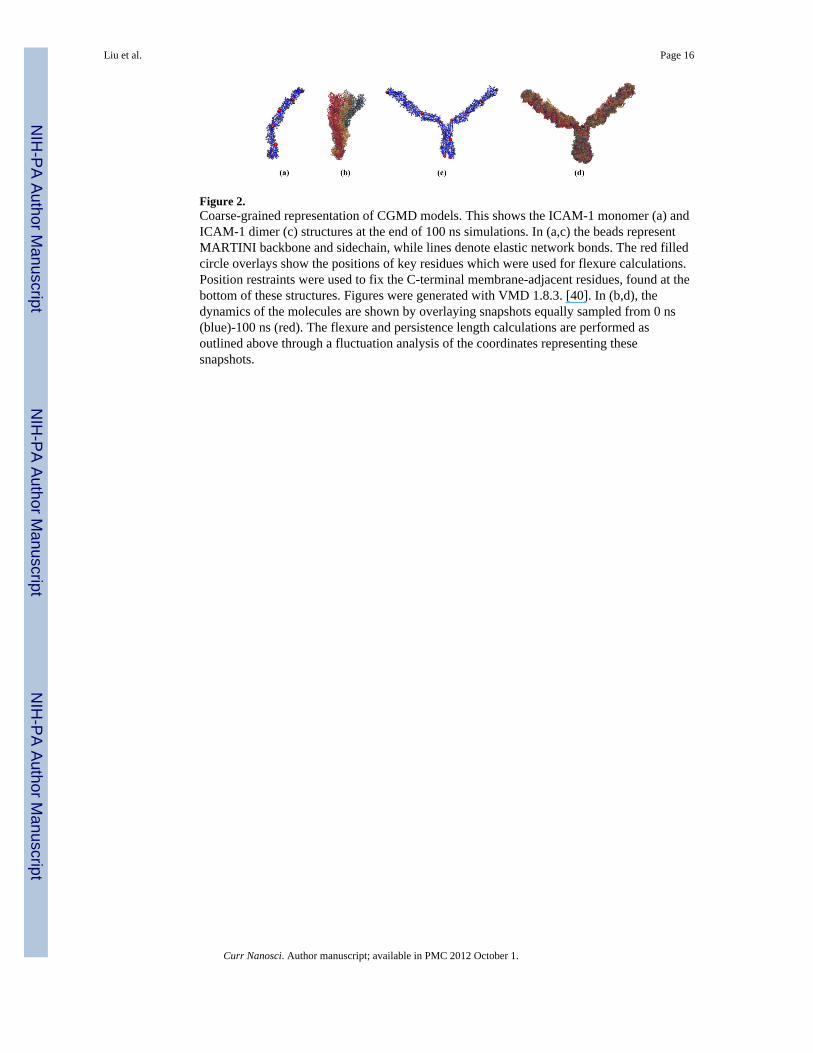
Figure 2.Coarse-grained representation of CGMD models. This shows the ICAM-1 monomer (a) andICAM-1 dimer (c) structures at the end of 100 ns simulations. In (a,c) the beads representMARTINI backbone and sidechain, while lines denote elastic network bonds. The red filledcircle overlays show the positions of key residues which were used for flexure calculations.Position restraints were used to fix the C-terminal membrane-adjacent residues, found at thebottom of these structures. Figures were generated with VMD 1.8.3. [40]. In (b,d), thedynamics of the molecules are shown by overlaying snapshots equally sampled from 0 ns(blue)-100 ns (red). The flexure and persistence length calculations are performed asoutlined above through a fluctuation analysis of the coordinates representing thesesnapshots.
Liu et al. Page 16
Curr Nanosci. Author manuscript; available in PMC 2012 October 1.
NIH
-PA Author Manuscript
NIH
-PA Author Manuscript
NIH
-PA Author Manuscript

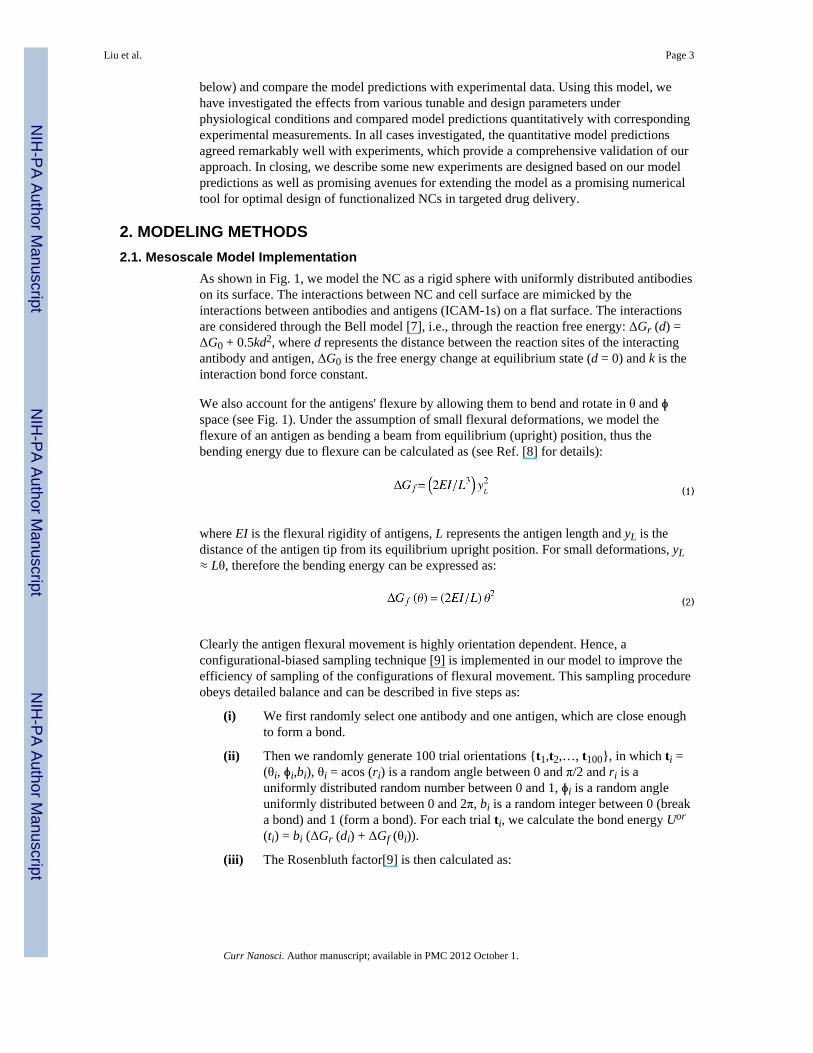
Figure 3.Calculation of flexure; two calculation methods were used to estimate flexure (top- tangentmethod and bottom- Fourier method). The logarithm slope of the tangent correlationfunction (top) is the inverse of the persistence length defined by Eq. (17). Fourier modeanalysis (bottom) from Eq. (15) provides independent estimates of flexural rigidity for eachmode; however, only the lowest modes are accurate.
Liu et al. Page 17
Curr Nanosci. Author manuscript; available in PMC 2012 October 1.
NIH
-PA Author Manuscript
NIH
-PA Author Manuscript
NIH
-PA Author Manuscript
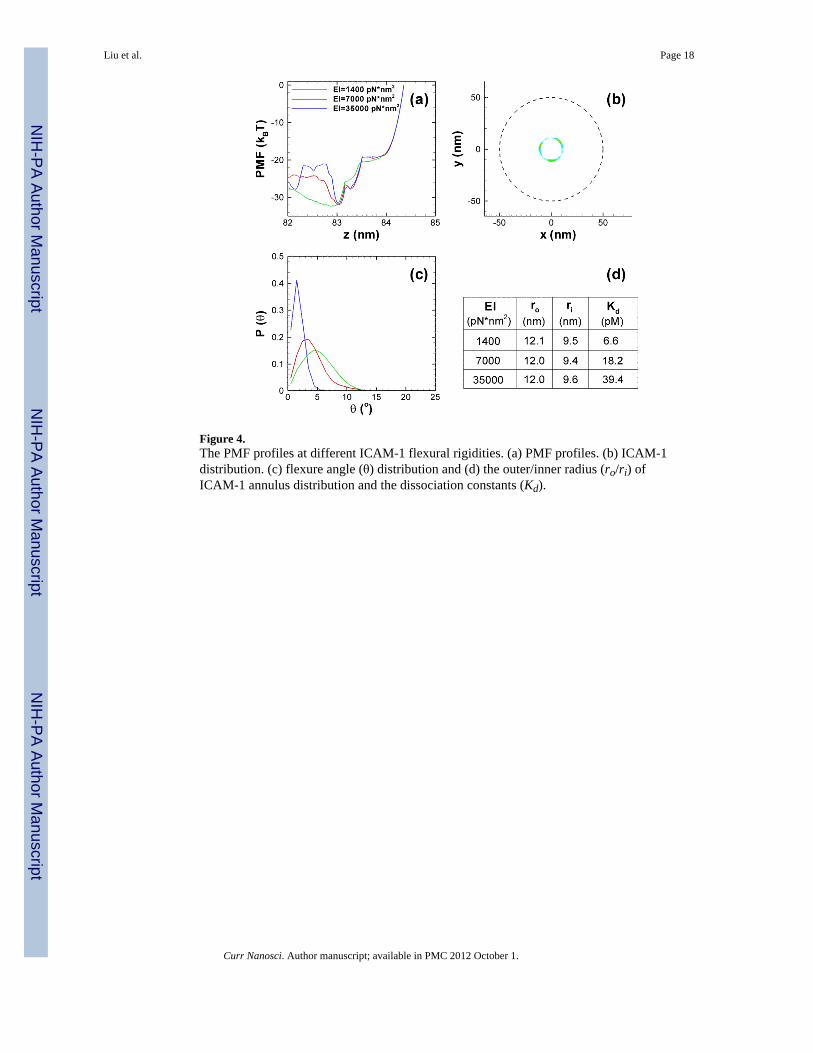
Figure 4.The PMF profiles at different ICAM-1 flexural rigidities. (a) PMF profiles. (b) ICAM-1distribution. (c) flexure angle (θ) distribution and (d) the outer/inner radius (ro/ri) ofICAM-1 annulus distribution and the dissociation constants (Kd).
Liu et al. Page 18
Curr Nanosci. Author manuscript; available in PMC 2012 October 1.
NIH
-PA Author Manuscript
NIH
-PA Author Manuscript
NIH
-PA Author Manuscript

NIH
-PA Author Manuscript
NIH
-PA Author Manuscript
NIH
-PA Author Manuscript
Liu et al. Page 19
Table 1
Summary of Model Parameters and the corresponding references.
Parameter Value Reference
Simulation surface area 1 μm2 [8]
Simulation height 0.5 μm [8]
NC diameter 100 nm [3]
Antigen length 19 nm [21]
Antibody length 15 nm [22]
Number of antigens 2000 [3]
Number of antibodies per NC 162 (74% of saturation) [3]
Δ G 0 −7.98×10⁻²⁰ J [3]
Bond spring constant, k 1000 dyn/cm [19]
Antigen flexural rigidity (1400–35000) pN·nm2 [10]
Glycocalyx height 100 nm [23]
Glycocalyx stiffness, kglyx 3.9×10⁹ J/m4 [14]
Curr Nanosci. Author manuscript; available in PMC 2012 October 1.

NIH
-PA Author Manuscript
NIH
-PA Author Manuscript
NIH
-PA Author Manuscript
Liu et al. Page 20
Table 2
Summary of flexure estimates by CGMD. This table shows flexure estimates for both Fourier mode analysisand tangent correlation functions, across the monomer and dimer systems. Each monomer in the dimer systemis reported separately, though they average to 18,000 pN·nm2. Though Fourier analysis provides anindependent estimate for flexure from each mode, all but the first are considered unreliable.
System Method Flexural Rigidity (pN·nm2) Persistence Length (nm)
Monomer1st Fourier Mode 800* 200
Tangent Correlation 500 100
Dimer (monomers A / B)1st Fourier Mode 12,000 / 24,000 3,000 / 5,000
Tangent Correlation 2,000 / 2,000 500 / 400
*We have also run simulations of ICAM-1 monomer in a straight conformation (as opposed to a bent conformation in the crystal structure). In this
case, a straightened monomer configuration yields a EI value within a few fold of the bent monomer configuration derived from the crystalstructure (data not shown).
Curr Nanosci. Author manuscript; available in PMC 2012 October 1.

NIH
-PA Author Manuscript
NIH
-PA Author Manuscript
NIH
-PA Author Manuscript
Liu et al. Page 21
Table 3
Common biomolecule persistence lengths derived from both experiment and theory. It is important to note thatmost of these systems show different persistence lengths under different experimental conditions.
Theory Expt. System Persistence Length
• DNA [42, 43] 5 nm (ss), 50 nm (ds)
• P-selectin [44] 20 nm
• • Collagen [45] 50 nm
• Glyco-proteins [10] 160 nm
• ICAM-1 (this work) 200 nm – 3 μm
• Actin [10, 39, 41] 0.5 – 20 μm
• Microtubules [39, 46] 0.5 – 10 mm
Curr Nanosci. Author manuscript; available in PMC 2012 October 1.

NIH
-PA Author Manuscript
NIH
-PA Author Manuscript
NIH
-PA Author Manuscript
Liu et al. Page 22
Table 4
The dissociation constants for different interactions. A comparison between model predictions andexperimental measurements. (Results are from Ref. [15])
Dissociation constant (Kd = 1/Ka) Model In vitro Experiment [3]
Antibody-ICAM-1 interaction 3.2 nM 8.5 nM
NC-cell interaction 18.2 pM (EI=7000 pN·nm2) 77 pM
Curr Nanosci. Author manuscript; available in PMC 2012 October 1.
Copyright © 2022 FDOKUMEN