University of Groningen Functionalized graphene sensors for ...
24
University of Groningen Functionalized graphene sensors for real time monitoring fermentation processes Chinnathambi, Selvaraj IMPORTANT NOTE: You are advised to consult the publisher's version (publisher's PDF) if you wish to cite from it. Please check the document version below. Document Version Publisher's PDF, also known as Version of record Publication date: 2020 Link to publication in University of Groningen/UMCG research database Citation for published version (APA): Chinnathambi, S. (2020). Functionalized graphene sensors for real time monitoring fermentation processes: electrochemical and chemiresistive sensors. University of Groningen. Copyright Other than for strictly personal use, it is not permitted to download or to forward/distribute the text or part of it without the consent of the author(s) and/or copyright holder(s), unless the work is under an open content license (like Creative Commons). The publication may also be distributed here under the terms of Article 25fa of the Dutch Copyright Act, indicated by the “Taverne” license. More information can be found on the University of Groningen website: https://www.rug.nl/library/open-access/self-archiving-pure/taverne- amendment. Take-down policy If you believe that this document breaches copyright please contact us providing details, and we will remove access to the work immediately and investigate your claim. Downloaded from the University of Groningen/UMCG research database (Pure): http://www.rug.nl/research/portal. For technical reasons the number of authors shown on this cover page is limited to 10 maximum. Download date: 08-01-2022
-
Upload
khangminh22 -
Category
Documents
-
view
1 -
download
0
Transcript of University of Groningen Functionalized graphene sensors for ...

University of Groningen
Functionalized graphene sensors for real time monitoring fermentation processesChinnathambi, Selvaraj
IMPORTANT NOTE: You are advised to consult the publisher's version (publisher's PDF) if you wish to cite fromit. Please check the document version below.
Document VersionPublisher's PDF, also known as Version of record
Publication date:2020
Link to publication in University of Groningen/UMCG research database
Citation for published version (APA):Chinnathambi, S. (2020). Functionalized graphene sensors for real time monitoring fermentationprocesses: electrochemical and chemiresistive sensors. University of Groningen.
CopyrightOther than for strictly personal use, it is not permitted to download or to forward/distribute the text or part of it without the consent of theauthor(s) and/or copyright holder(s), unless the work is under an open content license (like Creative Commons).
The publication may also be distributed here under the terms of Article 25fa of the Dutch Copyright Act, indicated by the “Taverne” license.More information can be found on the University of Groningen website: https://www.rug.nl/library/open-access/self-archiving-pure/taverne-amendment.
Take-down policyIf you believe that this document breaches copyright please contact us providing details, and we will remove access to the work immediatelyand investigate your claim.
Downloaded from the University of Groningen/UMCG research database (Pure): http://www.rug.nl/research/portal. For technical reasons thenumber of authors shown on this cover page is limited to 10 maximum.
Download date: 08-01-2022

98
Chapter 4

99
Fabrication of hydrothermally reduced graphene oxide electrodes for
potentiometric and chemiresistive pH measurements
Abstract
In this chapter, we report the synthesis of hydrothermally reduced graphene oxide (HRGO) as
a reagent-less sensing probe for the construction of a potentiometric and chemiresistive pH
sensor. We used cyclic voltammetry (CV) to study the chemical and electrochemical nature of
the functional groups present on the HRGO. We found that HRGO contains quinone-like
functional groups. The CV of HRGO showed reversible quinone/hydroquinone-like redox
couples in different buffers with a pH range from 2-8. In the presence of dissolved oxygen,
the HRGO electrode showed an oxygen reduction peak, which is absent when the electrode is
placed in an N2 saturated buffer. The absence of the O2 reduction peak indicates that the
quinone-like groups on HRGO have catalytic activity towards oxygen reduction. The HRGO
modified electrode, used as a potentiometric sensing probe, showed a sensitivity of 66 mV /
pH for a freshly prepared electrode and after a few exposures to different buffers, a stable
sensitivity of 55 mV / pH was obtained in a pH range from 2 – 12. In the chemiresistive
sensing mode, the HRGO electrode showed a sensitivity of 1000 Ω / pH in a pH range from
4-7. Reduced graphene oxide also was prepared by chemical and electrochemical reduction
methods to compare the influence of the reduction process on the pH sensor performance.
Although (electro)-chemically reduced graphene oxide electrodes contain surface functional
groups similar to HRGO, the electrodes showed a poor response in buffers with a pH higher
than 7.

100
4.1. Introduction
The pH is an important analytical parameter in many chemical and biological processes.
There are several techniques available to detect pH, which includes potentiometry,
amperometry, and chemiresistive methods. The glass-electrode is the most successfully used
potentiometric pH sensor and is widely accepted in the laboratory and industrial applications.
The ongoing miniaturization of laboratory equipment also requires the availability of small
sensors. This led to the exploration of new pH sensing techniques for use in applications that
require small sensors, e.g., microtiter plates, and in vivo tissue measurements. ISFET and
optical pH sensors are alternative sensors and can be constructed in tiny housings. However,
the drift and limited pH range is a significant drawback of ISFET and optical pH sensors [1-
2].
Oxygen-rich carbon materials are attractive for the construction of a pH sensing probe [3].
The carbon surface of the material contains a variety of functional groups, including
carboxylic acid, phenol, quinones, and carbonyl groups [4,5]. These functional groups are
sensitive towards pH and they undergo protonation and de-protonation reactions depending
on the pH. The presence of these functional groups on the surface turns the material into a
potential candidate for the construction of a reagent-less pH sensing probe. The pH-sensitive
molecules can be immobilized onto carbon surfaces in several ways. Chemical and
electrochemical activation, physical adsorption of pH-sensitive molecules, and composite
formation with carbon are popular immobilization methods [6-15]. The pH-sensitive
molecules are attached to the carbon surface through covalent and non-covalent bonding [15-
17]. Electrochemical oxidation is one of the easiest and efficient ways to covalently attach
pH-sensitive molecules to the surface. The carbon electrode is oxidized by applying a
potential higher than 1.0 V to electrochemically produce oxo functional groups like COOH,

101
C=O, and C-OH. The electrochemical reduction of aryl diazonium compounds at the carbon
surface also results in covalent attachment of pH-sensitive molecules [17-20].
Hydrothermally reduced graphene oxide (HRGO) is a typical material with abundant oxo
functional groups. It is produced through the bulk oxidation of graphite into graphene oxide
and then reduced under hydrothermal conditions. The hydrothermal reduction is one of the
greenest ways for the synthesis of reduced graphene oxide [21, 22]. At hydrothermal
conditions, super-heated water molecules catalyze the reduction of the oxo functional groups.
Reduced graphene oxide, obtained through hydrothermal reduction, contains more oxygen-
containing functional groups compared to other reduction processes. Under hydrothermal
conditions, the reduction occurs due to the acid-catalyzed dehydration through the protonation
of oxide functional groups in a reversible manner. As a result of this reversibility, some of the
functional groups like epoxides and alcohols are still present after the reduction process has
been completed [21]. C-13 NMR was used to identify the functional groups present on the
graphene oxide after hydrothermal reduction. The abundant oxygen functionalities on the
HRGO was explored for supercapacitor applications [23]. The contribution of pseudo-
capacitance, due to redox reactions of the functional groups, contributed to the high
capacitance of the material. However, the chemical/electrochemical nature of these functional
groups is not explored further. In this chapter, we investigated the nature of the functional
groups using cyclic voltammetry and studied the properties of HRGO as a potential reagent-
less pH sensing probe.

102
4.2. Experimental methods and physiochemical characterization
4.2.1. Material preparation
Graphite oxide (GO) was prepared according to Hummers’ method [24]. In a typical
procedure, 3 g of graphite flakes (Sigma-Aldrich) was dispersed in 69 ml of H2SO4 (Merck),
and 1.5 g of sodium nitrite (Sigma-Aldrich) was added to the suspension while stirring. Then
the suspension was placed in an ice bath and continuously stirred, followed by the slow
addition of 9 g KMnO4 (Sigma-Aldrich). Subsequently, 400 ml of distilled water was
cautiously added to the mixture. The temperature quickly rose to 90° C, and this temperature
was maintained for 15 minutes. Afterward, 7.5 ml of 30% H2O2 (Sigma-Aldrich) was added,
and the color of the suspension changed from brown to yellow. Finally, the GO suspension
was washed several times with 5% HCl (Merck) and Milli Q water.
For HRGO preparation, 50 mg GO was dispersed in 50 ml ultra-pure water sonicated for 12
hrs. Afterward, the dispersion was autoclaved at 130 ºC for 6 hours. After hydrothermal
treatment, the black dispersion was separated by centrifugation. Then the suspension was
repeatedly washed with water and re-dispersed in isopropanol. For comparison, reduced
graphene oxide also prepared by chemical and electrochemical methods. Two types of
chemically reduced graphene oxide (CRGO) electrodes were prepared using sodium
dithionite (sodium hydrosulfite) or sodium borohydride as reducing agents [25].
4.2.2. Electrochemical pH sensing
The responses of the HRGO modified electrodes were measured by immersing the electrode
in solutions with different pH values (pH 2.0 – pH 12). The Britton and Robinson (B-R)
universal buffer solution (0.04 M H3PO4, 0.04 M CH3COOH, and 0.04 M H3BO3) was titrated
with 0.2 N NaOH to adjust the pH to the desired value [26]. For the potentiometric sensor, a 2

103
mm gold disc, platinum wire, and Ag / AgCl were used as working, counter, and reference
electrode, respectively (CH Instruments, Austin, Texas, USA). The electrochemical
measurements were performed with a CH-Instruments potentiostat (CH600 and CH760). A
three-compartment electrochemical cell was used for the analyses. Potentiometric responses
were obtained by measuring the open circuit potential (OCP) against an Ag / AgCl reference
electrode, and changes in the potential values were used as the sensor signal. For cyclic
voltammetry, an R-B buffer was used for the pH range from 2-6, and 0.2 M phosphate buffer
was used for the pH range from 7-8. For all pH measurements, 0.1 M KCl was used as a
supporting electrolyte.
For chemiresistive sensing, 2 µl of HRGO dispersed in isopropanol was drop-casted on the
interdigitated gold-electrode. Two leads of the electrode were connected to the potentiostat
for data acquisition. A potential of 100 mV was applied between the source and the drain, and
the output current was measured over time. The resistance value of the HRGO-deposited
electrode was obtained through Ohms law.
4.3. Results and discussion
4.3.1. Material characterization
The formation of HRGO was characterized by FT-IR spectroscopy. The FT-IR spectrum of
GO (Fig. 4.1) showed strong peaks at 1700 cm-1, and 1010 cm-1, which are due to -C=O and -
C-O stretching of the COOH and epoxide functional groups, respectively. The intensity of
these peaks is reduced drastically after the hydrothermal reduction. This indicates the removal
of oxo functional groups and partial restoration of the sp2 hybridized carbon conductive
network [25, 27].

104
Figure 4.1: The FT-IR spectrum of GO and HRGO
The Raman spectra of GO and HRGO show two broad peaks around 1350 cm-1 and 1500 cm-
1, corresponding to the D and G mode of vibration (Fig 4.2). The G peak relates to E2g in the
plane vibration mode of graphite lattices, and the D peak corresponds to the K2 phonons of
the A2g symmetrical vibration mode [25, 27]. The D peak is considered to be indicative for the
number of defective sites in the graphene sheets. The higher the D peak, the higher are the
number of the defects.
Figure 4.2: Raman spectra of GO and HRGO
500 1000 1500 2000 2500 3000 3500500 1000 1500 2000 2500 3000 3500500 1000 1500 2000 2500 3000 3500
Inte
nsit
y / a
.u.
ID/I
G - 0.99
wavenumber / cm-1
HRGOID/I
G - 1.03
D+G2D
GO film

105
Transmission electron microscopic (TEM) images of parent GO and after the hydrothermal
reduction (HRGO) were taken and shown in Fig. 4.3. The TEM images showed a thin
graphene film with wrinkle formation and crumpled graphene sheets.
Figure 4.3: TEM images of GO (a and b), and HRGO (c and d).
4.3.2. Potentiometric pH sensing
The potentiometric response of the HRGO modified electrode was obtained for the pH range
from 2 to 12. The measurements are carried out by recording the potential differences against
Ag / AgCl. The potential differences occur because of the reversible
protonation/deprotonation of the oxo functional groups present on HRGO and follow the
Nernst equation shown in Eqn.1.
E = E° + [2.303RT / F] log [H+] (1)
(a))
(b)
(c) (d)

106
The HRGO electrode gave a near Nernstian response of 66 mV / pH for the first measurement
(Fig. 4.4 (a,b). After repeated experiments, the electrode showed a stable response of 55 mV /
pH (Fig. 4.4 (c,d)). The change of sensitivity in consecutive experiments is due to irreversible
de-protonation of the oxo functional groups at higher pH values. The response time and
stability of HRGO were obtained by continuously monitoring the open circuit potential over
some time while the pH of the solution was changed by the addition of 0.2 N NaOH (Fig. 4.4
(a,c)). From the graph, it can be seen that the HRGO electrode has good stability with a
response time of a few seconds.
The high sensitivity of the HRGO modified electrode indicates that it contains
electrochemically active pH-sensitive oxo functional groups that dominate the sensing
response. The hydrothermal reduction of GO is based upon acid-catalyzed dehydration of oxo
functional groups. Some of the oxo functional groups were not reduced during the
hydrothermal treatment because of the reversible nature of the dehydration process [21].
These remaining oxo functional groups are responsible for the pH-dependent potentiometric
response of the HRGO electrode.

107
Figure 4.4: Potentiometric measurements. The Continuous potential measurement of the
HRGO electrode in a buffer with increasing pH from 3 to 12 with respect to time (A),
corresponding potential versus pH plot for the first measurements (B), the potential
measurements of the electrode in a buffer with the pH from 3 to 12 and 12 to 2 with respect to
time (C), and the corresponding potential versus pH plot (D).
The pH response of chemically reduced GO (CRGO) has also been tested. Two reducing
agents, sodium dithionite and sodium borohydride, were used for the chemical reduction of
GO. Fig. 4.5 shows the potentiometric response of CRGO obtained using sodium dithionite
(CRGO-SS) when exposed to buffers with different pH. The CRGO-SS electrode showed a
linear response in the pH range from 2 to 9 with a sensitivity of 52 mV / pH (Fig. 5a,b) but a
poor response at a pH higher than 7 (Fig. 4.5 (c,d)).
0 5000 10000 15000 20000 25000
-0.1
0.0
0.1
0.2
0.3
0.4
0.5pH 2
pH 11Po
ten
tial (V
) V
s A
g / A
gc
l
Time / s
pH 3
pH 4
pH 5
pH 6
pH 7
pH 8
pH 9
pH 10
pH 12
pH 3
pH 4
pH 5
pH 6
pH 7
pH 8
pH 9
pH 10
pH 11
(c)
2 4 6 8 10 12
-0.1
0.0
0.1
0.2
0.3
0.4
Po
ten
tia
l (V
) v
s A
g /
Ag
cl
pH
pH 3-12
E = 0.548 - 0.052 pH
pH 12-2
E = 0.550 - 0.52 pH
(d)
2 4 6 8 10 12
-0.1
0.0
0.1
0.2
0.3
0.4
0.5
0.6
pH
Po
ten
tia
l (V
) v
s A
g /
Ag
cl
(b)
E = 0.748 - 0.066 pH
0 1000 2000 3000 4000 5000 6000
-0.1
0.0
0.1
0.2
0.3
0.4
0.5
0.6
pH 12
pH 9
pH 8
pH 7
pH 6
pH 5
pH 4
pH 10
Po
ten
tia
l (V
) (A
g /
Ag
Cl)
Time / s
pH 3 (a)
108
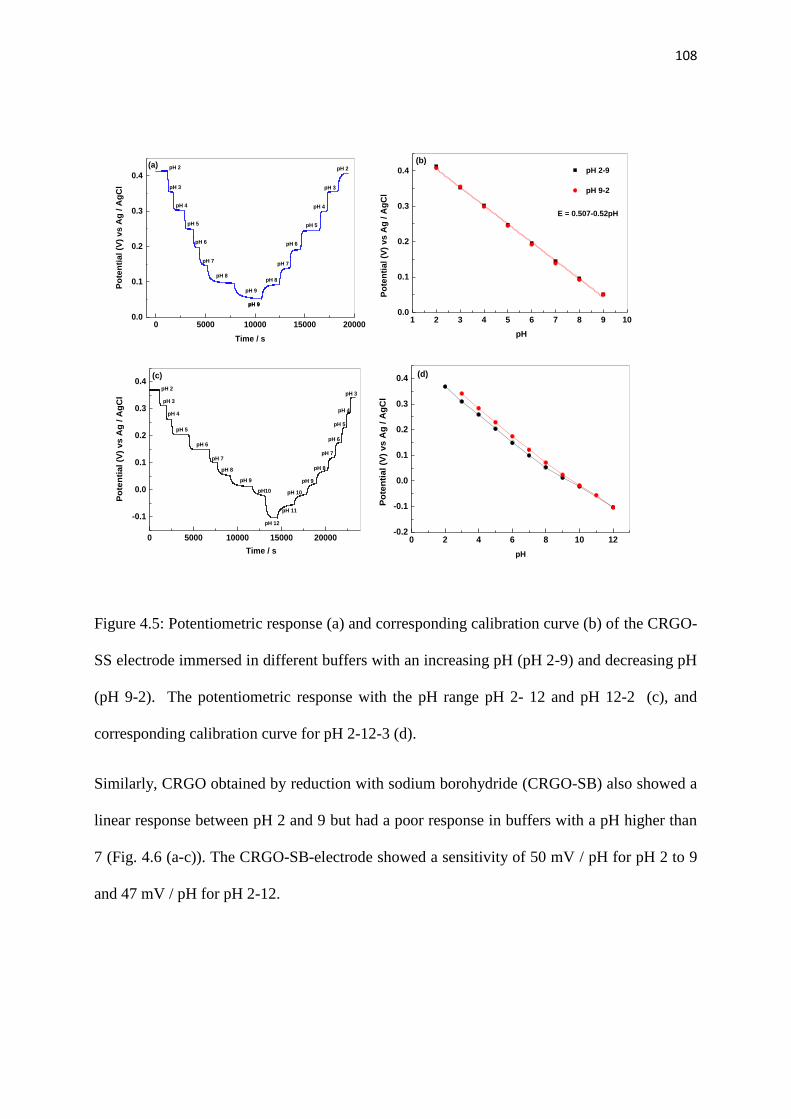
Figure 4.5: Potentiometric response (a) and corresponding calibration curve (b) of the CRGO-
SS electrode immersed in different buffers with an increasing pH (pH 2-9) and decreasing pH
(pH 9-2). The potentiometric response with the pH range pH 2- 12 and pH 12-2 (c), and
corresponding calibration curve for pH 2-12-3 (d).
Similarly, CRGO obtained by reduction with sodium borohydride (CRGO-SB) also showed a
linear response between pH 2 and 9 but had a poor response in buffers with a pH higher than
7 (Fig. 4.6 (a-c)). The CRGO-SB-electrode showed a sensitivity of 50 mV / pH for pH 2 to 9
and 47 mV / pH for pH 2-12.
1 2 3 4 5 6 7 8 9 100.0
0.1
0.2
0.3
0.4
Po
ten
tia
l (V
) v
s A
g /
Ag
Cl
pH
pH 2-9
pH 9-2
E = 0.507-0.52pH
(b)
0 5000 10000 15000 200000.0
0.1
0.2
0.3
0.4
Po
ten
tia
l (V
) v
s A
g /
Ag
Cl
Time / s
(a)
pH 3
pH 5
pH 6
pH 7
pH 8
pH 9
pH 2
pH 9
pH 4
pH 9
pH 2
pH 3
pH 4
pH 5
pH 6
pH 7
pH 8
0 5000 10000 15000 20000
-0.1
0.0
0.1
0.2
0.3
0.4
pH 7
pH 9
pH10
pH 12
Po
ten
tial (V
) vs
Ag
/ A
gC
l
Time / s
pH 2
pH 3
pH 4
pH 5
pH 6
pH 7
pH 8
pH 9
pH 11
pH 10
pH 6
pH 5
pH 4
pH 3
pH 8
(c)
0 2 4 6 8 10 12-0.2
-0.1
0.0
0.1
0.2
0.3
0.4P
ote
nti
al
(V)
vs
Ag
/ A
gC
l
pH
(d)

109
Figure 4.6: Potentiometric response (a) of the CRGO-SB electrode immersed in different
buffers with an increasing pH (pH 2-9) and the corresponding calibration curve for pH 2-9 (b)
and pH 2-12 (c).
From the three RGO’s (HRGO, CRGO-SS, CRGO-SB), only the electrode constructed with
HRGO showed good sensitivity and linear response in the pH range 2-12. The CRGO-SS and
CRGO-SB electrodes were sufficiently sensitive but showed a longer response time in buffers
with a pH above 7. This indicates that HRGO contains functional groups that are active at a
higher pH. To further understand the nature of the functional groups present in these
materials, cyclic voltammetry was used to characterize the materials.
0 4000 8000 12000 16000
-0.1
0.0
0.1
0.2
0.3
0.4
pH 10
pH 2
Po
ten
tia
l (V
) v
s A
g /
Ag
Cl
Time / s
pH 3
pH 4
pH 5
pH 6
pH 7
pH 8
pH 9
pH 11
pH 12
(a)
2 4 6 8 10 12
-0.1
0.0
0.1
0.2
0.3
0.4
Po
ten
tial (V
) V
s A
g / A
gC
l
pH
E = 0.470-0.047 pH
(c)
1 2 3 4 5 6 7 8 9 100.0
0.1
0.2
0.3
0.4
E = 0.483-0.050 pH
Po
ten
tial (V
) V
s A
g / A
gC
l
pH
(b)

110
4.3.3. Cyclic Voltammetry of pH-dependent HRGO
Cyclic voltammetry (CV) measurements were carried out to understand the electrochemical
nature and redox properties of the oxo functional groups that are responsible for pH sensing.
Initially, voltammograms were recorded in 1M H2SO4 electrolyte, and a potential range of -
0.3V to 0.8 V was applied (Fig. 4.7). During the positive scan, the oxidation potential
appeared at 0.380 V (vs Ag/AgCl), and during the backward scan, the reduction potential
appeared at 0.320 V (vs Ag/AgCl). These redox potentials were related to the
quinone/hydroquinone redox-couple [26-27]. The anodic potential corresponds to
hydroquinone oxidation, and the cathodic potential refers to quinone reduction. The
difference between anodic and cathodic potential is 60 mV, which is indicative of a two-
electron and two-proton reduction process related to quinone/hydroquinone-like redox-
couples. Voltammograms measured at a scan rate of 50 and 100 mV/s showed that the current
increases with increasing scan rate (Fig 4.7). At a higher scan rate, the effect of background
capacitance is higher; therefore, a low scan rate of 1 mV/s was selected for further pH
dependent CV measurements (Fig. 4.8-4.12). Subsequently, cyclic voltammograms were
measured for the HRGO electrode immersed in buffers with a different pH (Fig. 4.8). The
voltage limit was adjusted as a function of the pH.

111
Figure 4.7: CV measurements of the HRGO electrode immersed in 1 M H2SO4 from -0.3 V to
0.8 V at a scan rate of 50 and 100 mV / s.
When the pH buffer changed from 2 to 8, the redox potential became more negative and
shifted towards the cathodic direction. When the pH increases, well-defined oxidation peaks
were observed up to pH 8, but cathodic peaks are not clearly seen for pH 7 and 8. The anodic
potential values obtained with the HRGO electrode were plotted against the pH of the buffer.
The slope of the regression line was 57 mV / pH with an R2 of 0.9988, indicating Nernstian
behavior (Fig. 4.8(b)).
Figure 4.8: CV measurement of the HRGO electrode immersed in different R-B buffers with a pH
from 2 to 8 at a scan rate of 1 mV / s (A); Plot of the anodic potential of the HRGO electrode with
respect to the pH (B).
-0.2 0.0 0.2 0.4 0.6 0.8-3
-2
-1
0
1
-0.2 0.0 0.2 0.4 0.6 0.8
(a)
Cu
rre
nt
/ A
Potential (V) Vs Ag / AgCl
pH 2
pH 3
pH 4
pH 5
pH 6
pH 7 pH 8
1 2 3 4 5 6 7 8 9
0.00
0.07
0.14
0.21
0.28
0.35
pH
Po
ten
tia
l V
s A
g /
Ag
Cl
Slope - 57 mV / pH
R2 - 0.9988
E = 0.435-0.057 pH
(b)
-0.4 -0.2 0.0 0.2 0.4 0.6 0.8
-0.30
-0.15
0.00
0.15
0.30
-0.4 -0.2 0.0 0.2 0.4 0.6 0.8
-0.30
-0.15
0.00
0.15
0.30
Potential (V) Vs Ag / Agcl
Cu
rre
nt
/ m
A

112
The results suggested that the pH response of HRGO was due to the presence of oxo
functional groups on the graphene sheets. There are three different oxo functional groups
present on GO (carboxylic acid, alcohol, and epoxides). The redox peaks on the
voltammograms suggests that the -OH group presents on the adjacent carbon atom or at the
para position at the basal plane.
At pH > 6, the anodic peaks are not visible because they are concealed by the oxygen
reduction peak in the presence of dissolved oxygen. The CV measurements were carried out
in O2, and N2 saturated buffers at pH 3, 5, and 7 to understand the oxygen interference in
more detail (Fig. 4.9). It can be seen that in the absence of oxygen, explicit oxidation and
reduction peaks corresponding to the quinone-hydroquinone redox couples are present.
Although oxygen interfered with the measurement, oxygen did not affect the position of
oxidation potential.
Figure 4.9: CV measurements of the HRGO electrode immersed in pH buffers 3, 5, and 7,
saturated with oxygen (a) and saturated with N2 (b). The scan rate was 1 mV / s.
The CV of the HRGO electrode was compared with the CV of the ERGO electrode to look
for indications that hydroquinone redox peaks are present in ERGO as well (Fig. 4.10). The
CV of the ERGO electrode also showed a redox peak corresponding to the
-0.8 -0.4 0.0 0.4 0.8
-4.5
-3.0
-1.5
0.0
1.5(a)
Cu
rre
nt
/ A
Potential (V) Vs Ag / AgCl
pH 3
pH 5
pH 7
-0.8 -0.4 0.0 0.4 0.8
-1.6
-0.8
0.0
0.8
1.6
Cu
rre
nt
/ A
Potential (V) Vs Ag / AgCl
pH 3
pH 5
pH 7
(b)

113
quinone/hydroquinone redox couple but with a reduced current intensity compared to the
redox peak of the HRGO electrode. The anodic peak position also shifted to a more positive
potential in the case of the ERGO electrode. The main differences occurred in the reversibility
of the redox couples. The redox peak in ERGO is quasi-reversible with a difference of 190
mV while HRGO contains a highly reversible redox peak with a difference of 78 mV.
Figure 4.10: Comparison of cyclic voltammetry of an HRGO and ERGO electrode immersed
in an N2 saturated R-B buffer with pH 3 (A) and pH 7 (B). The scan rate was 1 mV / s.
Similarly, the CRGO-SS and CRGO-SB electrodes were electrochemically characterized
with CV. Fig.4.11 shows the cyclic voltammetry measurements of the CRGO-SS electrode.
The CV shows highly reversible quinone/hydroquinone redox-couples as it was also the case
with the HRGO and ERGO electrodes. The redox peak shifted cathodically with increasing
pH (Fig. 4.11 (a)). For every increasing pH unit, there is a potential shift of 51 mV in the
negative direction (Fig. 4.11(b)).
-0.4 -0.2 0.0 0.2 0.4 0.6 0.8
-0.16
-0.08
0.00
0.08
0.16
0.24
-0.4 -0.2 0.0 0.2 0.4 0.6 0.8-1.5
-1.0
-0.5
0.0
0.5
1.0
1.5
ERGO-pH 3
Potential (V) Vs Ag / AgCl
Cu
rre
nt
/ A
HRGO-pH 3
(a)
-0.8 -0.6 -0.4 -0.2 0.0 0.2 0.4 0.6 0.8
-0.1
0.0
0.1
0.2
-0.8 -0.6 -0.4 -0.2 0.0 0.2 0.4 0.6 0.8-1.5
-1.0
-0.5
0.0
0.5
1.0
1.5(b)
Potential (V) Vs Ag / AgCl
ERGO-pH 7
Cu
rre
nt
/ A
HRGO-pH 7

114
Figure 4.11: Cyclic voltammetry of the CRGO-SS electrode in pH buffers from 3 to 8 (a);
Plot of the potential shift of the CRGO-SS electrode versus the pH of the buffer (b). The scan
rate was 1 mV / s.
The CV of the CRGO-SB electrode showed a similar behavior as the CRGO-SS electrode
(Fig. 4.12). The pH-dependent redox peak corresponding to the quinone/hydroquinone redox
couples were clearly visible in the pH range 2 to 8.
Figure 4.12: CV measurements of the CRGO-SB electrode immersed in different buffers with
a pH from 2 to 8 (a). Plot of the potential shift of the CRGO-SB electrode versus the pH of
the buffer (b). The scan rate was 1 mV / s.
-0.8 -0.6 -0.4 -0.2 0.0 0.2 0.4 0.6 0.8 1.0
-2
-1
0
1
2
Cu
rre
nt
/ A
Potential (V) vs Ag / AgCl
pH 3
pH 4
pH 5
pH 6
pH 7
pH 8
(a)
3 4 5 6 7 8
0.00
0.05
0.10
0.15
0.20
0.25
0.30
Po
ten
tia
l (V
) V
s A
g /
Ag
Cl
pH
E = 0.417-0.051 pH
(b)
-0.6 -0.4 -0.2 0.0 0.2 0.4 0.6 0.8
-2
-1
0
1
2
Cu
rre
nt
/ A
Potential (V) Vs Ag / AgCl
pH 2
pH 3
pH 4
pH 5
pH 6
pH 7
pH 8
(a)
2 3 4 5 6 7 8
0.0
0.1
0.2
0.3
Po
ten
tial
(V)
vs
Ag
/ A
gC
l
pH
E = 0.386 - 0.051 pH
(b)

115
The CV investigations of the RGO’s indicate that the three RGO’s contain quinone and
hydroquinone-like functional groups that showed pH-dependent redox peaks.
4.3.4. Chemiresistive sensing of HRGO
For chemiresistive sensing, HRGO was dispersed in isopropanol and drop-casted on an
interdigitated gold electrode and dried at 100 0C for 12 hours. The I-V characteristics of the
HRGO electrode were measured between 0.1 to 1 V (Fig 13). A linear relationship was
obtained indicative of ohmic contact formation between the HRGO sheets and the gold
electrode surface. It can also be seen that after Nafion coating, the resistance of the HRGO
electrode was increased.
Figure 4.13: I-V curve of the HRGO electrode.
The chemiresistive response of the HRGO electrode was studied in different buffers with a
pH between 3 and 7 (Fig. 4.14). The HRGO electrode showed a response when exposed to pH
buffer from 3to 7. It showed a poor response for the pH below 3 and also for pH above 7.
0.0 0.2 0.4 0.6 0.8 1.00.0
-0.2
-0.4
-0.6
-0.8
-1.0
HRGO-1.083 K
HRGO-NA-1.534 K
Cu
rre
nt
/ m
A
Voltage / V

116
Figure 4.14: Chemiresistive response of the HRGO-NA electrode immersed in different
buffers with the pH between 3 and 7.
4.4. Conclusion
The role of oxygen functional groups present on the reduced graphene oxide was investigated
for pH sensing application. Three types of reduced graphene oxide was prepared by
hydrothermal (HRGO) and chemical reduction (CRGO) method. For the chemical reduction
method sodium thionite (CRGO-SS) and sodium borohydride (CRGO-SB) reducing agents
were used for the reduction process. All three reduced graphene oxide showed similar pH
response. HRGO showed linear response for the pH range 2-12 with the sensitivity of 52 mV
/ pH. The CRGO-SS and CRGO-SB also showed similar response. The notable differences in
the sensor response appeared for the pH higher than 7. HRGO showed linear response for pH
ranges from 2 – 12 while CRGO-SS and CRGO-SS showed poor response for the pH above
7.
The electrochemical nature of functional groups present on hydrothermally reduced graphene
oxide was investigated using cyclic voltammetry. The CV studies indicated that quinone-like
functional groups were present on the HRGO. The CVs showed reversible quinone and
0 500 1000 1500 2000 2500-84
-81
-78
-75
-72
pH 3
cu
rre
nt
/ A
Time / s
pH 4
pH 5
pH 6
pH 7
(a)
4000 6000 8000 10000
-92
-88
-84
-80
cu
rre
nt
/ A
Time / s
pH 3pH 4
pH 5
pH 6
pH 7
pH 4
pH 5
pH 6
pH 7
(b)

117
hydroquinone-like peaks in the pH range from 2-8. These quinone-like moieties promote the
reduction of dissolved oxygen. Hence, the removal of dissolved oxygen is necessary for the
accurate measurement of the reduction peak potential at a pH higher than 6. These redox
peaks were appeared with reduced current intensity for ERGO, which is indicative for a low
amount of quinone/hydroquinone species on the surface. The CRGO electrode also showed
quinone/hydroquinone redox peaks similar to the HRGO electrodes, but showed poor pH
response for a pH above 7.
4.5. References
1. S. Jamas, An analytical technique for counteracting drift in ion‐selective field effect
transistors (ISFETs). IEEE Sensors Journal 6 (2004) 795‐801.
2. E. Krommenhoek, Integrated sensor array online monitoring fermentation process, phd
thesis (2007) Enschede, The Netherlands
3. H. Kahlert, Functionalized carbon electrodes for pH determination, J Solid State
Electrochem 12 (2008) 1255–1266.
4. R. L. McCreery, Electroanalytical Chemistry a Series of Advances, ed. A. J. Bard,
Marcel Dekker, New York, 1991, 221–374.
5. C. A. Thorogood, G. G. Wildgoose, J. H. Jones and R. G. Compton, Identifying
quinone-like species on the surface of graphitic carbon and multi walled carbon
nanotubes using reactions with 2,4-dinitrophenylhydrazine to provide a voltammetric
fingerprint, New J. Chem., 31 (2007) 958–965.
6. G. G. Wildgoose, P. Abiman and R. G. Compton, Characterising chemical
functionality on carbon surfaces, J. Mater. Chem., 19 (2009) 4875–4886.
7. R. B. Mathur, J. Mittal, and P. Bahl, Characteristics of KMnO4 modified PAN fibres
and its influence on the resulting carbon fibres proberties, Carbon, 32 (1994) 71-77.

118
8. E. Zepesváry, E. Pungor, Potentiometric determination of acids and bases with a
silicone rubber based graphite electrode as indicationg electrode, Anal Chim Acta 54
(1971) 199.
9. C. A. Thorogood, G. G. Wildgoose, A. Crossley, R. M. J. Jacobs,
J. H. Jones, and R. G. Compton, Differentiating between ortho- and para-
Quinone Surface Groups on Graphite, Glassy Carbon, and Carbon Nanotubes Using
Organic and Inorganic Voltammetric and X-ray Photoelectron Spectroscopy Labels,
Chem. Mater., 20 (2007) 4964-4974.
10. H. Diissel, J. Komorsky-Lovric, and F. Scholz, A Solid Composite pH Sensor Based on
Quinhydrone Electroanalysis 7 (1995) 9.
11. H. Jankowska, S. Neffe, A. Swiatkowski, Investigations of the electrochemical
properties of activated carbon and carbon black, Electrochim Acta 26 (1981) 1861.
12. J. L. Bahr, J. Yang, D. V. Kosynkin, M. J. Bronikowski, R. E. Smalley, and J. M.
Tour, Functionalization of Carbon Nanotubes by Electrochemical Reduction of Aryl
Diazonium Salts: A Bucky Paper Electrode, J. Am. Chem. Soc. 123 (2001) 6536-6542.
13. A. L. Beilby, T. A. Sasaki, and H. M. Stem, Electrochemical Pretreatment of Carbon
Electrodes as a Function of Potential, pH, and Time Anal. Chem. 67 (1995) 976-980
14. J. Pinson and F. Podvorica. Attachment of organic layers to conductive or
semiconductive surfaces by reduction of diazonium salts, Chem. Soc. Rev., 34 (2005)
429–439
15. M. Delamar, G. De´sarmot, O. Fagebaume, R. Hitmi, J. Pinson, J. M. Save´ant,
Modification of carbon fiber surfaces by electrochemical reuduction of aryl diazonium
salts: Application to carbon epoxy composites. Carbon 35 (1997) 801-807.

119
16. A. Anderson, J. Phair, J. Benson, B. Meenan, J. Davis, Investigating the use of
endogenous quinoid moieties on carbon fibre as means of developing micro pH
sensors, Materials Science and Engineering C, 43 (2014) 533–537.
17. M. Delamar, R. Hitmi, J. Pinson, J. M. Save´ant, Covalent Modification of Carbon
Surfaces by Grafting of Functionalized Aryl Radicals Produced from Electrochemical
Reduction of Diazonium Salts, J. Am. Chem. Soc. 114 (1992) 5883-5884.
18. B. Ortiz, C. Saby, G. Y. Champagne, D. Be´langer, Electrochemical modification of a
carbon electrode using aromatic diazonium salts. 2. Electrochemistry of 4-nitrophenyl
modified glassy carbon electrodes in aqueous media, J. Electroanal.Chem. 455 (1998)
75-81.
19. B. Desbat, O. Fagebaume, R. Hitmi, J. Pinson, and J. M. Save´ant. Covalent
Modification of Carbon Surfaces by Aryl Radicals Generated from the electrochemical
Reduction of Diazonium Salts Philippe Allongue,1d Michel Delamar, J. Am. Chem.
Soc. 119 (1997) 201-207.
20. X. Yang, S. B. Hall, A. K. Burrellab and D. L. Officer, A pH-responsive
hydroquinone-functionalised glassy carbon electrode Chem. Commun., (2001) 2628–
2629.
21. Y. Zhou, Q. Bao, L. A. L. Tang, Y. Zhong, and Kian Ping Loh, Hydrothermal
Dehydration for the “Green” Reduction of Exfoliated Graphene Oxide to Graphene and
Demonstration of Tunable Optical Limiting Properties, Chem. Mater. 21 (2009) 2950–
2956
22. H. Huang, K. Kanishka, H. De Silva, G. R. A. Kumara & M. Yoshimura, Structural
Evolution of Hydrothermally Derived Reduced Graphene Oxide, Scientific reports 8
(2018) 6849.

120
23. Z. Li, T. Huang, W. Gao, Z. Xu, D. Chang, C. Zhang, and C. Gao, Hydrothermally
Activated Graphene Fiber Fabrics for Textile Electrodes of Supercapacitors, ACS
Nano 11 (2017) 11056−11065.
24. W. S. Hummers J, and R. E. Offeman, Preparation of Graphitic oxide, J. Am. Chem.
Soc. 80 (1958) 1339.
25. C. Selvaraj, S. Kumar, N. Munichandraiah, and L. G. Scanlon, Reduced Graphene
Oxide-Polypyrrole Composite as a Catalyst for Oxygen Electrode of High Rate
Rechargeable Li-O2 Cells, Journal of The Electrochemical Society 161 (2014) A554-
A560.
26. H. Thomas, S. Britton and R. A. Robinson, Universal buffer solutions and the
dissociation constant of veronal, J. Chem. Soc. (1931) 1456-1462.
27. S. Kumar, C. Selvaraj, N. Munichandraiah and L. G. Scanlon, Gold nanoparticles
anchored reduced graphene oxide as catalyst for oxygen electrode of rechargeable Li–
O2 cells, RSC Adv. 3 (2013) 21706-21714.
28. K. Chaisiwamongkhol, C. Batchelor-McAuley and R. G. Compton, Amperometric
micro pH measurements in oxygenated saliva, Analyst, 142 (2017) 2828-2835.
29. M. Quan, D. Sanchez, M. F. Wasylkiw, and D. K. Smith, Voltammetry of Quinones in
Unbuffered Aqueous Solution: Reassessing the Roles of Proton Transfer and Hydrogen
Bonding in the Aqueous Electrochemistry of Quinones, J. AM. CHEM. SOC. 129
(2007) 12847-12856.