
Groningen Pressure Maintenance (GPM) Study Progress ...
118
Groningen Pressure Maintenance (GPM) Study Progress Report February 2016 Datum February 2016
-
Upload
khangminh22 -
Category
Documents
-
view
2 -
download
0
Transcript of Groningen Pressure Maintenance (GPM) Study Progress ...

Groningen Pressure Maintenance (GPM) Study Progress Report February 2016
Datum February 2016

Title Groningen Pressure Maintenance (GPM)
Study - Progress Report February 2016
Date February 2016
Initiator NAM
Autor(s) Richard Hofmann and team Editors Richard Hofmann, Jan van Elk
Dirk Doornhof
Organisation Shell P&T Organisation P&T, NAM
Place in the
Study and
Data
Acquisition
Plan
Study Theme: Alternative Production Methods
Comment:
This report addresses the request of the minister of EZ from January 2014 to study
the option of pressure maintenance as a mitigating measure for seismic risk.
Directliy linked
research
(1) Reservoir engineering studies in the pressure depletion for different production scenarios.
(2) Seismic monitoring activities; both the extension of the geophone network and the installation on geophones in deep wells.
(3) Geomechanical studies
Used data
Associated
organisation
Shell P&T
Assurance Internal Review by Shell and NAM. Review by Scientific Advisory Committee.


Groningen Pressure Maintenance (GPM)
Achtergrond
NAM doet sinds begin 2013 onderzoek naar de mogelijkheden van drukbehoud door gasinjectie in het
Groningen gasveld. Het GPM-studieprogramma is een belangrijke prioriteit voor NAM, aangezien
drukbehoud – naast het verminderen van gasproductie en het versterken van gebouwen – als een
mogelijke veiligheidsmaatregel wordt beschouwd voor het Groningen gasveld. Het programma omvat
onderzoek van Shell Global Solutions, alsmede onderzoek door externe wetenschappers en
consultants.
Het GPM-studieprogramma is onderdeel van een breder studieprogramma dat is gericht op het
evalueren en beheersen van risico’s als gevolg van aardbevingen door drukdaling en compactie in het
Groningen gasveld.
Overzicht
Het GPM studieprogramma bestaat uit de volgende drie onderdelen:
1. Geomechanische effecten –
‘TNO 2014 R11761 Literature review on Injection-Related Induced Seismicity and its relevance to Nitrogen Injection’
‘TNO 2015 R10906 Injection-Related Induced Seismicity and its relevance to Nitrogen Injection: Description of Dutch field cases’
‘TNO 2015 R11259 Injection Related Induced Seismicity and its relevance to Nitrogen Injection: Modelling of geomechanical effects of injection on fault stability’
‘TNO 2015 R11648 Injection Related Induced Seismicity and its relevance to Nitrogen Injection: Main findings, recommendations and general guidelines’
TNO: onderzoek naar seismiciteit die wordt opgewekt door injectie door middel van literatuurstudies en het modelleren van geomechanische effecten van stikstofinjectie op breukstabiliteit. Deze rapporten worden op de website van TNO gepubliceerd;
2. Technische haalbaarheid - 'Groningen Pressure Maintenance Study', Shell Global Solutions:
onderzoek naar de technische haalbaarheid van gasinjectie in het Groningen gasveld met het
doel om seismische activiteit en bodemdaling te verminderen door behoud van de druk in het
reservoir;
3. Alternatieve opties en mogelijke synergiën - 'Groningen 2.0', professor W. Turkenburg:
onderzoek naar de alternatieven en potentiële synergiën tussen GPM en lokale economische
of industriële ontwikkelingen in de Groningse regio.
De technische haalbaarheidsstudie toont aan dat stikstofinjectie in het Groningse gasveld technisch
haalbaar is en de mate van drukdaling kan verminderen of de druk kan stabiliseren. Op dit moment
kan het seismische risico voor GPM echter niet berekend worden en blijft het onzeker of injectie op
grote schaal een significant positief of negatief effect heeft op seismische activiteit. Er is
veldonderzoek in Groningen en aanvullend onderzoek nodig om vast te stellen of GPM een effectieve
manier is om seismische activiteit te verminderen.
Naast de onzekerheden en risico’s van injectie, heeft drukbehoud door injectie als nadeel dat het een
langere implementatietijd heeft in vergelijking met andere mitigerende maatregelen, zoals bouwkundig

versterken. Gezien de schaal en complexiteit van drukbehoud, is een eerste gasinjectie naar
verwachting niet voor 2025 te realiseren.
GPM zou een groot en complex project zijn, waarbij er gedurende meerdere jaren boor- en
bouwactiviteiten zouden zijn op verschillende locaties in Groningen. In de hele regio zouden
pijpleidingen lopen tussen een installatie waar injectiegas wordt gegenereerd en de verschillende
injectielocaties. Een dusdanig project zou een grote economische en milieutechnische impact hebben,
met een aanzienlijke uitstoot van CO2.
Wat gaat de NAM met de onderzoeksresultaten doen?
In tegenstelling tot maatregelen als productiebeperking en bouwkundig versterken, kan op dit moment
niet bewezen worden dat GPM positief uitpakt voor het risico en is er daarom verder onderzoek nodig.
Omdat het erg lang duurt voordat GPM eventueel effect kan hebben, zal GPM niet worden
opgenomen in het Winningsplan dat bij de minister van Economische Zaken wordt ingediend op 1
april 2016.
NAM heeft de resultaten van het GPM-onderzoek overhandigd aan de minister van Economische
Zaken voor verdere review, discussie en besluitvorming in de toezichthoudende en democratische
processen.

Groningen Pressure maintenance (GPM)
Background
NAM has been assessing possibilities for pressure maintenance in the Groningen gas field by injection
since early 2013. The GPM study programme has been a key priority for NAM, as pressure
maintenance is considered as a possible safety measure with regard to the Groningen gas field, along
with reducing gas production and reinforcing buildings. The programme includes research by Shell
Global Solutions as well as research by external academics and consultants.
The GPM study programme is part of a broader study programme that is aimed at evaluating and
managing the risks and impacts resulting from earthquakes due to pressure depletion and reservoir
compaction in the Groningen gas field.
Overview
The GPM study programme covered the following three areas:
1. Geomechanical effects –
• ‘TNO 2014 R11761 Literature review on Injection-Related Induced Seismicity
and its relevance to Nitrogen Injection’
• ‘TNO 2015 R10906 Injection-Related Induced Seismicity and its relevance to
Nitrogen Injection: Description of Dutch field cases’
• ‘TNO 2015 R11259 Injection Related Induced Seismicity and its relevance to
Nitrogen Injection: Modelling of geomechanical effects of injection on fault
stability’
• ‘TNO 2015 R11648 Injection Related Induced Seismicity and its relevance to
Nitrogen Injection: Main findings, recommendations and general guidelines’
TNO: research into injection induced seismicity by means of literature studies and the
modelling of geomechanical effects of nitrogen injection on fault stability. These reports will be
published on the website of TNO;
2. Technical feasibility – ‘Groningen Pressure Maintenance Study’, Shell Global Solutions:
research into the technical feasibility of gas injection into the Groningen field with the objective
to reduce seismicity and subsidence by sustaining the reservoir pressure;
3. Alternative options and potential synergies – ‘Groningen 2.0’, Professor W. Turkenburg:
research into alternative options and potential synergies between GPM and local economic or
industrial developments in the Groningen area.
The technical feasibility study shows that injection of nitrogen into the Groningen field is technically
feasible and can reduce the rate of pressure decline or stabilize pressures. However, currently the
seismic hazard for GPM cannot be calculated and it remains uncertain whether large scale injection
will have a significant positive or negative effect on seismicity. A field test in Groningen and additional
research would be required to establish whether GPM is effective in reducing seismicity.
Besides the uncertainties and risks around injection, pressure maintenance through injection has the
further disadvantage of a longer implementation time compared to other mitigating measures, such as

structural upgrading. Given the size and complexity of a pressure maintenance scheme, a first
injection of gas is unlikely to be expected before 2025.
GPM would be a major and complex project with drilling and construction activities over several years
across various sites in the Groningen field, with pipelines connecting an injectant generation plant with
injection wells across the region. Such a project would have a large economic and environmental
impact, such as a significant CO2 footprint.
What is NAM going to do with the study results?
In contrast to the measures like production restrictions and structural upgrading, it can currently not be
proven that GPM has a positive effect on risk, and therefore requires further research.
Due to the long term horizon for GPM to possibly take effect, GPM will not be included in the
production plan (‘Winningsplan’) that will be submitted to the Minister of Economic Affairs on April 1st
2016.
NAM has handed over the results of the GPM study to the Minister of Economic Affairs for further
review, discussion and decision making in the regulatory and democratic processes.

Groningen Pressure Maintenance (GPM) Study
Progress Report, February 2016
by
Richard A Hofmann (GSNL-PTU/O/NN)
Tjerk E Hassing (GSNL-PTU/O/I)
Peter Schutjens (GSNL-PTU/E/Q)
Casper Buitendijk (GSNL-PTU/O/NN)
Joop van der Steen (GSNL-PTU/O/UE)
Jeanine CM van Leeuwen (GSNL-PTP/H/O)

- II -
Executive Summary
Introduction
The ongoing gas production in the Groningen field leads to a decrease in reservoir pore pressure,
causing the reservoir to compact. In turn, reservoir compaction increases the mechanical loads
acting on pre-existing geological faults. A small fraction of these faults becomes unstable and is
therefore prone to slip. Abrupt slip on such a fault results in an earthquake that radiates seismic
energy. The number and magnitude of the earthquakes in the Groningen field cause concern
about the future strength of earthquake ground motions and the resilience of existing buildings
to these ground motions.
The established and agreed mitigation measures to reduce the seismicity risk in the Groningen
field are currently production restrictions and structural upgrading of buildings. For 2014, a pro-
duction cap of 42.5 bcm/a was introduced by the regulator and for 2015, the cap was set at
30 bcm/a. Besides setting a production ceiling for the total field, production from the north of
the field specifically has been limited, requiring production from the south to be increased.
As an additional or alternative possibility to arrest production-induced seismicity, the concept of
continued production under pressure maintenance by injection has been studied.
The hypothesis for Groningen Pressure Maintenance (GPM) concepts is that if further compac-
tion can be avoided by maintaining pressure through injection, the number of earthquakes would
reduce. Given the large areal extent of the Groningen field and the uneven offtake under the new
production caps, pressure imbalances are being built up. If the pressures are not equilibrated first,
a future injection scheme will only be able at best to temporarily maintain the different pressures
in different parts of the field, but ultimately pressures will equilibrate. Therefore, despite being
labelled pressure maintenance concepts, all GPM concepts are essentially pressure management con-
cepts, however including injection, whereas the ongoing pressure management in the field is
achieved by controlling production only. While it is accepted that avoiding further pressure de-
pletion would reduce further seismicity, it is also accepted that injection itself carries the risk of
inducing seismicity by destabilising already critically stressed faults by reservoir pressure increas-
es. Depending on the injection scheme, the pressure increase can be confined to circles with radii
of several hundred meters around the injection wells or impact larger areas at kilometre scale, in
which the pressure rises due to pressure equilibration across the field.
This report gives a status update and summary of the GPM work done for the Nederlandse
Aardolie Maatschappij BV (NAM) by Shell Global Solutions. This report focuses on pressure
management through injection, whereas the ongoing pressure management by depletion only is
discussed separately in other reports.
Study History
This GPM study is part of a major effort to better understand the mechanisms of seismicity in
the Groningen field and to ensure that gas from the field can be produced within safe limits. The
work was done in preparation of the Groningen Winningsplan 2016, which will lay out the pro-
duction and development activities for the field for the coming years.
The option of pressure maintenance in Groningen to manage seismicity was first described in a
screening study in the Technical Addendum to the Winningsplan 2013 [1]. A single concept with
nitrogen (N2) injection was presented. The N2 would be generated in air separation units (ASUs)
located in Eemshaven and injected in new wells distributed across the field. The returned N2 in
the produced gas was to be removed and recycled for injection again in N2 rejection units
(NRUs) placed at the existing production clusters. The report described the massive dimensions

- III -
of this large-scale project. The concept was deemed by the Technische Begeleidingscommissie
Ondergrond1 (TBO) as currently too difficult to imagine, given the enormous cost, the loss of
production, and the scale of the required infrastructure [6].
Building on the work of the 2013 Winningsplan, the GPM study in 2014/’15 has focused on the
following topics:
Developing a range of pressure management policies and injection well patterns to limit
future compaction and thereby reducing production-induced seismicity while at the same
time being conscious of the risk of injection-induced seismicity
Assessing a range of injectants, processes to generate them, and developing concepts for
their removal from the produced gas, as part of the injectants will travel through the reser-
voir to the production wells
Minimising the environmental impact of the concepts (e.g. use of land, impact on open
landscape, energy use, and CO2 emissions) and minimising personal and process safety
risks during construction and operation
Gaining a better understanding of the potentially increased risk of seismicity from injection
in the Groningen field
Developing concepts for an injection test to de-risk the potential negative effect on seis-
micity risk that injection may have
In addition, external studies related to GPM have been conducted by TNO and the Groning-
en 2.0 study group.
Seismic Hazard for Injection Concepts
The aim of GPM is to avoid and/or defer future seismicity by avoiding and/or deferring future
pressure decline. The benefits of GPM in avoiding or deferring seismicity can be evaluated using
elements of the current NAM-developed probabilistic seismic hazard and risk model for Gro-
ningen [4]. This model is built on historical observations under depletion, relating compaction,
and seismicity. However, for injection, which can cause pore pressure increases, no suitable field
data, analogues, or predictive models exist to describe injection-induced seismicity in a strongly
depleted field like Groningen. This means that, currently, only the benefits of GPM can be quan-
tified but not the potential detrimental effects from injection. Adding the seismicity reduction
from maintaining pressures with the additional seismicity from injection might lead to an overall
seismicity reduction, or an insignificant change, or an overall increase of seismicity with GPM.
Therefore, a range of injection concepts is being studied that either accept pore pressure increas-
es or as much as possible avoid those pore pressure increases.
The concern is that such a pore pressure increase in the depleted Groningen field may induce
additional earthquakes, notably because many faults may now be critically stressed by the deple-
tion-induced compaction that accumulated over the more than five decades of production. Taken
together, information from analogue fields and global injection cases does not point to strong
earthquakes after injection in depleted reservoirs, but rather suggests that seismicity may be low
or absent during injection, or only occurs when injection pressures approach virgin pressures.
However, as always, one must recall that every field is different, and predictions based on ana-
logue fields remain highly speculative until proven by field data. The theory of frictional slip indi-
cates that, due to injection, such faults may become more prone to fault slip, and thus probably
also to seismicity, in particular if the total horizontal stress does not increase (substantially) as a
1 Technical Guidance Committee Subsurface, advising the Dutch Ministry of Economic Affairs.

- IV -
function of the increase in pore pressure (i.e. if there is an absence of a coupling effect between
the pore pressure and the horizontal stress). The recent modelling studies emphasise the im-
portance of the coupling – if the coupling is present and if it is sufficiently large, the tendency of
fault slip and seismicity may actually decrease as a function of increasing pore pressure. However,
the stress path is not the only parameter. There will be effects of virgin stress state (magnitude
and orientation), fault plane orientation, fault offset, plasticity, pore pressure diffusion, and tem-
perature as well. Their complex interplay will control the stress state in reservoir and in fault
gouge, thus controlling the deformation mechanisms active in fault gouge and the rock between
the faults.
Modelling studies of injection-related seismicity have been done at TNO and in-house, preceded
by extensive literature reviews. Further work is ongoing on rupture modelling and post-failure
fault stabilisation.
Injection Field Testing
Given the uncertainties around injection-induced seismicity, testing of injection in the Groningen
field itself should be seen as a prerequisite before implementing a full-field GPM concept. Using
existing wells and facilities, it could be possible to temporarily inject hydrocarbon gas at rates of
up to 7 bcm/a for several weeks or months to locally increase the reservoir pressure in a con-
trolled way, measure any change in seismicity, and establish whether injection is feasible. Fur-
thermore, an injection test may give insight into the deformation mechanisms and stress path
during injection, providing the basis for mechanism-based modelling of how injection may affect
fault slip. However, in the absence of predictive models for injection-induced seismicity, the
seismic hazard and risks of a test itself cannot be established. Furthermore, the representativeness
for other locations cannot be demonstrated and, therefore, multiple tests may be required.
If the risk of injection field-tests triggering unwanted seismicity could be shown to be tolerable,
GPM concepts could be envisaged that would include individual, sequential testing at all future
injection locations while the project is being implemented. In this step-wise approach, the injec-
tion concept would only be fully implemented if all locations have positive test results. Other-
wise, if too many locations show negative results, the concept would be left unfinished and only
partially operated or completely abandoned. This option of a step-wise implementation is yet to
be worked out in more detail.
Through a parallel approach of modelling and high-quality in-situ data collection, it is thought
that progress can be made in gaining a mechanism-based understanding of injection-induced
fault slip, so that the findings of the injection test can be applied to GPM concepts across the
Groningen field.
Pressure Management Policies
The production policies on the Groningen field since early 2014 are resulting in an increasing
pressure difference between the northern part of the field remaining at relatively higher pore
pressures and the south part of the field depleting to relatively lower pressures. This has implica-
tions for GPM: At the start of GPM, choices exist for the pressure levels at which to stabilise the
different regions and how and when to equilibrate the pressures again. The selection of a pres-
sure management policy would depend on the overall GPM seismicity “balance”, in which the
risk of injection-induced seismicity counteracts the benefit of avoided compaction-induced seis-
micity:
If reservoir pressure increases were not deemed acceptable, the local repressurisation
around the injector wells would have to be minimised, limiting the practical injection and
production rates of the field. At the same time, areas in the reservoir that at the start of

- V -
GPM are at higher pressures would have to be depleted further to equilibrate with the low-
est pressures in the reservoir to avoid a pressure increase in those more depleted areas.
This would be an approach, in which the risk of injection-induced seismicity is minimised,
but at the expense of increased seismicity from the areas that need to be depleted further.
If reservoir pressure increases were deemed acceptable, higher injection and production
rates would be possible. Furthermore, the pressure in the higher-pressure areas at the start
of GPM could be stabilised and any further compaction-induced seismicity in these areas
could be minimised, while areas of lower pressure would be allowed to increase in pressure
to equilibrate with the higher-pressure areas.
It should be noted that the risk associated with repressurisation does not only apply to GPM
cases but also to the cessation of production of the depletion case in which the lower, southern
pressure would be left to increase and equilibrate with the northern pressure. However, it should
be noted that the southern area has shown to be less prone to seismicity.
Injection Patterns
Depending on the desired pressure management policy for GPM, different injector-producer
configurations would have to be selected. Four patterns have been defined as archetypes:
a field-wide injector-producer pattern (“dispersed pattern”, similar to the one described in the
externally shared 2013 Winningsplan)
an injector-producer pattern confined to the north of the field (“semi-dispersed”)
a flank injection in the north (“north-south sweep”)
a local injection cluster (“central”)
The injection pattern affects how well the injectant sweeps the reservoir, i.e. how much natural
gas is by-passed in the reservoir and left unrecovered, and the time for the injectant to reach the
producer wells. The recovery under pressure maintenance can be up to 100 bcm lower, compared
to ongoing depletion with third-stage compression, which corresponds to approximately 25% of
the remaining recovery after 2025.
With tighter constraints on the allowable pressure increase around injector wells and the allowa-
ble degree of regional repressurisation, the forecasted feasible injection and production rates un-
der GPM are now lower and range from 10 to 30 bcm/a, as opposed to 30 to 40 bcm/a in the
Winningsplan 2013. The main reason for that is the assumed later start date of GPM. In the
Winningsplan 2013, GPM aimed at replacing voidage, while in the further study a wider range of
pressure management policies has been studied. These pressure management policies include
cases in which pressures are restored to their highest value at the start of GPM and also cases in
which repressurisation is avoided and pressures converge at the lowest levels found in the field at
the start of GPM.
Injectants and Facilities
Several possible injectants have been reviewed for potential application in an injection scheme,
including water, pure N2 (from air or flue gas from power stations), pure CO2 (from flue gas),
and combinations of N2 and CO2. Nitrogen generation with ASUs as described already in the
Winningsplan 2013 has been shown to be technically feasible and remains the preferred option
for pure N2 generation. Water and pure CO2 injection are not feasible.
The compression of the injection gas from atmospheric pressure (air or flue gas) to about 140 bar
injection pressure requires a large incremental amount of electricity (400 to 1000 MW), which
comes with a significant incremental indirect CO2 emission of up to 8 mln t/a (depending on the
energy source) compared to the ongoing depletion case. In order to lower the CO2 footprint, the

- VI -
option exists to co-inject a large fraction of the indirectly emitted CO2 with the N2 and store the
CO2 in the Groningen field. CO2 could be captured at the RWE/Essent coal-fired Eemshaven
plant through a Cansolv process and mixed with the N2 from ASUs. Alternatively, flue gas from
the Nuon Magnum power plant in Eemshaven could be captured, its O2 content reduced in an
additional boiler, and the flue gas injected directly without the need for separate N2 generation in
ASUs. Breakthrough of the CO2-containing injectant and flow through the existing production
wells and facilities (albeit with minor modifications) can be tolerated up to CO2 concentrations of
16% in the produced stream. However, the well integrity for some already abandoned wells for
long-term CO2 storage would need further consideration. In the option with ASUs and separate
CO2 capture (i.e. not when directly using flue gas), the pure CO2 could also be considered for
disposal in other depleted fields either onshore or offshore; however, the feasibility for this has
not been established.
Any injectant will eventually be back-produced in the production wells. To remove the excess N2
from the produced gas, cryogenic separation with NRUs was shown to be feasible. Depending
on the amount of N2 produced, the option exists to eliminate or at least defer the NRUs by
blending the produced gas with high-calorific gas to supply the required, original Groningen gas
quality to the market.
Health and Safety Risks Related to Surface Facilities and Environmental Impact
As for any large-scale industrial project, the potential impacts on the environment and on health
and safety of people living near or working at the facilities need to be assessed.
The key environmental issues for a full-field GPM implementation would be the large indirect
CO2 emissions associated with the required electrical power, land use for new wells and facilities,
noise emissions, and visual impact.
As described above, the options for flue gas injection and co-injecting a large fraction of the indi-
rectly emitted CO2 into the Groningen field exist. Alternatively, separate injection of pure CO2
into other, depleted fields could be studied further.
Land use, noise emissions, and visual impact for GPM would be minimised by drilling new injec-
tion wells as much as possible from existing production clusters and only using observation well
sites or new well sites where necessary, laying new pipelines in existing pipeline corridors, and
siting the large ASU and NRU facilities in industrial areas like Eemshaven or Delfzijl.
Identified safety risks for construction and operation would have to be minimised to an accepta-
ble level. Safeguarding and integrity of wells, pipelines, and facilities is paramount. This means
ensuring the facilities are well designed, safely operated, and properly inspected and maintained
to prevent process safety incidents that could place people, the environment, and the facilities at
risk. Specific health, safety, and environmental (HSE) risks for GPM have been identified, and it
can be concluded that the identified risks related to the facilities are manageable and GPM con-
cepts can be implemented and operated responsibly. However, as mentioned before, it is not yet
possible to assess to which extent GPM would decrease or possibly increase the risk from seis-
micity.
External Studies
The Groningen 2.0 team − an independent team of experts from academia and energy consul-
tancies − assessed improvements for the GPM case described in the 2013 Winningsplan and
looked for alternative options and potential synergies between GPM and local economic or in-
dustrial developments in the Groningen area. Some synergies were identified, such as the use of
O2, and other potential by-products from the ASU (argon, helium) and waste heat from com-
pression were identified. However, given the size of the GPM concepts, the stream of by-

- VII -
products and waste heat are far larger than could be absorbed by local developments, and there-
fore do not materially change or improve the GPM concepts. Nevertheless, those synergies
should be considered if GPM is developed further to make GPM as beneficial for the region as
possible.
Conclusions and Way-forward
Injection of N2 (with optionally some CO2) into the Groningen field is technically feasible and
can reduce the rate of pressure decline or stabilise pressures.
A reduction in or halt of pressure decline would slow down or stop further compaction and con-
sequently slow down or stop further compaction-induced seismicity while production continues
from the field. However, the risk of injection-induced seismicity from increased pore pressures
during injection exists. Whereas the benefits of a reduced rate of pressure decline or pressure
maintenance could be estimated with the currently being developed probabilistic seismic hazard
and risk model for Groningen, the effects of pore pressure increase – for which no suitable field
data, analogues or predictive models exist – cannot be quantified and therefore, an overall as-
sessment of the benefits of GPM concepts cannot be accomplished.
Given the uncertainty and risk of injection-induced seismicity, pressure management policies
could be envisaged that, as far as is possible, avoid pore pressure increases during an injection
scheme. Furthermore, testing of injection in the Groningen field itself needs to be considered
before implementing a full-field GPM concept. Additionally, GPM implementation scenarios can
be envisaged that consider phased implementation, including “test-as-you-build” of injection
wells.
Besides the uncertainties and risks around the injection-induced seismicity, compared to the
measures of production restrictions and structural upgrading, pressure maintenance through in-
jection has the further disadvantage of a longer implementation time: Given the size and com-
plexity of a pressure maintenance scheme, a first injection of N2 is unlikely to be expected before
the mid-2020s. Additionally, as with any injection scheme, N2 injection will lead to a significant
loss in ultimate recovery (UR) compared to ongoing depletion due to bypassing of hydrocarbon
gas by N2.
As opposed to production restrictions combined with structural upgrading, pressure maintenance
can currently only be seen as an alternative to be implemented if production restrictions com-
bined with structural upgrading are not acceptable. Pressure maintenance requires first a scientific
consensus on how to assess the safety risks of injection in Groningen – also for field-testing.

- VIII -
Table of Contents
Executive Summary II
Abbreviations XVI
1. Introduction 1
1.1. Study Overview 1
1.2. Potential Role of GPM in Managing Seismicity 2
1.3. GPM Concepts 4
2. Geomechanical Aspects of GPM 7
2.1. Introduction 7
2.2. Underground Gas Storage 8
2.3. Literature on Injection-Induced Seismicity 10
2.4. 1D Geomechanical Modelling 11
2.5. Limitations of 1D Mohr-Coulomb Geomechanical Modelling 16
2.6. Frictional-slip Modelling: A More Sophisticated 2D Model 18
2.7. Field Injection Test 23
2.8. Summary 24
3. Groningen Field Description and Performance 26
3.1. Groningen Reservoir Architecture and Volumes 26
3.2. Development History and Performance 27
3.3. Existing Infrastructure 28
4. Pressure Management and Recovery under Injection 30
4.1. Subsurface Concepts 30
4.2. Modelling Objectives and Approach 34
4.3. Subsurface Concept Examples 34
5. Appraisal and Testing of Injection 44
5.1. Introduction 44
5.2. Test Objectives and Measurement Options 44
5.3. Interpretability, Exclusivity, and Representativeness 47
5.4. Wells and Facilities Concepts 47
5.5. Potential Injection Locations, Rates, and Durations 48
5.6. Risks and Mitigation 49
5.7. Discussion 50
6. Facilities and Wells Concepts for Injection 52
6.1. Injectant Choices 52
6.2. Process Overview 54
6.3. Injectant Generation 55
6.4. Wells Infrastructure 65
6.5. Gas Production and Treatment 67
6.6. Pipelines 71

- IX -
6.7. Surface Concept Overviews 73
7. Operation of an Injection Scheme 76
7.1. Well, Reservoir, and Facilities Management (WRFM) 76
7.2. Health and Safety Risks and Environmental Impact 77
8. Development and Implementation of an Injection Scheme 83
9. Feasibility Assessment of GPM Concepts 85
References 87
Appendix 1. Groningen Field 90

- X -
List of figures
Figure 1.1: Cause and effect chain from gas production to damage and incidents caused
by seismicity in the Groningen field and potential mitigation measures. 3
Figure 1.2: The elements that make up an overall GPM concept. 4
Figure 1.3: Key aspects for the development and assessment of the GPM concepts. 5
Figure 1.4: GPM concepts can completely avoid further pressure decline (left), slow
down pressure decline (centre), or defer further pressure decline (right). 5
Figure 1.5: Examples of maps of pore pressure increase for two different periods in
time. (Note that the shown repressurisation in the Eemskanaal area, at the
western flank of the modelled area is due to a strong aquifer, which is
perceived to be a model artefact.) 6
Figure 1.6: Two classes of GPM concepts. Left, GPM is implemented with confidence
that a pressure increase will have a benign effect on seismicity. Pressure
could equilibrate below or above the average field pressure at the start of
GPM, as indicated by the green arrow. Right, GPM is implemented such
that a pressure increase is avoided that could induce additional seismicity.
To avoid such a regional pressure increase, pressures should equilibrate at
or below the pressure in the south at the start of GPM, as indicated by the
green arrow. 6
Figure 2.1: Compaction volumes calculated for continued depletion, shut-in, and a
number of GPM scenarios, including north-to-south gas sweep, central
injection, and dispersed injection. Implementation of GPM would reduce
the cumulative compaction volume of Groningen reservoir rock after 2015
by 23% to 35%. 7
Figure 2.2: Cartoon showing the possible effects of GPM on the pore pressure at any
given part of the field, including the near-wellbore area: A similar or lower
depletion as without GPM (case A and B), no further depletion (case C) or
an increase in pore pressure (case D). 8
Figure 2.3: Pore pressure evolution in the Norg gas field, about 30 km southeast of the
Groningen field [13]. The first stage (up to 1995) shows pressure evolution
during primary depletion of the field, the second part shows pressure
evolution during underground gas storage operations. The asterisks indicate
the occurrence of an earthquake larger than Ml 1. Note the tens of bar
increase in pore pressure (above the level of maximum depletion) before
the second earthquake (the one during injection) occurred. 9
Figure 2.4: Field data for Groningen suggesting a reduction of interpreted minimum
total horizontal stress with depletion, leading to a hor,depl of 0.64 with a 95%
confidence interval from 0.42 to 0.86 (Van Eijs and Valencia 2015 [30]). 12
Figure 2.5: Coupling between production/depletion-induced and injection-induced
changes in pore pressure and the change in minimum total horizontal stress,
captured in the stress path coefficients hor,depl and hor,inj. Field data indicate
that, typically, hor,depl > hor,inj. Note that hor,depl will be highest in the first
depletion, and may be smaller in subsequent depletion-injection cycles. 13
Figure 2.6: Stress state in virgin and depleted Groningen reservoir rock (brown and
blue Mohr circles, respectively) and at a Groningen-typical fault dipping 70°
to SSE 160° (brown and blue circular symbols). The red line is the Mohr-
Coulomb shear failure line. The length of the black vertical vector divided

- XI -
by the length of the red vector is the Shear Capacity Utilisation (SCU)
factor, a measure of the likelihood of shear failure. 14
Figure 2.7: Effect of an injection-induced increase in pore pressure on shear stress and
effective normal stress for a horizontal stress path coefficient during
injection (hor,inj) in the range 0.1 to 0.7, following depletion from 350 bar to
80 bar at hor,depl of 0.7. Injection at a relatively low value of hor,inj leads to
higher SCUs, i.e. to a higher tendency of shear failure, compared to the
depleted state (blue closed circle). 15
Figure 2.8: Results from an analytical one-dimensional Mohr-Coulomb frictional slip
model, comparing the effects of depletion at a horizontal stress path
coefficient (hor,depl) of 0.7 and injection under a horizontal stress path
coefficient (hor,inj) in the range 0 to 0.7. The influence of an injection-
induced pore pressure increase on SCU strongly depends on hor,inj: There
are model-specific ranges of hor,inj where injection reduces SCU overall
(green zone), reduces SCU compared to a similar depletion (yellow zone),
and increases SCU compared to a similar depletion (red zone). 15
Figure 2.9: A set of large faults in the Groningen field mapped based on seismic data
(a) with SCU indicated (b, van den Bogert et al. 2013a [32]). The amount of
earthquakes recorded through mid-October 2015 (c) agrees with a zone of
high SCU, but other zones of high SCU in (b) did not experience many
earthquakes, like at the edges of the field and the southern part. The in-situ
compaction strain inverted from subsidence (Bourne et al. 2014, [11]) is a
better indicator for seismicity (d). 17
Figure 2.10: Uncertainty in the input parameters of frictional slip models like the 1D
Mohr-Coulomb model produces significant uncertainty in the prediction of
fault slip. These results in Figure 2.10b represent 10,000 simulations in
which the magnitude of eight input parameters was varied: the initial stress
state (Svertical, Sh,max, Sh,min, Pp), orientation Sh,max, fault dip, fault azimuth, and
the stress path coefficient during depletion (hor,depl), the latter taken here as
0.78 with a standard deviation of 0.08. 17
Figure 2.11: Depletion to reach shear failure as a function of offset of depleting
reservoir along a normal and reverse fault. These 2D finite-element
frictional slip models show a strong effect of fault offset on the maximum
SCU along the fault. Note that the 1D Mohr-Coulomb model in which fault
slip is predicted on a fault without offset is not the most conservative
model, but rather, the most optimistic (fault-slip resistant). 18
Figure 2.12: Introducing two new parameters in frictional slip models: the length of the
fault that is slipping (Ls), i.e. where SCU ≥ 1, and the maximum slip
distance (Sd) along the slip part. 19
Figure 2.13: Overview of shear capacity utilisation (SCU) for a horizontal stress path
coefficient (hor,inj) of 0.07 (left) and 0.51 (right). Dashed lines represent SCU
for the base case, which is for a hor,inj of 0.68. Note the single and relatively
large slip patch in the simulation with hor,inj of 0.07 compared to the one
with hor,inj of 0.51, which shows two slip patches that are, in total, of a
smaller length than in the simulation with hor,inj of 0.07. The light grey
blocks indicate the position of the reservoir (Slochteren gas and water) in
the hanging wall and footwall [14]. 20

- XII -
Figure 2.14: Slip patch length (Ls) and maximum slip distance (Sd) as a function of stress
path coefficient hor,inj during injection (circle-data) and depletion (square-
data) of 50 bar in the 2D finite-element simulations of fault slip offsetting
the reservoir by 100 m (plot based, in part, on data in Figure 2.13 and
published in TNO 2015b [14]). Note that compared to the depletion case,
values for Ls and Sd are relatively low at relatively high values for the hor,inj.
This confirms that, perhaps, injection under high hor,inj can reduce
seismicity. 21
Figure 2.15: Effect of injection-induced cooling on SCU along a vertical plane at a
distance of 300 m from the injector well. Injection pressure is 165 bar, some
95 bar above the maximum depletion of 70 bar. This result is for a time 20
years after start of injection. Figures a and b give the absolute value of SCU
for the case of injection with temperature and without temperature effect,
respectively. Figures c and d give the change in SCU compared to the SCU
after depletion to 70 bar, again for the case of injection with temperature
and without temperature effect, respectively. Initial reservoir temperature is
94 °C; initial nitrogen temperature is 10 °C. Note the strong effect of
injection-induced temperature on SCU, which is caused by a cooling-
induced reduction in total stress state at the faults. Poisson’s ratio of the
reservoir rock is 0.20, the horizontal stress path coefficient is about 0.70,
Young’s modulus is 15 GPa, and the coefficient of thermal expansion is 10-5
°C-1. For detailed information, see TNO (2015b) [14]. 22
Figure 2.16: Schematic of field injection test. For optimal learning, instrumenting a
dedicated observation well should be considered to confirm the injection-
induced increase in pore pressure at nearby fault(s) around which induced
seismicity has occurred. 23
Figure 3.1: Historical gas production from the Groningen field in bcm per year. 27
Figure 3.2: Historical reservoir pressures measured at different production clusters. The
orange points represent pressures at the southern-most Tuschenklappen
cluster and the green points pressures at the northern-most t-Zandt cluster.
Due to the later development of the north of the field, the pressures in that
area remained higher than the pressures in the south until the late 1980s. 28
Figure 3.3: Schematic of processing facilities at each of the 20 production clusters. 29
Figure 4.1: Example of a schematic representation of a pressure management policy
showing the pressure in the north (solid green) and south (dashed green), as
well as the field average pressure (solid purple). 30
Figure 4.2: Overview of the range of potential pressure management policies. Each
chart shows conceptually the average pressures over time from the start of
GPM to the end of field life. Three pressure profiles are drawn: The average
pressure in the north (solid green line), the south (dashed green line), and in
the entire field (purple line). The pressure management policies are arranged
from top to bottom according to decreasing abandonment pressure and
from left to right by the increasing tolerance to pressure changes. 32
Figure 4.3: Four archetype injection patterns to implement the GPM pressure
management policies. Schematic pictures only, with notional locations and
number of injectors. For a small, local injection scheme (bottom, right),
additional flank producer wells (marked purple) would have to be drilled,
while in all other concepts the existing producer wells would suffice. 33

- XIII -
Figure 4.4: Pressure forecasts for GPM concept example 1: The bold red line
represents the field average pressure. The 5 remaining lines show the
average pressure for different areas in the field. 35
Figure 4.5: Production and injection forecasts for GPM concept example 1: Total
produced gas rate (solid green), Groningen gas production rate (light green),
N2 concentration (light blue), N2 injection rate (dark blue), and average field
pressure (red). 36
Figure 4.6: Expected pressure in bar at the start of GPM (left), expected minimum
pressure (middle) and maximum pressure increase (right) over the lifetime
of GPM example concept 1. (Note that the shown repressurisation in the
Eemskanaal area, at the western flank of the modelled area is due to a
strong aquifer, which is perceived to be a model artefact.) 37
Figure 4.7: Pressure forecasts for GPM concept example 1: The bold red line
represents the field average pressure. The five remaining lines show the
average pressure for different areas in the field. 38
Figure 4.8: Production and injection forecasts for GPM concept example 1: Total
produced gas rate (solid green), Groningen gas production rate (light green),
N2 concentration (light blue), N2 injection rate (dark blue), and average field
pressure (red). 39
Figure 4.9: Expected pressure in bar at the start of GPM (left), expected minimum
pressure (middle) and maximum pressure increase (right) over the lifetime
of GPM example concept 1. (Note that the shown repressurisation in the
Eemskanaal area, at the western flank of the modelled area is due to a
strong aquifer, which is perceived to be a model artefact.) 40
Figure 4.10: Cumulative production as a function of average field pressure for depletion
(green) and for GPM (black). 41
Figure 4.11: Snapshots in time showing the anticipated position of the nitrogen front in
the reservoir in 2027, 2032, 2040, 2050, and 2100 for GPM example
concept 1. The Groningen gas (concentration) is shown in red. This is an
example of a good sweep. 41
Figure 4.12: Snapshots in time showing the anticipated position of the nitrogen front in
the reservoir in 2027, 2032, 2040, 2050, and 2100 for GPM example
concept 2. The Groningen gas (concentration) is shown in red. This is an
example of a sweep that requires further optimisation of the well locations. 41
Figure 4.13: Stationary pressure profile between an injector-producer pair under voidage
replacement for a pattern injection scheme (left) like dispersed or semi-
dispersed and a line drive (right) like N-S sweep. 42
Figure 4.14: Total field production rate in a N-S sweep injection pattern predominantly
depends on the regional pressure difference between the North and South. 42
Figure 4.15: Indicative nitrogen (N2) breakthrough behaviour for two injection patterns,
the dispersed pattern (left) and the N-S sweep pattern (right). The
horizontal bars represent for each cluster the timing when N2 breaks
through and the time, when the cluster is shut-in as a result of high N2
concentration. Given the larger injector-producer distance in the N-S sweep
pattern, the N2 breakthroughs are later than in the dispersed pattern. (Note
that the clusters are ordered in each chart by their breakthrough timing). 43

- XIV -
Figure 5.1: Example of a regional pressure policy with imminent (pre-GPM) and later
test requirements. 45
Figure 5.2: Overview of the range of potential pressure management policies, with
indications of required testing for different phases. The three lines in each
pressure plot indicate regional pressure over time in the north (solid green),
south (dashed green), and on average (purple). 46
Figure 5.3: Simplified flow diagram of required cluster modifications. 48
Figure 5.4: Field maps showing an overlay of the simulated pressure increases that can
be achieved by injecting 5 bcm/a (left) or 8 bcm/a (right) in each
production cluster individually, while all other clusters continue producing.
The injection is assumed to last for the entire year 2018. (Note that the
maximum technically achievable injection rate for each cluster is only
approximately 7 bcm/a.) 49
Figure 5.5: Bow tie for injection-induced seismicity during injection test. 50
Figure 6.1: Conceptual diagram of a pressure maintenance concept. 55
Figure 6.2: Schematic of a typical ASU. 56
Figure 6.3: Examples for injectant generation processes. 57
Figure 6.4: Cansolv CO2 capture plant (outlined) at the Boundary dam power station,
Canada. For GPM, additional absorber towers would be required. 59
Figure 6.5: Analogue of boiler as would be required to generate 20 bcm/a of flue gas
with low oxygen content from the Nuon power plant. 60
Figure 6.6: Additional power requirements for three typical GPM concepts above the
ongoing depletion case. From top to bottom: Dispersed (30 bcm/a
injection), Central (10 bcm/a injection) and N-S sweep (20 bcm/a
injection). 64
Figure 6.7: Potential injector well design. 66
Figure 6.8: Injection well completion options for flue gas and pure N2 with co-injected
CO2. The injectant is dry; however, during stop of injection, the well
completion can be exposed to moisture from reservoir. This requires
corrosion-resistant materials. Possible options range from installing (1) non-
return valve to minimise the CRA part of the completion, (2) operational
measures “mothballing” with nitrogen, or (3) full-length CRA tubulars. 67
Figure 6.9: Block-flow diagram for a four-train nitrogen (N2) rejection unit with two
pre-treatment trains. 68
Figure 6.10: Nitrogen (N2) demand forecast for Dutch low calorific gas compared with
N2 produced in simulated GPM schemes. The maximum allowed N2
production is directly related to the Groningen gas demand which over time
decreases. Once N2 produced from the field exceeds demand, an NRU is
required. 69
Figure 6.11: Notional pipeline routes for four injection patterns . 72
Figure 6.12: Risk of maximum ultimate recovery (UR) loss in case O2 breaks through
and facilities have to be closed-in immediately. The total height of the bars
indicates the remaining UR under continued depletion, the light blue
sections indicate the UR loss in GPM schemes without O2 in the injectant,
caused by shut-in of producers at elevated N2 cuts (energetic cut-off), the
orange sections indicate the hypothetical UR loss if the producers had to be
closed-in immediately at injectant breakthrough, which would be the case if

- XV -
the breakthrough injectant contained O2 that had not been scavenged while
travelling through the reservoir. 73
Figure 6.13: The two surface concepts that are expected to be feasible are for pure
nitrogen (N2) and for N2 with CO2 co-injection. 75
Figure 7.1: Bow tie for injection-induced seismicity. 80
Figure 8.1: Hypothetical project implementation schedule assuming one injection test,
showing that first nitrogen (N2) injection before the mid-2020s is not
realistic. Additional time for testing and permitting delays can bring the first
injection date easily to 2027. 84
List of tables
Table 2.1: Observations on seismicity in three cases of gas injection in depleted
reservoirs (underground gas storage, UGS) in the northern part of the
Netherlands based on data by TNO (2015a [13]). 9
Table 2.2: Data from database on worldwide injection-induced seismicity [12]. 10
Table 5.1: Injection test objectives 45
Table 5.2: Range of measurements as part of an injection test. 46
Table 5.3: Geomechanical uncertainties reflected in views against and in favour of an
injection field test. 50
Table 6.1: List of power stations in Eemshaven. 53
Table 6.2: Typical flue gas compositions from a gas-fired and a coal-fired power
station. 54
Table 6.3: Injectant generation options with their ability to achieve desired
contaminant concentrations and selection of concepts to keep as an option
for GPM. 61
Table 6.4: Comparison of health, safety and environmental issues for the different
injectant generation options. Colour coding: Dark green - very favourable,
Green - favourable, Yellow - less favourable, Orange - not favourable. 63
Table 6.5: Well completion evaluation for Groningen reservoir conditions. 66
Table 6.6: Estimate pipeline scope for example injection patterns 71
Table 7.1: Potential major accident hazards for GPM concepts related to surface
facilities and injectants. 79
Table 7.2: Environmental issues and risk for GPM and range of mitigation measures. 82

- XVI -
Abbreviations
ASU air separation unit
Bcm billion cubic meters (109)
CCS carbon capture and sequestration
EGR enhanced gas recovery
EOR enhanced oil recovery
EZ Dutch Ministry of Economic Affairs (nl. Ministerie van Economische
Zaken)
GPM Groningen Pressure Maintenance study
GTS Gas Transport Services (GTS) acts as an independent transmission
system operator in the Netherlands and is a subsidiary of Gasunie, who
owns the national gas transmission network
HiCal High-calorific (non-Groningen) gas
IUCN International Union for Conservation of Nature
KNMI Royal Netherlands Meteorological Institute (nl. Koninklijk Nederlands
Meteorologisch Instituut)
LoCal Low-calorific (Groningen) gas
MC Mohr-Coulomb
Ml Local earthquake magnitude on Richter scale
Mrd milliard (US: billion, 109)
NAM Nederlandse Aardolie Maatschappij BV
NORM naturally occuring radioactive material
NRU nitrogen rejection unit
SCU shear capacity utilisation
TBO Ministerial Technical Guidance Committee Sub-surface (nl. Technische
Begeleidingscommissie Ondergrond) to oversee 2013 work on seismic
hazard and pressure maintenance
TNO Dutch Organisation for Applied Scientific Research
(nl. Nederlandse Organisatie voor Toegepast Natuurwetenschappelijk
Onderzoek)
TVNAP True Vertical depth below Amsterdam Ordnance Datum (nl. Normaal
Amsterdams Peil, NAP)
UGS underground gas storage
UR ultimate recovery
WRFM Well, Reservoir and Facilities Management

- XVII -
Production Clusters and Other Well Sites

- 1 -
1. Introduction
1.1. Study Overview
Since the mid-1980s, relatively small earth tremors have been observed in the vicinity of produc-
ing gas fields in the northern Netherlands. Since then, several multidisciplinary studies have been
initiated by the Dutch Ministry of Economic Affairs. A borehole seismometer network managed
by the Royal Dutch Meteorological Institute (KNMI) was installed in Groningen in 1995 to de-
tect tremors, pinpoint their location, and quantify their magnitude. Accelerometers were also
installed in areas where tremors frequently occurred.
In 2012, an earthquake with magnitude Ml = 3.6 occurred near the village of Huizinge in the
Loppersum area (16/08/2012). This earthquake was experienced as more intense than previous
earthquakes in the same area and caused a significantly larger number of reports of building dam-
age than previous earthquakes (Figure A1.4).
As a response, a study and data acquisition programme was started by NAM in late 2012. In De-
cember 2013, NAM published the results of the 2013 work in the Technical Addendum of the
Winningsplan 2013 [1]. These results included geomechanical and seismological studies into the
induced earthquakes in the Groningen field based on the historical earthquake record with fore-
casts of future seismicity, an analysis of the reservoir compaction and subsidence with forecasts
of future compaction and subsidence and the impact of different depletion scenarios on the
seismic hazard.
It is now well established that the seismicity in Groningen is caused by depletion-induced com-
paction, known for many years to cause seismicity at producing hydrocarbon reservoirs [8], [9].
Recent study work in Shell on the Groningen seismicity [5] has led to a model predicting that
further depletion will probably lead to more and possibly stronger earthquakes. The model is
based on a relationship between compaction strain, inverted from subsidence, and seismicity.
Based on this model, one can postulate that reducing or stopping the depletion in Groningen will
reduce or stop reservoir compaction, and thus reduce or stop compaction-induced seismicity,
which is the key premise for GPM.
In a parallel effort [43], an empirical relation between the amount of Groningen earthquakes and
depletion was used to predict future seismicity. With depletion being the driving force for earth-
quakes, reducing the depletion (and thus the compaction) was expected to reduce seismicity.
The Technical Addendum of the 2013 Winningsplan [1] also contained a high-level description
of a potential concept to maintain pressure in the Groningen field by replacing the gas produced
through injection of nitrogen (N2). This pressure maintenance scheme based on N2 injection was
presented as a potential mitigation measure for induced earthquakes. The dimensions of such a
project were given, demonstrating the substantial electrical power requirement and the high im-
pact on the surroundings. However, the feasibility and efficiency of this process at that time
could not be confirmed. The fact that injection itself can lead to earthquakes was highlighted and
it was also stressed that the current workflow to assess the seismic hazard is only calibrated for
pressure depletion and not tested nor validated for injection. No other workflows were identified
that could quantify the seismic hazard as a result of injection for the Groningen field. No suitable
analogues were available, as most of them are based on the injection of (waste) water in different
geological settings and stress regimes.
The Winningsplan 2013 [1] was approved by the Dutch Ministry of Economic Affairs in 2014
requiring an update of the Winningsplan again in 2016 [2]. In preparation of the next Winning-
splan, the study and data acquisition programme has been updated [2] and covers

- 2 -
updates to the seismic hazard and risk assessment, with ways to reduce the uncertainty in that
assessment and the impact of the seismic hazard on buildings and safety,
improved monitoring of compaction, subsidence, and seismicity,
increased understanding of the mechanisms leading to induced seismicity, and
identification of measures to reduce the hazard and risk, including the evaluation of their
effectiveness as well as early steer on the deployment of any mitigation measures.
Measures to take that would mitigate the seismic risk/impact to be studied are 1) different pro-
duction policies, which includes pressure maintenance through injection and 2) strengthening of
buildings. Whereas the intention of different production policies is to reduce the seismic hazard,
i.e. the number, frequency and/or strength of earth tremors, the intention of building strengthen-
ing is to address the seismic risk.
Building on the early assessment of a N2 injection scheme in the 2013 Winningsplan ([1], Tech-
nical Addendum), further work has been conducted since early 2014. The work has focussed on
the following aspects:
Geomechanics - In this area, several sub-studies have been performed or are being completed
at the time of writing: TNO has conducted a literature study for injection-induced seismicity
[3], described Dutch field cases with injection, performed modelling of geomechanical effects
of N2 injection on fault stability.
Subsurface concepts - Using the available NAM subsurface model for the Groningen field,
Shell Global Solutions has evaluated a range of injection and production patterns for differ-
ent pressure management policies and estimated the according injection and production rates
and the impact on the recovery of Groningen gas.
Surface concepts - Shell Global Solutions has also reviewed the choice of injectants, as well as
the methods for generation, distribution, and removal of the injectant from the produced gas.
Cost and schedules for new wells, pipelines, and facilities and associated safety and environ-
mental aspects have been evaluated to assess the footprint of a range of injection schemes.
Synergies - Under the title Groningen 2.0, a group of experts has investigated alternatives to
the pressure maintenance concept described in the 2013 Winningsplan, with a focus on sur-
face measures and potential synergies with other developments in the region.
The early conclusions from the Winningsplan 2013 [1] with respect to pressure maintenance are
supported; however, a wider range of pressure management policies and according facilities con-
cepts have now been evaluated. While these concepts are all deemed technically feasible, the ef-
fectiveness of such injection schemes to reduce seismicity compared to the ongoing depletion
case could not yet be established. A field injection test may allow a better assessment of the risk
of triggering additional seismicity by injection, but even such a test may not give a definitive an-
swer.
This report gives a status update and summary of the GPM work done for NAM by Shell Global
Solutions.
1.2. Potential Role of GPM in Managing Seismicity
The ongoing gas production from the Groningen field leads to a decrease of the pressure of hy-
drocarbon gas within the reservoir pore space, causing the reservoir to compact (ref. Figure 1.1).
In turn, reservoir compaction increases the mechanical loads acting on pre-existing geological
faults within and close to the reservoir. A small fraction of these faults becomes unstable and is
therefore prone to slip. Abrupt slip on such a fault results in an earthquake that radiates seismic
energy. This has been described in detail by Stephen Bourne et al. [5], [11].

- 3 -
Figure 1.1: Cause and effect chain from gas production to damage and incidents caused by
seismicity in the Groningen field and potential mitigation measures.
In order to reduce the risk of building damage, (partial) collapse and injuries, several barriers can
be envisaged:
1) structural upgrading to make buildings more resilient to ground movements
2) reduced pressure depletion by reduced production
3) Optimised depletion strategy as SodM/MEA requested from NAM by year-end 2016 and
4) reduced pressure depletion by complementing production with injection.
Structural upgrading is the most effective barrier to reduce the impact [4]. It can be targeted spe-
cifically to the most vulnerable buildings in the areas with the highest level of seismicity. Fur-
thermore, following the structural upgrading, the risk reduction is immediately in effect. Changes
to the field production policy (e.g. reduced total rate, adjusted areal distribution of offtake) are
perhaps less effective, although it can take more time for the effect to be felt. In contrast, con-
trolling the reservoir pressure through injection requires developing, designing, and building a
new infrastructure with wells, pipelines, and facilities, which will take several years and therefore
would take significantly longer before becoming effective. Only in that situation would pressure
maintenance be implemented, and only if:
the concept was proven to be effective in reducing the earthquakes (likely requiring field tri-
als) and operating within acceptable safety limits with regards to injection-induced seismicity,
the remaining gas volumes in the field would justify the significant investment, and finally
society and the regulator approved of this large-scale project.
Feasibility of GPM is not yet confirmed. No firm plans exist currently to test or implement such
a concept.

- 4 -
1.3. GPM Concepts
An overall GPM concept consists of a number of technical elements (Figure 1.2):
Pressure management policy: reservoir pressure at field abandonment and tolerances to pres-sure increases and decreases during GPM
Injection and production pattern and rates
Requirements for testing/appraisal of GPM before a full-field implementation
Injection medium
Type of facilities for a) injection medium sourcing/generation and processing and b) pro-duced gas treatment and/or blending with high-calorific gas
Project execution planning and phasing.
Figure 1.2: The elements that make up an overall GPM concept.
After discussing the possible impact of pressure on seismicity and a Groningen field description
in chapters 1 and 3, respectively, the above elements will be considered.
The range of possible pressure management policies and the logically corresponding injection
and production patterns will be discussed in chapter 4. Testing and test objectives for the differ-
ent pressure management policies are covered in chapter 5. The different injection medium op-
tions that have been considered and the corresponding surface infrastructure and facilities are
described in chapter 6. In chapter 7, the subsurface and surface concepts are considered from the
perspective of operations and Health, Safety and Environment (HSE). The implementation of
GPM is discussed in chapter 8, including a hypothetical execution schedule. In chapter 9, the
pros and cons of the range of possible GPM subsurface and surface concepts are considered, and
an initial screening of the concepts is made.
The key aspects for developing and assessing GPM concepts are (ref. Figure 1.3):
1) Seismic risk reduction - GPM concepts need to reduce the seismicity. Apart from production
restrictions, GPM is the only obvious risk mitigation option identified with the potential to
reduce the compaction induced seismic hazard. GPM could aim either for a temporary de-
ferment of seismicity by delaying depletion or a lifecycle reduction of seismicity by avoiding
final depletion (ref. Figure 1.4). Besides the compaction induced seismic risk, the potential in-
jection induced seismic risk must be considered.
2) Public acceptance - GPM acceptance by the key stakeholders, i.e. the communities impacted
by the earthquakes, the direct neighbours of any existing or new Groningen field installations,
various interest groups and NGOs, the regulator and the local, provincial, and national gov-
ernments. This acceptability is related to safety risks and nuisances from project execution
and operations (including the landscape impact); the delivery time for the project; the impact
to the environment, including carbon footprint; the security of gas supply; and a clear cost-
benefit compared to other options.
3) Schedule - GPM concepts should have short yet practical durations for design, construction,
and commissioning for early effectiveness.
4) Costs - GPM concepts need to be cost-effective, with capital and operational costs in propor-
tion to the benefits in seismic risk reduction and protected gas recovery and production.
GPM policies: Target &
Tolerances
Injection & Production
Pattern
Injection Medium
Source & Processing, Blending
Project ExecutionTesting

- 5 -
Figure 1.3: Key aspects for the development and assessment of the GPM concepts.
Figure 1.4: GPM concepts can completely avoid further pressure decline (left), slow down
pressure decline (centre), or defer further pressure decline (right).
The evaluation of GPM concepts requires reasonable estimates of the expected seismic risk re-
duction, the required injection rates and achievable production rates, the scope of the concept
(wells, facilities, pipelines), and the associated environmental and social impact, but also the asso-
ciated cost and the duration to design, procure, construct, commission, operate, and de-
commission the project scope.
Existing reservoir simulation models for the Groningen field allow making injection and produc-
tion rate forecasts for different pressure maintenance and pressure management policies. Those
forecasts are inherently uncertain, in particular, due to the underlying geological uncertainty. For
a given project scope, cost can be estimated based on past project experiences; those estimates
carry a degree of uncertainty due to the scope being incomplete or only defined at high level and
the general price uncertainty. For a given project scope, schedules also can be developed based
on past project experiences, which also will carry an uncertainty due to scope being incomplete
or only defined at a coarse level and with unforeseen interdependencies and events.
The most uncertain element is the seismic risk: As of yet, the seismic risk under GPM cannot be
assessed quantitatively. For continued depletion, seismicity can be estimated from compaction
with the existing probabilistic seismic hazard and risk model for Groningen. However, this model
is not valid if pressure in the field (or parts thereof) increases. Field examples and mechanism-
based models show a potential for seismicity induced by pore pressure increase. There are two
mechanisms for pressure increase under GPM. First, to enable injection, the area around the in-
jection well needs to have an elevated pressure. This area is localised to a few hundreds of meters
around the well. The total pressure difference between the injection well location and the average
region can be restricted to about 5 bar at the disadvantage of a low injection rate per well. Sec-
ond, regional pressure differences could give rise to pressure equilibration once production and
Seismic Risk Reduction
Cost
Gas Recovery
Schedule
Public Acceptance

- 6 -
injection have stopped, with some pressures in some regions dropping and pressures in other
regions rising. As a result, pressure could increase by tens of bars over a large area of the field.
A qualitative assessment of seismic risk under GPM will be based on two indicators, additional
compaction and pressure increase. These indicators can be shown in “heat” maps covering a
certain period in time. An example is shown in Figure 1.5.
Figure 1.5: Examples of maps of pore pressure increase for two different periods in time.
(Note that the shown repressurisation in the Eemskanaal area, at the western
flank of the modelled area is due to a strong aquifer, which is perceived to be a
model artefact.)
There are two classes of GPM concepts (ref. Figure 1.6): If GPM is implemented with confi-
dence that a pressure increase will have a benign effect on seismicity, further compaction can be
minimised by increasing pressure in the field to match the highest regional pressure. If the as-
sumption is that pressure increases should be kept to a minimum, further depletion in some areas
of the field to the lowest regional pressure needs to be allowed. This highlights the fundamental
dilemma of a GPM implementation when the field is in a regional pressure imbalance at the start
of GPM. Maximum effectiveness requires confidence in the safety of a pressure increase. As ex-
plained in chapter 5, a field test is unlikely to provide the technical evidence to build such confi-
dence.
Figure 1.6: Two classes of GPM concepts. Left, GPM is implemented with confidence that a
pressure increase will have a benign effect on seismicity. Pressure could equili-
brate below or above the average field pressure at the start of GPM, as indicated
by the green arrow. Right, GPM is implemented such that a pressure increase is
avoided that could induce additional seismicity. To avoid such a regional pressure
increase, pressures should equilibrate at or below the pressure in the south at the
start of GPM, as indicated by the green arrow.

- 7 -
2. Geomechanical Aspects of GPM
2.1. Introduction
Depletion-induced reservoir compaction is accompanied by changes in stress at faults in and
around the reservoir. This can lead to slip along geologic faults or create new faults, occasionally
with a sudden release of energy leading to ground motion (induced seismicity, see e.g. Segall [8],
Grasso [9], Suckale [42], Klose [10]). Regarding the depletion-induced seismicity in the Groning-
en field (ref. [1]), a recent seismological model in 2014 by Bourne et al. [5] predicts that further
depletion will probably lead to more earthquakes, and possibly also to stronger earthquakes than
the Huizinge one (16/08/2012, 3.6 on Richter scale, local magnitude Ml). As outlined in chapter
1, one way to mitigate further seismicity is to stop or reduce further depletion by injection of a
gaseous medium like N2 during Groningen gas production: hence, less compaction means less
build-up of shear stress at the faults, and thus less driving force for fault slip. Models for GPM
indicate that pressure maintenance can reduce the volume of reservoir compaction after 2015 by
22% to 35% compared to the depletion-only case, depending on the GPM scenario (Figure 2.1),
suggesting its potential to reduce depletion-induced seismicity in the Groningen field (see also
Hagoort [43]).
Figure 2.1: Compaction volumes calculated for continued depletion, shut-in, and a number of
GPM scenarios, including north-to-south gas sweep, central injection, and dis-
persed injection. Implementation of GPM would reduce the cumulative compac-
tion volume of Groningen reservoir rock after 2015 by 23% to 35%.
But there is a geomechanical caveat to GPM: The models also indicate that during a field-wide
GPM implementation, the pore fluid pressure may actually increase. This can occur around the
injector wells to provide the driving force for the injection gas to flow into the reservoir, and
during field-wide pore pressure equilibration when the field is shut-in, with the southern part of
the field gradually increasing in pore pressure as it equilibrates with the northern part of the field,
where the pore pressure is relatively high due to the production restrictions in the Loppersum
clusters. Compared to the base-case of continued depletion (case A in Figure 2.2), GPM can lead
to a reduced depletion (case B), to a no-depletion (case C), or to an increase in pore fluid pres-
sure (case D). These cases may vary in space and time across the field, from far-field unfaulted

- 8 -
rock to fault gouge and to the rock near the injector wells. Assuming a causal relation between
depletion-induced compaction and seismicity [5], there is little doubt that cases B and C will re-
duce seismicity compared to case A (although gas production rates and ultimate recovery (UR)
will be lower in cases B and C than in case A). But what about case D? Will an increase in pore
pressure have no measurable effect on induced seismicity, or will it decrease or perhaps even
increase seismicity? This question must be answered for a safe and effective implementation of
GPM.
Figure 2.2: Cartoon showing the possible effects of GPM on the pore pressure at any given
part of the field, including the near-wellbore area: A similar or lower depletion as
without GPM (case A and B), no further depletion (case C) or an increase in pore
pressure (case D).
This chapter shows geomechanical work performed to analyse and describe the possible effects
of case D, an increase in pore pressure in the depleted Groningen field, whereas for further dis-
cussion on compaction-induced seismicity, the reader is referred to [4] and [5]. We first list ob-
servations from underground gas storage (UGS) sites in the Netherlands (section 2.2) and from
the literature on injection-induced seismicity (section 2.3). Next, we introduce the concept of
reservoir stress path, and present a mechanism-based model (one-dimensional Mohr-Coulomb,
1D MC) to predict the onset of fault slip (section 2.4). Despite its apparent potential to predict
the effects of GPM on induced seismicity, there are some serious limitations to 1D MC models
that will be explained in section 2.5. Sections 2.6 and 2.7 present a parallel approach to gain more
insight in the geomechanics of GPM, based on two-dimensional (2D) Mohr-Coulomb modelling
with more realistic geology and rock physics than in 1D MC, and gathering data in a field injec-
tion test. Section 2.8 summarises our current view on the status of geomechanical understanding
for application to GPM in the Groningen field.
2.2. Underground Gas Storage
Underground gas storage (UGS) involves injection of natural gas in a depleted hydrocarbon res-
ervoir. The Dutch UGS sites in the Rotliegend sandstone are of interest as an analogue to GPM
in the Groningen field. Although these fields are smaller in size than the Groningen field, the
reservoir rocks have the same geologic age (Permian Rotliegend sandstone) and are also cut by
many large faults. Most importantly, the pore pressure changes during UGS are > 100 bar (Table
2.1) and should thus bring about similar or even higher compaction and dilation (volume de-

- 9 -
crease and increase, respectively) and stress changes to faults and reservoir rock as during GPM,
see Nagelhout and Roest (1997 [7]). Importantly, injection at UGS sites in the north of the Neth-
erlands did not give rise to large earthquakes like the one in Huizinge with Ml 3.6; see Table 2.1
based on data compiled by TNO [3]. The largest injection-induced earthquake during UGS in the
Netherlands was an Ml of 1.05 and occurred in 1999 in the Norg field at a pore pressure of
309 bar, after it was increased by about 125 bar above the pore pressure of the depleted field
(about 185 bar) to values just 20 bar below the virgin pore pressure of 328 bar [3]; see Figure 2.3
and Table 2.1.
Table 2.1: Observations on seismicity in three cases of gas injection in depleted reservoirs
(underground gas storage, UGS) in the northern part of the Netherlands based on
data by TNO [3].
Figure 2.3: Pore pressure evolution in the Norg gas field, about 30 km southeast of the Gro-
ningen field [3]. The first stage (up to 1995) shows pressure evolution during pri-
mary depletion of the field, the second part shows pressure evolution during un-
derground gas storage operations. The asterisks indicate the occurrence of an
earthquake larger than Ml 1. Note the tens of bar increase in pore pressure (above
Case Magnitude Date Depletion Virgin Depleted Pore press. Pore press. Pore press. Unload/load
on Richter or pore pore at seismic below above max. cycle
scale injection pressure pressure * event virgin depletion of event
(Ml) (bar) (bar) bar) (bar) (bar)
Norg 1.5 1993 328 245 83 - First depletion
1.05 1999 Injection 328 180 to 190 ** 309 19 119 to 129 ** First injection
Grijpskerk 1.3 1997 Depletion 392 280 112 - First depletion
1.5 2015 Depletion 392 180 270 122 90 14th depletion
Bergermeer 3 to 3.5 1994 (2 events) Depletion 228 50 178 35 First depletion
3 to 3.5 2001 (2 events) Depletion 228 25 203 10 First depletion
0.7 2013 Depl./Inj. 228 15 Recorded with downhole micro-seismic array: tens of tremors
*) Only listed when the seismic event occurred during the injection phase or during pore pressure cycling during UGS operations
*) Depending on the pore presure data used: Two sets of data falling in two pore pressure ranges

- 10 -
the level of maximum depletion) before the second earthquake (the one during in-
jection) occurred.
Of interest is also the Bergermeer UGS, in the province of Noord-Holland. In 1994 and 2001,
during primary depletion of this reservoir, four seismic events were recorded with magnitudes
varying between Ml of 3.0 and 3.5, so of only slightly lower magnitude than the Huizinge earth-
quake of Ml 3.6. During injection of gas, the pore pressure increased by a few tens of bar above
the pore pressure in the depleted field (25 bar). Many small earthquakes in the bandwidth Ml -3.5
to-1.5 (microseismicity) were recorded when the pore pressure was increased by up to 25 bar; 14
were larger than Ml –1.5 and three were larger than –0.5 Ml. The largest seismic event recorded
during injection of gas was a 0.7-Ml seismic event (Oct. 2013), interpreted to be located close to
the central fault [13]. Therefore, these are tremors rather than large earthquakes.
In summary, UGS data from three Dutch fields do not indicate large (e.g. Ml > 1.5) earthquakes
during gas injection, although the pore pressure was increased by 90 to 129 bar after depletion of
150 to 200 bar.
2.3. Literature on Injection-Induced Seismicity
There are no documented case studies on the geomechanical effects of large-scale multi-year gas
injection like GPM would require. However, injection-induced seismicity has been recorded,
studied, and modelled on fluid-waste disposal, EOR schemes, water-flooding (secondary HC
recovery), CO2/gas storage, geothermal systems, and hydraulic fracturing (for reviews see Ells-
worth 2013 [21], IEAGHG report 2013 [22], McGarr 2014 [14], TNO 2014 [12]). Table 2.2
summarises the number of injection wells and fields with seismic events Ml > 2 and maximum
magnitudes reported in literature, compiled by TNO [12].
Table 2.2: Data from database on worldwide injection-induced seismicity [12].
There are very few papers with useful information on the mechanism of injection-induced fault
slip and seismicity in depleted hydrocarbon reservoirs. Most papers are descriptive (case studies)
and lack the field data or experimental data to make models. Though every case has a different
structural geology, pore pressure, total stress state, and operational context, there are some learn-
ings to be captured from the literature (see also [12]):
1. There are many cases in which fluid injection in reservoirs did not induce seismicity.
2. There is general agreement in the literature that injection-induced seismicity is triggered by an
increase of pore pressure within the faults (above virgin pore pressure or above values after

- 11 -
depletion) and the associated reduction of effective normal stresses on the faults. In addition,
there will be a change, and probably an increase, in the shear stress, but how this occurs as a
function of the injection-induced deformation and dilation of the reservoir and fault gouge is
unclear.
3. For the majority of the field cases of induced seismicity described worldwide, seismicity is
interpreted to be related to an increase in pressure above the original reservoir pressure, ad-
versely affecting fault stability.
4. Injection of a cold fluid in a relatively warm reservoir can also trigger seismicity, and this will
depend on the temperature, type of fluid, amounts and rates of injection and on the distance
of injection to critically stressed faults.
5. Four cases are listed by TNO [12] of depleted reservoirs in which a delay of years occurred
between onset of injection and first seismic activity. Perhaps these faults were not critically
stressed, or pore pressure diffusion occurred, or other effects like those described in Hettema
et al. (2002) [26], describing delay effects between depletion and reservoir-compaction-
induced subsidence.
6. There are also field cases in which seismicity happened after the shut-in of the injection well.
7. Injection-induced seismicity is sometimes triggered on previously undetected geologic faults
(for recent examples, see Stabile et al. 2014 [24], Guglielmi et al. 2014 [25]).
There is no information in the literature to design “safe injection ranges” based solely on deple-
tion- and injection-induced pore pressure changes. This is no surprise, given the complexity of
induced seismicity and lack of field data. The literature indicates that the highest risk for injec-
tion-induced seismicity in a depleted reservoir often occurs with faults that are critically stressed
because of 1) geological conditions, like in an over-pressured reservoir with low effective normal
stresses acting on the faults, or because 2) depletion-induced compaction or injection occurred,
which led to differential strain across the fault and/or brought the stress state at the faults closer
to shear failure. Therefore, caution is required for pressure maintenance through injection in the
heavily depleted Groningen reservoir, as the hundreds of earthquakes over the past decades indi-
cate that many faults in Groningen are indeed critically stressed, at least over some part of their
surface. Even a small (a few bars) increase in pore pressure perturbing the stress field at these
“hot spots” could possibly cause earthquakes, releasing large amounts of energy accumulated due
to the depletion-induced reservoir compaction [11]. Having said this, it should be noted that in-
jection-induced-seismicity in Groningen is a hypothesis: it has not been observed yet, and there are
no papers that describe this scenario for a reservoir like Groningen.
2.4. 1D Geomechanical Modelling
Bourne et al. (2014) [11] made a calibrated model to predict compaction-induced seismicity in
Groningen. The model is strictly speaking only valid for depletion-induced compaction, and can-
not be applied to predict the effect of injection on seismicity without re-calibration to field data
collected during such an injection. With neither the Dutch UGS examples nor the literature
providing empirical or mechanism-based models previously used for injection-induced seismicity,
we start by investigating how the stress state at a typical Groningen fault may change during de-
pletion of a few hundred bar followed by an injection-induced increase in pore pressure of a few
tens of bar. This is done with a 1D analytical geomechanical tool for MC frictional slip [17], [15],
[38], where the input is the pre-production stress state and pore pressure, the stress path during
depletion and injection, the mechanical rock properties, and the orientation of the fault. The out-
put of the model is the shear capacity utilisation (SCU), which is a number between zero and one
indicating the tendency (likelihood) of fault slip. We will briefly explain the stress path and SCU
here.

- 12 -
The concept of stress path in reservoir mechanics is based on the observation in tens of papers
that reservoir depletion (Pp) is accompanied by a reduction in minimum total principal stress
(S3), see e.g. Teufel et al. (1991) [20], Addis et al. (1996) [19], Sayers and Schutjens (2007) [18],
and Segura et al. (2011) [30]. Defining the horizontal stress path coefficient2 during depletion as
hor,depl = S3/Pp = Sh/Pp ,
most values for hor,depl range from 0.4 to 0.9, reflecting the impact of geology variation on reser-
voir total stress response to depletion. Interestingly, hor,depl is often fairly constant within a given
reservoir, see e.g. Teufel et al. 1991 [20]. Figure 2.4 shows data on the stress path for the Gro-
ningen field from Van Eijs and Valencia (2015) [29], indicating a best-estimate hor,depl of 0.64 with
a 95%-confidence interval between 0.42 and 0.86. Information from laboratory experiments on
Groningen core points to hor,depl in the range 0.7 to 0.9. We used hor,depl = 0.7 in most simula-
tions.
Figure 2.4: Field data for Groningen suggesting a reduction of interpreted minimum total
horizontal stress with depletion, leading to a hor,depl of 0.64 with a 95% confidence
interval from 0.42 to 0.86 (Van Eijs and Valencia 2015 [29]).
So we have some insight on stress path during depletion. But unfortunately, papers with field
data on the stress path coefficient during an injection-induced pore pressure increase,
hor,inj = S3/Pp = Sh/Pp ,
are very scarce. Santarelli et al. (1998) [44] estimate hor,inj in a North Sea field to be between zero
and 0.1, and his paper remains the only published source of hor,inj to date. There is general agree-
ment in the literature that hor,inj will be smaller than hor,depl since part of the depletion-induced
deformation (and thus part of the S3-reduction) will probably not “bounce back” should the orig-
inal pore pressure be restored. This stress-path irreversibility occurs because energy has been
dissipated during depletion through plastic deformation of the rock, producing permanent (not-
2 For a normal faulting regime like Groningen, we will assume here that the minimum total principal stress (S3) equals the mini-mum total horizontal stress (Sh).

- 13 -
recoverable) microstructural changes like grain cracking, grain sliding, and grain rotation. These
mechanisms increase the system entropy and produce heat via grain-to-grain contact friction.
In the 1D MC modelling for GPM, the effective normal stress (n) and maximum shear stress
(max) is calculated at a planar fault dipping 70° to ENE 70°, which is typical of the orientation of
many large faults in the Groningen field. The fault-dip direction is aligned with the average direc-
tion of the minimum total horizontal stress in the Groningen field (ENE 70° to WSW 250°).
Starting from the virgin (pre-production) stress state in Groningen, scenarios for the stress path
as indicated in Figure 2.5 are used. The brown and blue dots in Figure 2.6 indicate the n-max
stress state for virgin conditions and after a depletion of 270 bar at a stress path hor,depl of 0.7,
respectively. Note that the dots plot on Mohr circles, which present n-max combinations of all
potential planar faults in the rock at this point in the reservoir (see Fjær et al. 2008 [17]). Also
indicated in the plot is the MC shear failure line, controlled by cohesion (C0) and angle of internal
friction (). The distance of the n-max points (indicating the stress state on a fault) to the MC-
line is a measure of the tendency of shear failure of the fault: The length of the vertical black line
divided by the length of the vertical red line is a ratio called the Shear Capacity Utilisation (SCU).
It ranges between zero, with no shear failure tendency, to 1, when the rock is at shear failure.
Figure 2.6 shows that a 270-bar depletion increases the SCU from about 0.45 at virgin conditions
to about 0.85 at a pore pressure of 80 bar. Note that depletion increases SCU on this particular
Groningen-typical fault, and that some hypothetical fault planes dipping 45° to 60° are already at
shear failure (A to A’ on the blue “depleted” Mohr circle).
Figure 2.5: Coupling between production/depletion-induced and injection-induced changes
in pore pressure and the change in minimum total horizontal stress, captured in
the stress path coefficients hor,depl and hor,inj. Field data indicate that, typically,
hor,depl > hor,inj. Note that hor,depl will be highest in the first depletion, and may be
smaller in subsequent depletion-injection cycles.

- 14 -
Figure 2.6: Stress state in virgin and depleted Groningen reservoir rock (brown and blue
Mohr circles, respectively) and at a Groningen-typical fault dipping 70° to SSE
160° (brown and blue circular symbols). The red line is the Mohr-Coulomb shear
failure line. The length of the black vertical vector divided by the length of the red
vector is the Shear Capacity Utilisation (SCU) factor, a measure of the likelihood
of shear failure.
Figure 2.7 shows stress paths during an injection-induced increase in pore fluid pressure of
40 bar, starting from the depleted value of 80 bar (blue dot) and using four stress path coefficient
hor,inj of 0.7 (perfect stress-rebound), 0.5, 0.3, and 0.1 (as shown in Figure 2.5). Note that, for this
model, injection along hor,inj of 0.5, 0.3, and 0.1 will increase the SCU. In contrast, the injection
along hor,inj of 0.7 will produce no significant change in SCU (stress path vector near-parallel to
the MC shear failure line). The smaller the hor,inj, the stronger the SCU increase per unit increase
in pore fluid pressure.
Depending on the virgin stress state, stress paths during depletion and injection, and rock me-
chanical parameters, there may be a range of relatively high hor,inj values in which the SCU actual-
ly decreases with increasing pore fluid pressure. Figure 2.8 shows the effects of depletion and
injection on SCU in 1D MC simulations with Groningen-typical stress states and rock properties,
again for a fault dipping 70° to 70° ENE. Starting with a depletion from 350 bar to 80 bar with
hor,depl of 0.7 (point A in Figure 2.8), further depletion with hor,depl of 0.7 (towards point B) will
increase the SCU. Should an injection-induced pore pressure increase from 80 bar (towards point
C) occur with the same stress path hor,inj of 0.7, of course, the SCU would decrease. This occurs
for all values of hor,depl in the green zone in Figure 2.8. But as stated above, it is likely that hor,inj is
smaller than hor,depl. For injection with hor,inj smaller than 0.54 (point D), the SCU actually in-
creases with increasing pore fluid pressure (yellow and red zones).
Comparison with the SCU increase during a depletion from 80 bar to 40 bar (point E) thus re-
veals three stress path ranges during injection: For hor,inj values in the green zone (hor,inj from 0.70
to 0.54) in Figure 2.8), the SCU decreases with injection. For hor,inj values in the yellow zone (0.54
to 0.39), the SCU increases with injection, but the SCU increase per unit increase in pore pressure
is lower than the SCU increase per unit depletion. Point F is the threshold hor,inj. For hor,inj values
in the red zone (0.39 to 0), the SCU increase per unit increase in pore pressure is higher than the
SCU increase per unit depletion.

- 15 -
Figure 2.7: Effect of an injection-induced increase in pore pressure on shear stress and effec-
tive normal stress for a horizontal stress path coefficient during injection (hor,inj)
in the range 0.1 to 0.7, following depletion from 350 bar to 80 bar at hor,depl of 0.7.
Injection at a relatively low value of hor,inj leads to higher SCUs, i.e. to a higher
tendency of shear failure, compared to the depleted state (blue closed circle).
Figure 2.8: Results from an analytical one-dimensional Mohr-Coulomb frictional slip model,
comparing the effects of depletion at a horizontal stress path coefficient (hor,depl)
of 0.7 and injection under a horizontal stress path coefficient (hor,inj) in the range 0
to 0.7. The influence of an injection-induced pore pressure increase on SCU
strongly depends on hor,inj: There are model-specific ranges of hor,inj where injec-

- 16 -
tion reduces SCU overall (green zone), reduces SCU compared to a similar deple-
tion (yellow zone), and increases SCU compared to a similar depletion (red zone).
It must be kept in mind that the model results shown in Figure 2.8 are for simulations with one
particular set of input parameters. But qualitatively similar results are obtained if we vary them,
with the three areas with hor,inj values in green, yellow and red zones appearing in all results,
though with different combinations of hor,inj. and SCU values. This contains a message with po-
tentially important implications for fault slip during GPM-induced injection: there may be a range
of hor,inj values where injection reduces the SCU, or at least reduces it compared to a similar pore
pressure change due to depletion (green and yellow zones in Figure 2.8). A reducing SCU may
lead to a reduction in the likelihood of induced seismicity. However, should the hor,inj values be
very low (say, < 0.2), a pore pressure increase with GPM may be accompanied by a relatively
large increase in SCU, and thus to an increase in seismic hazard compared to a similar pore pres-
sure change during depletion. In any case, the 1D MC simulations suggest strong control of the
stress path during injection on the fault slip, and this, in turn, may indicate control of the stress
path on seismicity. Unfortunately, as stated above, there is only one paper on hor,inj with one
datapoint. Furthermore, the validity of 1D MC simulations for the prediction of fault slip proper
under depletion and injection needs to be critically reviewed.
2.5. Limitations of 1D Mohr-Coulomb Geomechanical Modelling
Although 1D MC simulations indicate the potential for GPM to reduce seismicity, there are some
serious concerns.
First and foremost, stress-based models of fault slip tendency using 1D MC models predict fault
slip in the Groningen field where it is not occurring. Figure 2.9a shows several of the 700 large
Groningen faults, and Figure 2.9b shows their SCU value based on research by Van den Bogert
et al. (2013a) [31]. Note that this model predicts seismicity in the centre of the field, but also at
the edges of the field and in the Southern part (purple colours indicate faults with high SCU).
And indeed, most strong seismicity has occurred in the central part, around the Loppersum area
(Figure 2.9c), where there is a high compaction (Figure 2.9d). But in contrast with the model pre-
diction, seismic activity has been relatively low at the edges of the field, and in the southern part.
It requires a detailed 3D finite element geomechanical model with laterally varying mechanical
properties and stresses to match the model to field data (see Sanz et al. 2015 [39]), and even then,
the predictive capability of such an elaborate model to predict future earthquake is questioned
(see below).
Secondly, there is a large uncertainty in the pre-production stress state, the orientation of the
maximum total horizontal stress, and the stress path (see Van Eijs and Valencia, 2015 [29]). Also
the mechanical rock properties in reservoir and fault zones will be heterogeneous (see e.g. Chang
2006 [33]; Crawford et al. 2010 [35]), and as a result, MC type stress-based models show a large
uncertainty in the SCU (Figure 2.10).
Thirdly, 1D MC models use isotropic mechanical properties, and no distinction is made between
reservoir and fault. Yet 2D finite-element simulations of frictional slip along faults reveal a strong
variation of SCU along the fault in case the depleting reservoir is offset along the fault. Im-
portantly, the SCU obtained in 1D MC analyses, which corresponds to the no-fault-offset case, is
not the most conservative (i.e. high SCU) geologic scenario, but the most “optimistic” one, i.e.
predicting fault slip only after a relatively high depletion (Figure 2.11) compared to slip at faults
offsetting the depleting reservoir.
Fourth, a 1D MC model does not take into account any injection-induced cooling effects and
associated total stress reduction, or time-dependent fault gouge pressure changes.

- 17 -
Figure 2.9: A set of large faults in the Groningen field mapped based on seismic data (a) with
SCU indicated (b, van den Bogert et al. 2013a [31]). The amount of earthquakes
recorded through mid-October 2015 (c) agrees with a zone of high SCU, but other
zones of high SCU in (b) did not experience many earthquakes, like at the edges
of the field and the southern part. The in-situ compaction strain inverted from
subsidence (Bourne et al. 2014, [11]) is a better indicator for seismicity (d).
Figure 2.10: Uncertainty in the input parameters of frictional slip models like the 1D Mohr-
Coulomb model produces significant uncertainty in the prediction of fault slip.
These results in Figure 2.10b represent 10,000 simulations in which the magnitude
of eight input parameters was varied: the initial stress state (Svertical, Sh,max, Sh,min,
Pp), orientation Sh,max, fault dip, fault azimuth, and the stress path coefficient dur-
ing depletion (hor,depl), the latter taken here as 0.78 with a standard deviation of
0.08.

- 18 -
Figure 2.11: Depletion to reach shear failure as a function of offset of depleting reservoir along
a normal and reverse fault. These 2D finite-element frictional slip models show a
strong effect of fault offset on the maximum SCU along the fault. Note that the 1D
Mohr-Coulomb model in which fault slip is predicted on a fault without offset is
not the most conservative model, but rather, the most optimistic (fault-slip re-
sistant).
Fifth, 1D stress-based models only describe the onset of fault slip, and essentially have two out-
comes: not-slipping or slipping. Such models are unable to describe the distribution of fault slip
parameters along the fault, or the details of the fault-slip mechanism and how it evolves with
fault slip or time. This is also a limitation of the work of Sanz et al. (2015) [39]. Knowing these
limitations of MC-type modelling, we exert caution in over-interpreting the results of 1D MC
models, and we will not use such models to predict injection-induced seismicity.
Our further work was directed at providing geomechanical input to GPM in two ways:
1. via more sophisticated mechanism-based models for pore pressure increase and its effect on
fault stability, and
2. via feasibility analysis of a field injection test to accurately measure the effects of a well-
controlled pore pressure increase on seismicity, including gathering high-quality field data to
construct and calibrate new geomechanical models for injection-induced fault slip.
2.6. Frictional-slip Modelling: A More Sophisticated 2D Model
More sophisticated 2D finite-elements models have been constructed recently, based on a MC
constitutive law describing the relation between local stress and local strain, but with
1. a fault that offsets the depleting reservoir,
2. non-uniform pore pressure changing in reservoir and fault gouge as a function of injection
pressure and time,
3. homogeneous isotropic fault slip properties, and
4. plastic deformation when SCU > 1 with associated total stress redistribution (van den Bogert
and van Eijs 2013b [32], Van den Bogert 2015, TNO 2015b [28]).
Next to SCU, the model calculates the length of the fault that is slipping (Ls), i.e. where SCU ≥ 1,
and the maximum slip distance (Sd) along the slip part (Figure 2.12). The results obtained with
the new models confirm the result shown in Figure 2.13: fault offset, probably acerbated by the
introduction of plasticity, leads to a complex interplay between fault slip, near-fault reservoir and
fault gouge deformation, and total stress change. SCU, Ls, and Sd vary along the fault plane.

- 19 -
Figure 2.12: Introducing two new parameters in frictional slip models: the length of the fault
that is slipping (Ls), i.e. where SCU ≥ 1, and the maximum slip distance (Sd) along
the slip part.
The models for a Groningen-typical fault offset of 100 m indicate a strong dependence of fault
slip response during injection on the stress path coefficient (hor,inj) in the fault gouge: following a
depletion of 280 bar from an initial 350 bar to 70 bar with a stress path coefficient during deple-
tion of hor,depl 0.68, the pore pressure was increased by 50 bar at a constant stress path during
injection of hor,inj of 0.68 (base case), 0.51, 0.3, and 0.07 [13]. The result of this sensitivity analysis
is shown in Figure 2.13 and Figure 2.14.
With the 280-bar depletion creating a fault slip length (Ls) of 117 m (not shown here), injection
by 50 bar with a hor,inj of 0.07 increases Ls to 143 m. This is 14 m more than the 129 m, which
would have occurred during a further depletion of 50 bar. Coincidentally, injection by 50 bar with
a hor,inj of 0.3 also increases Ls to 129 m. In contrast, injection by 50 bar with a hor,inj of 0.51 de-
creases Ls from 117 m to 63 m. The maximum slip distance (Sd) shows a similar pattern: Com-
pared to the Sd of 4.6 cm during ongoing depletion of 50 bar, up by 1.6 cm from the Sd of 2.8 cm
obtained after the original 270 bar depletion, injection by 50 bar with hor,inj of 0.07, 0.3, and 0.57
leads to a an Sd of 5.6, 3.9, and 0 cm, respectively. Note that, just like the fault slip length Ld, Sd
during injection reduces with increasing hor,inj (Figure 2.14).
If slip patch length and maximum slip distance are measures for induced seismicity, these models
point out that in some scenarios, more seismicity can occur when compared to a further deple-
tion case, but in other scenarios, there can be less seismicity. The likelihood of these scenarios is
difficult to predict but from rock mechanical observations in the laboratory and from geodetic
measurement above the Norg UGS, we know that some part of the compaction is irreversible,
and therefore a lower value for the hor,inj is expected than the hor,depl of around 0.65 (Figure 2.4).
The new models were also used to investigate the effect of a temperature reduction during injec-
tion [13]. Injection of relatively cold N2 gas during GPM will cool the reservoir rock and cause it
to shrink, thereby reducing the total stresses that are acting on the reservoir rock. This cooled
zone and the larger zone of reduced total stress gradually extend outwards from the injector well
as the gas injection progresses, eventually reaching the fault zone where the injection-induced
increase in pore pressure has already affected the total stresses via the poro-elastic effect (we ne-
glect plasticity here, assuming SCU < 1). The first set of simulations reveal that the injection-
induced cooling of the fault gouge has a strong effect on fault slip stability, possibly changing the
total stress state and thus the SCU more than the poro-elastic effect. In the simulation results

- 20 -
shown in Figure 2.15, the SCU at the fault zone increases by about 0.1 if the influence of temper-
ature is accounted for, while the pore-pressure-increase alone has a negligible effect. So tempera-
ture must be accounted for, which is another reason why the 1D MC models shown above
should be regarded with caution, and more sophisticated geomechanical modelling, including
pore pressure diffusion and temperature effects, is necessary.
Figure 2.13: Overview of shear capacity utilisation (SCU) for a horizontal stress path coeffi-
cient (hor,inj) of 0.07 (left) and 0.51 (right). Dashed lines represent SCU for the base
case, which is for a hor,inj of 0.68. Note the single and relatively large slip patch in
the simulation with hor,inj of 0.07 compared to the one with hor,inj of 0.51, which
shows two slip patches that are, in total, of a smaller length than in the simulation
with hor,inj of 0.07. The light grey blocks indicate the position of the reservoir
(Slochteren gas and water) in the hanging wall and footwall [13].

- 21 -
Figure 2.14: Slip patch length (Ls) and maximum slip distance (Sd) as a function of stress path
coefficient hor,inj during injection (circle-data) and depletion (square-data) of 50
bar in the 2D finite-element simulations of fault slip offsetting the reservoir by
100 m (plot based, in part, on data in Figure 2.13 and published in TNO 2015b
[13]). Note that compared to the depletion case, values for Ls and Sd are relatively
low at relatively high values for the hor,inj. This confirms that, perhaps, injection
under high hor,inj can reduce seismicity.

- 22 -
Figure 2.15: Effect of injection-induced cooling on SCU along a vertical plane at a distance of
300 m from the injector well. Injection pressure is 165 bar, some 95 bar above the
maximum depletion of 70 bar. This result is for a time 20 years after start of injec-
tion. Figures a and b give the absolute value of SCU for the case of injection with
temperature and without temperature effect, respectively. Figures c and d give the
change in SCU compared to the SCU after depletion to 70 bar, again for the case
of injection with temperature and without temperature effect, respectively. Initial
reservoir temperature is 94 °C; initial nitrogen temperature is 10 °C. Note the
strong effect of injection-induced temperature on SCU, which is caused by a cool-
ing-induced reduction in total stress state at the faults. Poisson’s ratio of the res-
ervoir rock is 0.20, the horizontal stress path coefficient is about 0.70, Young’s
modulus is 15 GPa, and the coefficient of thermal expansion is 10-5 °C-1. For de-
tailed information, see TNO (2015b) [13].
The International Energy Agency recently published a review on fault geomechanical stability
during pressure build-up (IEAGHG 2015, [38]). Their key conclusion is that “the Mohr Cou-
lomb failure criterion is the major stress-strength relationship employed for stability analysis of
faults during injection of fluids such as CO2, or depletion of hydrocarbons. Analytical methods
combined with the numerical solutions provide the best approach for assessing geomechanical
stability of faults”. Because of the more realistic geology and rock mechanics in the new set of
frictional-slip models, we believe that the results are more representative of an injection-induced
fault slip during GPM than the 1D models shown in Figure 2.7 and Figure 2.8. The new models
present a mechanistic basis to the interpretation that injection can indeed reduce the tendency for
fault slip, reduce the fault slip length and reduce the maximum distance of fault slip, provided the
stress path coefficient is relatively high, i.e. similar to, or just slightly lower than, the one during
depletion. Yet, despite this insight, the input parameters still have a great uncertainty, and field

- 23 -
data to calibrate the new models are not available. In addition, there is the additional complexity
of the injection-induced temperature change affecting the total stress state, and thus SCU, Ls, and
Sd. This is where the idea for a field injection test comes in. Next to model construction and
elaborate sensitivity analyses, what is also required is a field injection test to measure what is actu-
ally happening at the Groningen faults during gas injection for pressure maintenance.
2.7. Field Injection Test
It is presently unknown whether increasing the pore pressure during GPM will produce less,
more, or a similar rate of earthquakes (amount and maximum magnitude over a given time) than
is occurring now under the slow-depletion conditions in the Groningen field. A controlled injec-
tion of N2 or Groningen gas into an area of the field close to a fault where a recent earthquake
occurred can probably help to gain insight which of these hypotheses is the most likely.
The first aim of such a field injection test is to de-risk GPM by gathering seismicity data and
conducting statistical analyses to establish whether or not changing the measured in-situ pore
pressure in a controlled way (ramped up by a few bar to a few tens of bar over a period of, say,
three months) changes the amount of earthquakes recorded over a given time period. Clearly, the
seismic events recorded during and after the pore pressure increase must be different from be-
fore the pore pressure change, and this and other data (like the change in total stress or the in-
situ strain) must be unambiguous in being due to the injection-induced (controlled) pore pressure
increase, and not because of another effect. The second aim of the field test is to gather data to
understand the detailed mechanics of the reservoir during injection: Will the reservoir around the
injector well and at the fault expand vertically (dilation), and will the minimum total principal
(horizontal) stress increase as a function of the increasing pore pressure, allowing an in-situ
measurement of hor,inj? Achieving both aims requires extensive instrumentation of injector and
observations wells to acquire a combination of geophysical (acoustic) data and rock mechanics
data (Figure 2.16).
Figure 2.16: Schematic of field injection test. For optimal learning, instrumenting a dedicated
observation well should be considered to confirm the injection-induced increase
in pore pressure at nearby fault(s) around which induced seismicity has occurred.

- 24 -
Key to a successful field test is the ability to get meaningful information for GPM from the field
data with acceptable safety risks, providing value-of-information at a fraction of the total GPM
project investment, and over a reasonable time span. We will briefly address here the concerns on
safety and on gaining meaningful information from a field injection test. Regarding safety, in-
deed, if the Groningen faults in the injection area are critically stressed (i.e. at the verge of slip-
ping), then, theoretically, a small (few-bar) pore pressure increase could lead to fault slip and
seismicity. We do not know how big such an earthquake would be, and how many of such large
seismic events would occur during and after a field injection test. This is certainly a major point
of concern, but a few points must be kept in mind. Firstly, there are no data or models in Shell
nor in the open literature indicating that injection-induced seismicity will occur in a field like
Groningen. Secondly, regarding the ability of a “controlled injection”, fluid-flow models based
on the latest static and dynamic reservoir model of Groningen show that a pore pressure increase
of tens of bar in a field test requires several bcm of gas injection. This will take months and thus
provide ample time to carefully measure the pore pressure increase in the injector and (as we
propose) in a dedicated observation well close to the fault, and if necessary, control it via the
bottomhole flowing pressure at the injector well.
On obtaining meaningful information from a field test, there is the rightful concern of represent-
ativeness of the findings in just one field test done in this large Groningen field. However, deal-
ing with the in-field geologic variability and shortage of field data is an essential part of any geo-
science modelling, and thus also of reservoir mechanics. We will only know the degree of hetero-
geneity of Groningen reservoir parameters if we measure them. The applicability of information
from the field test data for other locations in the Groningen field depends on the depth of un-
derstanding of the deformation mechanism (physics, thermodynamics) at the faults, and on the
lateral variation in geological structure and rock mechanical properties across the field. The re-
sults may be ambiguous or hard to use for model construction. However, there is an opportunity
to learn and increase the knowledge of poorly understood mechanism-based geomechanical ef-
fects of gas injection. Imagine, for example, that the field injection test leads to a reduced induced
seismicity complemented by relatively high values of in-situ-measured hor,inj. One would then gain
more confidence in models like the one shown in Figure 2.13. From a geomechanical perspec-
tive, if the rock mechanical properties, stress state, and stress changes vary gradually across the
field and within bounds captured by the model, there is no reason why a mechanism-based mod-
el could not be applied across the field 3. Field data are essential to construct and calibrate such a
model to predict the geomechanical effects of GPM operations in the Groningen field.
Chapter 5 contains more details on the field injection test, focusing on the test scope, on the
modification of the cluster where the injection test will occur, and on the statistical analysis of the
field data.
2.8. Summary
There is insufficient data in the literature to make an empirical or mechanism-based model for
injection-induced seismicity during GPM: There are no papers with systematic field-injection
tests, and geological, petrophysical, and operational conditions vary greatly between the various
cases. Data from UGS sites in the northern Netherlands show only one case of fairly large injec-
tion-induced seismicity (Norg, with magnitude 1.05 on the Richter scale) but do not point to
3 For an analogy, significant and fast (within years) technical progress was made in the understanding of shear-enhanced com-
paction and compaction bands via a combination of theoretical analysis, experimental rock deformation work, and field data
(see Wong et al. 1992 [40], 1999 [27], Knipe et al. 1998 [36], and Lewis and Couples 2007 [41]).

- 25 -
many large earthquakes during the tens of bar pore pressure increase above maximum depletion
levels. The UGS in the Bergermeer field is of interest as well, because during its depletion by
more than 200 bar, there have been several strong earthquakes (Ml of 3.0 to 3.5), see Table 2.1
and Table 2.2, so we can safely assume that some parts of the Bergermeer faults are critically
stressed. Nevertheless, during the subsequent injection with a pore pressure increase of a few bar
to tens of bar, only very small earthquakes (microseismicity, or tremors) were observed. In addi-
tion, a review of the open-literature papers indicates that, in most cases, induced seismicity is only
observed when injection pressures exceed virgin (pre-production) pore pressures. Taken togeth-
er, information from analogue fields and global injection cases does not point to strong earth-
quakes after injection in depleted reservoirs, but rather suggests that seismicity may be low or
absent during injection, or only occurs when injection pressures approach virgin pressures. But as
always, one must recall that every field is different, and predictions based on analogue fields re-
main highly speculative until proven by field data.
Most theoretical and review papers on injection-induced seismicity refer to frictional slip as the
underlying mechanism of injection-induced seismicity but no detailed modelling work is present-
ed, probably for two main reasons: The physics of injection-induced seismicity is very complex,
and there is a lack of systematically collected field data. In addition, classical (no-offset) MC type
frictional-slip models have a number of serious drawbacks. Our current modelling approach to
injection-induced fault slip is in line with the recent recommendations of IEAGHG (2015) [38]
to combine analytical and numerical methods, and aim for realistic geology; our models do con-
tain Groningen-typical structural geology with offset along the faults, pore pressure diffusion,
plasticity, and temperature effects. Rupture modelling and post-failure fault stabilisation analyses
are ongoing.
Given the present situation of no available valid and tested geomechanical-model and a clear
business need for knowledge on the impact of GPM-induced pore pressure changes on seismici-
ty, a field injection test should be considered in case GPM will be implemented in the coming
years. Such a test can gain valuable information on the effect of injection on seismicity and the
mechanisms acting at the slipping fault. But it must be executed within an acceptable safety enve-
lope, include detailed statistical techniques to prove the effect of injection on seismicity, and in-
volve extensive in-situ data collection and monitoring. Through a parallel approach of modelling
and high-quality in-situ data collection, progress could be made in gaining a mechanism-based
understanding of injection-induced fault slip, so that the findings of the injection test can be ap-
plied to GPM across the Groningen field.

- 26 -
3. Groningen Field Description and Performance
3.1. Groningen Reservoir Architecture and Volumes
The Groningen structure is a NNW-SSE-trending, gently folded, wedge-shaped intrabasinal high
with an extent of 40 km by 25 km with strongly faulted east, south, and west flanks and a gently
dipping north flank (Figure A1.1). The main reservoir is the Lower Permian, Rotliegend Sloch-
teren mainly aeoliean sandstone, which has good properties with porosities in the range of 15-
20% and permeabilities of up to 3 D. The reservoir thickness varies from some 70 m in the SE
part of the field to 240 m in the NW (Figure A1.2). The Slochteren formation can be subdivided
into the Upper and Lower Slochteren, which are overall in communication. The Slochteren is
overlain by the poorer quality Ten Boer claystone, which depletes into the Slochteren. The
Rotliegend is covered by the Late Permian Zechstein evaporite sequence, consisting of carbonate,
anhydrite, and halite, which acts as the top reservoir seal. The reservoir unconformably overlies
the Carboniferous fluvio-deltaic Limburg Group (Westphalian), which consists of poor-quality
sandstone, shales and coals.
There are about 1700 mapped faults intersecting the reservoir with predominantly E-W and
NNW-SSE orientations and throws of less than 100 m, which is less than the average reservoir
thickness of about 200 m. None of the faults within the main part of the reservoir appear to act
as significant barriers to gas flow, although they might hold a small pressure differential.
The gas-water contact is located at about 3,000 m depth, with some depth variations observed
for various compartments. A very weak aquifer underlies the northern part of the field.
Typically, Groningen gas is composed of around 80% CH4, 14% N2 and 1% CO2, with C2-C5
components making up the remainder. The field contained approximately 2,900 bcm of gas4, of
which, on 01/01/15, about 2,050 bcm have been produced.
The main petroleum engineering uncertainties, beside the volume of gas initially in place, are:
Late life behaviour of field due to potential pressure support from adjacent formations (i.e.
“slow gas initially in place”)
- The Ten Boer connectivity and depletion behaviour is not fully understood.
- The connectivity and depletion behaviour of the underlying Carboniferous reservoir is al-
so uncertain.
Depletion behaviour of periphery of the field
- The history match of the peripheral area is not as high quality as the field average.
- Subsidence in north-western part of field is overestimated (when compared to measure-
ments).
- Connectivity between fault blocks.
Mechanism for aquifer water ingression: Bottom water vs. breakthrough in high-permeability
streaks.
4 All volumes are given in norm cubic meters, if not stated otherwise.

- 27 -
3.2. Development History and Performance
The field was discovered in 1959 and first production was in 1963. The development started in
the south of the field before the actual northern extent of the field was known. This led to a lag
in pressure decline in the north until further production wells were put on production in the
north in the 1970s.
In the initial years, the Groningen field, due to its size and reservoir pressure, was capable of
supplying the necessary volumes to the market and had the necessary capacity to supply the re-
quired swing volumes as the customers requested their gas (Figure 3.1). Until the mid-1970s a
peak rate of almost 90 bcm/a was achieved. Since the late 1970s, production from smaller fields
was given priority and Groningen became a swing producer for times in which the small fields
could not meet demand. The initial reservoir pressure of about 350 bar declined to about 180 bar
by 1990, necessitating the introduction of compression on all production clusters (Figure 3.2).
With decreasing production capacity from Groningen, the Norg and Grijpskerk fields were add-
ed in 1997 as underground gas storage (UGS) to the Groningen system to supply gas for peak
demand. The reservoir pressure has meanwhile declined to less than 100 bar.
Figure 3.1: Historical gas production from the Groningen field in bcm per year.

- 28 -
Figure 3.2: Historical reservoir pressures measured at different production clusters. The or-
ange points represent pressures at the southern-most Tuschenklappen cluster and
the green points pressures at the northern-most t-Zandt cluster. Due to the later
development of the north of the field, the pressures in that area remained higher
than the pressures in the south until the late 1980s.
3.3. Existing Infrastructure
The Groningen System includes the Groningen field with 20 production clusters (Figure A1.3),
two satellite clusters, and the two UGS sites at Norg and Grijpskerk. Its support facilities include
pipeline systems and gas condensate separation and export facilities. There are 258 available pro-
duction, 22 observation, and three water disposal wells. Additionally, 24 abandoned wells exist in
the field.
The 20 production clusters have more or less identical process equipment (Figure 3.3). The only
major difference between the clusters is the number of wells feeding into the process equipment.
The process equipment consists of liquid knock-out vessels, air coolers, a single-stage depletion
compressor, gas/gas heat exchanger, Joule-Thompson valve, and low-temperature separators.
Auxiliary processing equipment to recover water and condensate and a glycol circuit are also in-
corporated in the facility. Each cluster has a single compressor train and dual gas processing
trains. The processing facilities primarily serve separate water and condensate from the gas. Since
the reservoir pressure is declining due to production, a depletion compressor ensures that the
facility remains operating in its operating window and delivering sufficient gas at sales pressure.
The current plants have a large overcapacity and the compressors are the system bottlenecks.

- 29 -
Figure 3.3: Schematic of processing facilities at each of the 20 production clusters.
The condensate and water separated from the gas are transported by pipeline to Delfzijl, where
the water is separated and injected into the water leg of the Groningen field at Borgsweer. The
gas is delivered from the clusters into the main ring line, which has seven custody transfer sta-
tions to deliver the gas into the Dutch grid. The pipeline system is designed in the shape of a
large ‘figure 8’ to increase operational flexibility and reliability. The total system consists of about
162 km of pipe with diameters of 24 to 36 inches. At the custody transfer stations, the gas is con-
tractually obliged to have a pressure between 55 and 65.5 barg and a temperature between 10 and
30 °C.

- 30 -
4. Pressure Management and Recovery under Injection
4.1. Subsurface Concepts
The key decisions for GPM related to the subsurface are
1. the pressure management policy, which consists of
a. the final equilibrium reservoir pressure at field abandonment
b. tolerances to pressure increases and decreases over time during GPM
i. at the regional level
ii. at the local level, around injection and production wells, and
2. the injection locations.
The regional pressure at the start of GPM depends on the GPM implementation date and on the
production scenario to that date. Under production policy with 33 bcm/a, the pressure at the
notional start date of GPM (2024) is expected to be approximately 65 bar in the north and ap-
proximately 40 bar in the south.
The regions are all interconnected, which means that gas cross-flows between regions. Regions at
a higher pressure will have a net outflow, while regions at low pressure will have a net inflow.
GPM can be designed to maintain the pressure in a region by injecting a volume that replaces the
net outflow from production and crossflow. GPM can also be designed to increase or decrease
the pressure in a region by surplus injection or production respectively.
The imbalance in regional pressure can only be sustained by continued injection and production.
Ultimately, as a result of the cross-flow between regions, all pressures have to equilibrate to the
same field pressure. The choice of the final equilibrium pressure is a key decision for the pressure
management policy. The full range is described by four options and the final equilibrium pressure
can be:
1) above the highest regional pressure at the start GPM (~65 bar in the north by 2024),
2) at the average field pressure at the start of GPM (~55 bar by 2024),
3) at the lowest regional pressure at the start of GPM (~40 bar in the south by 2024), or
4) at the abandonment pressure for third-stage compression (~10 bar).
A graphical representation of a pressure management policy is shown in Figure 4.1. The four
options for the final equilibrium pressure are indicated by dashed lines. The choice of the final
equilibrium pressure will depend on the geomechanical realisation. If a pressure increase is con-
sidered more hazardous than continued depletion, the pressure should equilibrate towards the
low end (“minimum repressurisation” approach, ref. Figure 1.6). If a pressure increase is consid-
ered effective in reducing seismic hazard, further depletion should be avoided and pressure
should equilibrate towards the high end (“equilibrate” approach, ref. Figure 1.6).
Figure 4.1: Example of a schematic representation of a pressure management policy showing
the pressure in the north (solid green) and south (dashed green), as well as the
field average pressure (solid purple).

- 31 -
Figure 4.2 shows a range of regional pressure management policies. This matrix of conceptual
policies is intended to help developing GPM concepts. The feasibility and attractiveness of the
individual policies will depend on future insights on the seismicity risk for depletion and injection
and an assessment across all other value drivers. This might render some policies unfeasible or
suboptimal.
Rows 1 to 4 show policies with decreasing abandonment pressure. Rows 1 and 2 require confi-
dence in the effectiveness of GPM. The columns depict different classes of pressure management
policies:
A. Immediate convergence. Only the top one (A1) would require injection, the others (A2-A4)
are cases with depletion production only and no injection.
B. Regional pressures are maintained constant from the start of GPM until they are allowed to
equilibrate at the end of field life.
C. Only the northern pressure is maintained constant from the start of GPM, whereas the
southern pressure is allowed to decline first before it is maintained constant until at the end
of field life, and the pressures are allowed to equilibrate. The further depletion in the south
allows higher production rates.
D. Analogous to C, only the southern pressure is maintained constant from the start of GPM,
whereas the pressure in the north is first increased before being stabilised to create a larger
pressure difference between north and south and thereby allowing higher production rates.
E. Combining C and D, both, the pressure in the south and the pressure in the north are first
allowed to move in opposite directions before being kept stable und then allowed to equili-
brate. Again, the larger N-S pressure aims at increasing higher production rates under GPM.
Columns C to E show increasing tolerance to regional pressure change to assess the impact on
the production rate. Columns D and E are mainly relevant in the context of a north-south (N-S)
sweep injection scheme.
The above policies focus mainly on pressure stabilisation or even increase in at least part of the
field. Policies with a reduced pressure decline across the field can also be achieved with GPM and
could to be assessed later as well (Figure 1.4).

- 32 -
Figure 4.2: Overview of the range of potential pressure management policies. Each chart
shows conceptually the average pressures over time from the start of GPM to the
end of field life. Three pressure profiles are drawn: The average pressure in the
north (solid green line), the south (dashed green line), and in the entire field (pur-
ple line). The pressure management policies are arranged from top to bottom ac-
cording to decreasing abandonment pressure and from left to right by the increas-
ing tolerance to pressure changes.
The above pressure management policies apply to the average regional pressures in the reservoir.
Injection will however also introduce a local pressure deviation in the near-wellbore area to ena-
ble flow from the injection well into the reservoir. This pressure difference is called fall-off and it
is the analogue of the drawdown pressure to enable flow from the reservoir towards a production
well.
An additional pressure management policy is required for the fall-off at the injection wells. The
fall-off pressure is related to the injection rate and the wellbore radius. The area affected by the
pressure increase will remain localised due to simultaneous production. Seasonal production vari-
ations in the south already give rise to pressure fluctuations of about 5 bar. Higher fall-off pres-
sures would enable a more efficient utilisation of injection wells.
The pressure management policies visualised in Figure 4.2 can be achieved with different injec-
tor-producer patterns. The range of injection locations is captured by four archetypes, dispersed,
semi-dispersed, central and N-S sweep, as illustrated in Figure 4.3. The dispersed and semi-
dispersed concepts are examples of a pattern injection. The dispersed concept has 20-30 wells
located between production clusters. The semi-dispersed concept has the same pattern, though
without the 10-15 most southern wells to avoid excessive breakthrough of N2 in the south. The
A B C D E
Abandonment pressure
Immediate Convergence
All areas pore pressure maintained
North pore pressure
maintained
South pore pressure
maintained
Porepressure un-constrained
1) High(Max. pressurein field at start of GPM)
Fill-up south
2) Medium(Avg. pressurein field at start of GPM)
Shut in
3) Low(Min. pressurein field at start of GPM)
1st stage depletion
4) Depletionto 10 bar(3rd stage compression)
3rd stage depletion

- 33 -
central concept is an example of a local injection scheme, e.g. to temporarily defer a pressure
decrease in the Loppersum area. The N-S injection pattern is an example of a line drive scheme.
Further optimisation of the selected injection pattern could be done at a later stage, for example
to minimise the need of additional wells and maximise the reservoir sweep.
Figure 4.3: Four archetype injection patterns to implement the GPM pressure management
policies. Schematic pictures only, with notional locations and number of injectors.
For a small, local injection scheme (bottom, right), additional flank producer
wells would have to be drilled, while in all other concepts the existing producer
wells would suffice.

- 34 -
4.2. Modelling Objectives and Approach
4.2.1. Modelling Objectives
The premise of the subsurface work is that the (lifecycle) seismic hazard of a GPM concept de-
pends predominantly on the pressure management policy. Thermal effects have been identified
as a possible cause for seismicity [3], but have not been considered here. These effects would
have to be managed by controlling the temperature of the injection gas.
The objective of the subsurface modelling work is to identify which pressure management poli-
cies are practical and which injection patterns are best suited to implement them, and to estimate
the production and injection rates and gas recoveries for the different concepts.
4.2.2. Modelling Approach
For a range of concepts, forecasts are made for the injection rate of N2 and the production rate
of Groningen gas and N2. The total demand for and back-produced amount of N2 determines
the phasing of the ASUs. In the reservoir, the N2 fluid is modelled with the same compressibility
and viscosity as the Groningen gas. The same approach is taken for CO2 co-injection. This is
deemed an appropriate simplification for the current modelling objectives.
The vantage point for the modelling work is the existing history-matched asset model. Modifica-
tions were made to incorporate
injection wells and N2 availability,
pressure management, and
N2 migration in the reservoir.
The subsurface uncertainty range relevant to depletion forecasts has been expanded to include
heterogeneity in reservoir permeability. Heterogeneity will enhance mixing (dispersion) of the N2.
As a result, the ultimate recovery will improve. In addition, the N2 front will become more dis-
persed, resulting in an earlier breakthrough, a slower increase in N2 concentration (leading to
longer time before reaching N2 cut-off) and therefore more N2 production.
Furthermore, the uncertainty range of fault transmissibility has been reviewed in the context of
N2 displacing gas. Sealing faults would divert the N2 sweep and leave pockets of hydrocarbon gas
stranded in their shadow. The historic production data, however, provides limited room for such
a downside.
A notional 80% N2 cut-off based on energy considerations is applied to the wells. Once the N2
concentration in a well reaches that value, the well is shut-in. Otherwise, no economic cut-off is
applied to the forecasts.
4.3. Subsurface Concept Examples
4.3.1. Concept Example 1 – Confident in benign effect of pore pressure increase
If it is assumed that pressure increase will have a benign effect on seismicity, a pressure manage-
ment policy can be adopted that minimises further compaction from depletion in the seismically
critical area around Loppersum. With this pressure management policy, all pressures in the field
are ultimately increased to match the highest regional pressure at the start of GPM, which is ~65
bar in the north of the field. The pressure management policy (C1) is implemented with a semi-
dispersed injection pattern.

- 35 -
For the period prior to GPM implementation, a yearly offtake of 33 bcm is assumed in this ex-
ample. Injection starts in 2024 and peaks at ~20 bcm/a after completion of the sixth ASU. First
breakthrough occurs a few years after the start of injection. Figure 4.4 and Figure 4.5 provide an
overview of the pressure change over time and the corresponding injection and production rates
that could be achieved for this concept.
Figure 4.4: Pressure forecasts for GPM concept example 1: The bold red line represents the
field average pressure. The 5 remaining lines show the average pressure for differ-
ent areas in the field.

- 36 -
Figure 4.5: Production and injection forecasts for GPM concept example 1: Total produced
gas rate (solid green), Groningen gas production rate (light green), N2 concentra-
tion (light blue), N2 injection rate (dark blue), and average field pressure (red).
Figure 4.6: Expected pressure in bar at the start of GPM (left), expected minimum pressure
(middle) and maximum pressure increase (right) over the lifetime of GPM example concept 1.
Figure 4.6 shows, on the left, the pressure at the start of GPM. The minimal pressure reached
over the lifetime of the GPM concept in this example is shown in the middle. This allows an
estimate of the compaction-induced seismicity that is still expected from this GPM concept ex-
ample and the further compaction-induced seismicity that could be avoided. The maximum pore
pressure increase over the lifetime of the field is shown on the right. The seismicity induced by
pore pressure increase is uncertain.

- 37 -
Figure 4.6: Expected pressure in bar at the start of GPM (left), expected minimum pressure
(middle) and maximum pressure increase (right) over the lifetime of GPM exam-
ple concept 1. (Note that the shown repressurisation in the Eemskanaal area, at
the western flank of the modelled area is due to a strong aquifer, which is per-
ceived to be a model artefact.)
4.3.2. Concept Example 2 – Minimum Repressurisation Approach
In this example, GPM is implemented cautiously to avoid a pressure increase that could induce
additional seismicity. With this pressure management policy, all pressures in the field are de-
creased to match the lowest regional pressure at the start of GPM, which is 40 bar in the south.
The pressure management policy (B3) is implemented with a semi-dispersed injection pattern.
For the period prior to GPM implementation, a yearly offtake of 33 bcm/a is assumed in this
example. Injection starts in 2024 and peaks at ~10 bcm/a after completion of the third ASU.
First breakthrough occurs a few years after the start of injection. Figure 4.7 and Figure 4.8 pro-
vide an overview of the pressure change over time and the corresponding injection and produc-
tion rates that could be achieved for this concept.

- 38 -
Figure 4.7: Pressure forecasts for GPM concept example 1: The bold red line represents the
field average pressure. The five remaining lines show the average pressure for dif-
ferent areas in the field.

- 39 -
Figure 4.8: Production and injection forecasts for GPM concept example 1: Total produced
gas rate (solid green), Groningen gas production rate (light green), N2 concentra-
tion (light blue), N2 injection rate (dark blue), and average field pressure (red).
Figure 4.9 shows, on the left, the pressure at the start of GPM. The minimal pressure reached
over the lifetime of the GPM concept in this example is shown in the middle. This allows an
estimate of the compaction-induced seismicity that is still expected from this GPM concept ex-
ample and the further compaction-induced seismicity that could be avoided. The maximum pres-
sure increase over the lifetime of the field is shown on the right. The seismicity induced by pore
pressure increase is uncertain. Compared to
Figure 4.6,

- 40 -
Figure 4.9 shows how this second pressure management policy limits the extent of repressurisa-
tion and the associated potential seismicity risk while incurring a larger compaction with associat-
ed compaction-induced seismicity.
Figure 4.9: Expected pressure in bar at the start of GPM (left), expected minimum pressure
(middle) and maximum pressure increase (right) over the lifetime of GPM exam-
ple concept 1. (Note that the shown repressurisation in the Eemskanaal area, at
the western flank of the modelled area is due to a strong aquifer, which is per-
ceived to be a model artefact.)
4.3.3. Ultimate Recovery for Different GPM Concepts
Ultimate recovery depends on two parameters, the final equilibrium pressure and the sweep effi-
ciency. This relation is shown in Figure 4.10, which is similar to a typical gas field P/Z material
balance plot. The green markers represent continued production-only behaviour. Injected N2 will
displace part of the hydrocarbon gas. The displaced hydrocarbon gas can be produced without
the corresponding drop in average pressure. Incremental production can continue until the N2
concentration reaches the economic limit. The amount recovered by N2 displacement is called
the sweep efficiency. All subsurface concepts show a sweep efficiency in the range of 50% to
70%. Any implementation of a GPM concept to avoid depletion below ~40 bar will, despite the
N2 sweep, result in a production loss compared to continued depletion to ~10 bar, ranging up to
~100 bcm.

- 41 -
Figure 4.10: Cumulative production as a function of average field pressure for depletion
(green) and for GPM (black).
Figure 4.11 and Figure 4.12 show the migration of the injected N2 through the reservoir at differ-
ent points in time. The first is an example of a good sweep which displaces 70% of the Groning-
en gas otherwise left behind. The second is an example of a sweep that would require further
optimization in well locations as the N2 sweep only displaces 50% of the Groningen gas.
Figure 4.11: Snapshots in time showing the anticipated position of the nitrogen front in the
reservoir in 2027, 2032, 2040, 2050, and 2100 for GPM example concept 1. The
Groningen gas (concentration) is shown in red. This is an example of a good
sweep.
Figure 4.12: Snapshots in time showing the anticipated position of the nitrogen front in the
reservoir in 2027, 2032, 2040, 2050, and 2100 for GPM example concept 2. The
Groningen gas (concentration) is shown in red. This is an example of a sweep that
requires further optimisation of the well locations.

- 42 -
4.3.4. Rate for Different GPM Subsurface Concepts
In a pattern injection like dispersed and semi-dispersed, the rate depends on the local pressure
difference between injector-producer pairs. The regional pressure is not expected to have a sig-
nificant impact on the rate.
In the N-S sweep, the bottleneck for the rate is the flux of gas from north to south. This flux
depends on the pressure gradient from north to south. Surplus offtake beyond the prevailing flux
will result in a further pressure drop in the south. Similarly, surplus injection will result in a pres-
sure increase in the north. Therefore, constraints on the pressure increase in the north or de-
crease in the south will directly limit the maximum production and injection rates.
These mechanisms are represented schematically in Figure 4.13. The relation between N-S pres-
sure difference and total field injection rate is shown in Figure 4.14.
Figure 4.13: Stationary pressure profile between an injector-producer pair under voidage re-
placement for a pattern injection scheme (left) like dispersed or semi-dispersed
and a line drive (right) like N-S sweep.
Figure 4.14: Total field production rate in a N-S sweep injection pattern predominantly de-
pends on the regional pressure difference between the north and south.
4.3.5. Breakthrough Time and Cycling
Breakthrough time depends on the injector-producer distance and the rate. Pattern injection
schemes like dispersed and semi-dispersed have relatively short injector-producer distances of a
few kilometres. This results in early breakthrough of the gas in all the clusters after a few years of
production and large volumes of back-produced N2. In the N-S sweep the N2 front passes clus-
ters when it moves south. These clusters can be shut in early without impact on the sweep effi-
ciency. As a consequence, the volume of back-produced N2 is much smaller than for a pattern
injection.

- 43 -
Figure 4.15: Indicative nitrogen (N2) breakthrough behaviour for two injection patterns, the
dispersed pattern (left) and the N-S sweep pattern (right). The horizontal bars
represent for each cluster the timing when N2 breaks through and the time, when
the cluster is shut-in as a result of high N2 concentration. Given the larger injec-
tor-producer distance in the N-S sweep pattern, the N2 breakthroughs are later
than in the dispersed pattern. (Note that the clusters are ordered in each chart by
their breakthrough timing).

- 44 -
5. Appraisal and Testing of Injection
5.1. Introduction
As laid-out in section 2.7, an injection field test might be required to demonstrate the impact (or
lack thereof) of (local) injection-induced pore pressure increase on seismicity. Analogues, theoret-
ical rock mechanics, and laboratory tests alone will not provide a conclusive answer to the ques-
tion if injection will lead to less, more or similar seismicity compared to the current few-bar-per-
year depletion of the Groningen field. One or more field tests might be the only option to ad-
dress this question; however, test outcomes may be inconclusive or contradictory to decide on
GPM.
Rather than injecting N2 gas or any other new injectant in such a field test, there is an option to
use existing production wells and compressors to re-inject Groningen gas. This would be a rela-
tively fast and efficient way to locally increase the reservoir pressure. The existing geophone net-
work, possibly augmented with additional geophones, would be used to observe any change in
seismicity.
The key success factors for a test are as follows:
1. Appropriate risk mitigation can be put in place for potential exposure to injection-induced
seismic hazard. This might require temporarily relocating people from the test area.
2. The test has clear relevance to GPM, which means the conditions at the tested area(s) must
be representative or similar to all locations in GPM with a pore pressure increase.
3. The acquired test data needs to be interpretable.
4. Preparing and conducting the test(s) needs to be short enough to provide timely information
for a decision on GPM.
5. During a test, the field can continue production to maintain security of supply.
Like GPM, a test would only be implemented if continued production under depletion – with
structural upgrading – was deemed unacceptable and only GPM remained. Given the risks asso-
ciated with a test, a test would only be implemented when continued depletion was deemed un-
acceptable.
5.2. Test Objectives and Measurement Options
The key objective of an injection test is to prove whether injection-induced pore pressure in-
crease will increase, decrease, or not influence seismicity. Depending on the pressure manage-
ment policy (section 4.1), different tests at different locations are required. The three incremental
test objectives are visualised in Table 5.1.

- 45 -
Table 5.1: Injection test objectives
A To prove for every injector where injection is
planned that a near-wellbore pressure increase, rep-
resentative to GPM injection, has acceptable seis-
micity risks. This is shown here for a case with in-
jection across the field, and in a small area.
B To prove for an entire region of the field that a pore
pressure increase from regional pressure equilibra-
tion is within acceptable seismic safety limits. This is
shown here for the southern half of the field.
C To prove that a pore pressure increase anywhere in
the field would have a benign effect on seismicity.
Figure 5.2 shows which test objectives would be required for each of the 20 regional pressure
management policies. The first symbol denotes the test objective required prior to implementa-
tion of the corresponding GPM policy. The second symbol denotes the test objective that can be
postponed to a later date. Such a phased testing could be considered if the early implementation
decisions for GPM would not change significantly if we would have known the outcome of the
later tests upfront.
As an example, Figure 5.1 shows the regional pressure management policy B1 (Figure 5.2) with
pressure equilibrating to the maximum field pressure at the end of GPM. The imminent test ob-
jective is to confirm whether a local pressure increase around the injectors is within acceptable
safety limits (objective A). The test should be representative to the GPM operating conditions
and might be required at every injection location. For pressure management policy B1, only later
in field life, further testing must demonstrate that pore pressure increase has acceptable safety
risks or is even beneficial everywhere (objective C). More importantly, it must be understood that
if the second test cannot demonstrate that field-wide pressure increase is beneficial or at least
safe, moving away from case B1 to e.g. B2 or B3 is still a safe alternative.
Figure 5.1: Example of a regional pressure policy with imminent (pre-GPM) and later test
requirements.

- 46 -
Figure 5.2: Overview of the range of potential pressure management policies, with indica-
tions of required testing for different phases. The three lines in each pressure plot
indicate regional pressure over time in the north (solid green), south (dashed
green), and on average (purple).
There are four types of data that should be measured (Table 5.2). As a minimum requirement, the
seismicity before and after the test and the pore pressure change needs to be recorded in order to
control and calibrate the test. Additionally, the expected associated increase in total horizontal
stress should be measured, such that the horizontal stress path coefficient during injection could
be estimated (see section 2.4), as well as the vertical extension of the reservoir.
Table 5.2: Range of measurements as part of an injection test.
Data Method
1. Direct measurements of seismicity Existing and possibly additional shallow and deep geo-
phones/fibre optics and accelerometers at surface; note
that new deep geophones/fibre optics could be installed in
existing production wells (requiring workovers and using
gelled kill fluids, causing well impairment when reinstating
the well for production) or preferably in dedicated, newly
drilled, non-perforated (i.e. observation) wells
2. Pore pressure change Tubing-head pressure measurements in the injector and
adjacent producers/observation wells and possibly com-
plemented through downhole memory or cable-less real-
time gauges in adjacent producers/observation wells
A B C D E
Abandonment pressure
Immediate Convergence
All areas pore pressure maintained
North pore pressure
maintained
South pore pressure
maintained
Porepressure un-constrained
1) High(Max. pressurein field at start of GPM)
Fill-up south
2) Medium(Avg. pressurein field at start of GPM)
Shut in
3) Low(Min. pressurein field at start of GPM)
1st stage depletion
4) Depletionto 10 bar(3rd stage compression)
3rd stage depletion

- 47 -
Data Method
3. Increase in total horizontal stress
per unit increase in pore pressure
(stress path coefficient γhi)
Extended leak-off tests in a dedicated, new well, alterna-
tively a recompletion of existing wells or minifrac tests in
existing wells
4. Vertical extension of the reservoir Distributed strain sensing (DSS) and geodetic techniques
(levelling, GPS, InSAR)
5.3. Interpretability, Exclusivity, and Representativeness
For the field test, a Design of Experiment approach is adopted to test pre-specified hypotheses.
For example, a hypotheses that corresponds to the test objective A (Table 5.2) is “the local pore
pressure increase at the injection well of X bar will result in a significant increase in seismic activi-
ty rate”. In the Design of Experiment approach, both statistical and geological knowledge are
needed.
For any experiment to be successful, the following needs to be considered:
1. Interpretability: It is imperative that there is baseline seismic activity to detect a trend change
in the variable(s) of interest over and above the noise random variability that is inherent to
the system. The higher the ability to detect such a trend change, the higher the statistical
power of the test.
2. Exclusivity: We want to be able to assign the outcome of the experiment, such as a trend
change in variable of interest, to the experimental manipulation. Thus, it will be necessary to
be able to distinguish with confidence the effect of the experimental manipulation from pos-
sible other factors. We refer to these other factors that may, apart from the experimental ma-
nipulation, also explain the observed outcomes (or part of the experimental outcomes) as
“confounding factors”.
3. Representativeness: We want to know to what extent we will be able to generalise the out-
comes of the experiment to other locations or parts of the Groningen field. Extrapolation on
pure statistical grounds will require a large number of tests. Therefore, extrapolation will re-
quire a geological understanding of the mechanisms of seismicity induced by a pore pressure
increase.
5.4. Wells and Facilities Concepts
The fastest and simplest way of conducting an injection test is to use Groningen gas from the
Groningen ring line and route it through the existing production compressor to existing wells for
injection. The modifications would be limited to manifolds, additional piping, and minor control
system configuration changes. If wells are in good condition, no additional downhole modifica-
tions would be required. The required facilities modifications are shown in Figure 5.3.

- 48 -
Figure 5.3: Simplified flow diagram of required cluster modifications.
Dry Groningen gas can be taken from the Groningen ring (tie-in 1, ref. Figure 5.3) via a new line
to the compressor knock out drums (tie-in 2), which need to be separated from the well inlet
manifold (between tie-ins 2 and 3). The compressed hot gas can be directed via the existing lines
to the compressor discharge air coolers at each low-temperature separator train; these trains need
to be isolated from the compressor discharge system and the Groningen ring. The cooled gas can
be sent to the wells’ inlet manifold by a new line (from tie-ins 4-8 to tie-in 3). No hardware modi-
fications to equipment outside the cluster are expected to be required.
The existing depletion compressor is at the core of the process. As the process conditions of the
suction side of the compressor hardly change (current suction pressure is around 58 bar and ring
pressure is around 60 bar), no major changes to the compressor are envisaged. Without changes,
the installed compressor driver power limits the flow rate that can be injected into the reservoir.
The maximum injection capacity is 6.6 bcm/a, limited by 23 MWe at 90% rotor driver power.
Using existing compressor capacity controls, the minimum injection flow is about 2 bcm/a. For
lower injection rates, an additional recycle line and flow control from tie-in 3 to tie-in 2 may be
required. Minor modifications to the compressor control software and safeguarding may be re-
quired to run the cluster in isolation of the Groningen field in this mode of operation.
5.5. Potential Injection Locations, Rates, and Durations
A 20-bar increase over an area of about 10 km2 can be achieved by injecting for multiple months
at a rate of 5 bcm/a in the southern clusters. A 30-bar increase will be challenging, as it requires
second-stage compressions and longer injection times. Figure 5.4 shows the maximum pressure
increase after injecting 5 or 8 bcm/a, respectively, in a single cluster for an entire year.
New line ~220 m; 20”
New line ~230 m; 20”
3-5*
From wells
Identical Feed inlet train
3-5 identical
LTS trains
Ring
JT-valve
Liquid Treating & StorageGlycol Regeneration
Off-gas
1
4-82
3
= tie-in point
Green = newRed = existing

- 49 -
Figure 5.4: Field maps showing an overlay of the simulated pressure increases that can be
achieved by injecting 5 bcm/a (left) or 8 bcm/a (right) in each production cluster
individually, while all other clusters continue producing. The injection is assumed
to last for the entire year 2018. (Note that the maximum technically achievable in-
jection rate for each cluster is only approximately 7 bcm/a.)
5.6. Risks and Mitigation
In the design of an injection test, consideration needs to be given to health, safety and environ-
mental (HSE) risks. The most evident risk related to the injection test is the risk of injection-
induced seismic activity potentially leading to nuisance, building damage, and/or injury. This risk
can currently not be quantified, given that – as described in chapter 2 – no suitable field data,
analogues, or predictive models exist to describe injection-induced seismicity in a strongly deplet-
ed field like Groningen.
Consideration should be given to what level of testing is required for which GPM concepts. The
risks of a test need to be weighed against the potential benefits of GPM.
The three test objectives described in section 5.2 have different risk levels of induced seismicity.
The higher the pressure increase and the larger the area with increased pressure, the higher the
risk would be. A potential risk mitigation measure would be a staged testing approach, which
starts with the lowest-risk test and only continues with the next-higher-risk tests if the previous
test shows no adverse effects.
The simplified “bow tie” in [Figure 5.5] visualises the hazard/threat of injection (left-hand side)
that could lead to a top event – in this case increased seismicity – and the potential consequences
(right-hand side) such as nuisance, building damage, and injury. The figure also shows, on the
left-hand side, possible barriers (1, 2, 3) to reducing the likelihood of the threat causing the top
event and, on the right-hand side, the possible barriers to reducing the severity of the potential
consequences.

- 50 -
Figure 5.5: Bow tie for injection-induced seismicity during injection test.
5.7. Discussion
Further work on the potential field test needs to focus on two key topics, both related to geome-
chanics: the representativeness of a test in one location to other locations in the field and the
additional hazard introduced by a test. The following Table 5.3 provides an overview of the range
of possible views. A resolution would require evidence for or against each view.
Table 5.3: Geomechanical uncertainties reflected in views against and in favour of an injec-
tion field test.
Topic Against a test In favour of a test
Representativeness -
areal
Geomechanical properties and stress
states vary unpredictably over field and
extrapolation of test results from any
tested location to any other location is
not possible. GPM cannot be de-risked
other than by implementing GPM step-
by-step and testing each injection loca-
tion.
Geomechanical properties and stress
states vary unpredictably over field;
however, trends (injection generally
causes additional or reduced seismicity)
should be consistent over the field and
one test thus may provide valuable
information.
Representativeness -
mechanism
Effect of pore pressure increase is only
one of many more possible effects;
temperature and other unknown effects
could play a role. The field test can only
capture “part of the reality”, so its re-
sults are unreliable in their own right,
and give no insight into the mechanism.
Injection test would mimic the actual
GPM parameters (pressures, tempera-
tures). Acoustic and rock mechanics
data would increase understanding of
the mechanism in reservoir and at faults
to the degree that lateral extrapolation is
warranted.
Safety: Maximum
magnitude of injec-
tion-induced seis-
micity
Faults are critically stressed, they pre-
sent a highly unstable system that is
easily perturbed; therefore, large-
magnitude earthquakes from a test can-
not be excluded.
Observations in UGS indicate that
seismicity under injection is below 1.5
on Richter scale, and only occurs after
at least a 60 bar increase in pore pres-
sure. Injection may well increase the
total horizontal stress on the faults,
making them more (rather than less)
stable.

- 51 -
Regarding the risk of injection-induced seismicity, a scientific consensus on its quantification
would have to be achieved before implementing an injection test. If the risk of a test triggering
unwanted seismicity could be shown to be tolerable, GPM concepts could be envisaged that
would include individual, sequential testing at all future injection locations while the project is
being implemented. This would circumvent the uncertainty around representativeness. In this
step-wise approach, the injection concept would only be fully implemented if all locations have
positive test results. Otherwise, if too many locations show negative results, the concept would
be left unfinished and only partially operated or completely abandoned. This option of a step-
wise implementation is yet to be worked out in more detail.

- 52 -
6. Facilities and Wells Concepts for Injection
6.1. Injectant Choices
Various injection fluids were considered. The most import criteria upon which to judge feasibility
are:
Abundance and availability given the required injection rates of potentially 10-30 bcm/a (30-
80 mln m3/d), depending on injection concept
Health, safety and environmental considerations related to the injectant composition and the
facilities to produce the injectant
Compatibility with the rock, water, and hydrocarbon gas in the reservoir (geochemistry)
Compatibility with existing installations (wells, production facilities, and pipes), as the in-
jectant has to be expected to travel from the injectors through the reservoir to the producer
wells
Compatibility with sales gas specifications
Energy required and cost to manufacture and compress the injectant and – if required – to
remove it from the produced gas
For all injectants (except for water), a delivery pressure of 140 barg at the facilities’ battery limit
has been assumed. Based on their abundant presence and low chemical activity (safety, environ-
mental, geochemistry), only the following injectants have been considered:
1. water
2. air
3. N2 - from air or flue gas
4. pure CO2 - from flue gas
5. a combination of the above.
The option of pure N2 is deemed technically feasible, while water, air, and pure CO2 have been
shown to be unfeasible. The feasibility of generating, injecting, and back-producing combinations
of N2 and CO2 (either obtained separately from different processes or directly from flue gas) are
deemed technically feasible; however, geochemical and geomechanical risks remain, including the
capacity of the reservoir to scavenge O2 and other contaminants and to accommodate CO2, in-
cluding the possibility of chemically induced seismicity [3].
6.1.1. Water
Water, although available in abundance, was ultimately deemed technically unfeasible. Firstly, a voidage replacement scheme with water would require a water injection rate of 1-2 mln m3/d, which if injected under reservoir fracture conditions would need 100-250 wells. From a geome-chanical point of view, fracturing is not desirable. Injection at pressures below fracture conditions would need 650-1,300 injection wells, which is about two to four times the number of wells drilled in the Groningen field to date (350 wells) and therefore impractical in view of the surface requirements for drilling locations, rigs required, and water pipelines. Sourcing this amount of fresh water is also not possible and, to prevent souring of the reservoir, utilisation of seawater would require world-scale water treatment facilities. Water that is introduced to the reservoir would be back-produced, which would likely require well interventions to install velocity strings or gas lift to bring the well fluid to surface. Furthermore, as the produced water will be saline, a significant extension of water handling and disposal capacity would be needed on the Groningen clusters. Secondly, water injection at large scale requires water to be injected close to faults, which very likely increases the risk of earthquakes. Thirdly, given that a water front moving through the res-

- 53 -
ervoir would trap gas at saturations of about 26% (trapped gas saturation), introducing a water injection scheme would be at the cost of at least 26% of the remaining gas, assuming a perfect water flooding of the reservoir (i.e. without bypassing of free gas).
6.1.2. Air
Injection of air was also ultimately deemed technically unfeasible, as it introduces high levels of
O2 into the entire system – the reservoir, the production wells, the surface pipelines, and the fa-
cilities. Neither the loss of containment risk due to corrosion of facilities nor the risk of explosive
mixtures being present and igniting either on the surface, in wells, or in the reservoir can be ade-
quately managed.
Although the reservoir may have some scavenging potential, this should only be considered for
low O2 content of the injectant (possibly up to several percentages).
6.1.3. Nitrogen
N2 is available in large quantities and can be sourced from air or from flue gases. N2 is a miscible
gas, which is inert and non-corrosive. Therefore, no special metallurgy measures are required to
avoid corrosion of pipelines, wells, and facilities. In fact, N2 is already present in significant
quantities (14%) in the Groningen gas.
As N2 is less compressible than Groningen gas and other injection gases, it provides a higher
volume at reservoir conditions per standard volume of N2 injected than any of the other injection
gases. Therefore, it has the lowest volume requirement for pressure maintenance. After break-
through of the N2 in the production wells, it was assumed that the excess N2 above the in-situ
concentration of 14% will need to be removed again to bring the produced gas back to sales
specification. N2 injection for EOR and EGR is being successfully applied commercially.
6.1.4. Pure Carbon Dioxide
Injection of pure CO2 has been considered as an opportunity to combine pressure maintenance
to reduce seismicity and at the same time reduce the Dutch greenhouse gas emissions by ulti-
mately sequestering large amounts of CO2 in the field. However, the required large amount of
CO2 would have to be sourced from various power stations, and all power stations in Eemshaven
(Table 6.1) would only provide sufficient CO2 for the smallest injection scheme (10 bcm/a natu-
ral gas). As well as insufficient availability of CO2, a pure CO2 injection scheme is not feasible due
to the impact of the returned CO2 on all of the existing wells and facilities, which are estimated to
be able to handle only 16% and 5% CO2 in the produced gas stream, respectively.
Table 6.1: List of power stations in Eemshaven.
Operator Name Fuel Start-up
RWE/Essent Eemshaven Coal 2014
GDF Suez/Electrabel Eemscentrale Gas 1996/97
NUON Magnum Gas 2013
6.1.5. Combinations (Nitrogen and Carbon Dioxide)
A combination of N2 and CO2 (with concentrations of up to 16% in the produced gas stream) is a potentially technically feasible option; however, further work would be required in the areas of long-term containment, operational models, and regulations regarding CO2 co-injection without repressurising the Groningen field, as would normally be the case in more projects for pure CO2 storage. There are two ways to create an injectable mix: by direct capture, treatment, and injection

- 54 -
of flue gas (removing impurities and excess of O2) or by production of N2 by an ASU and spiking in CO2 captured from flue gas. The power stations in Eemshaven (Table 6.1) could provide the flue gas and/or CO2. Given the age of the facilities, only the RWE/Essent coal-fired power plant, the Vattenfall/NUON gas-fired power plant, and a hypothetical new purpose-built gas-fired power plant have been considered as flue gas sources. Typical flue gas compositions are shown in Table 6.2.
Table 6.2: Typical flue gas compositions from a gas-fired and a coal-fired power station.
Flue Gas Components Gas-fired Power Station (NUON)
Coal-fired Power Station (RWE)
N2 74.82 vol% 76.23 vol%
CO2 4.11 vol% 16.07 vol%
H2O 8.15 vol% 4.06 vol%
O2 12 vol% 2 vol%
Ar 0.92 vol% 0.91 vol%
NOx 10 ppmv 60-200 mg/Nm3
SOx None 40-200 mg/Nm3
Hg unknown Unknown
Particulates None ~ 3 mg/ Nm3
Direct use of flue gas eliminates the separation of N2 from air or CO2 from flue gas; however,
this concept lacks the flexibility to control the CO2 content of the injection stream, as opposed to
the option of co-injecting CO2 captured from flue gas with pure N2 obtained in an ASU. The
flexibility would allow increasing the CO2 content with time and thereby transitioning to a CO2
storage scheme when production requirements diminish.
6.2. Process Overview
A conceptual process overview for pressure maintenance is shown in Figure 6.1. On the injection
side, as discussed in the previous sections, the feasible or potentially feasible injectants are pure
N2 or a mixture of N2 and CO2, with the CO2 concentration at a level that would still allow using
existing wells and facilities. The injectant would be sourced from the air and/or flue gas, air cryo-
genically separated and optionally CO2 captured from flue gas to be co-injected with pure N2
from cryogenic air separation.
In all cases, the injectant would have to be compressed and transported through a new pipeline
system to the injection wells. A decentralised injectant generation appears suboptimal (increased
plot space and visual impact, operability, more equipment). Instead, a centralised facility at
Eemshaven in proximity to the existing power stations or in industrial areas in Delfzijl appears
more attractive.
To reduce/mitigate injection-induced cooling effects by injecting at ambient temperature, it is
possible to omit (part of) the post-compression cooling of the injectant. To transfer hot injectant,
pipelines need to be insulated and underground expansion loops created which will make the
construction of pipeline system much more difficult. In such a case, operational procedures need
to be applied so that only hot gas is injected at injection start-up.

- 55 -
Figure 6.1: Conceptual diagram of a pressure maintenance concept.
Depending on the subsurface concepts (see chapter 4), injection would take place over different
numbers and locations of injection wells. As in any injection scheme, the possibility of the in-
jectant reaching the production wells and being produced with the hydrocarbon gas, needs to be
taken into account.
On the production side, the aim is to continue using the existing production wells (possibly add-
ing more production wells, depending on the subsurface concept) and to continue using the ex-
isting facilities, which serve to knock out liquids and dehydrate and compress the gas for delivery.
Some minor modifications to these facilities would be required. Facilities concepts have been
developed under the assumption that the field needs to continue delivering Groningen gas quality
and therefore, any injection component above the in-situ levels needs to be removed after the
current gas processing. Alternatively, if the produced gas only contains elevated levels of N2 and
possibly also elevated levels of CO2 from CO2 co-injection (and not other possible contaminants
like CO or H2), then the possibility exists to blend the produced gas with high-calorific gas in the
Dutch gas network to obtain the desired Groningen quality. This option is deemed technically
feasible and would require minor modifications to the existing infrastructure, but the operational
impact would have to be assessed further. However, if the excess N2 needs to be removed, the
additional steps consist of further drying and CO2 removal before a cryogenic separation of the
N2 in NRUs. Finally, the sales gas is compressed again to export pressure and the recovered in-
jectant(s) are compressed for recycling. Various options exist for siting the NRU, either centrally
(for example with the ASU or the flue gas capture facilities) or de-centrally at selected existing
production clusters or custody transfer points.
6.3. Injectant Generation
6.3.1. Nitrogen as Base Injectant
If the reservoir scavenging capacity for O2 was deemed too uncertain to inject traces of O2 and
risk O2 breakthrough in producing wells and facilities, pure N2 needs to be generated with O2
concentration only at ppm levels. In that case, cryogenic air separation is the only viable process.
Given the required rates, the air separation would have to take place at the Groningen field and
shipping of liquid N2 from another location would not be feasible). Use of air separation mem-
branes or pressure swing absorption (PSA) have been ruled out. The generation of pure N2 from
flue gas also has been ruled out, as it is far more complex and does not bring significant econom-
ic/energetic benefits to offset the complexity.
If a higher O2 concentration than ppm levels was acceptable in the injection stream (assuming a
sufficient scavenging capacity of the reservoir to exclude O2 breakthrough in the producing wells
GroningenReservoir
Alternative to NRU:
Blending withhigh-calorific gas
ASU(Air Separation
Unit)+ Compression
Pipelines Production Wells(existing)
Gas Processingand Compression
(existing)
N2 (+ CO2 + O2)
Optional with ASU: CO2
Capture and Co-injection with N2
Alternative to ASU: Flue Gas Capture
+ Treatment + Compr.
pre-Treatment+ NRU
+ Compression
N2 (+ CO2)
HC + N2 (+ CO2)
HC
Injection Wells

- 56 -
and facilities), cryogenic air separation is still deemed the best option for N2generation. Figure 6.2
shows a typical process scheme for an ASU process to deliver high-purity N2.
Figure 6.2: Schematic of a typical ASU.
6.3.2. Flue Gas as Alternative Source of Injectant
If some level of CO2 in the injectant is acceptable (in concentrations compatible with the existing
production wells and facilities, possibly with some modifications to internals of existing compres-
sors, and some other equipment) and actually desirable (to lower the project’s carbon footprint
by CO2 sequestration), the option of using (treated or untreated) flue gas exists. There are several
power stations in the vicinity of the field, in Eemshaven (Table 6.2).
As indicated in Figure 6.3, a broad set of potential process technologies to generate clean mix-
tures of N2 and CO2 with (very) low O2 content have been reviewed.
SEPARATORCHILLER
PRODUCT
GASEOUS
NITROGEN TO COMPRESSION
MAIN AIRCOMPRESSOR
MAIN HEAT
EXCHANGER
REBOILER
CONDENSER
HIGH
PRESSURE
COLUMN
ADSORBERS
COOLER
VENT
WATER
OXYGEN RICHPRODUCT / VENT
VENTLOW PURITYNITROGEN
COLD BOX
EXPANDER
Air
Gaseous N2
Liquid N2
Waste gas
O2
enriched liquid
Sump purge
CLIENT SUPPLY

- 57 -
Figure 6.3: Examples for injectant generation processes.
Composition (volumetric) Feasible maturation needed Composition (volumetric)
ASU Concept O2 Vent
N2 78% 1 bara Compress 1-10 bara Dry Expand/Cool Separate Compress 140 bara N2 99.999% WellsO2 22% N2 O2 10 ppmv
CO2 0.04% Adsorbent drying CO2 none
N2 76% ASU and CanSolv processO2* 2% N2 upto 99.999%
CO2 16% 1 bara Blower/ 1 bara Absorber Fluegas to stack Compress 140 bara O2 10 ppmv WellsH2O 4% transfer CO2 upto 99.9% SS or CRA
SOx 40-200 mg/Nm3
NOx 30-100 ppmv Steam Regenerator CO2 Compress 1-60 bar DryParticulates 5-20 mg/Nm3
CO 50-100 mg/Nm3 Glycol drying
N2 76% Direct Flue Gas Use: Not feasible N2 80%
O2* 2% O2 2%
CO2 16% 1 bara Blower/ 1 bara 1-60 bara Filter** Particulates Compress 140 bara CO2 17% WellsH2O 4% transfer + Dry removed H2O removed CRA
SOx 40-200 mg/Nm3 Sub micron filter SOx 10* mg/Nm3
NOx 30-100 ppmv Adsorbent drying NOx 10* ppmv
Particulates 5-20 mg/Nm3 Particulates 1* mg/Nm3
CO 50-100 mg/Nm3 * Typical coal power plant O2% is 4-6% and high NOX/SOX, needs modifications to powerplant firing system and flue gas treatment CO 50-100 mg/Nm3
** sour compression and submicron filter for aerosol are not mature and not available at the scale required by GPM
N2 75% Boiler up to <1% O2, for ppmv level O2 additional catalytic combustion step is required N2 87%
O2 12% O2 10ppmv* - 1%
CO2 4% CO2 up to 12%
H2O 8% 1 bara Blower/ 1 bara Boiler O2 1-60 bar** optional O2 Dry Compress 140 bara H2O removed Wells
SOx none transfer 1% Catalytic 10 ppm* SOx none CRANOx 10 ppmv Combustion* CO NOx 10 ppmv
Particulates none Particulates none
CO* 50-100 mg/Nm3
* ppm level O2 Catalytic combustion is not mature technology and hard to guarantee and likely introduce CO
** compression is limited by oxygen partial pressure 0.7 bar and needs confirmation from vendor
N2 75% Shell Gasification Process N2 88%
O2 12% O2 <1 ppmv*
CO2 4% Natural Gas CO2 11%
H2O 8% H2O removed
SOx none 1 bara Blower/ 1 bara 69 bara SGP* Methanation* CO Dry Compress 140 bara SOx none Wells
NOx 10 ppm transfer reduced NOx 10 ppmv SS or CRA
Particulates none steam Glycol drying Particulates 1 mg/Nm3*
Flue Gas CO 50 ppm*
H2 <0.05%*
Natural Gas Steam for power or direct drive compressor
* Maturation required
** compression is limited by oxygen partial pressure 0.7 bar and needs confirmation from vendor
N2 76% Cryogenic Separation: Not feasible external refrigerant O2 Vent N2 down to 80 %
O2*** 2% O2 10 ppmv
CO2 16% 1 bara Blower/ 1 bara 1- 10 bara Filter** Particulates Expand/Cool Compress 140 bara CO2 up to 20% Wells
H2O 4% transfer Dry removed CO2 solidfication* N2 H2O removed SS or CRA
SOx 40-200 mg/Nm3 SOx 10** mg/Nm3
NOx 30-100 ppmv NOx 10*** ppmv
Particulates 5-20 mg/Nm3 CO2 with 100 ppmv O2 * Particulates removed
CO 50-100 mg/Nm3 * Maturation required
** sour compression and submicron filter for aerosol are not mature and not available at the scale required by GPM
*** Typical coal power plant O2% is 4-6% and high NOX/SOX, needs modifications to powerplant firing system and flue gas treatment
Air
Flue
Gas
- R
WE
Flue
Gas
- N
uon
Natural Gas
not feasible
RW
E+
Can
Sol
v
Adsorbent or Glycol
depends on O2%
O2<1ppmv
CO, H2 rich
Sour
Compress**
Compress**
Flue
Gas
- R
WE Sour
Compress**
N2/O2
Separate*
Flue
Gas
- N
uon
Compress**
Boiler
Steam for power or direct drive compressor
N2 and CO2 can be mixed to get any
composition
Compress and commingle CO2 with N2

- 58 -

- 59 -
6.3.2.1. CO2 Capture and Mixing with N2 from ASUs
Pure CO2 from a capture process could be mixed with N2 from ASUs and injected in the Gro-
ningen field. This would require one or two fewer ASUs and reduce the greenhouse gas foot-
print, but it would add a large CO2 capture plant with its energy consumption to the GPM scope.
In a post-combustion process, CO2 absorption from flue gas is done by using amines, for exam-
ple using Shell’s Cansolv technology, which is being deployed at commercial scale in the carbon
capture and sequestration (CCS) project at Boundary Dam, Canada, and was planned for the Pe-
terhead/Goldeneye CCS project in the UK. As the CO2 absorption takes place at low pressure,
the plot space required for a Cansolv unit is large. An example of a Cansolv unit is shown in Fig-
ure 6.4. For GPM, two to four of these units would be required.
Figure 6.4: Cansolv CO2 capture plant (outlined) at the Boundary dam power station, Cana-
da. For GPM, additional absorber towers would be required.
To reduce CO2 capture cost, a synergy could be established between an oxy-firing power plant
(modified RWE or Magnum Phase 2) and the ASUs, which can provide the required O2 for pre-
combustion CO2 capture. However, this would require at least one or more of the ASUs to oper-
ate in later field life at full capacity to provide O2, even when N2 is no longer required for GPM.
Thus, the synergy would be only temporary.
6.3.2.2. Direct Injection of Flue Gas
Flue gas taken from the stack of a gas-fired power plant still contains an O2 content of about 12-
15%. Similar to air injection, which was discarded before, direct injection of flue gas is not feasi-
ble as the risk of O2 breakthrough is not acceptable. In contrast, the low CO2 content of the flue
gas in the order of 4% would be tolerable in existing wells and facilities.
Regarding its O2 content of only a few percent, flue gas from a coal-fired power plant could be
used directly for injection. Also the higher CO2 content compared to flue gas from a gas-fired
power station would be acceptable at levels of about 16%, provided upgrades of the internals of
the existing production compressors and other equipment can be made. However, the remaining
submicron fly-ash would cause injection well impairment. Furthermore, the SOx in the flue gas
from combustion of coal is very hygroscopic and forms microscopic aerosols with high dew
point. Investigations showed that there are no mature and commercial-scale technologies that can

- 60 -
guarantee against severe corrosion in wells and transfer lines at 140 barg unless exotic material
(e.g. tantalum or tantaline) is chosen. Additionally, the compatibility of other impurities, e.g. NOx
and heavy metals, with the reservoir would have to be assessed as well.
In conclusion, flue gas, whether from gas- or coal-fired power stations, cannot be used directly
for injection.
6.3.2.3. Flue Gas from Gas-fired Power Plant - Additional Combustion to Remove O2
For the flue gas from a gas-fired power station, the higher level of O2 would have to be reduced,
which could be achieved by further combustion in a new boiler. This appears the least complex
option with flue gas use. An example of an analogue boiler as required for bringing the O2 in the
NUON flue gas to less than 1-2% is shown in Figure 6.5. The option of building one or more
new gas-fired power plants with low O2 in the flue gas would enable district heating if these pow-
er plants could be placed close enough to the heat users, but it should be noted that the local heat
demand is low and does not significantly make GPM more efficient.
Catalytic combustion to reduce O2 from 15% to 1-2% is considered less attractive because the
large heat generated in this process will lead to temperatures that are too high for the catalyst,
requiring multiple reactor beds with intermediate cooling; the heat removed would require boilers
again (for steam and power generation). Catalytic combustion, however, could be considered as
to further bring down the O2 concentration from 1-2% to ppmv level. However, this technology
is considered not feasible for coal flue gas due its sensitivity on impurities (SOx and heavy met-
als). Furthermore, 5-10 years maturation is estimated as necessary to demonstrate its reliability on
low O2 and CO concentration and operability.
Figure 6.5: Analogue of boiler as would be required to generate 20 bcm/a of flue gas with low
oxygen content from the Nuon power plant.
6.3.2.4. Flue Gas from Gas-fired Power Plant Followed by Gasification
In a gasification process, flue gas from a gas-fired power plant can be used for the substoichio-
metric combustion of natural gas. This will yield virtually O2 -free injectant gas. This technology
is relative complex and has CO as a by-product, which will need to be removed in an additional
methanation reaction step. For this specific application, the proprietary Shell Gasification Process
(SGP) could be applied but it would require extensive testing and maturation for the use of flue
Main stack
1
Gasturbine ;
“NUON”

- 61 -
gas as “combustion air”. To demonstrate reliability and operability of this technology, three to
five years are expected to be required.
6.3.2.5. Flue Gas from Coal-fired Power Plant by Cryogenic Separation
If a lower O2 content was required for flue gas from a coal-fired power plant, a cryogenic separa-
tion process could in theory be employed to separate N2, O2, and CO2 to achieve the required
injectant specification. This technology is considered not feasible for GPM because it would need
further maturation and would require extensive pre-treatment to remove contaminants and cor-
rosive agents (e.g. SO3).
The catalytic de-oxygenation described above for flue gas from a gas-fired power station is not
feasible for flue gas from a coal-fired power station due to the heavy metals leading to poisoning
of the catalyst.
6.3.3. Comparison of Injectant Generation Options
Table 6.3 shows the robustness of various processes for the removal of contaminants to levels acceptable by the Dutch gas specification and for the existing producer wells and facilities.
Table 6.3: Injectant generation options with their ability to achieve desired contaminant
concentrations and selection of concepts to keep as an option for GPM.
It can be concluded that the technically feasible options for the injectant gas are limited to:
N2 produced by ASUs
Flue gas from the Nuon power plant or from purposely built gas-fired power plants; this is
the only technically feasible option for the direct use of flue gas
N2 mixed with CO2 captured by a solvent process from a coal-fired power plant.
Gasification and catalytic combustion processes can provide O2-free injectant but require further
maturation and are sensitive to operational up-sets.
For all flue gas processes, it should be noted that:
The processes that rely on the scavenging of O2 in the reservoir come with a significant risk
of loss in recovery in case O2 is not sufficiently scavenged when the injectant breaks through
to the production wells (see section 6.7).
Robustness against:
O2 SOx CO Operability
Yes
No
RWE+ CanSolv+ASU's Yes
NUON+CanSolv+ASU's No
NUON+Boiler+CanSolv No
Yes
In-field fluegas generation Yes
O2 free No
NUON+Boiler+Catalytic Combustion O2 free No
Cryogenic separation No
Not infeasible but requires further maturation, parked
until need for alternative O2 free injectant
Infeasible; confirmed by Air Products
Feasible
very inefficient due to low CO2 in fluegas
It is more logical to apply CanSolv to RWE
NUON+Boiler Feasible
As NUON+Boiler and enables potential for District
Heating
NUON+GasificationFeasible but requires further maturation, parked until
need for alternative O2 free injectant
Continue with
concept?
ASU -only Feasible
RWE - direct compressionLikely unfeasible, submicronal dust and SOx aerosol
removal technologies are immature

- 62 -
These processes have not yet been proven at the scale required for Groningen and would
require further maturation of technologies to world-scale size.
Handling of catalysts/chemicals used and waste (fly-ash, removed contaminants, waste water,
chemicals used) need to be considered.
If practically O2 -free N2 is required, the least complex process is cryogenic air separation. If CO2
needs to be co-injected, a combination of cryogenic air separation with a separate solvent process
to capture CO2 from flue gas from a coal-fired power station is less complex than gasification of
flue gas from a gas-fired power station.
The advantage of having ASUs and a separate capture of CO2 is the flexibility to start CO2 cap-
ture after N2 injection has started, and to vary the CO2 concentration in the injectant for Gro-
ningen but also to dispose of some or all CO2 at different storage sites.
The hazards and risks related to the various identified injectant generation options are described
in section 7.2. In Table 6.4, the health, safety and environmental issues for the different injectant
generation options are compared.

- 63 -
Table 6.4: Comparison of health, safety and environmental issues for the different injectant generation options. Colour coding: Dark green - very favourable, Green - favourable, Yellow - less favourable, Orange - not fa-
vourable.
Lowest O2 (ppm level) 1-2% O2 > 4% O2
Issues ASU only ASU
+ CO2 Capture (RWE)
Nuon
+ Boiler + Catalytic Com-
bustion
Nuon
+ Gasification (SGP)
Own Boiler, District Heating Nuon
+ Boiler
RWE Direct
Local content for contract-
ing and procurement
as base case as base case as base case potentially more local con-
tent due to common equip-
ment boiler, district heating
and many small sites
potentially more local
content due to common
equipment boiler
as base case
Noise location Eemshaven, noise
not expected an issue
location Eemshaven,
noise not expected an
issue
location Eemshaven, noise
not expected an issue
location Eemshaven, noise
not expected an issue
may be difficult, especially
for compression
location Eemshaven,
noise not expected an
issue
location Eemshaven, noise
not expected an issue
Road transport during
maintenance/ operation
low transport during opera-
tion, only mole sieves, indus-
trial area, low nuisance from
transport, potential for ma-
rine transport
fresh amine transport
required; requires slightly
more transport than in
base case
slightly more than base
case, but still industrial
area, low nuisance from
transport, potential for
marine transport
as base case (ASU) transport of chemicals for
water treatment, fresh amine,
glycol; longer distance for
transport through the prov-
ince
as base case fine dust filtered out, po-
tential transport of filter
cartridges (unless treated
on site)
Internal safety (Major Ac-
cidents Hazards)
asphyxiation and high O2 %
(fire risk)
CO2 toxicity + base case runaway reaction, asphyxia-
tion, potential high CO
concentration during upsets
runaway reaction, asphyxia-
tion, potential high CO
concentration during upsets
in case of misoperation, po-
tential CO concentration,
asphyxiation , boiler explo-
sion
in case of misoperation,
potential CO concentra-
tion, asphyxiation, boiler
explosion
asphyxiation, health hazard
exposure to fine dust dur-
ing filter change-out
External safety (Major Ac-
cidents Hazards)
high pressure N2 pipeline,
refer De Wijk
as base case + CO2 pipe-
line, risk contour around
ASU and RWE can-
solv+compression
Expected effects are in-
fence, potential for reactor
explosion and resulting
widespread catalyst dust
Expected effects are in-
fence, potential for reactor
explosion and resulting
widespread catalyst dust
like base case like base case like base case + potential
for dust emissions during
filter cartridge change-out
Landscape impact: appear-
ance and height of facilities
height > 60m height > 60m expected height < 30 m expected height < 30 m expected height < 30 m expected height < 30 m lower than RWE
Water use - thermal and
chemical impact for cooling
water, use of fresh water
for process
base case thermal load cooling wa-
ter higher than base case
fresh water required for
BFW
thermal load cooling water
higher than base case,
fresh water required for
BFW
thermal load cooling water
higher than base case,
fresh water required for
BFW
thermal load cooling water
higher than base case,
fresh water required for
BFW
thermal load cooling wa-
ter higher than base case,
fresh water required for
BFW
thermal load cooling water
higher than base case
CO2 emissions, CCS readi-
ness, CCS implementation,
greenhouse gas emissions
intensity
Highest; no CO2 mitigation lower than base case negative CO2 emission lower than base case lower than base case negative CO2 emission

- 64 -
6.3.4. Greenhouse Gas Management
All GPM concepts have a very large power demand, with power requirements of about 700-1300
(MWe) depending on the total injection rate. This is mainly for compression of the injectant gas
and produced gas. Generating this power comes with large indirect greenhouse gas (mainly CO2)
emissions.
Without GPM, the ongoing depletion of the reservoir will also require significant electrical power
in the range of 300 MWe for second- and third-stage compression, which may be avoided in a
GPM case.
Figure 6.6 shows the additional, significant, power requirements of GPM compared to ongoing
depletion.
Figure 6.6: Additional power requirements for three typical GPM concepts above the ongoing
depletion case. From top to bottom: Dispersed (30 bcm/a injection), Central (10
bcm/a injection) and N-S sweep (20 bcm/a injection).
0
200
400
600
800
1000
2015 2025 2035 2045 2055 2065
Ele
ctri
cal P
ow
er
MW
e
0
200
400
600
800
1000
2015 2025 2035 2045 2055 2065
Ele
ctri
cal P
ow
er
Mw
e
0
200
400
600
800
1000
2015 2025 2035 2045 2055 2065
Ele
ctri
cal P
ow
er
Mw
e

- 65 -
To manage the greenhouse gas footprint associated with GPM electrical power consumption, the
following options have been considered:
Do nothing: Accept increase of CO2 emissions for continued production from Groningen
under GPM. Use pure N2 as injectant and minimise risk of corrosion in injection and produc-
tion facilities.
Co-inject CO2 with the N2 into the Groningen field: Depending on the injectant rate and
future injection/production strategy, the GPM emissions can be significantly reduced. In this
option, the CO2 concentration that can be injected is limited to the materials of the produc-
ing wells, which allow a maximum 16% CO2 at 70 barg. Breakthrough of CO2 requires up-
grading of the depletion compressors and upgrading of other equipment (e.g. diethylene gly-
col (DEG) drying) at the clusters.
Inject CO2 into other field(s): In this option, pure N2 would be injected into the Groningen
field, while the CO2 captured from a power plant would be injected in a nearby field, either
onshore or offshore. This option decouples the CO2 storage from the Groningen production
system and is also independent of the Groningen production profiles, allowing a CO2 capture
of the entire power plants’ CO2 emissions also when GPM needs less power. However, off-
shore CO2 storage is likely not feasible because of economics and onshore CO2 storage in the
Netherlands is currently not permitted. If onshore storage would be allowed, then long-term
containment has to be proven and injection-related seismicity has to be excluded as an issue.
6.3.5. Injection Generation Location
For the ASU location, two large industrial areas above the Groningen field are considered:
Eemshaven and Delfzijl. Both locations are considered feasible; however, visual impact, logistics,
noise, etc., will have to be considered before a site selection and also exact plot spaces identified.
In terms of power supply, Eemshaven is preferred.
For concepts using CO2 or flue gas, the Eemshaven power plants are the only nearby flue gas or
CO2 sources and CO2 capture facilities and any flue gas treatment facilities should be built adja-
cent to the power plant sites. The Nuon Magnum power plant had plot space reserved for an
additional coal gasification unit (Magnum phase 2) that is unlikely to go ahead. That space close
to the power plants could be available for a new boiler, CO2 capture, and compression for GPM.
6.4. Wells Infrastructure
The majority of the new wells (injection wells, possibly new observation wells and – for some
concepts only – new production wells) will be located on existing wells sites (mostly producing
well sites and some observation well sites without production). A few observation wells sites may
need to be extended, depending on the concept selected. Most of the identified wells sites are
considered as feasible drilling locations. For sites that may anticipate potential permitting issues,
alternative sites have been identified. For the new sites and sites where extension is required, the
acquisition of additional lands would have to be assessed in further project phases.
In the south of the field, there are multiple production locations which are large enough to ac-
commodate multiple numbers of additional wells. Typically, the distribution of these locations is
such that subsurface targets can be drilled from multiple surface locations.
In the north and north-western parts of the field, the existing well and production locations are
more sparsely distributed. An initial survey to assess which outstep would be required in the
north to access all potential subsurface targets from existing locations showed that a maximum
outstep of 3 km would be sufficient.
Table 6.5 shows which completions sizes are feasible for a range of outsteps.

- 66 -
Table 6.5: Well completion evaluation for Groningen reservoir conditions.
Completion Size “OK to Drill” “Challenging” “Technical Limit”
9 ⅝” (big bore) Vertical 1 km outstep
7” Vertical
or up to 2 km outstep 3 km outstep 4 km outstep
5” Vertical
or up to 3 km outstep 4 km outstep 5 km outstep
A big bore well design (9 ⅝”) is technically challenging for a vertical well, considering the possi-
bility of over-pressured sand lenses in the Zechstein formation and drilling through a depleted
reservoir with associated hole stability problems. Already with a limited outstep of 1 km, a big
bore well design would be at the limit of what is technically feasible.
A smaller 7” completion can handle about 1 bcm/a and can reach all drilling targets within a
3-km outstep. Accepting a challenging completion choice, the 7” well can meet both: the geo-
graphic coverage required plus the injections rates with a limited number of wells. On this basis,
7” completion design has been recommended as the base case well for GPM.
A 5” completion can be executed with a larger outstep, yet would require an increased number of
wells. A 5” completion design should only be considered for wells with outstep bigger than 3 km.
The proposed well design is illustrated in Figure 6.7.
Figure 6.7: Potential injector well design.
For N2 injection, no special material selection is required and the standard 13Cr material could be
used. In the case of co-injection of pure CO2 with N2 or in the case of flue gas use, corrosion
risks must be considered and managed during operational upsets. During normal operation, the
injection gas will be dry; however, during upsets, backflow may occur and therefore, the well
completions shown in Figure 6.8 are proposed.

- 67 -
Figure 6.8: Injection well completion options for flue gas and pure N2 with co-injected CO2.
The injectant is dry; however, during stop of injection, the well completion can be
exposed to moisture from reservoir. This requires corrosion-resistant materials.
Possible options range from installing (1) non-return valve to minimise the CRA
part of the completion, (2) operational measures “mothballing” with nitrogen, or
(3) full-length CRA tubulars.
6.5. Gas Production and Treatment
6.5.1. Gas Treatment and Injectant Removal
In case that the amount of N2 produced with the Groningen hydrocarbon gas with GPM is too
high, such that it cannot be blended with high-calorific gas to give the required Groningen gas
quality (either because there is not enough high-calorific gas available or the amount of Groning-
en gas generated through blending is higher than the demand), the produced gas needs to be
treated through a N2 removal facility. The most effective means of removing N2 from a natural
gas stream is by cryogenic separation as this gives the purest separated N2 stream. The concepts
studied envisage recycling the recovered N2 for injection. The concentration of hydrocarbon gas
left in this separated N2 has a direct effect on ultimate reservoir recovery and therefore should be
reduced as far as possible.
Figure 6.9 shows a potential block-flow diagram for a processing facility. The gas treated in the
NRUs has an N2 content of 4% and therefore, some contaminated gas is left untreated and by-
passes the NRU to be combined with the treated steam, to give a stream of Groningen gas quali-
ty with 14% N2. The separation of N2 is achieved by liquefying the hydrocarbon components at
pressures of 16-34 barg and cryogenic conditions (-140±5 °C). The N2 remains primarily gaseous
at these conditions and is separated. Both fractions are re-heated to ambient conditions and pres-
surised to the required pressure level. Upon heating, the hydrocarbon product fraction re-

- 68 -
vaporises. The operation under cryogenic conditions requires the removal of components, which
would freeze out and thereby impede with the operation of the unit (blockage, increase of heat-
transfer resistance). These components are CO2 and water.
CO2 removal is achieved by an amine wash step (acid gas removal, AGRU). Water removal is
achieved with a mole sieve de-hydration unit (DHU). Due to utilisation of aluminium equipment
in the cryogenic part of the plant, mercury needs to be removed from the gas to prevent corro-
sion of the aluminium.
Figure 6.9: Block-flow diagram for a four-train nitrogen (N2) rejection unit with two pre-
treatment trains.
The delay between injection and breakthrough depends on the subsurface concept and ranges
from 2 to 4 years for a dispersed injection pattern to 5 to 25 years for a N-S sweep pattern. Upon
breakthrough, the concentrations of nitrogen will quickly ramp up.
Besides this established technology, upcoming and novel concepts have been evaluated for their
potential benefits, namely the application of membranes and the concept of CO2 freeze-out, re-
sulting in elimination of the pre-treating requirements (CO2 and water removal). However, the
lack of technological maturity of the novel solutions renders these options unfeasible.
Alternatively, to NRUs, it has been investigated whether the produced gas can be blended with
import gas to meet the overall Dutch domestic gas specifications. This potentially can avoid the
installation of large NRUs and make overall GPM concept more efficient. The Dutch future gas
demand requires the amount of N2 as shown in
Wells
Wells
Wells
…..
Gas Dew-
pointing
AGRUMol Sieve
DHUMRU
NRU Pre-Treatment Train 1
AGRUMol Sieve
DHUMRU
NRU Pre-Treatment Train 2
NRU1
NRU2
NRU3
NRU4
Export/Custody Transfer
NRU Bypass, off plot
N2 Injection
N2
N2
N2
N2
N2 = 14 %vol
CO2
Compression
Existing facilities
New facilities
N2=4 %vol

- 69 -
Figure 6.10.
Figure 6.10: Nitrogen (N2) demand forecast for Dutch low calorific gas compared with N2
produced in simulated GPM schemes. The maximum allowed N2 production is

- 70 -
directly related to the Groningen gas demand, which over time decreases. Once
N2 produced from the field exceeds demand, an NRU is required.
Whether blending can be applied depends on the subsurface concept, i.e. the injection and pro-
duction rates and the injection well pattern and according N2 breakthrough behaviour, as shown
for some sample schemes in
Figure 6.10. As long as the Groningen field produces less N2 than the demands in the Groningen
gas market, it is possible to blend. However, other limiting factors for this option are the CO2
specification for the gas transport system and the CO specification in case of direct use of flue
gas. As dispersed injection patterns have a fast breakthrough of N2 and accordingly high amounts
of N2 production, blending is not feasible in those types of concepts. Only the N-S sweep and
central injection pattern at low rates can provide opportunity to significantly reduce the required
NRU capacity by blending. It should be noted that the blended N2 is not recycled to injection
wells anymore and accordingly, more ASU capacity is required to obtain the same injectant rates.
The additional N2 from the Groningen production would replace some of GasTerra’s ASU ca-
pacity that is provided on a Dutch national level for blending with imported high-calorific gas.
In a GPM scheme, the potential benefits of blending versus ASU+NRU capacity can be opti-
mised, including initial blending up to maximum tolerable limits and later additional NRUs can
be installed.
6.5.2. Produced Gas Treatment Locations
To minimise the land use, the visual impact and the noise impact of the additional produced gas
treatment facilities, it would be preferable to have one (or two) large, central NRUs instead of
smaller NRUs at every existing production cluster as previously indicated in the 2013 Winning-
splan GPM concept.
For the NRU, the following potential location options have been identified:
Eemshaven (industrial area)

- 71 -
Delfzijl (industrial area)
Zuidbroek (currently farmland but close to Zuidbroek industrial area and GTS ASU and
blending station Heiligerlee)
Groningen south-East (industrial area)
Eemshaven and Delfzijl are considered feasible locations (see section 6.3.5). Other locations, if
needed, would need to be confirmed in later stages of the project. From an integration point of
view, grouping ASUs and NRUs in Eemshaven seems a logical choice.
As increasing amounts of produced gas get more and more contaminated with breakthrough N2
over time, the increasingly more produced gas needs to be routed to the NRUs. For this, new
pipelines from the Groningen ring to the NRUs are required. Depending on the injection
scheme, the Groningen ring line can be segregated in a non-contaminated and contaminated sys-
tem thus minimising the total gas flow to the NRUs. This segregation of the ring can be done in
phases following the breakthrough pattern.
6.6. Pipelines
For four main injection patterns, detailed pipeline routes have been developed making the best
use of existing infrastructure where possible, and the best use of existing pipeline corridors. Fig-
ure 6.11 and Table 6.6 show the pipeline scope for all of the concepts. It can be seen that the
dispersed injection case has a significant pipeline scope, as does the central injection case despite
the limited injection rate.
Table 6.6: Estimate pipeline scope for example injection patterns.
Injection Pattern
Pipeline Length (km)
Dispersed
(max injection
30 bcm/a)
Central
(max injection
10 bcm/a)
N-S sweep
(max injection
20 bcm/a)
Semi Dispersed
(max injection
20 bcm/a)
Line Diameter < 24" 50 27 0 53
Line Diameter >= 24" 110 57 54 56
Total 160 84 54 109

- 72 -
Figure 6.11: Notional pipeline routes for four injection patterns .
The injection pipeline system would be completely new-build and operates at 140 barg and the
routing confined to existing pipeline corridors as far as possible. The above schemes are consid-
ered archetypes covering a range of potential injection schemes. Based on final optimisation of
the required injection rates/locations, other schemes are possible; however, the conclusions will
not be significantly different from the above-indicated range of injection schemes.

- 73 -
6.7. Surface Concept Overviews
6.7.1. Injectant Selection as Function of Injection Pattern
The surface facilities concepts are defined by a) the required injection rate, b) the injection pat-
tern and c) the final field abandonment pressure. These parameters determine ultimate recovery
and breakthrough of injectant, which determines which injectant can or cannot be used.
For injectants containing contaminants like O2, CO, NOx, SOx the main threat is breakthrough of
O2. It is expected that O2 gets scavenged in the reservoir but that is uncertain, and will remain
uncertain even with extensive testing programmes. If O2 breaks through, the producing wells
need to be shut-in, which would significantly impact ultimate recovery. Figure 6.12 shows the
maximum potential loss in UR for three injection patterns in case O2 breaks through and the
facilities would have to be shut-in immediately.
Figure 6.12: Risk of maximum ultimate recovery (UR) loss in case O2 breaks through and fa-
cilities have to be closed-in immediately. The total height of the bars indicates the
remaining UR under continued depletion, the light blue sections indicate the UR
loss in GPM schemes without O2 in the injectant, caused by shut-in of producers
at elevated N2 cuts (energetic cut-off), the orange sections indicate the hypothet-
ical UR loss if the producers had to be closed-in immediately at injectant break-
through, which would be the case if the breakthrough injectant contained O2 that
had not been scavenged while travelling through the reservoir.
From this figure, it can be concluded that, in case of O2 breakthrough, the UR loss doubles com-
pared to cases without O2 in the injectant. For a dispersed-type scenario, the risk on UR is clearly
unacceptable; this means direct flue gas injection cannot be used in a dispersed-type concept
which is in general the scheme which best manages pressure in the reservoir.
6.7.2. Comparing Scope for Flue Gas and ASU Concepts
The main items in GPM are:
1. Compression: For comparable injection rates, there is little to no difference in compression
requirements between concepts with different injectants, as gas with roughly the same mo-
lecular weight needs to be compressed from atmospheric pressure to about 140 bar.
2. Injectant production (air separation and/or flue gas treatment): Flue gas capture and pro-
cessing (combustion, catalytic combustion, gasification, or CO2 extraction) require more capi-
tal than air separation alone as more processing units and equipment are required. Further-

- 74 -
more, flue gas concepts will require corrosion-resistant materials for the processing equip-
ment.
3. Wells: For comparable injection rates, the well count is independent of the injectant used.
Specific flue gas cases exist in which contaminants will require higher-grade materials. The
potential presence of O2 in particular will require the injection wells to be fitted with high-
grade materials completions.
4. Pipelines: For comparable injection rates, the pipeline system is independent of the injectant
used. A specific flue gas cases exist in which the potential presence of contaminants like SOx
(in RWE flue gas) will require high-grade materials.
5. Produced gas treatment (N2 and CO2 removal): Concepts with CO2 co-injection require more
CO2 to be removed at the NRU, which is not significantly offset by a reduction in NRU size.
Additionally, increasing CO2 concentration in the produced gas will require modifications to
the existing depletion compressor and some of the existing gas treatment equipment (e.g.
DEG drying).
As flue gas concepts are more expensive than ASU concepts, this higher CAPEX will need to be
offset by benefits from efficiency and/or CO2 stored. With compression energy being roughly
the same and produced gas treatment and CO2 capture requiring more energy, the only real effi-
ciency gain is in the difference in power generation efficiency for a new boiler or the gasification
process, which are not higher than commercial power plants. As CO2 capture from a power plant
requires a significant amount of energy, this option is expected to be the least energy efficient.
As there are no obvious benefits for use of direct flue gas, given the additional risks (e.g. UR loss,
HSSE) and operational complexity, the GPM work will focus for now on
a) N2 from ASUs and
b) N2 from ASUs with CO2 captured at a coal-fired power plant.
However, the option of flue gas use from a gas-fired power plant remains a potentially feasible
option and could be further worked once the injection patterns and rates are defined.

- 75 -
Figure 6.13: The two surface concepts that are expected to be feasible are for pure nitrogen
(N2) and for N2 with CO2 co-injection.
6.7.3. Comparing Scope of Continued Depletion and GPM
Under continued depletion, the Groningen field will also require modifications to continue pro-
duction. As the field further depletes, the clusters will need to be equipped with second- and
third-stage depletion compressors. Under GPM, these additional depletion compression stages
may not be required, which can reduce the total scope for GPM.

- 76 -
7. Operation of an Injection Scheme
7.1. Well, Reservoir, and Facilities Management (WRFM)
7.1.1. Operations of the Groningen Asset
The existing Well, Reservoir, and Facilities Management plans would have to be updated to take
into account the increased operational complexity and increased number of variables to ensure
reliable operation, acceptable safety risks and optimised recovery. Manning levels for operations
and maintenance may need to be increased to support the operations of new world-scale facili-
ties.
Injection rates, pressures, and temperatures need to be monitored at all injector wells. The cur-
rent practice of monitoring reservoir pressure from producing and observation wells will have to
be continued and intensified and the use of permanent downhole gauges should be considered.
Given the required level control of the reservoir pressures around injection, dense and frequent
monitoring will be required.
The overall GPM facility design infrastructure would be of a world-scale size and complexity,
especially the integration with power plants in the event of implementing flue gas and CO2 cap-
ture concepts.
Currently, seismicity is measured with two deep observation wells and 70 or so shallow geo-
phones and accelerometers at surface. Potentially, this monitoring network might have to be
made denser, in particular given the uncertainties around injection-induced seismicity. Subsidence
is measured by inSAR satellite, levelling, and GPS stations and compaction by radioactive bullets
in observation wells and distributed strain sensing in two new observation wells. Further subsid-
ence and compaction measurements might be required under GPM.
During the GPM injection scheme, injected and produced gas quality will require analysis.
For all injectants, the target O2 content will have to be closely monitored and in case of CO2 co-
injection, the ratios of N2 and CO2 controlled.
Monitoring of composition at well and cluster level to detect injectant breakthrough (gas chroma-
tography - mass spectroscopy) will be necessary. Furthermore, for more detailed reservoir under-
standing, tracers could be injected into selected injectors and their transport through the reservoir
monitored.
Following breakthrough of injectant with O2 and/or CO2, the level of well integrity testing would have to be increased. Once contaminated (N2-rich) gas breaks through, the gas composition to the Dutch grid (Gas-Terra) will need to be managed. For example, there may be an opportunity to separate contami-nated and non-contaminated gas into two separate rings. If blending of Groningen gas with ele-vated N2 content with high-calorific gas is considered, the produced gas rates and quality at clus-ter and system level will have to be monitored closely. The Groningen field is used to balance the gap between the demand and the production of the small fields. Therefore, the gas production of the Groningen field varies over time; however, over the recent years the seasonal swing has decreased due to flexibility delivered by the UGSs and the decline in field capacity.

- 77 -
7.2. Health and Safety Risks and Environmental Impact
7.2.1. Introduction
As for any large-scale industrial project, GPM included the potential impact on health and safety
of people living near or working at the facilities and the potential impact on the environment
needs to be assessed. Identified risks need to be minimised to an acceptable level. Safeguarding
and integrity of wells, pipelines, and facilities is paramount. This means ensuring the facilities are
well-designed; safely operated; and properly inspected and maintained and – at the end of field
life – abandoned to prevent process safety incidents that could place people, the environment,
and the facilities at risk.
Specific health, safety and environmental (HSE) risks for GPM facilities/wells have been identi-
fied and it can be concluded that the identified risks are manageable and GPM facilities/wells
have the means of being operated responsibly.
7.2.2. Surface Facilities Health Risks
The key health issues and risks of the GPM surface facilities are the following:
Potential health impact on people working or living near facilities, e.g. noise, road transport,
light, sleep deprivation, leaks, ultra-low-frequency noise, traffic disruptions
Additional exposures for people operating and maintaining the facilities: N2 from leaks, cryo-
genic burns, O2 over-exposure, CO2 from leaks, noise and vibration from compressors, natu-
rally occurring radioactive material (NORM), chemical exposure and handling
These hazards would be managed through the health risk assessment process and adherence to
existing laws, regulations, permit (conditions), standards, and guidelines for the design of the new
facilities and during operations, including human factors engineering. For example, the existing
medical emergency response plan would have to be updated with focussed attention for specific
first aid, e.g. asphyxiation, cryogenic burns, compliance with incident classification, and require-
ments and communication with local emergency services and health care providers.
As for ongoing operations, fatigue risk management and road journey management (shift work
and commuting) would have to be considered in particular, given the more extensive spread of
facilities across the field.
7.2.3. Surface Facilities Process Safety and External Safety
Process safety hazards of the GPM surface facilities were identified in the Hazard Identification
(HAZID) study, including the potential major accident hazards (MAH) listed in Table 7.1. The
HAZID technique is a means of identifying and describing health, safety, environmental and
social hazards and threats at the earliest practicable stage of a development or venture. In a meet-
ing with an experienced multi-disciplinary team, the hazards are identified using a structured
brainstorming technique, based on a checklist of potential HSE issues.
The identified hazards would be taken into account in a future concept ALARP demonstration (“as low as reasonably practicable”) and the Hazards and Effects Management Process (HEMP) would be followed to reduce the risk associated with these hazards to ALARP.
The well sites considered for GPM have been reviewed for potential external safety bottlenecks,
using the quantitative risk assessment (QRA) reports for the existing production clusters and the
QRA report for the De Wijk EGR project. The gas injection wells would be located mostly on
existing production clusters and some existing observation well sites (section 6.4). Based on the
external safety/QRA review, it is expected that the contours for a location-specific individual risk
greater than 10-6/a for the injection wells sites will not cover houses and/or other sensitive desti-

- 78 -
nations. The injectant generation plant and NRUs for GPM would be located on an industrial
area like Eemshaven or Delfzijl; hence the external safety contours are not expected to be an
issue for these facilities.
Process safety studies have been identified for possible future study phases to mitigate the major
accident hazards risks, e.g. physical effects modelling, QRA, facility siting, hazard and operability
analysis (HAZOP), hazard and effects management process (HEMP), and layers of protection
analysis (LOPA).
The work so far does not indicate any risks that could not be managed through design and pro-
cedures.

- 79 -
Table 7.1: Potential major accident hazards for GPM concepts related to surface facilities and injectants.
Nitrogen-only Injection (ASU)
(Hydro)carbons in ASU air intake, leading to explosion
Liquid Nitrogen (LIN): Loss of containment (LOC) of liquid nitrogen leading to O2
deficient atmosphere, potentially leading to fatalities
LNG (liquefied natural gas): Loss of containment of LNG from NRU, explosive gas
cloud leading to fire or explosion, potential multiple fatalities
Mercury breakthrough from absorber vessels, entering alumin-
ium cold box heat exchangers, leading to corrosion and loss of
containment of N2 and LNG/natural gas. Fire, explosion.
Nitrogen off spec (high O2 percentage), O2 in injectant pipe-
line, injected into reservoir, leading to corrosion of processing
equipment; extensive asset damage.
Oxygen rich waste stream from ASU: increased fire risk
Flue Gas Injection and CO2 Co-injection
For cleaning of flue gas from coal-fired power plant; dust from flue gas collected in fil-
ters may give rise to dust explosion during handling like shutdowns, filter replacement,
loss of containment etc.
For cryogenic separation option: LOC of liquid nitrogen leading to O2 deficient atmos-
phere and asphyxiation of people in the hazard zone, potentially leading to fatalities. This
risk is similar to the ASU Reference case.
CO2 is slightly toxic, so upon release of CO2 effects (like dizziness or even unconscious-
ness) can occur before O2 concentration falls to a level where asphyxiation effects occur.
For gasification option: Hydrogen induced corrosion/cracking, leading to LOC leading
to fire (invisible flame), explosion.
For gasification option and Boiler option: potential for elevated CO levels in flue gas
(toxic levels, above MAC) in case of process upset.
Corrosion issues in flue gas cleaning and injection facilities, including wells, due to O2,
SO3 (very hygroscopic, forming sulphuric acid; rapid corrosion), SO2, CO2 in injectant
(in presence of water).
Unforeseen chemical reactions in reservoir resulting in con-
taminants in produced gas e.g. lowering of the pH by CO2 in-
jection and the effects on contaminants. Given the conditions
in the reservoir it is very unlikely that H2S formation by sul-
phur-reducing bacteria would occur in the reservoir. The heavy
metal concentration in the flue gas from a coal fired power
plant is significantly lower than the background level concen-
tration of heavy metals (Hg) in the reservoir, so is not expected
to influence the composition of the produced gas.
For all concepts with O2 in the injectant: Water ingress (from
the formation) during injection suspension which can lead to
corrosion in the lower part of the completion. Potential loss of
well, and/or eventually LOC

- 80 -
The qualitative comparison of the hazards for different injectant generation processes shown in
Table 6.4 do not allow discarding or preferring any injectant generation concepts based on safety
considerations alone.
7.2.4. GPM Subsurface and Wells Risks
Additionally to the hazards identified in the previous section pertaining to facilities and injectants,
the nature of the GPM also brings particular subsurface hazards that were also identified in a
HAZID and a separate Geomechanical risk assessment exercise.
A particular risk for GPM is injection-induced seismicity. The underlying hazards are:
Reactivation of existing faults through injection. Risk mitigation is to inject away from known
faults and to minimise the pore pressure increase around injectors. The Well, Reservoir, and
Facilities Management plan will therefore include injection pressure monitoring.
Thermal effects in injection scheme. There is a potential risk of thermal effects during injec-
tion leading to contraction of rock, which may result in seismic activity. Given that thermal
effects appear to be a significant factor in the risk of seismicity (ref. [3]), risk mitigation can
be achieved by controlling the temperature of injected gas by heating the gas at surface or
control of the rate of injection. Technical implications of controlling the injection gas tem-
perature would have to be evaluated.
Figure 7.1 shows a safety “bow tie”, visualising the hazards/threats, related to injection (left-hand
side), which lead to a top event – in this case increased seismicity – and the potential conse-
quences (right-hand side). The figure also shows possible barriers to reduce the likelihood of the
threats causing the top event.
Figure 7.1: Bow tie for injection-induced seismicity.
Other subsurface risks only relevant for concepts with flue gas or CO2 injection are:
Leakage in abandoned wells: Five out of 33 abandoned wells have not been abandoned at the
reservoir cap rock level. Damage to cement or casing may create a leak path over time. Injec-

- 81 -
tion of CO2 or other reactive flue gas components will speed up the degradation of cement
and casing. The risk mitigation possibilities are:
- The Zechstein salts would squeeze against the casings or even close the borehole over
time. Furthermore, any water- or hydrocarbon-bearing sands within the Zechstein are at
higher pressures and if leaking would occur, flow would be into rather than out of the
depleted Groningen reservoir.
- Monitor pressures in wells adjacent to the incompletely abandoned wells to detect com-
munication and leak paths into the monitored wells.
Failure of producing wells: Mechanical failure of tubular or cement that limits or prevents
well operations. The current assumption is the existing wells can already handle up to 18% of
CO2 in the produced stream. However, there is a risk of overestimating the integrity of exist-
ing well stock with respect to potential CO2 corrosion. Risk mitigation possibilities are:
- Monitor the gas composition of producing wells.
- More frequent well interventions on wells with detected and elevated CO2 levels. Shut-in,
workover, and replace the producing string and a packer as required.
Onshore CO2 storage in the Netherlands is currently not permitted, however, for lowering the
carbon footprint of GPM, the option of pure CO2 injection in the Annerveen field has also been
reviewed. As for the Groningen field, the Annerveen field also has the Zechstein as cap rock,
which is a proven seal. However, the field also has similar subsurface hazards as described above
for the Groningen field. Seismicity from depletion has also been experienced in Annerveen. Alt-
hough the seismicity levels were lower than in Groningen, the risk of seismicity during injection
is not necessarily lower than for the Groningen field. The Annerveen field could be repressurised
to near virgin pressure (280 barg) for the purpose of CCS, whereas the Groningen field would
not go above 80 barg. The higher the pressure increase, the higher the probability of fault slip
and seismicity.
7.2.5. Environment
The environment in the Groningen area consists of rural area, small villages, a coastline with the
Waddenzee and the estuary of the Eems-Dollard and industrial areas in Eemshaven and Delfzijl.
The province of Groningen has areas of protected nature, but all currently producing 20 Gro-
ningen cluster locations are located in rural areas, although a couple of these locations have
neighbours living within 300 m. A few locations (e.g. Bierum) are near the Waddenzee and the
Eems-Dollard, which belongs to the Natura 2000 network of vulnerable habitats in the EU and
are classified as IUCN category IV areas.
Table 7.2 shows the environmental issues and risks and a range of mitigation measures that have been identified for the GPM project. Issues related to biodiversity are not expected. The area is well-known and potential project impact on biodiversity/endangered species is anticipated to be manageable based on NAM’s project experience (e.g. bird nesting periods’ impact on construc-tion timing).
Due consideration was given to the environmental risks and the possibilities to minimise them in
the concept development and site identification.

- 82 -
Table 7.2: Environmental issues and risk for GPM and range of mitigation measures.
Environmental Issues and Risks Mitigation Measures
Energy use (power and heat) and associated
greenhouse gas emissions: For the larger injec-
tion schemes (20-30 bcm/a), the power con-
sumption is around 1 GW. This would be a
significant increase in power consumption and
CO2 emissions on a national level. The carbon
intensity of the Groningen gas will significantly
increase.
Flue gas injection, CO2 co-injection,
and/or CCS in other fields have been identi-
fied as potential options to reduce the carbon
footprint of the project (see section 6.3.4)
Cooling water access in the northern part of
Groningen has been limited already for the
newer industries like IT data centres;
Air cooling is an alternative option if neces-
sary.
Noise exposure around ASU and NRU instal-
lation(s) for neighbouring buildings. The com-
pressors – required for compressing the injec-
tion and produced gas – are expected to be the
main contributor to the noise emission. Anoth-
er source of noise is air coolers, which are ex-
pected to be required if (sufficient) cooling wa-
ter is not available.
Visual impact of the newly built ASU and
NRU, especially if located in a rural area with
no, or very limited, industrial activity.
Incidental gaseous releases (for example
CO2, N2 and natural gas).
Light disturbance at night from the newly
built installations.
Re-use of existing sites: The injection wells
can be located on existing production clusters
or observation sites to minimise land use and
visual impact. A few new well sites may be re-
quired, depending on the selected injection well
pattern.
Centralised ASU and NRU: The injectant
generation is also centralised at Eemshaven or
Delfzijl (in the case of flue gas use: only Eems-
haven is possible). The number of NRU instal-
lations is limited to one or two, depending on
the selected concept. Also these industrial facil-
ities will preferably be located in industrial are-
as, like Eemshaven or Delfzijl, where they have
minimal incremental visual impact, noise and
light disturbance. In these industrial areas, land
is available for industrial activities.
If it is decided to implement GPM, a formal impact assessment (IA) would have to be carried out
as part of the permitting process. Therefore, the impact assessment will follow the formal appli-
cation process, including the start note ‘‘Notitie Reikwijdte en Detailniveau” and formally man-
dated engagement sessions.
In the design of the facilities, further consideration would have to be given to the environmental
aspects like visual impact, noise emissions, and water use, including any additional aspects identi-
fied during the EIA process.
7.2.6. End of Field Life Abandonment
The GPM injection wells and facilities do not contain elements that require special abandonment
considerations compared to other NAM onshore facilities. At the end of field life, the surface
facilities and wells, at the field level, will require to be abandoned in compliance with the Dutch
governing body. The abandonment scope will however significantly increase as the number of
wells and facilities would have increased due to the GPM project and the reservoir will have a
higher abandonment pressure.

- 83 -
8. Development and Implementation of an Injection Scheme
As mentioned in section 1.2, the feasibility of GPM is being studied, but no firm plans exist cur-
rently to test or implement such a concept. The following conditions are a prerequisite for GPM
to be implemented:
1. Continued production under depletion was deemed unacceptable.
2. The concept of pressure maintenance was proven to be within acceptable safety limits and
effective in reducing the earthquakes.
3. One or more field trials to demonstrate the effectiveness and acceptable safety risks has/have
been conducted successfully.
4. The remaining gas volumes in the field justified the significant investment.
5. Society and the regulator support this large-scale project.
6. GPM has acceptable economics and is proportional to other alternative risk mitigation op-
tions.
Hypothetical schedules have been developed as part of the GPM feasibility study. Estimating the
durations for testing, designing, procuring, constructing, and starting-up GPM concepts, helps to
establish from which points in time, GPM could be available as a measure to reduce seismicity.
Given the required effort to prove potential feasibility and to execute a GPM project, a start-up
of such scheme cannot be expected before the mid-2020s.
Figure 8.1 shows a hypothetical schedule of an implementation of GPM for injection of N2 from
ASUs. This schedule is largely influenced by the following uncertainties:
pace of technical and scientific progress to better understand the seismicity in Groningen,
whether injection is a potential option, and whether an injection test could be designed to
safely and reliably inform whether GPM would work
required time for injection testing – in particular the number of locations that would have to
be tested
decision-making and permitting process – also for an injection test alone – involving many
stakeholders, including the public.
The hypothetical schedule makes the following assumptions:
No wait periods – the implementation is assumed to be continuous, aiming for the fastest
possible start-up of GPM. Wait periods could be envisaged if there was no need for a fastest
possible implementation and GPM would still be studied and progressed as an “insurance
policy” with actual construction and implementation at a far later date.
Injection testing with hydrocarbons (see section 5.4) – no infrastructure needs to be built to
provide large quantities of N2 for testing.
Positive outcome from the injection test expected with little impact on selected full-field con-
cept – the frontend engineering and design (FEED) work for the full-field concept already
starts during the injection test period; a negative test would bring that work to a hold or re-
quire a review of the concept assumptions, leading to a recycling of work.
Best practical project execution.
No external constraints.
Given the project size and complexity, a start-up of such scheme cannot be expected before the
mid-2020s. For any concept evaluation so far, a first N2 injection date in 2024 has been assumed.
However, it can easily be envisaged that this date gets deferred if the feasibility of GPM and the
injection test cannot be demonstrated convincingly in time, the injection test scope becomes
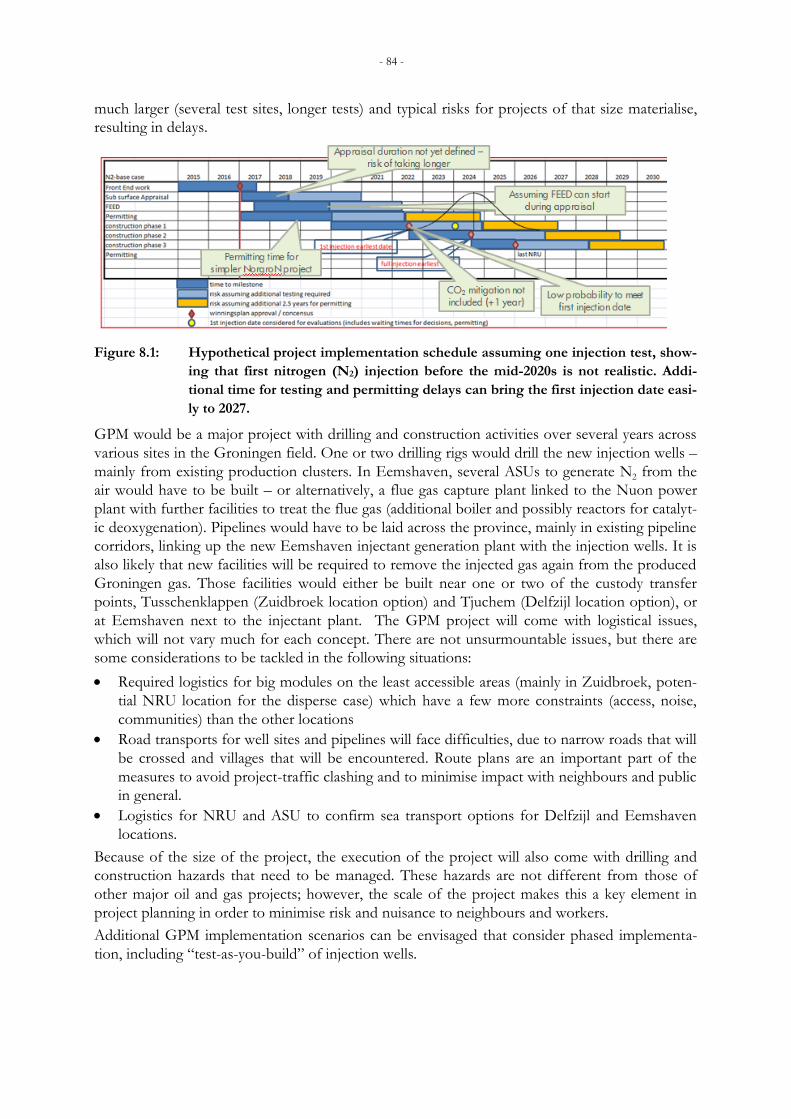
- 84 -
much larger (several test sites, longer tests) and typical risks for projects of that size materialise,
resulting in delays.
Figure 8.1: Hypothetical project implementation schedule assuming one injection test, show-
ing that first nitrogen (N2) injection before the mid-2020s is not realistic. Addi-
tional time for testing and permitting delays can bring the first injection date easi-
ly to 2027.
GPM would be a major project with drilling and construction activities over several years across
various sites in the Groningen field. One or two drilling rigs would drill the new injection wells –
mainly from existing production clusters. In Eemshaven, several ASUs to generate N2 from the
air would have to be built – or alternatively, a flue gas capture plant linked to the Nuon power
plant with further facilities to treat the flue gas (additional boiler and possibly reactors for catalyt-
ic deoxygenation). Pipelines would have to be laid across the province, mainly in existing pipeline
corridors, linking up the new Eemshaven injectant generation plant with the injection wells. It is
also likely that new facilities will be required to remove the injected gas again from the produced
Groningen gas. Those facilities would either be built near one or two of the custody transfer
points, Tusschenklappen (Zuidbroek location option) and Tjuchem (Delfzijl location option), or
at Eemshaven next to the injectant plant. The GPM project will come with logistical issues,
which will not vary much for each concept. There are not unsurmountable issues, but there are
some considerations to be tackled in the following situations:
Required logistics for big modules on the least accessible areas (mainly in Zuidbroek, poten-
tial NRU location for the disperse case) which have a few more constraints (access, noise,
communities) than the other locations
Road transports for well sites and pipelines will face difficulties, due to narrow roads that will
be crossed and villages that will be encountered. Route plans are an important part of the
measures to avoid project-traffic clashing and to minimise impact with neighbours and public
in general.
Logistics for NRU and ASU to confirm sea transport options for Delfzijl and Eemshaven
locations.
Because of the size of the project, the execution of the project will also come with drilling and
construction hazards that need to be managed. These hazards are not different from those of
other major oil and gas projects; however, the scale of the project makes this a key element in
project planning in order to minimise risk and nuisance to neighbours and workers.
Additional GPM implementation scenarios can be envisaged that consider phased implementa-
tion, including “test-as-you-build” of injection wells.

- 85 -
9. Feasibility Assessment of GPM Concepts
As already indicated in section 1.3, an overall GPM concept consists of a number of (technical)
elements:
Pressure management policy defined by reservoir abandonment pressure and tolerances to
regional pressure increases and decreases during GPM)
Injection and production pattern and rates
Testing/appraisal of GPM before a full-field implementation
Injection medium
Type of facilities for a) injection medium sourcing/generation and processing and b) pro-
duced gas treatment and/or blending with high-calorific gas
Project execution planning and phasing.
All of these elements have been discussed in the foregoing chapters. Combining the findings for
these elements, preliminary concepts of logical combinations of the pressure management poli-
cies, injection and production patterns and testing requirements can be built.
Any given pressure management policy from Figure 4.2 can be achieved with various injection
well patterns, for which archetypes were shown in Figure 4.3, that could be further optimised.
Assuming that the seismic risk is governed by the pressure management policy, concepts with
similar pressure management policies can be compared on other key drivers, like public ac-
ceptance, environmental and implementation footprint, gas recovery, schedule, and required pro-
ject scope.
Depending on the type of pressure management policy – whether pressure increases are accepta-
ble or not – certain injection patterns appear preferable: For cases, in which repressurisation is
allowed, the N/S sweep and semi-dispersed patterns appear suitable, while cases, in which re-
pressurisation needs to be avoided, the fully and semi-dispersed patterns appear more suitable. A
local injection pattern would only allow low injection rates and therefore, only be suitable to ei-
ther temporarily stabilise pressures locally or result in a low-rate full-field GPM scheme.
Further optimisation of the GPM cases is possible. Also, other GPM cases with, for example, a
continued but slower pressure decrease across the field down to certain abandonment pressures
could be assessed.
N2 injection and N2 with CO2 co-injection were both assessed to be technically feasible. The in-
jection medium selection was found to be relatively independent from the applied subsurface
concept, except for limitations to blending and different expectations of injection medium break-
through.

- 86 -
Figure 9.1: The two surface concepts that are expected to be feasible are for pure nitrogen
and for nitrogen with CO2 co-injection.
As indicated in chapter 8, different GPM concepts have similar start dates, given the common
scope (wells, compressors, pipelines) and testing and permitting durations. The extent of the in-
jection testing before implementing the full-field concept would influence the schedule. Currently
it is assumed that all concepts are impacted in the same way by the testing, but this needs to be
assessed further. The currently assumed GPM start date is in the mid-2020s.
Overall, implementation of GPM seems technically feasible, but whether the desired seismic risk
reduction can be achieved is yet unclear. Local testing seems technically feasible, but whether
appropriate testing can be done to obtain the required assurance that GPM is effective for all the
different pressure management policies, and whether testing can be executed with acceptable
safety risks, still remains uncertain. Given the issue of possibly low representativeness of injection
field-tests, concepts with a step-wise approach would have to be considered, in which appraisal
and implementation of the full-field scheme are progressed in parallel (“test-as-you-build” con-
cepts).
Ultimately, to establish feasibility for GPM and injection field-testing, a scientific consensus on
how to quantitatively estimate the risk of injection-induced seismicity would be required as well
as a cost benefit analysis versus other options to manage seismic risk.
Air Air
Pure N2
N2 + CO2
Flue
Gas Blending
Air Air
ASU Compression NRU Compression
ASU Compression NRU Compression
Fluegas duct(at RWE)
CO2 capture(CanSolv)
Recycle
Recycle

- 87 -
References
[1] Van Elk, J.F., de Haan, J.: Winningsplan Groningen 2013, NAM, November 2013.
http://www.namplatform.nl/mediatheek/winningsplannen.html
[2] Van Elk, J.F., Doornhof, D: Study and Data Acquisition Plan - Induced Seismicity in Gro-
ningen for the Update of the Winningsplan 2016, NAM, December 2014.
http://feitenencijfers.namplatform.nl/onderzoeksrapporten
[3] TNO report (2014). Literature review on injection-related induced seismicity and its rele-
vance to nitrogen injection. TNO project report 2014 R11761, December 2014.
http://www.nlog.nl/resources/Seismic_Risk/TNO-Report-2014-R11761-Public-
final18122014_anonymous.pdf
[4] NN: Hazard and Risk Assessment for Induced Seismicity Groningen - Update 1st May
2015 (Part 1 and 2), NAM, June 2015.
http://feitenencijfers.namplatform.nl/onderzoeksrapporten
[5] Bourne, S. J., S. J. Oates: An Activity Rate Model of Seismicity induced by Reservoir Com-
paction and Fault Reactivation in the Groningen Gas Field, NAM.
http://feitenencijfers.namplatform.nl/onderzoeksrapporten
[6] Letter from Dutch Minister of Economic Affairs to Chairman of the Second Chamber of
the Dutch Parliament on Gas Production in Groningen, 17 January 2014.
[7] Nagelhout, A.C.G. and Roest, J.P.A. (1997) Investigating fault slip in a model of an under-
ground gas storage facility. Int. J. Rock Mech. & Min. Sci. 34 (3-4), paper 212.
[8] Segall, P. (1989), Earthquakes triggered by fluid extraction, Geology, 17, 942-946.
[9] Grasso, J.R. (1992). Mechanics of seismic instabilities induced by the recovery of hydrocar-
bons. Pure and Applied Geophysics 139, p. 177-196.Gutenberg, B., and C. Richter (1954),
Seismicity of the Earth and Associated Phenomena, 2nd ed., Princeton Univ. Press, Prince-
ton, N. J.
[10] Klose, C. D. (2013), Mechanical and statistical evidence of the causality of human-made
mass shifts on the Earth’s upper crust and the occurrence of earthquakes, J. Seismology.,
17, 109-135.
[11] Bourne, S. J., S. J. Oates, J. van Elk, and D. Doornhof (2014). A seismological model for
earthquakes induced by fluid extraction from a subsurface reservoir, J. Geophys. Res. Solid
Earth, 119, doi:10.1002/2014JB011663.
[12] TNO report (2015a). Injection-Related Induced Seismicity and its relevance to Nitrogen
Injection: Description of Dutch field cases. TNO project report 2015 R10906, November
2015.
[13] TNO report (2015b). Injection Related Induced Seismicity and its relevance to Nitrogen
Injec-tion: Modeling of geomechanical effects of injection on fault stability. TNO project
report 2015 R11259, November 2015.
[14] McGarr, A. (2014), Maximum magnitude earthquakes induced by fluid injection, J. Ge-
ophys. Res. Solid Earth, 119, doi:10.1002/2013JB010597.
[15] Zoback, M.D. (2012). Managing the seismic risk posed by wastewater disposal. ARAM
Newsletter, Spring 2012. www.armarocks.org
[16] Jaeger, J.C., Cook, N.G.W, and Zimmerman, R.W. (2007). Fundamentals of rock mechan-
ics. 4th edition. Blackwell Publishing.
[17] Fjær, E., Holt, R.M., Horsrud, P., Raaen, A.M. and Risnes, R. (2008). Petroleum related
rock mechanics, 2nd edition. Elsevier. Developments in petroleum science.

- 88 -
[18] Sayers, C.M and Schutjens, P.M.T.M. (2007) An introduction to reservoir mechanics. The
Leading Edge, May 2007, special issue on geomechanics.
[19] Addis, M.A., N.C. Last and N.A. Yassir (1996). Estimation of horizontal stresses at depth
in faulted regions and their relationship to pore pressure variations. SPE Formation
Evaluation, SPE (March 1996), p. 11-18.
[20] Teufel, L.W., D.W. Rhett and H.E. Farrell (1991). Effect of reservoir depletion and pore
pressure drawdown on in situ stress and deformation in the Ekofisk field, North Sea. In:
Roegiers (ed.) Rock Mechanics as a Multidisciplinary Science, Balkema, p. 63-72.
[21] Ellsworth, W. (2013), Injection-induced earthquakes, Science, 341, 250-260.
[22] IEAGHG (2013), Induced seismicity and its implications for CO2 storage risk, Tech. Rep.
June, International Energy Agency Environmental Projects Ltd. (IEAGHG), Cheltenham,
U.K.
[23] Wassing, B.B.T. (2015). Description of Dutch field cases. TNO draft report TNO 2015
R10906, dated June 29 2015.
[24] Stabile, T. A., A. Giocoli, A. Perrone, S. Piscitelli, and V. Lapenna (2014), Fluid injection
induced seismicity reveals a NE dipping fault in the southeastern sector of the High Agri
Valley (southern Italy), Geophys. Res. Lett., 41, 5847-5854, doi:10.1002/2014GL060948.
[25] Guglielmi, Y., Cappa, F., Avouac, J-P, Henry, P. and Elsworth, D. (2015). Seismicity trig-
gered by fluid-injection-induced aseismic slip. Science Reports, June 12 21015, Vol. 340, is-
sue 6240.
[26] Hettema, M.H.H., P.M.T.M. Schutjens, B.J.M. Verboom and H.J. Gussinklo, 1998. Pro-
duction-induced compaction of sandstone reservoirs: The strong influence of field stress.
Society of Petroleum Engineers 50630. Paper at EUROPEC Conf., The Hague (NL) Oc-
tober 20-22 1998.
[27] Wong, T.-f. and P. Baud, (1999). Mechanical compaction of porous sandstone. Oil & Gas
Science and Technology - Rev. IFP, Vol. 54, p. 785-797.Zoback, M.D. (2007). Reservoir
geomechanics. Cambridge University Press.
[28] Van den Bogert, P. (2015) Impact of various modelling options on the onset of fault slip
and fault slip response using 2-dimensional Finite-Element modelling. Shell report
SR.15.11455.
[29] Van Eijs, R.M.H.E. and Valencia, K. (2015) Neotectonic stresses in the Groningen Field
(Rotliegendes Formation). NAM draft report. EP-201510210531.
[30] Segura, J.M., Fisher, Q.J., and Crook A.J.L. 2011. Reservoir stress path characterization and
its implications for fluid-flow production simulations. Petroleum Geoscience 2011, v. 17, p.
335-344.
[31] Van den Bogert, P.A.J., Van Eijs, R.M.H.E and Van der Wal, O (2013a), Groningen Fault
Stability Assessment, Draft Report shared with TBO committee and State regulator.
[32] Van den Bogert, P.A.J. and Van Eijs, R.M.H.E (2013b). Role of Faults, Chapter 9 in Tech-
nical Addendum to the Winningsplan Groningen 2013, Subsidence, Induced Earthquakes
and Seismic Hazard Analysis in the Groningen Field (http://www.namplatform.nl/wp-
content/uploads/2014/01/2-2-a-technical-addendum-to-the-winningsplan-groningen-2013.pdf)
[33] Chang et al. (2006). Empirical relations between rock strength and physical properties in
sedimentary rocks. J. Petr. Sci. and Eng. 51.
[34] Cesca, S, Grigoli F, Heimann, S, González, Á, Buforn E, Maghsoudi S, Blanch E, Dahm,
T. (2014). The 2013 September-October seismic sequence offshore Spain: a case of seis-
micity triggered by gas injection? Geophysical Journal International 198(2):941-953.

- 89 -
[35] Crawford, B.R. et al. (2010). Petrophysical methodology for predicting compressive
strength in siliciclastics. Publication 10-196, Presentation and paper at the 2010 Conference
of the American Rock Mechanics Association.
[36] Knipe, R.J., Jones, G. and Fisher, Q. (1998). Faulting, faults and fluid flow in hydrocarbon
reservoirs. An introduction. In: Jones, G., Fisher, Q.J. and Knipe, R.J. (eds) Faulting, fault
sealing and fluid flow in hydrocarbon reservoirs. Geological Society. London, Spec. Publi-
cations 147.
[37] Lewis, H. and Couples, G.D. (eds) (2007). The relationship between damage and localiza-
tion. Geol.Soc. Special Publication 289. Published by the Geological Society of London.
[38] IEAGHG (2015). Criteria of fault geomechanical stability during a pressure build up.
2015/04, April 2015. Tech. Rep. June, International Energy Agency Environmental Pro-
jects Ltd. (IEAGHG), Cheltenham, U.K.
[39] Sanz, P. F., Suvrat P. L., Searles, K.H., Hse, S-Y., Garzon, J.L., Burdette, J.A., Kline, W.E.,
Dale, B.A., and Hector, P.D., (2015). Geomechanical Analysis to Evaluate Production-
Induced Fault Reactivation at Groningen Gas Field. SPE-174942-MS.
[40] Wong, T.-f., H. Szeto and J. Zhang, (1992). Effect of loading path and porosity on the fail-
ure mode of porous rocks. Appl. Mech. Rev. 45, p. 281-293.
[41] Lewis, H. and Couples, G.D. (eds) (2007). The relationship between damage and localiza-
tion. Geol. Soc. Special Publication 289. Published by the Geological Society of London.
[42] Suckale, J. (2010). Moderate-to-large seismicity induced by hydrocarbon production. The
Leading Edge Vol. 29(3), p. 310-319.
[43] Hagoort, J: Aardbevingen in Groningen: Verleden en toekomst, 2015. Published on own
account on internet, referred to from an interview in “De Ingenieur”.
https://www.deingenieur.nl/uploads/media/553f33eea1332.pdf
[44] Santarelli, F.J., Tronvoll, J.T., Svennekjaer, M., Hernriksen, R. and Bratli, R.K. (1998). Res-
ervoir Stress Path: The Depletion and the Rebound, SPE/ISRM 47350.
The reports in this references list prepared by TNO can also be obtained using the following
TNO-link:
http://nlog.nl/nl/hazards/subsidence.html (NL) and
http://nlog.nl/en/hazards/subsidence.html (EN).

- 90 -
Appendix 1. Groningen Field
Figure A1.1: Groningen field Rotliegend top structure map.

- 91 -
Figure A1.2: Groningen field NW-SE cross-section (see Figure A1.1; approximately 7 times
vertically exaggerated).

- 92 -
Figure A1.3: Field map showing the outline of the Groningen field with locations of production
clusters, major pipelines, and locations of major towns and villages. Production
from the Loppersum clusters has been constrained to 3 bcm/a.

- 93 -
Figure A1.4: Topographical map with outline of the Groningen field, locations of production
clusters (ref. Figure A1.3) and epicentres of earthquakes measured between 1986
and 2000 (top) and measured from 2000 until mid-2015 (bottom). The colour and
size of the circles indicating the epicentres correspond to the earthquake magni-
tude. The location of the 2012 Huizinge earthquake (M 3.6) is marked with an ar-
row in the lower map.

- 94 -
The copyright of this document is vested in Shell Global Solutions International, B.V. The Hague, The Netherlands. All rights reserved. Neither the whole nor any part of this document may be reproduced, stored in any retrieval system or transmitted in any form or by any means (electronic, mechanical, reprographic, recording or otherwise) without the prior written consent of the copyright owner. Shell Global Solutions is a trading style used by a network of technology companies of the Shell Group.