
GPM Annual and Daily Precipitation Data for Real-Time Short ...
22
water Article GPM Annual and Daily Precipitation Data for Real-Time Short-Term Nowcasting: A Pilot Study for a Way Forward in Data Assimilation Kaiyang Wang 1 , Lingrong Kong 2 , Zixin Yang 1 , Prateek Singh 1 , Fangyu Guo 1 , Yunqing Xu 3 , Xiaonan Tang 1 and Jianli Hao 1, * Citation: Wang, K.; Kong, L.; Yang, Z.; Singh, P.; Guo, F.; Xu, Y.; Tang, X.; Hao, J. GPM Annual and Daily Precipitation Data for Real-Time Short-Term Nowcasting: A Pilot Study for a Way Forward in Data Assimilation. Water 2021, 13, 1422. https://doi.org/10.3390/w13101422 Academic Editors: Renato Morbidelli and David Dunkerley Received: 9 March 2021 Accepted: 6 May 2021 Published: 20 May 2021 Publisher’s Note: MDPI stays neutral with regard to jurisdictional claims in published maps and institutional affil- iations. Copyright: © 2021 by the authors. Licensee MDPI, Basel, Switzerland. This article is an open access article distributed under the terms and conditions of the Creative Commons Attribution (CC BY) license (https:// creativecommons.org/licenses/by/ 4.0/). 1 Department of Civil Engineering, Xi’an Jiaotong-Liverpool University, Suzhou 215123, China; [email protected] (K.W.); [email protected] (Z.Y.); [email protected] (P.S.); [email protected] (F.G.); [email protected] (X.T.) 2 Department of Planning, Wujiang Water Bureau, Wujiang District, Suzhou 215200, China; [email protected] 3 Department of Urban Planning and Design, Xi’an Jiaotong-Liverpool University, Suzhou 215123, China; [email protected] * Correspondence: [email protected] Abstract: This study explores the quality of data produced by Global Precipitation Measurement (GPM) and the potential of GPM for real-time short-term nowcasting using MATLAB and the Short- Term Ensemble Prediction System (STEPS). Precipitation data obtained by rain gauges during the period 2015 to 2017 were used in this comparative analysis. The results show that the quality of GPM precipitation has different degrees efficacies at the national scale, which were revealed at the performance analysis stage of the study. After data quality checking, five representative precipitation events were selected for nowcasting evaluation. The GPM estimated precipitation compared to a 30 min forecast using STEPS precipitation nowcast results, showing that the GPM precipitation data performed well in nowcasting between 0 to 120 min. However, the accuracy and quality of nowcasting precipitation significantly reduced with increased lead time. A major finding from the study is that the quality of precipitation data can be improved through blending processes such as kriging with external drift and the double-kernel smoothing method, which enhances the quality of nowcast over longer lead times. Keywords: rainfall; satellite precipitation; GPM; hydroclimatic changes; nowcasting; STEPS; Mexico 1. Introduction Precipitation is regarded as an essential component of global energy and water cycles, and it plays a significant role in the interactions between atmosphere, biosphere and hy- drosphere [1]. The measurement of precipitation not only provides essential information to weather forecasters and climate scientists but also to a wide range of decision-makers, including agriculturalists, hydrologists, industrialists and emergency managers [2]. There- fore, accurate estimation and prediction of precipitation is important for a wide range of applications, such as agricultural crop forecasting, monitoring freshwater resources and numerical weather prediction. In the last three decades, satellite measurement of precipitation has grown to be an uninterrupted, reliable and cost-effective source over large data-void areas [3]. In 1997, NASA sent the first dedicated meteorological precipitation satellite—the Tropical Rainfall Measurement Mission (TRMM) Multi-satellite Precipitation Analysis (TMPA)—with the National Space Development Agency (NASDA) to measure energy and precipitation exchange across tropical and subtropical areas of the world for 17 years (1997–2014) [4,5]. Motivated by the splendid success of the TRMM satellite, on 27 February 2014, its successor, the GPM Core Observatory (GPMCO) was launched by Water 2021, 13, 1422. https://doi.org/10.3390/w13101422 https://www.mdpi.com/journal/water
-
Upload
khangminh22 -
Category
Documents
-
view
1 -
download
0
Transcript of GPM Annual and Daily Precipitation Data for Real-Time Short ...

water
Article
GPM Annual and Daily Precipitation Data for Real-TimeShort-Term Nowcasting: A Pilot Study for a Way Forward inData Assimilation
Kaiyang Wang 1, Lingrong Kong 2, Zixin Yang 1, Prateek Singh 1 , Fangyu Guo 1, Yunqing Xu 3, Xiaonan Tang 1
and Jianli Hao 1,*
�����������������
Citation: Wang, K.; Kong, L.; Yang,
Z.; Singh, P.; Guo, F.; Xu, Y.; Tang, X.;
Hao, J. GPM Annual and Daily
Precipitation Data for Real-Time
Short-Term Nowcasting: A Pilot
Study for a Way Forward in Data
Assimilation. Water 2021, 13, 1422.
https://doi.org/10.3390/w13101422
Academic Editors: Renato Morbidelli
and David Dunkerley
Received: 9 March 2021
Accepted: 6 May 2021
Published: 20 May 2021
Publisher’s Note: MDPI stays neutral
with regard to jurisdictional claims in
published maps and institutional affil-
iations.
Copyright: © 2021 by the authors.
Licensee MDPI, Basel, Switzerland.
This article is an open access article
distributed under the terms and
conditions of the Creative Commons
Attribution (CC BY) license (https://
creativecommons.org/licenses/by/
4.0/).
1 Department of Civil Engineering, Xi’an Jiaotong-Liverpool University, Suzhou 215123, China;[email protected] (K.W.); [email protected] (Z.Y.);[email protected] (P.S.); [email protected] (F.G.); [email protected] (X.T.)
2 Department of Planning, Wujiang Water Bureau, Wujiang District, Suzhou 215200, China;[email protected]
3 Department of Urban Planning and Design, Xi’an Jiaotong-Liverpool University, Suzhou 215123, China;[email protected]
* Correspondence: [email protected]
Abstract: This study explores the quality of data produced by Global Precipitation Measurement(GPM) and the potential of GPM for real-time short-term nowcasting using MATLAB and the Short-Term Ensemble Prediction System (STEPS). Precipitation data obtained by rain gauges during theperiod 2015 to 2017 were used in this comparative analysis. The results show that the quality ofGPM precipitation has different degrees efficacies at the national scale, which were revealed at theperformance analysis stage of the study. After data quality checking, five representative precipitationevents were selected for nowcasting evaluation. The GPM estimated precipitation compared toa 30 min forecast using STEPS precipitation nowcast results, showing that the GPM precipitationdata performed well in nowcasting between 0 to 120 min. However, the accuracy and quality ofnowcasting precipitation significantly reduced with increased lead time. A major finding from thestudy is that the quality of precipitation data can be improved through blending processes such askriging with external drift and the double-kernel smoothing method, which enhances the quality ofnowcast over longer lead times.
Keywords: rainfall; satellite precipitation; GPM; hydroclimatic changes; nowcasting; STEPS; Mexico
1. Introduction
Precipitation is regarded as an essential component of global energy and water cycles,and it plays a significant role in the interactions between atmosphere, biosphere and hy-drosphere [1]. The measurement of precipitation not only provides essential informationto weather forecasters and climate scientists but also to a wide range of decision-makers,including agriculturalists, hydrologists, industrialists and emergency managers [2]. There-fore, accurate estimation and prediction of precipitation is important for a wide rangeof applications, such as agricultural crop forecasting, monitoring freshwater resourcesand numerical weather prediction. In the last three decades, satellite measurement ofprecipitation has grown to be an uninterrupted, reliable and cost-effective source over largedata-void areas [3]. In 1997, NASA sent the first dedicated meteorological precipitationsatellite—the Tropical Rainfall Measurement Mission (TRMM) Multi-satellite PrecipitationAnalysis (TMPA)—with the National Space Development Agency (NASDA) to measureenergy and precipitation exchange across tropical and subtropical areas of the world for17 years (1997–2014) [4,5]. Motivated by the splendid success of the TRMM satellite, on27 February 2014, its successor, the GPM Core Observatory (GPMCO) was launched by
Water 2021, 13, 1422. https://doi.org/10.3390/w13101422 https://www.mdpi.com/journal/water
Water 2021, 13, 1422 2 of 22
Japan Aerospace Exploration Agency (JAXA) and NASA to continue and improve satellite-based precipitation observations on a global scale [6]. Thanks to the other satellites, theCore satellite is possible to guarantee a covering region between 65◦ N and 65◦ S.
The GPM mission includes a constellation of nine satellites unified by the GPMCO asa reference standard for the other partner satellites [7]. The GPMCO contains an advanced13-channel passive microwave radiometer, and a GPM Microwave Imager (GMI) combinedwith a Ka/Ku-band Dual-frequency Precipitation Radar (DPR). Since this radar has twofrequencies that provides more accurate corrections for microwave rain attenuation, itunifies precipitation estimates as a benchmark [8]. Compared to the TRMM PrecipitationRadar (PR), the DPR Ka-band is more sensitive for high-latitude snowfall and light rainfall(sensitivity of PR and Ka-band is 0.5 mm/h and 0.2 mm/h, respectively) [9]. Therefore,GPM DPR can more accurately detect extreme precipitation and estimate its impact onglobal climate models, which is essential for exploring and understanding the globalwater cycle [10].
In late 2014, precipitation from Integrated Multi-satellite Retrievals for GPM (IMERG)were released to the public; this especially high-resolution precipitation product is nowavailable at the 30 min and 0.1◦ resolution in early mode (with a 4 h latency), late mode(with a 12 h latency) and final mode (with a 2.5 months latency), which run based onaccuracy and latency [11]. The early and late products are multi-satellite data. The finalrun is, instead, obtained taking advantage of a combination of information acquired fromsatellite and monthly rain gauges data. Huffman et al. [12] suggested that this productcan be regarded as the next generation of multi-sensor precipitation data and utilized fornear real-time flood risk monitoring applications. Currently, some studies have utilized theIMERG products to estimate snowfall [11,13]. The potential of data from IMERG for real-time short-term rainfall nowcasting and forecasting are less unexplored due to the lack ofreliable ground rain gauge observations. Therefore, the rainfall nowcasting and forecastingby IMERG data should be investigated with a view to improving the forecasting of extremerainfall events and assessing the potential of feeding this information into hydrologicalmodels, especially in regions where high-resolution precipitation data is not available.Gilewski and Nawalany [14] suggested that precipitation nowcasting is the generationof short-term (0–3 h) future precipitation distributions from a sequence of radar images,while Xinjian et al. [15] claimed that the goal of precipitation nowcasting is to predict thefuture rainfall intensity in a local region over a short period of time. Nowcasting modelsare based on the extrapolation of radar rainfall scans to track the motion of precipitationcells with a forecasting lead time of a few hours. Quantitative precipitation estimation andprecipitation nowcasting will help reduce or manage precipitation-related disasters such asflash-flooding [16], seasonal flooding [17], storms [18] and landslides [19]. Therefore, bothprecipitation measuring and predicting are significant for hydrology applications.
Using rain gauge data available from the Mexico Meteorological Services, this studyapplied a nowcasting model to compare the efficacy and reliability of precipitation datagenerated by GPM IMERG with ground data. The results provide valuable information, notonly for improving the processes of satellite precipitation retrieval but also for operators inmany relevant applications, from hydrological modelling and hazard research to climaticchange-based simulations such as for flash flood forecasting in urban areas. The aimof this study was to investigate whether real-time short-term (0–6 h) satellite rainfallmeasurements can be applied effectively for nowcasting and forecasting of precipitation(rainfall) in developing countries. The research objectives are in three-folds: (1) to determinethe efficacy and reliability of GPM precipitation compared to rain gauge data; (2) toassess the ability of nowcasting to forecast rainfall events with GPM rainfall; and (3) togather evidence to show that GPM precipitation data can be used for real-time short-term forecasting.
To achieve the objectives, the STEPS (Short Term Ensemble Prediction System) now-casting model was used to investigate the potential of GPM IMERG precipitation data andpredict short-term real-time precipitation (0–3 h). The short duration analysis is justified

Water 2021, 13, 1422 3 of 22
due to the fact that the resolution of weather radar is typically 1 km by 1 km, which is themost commonly used in nowcasting modelling. It was therefore necessary to use MATLABprojection for the GPM data in order to improve the accuracy of nowcasting results; thecode developed by Liguori and Rico-Ramirez [20] was used for this purpose. After dataprojection, the resolution of the GPM data was corrected from 10 km by 10 km to 5 kmby 5 km, which is the least resolution for GPM data without reducing the accuracy of thedata. Several representative precipitation events (i.e., heavy rainfall for a day) in Mexicowere then selected to simulate and nowcast precipitation. Finally, the performance ofprecipitation nowcasting was evaluated by calculating the errors between the observedprecipitation and the nowcast results.
2. Latest Developments
Several studies have assessed the quality of the rainfall products of GPM missionswhen estimating global precipitation and the performance of precipitation nowcasting. Atpresent, point measurements using a rain gauge and disdrometer [21,22], ground-basedweather radar [23] and satellite-based sensors [24] are the most widely used techniquesto measure and estimate precipitation. In most regions, tipping bucket rain gauges arefrequently utilized to measure precipitation. Several studies demonstrated that tippingbucket rain gauge measurements are the most reliable technique in terms of point groundmeasurements [25–27]. However, they cannot measure quantities of precipitation less than0.1 or 0.2 mm, depending on the size of the bucket [28]. Thus, depending on the intensityof rainfall measured, the tipping bucket rain gauges perform a temporal integration overa more or less long period. By contrast, ground weather radars have a large volumesample but present an indirect observation [23]. In terms of radar observations (also knownas a remote sensing instrument), the reflectivity of precipitation at a given altitude ismeasured to estimate precipitation. The ground weather radar is able to supply rainfallrate data with a fine spatiotemporal resolution, but it is hindered by several limitations.For instance, the poor data management and archiving, difficult image data processingand usage is limited for weather forecasting [29]. Although ground weather radar canprovide sound spatial resolutions to relatively large precipitation areas, the accuracy ofradar precipitation estimates is affected by several sources of uncertainties and errors. Forexample, the radar signal attenuation and stability of radar calibration can affect the radarreflectivity measurement because of contamination of heavy precipitation by range effectsor non-meteorological echoes (e.g., ground clutter) [30].
For satellite precipitation estimates, sensors onboard low-orbiting satellites are the onlyinstruments able to retrieve global and homogeneous measurements of precipitation [31].After the satellite measurement of radiances, the approaches applied to derive precipitationfrom radiances have advanced from Infrared (IR)- and Visible (VIS)-based methods to activeand passive Microwave (MW) techniques and merged MW and IR methods [31]. In termsof active microwave sensors, Ku-band TRMM Precipitation Radar (PR) was the first space-borne precipitation radar and has operated since 1997 [32]. The goal of TRMM satellitewas to measure moderate to heavy precipitation to give a better understanding of theprecipitation distribution on Earth and conduct near-real-time precipitation products. Sincethen, many methods such as [33–35] have built upon the success of the TRMM, culminatingin the GPM mission. The Integrated Multi-Satellite Retrievals for GPM (IMERG) is the multi-satellite precipitation algorithm for GPM, which merges sparse precipitation estimates fromIR-based geosynchronous satellites, all constellation microwave sensors and monthly gaugeprecipitation data [29]. NASA Goddard Earth Sciences (GES) Data and Information ServicesCenter (DISC) produced the latest GPM IMERG version 5 (IMERG V5) precipitation dataset,which was employed in this study.
Compared to TRMM, GPM has improved temporal and spatial resolution, as well as amore efficient minimum latency time [31,36–38]. For example, Prakash et al. [36] comparedboth the TRMM TMPA (V7) and GPM IMERG (V03) with the rain gauge measurementsover India. Their findings demonstrates that GPM provide more accurate information
Water 2021, 13, 1422 4 of 22
about extreme rainfall events compared to TRMM. The IMERG data also presented anotable improvement over TMPA during the comparison with the rain gauge data inmountainous areas. Arshad et al. [37] compared both the GPM IMERG V05 data and theTRMM 3B42 V7 data with the rain gauge measurements over Pakistan. This work revealedthat the performance of the IMERG final product showed the best results in the areas ofhigher annual average rainfall in terms of statistical indices (i.e., FAR, POD and CSI).
From Table 1 it can be obtained that the GPM satellite born precipitation data areavailable as near-real-time data available with a 4-h latency from acquisition and post-real-time research data, which are processed within 2.5 months.
Table 1. The key characteristics of GPM and TRMM.
SatelliteMission
SpatialResolution
TemporalResolution Coverage Minimum
Latency Period Algorithm
GPM ‘Early’
0.1◦ 0.5 h 65◦ S–65◦ N
4 h
2015-present IMERGGPM ‘Late’ 12 h
GPM ‘Final’ 2.5 months
TRMM 0.25◦ 3 h 50◦ S–50◦ N 9 h 1997–2015 ProbabilityMatching
3. Methodology and Study Area
To evaluate the GPM IMERG, several steps were carried out, which are presented inFigure 1 below. The process started with the preparation of the rain gauge precipitationmeasurement data and the GPM data processing and preparation. The following stepconsisted of data comparison, which involved four major steps carried out by MATLABprocessing [39], the last step of which was precipitation nowcasting of the observed GPMdata by using the STEPS model. The STEPS nowcasting model is an available advancedQuantitative Precipitation Forecast (QPF) system, which was developed in the cooperationof the Australian Bureau of Meteorology and the UK MetOffice. A detailed mathematicaldescription of the STEPS model can be found in [40,41]. The model generates ensembles ofrainfall nowcasts by employing both the extrapolation of radar images and the downscaledrainfall output of Numerical Weather Prediction (NWP) models. The basis behind STEPSis to represent the uncertainty caused by the unpredictable rainfall growth and decayprocesses by adding stochastic perturbations to the deterministic extrapolation of radarimages. The stochastic perturbations are designed to account for the unpredictable rainfallgrowth and decay processes and to reproduce the dynamic scaling of rainfall fields. Somestudies have proved this model is reliable in several applications, such as prediction offlows in the sewer system [42] and hydrological forecasting in catchment [43].
The study area of this project is the whole of mainland Mexico, which is located at23.626◦ N and 102.538◦ W in the southern portion of North America and covers a landsurface area of 1964 million square kilometers [44]. The climate in Mexico is determinedby different factors, such as latitude, elevation and ocean currents. As a result of itsgeographical location, the northern part of the country is located in a temperate area,while the southern part is in the inter-tropical area of the globe. Nearly two-thirds of theterritory is considered semi-arid or arid, with annual precipitation lower than 500 mm,whereas one third is regarded as humid (the southeast), with precipitation of over 2000 mmper year [44]. Figure 2 shows the precipitation distribution in Mexico from 2010 to 2015observed by ground weather radar, with more precipitation in the south of Mexico andless in the north during this period. The west coast of Mexico has a relatively low intenserainfall, while the east coast of Mexico has a relatively high intense rainfall, the detailscan be referred from [45]. This graph was used in this study as a reference for the GPMrainfall observations comparison. In most parts of Mexico, precipitation is more intense inthe summertime when there is often torrential rain. Figure 3 presents the monthly averagerainfall and temperature in the period of 1943 to 2018 over Mexico.

Water 2021, 13, 1422 5 of 22Water 2021, 13, x FOR PEER REVIEW 5 of 22
Figure 1. Flowchart of the evaluation process of the project.
The study area of this project is the whole of mainland Mexico, which is located at
23.626° N and 102.538° W in the southern portion of North America and covers a land
surface area of 1964 million square kilometers [44]. The climate in Mexico is determined
by different factors, such as latitude, elevation and ocean currents. As a result of its geo-
graphical location, the northern part of the country is located in a temperate area, while
the southern part is in the inter-tropical area of the globe. Nearly two-thirds of the territory
is considered semi-arid or arid, with annual precipitation lower than 500 mm, whereas
one third is regarded as humid (the southeast), with precipitation of over 2000 mm per
year [44]. Figure 2 shows the precipitation distribution in Mexico from 2010 to 2015 ob-
served by ground weather radar, with more precipitation in the south of Mexico and less
in the north during this period. The west coast of Mexico has a relatively low intense rain-
fall, while the east coast of Mexico has a relatively high intense rainfall, the details can be
referred from [45]. This graph was used in this study as a reference for the GPM rainfall
observations comparison. In most parts of Mexico, precipitation is more intense in the
summertime when there is often torrential rain. Figure 3 presents the monthly average
rainfall and temperature in the period of 1943 to 2018 over Mexico.
Evaluation Process
Data Acquisition
Ground Measurement-Rain
gauges (SMN website)
Satellite measurements-GPM data (NASA website)
Data processing
Ground Measurements Data
Preparation
GPM Data Processing and
preparation
Data Comparison
Year-based comparison
Daily-based comparison
Station-based comparison
Nowcasting Process
Events selection
Data projection
STEPS model
Error evaluation
Figure 1. Flowchart of the evaluation process of the project.
Water 2021, 13, x FOR PEER REVIEW 6 of 22
Figure 2. Maps showing the distribution of mean annual precipitation (mm) (2010–2015) (source: National Water Com-
mission (CONAGUA)).
Figure 3. The monthly average rainfall and temperature in Mexico (1943–2018) (source: National
Water Commission (CONAGUA)).
Rain gauge data was applied to provide a ground-based precipitation reference for
GPM satellite data in this study. All rain gauge data in Mexico was collected through the
online database provided by the Mexico National Meteorological Service website
(https://smn.conagua.gob.mx/es/) accessed on 18 July 2019, which supply meteorological
information and provides a quality-controlled dataset. The dataset consists of 2829 tipping
bucket rain gauges, each with a temporal resolution of 24 h (UTC-6). From Figure 4 it can
be observed that the distribution of rain gauges is uneven, which shows that the stations
are accumulated densely in the south and spatially in the north. The reason for this is that
Figure 2. Maps showing the distribution of mean annual precipitation (mm) (2010–2015) (source: National Water Commis-sion (CONAGUA)).

Water 2021, 13, 1422 6 of 22
Water 2021, 13, x FOR PEER REVIEW 6 of 22
Figure 2. Maps showing the distribution of mean annual precipitation (mm) (2010–2015) (source: National Water Com-
mission (CONAGUA)).
Figure 3. The monthly average rainfall and temperature in Mexico (1943–2018) (source: National
Water Commission (CONAGUA)).
Rain gauge data was applied to provide a ground-based precipitation reference for
GPM satellite data in this study. All rain gauge data in Mexico was collected through the
online database provided by the Mexico National Meteorological Service website
(https://smn.conagua.gob.mx/es/) accessed on 18 July 2019, which supply meteorological
information and provides a quality-controlled dataset. The dataset consists of 2829 tipping
bucket rain gauges, each with a temporal resolution of 24 h (UTC-6). From Figure 4 it can
be observed that the distribution of rain gauges is uneven, which shows that the stations
are accumulated densely in the south and spatially in the north. The reason for this is that
Figure 3. The monthly average rainfall and temperature in Mexico (1943–2018) (source: National Water Commission(CONAGUA)).
Rain gauge data was applied to provide a ground-based precipitation reference forGPM satellite data in this study. All rain gauge data in Mexico was collected throughthe online database provided by the Mexico National Meteorological Service website(https://smn.conagua.gob.mx/es/) accessed on 18 July 2019, which supply meteorologicalinformation and provides a quality-controlled dataset. The dataset consists of 2829 tippingbucket rain gauges, each with a temporal resolution of 24 h (UTC-6). From Figure 4 it canbe observed that the distribution of rain gauges is uneven, which shows that the stationsare accumulated densely in the south and spatially in the north. The reason for this isthat the arrangement of rain gauges is based on the levels of precipitation density, so thatthere are more rain gauge stations in dense precipitation areas. This therefore reflects thatsouthern Mexico receives more rainfall than the north. However, due to the frequencyof measurement errors, traditional ground-based rain gauge measurements are not oftenregarded as a representative over large and high precipitation intensity areas, particularlyat fine temporal resolutions. By contrast, satellite-based precipitation measurement has thepotential to improve the understanding and forecasting of hydrological systems.
In this study, the GPM-IMERG V5 near-real-time (NRT) run product at 0.1◦ spatialresolution (around 10 km but varies from the equator to the poles) and 30 min tempo-ral resolution were used. The data were available in an RT-H5 file format (RT indicatesreal-time and H5 represents an HDF5 file, respectively) and downloaded from the NASAPrecipitation Measurement Program website (http://www.pmm.nasa.gov) accessed on24 July 2019. In addition, the dataset was translated to the daily time period as to corre-spond with the rain gauge data set as only daily gauge precipitation data were available.Therefore, a daily period between 8 am to 8 pm local time (UTC-6) was created withinthe dataset by the MATLAB package. The data period collection of rain gauges and GPMIMERG is shown in Table 2 below.

Water 2021, 13, 1422 7 of 22
Figure 4. Distribution of rain gauge stations in Mexico (source: National Water Commission (CONAGUA)).
Table 2. Data period of rain gauges and GPM.
Observations Start End Time Period
Rain gauges 1 June 1957 1 March 2018 24 hGPM 1 June 2014 1 July 2018 24 h
From the table, it can be seen that the same period of data collection of rain gauges andGPM is from 1 June 2014 to 1 March 2018 and the full-year data for both of them are from2015 to 2017. Therefore, the precipitation data from this period of three years (2015–2017)was used in this analysis. Since the collected data is unstructured from the website, theprocessing the raw data into structured data takes considerable time for post processing.
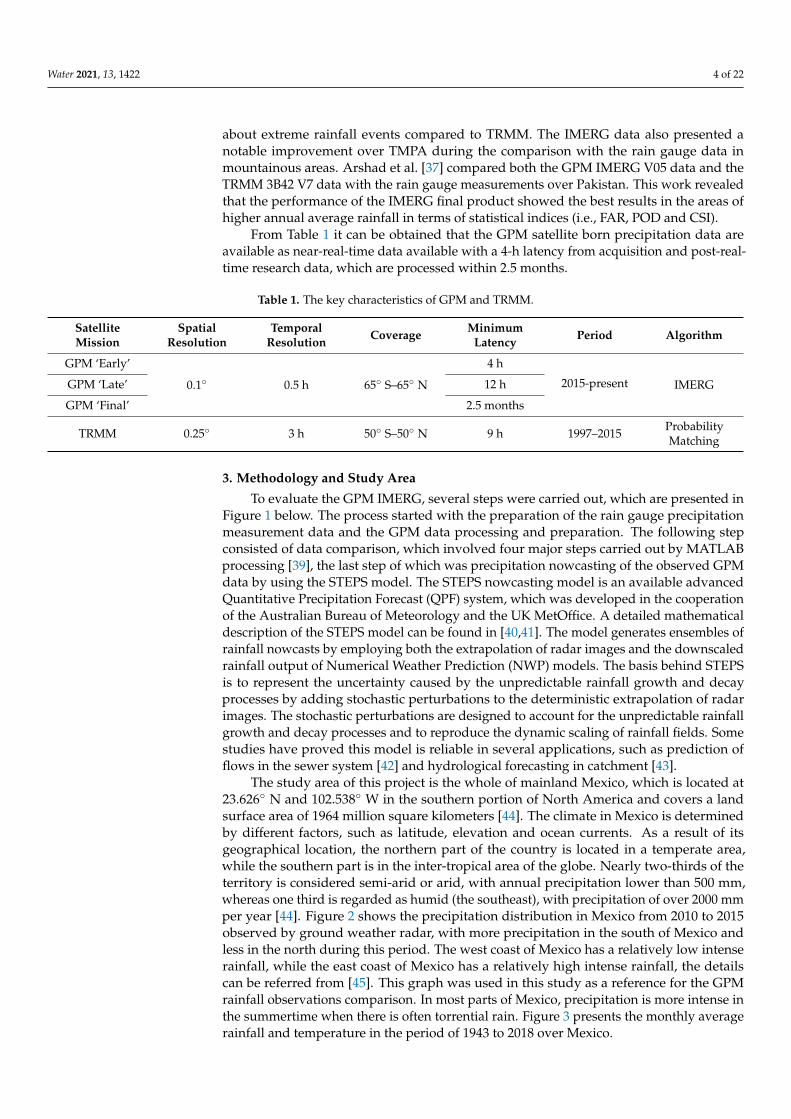
The distribution of mean annual precipitation in Mexico from 2010 to 2015 accordingto the National Water Commission (Figure 2), which was estimated by weather radar. Inorder to give a broad understanding of the quality of the GPM product for measuringprecipitation over Mexico, Figure 5 was plotted by MATLAB to present the distribution ofthe mean annual precipitation estimated using GPM data over a three-year period from2015 to 2017. By comparing these two graphs, it can be observed that the precipitationdistribution estimated by GPM is quite close to the radar precipitation estimation, and theGPM is proven to be able to duplicate the spatial precipitation patterns while showing onlyslight overestimates in coastal areas. The preliminary analysis indicates that the quality ofthe GPM data performs well at the national scale.
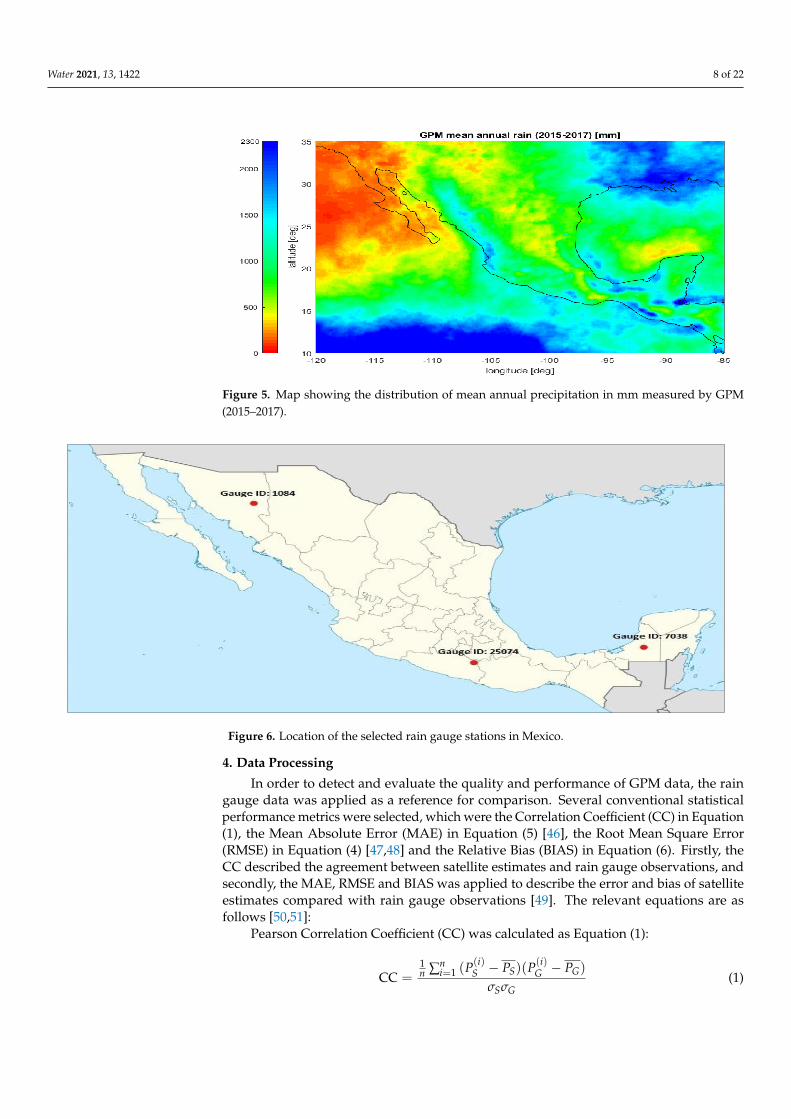
After evaluating the quality of GPM data at the annual and national scales, it wasfound that the GPM presented a relatively high agreement with rain gauges. It needs to benoted that the rain gauge data with zero was ignored in this study. The next stage of thestudy investigated the quality of GPM data at the daily scale by using single and multiplegauges. For single gauges, three single rain gauge stations were chosen with differentelevations above sea level based on two criteria: (a) the elevation is typical over Mexico, and(b) it has continuous data throughout the three-year period 2015–2017. Figure 6 presentsthe location of the selected three rain gauges, which are gauge 1084 at 2032 m elevation,gauge 25074 at 1472 m elevation and gauge 7038 at 226 m elevation. In addition, theclimate around gauge 1084 has a dry winter, pleasantly warm during the day and a veryhot summer. For gauge 25074, the climate is hot all year round, but the dry season, fromNovember to May, is sunny and it almost never rains. For gauge 7038, the least rainyperiod runs from February to April, and the driest month is April.
Water 2021, 13, 1422 8 of 22
Figure 5. Map showing the distribution of mean annual precipitation in mm measured by GPM(2015–2017).
Water 2021, 13, x FOR PEER REVIEW 8 of 22
of the mean annual precipitation estimated using GPM data over a three-year period from
2015 to 2017. By comparing these two graphs, it can be observed that the precipitation
distribution estimated by GPM is quite close to the radar precipitation estimation, and the
GPM is proven to be able to duplicate the spatial precipitation patterns while showing
only slight overestimates in coastal areas. The preliminary analysis indicates that the qual-
ity of the GPM data performs well at the national scale.
Figure 5. Map showing the distribution of mean annual precipitation in mm measured by GPM
(2015–2017).
After evaluating the quality of GPM data at the annual and national scales, it was
found that the GPM presented a relatively high agreement with rain gauges. It needs to
be noted that the rain gauge data with zero was ignored in this study. The next stage of
the study investigated the quality of GPM data at the daily scale by using single and mul-
tiple gauges. For single gauges, three single rain gauge stations were chosen with different
elevations above sea level based on two criteria: (a) the elevation is typical over Mexico,
and (b) it has continuous data throughout the three-year period 2015–2017. Figure 6 pre-
sents the location of the selected three rain gauges, which are gauge 1084 at 2032 m eleva-
tion, gauge 25074 at 1472 m elevation and gauge 7038 at 226 m elevation. In addition, the
climate around gauge 1084 has a dry winter, pleasantly warm during the day and a very
hot summer. For gauge 25074, the climate is hot all year round, but the dry season, from
November to May, is sunny and it almost never rains. For gauge 7038, the least rainy pe-
riod runs from February to April, and the driest month is April.
Figure 6. Location of the selected rain gauge stations in Mexico. Figure 6. Location of the selected rain gauge stations in Mexico.
4. Data Processing
In order to detect and evaluate the quality and performance of GPM data, the raingauge data was applied as a reference for comparison. Several conventional statisticalperformance metrics were selected, which were the Correlation Coefficient (CC) in Equation(1), the Mean Absolute Error (MAE) in Equation (5) [46], the Root Mean Square Error(RMSE) in Equation (4) [47,48] and the Relative Bias (BIAS) in Equation (6). Firstly, theCC described the agreement between satellite estimates and rain gauge observations, andsecondly, the MAE, RMSE and BIAS was applied to describe the error and bias of satelliteestimates compared with rain gauge observations [49]. The relevant equations are asfollows [50,51]:
Pearson Correlation Coefficient (CC) was calculated as Equation (1):
CC =1n ∑n
i=1 (P(i)S − PS)(P(i)
G − PG)
σSσG(1)
Water 2021, 13, 1422 9 of 22
σS =
√1n
n
∑i=1
(P(i)S − PS) (2)
σG =
√1n
n
∑i=1
(P(i)G − PG) (3)
The Root Mean Square Error (RMSE) was obtained by Equation (4) as:
RMSE =
√√√√∑ni=1 (P(i)
S − P(i)G )
2
n(4)
The Mean Absolute Error (MAE) was obtained by Equation (5) as:
MAE =∑n
i=1
∣∣∣P(i)S − P(i)
G
∣∣∣n
(5)
The GPM product overestimates precipitation amounts if MAE value higher than 1,otherwise, the satellite product underestimates the precipitation.
The Relative Bias (BIAS) was obtained by Equation (6) as:
BIAS =∑n
i=1 (P(i)S − P(i)
G )
∑ni=1 (P(i)
G )× 100% (6)
where PG and PS represent the actual precipitation value provided by rain gauges andprecipitation estimation provided by the satellite product, respectively. n is regarded as thenumber of observations. σS and σG are standard deviations of GPM satellite precipitationand standard deviations of rain gauge precipitation, respectively.
In addition, in terms of probabilistic statistical indices, the probability of detection(POD), the critical success index (CSI) and the false alarm ratio (FAR) was applied todescribe the eventuality of GPM satellite precipitation estimates. POD provides the fractionof precipitation events that the satellite distinguishes among all the actual precipitationevents, and FAR provides the fraction of unreal events among all the events GPM satellitesdetect [49]. The CSI was essentially obtained by a function of POD and FAR. Theseequations were as follows [6,52]:
The Probability of Detection (POD) as Equation (7) as:
POD =n11
n11 + n01(7)
The False Alarm Ration (FAR):
FAR =n10
n11 + n10(8)
The Critical Success Index (CSI):
CSI =n11
n11 + n01 + n10(9)
where n11 represents precipitation observed by the rain gauge and GPM satellite simulta-neously. n10 is precipitation observed by the GPM satellite but not observed by the raingauge, and n01 is converse to n10. The perfect values of the evaluation metrics are presentedin Table 3 below [38,49]. Moreover, since the expression for precipitation intensity in thisstudy is the collecting of precipitation over a consistent time period, the unit of precipitationis ‘mm’ instead of ‘mm/h’.

Water 2021, 13, 1422 10 of 22
Table 3. The range and perfect values of statistical performance measures.
Statistical Metrics Unit Perfect Value
Correlation Coefficient (CC) N/A 1Root Mean Square Error (RMSE) mm 0
Mean Absolute Error (MAE) mm 0Relative Bias (BIAS) N/A 1
Probability of Detection (POD) N/A 1False Alarm Ration (FAR) N/A 0
Critical Success Index (CSI) N/A 1
5. Results and Discussion5.1. Annual Precipitation
To explore the quality of GPM precipitation data, a comparison between the estimatesfrom rain gauges and GPM was carried out based on data collected from 2015 to 2017.Figures 7 and 8 show the scatterplots of GPM IMERG satellite precipitation versus raingauge data at annual scales over Mexico from 2015 to 2017.
Figure 7. Comparison of the precipitation between GPM satellite and rain gauges in (a) 2015; (b) 2016; and (c) 2017 atannual scale.

Water 2021, 13, 1422 11 of 22
Water 2021, 13, x FOR PEER REVIEW 12 of 22
To summarize, the performance of the GPM IMERG precipitation product is satisfac-
tory at both annual and national scales but shows a slight underestimation due to most
precipitation having happened in low-altitude sites or mistaken precipitation measure-
ments by rain gauges.
(a) (b)
(c) (d)
(e) (f)
Figure 8. Cont.

Water 2021, 13, 1422 12 of 22Water 2021, 13, x FOR PEER REVIEW 13 of 22
(g) (h)
(i)
Figure 8. Comparisons of the daily precipitation for a single gauge between GPM and single gauge (a) gauge 1084 (b)
gauge 7038 (c) gauge 25074 in 2015 (a–c); (d) gauge 1084 (e) gauge 7038 (f) gauge 25074 in 2016 (d–f); and (g) gauge 1084
(h) gauge 7038 (i) gauge 25074 in 2017 (g–i), respectively.
(a) (b)
Figure 9. Mean annual precipitation measured by (a) rain gauges and (b) GPM (2015-2017).
Figure 8. Comparisons of the daily precipitation for a single gauge between GPM and single gauge (a) gauge 1084 (b) gauge7038 (c) gauge 25074 in 2015 (a–c); (d) gauge 1084 (e) gauge 7038 (f) gauge 25074 in 2016 (d–f); and (g) gauge 1084 (h) gauge7038 (i) gauge 25074 in 2017 (g–i), respectively.
As can be observed, the conventional evaluation metrics are also indicated in thesefigures, and all the evaluation results are presented in Table 4. As mentioned before, thescale of the GPM data was projected into 5 km by 5 km since the STEPS model can processthe data in the range from 5 km by 5 km to 1 km by 1 km. In theory, each graph should have2829 points (one point for each station). As expected, GPM showed a relatively high degreeof agreement with rain gauges at annual scales, because the values of CC are close to 1 (0.91,0.88 and 0.90), which meets the finds by Libertino et al. [53] Similar study obtained theclose CC results. However, there are significant gaps in the data points of 2017, as shownin Figure 7c, because the precipitation data for rain gauges in 2017 were missing for somegauge stations (perhaps due to maintenance). The RMSE for 2017 is therefore significantlylower than for the previous two years. The values of RMSE are 416.29 mm and 406.79 mmin 2015 and 2016, respectively. Furthermore, the GPM shows a slight underestimationof precipitation according to the BIAS value, which means that GPM generated negativeerrors (bias < 0); the greater the BIAS value is from 1, the more biased the data is. Thus, theBIAS is shown to have decreased from −4.01% to −8.63% between 2015 and 2017, whichindicates the data for 2017 is more biased, and GPM is underestimating more. This maybecause the GPM is not sensitive to light precipitation. In addition, the values of MAEfluctuated from 0.29 to 0.33 for the three years, with the lowest value in 2016 and the highestin 2017. In terms of probabilistic statistical evaluation metrics, the POD (0.73 to 0.86), FAR(0.19 to 0.25) and CSI (0.55 to 0.73) are very satisfying, indicating that GPM IMERG can
Water 2021, 13, 1422 13 of 22
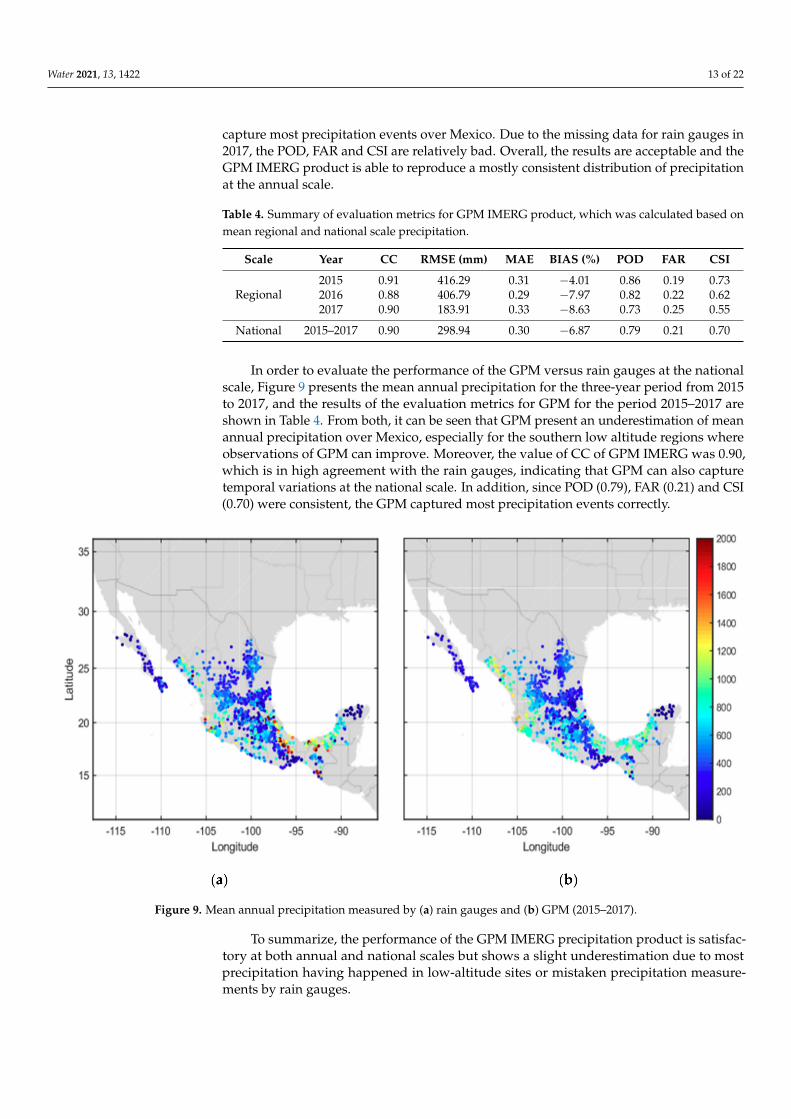
capture most precipitation events over Mexico. Due to the missing data for rain gauges in2017, the POD, FAR and CSI are relatively bad. Overall, the results are acceptable and theGPM IMERG product is able to reproduce a mostly consistent distribution of precipitationat the annual scale.
Table 4. Summary of evaluation metrics for GPM IMERG product, which was calculated based onmean regional and national scale precipitation.
Scale Year CC RMSE (mm) MAE BIAS (%) POD FAR CSI
Regional2015 0.91 416.29 0.31 −4.01 0.86 0.19 0.732016 0.88 406.79 0.29 −7.97 0.82 0.22 0.622017 0.90 183.91 0.33 −8.63 0.73 0.25 0.55
National 2015–2017 0.90 298.94 0.30 −6.87 0.79 0.21 0.70
In order to evaluate the performance of the GPM versus rain gauges at the nationalscale, Figure 9 presents the mean annual precipitation for the three-year period from 2015to 2017, and the results of the evaluation metrics for GPM for the period 2015–2017 areshown in Table 4. From both, it can be seen that GPM present an underestimation of meanannual precipitation over Mexico, especially for the southern low altitude regions whereobservations of GPM can improve. Moreover, the value of CC of GPM IMERG was 0.90,which is in high agreement with the rain gauges, indicating that GPM can also capturetemporal variations at the national scale. In addition, since POD (0.79), FAR (0.21) and CSI(0.70) were consistent, the GPM captured most precipitation events correctly.
Figure 9. Mean annual precipitation measured by (a) rain gauges and (b) GPM (2015–2017).
To summarize, the performance of the GPM IMERG precipitation product is satisfac-tory at both annual and national scales but shows a slight underestimation due to mostprecipitation having happened in low-altitude sites or mistaken precipitation measure-ments by rain gauges.

Water 2021, 13, 1422 14 of 22
5.2. Daily Precipitation
Figure 8a–i show the daily precipitation distributions for the chosen gauge stationsfor 2015–2017, respectively. Plots for each gauge should have 365 points in theory (onefor each day of the year). However, some plots have fewer points than this becauseof the disproportionate temporal precipitation patterns in Mexico. Additionally, due tomost precipitation falling in the summertime, there are many low values of precipitationthroughout the rest of year, which is not easily visible on the graphs.
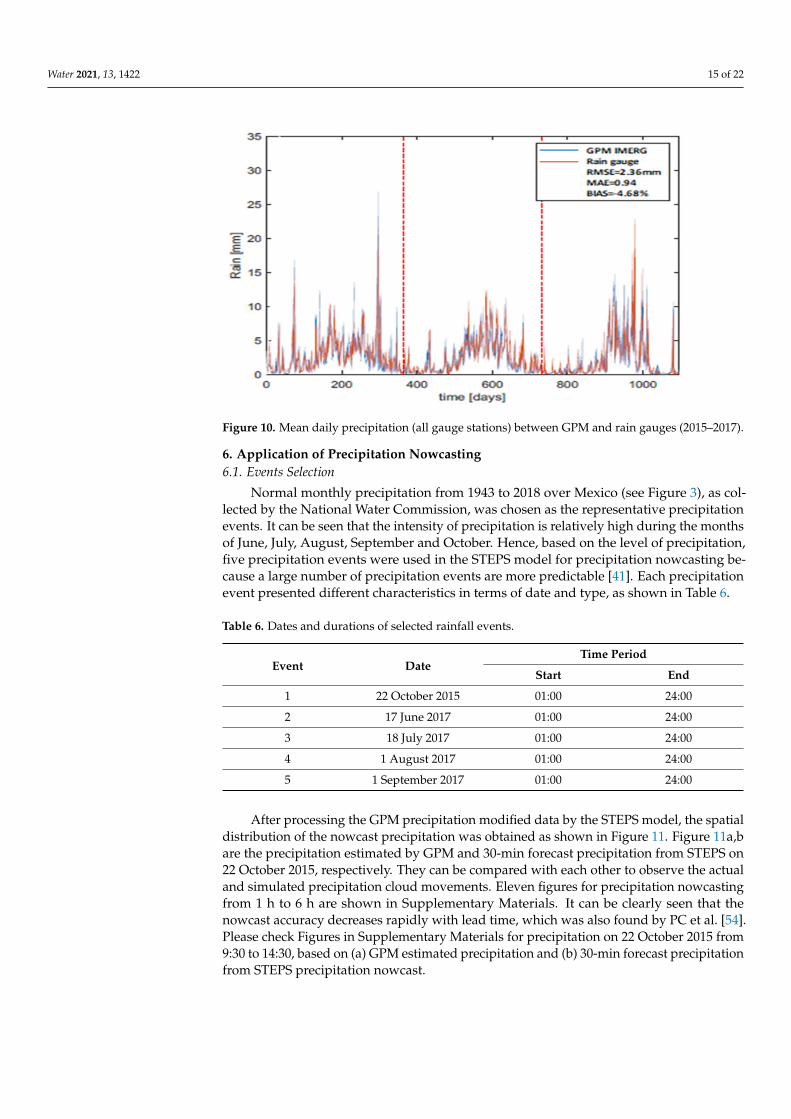
For gauge 1084 (Figure 8a,d,g), it can be observed that the values of CC (around 0.86)are high, which indicates that the precipitation data of GPM IMERG and rain gauges werein relatively high agreement compared to the other two single gauge stations. However,the CC values of gauge 25074 (Figure 8c,f,i) are relatively low at around 0.65. This canbe explained by the fact that the precipitation intensity is high in that region, which cancause the measurement errors of surrounding rain gauges and result in a low agreementbetween GPM and gauge data. A similar study [52] was conducted in the Yangtze Riverbasin at a daily scale, presenting a low CC value (0.44) between IMERG and rain gaugedata. Furthermore, both of the values of RMSE and MAE for three gauges are acceptable inTable 5, which are mean value of 8.2 mm and 1.12, respectively. In terms of the values ofBIAS, most of the values are positive, which indicate that the GPM precipitation productoverestimated the precipitation, especially for gauge 7038. Nevertheless, the results showthat the GPM precipitation measurements underestimated the precipitation at the nationaland annual scales. The reason may because the precipitation intensity was relatively highon that day and the wind flow may have impacted the measurement of precipitation byrain gauges, a phenomenon revealed by the literature review. Thus, the precipitationexceeded the capability of rain gauge measurement, which resulted in the instrument error.For the probabilistic statistical indices (POD, FAR and CSI), the values varied by about0.75–0.89, 0.21–0.31 and 0.68–0.73, respectively. Based on the results, it was found thatthe performance of the GPM IMERG precipitation product is decent at the daily scale.Moreover, in order to compare the precipitation data of GPM and rain gauges more clearly,Figure 10 was plotted to show the mean daily precipitation between GPM and rain gaugesduring the period of 2015–2017. Note that the red dash line indicates a year break. Fromthe plot, it is clearly seen that the GPM and rain gauge profiles are in good agreement. Thevalue of BIAS is −4.68%, so the GPM precipitation product shows a slight underestimation,and the values of RMSE and MAE are good at 2.36 mm and 0.94, respectively. The dataquality of the GPM precipitation product is therefore high at the daily scale.
Table 5. Summary of evaluation metrics for GPM IMERG products at daily scale for single rain gauges.
Gauge ID Elevation (m) Time CC RMSE (mm) MAE BIAS (%) POD FAR CSI
1084 2032
2015 0.82 7.27 0.76 −13.3 0.89 0.21 0.742016 0.80 4.55 0.97 26.4 0.87 0.23 0.712017 0.94 4.82 0.78 4.9 0.91 0.20 0.77
Average 0.86 5.55 0.84 6.0 0.89 0.21 0.74
7038 226
2015 0.79 10.10 1.21 21.5 0.78 0.28 0.712016 0.57 11.18 1.21 10.7 0.85 0.24 0.762017 0.84 8.94 0.98 6.8 0.81 0.26 0.72
Average 0.73 10.07 1.13 13.0 0.81 0.26 0.73
25074 1472
2015 0.65 13.79 1.53 −19.6 0.74 0.31 0.692016 0.56 13.28 1.51 3.91 0.70 0.33 0.642017 0.74 6.17 0.97 −2.3 0.80 0.28 0.70
Average 0.65 11.08 1.34 −5.99 0.75 0.31 0.68
Water 2021, 13, 1422 15 of 22
Figure 10. Mean daily precipitation (all gauge stations) between GPM and rain gauges (2015–2017).
6. Application of Precipitation Nowcasting6.1. Events Selection
Normal monthly precipitation from 1943 to 2018 over Mexico (see Figure 3), as col-lected by the National Water Commission, was chosen as the representative precipitationevents. It can be seen that the intensity of precipitation is relatively high during the monthsof June, July, August, September and October. Hence, based on the level of precipitation,five precipitation events were used in the STEPS model for precipitation nowcasting be-cause a large number of precipitation events are more predictable [41]. Each precipitationevent presented different characteristics in terms of date and type, as shown in Table 6.
Table 6. Dates and durations of selected rainfall events.
Event DateTime Period
Start End
1 22 October 2015 01:00 24:00
2 17 June 2017 01:00 24:00
3 18 July 2017 01:00 24:00
4 1 August 2017 01:00 24:00
5 1 September 2017 01:00 24:00
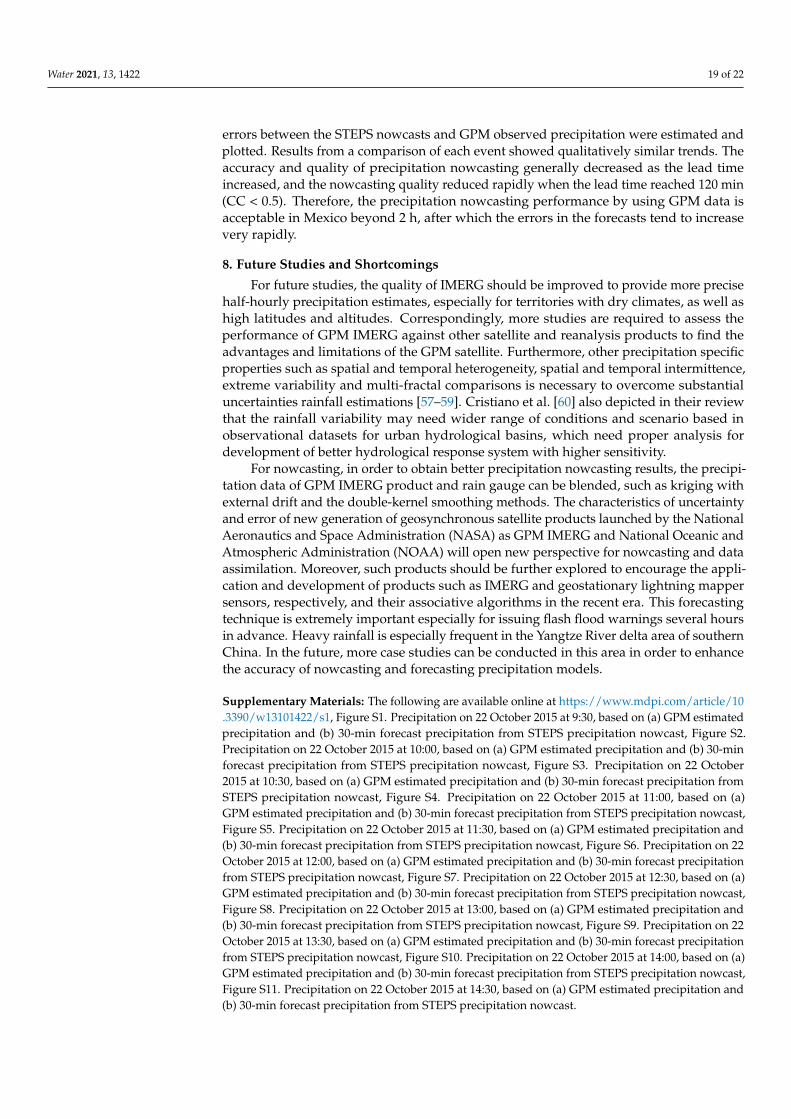
After processing the GPM precipitation modified data by the STEPS model, the spatialdistribution of the nowcast precipitation was obtained as shown in Figure 11. Figure 11a,bare the precipitation estimated by GPM and 30-min forecast precipitation from STEPS on22 October 2015, respectively. They can be compared with each other to observe the actualand simulated precipitation cloud movements. Eleven figures for precipitation nowcastingfrom 1 h to 6 h are shown in Supplementary Materials. It can be clearly seen that thenowcast accuracy decreases rapidly with lead time, which was also found by PC et al. [54].Please check Figures in Supplementary Materials for precipitation on 22 October 2015 from9:30 to 14:30, based on (a) GPM estimated precipitation and (b) 30-min forecast precipitationfrom STEPS precipitation nowcast.

Water 2021, 13, 1422 16 of 22
Figure 11. Precipitation on 22 October 2015 at 9:00, based on (a) GPM estimated precipitation and (b) 30-min forecastprecipitation from STEPS precipitation nowcast.
6.2. Error Analysis
The RMSE, MAE, CC and BIAS were calculated between STEPS nowcast and GPMprecipitation data at different lead times for each event, the profiles of which are shown inFigure 12a–d with their mean value lead times presented in Table 7. The average RMSE andMAE values between STEPS nowcast and GPM for five events during the whole periodwere obtained (7.1 mm and 4.2 mm, respectively), which indicate the errors related to theestimation of GPM precipitation. The results demonstrate that the errors obtained fromthe nowcast data are relatively small but increase with growing lead time, and that theerrors of RMSE and MAE increase as the lead time increases. For CC and BIAS, both ofthem decreased with the increased lead time, and the accuracy of precipitation nowcastingdecreases as the lead time grows, which concurs with finding of a previous study [55].Overall, the trend of nowcast precipitation decreases as the lead time increases.
Table 7. Summary of evaluation metrics for GPM IMERG versus nowcasts results along thelead times.
Lead Times RMSE MAE CC BIAS
30 3.69 1.91 0.68 0.8860 4.50 2.20 0.61 0.8590 4.80 2.69 0.56 0.84
120 5.93 3.71 0.50 0.82150 6.17 4.96 0.44 0.79180 5.92 3.90 0.42 0.78210 6.44 4.75 0.38 0.78240 6.57 4.98 0.35 0.74270 6.85 4.24 0.32 0.75300 7.20 5.47 0.27 0.76330 7.77 5.96 0.24 0.73360 10.31 5.78 0.20 0.72
In order to investigate the variability of errors, box plots were produced as presentedin Figure 13a–d. Box plots of errors of the GPM IMERG product provide details of theaccuracy of nowcasting. The lower and upper edges of the central box are the third (75%)and first (25%) quantiles that represent the Interquartile Range (IQR), as the central insideband and cross sign represents the median and mean values, respectively [56].

Water 2021, 13, 1422 17 of 22Water 2021, 13, x FOR PEER REVIEW 17 of 22
(a) (b)
(c) (d)
Figure 12. Summary of (a) root mean square error; (b) mean absolute error; (c) correlation coefficient; and (d) BIAS profiles
from the five precipitation events, obtained by STEPS model at different lead times.
(a) (b)
Figure 12. Summary of (a) root mean square error; (b) mean absolute error; (c) correlation coefficient; and (d) BIAS profilesfrom the five precipitation events, obtained by STEPS model at different lead times.
Water 2021, 13, x FOR PEER REVIEW 17 of 22
(a) (b)
(c) (d)
Figure 12. Summary of (a) root mean square error; (b) mean absolute error; (c) correlation coefficient; and (d) BIAS profiles
from the five precipitation events, obtained by STEPS model at different lead times.
(a) (b)
Figure 13. Cont.

Water 2021, 13, 1422 18 of 22Water 2021, 13, x FOR PEER REVIEW 18 of 22
(c) (d)
Figure 13. Box plot diagrams of ensemble precipitation nowcast skill as a function of lead time for averaged (a) root mean
square error (b) mean absolute error; (c) correlation coefficient; and (d) BIAS metrics.
Each box plot presents four evaluation metrics. A similar pattern in the variations of
RMSE and MAE, CC and BIAS with lead time was observed in the five precipitation
events, although differing magnitudes are given. An asymptotic growth in MAE and an
asymptotic reduction in CC with higher lead time was found. For smaller lead times for
the four metrics, generally the spread box is larger. Plus, since the values of CC less than
0.5 after the lead time becomes 120 min, the quality of precipitation nowcasting by using
the GPM data is high before 120 min. When the lead time reaches 120 min, the errors of
nowcasts increase rapidly. So, the GPM IMERG precipitation data is satisfying for real-
time short-term nowcasting, particular for two hours ahead.
7. Conclusions and Summary
In conclusion, the quality of the GPM IMERG precipitation product at half-hour and
0.1° resolution was evaluated, using daily precipitation observation data from over 2800
rain gauges across Mexico as reference. The STEPS model was applied to explore the po-
tential of the GPM IMERG precipitation product for real-time short-time precipitation
nowcasting (forecasting) in this analysis. The analysis was divided into two parts: the first
part used rain gauge data as a reference for data quality evaluation, while the second part
evaluated the GPM IMERG data. Five events were selected, and the data was applied in
the STEPS model to present the nowcasting performance over a relatively short lead time
period of 0–6 h. The main conclusions of this study are as follows.
(1) The quality of the GPM IMERG precipitation product at annual and national
scales was investigated. The performance of the data was represented by several evalua-
tion metrics, which were RMSE, CC, MAE, BIAS, POD, FAR and CSI. It was found that
the GPM IMERG precipitation product showed a slight underestimation over Mexico,
with small BIAS evaluations of −7.37% and −6.87% for the annual scale and national scale,
respectively, and that fluctuations between over and underestimating at the daily scale
were due to precipitation intensity and latitude. The quality of GPM IMERG data im-
proved at the national scale, with the lowest estimated error.
(2) The GPM IMERG product is able to reproduce a mostly consistent distribution of
precipitation at the annual scale. The overall results show the GPM precipitation data in
high agreement with the data from the rain gauges and provides better precipitation ob-
servations in remote areas, with great CC and POD values.
(3) The nowcasting model was applied to explore the potential of GPM precipitation
data for precipitation real-time short-term nowcasting and forecasting. The performance
of precipitation nowcasting was examined by the RMSE, CC, BIAS and MAE metrics. The
errors between the STEPS nowcasts and GPM observed precipitation were estimated and
Figure 13. Box plot diagrams of ensemble precipitation nowcast skill as a function of lead time for averaged (a) root meansquare error (b) mean absolute error; (c) correlation coefficient; and (d) BIAS metrics.
Each box plot presents four evaluation metrics. A similar pattern in the variationsof RMSE and MAE, CC and BIAS with lead time was observed in the five precipitationevents, although differing magnitudes are given. An asymptotic growth in MAE and anasymptotic reduction in CC with higher lead time was found. For smaller lead times forthe four metrics, generally the spread box is larger. Plus, since the values of CC less than0.5 after the lead time becomes 120 min, the quality of precipitation nowcasting by usingthe GPM data is high before 120 min. When the lead time reaches 120 min, the errors ofnowcasts increase rapidly. So, the GPM IMERG precipitation data is satisfying for real-timeshort-term nowcasting, particular for two hours ahead.
7. Conclusions and Summary
In conclusion, the quality of the GPM IMERG precipitation product at half-hourand 0.1◦ resolution was evaluated, using daily precipitation observation data from over2800 rain gauges across Mexico as reference. The STEPS model was applied to explore thepotential of the GPM IMERG precipitation product for real-time short-time precipitationnowcasting (forecasting) in this analysis. The analysis was divided into two parts: the firstpart used rain gauge data as a reference for data quality evaluation, while the second partevaluated the GPM IMERG data. Five events were selected, and the data was applied inthe STEPS model to present the nowcasting performance over a relatively short lead timeperiod of 0–6 h. The main conclusions of this study are as follows.
(1) The quality of the GPM IMERG precipitation product at annual and national scaleswas investigated. The performance of the data was represented by several evaluationmetrics, which were RMSE, CC, MAE, BIAS, POD, FAR and CSI. It was found that theGPM IMERG precipitation product showed a slight underestimation over Mexico, withsmall BIAS evaluations of −7.37% and −6.87% for the annual scale and national scale,respectively, and that fluctuations between over and underestimating at the daily scalewere due to precipitation intensity and latitude. The quality of GPM IMERG data improvedat the national scale, with the lowest estimated error.
(2) The GPM IMERG product is able to reproduce a mostly consistent distributionof precipitation at the annual scale. The overall results show the GPM precipitation datain high agreement with the data from the rain gauges and provides better precipitationobservations in remote areas, with great CC and POD values.
(3) The nowcasting model was applied to explore the potential of GPM precipitationdata for precipitation real-time short-term nowcasting and forecasting. The performance ofprecipitation nowcasting was examined by the RMSE, CC, BIAS and MAE metrics. The
Water 2021, 13, 1422 19 of 22
errors between the STEPS nowcasts and GPM observed precipitation were estimated andplotted. Results from a comparison of each event showed qualitatively similar trends. Theaccuracy and quality of precipitation nowcasting generally decreased as the lead timeincreased, and the nowcasting quality reduced rapidly when the lead time reached 120 min(CC < 0.5). Therefore, the precipitation nowcasting performance by using GPM data isacceptable in Mexico beyond 2 h, after which the errors in the forecasts tend to increasevery rapidly.
8. Future Studies and Shortcomings
For future studies, the quality of IMERG should be improved to provide more precisehalf-hourly precipitation estimates, especially for territories with dry climates, as well ashigh latitudes and altitudes. Correspondingly, more studies are required to assess theperformance of GPM IMERG against other satellite and reanalysis products to find theadvantages and limitations of the GPM satellite. Furthermore, other precipitation specificproperties such as spatial and temporal heterogeneity, spatial and temporal intermittence,extreme variability and multi-fractal comparisons is necessary to overcome substantialuncertainties rainfall estimations [57–59]. Cristiano et al. [60] also depicted in their reviewthat the rainfall variability may need wider range of conditions and scenario based inobservational datasets for urban hydrological basins, which need proper analysis fordevelopment of better hydrological response system with higher sensitivity.
For nowcasting, in order to obtain better precipitation nowcasting results, the precipi-tation data of GPM IMERG product and rain gauge can be blended, such as kriging withexternal drift and the double-kernel smoothing methods. The characteristics of uncertaintyand error of new generation of geosynchronous satellite products launched by the NationalAeronautics and Space Administration (NASA) as GPM IMERG and National Oceanic andAtmospheric Administration (NOAA) will open new perspective for nowcasting and dataassimilation. Moreover, such products should be further explored to encourage the appli-cation and development of products such as IMERG and geostationary lightning mappersensors, respectively, and their associative algorithms in the recent era. This forecastingtechnique is extremely important especially for issuing flash flood warnings several hoursin advance. Heavy rainfall is especially frequent in the Yangtze River delta area of southernChina. In the future, more case studies can be conducted in this area in order to enhancethe accuracy of nowcasting and forecasting precipitation models.
Supplementary Materials: The following are available online at https://www.mdpi.com/article/10.3390/w13101422/s1, Figure S1. Precipitation on 22 October 2015 at 9:30, based on (a) GPM estimatedprecipitation and (b) 30-min forecast precipitation from STEPS precipitation nowcast, Figure S2.Precipitation on 22 October 2015 at 10:00, based on (a) GPM estimated precipitation and (b) 30-minforecast precipitation from STEPS precipitation nowcast, Figure S3. Precipitation on 22 October2015 at 10:30, based on (a) GPM estimated precipitation and (b) 30-min forecast precipitation fromSTEPS precipitation nowcast, Figure S4. Precipitation on 22 October 2015 at 11:00, based on (a)GPM estimated precipitation and (b) 30-min forecast precipitation from STEPS precipitation nowcast,Figure S5. Precipitation on 22 October 2015 at 11:30, based on (a) GPM estimated precipitation and(b) 30-min forecast precipitation from STEPS precipitation nowcast, Figure S6. Precipitation on 22October 2015 at 12:00, based on (a) GPM estimated precipitation and (b) 30-min forecast precipitationfrom STEPS precipitation nowcast, Figure S7. Precipitation on 22 October 2015 at 12:30, based on (a)GPM estimated precipitation and (b) 30-min forecast precipitation from STEPS precipitation nowcast,Figure S8. Precipitation on 22 October 2015 at 13:00, based on (a) GPM estimated precipitation and(b) 30-min forecast precipitation from STEPS precipitation nowcast, Figure S9. Precipitation on 22October 2015 at 13:30, based on (a) GPM estimated precipitation and (b) 30-min forecast precipitationfrom STEPS precipitation nowcast, Figure S10. Precipitation on 22 October 2015 at 14:00, based on (a)GPM estimated precipitation and (b) 30-min forecast precipitation from STEPS precipitation nowcast,Figure S11. Precipitation on 22 October 2015 at 14:30, based on (a) GPM estimated precipitation and(b) 30-min forecast precipitation from STEPS precipitation nowcast.

Water 2021, 13, 1422 20 of 22
Author Contributions: Conceptualization: K.W., P.S., Z.Y., J.H., L.K., F.G., X.T., and Y.X.; method-ology: K.W., P.S., Z.Y., J.H., and X.T.; investigation: K.W., P.S., and Z.Y.; writing—original draftpreparation: K.W., P.S., and Z.Y.; writing—review and editing: K.W., P.S., Z.Y., J.H., L.K., F.G., andX.T.; supervision: J.H., X.T., F.G., and Y.X.; funding acquisition: J.H., L.K., X.T., and Y.X. and Z.Y. Allauthors have read and agreed to the published version of the manuscript.
Funding: The authors acknowledge the support given by the Research Fund (RDH-101-2020-0044) ofXi’an Jiaotong-Liverpool University Urban and Environmental Studies University Re-search Center.
Institutional Review Board Statement: Not applicable.
Informed Consent Statement: Not applicable.
Data Availability Statement: The data presented in this study are available on request from thecorresponding author.
Acknowledgments: We would like to thank Miguel A Rico-Ramirez for his helpful suggestions anddata support in this study. Gratitude is also due to the Optimizing Water Streams Project funded bythe Research Centre, Xi’an Jiaotong-Liverpool University.
Conflicts of Interest: The authors declare no conflict of interest.
References1. Kidd, C.; Huffman, G. Global precipitation measurement. Meteorol. Appl. 2011, 18, 334–353. [CrossRef]2. Ebert, E.E.; Janowiak, J.E.; Kidd, C. Comparison of Near-Real-Time Precipitation Estimates from Satellite Observations and
Numerical Models. Bull. Am. Meteorol. Soc. 2007, 88, 47–64. [CrossRef]3. Nashwan, M.S.; Shahid, S.; Wang, X. Assessment of satellite-based precipitation measurement products over the hot desert
climate of Egypt. Remote Sens. 2019, 11, 555. [CrossRef]4. Hamada, A.; Takayabu, Y.N.; Liu, C.; Zipser, E.J. Weak linkage between the heaviest rainfall and tallest storms. Nat. Commun.
2015, 6, 6213. [CrossRef]5. Liu, Z.; Ostrenga, D.; Teng, W.; Kempler, S. Tropical Rainfall Measuring Mission (TRMM) Precipitation Data and Services for
Research and Applications. Bull. Am. Meteorol. Soc. 2012, 93, 1317–1325. [CrossRef]6. Wang, Z.; Zhong, R.; Lai, C.; Chen, J. Evaluation of the GPM IMERG satellite-based precipitation products and the hydrological
utility. Atmos. Res. 2017, 196, 151–163. [CrossRef]7. NASA (The National Aeronautics and Space Administration). NASA. Global Precipitation Measurement. Available online:
https://www.nasa.gov/mission_pages/GPM/spacecraft/index.html (accessed on 24 July 2019).8. Iguchi, T. Dual-Frequency Precipitation Radar (DPR) on the Global Precipitation Measurement (GPM) Mission’s Core Observatory.
In Satellite Precipitation Measurement; Springer: Cham, Switzerland, 2020; pp. 183–192.9. Prakash, S.; Mitra, A.K.; AghaKouchak, A.; Liu, Z.; Norouzi, H.; Pai, D.S. A preliminary assessment of GPM-based multi-satellite
precipitation estimates over a monsoon dominated region. J. Hydrol. 2018, 556, 865–876. [CrossRef]10. Wu, Z.; Zhang, Y.; Zhang, L.; Hao, X.; Lei, H.; Zheng, H. Validation of GPM Precipitation Products by Comparison with
Ground-Based Parsivel Disdrometers over Jianghuai Region. Water 2019, 11, 1260. [CrossRef]11. Tang, G.; Clark, M.P.; Papalexiou, S.M.; Ma, Z.; Hong, Y. Have satellite precipitation products improved over last two decades? A
comprehensive comparison of GPM IMERG with nine satellite and reanalysis datasets. Remote Sens. Environ. 2020, 240, 111697.[CrossRef]
12. Huffman, G.J.; Bolvin, D.T.; Braithwaite, D.; Hsu, K.; Joyce, R.; Kidd, C.; Nelkin, E.J.; Sorooshian, S.; Tan, J.; Xie, P. NASA GlobalPrecipitation Measurement (GPM) Integrated Multi-satellitE Retrievals for GPM (IMERG). In Algorithm Theoretical Basis Document(ATBD); NASA/GSFC: Greenbelt, MD, USA, 2019.
13. Chen, X.; Long, D.; Hong, Y.; Zeng, C.; Yan, D.H. Improved modeling of snow and glacier melting by a progressive two-stagecalibration strategy with GRACE and multisource data: How snow and glacier meltwater contributes to the runoff of the UpperBrahmaputra River basin? Water Resour. Res. 2017, 53, 2431–2466. [CrossRef]
14. Gilewski, P.; Nawalany, M. Inter-Comparison of Rain-Gauge, Radar, and Satellite (IMERG GPM) Precipitation EstimatesPerformance for Rainfall-Runoff Modeling in a Mountainous Catchment in Poland. Water 2018, 10, 1665. [CrossRef]
15. Shi, X.J.; Chen, Z.; Wang, H.; Yeung, D.Y.; Wong, W.K.; Woo, W.C. Convolutional LSTM network: A machine learning approachfor precipitation nowcasting. arXiv 2015, arXiv:1506.04214v2.
16. Spyrou, C.; Varlas, G.; Pappa, A.; Mentzafou, A.; Katsafados, P.; Papadopoulos, A.; Anagnostou, M.N.; Kalogiros, J. Implementa-tion of a Nowcasting Hydrometeorological System for Studying Flash Flood Events: The Case of Mandra, Greece. Remote Sens.2020, 12, 2784. [CrossRef]
17. Jeong, C.H.; Kim, W.; Joo, W.; Jang, D.; Yi, M.Y. Enhancing the Encoding-Forecasting Model for Precipitation Nowcasting byPutting High Emphasis on the Latest Data of the Time Step. Atmosphere 2021, 12, 261. [CrossRef]
18. Tran, Q.K.; Song, S.K. Computer vision in precipitation nowcasting: Applying image quality assessment metrics for training deepneural networks. Atmosphere 2019, 10, 244. [CrossRef]
Water 2021, 13, 1422 21 of 22
19. Deng, Y.C.; Hwang, J.H.; Lyu, Y.D. Developing Real-Time Nowcasting System for Regional Landslide Hazard Assessment underExtreme Rainfall Events. Water 2021, 13, 732. [CrossRef]
20. Liguori, S.; Rico-Ramirez, M.A. A review of current approaches to radar-based quantitative precipitation forecasts. Int. J. RiverBasin Manag. 2014, 12, 391–402. [CrossRef]
21. Johannsen, L.L.; Zambon, N.; Strauss, P.; Dostal, T.; Neumann, M.; Zumr, D.; Cochrane, T.A.; Blöschl, G.; Klik, A. Comparison ofthree types of laser optical disdrometers under natural rainfall conditions. Hydrol. Sci. J. 2020, 65, 524–535. [CrossRef]
22. Zhang, A.; Xiao, L.; Min, C.; Chen, S.; Kulie, M.; Huang, C.; Liang, Z. Evaluation of latest GPM-Era high-resolution satelliteprecipitation products during the May 2017 Guangdong extreme rainfall event. Atmos. Res. 2019, 216, 76–85. [CrossRef]
23. Sokol, Z.; Szturc, J.; Orellana-Alvear, J.; Popová, J.; Jurczyk, A.; Célleri, R. The Role of Weather Radar in Rainfall Estimation andIts Application in Meteorological and Hydrological Modelling—A Review. Remote Sens. 2021, 13, 351. [CrossRef]
24. Dandridge, C.; Lakshmi, V.; Bolten, J.; Srinivasan, R. Evaluation of Satellite-Based Rainfall Estimates in the Lower Mekong RiverBasin (Southeast Asia). Remote Sens. 2019, 11, 2709. [CrossRef]
25. Ciach, G.J.; Krajewski, W.F.; Anagnostou, E.N.; Baeck, M.L.; Smith, J.A.; McCollum, J.R.; Kruger, A. Radar rainfall estimation forground validation studies of the Tropical Rainfall Measuring Mission. J. Appl. Meteorol. 1997, 36, 735–747. [CrossRef]
26. Habib, E.; Krajewski, W.F. Uncertainty Analysis of the TRMM Ground-Validation Radar-Rainfall Products: Application to theTEFLUN-B Field Campaign. J. Appl. Meteorol. 2002, 41, 558–572. [CrossRef]
27. Steiner, M.; Smith, J.A.; Burges, S.J.; Alonso, C.V.; Darden, R.W. Effect of bias adjustment and rain gauge data quality control onradar rainfall estimation. Water Resour. Res. 1999, 35, 2487–2503. [CrossRef]
28. Sypka, P. Dynamic real-time volumetric correction for tipping-bucket rain gauges. Agric. For. Meteorol. 2019, 271, 158–167.[CrossRef]
29. Mahmud, M.; Mohd Yusof, A.A.; Mohd Reba, M.N.; Hashim, M. Mapping the Daily Rainfall over an Ungauged TropicalMicro-Watershed: A Downscaling Algorithm Using GPM Data. Water 2020, 12, 1661. [CrossRef]
30. Cai, Y.; Jin, C.; Wang, A.; Guan, D.; Wu, J.; Yuan, F.; Xu, L. Spatio-temporal analysis of the accuracy of tropical multisatellite precitation analysis 3B42 precipitation data in mid-high latitudes of China. PLoS ONE 2015, 10, e0120026.
31. Mazzoglio, P.; Laio, F.; Balbo, S.; Boccardo, P.; Disabato, F. Improving an Extreme Rainfall Detection System with GPM IMERGdata. Remote Sens. 2019, 11, 677. [CrossRef]
32. Cao, Q.; Hong, Y.; Qi, Y.; Wen, Y.; Zhang, J.; Gourley, J.J.; Liao, L. Empirical conversion of the vertical profile of reflectivity fromKu-band to S-band frequency. J. Geophys. Res. Atmos. 2013, 118, 1814–1825. [CrossRef]
33. Du, L.; Tian, Q.; Yu, T.; Meng, Q.; Jancso, T.; Udvardy, P.; Huang, Y. A comprehensive drought monitoring method integratingMODIS and TRMM data. Int. J. Appl. Earth Obs. Geoinf. 2013, 23, 245–253. [CrossRef]
34. Yatagai, A.; Krishnamurti, T.N.; Kumar, V.; Mishra, A.K.; Simon, A. Use of APHRODITE Rain Gauge–Based Precipitation andTRMM 3B43 Products for Improving Asian Monsoon Seasonal Precipitation Forecasts by the Superensemble Method. J. Clim.2014, 27, 1062–1069. [CrossRef]
35. Qin, J.; Chen, Z.; Yang, K.; Liang, S.; Tang, W. Estimation of monthly-mean daily global solar radiation based on MODIS andTRMM products. Appl. Energy 2011, 88, 2480–2489. [CrossRef]
36. Prakash, S.; Mitra, A.K.; Pai, D.S.; AghaKouchak, A. From TRMM to GPM: How well can heavy rainfall be detected from space?Adv. Water Resour. 2016, 88, 1–7. [CrossRef]
37. Arshad, M.; Ma, X.; Yin, J.; Ullah, W.; Ali, G.; Ullah, S.; Liu, M.; Shahzaman, M.; Ullah, I. Evaluation of GPM-IMERG andTRMM-3B42 precipitation products over Pakistan. Atmos. Res. 2020, 249, 105341. [CrossRef]
38. Wu, Y.; Zhang, Z.; Huang, Y.; Jin, Q.; Chen, X.; Chang, J. Evaluation of the GPM IMERG v5 and TRMM 3B42 v7 precipitationproducts in the Yangtze River basin, China. Water. 2019, 11, 1459. [CrossRef]
39. Sun, Q.; Miao, C.; Duan, Q.; Ashouri, H.; Sorooshian, S.; Hsu, K.L. A review of global precipitation data sets: Data sources,estimation, and intercomparisons. Rev. Geophys. 2018, 56, 79–107. [CrossRef]
40. Bowler, N.E.; Pierce, C.E.; Seed, A.W. STEPS: A probabilistic precipitation forecasting scheme which merges an extrapolationnowcast with downscaled NWP. Q. J. R. Meteorol. Soc. J. Atmos. Sci. Appl. Meteorol. Phys. Oceanogr. 2006, 132, 2127–2155.[CrossRef]
41. Seed, A.W.; Pierce, C.E.; Norman, K. Formulation and evaluation of a scale decomposition-based stochastic precipitation nowcastscheme. Water Resour. Res. 2013, 49, 6624–6641. [CrossRef]
42. Liguori, S.; Rico-Ramirez, M.A.; Schellart, A.N.A.; Saul, A.J. Using probabilistic radar rainfall nowcasts and NWP forecasts forflow prediction in urban catchments. Atmos. Res. 2012, 103, 80–95. [CrossRef]
43. Lewis, H.; Mittermaier, M.; Mylne, K.; Norman, K.; Scaife, A.; Neal, R.; Pierce, C.; Harrison, D.; Jewell, S.; Kendon, M.; et al. Frommonths to minutes–exploring the value of high-resolution rainfall observation and prediction during the UK winter storms of2013/2014. Meteorol. Appl. 2015, 22, 90–104. [CrossRef]
44. National Water Commission (CONAGUA). Statistics on Water in Mexico. Available online: https://www.nwcjamaica.com/(accessed on 31 July 2019).
45. Sámano-Romero, G.; Mautner, M.; Chávez-Mejía, A.; Jiménez-Cisneros, B. Assessing marginalized communities in mexico forimplementation of rainwater catchment systems. Water 2016, 8, 140. [CrossRef]
46. Naik, B.; Khatua, K.K.; Wright, N.; Sleigh, A.; Singh, P. Numerical modeling of converging compound channel flow.ISH J. Hydraul. Eng. 2018, 24, 285–297. [CrossRef]

Water 2021, 13, 1422 22 of 22
47. Singh, P.K.; Banerjee, S.; Naik, B.; Kumar, A.; Khatua, K.K. Lateral distribution of depth average velocity & boundary shear stressin a gravel bed open channel flow. ISH J. Hydraul. Eng. 2018, 27, 1–15. [CrossRef]
48. Singh, P.K.; Khatua, K.K. Lateral dissemination of depth-averaged velocity, boundary shear stress and stage-discharge curves forcompound channels. ISH J. Hydraul. Eng. 2018, 1–14. [CrossRef]
49. Tang, G.; Ma, Y.; Long, D.; Zhong, L.; Hong, Y. Evaluation of GPM Day-1 IMERG and TMPA Version-7 legacy products overMainland China at multiple spatiotemporal scales. J. Hydrol. 2016, 533, 152–167. [CrossRef]
50. Chen, C.; Chen, Q.; Duan, Z.; Zhang, J.; Mo, K.; Li, Z.; Tang, G. Multiscale Comparative Evaluation of the GPM IMERG v5 andTRMM 3B42 v7 Precipitation Products from 2015 to 2017 over a Climate Transition Area of China. Remote Sens. 2018, 10, 944.[CrossRef]
51. Sharifi, E.; Steinacker, R.; Saghafian, B. Assessment of GPM-IMERG and Other Precipitation Products against Gauge Data underDifferent Topographic and Climatic Conditions in Iran: Preliminary Results. Remote Sens. 2016, 8, 135. [CrossRef]
52. Yong, B.; Ren, L.L.; Hong, Y.; Wang, J.H.; Gourley, J.J.; Jiang, S.H.; Chen, X.; Wang, W. Hydrologic evaluation of MultisatellitePrecipitation Analysis standard precipitation products in basins beyond its inclined latitude band: A case study in Laohahe basin,China. Water Resour. Res. 2010, 46. [CrossRef]
53. Libertino, A.; Sharma, A.; Lakshmi, V.; Claps, P. A global assessment of the timing of extreme rainfall from TRMM and GPM forimproving hydrologic design. Environ. Res. Lett. 2016, 11, 054003. [CrossRef]
54. PC, S.; Misumi, R.; Nakatani, T.; Iwanami, K.; Maki, M.; Seed, A.W.; Hirano, K. Comparison of rainfall nowcasting derived fromthe STEPS model and JMA precipitation nowcasts. Hydrol. Res. Lett. 2015, 9, 54–60.
55. Foresti, L.; Seed, A. On the spatial distribution of rainfall nowcasting errors due to orographic forcing. Meteorol. Appl. 2015, 22,60–74. [CrossRef]
56. Omranian, E.; Sharif, H.; Tavakoly, A. How Well Can Global Precipitation Measurement (GPM) Capture Hurricanes? Case Study:Hurricane Harvey. Remote Sens. 2018, 10, 1150. [CrossRef]
57. Vendrasco, E.P.; Machado, L.A.; Araujo, C.S.; Ribaud, J.-F.; Ferreira, R.C. Potential use of the GLM for nowcasting and dataassimilation. Atmos. Res. 2020, 242, 105019. [CrossRef]
58. Shehu, B.; Haberlandt, U. Relevance of merging radar and rainfall gauge data for rainfall nowcasting in urban hydrology.J. Hydrol. 2021, 594, 125931. [CrossRef]
59. Imhoff, R.O.; Brauer, C.C.; Overeem, A.; Weerts, A.H.; Uijlenhoet, R. Spatial and Temporal Evaluation of Radar RainfallNowcasting Techniques on 1,533 Events. Water Resour. Res. 2020, 56, e2019WR026723. [CrossRef]
60. Cristiano, E.; Veldhuis, M.C.T.; Giesen, N.V.D. Spatial and temporal variability of rainfall and their effects on hy-drologicalresponse in urban areas—A review. Hydrol. Earth Syst. Sci. 2017, 21, 3859–3878. [CrossRef]