
Improved confidence in climate change projections of precipitation evaluated using daily statistics...
10
Improved confidence in climate change projections of precipitation evaluated using daily statistics from the PRUDENCE ensemble Fredrik Boberg Peter Berg Peter Thejll William J. Gutowski Jens H. Christensen Received: 4 January 2008 / Accepted: 3 July 2008 Ó Springer-Verlag 2008 Abstract An ensemble of regional climate modelling simulations from the European framework project PRU- DENCE are compared across European sub-regions with observed daily precipitation from the European Climate Assessment dataset by characterising precipitation in terms of probability density functions (PDFs). Models that robustly describe the observations for the control period (1961–1990) in given regions as well as across regions are identified, based on the overlap of normalised PDFs, and then validated, using a method based on bootstrapping with replacement. We also compare the difference between the scenario period (2071–2100) and the control period precipitation using all available mod- els. By using a metric quantifying the deviation over the entire PDF, we find a clearly marked increase in the contribution to the total precipitation from the more intensive events and a clearly marked decrease for days with light precipitation in the scenario period. This change is tested to be robust and found in all models and in all sub-regions. We find a detectable increase that scales with increased warming, making the increase in the PDF difference a relative indicator of climate change level. Furthermore, the crossover point separating decreasing from increasing contributions to the norma- lised precipitation spectrum when climate changes does not show any significant change which is in accordance with expectations assuming a simple analytical fit to the precipitation spectrum. Keywords Regional climate change Extreme events Precipitation Probability distributions Bootstrapping with replacement Crossing-point statistics 1 Introduction As climate changes under human influence, a need has arisen for tools to estimate the nature and amplitude of future changes in precipitation. Sun et al. (2006) analysed daily precipitation data from 14 AGCMs that used the SRES A2 scenario (Nakic ´enovic ´ et al. 2000) to evaluate potential future changes and found a global shift toward more intense and extreme precipitation during the late twenty-first century. Dessai et al. (2005) estimated uncer- tainties in regional climate projections applying skill scores to seasonal precipitation data and found that the differences in emission scenarios dominates the precipitation uncer- tainty at the 95th percentile. In the European framework project PRUDENCE, AG- CMs are used to provide low resolution boundary conditions for a region inside which a detailed regional climate model (RCM) is run (Christensen et al. 2007). The models are validated using current climate and then used for making climate projections. Here, we use daily pre- cipitation output from an ensemble of RCMs to assess future precipitation projections. We present ways to reli- ably determine the ability to simulate daily precipitation statistics based on a comparison with observed precipita- tion, before using the models to assess future changes. This is done using a method based on statistical metrics specially produced for the task. The nature of the metrics F. Boberg (&) P. Berg P. Thejll J. H. Christensen Danish Climate Centre, Danish Meteorological Institute, Lyngbyvej 100, 2100 Copenhagen Ø, Denmark e-mail: [email protected] W. J. Gutowski Department of Geological and Atmospheric Sciences, Iowa State University, Ames, IA 50011, USA 123 Clim Dyn DOI 10.1007/s00382-008-0446-y
Transcript of Improved confidence in climate change projections of precipitation evaluated using daily statistics...

Improved confidence in climate change projectionsof precipitation evaluated using daily statisticsfrom the PRUDENCE ensemble
Fredrik Boberg Æ Peter Berg Æ Peter Thejll ÆWilliam J. Gutowski Æ Jens H. Christensen
Received: 4 January 2008 / Accepted: 3 July 2008
� Springer-Verlag 2008
Abstract An ensemble of regional climate modelling
simulations from the European framework project PRU-
DENCE are compared across European sub-regions with
observed daily precipitation from the European Climate
Assessment dataset by characterising precipitation in
terms of probability density functions (PDFs). Models
that robustly describe the observations for the control
period (1961–1990) in given regions as well as across
regions are identified, based on the overlap of normalised
PDFs, and then validated, using a method based on
bootstrapping with replacement. We also compare the
difference between the scenario period (2071–2100) and
the control period precipitation using all available mod-
els. By using a metric quantifying the deviation over the
entire PDF, we find a clearly marked increase in the
contribution to the total precipitation from the more
intensive events and a clearly marked decrease for days
with light precipitation in the scenario period. This
change is tested to be robust and found in all models and
in all sub-regions. We find a detectable increase that
scales with increased warming, making the increase in
the PDF difference a relative indicator of climate change
level. Furthermore, the crossover point separating
decreasing from increasing contributions to the norma-
lised precipitation spectrum when climate changes does
not show any significant change which is in accordance
with expectations assuming a simple analytical fit to the
precipitation spectrum.
Keywords Regional climate change � Extreme events �Precipitation � Probability distributions �Bootstrapping with replacement � Crossing-point statistics
1 Introduction
As climate changes under human influence, a need has
arisen for tools to estimate the nature and amplitude of
future changes in precipitation. Sun et al. (2006) analysed
daily precipitation data from 14 AGCMs that used the
SRES A2 scenario (Nakicenovic et al. 2000) to evaluate
potential future changes and found a global shift toward
more intense and extreme precipitation during the late
twenty-first century. Dessai et al. (2005) estimated uncer-
tainties in regional climate projections applying skill scores
to seasonal precipitation data and found that the differences
in emission scenarios dominates the precipitation uncer-
tainty at the 95th percentile.
In the European framework project PRUDENCE, AG-
CMs are used to provide low resolution boundary
conditions for a region inside which a detailed regional
climate model (RCM) is run (Christensen et al. 2007). The
models are validated using current climate and then used
for making climate projections. Here, we use daily pre-
cipitation output from an ensemble of RCMs to assess
future precipitation projections. We present ways to reli-
ably determine the ability to simulate daily precipitation
statistics based on a comparison with observed precipita-
tion, before using the models to assess future changes. This
is done using a method based on statistical metrics
specially produced for the task. The nature of the metrics
F. Boberg (&) � P. Berg � P. Thejll � J. H. Christensen
Danish Climate Centre, Danish Meteorological Institute,
Lyngbyvej 100, 2100 Copenhagen Ø, Denmark
e-mail: [email protected]
W. J. Gutowski
Department of Geological and Atmospheric Sciences,
Iowa State University, Ames, IA 50011, USA
123
Clim Dyn
DOI 10.1007/s00382-008-0446-y
used to intercompare models and reality takes into account
the properties of precipitation statistics. In particular, the
metrics focus on the spectrum of precipitation amount
versus daily intensity.
A model matching the observations for the full spectra
of precipitation values indicates that the model is likely
also to capture the full range under climate change,
including the tail of the distribution where the statistics
often are not well-sampled. Furthermore, precipitation
statistics vary from region to region based on the type of
climate. Perkins et al. (2007) suggest using a metric
where probability density functions (PDFs) are con-
structed to generate a ‘match metric’ based on the
overlap of normalised PDFs (model and observational
precipitation, respectively). A perfect overlap results in a
skill score of one while the score is closer to zero for
poor overlaps.
Note that the approach of using PDFs as our method of
comparison is focused on the models’ ability to optimally
describe the full precipitation distribution. Although the PDF
technique implicitly includes moments like the average and
standard deviation, it does not directly describe their possible
differences versus observations. Furthermore, the tail of the
PDFs has only a small influence on the skill score due to a
relatively small contribution from extreme events.
The analysis approach described here will be subse-
quently used on RCM data from the ENSEMBLES project
(Hewitt 2005). In this study we are aiming at quantifying
the error over the entire PDF, using only one out of several
metrics that will subsequently be used for ranking indi-
vidual ENSEMBLES RCM parameters.
Robustness of the optimal metrics must be estimated so
that we can state the quality of our answers. Here we use a
Monte Carlo method based on bootstrapping with
replacement to evaluate the robustness of the skill scores.
Using the results from the robustness test, we then consider
the technique of the crossing-point statistics (Gutowski
et al. 2007) in order to address the implications under
climate change conditions. Gutowski et al. (2007) exam-
ined changes in normalised precipitation intensity spectra
for several regions in the United States under global
warming as produced by two RCMs. They found a single
percentile separating decreasing from increasing contribu-
tions to the normalised spectrum and that it occurred
around the 70th percentile of cumulative precipitation,
irrespective of the governing precipitation processes or
which model produced the simulation. They further sug-
gested that this should be a robust behaviour when the
intensity spectra adhere to a gamma distribution. Here we
seek to demonstrate that this result also applies for Europe,
and is a robust result not depending on model formulation.
Our working hypothesis is as climate changes, the cross-
over point separating increasing from decreasing
contributions to the normalised spectrum can be a basis for
relating precipitation changes with a temperature change.
The structure of this paper is as follows. Section 2
presents the model data and the observations used in this
study. In Sect. 3, we present the results of assessing model
quality from a match with observations. In Sect. 4, we use
these highest scoring models to determine any possible
scenario changes in precipitation distribution. The paper
ends with a discussion in Sect. 5 and conclusions in
Sect. 6.
2 Data
Two different data sets are analysed in this study. The first
data set consists of daily precipitation from ten PRU-
DENCE RCMs driven by the GCM model HadAM3H
(Pope et al. 2000; Buonomo et al. 2007), including control
(1961–1990) and scenario (2071–2100) runs for each
(Christensen and Christensen 2007). Control runs are
forced by observed SSTs and observed greenhouse gases.
All of the simulations we use here have 50 km horizontal
resolution, and where future scenarios are discussed we
refer to the SRES A2 scenario (Nakicenovic et al. 2000).
The different models used in this study and their parent
institutes are listed in the leftmost column of Table 1.
The second data set in this study is based on measure-
ments monitored by the European Climate Assessment
(ECA) project (http://eca.knmi.nl/). ECA was initiated to
combine, present and analyse daily series of meteorological
measurements (Klein Tank et al. 2002). In this study, we
examine climate change by analysing series of daily
observations of precipitation at ECA stations within nine
European sub-regions with varying climatology (see
Fig. 1). Stations with fewer than 3,000 daily measurements
during the period 1961–1990 were arbitrarily excluded from
further analysis due to poor sampling. This left a data set
containing observations from 455 stations used in this
study. Note that the distribution of stations is inhomoge-
neous within some sub-regions and sparse for some regions.
Because we want to compare the model data to obser-
vations, PDFs are constructed for both data sets. Dry days
are defined as days with precipitation less than 1 mm and
these days are removed from the two precipitation data
sets. Observations of weak intensity precipitation are not
always reliable and low intensity precipitation does not
contribute significantly to the total amount of precipitation
(Dai 2001). Furthermore, low rainfall has a small societally
impact through flash floods, etc. Then PDFs are calculated
from the daily land data for each region and model through
three steps. First the data are put into bins of 1 mm day-1
width starting at 1 mm day-1. Secondly each bin’s fre-
quency of events is multiplied by the bin average to get the
F. Boberg et al.: Improved confidence in climate change projections of precipitation
123

precipitation amount. Finally the binned data are norma-
lised by dividing each bin value with the total wet day
precipitation amount for the 30 year period for the partic-
ular region and model run in question. The same procedure
is carried out for the observational data to enable a direct
comparison with the PRUDENCE RCM control runs.
3 Metric analysis
Figure 2 compares binned normalised precipitation distri-
butions for the ten PRUDENCE models driven by the same
GCM, for all nine sub-regions, with ECA precipitation data
for the period 1961–1990. Note that the plots are truncated
at bin 110 mm day-1 for the sake of clarity. With this
truncation at 110 mm day-1, a total of about 0.01% of the
daily values is omitted and a total of approximately 0.23%
of the precipitation amount is omitted.
The models’ poorest performance versus the observed
precipitation distribution occurs for the low-latitude region
2 (IP). Low performance also occurs for the region 7 (MD).
The relatively few days with observed light precipitation is
not modelled well for region IP and to some extent also
regions MD and AL. These three regions are, according to
the relatively small slope of the observational PDFs com-
pared to the other regions’ PDFs, characterised by long
periods of drought or only light precipitation interspersed
with heavy showers.
As seen in Fig. 2, extreme precipitation is, as expec-
ted, more difficult to simulate. One reason for this is due
to the 50 km horizontal resolution of the RCMs that
smooth any single-point extremes occurring in the
observational data. A conversion to gridded data for the
observations would decrease its extreme precipitation.
The comparison between model data and observations
presented here is mainly a demonstration case to the
upcoming study using ENSEMBLES RCM data vali-
dated using a gridded dataset of observed precipitation
(Haylock et al. 2008).
Also given in Fig. 2 are the 95th percentiles of accu-
mulated precipitation, both for observations and model
simulations. The model percentiles for the low-latitude
regions IP, AL, and MD have a relatively large scatter
compared to the other regions. For regions IP and FR no
Table 1 Results of robustness analysis for wet days for ten different RCMs all driven by the HadAM3H GCM
Institute/model BI IP FR ME SC AL MD EA EUx
DMI/HIRHAM_D 0.14
ETH/CHRM 19.64
GKSS/CLM 4.31 11.01 76.80 4.34 19.78 2.90 27.37 89.94
HC/HadRM 23.18 88.84 16.95 24.07 72.34 69.10 0.75 8.01 10.06
ICTP/RegCM 17.06 6.06 71.59 91.99
KNMI/RACMO 15.79 0.15 7.88 21.45
METNO/HIRHAM_M 1.70 0.05 0.07
MPI/REMO 10.63
SMHI/RCAO 6.51
UCM/PROMES 1.04 0.14 6.48 71.88
About 10,000 Monte Carlo bootstrap trials were performed for each region and the percentage of occurrences of first place ranking, measured by
the PDF overlap metric, is recorded in columns two through ten. For comparison, the models with the highest original skill score are indicated in
italics for each region
Fig. 1 Geographical position of ECA compiled precipitation stations
(marked by times symbol) and extent of eight predefined European
PRUDENCE sub-regions marked by solid lines (Christensen and
Christensen 2007). These regions are British Isles (BI), Iberian
Peninsula (IP), France (FR), Mid-Europe (ME), Scandinavia (SC), the
Alps (AL), the Mediterranean (MD), and Eastern Europe (EA). A
ninth region (dashed lines), defined as the maximum area included in
all the ten PRUDENCE models, termed ‘EUx’ will also be used in
this work. This region covers latitudes 41.0�N–59.5�N and longitudes
10.5�W–30.0�E. Note that region SC is not covered well by models
RegCM and PROMES while the IP and MD regions are not well
covered by the HIRHAM_M model
F. Boberg et al.: Improved confidence in climate change projections of precipitation
123

0 20 40 60 80 100
10−5
10−4
10−3
10−2
10−1
Bin [mm day−1]
Nor
m. P
reci
pita
tion
BI
ECA
HIRHAM_DCHRMCLMHadRMRegCMRACMOHIRHAM_MREMORCAOPROMES
0 20 40 60 80 100
10−5
10−4
10−3
10−2
10−1
Bin [mm day−1]
Nor
m. P
reci
pita
tion
IP
ECA
HIRHAM_DCHRMCLMHadRMRegCMRACMOREMORCAOPROMES
0 20 40 60 80 100
10−5
10−4
10−3
10−2
10−1
Bin [mm day−1]
Nor
m. P
reci
pita
tion
FR
ECA
HIRHAM_DCHRMCLMHadRMRegCMRACMOHIRHAM_MREMORCAOPROMES
0 20 40 60 80 100
10−5
10−4
10−3
10−2
10−1
Bin [mm day−1]N
orm
. Pre
cipi
tatio
n M
E
ECA
HIRHAM_DCHRMCLMHadRMRegCMRACMOHIRHAM_MREMORCAOPROMES
0 20 40 60 80 100
10−5
10−4
10−3
10−2
10−1
Bin [mm day−1]
Nor
m. P
reci
pita
tion
SC
ECA
HIRHAM_DCHRMCLMHadRMRACMOHIRHAM_MREMORCAO
0 20 40 60 80 100
10−5
10−4
10−3
10−2
10−1
Bin [mm day−1]
Nor
m. P
reci
pita
tion
AL
ECA
HIRHAM_DCHRMCLMHadRMRegCMRACMOHIRHAM_MREMORCAOPROMES
0 20 40 60 80 100
10−5
10−4
10−3
10−2
10−1
Bin [mm day−1]
Nor
m. P
reci
pita
tion
MD
ECA
HIRHAM_DCHRMCLMHadRMRegCMRACMOREMORCAOPROMES
0 20 40 60 80 100
10−5
10−4
10−3
10−2
10−1
Bin [mm day−1]
Nor
m. P
reci
pita
tion
EA
ECA
HIRHAM_DCHRMCLMHadRMRegCMRACMOHIRHAM_MREMORCAOPROMES
0 20 40 60 80 100
10−5
10−4
10−3
10−2
10−1
Bin [mm day−1]
Nor
m. P
reci
pita
tion
EU
x
ECA
HIRHAM_DCHRMCLMHadRMRegCMRACMOHIRHAM_MREMORCAOPROMES
F. Boberg et al.: Improved confidence in climate change projections of precipitation
123

model percentile is able to match the observed percentile
due to dissimilar PDFs.
To determine each model’s precipitation skill we com-
pare each PRUDENCE model against observed
precipitation using the skill score metric of the degree of
overlap of normalised precipitation intensity PDFs (Perkins
et al. 2007). The PDF overlap as a function of sub-region
for all ten models is shown in Fig. 3. We see that the
RegCM, HadRM and CLM models have high scores for
most regions and that the lowest scores occur for region IP.
Furthermore, the spread in skill score for the ten models is
relatively small for region BI.
The European sub-regions are chosen in order to be
consistent with previous analyses (e.g. Christensen and
Christensen 2007). One example where the choice of
region might not be physically justified is the SC region,
where the precipitation in western Norway is much more
extreme than that in the rest of the region. The effect of
dividing the region into two smaller regions depending on
the skewness of the frequency PDF, i.e. separating the parts
of Norway with extreme precipitation, was explored but the
ranking of the models was not affected by this (Boberg
et al. 2007). The European region was also divided into a
Northern and a Southern region, with the same result
(Boberg et al. 2007). This suggests that the results are not
dependent on the choice of regions. This is an encouraging
sign of robustness in the overall method. Seeking an
optimal subdivision is not pursued here, though we note
that the models that do best in the SC region (and in the
subdivisions thereof described above) also do well in the
AL region (see Fig. 3) which has similar orography to
western Norway—i.e. it is a region with a similar mecha-
nism for driving precipitation—and this is at least a
consistency check of the finding.
The robustness of the single model skill scores shown in
Fig. 3 is evaluated by a Monte Carlo method based on
bootstrapping with replacement (Efron and Tibshirani
1993). From the observations we have a number of time
series for each region, and by making random selections of
these time series we can evaluate how sensitive the skill
score is to changes in the sampling of observations. The
selections are here repeated 10,000 times for a good sta-
tistical description of the variations in the skill scores for
the different models, and we can determine the robustness
of the ranking of the individual models. We can thus assess
whether or not one model can score significantly higher
than the others.
In Table 1 we show the percentage distributions of
models’ probabilities of ranking the highest, across all
regions, for 10,000 Monte Carlo bootstrap trials. The val-
ues given in bold refers to the models having the highest
skill score for each region in Fig. 3. Once again we see that
the models CLM, HadRM and RegCM score well. We also
note that the best performing models from Fig. 3 are
clearly high ranked for all regions. The results, therefore,
are fairly robust.
4 Crossing-point statistics
We use the method of Gutowski et al. (2007) to study
changes in precipitation over long time scales. Daily pre-
cipitation PDFs for the HIRHAM_D experiment for all
land grid points are shown in Fig. 4 for both the control run
and the scenario run. We show here only the result for the
HIRHAM_D model (of the Danish Meteorological Insti-
tute) since all models give similarly shaped curves as
indicated by Table 2. Similar to the results by Gutowski
et al. (2007) and Sun et al. (2007), the plot in Fig. 4
indicates that days with moderate precipitation (less than
about 10 mm) will contribute less to the total precipitation
in the future scenario while days with higher (more than
about 10 mm) precipitation will have a larger contribution.
The crossover point xc for this transition is found by sub-
tracting the control precipitation from the scenario
precipitation (see Fig. 5) and determining where the curve
goes from negative to positive values. The related transi-
tion percentile, Pxc; is calculated as the accumulated
precipitation for the control run from 1 to xc mm day-1
divided by the total precipitation.
BI IP FR ME SC AL MD EA EUx
65
70
75
80
85
90
95
100
PRUDENCE sub−region
Com
mon
PD
F a
rea
[%]
HIRHAM_DCHRMCLMHadRMRegCMRACMOHIRHAM_MREMORCAOPROMES
Fig. 3 Results of comparing ten PRUDENCE models, all driven by
the HadAM3H GCM, for precipitation against ECA precipitation
data, using daily values for the period 1961–1990. Plotted is the
common PDF area as a function of sub-region (cf. Fig. 1) for all ten
models. The highest skill score for each region is BI 96.6%, IP 82.3%,
FR 95.3%, ME 96.6%, SC 97.7%, AL 93.6%, MD 92.3%, EA 94.9%,
and EUx 97.5%
Fig. 2 Comparison between ECA compiled precipitation observa-
tions (black) with precipitation data from ten PRUDENCE RCM
models (grey) for the period 1961–1990. The panels show distribu-
tions for the nine sub-regions. Arrows mark the 95th percentile of
accumulated observed precipitation. The vertical lines in the top part
of each panel represent the 95th percentile of accumulated precip-
itation for the various models covering the sub-region in question
b
F. Boberg et al.: Improved confidence in climate change projections of precipitation
123

The error bars, ri, in Fig. 5 are calculated by propaga-
tion of errors assuming independence between PDF bin
values for the control and scenario runs:
ri
Di
� �2
¼ E2C þ E2
S
¼ M
NC;i UCþ M
NS;i US:
ð1Þ
The left hand side of Eq. 1 is the squared relative error of
the normalised precipitation change (scenario minus con-
trol run), where Di is the normalised precipitation change
plotted in Fig. 5. EC2 and ES
2 are the squared relative errors
of the normalised precipitation for each run, assuming
Poisson statistics, corrected for spatial correlation. M is the
number of land grid points for the region in question, Ni is
the number of values in bin i and U is the number of
uncorrelated areas in the region in question. U is found by
calculating the autocorrelation between all land grid points.
All grid points with a correlation above e-1 relative to the
grid point in question are defined as belonging to the same
correlated area. U is then given by the total number of land
points in the specific region divided by the average size of
the correlated area. This is done for the control run and
scenario run separately. For the HIRHAM_D model,
M = 4,150 and U is 29.6 and 27.0 for the control and
scenario periods, respectively, and we see in Fig. 5 that the
amplitude of the precipitation change is significant.
As indicated by the error bars in the insert, the norma-
lised precipitation PDF change for the full land region in
Fig. 5 is no longer significantly different from zero at
64 mm day-1 (99.7 percentile). The analysis given in
Figs. 4 and 5 were performed for all ten RCMs with their
full individual land regions, and the characteristic values
for all these models are summarised in Table 2. The main
effect of considering the full land region instead of only the
maximum land region common to all models is that the
error bars are roughly 20% smaller. This error reduction in
turn is found to increase xmax by about 10% and Pmax by
about 0.5 percentage points.
The overall shape as well as the amplitude of the curves
are found to show strong similarities for all PRUDENCE
RCMs (cf. Table 2). The crossover point xc is similar for
all models with the possible exception of the HadRM
model with xc shifted towards lighter precipitation. The
crossing percentile is roughly 60% in most models, which
agrees better with the theory presented in Gutowski et al.
(2007) than the model results they analysed. This may be
0 20 40 60 80 100
10−5
10−4
10−3
10−2
10−1
Bin [mm day−1]
Nor
mal
ized
Pre
cipi
tatio
nControl 1961−1990Scenario 2071−2100
Fig. 4 Binned normalised precipitations for the full HIRHAM_D
land region covering 4,150 grid points. Square symbols refer to the
1961–1990 control run and pluses represent the 2071–2100 scenario
run. The arrow marks the crossover point xc at 10.4 mm day-1
separating increasing from decreasing contributions to the normalized
spectrum
Table 2 Characterising parameters for the scenario minus control
difference for the ten RCMs (cf. Fig. 5 for the HIRHAM_D model)
using their full individual land region
Institute/model A- A+ xc Pxcxmax Pmax xe Nmax
DMI/HIRHAM_D -0.72 0.22 10.4 69.2 64 99.7 25 3.2
ETH/CHRM -0.66 0.13 10.8 61.0 73 99.2 27 4.5
GKSS/CLM -0.82 0.17 11.5 60.0 85 99.4 26 4.8
HC/HadRM -0.95 0.14 8.4 47.8 90 99.4 23 4.9
ICTP/RegCM -0.86 0.15 12.0 59.7 87 99.3 21 4.8
KNMI/RACMO -0.65 0.14 12.7 64.1 74 99.6 27 3.6
METNO/
HIRHAM_M
-0.90 0.16 10.5 58.6 86 98.8 30 7.5
MPI/REMO -1.05 0.19 11.2 64.2 75 99.5 24 4.2
SMHI/RCAO -0.61 0.12 10.9 62.5 64 99.8 26 2.2
UCM/PROMES -0.84 0.16 11.7 58.8 81 98.9 18 5.4
The parameters from left to right are maximum negative amplitude,
A- (%); maximum positive amplitude, A+ (%); crossing-point value,
xc (mm day-1); crossing-point percentile, Pxc(%); largest significant
PDF change, xmax (mm day-1); largest significant percentile, Pmax
(%); extreme precipitation threshold, xe (mm day-1); and average
number of events above the largest significant PDF change per year,
Nmax
0 20 40 60 80 100
−0.7
−0.6
−0.5
−0.4
−0.3
−0.2
−0.1
0
0.1
0.2
Bin [mm day−1]
Nor
mal
ized
Pre
cipi
tatio
n C
hang
e [%
]
Pmax
=99.7%
Px
c
=69.2%
40 50 60 70 80
0
0.02
0.04
0.06
Fig. 5 Binned normalised precipitation change (scenario minus
control run) for the full HIRHAM_D land region. The error barsare calculated using Eq. 1. The curve’s crossover point xc is
10.4 mm day-1 with a corresponding crossover percentile Pxcof
69.2%. The percentile value Pmax of 99.7% relates to the largest
significant PDF change xmax of 64 mm day-1 as shown by the inset(see Table 2)
F. Boberg et al.: Improved confidence in climate change projections of precipitation
123
due in part to the longer sampling periods used here
(30 years) versus the 9-year periods they analysed. Inves-
tigating the crossover points for the individual sub-regions
gave values in the interval 9–13 mm day-1 for all models
and for all sub-regions except IP, AL, and MD. Here the
values were in the range 14–28 mm day-1 (Boberg et al.
2007).
Table 2 shows that the largest significant PDF change is
in the range 64–90 mm day-1 at an average percentile well
above 99%. Note that when comparing the error bars in the
insert of Fig. 5 with the variance of the PDF change, we
see that the error estimates are conservative (i.e. larger than
the given variance of the curve) leading to an underesti-
mation of xmax and Pmax.
Also given in Table 2 is the threshold for extreme
events, adopting the definition by Liebmann et al. (2001)
as days with precipitation exceeding 4% of the mean
annual total precipitation for the region in question. This
definition accounts for spatially varying climatologies and
the 4% threshold is chosen to ensure that extreme events
occur relatively rarely. We see that the largest significant
PDF change for the full PRUDENCE model regions is
clearly above the threshold for extreme precipitation. The
rightmost column of Table 2 gives the average number of
days Nmax per year with precipitation exceeding xmax, after
correction for the number of uncorrelated areas within the
individual full land regions. Nmax is in the range 2–7 events
per year, making it another measure of extreme
precipitation.
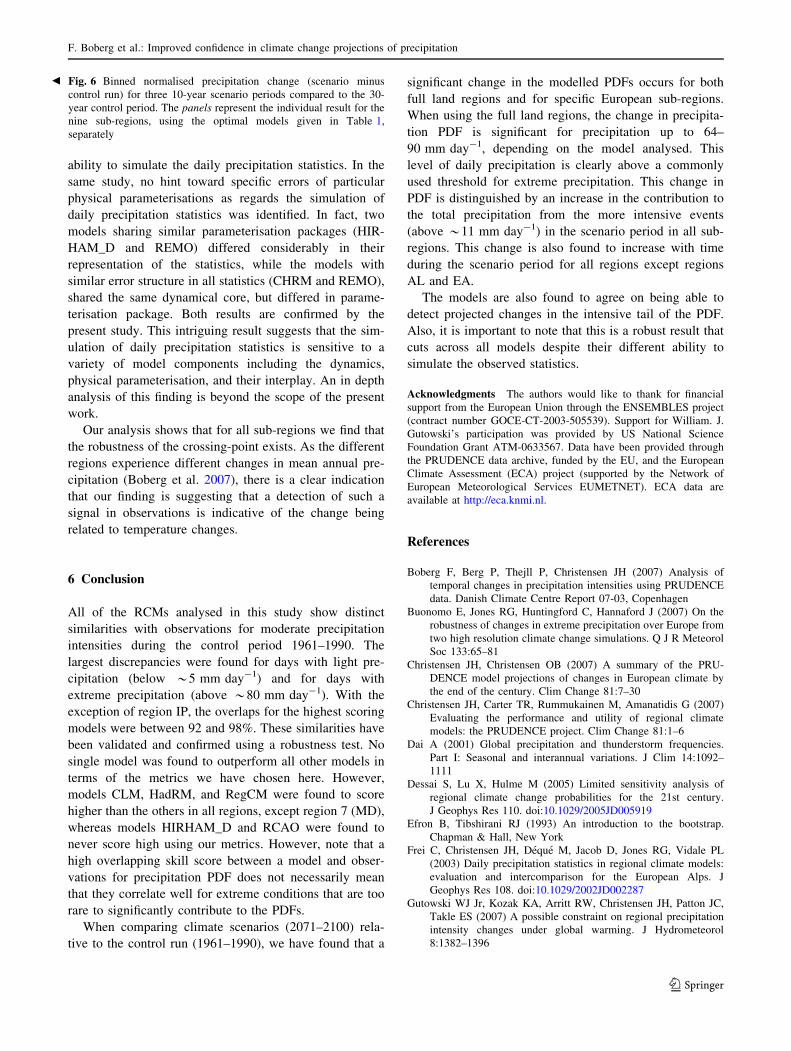
By dividing the 30-year long scenario period into three
10-year periods we investigate how xc changes with time
relative to the control run (cf. Fig. 5). Plotted in Fig. 6 are
the precipitation distribution changes for all nine sub-
regions. We use the optimal models given in Table 1 for
the nine sub-regions separately, but the results are similar
using the other models (not shown). The error bars in
Fig. 6 are calculated using Eq. 1, where M is between 124
and 1,608 depending on the size of the sub-region and U is
between 1.8 and 12.3 depending on the size and extent of
the sub-region in question. No region shows any clear
temporal change in xc which is in accordance with scenario
precipitation theory where this consistent change can be
described by a gamma distribution having a single transi-
tion point between precipitation rates that contribute more/
less to the total precipitation (Gutowski et al. 2007).
Notable is that the amplitude of the difference between the
10-year scenario periods and the control run is increasing
with time. As the mean temperature over most of the
European domain is slowly increasing within the 30 year
time slice 2071–2100, this is an indication that changes in
the precipitation intensities are approximately linearly
linked with the degree of warming. Moreover, this
dependency is in general strong enough to overcome
natural variability. Exceptions to this general behaviour are
seen for the AL and EA sub-regions where no clear tem-
poral change is seen.
For the six regions and models with a distinct PDF
change profile in Fig. 6 similar to the one given in Fig. 5,
we calculate xmax and xe (cf. Table 2). The values are BI:
37 (41) mm day-1, FR: 38 (30) mm day-1, ME: 38
(37) mm day-1, SC: 52 (32) mm day-1, EA: 46
(31) mm day-1, and EUx: 65 (25) mm day-1. With the
exception for region BI, the PDF changes described in
Fig. 5 and Table 2 are also valid for extreme precipitation
for individual sub-regions, using the definition by Lieb-
mann et al. (2001).
5 Discussion
Extreme precipitation has important effects on society and,
therefore, is it of great interest to determine the extreme
precipitation levels with significant scenario change. In this
study we used bin sizes of 1 mm day-1 when calculating
the PDFs. According to Eq. 1, the error in PDF change will
decrease when the number of values in a particular bin
increases. By making the bin errors smaller, thereby
increasing the largest significant PDF change xmax, we
make an attempt to find the maximum precipitation for
which the found precipitation change is significant. We,
therefore, calculated PDFs using bin sizes of 1, 2, 3, 5 and
8 mm day-1, respectively, for the HIRHAM_D model.
The corresponding xmax values for these bin sizes are 64,
73, 79, 88 and 100 mm day-1 (cf. Table 2). The relative
increase in xmax for bin sizes above 8 mm day-1 turned out
to be smaller than the relative increase in bin size and,
therefore, not of further interest. The equivalent values for
Pmax and Nmax (cf. Table 2), for HIRHAM_D, when using
PDF bin sizes of 8 mm day-1 are 99.95% and 0.34, values
that characterise very extreme conditions.
The results presented here can now be used in two ways.
First, we can estimate precipitation PDFs for the scenario
period 2071–2100 using models with varying scores for the
control period and then use the robustness of change in the
PDFs to assess future precipitation distribution. Secondly,
we can use the analysing and validation methods described
in this study on the upcoming ENSEMBLES RCM models
(Hewitt 2005) and make similar evaluations for the full
twenty-first century using its model data. Furthermore, the
ENSEMBLES RCM data will be validated using a high-
resolution observational dataset specially produced for the
task (Haylock et al. 2008).
In the present analysis, no attempt has been given to
address seasonal variation in the ability to simulate pre-
cipitation intensities. However, as found by Frei et al.
(2003) there appears to be substantial seasonality in the
F. Boberg et al.: Improved confidence in climate change projections of precipitation
123

0 5 10 15 20 25 30 35 40 45 50
−1.2
−0.9
−0.6
−0.3
0
0.3
Bin [mm day−1]
Nor
mal
ized
Pre
cipi
tatio
n C
hang
e [%
]R1 BI − RegCM
2071−20802081−20902091−2100
0 5 10 15 20 25 30 35 40 45 50
−1.2
−0.9
−0.6
−0.3
0
0.3
Bin [mm day−1]
Nor
mal
ized
Pre
cipi
tatio
n C
hang
e [%
]
R2 IP − HadRM
2071−20802081−20902091−2100
0 5 10 15 20 25 30 35 40 45 50
−1.2
−0.9
−0.6
−0.3
0
0.3
Bin [mm day−1]
Nor
mal
ized
Pre
cipi
tatio
n C
hang
e [%
]
R3 FR − CLM
2071−20802081−20902091−2100
0 5 10 15 20 25 30 35 40 45 50
−1.2
−0.9
−0.6
−0.3
0
0.3
Bin [mm day−1]N
orm
aliz
ed P
reci
pita
tion
Cha
nge
[%]
R4 ME − RegCM
2071−20802081−20902091−2100
0 5 10 15 20 25 30 35 40 45 50
−1.2
−0.9
−0.6
−0.3
0
0.3
Bin [mm day−1]
Nor
mal
ized
Pre
cipi
tatio
n C
hang
e [%
]
R5 SC − HadRM
2071−20802081−20902091−2100
0 5 10 15 20 25 30 35 40 45 50
−1.2
−0.9
−0.6
−0.3
0
0.3
Bin [mm day−1]
Nor
mal
ized
Pre
cipi
tatio
n C
hang
e [%
]
R6 AL − HadRM
2071−20802081−20902091−2100
0 5 10 15 20 25 30 35 40 45 50
−1.2
−0.9
−0.6
−0.3
0
0.3
Bin [mm day−1]
Nor
mal
ized
Pre
cipi
tatio
n C
hang
e [%
]
R7 MD − PROMES
2071−20802081−20902091−2100
0 5 10 15 20 25 30 35 40 45 50
−1.2
−0.9
−0.6
−0.3
0
0.3
Bin [mm day−1]
Nor
mal
ized
Pre
cipi
tatio
n C
hang
e [%
]
R8 EA − RegCM
2071−20802081−20902091−2100
0 5 10 15 20 25 30 35 40 45 50
−1.2
−0.9
−0.6
−0.3
0
0.3
Nor
mal
ized
Pre
cipi
tatio
n C
hang
e [%
]
R9 EUx − CLM
2071−20802081−20902091−2100
F. Boberg et al.: Improved confidence in climate change projections of precipitation
123
ability to simulate the daily precipitation statistics. In the
same study, no hint toward specific errors of particular
physical parameterisations as regards the simulation of
daily precipitation statistics was identified. In fact, two
models sharing similar parameterisation packages (HIR-
HAM_D and REMO) differed considerably in their
representation of the statistics, while the models with
similar error structure in all statistics (CHRM and REMO),
shared the same dynamical core, but differed in parame-
terisation package. Both results are confirmed by the
present study. This intriguing result suggests that the sim-
ulation of daily precipitation statistics is sensitive to a
variety of model components including the dynamics,
physical parameterisation, and their interplay. An in depth
analysis of this finding is beyond the scope of the present
work.
Our analysis shows that for all sub-regions we find that
the robustness of the crossing-point exists. As the different
regions experience different changes in mean annual pre-
cipitation (Boberg et al. 2007), there is a clear indication
that our finding is suggesting that a detection of such a
signal in observations is indicative of the change being
related to temperature changes.
6 Conclusion
All of the RCMs analysed in this study show distinct
similarities with observations for moderate precipitation
intensities during the control period 1961–1990. The
largest discrepancies were found for days with light pre-
cipitation (below *5 mm day-1) and for days with
extreme precipitation (above *80 mm day-1). With the
exception of region IP, the overlaps for the highest scoring
models were between 92 and 98%. These similarities have
been validated and confirmed using a robustness test. No
single model was found to outperform all other models in
terms of the metrics we have chosen here. However,
models CLM, HadRM, and RegCM were found to score
higher than the others in all regions, except region 7 (MD),
whereas models HIRHAM_D and RCAO were found to
never score high using our metrics. However, note that a
high overlapping skill score between a model and obser-
vations for precipitation PDF does not necessarily mean
that they correlate well for extreme conditions that are too
rare to significantly contribute to the PDFs.
When comparing climate scenarios (2071–2100) rela-
tive to the control run (1961–1990), we have found that a
significant change in the modelled PDFs occurs for both
full land regions and for specific European sub-regions.
When using the full land regions, the change in precipita-
tion PDF is significant for precipitation up to 64–
90 mm day-1, depending on the model analysed. This
level of daily precipitation is clearly above a commonly
used threshold for extreme precipitation. This change in
PDF is distinguished by an increase in the contribution to
the total precipitation from the more intensive events
(above *11 mm day-1) in the scenario period in all sub-
regions. This change is also found to increase with time
during the scenario period for all regions except regions
AL and EA.
The models are also found to agree on being able to
detect projected changes in the intensive tail of the PDF.
Also, it is important to note that this is a robust result that
cuts across all models despite their different ability to
simulate the observed statistics.
Acknowledgments The authors would like to thank for financial
support from the European Union through the ENSEMBLES project
(contract number GOCE-CT-2003-505539). Support for William. J.
Gutowski’s participation was provided by US National Science
Foundation Grant ATM-0633567. Data have been provided through
the PRUDENCE data archive, funded by the EU, and the European
Climate Assessment (ECA) project (supported by the Network of
European Meteorological Services EUMETNET). ECA data are
available at http://eca.knmi.nl.
References
Boberg F, Berg P, Thejll P, Christensen JH (2007) Analysis of
temporal changes in precipitation intensities using PRUDENCE
data. Danish Climate Centre Report 07-03, Copenhagen
Buonomo E, Jones RG, Huntingford C, Hannaford J (2007) On the
robustness of changes in extreme precipitation over Europe from
two high resolution climate change simulations. Q J R Meteorol
Soc 133:65–81
Christensen JH, Christensen OB (2007) A summary of the PRU-
DENCE model projections of changes in European climate by
the end of the century. Clim Change 81:7–30
Christensen JH, Carter TR, Rummukainen M, Amanatidis G (2007)
Evaluating the performance and utility of regional climate
models: the PRUDENCE project. Clim Change 81:1–6
Dai A (2001) Global precipitation and thunderstorm frequencies.
Part I: Seasonal and interannual variations. J Clim 14:1092–
1111
Dessai S, Lu X, Hulme M (2005) Limited sensitivity analysis of
regional climate change probabilities for the 21st century.
J Geophys Res 110. doi:10.1029/2005JD005919
Efron B, Tibshirani RJ (1993) An introduction to the bootstrap.
Chapman & Hall, New York
Frei C, Christensen JH, Deque M, Jacob D, Jones RG, Vidale PL
(2003) Daily precipitation statistics in regional climate models:
evaluation and intercomparison for the European Alps. J
Geophys Res 108. doi:10.1029/2002JD002287
Gutowski WJ Jr, Kozak KA, Arritt RW, Christensen JH, Patton JC,
Takle ES (2007) A possible constraint on regional precipitation
intensity changes under global warming. J Hydrometeorol
8:1382–1396
Fig. 6 Binned normalised precipitation change (scenario minus
control run) for three 10-year scenario periods compared to the 30-
year control period. The panels represent the individual result for the
nine sub-regions, using the optimal models given in Table 1,
separately
b
F. Boberg et al.: Improved confidence in climate change projections of precipitation
123

Haylock MR, Hofstra N, Klein Tank AMG, Klok EJ, Jones PD, New
M (2008) A European daily high-resolution gridded dataset of
surface temperature and precipitation for 1950–2006. J Geophys
Res (submitted)
Hewitt CD (2005) The ENSEMBLES project: providing ensemble-
based predictions of climate changes and their impacts. EGGS
Newsl 13:22–25
Klein Tank AMG et al. (2002) Daily dataset of 20th-century surface
air temperature and precipitation series for the European Climate
Assessment. Int J Climatol 22:1441–1453
Liebmann B, Jones C, de Carvalho LMV (2001) Interannual
variability of daily extreme precipitation events in the state of
Sao Paulo, Brazil. J Clim 14:208–218
Nakicenovic N, Alcamo J, Davis J, de Vries B, Fenhann J, Gaffin S,
Gregory K, Grubler A, Jung TY, Kram T, Lebre La Rovere E,
Michaelis L, Mori S, Morita T, Pepper W, Pitcher H, Price L,
Riahi K, Roehrl A, Rogner H-H, Sankovski A, Schlesinger M,
Shukla P, Smith S, Swart R, van Rooijen S, Victor N, Dadi Z
(2000) Special report on emission scenarios. A special report of
Working Group III for the intergovernmental panel on climate
change. Cambridge University Press, London
Perkins SE, Pitman AJ, Holbrook NJ, McAneney J (2007) Evaluation
of the AR4 climate models’ simulated daily maximum temper-
ature, minimum temperature, and precipitation over Australia
using probability density functions. J Clim 20:4356–4376
Pope VD, Gallaini ML, Rowntree PR, Stratton RA (2000) The impact
of new physical parametrizations in the Hadley centre climate
model: HadAM3. Clim Dyn 16:123–146
Sun Y, Solomon S, Dai A, Portmann RW (2006) How often does it
rain?. J Clim 19:916–934
Sun Y, Solomon S, Dai A, Portmann RW (2007) How often will it
rain?. J Clim 20:4801–4818
F. Boberg et al.: Improved confidence in climate change projections of precipitation
123