Polymeric Thermochromic Dye for Improvement of Asphalt ...
197
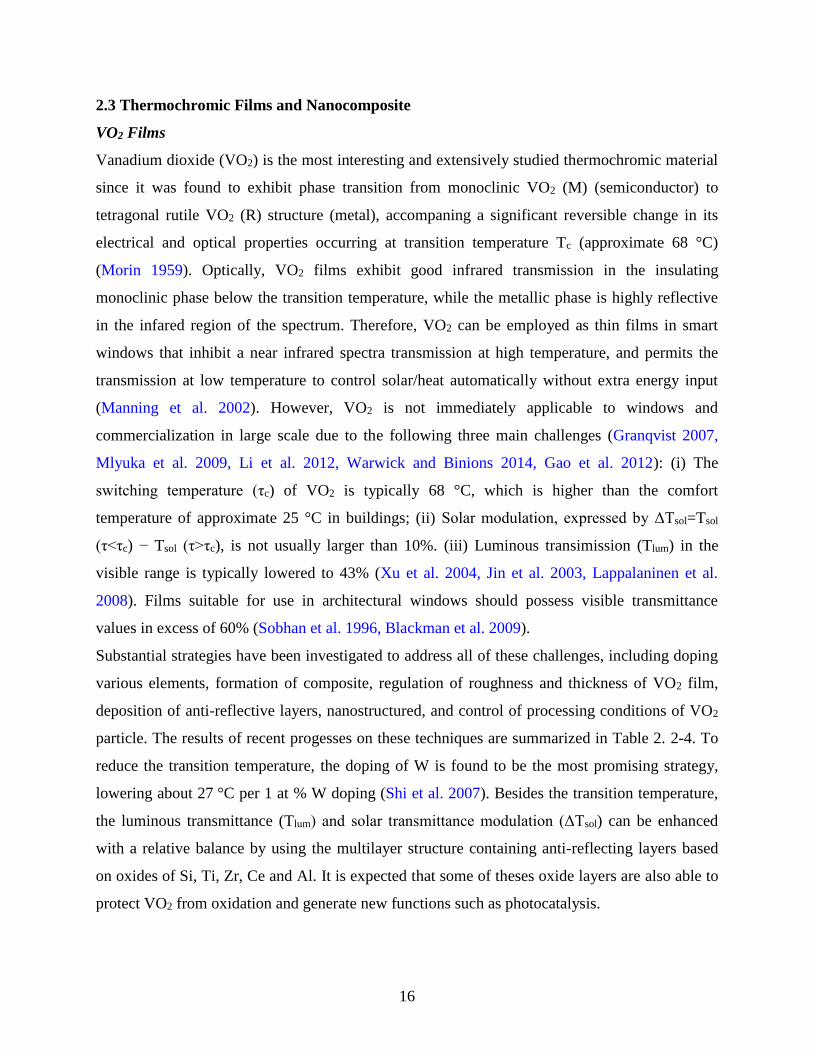
UV, Visible Infrared UV, Visible Infrared Below the transition temperature Above the transition temperature Solar Radiation Increase in infrared reflection Solar Radiation Asphalt binder Thermochromic powder 0:00 3:00 6:00 9:00 12:00 15:00 18:00 21:00 24:00 -8 -6 -4 -2 0 2 4 6 8 Surface Temperature Difference (C) Time black asphalt binder blue asphalt binder red asphalt binder Polymeric Thermochromic Dye for Improvement of Asphalt Pavement Durability Prepared by: Xiong (Bill) Yu and Jianying Hu Prepared for: The Ohio Department of Transportation, Office of Statewide Planning & Research State Job Number 134661 January 2017 Final Report
-
Upload
khangminh22 -
Category
Documents
-
view
1 -
download
0
Transcript of Polymeric Thermochromic Dye for Improvement of Asphalt ...
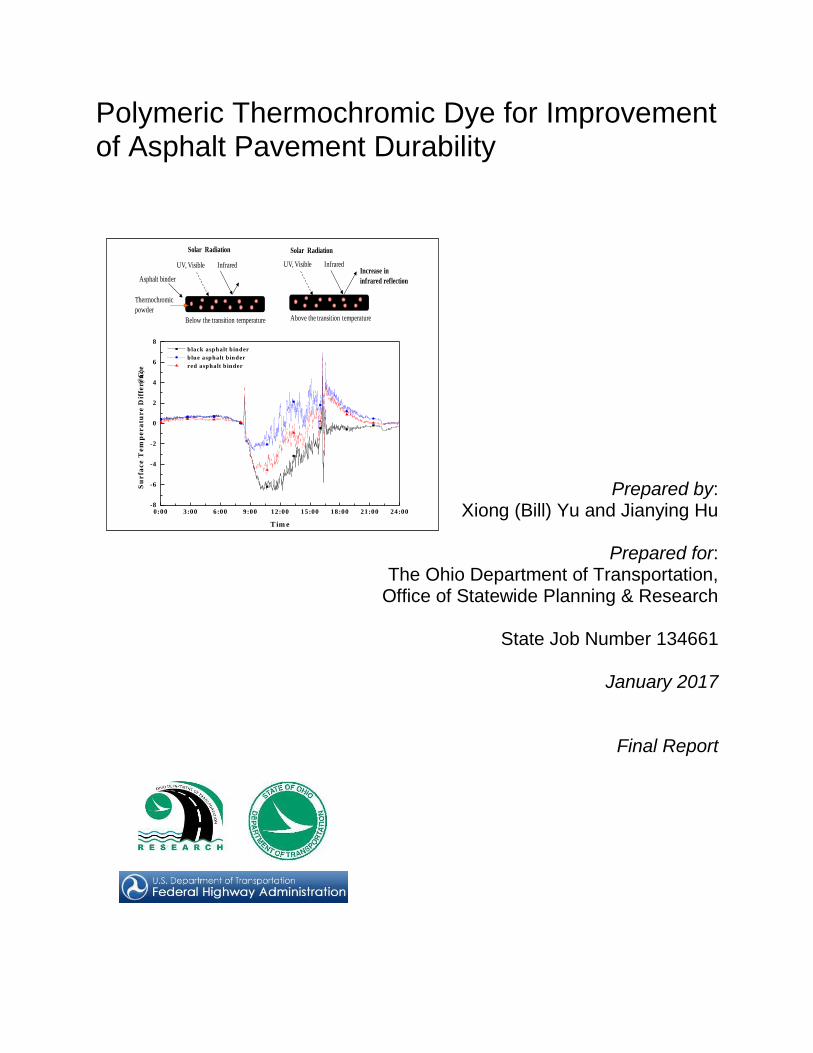
UV, Visible Infrared UV, Visible Infrared
Below the transition temperature Above the transition temperature
Solar Radiation
Increase in
infrared reflection
Solar Radiation
Asphalt binder
Thermochromic
powder
0:00 3:00 6:00 9:00 12:00 15:00 18:00 21:00 24:00-8
-6
-4
-2
0
2
4
6
8
Su
rfa
ce
Te
mp
er
atu
re
Dif
fer
en
ce
(
C)
T im e
b lack asphalt b inder
blue asphalt b inder
red asphalt b inder
Polymeric Thermochromic Dye for Improvement of Asphalt Pavement Durability
Prepared by: Xiong (Bill) Yu and Jianying Hu
Prepared for:
The Ohio Department of Transportation, Office of Statewide Planning & Research
State Job Number 134661
January 2017
Final Report
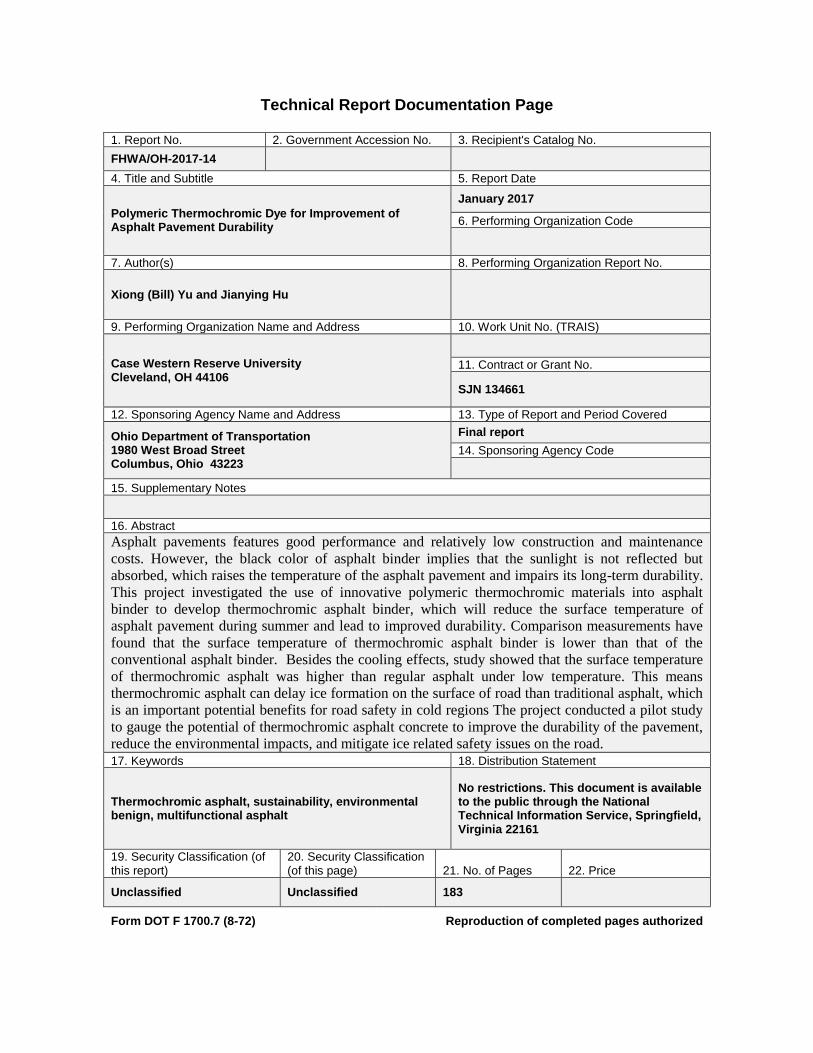
Technical Report Documentation Page
1. Report No. 2. Government Accession No. 3. Recipient's Catalog No.
FHWA/OH-2017-14
4. Title and Subtitle 5. Report Date
Polymeric Thermochromic Dye for Improvement of Asphalt Pavement Durability
January 2017
6. Performing Organization Code
7. Author(s) 8. Performing Organization Report No.
Xiong (Bill) Yu and Jianying Hu
9. Performing Organization Name and Address 10. Work Unit No. (TRAIS)
Case Western Reserve University Cleveland, OH 44106
11. Contract or Grant No.
SJN 134661
12. Sponsoring Agency Name and Address 13. Type of Report and Period Covered
Ohio Department of Transportation 1980 West Broad Street Columbus, Ohio 43223
Final report
14. Sponsoring Agency Code
15. Supplementary Notes
16. Abstract
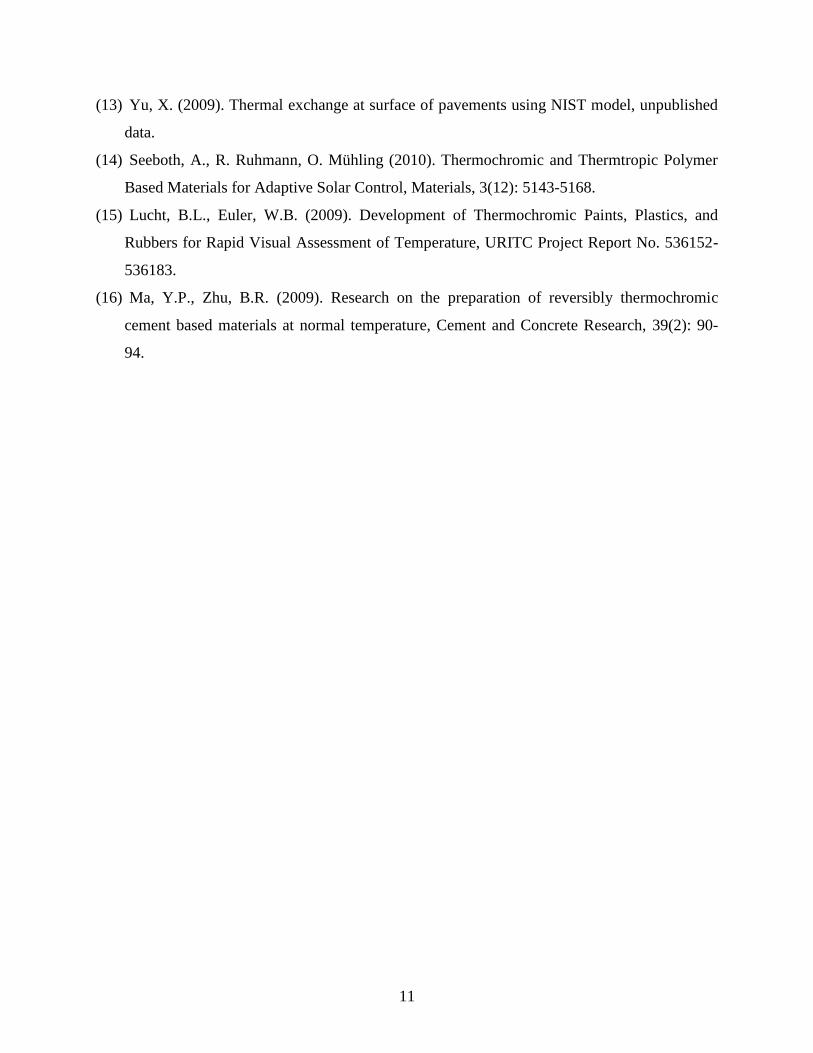
Asphalt pavements features good performance and relatively low construction and maintenance
costs. However, the black color of asphalt binder implies that the sunlight is not reflected but
absorbed, which raises the temperature of the asphalt pavement and impairs its long-term durability.
This project investigated the use of innovative polymeric thermochromic materials into asphalt
binder to develop thermochromic asphalt binder, which will reduce the surface temperature of
asphalt pavement during summer and lead to improved durability. Comparison measurements have
found that the surface temperature of thermochromic asphalt binder is lower than that of the
conventional asphalt binder. Besides the cooling effects, study showed that the surface temperature
of thermochromic asphalt was higher than regular asphalt under low temperature. This means
thermochromic asphalt can delay ice formation on the surface of road than traditional asphalt, which
is an important potential benefits for road safety in cold regions The project conducted a pilot study
to gauge the potential of thermochromic asphalt concrete to improve the durability of the pavement,
reduce the environmental impacts, and mitigate ice related safety issues on the road. 17. Keywords 18. Distribution Statement
Thermochromic asphalt, sustainability, environmental benign, multifunctional asphalt
No restrictions. This document is available to the public through the National Technical Information Service, Springfield, Virginia 22161
19. Security Classification (of this report)
20. Security Classification (of this page) 21. No. of Pages 22. Price
Unclassified Unclassified 183
Form DOT F 1700.7 (8-72) Reproduction of completed pages authorized
Polymeric Thermochromic Dye for Improvement of Asphalt Pavement Durability
Prepared by:
Xiong (Bill) Yu, Ph.D., P.E., Professor Jianying Hu, Graduate Research Assistant
Department of Civil Engineering, Case Western Reserve University
January 2017
Prepared in cooperation with the Ohio Department of Transportation and the U.S. Department of Transportation, Federal Highway Administration
The contents of this report reflect the views of the author(s) who is (are) responsible for the facts and the
accuracy of the data presented herein. The contents do not necessarily reflect the official views or
policies of the Ohio Department of Transportation or the Federal Highway Administration. This report
does not constitute a standard, specification, or regulation.

Acknowledgments
The project team would like to acknowledge the contributions, guidance and assistance of the Ohio DOT
engineers who worked as Subject Matter Experts (SMEs) and provided excellent technical guidance
during the course of this study. The SMEs include David Powers, Adam Au, Eric Biehl, Roger Green
(retired), Lloyd Welker (retired), and Lisa Zigmund.
Thanks are also extended to the project partner the Ohio Flexible Pavement Association. Kokosing
Materials Inc. provided excellent technical guidance and assisted the research team with their rich
collection of expertise and testing facilities during the course of this study. The help from these
organizations are highly appreciated.
We also would like to thank Ms. Cynthia Gerst, Ms. Jill Martindale, and Ms. Kelly Nye of Ohio DOT
Office of Statewide Planning and Research for the excellent management of the project program and
always provided quick responses to our project-related inquiries.
EXECUTIVE SUMMARY
Asphalt pavements features good performance and relatively low construction and maintenance costs.
However, the black color of asphalt binder implies that the sunlight is not reflected but absorbed, which
raises the temperature of the asphalt pavement and impairs its long-term durability. Conventional cool
pavement technologies reduce the surface temperature of roads regardless of the season. While this
provides benefit for the hot summer season, has a detrimental negative impact during the winter season.
Thermochromic materials are substances that can reversibly change their colors in response to
temperature. They reflect solar energy at high temperature and absorb that at low temperature. This
project investigated the use of innovative polymeric thermochromic materials into asphalt binder to
develop thermochromic asphalt binder, which will reduce the surface temperature of asphalt pavement
during summer and lead to improved durability. Comparison measurements have found that the surface
temperature of thermochromic asphalt binder is lower than that of the conventional asphalt binder with
maximum decrease as high as 6.6 °C during typical summer day in the northeast U.S. (i.e. Cleveland,
OH). Along with the cooling effects, the study showed that the surface temperature of thermochromic
asphalt was higher than regular asphalt under low temperature. This means thermochromic asphalt can
delay ice formation on the surface of road than traditional asphalt, which is an important potential benefits
for road safety in cold regions. The thermal, optical, and mechanical properties of the thermochromic
asphalt binders were characterized. Superpave binder grading was assigned to the thermochromic binders.
The plant production conditions for thermochromic asphalt were determined with thermal and pyrolysis
analyses. Experiments were also conducted to assess the performance of HMA prepared with
thermochromic binders. The results from the experiments indicates that thermochromic HMA can achieve
the performance requirements. The performance of the thermochromic HMA upon long term exposure
was evaluated in an outdoor set up. The results indicate that the effectiveness of the thermochromic HMA
was retained after long term exposure.
The project conducted a pilot study to gauge the potential of thermochromic asphalt concrete to
improve the durability of the pavement, reduce the environmental impacts, and mitigate ice related safety
issues on the road. This demonstrates innovation for development of sustainable and environmental
benign infrastructure.

TABLE OF CONTENTS
Chapter 1 Introduction ....................................................................................................................... 1.
1.1 Motivation for This Project ................................................................................................ 1.
1.2 Research Objectives ........................................................................................................... 1.
1.3 Research Background and Significance of the Work ........................................................ 2.
1.4 Technical Feasibility .......................................................................................................... 6.
1.5 Organization of this Report ................................................................................................ 8.
1.6 References ......................................................................................................................... 10.
Chapter 2 Literature Review: Progress on Thermochromic Materials and Applications ......... 12.
2.1 Introduction ....................................................................................................................... 12.
2.2 Catagories and Mechanisms ............................................................................................. 13.
2.3 Thermochromic Films and Nanocomposites .................................................................... 16.
2.4 Application of Thermochromic Materials ........................................................................ 26.
2.5 Conclusions and Recommendations ................................................................................ 30.
2.6 References ........................................................................................................................ 33.
Chapter 3 Preliminary Experimental Study of Thermochromic Asphalt Binder ...................... 52.
3.1 Introduction ............................................................................................................................ 52.
3.2 Experimental Design .............................................................................................................. 53.
3.3 Experimental Design to Measure the Properties and Performance of Thermochromic Binder ..
.................................................................................................................................... 55.
3.4 Thermal Performance of Thermochromic Asphalt Binder ..................................................... 56.
3.5 Results and Analyses .............................................................................................................. 57.
3.6 Summary ................................................................................................................................ 65.
3.7 References ........................................................................................................................ 66.
Chapter 4 Characterization and Empirical Analysis of the Optical Reflectance Spectra of
Thermochromic Asphalt ...................................................................................................... 69.
4.1 Introduction ............................................................................................................................ 69.
4.2 Experimental Design .............................................................................................................. 70.
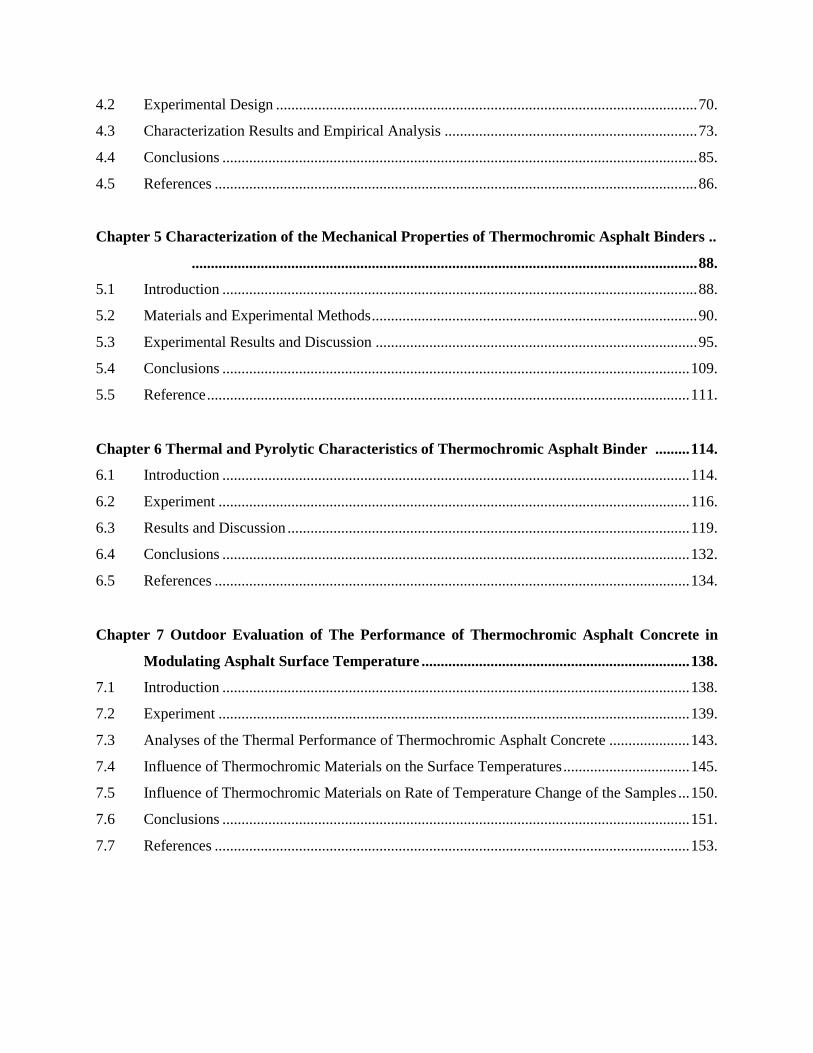
4.3 Characterization Results and Empirical Analysis .................................................................. 73.
4.4 Conclusions ............................................................................................................................ 85.
4.5 References .............................................................................................................................. 86.
Chapter 5 Characterization of the Mechanical Properties of Thermochromic Asphalt Binders ..
.................................................................................................................................... 88.
5.1 Introduction ............................................................................................................................ 88.
5.2 Materials and Experimental Methods ..................................................................................... 90.
5.3 Experimental Results and Discussion .................................................................................... 95.
5.4 Conclusions .......................................................................................................................... 109.
5.5 Reference .............................................................................................................................. 111.
Chapter 6 Thermal and Pyrolytic Characteristics of Thermochromic Asphalt Binder ......... 114.
6.1 Introduction .......................................................................................................................... 114.
6.2 Experiment ........................................................................................................................... 116.
6.3 Results and Discussion ......................................................................................................... 119.
6.4 Conclusions .......................................................................................................................... 132.
6.5 References ............................................................................................................................ 134.
Chapter 7 Outdoor Evaluation of The Performance of Thermochromic Asphalt Concrete in
Modulating Asphalt Surface Temperature ...................................................................... 138.
7.1 Introduction .......................................................................................................................... 138.
7.2 Experiment ........................................................................................................................... 139.
7.3 Analyses of the Thermal Performance of Thermochromic Asphalt Concrete ..................... 143.
7.4 Influence of Thermochromic Materials on the Surface Temperatures ................................. 145.
7.5 Influence of Thermochromic Materials on Rate of Temperature Change of the Samples ... 150.
7.6 Conclusions .......................................................................................................................... 151.
7.7 References ............................................................................................................................ 153.
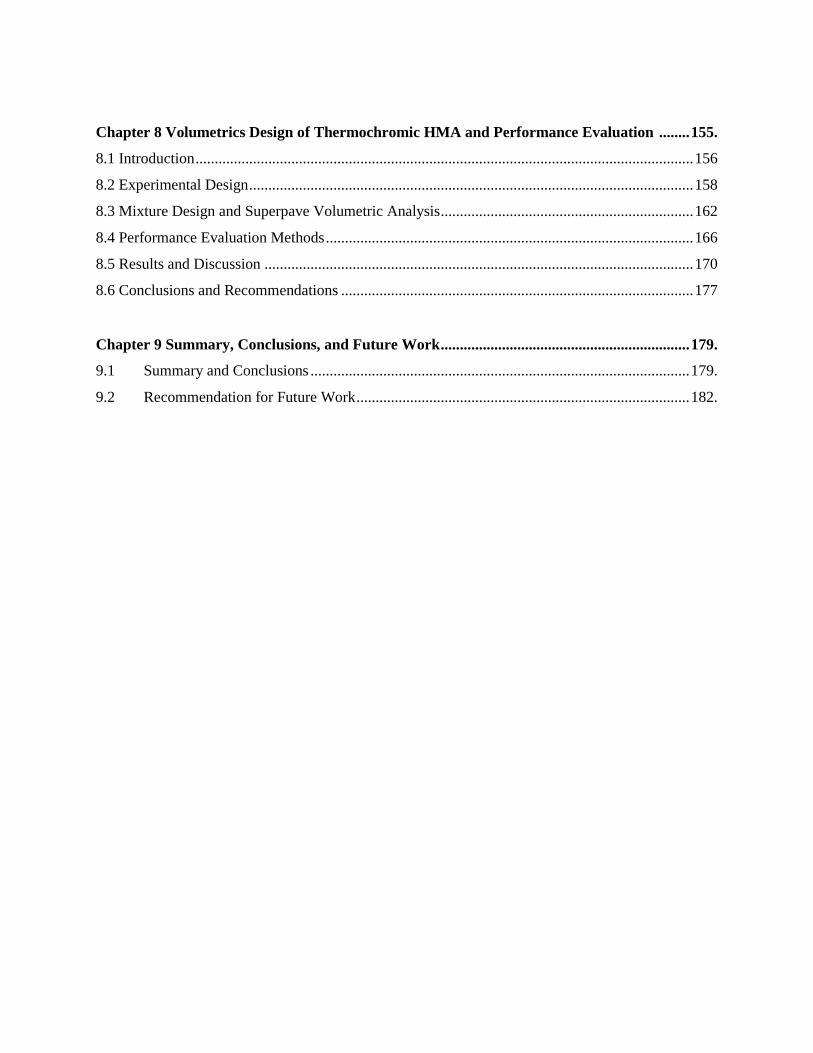
Chapter 8 Volumetrics Design of Thermochromic HMA and Performance Evaluation ........ 155.
8.1 Introduction .................................................................................................................................. 156
8.2 Experimental Design .................................................................................................................... 158
8.3 Mixture Design and Superpave Volumetric Analysis .................................................................. 162
8.4 Performance Evaluation Methods ................................................................................................ 166
8.5 Results and Discussion ................................................................................................................ 170
8.6 Conclusions and Recommendations ............................................................................................ 177
Chapter 9 Summary, Conclusions, and Future Work ................................................................. 179.
9.1 Summary and Conclusions ................................................................................................... 179.
9.2 Recommendation for Future Work ....................................................................................... 182.
LIST OF FIGURES
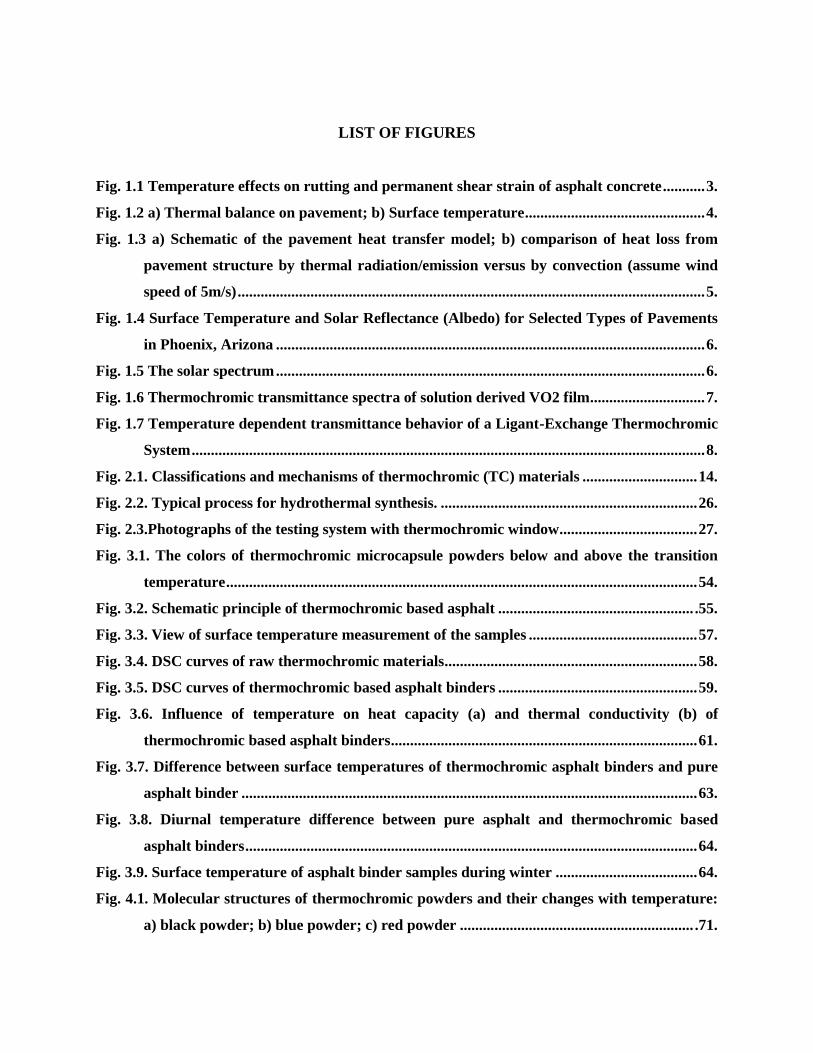
Fig. 1.1 Temperature effects on rutting and permanent shear strain of asphalt concrete ........... 3.
Fig. 1.2 a) Thermal balance on pavement; b) Surface temperature ............................................... 4.
Fig. 1.3 a) Schematic of the pavement heat transfer model; b) comparison of heat loss from
pavement structure by thermal radiation/emission versus by convection (assume wind
speed of 5m/s) .......................................................................................................................... 5.
Fig. 1.4 Surface Temperature and Solar Reflectance (Albedo) for Selected Types of Pavements
in Phoenix, Arizona ................................................................................................................ 6.
Fig. 1.5 The solar spectrum ................................................................................................................ 6.
Fig. 1.6 Thermochromic transmittance spectra of solution derived VO2 film .............................. 7.
Fig. 1.7 Temperature dependent transmittance behavior of a Ligant-Exchange Thermochromic
System ...................................................................................................................................... 8.
Fig. 2.1. Classifications and mechanisms of thermochromic (TC) materials .............................. 14.
Fig. 2.2. Typical process for hydrothermal synthesis. ................................................................... 26.
Fig. 2.3.Photographs of the testing system with thermochromic window.................................... 27.
Fig. 3.1. The colors of thermochromic microcapsule powders below and above the transition
temperature ........................................................................................................................... 54.
Fig. 3.2. Schematic principle of thermochromic based asphalt ................................................... .55.
Fig. 3.3. View of surface temperature measurement of the samples ............................................ 57.
Fig. 3.4. DSC curves of raw thermochromic materials .................................................................. 58.
Fig. 3.5. DSC curves of thermochromic based asphalt binders .................................................... 59.
Fig. 3.6. Influence of temperature on heat capacity (a) and thermal conductivity (b) of
thermochromic based asphalt binders ................................................................................ 61.
Fig. 3.7. Difference between surface temperatures of thermochromic asphalt binders and pure
asphalt binder ....................................................................................................................... 63.
Fig. 3.8. Diurnal temperature difference between pure asphalt and thermochromic based
asphalt binders ...................................................................................................................... 64.
Fig. 3.9. Surface temperature of asphalt binder samples during winter ..................................... 64.
Fig. 4.1. Molecular structures of thermochromic powders and their changes with temperature:
a) black powder; b) blue powder; c) red powder ............................................................. .71.
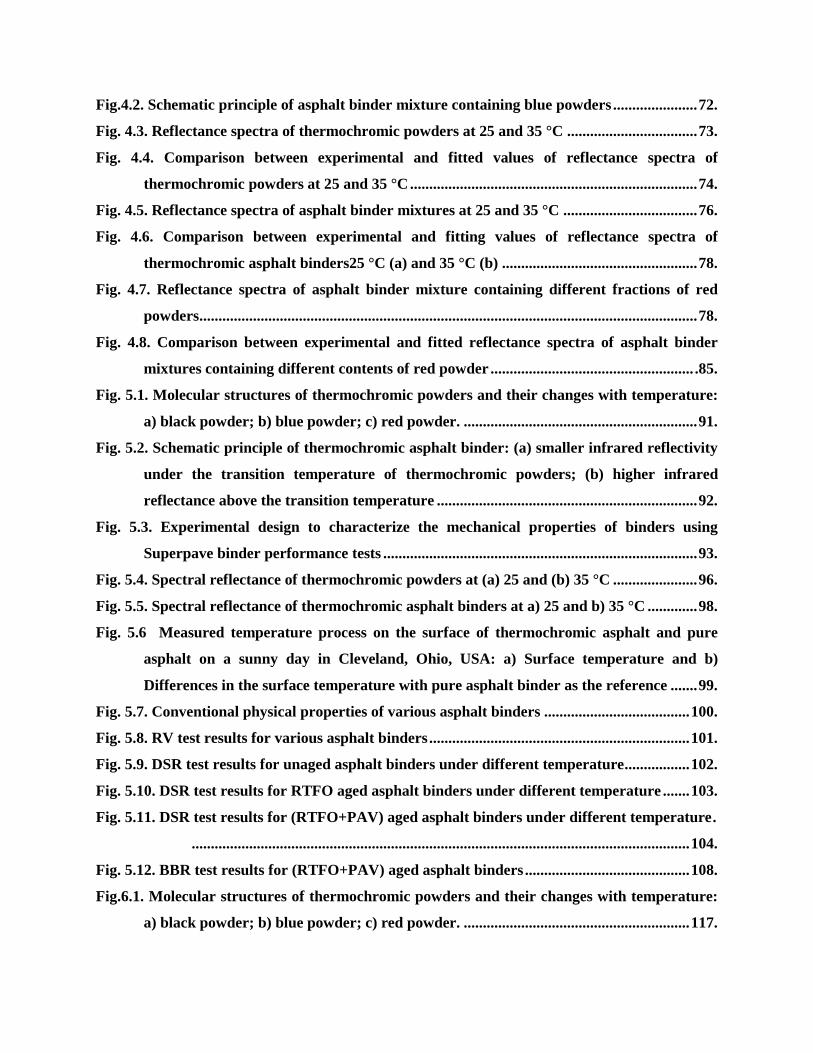
Fig.4.2. Schematic principle of asphalt binder mixture containing blue powders ...................... 72.
Fig. 4.3. Reflectance spectra of thermochromic powders at 25 and 35 °C .................................. 73.
Fig. 4.4. Comparison between experimental and fitted values of reflectance spectra of
thermochromic powders at 25 and 35 °C ........................................................................... 74.
Fig. 4.5. Reflectance spectra of asphalt binder mixtures at 25 and 35 °C ................................... 76.
Fig. 4.6. Comparison between experimental and fitting values of reflectance spectra of
thermochromic asphalt binders25 °C (a) and 35 °C (b) ................................................... 78.
Fig. 4.7. Reflectance spectra of asphalt binder mixture containing different fractions of red
powders .................................................................................................................................. 78.
Fig. 4.8. Comparison between experimental and fitted reflectance spectra of asphalt binder
mixtures containing different contents of red powder ..................................................... .85.
Fig. 5.1. Molecular structures of thermochromic powders and their changes with temperature:
a) black powder; b) blue powder; c) red powder. ............................................................. 91.
Fig. 5.2. Schematic principle of thermochromic asphalt binder: (a) smaller infrared reflectivity
under the transition temperature of thermochromic powders; (b) higher infrared
reflectance above the transition temperature .................................................................... 92.
Fig. 5.3. Experimental design to characterize the mechanical properties of binders using
Superpave binder performance tests .................................................................................. 93.
Fig. 5.4. Spectral reflectance of thermochromic powders at (a) 25 and (b) 35 °C ...................... 96.
Fig. 5.5. Spectral reflectance of thermochromic asphalt binders at a) 25 and b) 35 °C ............. 98.
Fig. 5.6 Measured temperature process on the surface of thermochromic asphalt and pure
asphalt on a sunny day in Cleveland, Ohio, USA: a) Surface temperature and b)
Differences in the surface temperature with pure asphalt binder as the reference ....... 99.
Fig. 5.7. Conventional physical properties of various asphalt binders ...................................... 100.
Fig. 5.8. RV test results for various asphalt binders .................................................................... 101.
Fig. 5.9. DSR test results for unaged asphalt binders under different temperature ................. 102.
Fig. 5.10. DSR test results for RTFO aged asphalt binders under different temperature ....... 103.
Fig. 5.11. DSR test results for (RTFO+PAV) aged asphalt binders under different temperature .
.................................................................................................................................. 104.
Fig. 5.12. BBR test results for (RTFO+PAV) aged asphalt binders ........................................... 108.
Fig.6.1. Molecular structures of thermochromic powders and their changes with temperature:
a) black powder; b) blue powder; c) red powder. ........................................................... 117.

Fig. 6.2. Schematic principle of thermochromic asphalt binder: (a) under the transition
temperature of thermochromic powders; (b) higher infrared reflectance above the
transition temperature. ...................................................................................................... 118.
Fig. 6.3. Surface Images of (a) untreated pure asphalt binder; (b) untreated red asphalt binder;
(c) treated red asphalt binder after subjected to 200 °C for 2h ..................................... 120.
Fig. 6.4. Infrared spectra before and after thermal treatment: (a) black powder, (b) blue
powder, (c) red powder ...................................................................................................... 121.
Fig. 6.5. Infrared spectra before and after thermal treatment: (a) pure asphalt binder, (b) black
asphalt binder, (c) blue asphalt binder, (d) red asphalt binder ..................................... 122.
Fig. 6.6. TGA (a) and DTG (b) curves of thermochromic powders............................................ 124.
Fig. 6.7. TGA (a) and DTG (b) curves of different asphalt binder samples .............................. 125.
Fig. 6.8. Reflectance spectra of both untreated thermochromic powders (a) and untreated
thermochromic asphalt binders (b) .................................................................................. 129.
Fig. 6.9. Influence of thermal treatment temperature and time on reflectance spectra of blue
asphalt binder a) 30 minutes, b) 1 hour; c) 2 hours......................................................... 130.
Fig. 7.1. Molecular structures of thermochromic powders and their changes with temperature:
a) black powder; b) blue powder; c) red powder ............................................................ 140.
Fig. 7.2. Photo of the samples on the platform ............................................................................. 141.
Fig. 7.3. The monthly average solar radiation on a horizontal surface for April, May and June,
2014 .................................................................................................................................. 142.
Fig. 7.4. Temperature reduction versus mean surface temperatures of (a) black, (b) blue and (c)
red thermochromic asphalt concrete ................................................................................ 147.
Fig. 7.5. The comparison between daily (a) and nocturnal (b) temperature fluctuations (ΔT0) of
conventional and thermochromic asphalt concrete during the experimental period .. 148.
Fig. 7.6. Reduction of surface temperature in the day and increase of surface temperature in
the evening by using (a) black, (b) blue and (c) red asphalt concrete ............................ 149.
Fig. 7.7. Surface temperature of various asphalt concretes on a typically summer day (a) and its
heating (b) and cooling process (c) .................................................................................... 151.
Fig. 8.1. Molecular structures of thermochromic powders and their changes with temperature: a)
black powder; b) blue powder; c) red powder ....................................................................... 160.
Fig. 8.2. Characteristics of trial asphalt mixtures ............................................................................... 164.
Fig. 8.3. Photos of modified HMA samples .......................................................................................... 165.
Fig. 8.4. Schematic view of the APA test .............................................................................................. 168.
Fig. 8.5. Photos of rutted surface (left) and exposed aggregate surface (right) of HMA mixtures . 169.
Fig. 8.6. Rutting depth of the HMA over 8000 loading cycles ............................................................ 172.
Fig. 8.7. Reflection spectra of original HMA samples ........................................................................ 173.
Fig. 8.8. Reflection spectra on exposed aggregate surfaces of HMA samples .................................. 175.
Fig. 8.9. Comparison of reflection spectra between original and rutted HMA mixtures ................ 176.
Fig. 8.10. Diffusion of light on the rough surface ................................................................................ 177.
LIST OF TABLES
Table 2.1. Examples of organic-inorganic hybrid thermochromic materals ............................... 15.
Table 2.2. Strategies for decrease of phase transition temperature (τc) of VO2 composite ...... 17.
Table 2.3. Strategies for enhancement of solar modulation (ΔTsol) ............................................ 19.
Table 2.4. Strategies for enhancement of luminous transition (Tlum) of VO2 films .................. 20.
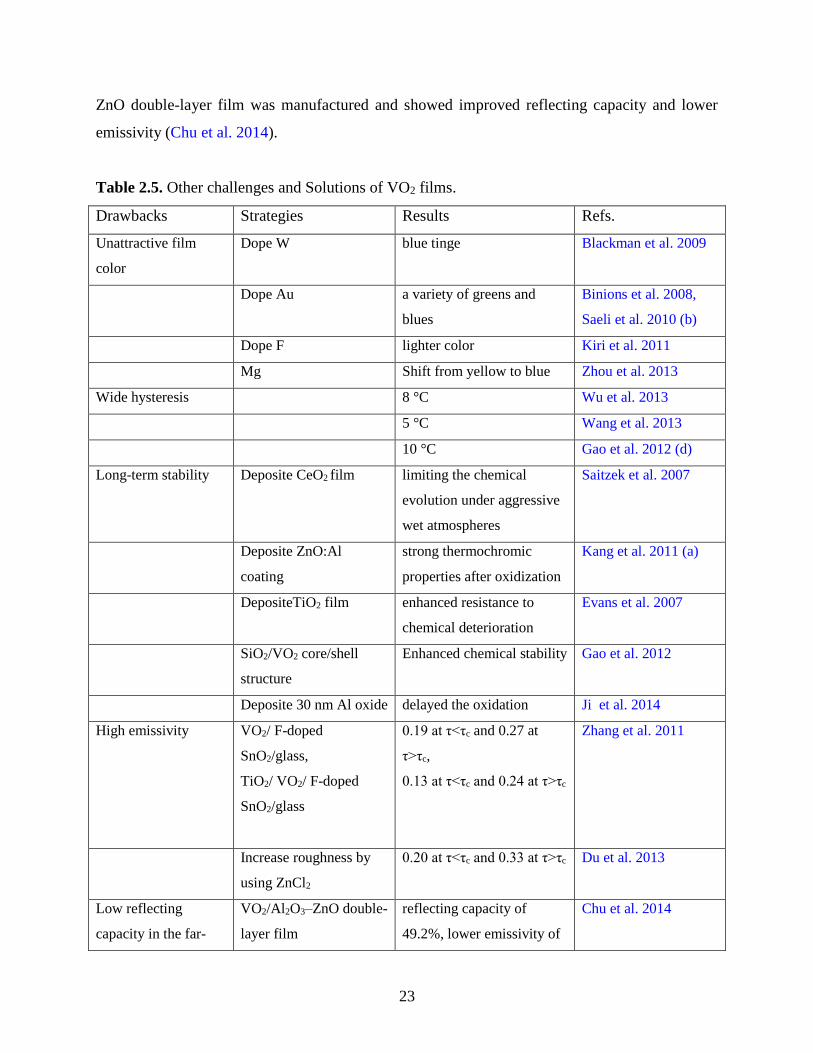
Table 2.5. Other challenges and Solutions of VO2 films ............................................................... 23.
Table 3.1. Density and DSC Results of the Samples ...................................................................... 57.
Table 3.2. Calibration Constant, Heat Capacity and Thermal Conductivity Results of the
Samples .................................................................................................................................. 60.
Table 3.3. Surface Temperature of the Tested Samples during Summer and Winter ............... 62.
Table 4.1. Empirical equations for reflectance spectra of thermochromic powders under
different temperatures ........................................................................................................ .75.
Table 4.2. Empirical equations for reflectance spectra of asphalt binder mixture and R2 ........ 77.
Table 4.3. Summary of models for the effective spectral reflectance of binary mixtures .......... 80.
Table 4.4. Summary on empirical equations by fitting various models and R2 .......................... 82.
Table 5.1. Percentage difference comparisons for G*/sin δ of unaged and RTFO aged samples ..
.................................................................................................................................. 105.
Table 5.2. Percentage difference comparisons for G*/sin δ between unaged and RTFO aged
samples at 64 °C ................................................................................................................. 106.
Table 5.3. Percentage difference comparisons for G*sin δ of RTFO+PAV aged samples ....... 107.
Table 5.4. Determination of performance grade (PG) of asphalt binder ................................... 109.
Table 6.1. Weight losses (%) of the samples at different temperatures ..................................... 123.
Table 6.2. Commonly used pyrolysis mechanism functions and integral functions ................. 126.
Table 6.3. Correlation coefficients of the plots of ln[g(α)/T2] ~ -1/(RT) for thermochromic
powders ................................................................................................................................ 127.
Table 6.4. Correlation coefficients of the plots of ln[g(α)/T2] ~ -1/(RT) for asphalt binder
samples ................................................................................................................................ 128.
Table 6.5. The kinetic parameters under different temperature range for thermochromic
powder and asphalt binder samples ................................................................................. 128.
Table 6.6. Increase percentage (%) of solar reflectance of treated thermochromic powders
compared to that of untreated powders ........................................................................... 131.
Table 6.7. Increase percentage (%) of solar reflectance (in the NIR) of treated thermochromic
asphalt binders compared to that of untreated binders .................................................. 132.
Table 7.1. Air temperature, wind speed, relative humidity and solar radiation during the
experimental period............................................................................................................ 142.
Table 7.2. Daily (8:00–20:00) and nocturnal (22:00–6:00) mean, maximum, minimum surface
temperatures temperature fluctuations and differences during April, 2014 ................ 143.
Table 7.3. Daily (8:00–20:00) and nocturnal (22:00–6:00) mean, maximum, minimum surface
temperatures temperature fluctuations and differences during May, 2014 ................. 144.
Table 7.4. Daily (8:00–20:00) and nocturnal (22:00–6:00) mean, maximum, minimum surface
temperatures, temperature fluctuations and differences during June, 2014 ................ 144.
Table 8.1. Characteristics of original asphalt binder ..................................................................... 159.
Table 8.2. Characteristics of RAP ................................................................................................... 161.
Table 8.3. Aggregate Gradation..................................................................................................... 161.
Table 8.4. Control HMA mix-design characteristics ...................................................................... 163.
Table 8.5. Superpave mix design criteria (AASHTO M 323) (AASHTO T166). ........................... 163.
Table 8.1. Optimized parameters for preparing control HMA ....................................................... 164.
Table 8.2. Different combinations percentages of additives ............................................................ 165.
Table 8.3. Specific gravity and air void results of HMA mixtures .................................................. 170.
Table 8.4. Tensile strength ratio test results of HMA mixtures ...................................................... 171.
Table 8.5. Solar reflectance (%) on original surface, exposed aggregate surface, and rutted surface
of HMA mixtures in the range of 800-1800 nm ................................................................... 173.
1
CHAPTER ONE
INTRODUCTION
1.1 Motivation for This Project
The majority of highways in Ohio and 94% of US highways are surfaced with asphalt. The
conventional asphalt has high solar absorbance due to its dark color. Consequently, the surface
temperature of asphalt pavement can be considerably higher during summer than pavement with
a lighter surface, i.e., concrete pavement. The dark color also means asphalt roads radiate
thermal energy faster during winter and therefore cool at a fast rate. The influence of thermal
loads can be translated into reduced structural strength, increased rutting, accelerated aging of
binders and thermal cracks; all compromising pavement performance. Pigments and seals have
become available to change the color of an asphalt surface to make it lighter. However, common
types of pigments are based on metallic powder or crystal salt, which does not have good
compatibility with polymeric binders. ODOT experience indicated that the use of Verglimit, a
crystalline phase change materials for thermal energy storage, resulted in failure of pavement.
Polymeric dye, which feature excellent compatibility with asphalt binder, has promise to
overcome the limitations and significantly increase the durability of asphalt road via its
multifunctional roles.
1.2 Research Objectives
The goal of this research is to evaluate the effectiveness of multifunctional polymeric
thermochromic dyes to increase the longevity of asphalt pavement via multifunctional roles of
both improving its optical properties and microstructure. In the optical properties side, the
selected polymeric dyes will feature a unique thermal-threshold infrared reflectance, i.e., it will
effectively reflect infrared solar radiation above the temperature threshold. Therefore, the
longevity of asphalt pavement will be increased by reducing the surface temperature of pavement
during summer. Since solar modulation occurs only in the infrared range, there will be no visual
impact on drivers. Besides, at the infrared reflectance thermal thresh, it will reduce the rate of
cooling of asphalt road on cold weathers. In the microstructure side, the polymeric dyes function
as a polymer modifier to existing asphalt binder and therefore may further improve its durability
in terms of resistance to rutting and fatigue. The effectiveness of thermochromic properties will
2
be evaluated by measuring the surface temperature of dye treated asphalt concrete (i.e., to assess
the reduction of its surface temperature variation). The effectiveness of microstructure
performance will be measured by assessing the asphalt binder and asphalt concrete in terms of
fatigue and rutting performance. For both types of testing, the un-modified asphalt concrete will
be used as the baseline. The durability will be directly assessed based on the extension of
pavement longevity from both thermal and microstructure aspects.
1.3 Research Background and Significance of the Work
As of 2001, there are about 2.5 million miles of paved roads in the United States. Maintenance
and rehabilitation of aging pavement cost billions of dollars each year (FHWA 2001). The design
of pavement, which is evolving from pure empirical to mechanistic-empirical procedures, has
been focusing on the mechanical aspects. The goal is to ensure the pavement structure is
sufficient to support the design traffic loads. A number of field experiences demonstrate the
significant role of non-mechanical environmental factors, including moisture and temperature, in
pavement deterioration. The thermal aspect of pavement is being recognized as a major factor
determining the durability of pavement.
About 94 percent of the roads and highways in the United States are surfaced with asphalt
(NAPA). The conventional asphalt has high solar absorbance due to its dark color. Consequently,
the surface temperature on asphalt pavement can be considerably higher than that of a lighter
surface, i.e., concrete pavement. The dark color also means the surface of the asphalt road emits
thermal radiation faster when the environmental temperature is lower (such as in winter) and
therefore might accelerate the icing process. The influence of thermal loads can be translated into
reduced structural strength, increased rutting, accelerated aging of binders, and thermal cracks;
all compromising pavement performance. The high surface temperature also accelerates green
gas volatile emission as the asphalt binder breaks down.
Pigments and seals have become available to change the color of an asphalt surface to make it
lighter, i.e., architectural asphalt. They however are suitable in most cases only for architectural
considerations where color is a dominant criterion (EPA 2005). Besides, the artificial color can
affect the driver perception of road conditions, as most drivers are accustomed to black (i.e.
asphalt) or while (i.e., concrete) road. The change of visual appearance can potentially change
the drivers’ perception, especially at high speeds.

3
Most pigments are based on metallic powder or crystal salt. Therefore, they can cause problems
in the bonding deterioration in the asphalt binder. In this study, we will evaluate the use of
polymeric thermochromic dye to modulate the thermal response of asphalt pavement. The
polymeric dye will feature much better thermal and solution stability as well as compatibility
with asphalt binder.
1.3.1 Influence of Temperature on Performance of Asphalt Pavement
A number of field and laboratory experiments demonstrate the significant role of temperature on
pavement durability under both hot and cold weather conditions (Shami et al. 1997). For
example, study by Huang et al. (2008) showed that the rutting typically occurred when the
surface temperature of asphalt pavement is above 20°C; the higher the surface temperature the
higher the potential of rutting occurrence. Low pavement temperature is related to thermal
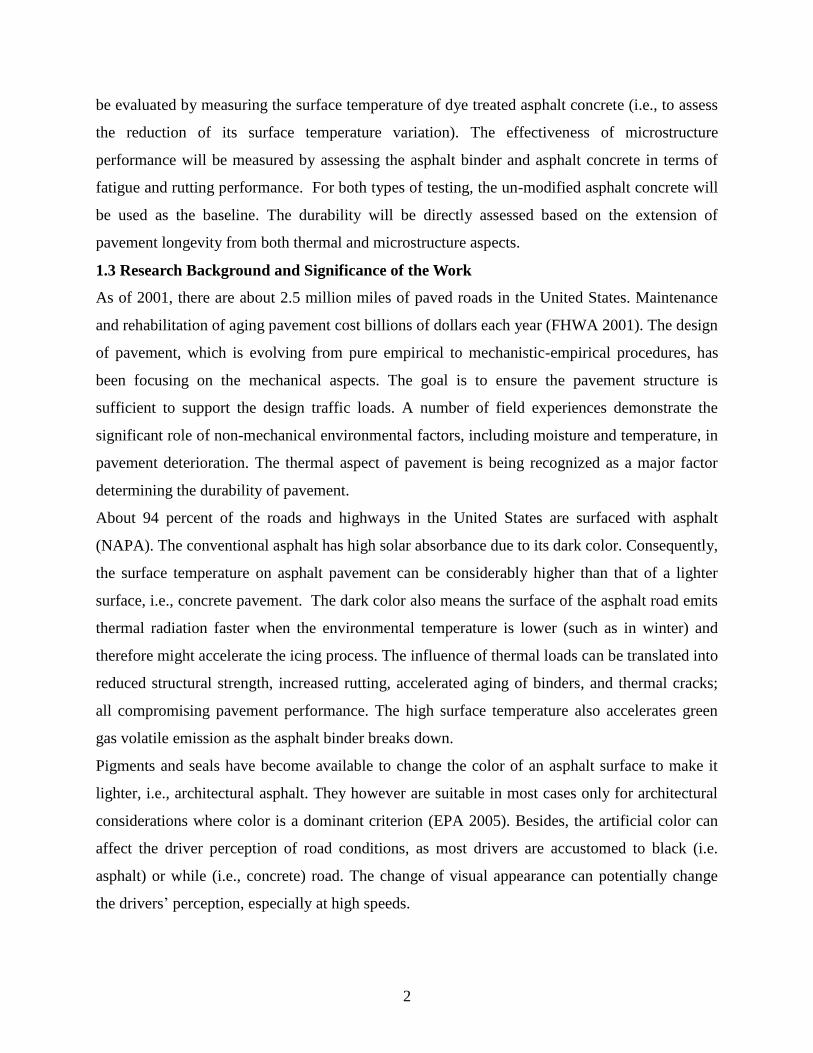
cracks, which is a major cause of pavement deterioration in cold regions such as Ohio. Figure 1.1
shows examples of measured data on the effects of pavement temperature on asphalt
performance properties. The data demonstrates that higher temperature caused considerable
increase of asphalt rutting and permanent shear strain.
Fig. 1.1 Temperature effects on rutting and permanent shear strain of asphalt concrete1
1.3.2 Properties Determining Thermal Energy Balance in Pavement Surfaces
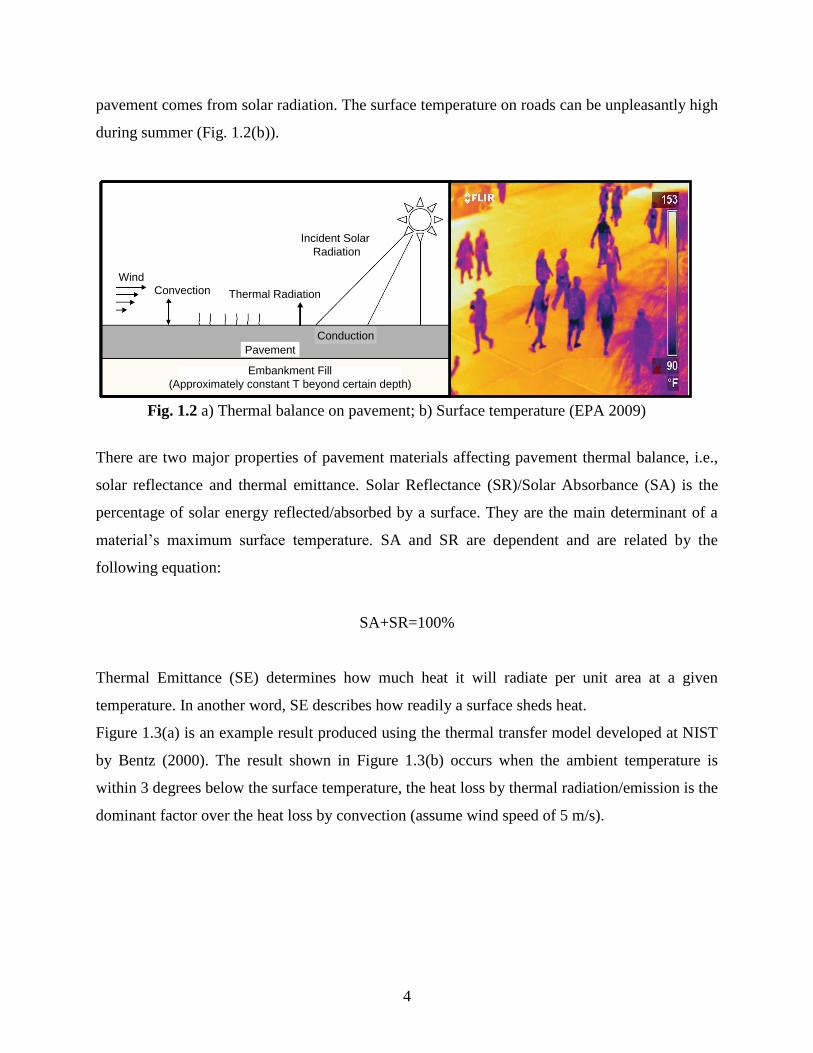
The temperature of the road surface is affected by three major thermal exchange mechanisms:
absorption of the incident solar energy, thermal radiation to the atmosphere and thermal
convection with the air close to the road surface (Fig. 1.2(a)). The direct source of heat for
1 http://heatisland.lbl.gov/Pavements/Durability/
4
pavement comes from solar radiation. The surface temperature on roads can be unpleasantly high
during summer (Fig. 1.2(b)).
There are two major properties of pavement materials affecting pavement thermal balance, i.e.,
solar reflectance and thermal emittance. Solar Reflectance (SR)/Solar Absorbance (SA) is the
percentage of solar energy reflected/absorbed by a surface. They are the main determinant of a
material’s maximum surface temperature. SA and SR are dependent and are related by the
following equation:
SA+SR=100%
Thermal Emittance (SE) determines how much heat it will radiate per unit area at a given
temperature. In another word, SE describes how readily a surface sheds heat.
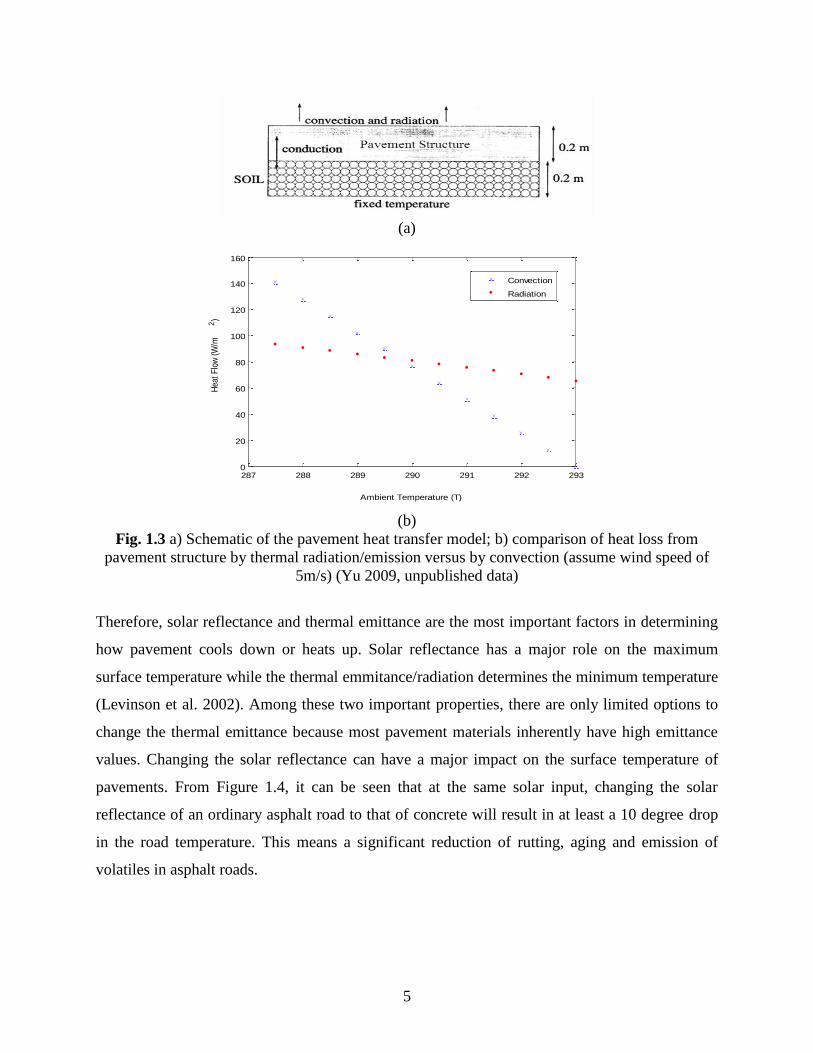
Figure 1.3(a) is an example result produced using the thermal transfer model developed at NIST
by Bentz (2000). The result shown in Figure 1.3(b) occurs when the ambient temperature is
within 3 degrees below the surface temperature, the heat loss by thermal radiation/emission is the
dominant factor over the heat loss by convection (assume wind speed of 5 m/s).
Pavement
Embankment Fill
(Approximately constant T beyond certain depth)
Thermal Radiation
Incident Solar
Radiation
Conduction
Convection
Wind
Pavement
Embankment Fill
(Approximately constant T beyond certain depth)
Thermal Radiation
Incident Solar
Radiation
Conduction
Convection
Wind
Fig. 1.2 a) Thermal balance on pavement; b) Surface temperature (EPA 2009)
5
(a)
287 288 289 290 291 292 2930
20
40
60
80
100
120
140
160
Ambient Temperature (T)
Hea
t F
low
(W
/m2)
Convection
Radiation
(b)
Fig. 1.3 a) Schematic of the pavement heat transfer model; b) comparison of heat loss from
pavement structure by thermal radiation/emission versus by convection (assume wind speed of
5m/s) (Yu 2009, unpublished data)
Therefore, solar reflectance and thermal emittance are the most important factors in determining
how pavement cools down or heats up. Solar reflectance has a major role on the maximum
surface temperature while the thermal emmitance/radiation determines the minimum temperature
(Levinson et al. 2002). Among these two important properties, there are only limited options to
change the thermal emittance because most pavement materials inherently have high emittance
values. Changing the solar reflectance can have a major impact on the surface temperature of
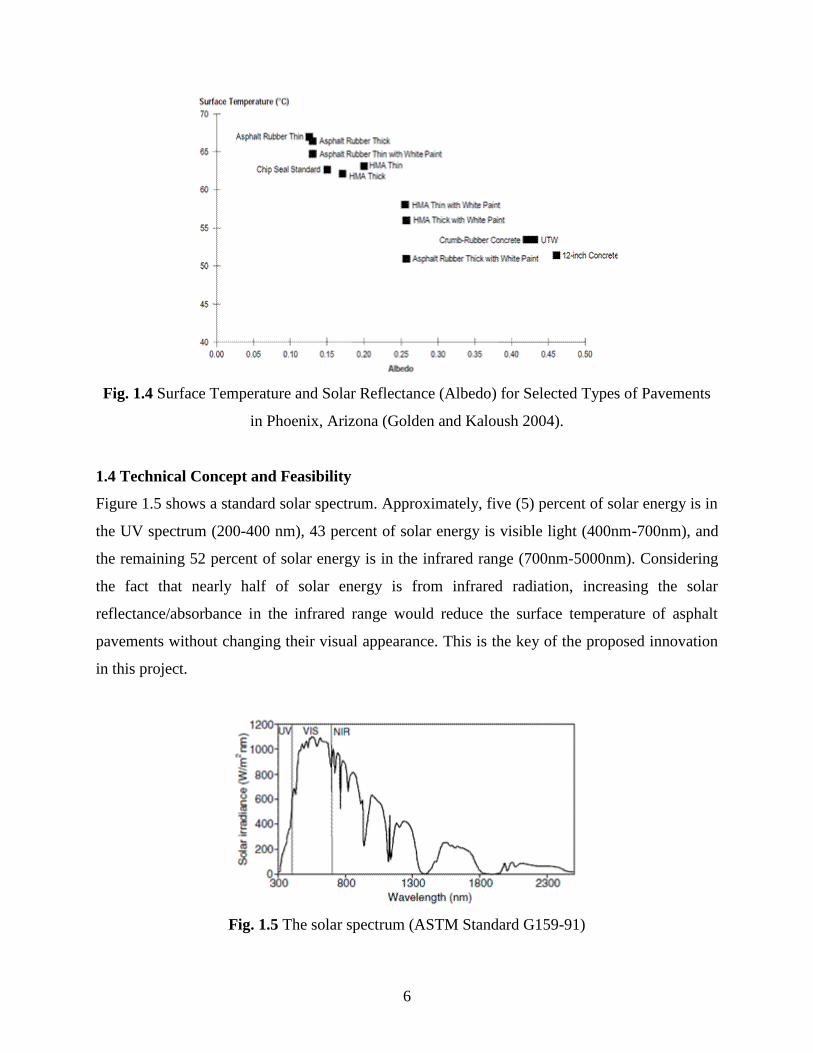
pavements. From Figure 1.4, it can be seen that at the same solar input, changing the solar
reflectance of an ordinary asphalt road to that of concrete will result in at least a 10 degree drop
in the road temperature. This means a significant reduction of rutting, aging and emission of
volatiles in asphalt roads.
6
Fig. 1.4 Surface Temperature and Solar Reflectance (Albedo) for Selected Types of Pavements
in Phoenix, Arizona (Golden and Kaloush 2004).
1.4 Technical Concept and Feasibility
Figure 1.5 shows a standard solar spectrum. Approximately, five (5) percent of solar energy is in
the UV spectrum (200-400 nm), 43 percent of solar energy is visible light (400nm-700nm), and
the remaining 52 percent of solar energy is in the infrared range (700nm-5000nm). Considering
the fact that nearly half of solar energy is from infrared radiation, increasing the solar
reflectance/absorbance in the infrared range would reduce the surface temperature of asphalt
pavements without changing their visual appearance. This is the key of the proposed innovation
in this project.
Fig. 1.5 The solar spectrum (ASTM Standard G159-91)
7
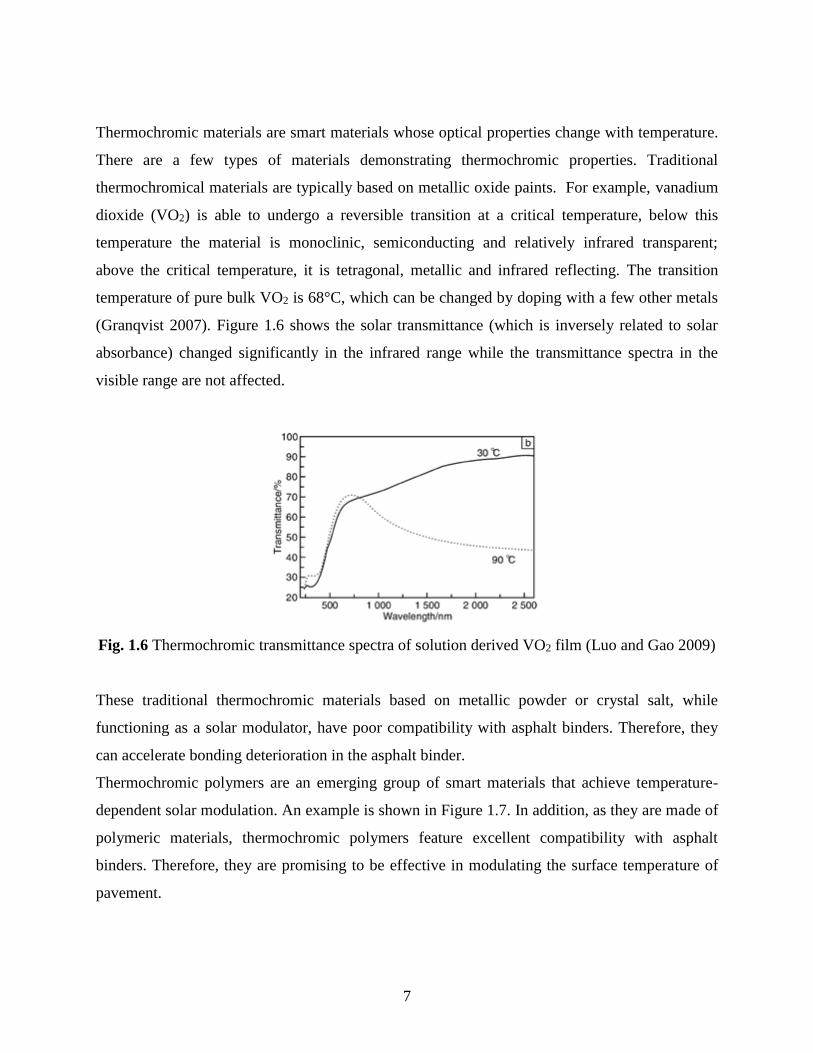
Thermochromic materials are smart materials whose optical properties change with temperature.
There are a few types of materials demonstrating thermochromic properties. Traditional
thermochromical materials are typically based on metallic oxide paints. For example, vanadium
dioxide (VO2) is able to undergo a reversible transition at a critical temperature, below this
temperature the material is monoclinic, semiconducting and relatively infrared transparent;
above the critical temperature, it is tetragonal, metallic and infrared reflecting. The transition
temperature of pure bulk VO2 is 68°C, which can be changed by doping with a few other metals
(Granqvist 2007). Figure 1.6 shows the solar transmittance (which is inversely related to solar
absorbance) changed significantly in the infrared range while the transmittance spectra in the
visible range are not affected.
Fig. 1.6 Thermochromic transmittance spectra of solution derived VO2 film (Luo and Gao 2009)
These traditional thermochromic materials based on metallic powder or crystal salt, while
functioning as a solar modulator, have poor compatibility with asphalt binders. Therefore, they
can accelerate bonding deterioration in the asphalt binder.
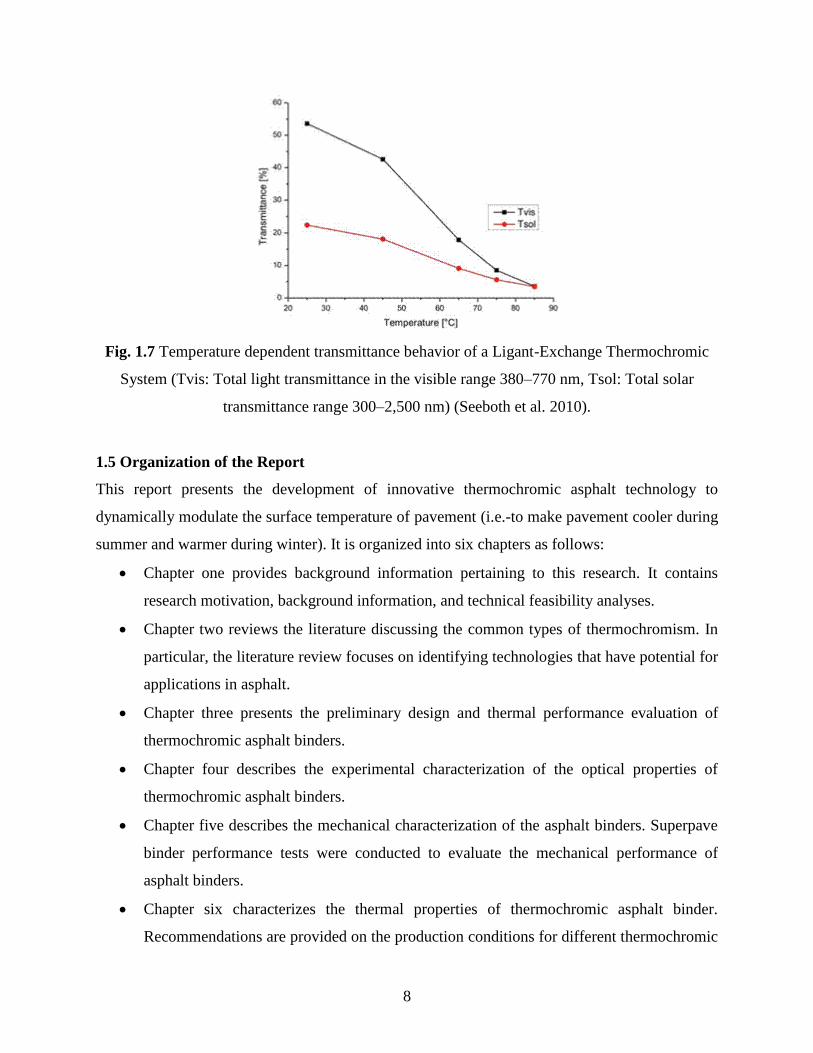
Thermochromic polymers are an emerging group of smart materials that achieve temperature-
dependent solar modulation. An example is shown in Figure 1.7. In addition, as they are made of
polymeric materials, thermochromic polymers feature excellent compatibility with asphalt
binders. Therefore, they are promising to be effective in modulating the surface temperature of
pavement.
8
Fig. 1.7 Temperature dependent transmittance behavior of a Ligant-Exchange Thermochromic
System (Tvis: Total light transmittance in the visible range 380–770 nm, Tsol: Total solar
transmittance range 300–2,500 nm) (Seeboth et al. 2010).
1.5 Organization of the Report
This report presents the development of innovative thermochromic asphalt technology to
dynamically modulate the surface temperature of pavement (i.e.-to make pavement cooler during
summer and warmer during winter). It is organized into six chapters as follows:
Chapter one provides background information pertaining to this research. It contains
research motivation, background information, and technical feasibility analyses.
Chapter two reviews the literature discussing the common types of thermochromism. In
particular, the literature review focuses on identifying technologies that have potential for
applications in asphalt.
Chapter three presents the preliminary design and thermal performance evaluation of
thermochromic asphalt binders.
Chapter four describes the experimental characterization of the optical properties of
thermochromic asphalt binders.
Chapter five describes the mechanical characterization of the asphalt binders. Superpave
binder performance tests were conducted to evaluate the mechanical performance of
asphalt binders.
Chapter six characterizes the thermal properties of thermochromic asphalt binder.
Recommendations are provided on the production conditions for different thermochromic
9
asphalt binders.
Chapter seven describes the evaluation of thermochromic asphalt binders’ performance
via an extended outdoor evaluation program. The performance of thermochromic asphalt
binders was determined.
Chapter eight summarizes the research activities. It also provides conclusions and
recommendations of future study.
10
1.6 References
(1) ASTM Standard E903-96. (1996). Standard Test Method for Solar Absorptance,
Reflectance and Transmittance of materials using integrating spheres. Standard Book of
ASTM Annual Book, ASTM publisher.
(2) ASTM Standard G159-91. (1991). Standard Tables for References Solar Spectral Irradiance
at Air Mass 1.5: Direct Normal and Hemispherical for a Tilted Surface, Standard Book of
ASTM Annual Book, ASTM publisher.
(3) Bentz, D.P. (2000). A computer model to predict the surface temperature and time-of-
wetness of concrete pavements and bridge decks, NIST Research Report. U.S. Department
of Commerce. 29p.
(4) Environmental Protection Agency (EPA). 2005. Cool Pavement Report, Cambridge
Systematics, Inc., 63p.
(5) EOL-LCA (2010). http://www.eiolca.net/Method/index.html.
(6) Golden, J.S., Kaloush, K.E. (2004). SMART Program, and Arizona State University, July
24, 2004.
(7) Granqvist, G.C. (2007). Transparent conductors as solar energy materials: a panoramic
review, Sol. Energy Mater. Sol. Cells 91, 1529–1598.
(8) Huang, X.M., Li, H., Zhang, J.P. (2008). Simulation of Rutting Behavior of Asphalt
Pavement Based on Real Temperature Field, Transportation Research Board Annual
Meeting 2008 Paper #08-0372.
(9) Luo, H.J., Gao, Y.F. (2009). Solution processing and optical properties of VO2
Thermochromic Materials, Materials China, 28(1): 38-42.
(10) National Asphalt Pavement Association (NAPA).
http://www.hotmix.org/index.php?option=com_content&task=view&id=379&Itemid=862.
(11) Shami H.I., Lai, J.S., D’Angelo J.A. and Harman, T.P. (1997). Development of
temperature-effect model for predicting rutting of asphalt mixtures using Georgia loaded
wheel tester, TRB Annual Meeting, Washington, DC , paper No. 1590.
(12) Synnefa, A., Santamouris, M., Apostolakis, K. (2007). On the development, optical
properties and thermal performance of cool colored coatings for the urban environment,
Solar Energy, 81: 488–497.
11
(13) Yu, X. (2009). Thermal exchange at surface of pavements using NIST model, unpublished
data.
(14) Seeboth, A., R. Ruhmann, O. Mühling (2010). Thermochromic and Thermtropic Polymer
Based Materials for Adaptive Solar Control, Materials, 3(12): 5143-5168.
(15) Lucht, B.L., Euler, W.B. (2009). Development of Thermochromic Paints, Plastics, and
Rubbers for Rapid Visual Assessment of Temperature, URITC Project Report No. 536152-
536183.
(16) Ma, Y.P., Zhu, B.R. (2009). Research on the preparation of reversibly thermochromic
cement based materials at normal temperature, Cement and Concrete Research, 39(2): 90-
94.
12
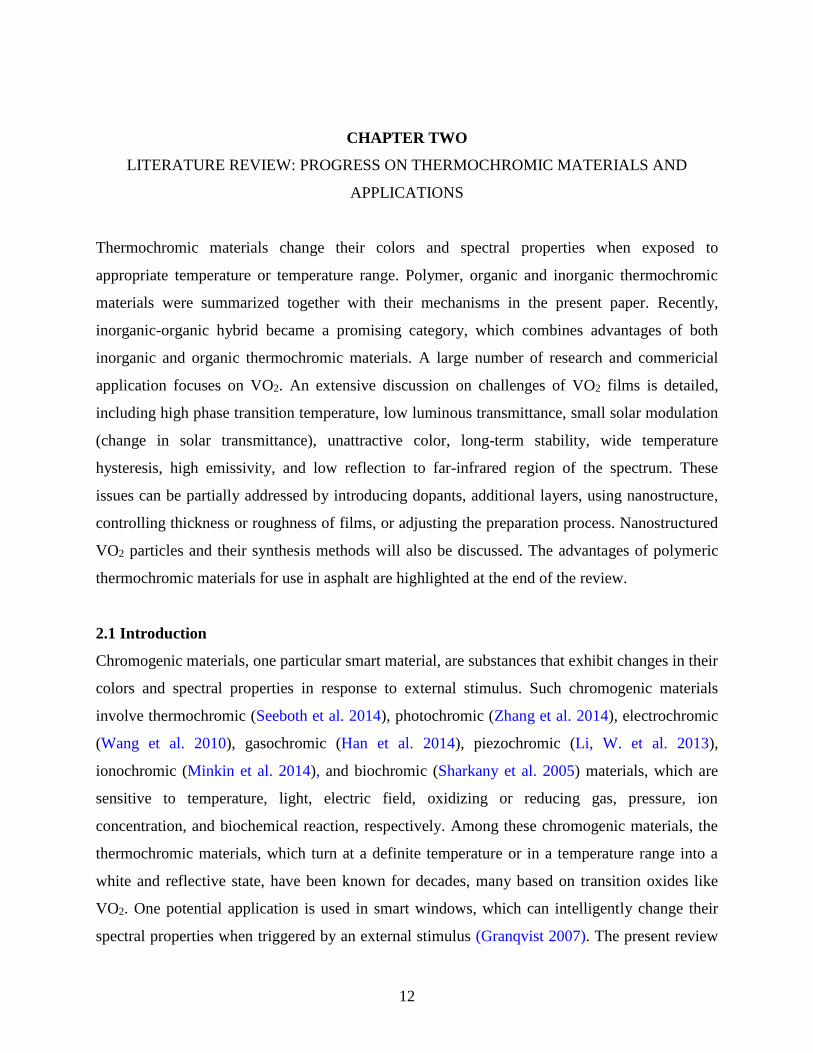
CHAPTER TWO
LITERATURE REVIEW: PROGRESS ON THERMOCHROMIC MATERIALS AND
APPLICATIONS
Thermochromic materials change their colors and spectral properties when exposed to
appropriate temperature or temperature range. Polymer, organic and inorganic thermochromic
materials were summarized together with their mechanisms in the present paper. Recently,
inorganic-organic hybrid became a promising category, which combines advantages of both
inorganic and organic thermochromic materials. A large number of research and commericial
application focuses on VO2. An extensive discussion on challenges of VO2 films is detailed,
including high phase transition temperature, low luminous transmittance, small solar modulation
(change in solar transmittance), unattractive color, long-term stability, wide temperature
hysteresis, high emissivity, and low reflection to far-infrared region of the spectrum. These
issues can be partially addressed by introducing dopants, additional layers, using nanostructure,
controlling thickness or roughness of films, or adjusting the preparation process. Nanostructured
VO2 particles and their synthesis methods will also be discussed. The advantages of polymeric
thermochromic materials for use in asphalt are highlighted at the end of the review.
2.1 Introduction
Chromogenic materials, one particular smart material, are substances that exhibit changes in their
colors and spectral properties in response to external stimulus. Such chromogenic materials
involve thermochromic (Seeboth et al. 2014), photochromic (Zhang et al. 2014), electrochromic
(Wang et al. 2010), gasochromic (Han et al. 2014), piezochromic (Li, W. et al. 2013),
ionochromic (Minkin et al. 2014), and biochromic (Sharkany et al. 2005) materials, which are
sensitive to temperature, light, electric field, oxidizing or reducing gas, pressure, ion
concentration, and biochemical reaction, respectively. Among these chromogenic materials, the
thermochromic materials, which turn at a definite temperature or in a temperature range into a
white and reflective state, have been known for decades, many based on transition oxides like
VO2. One potential application is used in smart windows, which can intelligently change their
spectral properties when triggered by an external stimulus (Granqvist 2007). The present review
13
is to introduce various kinds of thermochromic materials and their mechanisms. The former and
ongoing improvement strategies of VO2 films and nanoparticles will be summarized. Finally, the
application of thermochromic materials and performance will be presented, especially in smart
windows.
2.2 Categories and Mechanisms
A wide variety of materials have been found to exhibit thermochromic properties, including
polymers, organic, inorganic compounds. Inorganic and polymer based thermochromic materials
have been extensively reviewed in studies (Granqvist 2007, Li et als. 2011, Seeboth et al. 2008
and 2010), providing information on the current progess in material science developments,
switching characteristics of the various material formulations, and an assessment of market
maturity. Depdending on the mechanism that causes the color change, thermochromic materials
can be devided into: phase transitions (e.g., in an organic chromophore), changes in ligand
geometry, variation in the crystal field or the number of solvent molecules in the coordination
sphere (e.g., in a pure transition metal complex that derives its color from crystal field effects,
and other more complex mechanisms. Fig. 2.1 summarized various thermocromic materials and
their mechanisms. Recently, Seeboth et al. (Seeboth et al. 2014) detailed the thermochromism for
polymers, including temperature runnable photonic crystals, nanoparticle based effects (surface
plasmon absorption and quantum dots), and dye-dye or polymer-dye aggregation-
disaggreagation mechanisms. Additonaly, Naumov (Naumov et al. 2011) proposed a new
thermochromism that the thermochromism of overcrowded polycyclic aromatic enes stems from
large molecular distortions due to increased thermal oscillations of the two halves of the
molecules around the central bridge.

14
TC
Polymer
Thermochromic
liquid crystals
Conjugated
polymer
Leuco dye-
developer-solvent
systems
Organic
compound
Inorganic
compound
Spiropyrans
Spirooxazines
Salicyl-Schiff
bases
Bianthrones
Metal salts
Metal oxides
Variation in the crystal
field and Bragg reflection
law
Conformational change of
polymer backbone
Change of molecular
structures
Phase transition, change in ligand
geometry or coordination number
or crystal fields
Fig. 2.1. Classifications and mechanisms of thermochromic (TC) materials.
Organic compounds containing spiropyrans, spirooxazines, salicyl-Schiff bases, or overcrowded
ethylens, show thermochromic phenomena (Chen and Yan 2009, Crano and Guglielmetti 1999,
Lee et al. 2006). Some polymers, thermochromic liquid crystals (like polypeptide vinyl monomer
liquid crystals, cholesterol ester), conjugated polymers (like polysilane, polythiophene,
polydiacetylene, poly (phenylene vinylene), and leuco dye-developer-solvent system, exhibit
thermochromic properties (Seeboth and Lötzsch 2008, Park et al. 2007, Yu et al. 2008, Yarimaga
et al. 2010, Chen et al. 2011, Karlessi et al. 2009, Tang et al. 2010). Polymers and organic
compounds and systems present adjustable switching temperature, relatively low switching
temperature, non-toxic features, with poor light stability.
Metal salts and metal oxides are typically inorganic thermochromic compounds, e.g. Cu2HgI4,
ZnO and In2O3, Cr2O3-Al2O3), Et2NH2)2CuCl4, CoCl2. Inorganic thermochromic compounds
display thermochromic behavior upon exceeding a wide range of temperature, generally at 70-
500°C (Seeboth and Lötzsch 2008). With a view to application of thermochromic materials in
buildings, VO2 is the most suitable inorganic compounds since their switching temperature could
15
be lowered from 68°C to room temperature, which will be elaborated in the following context.
Inorganic themrochromic materials feature thermostability above 200 °C and light stability while
are toxic, have relatively high and fixed switching temperatures, and show irreversibly
thermochromic transition. To combine advantages of organic, polymer and inorganic
compounds, organic-inorganic hybrid thermochromic materials were proposed and have been
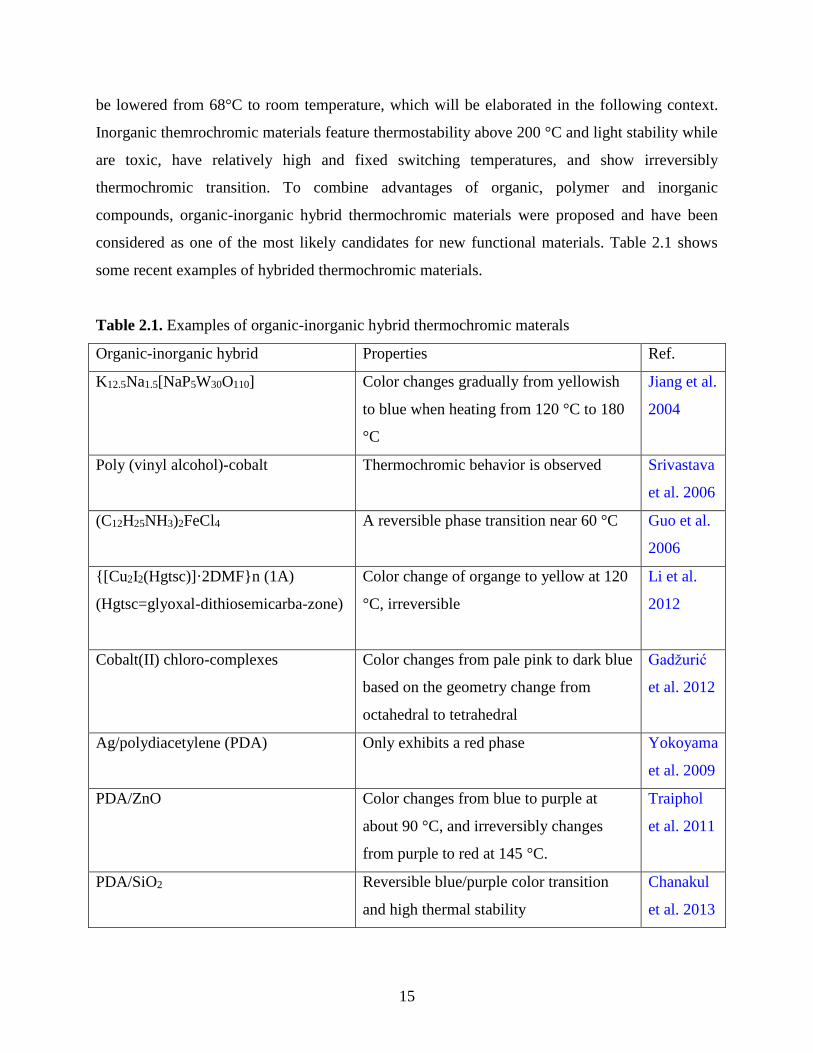
considered as one of the most likely candidates for new functional materials. Table 2.1 shows
some recent examples of hybrided thermochromic materials.
Table 2.1. Examples of organic-inorganic hybrid thermochromic materals
Organic-inorganic hybrid Properties Ref.
K12.5Na1.5[NaP5W30O110] Color changes gradually from yellowish
to blue when heating from 120 °C to 180
°C
Jiang et al.
2004
Poly (vinyl alcohol)-cobalt Thermochromic behavior is observed Srivastava
et al. 2006
(C12H25NH3)2FeCl4 A reversible phase transition near 60 °C Guo et al.
2006
{[Cu2I2(Hgtsc)]·2DMF}n (1A)
(Hgtsc=glyoxal-dithiosemicarba-zone)
Color change of organge to yellow at 120
°C, irreversible
Li et al.
2012
Cobalt(II) chloro-complexes Color changes from pale pink to dark blue
based on the geometry change from
octahedral to tetrahedral
Gadžurić
et al. 2012
Ag/polydiacetylene (PDA) Only exhibits a red phase Yokoyama
et al. 2009
PDA/ZnO Color changes from blue to purple at
about 90 °C, and irreversibly changes
from purple to red at 145 °C.
Traiphol
et al. 2011
PDA/SiO2 Reversible blue/purple color transition
and high thermal stability
Chanakul
et al. 2013
16
2.3 Thermochromic Films and Nanocomposite
VO2 Films
Vanadium dioxide (VO2) is the most interesting and extensively studied thermochromic material
since it was found to exhibit phase transition from monoclinic VO2 (M) (semiconductor) to
tetragonal rutile VO2 (R) structure (metal), accompaning a significant reversible change in its
electrical and optical properties occurring at transition temperature Tc (approximate 68 °C)
(Morin 1959). Optically, VO2 films exhibit good infrared transmission in the insulating
monoclinic phase below the transition temperature, while the metallic phase is highly reflective
in the infared region of the spectrum. Therefore, VO2 can be employed as thin films in smart
windows that inhibit a near infrared spectra transmission at high temperature, and permits the
transmission at low temperature to control solar/heat automatically without extra energy input
(Manning et al. 2002). However, VO2 is not immediately applicable to windows and
commercialization in large scale due to the following three main challenges (Granqvist 2007,
Mlyuka et al. 2009, Li et al. 2012, Warwick and Binions 2014, Gao et al. 2012): (i) The
switching temperature (τc) of VO2 is typically 68 °C, which is higher than the comfort
temperature of approximate 25 °C in buildings; (ii) Solar modulation, expressed by ΔTsol=Tsol
(τ<τc) − Tsol (τ>τc), is not usually larger than 10%. (iii) Luminous transimission (Tlum) in the
visible range is typically lowered to 43% (Xu et al. 2004, Jin et al. 2003, Lappalaninen et al.
2008). Films suitable for use in architectural windows should possess visible transmittance
values in excess of 60% (Sobhan et al. 1996, Blackman et al. 2009).
Substantial strategies have been investigated to address all of these challenges, including doping
various elements, formation of composite, regulation of roughness and thickness of VO2 film,
deposition of anti-reflective layers, nanostructured, and control of processing conditions of VO2
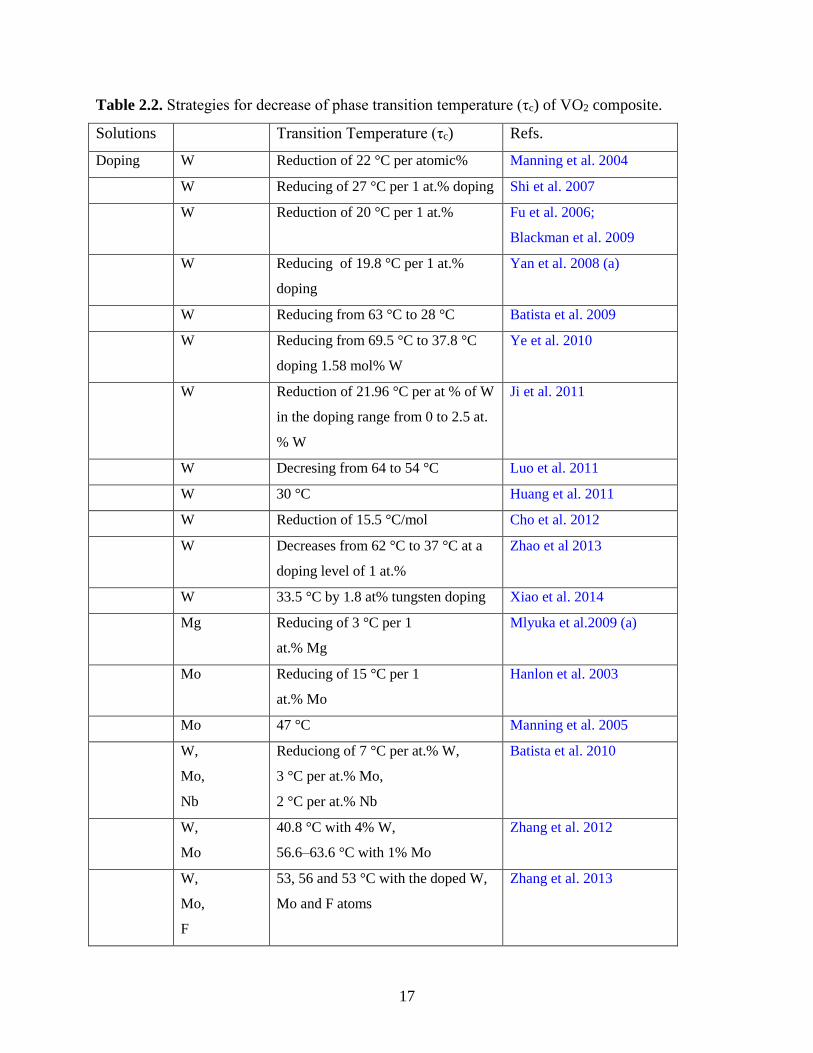
particle. The results of recent progesses on these techniques are summarized in Table 2. 2-4. To
reduce the transition temperature, the doping of W is found to be the most promising strategy,
lowering about 27 °C per 1 at % W doping (Shi et al. 2007). Besides the transition temperature,
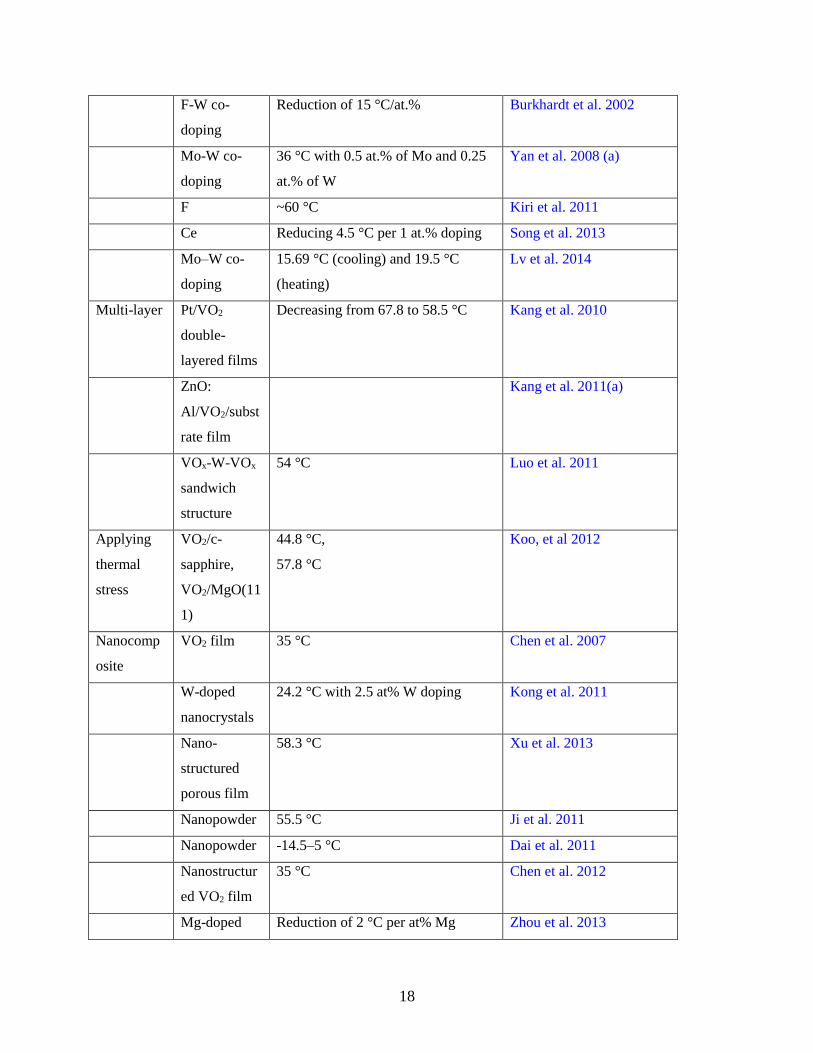
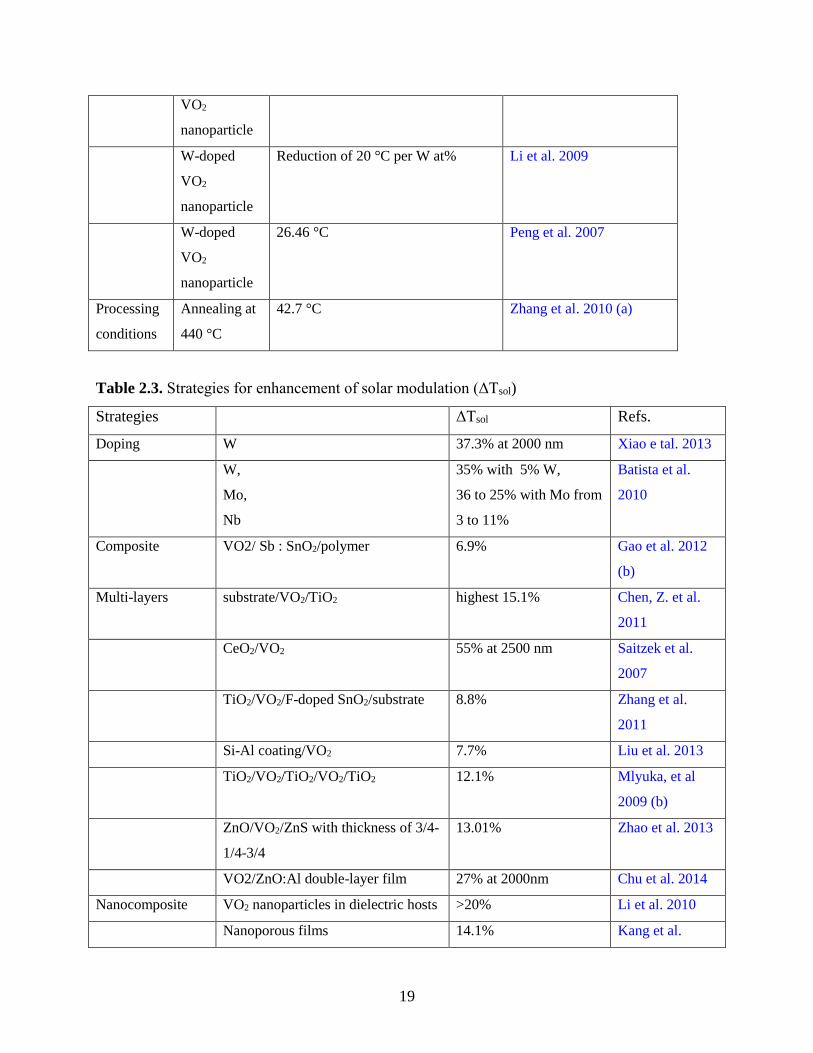
the luminous transmittance (Tlum) and solar transmittance modulation (ΔTsol) can be enhanced
with a relative balance by using the multilayer structure containing anti-reflecting layers based
on oxides of Si, Ti, Zr, Ce and Al. It is expected that some of theses oxide layers are also able to
protect VO2 from oxidation and generate new functions such as photocatalysis.
17
Table 2.2. Strategies for decrease of phase transition temperature (τc) of VO2 composite.
Solutions Transition Temperature (τc) Refs.
Doping W Reduction of 22 °C per atomic% Manning et al. 2004
W Reducing of 27 °C per 1 at.% doping Shi et al. 2007
W Reduction of 20 °C per 1 at.% Fu et al. 2006;
Blackman et al. 2009
W Reducing of 19.8 °C per 1 at.%
doping
Yan et al. 2008 (a)
W Reducing from 63 °C to 28 °C Batista et al. 2009
W Reducing from 69.5 °C to 37.8 °C
doping 1.58 mol% W
Ye et al. 2010
W Reduction of 21.96 °C per at % of W
in the doping range from 0 to 2.5 at.
% W
Ji et al. 2011
W Decresing from 64 to 54 °C Luo et al. 2011
W 30 °C Huang et al. 2011
W Reduction of 15.5 °C/mol Cho et al. 2012
W Decreases from 62 °C to 37 °C at a
doping level of 1 at.%
Zhao et al 2013
W 33.5 °C by 1.8 at% tungsten doping Xiao et al. 2014
Mg Reducing of 3 °C per 1
at.% Mg
Mlyuka et al.2009 (a)
Mo Reducing of 15 °C per 1
at.% Mo
Hanlon et al. 2003
Mo 47 °C Manning et al. 2005
W,
Mo,
Nb
Reduciong of 7 °C per at.% W,
3 °C per at.% Mo,
2 °C per at.% Nb
Batista et al. 2010
W,
Mo
40.8 °C with 4% W,
56.6–63.6 °C with 1% Mo
Zhang et al. 2012
W,
Mo,
F
53, 56 and 53 °C with the doped W,
Mo and F atoms
Zhang et al. 2013
18
F-W co-
doping
Reduction of 15 °C/at.% Burkhardt et al. 2002
Mo-W co-
doping
36 °C with 0.5 at.% of Mo and 0.25
at.% of W
Yan et al. 2008 (a)
F ~60 °C Kiri et al. 2011
Ce Reducing 4.5 °C per 1 at.% doping Song et al. 2013
Mo–W co-
doping
15.69 °C (cooling) and 19.5 °C
(heating)
Lv et al. 2014
Multi-layer Pt/VO2
double-
layered films
Decreasing from 67.8 to 58.5 °C Kang et al. 2010
ZnO:
Al/VO2/subst
rate film
Kang et al. 2011(a)
VOx-W-VOx
sandwich
structure
54 °C Luo et al. 2011
Applying
thermal
stress
VO2/c-
sapphire,
VO2/MgO(11
1)
44.8 °C,
57.8 °C
Koo, et al 2012
Nanocomp
osite
VO2 film 35 °C Chen et al. 2007
W-doped
nanocrystals
24.2 °C with 2.5 at% W doping Kong et al. 2011
Nano-
structured
porous film
58.3 °C Xu et al. 2013
Nanopowder 55.5 °C Ji et al. 2011
Nanopowder -14.5–5 °C Dai et al. 2011
Nanostructur
ed VO2 film
35 °C Chen et al. 2012
Mg-doped Reduction of 2 °C per at% Mg Zhou et al. 2013
19
VO2
nanoparticle
W-doped
VO2
nanoparticle
Reduction of 20 °C per W at% Li et al. 2009
W-doped
VO2
nanoparticle
26.46 °C Peng et al. 2007
Processing
conditions
Annealing at
440 °C
42.7 °C Zhang et al. 2010 (a)
Table 2.3. Strategies for enhancement of solar modulation (ΔTsol)
Strategies ΔTsol Refs.
Doping W 37.3% at 2000 nm Xiao e tal. 2013
W,
Mo,
Nb
35% with 5% W,
36 to 25% with Mo from
3 to 11%
Batista et al.
2010
Composite VO2/ Sb : SnO2/polymer 6.9% Gao et al. 2012
(b)
Multi-layers substrate/VO2/TiO2 highest 15.1% Chen, Z. et al.
2011
CeO2/VO2 55% at 2500 nm Saitzek et al.
2007
TiO2/VO2/F-doped SnO2/substrate 8.8% Zhang et al.
2011
Si-Al coating/VO2 7.7% Liu et al. 2013
TiO2/VO2/TiO2/VO2/TiO2 12.1% Mlyuka, et al
2009 (b)
ZnO/VO2/ZnS with thickness of 3/4-
1/4-3/4
13.01% Zhao et al. 2013
VO2/ZnO:Al double-layer film 27% at 2000nm Chu et al. 2014
Nanocomposite VO2 nanoparticles in dielectric hosts >20% Li et al. 2010
Nanoporous films 14.1% Kang et al.
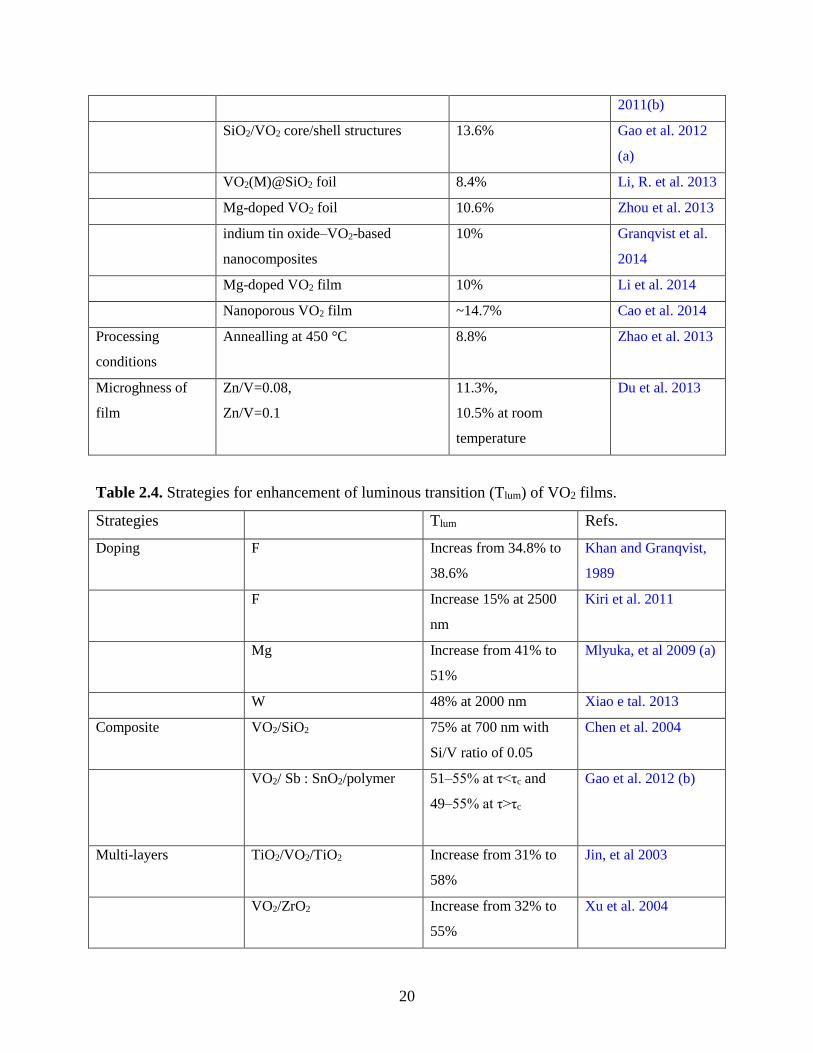
20
2011(b)
SiO2/VO2 core/shell structures 13.6% Gao et al. 2012
(a)
VO2(M)@SiO2 foil 8.4% Li, R. et al. 2013
Mg-doped VO2 foil 10.6% Zhou et al. 2013
indium tin oxide–VO2-based
nanocomposites
10% Granqvist et al.
2014
Mg-doped VO2 film 10% Li et al. 2014
Nanoporous VO2 film ~14.7% Cao et al. 2014
Processing
conditions
Annealling at 450 °C 8.8% Zhao et al. 2013
Microghness of
film
Zn/V=0.08,
Zn/V=0.1
11.3%,
10.5% at room
temperature
Du et al. 2013
Table 2.4. Strategies for enhancement of luminous transition (Tlum) of VO2 films.
Strategies Tlum Refs.
Doping F Increas from 34.8% to
38.6%
Khan and Granqvist,
1989
F Increase 15% at 2500
nm
Kiri et al. 2011
Mg Increase from 41% to
51%
Mlyuka, et al 2009 (a)
W 48% at 2000 nm Xiao e tal. 2013
Composite VO2/SiO2 75% at 700 nm with
Si/V ratio of 0.05
Chen et al. 2004
VO2/ Sb : SnO2/polymer 51–55% at τ<τc and
49–55% at τ>τc
Gao et al. 2012 (b)
Multi-layers TiO2/VO2/TiO2 Increase from 31% to
58%
Jin, et al 2003
VO2/ZrO2 Increase from 32% to
55%
Xu et al. 2004
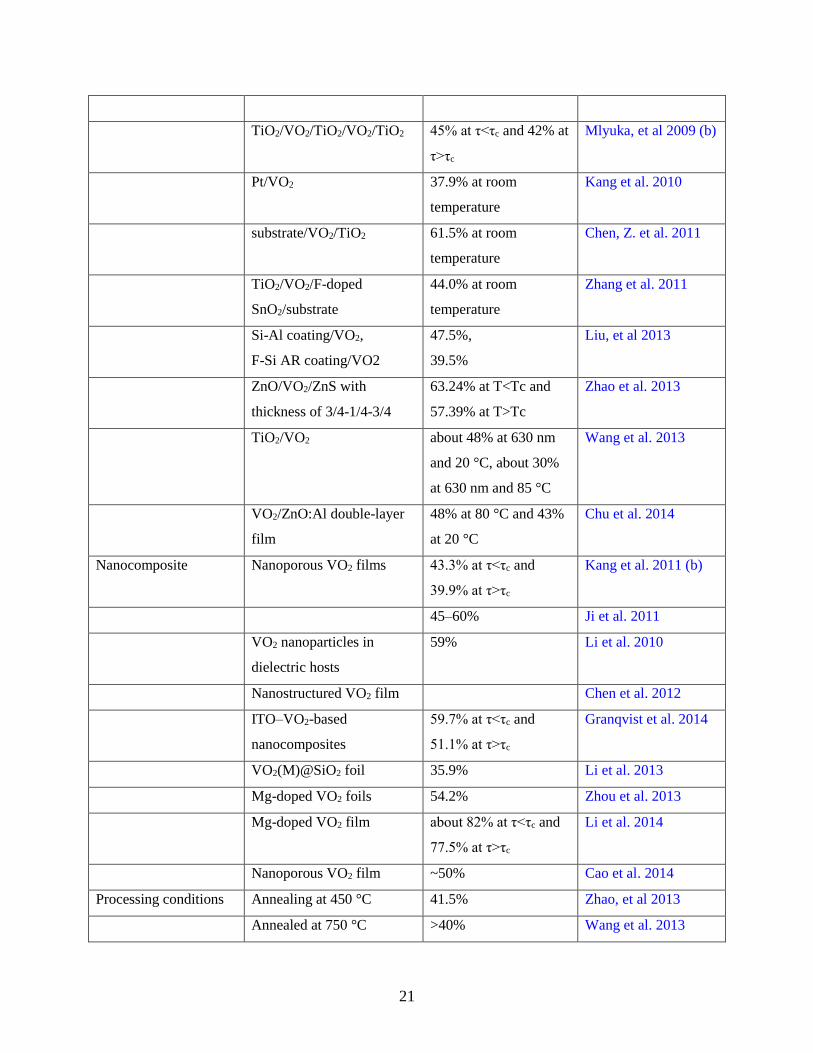
21
TiO2/VO2/TiO2/VO2/TiO2 45% at τ<τc and 42% at
τ>τc
Mlyuka, et al 2009 (b)
Pt/VO2 37.9% at room
temperature
Kang et al. 2010
substrate/VO2/TiO2 61.5% at room
temperature
Chen, Z. et al. 2011
TiO2/VO2/F-doped
SnO2/substrate
44.0% at room
temperature
Zhang et al. 2011
Si-Al coating/VO2,
F-Si AR coating/VO2
47.5%,
39.5%
Liu, et al 2013
ZnO/VO2/ZnS with
thickness of 3/4-1/4-3/4
63.24% at T<Tc and
57.39% at T>Tc
Zhao et al. 2013
TiO2/VO2 about 48% at 630 nm
and 20 °C, about 30%
at 630 nm and 85 °C
Wang et al. 2013
VO2/ZnO:Al double-layer
film
48% at 80 °C and 43%
at 20 °C
Chu et al. 2014
Nanocomposite Nanoporous VO2 films 43.3% at τ<τc and
39.9% at τ>τc
Kang et al. 2011 (b)
45–60% Ji et al. 2011
VO2 nanoparticles in
dielectric hosts
59% Li et al. 2010
Nanostructured VO2 film Chen et al. 2012
ITO–VO2-based
nanocomposites
59.7% at τ<τc and
51.1% at τ>τc
Granqvist et al. 2014
VO2(M)@SiO2 foil 35.9% Li et al. 2013
Mg-doped VO2 foils 54.2% Zhou et al. 2013
Mg-doped VO2 film about 82% at τ<τc and
77.5% at τ>τc
Li et al. 2014
Nanoporous VO2 film ~50% Cao et al. 2014
Processing conditions Annealing at 450 °C 41.5% Zhao, et al 2013
Annealed at 750 °C >40% Wang et al. 2013
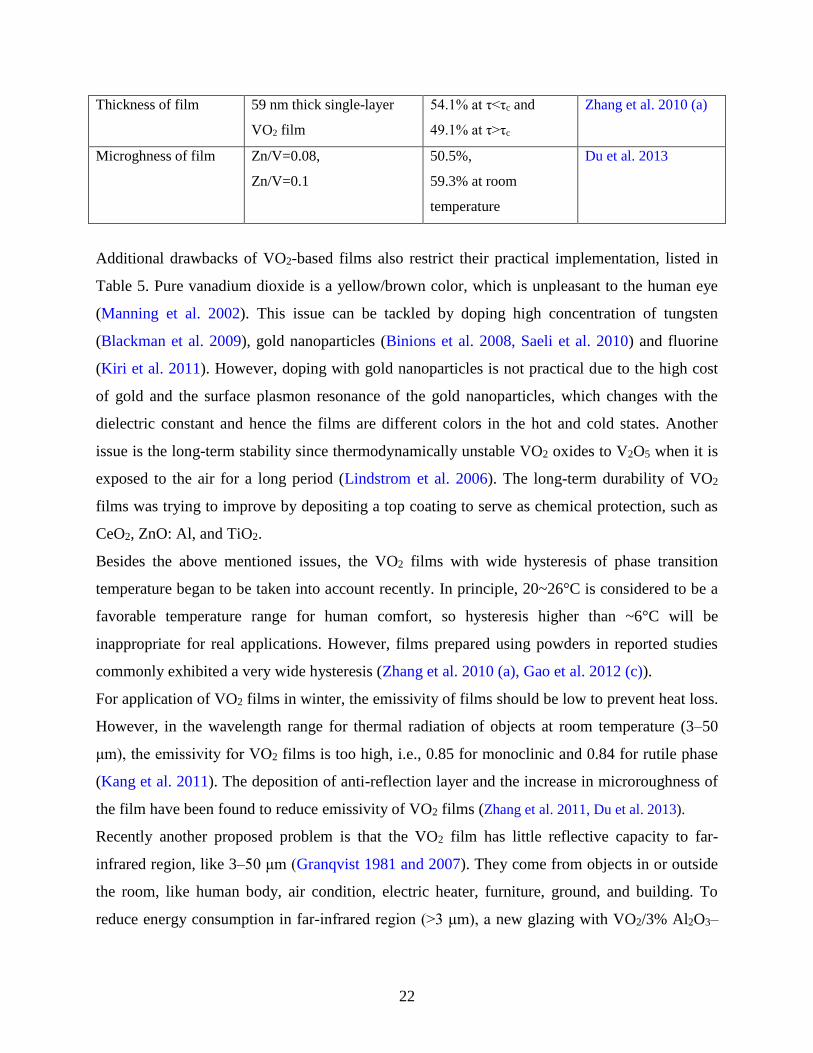
22
Thickness of film 59 nm thick single-layer
VO2 film
54.1% at τ<τc and
49.1% at τ>τc
Zhang et al. 2010 (a)
Microghness of film Zn/V=0.08,
Zn/V=0.1
50.5%,
59.3% at room
temperature
Du et al. 2013
Additional drawbacks of VO2-based films also restrict their practical implementation, listed in
Table 5. Pure vanadium dioxide is a yellow/brown color, which is unpleasant to the human eye
(Manning et al. 2002). This issue can be tackled by doping high concentration of tungsten
(Blackman et al. 2009), gold nanoparticles (Binions et al. 2008, Saeli et al. 2010) and fluorine
(Kiri et al. 2011). However, doping with gold nanoparticles is not practical due to the high cost
of gold and the surface plasmon resonance of the gold nanoparticles, which changes with the
dielectric constant and hence the films are different colors in the hot and cold states. Another
issue is the long-term stability since thermodynamically unstable VO2 oxides to V2O5 when it is
exposed to the air for a long period (Lindstrom et al. 2006). The long-term durability of VO2
films was trying to improve by depositing a top coating to serve as chemical protection, such as
CeO2, ZnO: Al, and TiO2.
Besides the above mentioned issues, the VO2 films with wide hysteresis of phase transition
temperature began to be taken into account recently. In principle, 20~26°C is considered to be a
favorable temperature range for human comfort, so hysteresis higher than ~6°C will be
inappropriate for real applications. However, films prepared using powders in reported studies
commonly exhibited a very wide hysteresis (Zhang et al. 2010 (a), Gao et al. 2012 (c)).
For application of VO2 films in winter, the emissivity of films should be low to prevent heat loss.
However, in the wavelength range for thermal radiation of objects at room temperature (3–50
μm), the emissivity for VO2 films is too high, i.e., 0.85 for monoclinic and 0.84 for rutile phase
(Kang et al. 2011). The deposition of anti-reflection layer and the increase in microroughness of
the film have been found to reduce emissivity of VO2 films (Zhang et al. 2011, Du et al. 2013).
Recently another proposed problem is that the VO2 film has little reflective capacity to far-
infrared region, like 3–50 μm (Granqvist 1981 and 2007). They come from objects in or outside
the room, like human body, air condition, electric heater, furniture, ground, and building. To
reduce energy consumption in far-infrared region (>3 μm), a new glazing with VO2/3% Al2O3–
23
ZnO double-layer film was manufactured and showed improved reflecting capacity and lower
emissivity (Chu et al. 2014).
Table 2.5. Other challenges and Solutions of VO2 films.
Drawbacks Strategies Results Refs.
Unattractive film
color
Dope W blue tinge Blackman et al. 2009
Dope Au a variety of greens and
blues
Binions et al. 2008,
Saeli et al. 2010 (b)
Dope F lighter color Kiri et al. 2011
Mg Shift from yellow to blue Zhou et al. 2013
Wide hysteresis 8 °C Wu et al. 2013
5 °C Wang et al. 2013
10 °C Gao et al. 2012 (d)
Long-term stability Deposite CeO2 film limiting the chemical
evolution under aggressive
wet atmospheres
Saitzek et al. 2007
Deposite ZnO:Al
coating
strong thermochromic
properties after oxidization
Kang et al. 2011 (a)
DepositeTiO2 film enhanced resistance to
chemical deterioration
Evans et al. 2007
SiO2/VO2 core/shell
structure
Enhanced chemical stability Gao et al. 2012
Deposite 30 nm Al oxide delayed the oxidation Ji et al. 2014
High emissivity VO2/ F-doped
SnO2/glass,
TiO2/ VO2/ F-doped
SnO2/glass
0.19 at τ<τc and 0.27 at
τ>τc,
0.13 at τ<τc and 0.24 at τ>τc
Zhang et al. 2011
Increase roughness by
using ZnCl2
0.20 at τ<τc and 0.33 at τ>τc Du et al. 2013
Low reflecting
capacity in the far-
VO2/Al2O3–ZnO double-
layer film
reflecting capacity of
49.2%, lower emissivity of
Chu et al. 2014
24
infrared region 0.66
Properties of VO2 films are also influenced by their prepation techniques. Until now, two basic
methods have been developed to fabricate VO2 films, inclcuding gas-phase deposition method
and solution based deposition method. The gas-phase depositon method is the most commonly
used and studied method for the fabrication of VO2 films, including chemical vapor deposition
(Takei and Soide 1966, Manning et al. 2002 and 2004, Mathur et al. 2007, Vernardou et al. 2004
and 2008, 2006 and 2011, Blackman et al.2009, Kiri et al. 2011), physical vapor deposition
(Guinneton 2004), pulse laser deposition (Lysenko et al. 2009, Chen, B. et al. 2009, Soltani et al.
2006), RF sputter deposition (Li et al. 2014), ion implantation (Lopez et al. 2002), atomic layer
deposition (Rampelerg et al. 2011, Blanquart et al. 2013, Povey et al. 2007, Zhang, K. et al.
2013, Madhavi et al. 2014, Kim et al. 2014) and recently new proposed high power impulse
magnetron sputtering (Fortier et al. 2014). These methods yield superior quality films with
precise control over process parameters such as oxygen partial pressure (typically in the range
0.06–0.13 Pa), and film features, including thickness and microstructure. However, these
methods are not suitable for practical manufacturing because of complex control parameter,
unstable technology, the necessity of special and expensive equipment, and high costs (Peng et
al. 2007).
Alternatively, a solution based deposition method (e.g. sol-gel) to prepare VO2 films has also
received great attention in recent years (Gao et al. 2012 (c), Pergament et al. 2008, Wu et al.
2013, Cho et al. 2012, Shi et al. 2011, Kang et al. 2010 and 2011, Chen et al. 2011, Zhang et al.
2010 (b), Jin et al. 2009, Yan et al. 2008 (b), Tsuyumoto and Nawa 2008, Yang et al. 2007, Mai
et al. 2006, Pan et al. 2004), including organic and inorganic sol-gel method. Compared with the
gas phase deposition method, solution based deposition method is cost-effective, easy doping of
other elements, large-scale deposition and flexible on complex shape or large substrate surface
(Chae and Kim 2010, Binions et al. 2007, Ye et al. 2010). Also, the inorganic sol-gel method
facilitates use of ordinary raw materials. Furthermore, sol-gel method was reported to prepare
VO2 films with narrow temperature hysteresis width. For instance, the hysteresis width of 8 °C at
500 °C was exhibited in VO2 thin films on mica substrates (Wu et al. 2013) and less 5 °C was
found in another study (Wang et al. 2013). However, this method requires complex treatment,

25
like annealing at high temperature (Kang et al. 2010). More information about these methods is
referenced in original literatures.
VO2 Nanocomposites
In the last few years nanostructured VO2 has been gaining interests which provides another
promising way to incorporate thermochromic materials into windows and auto devices. As
summarized in Table 2-4, VO2 nanocomposite can offer significant properties, e.g. lower
transition temperature (Xu et al. 2013, Dai et al. 2011, Chen et al. 2012, Zhou et al. 2013, Kong
et al. 2011, Chen et al. 2007, Peng et al. 2007), simultaneously enhanced luminous transmission
and solar modulation (Li et al. 2010, Kang et al. 2011 (b), Li et al. 2013, Zhou et al. 2013, Li et
al. 2014, Cao et al. 2014), improved stability (Melnik et al. 2012) and preferred color (Saeli et al.
2010). Various types of nanostructured VO2 have been prepared, including nanoparticles
(Ishiwata et al. 2010. Son et al. 2010, Zhang et al. 2010, Zhou et al. 2013), nanowires (Chen et
al. 2004), nanorods (Gui et al. 2002, Guiton et al. 2005, Ji et al. 2010 (a) and (b), Rama and Rao
2010, Dai et al. 2011), nanobelts (Liu et al. 2004), nanotube (Liu and Taschner 2005) (X. Liu, C.
Taschner, A. Leonhardt, M.H. Rummeli, T. Pichler, T. Gemming, B. Buchner, M. Knupfer,
Phys. Rev. B 72 (2005) 115407. ) and nanoplatelets (Tselev et al. 2010) as well as on VO2(B)
nanoparticles (Li and Liu 2010), nanorods (Chen et al. 2010), and nanobelts (Zakharova et al.
2010, Ye et al. 2010), element doped VO2 nanoparticles (Gao et al. 2010, Chen and Huang et al.
2012).
More attention has also been given to the synthetic techniques of VO2 nanocomposites, such as
thermolysis method (Zheng et al. 2001, Peng et al. 2007), reduction-hydrolysis method (Xu and
Ma et al. 2004), and hydrothermal method (Li et al. 2006, Whittaker et al. 2011, Ji et al. 2010
and 2011, Cao et al. 2008, Son et al. 2010, Cao et al. 2010, Gui et al. 2001, Zhang et al. 2013,
Liu et al. 2004, Li et al. 2009, Gao et al. 2012 (b) and 2013). Among them, the hydrothermal
synthesis has gained increasing attention due to its uncomplicated route, low cost, large-scale
and mass production. Fig. 2.2 displays the typical procedure of hydrothermal synthesis.
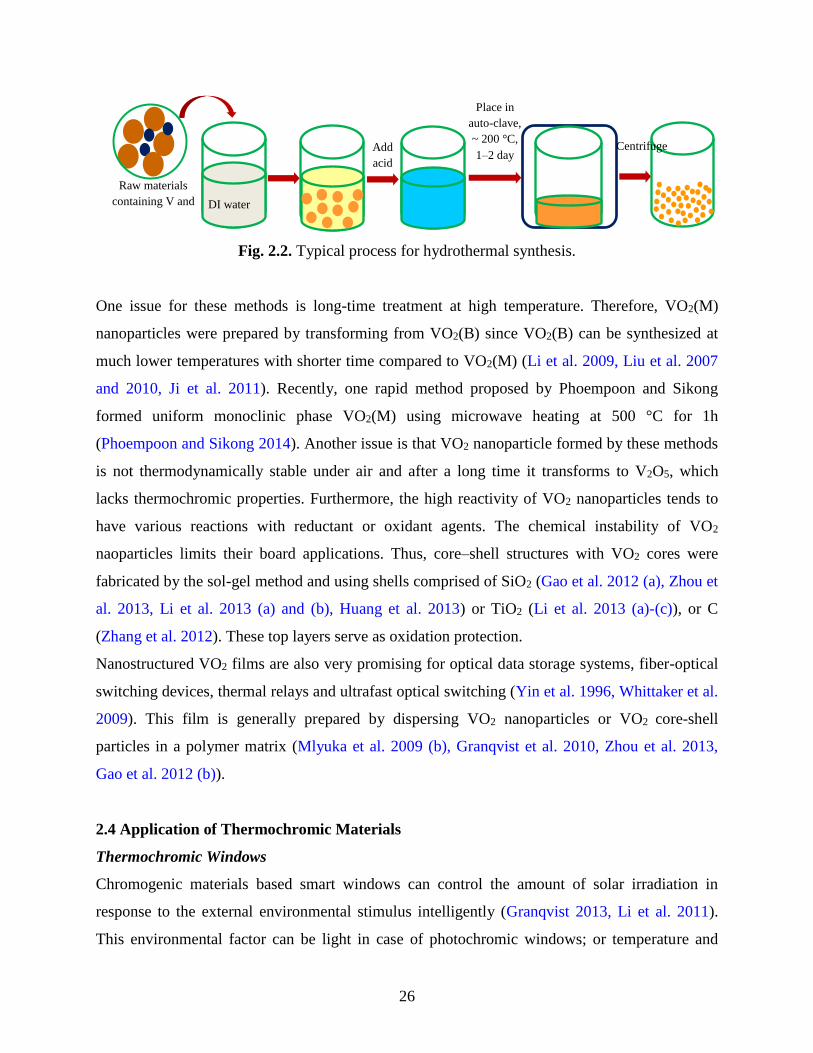
26
Fig. 2.2. Typical process for hydrothermal synthesis.
One issue for these methods is long-time treatment at high temperature. Therefore, VO2(M)
nanoparticles were prepared by transforming from VO2(B) since VO2(B) can be synthesized at
much lower temperatures with shorter time compared to VO2(M) (Li et al. 2009, Liu et al. 2007
and 2010, Ji et al. 2011). Recently, one rapid method proposed by Phoempoon and Sikong
formed uniform monoclinic phase VO2(M) using microwave heating at 500 °C for 1h
(Phoempoon and Sikong 2014). Another issue is that VO2 nanoparticle formed by these methods
is not thermodynamically stable under air and after a long time it transforms to V2O5, which
lacks thermochromic properties. Furthermore, the high reactivity of VO2 nanoparticles tends to
have various reactions with reductant or oxidant agents. The chemical instability of VO2
naoparticles limits their board applications. Thus, core–shell structures with VO2 cores were
fabricated by the sol-gel method and using shells comprised of SiO2 (Gao et al. 2012 (a), Zhou et
al. 2013, Li et al. 2013 (a) and (b), Huang et al. 2013) or TiO2 (Li et al. 2013 (a)-(c)), or C
(Zhang et al. 2012). These top layers serve as oxidation protection.
Nanostructured VO2 films are also very promising for optical data storage systems, fiber-optical
switching devices, thermal relays and ultrafast optical switching (Yin et al. 1996, Whittaker et al.
2009). This film is generally prepared by dispersing VO2 nanoparticles or VO2 core-shell
particles in a polymer matrix (Mlyuka et al. 2009 (b), Granqvist et al. 2010, Zhou et al. 2013,
Gao et al. 2012 (b)).
2.4 Application of Thermochromic Materials
Thermochromic Windows
Chromogenic materials based smart windows can control the amount of solar irradiation in
response to the external environmental stimulus intelligently (Granqvist 2013, Li et al. 2011).
This environmental factor can be light in case of photochromic windows; or temperature and
Raw materials
containing V and
other dopants DI water
Add
acid
solutio
n
Place in
auto-clave,
~ 200 °C,
1–2 day
Centrifuge
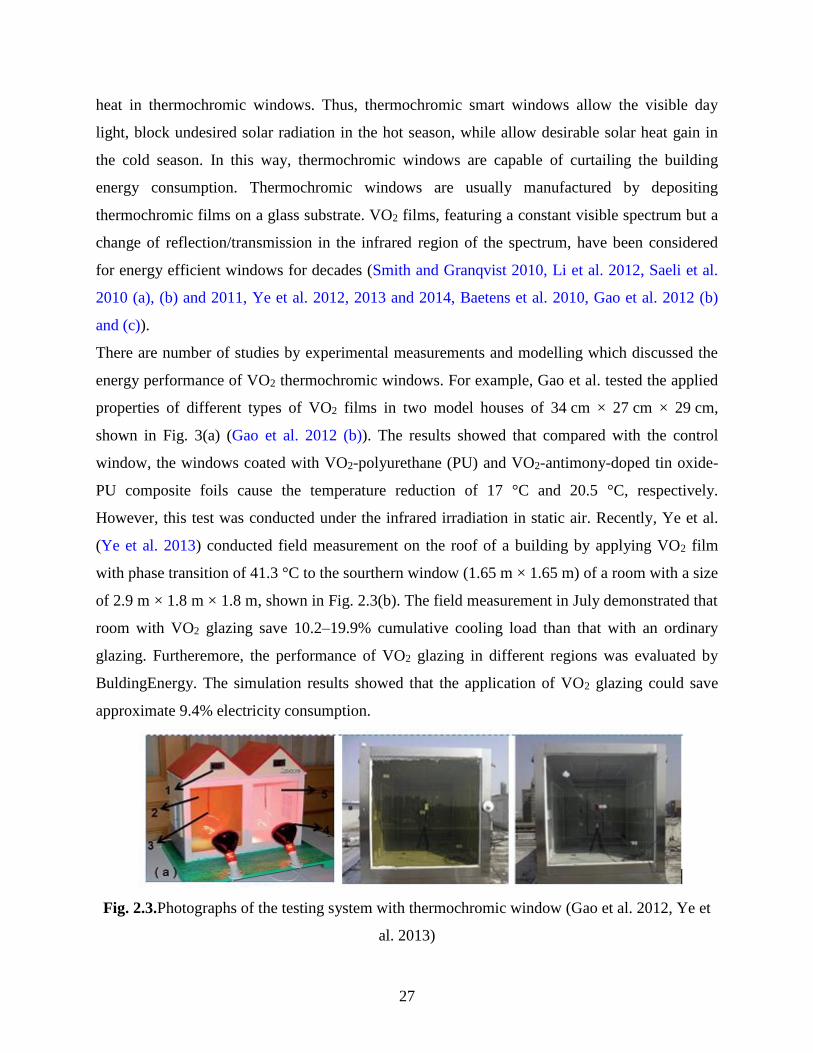
27
heat in thermochromic windows. Thus, thermochromic smart windows allow the visible day
light, block undesired solar radiation in the hot season, while allow desirable solar heat gain in
the cold season. In this way, thermochromic windows are capable of curtailing the building
energy consumption. Thermochromic windows are usually manufactured by depositing
thermochromic films on a glass substrate. VO2 films, featuring a constant visible spectrum but a
change of reflection/transmission in the infrared region of the spectrum, have been considered
for energy efficient windows for decades (Smith and Granqvist 2010, Li et al. 2012, Saeli et al.
2010 (a), (b) and 2011, Ye et al. 2012, 2013 and 2014, Baetens et al. 2010, Gao et al. 2012 (b)
and (c)).
There are number of studies by experimental measurements and modelling which discussed the
energy performance of VO2 thermochromic windows. For example, Gao et al. tested the applied
properties of different types of VO2 films in two model houses of 34 cm × 27 cm × 29 cm,
shown in Fig. 3(a) (Gao et al. 2012 (b)). The results showed that compared with the control
window, the windows coated with VO2-polyurethane (PU) and VO2-antimony-doped tin oxide-
PU composite foils cause the temperature reduction of 17 °C and 20.5 °C, respectively.
However, this test was conducted under the infrared irradiation in static air. Recently, Ye et al.
(Ye et al. 2013) conducted field measurement on the roof of a building by applying VO2 film
with phase transition of 41.3 °C to the sourthern window (1.65 m × 1.65 m) of a room with a size
of 2.9 m × 1.8 m × 1.8 m, shown in Fig. 2.3(b). The field measurement in July demonstrated that
room with VO2 glazing save 10.2–19.9% cumulative cooling load than that with an ordinary
glazing. Furtheremore, the performance of VO2 glazing in different regions was evaluated by
BuldingEnergy. The simulation results showed that the application of VO2 glazing could save
approximate 9.4% electricity consumption.
Fig. 2.3.Photographs of the testing system with thermochromic window (Gao et al. 2012, Ye et
al. 2013)
28
Saeli et al. firstly simulated the energy consumption of the rooms with thermochromic glazing
using Energy Plus (Saeli et al. 2010 (a) and 2011) and demonstrated the potential of VO2 glazing
in saving energy. According to the conclusions, the total energy consumption reduced more for
commercial windows (100% of wall area glazing) than the residential case (25% of wall area
glazing). It is found that the glazing works best in cities with warmer climates but is not
applicable in cold climate region due to its low solar transmittance, which decreases the indoor
heat gain from the solar radiation and leads to an increase in heating energy consumption.
Similarily, Xu et al. (Xu et al. 2012) found the cooling energy consumption of the double glass
coated with VO2 films outside is 85% lower than white glass, while the heating consumption of
the VO2 glazing is the highest. The result of this study also shows that thermochromic windows
are more suitable for cooling demand climates. Again, Lee et al. (Lee et al. 2013) evaluated
large-area polymer thermochromic laminated windows in a full-scale tested office. The film had
a broad switching temperature range and when combined to make an insulating window unit had
center-of-glass properties of Tsol=0.12–0.03, Tvis=0.28–0.03 for a glass temperature range of 24–
75 °C. The EnergyPlus simulation results demonstrated that annual energy savings in the south,
east, and west perimeter zones are 20–43% in the hot/cold climate of Chicago compared to the
ASHRAE 90.1-2004 Standard prescriptive window. Compared to code, energy saving in hot
climates is lower, e.g. 4–22% in Houston. What’s more, Hoffmann (Hoffmann et al. 2014)
conducted EnergyPlus simulations on a prototypical large office building with a hypothetical
thermochromic glazing with variable solar transimission in the near-infrared region of the solar
spectrum: Tsol=0.10–0.50 and Tvis=0.30–0.60. This glazing coupled with a low-e glazing layer
(e=0.04) could reduce the total site annual energy use of 14.0–21.1 kW h/m2-floor-yr or 12–14%
for moderate- to large-area windows (WWR≥0.30) in Chicago and 9.8–18.6 kW h/m2-floor-yr or
10–17% for WWR≥0.45 in Houston compared to an unshaded spectrally-selective, low-e
window in south-, east-, and west-facing perimeter zones.
However, Ye et al. (Ye eet al. 2012) evaluated the energy consumption of different
thermochromic windows by an energy analysis program “BuildingEnergy” and found that VO2
glazing has no apparent energy saving benefit and solar control advantage over conventional
glazing. It was concluded that, the energy saving effect of thermochromic windows in summer is
due to low transmittance of solar radiation and the higher absorptivity in the metal state results in
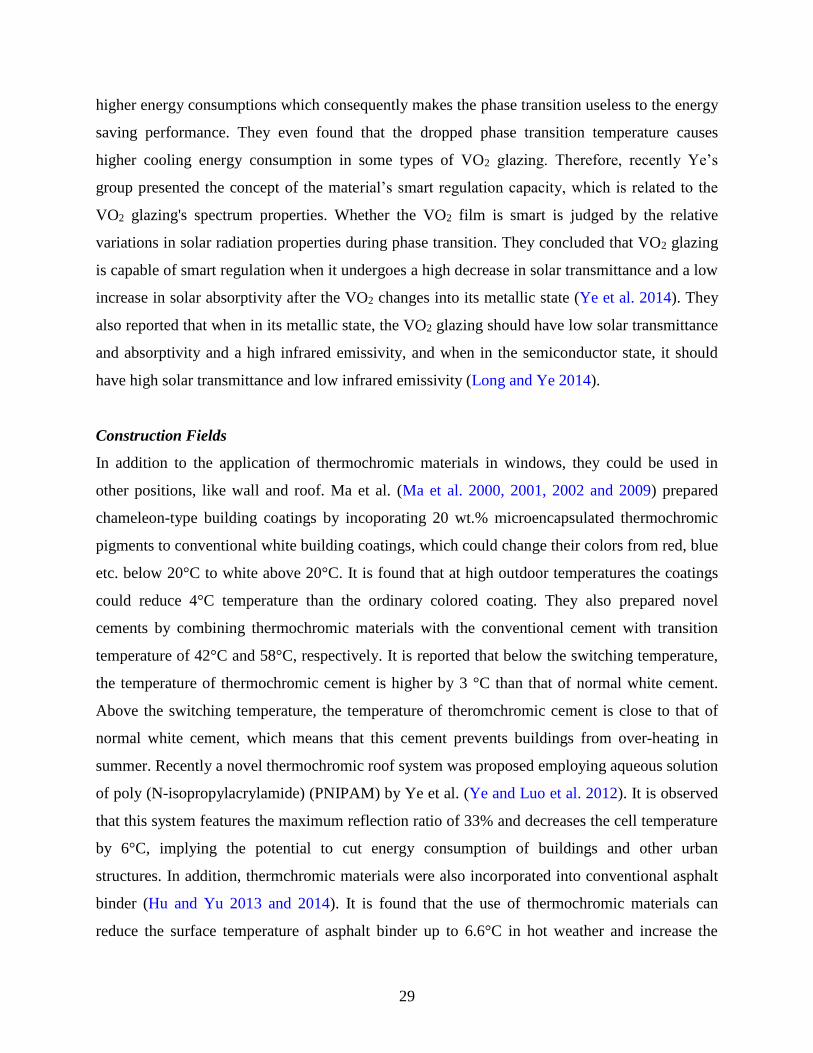
29
higher energy consumptions which consequently makes the phase transition useless to the energy
saving performance. They even found that the dropped phase transition temperature causes
higher cooling energy consumption in some types of VO2 glazing. Therefore, recently Ye’s
group presented the concept of the material’s smart regulation capacity, which is related to the
VO2 glazing's spectrum properties. Whether the VO2 film is smart is judged by the relative
variations in solar radiation properties during phase transition. They concluded that VO2 glazing
is capable of smart regulation when it undergoes a high decrease in solar transmittance and a low
increase in solar absorptivity after the VO2 changes into its metallic state (Ye et al. 2014). They
also reported that when in its metallic state, the VO2 glazing should have low solar transmittance
and absorptivity and a high infrared emissivity, and when in the semiconductor state, it should
have high solar transmittance and low infrared emissivity (Long and Ye 2014).
Construction Fields
In addition to the application of thermochromic materials in windows, they could be used in
other positions, like wall and roof. Ma et al. (Ma et al. 2000, 2001, 2002 and 2009) prepared
chameleon-type building coatings by incoporating 20 wt.% microencapsulated thermochromic
pigments to conventional white building coatings, which could change their colors from red, blue
etc. below 20°C to white above 20°C. It is found that at high outdoor temperatures the coatings
could reduce 4°C temperature than the ordinary colored coating. They also prepared novel
cements by combining thermochromic materials with the conventional cement with transition
temperature of 42°C and 58°C, respectively. It is reported that below the switching temperature,
the temperature of thermochromic cement is higher by 3 °C than that of normal white cement.
Above the switching temperature, the temperature of theromchromic cement is close to that of
normal white cement, which means that this cement prevents buildings from over-heating in
summer. Recently a novel thermochromic roof system was proposed employing aqueous solution
of poly (N-isopropylacrylamide) (PNIPAM) by Ye et al. (Ye and Luo et al. 2012). It is observed
that this system features the maximum reflection ratio of 33% and decreases the cell temperature
by 6°C, implying the potential to cut energy consumption of buildings and other urban
structures. In addition, thermchromic materials were also incorporated into conventional asphalt
binder (Hu and Yu 2013 and 2014). It is found that the use of thermochromic materials can
reduce the surface temperature of asphalt binder up to 6.6°C in hot weather and increase the
30
surface temperature in cold weather. This implies that the application of thermochromic
materials can potentially improve the durability of asphalt pavement as well as mitigate the urban
heat island effects.
2.5 Conclusions and Recommendations
The common types of thermochromic materials were summarized, including classifications,
thermochromisms, VO2 films and nanoparticles, applications and their performances.
Among the organic, polymer and inorganic thermochromic materials, vanadium dioxide is the
most studied thermcohromic materials, due to its transition temperature close to the room
temperature, and as such features the greatest potential for application in thermochromic devices
and smart windows. However, significant challenges impede the large scale application and
commercialization of VO2 films, including high transition temperature, low solar modulation
(change of solar transmission during phase transition), low visible transmission, unattractive
color, long-term durability, and low reflecting capacity in the far-infrared region. Some of them
can be addressed by doping elements (W, Mo, Mg, F, Au), forming composite, adjusting
thickness of film, designing multilayer, using nanoparticles, or controlling processing conditions
and surface roughness. However, no one strategy can address all of the challenges
simultaneously. For instance, the doping with tungsten always decreases solar modulation.
Therefore, a novel material, a new solution or a combination of these existing solutions is
urgently needed for future study.
Nanostructured VO2 particles and films have recently attracted much attention due to their
distinguished features, including reduced phase transition temperature, simultaneously enhanced
Tlum and ΔTsol, and narrow hysteresis. Several methods have been proposed to synthesize VO2
nanoparticles, including thermolysis, hydrothermal method, and core-shell structure. One key
point is to fabricate high quality nanostructured VO2 in a simple, low cost and large-scale
approach.
Thermochromic smart windows, typically based on VO2 films, have been widely studied for
energy saving in buildings. In theory, with an appropriate transition temperature, the adoption of
VO2 glazing could reduce both cooling and heating energy consumption by regulating heat gain
in buildings. However, some experimental and modelling results showed that thermochromic
smart windows only save cooling energy, have no benefits or even increase heating energy
31
consumption.The inconsistency between theory and modelling about the energy performance of
thermochromic windows emphasizes the necessity of more comprehensive research in this field.
Therefore, phase transition temperature and temperature range, changes of transmission,
absorption, reflection and emissivity need be carefully designed to maximize the smart
regulation capacity of thermochromic glazing systems. Specifically, the ideal transition
temperature should be as low as possible to maximize the time the film spends in the hot and
infrared reflective state. Thermochromic films with a narrow switching range about 1–2 °C is
also encouraged to produce small temperature gradient and exhibit even appearance, which is
desirable from the architectural esthetic perspective. Besides, the change in the infrared optical
properties should be as large as possible to maximize the benefit of the hot and reflective state.
The larger the change of reflection and transmission between hot and cold state, the higher the
energy saving performance can be achieved. The film with high emissivity in both the cold and
hot state is not suitable for cold region. Summarily, above the transition temperature, the glazing
should have low solar transmittance and absorption, higher reflection and infrared emissivity,
while below the transition temperature, it should feature high transmittance and absorption, low
reflection and infrared emissivity.
Besides these characteristics, future glazing system for buildings should possess multiple
functions from the viewpoints of energy-efficiency and environmental friendship, such as self-
protecting based on CeO2, ZnO:Al, and TiO2, light control, energy conversion, and so on.
Furthermore, the combination of thermochromic windows with photo-, electro- and/or gaso-
chromic windows offers a new and promising energy saving application in buildings.
The most widely used thermochromic materials, VO2, can undergo a sharp, reversible metal-to-
insulator transition, accompanying by dramiatic changes in electric and near-infrared optical
properties. These unique characteristics make VO2 a promising material for a variety of potential
applications such as the aforementioned energy-efficient windows, thermal sensors (Sella et al.
1998), cathode materials for reversible lithium batteries (Ni et al. 2011), electrical and infrared
light switching device (Chen et al. 2008. Viswanath et al. 2011), electronic and gas sensing
devices (Strelcov et al. 2009, Bae et al. 2013) and electromechanical actuators (Lee et al. 2013).
New applications and other promising thermochromic materials are needed to further explore.

32
Traditional thermochromic materials based on metallic powder or crystal salt, while functioning
as a solar modulator, have poor compatibility with asphalt binders. Therefore, they can accelerate
bonding deterioration in the asphalt binder. Polymeric thermochromic dyes feature excellent
compatibility with asphalt binders. Therefore, they are promising to be effective in modulating
the surface temperature of pavement.
33
2.6 References
(1) Baetens, R., Jelle, B.P., Gustavsen, A. Properties, requirements and possibilities of smart
windows for dynamic daylight and solar energy control in buildings: a state-of-the-art
review. Solar Energy Materials and Solar Cells, 2010, 94(2): 87–105.
(2) Bae, S.H., Lee, S., Koo, H., Lin, L., Jo, B.H., Park, C., Wang, Z. L. The memristive
properties of a single VO2 nanowire with switching controlled by self-heating. Advanced
Materials, 2013, 25(36):5098-103
(3) Batista, C., Teixeira, V., Ribeiro, R.M. Synthesis and Characterization of V1- xMoxO2
Thermochromic Coatings with Reduced Transition Temperatures. Journal of nanoscience
and nanotechnology, 2010, 10(2): 1393–1397.
(4) Batista, C., Carneiro, J., Ribeiro, R., Teixeira, V. Reactive Pulsed-DC Sputtered Nb-doped
VO2 coatings for smart thermochromic windows with active solar control. Journal of
Nanoscience and Nanotechnology, 2011, 11(10): 9042–9045(4).
(5) Berezina, O.Ya., Velichko, A.A., Lugovskaya, L.A., Pergament, A.L., Stefanovich, G.B.
Metal-semiconductor transition in nonstoichiometric vanadium dioxide films. Inorganic
Materials, 2007, 43(5): 505–511.
(6) Binions, R., Hyett, G., Piccirillo, C., Parkin, I.P. Doped and un-doped vanadium dioxide
thin films prepared by atmospheric pressure chemical vapour deposition from vanadyl
acetylacetonate and tungsten hexachloride: the effects of thickness and crystallographic
orientation on thermochromic properties. Journal of Materials Chemistry, 2007, 17(44):
4650–4652.
(7) Binions, R., Piccirillo, C., Palgrave, R.G., Parkin, I.P. Hybrid Aerosol Assisted and
Atmospheric Pressure CVD of Gold-Doped Vanadium Dioxide. Chemical Vapor
Deposition, 2008, 14(1-2): 33–39.
(8) Blackman, C.S., Piccirillo, C., Binions, R., Parkin, I.P. Atmospheric pressure chemical
vapour deposition of thermochromic tungsten doped vanadium dioxide thin films for use
in architectural glazing. Thin Solid Films, 2009, 517(16): 4565–4570.
(9) Blanquart, T., Niinisto, J., Gavagnin, M., Longo, V., Heikkila, M., Puukilainen, E., Pallem,
V.R., Dussarrat, C., Ritala, M., Leskela, M. Atomic layer deposition and characterization
of vanadium oxide thin films. RSC Advances, 2013, 3(4): 1179–1185.
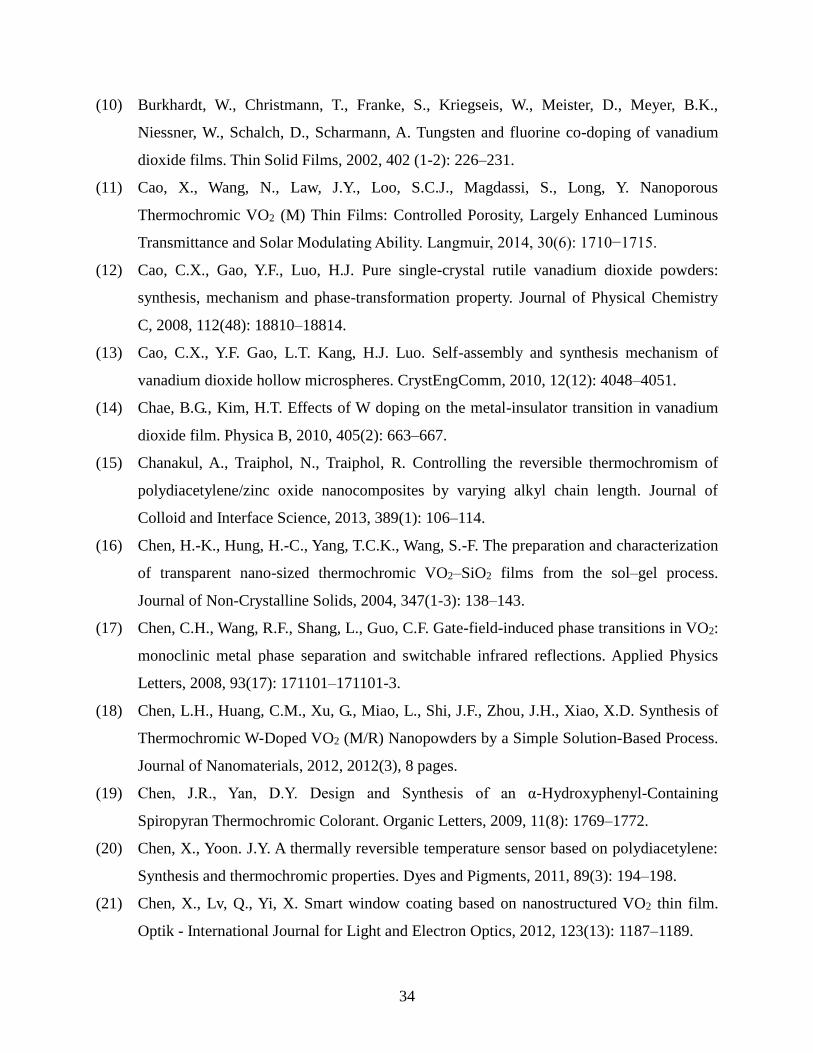
34
(10) Burkhardt, W., Christmann, T., Franke, S., Kriegseis, W., Meister, D., Meyer, B.K.,
Niessner, W., Schalch, D., Scharmann, A. Tungsten and fluorine co-doping of vanadium
dioxide films. Thin Solid Films, 2002, 402 (1-2): 226–231.
(11) Cao, X., Wang, N., Law, J.Y., Loo, S.C.J., Magdassi, S., Long, Y. Nanoporous
Thermochromic VO2 (M) Thin Films: Controlled Porosity, Largely Enhanced Luminous
Transmittance and Solar Modulating Ability. Langmuir, 2014, 30(6): 1710−1715.
(12) Cao, C.X., Gao, Y.F., Luo, H.J. Pure single-crystal rutile vanadium dioxide powders:
synthesis, mechanism and phase-transformation property. Journal of Physical Chemistry
C, 2008, 112(48): 18810–18814.
(13) Cao, C.X., Y.F. Gao, L.T. Kang, H.J. Luo. Self-assembly and synthesis mechanism of
vanadium dioxide hollow microspheres. CrystEngComm, 2010, 12(12): 4048–4051.
(14) Chae, B.G., Kim, H.T. Effects of W doping on the metal-insulator transition in vanadium
dioxide film. Physica B, 2010, 405(2): 663–667.
(15) Chanakul, A., Traiphol, N., Traiphol, R. Controlling the reversible thermochromism of
polydiacetylene/zinc oxide nanocomposites by varying alkyl chain length. Journal of
Colloid and Interface Science, 2013, 389(1): 106–114.
(16) Chen, H.-K., Hung, H.-C., Yang, T.C.K., Wang, S.-F. The preparation and characterization
of transparent nano-sized thermochromic VO2–SiO2 films from the sol–gel process.
Journal of Non-Crystalline Solids, 2004, 347(1-3): 138–143.
(17) Chen, C.H., Wang, R.F., Shang, L., Guo, C.F. Gate-field-induced phase transitions in VO2:
monoclinic metal phase separation and switchable infrared reflections. Applied Physics
Letters, 2008, 93(17): 171101–171101-3.
(18) Chen, L.H., Huang, C.M., Xu, G., Miao, L., Shi, J.F., Zhou, J.H., Xiao, X.D. Synthesis of
Thermochromic W-Doped VO2 (M/R) Nanopowders by a Simple Solution-Based Process.
Journal of Nanomaterials, 2012, 2012(3), 8 pages.
(19) Chen, J.R., Yan, D.Y. Design and Synthesis of an α-Hydroxyphenyl-Containing
Spiropyran Thermochromic Colorant. Organic Letters, 2009, 11(8): 1769–1772.
(20) Chen, X., Yoon. J.Y. A thermally reversible temperature sensor based on polydiacetylene:
Synthesis and thermochromic properties. Dyes and Pigments, 2011, 89(3): 194–198.
(21) Chen, X., Lv, Q., Yi, X. Smart window coating based on nanostructured VO2 thin film.
Optik - International Journal for Light and Electron Optics, 2012, 123(13): 1187–1189.
35
(22) Chen, S., Ma, H., Dai, J., Yi, X. Nanostructured vanadium dioxide thin films with low
phase transition temperature. Applied Physics Letters, 2007, 90(10):101117– 101117-3.
(23) Chen, Z., Gao, S., Jiang, L., Wie, M., Wie, K. Crystalline VO2 (B) nanorods with a
rectangular cross-section. Materials Chemistry and Physics, 2010, 121(1-2): 254–258.
(24) Chen, Z., Gao, Y., Kang, L., Du, J., Zhang, Z., Luo, H., Miao, H., Tan, G. VO2-based
double-layered films for smart windows: optical design, all-solution preparation and
improved properties. Solar Energy Materials and Solar Cells, 2011, 95(9): 2677–2684.
(25) Chen, B., Yang, D., Charpentier, P.A., Zeman, M. Al3+-doped Vanadium Dioxide Thin
Films Deposited by PLD. Solar Energy Materials and Solar Cells, 2009. 93(9): 1550–
1554.
(26) Chen, W., Peng, J.F., Mai, L.Q., Xu, Q., Zhu, Q.Y. Syntheses and characterizations of two
kinds of one-dimensional nanostructure vanadium oxide. Chinese J Inorg Chem , 2004,
20(2004): 147.
(27) Cho, J.-H., Byun, Y.-J., Kim, J.-H., Lee, Y.-J., Jeong, Y.-H., Chun, M.-P., Paik, J.-H., Sung,
T.H. Thermochromic characteristics of WO3-doped vanadium dioxide thin films prepared
by sol–gel method. Ceramics International, 2012, 38S (1): S589–S593.
(28) Chu, X.H., Tao, H., Liu, Y., Ni, J., Bao, J., Zhao, X. VO2/AZO double-layer films with
thermochromism and low-emissivity for smart window applications. Journal of Non-
Crystalline Solids, 2014, 383(1): 121–125.
(29) Crano, J.C., Guglielmetti, R.J. Organic Photochromic and Thermochromic Compounds.
vol. 2, Kluwer Academic/Plenum Publishers, New York, 1999.
(30) Dai, L., C. Cao, Gao, Y., Luo, H. Synthesis and phase transition behavior of undoped VO2
with a strong nano-size effect, Solar Energy Materials and Solar Cells, 2011, 95(2): 712–
715.
(31) Du, J. Gao, Y., Chen, Z., Kang, L., Zhang, Z., Luo, H. Enhancing thermochromic
performance of VO2 films via increased microroughness by phase separation. Solar
Energy Materials and Solar Cells, 2013, 110: 1–7.
(32) Evans, P., Pemble, M.E., Sheel, D.W., Yates, H.M. Multi-functional self-cleaning
thermochromic films by atmospheric pressure chemical vapour deposition. Journal of
Photochemistry and Photobiology A: Chemistry, 2007, 189(2–3): 387–397.
(33) Fortier, J.-P., Baloukas, B., Zabeida, O., Klemberg-Sapieha, J.E., Martinu, L.
36
Thermochromic VO2 thin films deposited by HiPIMS. Solar Energy Materials and Solar
Cells, 2014, 125: 291–296.
(34) Fu, G.H., Polity, A., Volbers, N., Meyer, B.K. Annealing effects on VO2 thin films
deposited by reactive sputtering. Thin Solid Films, 2006, 515(4): 2519–2522.
(35) Gadžurić, S., Vraneš, M., Dožić, S. Thermochromic cobalt(II) chloro-complexes in
different media: Possible application for auto-regulated solar protection. Solar Energy
Materials and Solar Cells, 2012, 105: 309–316.
(36) Gao, Y., Wang, S., Luo, H., Dai, L., Cao, C., Liu, Y., Chen, Z., Kanehira, M. Enhanced
chemical stability of VO2 nanoparticles by the formation of SiO2/VO2 core/shell
structures and the application to transparent and flexible VO2-based composite foils with
excellent thermochromic properties for solar heat control. Energy and Environmental
Science, 2012, 5 (3): 6104–6110.
(37) Gao, Y.F., Wang, S., Kang, L., Chen, Z., Du, J., Liu, X., Luo H., Kanehira, M. VO2–
Sb:SnO2 composite thermochromic smart glass foil. Energy & Environmental Science,
2012, 5(8): 8234–8237.
(38) Gao, Y., Luo, H., Zhang, Z., Kang, L., Chen, Z., Du, J., Kanehira, M., Cao, C.
Nanoceramic VO2 thermochromic smart glass: a review on progress in solution
progressing. Nano Energy, 2012, 1(2): 221–246.
(39) Gao, Y., Cao, C., Dai, L., Luo, H., Kanehira, M., Ding, Y., Wang, Z.L. Phase and shape
controlled VO2 nanostructures by antimony doping. Energy Environ. Sci., 2012, 5(9):
8708–8715.
(40) Granqvist, C.G. Radiative heating and cooling with spectrally selective surfaces. Applied
Optics, 1981, 20: 2606–2615.
(41) Granqvist, C.G. Transparent conductors as solar energy materials: a panoramic review.
Solar Energy Materials and Solar Cells, 2007, 91: 1529–1598.
(42) Granqvist, C. G., Green, S., Niklasson, G.A., Mlyuka, N.R., von Kraemer, S., Georen, P.
Advances in chromogenic materials and devices.Thin Solid Films, 2010, 518(11): 3046–
3053.
(43) Granqvist, C.G. Chromogenic windows. Advances in Science and Technology, 2013, 77:
108–117.
(44) Granqvist, C. G., Pehlivan, B., Ji, Y.-X., Li, S.-Y., Niklasson, G.A. Electrochromics and
37
thermochromics for energy efficient fenestration: Functionalities based on nanoparticles of
In2O3:Sn and VO2. Thin Solid Films, 2014, 559: 2–8.
(45) Gui, Z., Fan, R., Chen, X.H., Wu, Y.C. A new metastable phase of needle-like
nanocrystalline VO2 center dot H2O and phase transformation. Journal of Solid State
Chemistry, 2001, 157(2): 250–254.
(46) Gui, Z., Fan, R., Mo, W.Q., Chen, X.H., Yang, L., Zhang, S.Y., Hu, Y., Wang, Z.Z., Fan,
W.C. Precursor Morphology Controlled Formation of Rutile VO2 Nanorods and Their
Self-Assembled Structure. Chem. Mater., 2002, 14(12): 5053–5056.
(47) Guo, L.L., Dai, Y.D., Liu, H.X., Ouyang, S.X. Phase Transition and Thermochromism of
the Hybrid (C12H25NH3)2FeCl4. Solid State Phenomena, 2006, 111: 55–58.
(48) Guinneton, F. Optimized infrared switching properties in thermochromic vanadium
dioxide thin films: role of deposition process and microstructure.Thin Solid Films, 2004,
446(2): 287–295.
(49) Guiton, B.S., Gu, Q., Prieto, A.L., Gudiksen, M.S., Park, H. Single-crystalline vanadium
dioxide nanowires with rectangular cross sections. Journal of the American Chemical
Society, 2005, 127(2): 498-499.
(50) Hanlon, T.J., Coath, J.A., Richardson, M.A. Molybdenum-doped vanadium dioxide
coatings on glass produced by the aqueous sol–gel method. Thin Solid Films, 2003,
436(2): 269–272.
(51) Hoffmann, S., Lee, E.S., Clavero, C. Examination of the technical potential of near-
infrared switching thermochromic windows for commercial building applications. Solar
Energy Materials and Solar Cells, 2014, 123: 65–80.
(52) Huang, Z., Chen, S., Wang, B., Huang, Y., Liu, N., Xu, J., Lai, J. Vanadium dioxide thin
film with low phase transition temperature deposited on borosilicate glass substrate. Thin
Solid Films, 2011, 519(13): 4246–4248.
(53) Huang, A., Zhou, Y., Li, Y., Ji, S., Luo, H., Jin, P. Preparation of VxW1-xO2(M)@SiO2
ultrathin nanostructures with high optical performance and optimization for smart
windows by etching.
(54) Journal of Materials Chemistry A, 2013, 1(40): 12545–12552.
(55) Hu, J.Y., Yu, X. Experimental Study of Sustainable Asphalt Binder. Journal of the
Transportation Research Board, 2013, 2372(1): 108-115.
38
(56) Hu, J.Y., Gao, Q., Yu, X. Characterization of the Optical and Mechanical Properties of
Innovative Multifunctional Thermochromic Asphalt Binders. Journal of Materials in Civil
Engineering, 2014.
(57) Ishiwata, Y., Suehiro, S., Hagihala, M., Zheng, X.G., Kawae, T., Morimoto, O., Tezuka, Y.
Unusual low-temperature phase in VO2 nanoparticles. Physical Review B, 2010,
82(1182): 115404.
(58) Ji, S.D., Y. Zhao, F. Zhang, P. Jin. Direct formation of single crystal VO2(R) nanorods by
one-step hydrothermal treatment. Journal of Crystal Growth, 2010, 312(2): 282–286.
(59) Ji, S.D., Zhao, Y., Zhang, F., Jin, P. Synthesis and phase transition behavior of w-doped
VO2(A) nanorods. Ceramic Society of Japan, 2010, 118(1382): 867–871.
(60) Ji, Y.X., Li, S.-Y., Niklasson, G.A., Granqvist, C.G. Durability of thermochromic VO2 thin
films under heating and humidity: Effect of Al oxide top coatings. Thin Solid Films, 2014,
562: 568–573.
(61) Ji, S., Zhang, F., Jin, P. Preparation of high performance pure single phase VO2
nanopowder by hydrothermally reducing the V2O5 gel. Solar Energy Materials and Solar
Cells, 2011, 95(12): 3520–3526.
(62) Jiang, M., Wang, E., Xu, L., Kang, Z., Lian, S. The first example of multilayer films with
thermochromic properties. Journal of Solid State Chemistry, 2004, 177(4–5): 1776–1779.
(63) Jin, P., Xu, G., Tazawa, M., Yoshimura, K. Design, formation and characterization of a
novel multifunctional window with VO2 and TiO2 coatings. Applied Physics A, 2003,
77(3-4): 455–459.
(64) Jin, A., Chen, W., Zhu, Q., Yang, Y., Volkov, V., Zakharova, G. Structural and
electrochromic properties of molybdenum doped vanadium pentoxide thin films by sol-gel
and hydrothermal synthesis. Thin Solid Films, 2009, 517(6): 2023–2028.
(65) Kang, L., Gao, Y., Chen, Z., Du, J., Zhang, Z., Luo, H. Pt/VO2 double-layered films
combining thermochromic properties with low emissivity. Solar Energy Materials and
Solar Cells, 2010, 94(12): 2078–2084.
(66) Kang, L.T., Gao, Y., Luo, H., Wang, J., Zhu, B., Zhang, Z., Du, J., Kanehira, M., Zhang, Y.
Thermochromic properties and low emissivity of ZnO:Al/VO2 double-layered films with
a lowered phase transition temperature. Solar EnergyMaterials & Solar Cells, 2011,
95(12): 3189–3194.
39
(67) Kang, L.T., Gao,Y.F., Luo, H.J., Chen, Z., Du, J., Zhang, Z.T. Nanoporous thermochromic
VO2 films with low optical constants, enhanced luminoustransmittance and
thermochromic properties. ACS Applied Materials and Interfaces, 2011, 3(2): 135–138.
(68) Karlessi, T., Santamouris, M., Apostolakis, K., Synnefa, A., Livada, I. Development and
testing of thermochromic coatings for buildings and urban structures. Solar Energy, 2009,
83(4): 538–551.
(69) Khan, K.A., Granqvist, C.G. Thermochromic sputter-deposited vanadium oxyflu-oride
coatings with low luminous absorptance. Applied Physics Letters, 1989, 55(1): 4–6.
(70) Kim, C.-Y., Kim, S.H., Kim, S.J., An, K.-S. VO2(1 1 0) film formation on TiO2 (1 1 0)
through post-reduction of ALD grown vanadium oxide. Applied Surface Science, 2014,
313: 368–371.
(71) Kiri, P., Warwick, M.E.A., Ridley, I., Binions, R. Fluorine doped vanadium dioxide thin
films for smart windows. Thin Solid Films, 2011, 520(4): 1363–1366.
(72) Koo, H., Yoon, S., Kwon, O.J., Ko, K.E., Shin, D., Bae, S.H., Chang, S.H., Park, C. Effect
of lattice misfit on the transition temperature of VO2 thin film. Journal of Materials
Science, 2012, 47(17): 6397–6401.
(73) Kong, F.Y., Li, M., Pan, S.S., Zhang, Y.X., Li, G.H. Synthesis and thermal stability of W-
doped VO2 nanocrystals. Materials Research Bulletin, 2011, 46(11): 2100–2104.
(74) Lappalainen, J., Heinilehto, S., Saukko, S., Lantto, W., Jantunen, H. Microstructure
dependent switching properties of VO2 thin films. Sensors and Actuators A: Physics,
2008, 142(1): 250–255.
(75) Lee, S. C., Jeong, Y.G., Jo, W.H., Kim, H.J., Jang, J., Park, K. M., Chung, I. H.
Thermochromism of a novel organic compound in the solid state via crystal-to-crystal
transformation. Journal of Molecular Structure, 2006, 825(1-3): 70–78.
(76) Lee, E.S., Pang, X., Hoffmann, S., Goudey, H. Thanachareonkit, A. An empirical study of
a full-scale polymer thermochromic window and its implications on material science
development objectives. Solar Energy Materials and Solar Cells, 2013, 116: 14–26.
(77) Lee, S., Cheng, C., Guo, H., Hippalgaonkar, K., Wang, K., Suh, J., Liu, K., Wu, J. Axially
engineered metal-insulator phase transition by graded doping VO2 nanowires. Journal of
the American Chemical Society, 2013, 135(12): 4850–4855.
(78) Lee, K.W., Kweon, J.J., Lee, C.E., Gedanken, A., Ganesan, R. Infrared-wave number-
40
dependent metal–insulator transition in vanadium dioxide nanoparticles. Applied Physics
Letters, 2010, 96: 243111.
(79) Li, J., Liu, C.-Y., Mao, L.-J. The character of W-doped one-dimensional VO2(M). Journal
of Solid State Chemistry, 2009, 182(10): 2835–2839.
(80) Li, S.Y., G.A. Niklasson, C.G. Granqvist. Nanothermochromics: calculations for VO2
nanoparticles in dielectric hosts show much improved luminous transmittance and solar
energy transmittance modulation. J. Appl. Phys., 108 (6) (2010), pp. 063525–063528.
(81) Li. S.-Y., Niklasson, G.A., Granqvist, C.G. Thermochromic fenestration with VO2-based
materials: Three challenges and how they can be met. Thin Solid Films, 2012, 520(10),
10.1016.
(82) Li, S.Y., G.A. Niklasson, C.G. Granqvist, Nanothermochromics with VO2-basedcore–shell
structures: calculated luminous and solar optical properties, Journalof Applied Physics 109
(2011) 061102.
(83) Li, S.-Y., G.A. Niklasson, C.G. Granqvist, Thermochromic undoped and Mg-doped VO2
thin films and nanoparticles: optical properties and performance limits for energy efficient
windows, J. Appl. Phys. 115 (2014) 053513/1.
(84) Li, S., Y. Li, M. Jiang, S. Ji, H. Luo, Y. Gao, P. Jin, Preparation and characterization of
selfsupporting thermochromic films composed of VO2(M)@SiO2 nanofibers, ACS Appl.
Mater. Interfaces 5 (2013) 6453.
(85) Li, S.-Y., G.A. Niklasson, C.G. Granqvist. Thermochromic fenestration with VO2-based
materials: three challenges and how they can be met, Thin Solid Films, 2012, 520(10):
3823–3828.
(86) Li, H.H., Wang, Y.-J., Dong, H.-J., Chen, Z.-R., Wu, Y.-L., Wang, M., Huang, S.-W. An
organic–inorganic hybrid heterobridging luminescent copper(I) polymer exhibiting
thermochromic behavior. CrystEngComm , 2011, 13(6): 1778–1781.
(87) Li, W., Yan, D., Gao, R., Lu, J., Wei, M., Duan, X. Recent Advances in Stimuli-
Responsive Photofunctional Materials Based on Accommodation of Chromophore into
Layered Double Hydroxide Nanogallery. Journal of Nanomaterials, 2013, 2013, 14 pages.
(88) Li, R., Liu, C.Y. VO2(B) nanospheres: hydrothermal synthesis and electrochemical
properties. Materials Research Bulletin, 2010, 45(6): 688–692.
(89) Li, R., Ji, S., Li, Y., Gao, Y., Luo, H., Jin, P. Synthesis and characterization of plate-like
41
VO2(M)@SiO2 nanoparticles and their application to smart window. Materials Letters,
2013, 110(1): 241–244.
(90) Li, Z.Y., Cao, D.M., Zhou, K.C. Review on synthetic technology of vanadium dioxide
powder. Rare Metal Materials and Engineering, 2006, 35(2): 316–320.
(91) Li, Y., Ji, S., Gao, Y., Luo, H., Kanehira, M. Core–shell VO2/TiO2 nanorods that combine
thermochromic and photocatalytic properties for application as energy-saving smart
coatings. Scientific Reports, 2013, 3, 1370/1.
(92) Li, Y., Ji, S., Gao, Y., Luo, H., Jin, P. Modification of Mott phase transition characteristics
in VO2@TiO2 core/shell nanostructures by misfit-strained heteroepitaxy. ACS Appl.
Mater. Interfaces, 2013, 5(14): 6603–6614.
(93) Li, Y., Ji, S., Gao, Y., Luo, H., Li, S., Jiang, M., Zhou, Y., Li, R., Wang, B., Jin, P. Core-
regenerated vapor–solid growth of hierarchical stem-like VOx nanocrystals on
VO2@TiO2 core–shell nanorods: microstructure and mechanism. CrystEngComm, 2013,
15(41): 8330–8336.
(94) Lindstrom, R., Maurice, V., Zanna, S., Klein, L., Groult, H., Perrigaud, L., Cohen, C.,
Marcus, P. Thin films of vanadium oxide grown on vanadium metal: oxidation conditions
to produce V2O5 films for Li-intercalation applications and char-acterisation by XPS,
AFM, RBS/NRA. Surface and Interface Analysis, 2006, 38(1): 6–18.
(95) Liu, C., Wang, N., Long, Y. Multifunctional overcoats on vanadium dioxide
thermochromic thin films with enhanced luminous transmission and solar modulation,
hydrophobicity and anti-oxidation. Applied Surface Science, 2013, 283: 222–226.
(96) Liu, J.F., Li, Q.H., Wang, T.H., Yu, D.P., Li, Y.D. Metastable vanadium dioxide nanobelts:
Hydrothermal synthesis, electrical transport, and magnetic properties. Angewandte
Chemie International Edition, 2004, 43(38): 5048–5052.
(97) Lopez, R., Boatner, L.A., Haynes, T.E., Feldman, L.C., Haglund, R.F. Synthesis and
characterization of size-controlled vanadium dioxide nanocrystals in a fused silica matrix.
Journal of Applied Physics, 2002, 92(7): 4031–4036.
(98) Liu, X., Huang, C., Yi, S., Xie, G., Li, H., Luo, Y. A new solvothermal method of
preparing VO2 nanosheets and petaloid clusters. Solid State Communications, 2007, 144:
259–263.
(99) Long, L.S., Ye, H. Discussion of the performance improvement of thermochromic smart
42
glazing applied in passive buildings. Solar Energy, 2014, 107: 236–244.
(100) Luo, Z.F., Wu, Z., Xu, X., Du, M., Wang, T., Jiang, Y. Microstructures and thermochromic
properties of tungsten doped vanadium oxide film prepared by using VOX–W–VOX
sandwich structure. Materials Science and Engineering B, 2011, 176(9): 762–766.
(101) Lv, W.Z., Huang, D., Chen, Y., Qiu, Q., Luo, Z. Synthesis and characterization of Mo–W
co-doped VO2(R) nano-powders by the microwave-assisted hydrothermal method.
Ceramics International, 2014, 40(8):12661–12668.
(102) Lysenko, S., Rua, A., Fernandez, F., Liu, H. Optical nonlinearity and structural dynamics
of VO2 films. J. Appl. Phys., 2009, 105(4): 043502.
(103) Ma, Y., Zhu, B., Wu, K. Preparation and solar reflectance spectra of chameleon-type
building coatings. Solar Energy, 2001, 70(5): 417–422.
(104) Ma, Y., Zhu, B., Wu, K. Preparation of Reversible Thermochromic Building Coatings and
Their Properties. Journal of Coatings Technology, 2000, 72(911): 67–71.
(105) Ma, Y., Zhang, X., Zhu, B., Wu, K. Research on reversible effects and mechanism
between the energy-absorbing and energy-reflecting states of chameleon-type building
coatings. Solar Energy, 2002, 72(6):511–520.
(106) Ma, Y., Zhu, B. Research on the preparation of reversibly thermochromic cement based
materials at normal temperature. Cement and Concrete Research, 2009, 39(2): 90–94.
(107) Mai, L.Q., Hu, B., Hu, T., Chen, W., Gu, E.D. Electrical Property of Mo-Doped VO2
Nanowire Array Film by Melting−Quenching Sol−Gel Method. J. Phys. Chem. B, 2006,
110(39): 19083–19086
(108) Manning, T.D., Parkin, I.P., Clark, R.J.H., Sheel, D., Pemble, M.E., Vernadou, D.
Intelligent window coatings: atmospheric pressure chemical vapour deposition of
vanadium oxides.
(109) Journal of Materials Chemistry, 2002, 12(10): 2936–2939.
(110) Manning, T.D., Parkin, I.P., Pemble, M.E., Sheel, D., Vernardou, D. Intelligent window
coatings: atmospheric pressure chemical vapor deposition of tungsten-doped vanadium
dioxide. Chemistry of Materials, 2004, 16(4): 744–749.
(111) Manning, T.D., Parkin, I.P., Blackman, C., Qureshi, U. APCVD of thermochromic
vanadium dioxide thin films - solid solutions V2-xMxO2 (M = Mo, Nb) or composites
VO2: SnO2. Journal of Materials Chemistry, 2005, 15(42): 4560–4566.
43
(112) Mathur, S., Ruegamer, T., Grobelsek, I. Phase-selective CVD of vanadium oxide
nanostructures. Chemical Vapor Deposition, 2007, 13(1): 42–47.
(113) Melnik, I. Khatsevych, V., Kladko, A., Kuchuk, V., Nikirin, B., Romanyuk. Low-
temperature method for thermochromic high ordered VO2 phase formation. Materials
Letters, 2012, 68(1): 215–217.
(114) Minkin, V.I., Bren’, V.A., Dubonosov, A.D., Tikhomirova, K.S., Shepelenko, E.N. Photo-
and ionochromic properties of aza crown derivatives of enamino 1-benzothiophen-2-ones.
Russian Journal of Organic Chemistry, 2014, 50(4): 540–543.
(115) Mlyuka, N.R., Niklasson, G.A., Granqvist, C.G. Thermochromic VO2-based mul-tilayer
films with enhanced luminous transmittance and solar modulation. Physica Status Solidi
A, 2009, 206(9): 2155–2160.
(116) Mlyuka, N.R., Niklasson, G.A., Granqvist, C.G. Mg doping of thermochromic VO2 films
enhances the optical transmittance and decreases the metal–insulatortransition
temperature. Applied Physics Letters, 2009, 95:171909.
(117) Morin, F. Oxides Which Show a Metal-to-Insulator Transition at the Neel Temperature.
Phys. Rev. Lett., 1959, 3(1): 34.
(118) Naumov, P., Ishizawa, N., Wang, J., Pejov, L., Pumera, M., Lee, S. C. On the Origin of the
Solid-State Thermochromism and Thermal Fatigue of Polycyclic Overcrowded Enes.
Journal of Physical Chemistry A, 2011, 115(30): 8563–8570.
(119) Ni, J., Jiang, W.T., Yu, K., Gao, Y. F., Zhu, Z.Q. Hydrothermal synthesis of VO2 (B)
nanostructures and application in aqueous Li-ion battery. Electrochim Acta, 2011, 56(5):
2122–2126..
(120) Park, H., Lee, J.S., Choi, H., Ahn, D. J. Kim, J.M. Advanced Functional Materials, 2007,
17, 3447-3455.
(121) Peng, Z.F., Jiang, W., Liu, H. Synthesis and electrical properties of tungsten-doped
vanadium dioxide nanopowders by thermolysis. Journal of Physical Chemistry C, 2007,
111(3): 1119–1122.
(122) Perdew, J. P., Burke, K., Ernzerhof, M. Generalized Gradient Approximation Made
Simple. Physical. Review Letters, 1996, 77: 3865-3868.
(123) Pergament, A.L., Velichko, A.A., Berezina, O.Ya., Kazakova, E.L., Kuldin, N.A.,
Artyukhin, D.V. Influence of doping on the properties of vanadium oxide gel films.
44
Journal of Physics: Condensed Matter, 2008, 20(42): 422204.
(124) Phoempoon, P., Sikong, L. Phase Transformation of VO2 Nanoparticles Assisted by
Microwave Heating. The Scientific World Journal, 2014, 2014, 8 pages.
(125) Povey, I.M., Bardosova, M., Chalvet, F., Pemble, M.E., Yates, H.M. Atomic layer
deposition for the fabrication of 3D photonic crystals structures: growth of Al2O3 and
VO2 photonic crystal systems. Surface and Coatings Technology, 2007, 201(22-23):
9345–9348.
(126) Rama, N., M.S.R. Rao. Synthesis and study of electrical and magnetic properties of
vanadium oxide micro and nanosized rods grown using pulsed laser deposition technique.
Solid State Communications, 2010, 150, 1041.
(127) Rampelberg, G., Schaekers, M., Martens, K., Xie, Q., Deduytsche, D., De Schutter, B.,
Blasco, N., Kittl, J., Detavernier, C. Semiconductor-metal transition in thin VO2 films
grown by ozone based atomic layer deposition. Applied Physics Letters, 2011, 98(16):
162902–162903.
(128) Saitzek, S., Guinneton, F., Sauques, L., Aguir, K., Gavarri, J.R. Thermochromic CeO2–
VO2 bilayers: role of ceria coating in optical switching properties. Optical Materials,
2007, 30(3): 407–415.
(129) Saeli, M., Piccirillo, C., Parkin, I.P., Binions, R., Ridley, I. Energy modeling studies of
thermochromic glazing. Energy and Buildings, 2010, 42(10): 1666–1673.
(130) Saeli, M., Piccirillo, C., Parkin, I.P., Ridley, I., Binions, R. Nano-composite
thermochromic thin films and their application in energy-efficient glazing. Sol. Energy
Mater. Sol. Cells, 2010, 94 (2): 141–151
(131) Saeli, M., Vincenzini, P., Ginley, D.S., Bruno, G. Optimisation of thermochromic thin
films on glass; design of intelligent windows. Advances in Science and Technology, 2011,
75 (2011): 79–90
(132) Seeboth, A., Lötzsch, D.Thermochromic Phenomena in Polymers. Shawbury, Smithers
Rapra Technology Limited, 2008.
(133) Seeboth, A., Ruhmann, R., Mühling, O. Thermotropic and thermochromic polymer based
materials for adaptive solar control. Materials, 2010, 3(12): 5143-5168
(134) Seeboth, A., Lo tzsch, D., Ruhmann, R., Muehling, O. Thermochromic Polymers-Function
by Design. Chemical Review, 2014, 114(5): 3037–3068.
45
(135) Sella, C., Maaza, M., Nemraoui, O., Lafait, J., Renard, N., Sampeur, Y. Preparation,
characterization and properties of sputtered electrochromic and thermochromic devices.
Surface and Coatings Technology, 1998, 98(1–3): 1477–1482.
(136) Sharkany, J.P., Korposh, S.O., Batori-Tarci, Z.I., Trikur, I.I., Ramsden, J.J.
Bacteriorhodopsin-based biochromic films for chemical sensors. Sensors and Actuators B:
Chemical, 2005, 107(1): 77–81.
(137) Sharoni, A., Ramirez, J.G., Schuller, I.K. Multiple Avalanches across the Metal-Insulator
Transition of Vanadium Oxide Nanoscaled Junctions. Physical review letter, 2008, 101(2):
026404–026407.
(138) Shi, J., Zhou, S., You, B., Wu, L. Preparation and thermochromic property of tungsten-
doped vanadium dioxide particles. Solar Energy Materials & Solar Cells, 2007, 91(19):
1856–1862.
(139) Shi, Q., Huang, W., Zhang, Y., Yan, J., Zhang, Y., Mao, M., Zhang, Y., Tu, M. Giant phase
transition properties at terahertz range in VO₂ films deposited by sol-gel method. ACS
Appl. Mater. Interfaces, 2011, 3(9): 3523–3527.
(140) Smith, G.B., Granqvist, C.G. Green Nanotechnology: Solutions for Sustainability and
Energy in the Built Environment. CRC Press, Boca Raton, USA (2010).
(141) Sobhan, M.A., Kivaisi, R.T., Stjerna, B., Granqvist, C.G. Thermochromism of sputter-
deposited WxV1−xO2 films. Solar Energy Materials and Solar Cells, 1996, 44 (4): 451–
455.
(142) Soltani, M., Chaker, M., Haddad, E., Kruzelesky, R. V. Thermochromic vanadium dioxide
smart coatings grown on Kapton substrates by reactive pulsed laser deposition. Journal of
Vacuum Science Technology A Vacuum Surfaces and Films, 2006, 24(3): 612.
(143) Son, J.H., Wei, J., Cobden, D., Cao, G.Z., Xia, Y.N. Hydrothermal synthesis of monoclinic
VO2 micro- and nanocrystals in one step and their use in fabricating inverse opals.
Chemistry of Materials, 2010, 22 (10): 3043–3050.
(144) Song, L.W., Zhang, Y., Huang, W., Shi, Q., Li, D., Zhang, Y., Xu, Y. Preparation and
thermochromic properties of Ce-doped VO2 films. Materials Research Bulletin, 2013,
48(6): 2268–2271.
(145) Strelcov, E., Lilach, Y., Kolmakov, A. Gas Sensor Based on Metal-Insulator Transition in
VO2 Nanowire Thermistor. Nano Letters, 2009, 9(6): 2322–2326.
46
(146) Srivastava, J., Srivastava, J.N., Alam, S., Mathur, G.N. Quantification of response time in
poly(vinyl alcohol)-metal complex thermochromic polymeric systems. Journal of Applied
Polymer Science, 2006, 100(6): 4832–4834.
(147) Takei, H., Koide, S. Growth and Electrical Properties of Vanadium-Oxide Single Crystals
by Oxychrolide Decomposition Method. Journal of the Physical Society of Japan, 1966,
21(5): 1010.
(148) Tan, X., Yao, T., Long, R., Sun, Z., Feng, Y., Cheng, H., Yuan, X., Zhang, W., Liu, Q., Wu,
C., Xie, Y., Wei, S. Unraveling metal– insulator transition mechanism of VO2 triggered by
tungsten doping. Sci. Rep., 2012, 2, 466–471.
(149) Tang, H., MacLaren, D.C., White, M.A. New insights concerning the mechanism of
reversible thermochromic mixtures. Canadian Journal of Chemistry, 2010, 88(11): 1063-
1070,
(150) Tangirala, M., Zhang, K., Nminibapiel, D., Pallem, V., Dussarrat, C., Cao, W., Adam, T.N.,
Johnson, C.S., Elsayed-Ali, H.E., Baumgart, H., Physical Analysis of VO2 Films Grown
by Atomic Layer Deposition and RF Magnetron Sputtering. ECS J. Solid State Sci.
Technol. 2014, 3(6): N89-N94.
(151) Traiphol, N., Rungruangviriya, N., Potai, R., Traiphol, R. Stable polydiacetylene/ZnO
nanocomposites with two-steps reversible and irreversible thermochromism: The influence
of strong surface anchoring. Journal of Colloid and Interface Science, 2011, 356(2): 481–
489.
(152) Tselev, A., Strelcov, E., Luk'yanchuk, I.A., Budai, J.D., Tischler, J.Z., Ivanov, I.N., Jones,
K., Proksch, R., Kalinin, S.V., Kolmakov, A. Symmetry Relationship and Strain-Induced
Transitions between Insulating M1 and M2 and Metallic R phases of Vanadium Dioxide.
Nano letters, 2010, 10(11): 4409–4416.
(153) Tsuyumoto, I., Nawa, K. Thermochromism of titanium–vanadium oxide thin films
prepared from peroxotitanate and peroxovanadate solution. Solid State Ionics, 2008,
179(21–26): 1227–1229.
(154) Vernardou, D., Pemble, M.E., Sheel, D.W. Vanadium oxides prepared by liquid injection
MOCVD using vanadyl acetylacetonate. Surface and Coatings Technology, 2004, 188–
189: 250–254.
(155) Vernardou, D., Pemble, M.E., Sheel D.W. The growth of thermochromic VO2 films on
47
glass by atmospheric-pressure CVD: a comparative study of precursors, CVD
methodology and substrates. Chemical Vapor Deposition, 2006, 12(5): 263–274.
(156) Vernardou, D., Paterakis, P., Drosos, H., Spanakis, E., Povey, I.M., Pemble, M.E.,
Koudoumas, E., Katsarakis, N. A study of the electrochemical performance of vanadium
oxide thin films grown by atmospheric pressure chemical vapor deposition. Solar Energy
Materials and Solar Cells, 2011, 95(10): 2842–2847.
(157) Vinogradova, O.P., Sidorov, A.I., Klimov,V.A., Shadrin, E.B., Nashchekin, A.V., Khanin,
S.D., Lyubimov, V.Y. Specific features of the formation of vanadium oxide micro- and
nanocrystals during gas-phase synthesis. Physics of the Solid State, 2008, 50(7): 1227–
1233.
(158) Viswanath, B., Ko, C., Ramanathan,cS. Thermoelastic switching with controlled actuation
in VO2 thin films. Scripta Materialia, 2011, 64(6): 490–493.
(159) Wang, J., Sun, X.W., Jiao, Z. Application of Nanostructures in Electrochromic Materials
and Devices: Recent Progress. Materials, 2010, 3(12): 5029–5053.
(160) Wang, H., He, W., Yuan, G., Wang, X., Chen, Q. Large change of visible transmittance
with VO2 phase transition in VO2/TiO2 polycrystalline films. Thin Solid Films, 2013,
540: 168–172.
(161) Wang, M.H., Lei, H., Sawada, Y., Hoshi, Y., Uchida, T., Hou, Z.X. Recent Progress in
Gasochromics of Nano-Structured WO3 Film and its Applications. Advanced Materials
Research, 2014, 941-944: 1298-1301.
(162) Wang, N., Magdassi, S., Mandler, D., Long, Y. Simple sol–gel process and one-step
annealing of vanadium dioxide thin films: Synthesis and thermochromic properties. Thin
Solid Films, 2013, 534: 594–598.
(163) Warwick, M.E.A., Binions, R. Advances in thermochromic vanadium dioxide films.
Journal of Materials Chemistry A, 2014, 2(10): 3275–3292.
(164) Whittaker, L., Jaye, C., Fu, Z., Fischer, D.A., Banerjee, S. Depressed Phase Transition in
Solution-Grown VO2 Nanostructures. J. Am. Chem. Soc., 2009, 131(25): 8884–8894.
(165) Whittaker, L., Wu, T.L., Patridge, C.J., Sambandamurthy, G., Banerjee, S. Distinctive
finite size effects on the phase diagram and metal–insulator transitions of tungsten-doped
vanadium (IV) oxide. Journal of Materials Chemistry, 2011, 21(15): 5580–5592.
(166) Wu, J., Huang, W., Shi, Q., Cai, J., Zhao, D., Zhang, Y., Yan, J. Effect of annealing
48
temperature on thermochromic properties of vanadium dioxide thin films deposited by
organic sol–gel method. Applied Surface Science, 2013, 268: 556– 560.
(167) Xiao, X.D., Zhang, H., Chai, G., Sun, Y., Yang, T., Cheng, H., Chen, L., Miao, L., Xu, G. A
cost-effective process to prepare VO2 (M) powder and films with superior thermochromic
properties. Materials Research Bulletin, 2014, 51: 6–12.
(168) Xu, C.-L., Ma, L., Liu, X., Qiu, W.-Y., Su, Z.-X. A novel reduction-hydrolysis method of
preparing VO2 nanopowders. Materials Research Bulletin, 2004, 39(7-8): 881–886.
(169) Xu, G, Jin, P., Tazawa, M., Yoshimura, K. Optimization of antireflection coating for VO2-
based energy efficient window. Solar Energy Materials & Solar Cells, 2004, 83(1): 29–37.
(170) Xu, X. et al. Simulation and improvement of energy consumption on intelligent glasses in
typical cities of China. Science China Technological Sciences, 2012, 55(7): 1999–2005.
(171) Xu, Y.J., Huang, W., Shi, Q., Zhang, Y., Wu, J., Song, L. Shape-dependent thermochromic
phenomenon in porous nanostructured VO2 films. Materials Research Bulletin, 2013,
48(10): 4146-4149.
(172) Yan, J.Z., Zhang, Y., Huang, W.X., Tu, M.J. Effect of Mo–W co-doping on semiconductor-
metal phase transition temperature of vanadium dioxide film. Thin Solid Films, 2008,
516(23): 8554–8558.
(173) Yan, J.Z., Huang, W., Zhang, Y., Liu, X., Tu, M. Characterization of preferred orientated
vanadium dioxide film on muscovite (001) substrate. Physica Status Solidi (A), 2008,
205(10): 2409–2412.
(174) Yarimaga, O., Im, M., Choi, Y.-K., Kim, T.W., Jung, Y.K., Park, H.G., Lee, S., Kim, J.-M.
A color display system based on thermochromic conjugated polydiacetylene
supramolecules. Macromolecular Research, 2010, 18(4): 404–407.
(175) Yang, T., Hung, B., Chen, Y., Lai, M., Chung, T. Manufacture and characterization of sol–
gel V1−x−yWxSiyO2 films for uncooled thermal detectors. Sensors and Actuators A,
2007, 140 (2): 194–199.
(176) Ye, H., Meng, X., Xu, B. Theoretical discussions of perfect window, ideal near infrared
solar spectrum regulating window and current thermochromic window. Energy and
Buildings, 2012, 49: 164–172.
(177) Ye, H.L., Long, S., Zhang, H.T., Xu, B., Gao, Y.F., Kang, L.T., Chen, Z. The
demonstration and simulation of the application performance of the vanadium dioxide
49
single glazing. Solar Energy Materials and Solar Cells, 2013, 117: 168–173.
(178) Ye, H., Long, L. Smart or not? A theoretical discussion on the smart regulation capacity of
vanadium dioxide glazing. Solar Energy Materials and Solar Cells, 2014, 120 B: 669–674.
(179) Ye, J., Zhou, L., Liu, F., Qi, J., Gong, W., Lin, Y., Ning, G. Preparation, characterization
and properties of thermochromic tungsten-doped vanadium dioxide by thermal reduction
and annealing. Journal of Alloys and Compounds, 2010, 504 (2): 503–507.
(180) Ye, X.W., Luo, Y., Gao, X., Zhu, S. Design and evaluation of a thermochromic roof
system for energy saving based on poly(N-isopropylacrylamide) aqueous solution. Energy
and Buildings, 2012, 48:175–179.
(181) Yokoyama, T., Masuhara, A., Onodera, T., Kasai, H., Oikawa, H. Development of
fabrication process for Ag/polydiacetylene (core/shell) hybridized nanocrystals. Synthetic
Metals, 2009, 159(9-10): 897–899.
(182) Yu, X., Luo, Y., Wu, W., Yan, Q., Zou, G., Zhang, Q. Synthesis and reversible
thermochromism of azobenzene-containing polydiacetylenes. European Polymer Journal,
2008, 44(9): 3015–3021.
(183) Zakharova, G.S., Hellmann, I., Volkov,V.L., Täschner, C., Bachmatiuk, A., Leonhardt, A.,
Klingeler, R., Büchner, B. Vanadium dioxide nanobelts: Hydrothermal synthesis and
magnetic properties. Materials Research Bulletin, 2010, 45(9): 1118–1121.
(184) Zhang, Y.F., Li, W., Fan, M.J., Zhang, F.F., Zhang, J.C., Liu, X.H., Zhang, H.N., Huang,
C., Li, H.B. Preparation of W- and Mo-doped VO2(M) by ethanol reduction of
peroxovanadium complexes and their phase transition and optical switching properties.
Journal of Alloys and Compounds, 2012, 544: 30–36.
(185) Zhang, Y.F., Zhang, J., Zhang, X., Deng, Y., Zhong, Y., Huang, C., Liu, X., Liu, X., Mo, S.
Influence of different additives on the synthesis of VO2 polymorphs. Ceramics
International, 2013, 39(7): 8363–8376.
(186) Zhang, J., Eerdemutu, Y.C., Feng, J., Di, X., Liu, Z., Xu, G. Size- and shape-controlled
synthesis of monodisperse vanadium dioxide nanocrystals. J Nanosci Nanotechnol., 2010,
10(3): 2092–2098.
(187) Zhang, J., Wang, J., Tian, H. Taking orders from light: progress in photochromic bio-
materials.
(188) Materials Horizons, 2014, 1(2): 169–184.
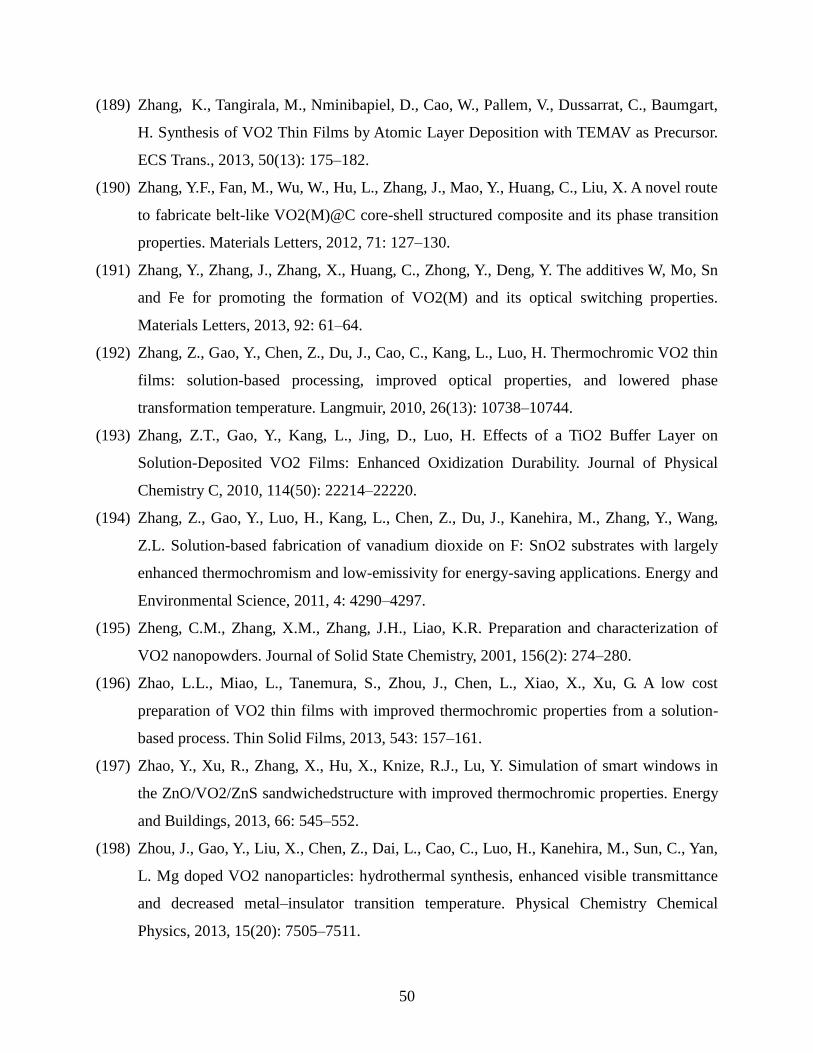
50
(189) Zhang, K., Tangirala, M., Nminibapiel, D., Cao, W., Pallem, V., Dussarrat, C., Baumgart,
H. Synthesis of VO2 Thin Films by Atomic Layer Deposition with TEMAV as Precursor.
ECS Trans., 2013, 50(13): 175–182.
(190) Zhang, Y.F., Fan, M., Wu, W., Hu, L., Zhang, J., Mao, Y., Huang, C., Liu, X. A novel route
to fabricate belt-like VO2(M)@C core-shell structured composite and its phase transition
properties. Materials Letters, 2012, 71: 127–130.
(191) Zhang, Y., Zhang, J., Zhang, X., Huang, C., Zhong, Y., Deng, Y. The additives W, Mo, Sn
and Fe for promoting the formation of VO2(M) and its optical switching properties.
Materials Letters, 2013, 92: 61–64.
(192) Zhang, Z., Gao, Y., Chen, Z., Du, J., Cao, C., Kang, L., Luo, H. Thermochromic VO2 thin
films: solution-based processing, improved optical properties, and lowered phase
transformation temperature. Langmuir, 2010, 26(13): 10738–10744.
(193) Zhang, Z.T., Gao, Y., Kang, L., Jing, D., Luo, H. Effects of a TiO2 Buffer Layer on
Solution-Deposited VO2 Films: Enhanced Oxidization Durability. Journal of Physical
Chemistry C, 2010, 114(50): 22214–22220.
(194) Zhang, Z., Gao, Y., Luo, H., Kang, L., Chen, Z., Du, J., Kanehira, M., Zhang, Y., Wang,
Z.L. Solution-based fabrication of vanadium dioxide on F: SnO2 substrates with largely
enhanced thermochromism and low-emissivity for energy-saving applications. Energy and
Environmental Science, 2011, 4: 4290–4297.
(195) Zheng, C.M., Zhang, X.M., Zhang, J.H., Liao, K.R. Preparation and characterization of
VO2 nanopowders. Journal of Solid State Chemistry, 2001, 156(2): 274–280.
(196) Zhao, L.L., Miao, L., Tanemura, S., Zhou, J., Chen, L., Xiao, X., Xu, G. A low cost
preparation of VO2 thin films with improved thermochromic properties from a solution-
based process. Thin Solid Films, 2013, 543: 157–161.
(197) Zhao, Y., Xu, R., Zhang, X., Hu, X., Knize, R.J., Lu, Y. Simulation of smart windows in
the ZnO/VO2/ZnS sandwichedstructure with improved thermochromic properties. Energy
and Buildings, 2013, 66: 545–552.
(198) Zhou, J., Gao, Y., Liu, X., Chen, Z., Dai, L., Cao, C., Luo, H., Kanehira, M., Sun, C., Yan,
L. Mg doped VO2 nanoparticles: hydrothermal synthesis, enhanced visible transmittance
and decreased metal–insulator transition temperature. Physical Chemistry Chemical
Physics, 2013, 15(20): 7505–7511.
51
(199) Zhou, Y., Huang, A., Li, Y., Ji, S., Gao, Y., Jin, P. Surface plasmon resonance induced
excellent solar control for VO2@SiO2 nanorods-based thermochromic foils. Nanoscale,
2013, 5(19): 9208–9213.

52
CHAPTER THREE
PRELIMINARY EXPERIMENTAL STUDY OF THERMOCHROMIC ASPHALT BINDER
This chapter investigates the potential of using a commercially available polymeric dye to
produce thermochromic asphalt binder, which reflects solar energy at high temperature and
absorbs solar energy at low temperature. Therefore, it will reduce the surface temperature of
asphalt pavement during summer and lead to improved durability. The thermal and phase
transition properties of thermochromic materials were characterized by Differential Scanning
Calorimetry (DSC) and modulated DSC. Comparison measurements found that the surface
temperature of thermochromic asphalt binder is lower than that of the conventional asphalt
binder with maximum decrease as high as 6.6°C during a typical summer day in the northeast
U.S. (i.e. Cleveland, OH). Moreover, experimental results indicated that the temperature dropped
slower in thermochromic asphalts than in regular asphalt when subjected to simulated winter
temperature. This means thermochromic asphalt can delay ice formation on the surface of road,
which is an important potential benefit for road safety in cold regions.
3.1 Introduction
Asphalt pavements are widely used in highways due to their good performance and relatively
low construction and maintenance costs. However, the black color of asphalt binder has large
solar absorption that leads to high surface temperature of asphalt pavement. Studies (i.e., (1-3))
measured surface temperature as high as 48-67°C during summer. The increased temperature in
summer impacts durability of asphalt pavement by accelerating various distress mechanisms
(i.e., rutting, shoving, aging, fatigue damage, bleeding) (4). A potential way to improve
durability that has gained attention is the use of materials that present high solar reflectivity.
Cool pavement has been consequently developed by using these cool materials with high
reflectivity and emissivity to the solar radiation. Studies (5-9) show that cool pavement results in
increased service life (durability) of the pavement. However, the reduced temperature of asphalt
pavement exacerbates low temperature cracking during the winter period (10-11), which is quite
harmful to the service life of the road. Furthermore, the lower temperature causes ice formation
53
in cold weather. So it is necessary to develop a new method to keep asphalt pavement cool
during summer and warm during winter.
The strategy we undertake is to use thermochromic materials to create new materials possessing
desirable solar reflectance, i.e., they reflect more solar energy at high temperature and reflect less
solar energy at low temperature. To avoid any visual impact on road users, we hope to restrain
such effects in the infrared range only. Thermochromic materials are substances that can change
their colors in response to temperature. The specific temperature that causes the transition is
called the transition temperature. The reversible temperature-dependent transformation of
thermochromic materials is attributed to the variations of the molecular structures associated
with temperature, such as phase transition in a compound (e.g., in an organic chromophore),
changes in ligand geometry, variation in the crystal field or the number of solvent molecules in
the coordination sphere (e.g., in a pure transition metal complex that derives its color from
crystal field effects), and more complex factors in multicomponent mixtures (12).
Thermochromic materials are characterized by high solar reflectance in summer and high solar
absorption in winter. These properties make them attractive for building applications (13-16). Ma
and Zhu (17) studied thermochromic cement and its potential use in building applications.
The objective of this paper is to study the performance of new thermochromic asphalt binders in
reducing the pavement surface temperature during summer and therefore extend pavement
service life. The study also aims to assess the materials’ thermal performance under cold
weather conditions. For this purpose, we firstly developed thermochromic asphalt binders by
incorporating three selected organic thermochromic pigments into the conventional pure asphalt
binder. The properties and performance of thermochromic asphalts were experimentally
measured against that of the conventional pure asphalt. The results indicated that the use of
thermochromic asphalt brings performance and safety benefits under both hot and cold weather
conditions.
3.2 Experimental Design
Materials
The conventional asphalt binder used in this study is Superpave grade, PG64-22, produced by
Kokosing Materials Inc. The organic thermochromic pigments were selected from those
manufactured by Hali Industrial Corporation Ltd. Red, blue and black thermochromic pigments
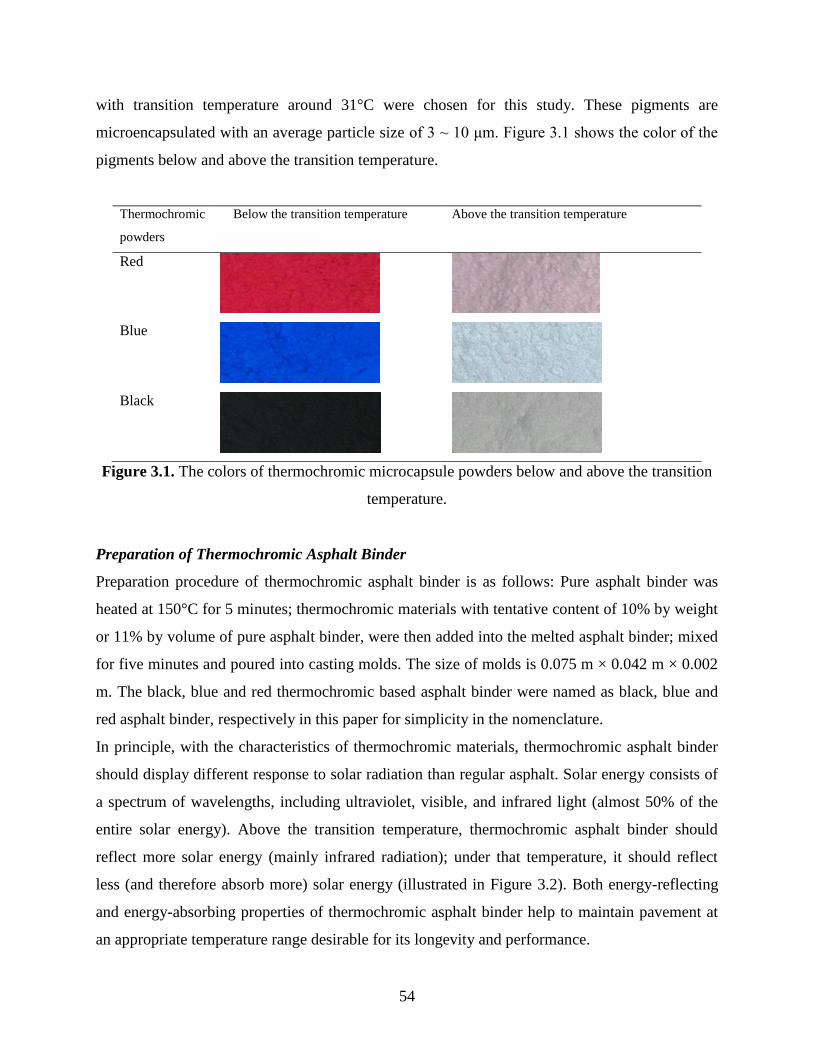
54
with transition temperature around 31°C were chosen for this study. These pigments are
microencapsulated with an average particle size of 3 ~ 10 μm. Figure 3.1 shows the color of the
pigments below and above the transition temperature.
Thermochromic
powders
Below the transition temperature Above the transition temperature
Red
Blue
Black
Figure 3.1. The colors of thermochromic microcapsule powders below and above the transition
temperature.
Preparation of Thermochromic Asphalt Binder
Preparation procedure of thermochromic asphalt binder is as follows: Pure asphalt binder was
heated at 150°C for 5 minutes; thermochromic materials with tentative content of 10% by weight
or 11% by volume of pure asphalt binder, were then added into the melted asphalt binder; mixed
for five minutes and poured into casting molds. The size of molds is 0.075 m × 0.042 m × 0.002
m. The black, blue and red thermochromic based asphalt binder were named as black, blue and
red asphalt binder, respectively in this paper for simplicity in the nomenclature.
In principle, with the characteristics of thermochromic materials, thermochromic asphalt binder
should display different response to solar radiation than regular asphalt. Solar energy consists of
a spectrum of wavelengths, including ultraviolet, visible, and infrared light (almost 50% of the
entire solar energy). Above the transition temperature, thermochromic asphalt binder should
reflect more solar energy (mainly infrared radiation); under that temperature, it should reflect
less (and therefore absorb more) solar energy (illustrated in Figure 3.2). Both energy-reflecting
and energy-absorbing properties of thermochromic asphalt binder help to maintain pavement at
an appropriate temperature range desirable for its longevity and performance.
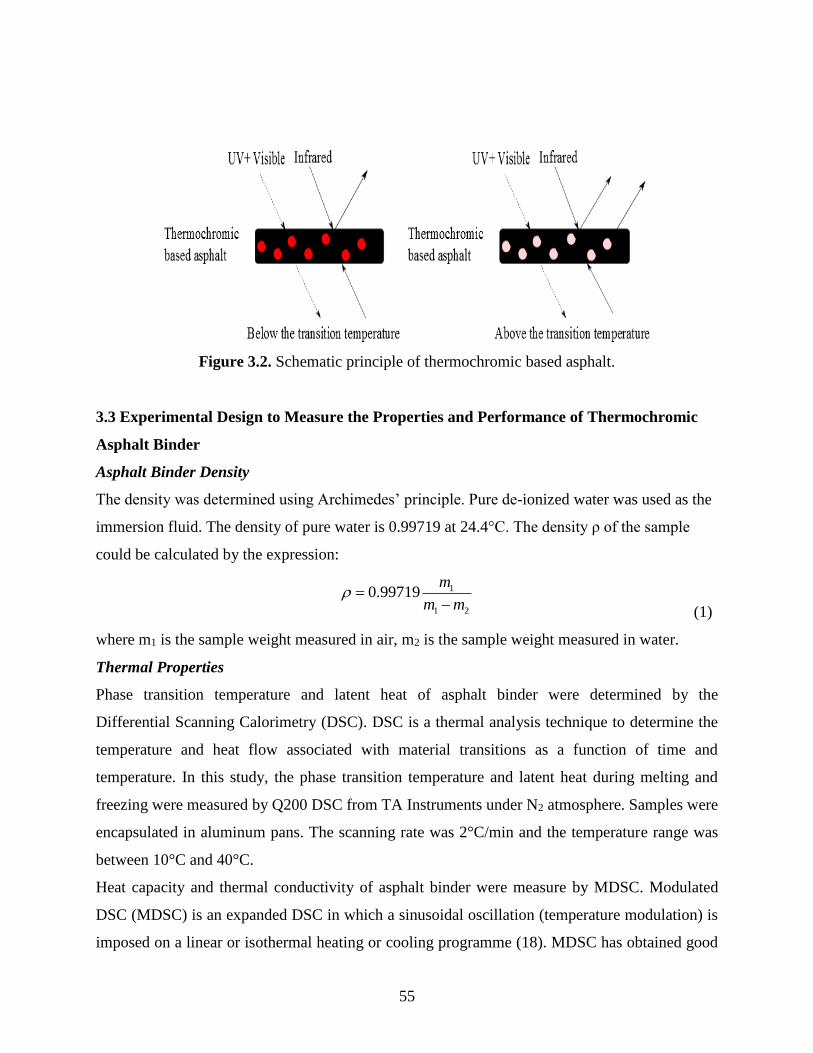
55
Figure 3.2. Schematic principle of thermochromic based asphalt.
3.3 Experimental Design to Measure the Properties and Performance of Thermochromic
Asphalt Binder
Asphalt Binder Density
The density was determined using Archimedes’ principle. Pure de-ionized water was used as the
immersion fluid. The density of pure water is 0.99719 at 24.4°C. The density ρ of the sample
could be calculated by the expression:
1
1 2
0.99719m
m m
(1)
where m1 is the sample weight measured in air, m2 is the sample weight measured in water.
Thermal Properties
Phase transition temperature and latent heat of asphalt binder were determined by the
Differential Scanning Calorimetry (DSC). DSC is a thermal analysis technique to determine the
temperature and heat flow associated with material transitions as a function of time and
temperature. In this study, the phase transition temperature and latent heat during melting and
freezing were measured by Q200 DSC from TA Instruments under N2 atmosphere. Samples were
encapsulated in aluminum pans. The scanning rate was 2°C/min and the temperature range was
between 10°C and 40°C.
Heat capacity and thermal conductivity of asphalt binder were measure by MDSC. Modulated
DSC (MDSC) is an expanded DSC in which a sinusoidal oscillation (temperature modulation) is
imposed on a linear or isothermal heating or cooling programme (18). MDSC has obtained good
56
results of specific heat capacity and thermal conductivity (19-21). In this study, the heat capacity
(Cp) and thermal conductivity (λ) of materials were measured in a MDSC (Q2000, TA
Instruments) at 15, 25 and 35°C. The detailed experimental procedure and calculations referred
to ASTM E1958-98 (22).
Cylindrical specimens of polystyrene were previously used to calibrate the MDSC. The
measurement was performed by keeping the specimen for 20 minutes at each temperature of
interest, with modulation amplitude of ±0.5 °C every 80 seconds. The experimental thermal
conductivity was calculated using the equation:
2
0 2
8
p
LC
C md P
(2)
where λ0 is the experimental thermal conductivity (W/m·K), L is the sample thickness (m), C is
the apparent heat capacity (J/K), Cp is the heat capacity (J/kg·K), m is the mass of the sample
(kg), d is the sample diameter (m) and P is the oscillation period (s), 80 s.
However, the experimental thermal conductivity must be corrected using a standard specimen,
polystyrene. So the calibration constant (D) was generated to determine correct thermal
conductivity λ:
0.5
0 r rD (3)
2 0.5
0 0 02 ( 4 )
2
D D
(4)
where λr is the thermal conductivity from the literature (23). The calibration constant should be
in a range of 0.01 and 0.05 W/(m·K).
3.4 Thermal Performance of Thermochromic Asphalt Binder
For comparison of the thermal performance, black asphalt binder (asphalt binder incorporated
with black thermochromic materials), blue asphalt binder (asphalt incorporated with blue
thermochromic materials), red asphalt binder (asphalt incorporated with red thermochromic
materials) and pure asphalt binder with dimensions of 0.075 m × 0.042 m × 0.002 m were placed
on asphalt concrete tiles. To avoid heat flow from below, these tiles were insulated from below

57
and surrounding sides (Figure 3.3). The diameter and length of the tiles were 0.10 m and 0.06 m.
Surface temperatures were recorded for 24 h during a typical hot summer day in Cleveland, OH
in July 2012. The basic experiment setup consists of surface temperature sensors (thermocouples
type K) connected to a data logging system. The temperature sensors, with an accuracy of 0.1°C,
were mounted on the centers of the surfaces of each tile. Instantaneous values of temperature
were measured and saved every 60 seconds. To assess their thermal characteristics during winter,
comparison measurement was also performed in a freezer. Details of experimental results are
elaborated in the following section.
Figure 3.3. View of surface temperature measurement of the samples.
3.5 Results and Analyses
Density
The densities of asphalt binder specimens were measured using Archimedes’ principle, each with
three repetitions. From this, the average densities and standard deviations of prepared asphalt
samples were determined. Results are summarized in Table 3.1.
TABLE 3.1. Density and DSC Results of the Samples
Sample Density
(kg/m3)
Melting Freezing
Phase change
temperature (°C)
Latent heat
(J/kg)
Phase change
temperature (°C)
Latent heat
(J/kg)
Black
thermochromic
900 27.28 33,660 20.38 35,680
Blue thermochromic 900 34.41 25,040 23.31 29,370
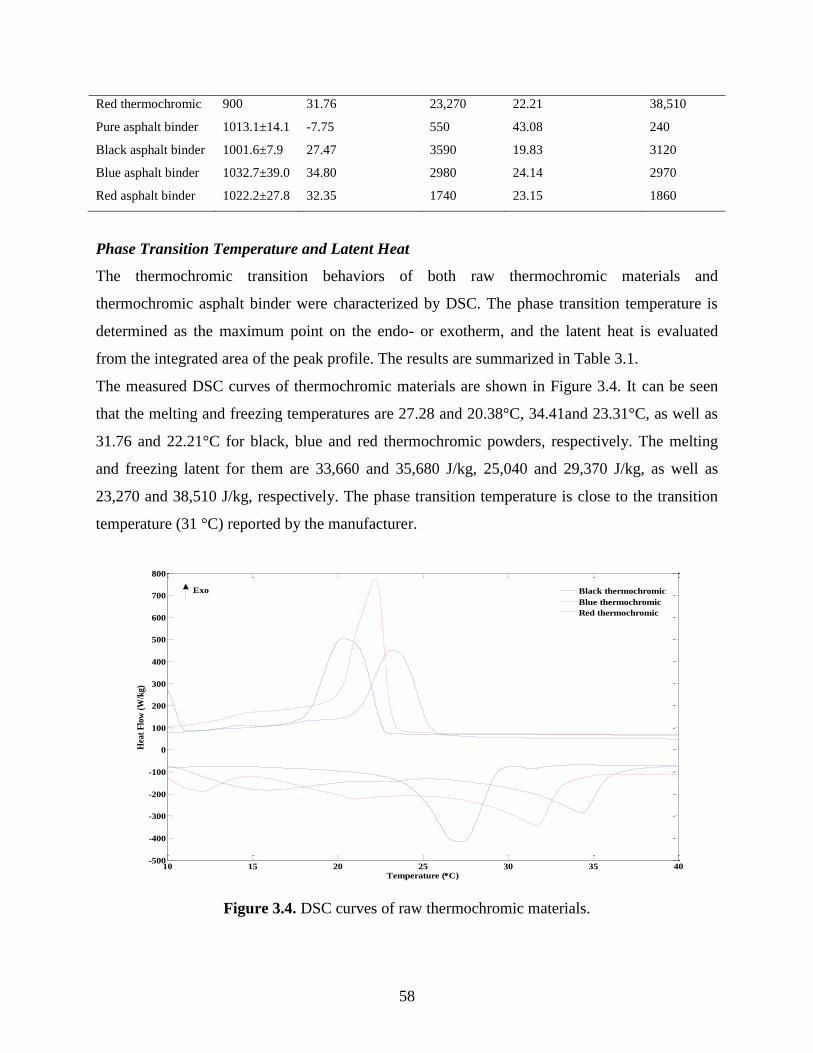
58
Red thermochromic 900 31.76 23,270 22.21 38,510
Pure asphalt binder 1013.1±14.1 -7.75 550 43.08 240
Black asphalt binder 1001.6±7.9 27.47 3590 19.83 3120
Blue asphalt binder 1032.7±39.0 34.80 2980 24.14 2970
Red asphalt binder 1022.2±27.8 32.35 1740 23.15 1860
Phase Transition Temperature and Latent Heat
The thermochromic transition behaviors of both raw thermochromic materials and
thermochromic asphalt binder were characterized by DSC. The phase transition temperature is
determined as the maximum point on the endo- or exotherm, and the latent heat is evaluated
from the integrated area of the peak profile. The results are summarized in Table 3.1.
The measured DSC curves of thermochromic materials are shown in Figure 3.4. It can be seen
that the melting and freezing temperatures are 27.28 and 20.38°C, 34.41and 23.31°C, as well as
31.76 and 22.21°C for black, blue and red thermochromic powders, respectively. The melting
and freezing latent for them are 33,660 and 35,680 J/kg, 25,040 and 29,370 J/kg, as well as
23,270 and 38,510 J/kg, respectively. The phase transition temperature is close to the transition
temperature (31 °C) reported by the manufacturer.
10 15 20 25 30 35 40-500
-400
-300
-200
-100
0
100
200
300
400
500
600
700
800
Temperature (C)
Hea
t F
low
(W
/kg)
Black thermochromic
Blue thermochromic
Red thermochromic
Exo
Figure 3.4. DSC curves of raw thermochromic materials.
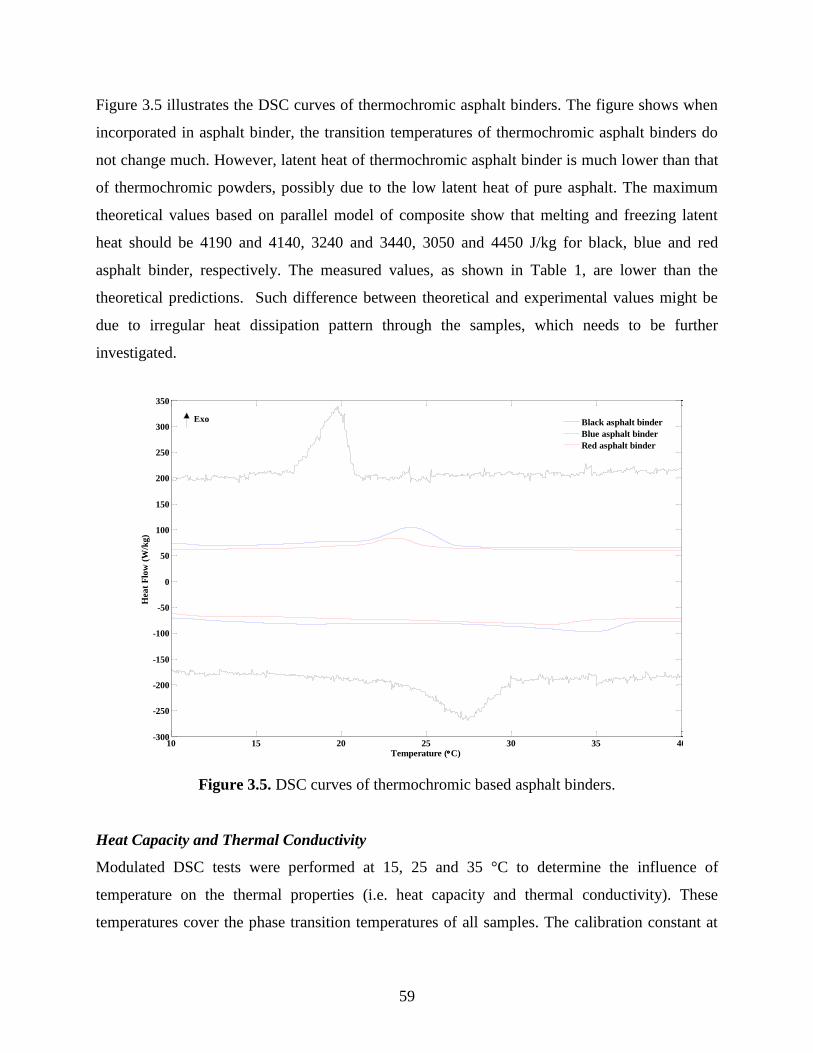
59
Figure 3.5 illustrates the DSC curves of thermochromic asphalt binders. The figure shows when
incorporated in asphalt binder, the transition temperatures of thermochromic asphalt binders do
not change much. However, latent heat of thermochromic asphalt binder is much lower than that
of thermochromic powders, possibly due to the low latent heat of pure asphalt. The maximum
theoretical values based on parallel model of composite show that melting and freezing latent
heat should be 4190 and 4140, 3240 and 3440, 3050 and 4450 J/kg for black, blue and red
asphalt binder, respectively. The measured values, as shown in Table 1, are lower than the
theoretical predictions. Such difference between theoretical and experimental values might be
due to irregular heat dissipation pattern through the samples, which needs to be further
investigated.
10 15 20 25 30 35 40-300
-250
-200
-150
-100
-50
0
50
100
150
200
250
300
350
Temperature (C)
Hea
t F
low
(W
/kg
)
Black asphalt binder
Blue asphalt binder
Red asphalt binder
Exo
Figure 3.5. DSC curves of thermochromic based asphalt binders.
Heat Capacity and Thermal Conductivity
Modulated DSC tests were performed at 15, 25 and 35 °C to determine the influence of
temperature on the thermal properties (i.e. heat capacity and thermal conductivity). These
temperatures cover the phase transition temperatures of all samples. The calibration constant at
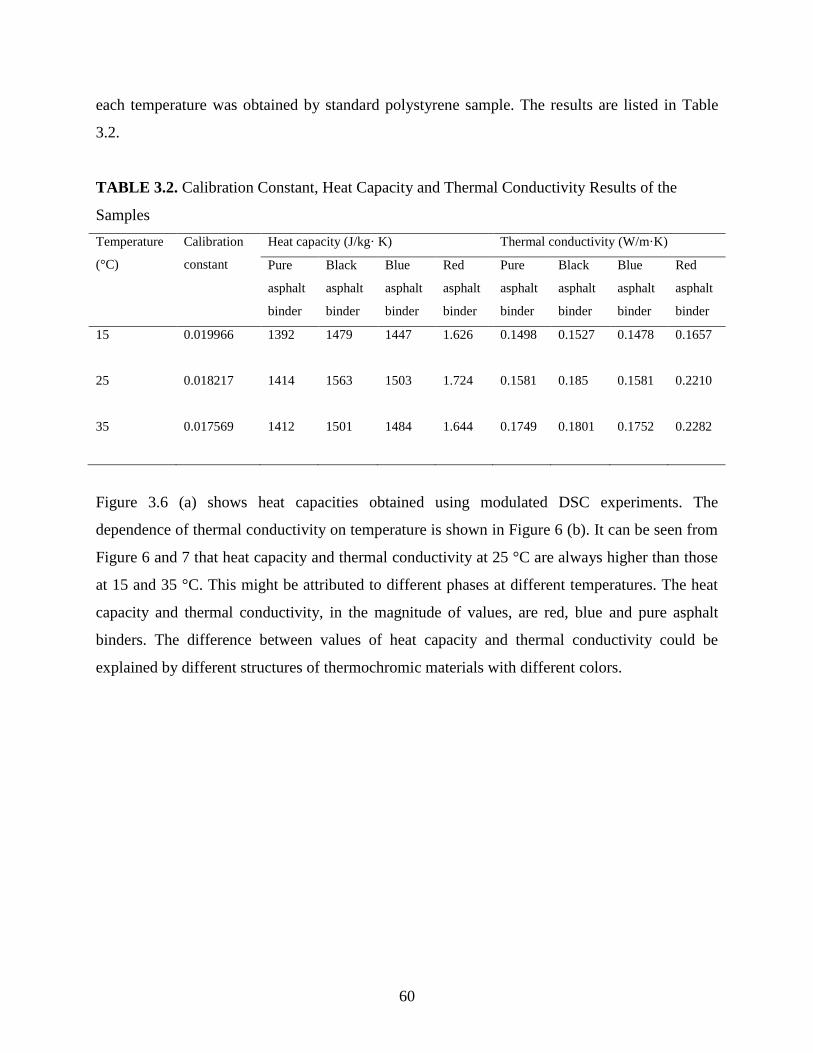
60
each temperature was obtained by standard polystyrene sample. The results are listed in Table
3.2.
TABLE 3.2. Calibration Constant, Heat Capacity and Thermal Conductivity Results of the
Samples
Temperature
(°C)
Calibration
constant
Heat capacity (J/kg· K) Thermal conductivity (W/m·K)
Pure
asphalt
binder
Black
asphalt
binder
Blue
asphalt
binder
Red
asphalt
binder
Pure
asphalt
binder
Black
asphalt
binder
Blue
asphalt
binder
Red
asphalt
binder
15 0.019966 1392 1479 1447
1.626 0.1498 0.1527 0.1478 0.1657
25 0.018217 1414 1563
1503 1.724 0.1581 0.185 0.1581 0.2210
35 0.017569 1412
1501
1484
1.644 0.1749 0.1801 0.1752 0.2282
Figure 3.6 (a) shows heat capacities obtained using modulated DSC experiments. The
dependence of thermal conductivity on temperature is shown in Figure 6 (b). It can be seen from
Figure 6 and 7 that heat capacity and thermal conductivity at 25 °C are always higher than those
at 15 and 35 °C. This might be attributed to different phases at different temperatures. The heat
capacity and thermal conductivity, in the magnitude of values, are red, blue and pure asphalt
binders. The difference between values of heat capacity and thermal conductivity could be
explained by different structures of thermochromic materials with different colors.
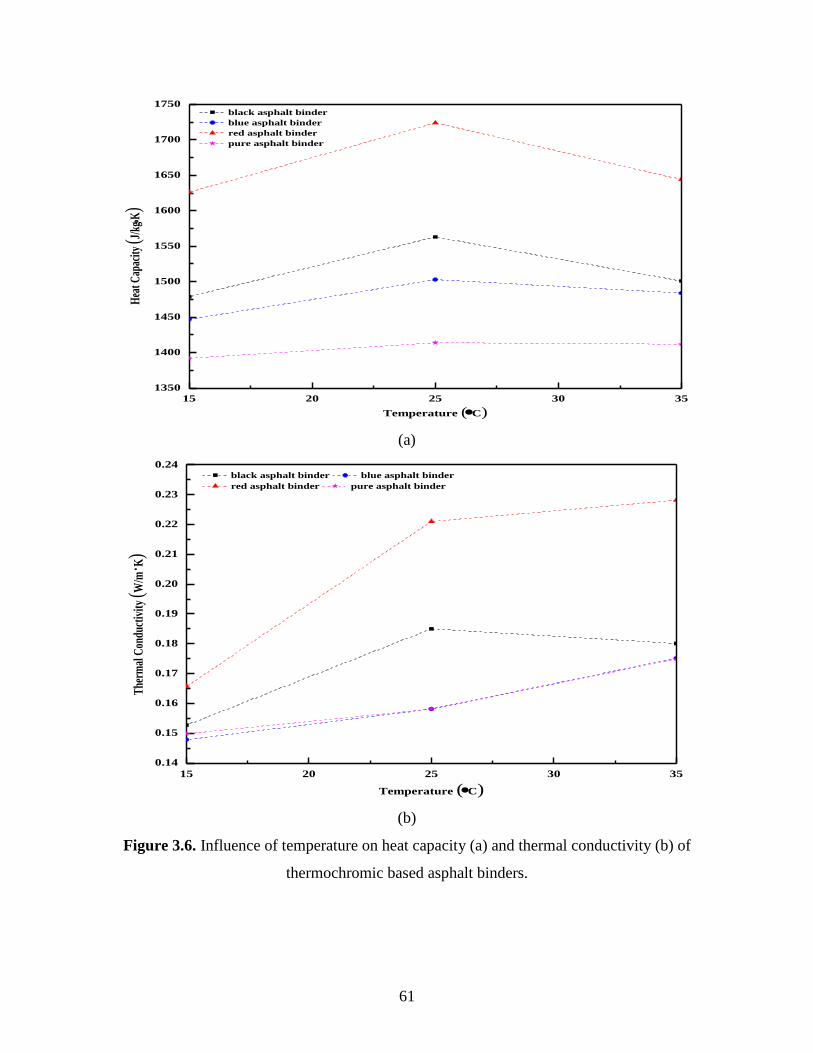
61
15 20 25 30 35
1350
1400
1450
1500
1550
1600
1650
1700
1750
Hea
t Cap
acity
(J/k
gK)
Temperature (C)
black asphalt binder
blue asphalt binder
red asphalt binder
pure asphalt binder
(a)
15 20 25 30 35
0.14
0.15
0.16
0.17
0.18
0.19
0.20
0.21
0.22
0.23
0.24
The
rmal
Con
duct
ivit
y (W
/m·K
)
Temperature (C)
black asphalt binder blue asphalt binder
red asphalt binder pure asphalt binder
(b)
Figure 3.6. Influence of temperature on heat capacity (a) and thermal conductivity (b) of
thermochromic based asphalt binders.

62
Thermal Performance of Thermochromic Asphalt Binder Samples
Experiments were conducted to evaluate the effects of thermochromic materials on the thermal
responses of pavement. The experimental design simulated the surface temperatures of
thermochromic asphalt binder samples under typical summer condition. The set up for this
comparison study was illustrated in Figure 3.3 and described in the earlier context. Based on the
measured surface temperature measurements, the mean, maximum and minimum surface
temperatures were calculated for each sample. The results are shown in Table 3.3. The difference
between surface temperatures of thermochromic asphalt binders and pure asphalt binder
(Tthermochromic-Tpure) with time is shown in Figure 3.7.
TABLE 3.3. Surface Temperature of the Tested Samples during Summer and Winter
Sample Surface temperature (°C) in summer Surface temperature (°C) in winter
Diurnal Nocturnal Mean
mean maximum ΔTmax Mean
Pure asphalt 51.83 72.11 - 24.79 -6.31
Black asphalt 48.45 68.91 6.6 24.97 -3.54
Blue asphalt 51.74 71.88 2.68 25.36 -3.85
Red asphalt 50.34 70.83 4.96 25.08 -6.12
To explain Table 3.3, during summer, the diurnal surface temperature (07:00-19:00) and the
nocturnal surface temperature (00:00-07:00 and 19:00-00:00) were considered respectively. The
results show that all thermochromic asphalt binders have lower surface temperature than
conventional pure asphalt binder at daytime during summer. The mean diurnal temperature of
thermochromic based asphalt binder samples ranges from 48.45°C for black asphalt binder
sample to 51.74°C for blue asphalt binder sample. The corresponding temperature for
conventional pure asphalt binder is 51.83°C. The maximum diurnal surface temperature of
thermochromic based asphalt binders occurred at different time ranges from 68.91°C for black
asphalt binder to 71.88°C for blue asphalt binder. The corresponding temperature for
conventional pure asphalt binder is 72.11°C. At the same time, the maximum differences of
surface temperature between pure asphalt binder and thermochromic based asphalt binders are
6.6°C, 2.68°C and 4.96°C for black, blue and red asphalt binder. These temperature differences
between the samples can be explained by the solar reflectance and thermal properties of the
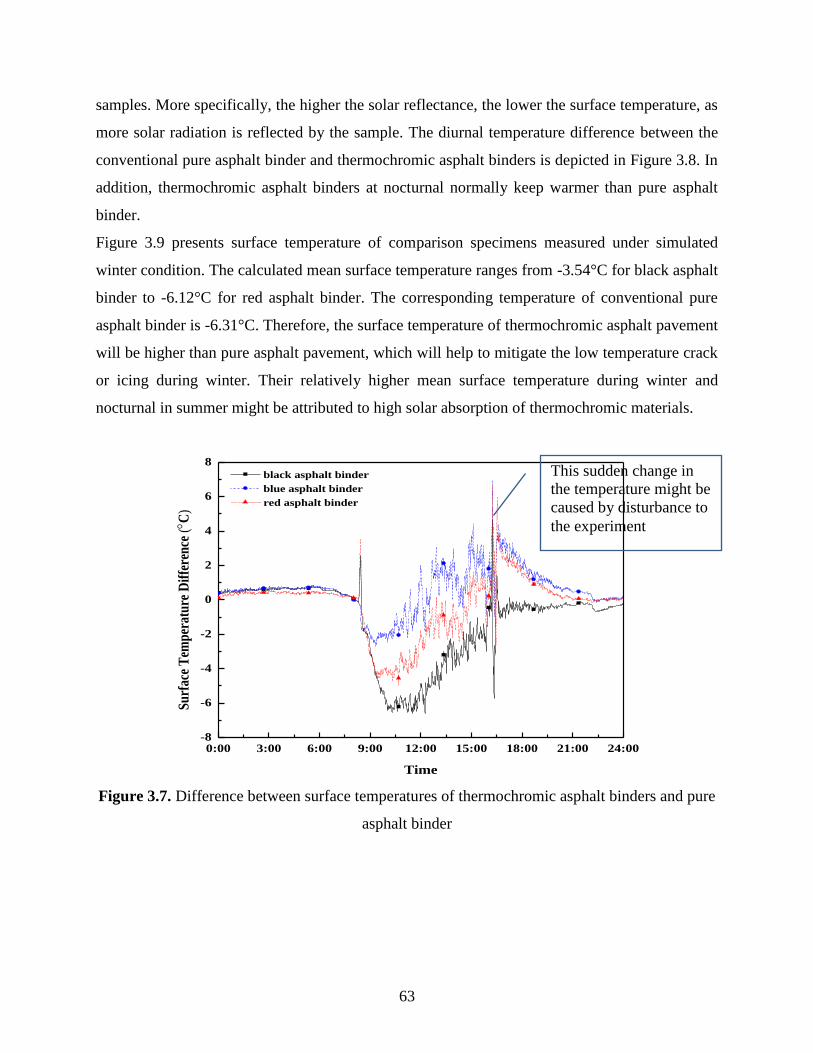
63
samples. More specifically, the higher the solar reflectance, the lower the surface temperature, as
more solar radiation is reflected by the sample. The diurnal temperature difference between the
conventional pure asphalt binder and thermochromic asphalt binders is depicted in Figure 3.8. In
addition, thermochromic asphalt binders at nocturnal normally keep warmer than pure asphalt
binder.
Figure 3.9 presents surface temperature of comparison specimens measured under simulated
winter condition. The calculated mean surface temperature ranges from -3.54°C for black asphalt
binder to -6.12°C for red asphalt binder. The corresponding temperature of conventional pure
asphalt binder is -6.31°C. Therefore, the surface temperature of thermochromic asphalt pavement
will be higher than pure asphalt pavement, which will help to mitigate the low temperature crack
or icing during winter. Their relatively higher mean surface temperature during winter and
nocturnal in summer might be attributed to high solar absorption of thermochromic materials.
0:00 3:00 6:00 9:00 12:00 15:00 18:00 21:00 24:00-8
-6
-4
-2
0
2
4
6
8
Su
rfac
e T
emp
erat
ure
Dif
fere
nce
(C
)
Time
black asphalt binder
blue asphalt binder
red asphalt binder
Figure 3.7. Difference between surface temperatures of thermochromic asphalt binders and pure
asphalt binder
This sudden change in
the temperature might be
caused by disturbance to
the experiment
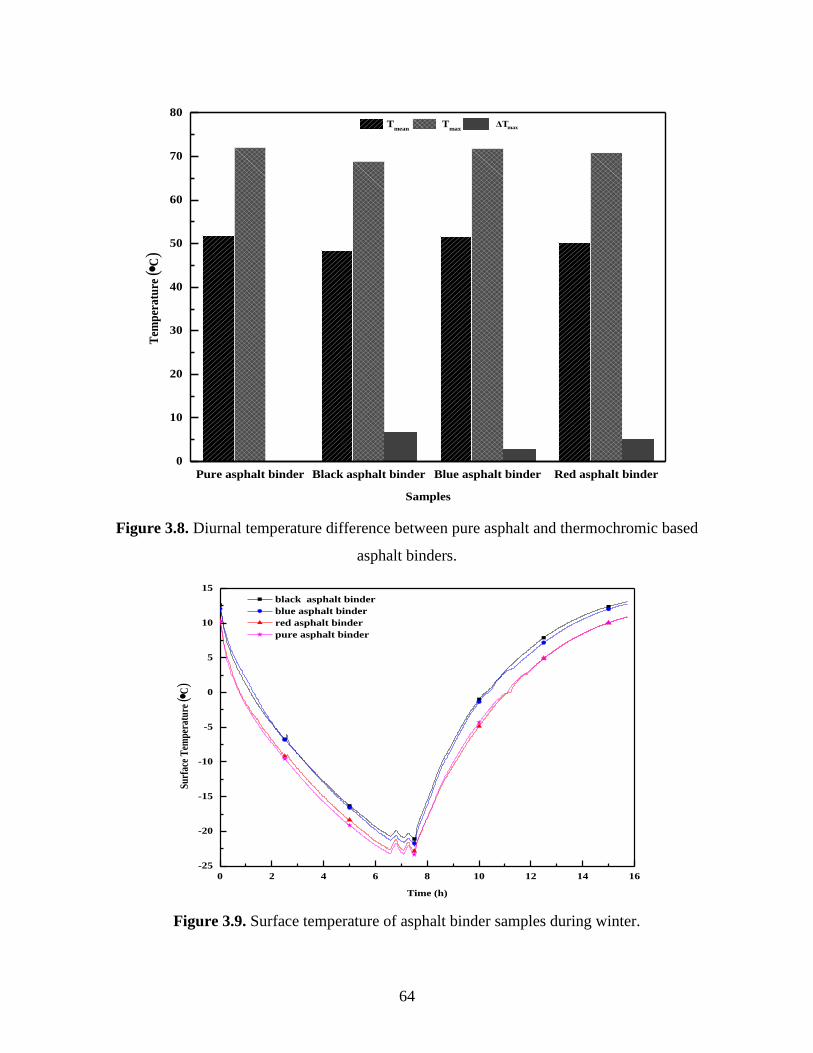
64
Pure asphalt binder Black asphalt binder Blue asphalt binder Red asphalt binder
0
10
20
30
40
50
60
70
80
maxΔT Tmean
Tmax
Tem
per
atu
re (C
)
Samples
Figure 3.8. Diurnal temperature difference between pure asphalt and thermochromic based
asphalt binders.
0 2 4 6 8 10 12 14 16
-25
-20
-15
-10
-5
0
5
10
15
Su
rfac
e T
emp
erat
ure
(C
)
Time (h)
black asphalt binder
blue asphalt binder
red asphalt binder
pure asphalt binder
Figure 3.9. Surface temperature of asphalt binder samples during winter.

65
Discussion
It should be noticed that during evaluation of thermal performance of thermochromic asphalt
binder, the rectangular samples with size of 0.075 m × 0.042 m only cover a portion of the
surface of the cylinder asphalt specimen (diameter of 0.1 m), or 40% of the surface of the asphalt
concrete specimen. Therefore, the net effectiveness of the thermochromic surface is increased in
complete surface coverage. It is anticipated that the reduction of the surface temperature will be
more significant with 100% coverage of the surface of the comparison specimens. The reduced
surface temperature during summer and increased surface temperature during winter both help to
reduce temperature related distresses.
Besides the above benefits, it has shown that reduced surface temperature of pavement can
mitigate urban heat island, and reduce air pollution and smog formation. The increase of surface
temperature during winter conditions helps to mitigate problems such as black ice.
3.6 Summary
This chapter describes the preliminary study to assess the potential of thermochromic materials
for improving the performance of asphalt pavement. The key is to use the materials to modulate
the surface temperature of asphalt pavement (to make it cooler under high temperature and
warmer under low temperature). Experiments were conducted to validate this concept.
Thermochromic asphalt binder was prepared by mixing selected thermochromic materials with
traditional asphalt binder. Physical and thermal properties of both thermochromic materials and
thermochromic asphalt binders were measured.
The effectiveness of thermochromic asphalt binders in changing the surface temperature of
asphalt pavement was studied by comparison experiments under typical summer and modeling
winter conditions. The results showed that the use of thermochromic asphalt binder (with 40%
coverage of pavement surface) can reduce the surface temperature as high as 6.6°C during
summer compared with pure asphalt binder. This helps to reduce high temperature related
performance degradation. In addition, under winter conditions, the surface temperatures of
thermochromic asphalt binders are higher than that of pure asphalt binder. This could help to
reduce the low temperature cracking and mitigate ice formation on pavement during winter.
Therefore, this innovative thermochromic asphalt binder might potentially help improve the
durability and safety of asphalt roads.

66
3.7 References
(1) Santamouris, M., Pavlou, K., Synnefa, A., Niachou, K., Kolokotsa, D. Recent progress on
passive cooling techniques: Advanced technological developments to improve survivability
levels in low-income households. Energy and Buildings, 2007, 39(7): 859-866.
(2) Synnefa, A., Dandou, A., Santamouris, M., Tombrou, M., Soulakellis, N. Large scale
albedo changes using cool materials to mitigate heat island in Athens. Journal of Applied
Meteorology and Climatology, 2008, 47(11): 2846-2856.
(3) Doulos, L., Santamouris, M., Livada, I. Passive cooling of outdoor urban spaces. The role
of materials. Solar Energy, 2004, 77(2): 231-249.
(4) Yoder, E. J. and Witzak, M. W. Principles of Pavement Design. New York, NY: Wiley and
Sons, 1975.
(5) Pomerantz, M. and Akbari. H. Cooler Paving Materials for Heat Island Mitigation. In 1998
ACEEE Summer Study on Energy Efficiency in Buildings, Asilomar, CA, City: American
Council for an Energy-Efficient Economy, 1998.
(6) Pomerantz, M., Akbari, H. Cooler paving materials for heat island mitigation, in:
Proceedings of the 1998 ACEEE Summer Study on Energy Efficiency in Buildings, vol. 9,
Pacific Grove, CA, 1998, p. 135.
(7) Pomerantz, M., Akbari, H., Chen, A., Taha, H., Rosenfeld, A. Paving Materials for Heat
Island Mitigation, Lawrence Berkeley National Laboratory Report LBL- 38074, Berkeley,
CA, 1997.
(8) Pomerantz, M., Akbari, H., Harvey, J. T. 2000. Cooler reflective pavements give benefits
beyond energy savings: Durability and illumination. Rep. No. LBNL-45370, Berkeley, CA,
14 pp.
(9) Kinouchi, T., Yoshinaka, T., Fukae, N., Kanda, M., 2004. Development of cool pavement
with dark colored high albedo coating. Fifth Conference for the Urban Environment,
Vancouver, Canada.
(10) Hao, P.W., Zhang, D.L., Hu, X.N., 2000. Evaluation method for low temperature
anticracking performance of asphalt mixture. Journal of Xi'an Highway University 20 (3),
1–5.
(11) Kanerva, H.K., VINSON, T.S., Zeng, H., 1994. Low Temperature Cracking Field
Validation of the Thermal Stress Rest Rained Specimen Test. R. SHRP-A-401.
67
(12) White, M. A., LeBlanc, M. Thermochromism in Commercial Products. Journal of
Chemical Education, 1999, 76 (9): 1201-1205.
(13) Santamouris, M., Synnefa, A., Kolokotsa, D., Dimitriou, V., Apostolakis, K. Passive
cooling of the built environment - use of innovative reflective materials to fight heat island
and decrease cooling needs. International Journal Low Carbon Technologies, 2008, 3(2):
71-82.
(14) Karlessi, T., Santamouris, M., Apostolakis, K., Synnefa, A., Livada, I. Development and
testing of thermochromic coatings for buildings and urban structures. Solar Energy, 2009,
83(4): 538-551.
(15) Granqvist, C.G. Materials Science for Solar Energy Conversion Systems. Pergamon press,
Oxford, 1991.
(16) Saeli, M., Piccirillo, C., Parkin, I. P., Binions, R., Ridley, I. Energy modelling studies of
thermochromic glazing. Energy and Buildings, 2010, 42(10): 1666-1673.
(17) Ma, Y. P. and Zhu, B.R. Research on the preparation of reversibly thermochromic cement
based materials at normal temperature. Cement and Concrete Research, 2009, 39(2): 90-94.
(18) Reading, M., Luget, A., Wilson, R. Modulated differential scanning calorimetry.
Thermochimica Acta, 1994, 238: 295–307.
(19) Marcus, S.M., Blaine, R.L. Thermal-conductivity of polymers, glasses and ceramics by
modulated DSC. Thermochimica Acta, 1994, 243(2): 231-239.
(20) Simon, S.L., McKenna, G.B. Measurement of thermal conductivity using TMDSC:
solution to the heat flow problem. Journal of Reinforced Plastics and Composites, 1999,
18(6): 559-571.
(21) Isa, I.A.A., Jodeh, S.W. Thermal properties of automotive polymers III—thermal
characteristics and flammability of fire retardant polymers. Materials Research Innovations,
2001, 4 (2–3): 135-143.
(22) ASTM E1958-98. Thermal conductivity and thermal diffusivity by modulated temperature
differential scanning calorimetry.
(23) Privalko, V.P., Novikov, V.V. The Science of Heterogeneous Polymers: Structure and
Thermophysical Properties, John Wiley & Sons, 1995.

68
69
CHAPTER FOUR
CHARACTERIZATION AND EMPIRICAL ANALYSIS OF THE OPTICAL REFLECTANCE
SPECTRA OF THERMOCHROMIC ASPHALT
This chapter describes the study of the optical reflectance of thermochromic binder.
Measurements of spectral reflectance of thermochromic powders indicate that thermochromic
materials feature more reflection at higher temperature and more absorption at lower
temperature. The spectral reflectance of thermochromic powders as functions of wavelength and
temperature are proposed by fitting experimental results. Optical measurements conducted on the
asphalt binder mixture show more reflection than conventional asphalt binder and that the
reflectance increases with temperature. The relationship between spectral reflectance of asphalt
binder mixture and temperature as well as wavelength has been deduced by fitting experimental
data. Finally, it is found that the spectral reflectance of the thermochromic asphalt binder mixture
increases as the powder content increases. The empirical formulas based on Maxwell, Mori-
Tanaka, and effective medium theory (EMT) models are determined between spectral reflectance
of the thermochromic asphalt binder mixture and powder content as well as wavelength in the
near infrared region by fitting technique. These empirical equations provide a good potential to
predict the reflectance spectra of the thermochromic asphalt binder mixture with different
contents of thermochromic powders at different temperatures.
4.1 Introduction
Asphalt pavement has been widely used in highways due to the good performance and relatively
low construction and maintenance costs. However, the surface temperature of asphalt pavement
is reported in studies (i.e., (1-3)) as high as 48-67°C during summer. This is attributed to the
black color of asphalt binder, which possesses large solar absorption. The increased temperature
in asphalt pavement deteriorates its durability by accelerating various distress mechanisms (i.e.,
rutting, shoving, aging, fatigue damage, bleeding) (4). A potential way to improve durability that
is attractive is to use materials which create high solar reflectivity. Cool pavement has been
consequently developed by using these cool materials with high reflectivity and emissivity to
solar radiation. Studies (5–9) show that cool pavement exhibits lower surface temperatures,
70
resulting in increased service life (durability) of pavements. However, the reduced temperature in
asphalt pavement exacerbates low-temperature cracking during the winter period (10–11), which
is quite harmful to service life of the road. Moreover, the lower temperature is conductive to ice
formation in cold weather. So it is necessary to develop a new method to keep asphalt pavement
cool during summer and warm during winter.
An innovative strategy in our study is to use thermochromic materials to develop new
materials possessing desirable solar reflectance, i.e., they reflect more solar energy at high
temperature and reflect less solar energy at low temperature. Thermochromic materials are
substances that can change their colors in response to variation in temperature. Materials
incorporated with proper thermochromic materials feature high solar reflectance in summer and
high solar absorption in winter. The change of their optics in such a dynamic way makes them
attractive for applications that improve the urban microclimate, decrease the energy demands of
the buildings, and provide a thermally comfortable indoor environment (12–16).
In this study an innovative asphalt binder mixture containing thermochromic materials is
designed to modulate the temperature of asphalt pavement. The optical properties are
characterized by spectrophotometry measurements. The relationship between reflectance spectra
of both of thermochromic powders and asphalt binder mixture and temperature is determined by
fitting experimental data. The empirical expressions between reflectance spectra of asphalt
binder mixture and content of powders in the near infrared region also are derived. These
empirical equations provide good prediction for optical properties of thermochromic asphalt
binder mixtures.
4.2 Experimental Design
Raw Materials
Asphalt binder used in this study is Superpave grade, PG 64-22, produced by Kokosing Materials
Inc. Thermochromic powders with an average particle size of 3 ~ 10 μm were selected from
those manufactured by Hali Industrial Corporation Ltd. Red, blue and black thermochromic
powders with transition temperature around 31 °C were chosen for this study. These
thermochromic materials are organic mixtures, which consists of lueco dye (electron donor),
developer (electron acceptor) and solvent. Below the transition temperature, leuco dye reacts
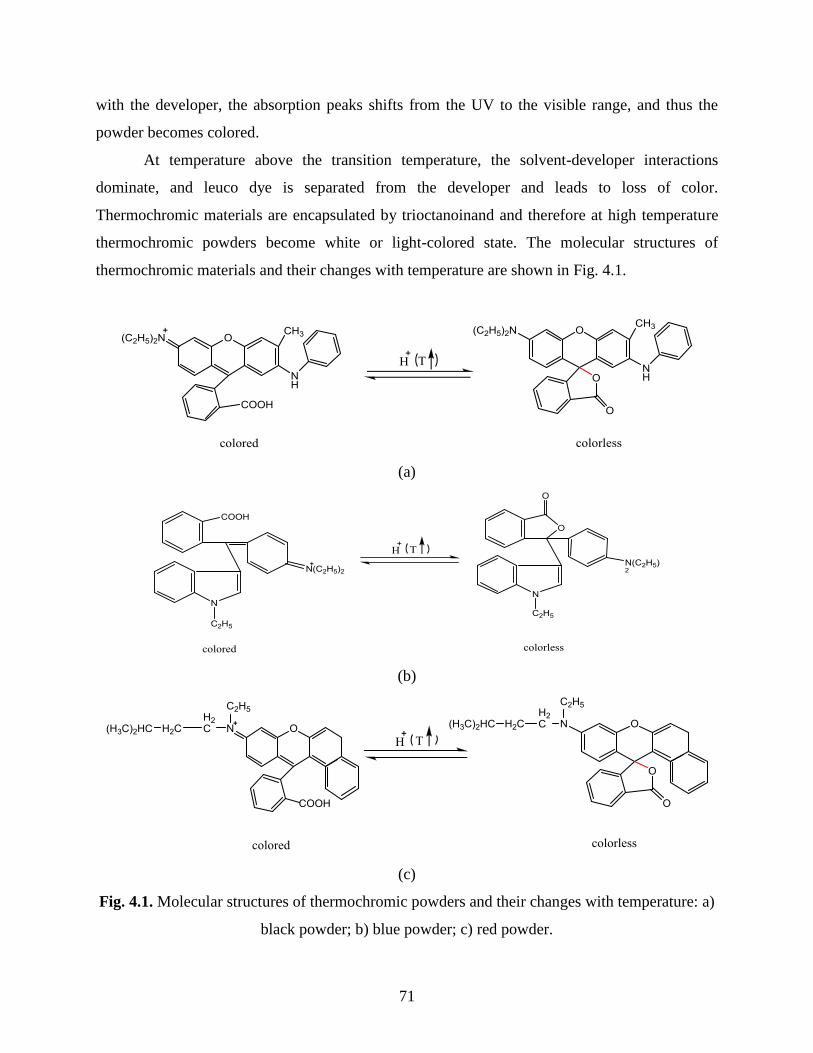
71
with the developer, the absorption peaks shifts from the UV to the visible range, and thus the
powder becomes colored.
At temperature above the transition temperature, the solvent-developer interactions
dominate, and leuco dye is separated from the developer and leads to loss of color.
Thermochromic materials are encapsulated by trioctanoinand and therefore at high temperature
thermochromic powders become white or light-colored state. The molecular structures of
thermochromic materials and their changes with temperature are shown in Fig. 4.1.
(a)
(b)
(c)
Fig. 4.1. Molecular structures of thermochromic powders and their changes with temperature: a)
black powder; b) blue powder; c) red powder.
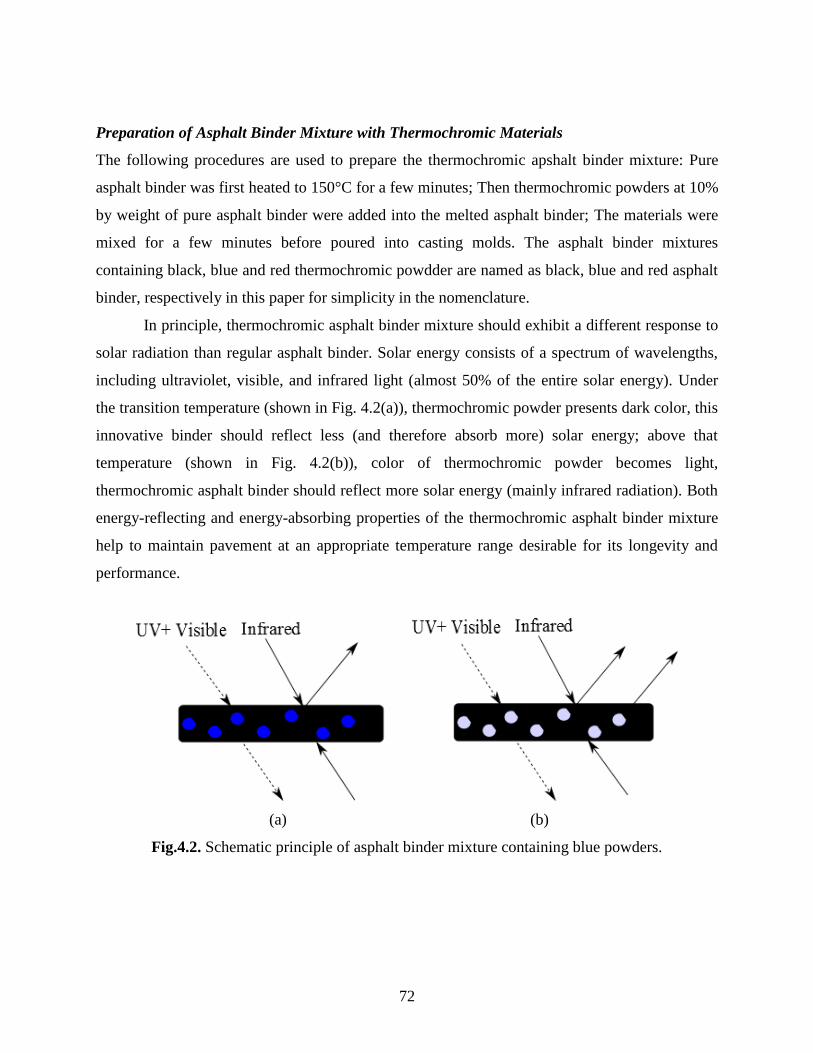
72
Preparation of Asphalt Binder Mixture with Thermochromic Materials
The following procedures are used to prepare the thermochromic apshalt binder mixture: Pure
asphalt binder was first heated to 150°C for a few minutes; Then thermochromic powders at 10%
by weight of pure asphalt binder were added into the melted asphalt binder; The materials were
mixed for a few minutes before poured into casting molds. The asphalt binder mixtures
containing black, blue and red thermochromic powdder are named as black, blue and red asphalt
binder, respectively in this paper for simplicity in the nomenclature.
In principle, thermochromic asphalt binder mixture should exhibit a different response to
solar radiation than regular asphalt binder. Solar energy consists of a spectrum of wavelengths,
including ultraviolet, visible, and infrared light (almost 50% of the entire solar energy). Under
the transition temperature (shown in Fig. 4.2(a)), thermochromic powder presents dark color, this
innovative binder should reflect less (and therefore absorb more) solar energy; above that
temperature (shown in Fig. 4.2(b)), color of thermochromic powder becomes light,
thermochromic asphalt binder should reflect more solar energy (mainly infrared radiation). Both
energy-reflecting and energy-absorbing properties of the thermochromic asphalt binder mixture
help to maintain pavement at an appropriate temperature range desirable for its longevity and
performance.
(a) (b)
Fig.4.2. Schematic principle of asphalt binder mixture containing blue powders.
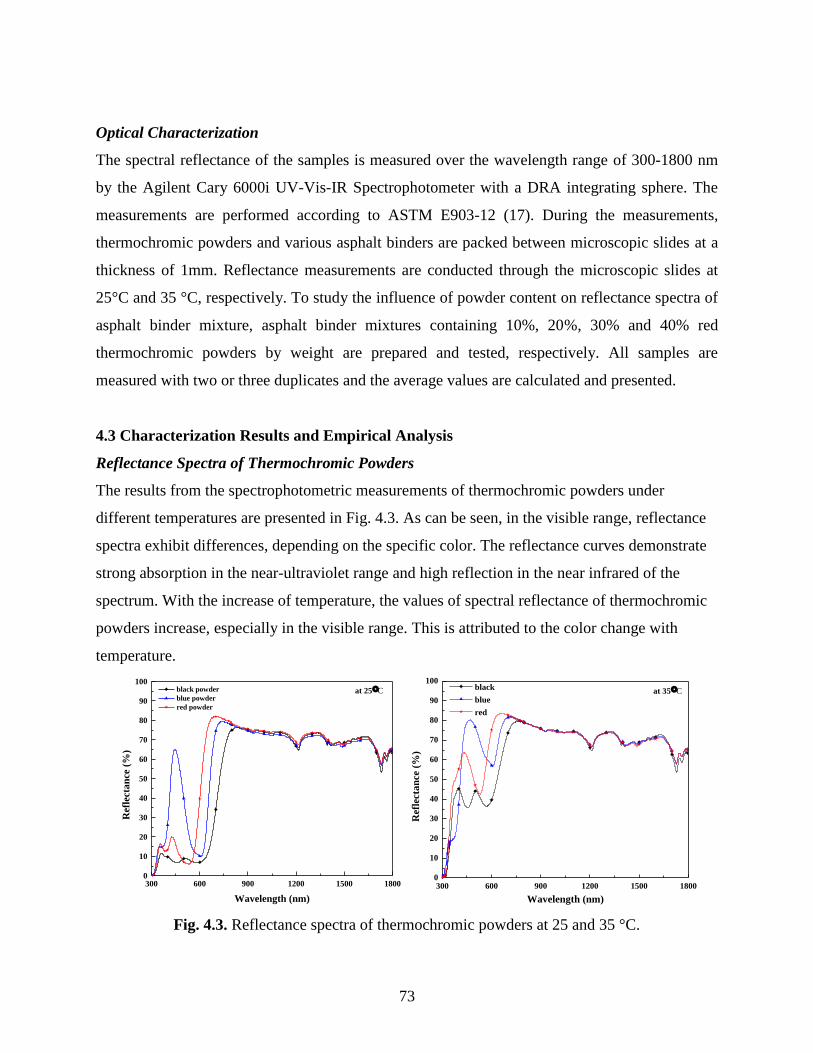
73
Optical Characterization
The spectral reflectance of the samples is measured over the wavelength range of 300-1800 nm
by the Agilent Cary 6000i UV-Vis-IR Spectrophotometer with a DRA integrating sphere. The
measurements are performed according to ASTM E903-12 (17). During the measurements,
thermochromic powders and various asphalt binders are packed between microscopic slides at a
thickness of 1mm. Reflectance measurements are conducted through the microscopic slides at
25°C and 35 °C, respectively. To study the influence of powder content on reflectance spectra of
asphalt binder mixture, asphalt binder mixtures containing 10%, 20%, 30% and 40% red
thermochromic powders by weight are prepared and tested, respectively. All samples are
measured with two or three duplicates and the average values are calculated and presented.
4.3 Characterization Results and Empirical Analysis
Reflectance Spectra of Thermochromic Powders
The results from the spectrophotometric measurements of thermochromic powders under
different temperatures are presented in Fig. 4.3. As can be seen, in the visible range, reflectance
spectra exhibit differences, depending on the specific color. The reflectance curves demonstrate
strong absorption in the near-ultraviolet range and high reflection in the near infrared of the
spectrum. With the increase of temperature, the values of spectral reflectance of thermochromic
powders increase, especially in the visible range. This is attributed to the color change with
temperature.
300 600 900 1200 1500 18000
10
20
30
40
50
60
70
80
90
100at 25 C
Ref
lect
an
ce (
%)
Wavelength (nm)
black powder
blue powder
red powder
300 600 900 1200 1500 18000
10
20
30
40
50
60
70
80
90
100
at 35 C
Ref
lect
an
ce (
%)
Wavelength (nm)
black
blue
red
Fig. 4.3. Reflectance spectra of thermochromic powders at 25 and 35 °C.

74
To predict the reflectance spectra of thermochromic powders under a different
temperature, the relationship between reflectance and wavelength is first determined by fitting at
each temperature. Considered the curve shape in Fig. 4.3, polynomial and Boltzman models are
used in different regions to fit experimental data. The fit equations and the values of adjusted R
square (R2) are summarized in Table 4.1. Fig. 4.4 displays the comparison between fitted and
measured values. It can be seen that the empirical formulas present good agreement with
experimental results. In addition, at higher temperature, the lower bound in Boltzman model
increases. In the range of 800–1800 nm, the reflectance spectra of thermochromic powders as a
function of temperature can be derived by the interpolation method as follows:
For black thermochromic powder,
706.80
20.50
73.575 3.245 70.6570.65
1
p
TR
e
(1)
For blue thermochromic powder,
655.65
10.99
108.13 4.718 70.8670.86
1p
TR
e
(2)
For red thermochromic powder,
599.33
13.68
83.39 3.594 72.5072.50
1
p
TR
e
(3)
300 600 900 1200 1500 18000
10
20
30
40
50
60
70
80
90
100
25 C
Ref
lect
an
ce (
%)
Wavelength (nm)
black powder fitted black powder
blue powder fitted blue powder
red powder fitted red powder
300 600 900 1200 1500 18000
10
20
30
40
50
60
70
80
90
10035 C
Ref
lect
an
ce (
%)
Wavelength (nm)
black powder fitted black powder
blue powder fitted blue powder
red powder fitted red powder
Fig. 4.4. Comparison between experimental and fitted values of reflectance spectra of
thermochromic powders at 25 and 35 °C.
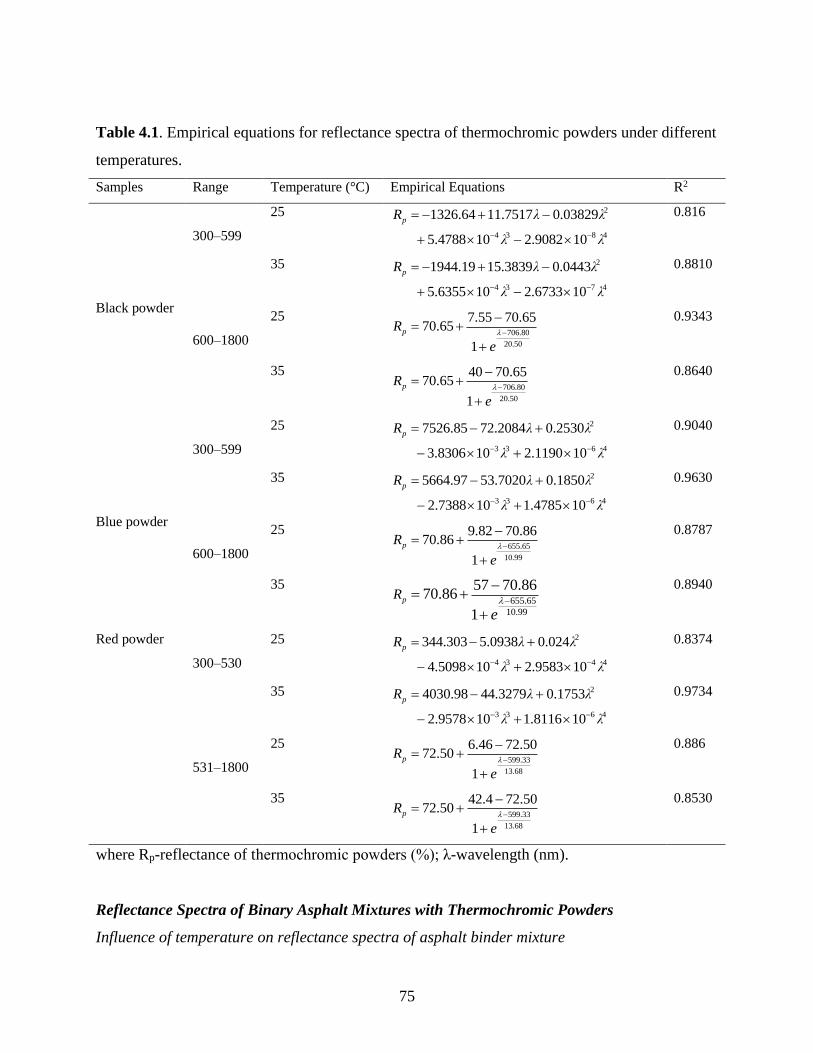
75
Table 4.1. Empirical equations for reflectance spectra of thermochromic powders under different
temperatures.
Samples Range Temperature (°C) Empirical Equations R2
Black powder
300–599
25 2
4 3 8 4
1326.64 11.7517 0.03829
5.4788 10 2.9082 10
pR λ λ
λ λ
0.816
35 2
4 3 7 4
1944.19 15.3839 0.0443
5.6355 10 2.6733 10
pR λ λ
λ λ
0.8810
600–1800
25 706.80
20.50
7.55 70.6570.65
1
pR
e
0.9343
35 706.80
20.50
40 70.6570.65
1
pR
e
0.8640
Blue powder
300–599
25 2
3 3 6 4
7526.85 72.2084 0.2530
3.8306 10 2.1190 10
pR λ λ
λ λ
0.9040
35 2
3 3 6 4
5664.97 53.7020 0.1850
2.7388 10 1.4785 10
pR λ λ
λ λ
0.9630
600–1800
25 655.65
10.99
9.82 70.8670.86
1
pR
e
0.8787
35 655.65
10.99
57 70.8670.86
1pR
e
0.8940
Red powder
300–530
25 2
4 3 4 4
344.303 5.0938 0.024
4.5098 10 2.9583 10
pR λ λ
λ λ
0.8374
35 2
3 3 6 4
4030.98 44.3279 0.1753
2.9578 10 1.8116 10
pR λ λ
λ λ
0.9734
531–1800
25 599.33
13.68
6.46 72.5072.50
1
pR
e
0.886
35 599.33
13.68
42.4 72.5072.50
1
pR
e
0.8530
where Rp-reflectance of thermochromic powders (%); λ-wavelength (nm).
Reflectance Spectra of Binary Asphalt Mixtures with Thermochromic Powders
Influence of temperature on reflectance spectra of asphalt binder mixture
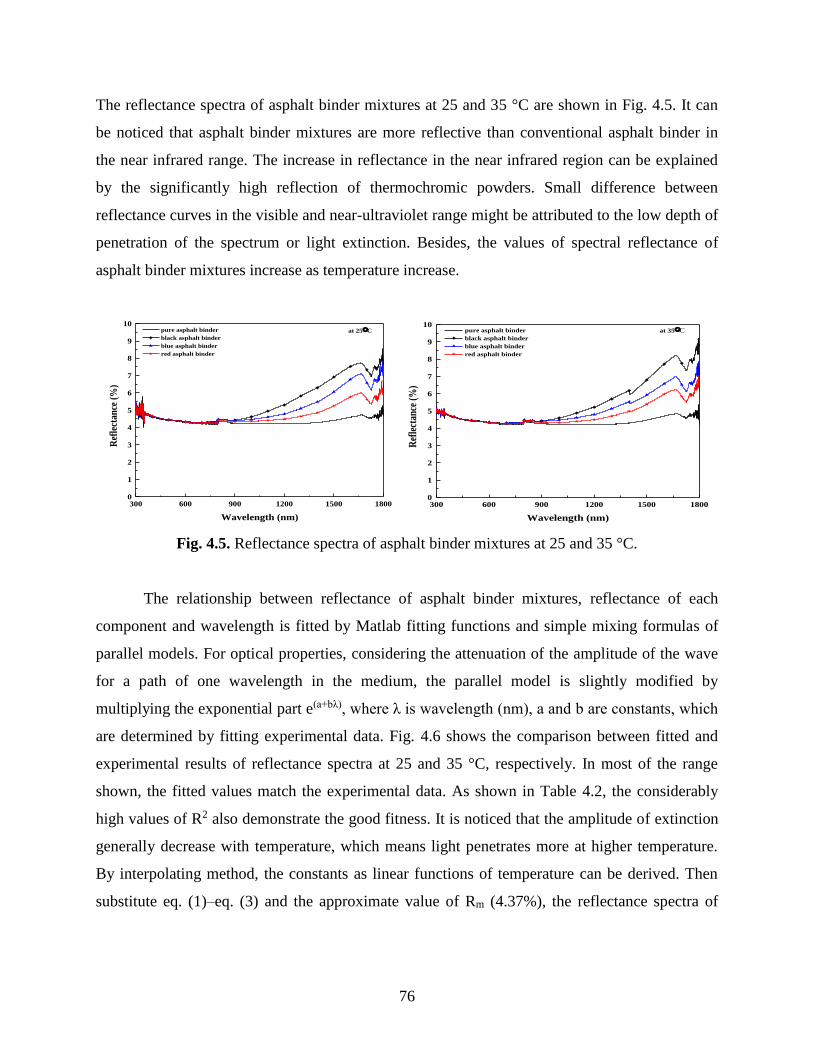
76
The reflectance spectra of asphalt binder mixtures at 25 and 35 °C are shown in Fig. 4.5. It can
be noticed that asphalt binder mixtures are more reflective than conventional asphalt binder in
the near infrared range. The increase in reflectance in the near infrared region can be explained
by the significantly high reflection of thermochromic powders. Small difference between
reflectance curves in the visible and near-ultraviolet range might be attributed to the low depth of
penetration of the spectrum or light extinction. Besides, the values of spectral reflectance of
asphalt binder mixtures increase as temperature increase.
300 600 900 1200 1500 18000
1
2
3
4
5
6
7
8
9
10at 25 C
Ref
lect
ance
(%
)
Wavelength (nm)
pure asphalt binder
black asphalt binder
blue asphalt binder
red asphalt binder
300 600 900 1200 1500 18000
1
2
3
4
5
6
7
8
9
10at 35 C
Ref
lect
ance
(%
)
Wavelength (nm)
pure asphalt binder
black asphalt binder
blue asphalt binder
red asphalt binder
Fig. 4.5. Reflectance spectra of asphalt binder mixtures at 25 and 35 °C.
The relationship between reflectance of asphalt binder mixtures, reflectance of each
component and wavelength is fitted by Matlab fitting functions and simple mixing formulas of
parallel models. For optical properties, considering the attenuation of the amplitude of the wave
for a path of one wavelength in the medium, the parallel model is slightly modified by
multiplying the exponential part e(a+bλ), where λ is wavelength (nm), a and b are constants, which
are determined by fitting experimental data. Fig. 4.6 shows the comparison between fitted and
experimental results of reflectance spectra at 25 and 35 °C, respectively. In most of the range
shown, the fitted values match the experimental data. As shown in Table 4.2, the considerably
high values of R2 also demonstrate the good fitness. It is noticed that the amplitude of extinction
generally decrease with temperature, which means light penetrates more at higher temperature.
By interpolating method, the constants as linear functions of temperature can be derived. Then
substitute eq. (1)–eq. (3) and the approximate value of Rm (4.37%), the reflectance spectra of
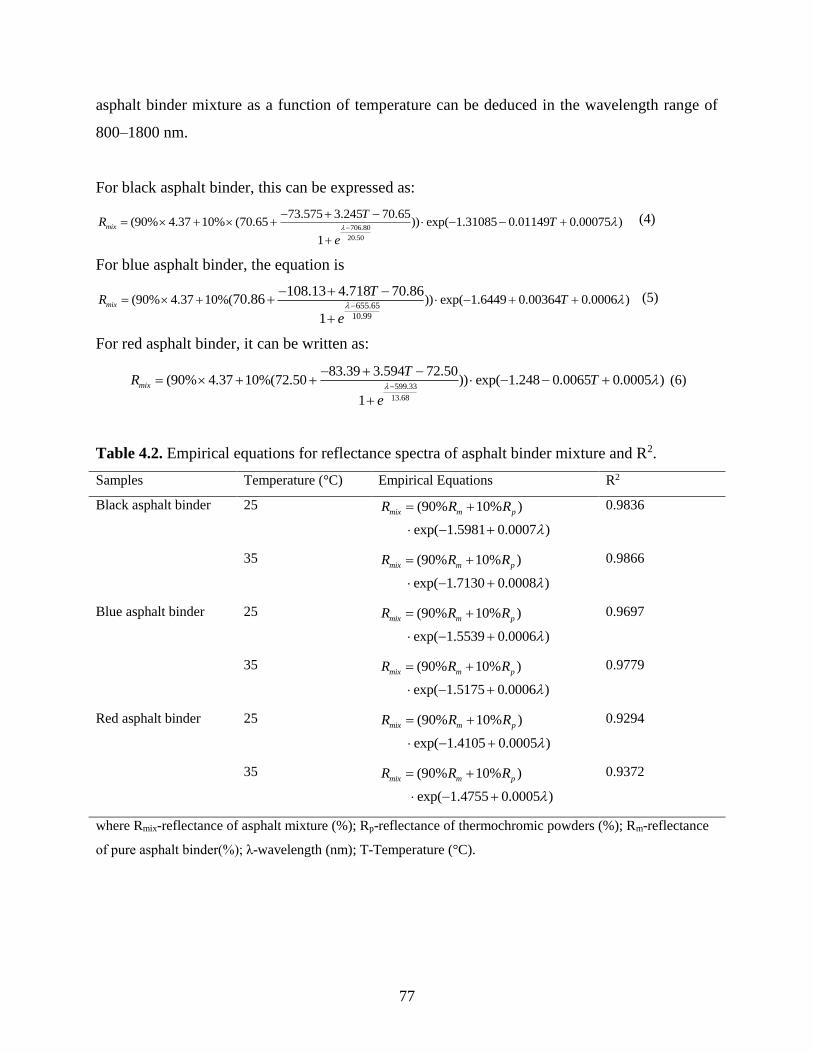
77
asphalt binder mixture as a function of temperature can be deduced in the wavelength range of
800–1800 nm.
For black asphalt binder, this can be expressed as:
706.80
20.50
73.575 3.245 70.65(90% 4.37 10% (70.65 )) exp( 1.31085 0.01149 0.00075 )
1
mix
TR T
e
(4)
For blue asphalt binder, the equation is
655.65
10.99
(90% 4.37 10%( )) exp( 1.6449 0.00364 0.0006 )108.13 4.718 70.86
70.86
1mixR T
T
e
(5)
For red asphalt binder, it can be written as:
599.33
13.68
83.39 3.594 72.50(90% 4.37 10%(72.50 )) exp( 1.248 0.0065 0.0005 )
1
mix
TR T
e
(6)
Table 4.2. Empirical equations for reflectance spectra of asphalt binder mixture and R2.
Samples Temperature (°C) Empirical Equations R2
Black asphalt binder 25 (90% 10% )
exp( 1.5981 0.0007 )
mix m pR R R
0.9836
35 (90% 10% )
exp( 1.7130 0.0008 )
mix m pR R R
0.9866
Blue asphalt binder 25 (90% 10% )
exp( 1.5539 0.0006 )
mix m pR R R
0.9697
35 (90% 10% )
exp( 1.5175 0.0006 )
mix m pR R R
0.9779
Red asphalt binder 25 (90% 10% )
exp( 1.4105 0.0005 )
mix m pR R R
0.9294
35 (90% 10% )
exp( 1.4755 0.0005 )
mix m pR R R
0.9372
where Rmix-reflectance of asphalt mixture (%); Rp-reflectance of thermochromic powders (%); Rm-reflectance
of pure asphalt binder(%); λ-wavelength (nm); T-Temperature (°C).
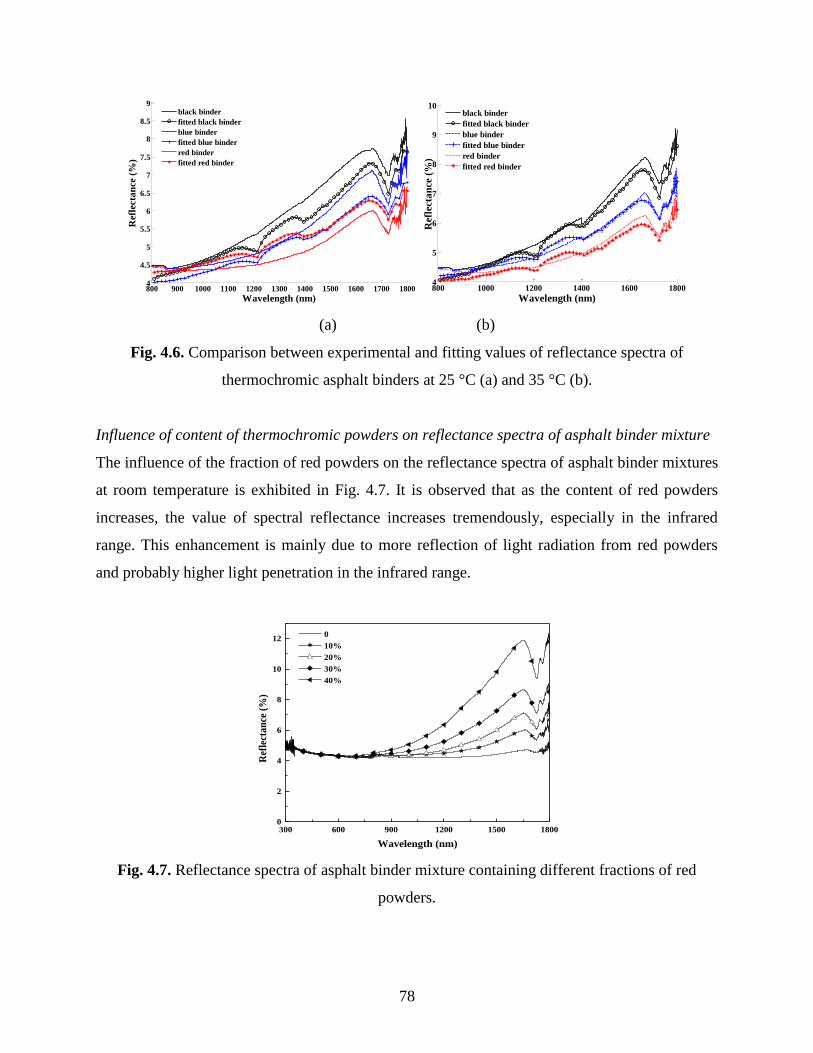
78
800 900 1000 1100 1200 1300 1400 1500 1600 1700 18004
4.5
5
5.5
6
6.5
7
7.5
8
8.5
9
Wavelength (nm)
Ref
lect
an
ce (
%)
black binder
fitted black binder
blue binder
fitted blue binder
red binder
fitted red binder
800 1000 1200 1400 1600 18004
5
6
7
8
9
10
Wavelength (nm)
Ref
lect
an
ce (
%)
black binder
fitted black binder
blue binder
fitted blue binder
red binder
fitted red binder
(a) (b)
Fig. 4.6. Comparison between experimental and fitting values of reflectance spectra of
thermochromic asphalt binders at 25 °C (a) and 35 °C (b).
Influence of content of thermochromic powders on reflectance spectra of asphalt binder mixture
The influence of the fraction of red powders on the reflectance spectra of asphalt binder mixtures
at room temperature is exhibited in Fig. 4.7. It is observed that as the content of red powders
increases, the value of spectral reflectance increases tremendously, especially in the infrared
range. This enhancement is mainly due to more reflection of light radiation from red powders
and probably higher light penetration in the infrared range.
300 600 900 1200 1500 18000
2
4
6
8
10
12
Ref
lect
an
ce (
%)
Wavelength (nm)
0
10%
20%
30%
40%
Fig. 4.7. Reflectance spectra of asphalt binder mixture containing different fractions of red
powders.
79
To predict the effective thermal, electrical, mechanical and chemical properties of the
composite materials, several models have been developed, such as parallel, serial, Maxwell,
effective medium theory (EMT), self-consistent and Mori-Tanaka models. In this paper, these
models are applied to predict the effective reflectance spectra of binary asphalt binder mixtures.
The schematic models and basic expressions are shown in Table 4.3. In the parallel model, layers
of components are placed in the direction of the light radiation. For the serial model, layers of
components are normal to the radiation flow. Of the common models, the parallel and serial
models are the simplest for two-phase systems and offer upper and lower bounds for many
properties of two-phase heterogonous materials (18–19). Based on dielectric theory, Maxwell
(20) obtained a simple relationship for the effective properties of the two-component system
consisting of a continuous and a randomly, non-interacting dispersed phase. Maxwell model is
only applicable to two-phase, dilute composites with spherical powders. EMT model (18, 21)
describes the macroscopic properties of a medium based on the properties and the relative
fractions of its components. It assumes that for a completely random distribution of components,
the local effect caused by individual powders could be averaged such that over a sufficiently
large volume the properties within the material could be approximated by a material having a
uniform behavior (22). A self-consistent model assumes that each particle is surrounded by the
composite material with the effective property rather than by matrix (23). This model is valid for
multiphase composites with various inclusion geometries, isotropy or anisotropies, and it has a
simple and explicit expression. The Mori-Tanaka (24) model is proposed for the graded
microstructure which has a well-defined continuous matrix and a randomly distributed
particulate phase. This model takes into account the interaction among neighboring inclusions
and assumes that the matrix phase is reinforced by spherical particles. Besides, as above-
mentioned, these models need multiply the exponential part e(a+bλ), considering light extinction in
the medium.
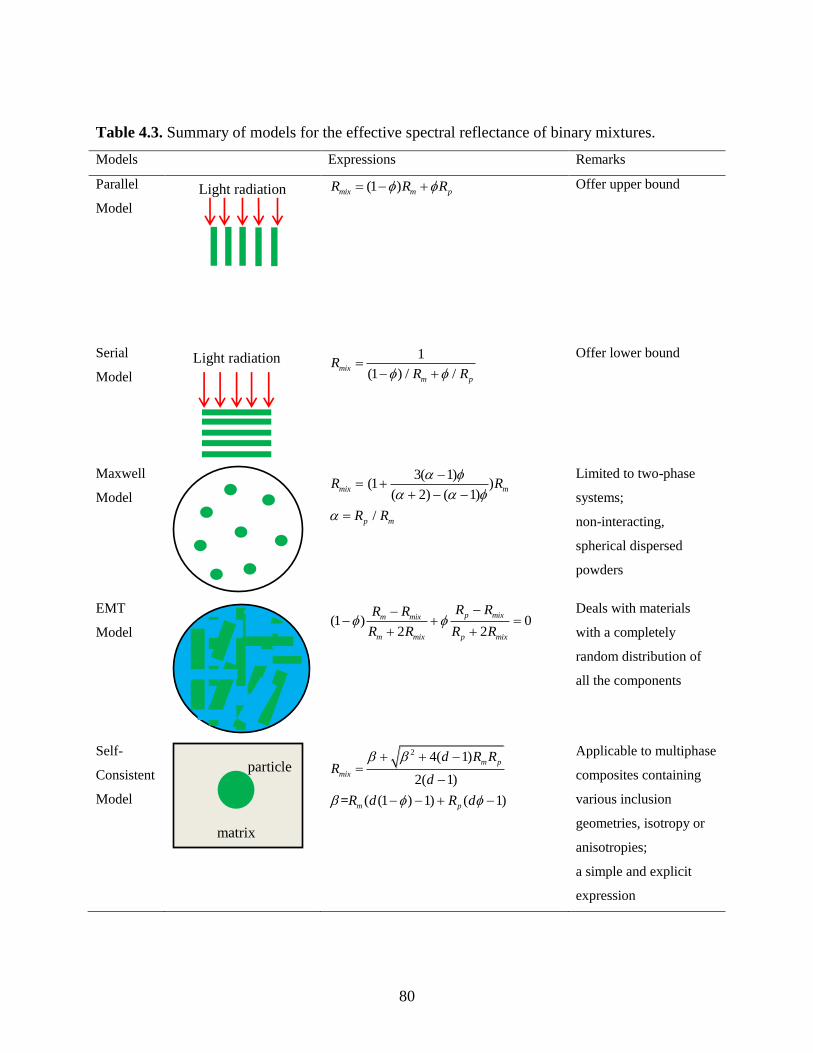
80
Table 4.3. Summary of models for the effective spectral reflectance of binary mixtures.
Models Expressions Remarks
Parallel
Model
(1 )mix m pR R R Offer upper bound
Serial
Model
1
(1 ) / /mix
m p
RR R
Offer lower bound
Maxwell
Model
3( 1) (1 )
( 2) ( 1)
/
mix m
p m
R R
R R
Limited to two-phase
systems;
non-interacting,
spherical dispersed
powders
EMT
Model
(1 ) 0 2 2
p mixm mix
m mix p mix
R RR R
R R R R
Deals with materials
with a completely
random distribution of
all the components
Self-
Consistent
Model
2 4( 1)
2( 1)
( (1 ) 1) ( 1)
m p
mix
m p
d R RR
d
R d R d
=
Applicable to multiphase
composites containing
various inclusion
geometries, isotropy or
anisotropies;
a simple and explicit
expression
matrix
particle
Light radiation
Light radiation
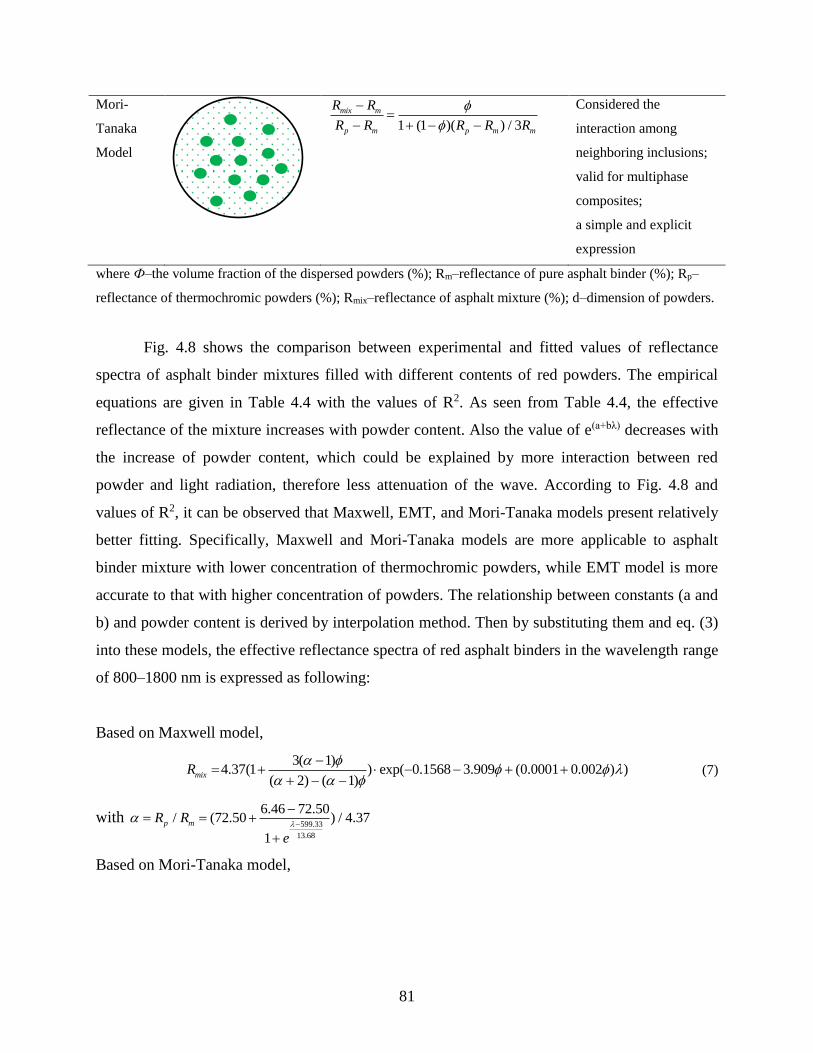
81
Mori-
Tanaka
Model
1 (1 )( ) / 3
mix m
p m p m m
R R
R R R R R
Considered the
interaction among
neighboring inclusions;
valid for multiphase
composites;
a simple and explicit
expression
where Ф–the volume fraction of the dispersed powders (%); Rm–reflectance of pure asphalt binder (%); Rp–
reflectance of thermochromic powders (%); Rmix–reflectance of asphalt mixture (%); d–dimension of powders.
Fig. 4.8 shows the comparison between experimental and fitted values of reflectance
spectra of asphalt binder mixtures filled with different contents of red powders. The empirical
equations are given in Table 4.4 with the values of R2. As seen from Table 4.4, the effective
reflectance of the mixture increases with powder content. Also the value of e(a+bλ) decreases with
the increase of powder content, which could be explained by more interaction between red
powder and light radiation, therefore less attenuation of the wave. According to Fig. 4.8 and
values of R2, it can be observed that Maxwell, EMT, and Mori-Tanaka models present relatively
better fitting. Specifically, Maxwell and Mori-Tanaka models are more applicable to asphalt
binder mixture with lower concentration of thermochromic powders, while EMT model is more
accurate to that with higher concentration of powders. The relationship between constants (a and
b) and powder content is derived by interpolation method. Then by substituting them and eq. (3)
into these models, the effective reflectance spectra of red asphalt binders in the wavelength range
of 800–1800 nm is expressed as following:
Based on Maxwell model,
3( 1)
4.37(1 ) exp( 0.1568 3.909 (0.0001 0.002 ) )( 2) ( 1)
mixR
(7)
with 599.33
13.68
6.46 72.50/ (72.50 ) / 4.37
1
p mR R
e
Based on Mori-Tanaka model,
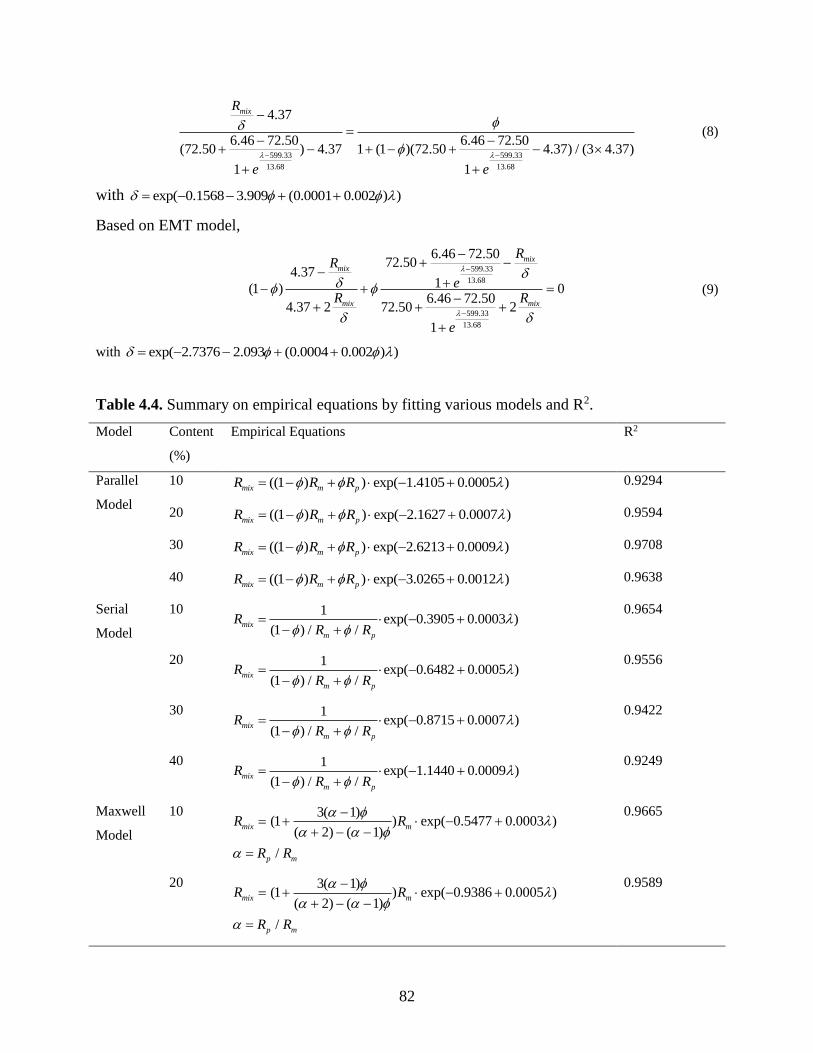
82
599.33 599.33
13.68 13.68
4.37
6.46 72.50 6.46 72.50(72.50 ) 4.37 1 (1 )(72.50 4.37) / (3 4.37)
1 1
mixR
e e
(8)
with exp( 0.1568 3.909 (0.0001 0.002 ) )
Based on EMT model,
599.33
13.68
599.33
13.68
6.46 72.5072.50
4.371(1 ) 0
6.46 72.504.37 2 72.50 2
1
mix
mix
mix mix
RR
eR R
e
(9)
with exp( 2.7376 2.093 (0.0004 0.002 ) )
Table 4.4. Summary on empirical equations by fitting various models and R2.
Model Content
(%)
Empirical Equations R2
Parallel
Model
10 ((1 ) ) exp( 1.4105 0.0005 )mix m pR R R 0.9294
20 ((1 ) ) exp( 2.1627 0.0007 )mix m pR R R 0.9594
30 ((1 ) ) exp( 2.6213 0.0009 )mix m pR R R 0.9708
40 ((1 ) ) exp( 3.0265 0.0012 )mix m pR R R 0.9638
Serial
Model
10 1 exp( 0.3905 0.0003 )
(1 ) / /mix
m p
RR R
0.9654
20 1 exp( 0.6482 0.0005 )
(1 ) / /mix
m p
RR R
0.9556
30 1 exp( 0.8715 0.0007 )
(1 ) / /mix
m p
RR R
0.9422
40 1 exp( 1.1440 0.0009 )
(1 ) / /mix
m p
RR R
0.9249
Maxwell
Model
10 3( 1) (1 ) exp( 0.5477 0.0003 )
( 2) ( 1)
/
mix m
p m
R R
R R
0.9665
20 3( 1) (1 ) exp( 0.9386 0.0005 )
( 2) ( 1)
/
mix m
p m
R R
R R
0.9589
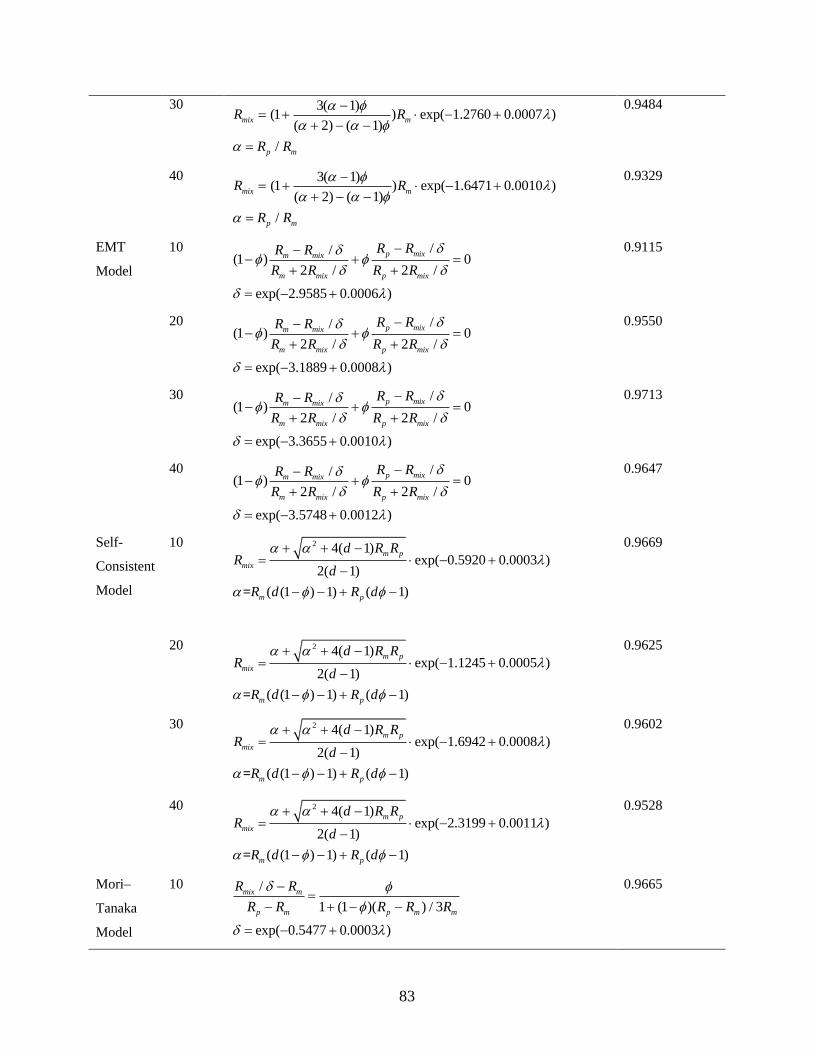
83
30 3( 1) (1 ) exp( 1.2760 0.0007 )
( 2) ( 1)
/
mix m
p m
R R
R R
0.9484
40 3( 1) (1 ) exp( 1.6471 0.0010 )
( 2) ( 1)
/
mix m
p m
R R
R R
0.9329
EMT
Model
10 //(1 ) 0
2 / 2 /
exp( 2.9585 0.0006 )
p mixm mix
m mix p mix
R RR R
R R R R
0.9115
20 //(1 ) 0
2 / 2 /
exp( 3.1889 0.0008 )
p mixm mix
m mix p mix
R RR R
R R R R
0.9550
30 //(1 ) 0
2 / 2 /
exp( 3.3655 0.0010 )
p mixm mix
m mix p mix
R RR R
R R R R
0.9713
40 //(1 ) 0
2 / 2 /
exp( 3.5748 0.0012 )
p mixm mix
m mix p mix
R RR R
R R R R
0.9647
Self-
Consistent
Model
10 2 4( 1)exp( 0.5920 0.0003 )
2( 1)
( (1 ) 1) ( 1)
m p
mix
m p
d R RR
d
R d R d
=
0.9669
20 2 4( 1)exp( 1.1245 0.0005 )
2( 1)
( (1 ) 1) ( 1)
m p
mix
m p
d R RR
d
R d R d
=
0.9625
30 2 4( 1)exp( 1.6942 0.0008 )
2( 1)
( (1 ) 1) ( 1)
m p
mix
m p
d R RR
d
R d R d
=
0.9602
40 2 4( 1)exp( 2.3199 0.0011 )
2( 1)
( (1 ) 1) ( 1)
m p
mix
m p
d R RR
d
R d R d
=
0.9528
Mori–
Tanaka
Model
10 /
1 (1 )( ) / 3
exp( 0.5477 0.0003 )
mix m
p m p m m
R R
R R R R R
0.9665
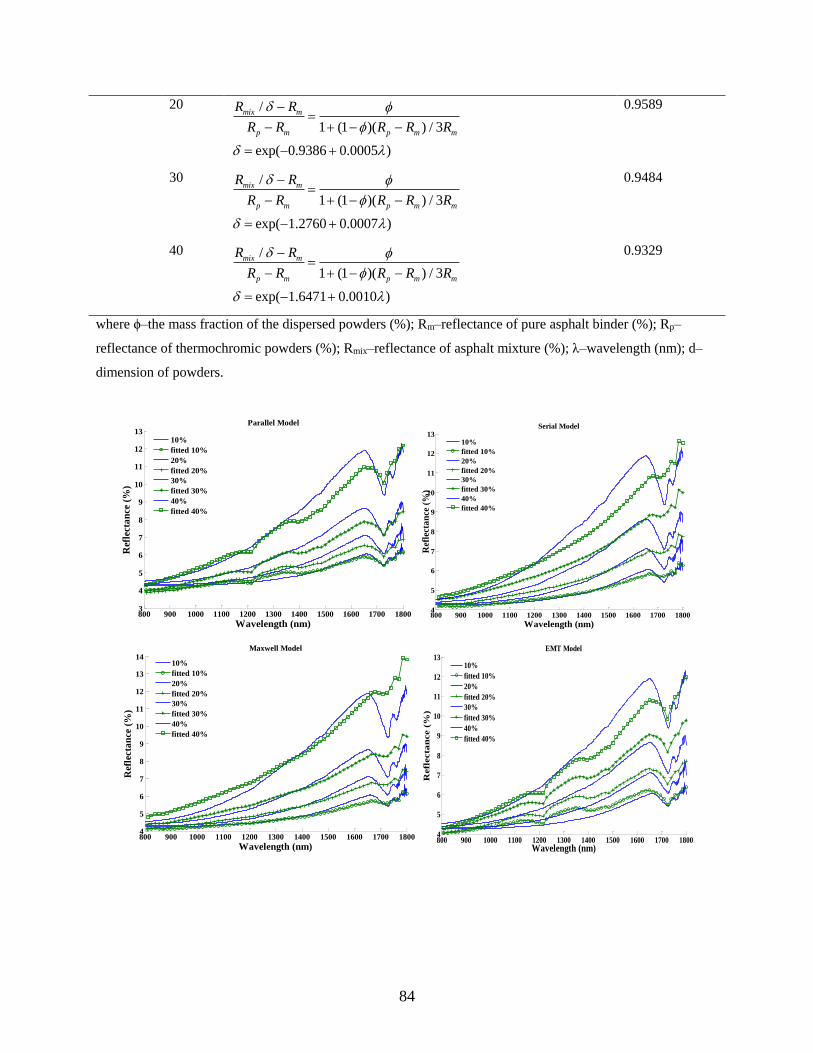
84
20 /
1 (1 )( ) / 3
exp( 0.9386 0.0005 )
mix m
p m p m m
R R
R R R R R
0.9589
30 /
1 (1 )( ) / 3
exp( 1.2760 0.0007 )
mix m
p m p m m
R R
R R R R R
0.9484
40 /
1 (1 )( ) / 3
exp( 1.6471 0.0010 )
mix m
p m p m m
R R
R R R R R
0.9329
where ϕ–the mass fraction of the dispersed powders (%); Rm–reflectance of pure asphalt binder (%); Rp–
reflectance of thermochromic powders (%); Rmix–reflectance of asphalt mixture (%); λ–wavelength (nm); d–
dimension of powders.
800 900 1000 1100 1200 1300 1400 1500 1600 1700 18003
4
5
6
7
8
9
10
11
12
13
Wavelength (nm)
Ref
lect
an
ce (
%)
Parallel Model
10%
fitted 10%
20%
fitted 20%
30%
fitted 30%
40%
fitted 40%
800 900 1000 1100 1200 1300 1400 1500 1600 1700 18004
5
6
7
8
9
10
11
12
13
Wavelength (nm)
Ref
lect
an
ce (
%)
Serial Model
10%
fitted 10%
20%
fitted 20%
30%
fitted 30%
40%
fitted 40%
800 900 1000 1100 1200 1300 1400 1500 1600 1700 18004
5
6
7
8
9
10
11
12
13
14
Wavelength (nm)
Ref
lect
an
ce (
%)
Maxwell Model
10%
fitted 10%
20%
fitted 20%
30%
fitted 30%
40%
fitted 40%
800 900 1000 1100 1200 1300 1400 1500 1600 1700 18004
5
6
7
8
9
10
11
12
13
Wavelength (nm)
Refl
ecta
nce (
%)
EMT Model
10%
fitted 10%
20%
fitted 20%
30%
fitted 30%
40%
fitted 40%
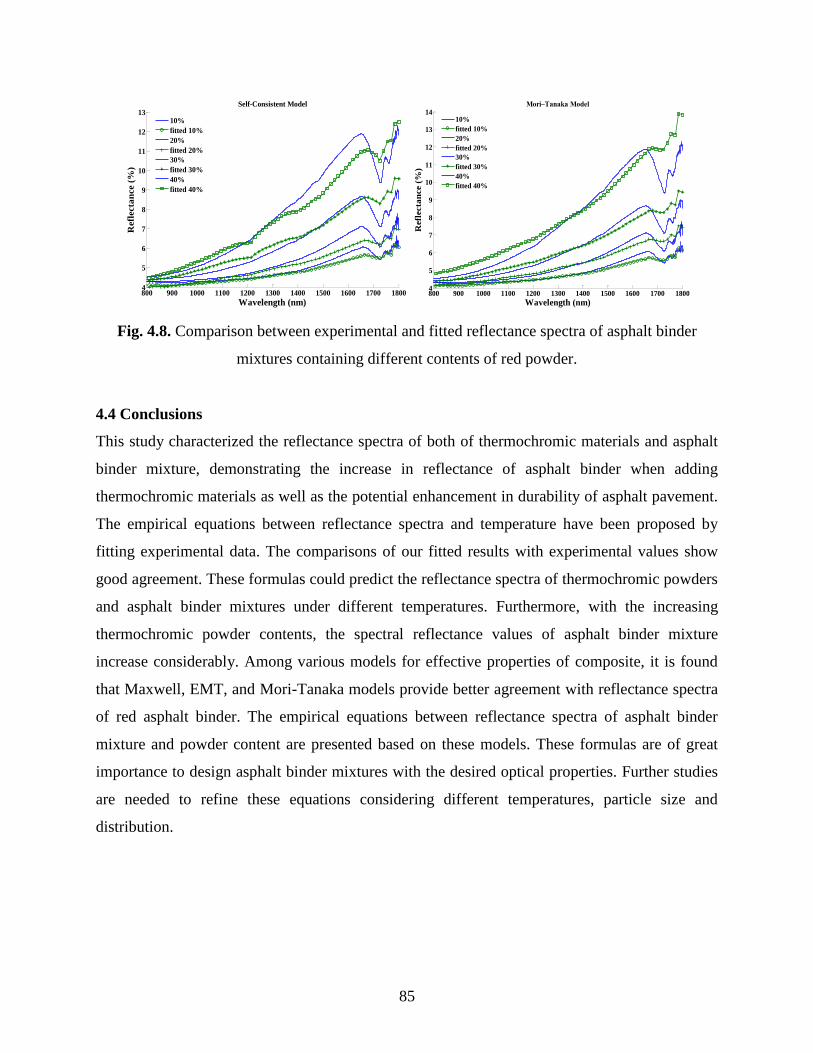
85
800 900 1000 1100 1200 1300 1400 1500 1600 1700 18004
5
6
7
8
9
10
11
12
13
Wavelength (nm)
Refl
ecta
nce (
%)
Self-Consistent Model
10%
fitted 10%
20%
fitted 20%
30%
fitted 30%
40%
fitted 40%
800 900 1000 1100 1200 1300 1400 1500 1600 1700 18004
5
6
7
8
9
10
11
12
13
14
Wavelength (nm)
Refl
ecta
nce (
%)
Mori–Tanaka Model
10%
fitted 10%
20%
fitted 20%
30%
fitted 30%
40%
fitted 40%
Fig. 4.8. Comparison between experimental and fitted reflectance spectra of asphalt binder
mixtures containing different contents of red powder.
4.4 Conclusions
This study characterized the reflectance spectra of both of thermochromic materials and asphalt
binder mixture, demonstrating the increase in reflectance of asphalt binder when adding
thermochromic materials as well as the potential enhancement in durability of asphalt pavement.
The empirical equations between reflectance spectra and temperature have been proposed by
fitting experimental data. The comparisons of our fitted results with experimental values show
good agreement. These formulas could predict the reflectance spectra of thermochromic powders
and asphalt binder mixtures under different temperatures. Furthermore, with the increasing
thermochromic powder contents, the spectral reflectance values of asphalt binder mixture
increase considerably. Among various models for effective properties of composite, it is found
that Maxwell, EMT, and Mori-Tanaka models provide better agreement with reflectance spectra
of red asphalt binder. The empirical equations between reflectance spectra of asphalt binder
mixture and powder content are presented based on these models. These formulas are of great
importance to design asphalt binder mixtures with the desired optical properties. Further studies
are needed to refine these equations considering different temperatures, particle size and
distribution.
86
4.5 References
(1) Santamouris, M., Pavlou, K., Synnefa, A., Niachou, K., Kolokotsa, D. Recent progress on
passive cooling techniques: Advanced technological developments to improve survivability
levels in low-income households. Energy and Buildings, 2007, 39(7): 859-866.
(2) Synnefa, A., Dandou, A., Santamouris, M., Tombrou, M., Soulakellis, N. Large scale albedo
changes using cool materials to mitigate heat island in Athens. Journal of Applied
Meteorology and Climatology, 2008, 47(11): 2846-2856.
(3) Doulos, L., Santamouris, M., Livada, I. Passive cooling of outdoor urban spaces. The role of
materials. Solar Energy, 2004, 77(2): 231-249.
(4) Yoder, E. J. and Witzak, M. W. Principles of Pavement Design. New York, NY: Wiley and
Sons, 1975.
(5) Pomerantz, M. and Akbari. H. Cooler Paving Materials for Heat Island Mitigation. In 1998
ACEEE Summer Study on Energy Efficiency in Buildings, Asilomar, CA, City: American
Council for an Energy-Efficient Economy, 1998.
(6) Pomerantz, M., Akbari, H. Cooler paving materials for heat island mitigation, in:
Proceedings of the 1998 ACEEE Summer Study on Energy Efficiency in Buildings, vol. 9,
Pacific Grove, CA, 1998, p. 135.
(7) Pomerantz, M., Akbari, H., Chen, A., Taha, H., Rosenfeld, A. Paving Materials for Heat
Island Mitigation, Lawrence Berkeley National Laboratory Report LBL- 38074, Berkeley,
CA, 1997.
(8) Pomerantz, M., Akbari, H., Harvey, J. T. 2000. Cooler reflective pavements give benefits
beyond energy savings: Durability and illumination. Rep. No. LBNL-45370, Berkeley, CA,
14 pp.
(9) Kinouchi, T., Yoshinaka, T., Fukae, N., Kanda, M., 2004. Development of cool pavement
with dark colored high albedo coating. Fifth Conference for the Urban Environment,
Vancouver, Canada.
(10) Hao, P.W., Zhang, D.L., Hu, X.N., 2000. Evaluation method for low temperature
anticracking performance of asphalt mixture. Journal of Xi'an Highway University 20 (3),
1–5.
87
(11) Kanerva, H.K., VINSON, T.S., Zeng, H., 1994. Low Temperature Cracking Field
Validation of the Thermal Stress Rest Rained Specimen Test. R. SHRP-A-401.
(12) Santamouris, M., Synnefa, A., Kolokotsa, D., Dimitriou, V., Apostolakis, K. Passive
cooling of the built environment - use of innovative reflective materials to fight heat island
and decrease cooling needs. International Journal Low Carbon Technologies, 2008, 3(2):
71-82.
(13) Karlessi, T., Santamouris, M., Apostolakis, K., Synnefa, A., Livada, I. Development and
testing of thermochromic coatings for buildings and urban structures. Solar Energy, 2009,
83(4): 538-551.
(14) Granqvist, C.G. Materials Science for Solar Energy Conversion Systems. Pergamon press,
Oxford, 1991.
(15) Saeli, M., Piccirillo, C., Parkin, I. P., Binions, R., Ridley, I. Energy modelling studies of
thermochromic glazing. Energy and Buildings, 2010, 42(10): 1666-1673.
(16) Ma, Y. P. and Zhu, B.R. Research on the preparation of reversibly thermochromic cement
based materials at normal temperature. Cement and Concrete Research, 2009, 39(2): 90-94.
(17) ASTM E903-12. Standard test method for solar absorptance, reflectance, and transmittance
of materials using integrating spheres. Book of Standards, Volume: 12.02, American
Society for Testing and Materials, 2012.
(18) Bottcher, C. J. F. Theory of Electric Polarization. Elsevier, New York, 1952.
(19) Zimmerman, R.W. Thermal conductivity of fluid-saturated rocks. Journal of Petroleum
Science and Engineering 3, 1989, 3(3): 219–227.
(20) Maxwell, J. C. A treatise on Electricity and Magnetism. Oxford University Press,
Cambridge, UK, 1904.
(21) Landauer, R. Electrical Transport and Optical Properties of Inhomogeneous Media. Journal
of Applied Physics, 1952, 23: 779–784.
(22) Davis, H.T., Valencourt, L.R., Johnson, C.E. Transport processes in composite media.
Journal of the American Ceramic Society, 1975, 58 (9–10): 446–452.
(23) Hashin, Z. Assessment of the self-consistent scheme approximation: conductivity of
particulate composites. Journal of Composite Materials, 1968, 2 (3): 284–300.
(24) Mori, T., Tanaka, K. Average stress in matrix and average elastic energy of materials with
misfitting inclusions. Acta Materialia, 1973, 21 (5): 571-574.
88
CHAPTER FIVE
CHARACTERIZATION OF THE MECHANICAL PROPERTIES OF THERMOCHROMIC
ASPHALT BINDERS
This study investigated the effects of thermochromic materials on the mechanical performance of
the asphalt binder. The thermochromic asphalts are characterized using Superpave binder
performance tests. Typical testing methods have been conducted on the asphalt binders at three
stages: unaged, rolling thin film oven (RTFO) residues, and RTFO + pressure aging vessel
residuals. Experimental results indicated that the penetration, phase angle and creep rate of
asphalt binder was decreased, while the softening point, viscosity, complex modulus, rutting
parameter, fatigue parameter and stiffness of asphalt binder was increased when thermochromic
powder was added to conventional asphalt binder. Furthermore, increasing the content of
thermochromic powder leads to reduction in the penetration depth and creep rate, and increase of
softening point, viscosity, complex shear modulus, rutting parameter, fatigue parameter and
stiffness. Additionally, the high temperature performance grades of asphalt binder were
enhanced with blending 3–6% black, 6% blue and red themochromic powders. These effects
were achieved without considering the benefits of thermochromic asphalt in achieving
modulating the surface temperature (i.e., a lower surface temperature during summer and higher
surface temperature during winter). Therefore, the incorporation of thermochromic materials
into asphalt pavement will potentially improve its performance and durability, especially in hot
regions.
5.1 Introduction
Conventional asphalt binder, which consists of residuals from crude oil distillation processes, has
been used widely in highway pavement and city roads. However, the black color of asphalt
binder causes large solar absorption that leads to high surface temperature of asphalt pavement.
Studies (Santamouris et al. 2007, Synnefa et al. 2008, Doulous et al. 2004) reported the surface
temperature of asphalt pavement as high as 48–67 °C during summer. The increased temperature
in summer impacts durability of asphalt pavement by accelerating various distress mechanisms

89
(i.e., rutting, shoving, aging, fatigue damage, bleeding) (Yoder and Witzak 1975) as well as
causes undesirable environmental issues (i.e., heat island effects, volatile gas emission, etc.) (Gui
et al. 2007). A potential way to improve the durability is to use materials with high reflectivity
and emissivity to solar radiation. This has led to the development of various cool pavement
technologies. Studies (Pomerantz and Akbari 1998, Pomerantz et al. 1997, Pomerantz et al.
2000, Kinouchi et al. 2004) show that cool pavement features low surface temperatures, which
increases the service life (durability) of pavements. However, the reduced temperature of asphalt
pavement exacerbates the distress of low-temperature cracking during the winter period (Hao et
al. 2000, Kanerva et al. 1994), which compromises the service life of road in cold climate.
Besides, the lower surface temperature is conductive to ice formation in cold weather, which is a
major safety concern. So it is highly desirable to develop new pavement materials and
technology to make asphalt pavement cooler during summer and warmer during winter.
An innovative strategy our study pursued is to use thermochromic materials to create new
asphalt binders with desirable solar reflectance, i.e., they reflect more solar energy at high
temperature and reflect less solar energy at low temperature. To avoid any visual impact on road
users, we hope to restrain such effects in the infrared range only. Thermochromic materials,
materials changing their colors with temperature, are promising to achieve such functionality as
they possess required optical and thermal properties. Materials incorporated with proper
thermochromic materials feature high solar reflectance in summer and high solar absorption in
winter. The change of their optical and thermal properties in such a dynamic way can lead to
applications that improve the urban microclimate, decrease the energy demands of the buildings,
and provide a thermally comfortable indoor environment (Santamouris et al. 2008, Karlessi et al.
2009, Granqvist 1991, Saeli et al. 2010, Ma and Zhu 2009, Kinouchi and Santamouris 2013).
In our study, innovative asphalt binder containing thermochromic materials is designed to
modulate the temperature of asphalt pavement. The preliminary thermal performance evaluation
indicated that the use of thermochromic asphalt binder could reduce the surface temperature of
asphalt concrete up to 6.6°C during a typical summer day in Cleveland, Ohio, USA (Hu and Yu
2013). This paper describes the experimental characterization on the effects of thermochromic
materials on the optical and mechanical properties of asphalt binder. The optical properties are
characterized by spectrophotometry measurements. The mechanical properties are evaluated
using complete sets of Superpave binder characterization tests, including needle penetration,
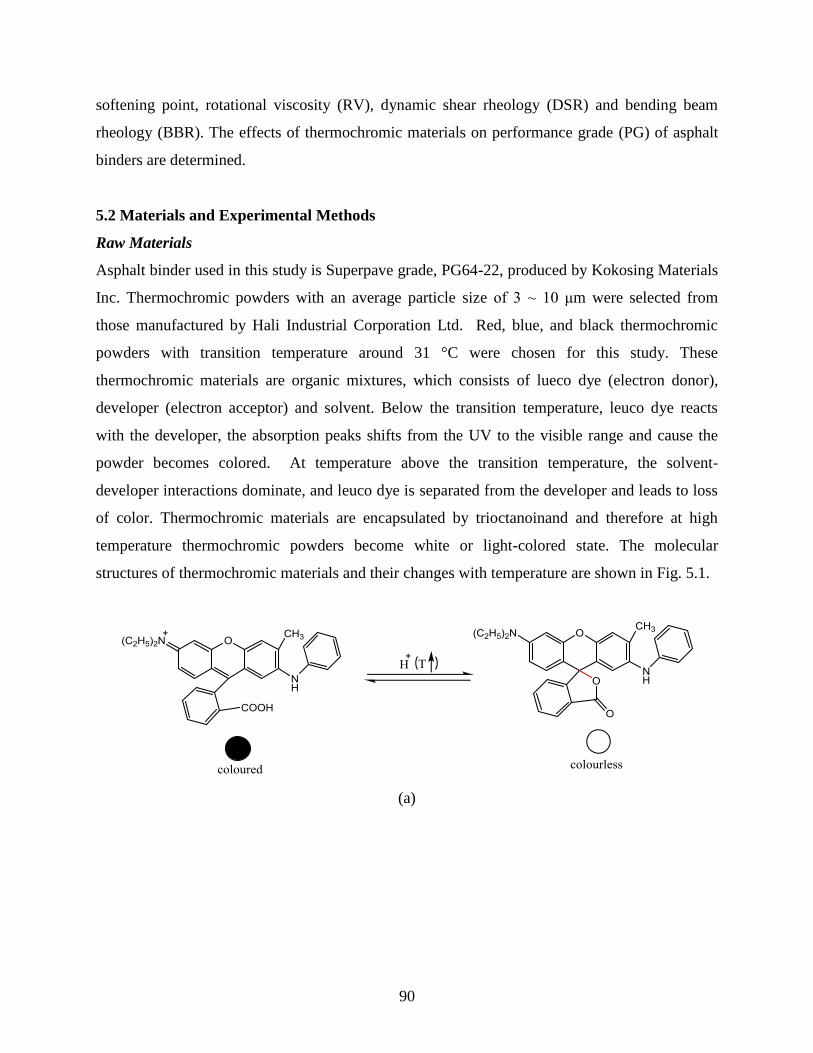
90
softening point, rotational viscosity (RV), dynamic shear rheology (DSR) and bending beam
rheology (BBR). The effects of thermochromic materials on performance grade (PG) of asphalt
binders are determined.
5.2 Materials and Experimental Methods
Raw Materials
Asphalt binder used in this study is Superpave grade, PG64-22, produced by Kokosing Materials
Inc. Thermochromic powders with an average particle size of 3 ~ 10 μm were selected from
those manufactured by Hali Industrial Corporation Ltd. Red, blue, and black thermochromic
powders with transition temperature around 31 °C were chosen for this study. These
thermochromic materials are organic mixtures, which consists of lueco dye (electron donor),
developer (electron acceptor) and solvent. Below the transition temperature, leuco dye reacts
with the developer, the absorption peaks shifts from the UV to the visible range and cause the
powder becomes colored. At temperature above the transition temperature, the solvent-
developer interactions dominate, and leuco dye is separated from the developer and leads to loss
of color. Thermochromic materials are encapsulated by trioctanoinand and therefore at high
temperature thermochromic powders become white or light-colored state. The molecular
structures of thermochromic materials and their changes with temperature are shown in Fig. 5.1.
(a)

91
(b)
(c)
Fig. 5.1. Molecular structures of thermochromic powders and their changes with temperature: a)
black powder; b) blue powder; c) red powder.
Preparation of Thermochromic Asphalt Binders
Thermochromic asphalt binders are prepared by the following procedures: the original asphalt
binder was heated to 163 °C in an oven until it completely melted, then thermochromic powders
were added. The amount of thermochromic powders by total weight of asphalt binder are 3%,
6% and 10%, respectively. The mixture was mixed using a mixer for 10 minutes and then put
them into the oven for 1 hour to ensure the blend became homogenous. The asphalt binders
containing black, blue and red thermochromic powders were named as black, blue and red
asphalt binder, respectively in this paper for simplicity in the nomenclature.
In principle, with the characteristics of thermochromic materials, thermochromic asphalt
binder should exhibit a different response to solar radiation than conventional asphalt binder.
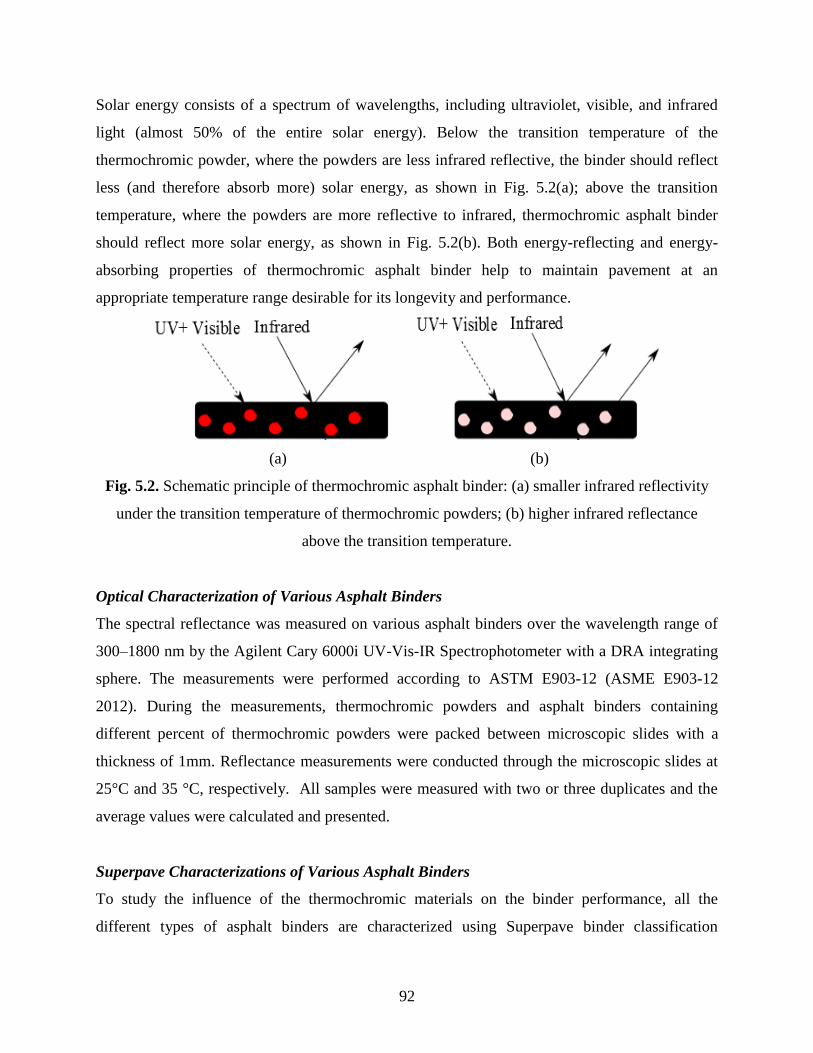
92
Solar energy consists of a spectrum of wavelengths, including ultraviolet, visible, and infrared
light (almost 50% of the entire solar energy). Below the transition temperature of the
thermochromic powder, where the powders are less infrared reflective, the binder should reflect
less (and therefore absorb more) solar energy, as shown in Fig. 5.2(a); above the transition
temperature, where the powders are more reflective to infrared, thermochromic asphalt binder
should reflect more solar energy, as shown in Fig. 5.2(b). Both energy-reflecting and energy-
absorbing properties of thermochromic asphalt binder help to maintain pavement at an
appropriate temperature range desirable for its longevity and performance.
(a) (b)
Fig. 5.2. Schematic principle of thermochromic asphalt binder: (a) smaller infrared reflectivity
under the transition temperature of thermochromic powders; (b) higher infrared reflectance
above the transition temperature.
Optical Characterization of Various Asphalt Binders
The spectral reflectance was measured on various asphalt binders over the wavelength range of
300–1800 nm by the Agilent Cary 6000i UV-Vis-IR Spectrophotometer with a DRA integrating
sphere. The measurements were performed according to ASTM E903-12 (ASME E903-12
2012). During the measurements, thermochromic powders and asphalt binders containing
different percent of thermochromic powders were packed between microscopic slides with a
thickness of 1mm. Reflectance measurements were conducted through the microscopic slides at
25°C and 35 °C, respectively. All samples were measured with two or three duplicates and the
average values were calculated and presented.
Superpave Characterizations of Various Asphalt Binders
To study the influence of the thermochromic materials on the binder performance, all the
different types of asphalt binders are characterized using Superpave binder classification
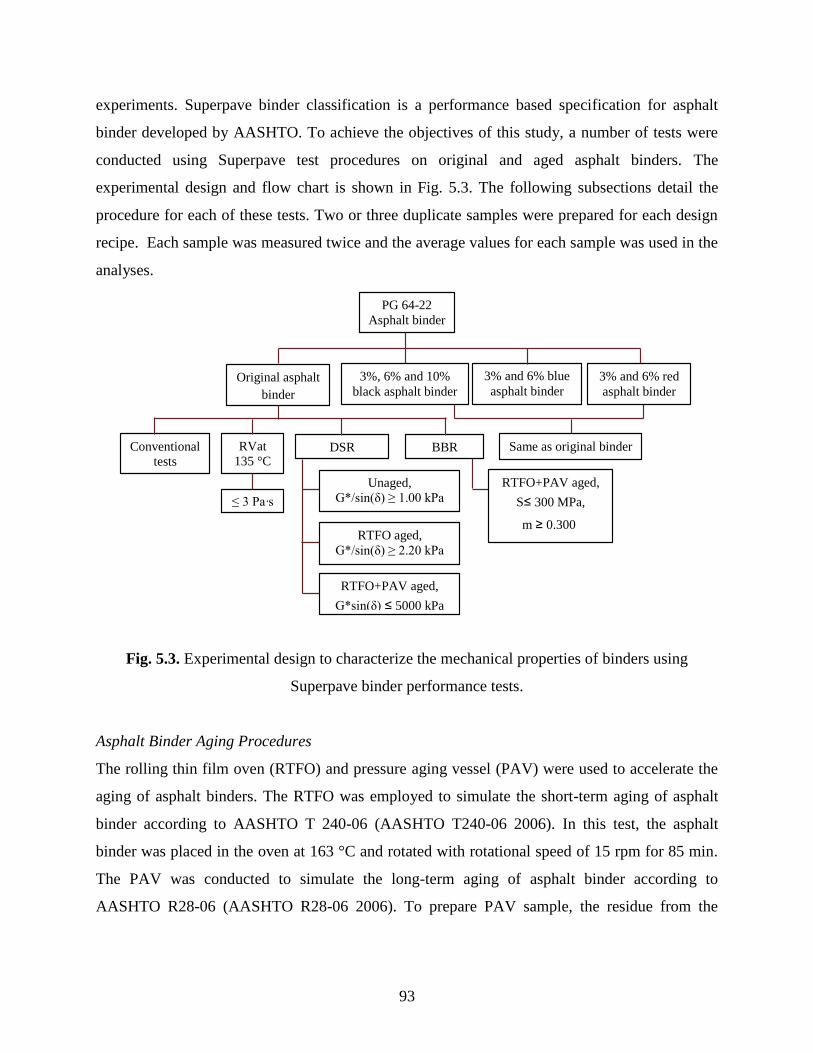
93
experiments. Superpave binder classification is a performance based specification for asphalt
binder developed by AASHTO. To achieve the objectives of this study, a number of tests were
conducted using Superpave test procedures on original and aged asphalt binders. The
experimental design and flow chart is shown in Fig. 5.3. The following subsections detail the
procedure for each of these tests. Two or three duplicate samples were prepared for each design
recipe. Each sample was measured twice and the average values for each sample was used in the
analyses.
PG 64-22
Asphalt binder
Original asphalt
binder
3%, 6% and 10%
black asphalt binder
3% and 6% blue
asphalt binder
3% and 6% red
asphalt binder
Conventional
tests RVat
135 °C DSR BBR
≤ 3 Pa·s
Unaged,
G*/sin(δ) ≥ 1.00 kPa
RTFO aged, G*/sin(δ) ≥ 2.20 kPa
RTFO+PAV aged,
G*sin(δ) ≤ 5000 kPa
RTFO+PAV aged,
S≤ 300 MPa,
m ≥ 0.300
Same as original binder
Fig. 5.3. Experimental design to characterize the mechanical properties of binders using
Superpave binder performance tests.
Asphalt Binder Aging Procedures
The rolling thin film oven (RTFO) and pressure aging vessel (PAV) were used to accelerate the
aging of asphalt binders. The RTFO was employed to simulate the short-term aging of asphalt
binder according to AASHTO T 240-06 (AASHTO T240-06 2006). In this test, the asphalt
binder was placed in the oven at 163 °C and rotated with rotational speed of 15 rpm for 85 min.
The PAV was conducted to simulate the long-term aging of asphalt binder according to
AASHTO R28-06 (AASHTO R28-06 2006). To prepare PAV sample, the residue from the
94
RTFO test was kept in the chamber with the set temperature of 100 °C and pressure of 300 psi
for 20 h.
Conventional Physical Properties Tests
The conventional physical properties of asphalt binders, including needle penetration at 25 °C
and softening point, were tested in accordance with AASHTO T 49 (AASHTO T 49-06 2006)
and AASHTO T 53 (AASHTO T53-06, 2006), respectively.
Rotational Viscosity (RV) Test
Rotation viscosity of asphalt binders were measured with the Brookfield viscometer in according
to AASHTO T 316 (AASHTO T 316-06 2006). The RV test was conducted on approximate 8 g
of asphalt binders under rotational speed of 20 rpm and the stabilized temperature of 135 °C.
Dynamic Shear Properties Test
Dynamic shear properties were measured with the dynamic shear rheometer according to
AASHTO T 315 (AASHTO T 315-06 2006). The DSR measures the complex shear modulus
(G*) and phase angle (δ), both used to evaluate performance of rutting-resistance and fatigue
cracking (Asphalt Institute 2003). Rheological tests were performance under controlled strain
conditions. There were three test samples using DSR: the unaged, RTFO aged, and PAV aged
asphalt binders. The unaged and RTFO aged asphalt binder samples with diameter of 25 mm
were tested at high temperature. The PAV aged asphalt binder samples with diameter of 8 mm
were tested at intermediate service temperatures. DSR testing was conducted at a frequency of
10 rad/s. The test stopped running until the measured result failed according to the specification.
Low-Temperature Cracking Properties Test
The bending beam rheometer (BBR) tested asphalt binders at low service temperatures to
determine the ability of the binder to relax stresses and resist low-temperature cracking (Freddy
et al. 2006). The BBR tests were conducted according to AASHTO T 313 (AASHTO T 313-06
2006). Since low temperature cracking occurs only after the pavement undergoes some time, this
standard evaluates the low-temperature creep properties using (RTFO+PAV) residues. The
asphalt binder beams (125 × 12.5 × 6.25 mm) were prepared in an aluminum mold. The beam
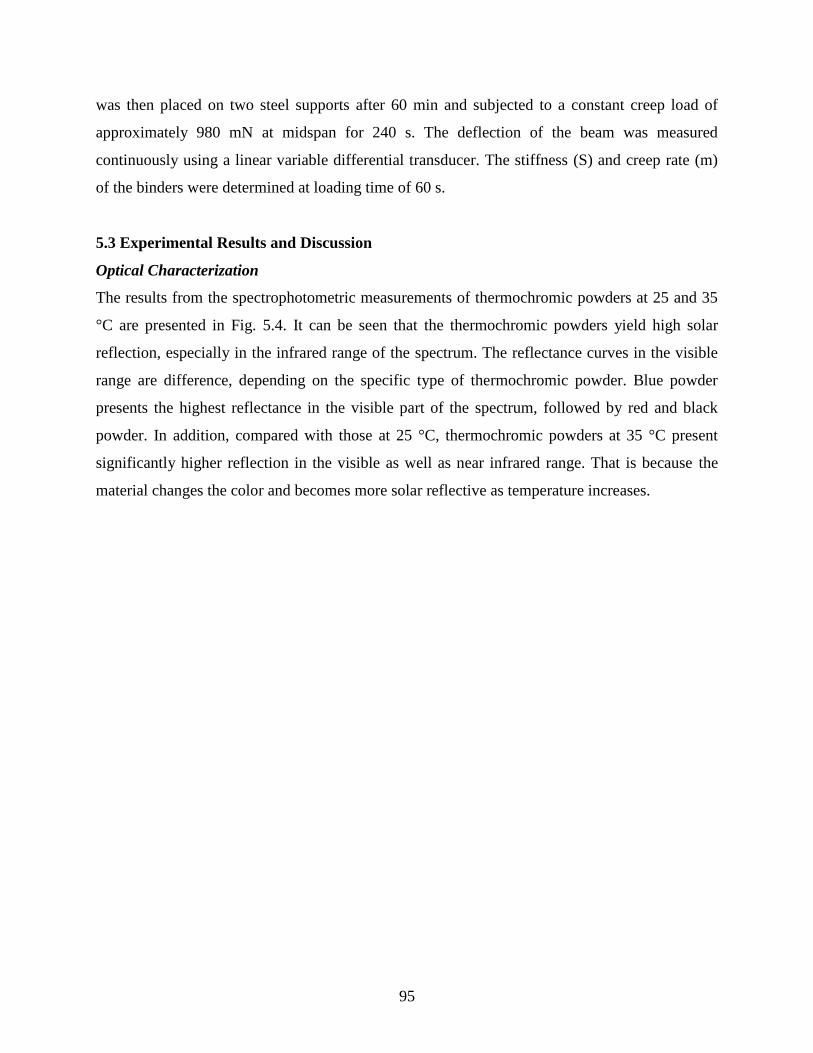
95
was then placed on two steel supports after 60 min and subjected to a constant creep load of
approximately 980 mN at midspan for 240 s. The deflection of the beam was measured
continuously using a linear variable differential transducer. The stiffness (S) and creep rate (m)
of the binders were determined at loading time of 60 s.
5.3 Experimental Results and Discussion
Optical Characterization
The results from the spectrophotometric measurements of thermochromic powders at 25 and 35
°C are presented in Fig. 5.4. It can be seen that the thermochromic powders yield high solar
reflection, especially in the infrared range of the spectrum. The reflectance curves in the visible
range are difference, depending on the specific type of thermochromic powder. Blue powder
presents the highest reflectance in the visible part of the spectrum, followed by red and black
powder. In addition, compared with those at 25 °C, thermochromic powders at 35 °C present
significantly higher reflection in the visible as well as near infrared range. That is because the
material changes the color and becomes more solar reflective as temperature increases.
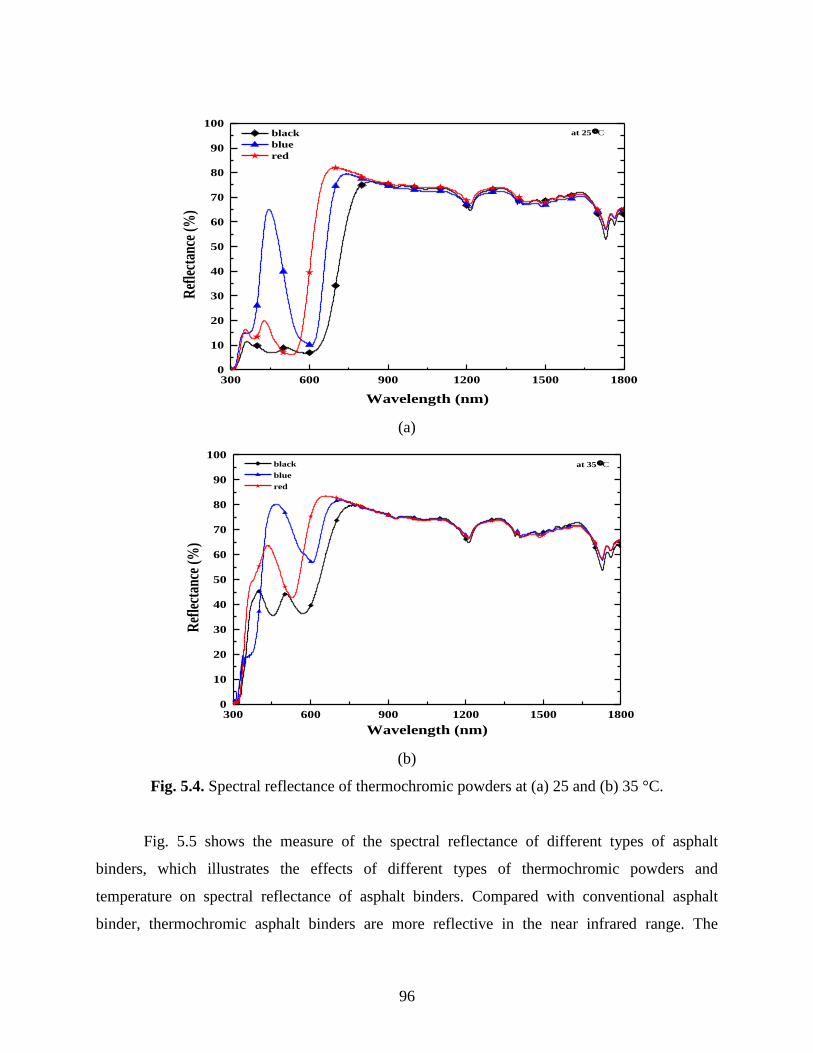
96
300 600 900 1200 1500 18000
10
20
30
40
50
60
70
80
90
100at 25 C
Ref
lect
ance
(%
)
Wavelength (nm)
black
blue
red
(a)
300 600 900 1200 1500 18000
10
20
30
40
50
60
70
80
90
100at 35 C
Ref
lect
ance
(%
)
Wavelength (nm)
black
blue
red
(b)
Fig. 5.4. Spectral reflectance of thermochromic powders at (a) 25 and (b) 35 °C.
Fig. 5.5 shows the measure of the spectral reflectance of different types of asphalt
binders, which illustrates the effects of different types of thermochromic powders and
temperature on spectral reflectance of asphalt binders. Compared with conventional asphalt
binder, thermochromic asphalt binders are more reflective in the near infrared range. The
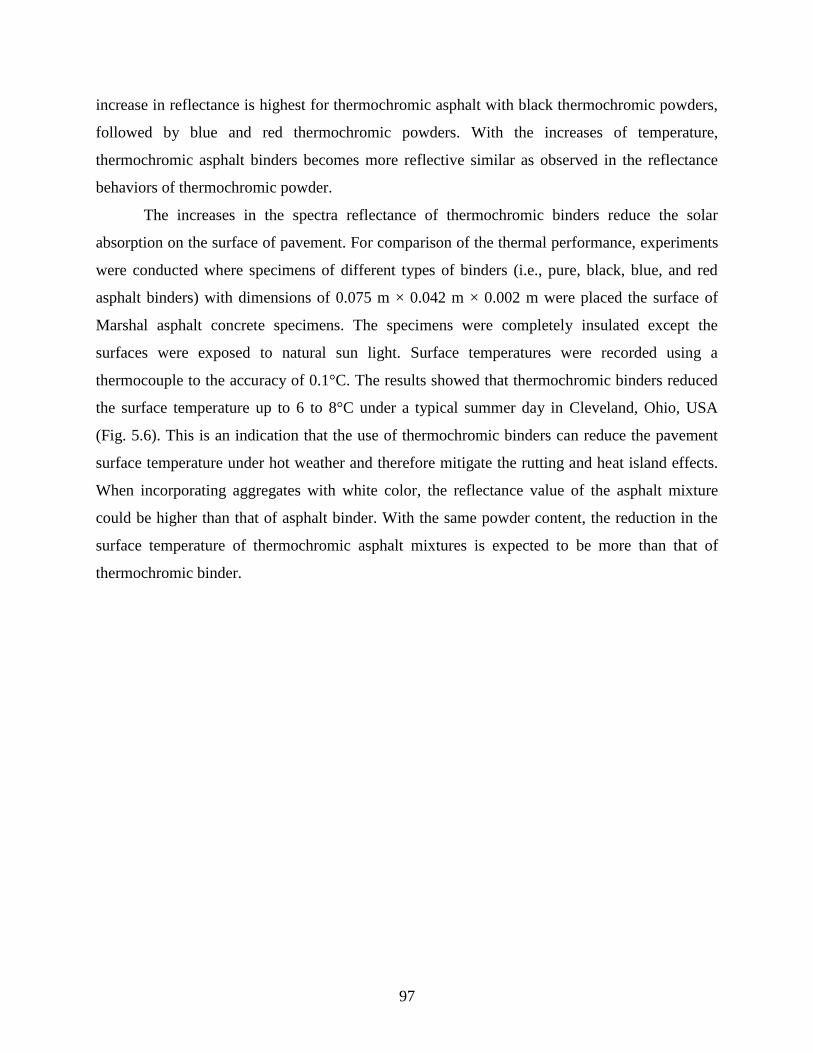
97
increase in reflectance is highest for thermochromic asphalt with black thermochromic powders,
followed by blue and red thermochromic powders. With the increases of temperature,
thermochromic asphalt binders becomes more reflective similar as observed in the reflectance
behaviors of thermochromic powder.
The increases in the spectra reflectance of thermochromic binders reduce the solar
absorption on the surface of pavement. For comparison of the thermal performance, experiments
were conducted where specimens of different types of binders (i.e., pure, black, blue, and red
asphalt binders) with dimensions of 0.075 m × 0.042 m × 0.002 m were placed the surface of
Marshal asphalt concrete specimens. The specimens were completely insulated except the
surfaces were exposed to natural sun light. Surface temperatures were recorded using a
thermocouple to the accuracy of 0.1°C. The results showed that thermochromic binders reduced
the surface temperature up to 6 to 8°C under a typical summer day in Cleveland, Ohio, USA
(Fig. 5.6). This is an indication that the use of thermochromic binders can reduce the pavement
surface temperature under hot weather and therefore mitigate the rutting and heat island effects.
When incorporating aggregates with white color, the reflectance value of the asphalt mixture
could be higher than that of asphalt binder. With the same powder content, the reduction in the
surface temperature of thermochromic asphalt mixtures is expected to be more than that of
thermochromic binder.
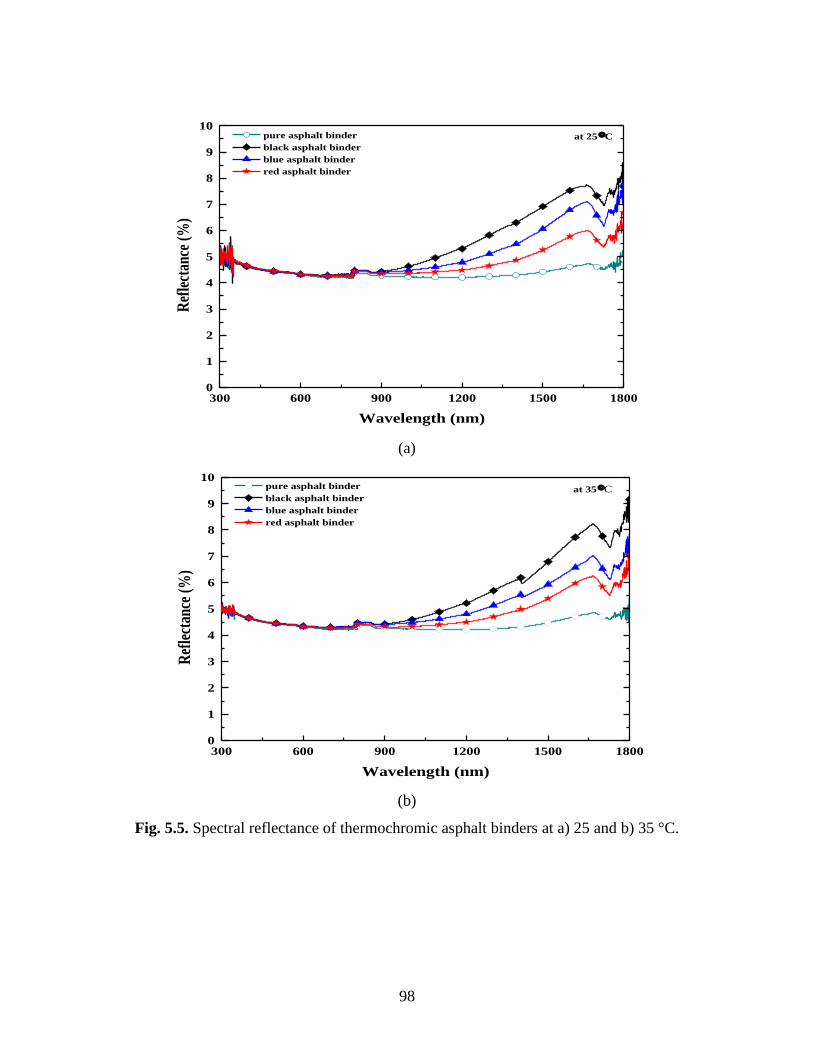
98
300 600 900 1200 1500 18000
1
2
3
4
5
6
7
8
9
10at 25 C
Ref
lect
ance
(%
)
Wavelength (nm)
pure asphalt binder
black asphalt binder
blue asphalt binder
red asphalt binder
(a)
300 600 900 1200 1500 18000
1
2
3
4
5
6
7
8
9
10at 35 C
Ref
lect
ance
(%
)
Wavelength (nm)
pure asphalt binder
black asphalt binder
blue asphalt binder
red asphalt binder
(b)
Fig. 5.5. Spectral reflectance of thermochromic asphalt binders at a) 25 and b) 35 °C.
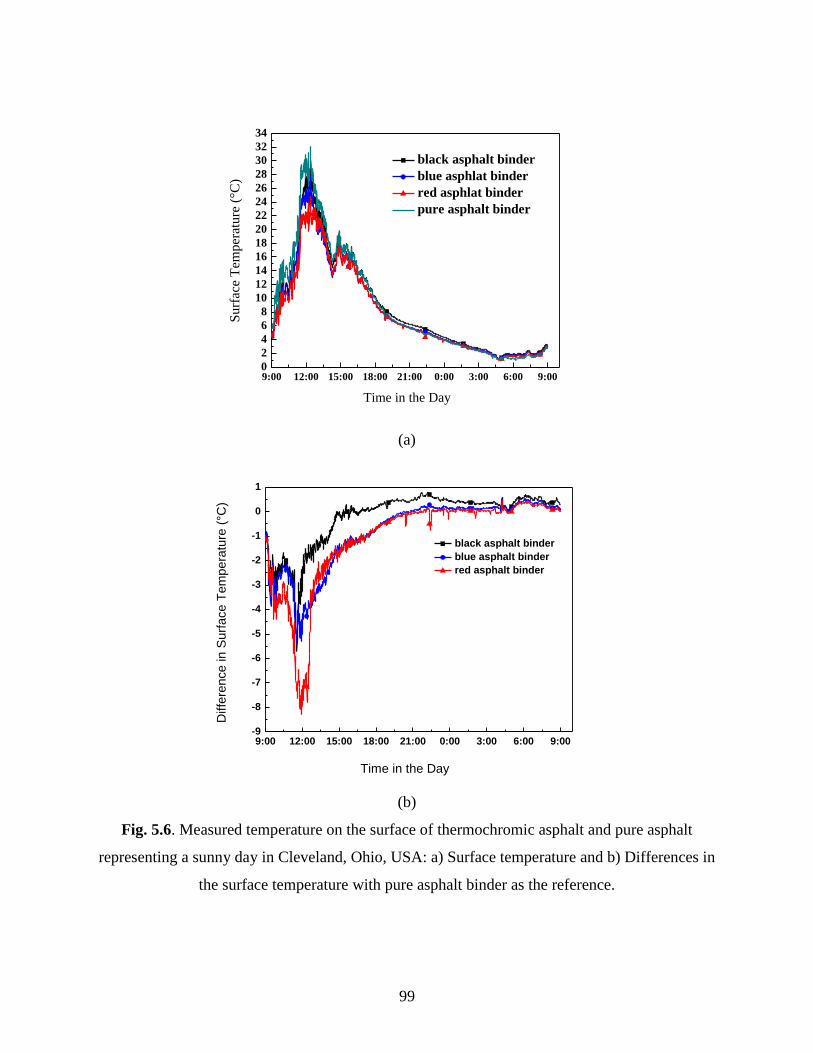
99
9:00 12:00 15:00 18:00 21:00 0:00 3:00 6:00 9:000
2
4
6
8
10
12
14
16
18
20
22
24
26
28
30
32
34
black asphalt binder
blue asphlat binder
red asphlat binder
pure asphalt binder
Su
rfac
e T
emp
erat
ure
(°C
)
Time in the Day
(a)
9:00 12:00 15:00 18:00 21:00 0:00 3:00 6:00 9:00-9
-8
-7
-6
-5
-4
-3
-2
-1
0
1
black asphalt binder
blue asphalt binder
red asphalt binder
Diffe
ren
ce
in
Su
rface
Tem
pera
ture
(°C
)
Time in the Day
(b)
Fig. 5.6. Measured temperature on the surface of thermochromic asphalt and pure asphalt
representing a sunny day in Cleveland, Ohio, USA: a) Surface temperature and b) Differences in
the surface temperature with pure asphalt binder as the reference.
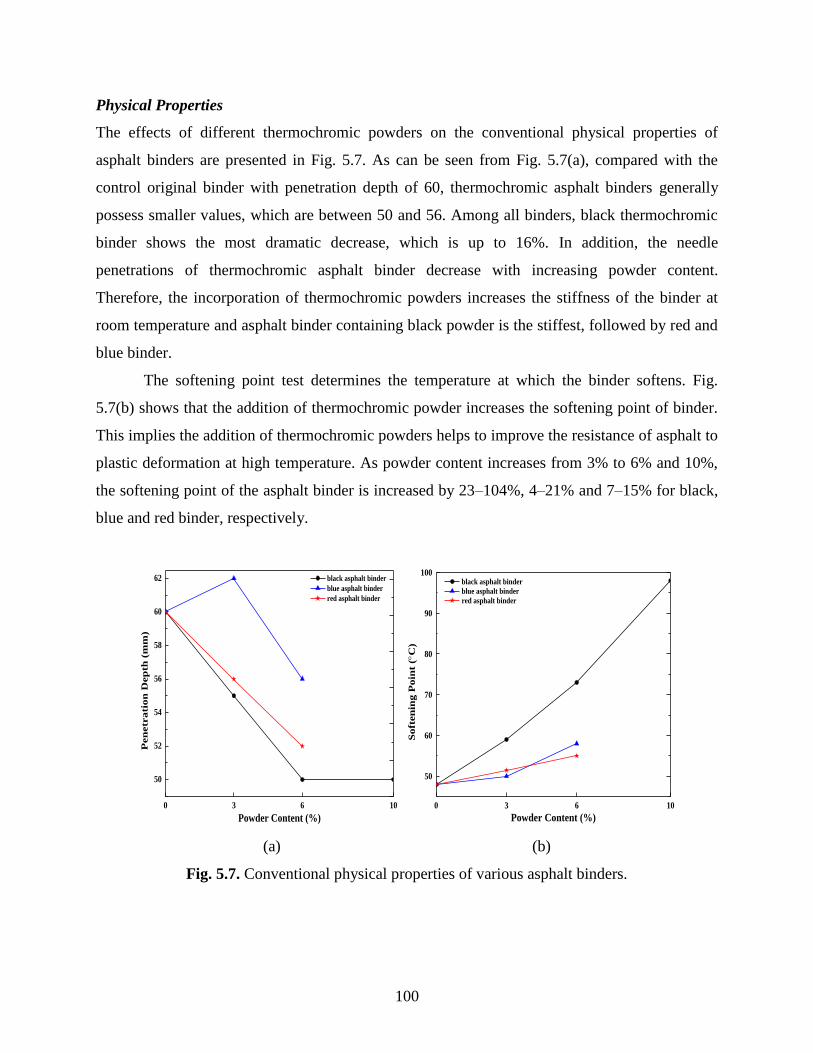
100
Physical Properties
The effects of different thermochromic powders on the conventional physical properties of
asphalt binders are presented in Fig. 5.7. As can be seen from Fig. 5.7(a), compared with the
control original binder with penetration depth of 60, thermochromic asphalt binders generally
possess smaller values, which are between 50 and 56. Among all binders, black thermochromic
binder shows the most dramatic decrease, which is up to 16%. In addition, the needle
penetrations of thermochromic asphalt binder decrease with increasing powder content.
Therefore, the incorporation of thermochromic powders increases the stiffness of the binder at
room temperature and asphalt binder containing black powder is the stiffest, followed by red and
blue binder.
The softening point test determines the temperature at which the binder softens. Fig.
5.7(b) shows that the addition of thermochromic powder increases the softening point of binder.
This implies the addition of thermochromic powders helps to improve the resistance of asphalt to
plastic deformation at high temperature. As powder content increases from 3% to 6% and 10%,
the softening point of the asphalt binder is increased by 23–104%, 4–21% and 7–15% for black,
blue and red binder, respectively.
0 3 6 10
50
52
54
56
58
60
62
Pen
etr
ati
on
Dep
th (
mm
)
Powder Content (%)
black asphalt binder
blue asphalt binder
red asphalt binder
0 3 6 10
50
60
70
80
90
100
Soft
en
ing P
oin
t (
C)
Powder Content (%)
black asphalt binder
blue asphalt binder
red asphalt binder
(a) (b)
Fig. 5.7. Conventional physical properties of various asphalt binders.

101
Rotational Viscosity (RV)
The effect of thermochromic powder type and content on the rotational viscosity of asphalt
binders at 135 °C is shown in Fig. 8. The results indicated that thermochromic binder containing
red thermochromic powder exhibits higher viscosity than original binder; while the binder with
blue and black powders however presents lower viscosity than the original asphalt binder. The
workability and pumping potential of black and blue binder is better than that of red binder. It is
also shown from Fig. 5.8 that with the increasing amount of powders, the viscosity of red and
black binder is increased but the viscosity of blue binder is reduced. When considering the
SuperpaveTM specification for asphalt binder viscosity under 3 Pa·s shown in Fig. 5.8, all binders
satisfy the performance specification.
0 3 6 10410
420
430
440
450
460
470
480
Vis
cosi
ty (
mP
as
)
Content of Powder (%)
black asphalt binder
blue asphalt binder
red asphalt binder
Fig. 5.8. RV test results for various asphalt binders.
Dynamic Shear Rheological (DSR) Properties
Effects of thermochromic powder type, content, and temperature on DSR parameters including
G*, δ and G*/sin δ, and G*sin δ are illustrated in Figs. 5.9–5.11. As seen in Figs. 5.9(a)–5.11(a),
for unaged and aged asphalt binders, the complex modulus G* decreases with temperature.
Besides, the addition of thermochromic powder increases G* compared with original asphalt
binder. The increasing extent of G* is different, and black powder has larger effect than blue and
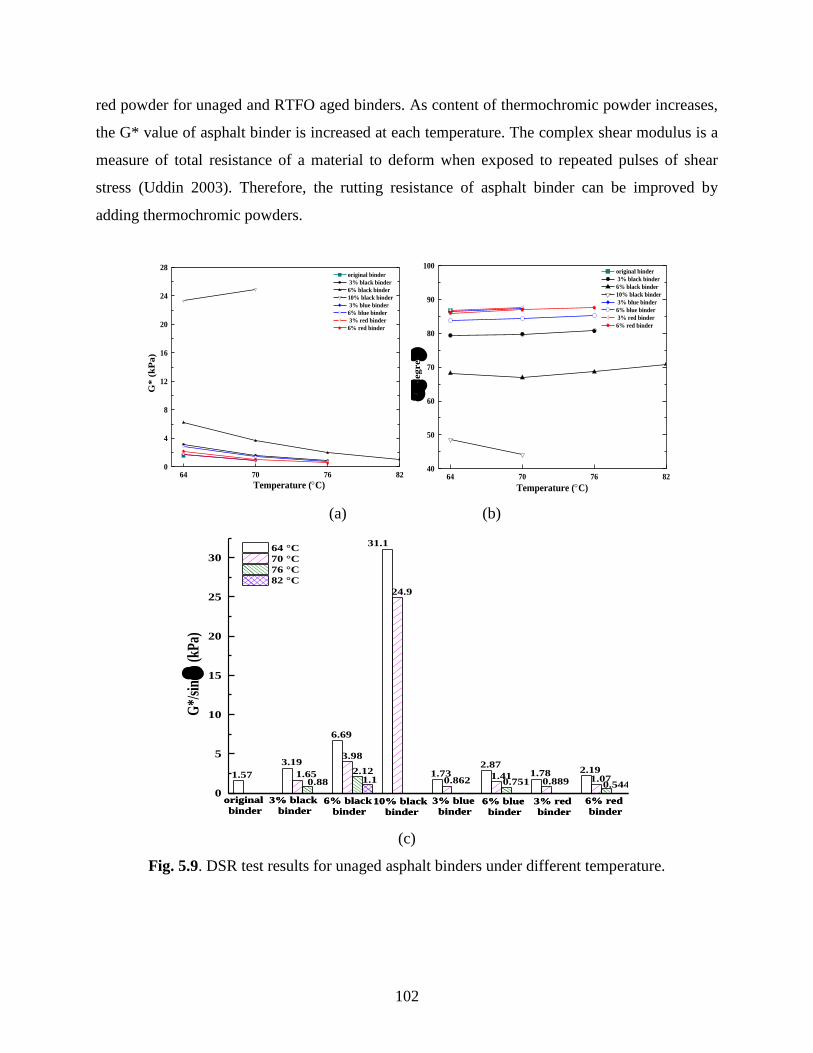
102
red powder for unaged and RTFO aged binders. As content of thermochromic powder increases,
the G* value of asphalt binder is increased at each temperature. The complex shear modulus is a
measure of total resistance of a material to deform when exposed to repeated pulses of shear
stress (Uddin 2003). Therefore, the rutting resistance of asphalt binder can be improved by
adding thermochromic powders.
64 70 76 820
4
8
12
16
20
24
28
G*
(k
Pa
)
Temperature (C)
original binder
3% black binder
6% black binder
10% black binder
3% blue binder
6% blue binder
3% red binder
6% red binder
64 70 76 82
40
50
60
70
80
90
100
degree
Temperature (C)
original binder
3% black binder
6% black binder
10% black binder
3% blue binder
6% blue binder
3% red binder
6% red binder
(a) (b)
1.57
3.19
6.69
31.1
1.732.87
1.78 2.191.65
3.98
24.9
0.8621.41
0.889 1.070.88
2.12
0.751 0.5441.1
0
5
10
15
20
25
30
G*/
sin()
(kP
a)
64 °C
70 °C
76 °C
82 °C
original
binder
3% black
binder6% black
binder
10% black
binder
3% blue
binder
6% blue
binder
3% red
binder
6% red
binder
original
binder
3% black
binder6% black
binder
10% black
binder
3% blue
binder
6% blue
binder
3% red
binder
6% red
binder
(c)
Fig. 5.9. DSR test results for unaged asphalt binders under different temperature.
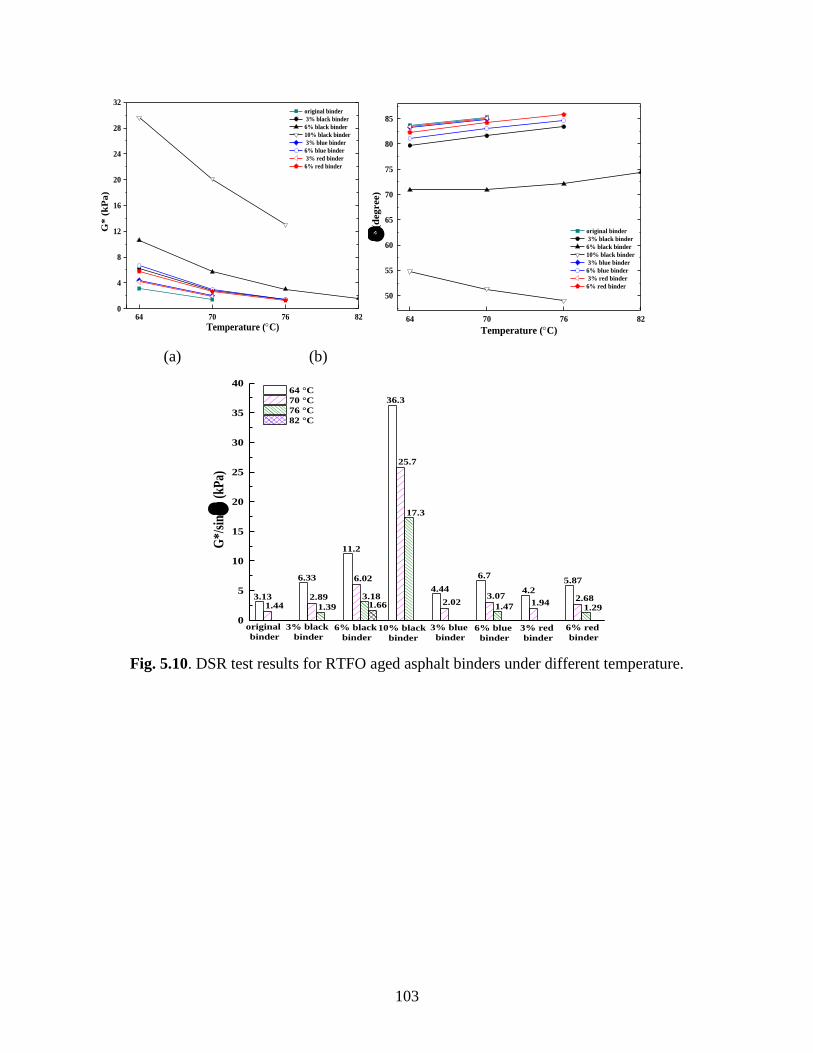
103
64 70 76 820
4
8
12
16
20
24
28
32G
* (
kP
a)
Temperature (C)
original binder
3% black binder
6% black binder
10% black binder
3% blue binder
6% blue binder
3% red binder
6% red binder
64 70 76 82
50
55
60
65
70
75
80
85
(
deg
ree)
Temperature (C)
original binder
3% black binder
6% black binder
10% black binder
3% blue binder
6% blue binder
3% red binder
6% red binder
(a) (b)
3.13
6.33
11.2
36.3
4.44
6.7
4.2
5.87
1.442.89
6.02
25.7
2.023.07
1.942.68
1.39
3.18
17.3
1.47 1.291.66
0
5
10
15
20
25
30
35
40
G*/
sin
()
(kP
a)
64 °C
70 °C
76 °C
82 °C
original
binder
3% black
binder6% black
binder
10% black
binder
3% blue
binder
6% blue
binder
3% red
binder
6% red
binder
Fig. 5.10. DSR test results for RTFO aged asphalt binders under different temperature.

104
6480
70307290
8030
7570 74707820
8740
47805030 4930
5160
5770
0
3000
6000
9000
6% red
binder
3% red
binder
6% blue
binder
3% blue
binder
10% black
binder
6% black
binder
original
binder
3% black
binder
G* (
kP
a)
25 °C
28 °C
44.5 4444.9 44.5 44.6
45.644.7 44.6
48.2 47.648.7
47.7 47.7
0
10
20
30
40
50
(
degree)
25 °C
28 °C
original
binder3% black
binder
6% black
binder
10% black
binder
3% blue
binder
6% blue
binder3% red
binder
6% red
binder
(a) (b)
4540
48805140
5630
5320 53405500
6140
35603720 3710 3810
4260
0
1000
2000
3000
4000
5000
6000
original
binder
G*s
in(
) (k
Pa)
25 °C
28 °C
3% black
binder6% black
binder
10% black
binder
3% blue
binder
6% blue
binder
3% red
binder
6% red
binder
(c)
Fig. 5.11. DSR test results for (RTFO+PAV) aged asphalt binders under different temperature.
As shown in Figs. 5.9(b)–5.11(b), there are small changes in the phase angle with
temperature. The small change of δ with temperature indicates a reduction in binder temperature
susceptibility and better thermal resistance (Navarro et al. 2009). The δ refers to the ratio
between elastic and viscous behaviors during the shearing process. Thermochromic asphalt
binder exhibits smaller δ than the control binder, indicating thermochromic asphalt binder shows
more elastic behavior than conventional binder. Additionally, with the increasing powder
content, the δ of all thermochromic asphalt binders decrease. So the addition of thermochromic
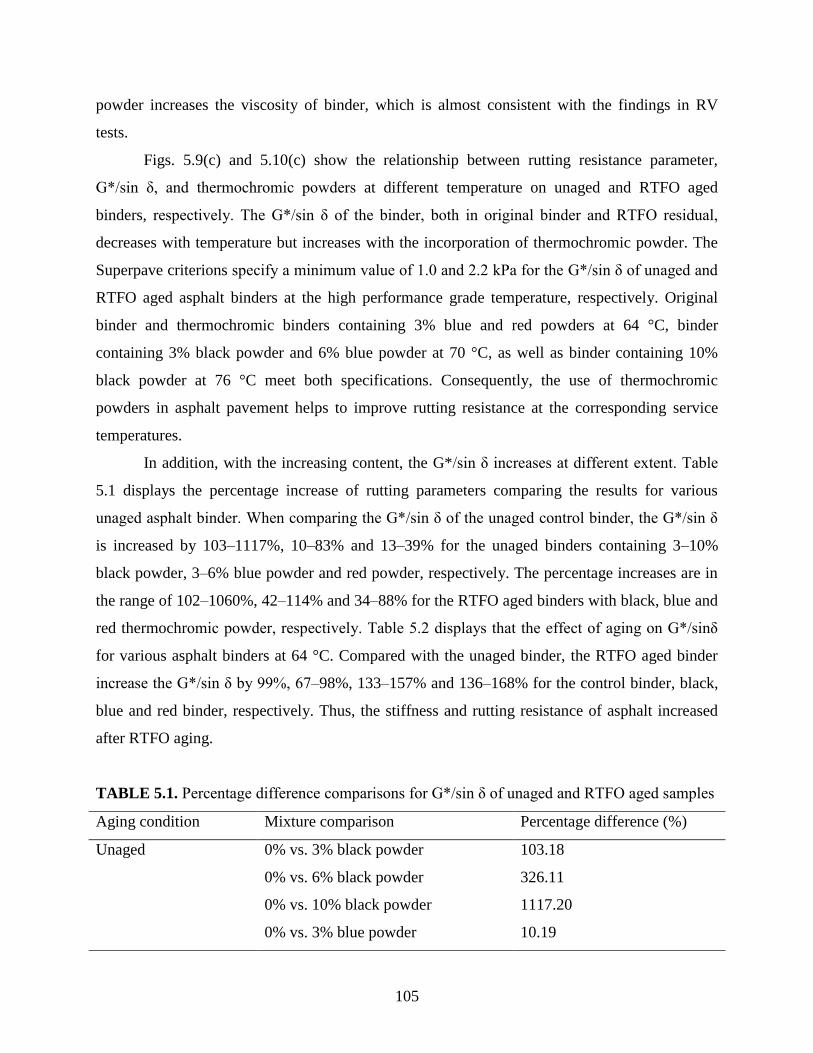
105
powder increases the viscosity of binder, which is almost consistent with the findings in RV
tests.
Figs. 5.9(c) and 5.10(c) show the relationship between rutting resistance parameter,
G*/sin δ, and thermochromic powders at different temperature on unaged and RTFO aged
binders, respectively. The G*/sin δ of the binder, both in original binder and RTFO residual,
decreases with temperature but increases with the incorporation of thermochromic powder. The
Superpave criterions specify a minimum value of 1.0 and 2.2 kPa for the G*/sin δ of unaged and
RTFO aged asphalt binders at the high performance grade temperature, respectively. Original
binder and thermochromic binders containing 3% blue and red powders at 64 °C, binder
containing 3% black powder and 6% blue powder at 70 °C, as well as binder containing 10%
black powder at 76 °C meet both specifications. Consequently, the use of thermochromic
powders in asphalt pavement helps to improve rutting resistance at the corresponding service
temperatures.
In addition, with the increasing content, the G*/sin δ increases at different extent. Table
5.1 displays the percentage increase of rutting parameters comparing the results for various
unaged asphalt binder. When comparing the G*/sin δ of the unaged control binder, the G*/sin δ
is increased by 103–1117%, 10–83% and 13–39% for the unaged binders containing 3–10%
black powder, 3–6% blue powder and red powder, respectively. The percentage increases are in
the range of 102–1060%, 42–114% and 34–88% for the RTFO aged binders with black, blue and
red thermochromic powder, respectively. Table 5.2 displays that the effect of aging on G*/sinδ
for various asphalt binders at 64 °C. Compared with the unaged binder, the RTFO aged binder
increase the G*/sin δ by 99%, 67–98%, 133–157% and 136–168% for the control binder, black,
blue and red binder, respectively. Thus, the stiffness and rutting resistance of asphalt increased
after RTFO aging.
TABLE 5.1. Percentage difference comparisons for G*/sin δ of unaged and RTFO aged samples
Aging condition Mixture comparison Percentage difference (%)
Unaged 0% vs. 3% black powder 103.18
0% vs. 6% black powder 326.11
0% vs. 10% black powder 1117.20
0% vs. 3% blue powder 10.19

106
0% vs. 6% blue powder 82.80
0% vs. 3% red powder 13.38
0% vs. 6% red powder 39.49
RTFO aged 0% vs. 3% black powder 102.24
0% vs. 6% black powder 257.83
0% vs. 10% black powder 1059.74
0% vs. 3% blue powder 41.85
0% vs. 6% blue powder 114.06
0% vs. 3% red powder 34.19
0% vs. 6% red powder 87.54
TABLE 5.2. Percentage difference comparisons for G*/sin δ between unaged and RTFO aged
samples at 64 °C
Samples Percent difference %
Original binder 99.36
3% black binder 98.43
6% black binder 67.41
10% black binder 89.95
3% blue binder 156.65
6% blue binder 133.45
3% red binder 135.96
6% red binder 168.04
Fig. 5.11(c) shows the effects of thermochromic powder type and content on the fatigue
parameter, G*sin δ, at 25 and 28 °C. The G*sin δ value of (RTFO+PAV) residual decreases with
temperature but increases with the content of thermochromic powder. According to the Super
pave binder specifications, the G*sin δ should be less than 5000 kPa. The results indicate that
original binder and the binder with 3% black powder at 25 °C, the binder with 6% black powder,
3% and 6% blue and red powder at 28 °C satisfy this requirement. This indicates that the low
temperature performance grade of binder needs be increased when adding 6% black powder, 3%
and 6% blue and red powder. As content increases, the G*sin δ value increases by different
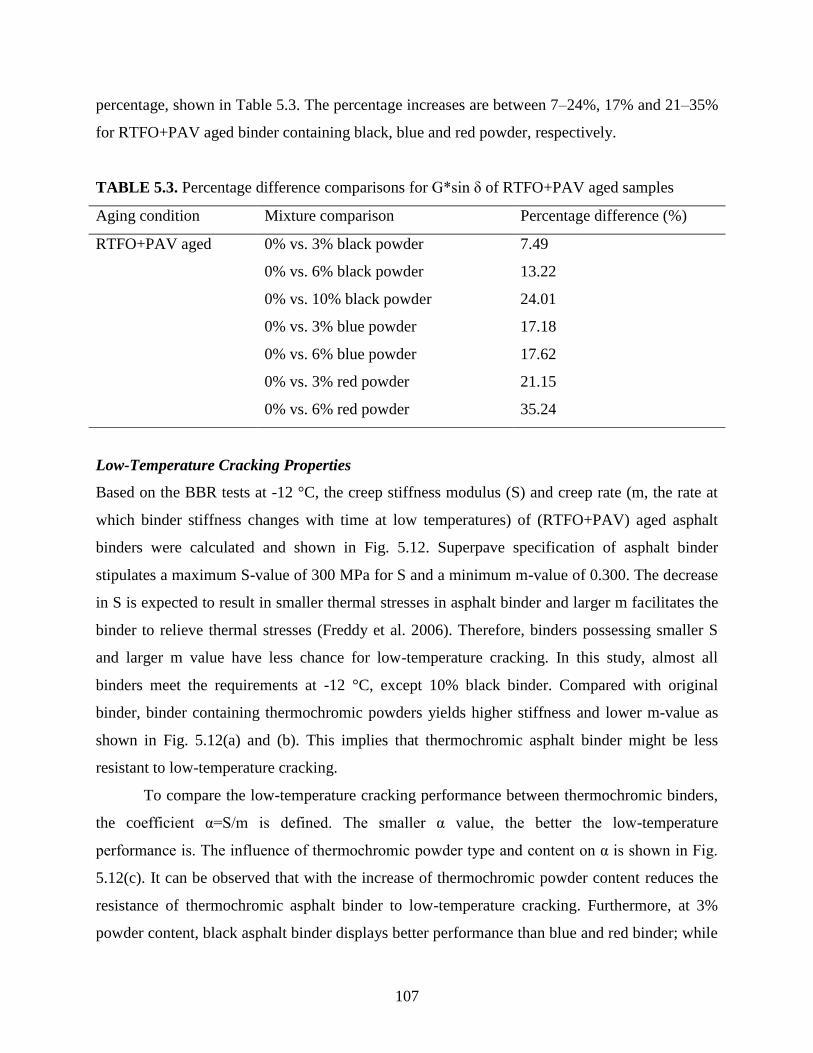
107
percentage, shown in Table 5.3. The percentage increases are between 7–24%, 17% and 21–35%
for RTFO+PAV aged binder containing black, blue and red powder, respectively.
TABLE 5.3. Percentage difference comparisons for G*sin δ of RTFO+PAV aged samples
Aging condition Mixture comparison Percentage difference (%)
RTFO+PAV aged 0% vs. 3% black powder 7.49
0% vs. 6% black powder 13.22
0% vs. 10% black powder 24.01
0% vs. 3% blue powder 17.18
0% vs. 6% blue powder 17.62
0% vs. 3% red powder 21.15
0% vs. 6% red powder 35.24
Low-Temperature Cracking Properties
Based on the BBR tests at -12 °C, the creep stiffness modulus (S) and creep rate (m, the rate at
which binder stiffness changes with time at low temperatures) of (RTFO+PAV) aged asphalt
binders were calculated and shown in Fig. 5.12. Superpave specification of asphalt binder
stipulates a maximum S-value of 300 MPa for S and a minimum m-value of 0.300. The decrease
in S is expected to result in smaller thermal stresses in asphalt binder and larger m facilitates the
binder to relieve thermal stresses (Freddy et al. 2006). Therefore, binders possessing smaller S
and larger m value have less chance for low-temperature cracking. In this study, almost all
binders meet the requirements at -12 °C, except 10% black binder. Compared with original
binder, binder containing thermochromic powders yields higher stiffness and lower m-value as
shown in Fig. 5.12(a) and (b). This implies that thermochromic asphalt binder might be less
resistant to low-temperature cracking.
To compare the low-temperature cracking performance between thermochromic binders,
the coefficient α=S/m is defined. The smaller α value, the better the low-temperature
performance is. The influence of thermochromic powder type and content on α is shown in Fig.
5.12(c). It can be observed that with the increase of thermochromic powder content reduces the
resistance of thermochromic asphalt binder to low-temperature cracking. Furthermore, at 3%
powder content, black asphalt binder displays better performance than blue and red binder; while
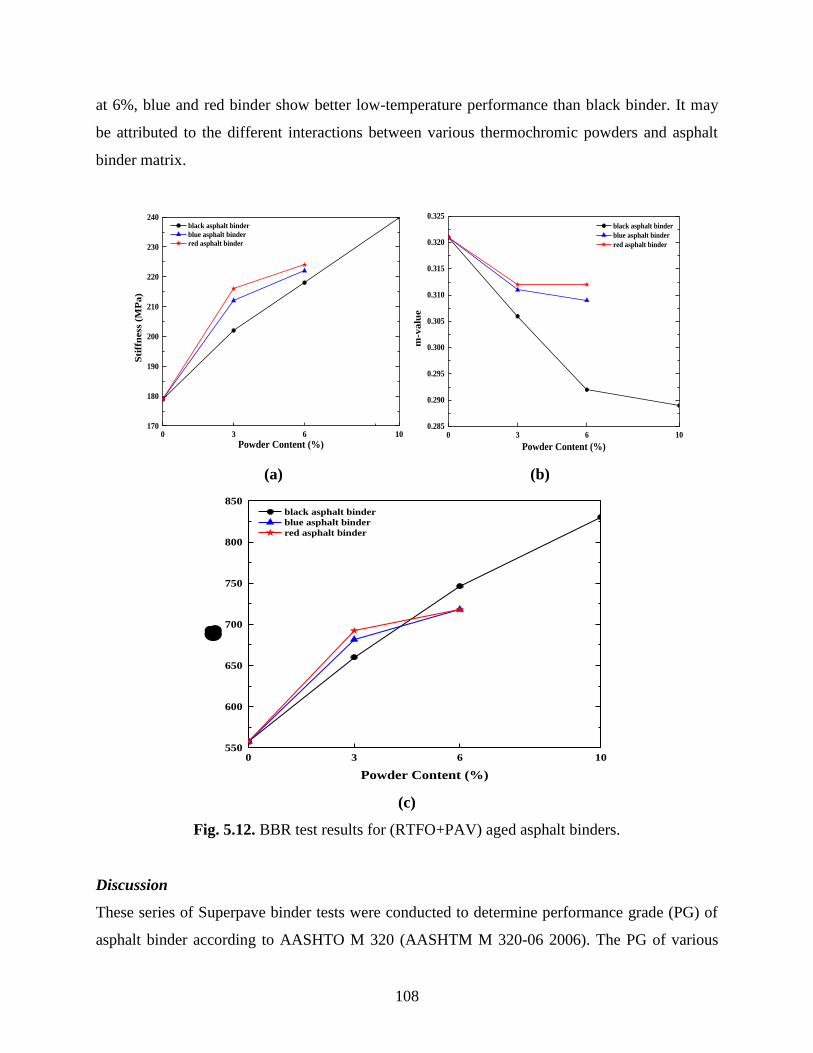
108
at 6%, blue and red binder show better low-temperature performance than black binder. It may
be attributed to the different interactions between various thermochromic powders and asphalt
binder matrix.
0 3 6 10170
180
190
200
210
220
230
240
Sti
ffn
ess
(M
Pa)
Powder Content (%)
black asphalt binder
blue asphalt binder
red asphalt binder
0 3 6 10
0.285
0.290
0.295
0.300
0.305
0.310
0.315
0.320
0.325
m-v
alu
e
Powder Content (%)
black asphalt binder
blue asphalt binder
red asphalt binder
(a) (b)
0 3 6 10550
600
650
700
750
800
850
Powder Content (%)
black asphalt binder
blue asphalt binder
red asphalt binder
(c)
Fig. 5.12. BBR test results for (RTFO+PAV) aged asphalt binders.
Discussion
These series of Superpave binder tests were conducted to determine performance grade (PG) of
asphalt binder according to AASHTO M 320 (AASHTM M 320-06 2006). The PG of various
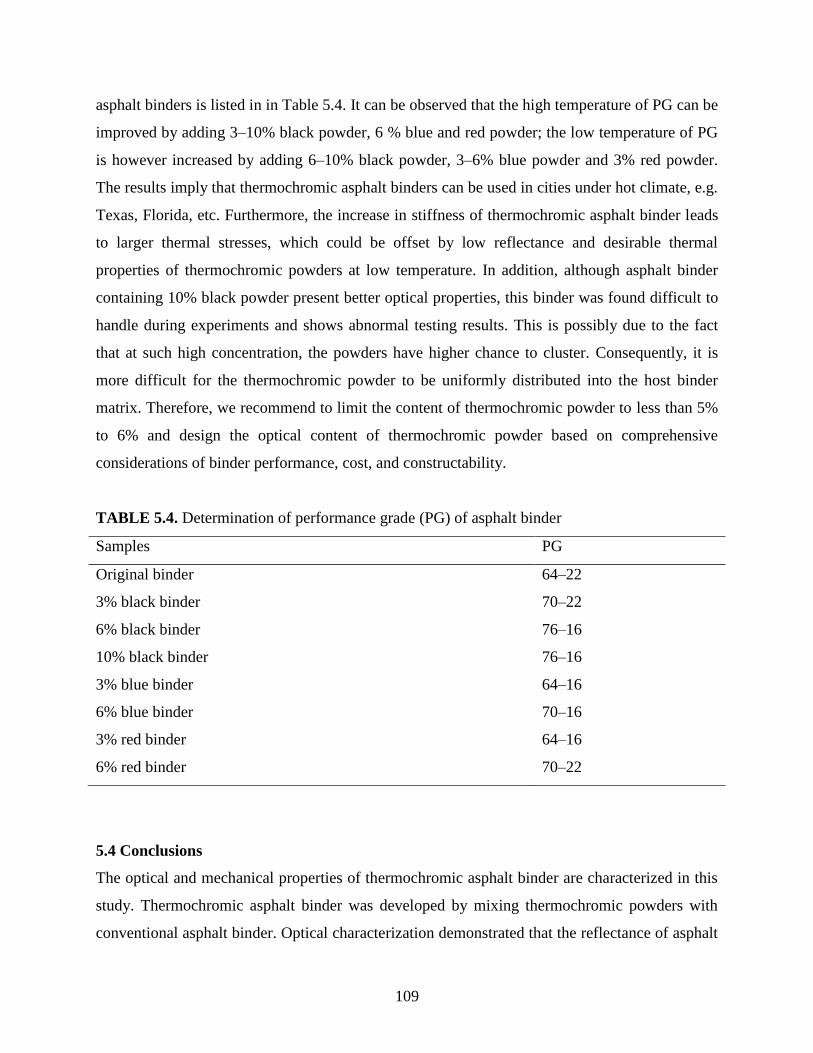
109
asphalt binders is listed in in Table 5.4. It can be observed that the high temperature of PG can be
improved by adding 3–10% black powder, 6 % blue and red powder; the low temperature of PG
is however increased by adding 6–10% black powder, 3–6% blue powder and 3% red powder.
The results imply that thermochromic asphalt binders can be used in cities under hot climate, e.g.
Texas, Florida, etc. Furthermore, the increase in stiffness of thermochromic asphalt binder leads
to larger thermal stresses, which could be offset by low reflectance and desirable thermal
properties of thermochromic powders at low temperature. In addition, although asphalt binder
containing 10% black powder present better optical properties, this binder was found difficult to
handle during experiments and shows abnormal testing results. This is possibly due to the fact
that at such high concentration, the powders have higher chance to cluster. Consequently, it is
more difficult for the thermochromic powder to be uniformly distributed into the host binder
matrix. Therefore, we recommend to limit the content of thermochromic powder to less than 5%
to 6% and design the optical content of thermochromic powder based on comprehensive
considerations of binder performance, cost, and constructability.
TABLE 5.4. Determination of performance grade (PG) of asphalt binder
Samples PG
Original binder 64–22
3% black binder 70–22
6% black binder 76–16
10% black binder 76–16
3% blue binder 64–16
6% blue binder 70–16
3% red binder 64–16
6% red binder 70–22
5.4 Conclusions
The optical and mechanical properties of thermochromic asphalt binder are characterized in this
study. Thermochromic asphalt binder was developed by mixing thermochromic powders with
conventional asphalt binder. Optical characterization demonstrated that the reflectance of asphalt

110
binders is enhanced by incorporating thermochromic powders. Based on the Superpave tests of
various asphalt binders, it was found that the addition of thermochromic powder increases the
values of softening point, viscosity, complex modulus (G*), rutting parameter (G*/sinδ), fatigue
parameter (G*sinδ), stiffness (S) and decreases the values of penetration, phase angle (δ) and
creep rate (m-value). Black binder presented the lowest needle penetration depth, highest
softening point, lowest viscosity, highest values of G* and G*/sinδ, lowest values of δ, S and m-
value, followed by blue and red binder. Furthermore, with increasing thermochromic powder
contents, the penetration depth and m-value of thermochromic binders decreased and softening
point, viscosity, G*, G*/sinδ, G*sinδ, and S increased. The use of thermochromic powder is
found to increase the Superpave high temperature performance grades of asphalt binder. It,
however, deteriorates the low temperature performance grade. The use of thermochromic
powders is recommended to be less than 5% to 6% from comprehensive considerations of binder
performance, cost, and constructability. The use of thermochromic binder could potentially
improve performance of asphalt pavement by reducing the surface temperature of pavement,
especially in cities under hot climate zone. The lower temperature performance can be improved
by use of binder modifier, which is a topic we will continue investigate.
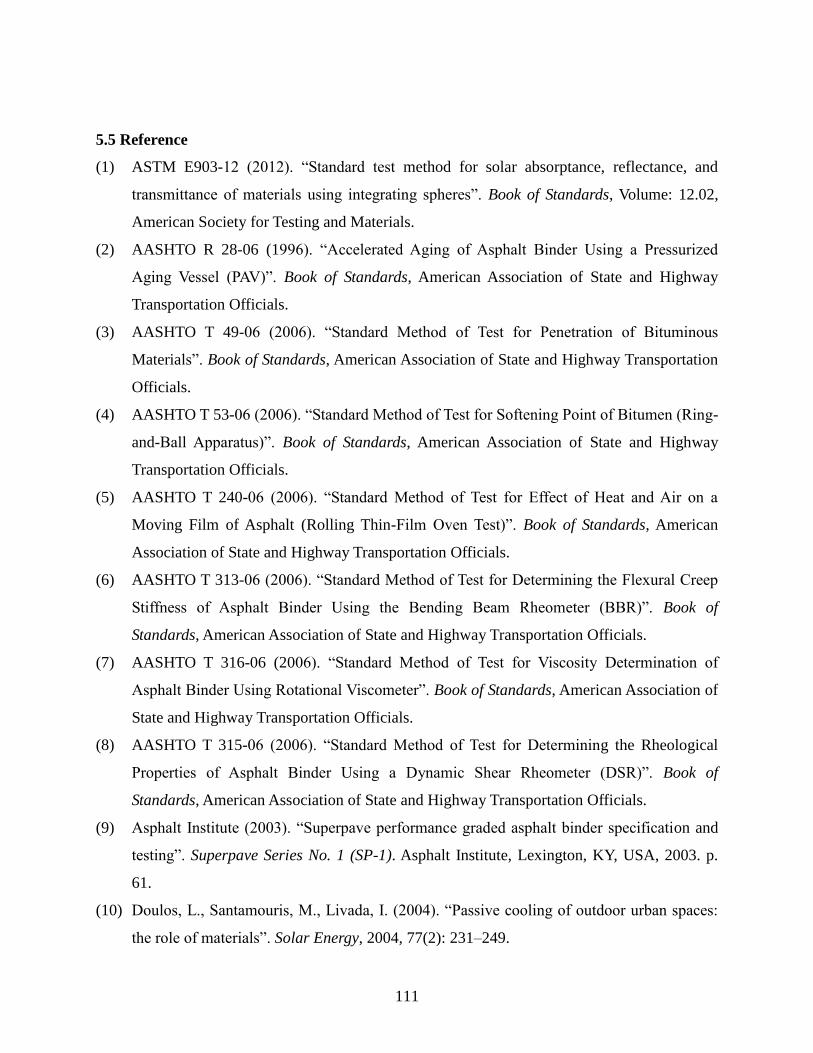
111
5.5 Reference
(1) ASTM E903-12 (2012). “Standard test method for solar absorptance, reflectance, and
transmittance of materials using integrating spheres”. Book of Standards, Volume: 12.02,
American Society for Testing and Materials.
(2) AASHTO R 28-06 (1996). “Accelerated Aging of Asphalt Binder Using a Pressurized
Aging Vessel (PAV)”. Book of Standards, American Association of State and Highway
Transportation Officials.
(3) AASHTO T 49-06 (2006). “Standard Method of Test for Penetration of Bituminous
Materials”. Book of Standards, American Association of State and Highway Transportation
Officials.
(4) AASHTO T 53-06 (2006). “Standard Method of Test for Softening Point of Bitumen (Ring-
and-Ball Apparatus)”. Book of Standards, American Association of State and Highway
Transportation Officials.
(5) AASHTO T 240-06 (2006). “Standard Method of Test for Effect of Heat and Air on a
Moving Film of Asphalt (Rolling Thin-Film Oven Test)”. Book of Standards, American
Association of State and Highway Transportation Officials.
(6) AASHTO T 313-06 (2006). “Standard Method of Test for Determining the Flexural Creep
Stiffness of Asphalt Binder Using the Bending Beam Rheometer (BBR)”. Book of
Standards, American Association of State and Highway Transportation Officials.
(7) AASHTO T 316-06 (2006). “Standard Method of Test for Viscosity Determination of
Asphalt Binder Using Rotational Viscometer”. Book of Standards, American Association of
State and Highway Transportation Officials.
(8) AASHTO T 315-06 (2006). “Standard Method of Test for Determining the Rheological
Properties of Asphalt Binder Using a Dynamic Shear Rheometer (DSR)”. Book of
Standards, American Association of State and Highway Transportation Officials.
(9) Asphalt Institute (2003). “Superpave performance graded asphalt binder specification and
testing”. Superpave Series No. 1 (SP-1). Asphalt Institute, Lexington, KY, USA, 2003. p.
61.
(10) Doulos, L., Santamouris, M., Livada, I. (2004). “Passive cooling of outdoor urban spaces:
the role of materials”. Solar Energy, 2004, 77(2): 231–249.
112
(11) Granqvist, C.G. (1991). Materials Science for Solar Energy Conversion Systems. Pergamon
Press, Oxford.
(12) Hao, P.W., Zhang, D.L., Hu, X.N. (2000). “Evaluation method for low temperature
anticracking performance of asphalt mixture”. Journal of Xi'an Highway University, 2000,
20 (3):1–5.
(13) Kanerva, H.K., VINSON, T.S., Zeng, H. Low Temperature Cracking Field Validation of the
Thermal Stress Rest Rained Specimen Test. R. SHRP-A-401, 1994.
(14) Karlessi, T., Santamouris, M., Apostolakis, K., Synnefa, A., Livada, I. (2009).
“Development and testing of thermochromic coatings for buildings and urban structures”.
Solar Energy, 2009, 83(4): 538–551.
(15) Kinouchi, T., Yoshinaka, T., Fukae, N., Kanda, M. (2004). Development of cool pavement
with dark colored high albedo coating. Fifth Conference for the Urban Environment,
Vancouver, Canada, 2004.
(16) Kinouchi, T., Santamouris, M. (2013). “Improving the performance of thermochromic
coatings with the use of UV and optical filters tested under accelerated aging conditions”.
International Journal of Low-Carbon Technologies, 2013,0, 1-17.
(17) Ma, Y. P. and Zhu, B.R. (2009). “Research on the preparation of reversibly thermochromic
cement based materials at normal temperature”. Cement and Concrete Research, 2009,
39(2): 90-94.
(18) Hu, J.Y., Yu, X. (2013). “Experimental Study of Sustainable Asphalt Binder: Influence of
Thermochromic Materials”. Journal of Transportation Research Record, 2013.
(19) Pomerantz, M. and Akbari. H. (1998). “Cooler Paving Materials for Heat Island
Mitigation”. In 1998 ACEEE Summer Study on Energy Efficiency in Buildings, Asilomar,
CA, City: American Council for an Energy-Efficient Economy, vol. 9, Pacific Grove, 1998,
135.
(20) Pomerantz, M., Akbari, H., Chen, A., Taha, H., Rosenfeld, A. (1997). Paving Materials for
Heat Island Mitigation. Lawrence Berkeley National Laboratory Report LBL- 38074,
Berkeley, CA.
(21) Pomerantz, M., Akbari, H., Harvey, J. T. (2000). Cooler reflective pavements give benefits
beyond energy savings: Durability and illumination. Report No. LBNL-45370, Berkeley,
CA, 14.
113
(22) Saeli, M., Piccirillo, C., Parkin, I. P., Binions, R., Ridley, I. (2010). “Energy modelling
studies of thermochromic glazing”. Energy and Buildings, 42(10): 1666–1673.
(23) Santamouris, M., Synnefa, A., Kolokotsa, D., Dimitriou, V., Apostolakis, K. (2008).
“Passive cooling of the built environment - use of innovative reflective materials to fight
heat island and decrease cooling needs”. International Journal Low Carbon Technologies,
3(2): 71–82.
(24) Yoder, E. J. and Witzak, M. W. (1975). Principles of Pavement Design. New York, NY:
Wiley and Sons.
(25) Gui, J., Phelan, P. E., Kaloush, K. E., Golden, J. S. (2007). “Impact of Pavement
Thermophysical Properties on Surface Temperatures”. Journal of Materials in Civil
Engineering, 19(8): 683–690.
(26) Roberts Freddy L, Kandhal Prithvi S, Brown E Ray. (1996). “Hot mix asphalt materials”,
Mixture Design and Construction. 2nd ed. NAPA Research and Education Foundation;
1996.
(27) Uddin, W. (2003). “Viscoelastic characterization of polymer modified asphalt binders of
pavement applications”. Applied Rheology, 13(4): 191-199.
(28) Navarro, F.J., Partal, P., Garcia, M.M., Martın-Alfonso, M.J., Martınez, B.F., Gallegos. C.,
Bordado, J.C.M., Diogo, A.C. (2009). “Bitumen modification with reactive and non-
reactive (virgin and recycled) polymers: a comparative analysis”. Journal of Industrial and
Engineering Chemistry, 15(4): 458–464.
(29) AASHTO M320-05 (2006). Standard specification for performance graded asphalt binder.
American Association of State and Highway Transportation Officials, 2006.
(30) Santamouris, M., Pavlou, K., Synnefa, A., Niachou, K., Kolokotsa, D. (2007). “Recent
progress on passive cooling techniques: Advanced technological developments to improve
survivability levels in low-income households”. Energy and Buildings, 39(7): 859–866.
(31) Synnefa, A., Dandou, A., Santamouris, M., Tombrou, M., Soulakellis, N. (2008). “Large
scale albedo changes using cool materials to mitigate heat island in Athens”. Journal of
Applied Meteorology and Climatology, 47(11): 2846–2856.
114
CHAPTER SIX
THERMAL AND PYROLYTIC CHARACTERISTICS OF THERMOCHROMIC ASPHALT
BINDER
The research in this chapter studied the thermal kinetic behaviors of the thermochromic asphalt.
The goal is to determine the production parameters for thermochromic asphalt. The pyrolytic
behavior (more accurate thermolytic behavior, defined as chemical reaction during heating
process) and kinetic study of pyrolysis mechanism are important for setting the optimal plant
production parameters (i.e., mixing temperature and duration) of thermochromic asphalt binders.
This paper reports on the pyrolytic and kinetic characteristics of thermochromic asphalt binder
using thermogravimetric analysis (TGA). The results indicate that the mass loss of
thermochromic binders are less than 5% when subjected to 200°C for 2 hours. Although the rate
of mass losses of asphalt binder is increased, the activation energy of asphalt binder is also
increased after adding thermochromic materials, indicating less susceptibility of viscosity of
asphalt binder to temperature. The kinetic analysis found that the pyrolytic behaviors of binders
are best described by the three-dimensional diffusion function mechanism model, as indicated by
the best fits to the experimental data among typical models. Confocal Microscope, Fourier
Transform Infrared Spectroscopy (FTIR), and UV-Vis-IR Spectrophotometer are used to
characterize the structural and optical behaviors of thermochromic binders before and after
thermal treatments. No strong chemical interactions occurs between thermochromic powders and
binder matrix. Heat treatment is found to reduce the solar reflectance of thermochromic binders
with the effects depending upon the exposure duration. Considering both the pyrolysis
characteristics (mass loss) and the performance of solar (infrared) reflectance, blue and red
asphalt binders can be produced with temperature ranges covering both hot mix asphalt (HMA)
and warm mix asphalt (WMA), while black asphalt binder should be produced with low mixing
temperature such as WMA technique.
6.1. Introduction
Asphalt is one of the most widely consumed construction materials worldwide. For example,
96% of the over 10 million kilometers of interstate highway in the U.S. is built with asphalt
115
pavement. Asphalt binders are produced from the residuals of crude oil distillation processes. It
features excellent performance properties. The increases in the price of crude oils experienced in
the past decade lead to significant increases in the price of asphalt. As a non-renewable material,
improvements of its durability have important sustainability contributions. However, the black
color of asphalt binder causes large solar absorption and leads to high surface temperature of
asphalt pavement, which has been reported up to 48-67 °C during summer [1-3]. The increased
temperature in summer impairs durability of asphalt pavement by accelerating various distress
mechanisms (i.e., rutting, shoving, aging, fatigue damage, bleeding) [4] as well as causes
undesirable environmental issues (i.e., heat island effects, volatile gas emission, etc.) [5]. A
potential way to improve the durability is to use materials with high reflectivity and emissivity to
solar radiation. This has led to the development of various cool pavement technologies, or
pavement with lower surface temperatures. Studies [6-10] show that cooling the pavement
increased the service life (durability) of pavements. However, the reduced temperature of asphalt
pavement exacerbates the distress of low-temperature cracking during the winter period [11-12],
which compromises the service life of road in cold climate. Besides, the lower surface
temperature is inductive to ice formation in cold weather, which is a major safety concern. New
pavement materials and technology that make asphalt pavement cooler during summer and
warmer during winter will lead to more durable and safe pavement.
An innovative strategy we have pursued is to use thermochromic materials to create
asphalt binder with desirable solar reflectance, i.e., they reflect more solar energy at high
temperature and reflect less solar energy at low temperature. To avoid visual impacts on road
users, such effects are mostly restrained in the infrared range, since infrared accounts for 50% of
total solar radiation. Thermochromic materials are materials that change their colors with
temperature. Our study has found that thermochromic asphalt binder features high solar
reflectance in summer and high solar absorption in winter [13-14]. The change of their optical
and thermal properties in such a dynamic way can lead to applications that improve the urban
microclimate, decrease the energy demands of the buildings, and provide a thermally
comfortable indoor environment [15-20].
To upscale to the plant production, the pyrolysis characteristics and effects of exposure to
mixing temperature on the solar reflectance of thermochromic binders need to be evaluated. This
paper describes the effects of thermochromic materials on the decomposition kinetics of asphalt
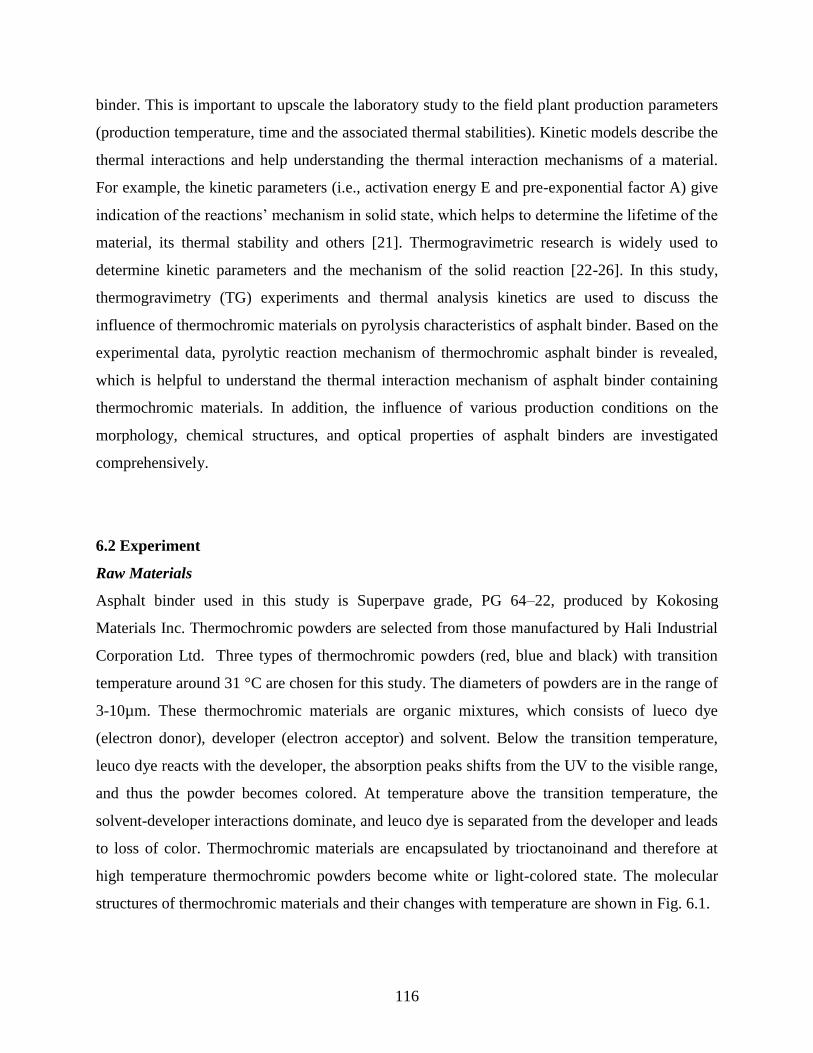
116
binder. This is important to upscale the laboratory study to the field plant production parameters
(production temperature, time and the associated thermal stabilities). Kinetic models describe the
thermal interactions and help understanding the thermal interaction mechanisms of a material.
For example, the kinetic parameters (i.e., activation energy E and pre-exponential factor A) give
indication of the reactions’ mechanism in solid state, which helps to determine the lifetime of the
material, its thermal stability and others [21]. Thermogravimetric research is widely used to
determine kinetic parameters and the mechanism of the solid reaction [22-26]. In this study,
thermogravimetry (TG) experiments and thermal analysis kinetics are used to discuss the
influence of thermochromic materials on pyrolysis characteristics of asphalt binder. Based on the
experimental data, pyrolytic reaction mechanism of thermochromic asphalt binder is revealed,
which is helpful to understand the thermal interaction mechanism of asphalt binder containing
thermochromic materials. In addition, the influence of various production conditions on the
morphology, chemical structures, and optical properties of asphalt binders are investigated
comprehensively.
6.2 Experiment
Raw Materials
Asphalt binder used in this study is Superpave grade, PG 64–22, produced by Kokosing
Materials Inc. Thermochromic powders are selected from those manufactured by Hali Industrial
Corporation Ltd. Three types of thermochromic powders (red, blue and black) with transition
temperature around 31 °C are chosen for this study. The diameters of powders are in the range of
3-10µm. These thermochromic materials are organic mixtures, which consists of lueco dye
(electron donor), developer (electron acceptor) and solvent. Below the transition temperature,
leuco dye reacts with the developer, the absorption peaks shifts from the UV to the visible range,
and thus the powder becomes colored. At temperature above the transition temperature, the
solvent-developer interactions dominate, and leuco dye is separated from the developer and leads
to loss of color. Thermochromic materials are encapsulated by trioctanoinand and therefore at
high temperature thermochromic powders become white or light-colored state. The molecular
structures of thermochromic materials and their changes with temperature are shown in Fig. 6.1.
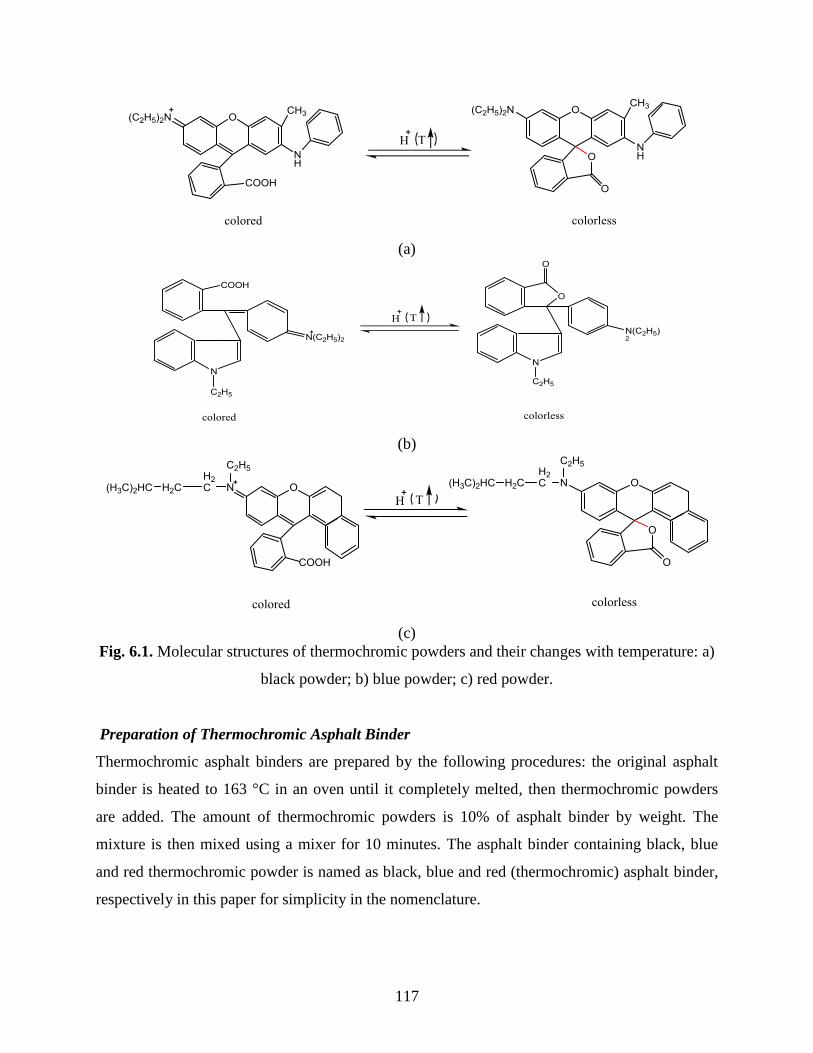
117
(a)
(b)
(c)
Fig. 6.1. Molecular structures of thermochromic powders and their changes with temperature: a)
black powder; b) blue powder; c) red powder.
Preparation of Thermochromic Asphalt Binder
Thermochromic asphalt binders are prepared by the following procedures: the original asphalt
binder is heated to 163 °C in an oven until it completely melted, then thermochromic powders
are added. The amount of thermochromic powders is 10% of asphalt binder by weight. The
mixture is then mixed using a mixer for 10 minutes. The asphalt binder containing black, blue
and red thermochromic powder is named as black, blue and red (thermochromic) asphalt binder,
respectively in this paper for simplicity in the nomenclature.

118
In principle, the thermochromic asphalt binder should exhibit different a response to solar
radiation than conventional asphalt binder. Solar energy consists of a spectrum of wavelengths,
including ultraviolet, visible, and infrared light (almost 50% of the entire solar energy). Below
the transition temperature of the thermochromic powder, where the powders are less infrared
reflective, the binder should reflect less (and therefore absorb more) solar energy, as shown in
Fig. 6.2(a); above the transition temperature, where the powders are more reflective to infrared,
thermochromic asphalt binder should reflect more solar energy, as shown in Fig. 6.2(b). Both
energy-reflecting and energy-absorbing properties of thermochromic asphalt binder help to
maintain pavement at an appropriate temperature range desirable for its longevity and
performance. Another study by the authors have validated that the surface temperature of
thermochromic binder is up to around 7 °C lower than regular asphalt at a temperature of around
50 °C [13-14]. The details can be found in the cited papers and are not duplicated here. The
kinetic analyses are important to evaluate the thermal stability of thermochromic binder and to
set the optimal plant production parameters.
(a) (b)
Fig. 6.2. Schematic principle of thermochromic asphalt binder: (a) under the transition
temperature of thermochromic powders; (b) higher infrared reflectance above the transition
temperature.
Thermal Treatment of Samples
Generally, two technologies are employed to produce asphalt mixtures in plant: hot mix asphalt
(HMA) and warm mix asphalt (WMA).Traditional HMA mixtures are typically produced at
temperatures ranging from 140 to 170 °C [27]. WMA technology allows significant lower
production temperature, which is generally in the temperature range of 105 to 135 °C. To assess
119
the influence of production processes on the properties of the final binder, thermochromic
powders and asphalt binders were heated at 105, 140, 170 and 200 °C for 0.5, 1 and 2 hours,
respectively. These thermally treated samples were then analyzed by the following techniques.
Characterizations
The powder distribution in asphalt binder was studied by the Olympus FV1000 Confocal
Microscope BX62 based on both surface mapping and depth profiling experiments.
The chemical structures of untreated and treated samples were investigated by Fourier
Transform Infrared Spectroscopy (FTIR). The measurements were carried out in the absorption
mode in the mid-infrared range (400–4000 cm-1) with a resolution of 4 cm−1.
Thermal degradation of both thermochromic powders, and various regular and
thermochromic asphalt binder samples were performance in a thermogravimetric analyzer (Q500
TG, TA Instruments), respectively. Considering the extreme of industrial production conditions,
the samples are first heated from ambient temperature to 200 ºC with the heating rate of 5
°C/min, then kept isothermal at 200 ºC for 120 min, and finally heated to 400 ºC with the same
heating rate. The continuous records of weight loss and temperature are then used to plot a TG
curve and derivative thermogravimetric analysis (DTG) curves.
The reflectance spectra of both thermochromic powders and asphalt binders were
measured over the wavelength range of 300–1800 nm by the Agilent Cary 6000i UV-Vis-IR
Spectrophotometer with a DRA integrating sphere. The measurements were performed according
to ASTM E903-96 [28]. During the measurements, thermochromic powders and asphalt binders
were packed between microscopic slides with a thickness of 1mm at room temperature. The
change of reflectance spectra between untreated and treated samples was also evaluated.
6.3 Results and Discussion
Confocal surface mapping analyses
Fig. 6.3 shows example of the confocal optical image of the surface of untreated pure asphalt
binder as well as untreated and treated red asphalt binders. It is seen that there is a smooth
surface in pure asphalt binder (Fig. 6.3(a)). After mixed with thermochromic powders, rough
morphology and agglomerated powders appear in the binder matrix as agglomerated particles as
can be seen in Fig. 6.3(b). The separation of binder and powders is an indication that the
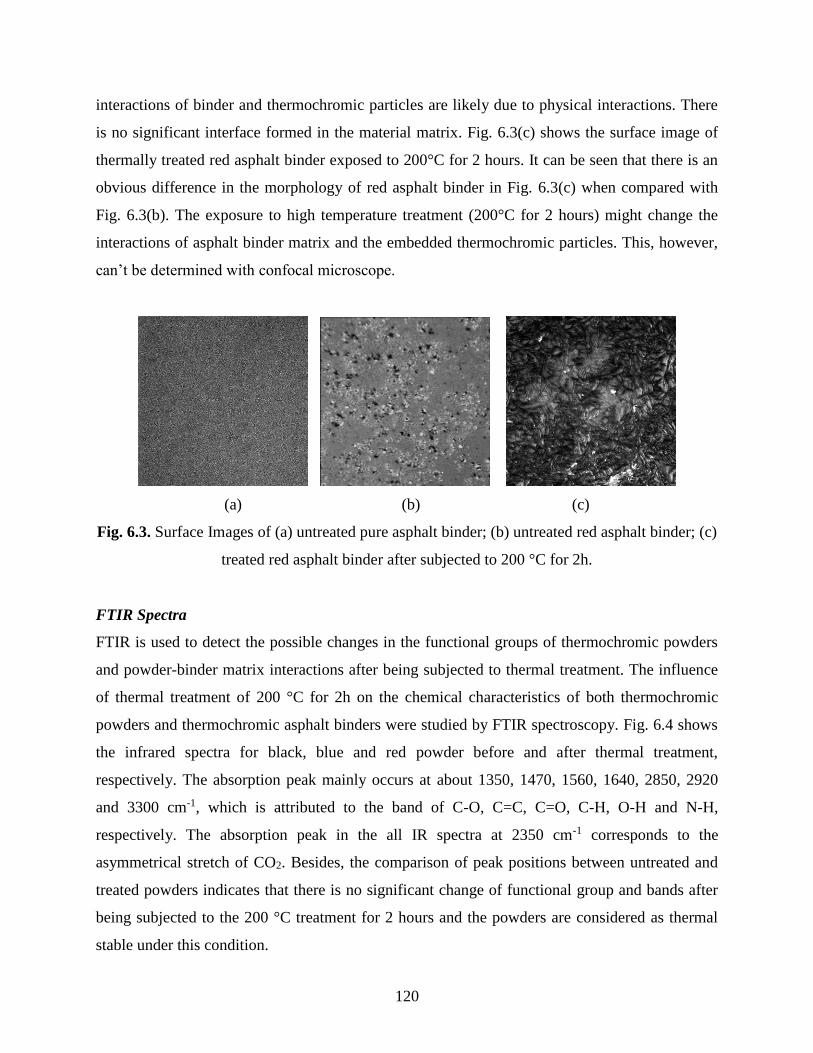
120
interactions of binder and thermochromic particles are likely due to physical interactions. There
is no significant interface formed in the material matrix. Fig. 6.3(c) shows the surface image of
thermally treated red asphalt binder exposed to 200°C for 2 hours. It can be seen that there is an
obvious difference in the morphology of red asphalt binder in Fig. 6.3(c) when compared with
Fig. 6.3(b). The exposure to high temperature treatment (200°C for 2 hours) might change the
interactions of asphalt binder matrix and the embedded thermochromic particles. This, however,
can’t be determined with confocal microscope.
(a) (b) (c)
Fig. 6.3. Surface Images of (a) untreated pure asphalt binder; (b) untreated red asphalt binder; (c)
treated red asphalt binder after subjected to 200 °C for 2h.
FTIR Spectra
FTIR is used to detect the possible changes in the functional groups of thermochromic powders
and powder-binder matrix interactions after being subjected to thermal treatment. The influence
of thermal treatment of 200 °C for 2h on the chemical characteristics of both thermochromic
powders and thermochromic asphalt binders were studied by FTIR spectroscopy. Fig. 6.4 shows
the infrared spectra for black, blue and red powder before and after thermal treatment,
respectively. The absorption peak mainly occurs at about 1350, 1470, 1560, 1640, 2850, 2920
and 3300 cm-1, which is attributed to the band of C-O, C=C, C=O, C-H, O-H and N-H,
respectively. The absorption peak in the all IR spectra at 2350 cm-1 corresponds to the
asymmetrical stretch of CO2. Besides, the comparison of peak positions between untreated and
treated powders indicates that there is no significant change of functional group and bands after
being subjected to the 200 °C treatment for 2 hours and the powders are considered as thermal
stable under this condition.
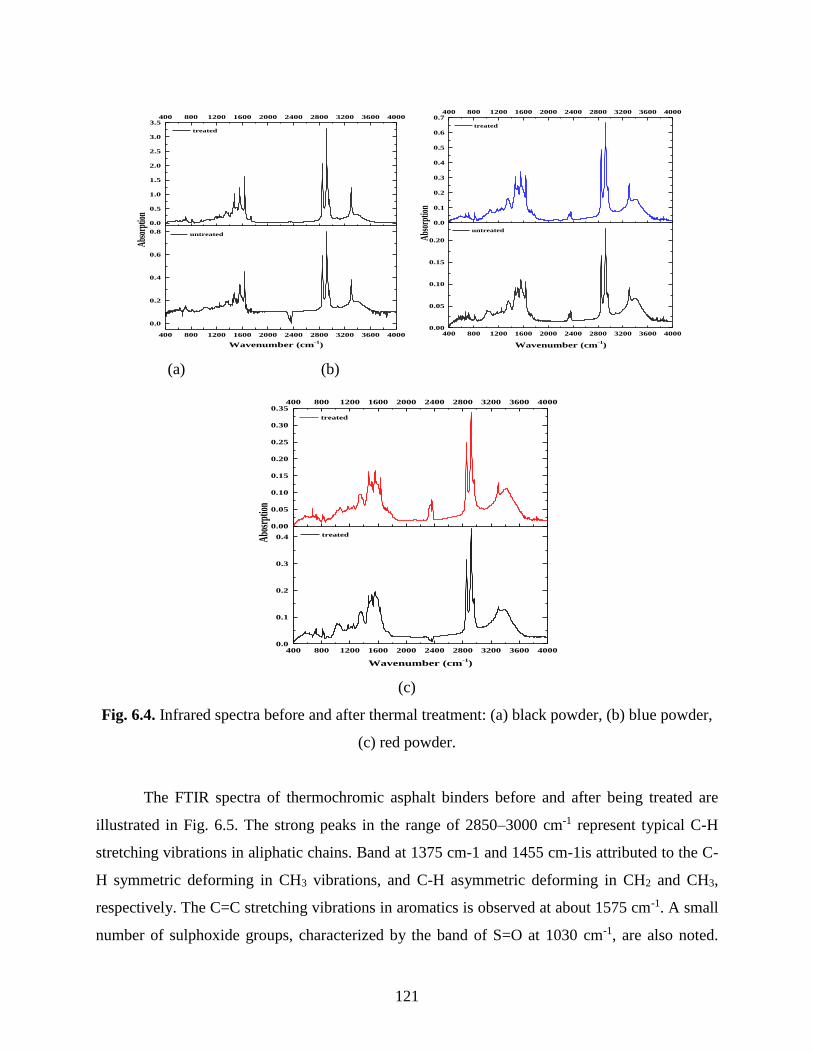
121
400 800 1200 1600 2000 2400 2800 3200 3600 4000
0.0
0.2
0.4
0.6
0.8
0.0
0.5
1.0
1.5
2.0
2.5
3.0
3.5400 800 1200 1600 2000 2400 2800 3200 3600 4000
Abs
orpt
ion
Wavenumber (cm-1)
untreated
treated
400 800 1200 1600 2000 2400 2800 3200 3600 4000
0.00
0.05
0.10
0.15
0.20
0.0
0.1
0.2
0.3
0.4
0.5
0.6
0.7400 800 1200 1600 2000 2400 2800 3200 3600 4000
Abs
orpt
ion
Wavenumber (cm-1)
untreated
treated
(a) (b)
400 800 1200 1600 2000 2400 2800 3200 3600 40000.0
0.1
0.2
0.3
0.4
0.00
0.05
0.10
0.15
0.20
0.25
0.30
0.35400 800 1200 1600 2000 2400 2800 3200 3600 4000
Abo
srpt
ion
Wavenumber (cm-1)
treated
treated
(c)
Fig. 6.4. Infrared spectra before and after thermal treatment: (a) black powder, (b) blue powder,
(c) red powder.
The FTIR spectra of thermochromic asphalt binders before and after being treated are
illustrated in Fig. 6.5. The strong peaks in the range of 2850–3000 cm-1 represent typical C-H
stretching vibrations in aliphatic chains. Band at 1375 cm-1 and 1455 cm-1is attributed to the C-
H symmetric deforming in CH3 vibrations, and C-H asymmetric deforming in CH2 and CH3,
respectively. The C=C stretching vibrations in aromatics is observed at about 1575 cm-1. A small
number of sulphoxide groups, characterized by the band of S=O at 1030 cm-1, are also noted.

122
Furthermore, the thermochromic asphalt binder shows a tiny peak at 3300 cm-1, which is N-H
stretching vibration from thermochromic powders. As shown in Fig. 6.5, thermochromic asphalt
binders contain the functional groups similar as the original asphalt binder besides N-H. In
addition, compared with untreated binders, treated binders present the similar peak positions in
FTIR spectra. This indicates that no chemical major changes occurred after the heat treatment
and these asphalt binders are chemically stable under the condition.
400 800 1200 1600 2000 2400 2800 3200 3600 40000.00
0.05
0.10
0.00
0.05
0.10
0.15
0.20400 800 1200 1600 2000 2400 2800 3200 3600 4000
Abs
orpt
ion
Wavenumber (cm-1)
untreated
treated
400 800 1200 1600 2000 2400 2800 3200 3600 4000
0.00
0.05
0.10
0.15
0.20
0.25
0.000
0.005
0.010
0.015
0.020400 800 1200 1600 2000 2400 2800 3200 3600 4000
Wavenumber (cm-1)
Abs
orpt
ion
untreated
treated
(a) (b)
400 800 1200 1600 2000 2400 2800 3200 3600 40000.00
0.05
0.10
0.15
0.20
0.25
0.00
0.01
0.02
0.03
0.04
0.05
400 800 1200 1600 2000 2400 2800 3200 3600 4000
Abs
orpt
ion
Wavenumber (cm-1)
untreated
treated
400 800 1200 1600 2000 2400 2800 3200 3600 40000.00
0.02
0.04
0.0
0.1
0.2
0.3400 800 1200 1600 2000 2400 2800 3200 3600 4000
Abs
orpt
ion
Wavenumber (cm-1)
untreated
treated
(c) (d)
Fig. 6.5. Infrared spectra before and after thermal treatment: (a) pure asphalt binder, (b) black
asphalt binder, (c) blue asphalt binder, (d) red asphalt binder.
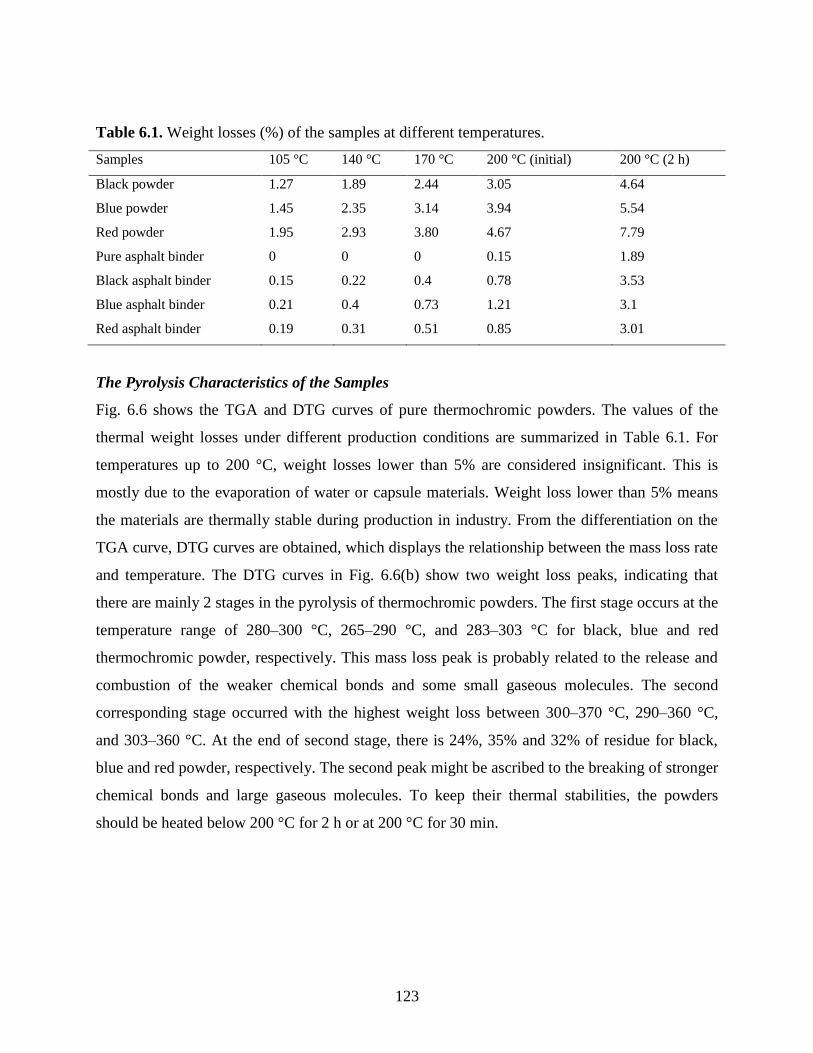
123
Table 6.1. Weight losses (%) of the samples at different temperatures.
Samples 105 °C 140 °C 170 °C 200 °C (initial) 200 °C (2 h)
Black powder 1.27 1.89 2.44 3.05 4.64
Blue powder 1.45 2.35 3.14 3.94 5.54
Red powder 1.95 2.93 3.80 4.67 7.79
Pure asphalt binder 0 0 0 0.15 1.89
Black asphalt binder 0.15 0.22 0.4 0.78 3.53
Blue asphalt binder 0.21 0.4 0.73 1.21 3.1
Red asphalt binder 0.19 0.31 0.51 0.85 3.01
The Pyrolysis Characteristics of the Samples
Fig. 6.6 shows the TGA and DTG curves of pure thermochromic powders. The values of the
thermal weight losses under different production conditions are summarized in Table 6.1. For
temperatures up to 200 °C, weight losses lower than 5% are considered insignificant. This is
mostly due to the evaporation of water or capsule materials. Weight loss lower than 5% means
the materials are thermally stable during production in industry. From the differentiation on the
TGA curve, DTG curves are obtained, which displays the relationship between the mass loss rate
and temperature. The DTG curves in Fig. 6.6(b) show two weight loss peaks, indicating that
there are mainly 2 stages in the pyrolysis of thermochromic powders. The first stage occurs at the
temperature range of 280–300 °C, 265–290 °C, and 283–303 °C for black, blue and red
thermochromic powder, respectively. This mass loss peak is probably related to the release and
combustion of the weaker chemical bonds and some small gaseous molecules. The second
corresponding stage occurred with the highest weight loss between 300–370 °C, 290–360 °C,
and 303–360 °C. At the end of second stage, there is 24%, 35% and 32% of residue for black,
blue and red powder, respectively. The second peak might be ascribed to the breaking of stronger
chemical bonds and large gaseous molecules. To keep their thermal stabilities, the powders
should be heated below 200 °C for 2 h or at 200 °C for 30 min.
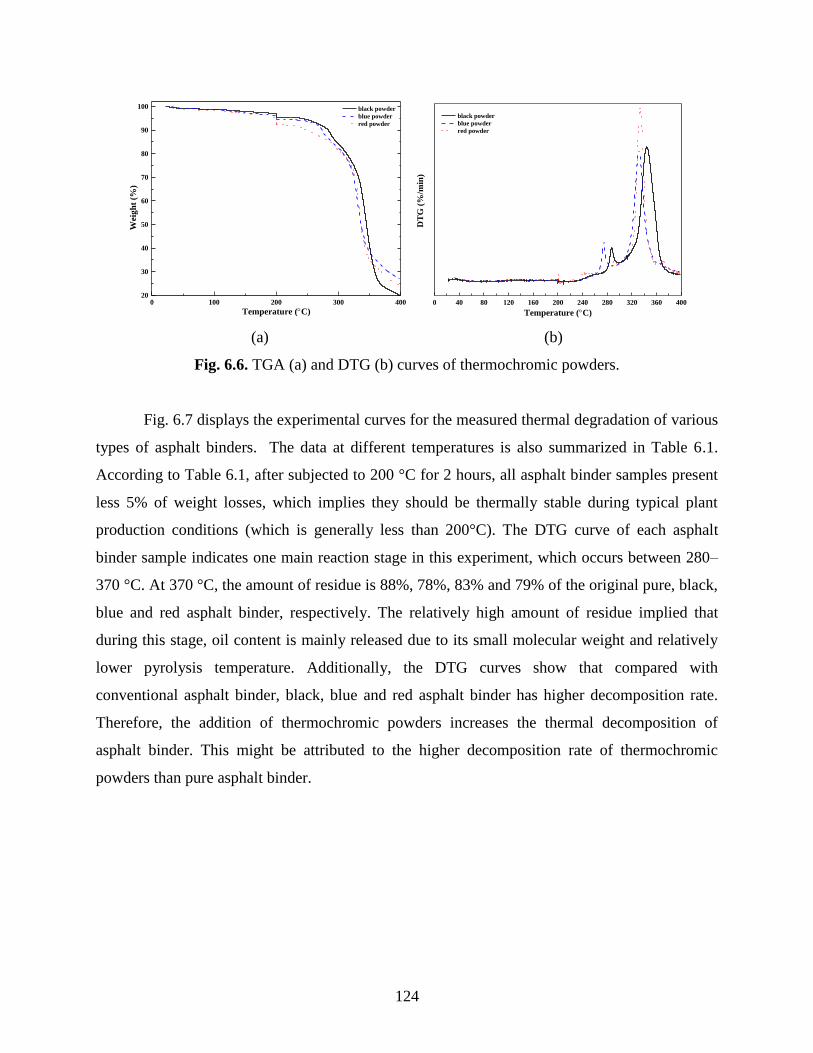
124
0 100 200 300 40020
30
40
50
60
70
80
90
100
Weig
ht
(%)
Temperature (C)
black powder
blue powder
red powder
0 40 80 120 160 200 240 280 320 360 400
D
TG
(%
/min
)
Temperature (C)
black powder
blue powder
red powder
(a) (b)
Fig. 6.6. TGA (a) and DTG (b) curves of thermochromic powders.
Fig. 6.7 displays the experimental curves for the measured thermal degradation of various
types of asphalt binders. The data at different temperatures is also summarized in Table 6.1.
According to Table 6.1, after subjected to 200 °C for 2 hours, all asphalt binder samples present
less 5% of weight losses, which implies they should be thermally stable during typical plant
production conditions (which is generally less than 200°C). The DTG curve of each asphalt
binder sample indicates one main reaction stage in this experiment, which occurs between 280–
370 °C. At 370 °C, the amount of residue is 88%, 78%, 83% and 79% of the original pure, black,
blue and red asphalt binder, respectively. The relatively high amount of residue implied that
during this stage, oil content is mainly released due to its small molecular weight and relatively
lower pyrolysis temperature. Additionally, the DTG curves show that compared with
conventional asphalt binder, black, blue and red asphalt binder has higher decomposition rate.
Therefore, the addition of thermochromic powders increases the thermal decomposition of
asphalt binder. This might be attributed to the higher decomposition rate of thermochromic
powders than pure asphalt binder.
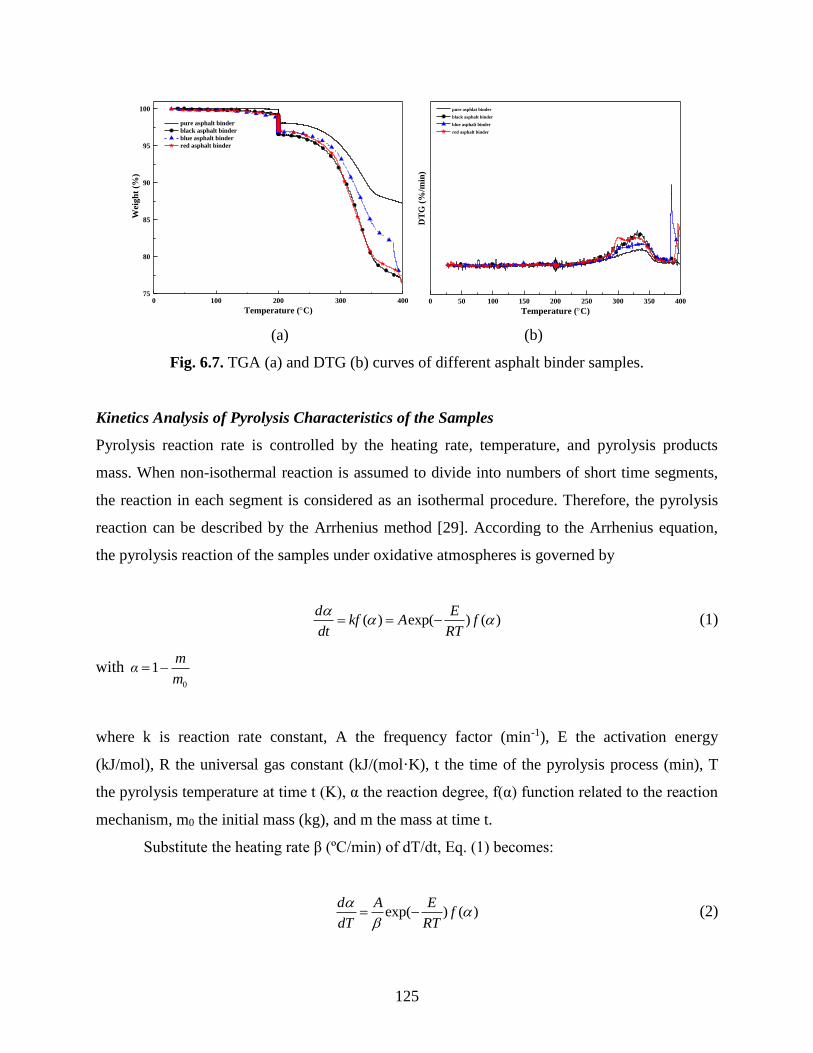
125
0 100 200 300 40075
80
85
90
95
100
Wei
gh
t (%
)
Temperature (C)
pure asphalt binder
black asphalt binder
blue asphalt binder
red asphalt binder
0 50 100 150 200 250 300 350 400
DT
G (
%/m
in)
Temperature (C)
pure asphlat binder
black asphalt binder
blue asphalt binder
red asphalt binder
(a) (b)
Fig. 6.7. TGA (a) and DTG (b) curves of different asphalt binder samples.
Kinetics Analysis of Pyrolysis Characteristics of the Samples
Pyrolysis reaction rate is controlled by the heating rate, temperature, and pyrolysis products
mass. When non-isothermal reaction is assumed to divide into numbers of short time segments,
the reaction in each segment is considered as an isothermal procedure. Therefore, the pyrolysis
reaction can be described by the Arrhenius method [29]. According to the Arrhenius equation,
the pyrolysis reaction of the samples under oxidative atmospheres is governed by
( ) exp( ) ( )d E
kf A fdt RT
(1)
with 0
1m
αm
where k is reaction rate constant, A the frequency factor (min-1), E the activation energy
(kJ/mol), R the universal gas constant (kJ/(mol·K), t the time of the pyrolysis process (min), T
the pyrolysis temperature at time t (K), α the reaction degree, f(α) function related to the reaction
mechanism, m0 the initial mass (kg), and m the mass at time t.
Substitute the heating rate β (ºC/min) of dT/dt, Eq. (1) becomes:
exp( ) ( )d A E
fdT RT
(2)
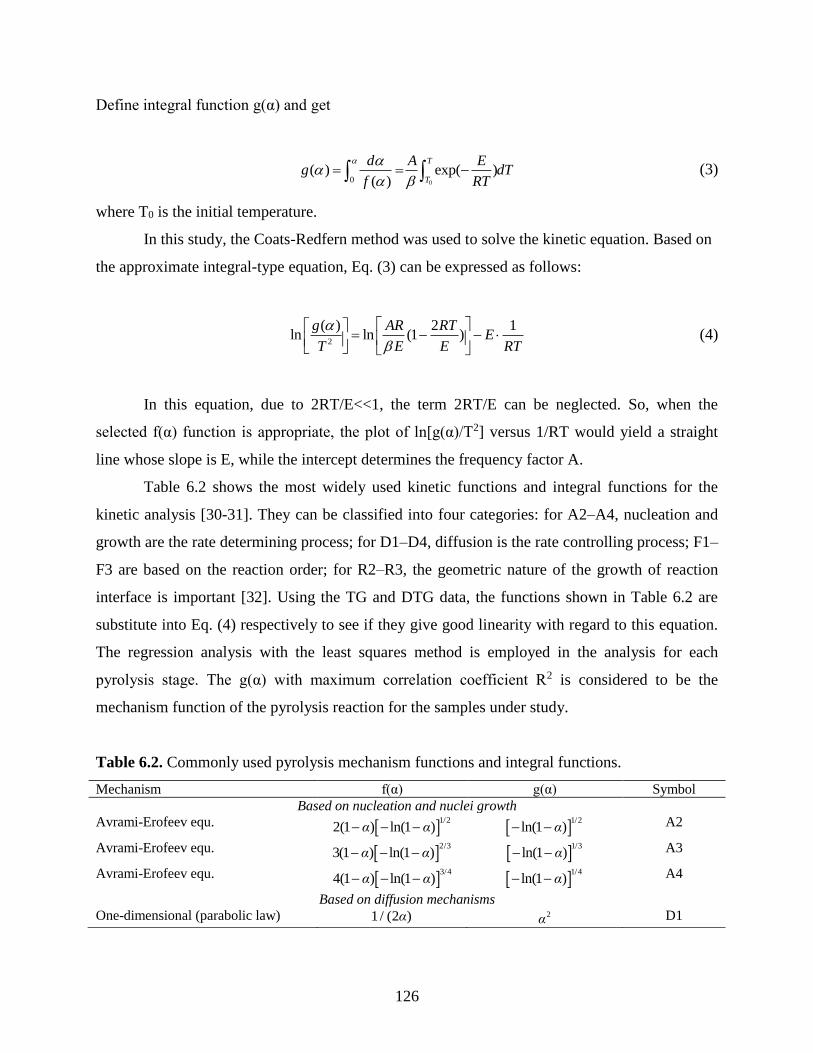
126
Define integral function g(α) and get
00
( ) exp( )( )
T
T
d A Eg dT
f RT
(3)
where T0 is the initial temperature.
In this study, the Coats-Redfern method was used to solve the kinetic equation. Based on
the approximate integral-type equation, Eq. (3) can be expressed as follows:
2
( ) 2 1ln ln (1 )
g AR RTE
T E E RT
(4)
In this equation, due to 2RT/E<<1, the term 2RT/E can be neglected. So, when the
selected f(α) function is appropriate, the plot of ln[g(α)/T2] versus 1/RT would yield a straight
line whose slope is E, while the intercept determines the frequency factor A.
Table 6.2 shows the most widely used kinetic functions and integral functions for the
kinetic analysis [30-31]. They can be classified into four categories: for A2–A4, nucleation and
growth are the rate determining process; for D1–D4, diffusion is the rate controlling process; F1–
F3 are based on the reaction order; for R2–R3, the geometric nature of the growth of reaction
interface is important [32]. Using the TG and DTG data, the functions shown in Table 6.2 are
substitute into Eq. (4) respectively to see if they give good linearity with regard to this equation.
The regression analysis with the least squares method is employed in the analysis for each
pyrolysis stage. The g(α) with maximum correlation coefficient R2 is considered to be the
mechanism function of the pyrolysis reaction for the samples under study.
Table 6.2. Commonly used pyrolysis mechanism functions and integral functions.
Mechanism f(α) g(α) Symbol
Based on nucleation and nuclei growth
Avrami-Erofeev equ. 1/2
2(1 ) ln(1 )α α 1/2
ln(1 )α A2
Avrami-Erofeev equ. 2/3
3(1 ) ln(1 )α α 1/3
ln(1 )α A3
Avrami-Erofeev equ. 3/4
4(1 ) ln(1 )α α 1/4
ln(1 )α A4
Based on diffusion mechanisms
One-dimensional (parabolic law) 1/ (2 )α 2α D1
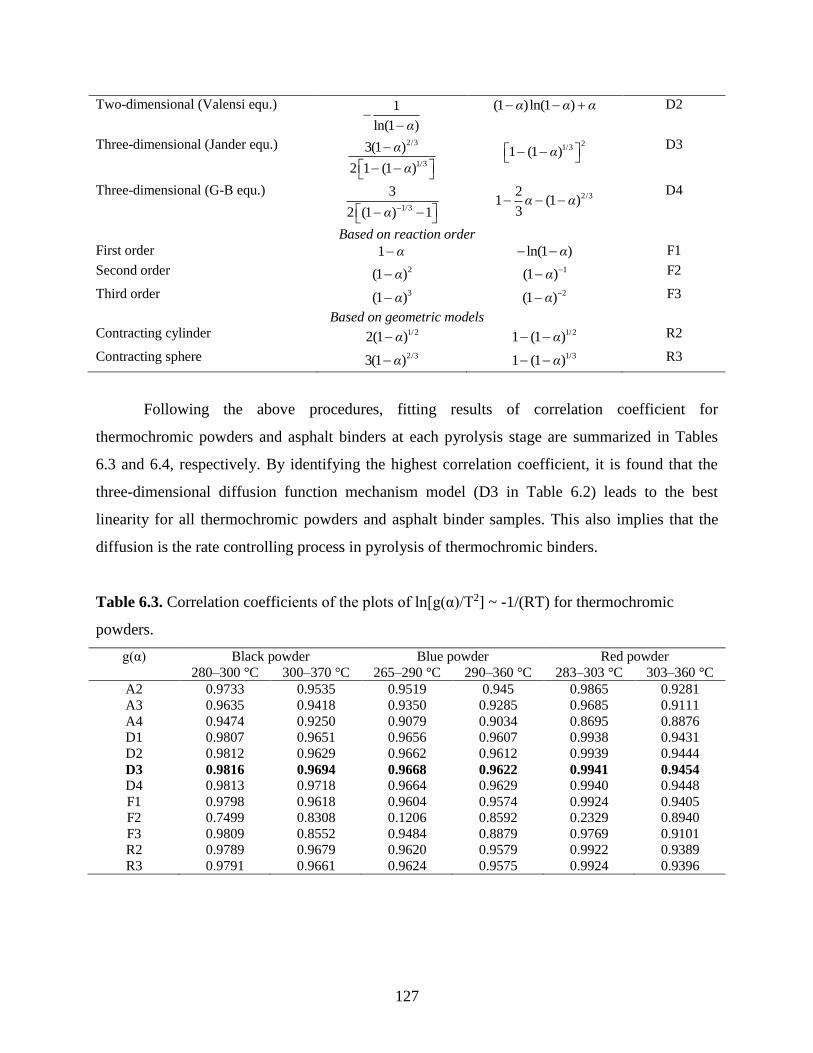
127
Two-dimensional (Valensi equ.) 1
ln(1 )α
(1 )ln(1 )α α α D2
Three-dimensional (Jander equ.) 2/3
1/3
3(1 )
2 1 (1 )
α
α
2
1/31 (1 )α D3
Three-dimensional (G-B equ.) 1/3
3
2 (1 ) 1α
2/32
1 (1 )3α α
D4
Based on reaction order
First order 1 α ln(1 )α F1
Second order 2(1 )α 1(1 )α F2
Third order 3(1 )α 2(1 )α F3
Based on geometric models Contracting cylinder 1/22(1 )α
1/21 (1 )α R2
Contracting sphere 2/33(1 )α 1/31 (1 )α R3
Following the above procedures, fitting results of correlation coefficient for
thermochromic powders and asphalt binders at each pyrolysis stage are summarized in Tables
6.3 and 6.4, respectively. By identifying the highest correlation coefficient, it is found that the
three-dimensional diffusion function mechanism model (D3 in Table 6.2) leads to the best
linearity for all thermochromic powders and asphalt binder samples. This also implies that the
diffusion is the rate controlling process in pyrolysis of thermochromic binders.
Table 6.3. Correlation coefficients of the plots of ln[g(α)/T2] ~ -1/(RT) for thermochromic
powders.
g(α) Black powder Blue powder Red powder
280–300 °C 300–370 °C 265–290 °C 290–360 °C 283–303 °C 303–360 °C
A2 0.9733 0.9535 0.9519 0.945 0.9865 0.9281
A3 0.9635 0.9418 0.9350 0.9285 0.9685 0.9111
A4 0.9474 0.9250 0.9079 0.9034 0.8695 0.8876
D1 0.9807 0.9651 0.9656 0.9607 0.9938 0.9431
D2 0.9812 0.9629 0.9662 0.9612 0.9939 0.9444
D3 0.9816 0.9694 0.9668 0.9622 0.9941 0.9454
D4 0.9813 0.9718 0.9664 0.9629 0.9940 0.9448
F1 0.9798 0.9618 0.9604 0.9574 0.9924 0.9405
F2 0.7499 0.8308 0.1206 0.8592 0.2329 0.8940
F3 0.9809 0.8552 0.9484 0.8879 0.9769 0.9101
R2 0.9789 0.9679 0.9620 0.9579 0.9922 0.9389
R3 0.9791 0.9661 0.9624 0.9575 0.9924 0.9396
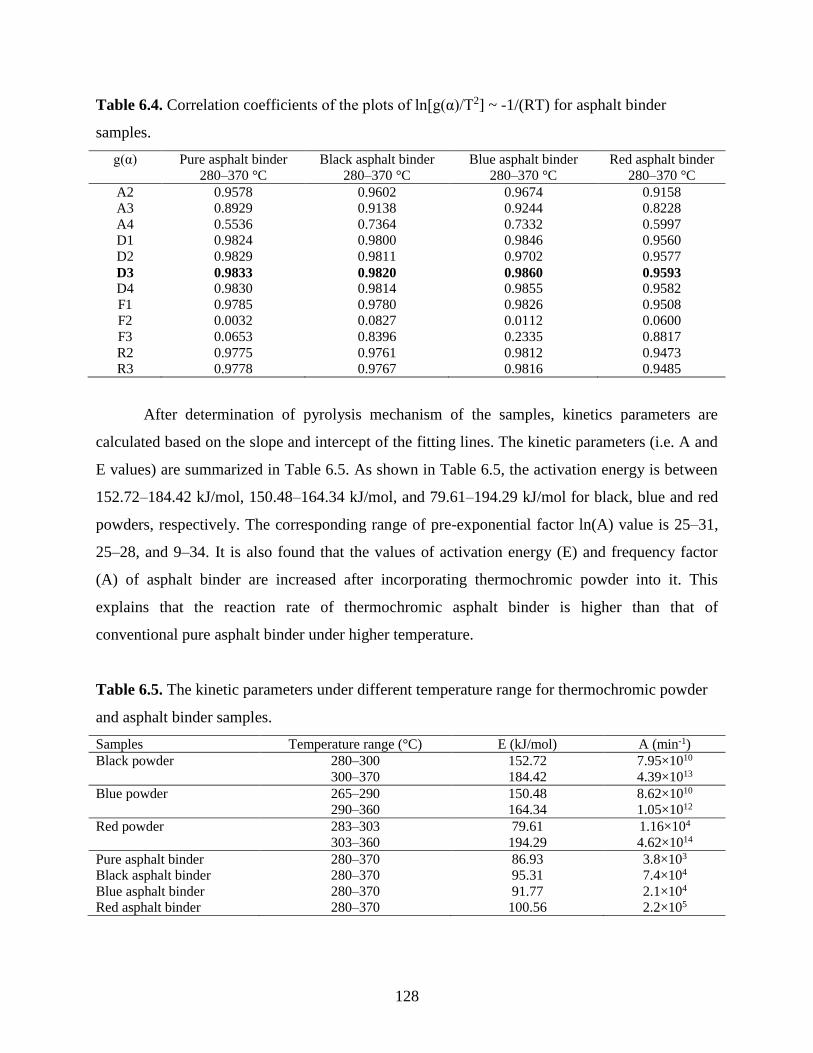
128
Table 6.4. Correlation coefficients of the plots of ln[g(α)/T2] ~ -1/(RT) for asphalt binder
samples.
g(α) Pure asphalt binder Black asphalt binder Blue asphalt binder Red asphalt binder
280–370 °C 280–370 °C 280–370 °C 280–370 °C
A2 0.9578 0.9602 0.9674 0.9158
A3 0.8929 0.9138 0.9244 0.8228
A4 0.5536 0.7364 0.7332 0.5997
D1 0.9824 0.9800 0.9846 0.9560
D2 0.9829 0.9811 0.9702 0.9577
D3 0.9833 0.9820 0.9860 0.9593 D4 0.9830 0.9814 0.9855 0.9582
F1 0.9785 0.9780 0.9826 0.9508
F2 0.0032 0.0827 0.0112 0.0600
F3 0.0653 0.8396 0.2335 0.8817
R2 0.9775 0.9761 0.9812 0.9473
R3 0.9778 0.9767 0.9816 0.9485
After determination of pyrolysis mechanism of the samples, kinetics parameters are
calculated based on the slope and intercept of the fitting lines. The kinetic parameters (i.e. A and
E values) are summarized in Table 6.5. As shown in Table 6.5, the activation energy is between
152.72–184.42 kJ/mol, 150.48–164.34 kJ/mol, and 79.61–194.29 kJ/mol for black, blue and red
powders, respectively. The corresponding range of pre-exponential factor ln(A) value is 25–31,
25–28, and 9–34. It is also found that the values of activation energy (E) and frequency factor
(A) of asphalt binder are increased after incorporating thermochromic powder into it. This
explains that the reaction rate of thermochromic asphalt binder is higher than that of
conventional pure asphalt binder under higher temperature.
Table 6.5. The kinetic parameters under different temperature range for thermochromic powder
and asphalt binder samples.
Samples Temperature range (°C) E (kJ/mol) A (min-1)
Black powder 280–300 152.72 7.95×10¹⁰
300–370 184.42 4.39×10¹³
Blue powder 265–290 150.48 8.62×10¹⁰
290–360 164.34 1.05×10¹²
Red powder 283–303 79.61 1.16×10⁴
303–360 194.29 4.62×10¹⁴
Pure asphalt binder 280–370 86.93 3.8×10³
Black asphalt binder 280–370 95.31 7.4×10⁴
Blue asphalt binder 280–370 91.77 2.1×10⁴
Red asphalt binder 280–370 100.56 2.2×10⁵
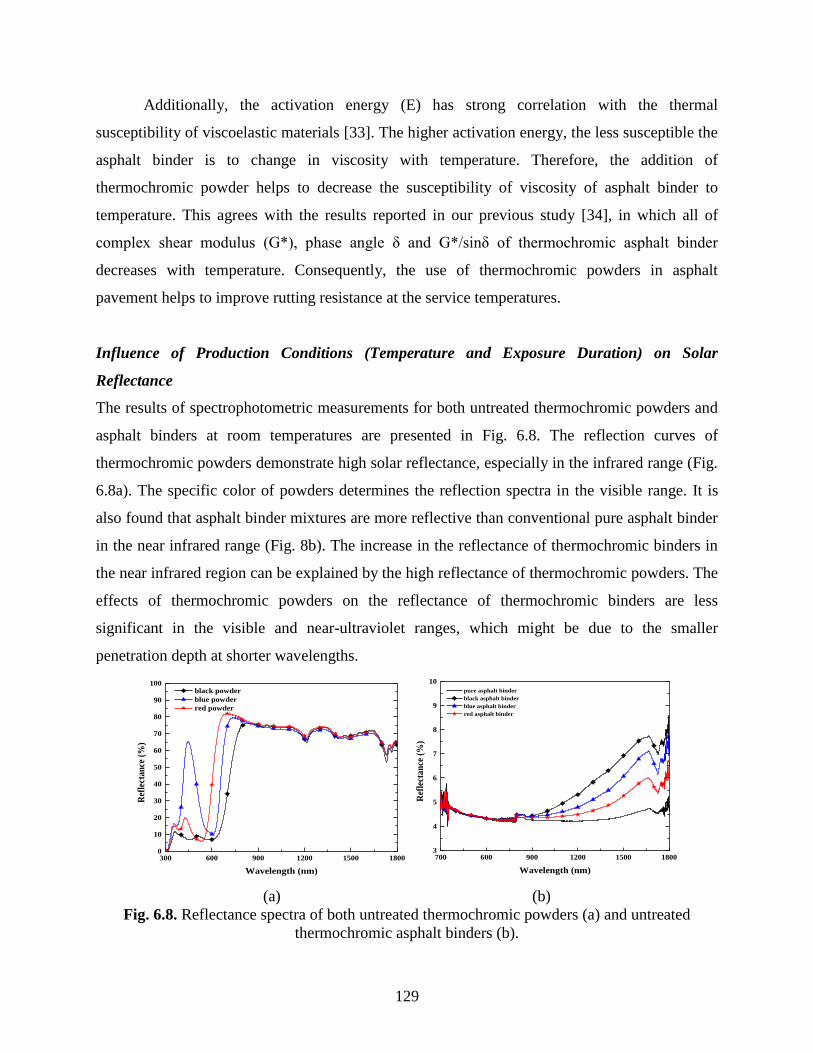
129
Additionally, the activation energy (E) has strong correlation with the thermal
susceptibility of viscoelastic materials [33]. The higher activation energy, the less susceptible the
asphalt binder is to change in viscosity with temperature. Therefore, the addition of
thermochromic powder helps to decrease the susceptibility of viscosity of asphalt binder to
temperature. This agrees with the results reported in our previous study [34], in which all of
complex shear modulus (G*), phase angle δ and G*/sinδ of thermochromic asphalt binder
decreases with temperature. Consequently, the use of thermochromic powders in asphalt
pavement helps to improve rutting resistance at the service temperatures.
Influence of Production Conditions (Temperature and Exposure Duration) on Solar
Reflectance
The results of spectrophotometric measurements for both untreated thermochromic powders and
asphalt binders at room temperatures are presented in Fig. 6.8. The reflection curves of
thermochromic powders demonstrate high solar reflectance, especially in the infrared range (Fig.
6.8a). The specific color of powders determines the reflection spectra in the visible range. It is
also found that asphalt binder mixtures are more reflective than conventional pure asphalt binder
in the near infrared range (Fig. 8b). The increase in the reflectance of thermochromic binders in
the near infrared region can be explained by the high reflectance of thermochromic powders. The
effects of thermochromic powders on the reflectance of thermochromic binders are less
significant in the visible and near-ultraviolet ranges, which might be due to the smaller
penetration depth at shorter wavelengths.
300 600 900 1200 1500 18000
10
20
30
40
50
60
70
80
90
100
Ref
lect
an
ce (
%)
Wavelength (nm)
black powder
blue powder
red powder
700 600 900 1200 1500 18003
4
5
6
7
8
9
10
Ref
lect
an
ce (
%)
Wavelength (nm)
pure asphalt binder
black asphalt binder
blue asphalt binder
red asphalt binder
(a) (b)
Fig. 6.8. Reflectance spectra of both untreated thermochromic powders (a) and untreated
thermochromic asphalt binders (b).
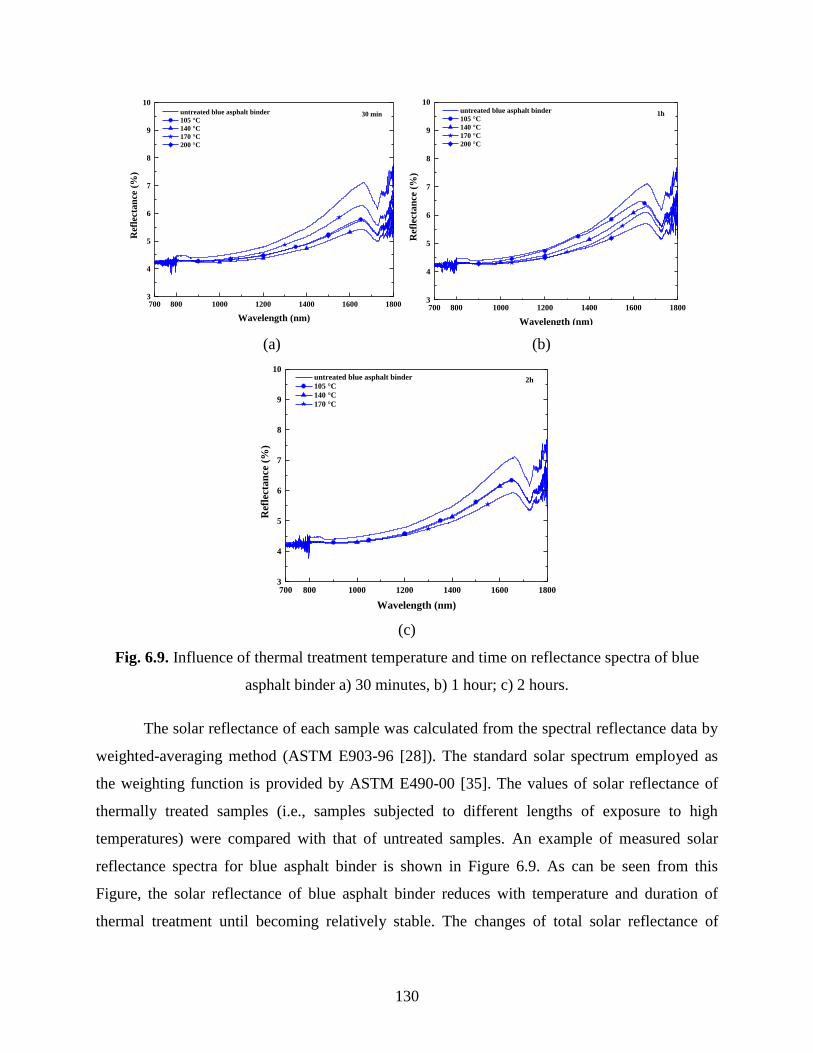
130
700 800 1000 1200 1400 1600 18003
4
5
6
7
8
9
10
30 min
Ref
lect
an
ce (
%)
Wavelength (nm)
untreated blue asphalt binder
105 °C
140 °C
170 °C
200 °C
700 800 1000 1200 1400 1600 18003
4
5
6
7
8
9
10
1h
Ref
lect
an
ce (
%)
Wavelength (nm)
untreated blue asphalt binder
105 °C
140 °C
170 °C
200 °C
(a) (b)
700 800 1000 1200 1400 1600 18003
4
5
6
7
8
9
10
Ref
lect
an
ce (
%)
Wavelength (nm)
untreated blue asphalt binder
105 °C
140 °C
170 °C
2h
(c)
Fig. 6.9. Influence of thermal treatment temperature and time on reflectance spectra of blue
asphalt binder a) 30 minutes, b) 1 hour; c) 2 hours.
The solar reflectance of each sample was calculated from the spectral reflectance data by
weighted-averaging method (ASTM E903-96 [28]). The standard solar spectrum employed as
the weighting function is provided by ASTM E490-00 [35]. The values of solar reflectance of
thermally treated samples (i.e., samples subjected to different lengths of exposure to high
temperatures) were compared with that of untreated samples. An example of measured solar
reflectance spectra for blue asphalt binder is shown in Figure 6.9. As can be seen from this
Figure, the solar reflectance of blue asphalt binder reduces with temperature and duration of
thermal treatment until becoming relatively stable. The changes of total solar reflectance of
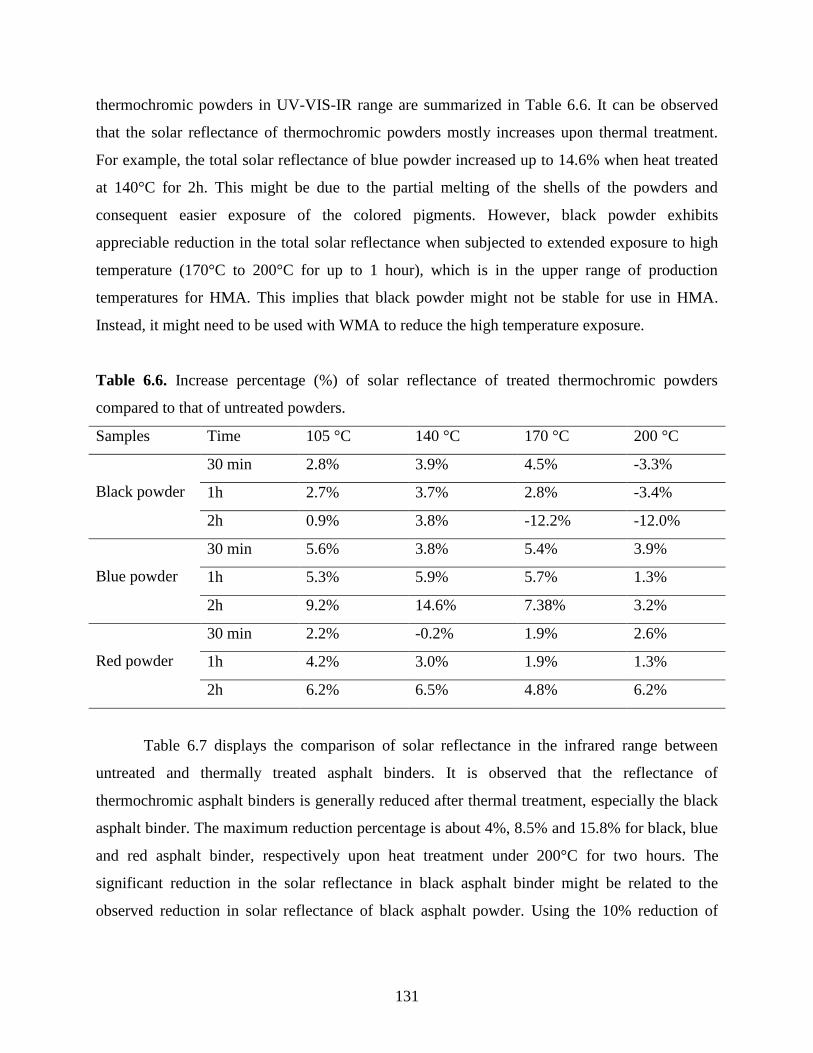
131
thermochromic powders in UV-VIS-IR range are summarized in Table 6.6. It can be observed
that the solar reflectance of thermochromic powders mostly increases upon thermal treatment.
For example, the total solar reflectance of blue powder increased up to 14.6% when heat treated
at 140°C for 2h. This might be due to the partial melting of the shells of the powders and
consequent easier exposure of the colored pigments. However, black powder exhibits
appreciable reduction in the total solar reflectance when subjected to extended exposure to high
temperature (170°C to 200°C for up to 1 hour), which is in the upper range of production
temperatures for HMA. This implies that black powder might not be stable for use in HMA.
Instead, it might need to be used with WMA to reduce the high temperature exposure.
Table 6.6. Increase percentage (%) of solar reflectance of treated thermochromic powders
compared to that of untreated powders.
Samples Time 105 °C 140 °C 170 °C 200 °C
Black powder
30 min 2.8% 3.9% 4.5% -3.3%
1h 2.7% 3.7% 2.8% -3.4%
2h 0.9% 3.8% -12.2% -12.0%
Blue powder
30 min 5.6% 3.8% 5.4% 3.9%
1h 5.3% 5.9% 5.7% 1.3%
2h 9.2% 14.6% 7.38% 3.2%
Red powder
30 min 2.2% -0.2% 1.9% 2.6%
1h 4.2% 3.0% 1.9% 1.3%
2h 6.2% 6.5% 4.8% 6.2%
Table 6.7 displays the comparison of solar reflectance in the infrared range between
untreated and thermally treated asphalt binders. It is observed that the reflectance of
thermochromic asphalt binders is generally reduced after thermal treatment, especially the black
asphalt binder. The maximum reduction percentage is about 4%, 8.5% and 15.8% for black, blue
and red asphalt binder, respectively upon heat treatment under 200°C for two hours. The
significant reduction in the solar reflectance in black asphalt binder might be related to the
observed reduction in solar reflectance of black asphalt powder. Using the 10% reduction of
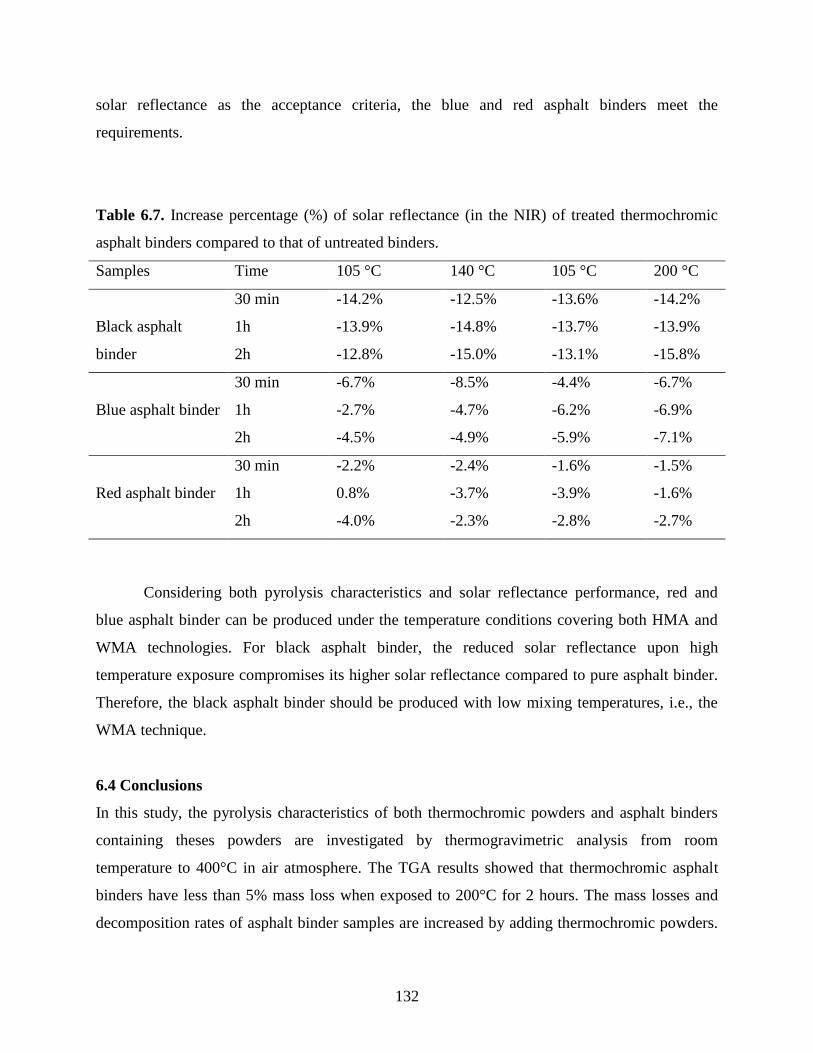
132
solar reflectance as the acceptance criteria, the blue and red asphalt binders meet the
requirements.
Table 6.7. Increase percentage (%) of solar reflectance (in the NIR) of treated thermochromic
asphalt binders compared to that of untreated binders.
Samples Time 105 °C 140 °C 105 °C 200 °C
Black asphalt
binder
30 min -14.2% -12.5% -13.6% -14.2%
1h -13.9% -14.8% -13.7% -13.9%
2h -12.8% -15.0% -13.1% -15.8%
Blue asphalt binder
30 min -6.7% -8.5% -4.4% -6.7%
1h -2.7% -4.7% -6.2% -6.9%
2h -4.5% -4.9% -5.9% -7.1%
Red asphalt binder
30 min -2.2% -2.4% -1.6% -1.5%
1h 0.8% -3.7% -3.9% -1.6%
2h -4.0% -2.3% -2.8% -2.7%
Considering both pyrolysis characteristics and solar reflectance performance, red and
blue asphalt binder can be produced under the temperature conditions covering both HMA and
WMA technologies. For black asphalt binder, the reduced solar reflectance upon high
temperature exposure compromises its higher solar reflectance compared to pure asphalt binder.
Therefore, the black asphalt binder should be produced with low mixing temperatures, i.e., the
WMA technique.
6.4 Conclusions
In this study, the pyrolysis characteristics of both thermochromic powders and asphalt binders
containing theses powders are investigated by thermogravimetric analysis from room
temperature to 400°C in air atmosphere. The TGA results showed that thermochromic asphalt
binders have less than 5% mass loss when exposed to 200°C for 2 hours. The mass losses and
decomposition rates of asphalt binder samples are increased by adding thermochromic powders.
133
The kinetic mechanism of both thermochromic powder and asphalt binder samples is best
described by the three dimensional diffusion mechanism model. The kinetic parameters of
activation energy and pre-exponential factor of asphalt binder are increased by adding
thermochromic powders. The increase of activation energy helps to reduce susceptibility of
viscosity of asphalt binder to temperature, potentially improving the rutting resistance of asphalt
pavement.
The confocal image demonstrated the rough morphology of thermochromic asphalt
binder and the lack of physical interactions between thermochromic powders and binder matrix.
The thermal treatment at 200°C for two hours changed the microstructure of the binder matrix.
Meanwhile, FTIR spectra revealed that thermochromic asphalt binder features similar functional
groups as the pure asphalt binder except the N-H bond due to thermochromic powders. This
implies there are no strong chemical interactions between thermochromic powders and asphalt
binder. The optical reflectance spectra of thermochromic binders before and after thermal
treatment were measured. In general, the optical reflectance of thermochromic binders reduced
after thermal treatment. The blue and red asphalt binders present less percentage reduction of
solar reflectance than black asphalt binder under typical production temperature of asphalt.
Considering the influence of production temperatures on the morphology, chemical stability,
thermal stability, and performance of solar reflectance of thermochromic binders, blue and red
asphalt binders can be produced with typical HMA and WMA mixing temperatures, while black
asphalt binder has to be produced at lower temperature, i.e., the WMA mixing procedures.
134
6.5 References
(1) Santamouris, M., Pavlou, K., Synnefa, A., Niachou, K., Kolokotsa, D. Recent progress on
passive cooling techniques: Advanced technological developments to improve survivability
levels in low-income households. Energy and Buildings, 2007, 39(7): 859-866.
(2) Synnefa, A., Dandou, A., Santamouris, M., Tombrou, M., Soulakellis, N. Large scale
albedo changes using cool materials to mitigate heat island in Athens. Journal of Applied
Meteorology and Climatology, 2008, 47(11): 2846-2856.
(3) Doulos, L., Santamouris, M., Livada, I. Passive cooling of outdoor urban spaces. The role
of materials. Solar Energy, 2004, 77(2): 231-249.
(4) Yoder, E. J. and Witzak, M. W. Principles of Pavement Design. New York, NY: Wiley and
Sons, 1975.
(5) Gui, J., Phelan, P. E., Kaloush, K. E., Golden, J. S. Impact of Pavement Thermophysical
Properties on Surface Temperatures. Journal of Materials in Civil Engineering, 2007, 19(8):
683-690.
(6) Pomerantz, M. and Akbari. H. Cooler Paving Materials for Heat Island Mitigation. In 1998
ACEEE Summer Study on Energy Efficiency in Buildings, Asilomar, CA, City: American
Council for an Energy-Efficient Economy, 1998.
(7) Pomerantz, M., Akbari, H. Cooler paving materials for heat island mitigation, in:
Proceedings of the 1998 ACEEE Summer Study on Energy Efficiency in Buildings, vol. 9,
Pacific Grove, CA, 1998, 135.
(8) Pomerantz, M., Akbari, H., Chen, A., Taha, H., Rosenfeld, A. Paving Materials for Heat
Island Mitigation. Lawrence Berkeley National Laboratory Report LBL- 38074, Berkeley,
CA, 1997.
(9) Pomerantz, M., Akbari, H., Harvey, J. T. Cooler reflective pavements give benefits beyond
energy savings: Durability and illumination. Report No. LBNL-45370, Berkeley, CA, 2000,
14.
(10) Kinouchi, T., Yoshinaka, T., Fukae, N., Kanda, M. Development of cool pavement with
dark colored high albedo coating. Fifth Conference for the Urban Environment, Vancouver,
Canada, 2004.
(11) Hao, P.W., Zhang, D.L., Hu, X.N. Evaluation method for low temperature anticracking

135
performance of asphalt mixture. Journal of Xi'an Highway University, 2000, 20 (3):1-5.
(12) Kanerva, H.K., VINSON, T.S., Zeng, H. Low Temperature Cracking Field Validation of the
Thermal Stress Rest Rained Specimen Test. R. SHRP-A-401, 1994.
(13) Hu, J.Y., Yu, X. Experimental Study of Sustainable Asphalt Binder: Influence of
Thermochromic Materials. Journal of Transportation Research Record, 2013, 3(2372): 108-
115.
(14) Hu, J.Y., Yu, X. Innovative Chromogenic Materials for Pavement Life Extension: Modeling
Study of Surface Temperature of Sustainable Asphalt Pavement. International Journal of
Pavement Research and Technology, 2013, 6(2): 141-146.
(15) Santamouris, M., Synnefa, A., Kolokotsa, D., Dimitriou, V., Apostolakis, K. Passive
cooling of the built environment - use of innovative reflective materials to fight heat island
and decrease cooling needs. International Journal Low Carbon Technologies, 2008, 3(2):
71-82.
(16) Karlessi, T., Santamouris, M., Apostolakis, K., Synnefa, A., Livada, I. Development and
testing of thermochromic coatings for buildings and urban structures. Solar Energy, 2009,
83(4): 538-551.
(17) Granqvist, C.G. Materials Science for Solar Energy Conversion Systems. Pergamon press,
Oxford, 1991.
(18) Saeli, M., Piccirillo, C., Parkin, I. P., Binions, R., Ridley, I. Energy modelling studies of
thermochromic glazing. Energy and Buildings, 2010, 42(10): 1666-1673.
(19) Ma, Y. P. and Zhu, B.R. Research on the preparation of reversibly thermochromic cement
based materials at normal temperature. Cement and Concrete Research, 2009, 39(2): 90-94.
(20) Kinouchi, T., Santamouris, M. Improving the performance of thermochromic coatings with
the use of UV and optical filters tested under accelerated aging conditions. International
Journal of Low-Carbon Technologies, 2013.
(21) Rodriguez, R.P., Sierens, R., Verhelst, S. Thermal and kinetic evaluation of biodiesel
derived from soybean oil and higuereta oil. Journal of Thermal Analysis and Calorimetry,
2009, 96(3): 897-901.
(22) Liu, Q., Wang, S.R., Zheng, Y., Luo, Z.Y., Cen K. Mechanism study of wood lignin
pyrolysis by using TG–FTIR analysis. Journal of Analytical and Applied Pyrolysis, 2008,
82(1): 170-177.
136
(23) Aboulkas, A., Harfi, K.E. Bouadili, A.E., Chanâa, M.B., Mokhlisse, A. Pyrolysis kinetics of
polypropylene: Morocco oil shale and their mixture. Journal of Thermal Analysis and
Calorimetry, 2007, 89(1): 203-209.
(24) Mothe´, M. G., Leite, L.F. M., Cheila, G. Thermal characterization of asphalt mixtures by
TG/DTG, DTA and FTIR. Journal of Thermal Analysis and Calorimetry, 2008, 93(1): 105-
109.
(25) Xu, T. Huang, X.M. Pyrolysis Properties and Kinetic Model of an Asphalt Binder
Containing a Flame Retardant. Journal of Applied Polymer Science, 2011, 119(5): 2661-
2665.
(26) Naskara, M., Chaki, T.K., Reddy, K.S. Effect of waste plastic as modifier on thermal
stability and -degradation kinetics of bitumen/waste plastics blend. Thermochimica Acta,
2010, 509(1–2): 128-134.
(27) Newcomb, D. An Introduction to Warm-Mix Asphalt. National Asphalt Pavement
Association, Accessed from http://fs1.hotmix.org/mbc/Introduction_to_Warm-
mix_Asphalt.pdf, August 8, 2007.
(28) ASTM E903-96. Standard test method for solar absorptance, reflectance, and transmittance
of materials using integrating spheres. Technical Report, American Society for Testing and
Materials, 1996.
(29) Han, X.X., Jiang, X.M., Cui, Z.G. Thermal analysis studies on combustion mechanism of
oil shale. Journal of Thermal Analysis and Calorimetry, 2006, 84(3): 631-636.
(30) Liu, N., Fan, W., Dobashi, R., Huang, L.S. Kinetic modeling of thermal decomposition of
natural cellulosic materials in air atmosphere. Journal of Analytical and Applied Pyrolysis,
2002, 63(2): 303-325.
(31) Nunez, L., Fraga, F., Nunez, M.R., Villanueva, M. Thermogravimetric study of the
decomposition process of the system BADGE (n=0)/1, 2 DCH. Polymer, 2000, 41(12):
4635-4641.
(32) Reading, M., Dollimore, D., Whitehead, R. The measurement of meaningful kinetic
parameters for solid state decomposition reactions. Journal of Thermal Analysis, 1991,
37(9): 2165-2188.
(33) Cong, P.L., Wang, J., Li, K., Chen, S.F. Physical and rheological properties of asphalt
binders containing various antiaging agents. Fuel, 2012, 97: 678-684.
137
(34) Hu, J.Y., Gao, Q., Yu, X. Characterization of the Optical and Mechanical Properties of
Innovative Multifunctional Thermochromic Asphalt Binders. Journal of Materials in Civil
Engineering, 2014.
(35) ASTM E490-00. Standard Solar Constant and Zero Air Mass Solar Spectral Irradiance
Tables. American society for Testing and Materials, 2000.

138
CHAPTER SEVEN
OUTDOOR EVALUATION OF THE PERFORMANCE OF THERMOCHROMIC ASPHALT
CONCRETE IN MODULATING PAVEMENT SURFACE TEMPERATURE
This study evaluated the performance of the thermochromic asphalt binder on surface
temperatures of pavement to assess its durability and sustainability. Comparison studies were
performed that include the outdoor thermal performance of conventional asphalt concrete and
asphalt concrete containing black, blue and red thrmochromic materials. The study was operated
between spring and summer 2015. Surface temperatures of comparison samples were monitored
to investigate the thermal performance of thermochromic asphalt concrete. The results show that
the surface temperature of thermochromic asphalt concrete was cooler than conventional asphalt
concrete under hot summer conditions up to 6°C, 6.2°C and 3.6°C and warmer during the
evening up to 0.4°C, 1.7°C and 1.8°C by using black, blue and red thermochromic materials,
respectively. Besides, the temperature fluctuation of asphalt concrete was found to be reduced up
to 5°C, 4°C and 3°C by using black, blue and red thermochromic materials, respectively.
Furthermore, compared to conventional asphalt concrete, thermochromic asphalt concrete
reduced the rate of heating and cooling. These demonstrate the potential of thermochromic
asphalt concrete to improve the durability of the pavement, reduce the environmental impacts,
and mitigate ice related safety issues on the road. This demonstrates innovation for development
of sustainable and environmental benign infrastructure.
7.1 Introduction
The use of asphalt pavement accounts for approximately 94% of US roads (1). As a
thermoplastic material, asphalt becomes brittle at low temperatures and becomes soft at high
temperatures. Studies (i.e., (2-4)) measured surface temperature as high as 48-67 °C during
summer. The increased temperature in summer impacts durability of asphalt pavement by
accelerating various distress mechanisms (i.e., rutting, shoving, aging, fatigue damage, bleeding)
(5). A potential way to improve durability that aroused interest in the past years is the use of
materials that present high solar reflectivity to develop cool pavement. Cool pavement has been
developed by using cool materials with high reflectivity and emissivity to the solar radiation.

139
Studies (6-10) show that cool pavement presents lower surface temperatures, resulting in
increased service life (durability) of pavements. However, the reduced temperature of asphalt
pavement exacerbates low temperature cracking during the winter period (11-12), which
compromise the service life of the road. Additionally, the lower temperature is conductive to ice
formation in cold weather. Therefore, it is necessary to develop a new technique to make asphalt
pavement cooler during summer and warmer during winter.
An innovative strategy the researchers pioneered is the use of thermochromic materials to create
new materials possessing desirable solar reflectance, i.e., they reflect more solar energy at high
temperature and reflect less solar energy at low temperature (13-14). Thermochromic materials
are substances that can change their colors in response to temperature. They feature high solar
reflectance in summer and high solar absorption in winter. These properties make them attractive
for urban and building applications (15-19) to improve the urban microclimate, decrease the
energy demands of the buildings, and provide a thermally comfortable indoor environment.
The objective of this study is to study the thermal performance of asphalt mixture containing
thermochromic materials, which could modulate the pavement surface temperature according to
environmental temperatures and therefore extend service life of the pavement. In this study, the
surface temperatures of both conventional and thermochromic asphalt concretes are measured on
24 h basis between April and June, 2014. The influence of themochromic materials on surface
temperature and temperature fluctuation are evaluated by comparing surface temperature of
thermochromic asphalt concrete with that of conventional asphalt concrete under different
weather conditions. Example is given to evaluate the influence of thermochromic materials on
rate of temperature change of the pavement on a typically summer day.
7.2 Experiment
Materials and Preparation
Asphalt binder used in this study is supplied by Kokosing Materials Inc. and classified as
Superpave grade, PG64-22. Thermochromic powders were manufactured by Hali Industrial
Corporation Ltd. Red, blue and black thermochromic powders with transition temperature
around 31 °C were chosen for this study. The powders have particle sizes in the range of 3 ~ 10
μm. The molecular structures of thermochromic powders and their changes below and above
transition temperature are shown in Fig. 7.1. These powders were firstly mixed with asphalt
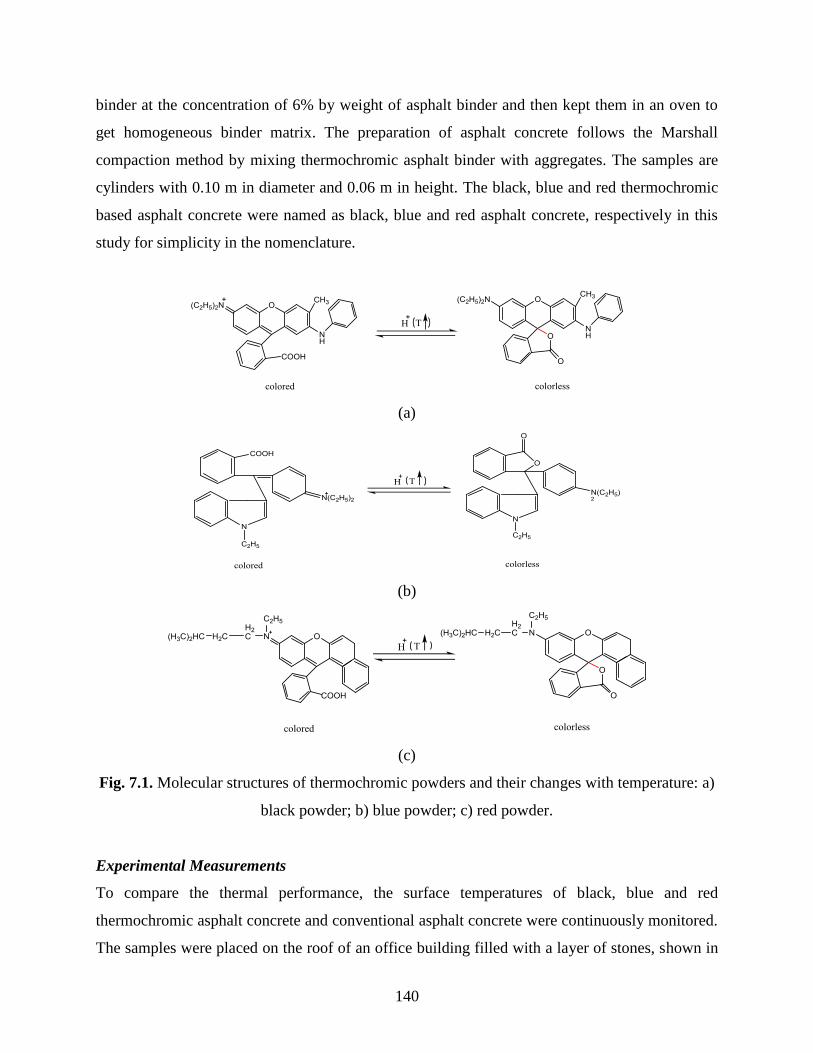
140
binder at the concentration of 6% by weight of asphalt binder and then kept them in an oven to
get homogeneous binder matrix. The preparation of asphalt concrete follows the Marshall
compaction method by mixing thermochromic asphalt binder with aggregates. The samples are
cylinders with 0.10 m in diameter and 0.06 m in height. The black, blue and red thermochromic
based asphalt concrete were named as black, blue and red asphalt concrete, respectively in this
study for simplicity in the nomenclature.
(a)
(b)
(c)
Fig. 7.1. Molecular structures of thermochromic powders and their changes with temperature: a)
black powder; b) blue powder; c) red powder.
Experimental Measurements
To compare the thermal performance, the surface temperatures of black, blue and red
thermochromic asphalt concrete and conventional asphalt concrete were continuously monitored.
The samples were placed on the roof of an office building filled with a layer of stones, shown in
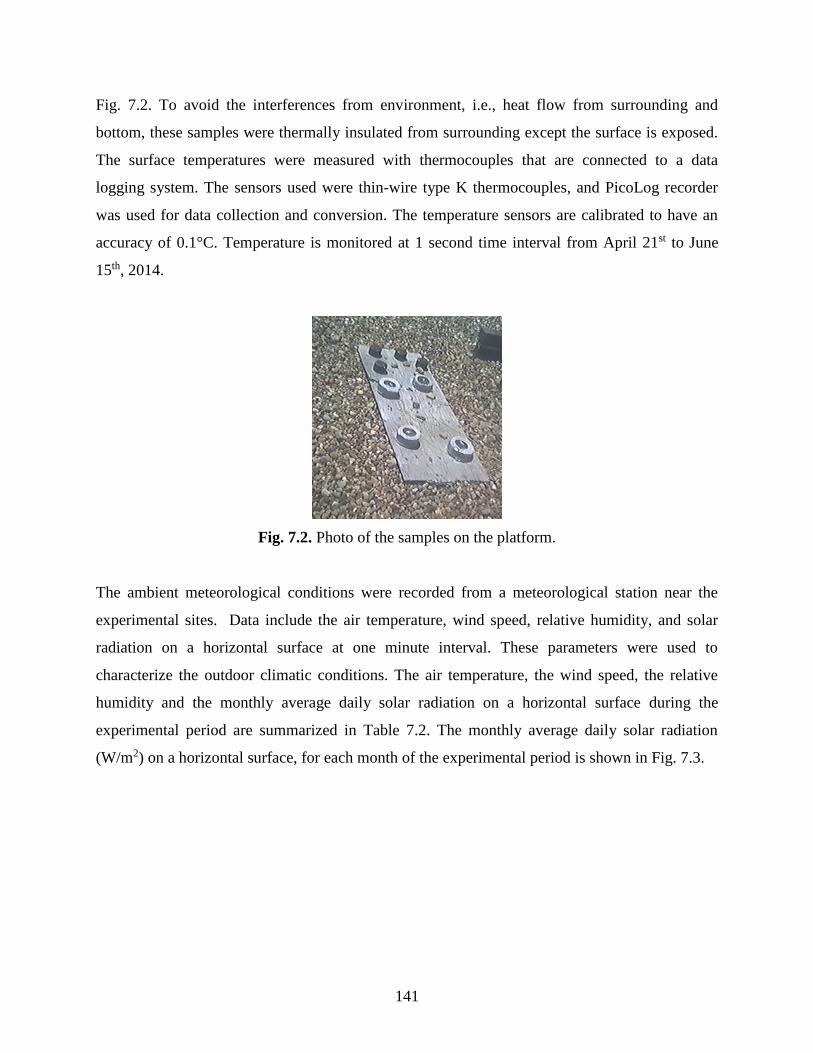
141
Fig. 7.2. To avoid the interferences from environment, i.e., heat flow from surrounding and
bottom, these samples were thermally insulated from surrounding except the surface is exposed.
The surface temperatures were measured with thermocouples that are connected to a data
logging system. The sensors used were thin-wire type K thermocouples, and PicoLog recorder
was used for data collection and conversion. The temperature sensors are calibrated to have an
accuracy of 0.1°C. Temperature is monitored at 1 second time interval from April 21st to June
15th, 2014.
Fig. 7.2. Photo of the samples on the platform.
The ambient meteorological conditions were recorded from a meteorological station near the
experimental sites. Data include the air temperature, wind speed, relative humidity, and solar
radiation on a horizontal surface at one minute interval. These parameters were used to
characterize the outdoor climatic conditions. The air temperature, the wind speed, the relative
humidity and the monthly average daily solar radiation on a horizontal surface during the
experimental period are summarized in Table 7.2. The monthly average daily solar radiation
(W/m2) on a horizontal surface, for each month of the experimental period is shown in Fig. 7.3.
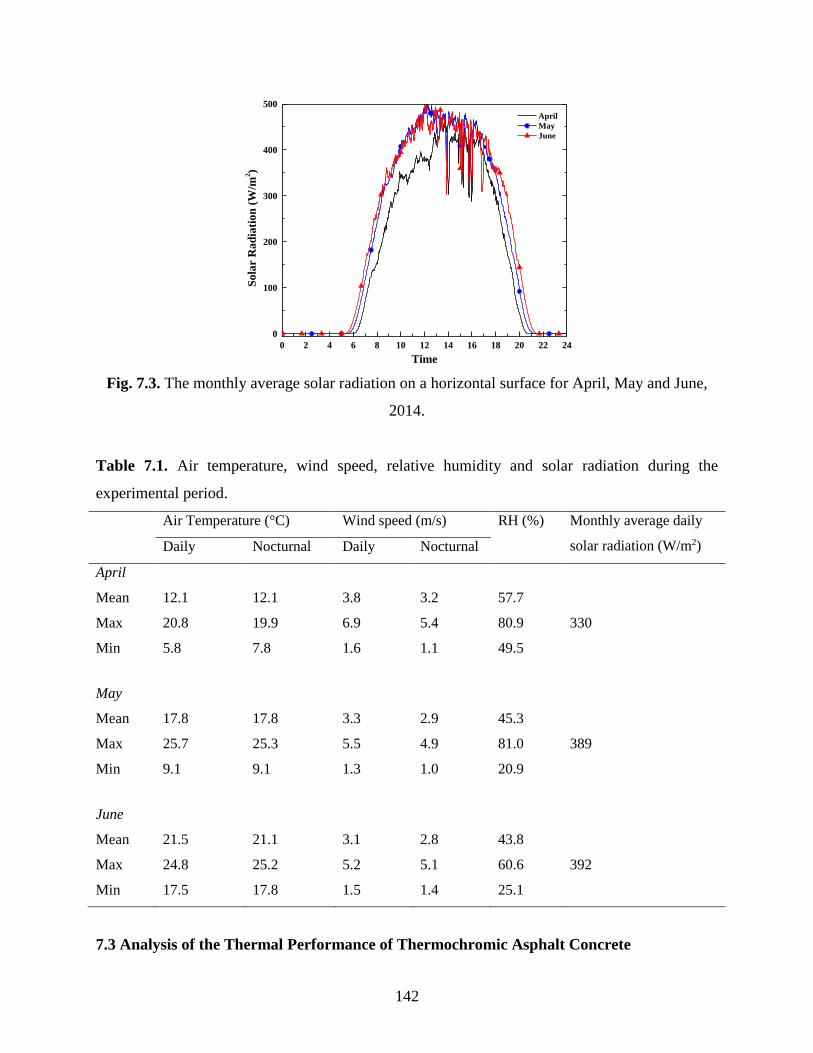
142
0 2 4 6 8 10 12 14 16 18 20 22 24
0
100
200
300
400
500
So
lar
Ra
dia
tio
n (
W/m
2)
Time
April
May
June
Fig. 7.3. The monthly average solar radiation on a horizontal surface for April, May and June,
2014.
Table 7.1. Air temperature, wind speed, relative humidity and solar radiation during the
experimental period.
Air Temperature (°C) Wind speed (m/s) RH (%) Monthly average daily
solar radiation (W/m2) Daily Nocturnal Daily Nocturnal
April
Mean 12.1 12.1 3.8 3.2 57.7
Max 20.8 19.9 6.9 5.4 80.9 330
Min 5.8 7.8 1.6 1.1 49.5
May
Mean 17.8 17.8 3.3 2.9 45.3
Max 25.7 25.3 5.5 4.9 81.0 389
Min 9.1 9.1 1.3 1.0 20.9
June
Mean 21.5 21.1 3.1 2.8 43.8
Max 24.8 25.2 5.2 5.1 60.6 392
Min 17.5 17.8 1.5 1.4 25.1
7.3 Analysis of the Thermal Performance of Thermochromic Asphalt Concrete
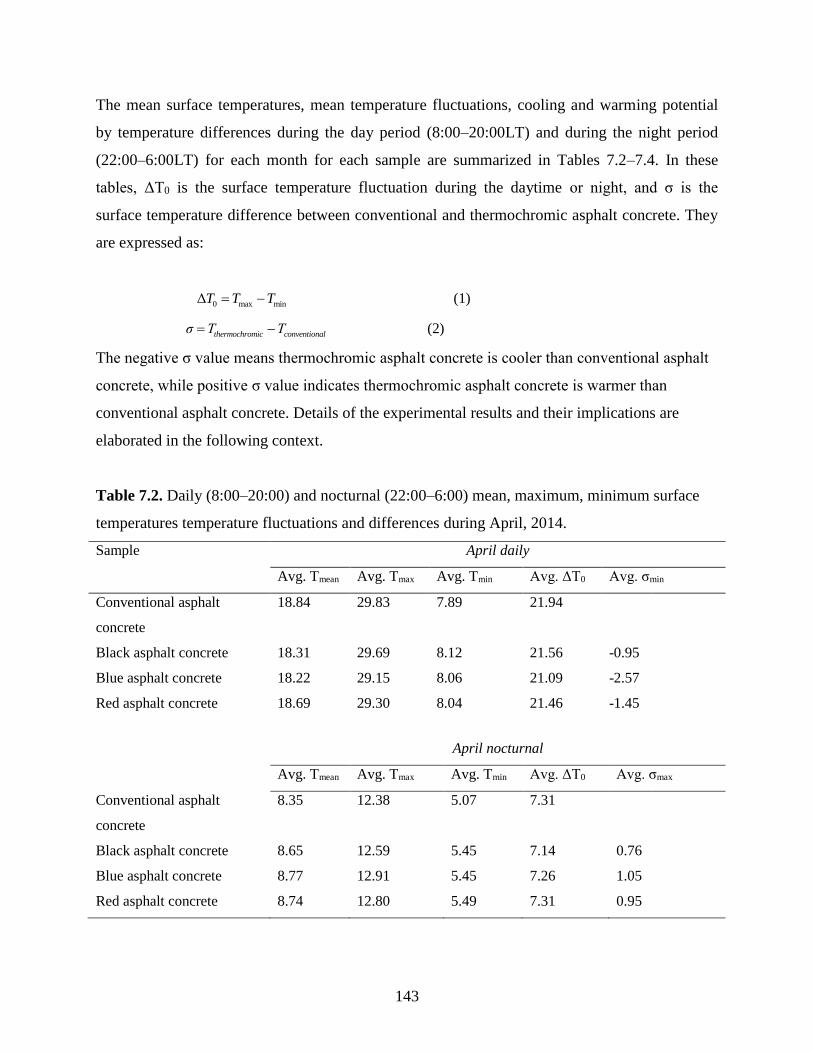
143
The mean surface temperatures, mean temperature fluctuations, cooling and warming potential
by temperature differences during the day period (8:00–20:00LT) and during the night period
(22:00–6:00LT) for each month for each sample are summarized in Tables 7.2–7.4. In these
tables, ΔT0 is the surface temperature fluctuation during the daytime or night, and σ is the
surface temperature difference between conventional and thermochromic asphalt concrete. They
are expressed as:
0 max minΔT T T (1)
thermochromic conventionalσ T T (2)
The negative σ value means thermochromic asphalt concrete is cooler than conventional asphalt
concrete, while positive σ value indicates thermochromic asphalt concrete is warmer than
conventional asphalt concrete. Details of the experimental results and their implications are
elaborated in the following context.
Table 7.2. Daily (8:00–20:00) and nocturnal (22:00–6:00) mean, maximum, minimum surface
temperatures temperature fluctuations and differences during April, 2014.
Sample April daily
Avg. Tmean Avg. Tmax Avg. Tmin Avg. ΔT0 Avg. σmin
Conventional asphalt
concrete
18.84 29.83 7.89 21.94
Black asphalt concrete 18.31 29.69 8.12 21.56 -0.95
Blue asphalt concrete 18.22 29.15 8.06 21.09 -2.57
Red asphalt concrete 18.69 29.30 8.04 21.46 -1.45
April nocturnal
Avg. Tmean Avg. Tmax Avg. Tmin Avg. ΔT0 Avg. σmax
Conventional asphalt
concrete
8.35 12.38 5.07 7.31
Black asphalt concrete 8.65 12.59 5.45 7.14 0.76
Blue asphalt concrete 8.77 12.91 5.45 7.26 1.05
Red asphalt concrete 8.74 12.80 5.49 7.31 0.95
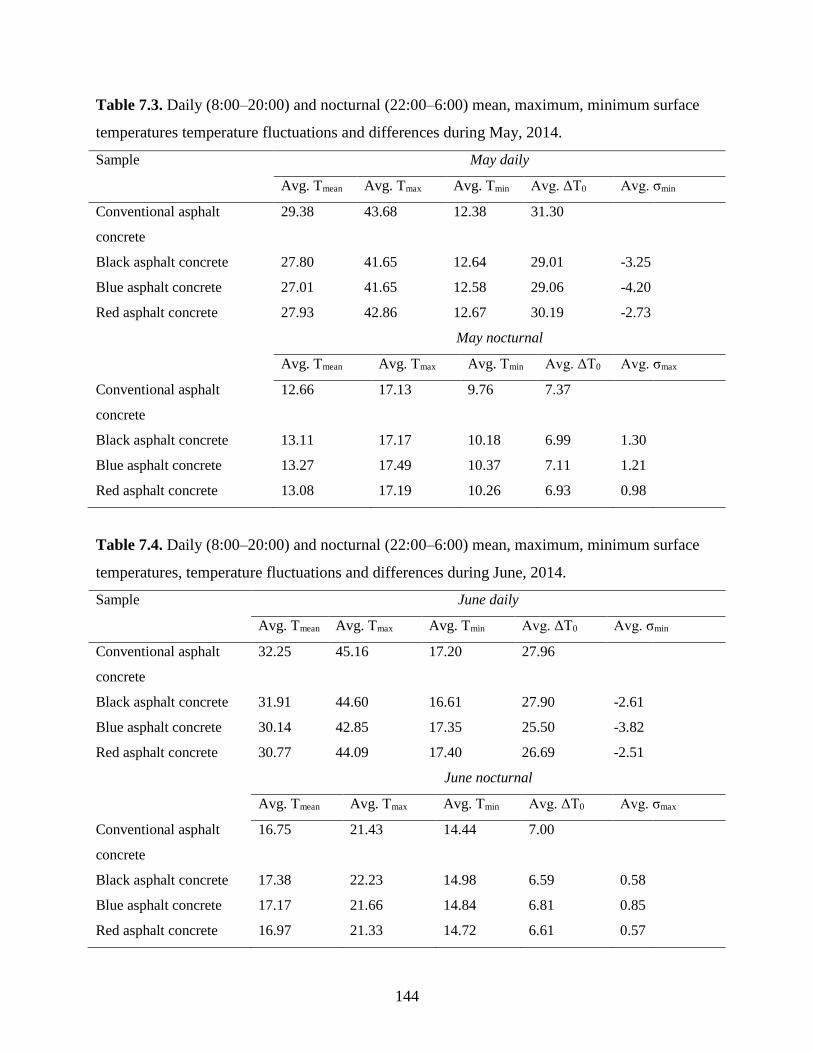
144
Table 7.3. Daily (8:00–20:00) and nocturnal (22:00–6:00) mean, maximum, minimum surface
temperatures temperature fluctuations and differences during May, 2014.
Sample May daily
Avg. Tmean Avg. Tmax Avg. Tmin Avg. ΔT0 Avg. σmin
Conventional asphalt
concrete
29.38 43.68 12.38 31.30
Black asphalt concrete 27.80 41.65 12.64 29.01 -3.25
Blue asphalt concrete 27.01 41.65 12.58 29.06 -4.20
Red asphalt concrete 27.93 42.86 12.67 30.19 -2.73
May nocturnal
Avg. Tmean Avg. Tmax Avg. Tmin Avg. ΔT0 Avg. σmax
Conventional asphalt
concrete
12.66 17.13 9.76 7.37
Black asphalt concrete 13.11 17.17 10.18 6.99 1.30
Blue asphalt concrete 13.27 17.49 10.37 7.11 1.21
Red asphalt concrete 13.08 17.19 10.26 6.93 0.98
Table 7.4. Daily (8:00–20:00) and nocturnal (22:00–6:00) mean, maximum, minimum surface
temperatures, temperature fluctuations and differences during June, 2014.
Sample June daily
Avg. Tmean Avg. Tmax Avg. Tmin Avg. ΔT0 Avg. σmin
Conventional asphalt
concrete
32.25 45.16 17.20 27.96
Black asphalt concrete 31.91 44.60 16.61 27.90 -2.61
Blue asphalt concrete 30.14 42.85 17.35 25.50 -3.82
Red asphalt concrete 30.77 44.09 17.40 26.69 -2.51
June nocturnal
Avg. Tmean Avg. Tmax Avg. Tmin Avg. ΔT0 Avg. σmax
Conventional asphalt
concrete
16.75 21.43 14.44 7.00
Black asphalt concrete 17.38 22.23 14.98 6.59 0.58
Blue asphalt concrete 17.17 21.66 14.84 6.81 0.85
Red asphalt concrete 16.97 21.33 14.72 6.61 0.57

145
7.4 Influence of Thermochromic Materials on the Surface Temperatures
The Modulation of Surface Temperatures
Comparing Tables 7.2–7.4 with Table 7.1, the daily average temperature of the asphalt concrete
samples is higher than the daily average air temperature during daytime, and the average
nocturnal temperature of asphalt concrete is lower than that of the nocturnal air temperature.
Specifically, during the three month period studied, during the daytime, the average surface
temperature of conventional asphalt concrete is 6.7–11.6°C warmer than air temperature, while
thermochromic asphalt concrete is 6.1–10.4°C warmer. During the evening, conventional asphalt
concrete is 3.8–5.1°C colder than air temperature, and thermochromic asphalt concrete is 3.4–
4.7°C colder. The temperature difference between asphalt concrete and ambient air might be
attributed to the large solar absorption of asphalt binder at daytime and its large emissivity in the
evening.
Interestingly, from Tables 7.2-7.4, the average surface temperature of thermochromic asphalt
concrete is lower than that of the conventional asphalt concrete during daytime; while it is higher
during evening. For example, during the 2nd month of the experimental period (i.e. May), the
average daily surface temperature on black, blue and red asphalt concrete is 3.25, 4.20, 2.73°C
lower than traditional asphalt concrete, respectively. This shows that the thermochromic asphalt
concrete helps to reduce the surface temperature of pavement during high temperature. On the
other hand, during the evening when the air temperature is low, the surface temperature of black,
blue and red asphalt concrete is 1.30, 1.21, 0.98°C higher than traditional asphalt concrete,
respectively. This indicates that the thermochromic asphalt concrete increases the surface
temperature of pavement under low temperature environment. Similar observations can be found
during the other study period (i.e., April and June). Among these thermochromic asphalt
concrete samples, it is observed higher temperature differences (σ) occur with blue asphalt
concrete, exhibiting superior thermal performance. It also needs to be noted that the data shown
in Table 7.2-7.4 are the average value of a whole month. The effects of temperature modulation
by thermochromic materials are more significant for an individual day/time.
All the above-mentioned cooling and warm effects for thermochromic asphalt concrete can be
explained by the higher solar reflectance at high temperature and temperature-dependent thermal
properties of thermochromic materials, which have been shown in our previous study (18-19).
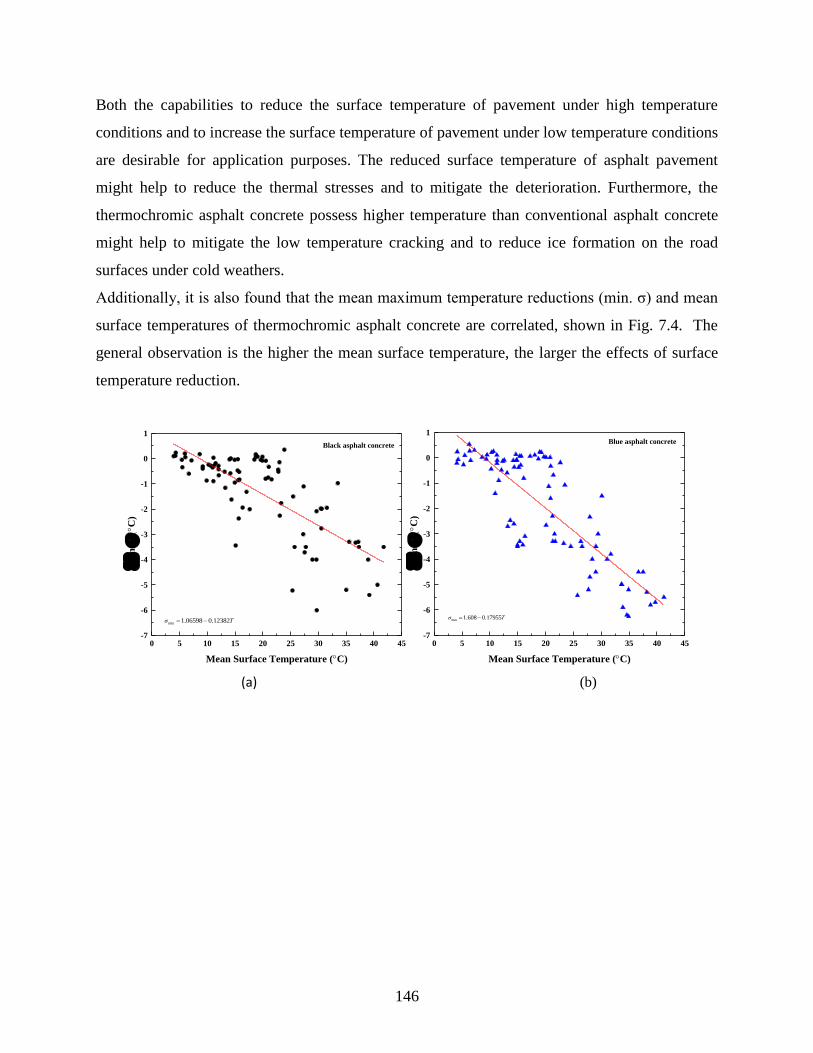
146
Both the capabilities to reduce the surface temperature of pavement under high temperature
conditions and to increase the surface temperature of pavement under low temperature conditions
are desirable for application purposes. The reduced surface temperature of asphalt pavement
might help to reduce the thermal stresses and to mitigate the deterioration. Furthermore, the
thermochromic asphalt concrete possess higher temperature than conventional asphalt concrete
might help to mitigate the low temperature cracking and to reduce ice formation on the road
surfaces under cold weathers.
Additionally, it is also found that the mean maximum temperature reductions (min. σ) and mean
surface temperatures of thermochromic asphalt concrete are correlated, shown in Fig. 7.4. The
general observation is the higher the mean surface temperature, the larger the effects of surface
temperature reduction.
0 5 10 15 20 25 30 35 40 45-7
-6
-5
-4
-3
-2
-1
0
1
Black asphalt concrete
in
. C
)
Mean Surface Temperature (C)
min 1.06598 0.12382σ T
0 5 10 15 20 25 30 35 40 45-7
-6
-5
-4
-3
-2
-1
0
1Blue asphalt concrete
in
. C
)
Mean Surface Temperature (C)
min 1.608 0.17955σ T
(a) (b)

147
0 5 10 15 20 25 30 35 40 45
-6
-5
-4
-3
-2
-1
0
1
Min
.C
)
Red asphalt concrete
Mean Surface Temperature (C)
min 0.72315 0.10335σ T
(c)
Fig. 7.4. Temperature reduction versus mean surface temperatures of (a) black, (b) blue and (c)
red thermochromic asphalt concrete.
Temperature Fluctuation (ΔT0) and Temperature Difference (σ)
The temperature fluctuations of asphalt pavement can have drastic impact on the durability and
functional lifetime due to thermal expansion and contraction. Fig. 7.5 presents the daily and
nocturnal temperature fluctuations (ΔT0) of various asphalt concrete samples from April to June.
It can be observed that the daily temperature fluctuation can decreased up to 5°C, 4°C and 3°C
by using black, blue and red asphalt concrete, respectively while the corresponding nocturnal
temperature fluctuation is decreased by 1.5°C, 1.1°C and 1.6°C. Such reduction of surface
temperature fluctuation of asphalt concrete with thermochromic materials will help to mitigate
distresses due to thermal loading including increasing the fatigue resistance of the pavement.
Besides, the factor of weathering is important regarding the thermal performance of the
pavement (i.e.-atmospheric pollution and biological growth, and other alterations like UV
radiation, sudden temperature swings and precipitation). From Fig. 7.5 it can be seen that for the
approximate 2 months of exposures, there is no clear degradation for the reduction function of
temperature fluctuations by using thermochromic materials. This might imply that the effect of
weathering is insignificant during the period of this study.
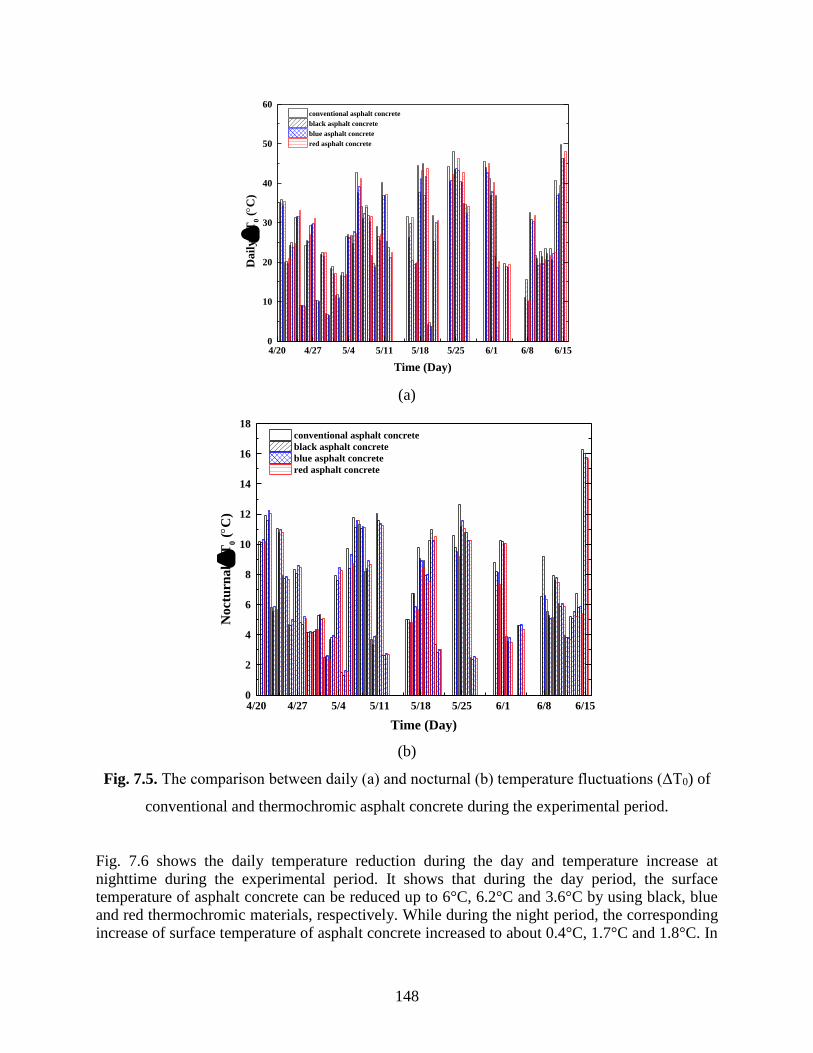
148
4/20 4/27 5/4 5/11 5/18 5/25 6/1 6/8 6/150
10
20
30
40
50
60
Da
ily
T
0 (C
)
Time (Day)
conventional asphalt concrete
black asphalt concrete
blue asphalt concrete
red asphalt concrete
(a)
4/20 4/27 5/4 5/11 5/18 5/25 6/1 6/8 6/150
2
4
6
8
10
12
14
16
18
No
ctu
rna
l
T0 (C
)
Time (Day)
conventional asphalt concrete
black asphalt concrete
blue asphalt concrete
red asphalt concrete
(b)
Fig. 7.5. The comparison between daily (a) and nocturnal (b) temperature fluctuations (ΔT0) of
conventional and thermochromic asphalt concrete during the experimental period.
Fig. 7.6 shows the daily temperature reduction during the day and temperature increase at nighttime during the experimental period. It shows that during the day period, the surface temperature of asphalt concrete can be reduced up to 6°C, 6.2°C and 3.6°C by using black, blue and red thermochromic materials, respectively. While during the night period, the corresponding increase of surface temperature of asphalt concrete increased to about 0.4°C, 1.7°C and 1.8°C. In
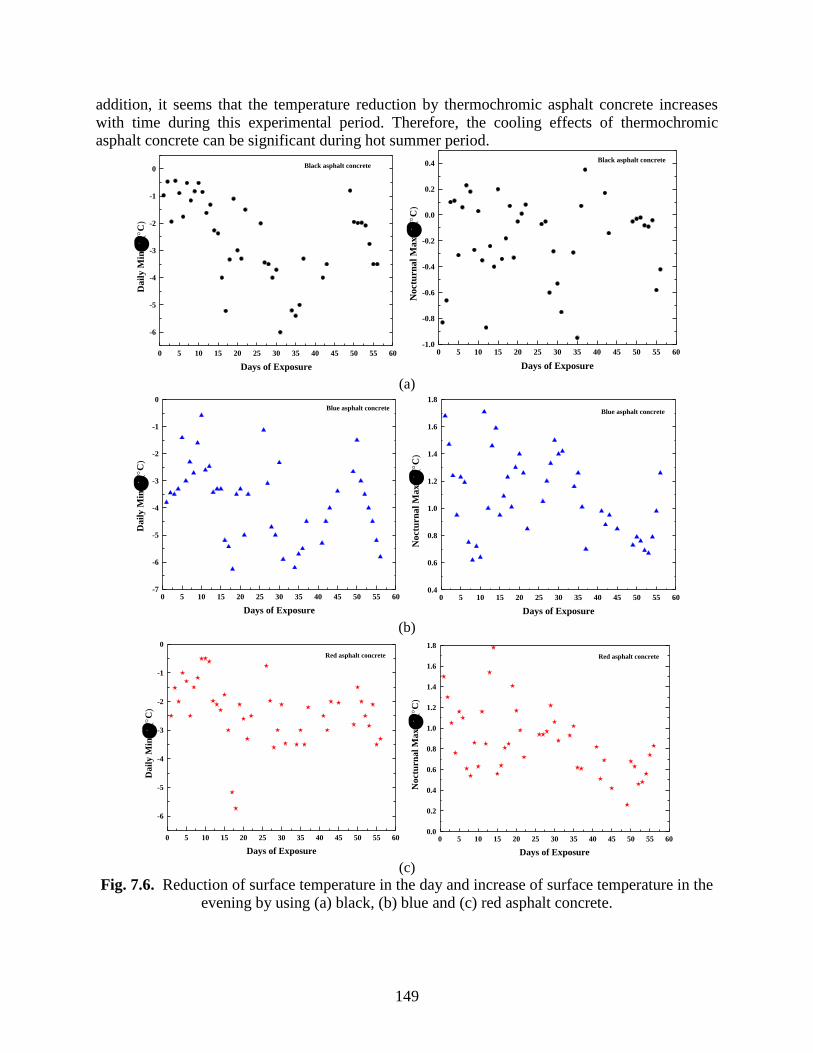
149
addition, it seems that the temperature reduction by thermochromic asphalt concrete increases with time during this experimental period. Therefore, the cooling effects of thermochromic asphalt concrete can be significant during hot summer period.
0 5 10 15 20 25 30 35 40 45 50 55 60
-6
-5
-4
-3
-2
-1
0Black asphalt concrete
Da
ily
Min
.
(C
)
Days of Exposure
0 5 10 15 20 25 30 35 40 45 50 55 60-1.0
-0.8
-0.6
-0.4
-0.2
0.0
0.2
0.4
Noct
urn
al
Max
.
(C
)
Black asphalt concrete
Days of Exposure
(a)
0 5 10 15 20 25 30 35 40 45 50 55 60-7
-6
-5
-4
-3
-2
-1
0
Days of Exposure
Da
ily
Min
.
(C
)
Blue asphalt concrete
0 5 10 15 20 25 30 35 40 45 50 55 600.4
0.6
0.8
1.0
1.2
1.4
1.6
1.8
N
oct
urn
al
Max
.
(C
)
Days of Exposure
Blue asphalt concrete
(b)
0 5 10 15 20 25 30 35 40 45 50 55 60
-6
-5
-4
-3
-2
-1
0
Days of Exposure
Da
ily
Min
.
(C
)
Red asphalt concrete
0 5 10 15 20 25 30 35 40 45 50 55 600.0
0.2
0.4
0.6
0.8
1.0
1.2
1.4
1.6
1.8
N
oct
urn
al
Ma
x.
(C
)
Days of Exposure
Red asphalt concrete
(c)
Fig. 7.6. Reduction of surface temperature in the day and increase of surface temperature in the evening by using (a) black, (b) blue and (c) red asphalt concrete.
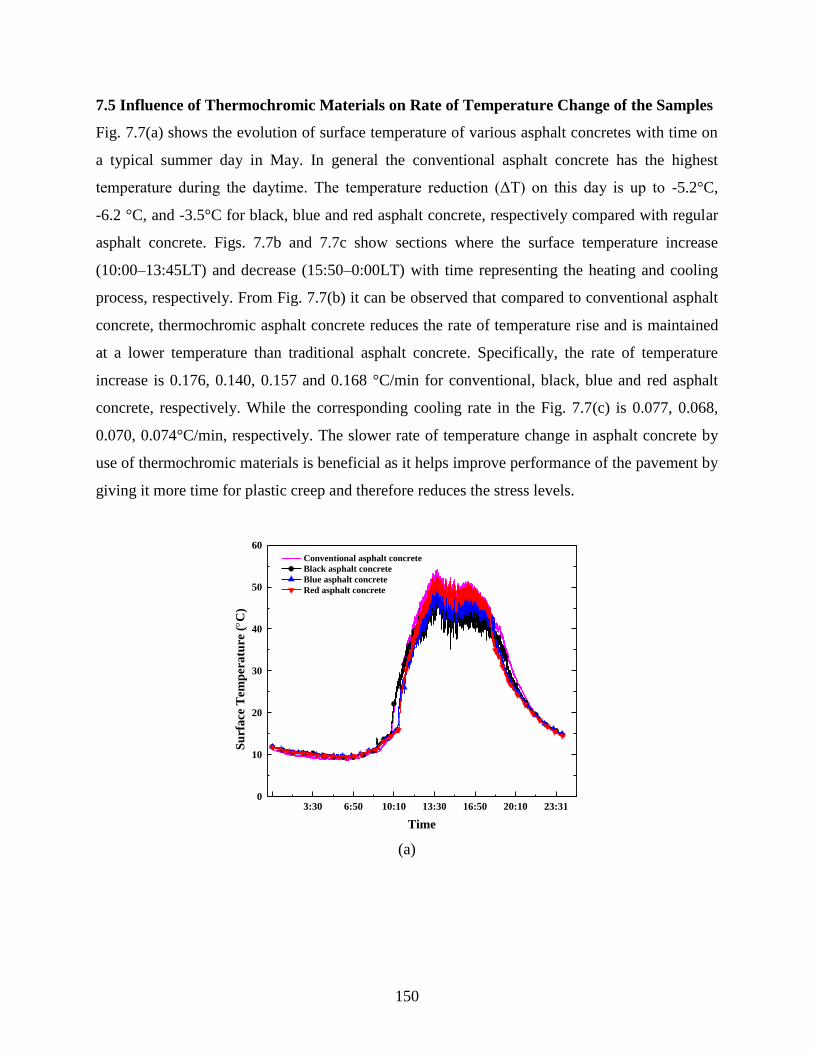
150
7.5 Influence of Thermochromic Materials on Rate of Temperature Change of the Samples
Fig. 7.7(a) shows the evolution of surface temperature of various asphalt concretes with time on
a typical summer day in May. In general the conventional asphalt concrete has the highest
temperature during the daytime. The temperature reduction (ΔT) on this day is up to -5.2°C,
-6.2 °C, and -3.5°C for black, blue and red asphalt concrete, respectively compared with regular
asphalt concrete. Figs. 7.7b and 7.7c show sections where the surface temperature increase
(10:00–13:45LT) and decrease (15:50–0:00LT) with time representing the heating and cooling
process, respectively. From Fig. 7.7(b) it can be observed that compared to conventional asphalt
concrete, thermochromic asphalt concrete reduces the rate of temperature rise and is maintained
at a lower temperature than traditional asphalt concrete. Specifically, the rate of temperature
increase is 0.176, 0.140, 0.157 and 0.168 °C/min for conventional, black, blue and red asphalt
concrete, respectively. While the corresponding cooling rate in the Fig. 7.7(c) is 0.077, 0.068,
0.070, 0.074°C/min, respectively. The slower rate of temperature change in asphalt concrete by
use of thermochromic materials is beneficial as it helps improve performance of the pavement by
giving it more time for plastic creep and therefore reduces the stress levels.
3:30 6:50 10:10 13:30 16:50 20:10 23:310
10
20
30
40
50
60
Su
rfa
ce T
emp
era
ture
(C
)
Time
Conventional asphalt concrete
Black asphalt concrete
Blue asphalt concrete
Red asphalt concrete
(a)
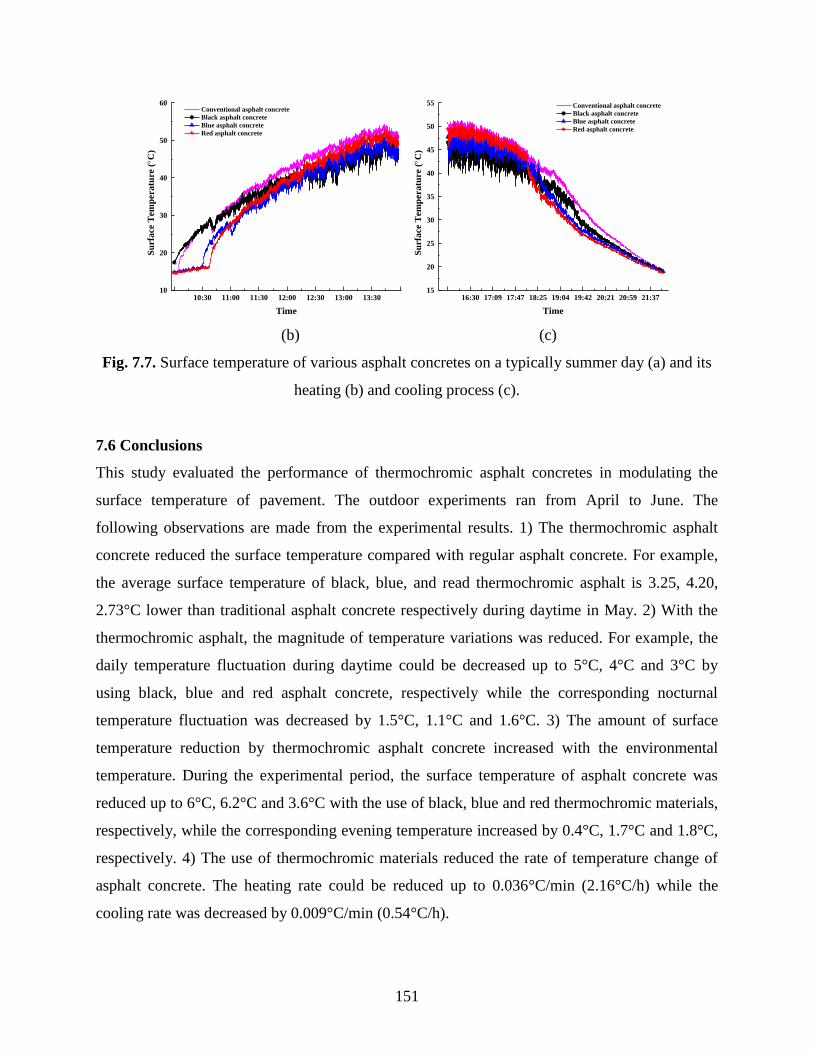
151
10:30 11:00 11:30 12:00 12:30 13:00 13:3010
20
30
40
50
60 Conventional asphalt concrete
Black asphalt concrete
Blue asphalt concrete
Red asphalt concrete
Su
rfa
ce T
emp
era
ture
(C
)
Time 16:30 17:09 17:47 18:25 19:04 19:42 20:21 20:59 21:37
15
20
25
30
35
40
45
50
55
Su
rfa
ce T
emp
era
ture
(C
)
Time
Conventional asphalt concrete
Black asphalt concrete
Blue asphalt concrete
Red asphalt concrete
(b) (c)
Fig. 7.7. Surface temperature of various asphalt concretes on a typically summer day (a) and its
heating (b) and cooling process (c).
7.6 Conclusions
This study evaluated the performance of thermochromic asphalt concretes in modulating the
surface temperature of pavement. The outdoor experiments ran from April to June. The
following observations are made from the experimental results. 1) The thermochromic asphalt
concrete reduced the surface temperature compared with regular asphalt concrete. For example,
the average surface temperature of black, blue, and read thermochromic asphalt is 3.25, 4.20,
2.73°C lower than traditional asphalt concrete respectively during daytime in May. 2) With the
thermochromic asphalt, the magnitude of temperature variations was reduced. For example, the
daily temperature fluctuation during daytime could be decreased up to 5°C, 4°C and 3°C by
using black, blue and red asphalt concrete, respectively while the corresponding nocturnal
temperature fluctuation was decreased by 1.5°C, 1.1°C and 1.6°C. 3) The amount of surface
temperature reduction by thermochromic asphalt concrete increased with the environmental
temperature. During the experimental period, the surface temperature of asphalt concrete was
reduced up to 6°C, 6.2°C and 3.6°C with the use of black, blue and red thermochromic materials,
respectively, while the corresponding evening temperature increased by 0.4°C, 1.7°C and 1.8°C,
respectively. 4) The use of thermochromic materials reduced the rate of temperature change of
asphalt concrete. The heating rate could be reduced up to 0.036°C/min (2.16°C/h) while the
cooling rate was decreased by 0.009°C/min (0.54°C/h).
152
In summary, this study found that the thermochromic asphalt concrete reduces the surface
temperatures under high environmental temperature and increase the surface temperature under
low environmental temperature. Therefore, the use of thermochromic asphalt concrete helps
reduce high temperature related performance degradation (such as rutting, fatigue, etc) as well as
mitigate low temperature effects (such as low temperature cracking, ice formation, etc.). These
potentially will help improve the durability and safety of asphalt pavement.
153
7.7 References
(1) Tripathi, R., Pickett, K.W., Solaimanian M., Kennedy, T.W. Toner-modified asphalt
compositions. US pat. 6113681, 2000.
(2) Santamouris, M., Pavlou, K., Synnefa, A., Niachou, K., Kolokotsa, D. Recent progress on
passive cooling techniques: Advanced technological developments to improve survivability
levels in low-income households. Energy and Buildings, 2007, 39(7): 859–866.
(3) Synnefa, A., Dandou, A., Santamouris, M., Tombrou, M., Soulakellis, N. Large scale
albedo changes using cool materials to mitigate heat island in Athens. Journal of Applied
Meteorology and Climatology, 2008, 47(11): 2846–2856.
(4) Doulos, L., Santamouris, M., Livada, I. Passive cooling of outdoor urban spaces. The role
of materials. Solar Energy, 2004, 77(2): 231–249.
(5) Yoder, E. J. and Witzak, M. W. Principles of Pavement Design. New York, NY: Wiley and
Sons, 1975.
(6) Pomerantz, M. and Akbari. H. Cooler Paving Materials for Heat Island Mitigation. In 1998
ACEEE Summer Study on Energy Efficiency in Buildings, Asilomar, CA, City: American
Council for an Energy-Efficient Economy, 1998.
(7) Pomerantz, M., Akbari, H. Cooler paving materials for heat island mitigation, in:
Proceedings of the 1998 ACEEE Summer Study on Energy Efficiency in Buildings, vol. 9,
Pacific Grove, CA, 1998, 135.
(8) Pomerantz, M., Akbari, H., Chen, A., Taha, H., Rosenfeld, A. Paving Materials for Heat
Island Mitigation, Lawrence Berkeley National Laboratory Report LBL- 38074, Berkeley,
CA, 1997.
(9) Pomerantz, M., Akbari, H., Harvey, J. T. Cooler reflective pavements give benefits beyond
energy savings: Durability and illumination. Rep. No. LBNL-45370, Berkeley, CA, 2000,
14 pp.
(10) Kinouchi, T., Yoshinaka, T., Fukae, N., Kanda, M. Development of cool pavement with
dark colored high albedo coating. Fifth Conference for the Urban Environment, Vancouver,
Canada, 2004.
(11) Hao, P.W., Zhang, D.L., Hu, X.N. Evaluation method for low temperature anticracking
performance of asphalt mixture. Journal of Xi'an Highway University, 2000, 20 (3):1–5.

154
(12) Kanerva, H.K., VINSON, T.S., Zeng, H. Low Temperature Cracking Field Validation of the
Thermal Stress Rest Rained Specimen Test. R. SHRP-A-401, 1994.
(13) Jianying Hu, Quan Gao, Xiong Yu. Optical and Superpave Characterization of Innovative
Asphalt Binder Containing Thermochromic Materials. Journal of materials in civil
engineering, 2014.
(14) Jianying Hu, Nandula Wanasekara, Xiong (Bill) Yu. Thermal Properties of Thermochromic
Asphalt Binders by Modulated Differential Scanning Calorimetry. Journal of
Transportation Research Record, 2014.
(15) Santamouris, M., Synnefa, A., Kolokotsa, D., Dimitriou, V., Apostolakis, K. Passive
cooling of the built environment - use of innovative reflective materials to fight heat island
and decrease cooling needs. International Journal Low Carbon Technologies, 2008, 3(2):
71–82.
(16) Karlessi, T., Santamouris, M., Apostolakis, K., Synnefa, A., Livada, I. Development and
testing of thermochromic coatings for buildings and urban structures. Solar Energy, 2009,
83(4): 538–551.
(17) Granqvist, C.G. Materials Science for Solar Energy Conversion Systems. Pergamon press,
Oxford, 1991.
(18) Saeli, M., Piccirillo, C., Parkin, I. P., Binions, R., Ridley, I. Energy modelling studies of
thermochromic glazing. Energy and Buildings, 2010, 42(10): 1666–1673.
(19) Ma, Y. P. and Zhu, B.R. Research on the preparation of reversibly thermochromic cement
based materials at normal temperature. Cement and Concrete Research, 2009, 39(2): 90-94.
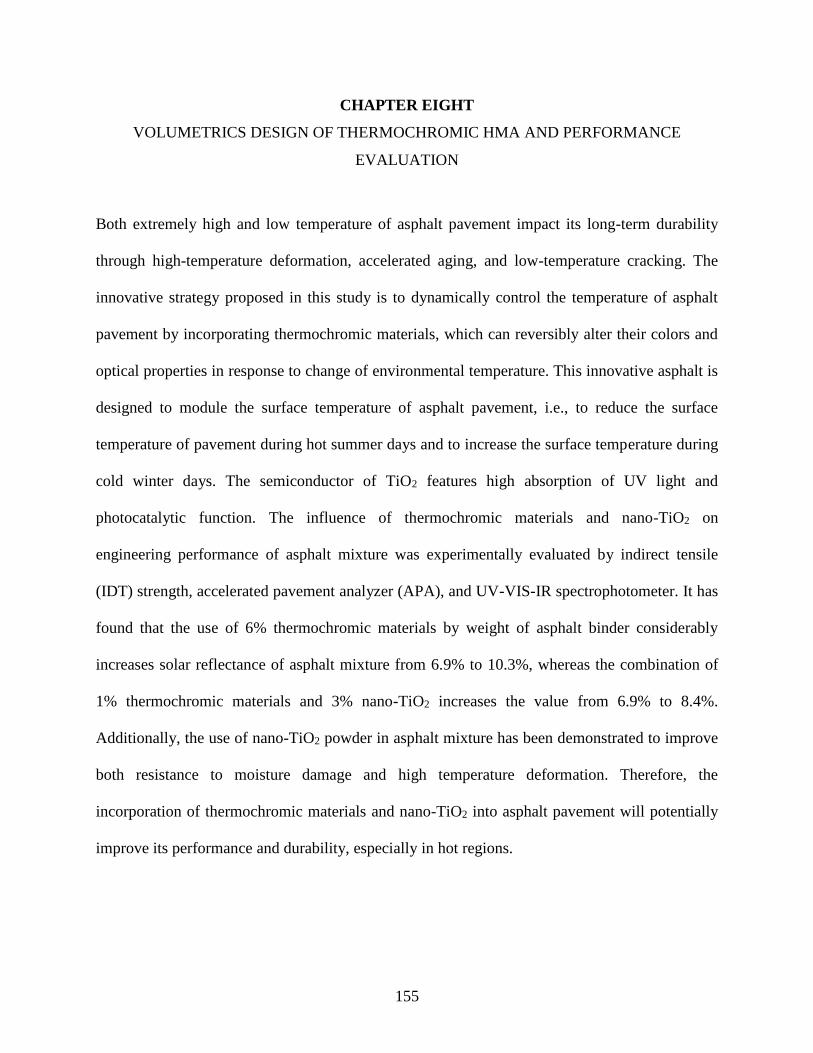
155
CHAPTER EIGHT
VOLUMETRICS DESIGN OF THERMOCHROMIC HMA AND PERFORMANCE
EVALUATION
Both extremely high and low temperature of asphalt pavement impact its long-term durability
through high-temperature deformation, accelerated aging, and low-temperature cracking. The
innovative strategy proposed in this study is to dynamically control the temperature of asphalt
pavement by incorporating thermochromic materials, which can reversibly alter their colors and
optical properties in response to change of environmental temperature. This innovative asphalt is
designed to module the surface temperature of asphalt pavement, i.e., to reduce the surface
temperature of pavement during hot summer days and to increase the surface temperature during
cold winter days. The semiconductor of TiO2 features high absorption of UV light and
photocatalytic function. The influence of thermochromic materials and nano-TiO2 on
engineering performance of asphalt mixture was experimentally evaluated by indirect tensile
(IDT) strength, accelerated pavement analyzer (APA), and UV-VIS-IR spectrophotometer. It has
found that the use of 6% thermochromic materials by weight of asphalt binder considerably
increases solar reflectance of asphalt mixture from 6.9% to 10.3%, whereas the combination of
1% thermochromic materials and 3% nano-TiO2 increases the value from 6.9% to 8.4%.
Additionally, the use of nano-TiO2 powder in asphalt mixture has been demonstrated to improve
both resistance to moisture damage and high temperature deformation. Therefore, the
incorporation of thermochromic materials and nano-TiO2 into asphalt pavement will potentially
improve its performance and durability, especially in hot regions.
156
8.1 Introduction
Conventional asphalt binder, which consists of residuals from crude oil distillation processes, has
been used widely in highway pavement and city roads. However, the considerable high
absorption of black asphalt binder to solar radiation induces extremely high surface temperature
of asphalt pavement, which is typically as high as 48–67 °C during summer reported in studies
(Santamouris et al. 2007, Synnefa et al. 2008, Doulous et al. 2004). The increased temperature in
summer impairs durability of asphalt pavement by accelerating various distress mechanisms (i.e.,
rutting, shoving, aging, fatigue damage, bleeding) (Yoder and Witzak 1975) as well as causes
undesirable environmental issues (i.e., heat island effects, volatile gas emission, etc.) (Gui et al.
2007). A potential way to improve the durability is to use materials with high reflectivity and
emissivity to solar radiation. This has led to the development of various cool pavement
technologies. Studies (Pomerantz and Akbari 1998, Pomerantz et al. 1997, Pomerantz et al.
2000, Kinouchi et al. 2004) show that cool pavement features low surface temperatures, which
increases the service life (durability) of pavements. However, the reduced temperature of asphalt
pavement exacerbates the distress of low-temperature cracking during the winter period (Hao et
al. 2000, Kanerva et al. 1994), which compromises the service life of road in cold climate.
Besides, the lower surface temperature is inductive to ice formation in cold weather, which is a
major safety concern. So it is highly desirable to develop new pavement materials and
technology to make asphalt pavement cooler during summer and warmer during winter.
An innovative strategy our study pursued is to use thermochromic materials to create new asphalt
binders with desirable solar reflectance, i.e., they reflect more solar energy at high temperature
and reflect less solar energy at low temperature. To avoid any visual impact on road users, we
hope to restraint such effects in the infrared range only. Thermochromic materials, materials
157
changing their colors with temperature, are promising to achieve such functionality as they
possess required optical and thermal properties. Materials incorporated with proper
thermochromic materials feature high solar reflectance in summer and high solar absorption in
winter. The change of their optical and thermal properties in such a dynamic way can lead to
applications that improve the urban microclimate, decrease the energy demands of the buildings,
and provide a thermally comfortable indoor environment (Santamouris et al. 2008, Karlessi et al.
2009, Granqvist 1991, Saeli et al. 2010, Ma and Zhu 2009, Kinouchi and Santamouris 2013). In
the present study, innovative asphalt binder containing thermochromic materials is designed to
modulate the temperature of asphalt pavement. The preliminary study indicated that the use of
thermochromic binder could reduce the surface temperature of asphalt concrete up to 6.6°C
during a typical summer day in Cleveland, Ohio, USA (Hu and Yu 2013 (a)).
Titanium dioxide (TiO2) is another attracting material recently which is carried out to develop
photocatalytic and self-cleaning asphalt road (Hashimoto et al. 2005, Carneiro et al. 2013, Liu et
al. 2015, Chen and Liu 2010). The semiconductor material of TiO2 is reported to feature
powerful oxidation strength, chemical stability, non-toxic properties and availability (Chen et al.
1999, Gouttebaron et al. 2000). Nanosized TiO2 has been employed by many research groups to
improve the light absorption and thus photocatalytic activity through the high surface-to-volume
ratio of nanograins (Shannon 1976). It was found that the spraying technique of nano-TiO2 over
the surface of asphalt mixture presents superior photocatalytic capability than volumetric
incorporation 25(Gouttebaron et al. 2000). Besides photocatalytic effect, the incorporation of
nanoTiO2 into asphalt mixture was demonstrated to improve the rheological properties of
original bitumen, to enhance rutting resistance and fatigue lift of asphalt mixtures (Shafabakhsh
158
and Jafari Ani 2015, Shafabakhsh et al. 2014).
The aim of this study is to fabricate asphalt mixture containing both thermochromic materials
and nano-TiO2 and to evaluate the influence of these additives on engineering performance of
asphalt concrete mixtures. For this purpose, Superpave volumetric analysis was employed to
optimize mixing parameters of the hot-mixing asphalt (HMA) mixtures. Indirect tensile strength,
accelerated asphalt pavement analyzer (APA) tests, and optical characterization were performed
on HMA mixtures containing different content of thermochromic materials and nano-TiO2.
8.2 Experimental Design
8.2.1 Materials and Mixture Design
Materials
Asphalt binder used in this study is Superpave grade, PG 64-22, produced by Kokosing Materials
Inc. The properties of virgin asphalt binder used in this study is illustrated in Table 8.1. The
viscosity values at different temperature determine the mixing temperature range of asphalt
mixture (153-159 ºC) and compaction temperature range of asphalt mixture (142-146 ºC).
Thermochromic powders with an average particle of 3-10 μm were selected from those
manufactured by Hali Industrial Corporation Ltd. Red, blue, and black thermochromic powders
with transition temperature around 31°C were chosen for this study. These thermochromic
materials are organic mixtures, which consists of lueco dye (electron donor), developer (electron
acceptor) and solvent. Below the transition temperature, leuco dye reacts with the developer, the
absorption peaks shifts from the UV to the visible range and cause the powder becomes colored.
At temperature above the transition temperature, the solvent-developer interactions dominate,
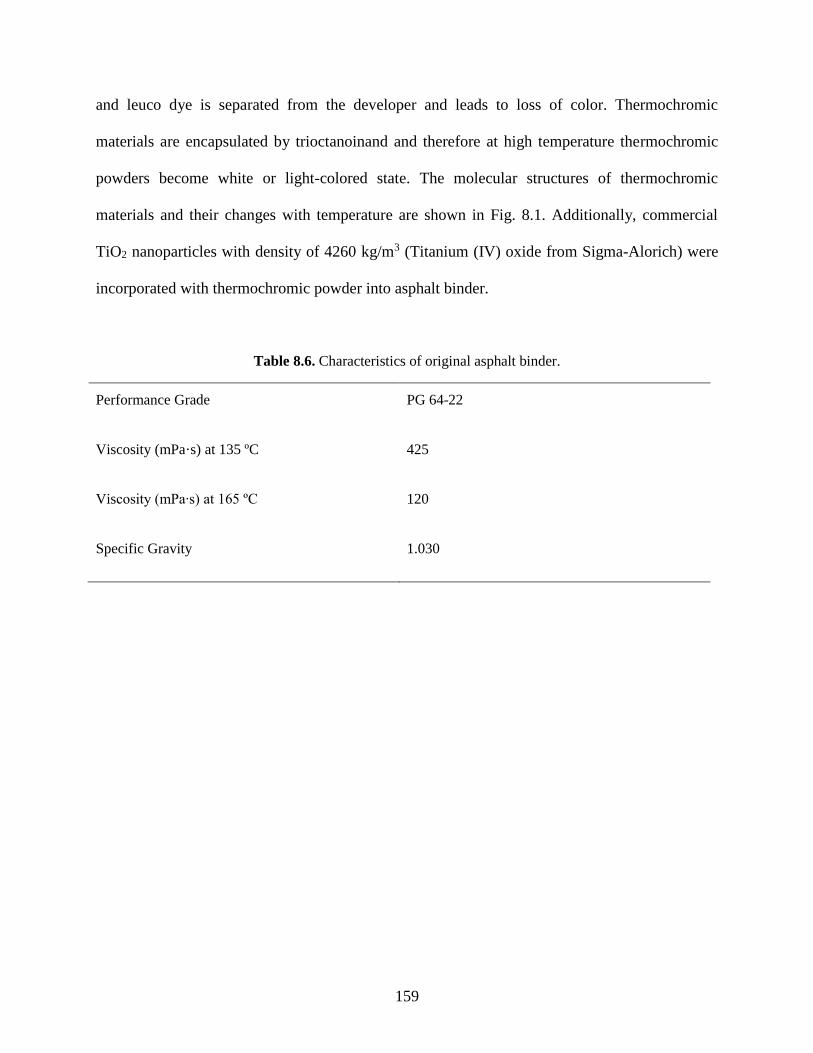
159
and leuco dye is separated from the developer and leads to loss of color. Thermochromic
materials are encapsulated by trioctanoinand and therefore at high temperature thermochromic
powders become white or light-colored state. The molecular structures of thermochromic
materials and their changes with temperature are shown in Fig. 8.1. Additionally, commercial
TiO2 nanoparticles with density of 4260 kg/m3 (Titanium (IV) oxide from Sigma-Alorich) were
incorporated with thermochromic powder into asphalt binder.
Table 8.6. Characteristics of original asphalt binder.
Performance Grade PG 64-22
Viscosity (mPa·s) at 135 ºC 425
Viscosity (mPa∙s) at 165 ºC 120
Specific Gravity 1.030
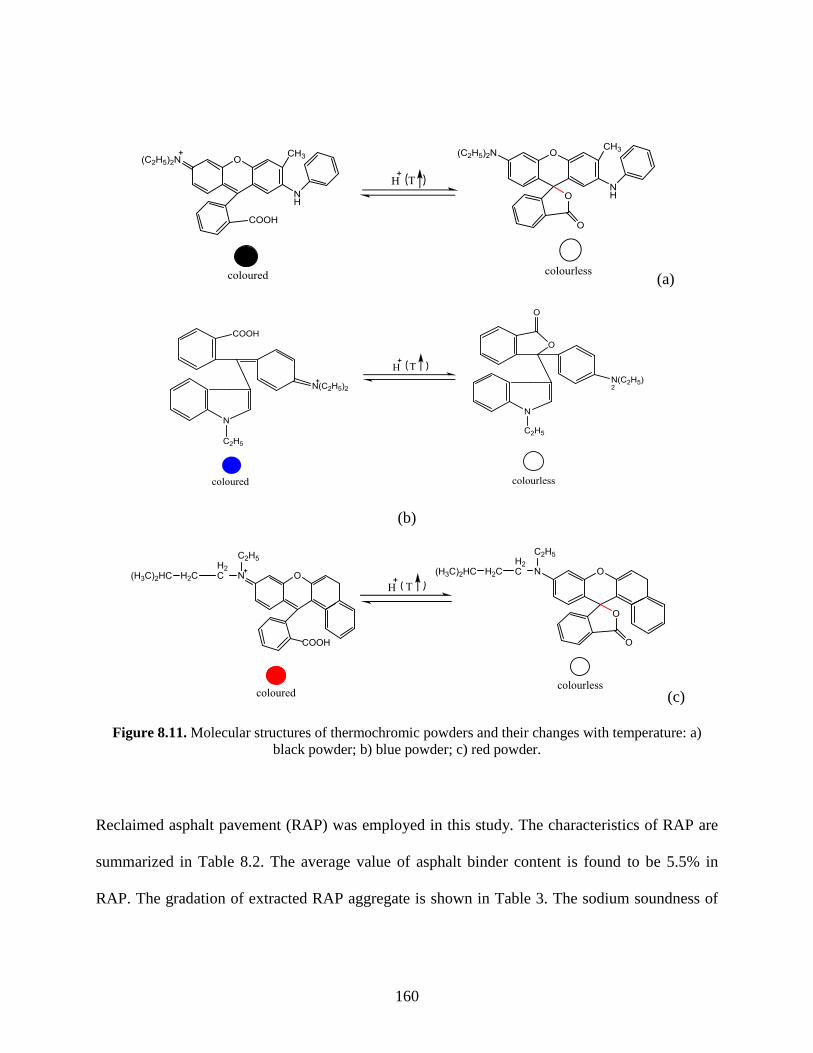
160
(a)
(b)
(c)
Figure 8.11. Molecular structures of thermochromic powders and their changes with temperature: a)
black powder; b) blue powder; c) red powder.
Reclaimed asphalt pavement (RAP) was employed in this study. The characteristics of RAP are
summarized in Table 8.2. The average value of asphalt binder content is found to be 5.5% in
RAP. The gradation of extracted RAP aggregate is shown in Table 3. The sodium soundness of

161
RAP aggregated measured according to AASHTO T 104 (AASHTO T104) is 2.60, which
satisfies the specifications from ODOT and ASTM.
Combining RAP aggregate with limestone, sand, and Baghous fines, the blended aggregate was
designed to meet ODOT specification on aggregation gradation. The gradation and percentage of
each aggregate is reported in Table 8.3. The nominal maximum aggregated size was 12.5 mm
and effective specific gravity of aggregate (Gse) was calculated to be 2.635.
Table 8.7. Characteristics of RAP.
RAP Maximum Specific Gravity 2.438
RAP Binder Specific Gravity 1.050
RAP Binder Viscosity (Pa·s) 5920
RAP Aggregate Soundness Loss 2.60
Binder Content in RAP (%) 5.5
Table 8.8. Aggregate Gradation.
Sieve
Size
(mm)
Sieve
Size
Content and Passing (%)
42% #8
Limestone
10% #9
Limestone
18%
Limestone
Sand
14%
Natural
Sand
1%
Baghouse
Fines
15%
RAP
Accum
ulated
50.8 2 in 100.0 100.0 100.0 100.0 100.0 100.0 100
38.1 1 1/2 in 100.0 100.0 100.0 100.0 100.0 100.0 100
25.4 1 in 100.0 100.0 100.0 100.0 100.0 100.0 100
19 3/4 in 100.0 100.0 100.0 100.0 100.0 100.0 100
12.5 1/2 in 100.0 100.0 100.0 100.0 100.0 100.0 100
9.5 3/8 in 90.0 100.0 100.0 100.0 100.0 90.0 94.3
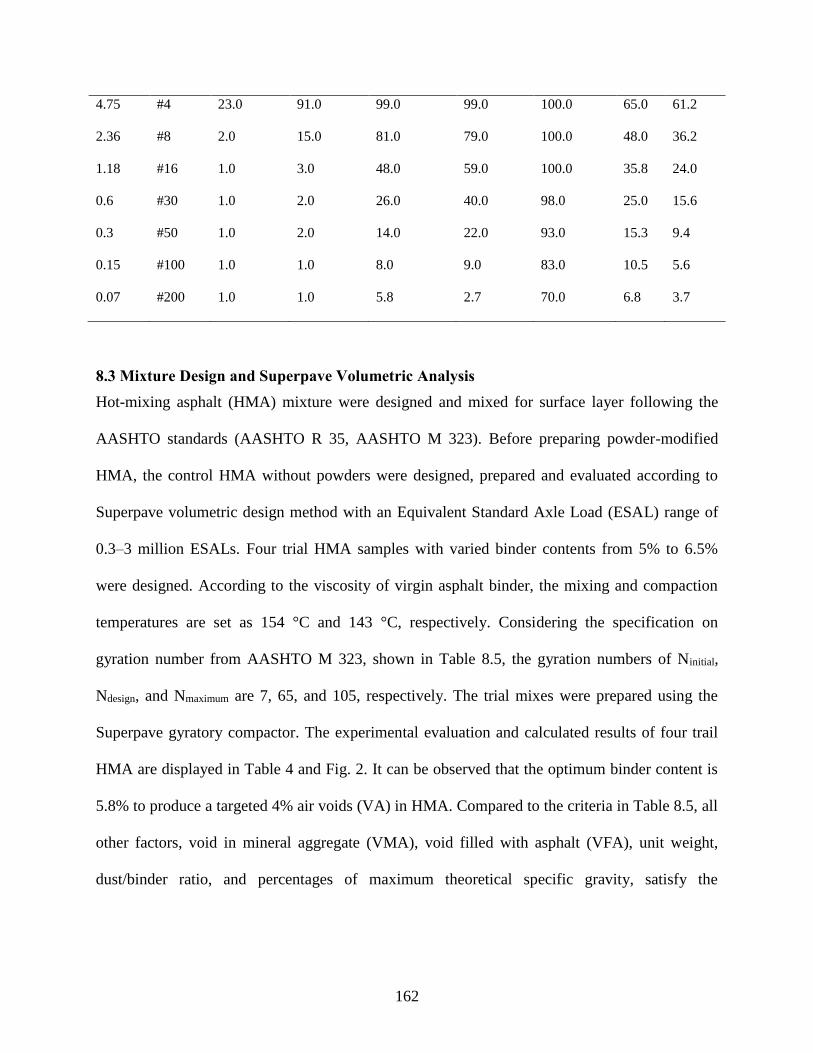
162
4.75 #4 23.0 91.0 99.0 99.0 100.0 65.0 61.2
2.36 #8 2.0 15.0 81.0 79.0 100.0 48.0 36.2
1.18 #16 1.0 3.0 48.0 59.0 100.0 35.8 24.0
0.6 #30 1.0 2.0 26.0 40.0 98.0 25.0 15.6
0.3 #50 1.0 2.0 14.0 22.0 93.0 15.3 9.4
0.15 #100 1.0 1.0 8.0 9.0 83.0 10.5 5.6
0.07 #200 1.0 1.0 5.8 2.7 70.0 6.8 3.7
8.3 Mixture Design and Superpave Volumetric Analysis
Hot-mixing asphalt (HMA) mixture were designed and mixed for surface layer following the
AASHTO standards (AASHTO R 35, AASHTO M 323). Before preparing powder-modified
HMA, the control HMA without powders were designed, prepared and evaluated according to
Superpave volumetric design method with an Equivalent Standard Axle Load (ESAL) range of
0.3–3 million ESALs. Four trial HMA samples with varied binder contents from 5% to 6.5%
were designed. According to the viscosity of virgin asphalt binder, the mixing and compaction
temperatures are set as 154 °C and 143 °C, respectively. Considering the specification on
gyration number from AASHTO M 323, shown in Table 8.5, the gyration numbers of Ninitial,
Ndesign, and Nmaximum are 7, 65, and 105, respectively. The trial mixes were prepared using the
Superpave gyratory compactor. The experimental evaluation and calculated results of four trail
HMA are displayed in Table 4 and Fig. 2. It can be observed that the optimum binder content is
5.8% to produce a targeted 4% air voids (VA) in HMA. Compared to the criteria in Table 8.5, all
other factors, void in mineral aggregate (VMA), void filled with asphalt (VFA), unit weight,
dust/binder ratio, and percentages of maximum theoretical specific gravity, satisfy the
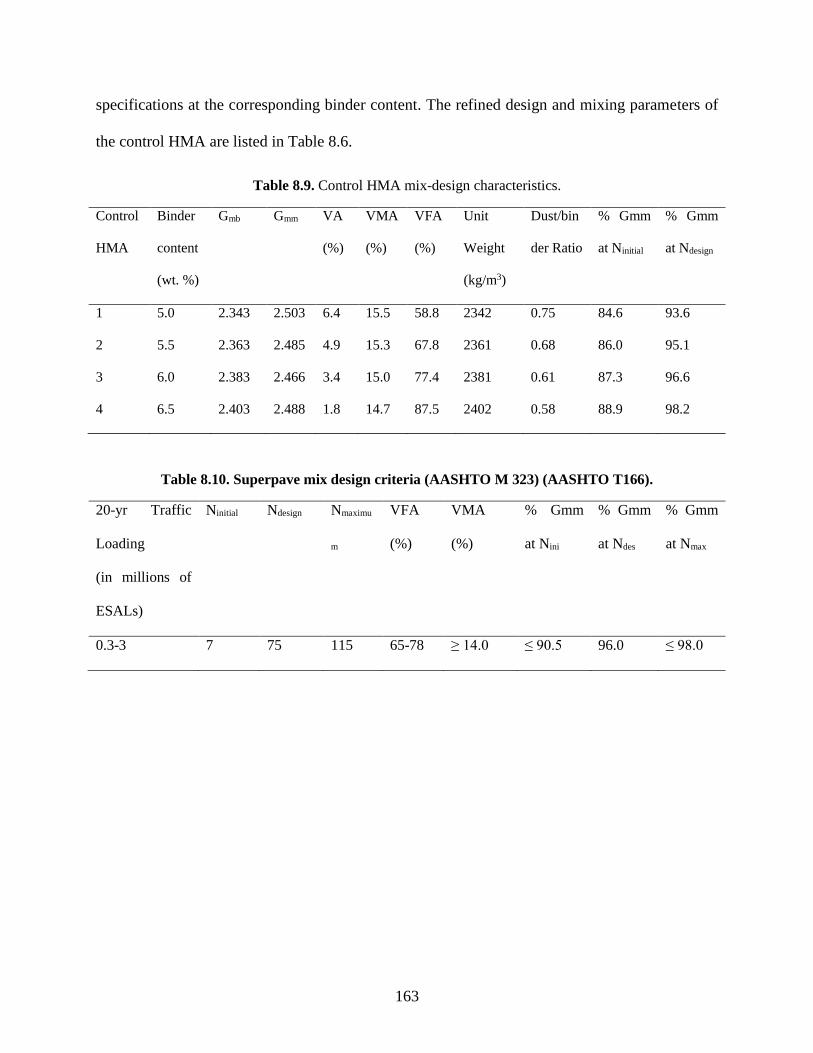
163
specifications at the corresponding binder content. The refined design and mixing parameters of
the control HMA are listed in Table 8.6.
Table 8.9. Control HMA mix-design characteristics.
Control
HMA
Binder
content
(wt. %)
Gmb Gmm VA
(%)
VMA
(%)
VFA
(%)
Unit
Weight
(kg/m3)
Dust/bin
der Ratio
% Gmm
at Ninitial
% Gmm
at Ndesign
1 5.0 2.343 2.503 6.4 15.5 58.8 2342 0.75 84.6 93.6
2 5.5 2.363 2.485 4.9 15.3 67.8 2361 0.68 86.0 95.1
3 6.0 2.383 2.466 3.4 15.0 77.4 2381 0.61 87.3 96.6
4 6.5 2.403 2.488 1.8 14.7 87.5 2402 0.58 88.9 98.2
Table 8.10. Superpave mix design criteria (AASHTO M 323) (AASHTO T166).
20-yr Traffic
Loading
(in millions of
ESALs)
Ninitial Ndesign Nmaximu
m
VFA
(%)
VMA
(%)
% Gmm
at Nini
% Gmm
at Ndes
% Gmm
at Nmax
0.3-3 7 75 115 65-78 ≥ 14.0 ≤ 90.5 96.0 ≤ 98.0

164
5.0 5.5 6.0 6.51
2
3
4
5
6
7A
ir V
oid
(%
)
Binder Content (%)
5.0 5.5 6.0 6.514.6
14.8
15.0
15.2
15.4
15.6
Binder Content (%)
VM
A (
%)
5.0 5.5 6.0 6.555
60
65
70
75
80
85
90
VF
A (
%)
Binder Content (%)
5.0 5.5 6.0 6.52340
2350
2360
2370
2380
2390
2400
2410
Un
it W
eigh
t (k
g/m
3)
Binder Content (%)
Figure 8.12. Characteristics of trial asphalt mixtures.
Table 8.11. Optimized parameters for preparing control HMA.
Optimum binder content (%) 5.8%
Mixing temperature (°C) 154
Compaction temperature (°C) 143
Initial Gyration Number (Nini) 7
Designed Gyration Number (Ndes) 65
Maximum Gyration Number (Nmax) 105
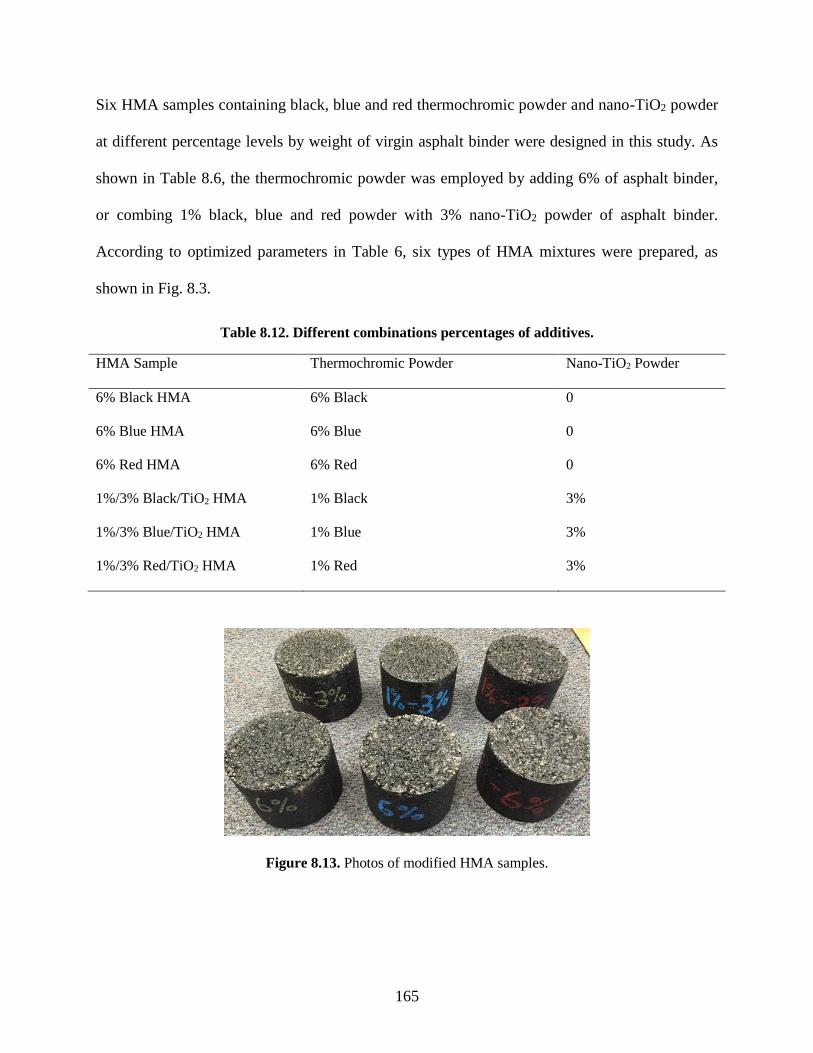
165
Six HMA samples containing black, blue and red thermochromic powder and nano-TiO2 powder
at different percentage levels by weight of virgin asphalt binder were designed in this study. As
shown in Table 8.6, the thermochromic powder was employed by adding 6% of asphalt binder,
or combing 1% black, blue and red powder with 3% nano-TiO2 powder of asphalt binder.
According to optimized parameters in Table 6, six types of HMA mixtures were prepared, as
shown in Fig. 8.3.
Table 8.12. Different combinations percentages of additives.
HMA Sample Thermochromic Powder Nano-TiO2 Powder
6% Black HMA 6% Black 0
6% Blue HMA 6% Blue 0
6% Red HMA 6% Red 0
1%/3% Black/TiO2 HMA 1% Black 3%
1%/3% Blue/TiO2 HMA 1% Blue 3%
1%/3% Red/TiO2 HMA 1% Red 3%
Figure 8.13. Photos of modified HMA samples.
166
8.4 Performance Evaluation Methods
8.4.1 Specific Gravity and Air Void
Superpave volumetric analysis of compacted HMA mixtures involves two basic tests: bulk
specific gravity of the compacted HMA mixture and theoretical maximum specific gravity of the
loose HMA mixture. The bulk specific gravity was determined on two cylindrical specimens
with diameter of 150 mm and thickness of 115 mm following the procedure in AASHTO T 166
(AASHTO T 166) and was calculated using the following the formula:
mb
AG
B C
(8-1)
where Gmb is the bulk specific gravity of compacted specimen; A the mass of dry specimen in air
(g); B mass of saturated surface-dry specimen in air (g); and C the mass of specimen in water
(g).
The theoretical maximum specific gravity was determined according to AASHTO T 209
(AASHTO T 2091). The following formula was used to for calculating theoretical maximum
specific gravity of the specimen:
mm
AG
A D E
(8-2)
where Gmm is the theoretical maximum specific gravity of loose specimen; A the mass of oven-
dry specimen in air (g); D the mass of container filled with water at 25 °C to calibration mark
(g); and E the mass of container with specimen filled with water at 25 °C to calibration mark (g).
167
Bulk specific gravity features the specific gravity of the compacted specimen, including air voids
within the mixture; the theoretical maximum specific gravity gives the specific gravity of the
loose compacted with air voids of zero. Both contribute to determining volumetric factor, air
void content, which is a good indicator of mixture performance. Air void content (VA, %) was
calculated using the following expression:
100 1 mb
mm
GVA
G
(8-3)
8.4.2 Moisture Susceptibility
Six cylindrical samples (150 mm diameter by 57.5 mm thickness) were used in finding moisture
resistance potential in prepared mixture according to AASHTO T 283 (AASHTO T283). The
samples were divided into two groups: the first group is “unconditioned”, while the second group
is “conditioned”. The conditioned samples were saturated with water to between 70-80 percent
with water, followed by a freeze-thaw cycle and a warm water soak. The tensile strength of
“conditioned” sample St(Conditioned) is compared to the tensile strength of “unconditioned”
sample St(Control) to determine tensile strength ratio (TSR) as follows:
conditioned
unconditioned
100St
TSRSt
(8-4)
The ratio of the average tensile strength of the conditioned to unconditioned samples and a visual
assessment of stripping is used to assess moisture sensitivity of HMA. A mixture is considered
acceptable if the tensile strength ratio is equal to or greater than 80% and there is no visual
evidence of stripping in the conditioned test specimens.
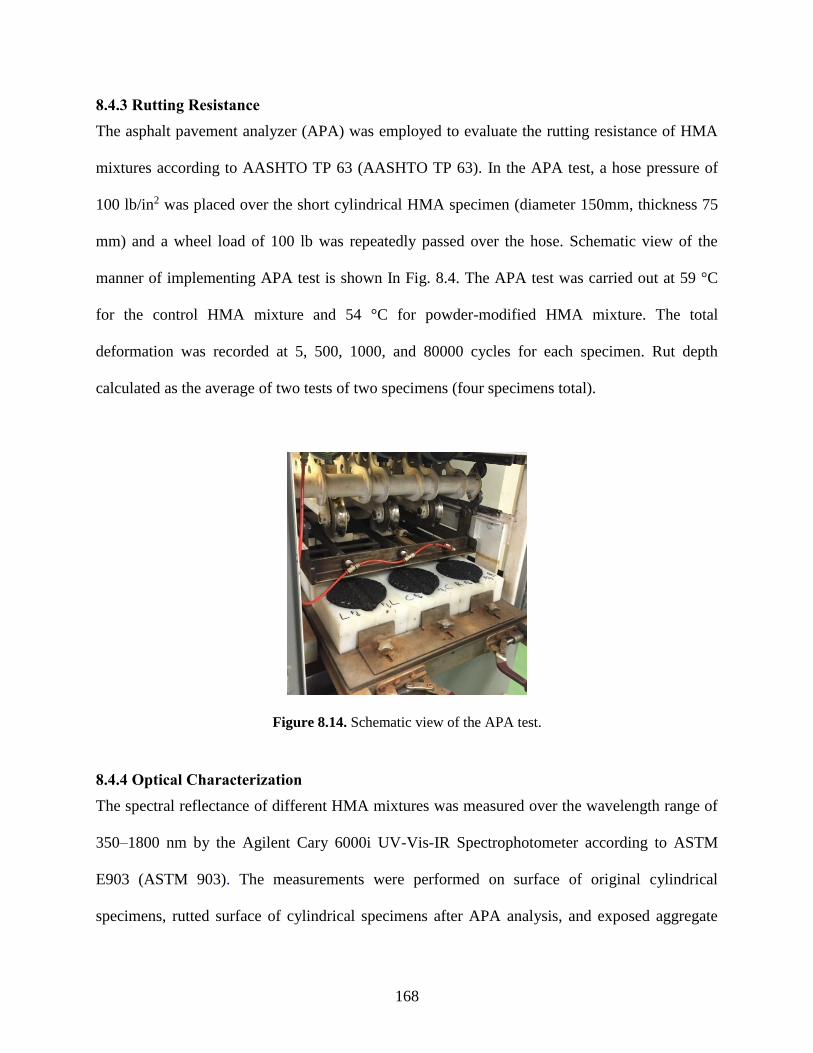
168
8.4.3 Rutting Resistance
The asphalt pavement analyzer (APA) was employed to evaluate the rutting resistance of HMA
mixtures according to AASHTO TP 63 (AASHTO TP 63). In the APA test, a hose pressure of
100 lb/in2 was placed over the short cylindrical HMA specimen (diameter 150mm, thickness 75
mm) and a wheel load of 100 lb was repeatedly passed over the hose. Schematic view of the
manner of implementing APA test is shown In Fig. 8.4. The APA test was carried out at 59 °C
for the control HMA mixture and 54 °C for powder-modified HMA mixture. The total
deformation was recorded at 5, 500, 1000, and 80000 cycles for each specimen. Rut depth
calculated as the average of two tests of two specimens (four specimens total).
Figure 8.14. Schematic view of the APA test.
8.4.4 Optical Characterization
The spectral reflectance of different HMA mixtures was measured over the wavelength range of
350–1800 nm by the Agilent Cary 6000i UV-Vis-IR Spectrophotometer according to ASTM
E903 (ASTM 903). The measurements were performed on surface of original cylindrical
specimens, rutted surface of cylindrical specimens after APA analysis, and exposed aggregate
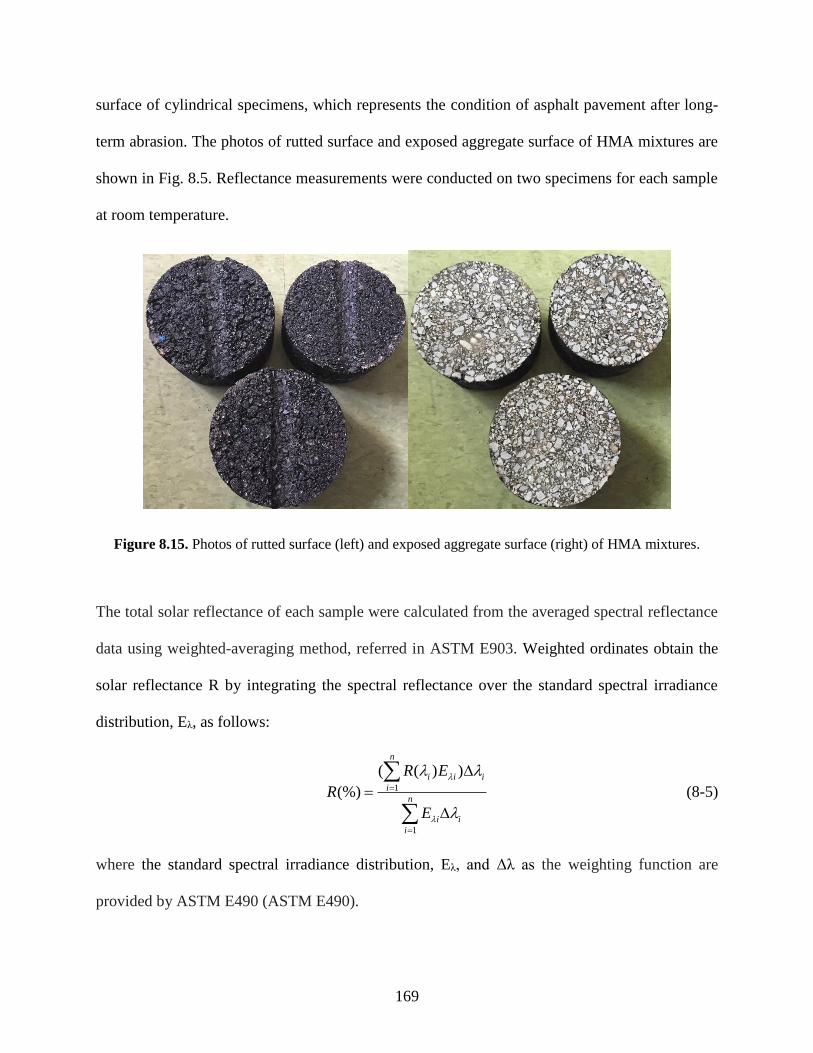
169
surface of cylindrical specimens, which represents the condition of asphalt pavement after long-
term abrasion. The photos of rutted surface and exposed aggregate surface of HMA mixtures are
shown in Fig. 8.5. Reflectance measurements were conducted on two specimens for each sample
at room temperature.
Figure 8.15. Photos of rutted surface (left) and exposed aggregate surface (right) of HMA mixtures.
The total solar reflectance of each sample were calculated from the averaged spectral reflectance
data using weighted-averaging method, referred in ASTM E903. Weighted ordinates obtain the
solar reflectance R by integrating the spectral reflectance over the standard spectral irradiance
distribution, Eλ, as follows:
1
1
( ( ) )
(%)
n
i i i
i
n
i i
i
R E
R
E
(8-5)
where the standard spectral irradiance distribution, Eλ, and Δλ as the weighting function are
provided by ASTM E490 (ASTM E490).
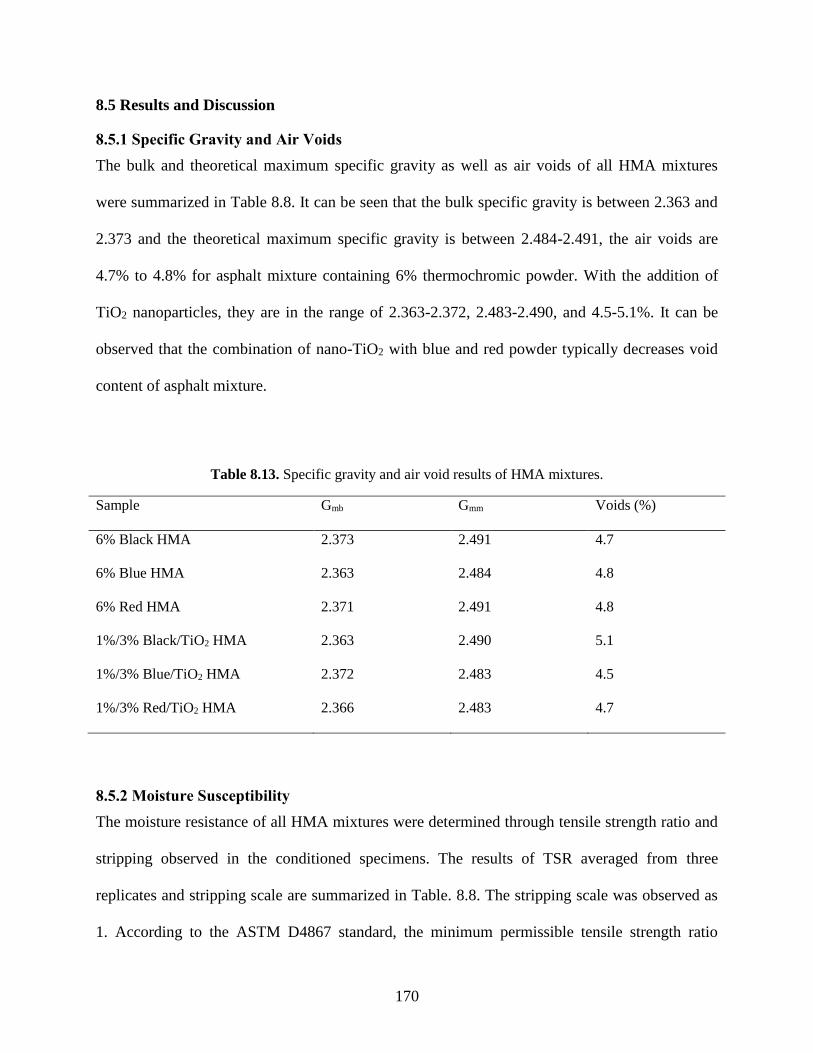
170
8.5 Results and Discussion
8.5.1 Specific Gravity and Air Voids
The bulk and theoretical maximum specific gravity as well as air voids of all HMA mixtures
were summarized in Table 8.8. It can be seen that the bulk specific gravity is between 2.363 and
2.373 and the theoretical maximum specific gravity is between 2.484-2.491, the air voids are
4.7% to 4.8% for asphalt mixture containing 6% thermochromic powder. With the addition of
TiO2 nanoparticles, they are in the range of 2.363-2.372, 2.483-2.490, and 4.5-5.1%. It can be
observed that the combination of nano-TiO2 with blue and red powder typically decreases void
content of asphalt mixture.
Table 8.13. Specific gravity and air void results of HMA mixtures.
Sample Gmb Gmm Voids (%)
6% Black HMA 2.373 2.491 4.7
6% Blue HMA 2.363 2.484 4.8
6% Red HMA 2.371 2.491 4.8
1%/3% Black/TiO2 HMA 2.363 2.490 5.1
1%/3% Blue/TiO2 HMA 2.372 2.483 4.5
1%/3% Red/TiO2 HMA 2.366 2.483 4.7
8.5.2 Moisture Susceptibility
The moisture resistance of all HMA mixtures were determined through tensile strength ratio and
stripping observed in the conditioned specimens. The results of TSR averaged from three
replicates and stripping scale are summarized in Table. 8.8. The stripping scale was observed as
1. According to the ASTM D4867 standard, the minimum permissible tensile strength ratio
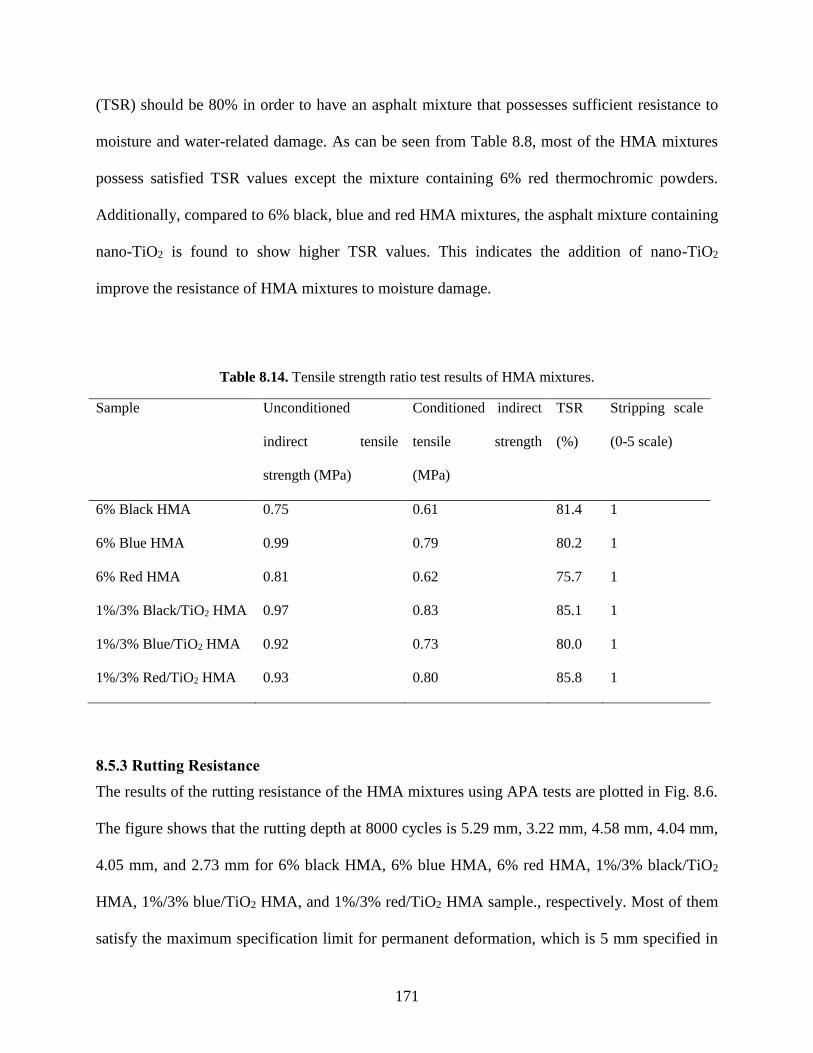
171
(TSR) should be 80% in order to have an asphalt mixture that possesses sufficient resistance to
moisture and water-related damage. As can be seen from Table 8.8, most of the HMA mixtures
possess satisfied TSR values except the mixture containing 6% red thermochromic powders.
Additionally, compared to 6% black, blue and red HMA mixtures, the asphalt mixture containing
nano-TiO2 is found to show higher TSR values. This indicates the addition of nano-TiO2
improve the resistance of HMA mixtures to moisture damage.
Table 8.14. Tensile strength ratio test results of HMA mixtures.
Sample Unconditioned
indirect tensile
strength (MPa)
Conditioned indirect
tensile strength
(MPa)
TSR
(%)
Stripping scale
(0-5 scale)
6% Black HMA 0.75 0.61 81.4 1
6% Blue HMA 0.99 0.79 80.2 1
6% Red HMA 0.81 0.62 75.7 1
1%/3% Black/TiO2 HMA 0.97 0.83 85.1 1
1%/3% Blue/TiO2 HMA 0.92 0.73 80.0 1
1%/3% Red/TiO2 HMA 0.93 0.80 85.8 1
8.5.3 Rutting Resistance
The results of the rutting resistance of the HMA mixtures using APA tests are plotted in Fig. 8.6.
The figure shows that the rutting depth at 8000 cycles is 5.29 mm, 3.22 mm, 4.58 mm, 4.04 mm,
4.05 mm, and 2.73 mm for 6% black HMA, 6% blue HMA, 6% red HMA, 1%/3% black/TiO2
HMA, 1%/3% blue/TiO2 HMA, and 1%/3% red/TiO2 HMA sample., respectively. Most of them
satisfy the maximum specification limit for permanent deformation, which is 5 mm specified in
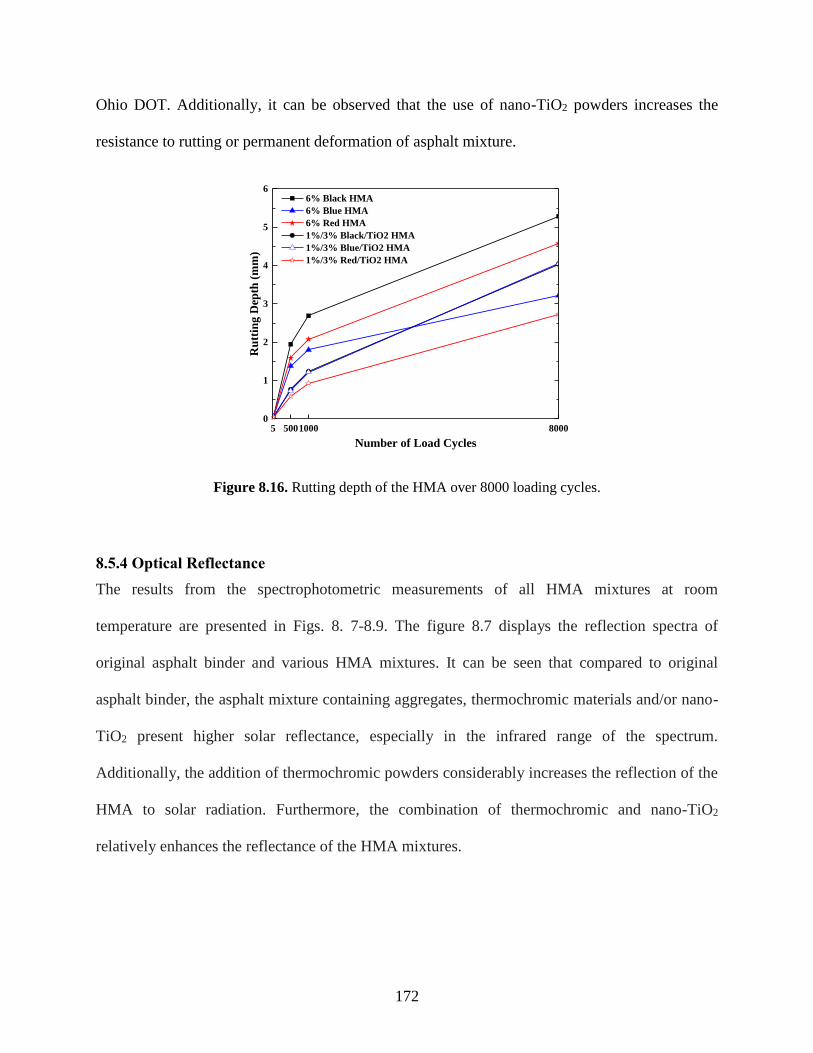
172
Ohio DOT. Additionally, it can be observed that the use of nano-TiO2 powders increases the
resistance to rutting or permanent deformation of asphalt mixture.
5 5001000 80000
1
2
3
4
5
6
Ru
ttin
g D
epth
(m
m)
Number of Load Cycles
6% Black HMA
6% Blue HMA
6% Red HMA
1%/3% Black/TiO2 HMA
1%/3% Blue/TiO2 HMA
1%/3% Red/TiO2 HMA
Figure 8.16. Rutting depth of the HMA over 8000 loading cycles.
8.5.4 Optical Reflectance
The results from the spectrophotometric measurements of all HMA mixtures at room
temperature are presented in Figs. 8. 7-8.9. The figure 8.7 displays the reflection spectra of
original asphalt binder and various HMA mixtures. It can be seen that compared to original
asphalt binder, the asphalt mixture containing aggregates, thermochromic materials and/or nano-
TiO2 present higher solar reflectance, especially in the infrared range of the spectrum.
Additionally, the addition of thermochromic powders considerably increases the reflection of the
HMA to solar radiation. Furthermore, the combination of thermochromic and nano-TiO2
relatively enhances the reflectance of the HMA mixtures.
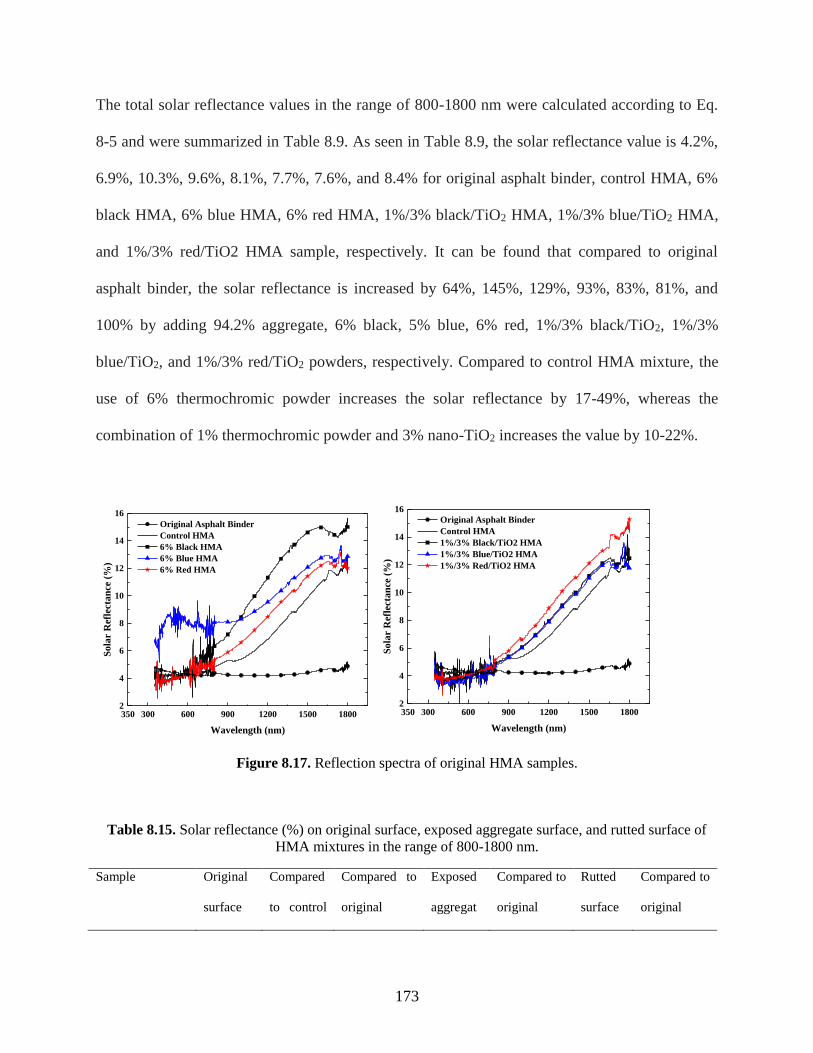
173
The total solar reflectance values in the range of 800-1800 nm were calculated according to Eq.
8-5 and were summarized in Table 8.9. As seen in Table 8.9, the solar reflectance value is 4.2%,
6.9%, 10.3%, 9.6%, 8.1%, 7.7%, 7.6%, and 8.4% for original asphalt binder, control HMA, 6%
black HMA, 6% blue HMA, 6% red HMA, 1%/3% black/TiO2 HMA, 1%/3% blue/TiO2 HMA,
and 1%/3% red/TiO2 HMA sample, respectively. It can be found that compared to original
asphalt binder, the solar reflectance is increased by 64%, 145%, 129%, 93%, 83%, 81%, and
100% by adding 94.2% aggregate, 6% black, 5% blue, 6% red, 1%/3% black/TiO2, 1%/3%
blue/TiO2, and 1%/3% red/TiO2 powders, respectively. Compared to control HMA mixture, the
use of 6% thermochromic powder increases the solar reflectance by 17-49%, whereas the
combination of 1% thermochromic powder and 3% nano-TiO2 increases the value by 10-22%.
300 600 900 1200 1500 18003502
4
6
8
10
12
14
16
Original Asphalt Binder
Control HMA
6% Black HMA
6% Blue HMA
6% Red HMA
Sola
r R
efle
cta
nce
(%
)
Wavelength (nm)
300 600 900 1200 1500 18003502
4
6
8
10
12
14
16
So
lar
Ref
lect
an
ce (
%)
Wavelength (nm)
Original Asphalt Binder
Control HMA
1%/3% Black/TiO2 HMA
1%/3% Blue/TiO2 HMA
1%/3% Red/TiO2 HMA
Figure 8.17. Reflection spectra of original HMA samples.
Table 8.15. Solar reflectance (%) on original surface, exposed aggregate surface, and rutted surface of
HMA mixtures in the range of 800-1800 nm.
Sample Original
surface
Compared
to control
Compared to
original
Exposed
aggregat
Compared to
original
Rutted
surface
Compared to
original
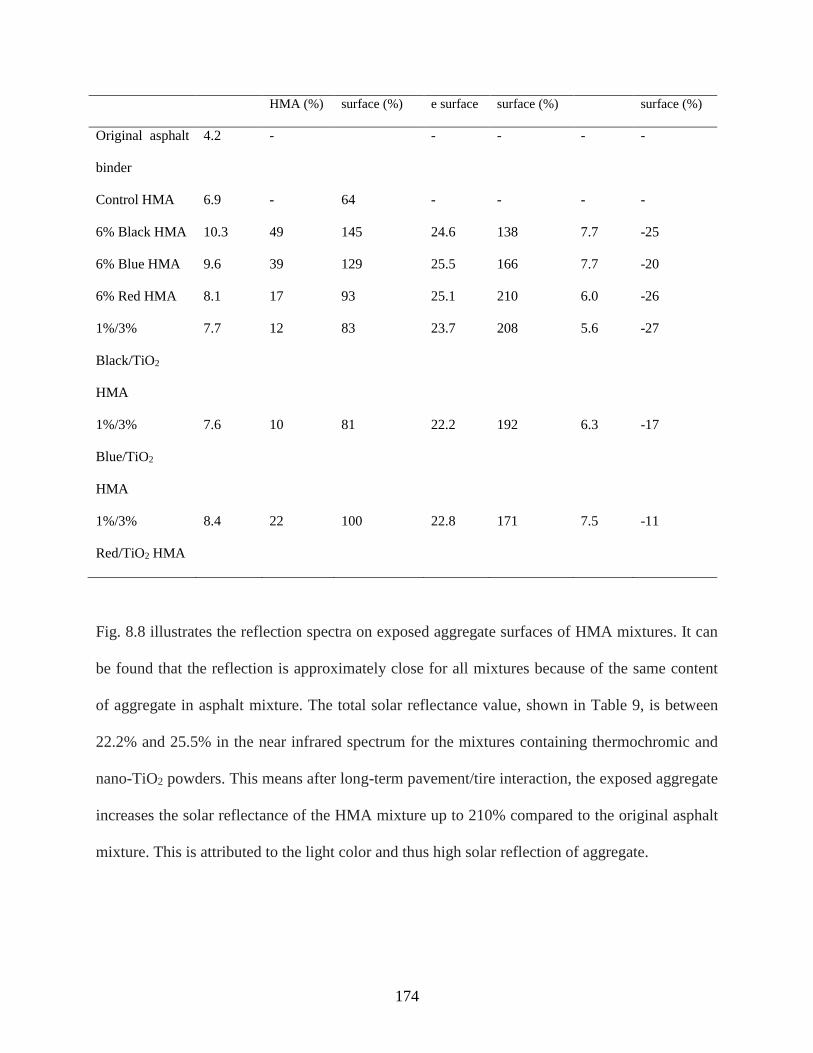
174
HMA (%) surface (%) e surface surface (%) surface (%)
Original asphalt
binder
4.2 - - - - -
Control HMA 6.9 - 64 - - - -
6% Black HMA 10.3 49 145 24.6 138 7.7 -25
6% Blue HMA 9.6 39 129 25.5 166 7.7 -20
6% Red HMA 8.1 17 93 25.1 210 6.0 -26
1%/3%
Black/TiO2
HMA
7.7 12 83 23.7 208 5.6 -27
1%/3%
Blue/TiO2
HMA
7.6 10 81 22.2 192 6.3 -17
1%/3%
Red/TiO2 HMA
8.4 22 100 22.8 171 7.5 -11
Fig. 8.8 illustrates the reflection spectra on exposed aggregate surfaces of HMA mixtures. It can
be found that the reflection is approximately close for all mixtures because of the same content
of aggregate in asphalt mixture. The total solar reflectance value, shown in Table 9, is between
22.2% and 25.5% in the near infrared spectrum for the mixtures containing thermochromic and
nano-TiO2 powders. This means after long-term pavement/tire interaction, the exposed aggregate
increases the solar reflectance of the HMA mixture up to 210% compared to the original asphalt
mixture. This is attributed to the light color and thus high solar reflection of aggregate.
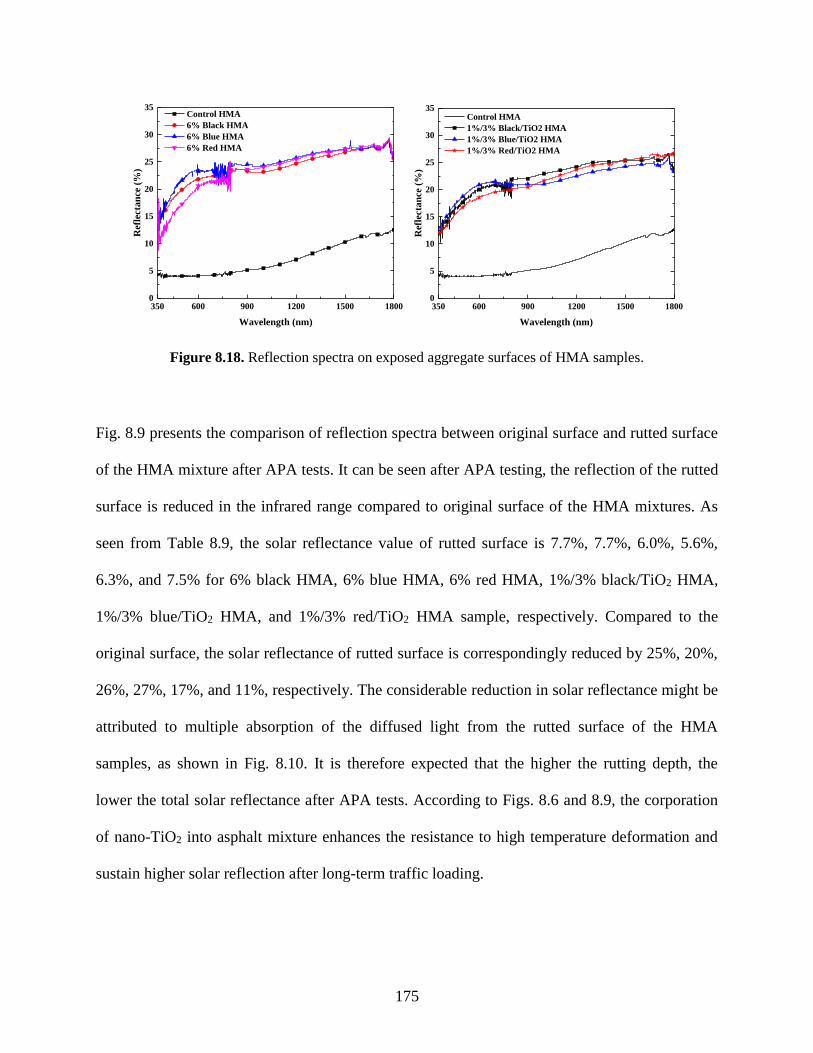
175
600 900 1200 1500 18003500
5
10
15
20
25
30
35 Control HMA
6% Black HMA
6% Blue HMA
6% Red HMA
Ref
lect
an
ce (
%)
Wavelength (nm)
600 900 1200 1500 18003500
5
10
15
20
25
30
35 Control HMA
1%/3% Black/TiO2 HMA
1%/3% Blue/TiO2 HMA
1%/3% Red/TiO2 HMA
Ref
lect
an
ce (
%)
Wavelength (nm)
Figure 8.18. Reflection spectra on exposed aggregate surfaces of HMA samples.
Fig. 8.9 presents the comparison of reflection spectra between original surface and rutted surface
of the HMA mixture after APA tests. It can be seen after APA testing, the reflection of the rutted
surface is reduced in the infrared range compared to original surface of the HMA mixtures. As
seen from Table 8.9, the solar reflectance value of rutted surface is 7.7%, 7.7%, 6.0%, 5.6%,
6.3%, and 7.5% for 6% black HMA, 6% blue HMA, 6% red HMA, 1%/3% black/TiO2 HMA,
1%/3% blue/TiO2 HMA, and 1%/3% red/TiO2 HMA sample, respectively. Compared to the
original surface, the solar reflectance of rutted surface is correspondingly reduced by 25%, 20%,
26%, 27%, 17%, and 11%, respectively. The considerable reduction in solar reflectance might be
attributed to multiple absorption of the diffused light from the rutted surface of the HMA
samples, as shown in Fig. 8.10. It is therefore expected that the higher the rutting depth, the
lower the total solar reflectance after APA tests. According to Figs. 8.6 and 8.9, the corporation
of nano-TiO2 into asphalt mixture enhances the resistance to high temperature deformation and
sustain higher solar reflection after long-term traffic loading.
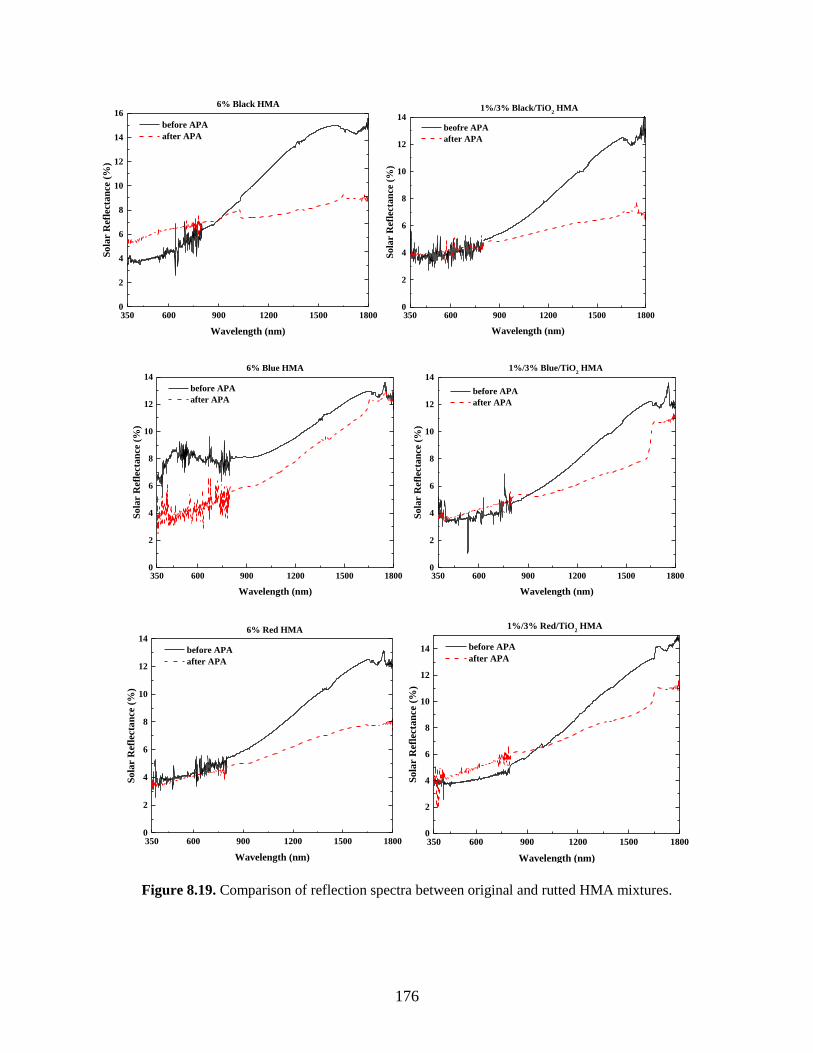
176
600 900 1200 1500 18003500
2
4
6
8
10
12
14
16
before APA
after APA
6% Black HMAS
ola
r R
efle
ctan
ce (
%)
Wavelength (nm)
600 900 1200 1500 18003500
2
4
6
8
10
12
141%/3% Black/TiO
2 HMA
beofre APA
after APA
So
lar
Ref
lect
an
ce (
%)
Wavelength (nm)
600 900 1200 1500 18003500
2
4
6
8
10
12
14
before APA
after APA
6% Blue HMA
Sola
r R
efle
ctan
ce (
%)
Wavelength (nm)
600 900 1200 1500 18003500
2
4
6
8
10
12
141%/3% Blue/TiO
2 HMA
before APA
after APA
Sola
r R
efle
ctan
ce (
%)
Wavelength (nm)
600 900 1200 1500 18003500
2
4
6
8
10
12
14
before APA
after APA
6% Red HMA
So
lar
Ref
lect
an
ce (
%)
Wavelength (nm)
600 900 1200 1500 18003500
2
4
6
8
10
12
14 before APA
after APA
1%/3% Red/TiO2 HMA
So
lar
Ref
lect
an
ce (
%)
Wavelength (nm)
Figure 8.19. Comparison of reflection spectra between original and rutted HMA mixtures.
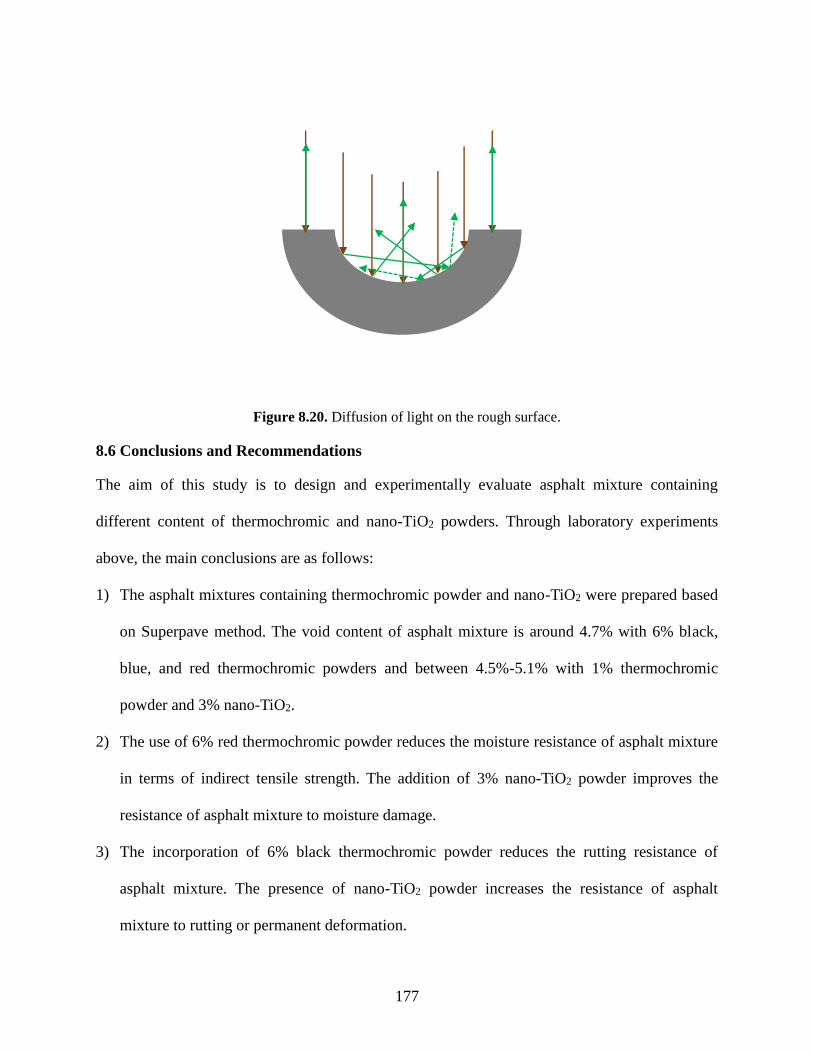
177
Figure 8.20. Diffusion of light on the rough surface.
8.6 Conclusions and Recommendations
The aim of this study is to design and experimentally evaluate asphalt mixture containing
different content of thermochromic and nano-TiO2 powders. Through laboratory experiments
above, the main conclusions are as follows:
1) The asphalt mixtures containing thermochromic powder and nano-TiO2 were prepared based
on Superpave method. The void content of asphalt mixture is around 4.7% with 6% black,
blue, and red thermochromic powders and between 4.5%-5.1% with 1% thermochromic
powder and 3% nano-TiO2.
2) The use of 6% red thermochromic powder reduces the moisture resistance of asphalt mixture
in terms of indirect tensile strength. The addition of 3% nano-TiO2 powder improves the
resistance of asphalt mixture to moisture damage.
3) The incorporation of 6% black thermochromic powder reduces the rutting resistance of
asphalt mixture. The presence of nano-TiO2 powder increases the resistance of asphalt
mixture to rutting or permanent deformation.

178
4) The addition of 6% thermochromic powder increases the solar reflectance in the infrared
range from 17% to 49%, whereas the use of 3% nano-TiO2 increases the value from 10% to
22%. After APA testing, the asphalt mixture containing 6% blue thermochromic powder,
1%/3% blue/TiO2, and 1%/3% red/TiO2 powders keeps relatively higher solar reflectance.
Additionally, the exposed aggregate surface of all HMA mixtures features considerably high
reflectance of around 23%.
Based on these findings, it is recommended to add 6% blue thermochromic powder, 1%/3%
blue/TiO2 powders, and 1%/3% red/TiO2 powders in asphalt mixture, which has been
demonstrated to improve both resistance to moisture damage and high temperature deformation
as well as stability of solar reflectance.
179
CHAPTER NINE
SUMMARY, CONCLUSIONS, AND FUTURE WORK
9.1 Summary and Conclusions
This report consisted of four major components: 1) review of thermochromism and common
types of thermochromic materials; 2) preliminary analyses of material production and
performance evaluation of thermochromic asphalt binder; 3) advanced characterization of
thermochromic asphalt binder in the areas of multifunctional properties (optical, thermal,
mechanical properties); and 4) evaluation of performance of thermochromic binder under
extended outdoor exposure.
9.1.1 Review of thermochromism and thermochromic materials
Comprehensive literature review was conducted to identify the common types of thermochromic
mechanism as well as common types of thermochromic materials. Common types of applications
of thermochromic materials in different industries are identified. In particular, the literature
review focuses on identifying technologies that have potentials for applications in asphalt.
Polymeric thermochromic materials, which feature excellent compatibility with asphalt, are
identified. The advantages and limitations of different thermochromisms for applications in
asphalt are discussed.
9.1.2 Preliminary analyses of material production and performance evaluation of
thermochromic asphalt binder
Activities in this area developed production procedures to introduce thermochromic materials
into asphalt binder. Properties of the produce samples were characterized with DSC and other
techniques. The performance of the thermochromic binder materials in modulating the surface
temperature of pavement were compared with those of the regular asphalt binder. Comparison
measurements found that the surface temperature of thermochromic asphalt binder is lower than
that of the conventional asphalt binder with maximum decrease as high as 6.6°C during typical
180
summer day in the northeast U.S. (i.e. Cleveland, OH). Furthermore, experimental results
indicated that the temperature dropped slower in thermochromic asphalts than in regular asphalt
when subjected to simulated winter temperature. This implies that thermochromic asphalt can
delay ice formation on the surface of road than traditional asphalt, which is an important
potential benefit for road safety in cold regions such as in Ohio. The preliminary study
demonstrated the potential of thermoelectric asphalt and set the tone for further investigations.
9.1.3 Advanced Characterization of Multifunctional Properties of Thermochromic
Asphalt Binder
Multifunctional characterizations were conducted to measure the properties of thermochromic
asphalt binders to understand the basis of its performance, characterize its mechanical durability,
and recommend the production parameters.
Optical properties: The optical reflectance of thermochromic binder was characterized with
spectral reflectance measurement. Measurement results indicate that thermochromic materials
feature more reflection at higher temperature and more absorption at lower temperature. The
spectral reflectance of thermochromic powders as functions of wavelength and temperature are
proposed by fitting experimental results. Optical measurements conducted on the asphalt binder
mixture show more reflection than conventional asphalt binder and besides, the solar reflectance
also increases with temperature. These are desirable for dynamically modulating the surface
temperature of pavements.
Thermal properties: The kinetic behaviors of thermochromic asphalt were characterized with
thermal analytic instruments such as TGA. The goal is to determine the production parameters
for thermochromic asphalt. The pyrolytic and kinetic behaviors are important for setting the
optimal plant production parameters (i.e., mixing temperature and duration) of thermochromic
asphalt binders. The results indicate that the mass loss of thermochromic binders are less than
5% when subjected to 200°C for 2 hours. Although the rate of mass losses of asphalt binder is
increased, the activation energy of asphalt binder is also increased after adding thermochromic
materials, indicating less susceptibility of viscosity of asphalt binder to temperature. No strong
chemical interactions occur between thermochromic powders and binder matrix. Heat treatment
181
is found to reduce the solar reflectance of thermochromic binders with the effects depending
upon the exposure duration. Considering both the pyrolysis characteristics (mass loss) and the
performance of solar (infrared) reflectance, the production parameters (temperature and mixing
duration) for the thermochromic asphalt binders are determined.
Mechanical properties: The mechanical properties of thermochromic asphalt binder are
studied via the Superpave binder performance tests. Experiments were conducted on asphalt
binders at three stages: unaged, rolling thin film oven (RTFO) residues, and RTFO + pressure
aging vessel residuals. Experimental results indicated that the penetration, phase angle and creep
rate of asphalt binder was decreased, while the softening point, viscosity, complex modulus,
rutting parameter, fatigue parameter and stiffness of asphalt binder was increased when
thermochromic powder were added into conventional asphalt binder. Furthermore, increasing the
content of thermochromic powder leads to reduction in the penetration depth and creep rate, and
increase of softening point, viscosity, complex shear modulus, rutting parameter, fatigue
parameter and stiffness. The percentages of thermochromic powders that improve the high
temperature performance grades of asphalt binder were determined. Overall, incorporation of
thermochromic materials into asphalt pavement will potentially improve its performance and
durability, especially in hot regions.
9.1.4 Evaluation of performance of thermochromic binder under extended outdoor
exposure.
Research activities evaluated the performance of thermochromic asphalt binder on modulating
the surface temperatures of pavement to assess its durability and sustainability. Comparison
studies were performed that include the outdoor thermal performance of conventional asphalt
concrete and different types of thermochromic asphalt concrete. The comparison study operated
through spring and summer 2014. The results show that the surface temperature of
thermochromic asphalt concrete was cooler than conventional asphalt concrete under hot
summer conditions up to 6°C, 6.2°C and 3.6°C and warmer during the evening up to 0.4°C,
1.7°C and 1.8°C by using black, blue and red thermochromic materials, respectively. Besides,
the temperature fluctuation of asphalt concrete was found to be reduced up to 5°C, 4°C and 3°C
by using black, blue and red thermochromic materials, respectively. Furthermore, compared to
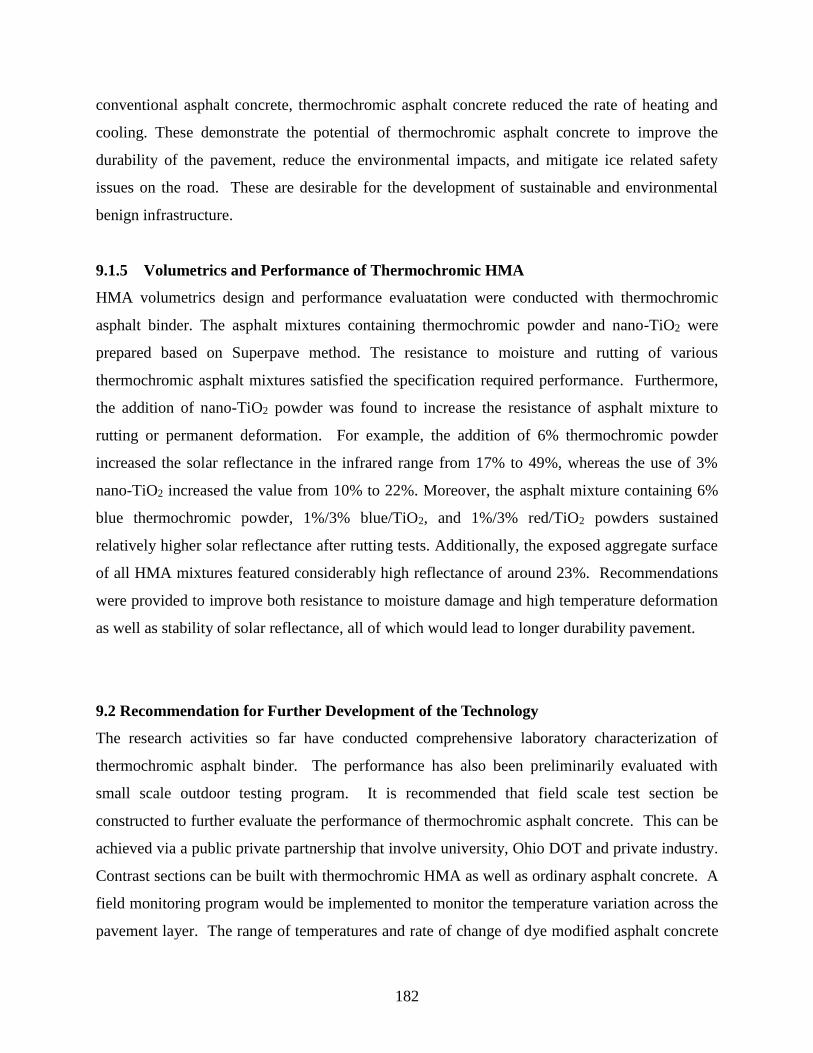
182
conventional asphalt concrete, thermochromic asphalt concrete reduced the rate of heating and
cooling. These demonstrate the potential of thermochromic asphalt concrete to improve the
durability of the pavement, reduce the environmental impacts, and mitigate ice related safety
issues on the road. These are desirable for the development of sustainable and environmental
benign infrastructure.
9.1.5 Volumetrics and Performance of Thermochromic HMA
HMA volumetrics design and performance evaluatation were conducted with thermochromic
asphalt binder. The asphalt mixtures containing thermochromic powder and nano-TiO2 were
prepared based on Superpave method. The resistance to moisture and rutting of various
thermochromic asphalt mixtures satisfied the specification required performance. Furthermore,
the addition of nano-TiO2 powder was found to increase the resistance of asphalt mixture to
rutting or permanent deformation. For example, the addition of 6% thermochromic powder
increased the solar reflectance in the infrared range from 17% to 49%, whereas the use of 3%
nano-TiO2 increased the value from 10% to 22%. Moreover, the asphalt mixture containing 6%
blue thermochromic powder, 1%/3% blue/TiO2, and 1%/3% red/TiO2 powders sustained
relatively higher solar reflectance after rutting tests. Additionally, the exposed aggregate surface
of all HMA mixtures featured considerably high reflectance of around 23%. Recommendations
were provided to improve both resistance to moisture damage and high temperature deformation
as well as stability of solar reflectance, all of which would lead to longer durability pavement.
9.2 Recommendation for Further Development of the Technology
The research activities so far have conducted comprehensive laboratory characterization of
thermochromic asphalt binder. The performance has also been preliminarily evaluated with
small scale outdoor testing program. It is recommended that field scale test section be
constructed to further evaluate the performance of thermochromic asphalt concrete. This can be
achieved via a public private partnership that involve university, Ohio DOT and private industry.
Contrast sections can be built with thermochromic HMA as well as ordinary asphalt concrete. A
field monitoring program would be implemented to monitor the temperature variation across the
pavement layer. The range of temperatures and rate of change of dye modified asphalt concrete
183
can provide comparison with conventional un-modified asphalt pavement. This will quantify the
effectiveness of thermochromic asphalt to positively modulate the surface temperature of
pavements.
It is also recommended to develop guidelines for material selection, field construction
and maintenance based on the experience from field testing program, guidelines will be
developed for materials selection and field construction.