HOT MIX ASPHALT MIX DESIGN CERTIFICATION | TN.gov
207
HOT MIX ASPHALT MIX DESIGN CERTIFICATION VERSION 21.0 2021 Division of Materials and Tests
-
Upload
khangminh22 -
Category
Documents
-
view
2 -
download
0
Transcript of HOT MIX ASPHALT MIX DESIGN CERTIFICATION | TN.gov

HOT MIX ASPHALT
MIX DESIGN
CERTIFICATION
VERSION 21.0
2021Division of Materials and Tests
Regional Materials & Tests Supervisors
Region 1: Brad Baskette (865) 594-4552
Region 2: Tony Renfro (423) 510-1190
Region 3: Kevin Isenberg (615) 350-4312
Region 4: Mitch Blankenship (731) 935-0215
Headquarters
HQ State Bituminous Engineer: Matthew Chandler, PE [email protected]
HQ Asphalt Field Operations: Dr. Hong J. Park [email protected]
Tyler Lacy [email protected]
Joseph Kerstetter [email protected]
Kim Whitby [email protected]
Helpful Links
HQ Asphalt Laboratory:
HQ Training Coordinator:
Specs, Circulars, Etc:
SOP:
https://www.tn.gov/tdot/tdot-construction-division/transportation-construction-division-resources/transportation-construction-2015-standard-specifications.html
https://www.tn.gov/tdot/materials-and-tests/standard-operating-procedures.html

1
Introduction
1. Introduction
1
Division of Materials and Tests
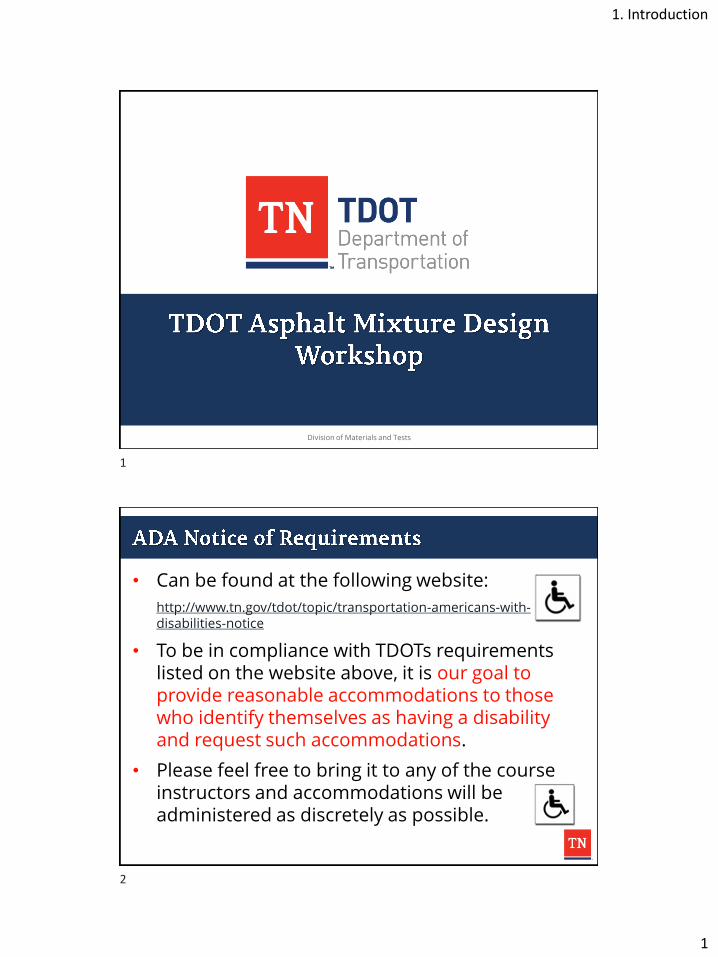
• Can be found at the following website:
http://www.tn.gov/tdot/topic/transportation-americans-with-disabilities-notice
• To be in compliance with TDOTs requirements listed on the website above, it is our goal to provide reasonable accommodations to those who identify themselves as having a disability and request such accommodations.
• Please feel free to bring it to any of the course instructors and accommodations will be administered as discretely as possible.
1
2

1. Introduction
2
No Tobacco Related Product Inside Building
No Electronic Cigarette No Chewing Tobacco AllowedSpitting into a bottle disturbs others
THIS IS A
TOBACCO FREE
LEARNING PLACE
• Workbook Description
–General Information
–Definitions/Abbreviations/Formulas
–Standard Test Methods Specs
–TDOT Specs/Applicable Supplemental Specs
–Sample Job Mix Formula (JMF)
3
4

1. Introduction
3
• Lecture
• Hands-on Demonstration
• Performing Calculations
• Test (Half Day)
–Test Methods
–Specifications/Results Interpretation
• Contacts for demonstration at the Regional Laboratories:
– Region 1: Billy Goins (865) 806-1935
– Region 2: Tony Renfro (423) 510-1190
– Region 3: Trey Anderson (615) 350-4198
– Region 4: Mitch Blankenship (731) 935-0231
5
6

1. Introduction
4
• Contractor is responsible for performing mix designs
• Federal Regulations (CFR 637) requires the State maintain a Quality program which includes laboratories and technicians
• QUALITY!!
7
8
1. Introduction
5
9
10

1. Introduction
6
• Pass Exam, 70% or better.
• Perform a Full Mix Design Demonstration at Regional Lab
• Regional TDOT personnel will mail documentation of your passed demo to Nashville (HQ).
• HQ personnel will mail your certificate and card with your certification number to the address you provided here on the sign-up sheet.
• Certifications last 5 years
• To Re-certify, you must attend a one-day, regional re-certification class BEFORE your certificate expires. Then, you must do a small re-cert demo at the region.
• Regional TDOT personnel will mail documentation of your passed re-cert demo to Nashville (HQ).
• New cards and certs will be mailed out as before.
11
12
1. Introduction
7
• The final page at the end of the (specifications) book contains all abbreviations.
Questions?
13
14
2
Basic Materials
2. Basic Materials
1
Division of Materials and Tests
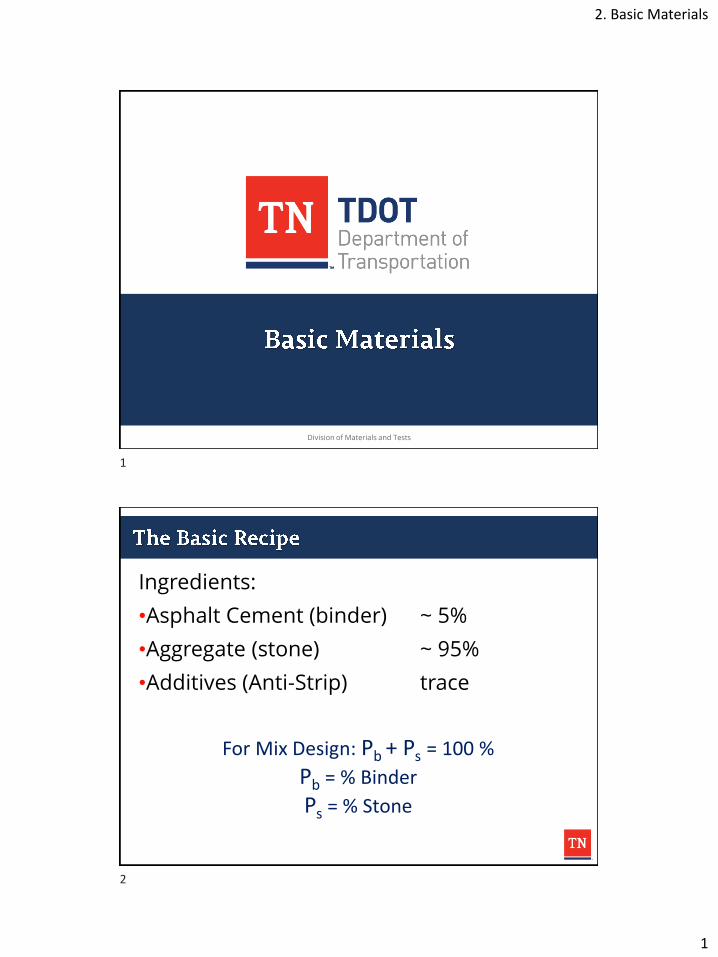
Ingredients:
•Asphalt Cement (binder) ~ 5%
•Aggregate (stone) ~ 95%
•Additives (Anti-Strip) trace
For Mix Design: Pb + Ps = 100 %
Pb = % Binder
Ps = % Stone
1
2

2. Basic Materials
2
Step 1: Heat AC until it becomes a liquid state and put in chemical additive if required.
Step 2: Combine all ingredients and mix until all aggregates are coated by AC.
Step 3: Spread Mixture on Roadway
• Does that sound familiar?
• Maybe like something you learned to cook as a kid?
3
4

2. Basic Materials
3
5
6

2. Basic Materials
4
• ~5% of mix
• Glue / Binder
–Resists tensile force
–Holds aggregate together
• Little Compressive Strength
–Does not resist compaction well
Early roads were just stone, what could go wrong?
7
8

2. Basic Materials
5
• People began to use other materials to glue, or bind, the stone together, two solutions became the norm.
• One of the solutions was Tar, thus Tar-Mac, the term still commonly used for airports.
Asphalt soon replaced, tar. Why?
• Asphalt has more favorable properties for production and durability.
• Availability: Asphalt is a byproduct of petroleum production.
– More Cars = More Pavement, but also
– More Cars = More Petroleum Production
9
10

2. Basic Materials
6
• We call asphalt binder is ViscoElastic material, or we call it temperature dependent material.
• Which means asphalt binder behave like a liquid body or a solid body depending on temperature.
TEMPERATURE HIGHLOW
SOLID LIQUIDAPPARENT STATE
VISCOSITY
ELASTICITY
HIGH
HIGH
LOW
LOW
11
12

2. Basic Materials
7
Effect of Temperature (Temperature-Dependent behavior)
Effect of Loading Time (Time-Dependent behavior)
13
14

2. Basic Materials
8
• Asphalt Reacts with Oxygen
– “Oxidative” or “Age” hardening
–Aging begins right after mixing
• During Construction - Short Term
–Hot mixing temp.
–Placing/Compaction
• In Service - Long Term
–Hot climate is worse than cool climate
–Summer is worse than winter
BLUE SMOKE!!
15
16

2. Basic Materials
9
• Aged pavement
–Harder = Stiffer
– Less Flexible = More Brittle
• Eventually will happen, one of goals of mix design is to put this off as long as possible.
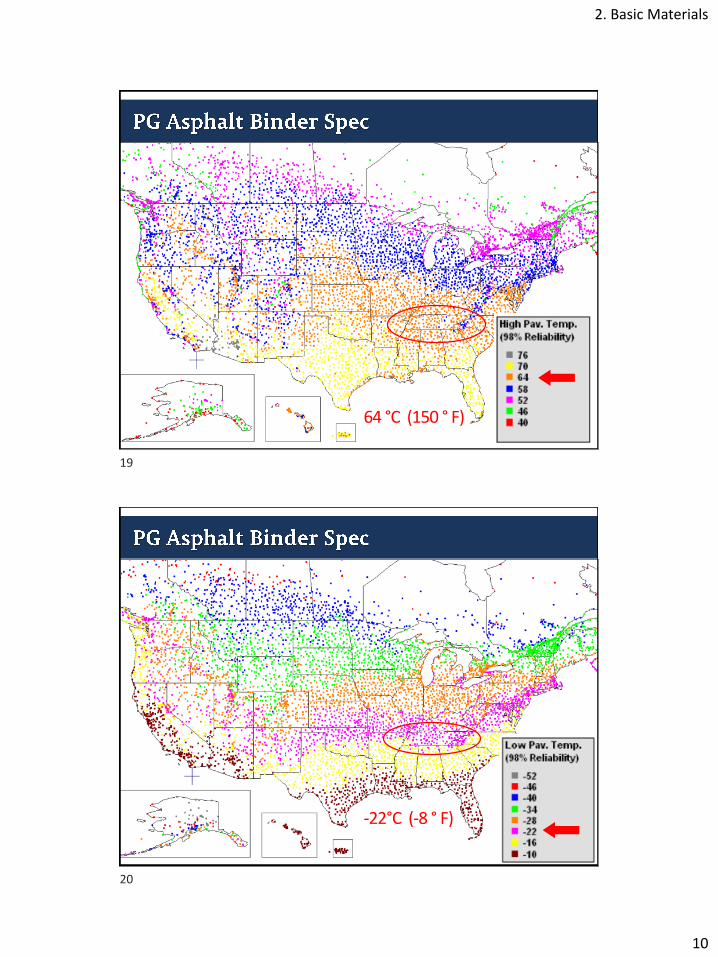
• Can be controlled by binder properties
Grading System of Asphalt Binder Based on Climate
PG 64-22
PerformanceGrade
Average 7-daymax pavement
design temp
Min pavementdesign temp
17
18
2. Basic Materials
10
64 °C (150 ° F)
-22°C (-8 ° F)
19
20

2. Basic Materials
11
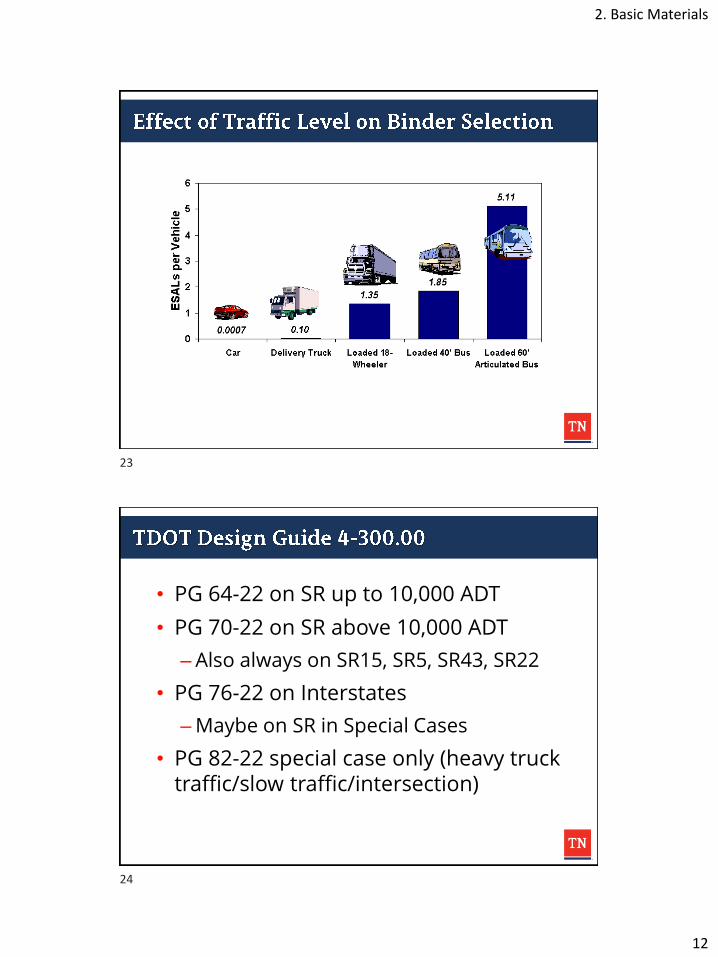
• Asphalt also deforms because of loading
– Heavier and Slower traffic cause more deformation than Faster and Lighter
• Account for traffic loading by “grade bumping” the high temp to a stiffer AC
• TDOT specifies on plan which grade
• Measured in ESALs
– Equivalent Single Axle Load = 18 kips
– Cumulative over life (20 years)
• General Guidance
– 10,000 – 30,000 ESALs: bump one grade
– >30,000 ESALs : bump two grades
21
22
2. Basic Materials
12
• PG 64-22 on SR up to 10,000 ADT
• PG 70-22 on SR above 10,000 ADT
– Also always on SR15, SR5, SR43, SR22
• PG 76-22 on Interstates
–Maybe on SR in Special Cases
• PG 82-22 special case only (heavy truck traffic/slow traffic/intersection)
23
24

2. Basic Materials
13
• Balance Between High and Low Temp Physical Properties
– Absolute difference between high and low temp.
– Difference < 90 probably unmodified asphalt
– Difference > 90 probably modified asphalt
• PG 64-22
– Difference = 64 – (-22) = 86 Unmodified
• PG 70-22
– Difference = 70 – (-22) = 92 Modified
If modification of the asphalt is necessary that will be accomplished by blending the following modifiers:
–Styrene Butadiene (SB)
–Styrene Butadiene Styrene (SBS)
–Styrene Butadiene Rubber (SBR)
–Ground Tire Rubber (GTR)
25
26

2. Basic Materials
14
• Modified binders: more expensive
– 92 degree differential (PG 70-22)
• 5% more expensive than PG 64-22
– 98 degree differential (PG 76-22)
• 15% more expensive than PG 64-22
• Modified binders: stiffer, have to be heated more to get to desirable viscosity for mixing/compaction
Perform any additional laboratory testing of the mix using thelaboratory mix and compaction temperatures listed on theapproved JMF, with a tolerance of ± 5°F for each temperature.
27
28
2. Basic Materials
15
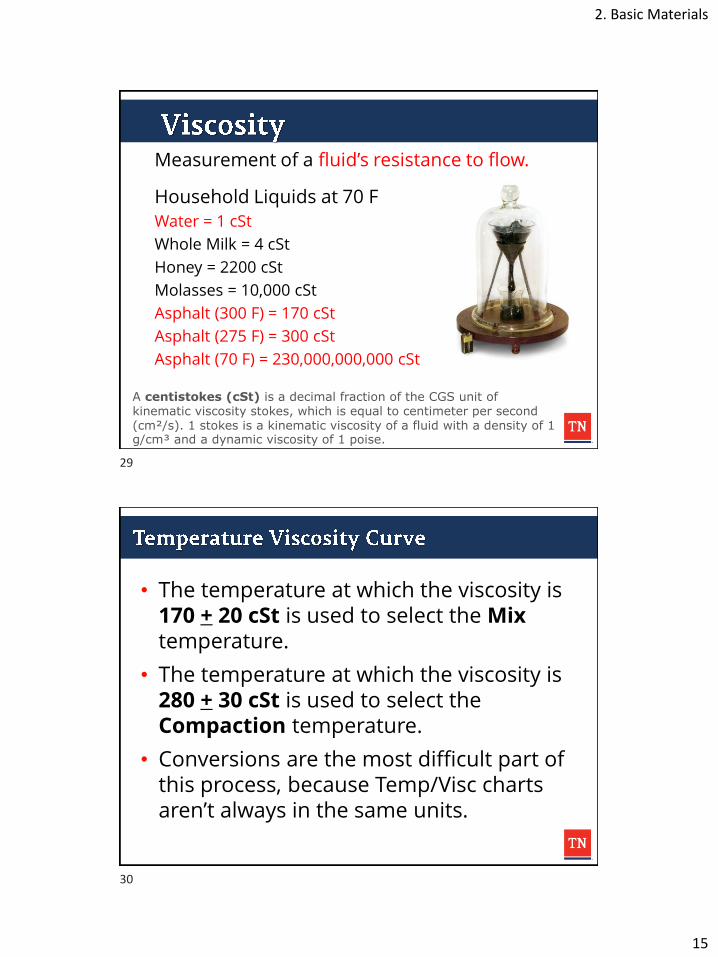
Measurement of a fluid’s resistance to flow.
Household Liquids at 70 F
Water = 1 cSt
Whole Milk = 4 cSt
Honey = 2200 cSt
Molasses = 10,000 cSt
Asphalt (300 F) = 170 cSt
Asphalt (275 F) = 300 cSt
Asphalt (70 F) = 230,000,000,000 cSt
A centistokes (cSt) is a decimal fraction of the CGS unit of kinematic viscosity stokes, which is equal to centimeter per second (cm²/s). 1 stokes is a kinematic viscosity of a fluid with a density of 1 g/cm³ and a dynamic viscosity of 1 poise.
• The temperature at which the viscosity is 170 + 20 cSt is used to select the Mixtemperature.
• The temperature at which the viscosity is 280 + 30 cSt is used to select the Compaction temperature.
• Conversions are the most difficult part of this process, because Temp/Visc charts aren’t always in the same units.
29
30

2. Basic Materials
16
1,000
500
º Celsius 52 58 64 70 76 82
º Fahrenheit 125 137 147 158 169 180 356 511248 275 302 329
100,000
88 100 120 135 150 165 180 200
100
10,000
500,000
190 212
Vis
cosi
ty,
Ce
ntip
ois
e
cP
Temperature / Viscosity Chart
0.3
0.1
10
5
0.2
0.5
1
Vis
cosi
ty, P
a s
Compaction Range (280 ± 30cSt)
Mixing Range (170 ± 20cSt)
Temperature, C / F
ºCelsius
ºFahrenheit
Centistroke(cSt)
Poise Pascal Seconds (Pa*s)
Mixing 170±20 1.7±0.2 0.17±0.02
Compaction 280±30 2.8±0.3 0.28±0.03
AASHTO T245, Section 3.3
Must adhere to TDOT Spec 407.11
The temperature for Grading AS, Grading ACRL, and Grading TPB mixtures shall be between 225 and 275°F, except when modified binders are used, and then the temperature shall be between 250 and 310 °F. Aggregate should be coated and no visible drain down should occur in storage silos or hauling equipment.
31
32

2. Basic Materials
17
• ~95% of mix
• Structural Skeleton
–Resists compressive force
–Provides stability
• No Tensile Strength
–Cannot be stretched
33
34

2. Basic Materials
18
Above
Below
35
36
2. Basic Materials
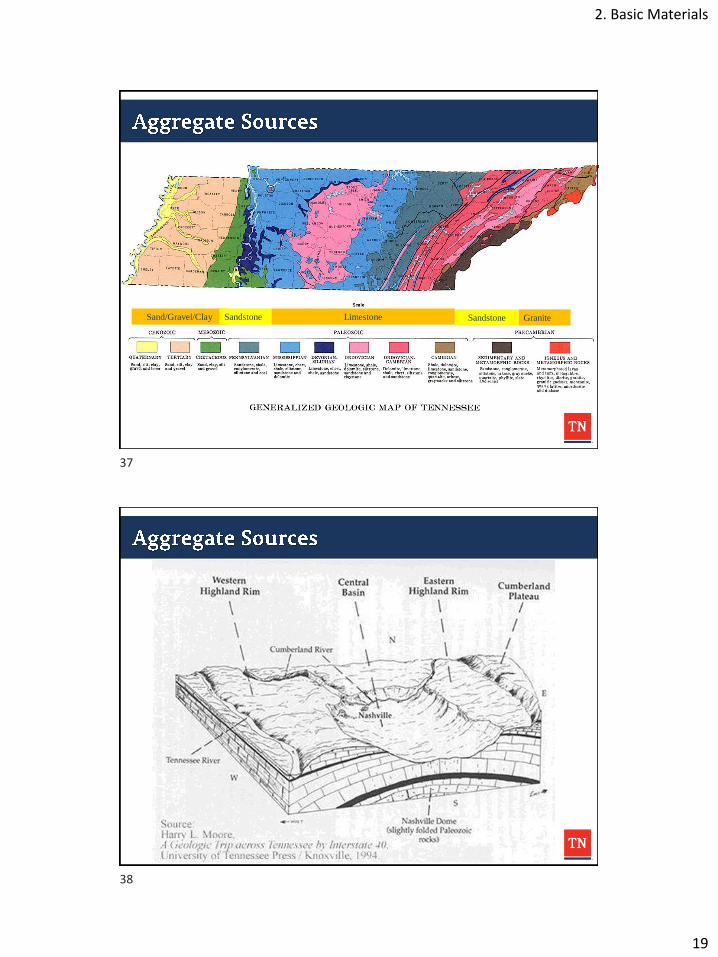
19
Sand/Gravel/Clay Limestone Sandstone GraniteSandstone
37
38
2. Basic Materials
20
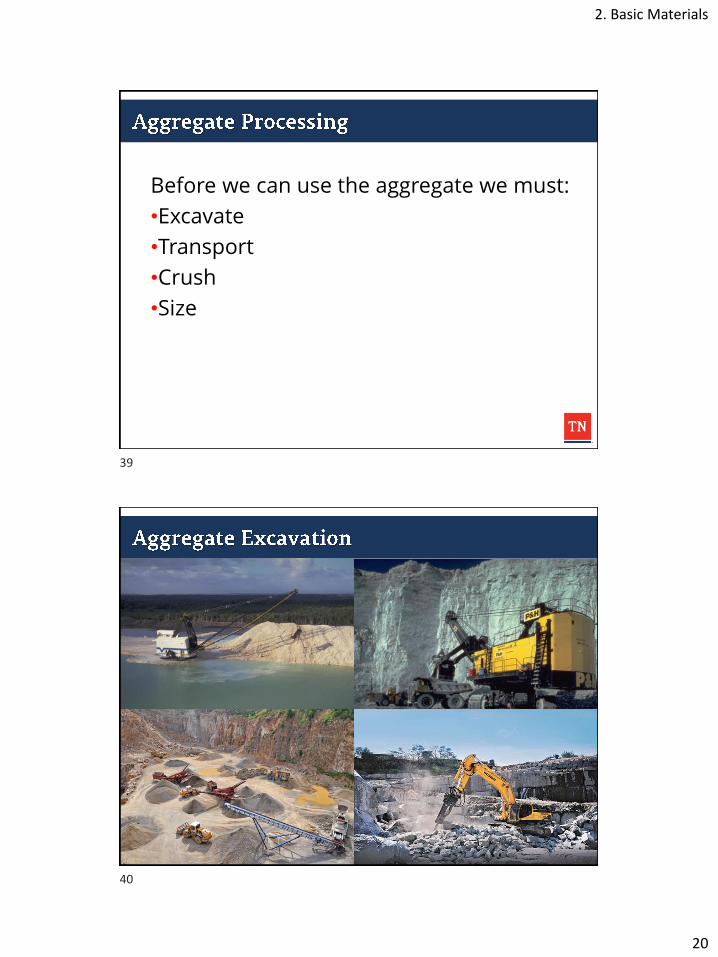
Before we can use the aggregate we must:
•Excavate
•Transport
•Crush
•Size
39
40

2. Basic Materials
21
Above the Fall Line (East of the River)•Blasted from quarry: creates rough surface, 100% angular.
•Highly Angular: rough surface -> more friction between particles
•Coarse: Crushed Stone
•Fine: Manufactured Sand
Below the Fall Line (West of the River)•Round: smooth surface -> less friction between particles
•Must be crushed or roundness otherwise accounted for in design
•Coarse: Crushed Stone
•Fine: Manufactured Sand
41
42

2. Basic Materials
22
Where are asphalt plants usually located?
43
44

2. Basic Materials
23
If there is a quarry, that is where you will find the asphalt plant. Why?
Haul costs by truck are very expensive
–Typically: 1st mile is a flat fee/(ton)
–All subsequent miles are a price/(ton-mile)
Example: TDOT Maintenance on-call Price
45
46

2. Basic Materials
24
Aggregate Price = $14 per ton
Haul Price = 3.75/ton (1st mile) + $0.30/(ton-mile)
$14(1T) = 3.75/ton(1T) + 0.30/(T-mi)(1T)(X-1 mi)
X= (14-3.75)/0.30 + 1
X= 35 mi
So: at 35 miles you are paying more for hauling than materials.
Hauling economics drive using as near as local aggregate as possible.
Ideally you want to use angular stone but…
If all you have nearby is river gravel, that is what you are probably going to have to use.
47
48
2. Basic Materials
25
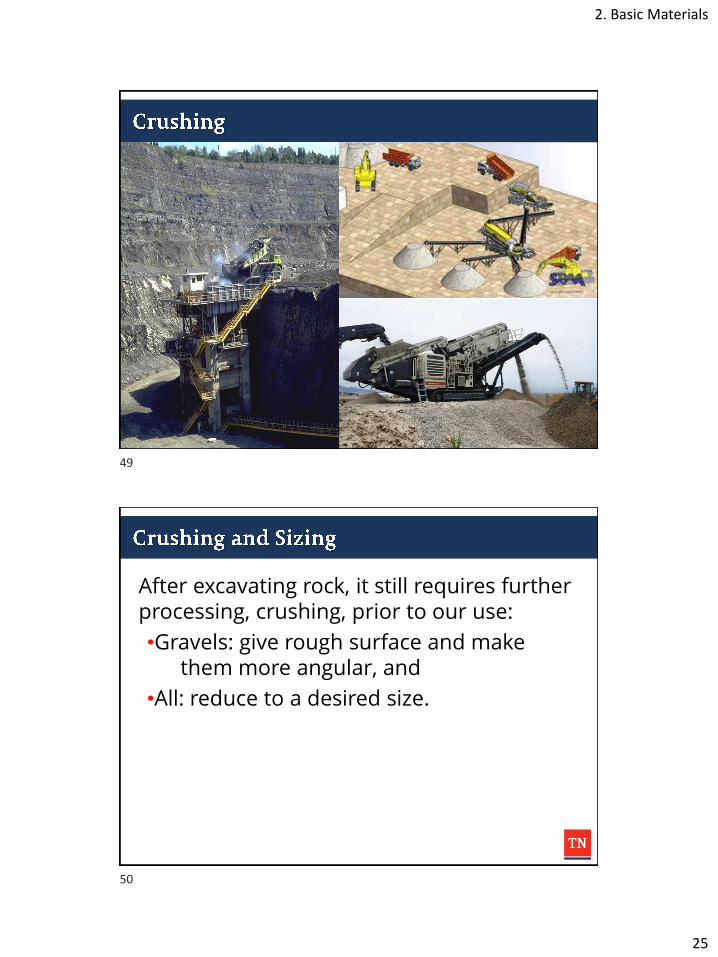
After excavating rock, it still requires further processing, crushing, prior to our use:
•Gravels: give rough surface and make them more angular, and
•All: reduce to a desired size.
49
50
2. Basic Materials
26
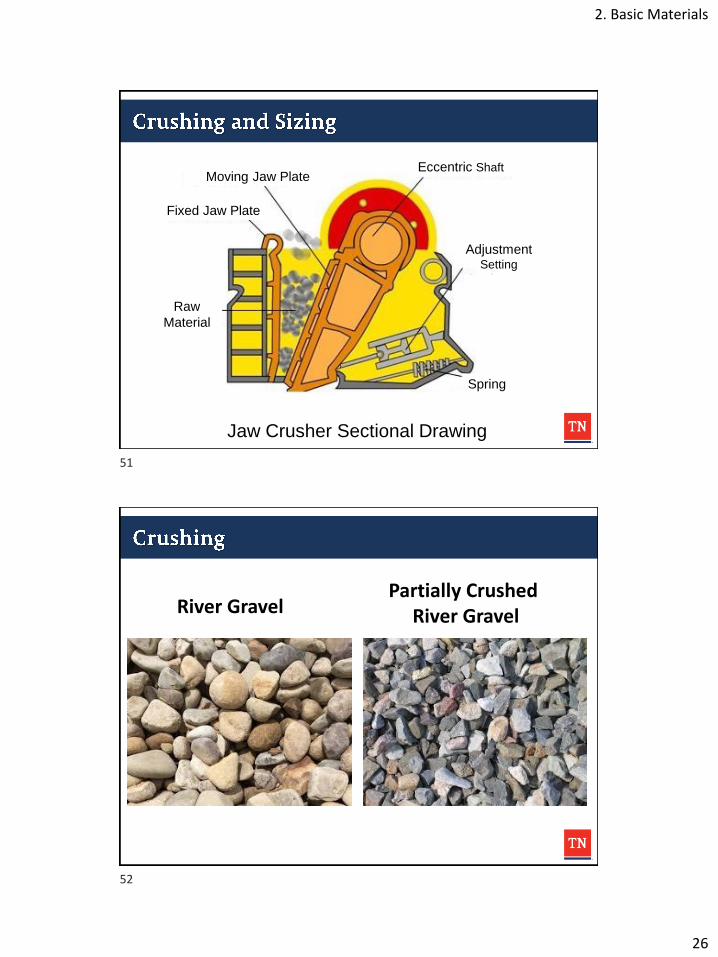
Eccentric Shaft
AdjustmentSetting
Spring
Raw
Material
Fixed Jaw Plate
Moving Jaw Plate
Jaw Crusher Sectional Drawing
River GravelPartially Crushed
River Gravel
51
52

2. Basic Materials
27
• After crushing, aggregates are ran across screens to sort by size.
• Stones of like size are then stockpiled.
– Defined by nominal aggregate size but will contain particles smaller.
– Maximum Aggregate and Nominal Maximum Aggregate Size terminology is slightly different when talking about stockpiles aggregate vs. asphalt.
53
54

2. Basic Materials
28
• Source Properties: Properties that are fairly uniform for rock from the same source
• Consensus Properties: Properties that are dependent on aggregate processing.
– “Consensus” because state DOTs agreed they were important to the mix design.
• Source Properties: Properties that are fairly uniform for rock from the same source
– Toughness
– Soundness
– Gradation
– Deleterious (covered in Agg. Class)
55
56

2. Basic Materials
29
• Resistance of course aggregate to abrasion and mechanical degradation during handling, construction, and use.
• LA Abrasion Test (AASHTO T-96)
– Aggregate at standard gradation subjected to damage by rolling with a prescribed number of steel balls in large drum for a given number of rotations.
– Result expressed as a percent change to original weight.
LA Abrasion Test
Approx. 10% loss for extremely hard igneous rocks.
Approx. 60% loss for soft limestones and sandstones
57
58

2. Basic Materials
30
• Estimates resistance to weathering.
• AASHTO T 104 “Sodium Sulfate Soundness Test”
– Simulates freeze/thaw action by successively wetting and drying aggregate in a sodium sulfate or magnesium solution.
– One immersion and drying is considered one cycle.
– Result is total percent loss over various sieve intervals for a prescribed number of cycles.
– Mass loss values typically fall between 10% to 20% per 5 intervals.
AASHTO T104 - Sodium Sulfate Soundness Test
Before After
59
60
2. Basic Materials
31
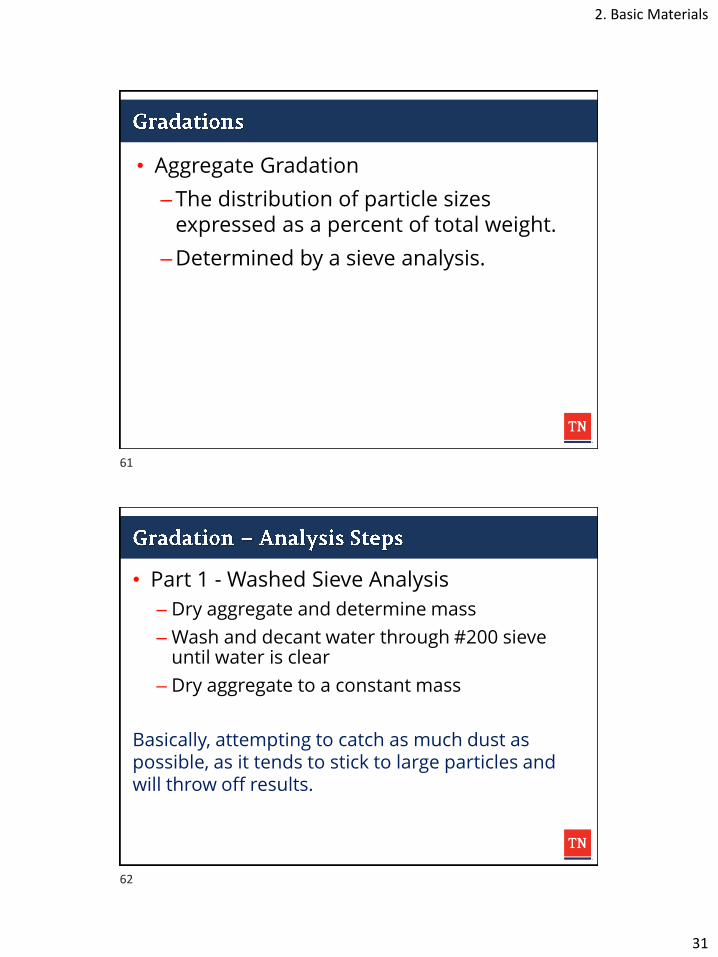
• Aggregate Gradation
–The distribution of particle sizes expressed as a percent of total weight.
–Determined by a sieve analysis.
• Part 1 - Washed Sieve Analysis
– Dry aggregate and determine mass
– Wash and decant water through #200 sieve until water is clear
– Dry aggregate to a constant mass
Basically, attempting to catch as much dust as possible, as it tends to stick to large particles and will throw off results.
61
62

2. Basic Materials
32
• Part 2 – Mechanical Sieve Analysis
– Place dry aggregate in standard stack of sieves
– Place sieve stack in mechanical shaker
– Determine mass of aggregate retained on each sieve
– Add the mass loss from the part 1 to the weight retained in the pan
63
64

2. Basic Materials
33
Aggregate Size Definitions
• Nominal Maximum Aggregate Size:
One size larger than the first sieve to retain more than 10%.
• Maximum Aggregate Size:
One size larger than nominal maximum size.
Aggregate Size Definitions
What would be the NMAS and Max.
Aggregate Size for the blend shown
here?
Sieve
(in)
%
Pass
3/4" 100
5/8" 100
1/2" 97
3/8" 84
No.4 57
No.8 43
No.16
No.30 25
No.50 10
No.100 6
No.200 4
NMAS
Max. Aggregate Size
Less than 90% Passing (the first sieve retained more than
10% retained)
65
66

2. Basic Materials
34
Types of gradations in asphalt mixture
• Uniformly-Graded• Few points of contact.• Poor interlock (Shape dependent).• High permeability.
• Well-Graded• Good interlock.• Low permeability.
• Gap-Graded• Only limited sizes.• Good interlock.• Low permeability.
• Source Properties: Properties that are fairly uniform for rock from the same source
• Consensus Properties: Properties that are dependent on aggregate processing.
– “Consensus” because state DOTs agreed they were important to the mix design.
67
68

2. Basic Materials
35
• Coarse Aggregate Particle Shape
–Percent Crushed Faces
–Flat and Elongated
• Fine Aggregate Particle Shape
• Deleterious Materials
• TDOT Tests:
– coarse aggregate crushed faces
– coarse aggregate flat/elongated
– deleterious materials
• TDOT does not test:
– fine aggregate angularity
• limits natural sand by method spec instead
69
70

2. Basic Materials
36
• Crushed Faces (AKA Fractured Faces)
• Quarried materials always 100% crushed.
• Minimum values depended upon traffic level and layer.
• Defined as a percent by count with a required number of crushed faces of the aggregate
– Required number of fractured faces is spelled out in each spec
TDOT Standard SPEC 903.11. C3
71
72

2. Basic Materials
37
0% Crushed100% Crushed
(2 or more faces)
Does the rock pass the sieve?
73
74
2. Basic Materials
38
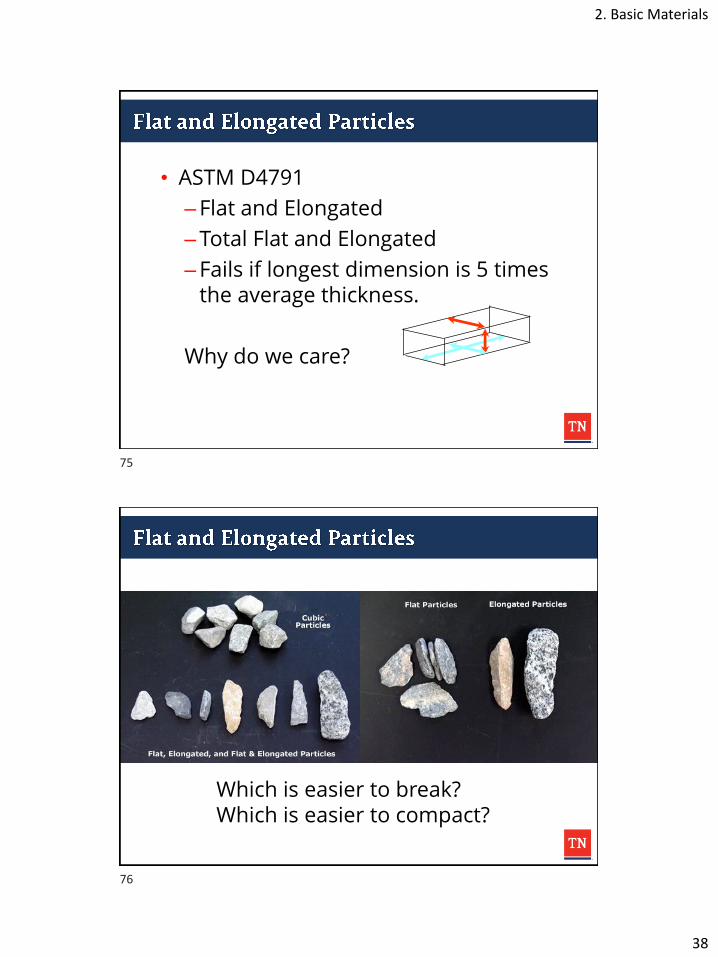
• ASTM D4791
–Flat and Elongated
–Total Flat and Elongated
–Fails if longest dimension is 5 times the average thickness.
Why do we care?
Which is easier to break?Which is easier to compact?
75
76

2. Basic Materials
39
• Rocks that are close to uniform in dimension:
–Orientation does not matter
–All axis are equally strong
• Rocks that have widely different dimensions:
–Behavior is reliant on orientation
–Has a weak axis that can be more easily broken
Check for materials present in the stockpile other than aggregate that is harmful to the mix
•Particularly concerned with natural sand
– Why?
•Checked by independent lab
77
78

2. Basic Materials
40
Quick Refresher
•Volume
•Density
•Specific Gravity
Amount of space that a substance occupies
How compact or heavy it is in a given volume
Density of a substance divided by the density of water.
• Amount of space that a substance occupies
• For solid objects: fairly straight forward equations exist
• For objects that are not solid: a bit more work to do
79
80

2. Basic Materials
41
• The easiest way to measure a non-solid object is to submerge it in water and measure the displacement.
• The amount of volume displaced is equal to the volume of the object.
Why do we care?
What does TDOT want from the contractor?
• Pave a road “X” thick by “Y” wide by “Z” long
• In other words, a volume of asphalt
How does TDOT Estimate and Pay for asphalt?
• By the ton
• Which is a mass, not a volume
81
82

2. Basic Materials
42
How do we get from volume to mass (weight)
• Density is the unit weight of a material(lb/ft3 or g/cm3)
–SI Unit
𝜌𝑊 = 1.0 ൗ𝑔𝑐𝑚3 = 1.0 ൗ
𝑔𝑚𝑙
–US Metric
𝜌𝑊 = 62.4 ൗ𝑙𝑏 𝑓𝑡3
83
84
2. Basic Materials
43
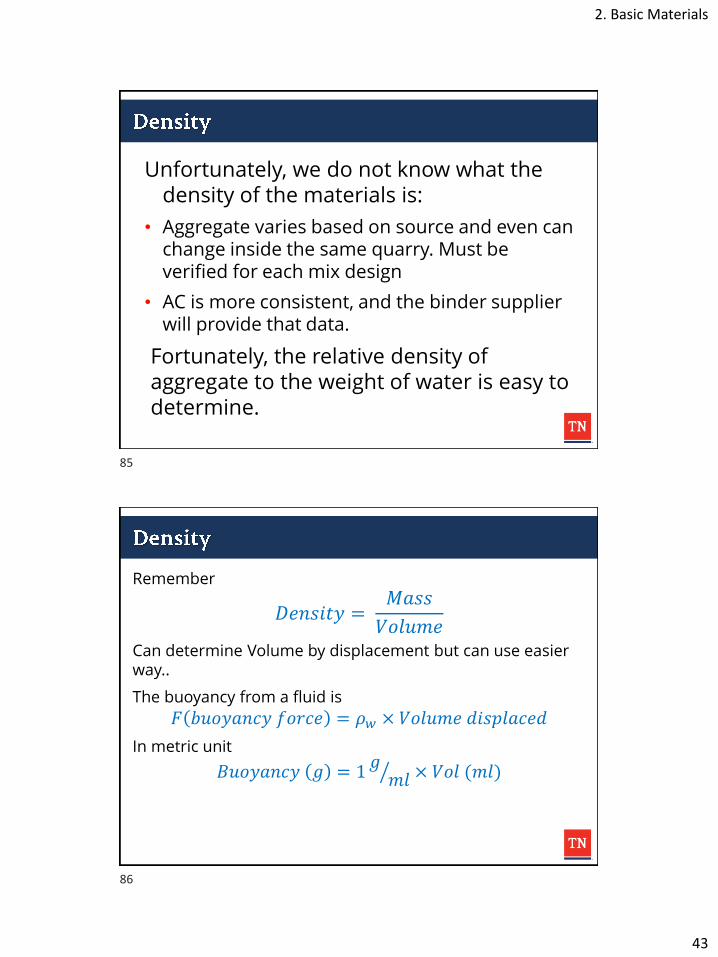
Unfortunately, we do not know what the density of the materials is:
• Aggregate varies based on source and even can change inside the same quarry. Must be verified for each mix design
• AC is more consistent, and the binder supplier will provide that data.
Fortunately, the relative density of aggregate to the weight of water is easy to determine.
Remember
𝐷𝑒𝑛𝑠𝑖𝑡𝑦 =𝑀𝑎𝑠𝑠
𝑉𝑜𝑙𝑢𝑚𝑒Can determine Volume by displacement but can use easier way..
The buoyancy from a fluid is
𝐹 𝑏𝑢𝑜𝑦𝑎𝑛𝑐𝑦 𝑓𝑜𝑟𝑐𝑒 = 𝜌𝑤 × 𝑉𝑜𝑙𝑢𝑚𝑒 𝑑𝑖𝑠𝑝𝑙𝑎𝑐𝑒𝑑
In metric unit
𝐵𝑢𝑜𝑦𝑎𝑛𝑐𝑦 𝑔 = 1 ൗ𝑔𝑚𝑙 × 𝑉𝑜𝑙 (𝑚𝑙)
85
86

2. Basic Materials
44
Since the density of water is 1, we can use grams and milliliters interchangeably and actually measure volume by determining the change in weight while submerged.
𝑀𝑎𝑠𝑠 𝑖𝑛 𝐴𝑖𝑟 − 𝑀𝑎𝑠𝑠 𝑖𝑛 𝑊𝑎𝑡𝑒𝑟 = 𝐵𝑢𝑜𝑦𝑎𝑛𝑡 𝐹𝑜𝑟𝑐𝑒𝑀𝑎𝑠𝑠 𝑖𝑛 𝐴𝑖𝑟 − 𝑀𝑎𝑠𝑠 𝑖𝑛 𝑊𝑎𝑡𝑒𝑟 = 𝑉𝑜𝑙𝑢𝑚𝑒
𝐷𝑒𝑛𝑠𝑖𝑡𝑦 =𝑀𝑎𝑠𝑠
𝑉𝑜𝑙𝑢𝑚𝑒=
𝑀𝑎𝑠𝑠 𝑖𝑛 𝐴𝑖𝑟
(𝑀𝑎𝑠𝑠 𝑖𝑛 𝐴𝑖𝑟 −𝑀𝑎𝑠𝑠 𝑖𝑛 𝑊𝑎𝑡𝑒𝑟)
𝑀𝑎𝑠𝑠 𝑖𝑛 𝑊𝑎𝑡𝑒𝑟 = 𝑀𝑎𝑠𝑠 𝑖𝑛 𝐴𝑖𝑟 − 𝐵𝑢𝑜𝑦𝑎𝑛𝑡 𝐹𝑜𝑟𝑐𝑒
• Ratio of the density of a material to the that of water for equal volumes.
• Specific gravities are always expressed to three decimal places.
𝑆𝐺 =𝐷𝑒𝑛𝑠𝑖𝑡𝑦 𝑜𝑓 𝑀𝑎𝑡𝑒𝑟𝑖𝑎𝑙
𝐷𝑒𝑛𝑠𝑖𝑡𝑦 𝑜𝑓 𝑊𝑎𝑡𝑒𝑟=𝜌𝑚𝑎𝑡𝑒𝑟𝑖𝑎𝑙
𝜌𝑤𝑎𝑡𝑒𝑟
=
𝑀𝑎𝑠𝑠𝑉𝑜𝑙𝑚𝑢𝑒 𝑜𝑓 𝑀𝑎𝑡𝑒𝑟𝑖𝑎𝑙
1 ൗ𝑔𝑐𝑚3
Using metric units we can simply divide the mass/volume of the material
87
88

2. Basic Materials
45
• Yes, If Specific Gravity is less than 1.000, it will float
• No, If Specific Gravity is larger than 1.000, it will sink
• Naming Convention
Gsb
Material:s: stone (aggregate)b: binder (asphalt cement)m: mixture
Type of Specific Gravity:m: maximum densityb: bulka: apparente: effective
G: Specific Gravity
89
90

2. Basic Materials
46
Not counted in volume
Unfillable Voids
91
92

2. Basic Materials
47
Volume of water-permeable voids.
Surface Voids
𝑆𝑝𝑒𝑐𝑖𝑓𝑖𝑐 𝐺𝑟𝑎𝑣𝑖𝑡𝑦 =𝐷𝑒𝑛𝑠𝑖𝑡𝑦 𝑜𝑓 𝑀𝑎𝑡𝑒𝑟𝑖𝑎𝑙
𝐷𝑒𝑛𝑠𝑖𝑡𝑦 𝑜𝑓 𝑊𝑎𝑡𝑒𝑟=
𝑀𝑎𝑠𝑠𝑉𝑜𝑙𝑚𝑢𝑒 𝑜𝑓 𝑀𝑎𝑡𝑒𝑟𝑖𝑎𝑙
1 ൗ𝑔𝑐𝑚3
𝐺𝑠𝑎 𝐺𝑠𝑏𝐺𝑠𝑒
Vol. of agg. not including surface pores
Vol. of agg. including pores not filled with AC
Vol. of agg. including surface pores
≥ ≥
93
94
2. Basic Materials
48
Questions?
95
3
Designing TDOT Mixes

3. Designing TDOT Mixtures
1
Division of Materials and Tests
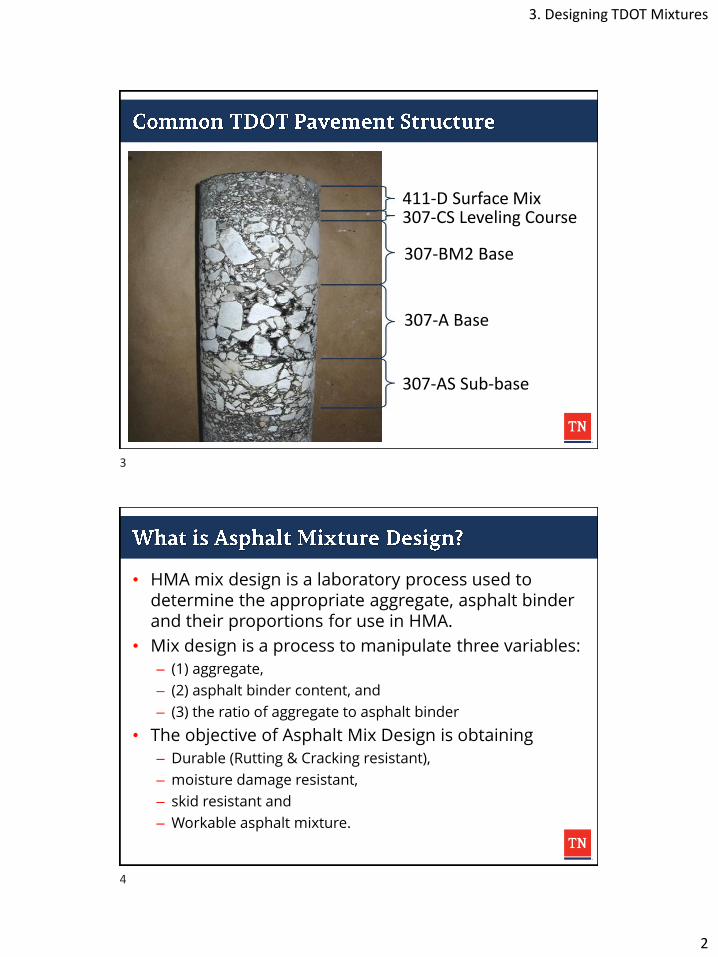
Asphalt pavement has multi layered structure
• Surface Mix – Section 411
D, TL, TLD, TLE, OGFC, E, E (Shoulder)
• Base/Intermediate Mix – Section 307
A, AS, ACRL, B, BM, BM2, C, CS, & CW
• Treated Permeable Base – Section 313
TPB
•Surface/wearing course•Intermediate/binder course•Base Course•Subgrade
1
2
3. Designing TDOT Mixtures
2
411-D Surface Mix307-CS Leveling Course
307-BM2 Base
307-A Base
307-AS Sub-base
• HMA mix design is a laboratory process used to determine the appropriate aggregate, asphalt binder and their proportions for use in HMA.
• Mix design is a process to manipulate three variables:
– (1) aggregate,
– (2) asphalt binder content, and
– (3) the ratio of aggregate to asphalt binder
• The objective of Asphalt Mix Design is obtaining
– Durable (Rutting & Cracking resistant),
– moisture damage resistant,
– skid resistant and
– Workable asphalt mixture.
3
4

3. Designing TDOT Mixtures
3
• Build a mixture that meets the desired gradation presented in Spec.
• Find an optimum AC content that yields results that meet the design criteria.
– Primarily: % Air Void (VTM)
– But also: Stability, Flow, VFA
• Determine what antistrip precautions must be taken.
• Which tests do you need to complete to determine your optimum binder content?
• Which additional tests do you need to complete on the specimens?
• What information is useful from each test method and why?
5
6
3. Designing TDOT Mixtures
4
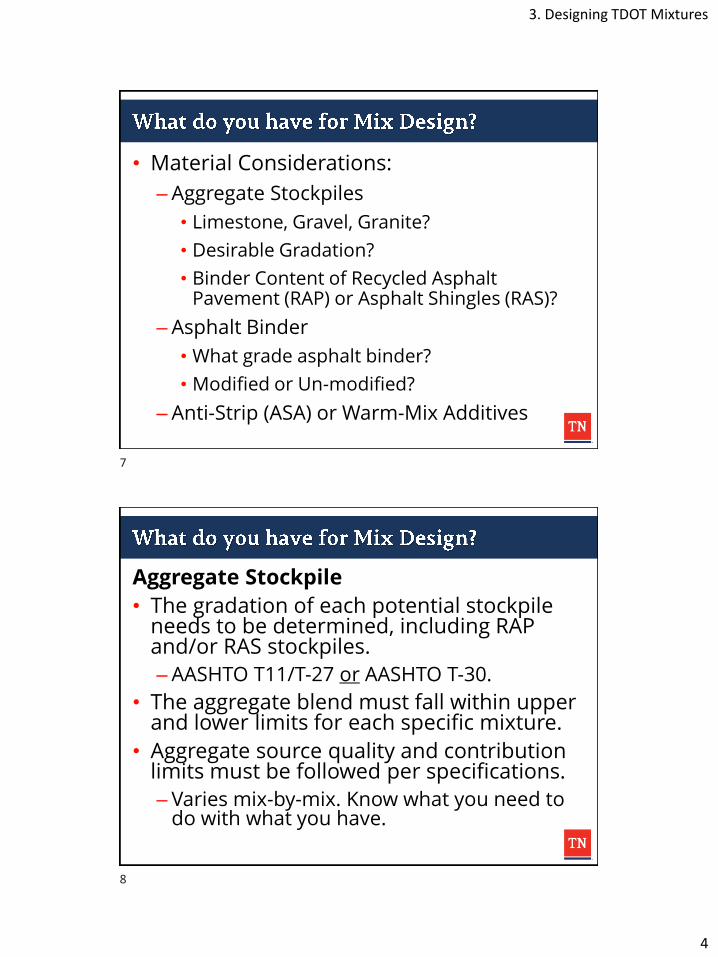
• Material Considerations:
– Aggregate Stockpiles
• Limestone, Gravel, Granite?
• Desirable Gradation?
• Binder Content of Recycled Asphalt Pavement (RAP) or Asphalt Shingles (RAS)?
– Asphalt Binder
• What grade asphalt binder?
• Modified or Un-modified?
– Anti-Strip (ASA) or Warm-Mix Additives
Aggregate Stockpile
• The gradation of each potential stockpile needs to be determined, including RAP and/or RAS stockpiles.
– AASHTO T11/T-27 or AASHTO T-30.
• The aggregate blend must fall within upper and lower limits for each specific mixture.
• Aggregate source quality and contribution limits must be followed per specifications.
– Varies mix-by-mix. Know what you need to do with what you have.
7
8
3. Designing TDOT Mixtures
5
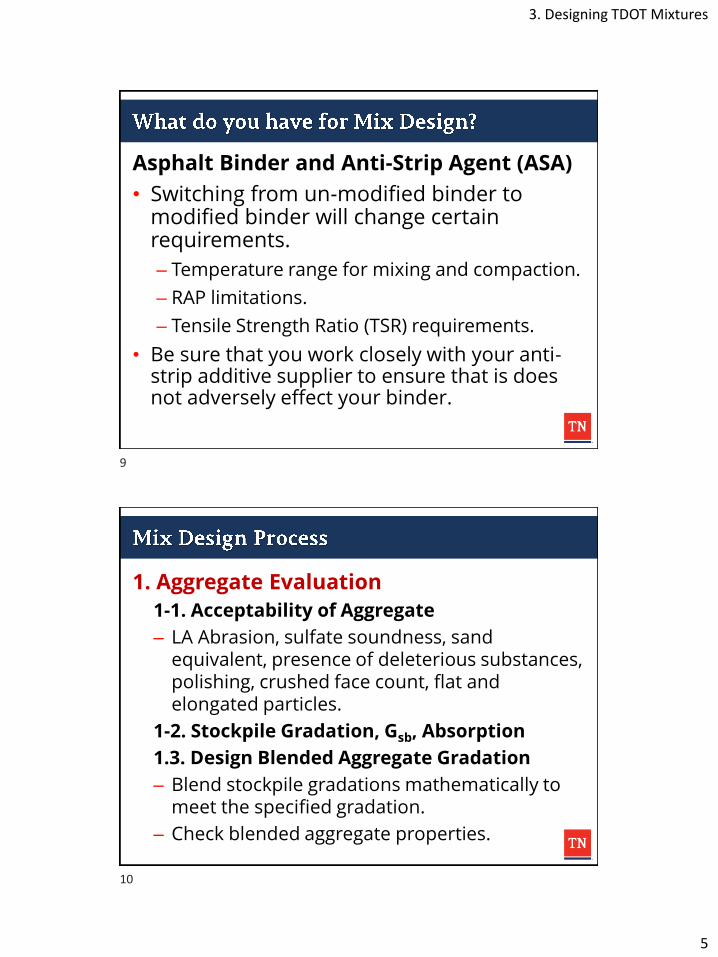
Asphalt Binder and Anti-Strip Agent (ASA)
• Switching from un-modified binder to modified binder will change certain requirements.
– Temperature range for mixing and compaction.
– RAP limitations.
– Tensile Strength Ratio (TSR) requirements.
• Be sure that you work closely with your anti-strip additive supplier to ensure that is does not adversely effect your binder.
1. Aggregate Evaluation
1-1. Acceptability of Aggregate
– LA Abrasion, sulfate soundness, sand equivalent, presence of deleterious substances, polishing, crushed face count, flat and elongated particles.
1-2. Stockpile Gradation, Gsb, Absorption
1.3. Design Blended Aggregate Gradation
– Blend stockpile gradations mathematically to meet the specified gradation.
– Check blended aggregate properties.
9
10
3. Designing TDOT Mixtures
6
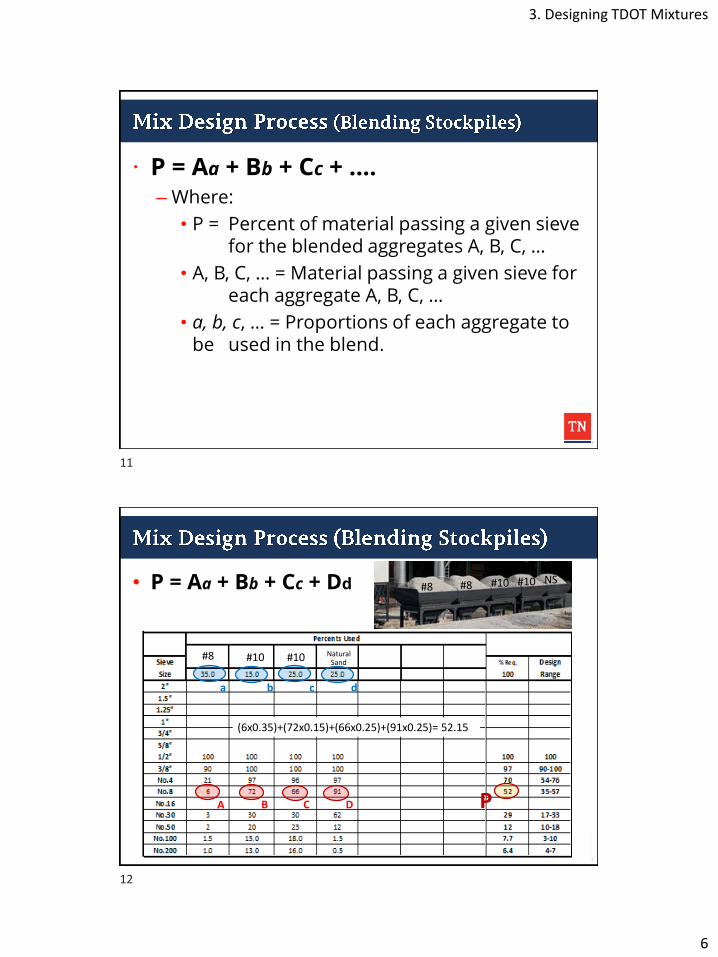
· P = Aa + Bb + Cc + ….– Where:
• P = Percent of material passing a given sieve for the blended aggregates A, B, C, …
• A, B, C, … = Material passing a given sieve for each aggregate A, B, C, …
• a, b, c, … = Proportions of each aggregate to be used in the blend.
• P = Aa + Bb + Cc + Dd
#8 #10 Natural Sand#10
A B C D P
a b c d
#8 #10#8 #10 NS
(6x0.35)+(72x0.15)+(66x0.25)+(91x0.25)= 52.15
11
12

3. Designing TDOT Mixtures
7
2. Asphalt Binder Evaluation
2-1. Determine AC grade
− PG grade based on temperature, Volume of traffic
2-2. Determine Gb and Visc-Temp. curve
2-3. Determine Mixing and Compaction Temp.
− Mixing: 170 ± 20 centistrokes
− Compaction: 280 ± 30 centistrokes
3. Marshall Specimen Fabrication3-1. Dry and Sieve Multiple Aggregate Sources
3-2. Batch Aggregate
3-3. Mixing
− Heat batched agg. and AC
− Mix aggregate and AC at predetermined temperature
− Part of mixture is used for measuring Gmm
3-4. Compaction
−Compact temperature conditioned mixture
−Compacted Specimens are used for measuring Gmb
13
14

3. Designing TDOT Mixtures
8
Mixing & Quartering
Specimen #2(AASHTO: T245)
Specimen #1 Specimen #3 Theoretical Maximum
Specific Gravity
(AASHTO T209)Bulk Specific Gravity (AASHTO T166)
% Density and % Air Void
Batching
1. Temp Conditioning 2. Pour batched agg. and mix
4. Add binder and cover it3. Tare bowl with agg.
15
16
3. Designing TDOT Mixtures
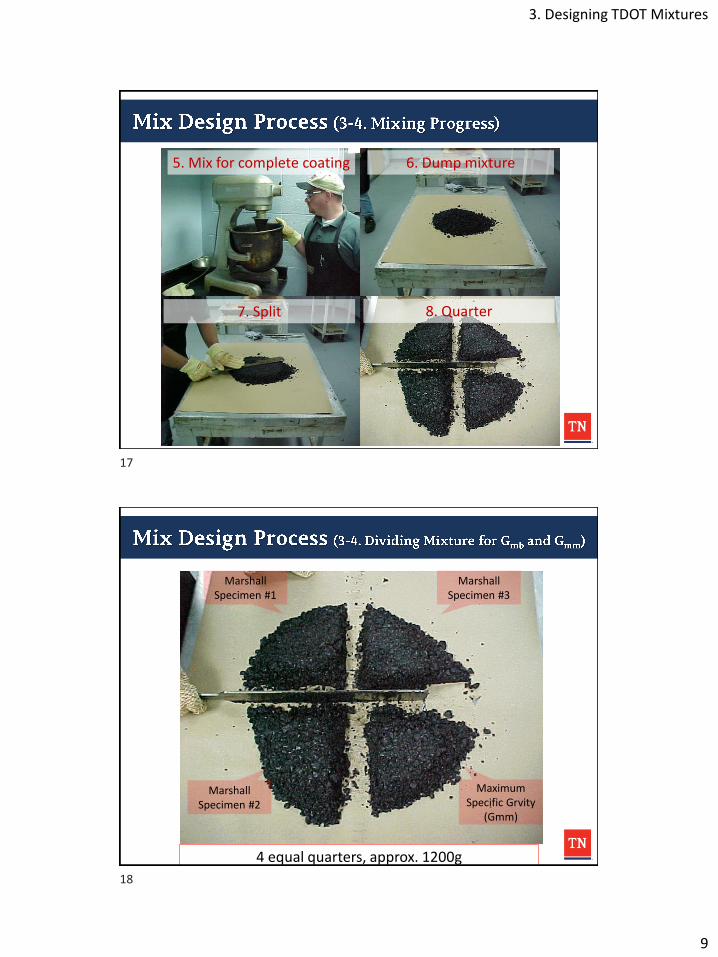
9
5. Mix for complete coating
8. Quarter7. Split
6. Dump mixture
4 equal quarters, approx. 1200g
Marshall Specimen #3
Marshall Specimen #1
Maximum Specific Grvity
(Gmm)
Marshall Specimen #2
17
18

3. Designing TDOT Mixtures
10
3 out of 4 quartered materials
• Compact the mixture at compaction temp.
– 75 blows per side: Conventional Mixes
– Ndesign: Superpave Mixes
• Extrude from the compaction molds
• Allow the samples to cool
1 out of 4 quartered materials
• Short-term conditioning the sample and perform test for Gmm.
– AASHTO T-209
Theoretical Maximum Specific Gravity (AASHTO T-209)
• Why do we do this?
– Determine the theoretical maximum specific gravity
• Who do this test?
– Mix designer / Lab technician
• What do we test?
– Asphalt mixture either from lab or plant produced
– Called loose mixture because each aggregate particle should be separated manually
19
20

3. Designing TDOT Mixtures
11
Theoretical Maximum Specific Gravity (AASHTO T-209)
• Used to calculate percent air voids/density in compacted mixture
• Influenced by the composition of the mixture in terms of type and amount of aggregate and asphalt materials
• Provide target value for the compaction of asphalt mixture
21
22

3. Designing TDOT Mixtures
12
23
24
3. Designing TDOT Mixtures
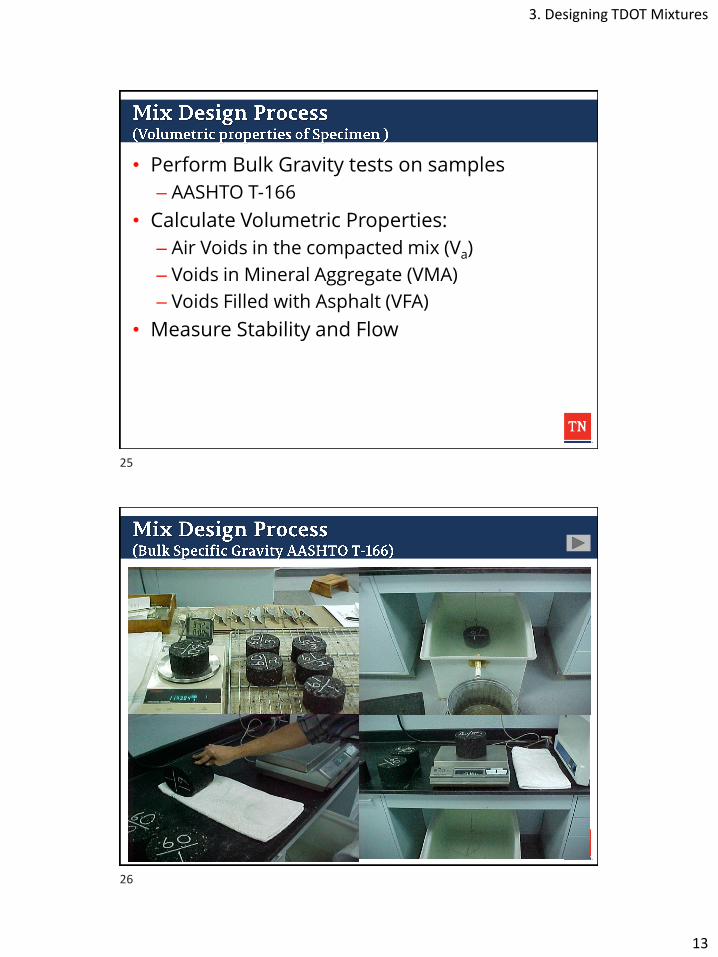
13
• Perform Bulk Gravity tests on samples
– AASHTO T-166
• Calculate Volumetric Properties:
– Air Voids in the compacted mix (Va)
– Voids in Mineral Aggregate (VMA)
– Voids Filled with Asphalt (VFA)
• Measure Stability and Flow
25
26

3. Designing TDOT Mixtures
14
4. Density and Air Void Analysis
4-1. Calculate Air Void (VTM)
𝑉𝑎 =𝐺𝑚𝑚 − 𝐺𝑚𝑏
𝐺𝑚𝑚× 100
4-2. Calculate the Density
𝐷𝑒𝑛𝑠𝑖𝑡𝑦 =𝐺𝑚𝑏
𝐺𝑚𝑚× 100
4-3. Calculate Void in Mineral Aggregates (VMA)
𝑉𝑀𝐴𝑒𝑓𝑓 = 100 −𝐺𝑚𝑏 × 𝑃𝑠𝐺𝑠𝑒
4-3. Calculate Void Filled with AC (VFA)
𝑉𝐹𝐴 = 100 ×𝑉𝑀𝐴𝑒𝑓𝑓 − 𝑉𝑎
𝑉𝑀𝐴𝑒𝑓𝑓
5. Marshal Stability and Flow
5-1. Condition specimens in water bath
− 60±1°C (140±1.8°F) water bath for 30min
− Oven for 2 hours
5-2. Remove Specimens from the water bath
5-3. Remove excess water on specimen
5-3. Apply loading on specimen and record− Vertical movement of 2-in/min.
− Stability (lbs)
− Flow (0.01 in.)
27
28

3. Designing TDOT Mixtures
15
6. Plotting Test Result to Check Trend
4-1. Calculate average value of 3 specimens
4-2. Plot the following figures
− % AC vs. % Air Void
− % AC vs. Density
− % AC vs. Marshall Flow
− % AC vs. Marshall Stability
− % AC vs. VFA
− % AC vs. VMA
29
30

3. Designing TDOT Mixtures
16
• We calculate the Gse of the aggregate blend we are using.
• As this blend is not changing we can use this Gse
for all AC% and with that information calculate the Gmm at different AC%.
• MEANING… We do not have to run a rice at each AC%.
• Now we only need to run T-166 & T-245 and calculate mixture properties at each AC%
𝐺𝑚𝑚 =100
𝑃𝑠𝐺𝑠𝑒
+𝑃𝑏𝐺𝑏
31
32

3. Designing TDOT Mixtures
17
33
34

3. Designing TDOT Mixtures
18
7. Determine Optimum Asphalt Content
7-1. Start from predetermined % Air Void
7-2. Check with TDOT Std Spec.
− % Air Void
− Marshall Flow
− Marshall Stability
− VFA
− VMA
• Follow the graph along 4% air voids.
• Once you reach the trendline look at the corresponding binder content.
• Verify the optimum and plot.
35
36

3. Designing TDOT Mixtures
19
• Once the optimum binder content is determined additional testing will be necessary to complete the design:
– ASTM D-4867: Tensile Strength Ratio
– AASHTO T-308: NCAT Oven Correction
– Loss on Ignition (surface only)
– Sensitive Mix Criteria
• Not all TDOT mixes require a design, just paperwork.
• Mixes that require a design are listed in TDOT Standard Operating Procedure 3-4, “Submittal and Approval of HMA Designs.”
37
38

3. Designing TDOT Mixtures
20
• Mixes Requiring Design:
− BM, BM2, C, CS, CW, D, TL, TLD, TLE, OGFC, E (Roadway), E (Shoulder)
• Everything else – Paperwork only
• “Unless otherwise directed by the regional materials supervisor.”
• Excel Mix Design File
• Check Design Sheet Information
• Summary Report
• Signature, Cert Number
39
40

3. Designing TDOT Mixtures
21
Questions?
41

4
Aggregates
4. Testing Aggregates, Part 1
1
Division of Materials and Tests
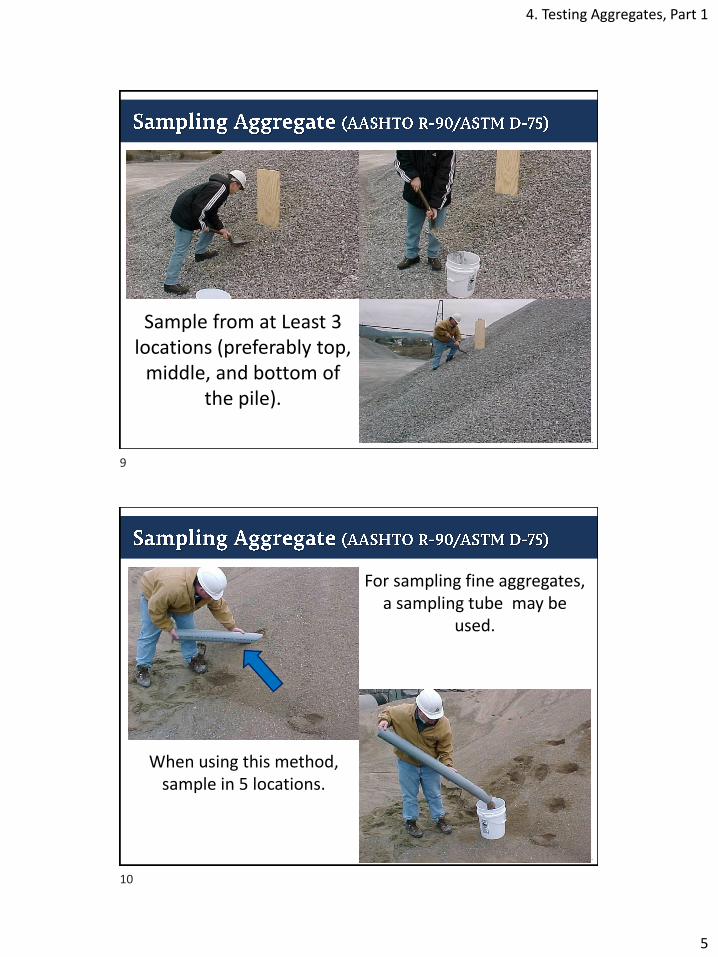
• Determine NMAS from JMF.
• See TABLE 1 in specification.
– Determine sample size.
1
2

4. Testing Aggregates, Part 1
2
AASHTO recommends obtaining belt samples of
aggregates whenever possible.
A belt-shaped template must be used.
Use a scoop to remove the aggregate from the
portioned section.
Make sure to sweep the fine aggregate off
the belt entirely.
3
4

4. Testing Aggregates, Part 1
3
• Most raw materials must be sampled from a stockpile.
Use power equipment whenever available.
Ensure that the material is re-blended before the loader takes a sample.
5
6

4. Testing Aggregates, Part 1
4
Create a small pile adjacent to the original stockpile.
Strike off the top of the pile to create a flat
surface.
Approach the pile as 4 separate quadrants. Take
1 equal sample from each quadrant.
7
8
4. Testing Aggregates, Part 1
5
Sample from at Least 3 locations (preferably top,
middle, and bottom of the pile).
For sampling fine aggregates, a sampling tube may be
used.
When using this method, sample in 5 locations.
9
10

4. Testing Aggregates, Part 1
6
• Tests to be run:–Stockpile Moisture Contents
• TDOT Method
–T-27 / T-11 Washed Sieve Analysis on ALL aggregates
–TDOT Glassy Particle Test • If slag is used as a coarse aggregate.
–TDOT Fractured Face Count • If gravel is used as a coarse aggregate.
• Method A: Mechanical Splitter
Openings may either be fixed or
adjustable.
Their widths are dependent upon aggregate size.
11
12
4. Testing Aggregates, Part 1
7
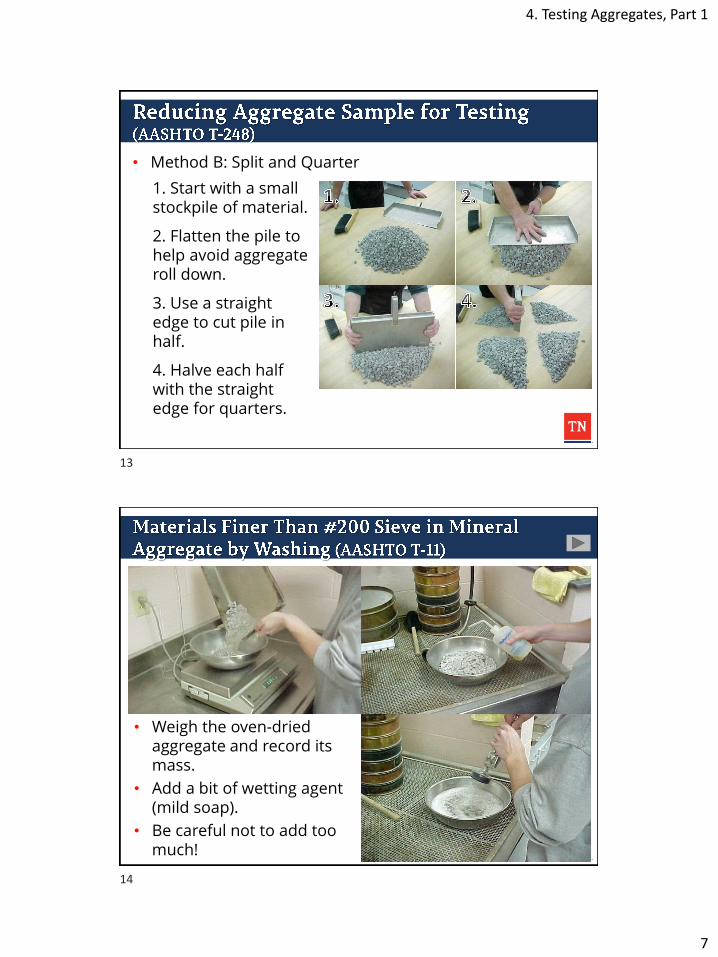
• Method B: Split and Quarter
1. Start with a small stockpile of material.
2. Flatten the pile to help avoid aggregate roll down.
3. Use a straight edge to cut pile in half.
4. Halve each half with the straight edge for quarters.
• Weigh the oven-dried aggregate and record its mass.
• Add a bit of wetting agent (mild soap).
• Be careful not to add too much!
13
14
4. Testing Aggregates, Part 1
8
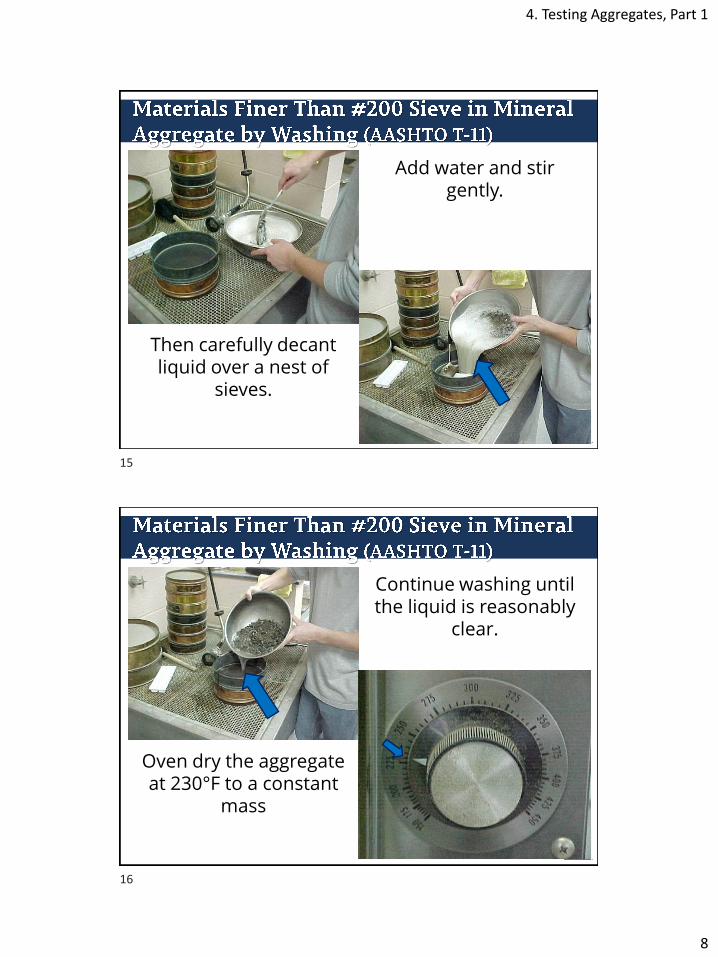
Add water and stir gently.
Then carefully decant liquid over a nest of
sieves.
Continue washing until the liquid is reasonably
clear.
Oven dry the aggregate at 230°F to a constant
mass
15
16

4. Testing Aggregates, Part 1
9
After recording the mass of the oven-dried, washed aggregate, the material must be shaken though a stack of sieves.
Once the material has been shaken for a
sufficient period of time, each sieve must be
cleaned out.
The mass of its contents recorded cumulatively.
17
18

4. Testing Aggregates, Part 1
10
AASHTO T-11
Original Dry Sample Weight (A) 1545.5 grams
Weight Of Sample After Wash, Dried (B) 1474.2 grams
Wash Loss (A-B) 71.3 grams
AASHTO T-27
US Standard Sieve Sizes
Cumulative Wt. Retained (grams)
Percent Retained (%)
Percent Passing (%)
JMF Design
5/8" 30.3 2.0 98.0 100
1/2" 76.5 4.9 95.1 97
3/8" 287.8 18.6 81.4 85
No.4 615.4 39.8 60.2 58
No.8 858.4 55.5 44.5 46
No.30 1148.5 74.3 25.7 25
No.50 1330.9 86.1 13.9 15
No.100 1420.4 91.9 8.1 10
No.200 1458.1 94.3 5.7 5.3
PAN 1474.2 *** *** ***
Questions?
19
20

4. Testing Aggregates, Part 1 (Example)
1
Division of Materials and Tests
Material Passing #200 Sieve
T-11
ORIGINAL DRY SAMPLE WEIGHT (A) 1500.0 grams
WEIGHT OF SAMPLE AFTER WASH (B) 1331.6 grams
WASH LOSS (A-B) grams
T-27
PAN WEIGHT (C) 1331.6 grams
Add'l -#200 Material (C-weight retained #200) grams
Total Material Passing #200 Sieve grams
SIEVE ANALYSIS (WASHED)
AASHTO T-11 & AASHTO T-27
Contract No. Z-000 Contractor Watts Paving INC.
Project Reference No. STP-99-3(22) Mix Type # 10 (Hard) screenings
168.4
1
2

4. Testing Aggregates, Part 1 (Example)
2
T-27 RESULTS
U.S. ACCUMULATIVE JMF
STANDARDS WEIGHT PERCENT PERCENT OR
SIEVES RETAINED RETAINED PASSING SPECIFICATION
2"
1 1/2"
1 1/4"
1"
3/4"
5/8"
1/2"
3/8"
NO. 4 99.9
NO. 8 450.9
NO. 16
NO. 30 1040.2
NO. 50 1188.2
NO. 100 1231.2
NO. 200 1290.0
Minus #200
TOTAL
69.3
79.2
82.1
86.0
30.1
6.7
1000.1500
9.99
=PR
1000.1500
9.450
=PR
1331.6 6.410.12906.1331 =−=Pan
Material Passing #200 Sieve
T-11
ORIGINAL DRY SAMPLE WEIGHT (A) 1500.0 grams
WEIGHT OF SAMPLE AFTER WASH (B) 1331.6 grams
WASH LOSS (A-B) grams
T-27
PAN WEIGHT (C) 1331.6 grams
Add'l -#200 Material (C-weight retained #200) grams
Total Material Passing #200 Sieve grams
SIEVE ANALYSIS (WASHED)
AASHTO T-11 & AASHTO T-27
Contract No. Z-000 Contractor Watts Paving INC.
Project Reference No. STP-99-3(22) Mix Type # 10 (Hard) screenings
168.4
41.6
210.0
3
4

4. Testing Aggregates, Part 1 (Example)
3
T-27 RESULTS
U.S. ACCUMULATIVE JMF
STANDARDS WEIGHT PERCENT PERCENT OR
SIEVES RETAINED RETAINED PASSING SPECIFICATION
2"
1 1/2"
1 1/4"
1"
3/4"
5/8"
1/2"
3/8"
NO. 4 99.9
NO. 8 450.9
NO. 16
NO. 30 1040.2
NO. 50 1188.2
NO. 100 1231.2
NO. 200 1290.0
Minus #200 210.0
TOTAL 1500.0
7.6100−=PP
69.3
79.2
82.1
86.0
30.1
6.7100
93.3
69.9
30.7
20.8
17.9
14.0
1331.6
5
6
4. Testing Aggregates, Part 1 (Example)
4
Questions?
7
5. Batching Aggregates
1
Division of Materials and Tests
Reasons for Blending
–Obtain desirable gradation
– Single natural or quarried material not enough
– Economical to combine natural and processed materials
• Numerical Method
–Trial and Error
–Basic Formula
1
2

5. Batching Aggregates
2
· P = Aa + Bb + Cc + ….– Where:
• P = Percent of material passing a given sieve for the blended aggregates A, B, C, …
• A, B, C, … = Material passing a given sieve for each aggregate A, B, C, …
• a, b, c, … = Proportions of each aggregate to be used in the blend.
+ + =
𝐺𝐴, 𝐺𝐵 , & 𝐺𝐶 = 𝐵𝑢𝑙𝑘 𝑠𝑝𝑒𝑐𝑖𝑓𝑖𝑐 𝑔𝑟𝑎𝑣𝑖𝑡𝑦 𝑜𝑓 𝑒𝑎𝑐ℎ 𝑎𝑔𝑔𝑟𝑒𝑔𝑎𝑡𝑒 𝑖𝑛 𝑏𝑙𝑒𝑛𝑑
𝑮𝒔𝒃 =𝑷𝑨 + 𝑷𝑩 + 𝑷𝑪
𝑷𝑨𝑮𝑨
+𝑷𝑩𝑮𝑩
+𝑷𝑪𝑮𝑪
𝑃𝐴, 𝑃𝐵 , & 𝑃𝐶 = 𝑃𝑒𝑟𝑐𝑒𝑛𝑡 𝑏𝑦 𝑚𝑎𝑠𝑠 𝑜𝑓 𝑒𝑎𝑐ℎ 𝑎𝑔𝑔𝑟𝑒𝑔𝑎𝑡𝑒 𝑖𝑛 𝑏𝑙𝑒𝑛𝑑Where:
3
4

5. Batching Aggregates
3
𝐺𝐴, 𝐺𝐵 , & 𝐺𝐶 = 𝐵𝑢𝑙𝑘 𝑠𝑝𝑒𝑐𝑖𝑓𝑖𝑐 𝑔𝑟𝑎𝑣𝑖𝑡𝑦 𝑜𝑓 𝑒𝑎𝑐ℎ 𝑎𝑔𝑔𝑟𝑒𝑔𝑎𝑡𝑒 𝑖𝑛 𝑏𝑙𝑒𝑛𝑑
𝑮𝒔𝒃 =𝑷𝑨 + 𝑷𝑩 + 𝑷𝑪
𝑷𝑨𝑮𝑨
+𝑷𝑩𝑮𝑩
+𝑷𝑪𝑮𝑪
𝑃𝐴, 𝑃𝐵 , & 𝑃𝐶 = 𝑃𝑒𝑟𝑐𝑒𝑛𝑡 𝑏𝑦 𝑚𝑎𝑠𝑠 𝑜𝑓 𝑒𝑎𝑐ℎ 𝑎𝑔𝑔𝑟𝑒𝑔𝑎𝑡𝑒 𝑖𝑛 𝑏𝑙𝑒𝑛𝑑Where:
Based on the information given:
GA = 2.695GB = 2.711GC = 2.721
PA = 50%PB = 25%PC = 25%
𝑮𝒔𝒃 =𝟓𝟎 + 𝟐𝟓 + 𝟐𝟓
𝟓𝟎𝟐. 𝟔𝟗𝟓
+𝟐𝟓
𝟐. 𝟕𝟏𝟏+
𝟐𝟓𝟐. 𝟕𝟐𝟏
= 𝟐. 𝟕𝟎𝟓
𝐺𝐴, 𝐺𝐵 , & 𝐺𝐶 = 𝐵𝑢𝑙𝑘 𝑠𝑝𝑒𝑐𝑖𝑓𝑖𝑐 𝑔𝑟𝑎𝑣𝑖𝑡𝑦 𝑜𝑓 𝑒𝑎𝑐ℎ 𝑎𝑔𝑔𝑟𝑒𝑔𝑎𝑡𝑒 𝑖𝑛 𝑏𝑙𝑒𝑛𝑑
𝑮𝒔𝒃 =𝑷𝑨 + 𝑷𝑩 + 𝑷𝑪
𝑷𝑨𝑮𝑨
+𝑷𝑩𝑮𝑩
+𝑷𝑪𝑮𝑪
𝑃𝐴, 𝑃𝐵 , & 𝑃𝐶 = 𝑃𝑒𝑟𝑐𝑒𝑛𝑡 𝑏𝑦 𝑚𝑎𝑠𝑠 𝑜𝑓 𝑒𝑎𝑐ℎ 𝑎𝑔𝑔𝑟𝑒𝑔𝑎𝑡𝑒 𝑖𝑛 𝑏𝑙𝑒𝑛𝑑Where:
Based on the information given:
GA = 2.695GB = 2.809GC = 2.375
PA = 40%PB = 30%PC = 30%
𝑮𝒔𝒃 =𝟒𝟎 + 𝟑𝟎 + 𝟑𝟎
𝟒𝟎𝟐. 𝟔𝟗𝟓
+𝟑𝟎
𝟐. 𝟖𝟎𝟗+
𝟑𝟎𝟐. 𝟑𝟕𝟓
= 𝟐. 𝟔𝟐𝟏
5
6

5. Batching Aggregates
4
Once aggregate proportions have been determined through the sieve analysis, the shaken rock can be recombined into the designed mixture.
Best practice for this method is to add each aggregate and size into individual piles in the event excess must be removed.
Why Batch?
–We Want To Reproduce the Desired Gradation for Mix Design
–We cannot fire the plant up to make 10 lbs.
7
8

5. Batching Aggregates
5
• Things We Must Know To Batch
– Percent of Each Stockpile in Blend.
– Percent Retained For Each Sieve of Each Stockpile in the Blend.
• Confidence in gradations is paramount
– Run at least three per aggregate type.
• Average the sieve totals from each run.
– Include quality control numbers from the manufacturer if possible.
9
10

5. Batching Aggregates
6
Retained per Sieve
(Decimal)
Mass for Batch per Sieve
Percent of Stockpile=
Batch Wt.
xx
Example: How much #4 material do I need from a stockpile no. 1 aggregate for a 4,000 gram total batch?
Given: Percent Retained on #4 sieve = 23.0 %Percent no. 1 Agg. used in Blend = 30.0 %Total Batch wt. = 4000 grams
= 0.23 x 0.30 x 4000
= 276.0 grams
Mass of #4 material
How to calculate the amount of aggregate at a certain sieve in blended batch?
11
12
5. Batching Aggregates
7
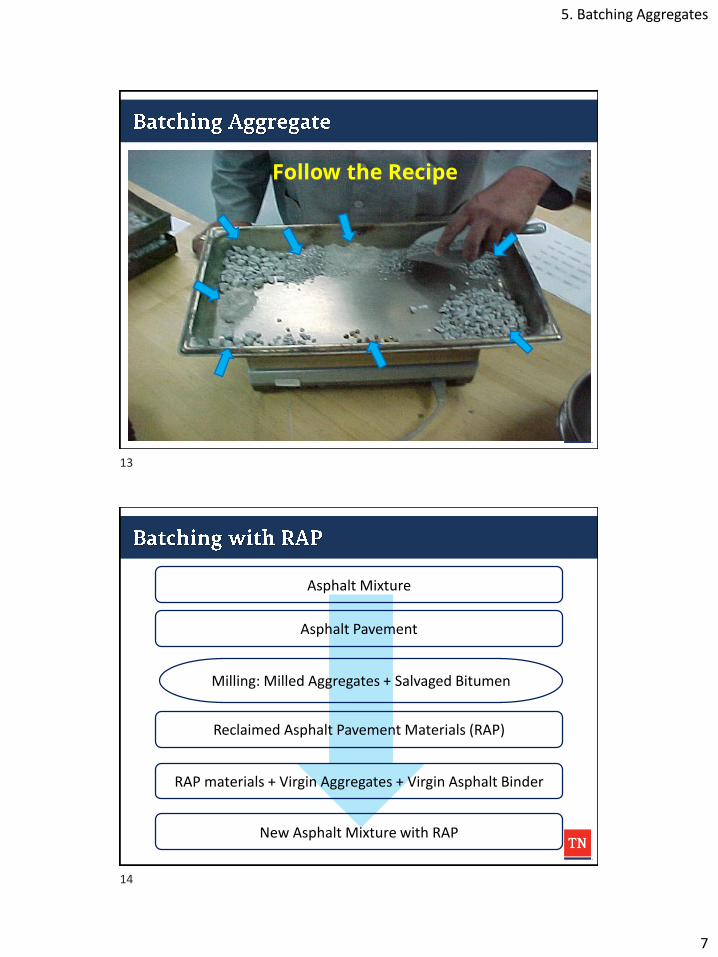
Follow the Recipe
Asphalt Mixture
Asphalt Pavement
Reclaimed Asphalt Pavement Materials (RAP)
RAP materials + Virgin Aggregates + Virgin Asphalt Binder
New Asphalt Mixture with RAP
Milling: Milled Aggregates + Salvaged Bitumen
13
14

5. Batching Aggregates
8
• Combination of Aged Asphalt and Aggregate.
• Aged binder content on RAP will be transferred to total/final binder content.
• Aggregate (aggregate gradation) of RAP will be transferred to total/final aggregate (aggregate gradation).
Preparing to use RAP• Shown to be consistent
– At least 5 samples
– Consistent binder content
– Consistent Gradation
• Known location
15
16

5. Batching Aggregates
9
Abbreviations you need to know
• MRAP= Mass of RAP Material
• PRAP= Decimal Percentage of RAP in Mix
• Mtot= Total Mass of Aggregates in Mix
• Pb RAP= Percent AC in RAP
• MAC Pb= Mass of Virgin AC
RAP Blending Calculation
How to calculated required mass of RAP material in a final mixture with a certain % of RAP?
𝑴𝑹𝑨𝑷 =𝑷𝑹𝑨𝑷 ×𝑴𝒕𝒐𝒕
𝟏𝟎𝟎 − 𝑷𝒃𝑹𝑨𝑷
17
18

5. Batching Aggregates
10
Adding Liquid Asphalt to HMA Mixtures for Known Binder Content
How to calculated required mass of Virgin Asphalt Binder in a final mixture with a certain % of RAP?
𝑴𝑨𝑪 𝑷𝒃 =𝑴𝒕𝒐𝒕
𝟏𝟎𝟎 − 𝑷𝒃𝟏𝟎𝟎
−𝑴𝑹𝑨𝑷 × 𝑷𝒃 𝑹𝑨𝑷
𝟏𝟎𝟎−𝑴𝒕𝒐𝒕
Total Blend Weight after AC added (asphalt and aggregate)
Subtract RAP’s AC Contribution
Agg. Wt.
AC Blending Example 1.• Mtot = 4,400 grams
• Pb = 4.5%
• PRAP = 10%
• Pb RAP = 6.0%
Calculate Mass of Virgin Binder (MAC Pb)
19
20

5. Batching Aggregates
11
AC Blending Example 1.• Mtot = 4,400 grams
• Pb = 4.5%
• PRAP = 10%
• Pb RAP= 6.0%
𝑴𝑹𝑨𝑷 =𝑷𝑹𝑨𝑷 ×𝑴𝒕𝒐𝒕
𝟏𝟎𝟎 − 𝑷𝒃𝑹𝑨𝑷=𝟏𝟎 × 𝟒, 𝟒𝟎𝟎
(𝟏𝟎𝟎 − 𝟔)
=𝟒𝟒, 𝟎𝟎𝟎
𝟗𝟒= 𝟒𝟔𝟖. 𝟏
AC Blending Example 1.• Mtot = 4,400 grams
• Pb = 4.5%
• PRAP = 10%
• Pb RAP= 6.0%
• MRAP = 468.1
𝑴𝑨𝑪 𝑷𝒃 =𝑴𝒕𝒐𝒕
𝟏𝟎𝟎 − 𝑷𝒃𝟏𝟎𝟎
−𝑴𝑹𝑨𝑷 × 𝑷𝒃 𝑹𝑨𝑷
𝟏𝟎𝟎−𝑴𝒕𝒐𝒕
=𝟒𝟒𝟎𝟎
𝟏𝟎𝟎 − 𝟒. 𝟓𝟏𝟎𝟎
−𝟒𝟔𝟖. 𝟏 × 𝟔
𝟏𝟎𝟎− 𝟒, 𝟒𝟎𝟎
= 𝟒𝟔𝟎𝟕. 𝟑 − 𝟐𝟖. 𝟏 − 𝟒, 𝟒𝟎𝟎 = 𝟏𝟕𝟗. 𝟐 (𝒈)
21
22

5. Batching Aggregates
12
Aggregate Blending Example
Material # 67 78 - M W. Scrg RAP Blend
Percent 10% 45% 35% 10% 100%
1 inch 100 100 100 100 100.0
3/4 inch 97 100 100 100 99.7
1/2 inch 48 100 100 100 94.8
3/8 inch 22 80 100 100 83.2
No. 4 6 21 94 88 51.8
No. 8 4 5 70 67 33.9
Minus 8
Batch Weight = 4400 grams RAP AC = 6%
Questions?
23
24

5. Batching Aggregates (Example)
1
Division of Materials and Tests
2 3 4 5 6
D Rock(Limestone) 0 #10 (Soft) Natural Sand RAP
Medium Coarse Aggregate 0 Screenings Natural Sand Minus 1/2 inch RapRGI,
Lawrenceburg
Plant
RGI,
Lawrenceburg
Plant
Gibbs
Construction,
Crump, TN
RGI,
Lawrenceburg
Plant
100.0 100.0 100.0
100.0 100.0 100.0
100.0 100.0 100.0
100.0 100.0 100.0
100.0 100.0 100.0
100.0 100.0 100.0
95.0 100.0 100.0
72.0 100.0 94.0
16.0 97.0 74.0
6.0 82.0 52.0
3.0 67.0 30.0
2.0 14.0 24.0
1.5 3.0 17.0
1.0 1.0 12.0
5.7
D Rock(Limestone)
Medium Coarse Aggregate
RAPNatural Sand#10 (Soft)
Screenings Natural Sand Minus 1/2 inch Rap
21.0
18.0
14.0
70.0
31.0
100.0
100.0
100.0
1
100.0
100.0100.0
100.0100.0
93.0
1
2

5. Batching Aggregates (Example)
2
Sieve % Req. Design
Size Range
2"
1.5"
1.25"
1"
3/4"
5/8"
1/2"
3/8"
No.4
No.8
No.16
No.30
No.50
No.100
No.200
Percents Used
D Rock #10 Natural RAP
Limestone (Soft) Sand
50% 10% 25% 15%
100
98
100.0
85
53
A
B C
++ + = C
100
95-100
80-93
54-76
35-57
17-29
10-18
3-10
0-6.5
100.0
95.0
72.0
16.0
6.0
3.0
2.0
1.5
1.0
100.0 100.0 100.0
100.0 100.0 100.0
100.0 100.0 94.0
93.0 97.0 74.0
70.0 82.0 52.0
31.0 67.0 30.0
21.0 14.0 24.0
18.0 3.0 17.0
14.0 1.0 12.0
38
26
10
5.9
4.0
903.06 (Base and Binder Mixtures)
903.11 (Surface Mixtures)
100
BA
100
BA
100
BA
100
BA
Worksheet for Determining the Aggregate Quantities and their
Corresponding sized fractions for an Aggregate Blend
Mix Type
Wt. Total Aggregate Blend 1500 grams Blend Name
Contract No.
Aggregate % Used Wt. (gms)
1) D Rock(Limestone) 50
2) #10 (Soft) 10
3) Natural Sand 25
4)
5)
6)
7) RAP 15
Sized % Ind. % Ind wt. Accum.
Fractions Passing Retained Retained wt.
1.5"/1.25"
1"
3/4"
1) 1/2"
3/8"
#4
#8
-#8
1.5"/1.25"
1"
3/4"
1/2"
2) 3/8"
#4
#8
-#8
411-D w/ RAP PG 64-22
Z-000
−
=
100
100 PbRAP
APRAPMRap
=
100
3.94
225MRap
−
=
100
7.5100
150015.0MRap
94.
225=MRap
A
B C
150
375
239
100.0
100.0
95.0
72.0
16.0
6.0
100.0
93.0
70.0
7.0
23.0
70.0
23
56
10
6
10.5
34.5
105.0
DC 172.5
420.0
75.0
45.0
760.5
795.0
900.0
750
5 37.5 37.5210.0
630.0
705.0
750.0
100
150050
100
BA
750
150
D
3
4

5. Batching Aggregates (Example)
3
Sized % Ind. % Ind wt. Accum.
Fractions Passing Retained Retained wt.
1/2"
3/8"
7) #4
#8
-#8
Asphalt Liquid Calculation
Desired AC Content Binder Weight
4.00
4.50
5.00
5.50
6.00
TotbRAP MPM RAP −−=
100*
100P-100
MMb
TotACPb
239
100.0
94.0
74.0
52.0
6.0
20.0
22.0
52.0
14.3
47.7
52.5
124.1
1289.3
1337.0
1389.5
1513.6
1500100
7.5239
100
0.4100
1500−
−
−=ACPbM
1500100
3.1362
100
0.96
1500−−=ACPbM
15006.135.1562 −−=ACPbM
48.9
57.1
65.3
73.7
82.15.90 80.4
( )( )bRap
TotRap
P
MP
−
100 ( )( )7.5100
150015
−
( )3.94
500,226.238
3.94
500,22=
TotbRapRap
b
TotM
PM
P
M−
−
− 100
100
1001500
100
7.56.238
100
9.5100
1500−
−
−
1500100
0.1360
100
1.94
1500−−
150060.13941.0
1500−−
5.80150060.131.1594 =−−
MTot 1500 g
PRap 15%
PbRap 5.7%
Pb 5.9%
5
6

5. Batching Aggregates (Example)
4
Questions?
7
6. Testing Aggregates, Part 2
1
Division of Materials and Tests
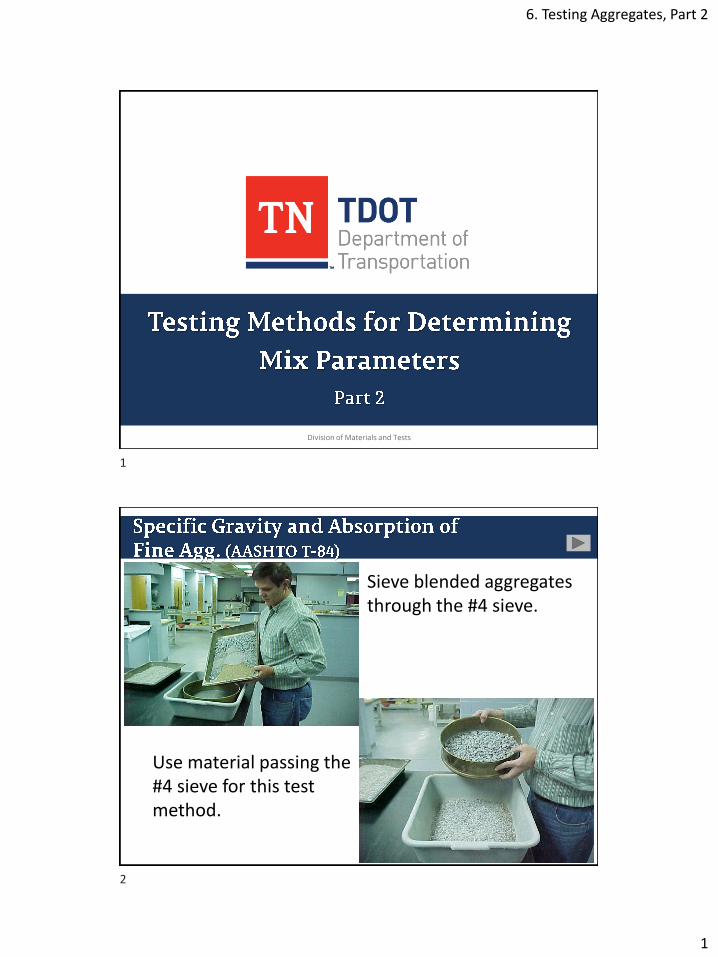
Sieve blended aggregates through the #4 sieve.
Use material passing the #4 sieve for this test method.
1
2

6. Testing Aggregates, Part 2
2
Place the material passing the #4 sieve in a pan.
Cover material completely with water.
Allow the fine aggregate to soak for 15 to 19 hours.
Decant the water after soaking.
3
4

6. Testing Aggregates, Part 2
3
• Partially dry under gently moving warm air while stirring frequently.
• Do not oven dry.
• Cone test of 25 tamps from 5mm/0.2” drop.
• Continue until saturated surface dry (SSD).
• Initial cone test should stand.
• Over dried material will fall apart.
• For SSD, only a small section will fall off.
wet material dry material
SSD condition
5
6

6. Testing Aggregates, Part 2
4
Fill water to calibration line and remove air bubbles.
• Fill pycnometer with 500 +/-10 grams of SSD aggregate.
• Fill pycnometer to 90% with deionized water.
• Agitate to remove entrapped air from aggregate.
Alcohol may be used to assist in removal of foam.
Record the final mass of the pycnometer, aggregate, and water.
7
8

6. Testing Aggregates, Part 2
5
Remove aggregate from flask, dry to a constant mass, and record the dry mass.
Sieve blended aggregates through the #4 sieve.
Use material retained on the #4 sieve for this test method.
9
10

6. Testing Aggregates, Part 2
6
Wash the material retained on the #4 sieve and place it in a pan.
Cover material completely with water and let it soak for 15 to 19 hours.
Decant the water after soaking.
Empty aggregate onto a clean, dry towel.
11
12

6. Testing Aggregates, Part 2
7
Towel dry aggregate to remove the wet sheen from the outer surface (SSD condition).
Record the mass of the SSD material.
Place all of the material into the basket and place the basket into the water bath.
Shake the submerged basket a few times, let the basket hang awhile, and record the mass.
13
14

6. Testing Aggregates, Part 2
8
Remove aggregate from basket and place into a pan. Be sure to remove all aggregate.
Oven dry to a constant mass.
• Performed IAW TDOT Spec. 407.03.E
• Performed on 411 D, 411 S, 411 SGC, 411 SMA
• Results Compared to Value Listed on JMF
• L.O.I. IS A PAY FACTOR
15
16

6. Testing Aggregates, Part 2
9
LOI of Mineral Aggregate in an Asphalt Paving Mixture
• Obtain a representative aggregate sample and weigh approximately 600 grams
• Pour the aggregate into an assayer's fire clay crucible, and the crucible must have a cover to prevent pop-out of aggregate while heating.
• The covered crucible and its contents is then ignited in a muffle furnace at 1742 F (950 C) to constant weight (min. 8 hours).
• If the aggregate sample has been obtained by extraction with a vacuum extractor, the weights before and after ignition must be corrected for filter aid.
Record the mass of each container while empty, then fill them with the aggregate.
Record the mass of all of the containers filled
with the aggregate.
17
18

6. Testing Aggregates, Part 2
10
Place lids on all of the containers and insert
them into the furnace.
Place a piece of ceramic media on top
of the lids to hold them in place.
Minimum burn time is 8 hours.
Record the mass of all of the containers filled
with the ignited aggregates.
19
20
6. Testing Aggregates, Part 2
11
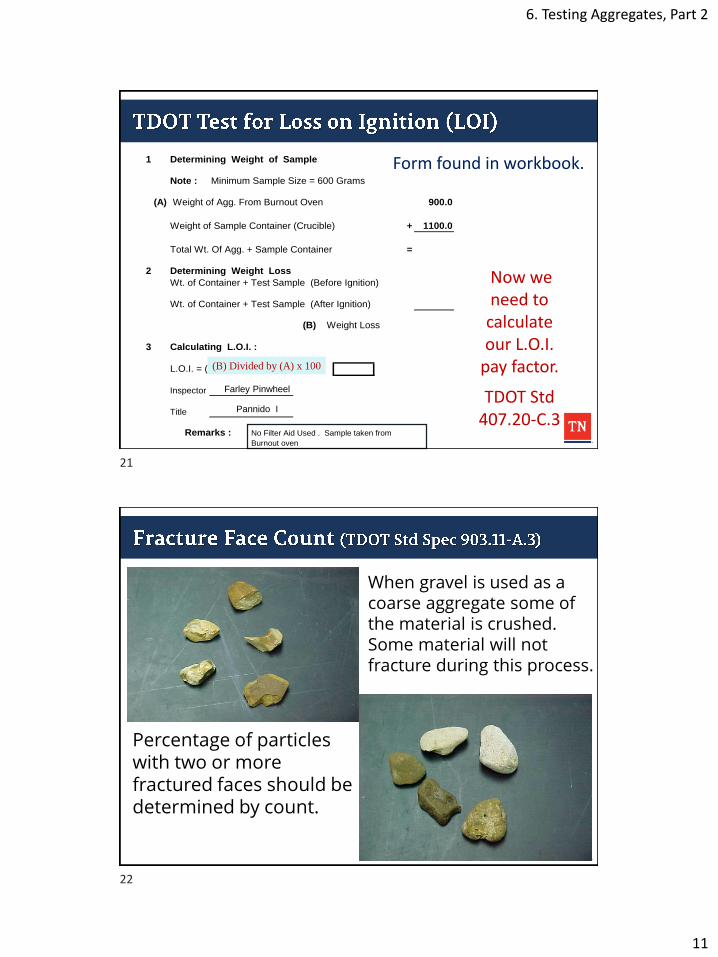
Type Mix 411-D w/PG 64-22
Project No. 0
Date
1 Determining Weight of Sample
Note : Minimum Sample Size = 600 Grams
(A) Weight of Agg. From Burnout Oven 900.0
Weight of Sample Container (Crucible) + 1100.0
Total Wt. Of Agg. + Sample Container = 2000.0
2 Determining Weight Loss
Wt. of Container + Test Sample (Before Ignition) 2000.0
Wt. of Container + Test Sample (After Ignition) 1900.0
(B) Weight Loss 100.0
3 Calculating L.O.I. :
L.O.I. = (A) Divided by (B) X 100 11.1
Inspector
Title
No Filter Aid Used . Sample taken from
Burnout oven
Contract No.
Remarks :
0
12/30/2004
Farley Pinwheel
Pannido I
(B) Divided by (A) x 100
Form found in workbook.
Now we need to
calculate our L.O.I.
pay factor.
TDOT Std407.20-C.3
When gravel is used as a coarse aggregate some of the material is crushed. Some material will not fracture during this process.
Percentage of particles with two or more fractured faces should be determined by count.
21
22

6. Testing Aggregates, Part 2
12
Fractured
Non - Fractured ?
Fractured Face Count
Subsection 903.11(a)(3)
Yes
No
No. of Particles Fractured 305
Total No. of Particles Inspected 391
% Fractured = 78.0 %
Is Crushed Gravel used as a coarse aggregate in this mix?
At least 70% by count, of the material retained on the 4.75 mm (No. 4)
sieve shall have a minimum of two fractured faces, one of which must be
fractured for the approximate average diameter or thickness of the
particle. A representative sample containing at least 200 grams should be
used.
% Fractured = No. of Particles Fractured
Total No. of Particles Inspected
23
24

6. Testing Aggregates, Part 2
13
When slag is used as a coarse aggregate a check for glassy particles must be performed.
A sample of material retained on the #4 sieve cannot exceed 20% glassy particles by mass.
Glassy Particles (Slag)
Subsection 903.11(a)(4)
Does mix contain slag used as coarse aggregate?Yes
No
Mass of Glassy Particles 32.0 g
Total Mass of Sample Used 350.0 g
% Glassy Particles = 9.1 %
Crushed slag coarse aggregate shall contain no more than 20%, by weight,
of glassy particles; except that where used in Grading G mix, the percent of
glassy particles, by weight, shall not exceed 10%.
A representative sample containing at least 300 grams of the (+4) slag
should be used.*
* DOT Policy
% Glassy Particles = Mass of Glassy Particles
of Sample Used 100%
Total Massx
25
26

6. Testing Aggregates, Part 2
14
903.11.A-2
“Material retained on the #4 sieve shall contain a maximum of 20% elongated pieces (length greater than five times the average thickness).”
Questions?
27
28

6. Testing Aggregate, Part 2 (Example)
1
Division of Materials and Tests
Specific Gravity and Absorption of Aggregates Specific Gravity and Absorption of Aggregates
AASHTO T-84 AND T-85
Blended Aggregates Stockpile Method
From the Job Mix Formula: % Passing #4 Sieve
% Retained on #4 Sieve
Fine Aggregate: (-4 Matl.) AASHTO T-84
A--Mass of Oven Dried Sample grams
B--Mass of Flask and Water grams
C--Mass of Flask and Water and Sample grams
D--Mass of Saturated Surface Dried Sample grams
Bulk Specific Gravity = A
B + D - C =
Apparent Specific Gravity = A
B + A - C =
41.6
58.4
500.0
1000.0
1300.0
504.0
0.204
0.500==
−+ 0.13000.5040.1000
0.500
2.500
2.451
=−+
=0.13000.5000.1000
0.500
0.200
0.500
1
2

6. Testing Aggregate, Part 2 (Example)
2
Coarse Aggregate: (+4 Matl.) AASHTO T-85
A--Mass of Oven Dried Sample grams
B--Mass of Saturated Surface Dried Sample grams
C--Mass of Sample in Water grams
= %
Combined Bulk Specific Gravity (Gsb)
Combined Apparent Specific Gravity (Gsa)
Combined Blend Absorption
(100/Gsb) - (100/Gsa)Combined Absorption
Combined Specific Gravity
Bulk Sp. Gr. =A
B - C =
Apparent Sp. Gr. = A
A - C =
% Absorption = B - A
A 100% =´
100
% F. A.
Sp. Gr. F.A.
C A
Gr. C.A.
=
+% . .
.Sp
1500.0
1515.0
995.0
=− 0.9950.1515
0.1500==
0.520
0.1500
2.970
2.885
0.520
0.1500=
−=
9951500
1500
=´−
= %1000.1500
0.15000.1515%100
0.1500
0.15´
1.0
885.2
6.41
451.2
4.58
100
+ 419.14827.23
100
+246.38
100
2.614
2.676
.9
( ) ( )676.2/100614.2/100 −
Loss on Ignition (L. O. I.)
T. D. O. T. Procedures
(1) (2) (3) (4)
Mass Crucible & Test Sample g
(before ignition)
Mass Crucible (-) g
Mass Test Sample g
Mass Crucible & Test Sample g
(before ignition)
Mass Crucible & Test Sample g
(after ignition)
Mass Loss g g g g
Combined Masses from above:
Mass of Test Samples g
Mass of Losses g
% L. O. I.
% Loss on Ignition (L. O. I. ) = Mass of Losses
Mass of Test Samples
1908.1
1480.8
323.1
1480.8
323.1
X 100
21.8
427.3
1585.0
1908.1
3
4
6. Testing Aggregate, Part 2 (Example)
3
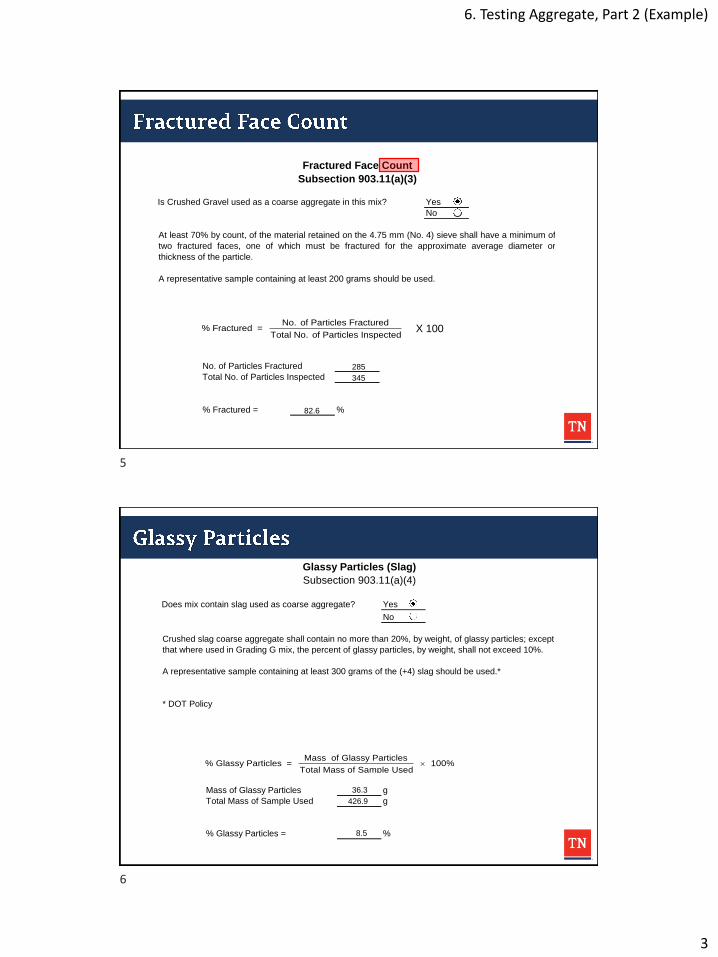
Fractured Face Count
Subsection 903.11(a)(3)
Is Crushed Gravel used as a coarse aggregate in this mix? Yes
No
No. of Particles Fractured
Total No. of Particles Inspected
% Fractured = %
At least 70% by count, of the material retained on the 4.75 mm (No. 4) sieve shall have a minimum of
two fractured faces, one of which must be fractured for the approximate average diameter or
thickness of the particle.
A representative sample containing at least 200 grams should be used.
% Fractured = No. of Particles Fractured
Total No. of Particles InspectedX 100
285
345
82.6
Glassy Particles (Slag)
Subsection 903.11(a)(4)
Does mix contain slag used as coarse aggregate? Yes
No
Mass of Glassy Particles g
Total Mass of Sample Used g
% Glassy Particles = %
Crushed slag coarse aggregate shall contain no more than 20%, by weight, of glassy particles; except
that where used in Grading G mix, the percent of glassy particles, by weight, shall not exceed 10%.
A representative sample containing at least 300 grams of the (+4) slag should be used.*
* DOT Policy
% Glassy Particles = Mass of Glassy Particles
of Sample Used 100%
Total Mass´
36.3
426.9
8.5
5
6

6. Testing Aggregate, Part 2 (Example)
4
Questions?
7
7. Power 0.45
1
Division of Materials and Tests
1
2

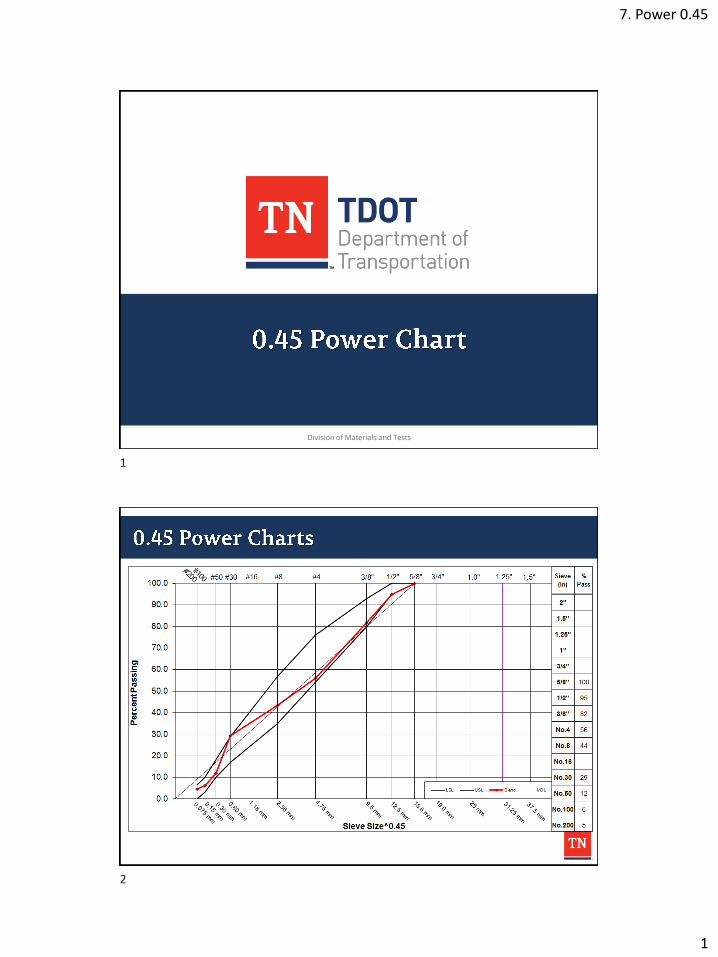
7. Power 0.45
2
• In the early 1960s, the FHWA introduced the standard gradation graph used in the HMA industry today.
• It was determined that raising sieve sizes to the 0.45th power more effectively helps us evaluate mixes.− Provide us with a visual interpretation of our blend of
aggregates.
− Helps visually determine whether a blend is going to be coarse, fine, open graded, gap graded, etc.
− Helps evaluate VMA issues.
5/8"
15.6 mm
1/2"
12.5 mm
3/8"
9.5 mm
#4
4.75 mm
#8
2.36 mm
#30
0.60 mm
#50
0.30 mm
#100
0.15 mm
#200
0.075 mm
0
10
20
30
40
50
60
70
80
90
100
Sieve Size (mm)
Pe
rce
nt
Pa
ss
ing
Blend
Plotting sieve values against their regular sizes
(0.075mm, 0.15mm, etc) makes the lower sieves very
difficult to examine.
Sieve
(in)% Pass
1.25" 100
1" 100
3/4" 100
5/8" 100
1/2" 99
3/8" 91
No.4 70
No.8 46
No.16
No.30 22
No.50 10
No.100 7
No.200 6
3
4

7. Power 0.45
3
5/8"
15.6 mm
1/2"
12.5 mm
3/8"
9.5 mm
#4
4.75 mm
#8
2.36 mm
#30
0.60 mm
#50
0.30 mm
#100
0.15 mm
#200
0.075 mm
0
10
20
30
40
50
60
70
80
90
100
Sieve Size (mm)
Pe
rce
nt
Pa
ss
ing
Blend
These smaller sieves are just as important to analyze as
the larger ones (#8 and above).
Sieve
(in)% Pass
1.25" 100
1" 100
3/4" 100
5/8" 100
1/2" 99
3/8" 91
No.4 70
No.8 46
No.16
No.30 22
No.50 10
No.100 7
No.200 6
#30
0.60 mm
#50
0.30 mm
#100
0.15 mm
#200
0.075 mm
0
10
20
30
40
50
60
70
80
90
100
Sieve Size (mm)
Pe
rce
nt
Pa
ss
ing
Sieve
(in)% Pass
1.25" 100
1" 100
3/4" 100
5/8" 100
1/2" 99
3/8" 91
No.4 70
No.8 46
No.16
No.30 22
No.50 10
No.100 7
No.200 6
5
6

7. Power 0.45
4
• Try taking the same blend and raising the sieve values (in millimeters) to the 0.45 power:
– For example – the #8 sieve (2.36 mm) raised to the 0.45 Power equals:
(2.36)0.45 = 1.472
• Now let us plot our percent passing values for a blend against these 0.45 Power numbers.
7
8

7. Power 0.45
5
1.25"
31.25 mm
1.0"
25 mm
3/4"
19.0 mm
5/8"
15.6 mm
1/2"
12.5 mm
3/8"
9.5 mm
#4
4.75 mm
#8
2.36 mm
#16
1.18 mm
#30
0.60 mm
#50
0.30 mm
#100
0.15 mm
#200
0.075 mm
0
10
20
30
40
50
60
70
80
90
100
Sieve Size^0.45
Pe
rce
nt
Pa
ss
ing
Blend
The smaller sieves are much easier to
see now.
Sieve
(in)% Pass
1.25" 100
1" 100
3/4" 100
5/8" 100
1/2" 99
3/8" 91
No.4 70
No.8 46
No.16
No.30 22
No.50 10
No.100 7
No.200 6
31.25 mm
1.25"
25 mm
1.0"
19.0 mm
3/4"
15.6 mm
5/8"
12.5 mm
1/2"
9.5 mm
3/8"
4.75 mm
#4
2.36 mm
#8
1.18 mm
#16
0.60 mm
#30
0.30 mm
#50
0.15 mm
#100
0.075 mm
#200
0
10
20
30
40
50
60
70
80
90
100
Sieve Size^0.45
Pe
rce
nt
Pa
ss
ing
Blend MDL
Plotting a straight line from the 0,0 point to 100% Passing our Maximum
Aggregate Size gives us the MAXIMUM DENSITY LINE.
Sieve
(in)% Pass
1.25" 100
1" 100
3/4" 100
5/8" 100
1/2" 99
3/8" 91
No.4 70
No.8 46
No.16
No.30 22
No.50 10
No.100 7
No.200 6
9
10

7. Power 0.45
6
31.25 mm
1.25"
25 mm
1.0"
19.0 mm
3/4"
15.6 mm
5/8"
12.5 mm
1/2"
9.5 mm
3/8"
4.75 mm
#4
2.36 mm
#8
1.18 mm
#16
0.60 mm
#30
0.30 mm
#50
0.15 mm
#100
0.075 mm
#200
0
10
20
30
40
50
60
70
80
90
100
Sieve Size^0.45
Pe
rce
nt
Pa
ss
ing
Blend MDL
The closer the blend gets to the maximum density
line the lower the VMA will be.
Sieve
(in)% Pass
1.25" 100
1" 100
3/4" 100
5/8" 100
1/2" 99
3/8" 91
No.4 70
No.8 46
No.16
No.30 22
No.50 10
No.100 7
No.200 6
31.25 mm
1.25"
25 mm
1.0"
19.0 mm
3/4"
15.6 mm
5/8"
12.5 mm
1/2"
9.5 mm
3/8"
4.75 mm
#4
2.36 mm
#8
1.18 mm
#16
0.60 mm
#30
0.30 mm
#50
0.15 mm
#100
0.075 mm
#200
0
10
20
30
40
50
60
70
80
90
100
Sieve Size^0.45
Pe
rce
nt
Pa
ss
ing
Blend MDL
A blend that mainly plots in the area above the MDL is
considered a fine mix.
Sieve
(in)% Pass
1.25" 100
1" 100
3/4" 100
5/8" 100
1/2" 99
3/8" 91
No.4 70
No.8 46
No.16
No.30 22
No.50 10
No.100 7
No.200 6
11
12

7. Power 0.45
7
31.25 mm
1.25"
25 mm
1.0"
19.0 mm
3/4"
15.6 mm
5/8"
12.5 mm
1/2"
9.5 mm
3/8"
4.75 mm
#4
2.36 mm
#8
1.18 mm
#16
0.60 mm
#30
0.30 mm
#50
0.15 mm
#100
0.075 mm
#200
0
10
20
30
40
50
60
70
80
90
100
Sieve Size^0.45
Pe
rce
nt
Pa
ss
ing
Blend MDL
Sieve
(in)% Pass
1.25" 100
1" 100
3/4" 100
5/8" 100
1/2" 99
3/8" 91
No.4 70
No.8 46
No.16
No.30 22
No.50 10
No.100 7
No.200 6
A blend that mainly plots in the area below the MDL is
considered a coarse mix.
1.25"
31.25 mm
1.0"
25 mm
3/4"
19.0 mm
5/8"
15.6 mm
1/2"
12.5 mm
3/8"
9.5 mm
#4
4.75 mm
#8
2.36 mm
#16
1.18 mm
#30
0.60 mm
#50
0.30 mm
#100
0.15 mm
#200
0.075 mm
0.0
10.0
20.0
30.0
40.0
50.0
60.0
70.0
80.0
90.0
100.0
Sieve Size^0.45
Pe
rce
nt
Pa
ss
ing
LSL USL Blend MDL
We can also plot Our Maximum and Minimum specs for percent passing each sieve to see if your
blend meets spec.
Sieve
(in)% Pass
1.25" 100
1" 100
3/4" 100
5/8" 100
1/2" 99
3/8" 91
No.4 70
No.8 46
No.16
No.30 22
No.50 10
No.100 7
No.200 6
13
14

7. Power 0.45
8
• Most TDOT mixes have specification ranges for Dust to Asphalt Ratio (DAR)
• DAR =%𝑃𝑎𝑠𝑠𝑖𝑛𝑔 #200 𝑆𝑖𝑒𝑣𝑒
% 𝐴𝑠𝑝ℎ𝑎𝑙𝑡 𝐶𝑜𝑛𝑡𝑒𝑛𝑡
• Why is this ratio important?
• For the mix we plotted a minute ago, the percent passing #200 was 6.0%. Say the optimum asphalt content for this design was 5.3%. What is the DAR?
DAR =%𝑃𝑎𝑠𝑠𝑖𝑛𝑔 #200 𝑆𝑖𝑒𝑣𝑒
% 𝐴𝑠𝑝ℎ𝑎𝑙𝑡 𝐶𝑜𝑛𝑡𝑒𝑛𝑡=6.0
5.3= 1.13
Would this meet TDOT specification for 411-D? (Hint: Section 411 in spec, 3rd page, in table)
15
16

7. Power 0.45
9
Questions?
17

5
Asphalt Mixtures

8. Testing Mix, Part 1
1
Division of Materials and Tests
Why do we do this?
• Marshall stability is related to the resistance of bituminous materials to distortion, displacement, rutting and shearing stresses.
• The stability is derived mainly from internal friction and cohesion.
• As bituminous pavement is subjected to severe traffic loads from time to time, it is necessary to adopt bituminous material with good stability and flow.
1
2

8. Testing Mix, Part 1
2
How do we do this test?
• Prior to testing in a Stability and Flow testing device, the pills must be conditioned in water bath at 140° F (60°C) for 30~40 min or in oven for 2 hours.
• The testing-head temperature shall be maintained between 70 to 100° F (21.1 to 37.8 °C) using water bath when required.
How do we do this test?• Once taken out of the
conditioning bath, the specimen must be tested within 30 seconds. Why?
• Apply load to specimen by means of the constant rate of movement of the loading head of 2 in. (50.8mm) per minutes until maximum load is reached.
• The stability/flow test data is recorded on a special graph chart. Multiple specimens can be shown on the same chart.
3
4

8. Testing Mix, Part 1
3
How do we understand test result?
• Report average maximum load in pounds-force of at least three specimens.
Flow
Stability
Load (lbs)
Deformation (0.01”)
Peak Point
Why do we do this?
• The theoretical maximum specific gravity (Gmm) of an asphalt mixture is the specific gravity without air voids.
• Theoretically, if all the air voids were eliminated from an asphalt mix, no further densification is possible.
• If the mix is compacted and has 90% density, we can say that the compacted sample has 90% density out of maximum (100%) density.
w/ air void w/o air void
5
6

8. Testing Mix, Part 1
4
GmmGmb
Air
Aggregates
Binder
Volume of compacted specimen
Volume of loose mixture w/o air pockets=
<
w/ air void w/o air void
Why do we do this?
Why do we do this? (cont’d)
Ultimately, we can find the density of the compacted mixture with theoretical maximum specific gravity of the mixture.
Example
Gmb is 2.464 and Gmm is 2.672. What is density of the compacted specimen?
w/ air void
w/o air void
X 100 =2.464
2.672X 100 = 92.2 %
• We can say that 92.2% of density of the compacted specimen out of maximum (100%) density with the mix.
• Or simply 92.2% density
7
8

8. Testing Mix, Part 1
5
How do we do this?
• Open SPEC book (AASHTO T-209, section 6)
• Collect minimum amount of material
• Fully dry material before testing
How do we do this?
• Always remember to record all measurable weight of materials and apparatus.
• Loose mix is allowed to cool to room temperature.
• The mix will also have to be crumbled into small particles. What is the largest conglomerate particle that can remain?
9
10

8. Testing Mix, Part 1
6
How do we do this?
• The mix is placed into a calibrated
volumetric flask and the dry mass
is determined.
• The mix is then covered (by about
an inch) with water that is 77° F
(25° C)
• Remove air trapped in the
mixture by applying vacuum
until the residual pressure
manometer reads 3.7±0.3kPa
(27.5±2.5 mmHg).
• Maintain this residual pressure
for 15±2 minute.
• Turn on vibrator to agitate the
container and content during
the vacuum period.
• Slowly bleed the vacuum off
using the required valve.
11
12
8. Testing Mix, Part 1
7
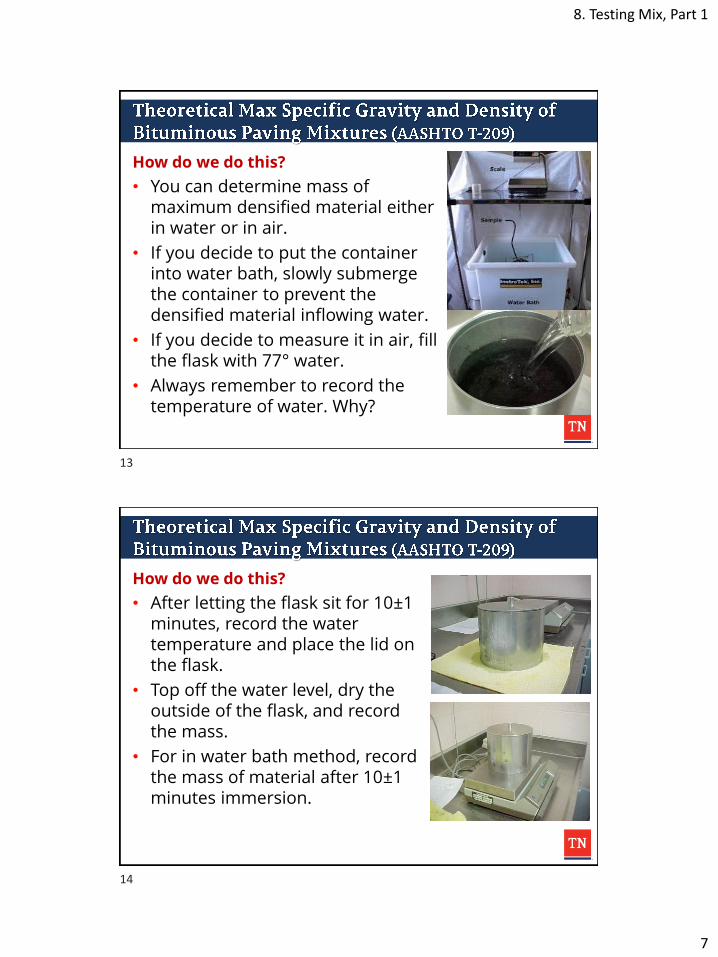
How do we do this?
• You can determine mass of maximum densified material either in water or in air.
• If you decide to put the container into water bath, slowly submerge the container to prevent the densified material inflowing water.
• If you decide to measure it in air, fill the flask with 77° water.
• Always remember to record the temperature of water. Why?
How do we do this?
• After letting the flask sit for 10±1 minutes, record the water temperature and place the lid on the flask.
• Top off the water level, dry the outside of the flask, and record the mass.
• For in water bath method, record the mass of material after 10±1 minutes immersion.
13
14

8. Testing Mix, Part 1
8
How can we calculate Gmm?
• In water bath method
𝐺𝑚𝑚 =𝐴
𝐴 + 𝐵 − 𝐶• In Air method
𝐺𝑚𝑚 =𝐴
𝐴 + 𝐷 − 𝐸
A= mass of oven-dry loose mixture,
B= mass of container submerged in water,
C= mass of sample and container in water,
D= mass of container filler with water, and
E= mass of container filled with sample and water.
CALCULATION OF MAXIMUM SPECIFIC GRAVITY:
WT. DRY SAMPLE (A) 1604.0
WT. FLASK FILLED WITH WATER (D) 7399.0
WT. FLASK FILLED WITH WATER & DRY SAMPLE (E) 8347.2
Gmm = =AA + D - E
Gmm = 𝐴
𝐴+𝐷−𝐸=
1604
1604+7399−8347.2=
1604
655.8= 2.446
How can we calculate Gmm?
Example
Remember all specific gravity values should be displaced by three decimal point (X.XXX).
15
16

8. Testing Mix, Part 1
9
Why do we do this?• This test used to determine the bulk specific gravity of
a compacted specimen (Gmb)
• Gmb is may be used to calculate % air void, density, unit weight of mix for construction.
• Can be performed on either a lab or field compacted specimen (core)
• Three weights needed:
– Dry Weight
– Saturated Surface-Dry Weight (SSD)
– Weight Submerged in Water
How do we do this?
• As an alternative, T-331 (auto vacuum sealing method) can be used to measure Gmb
• Record the mass of the specimen.
• Place the specimen in a basket suspended in water under a balance for 4 ± 1 minutes.
17
18

8. Testing Mix, Part 1
10
How do we do this?
• Blot lightly with a damp towel to remove excess exterior moisture.
• Do not forget to be consistent to reduce person-to-person variation.
– Example: Have everyone test right at 4 minutes.
• Re-weigh the specimen and record its SSD mass.
How do we calculate bulk specific gravity?
Bulk Specific Gravity (Gmb)= 𝐷𝑟𝑦 𝑊𝑒𝑖𝑔ℎ𝑡
𝑆𝑆𝐷𝑊𝑒𝑖𝑔ℎ𝑡 −𝑊𝑒𝑖𝑔ℎ𝑡 𝑖𝑛 𝑊𝑎𝑡𝑒𝑟
Example
Dry weight is 1,156 g, surface saturated dry weight is 1,161g, and specimen weight in water is 665g. What is Gmb?
Gmb = 1156
1161 −665=
1156
496= 2.331
Remember all specific gravity values should be displaced by three decimal point (X.XXX).
19
20

8. Testing Mix, Part 1
11
Questions?
21

9. Volumetric
1
Division of Materials and Tests
1-3
1-2
1-1
2-3
2-2
2-1
3-3
3-2
3-1
4-3
4-2
4-1
3.5% 4.0% 4.5% 5.0%
5-3
5-2
5-1
5.5%
1
2

9. Volumetric
2
VOLUMETRICS
VOLUMETRICS FLOW CHART FOR MIX DESIGN DATA @ CHOOSEN % ASPHALT CONTENT
% AC
% AGGREGATE
VFA
VOIDS FILLED WITH ASPHALT IN COMPACTED MIX
100 x VMA BULK - Va / VMA BULK
100 x VMA EFF - Va / VMA EFF
VMA
VOIDS IN MINERAL AGGREGATE OF COMPACTED MIX
100 - Gmb x Ps / Gsb = VMA BULK
100 - Gmb x Ps / Gse = VMA EFFECTIVE
Va OR VTA
AIR VOIDS OR VOIDS IN TOTAL COMPACTED MIX
100 x Gmm - Gmb / Gmm
Gmb
BULK SPECIFIC GRAVITY OF COMPACTED SPECIMENS
SSD - IN WATER = VOLUME
IN AIR / VOLUME =Gmb
BULK SPECIFIC GRAVITY
MASS (IN GRAMS)
IN AIR, SSD, IN WATER
VOLUME (ml)
Gse
EFFECTIVE SPECIFIC GRAVITY OF AGGREGATES
Pmm - Pb / (Pmm / Gmm - Pb / Gb) = Gse
Gmm
AASHTO T- 209
FOR % AC CHOSEN
RICE SPECIFIC GRAVITY
AASHTO T- 209
FOR % AC CHOSEN
MIX DESIGN SHEET
VOLUMETRICS FLOW CHART FOR MIX DESIGN DATA @ CHOOSEN % ASPHALT CONTENT
% AC
% AGGREGATE
VFA
VOIDS FILLED WITH ASPHALT IN COMPACTED MIX
100 x VMA BULK - Va / VMA BULK
100 x VMA EFF - Va / VMA EFF
VMA
VOIDS IN MINERAL AGGREGATE OF COMPACTED MIX
100 - (Gmb x Ps) / Gsb = VMA BULK
100 - (Gmb x Ps) / Gse = VMA EFFECTIVE
Va OR VTA
AIR VOIDS OR VOIDS IN TOTAL COMPACTED MIX
100 x Gmm - Gmb / Gmm
Gmb
BULK SPECIFIC GRAVITY OF COMPACTED SPECIMENS
SSD - IN WATER = VOLUMEIN AIR / VOLUME =Gmb
BULK SPECIFIC GRAVITY
MASS (IN GRAMS)
IN AIR, SSD, IN WATER
VOLUME (ml)
Gse
EFFECTIVE SPECIFIC GRAVITY OF AGGREGATES
Pmm - Pb / ((Pmm / Gmm) - (Pb / Gb)) = Gse
Gmm
CALCULATED MAXIMUM SPECIFIC GRAVITY OF MIX
@ DIFFERRENT ASPHALT CONTENTS
Gmm = Pmm / ((Ps / Gse) + (Pb / Gb))
Gmm
AASHTO T- 209
FOR % AC CHOSEN
Gmm MAXIMUM SPECIFIC GRAVITY OF MIX
RICE GRAVITY @ CHOSEN ASPHALT CONTENT
AASHTO T- 209
FOR % AC CHOSEN
MIX DESIGN SHEET
VOLUMETRICS
VOLUMETRICS
VOLUMETRICS FLOW CHART FOR MIX DESIGN DATA @ CHOOSEN % ASPHALT CONTENT
% AC
% AGGREGATE
VFA
VOIDS FILLED WITH ASPHALT IN COMPACTED MIX
100 x VMA BULK - Va / VMA BULK
100 x VMA EFF - Va / VMA EFF
VMA
VOIDS IN MINERAL AGGREGATE OF COMPACTED MIX
100 - Gmb x Ps / Gsb = VMA BULK
100 - Gmb x Ps / Gse = VMA EFFECTIVE
Va OR VTA
AIR VOIDS OR VOIDS IN TOTAL COMPACTED MIX
100 x Gmm - Gmb / Gmm
Gmb
BULK SPECIFIC GRAVITY OF COMPACTED SPECIMENS
SSD - IN WATER = VOLUME
IN AIR / VOLUME =Gmb
BULK SPECIFIC GRAVITY
MASS (IN GRAMS)
IN AIR, SSD, IN WATER
VOLUME (ml)
Gse
EFFECTIVE SPECIFIC GRAVITY OF AGGREGATES
Pmm - Pb / (Pmm / Gmm - Pb / Gb) = Gse
Gmm
AASHTO T- 209
FOR % AC CHOSEN
RICE SPECIFIC GRAVITY
AASHTO T- 209
FOR % AC CHOSEN
MIX DESIGN SHEET
A: Sample mass in air
C: Sample & container mass in
water
D: Container mass filled with water
E: Container mass filled with sample &
water
𝑮𝒎𝒎 =𝑨
𝑨 + 𝑩 − 𝑪
𝑮𝒎𝒎 =𝑨
𝑨 + 𝑫 − 𝑪
Water Bath Method
In Air Method
B= mass of container submerged in water
3
4

9. Volumetric
3
A: Mass in air B: SSD Mass C: Mass in Water
𝑮𝒎𝒃 =𝑨
𝑩 − 𝑪
Using Gmm from AASHTO T- 209 (Rice Gravity) for chosen Asphalt Content
𝑮𝒔𝒆 =𝑷𝒎𝒎 − 𝑷𝒃
𝑷𝒎𝒎𝑮𝒎𝒎
−𝑷𝒃𝑮𝒃
=𝟏𝟎𝟎 − 𝑷𝒃
𝟏𝟎𝟎𝑮𝒎𝒎
−𝑷𝒃
𝟏. 𝟎𝟑𝟐
Where𝐺𝑠𝑒= Effective Specific gravity of aggregate𝑃𝑚𝑚= % by mass of total loose mixture = 100𝑃𝑏 = % of asphalt binder content by total mass of mix𝐺𝑏 = specific gravity of asphalt binder = 1.032
5
6

9. Volumetric
4
𝑽𝒂 = 𝑮𝒎𝒎−𝑮𝒎𝒃
𝑮𝒎𝒎× 𝟏𝟎𝟎
𝐺𝑚𝑚−𝐺𝑚𝑏
𝐺𝑚𝑚× 100 = 1 −
Gmb
Gmm× 100 = 100 −
𝐺𝑚𝑏
𝐺𝑚𝑚× 100
% Density% Air Void + % Density = 100
Voids in compacted mixture consist of small air spaces between the coated particles.
𝐺𝑚𝑚= theoretical maximum specific gravity of loose mix𝐺𝑚𝑏= bulk specific gravity of compacted mix
7
8

9. Volumetric
5
𝑽𝑴𝑨𝒆𝒇𝒇 = 𝟏𝟎𝟎 −𝑮𝒎𝒃 × 𝑷𝒔
𝑮𝒔𝒆
𝑃𝑠 = % of aggregate by total mass of mixture𝐺𝑠𝑒= Effective specific gravity of aggregate
VMA are defined as the intergranular void space between the aggregate particles in a compacted mixture that includes the air voids and the effective asphalt content, expressed as a percent of total volume.
VFA is defined as the percentage of the voids in total volume in the mineral aggregate that are filled with asphalt.
𝑽𝑭𝑨𝒆𝒇𝒇 =𝑽𝑴𝑨𝒆𝒇𝒇 − 𝑽𝒂
𝑽𝑴𝑨𝒆𝒇𝒇× 𝟏𝟎𝟎
𝑉𝑎 = the volume of Air void in the total volume of compacted Mixture
9
10

9. Volumetric
6
The effective asphalt content of paving mixture is the total asphalt content minus the quantity of asphalt lost by absorption in the aggregate particles.
𝑷𝒃𝒆 = 𝑷𝒃 −𝑷𝒃𝒂
𝟏𝟎𝟎× 𝑷𝒔
𝑃𝑏 = % of asphalt binder content by total mass of mix𝑃𝑏𝑎 = % of absorbed asphalt binder content by total mass
of mix𝑃𝑠 = % of aggregate by total mass of Mixture
Absorption is expressed as a percentage by the mass of aggregate rather than as a percentage of total mass of mixture.
𝑷𝒃𝒂 =𝑮𝒔𝒆 − 𝑮𝒔𝒃
𝑮𝒔𝒃 × 𝑮𝒔𝒆× 𝑮𝒃 × 𝟏𝟎𝟎
𝐺𝑠𝑒 = effective specific gravity of aggregate𝐺𝑠𝑏 = bulk specific gravity of aggregate𝐺𝑏 = specific gravity of asphalt binder = 1.032
1.032
11
12

9. Volumetric
7
Finding Gmm at Different Asphalt Contents
𝑮𝒎𝒎 =𝑷𝒎𝒎
𝑷𝒔𝑮𝒔𝒆
+𝑷𝒃𝑮𝒃
=𝟏𝟎𝟎
𝟏𝟎𝟎 − 𝑷𝒃𝑮𝒔𝒆
+𝑷𝒃
𝟏. 𝟎𝟑𝟐
𝑃𝑚𝑚= total loose mixture percentage = 100𝑃𝑏 = % of asphalt binder content by total mass of mix𝑃𝑠 = % of aggregate content by total mass of mix𝐺𝑏 = specific gravity of asphalt binder = 1.032𝐺𝑠𝑒 = effective specific gravity of aggregate
𝐺𝑠𝑒 =𝑃𝑚𝑚 − 𝑃𝑏
𝑃𝑚𝑚𝐺𝑚𝑚
−𝑃𝑏𝐺𝑏
=100 − 𝑃𝑏
100𝐺𝑚𝑚
−𝑃𝑏
1.032
Mix Design Sheet
13
14

9. Volumetric
8
Based on laboratory Information, Calculate the Volumetric for the Marshall Mix Design Sheet.
Two Rice Gravities (Gmm) (AASHTO T-209) were performed at 4.0% and 4.5% Asphalt Content.4.0% = 2.529 4.5% = 2.513
Based on laboratory Information, Calculate the Volumetric for the Marshall Mix Design Sheet.
Bulk Specific Gravities (Gmb) were performed for all SpecimensThen averaged for each Asphalt Content 3.5%, 4.0%, 4.5%, 5.0% and 5.5%.
3.5% = 2.4044.0% = 2.4214.5% = 2.4345.0% = 2.4475.5% = 2.451
Based on lab Information, starting at an asphalt content where a rice gravity has been performed. Calculate the Effective Specific Gravity (Gse) of the Aggregates.
15
16

9. Volumetric
9
Using Gmm from AASHTO T- 209 (Rice Gravity) for 4.0 % Asphalt Content
𝑮𝒔𝒆 =𝑷𝒎𝒎 − 𝑷𝒃
𝑷𝒎𝒎𝑮𝒎𝒎
−𝑷𝒃𝑮𝒃
=𝟏𝟎𝟎 − 𝑷𝒃
𝟏𝟎𝟎𝑮𝒎𝒎
−𝑷𝒃
𝟏. 𝟎𝟑𝟐
Where𝐺𝑠𝑒= Effective Specific gravity of aggregate𝑃𝑚𝑚= % by mass of total loose mixture = 100𝑃𝑏 = % of asphalt binder content by total mass of mix = 4.0𝐺𝑚𝑚 = Maximum specific of the mixture @ 4.0 % asphalt
binder content = 2.532𝐺𝑏 = specific gravity of asphalt binder = 1.032
Using Gmm from AASHTO T- 209 (Rice Gravity) for 4.0 % Asphalt Content
𝑮𝒔𝒆 =𝟏𝟎𝟎 − 𝟒. 𝟎
𝟏𝟎𝟎𝟐. 𝟓𝟑𝟐
−𝟒. 𝟎
𝟏. 𝟎𝟑𝟐
=𝟗𝟔
𝟑𝟗. 𝟒𝟗𝟒 − 𝟑. 𝟖𝟕𝟔= 𝟐. 𝟔𝟗𝟔
𝐺𝑠𝑒= Effective Specific gravity of aggregate (Stay the same for all asphalt contents)
17
18
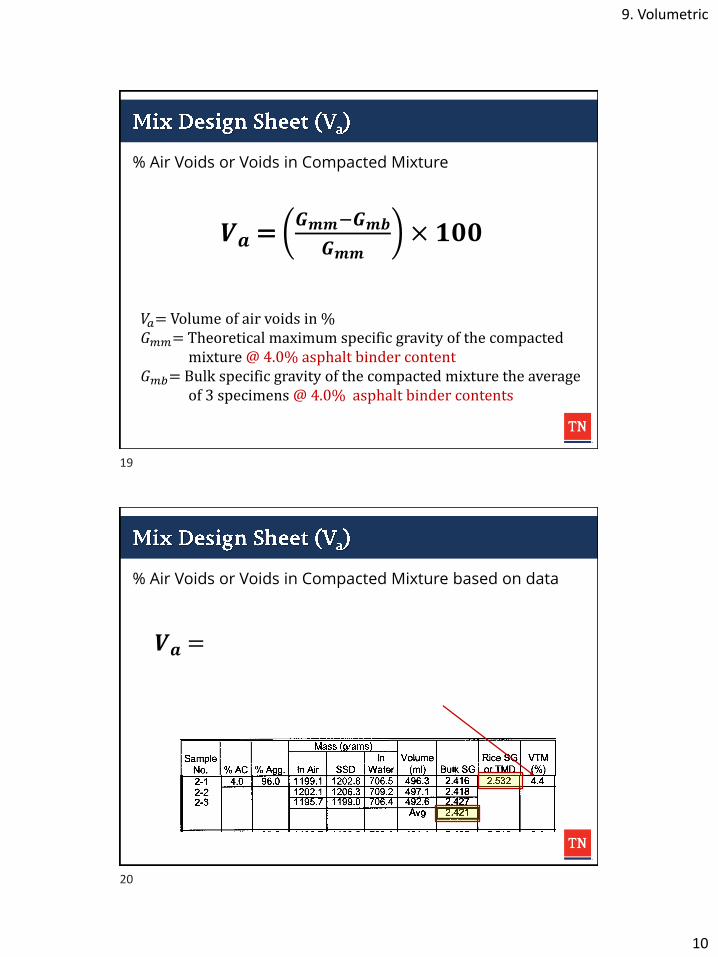
9. Volumetric
10
% Air Voids or Voids in Compacted Mixture
𝑽𝒂 = 𝑮𝒎𝒎−𝑮𝒎𝒃
𝑮𝒎𝒎× 𝟏𝟎𝟎
𝑉𝑎= Volume of air voids in %𝐺𝑚𝑚= Theoretical maximum specific gravity of the compacted
mixture @ 4.0% asphalt binder content𝐺𝑚𝑏= Bulk specific gravity of the compacted mixture the average
of 3 specimens @ 4.0% asphalt binder contents
% Air Voids or Voids in Compacted Mixture based on data
𝑽𝒂 =𝟐.𝟓𝟑𝟐−𝟐.𝟒𝟐𝟏
𝟐.𝟓𝟑𝟐× 𝟏𝟎𝟎 =
𝟎.𝟏𝟏𝟏
𝟐.𝟓𝟑𝟐× 𝟏𝟎𝟎
= 𝟎. 𝟎𝟒𝟑𝟖 = 𝟒. 𝟒%
19
20

9. Volumetric
11
Void in mineral aggregate at 4.0% asphalt binder content
𝑽𝑴𝑨𝒆𝒇𝒇 = 𝟏𝟎𝟎 −𝑮𝒎𝒃 × 𝑷𝒔
𝑮𝒔𝒆
𝑉𝑀𝐴𝑒𝑓𝑓 = Voids in mineral aggregate using effective specific
gravity of the aggregate𝐺𝑚𝑏 = Bulk specific gravity of the compacted mixture the average
of 3 specimens @ 4.0% asphalt binder content = 2.421𝑃𝑠 = % of aggregate by total mass of mixture = 96%𝐺𝑠𝑒= Effective specific gravity of aggregate = 2.696
∗ 𝑉𝑀𝐴𝑒𝑓𝑓is TDOT’s Definition
Void in mineral aggregate at 4.0% asphalt binder content
𝑽𝑴𝑨𝒆𝒇𝒇 = 𝟏𝟎𝟎 −𝟐. 𝟒𝟐𝟏 × 𝟗𝟔
𝟐. 𝟔𝟗𝟔
= 𝟏𝟎𝟎 −𝟐𝟑𝟐. 𝟒𝟏𝟔
𝟐. 𝟔𝟗𝟔= 𝟏𝟎𝟎 − 𝟖𝟔. 𝟐 = 𝟏𝟑. 𝟖
21
22

9. Volumetric
12
Void filled with Asphalt at 4.0% asphalt binder content
𝑽𝑭𝑨𝒆𝒇𝒇 =𝑽𝑴𝑨𝒆𝒇𝒇 − 𝑽𝒂
𝑽𝑴𝑨𝒆𝒇𝒇× 𝟏𝟎𝟎
𝑉𝐹𝐴𝑒𝑓𝑓 = the volume of Air void in the total volume of
compacted mixture𝑉𝑀𝐴𝑒𝑓𝑓 = the volume of Air void in the total volume of
compacted mixture=13.8𝑉𝑎 = the volume of Air void in the total volume of compacted
Mixture=4.4%
∗ 𝑉𝐹𝐴𝑒𝑓𝑓is TDOT’s Definition
Void filled with Asphalt at 4.0% asphalt binder content
𝑽𝑭𝑨𝒆𝒇𝒇 =𝟏𝟑. 𝟖 − 𝟒. 𝟒
𝟏𝟑. 𝟖× 𝟏𝟎𝟎 =
𝟗. 𝟒
𝟏𝟑. 𝟖× 𝟏𝟎𝟎 = 𝟔𝟖. 𝟎
23
24
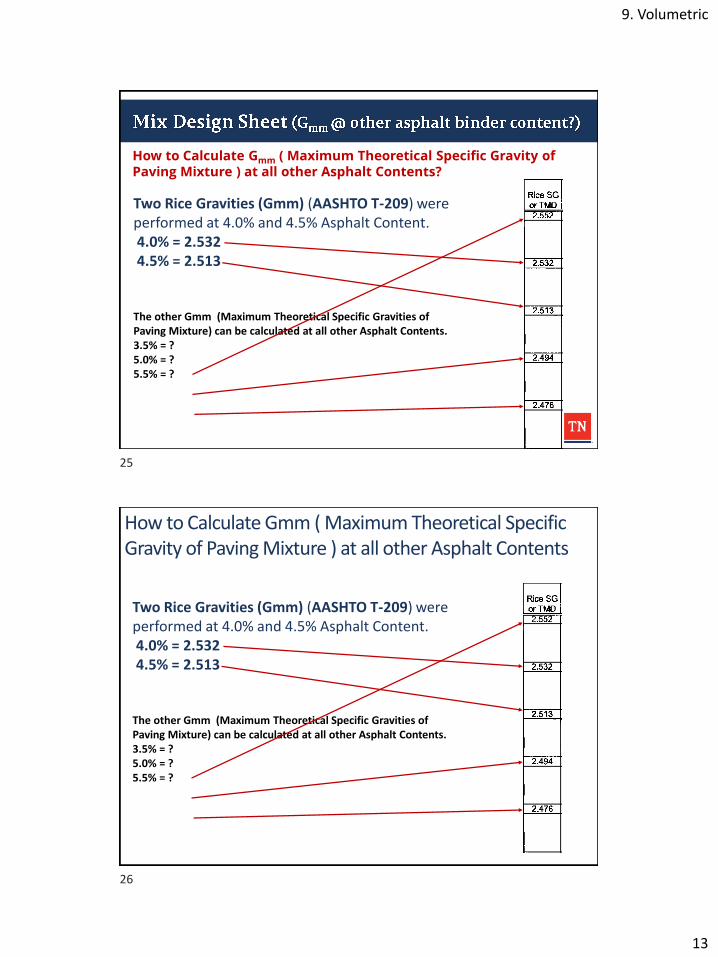
9. Volumetric
13
How to Calculate Gmm ( Maximum Theoretical Specific Gravity of Paving Mixture ) at all other Asphalt Contents?
Two Rice Gravities (Gmm) (AASHTO T-209) were performed at 4.0% and 4.5% Asphalt Content.4.0% = 2.532 4.5% = 2.513
The other Gmm (Maximum Theoretical Specific Gravities of Paving Mixture) can be calculated at all other Asphalt Contents.3.5% = ?5.0% = ?5.5% = ?
How to Calculate Gmm ( Maximum Theoretical Specific Gravity of Paving Mixture ) at all other Asphalt Contents
Two Rice Gravities (Gmm) (AASHTO T-209) were performed at 4.0% and 4.5% Asphalt Content.4.0% = 2.532 4.5% = 2.513
The other Gmm (Maximum Theoretical Specific Gravities of Paving Mixture) can be calculated at all other Asphalt Contents.3.5% = ?5.0% = ?5.5% = ?
25
26

9. Volumetric
14
Calculate the Gmm @ 3.5 % Asphalt Content
𝑮𝒎𝒎 =𝑷𝒎𝒎
𝑷𝒔𝑮𝒔𝒆
+𝑷𝒃𝑮𝒃
=𝟏𝟎𝟎
𝟏𝟎𝟎 − 𝑷𝒃𝑮𝒔𝒆
+𝑷𝒃
𝟏. 𝟎𝟑𝟐
𝐺𝑚𝑚= Maximum specific gravity of compacted mixture𝑃𝑚𝑚= total loose mixture percentage = 100𝑃𝑏 = % of asphalt binder content by total mass of mix = 3.5𝑃𝑠 = % of aggregate content by total mass of mix = 96.5𝐺𝑏 = specific gravity of asphalt binder = 1.032𝐺𝑠𝑒 = effective specific gravity of aggregate=2.696
27
28

9. Volumetric
15
Calculate the Gmm @ 3.5 % Asphalt Content
𝑮𝒎𝒎 =𝑷𝒎𝒎
𝑷𝒔𝑮𝒔𝒆
+𝑷𝒃𝑮𝒃
=𝟏𝟎𝟎
𝟏𝟎𝟎 − 𝟑. 𝟓𝟐. 𝟔𝟗𝟔
+𝟑. 𝟓
𝟏. 𝟎𝟑𝟐
=𝟏𝟎𝟎
𝟑𝟓. 𝟒𝟗𝟕 + 𝟑. 𝟑𝟗𝟏=
𝟏𝟎𝟎
𝟑𝟗. 𝟏𝟖𝟔= 𝟐. 𝟓𝟓𝟐
Questions?
29
30

9. Volumetric (Example)
1
Division of Materials and Tests
CALCULATION OF MAXIMUM SPECIFIC GRAVITY: (1) (2) (3)
FLASK % AC
WT. DRY SAMPLE + FLASK (grams)
WT. FLASK (grams)
WT. DRY SAMPLE (A) (grams)
WT. FLASK FILLED WITH WATER (D) (grams)
WT. FLASK FILLED WITH WATER & DRY SAMPLE (E) (grams)
MAXIMUM SPECIFIC GRAVITY MIX (G ) = A
A + D - Emm Þ
5.9
3927.7
2177.7
7399.0
1750.0
8423.7
Þ−+
=7.84230.73990.1750
0.1750).(... GmmMixGravitySpecificMax Þ=
3.725
0.1750).(... GmmMixGravitySpecificMax 2.413
1
2

9. Volumetric (Example)
2
CALCULATION OF THE EFFECTIVE GRAVITY OF THE AGGREGATES:
% AGGREGATES
SPECIFIC GRAVITY OF ASPHALT CEMENT 1.032
Effective Specific Gravity of Aggregates (Gse)
Avg. Effective Gravity
RICE VALUES AT OTHER ASPHALT CONTENTS
Percent Asphalt Theoretical Maximum Density
7.0
6.5
6.0
5.5
5.0
Gse =
−
% AGG
100
G
% AC
Gmm b
b
b
se
s
mm
G
P
G
P
100G
+
=
94.1
2.635
2.635
032.1413.2
100
1.94
9.5−
=Gse
7.54.41
1.94
−=Gse
2.393
2.410
2.427
2.445
2.376
032.1635.2
0.93
100
0.7+
=Gmm
783.6294.35
100
+=Gmm
077.42
100=Gmm
0
500
1000
1500
2000
2500
3000
3500
4000
4500
5000
0 5 10 15 20 25 30 35
Flow
ST
AB
ILIT
Y P
OU
ND
S (
LB
S)Y
LAB NO. _____
PASSING NO. :
200 ____
100 ____
50 ____
30 ____
16 ____
8 ____
4 ____
3/8 ____
1/2 ____
3/4 ____
1 ½ ____
DATE __________
SAMPLE NO. ____
WEIGHT ________
HEIGHT ________
VOLUME _______
SP. GR. _______
VOIDS _________
AGGR. _________
ASPHALT _______
PERCENT _______
TEMPERATURE ___
STABILITY _______
FLOW ___________
For “STABILITY”/“LOAD”, Read the
upper most portion of the arc
For “FLOW”, Read where the arc first begins
to break
“STABILITY”/“LOAD”, is
read from this scale
“FLOW”, is read from this scale
Marshall Stability/Flow Chart
3
4

9. Volumetric (Example)
3
0
500
1000
1500
2000
2500
3000
3500
4000
4500
5000
0 5 10 15 20 25 30 35
Flow
ST
AB
ILIT
Y P
OU
ND
S (
LB
S)Y
LAB NO. _____
PASSING NO. :
200 ____
100 ____
50 ____
30 ____
16 ____
8 ____
4 ____
3/8 ____
1/2 ____
3/4 ____
1 ½ ____
DATE __________
SAMPLE NO. ____
WEIGHT ________
HEIGHT ________
VOLUME _______
SP. GR. _______
VOIDS _________
AGGR. _________
ASPHALT _______
PERCENT _______
TEMPERATURE ___
STABILITY _______
FLOW ___________
As a rule, not a Spec., if one of the
samples reads a 500+/- lbs difference than the others, you
can discard it and average the
remaining two.
This would be a preferred read
Marshall Stability/Flow Chart
Mass (grams) Unit
Sample Pb Ps In Volume Gmb Gmm Va VMA VFA Weight Stability Flow
No. % AC % Agg. In Air SSD Water (ml) Bulk SG Rice SG (%) (%) (%) (pcf) (lb) (0.01")1-1
1-21-3
Avg Avg
2-1
2-22-3
Avg Avg
3-1
3-23-3
Avg Avg
5.0 95.0 1177.2 1181.4 666.2
1179.6 1183.9 668.7
1175.8 1178.9 665.0
515.2
515.2
513.9
5.5 94.5 1181.4 1183.9 668.0
1178.2 1181.5 669.2
1177.4 1179.3 671.2
6.0 94.0 1182.1 1183.0 672.3 510.7 2.315 2.410 3.8 17.3 78.1 144.7 2625 12.0
1180.4 1181.2 674.1 507.1 2.328 2650 12.0
1181.6 1182.6 672.0 510.6 2.314 2600 12.0
2.319 2625 12.0
515.9
512.3
508.1
2.285
2.290
2.288
2.290
2.300
2.317
2.302
2750
2800
2850
10.0
9.0
9.0
2650 11.0
2700 10.0
2725 10.0
2.288
2.445 6.4 17.5 63.3 142.7
2800 9.3
5.2 17.4 70.4 143.7
100−
Gmm
GmbGmm100
445.2
288.2445.2
−
se
smb
G
PG −100
635.2
0.95288.2100
−100
−
VMA
VaVMA100
5.17
4.65.17
−
mbG4.62 288.24.62 ( )
Gse
PsGmbVMA
−= 100
( )100
−=
Gmm
GmbGmmVa
( )100
−=
VMA
VaVMAVFA
GmbWeightUnit = 4.62..
Contractor ________________________
Effective Gravity of Agg. ( Gse ) ____________
SG of Asphalt ( Gb ) ____________________
Number of Blows w/Marshall Hammer 75
Watts Paving INC
1.032
2.635
From bottom section of T-209(rice)
2.247
2692 10.3
5
6

9. Volumetric (Example)
4
Questions?
7
10. Preparing Graphs & Selecting Optimum
1
Division of Materials and Tests
• With all the Marshall Specimens prepared at varying AC contents, tests can be preformed on them to determine various design parameters.
• These numbers (VTM, VMA, etc.) will be utilized to select numbers for the mix design.
1
2

10. Preparing Graphs & Selecting Optimum
2
State of Tennessee Marshall Mix Design Sheet
Type of Mix 411-D PG 64-22 Contract No. CNE315 Contractor Concrete Structures
County Hickman Date 3/13/2008 Effective Gravity of Aggregate 2.614
Project Ref. No. BR-STP-48(21) Region 3 SG of Asphalt 1.032
HMA Producer Number of Blows w/ Marshall Hammer 75
Mass (grams) Unit
Sample In Volume Rice SG VTM VMA VFA Weight Stability Flow
No. % AC % Agg. In Air SSD Water (ml) Bulk SG or TMD (%) (%) (%) (pcf) (lb) (0.01")
1-1 5.0 95.0 1160.7 1161.7 636.7 525.0 2.211 2.428 8.9 19.6 54.7 138.0 3275 9.51-2 1156.6 1157.9 635.8 522.1 2.215 3900 10.51-3 1164.4 1165.6 638.7 526.9 2.210 3700 11.0
Avg 2.212 Avg 3625 10.3
2-1 5.5 94.5 1157.4 1158.3 645.8 512.5 2.258 2.411 6.3 18.3 65.7 141.0 2750 12.02-2 1161.2 1162.0 647.5 514.5 2.257 2400 9.52-3 1160.8 1161.7 648.6 513.1 2.262 3175 10.0
Avg 2.259 Avg 2775 10.5
3-1 5.9 94.1 1160.6 1161.3 655.8 505.5 2.296 2.397 4.1 17.2 76.3 143.5 2050 9.03-2 1155.4 1156.2 653.6 502.6 2.299 2600 9.53-3 1159.8 1160.7 657.0 503.7 2.302 2400 10.0
Avg 2.299 Avg 2350 9.5
4-1 6.0 94.0 1161.4 1162.3 659.2 503.1 2.308 2.394 3.7 17.1 78.2 143.8 2125 10.04-2 1159.0 1159.5 657.0 502.5 2.306 1950 10.04-3 1159.3 1159.9 655.5 504.4 2.298 2250 10.0
Avg 2.304 Avg 2108 10.0
5-1 6.5 93.5 1155.3 1155.8 663.9 491.9 2.349 2.377 1.2 16.0 92.5 146.5 1875 8.55-2 1159.3 1159.9 667.0 492.9 2.352 1875 9.55-3 1162.7 1163.4 667.5 495.9 2.345 1750 11.0
Avg 2.348 Avg 1833 9.7
Opt-1 5.9 94.1 1160.6 1161.3 655.8 505.5 2.296 2.397 4.1 17.2 76.3 143.5 2050 9.0Opt-2 1155.4 1156.2 653.6 502.6 2.299 2600 9.5Opt-3 1159.8 1160.7 657.0 503.7 2.302 2400 10.0
Avg 2.299 Avg 2350 9.5
EUBANK ASPHALT, DICKSON PLANT #1
• All of the following parameters from the Marshall Sheet are plotted versus AC percentage:
– Void in the Mixture (VTM)
– Void in Mineral Aggregate (VMA)
– Voids Filled with Asphalt (VFA)
– Unit Weight
– Marshall Stability
– Marshall Flow
3
4

10. Preparing Graphs & Selecting Optimum
3
• The most important graph is the plot of AC content vs. Air Voids, which is used to select the optimum binder content of the mixture.
VTM vs % AC
0.0
1.0
2.0
3.0
4.0
5.0
6.0
7.0
8.0
9.0
10.0
3.0 3.5 4.0 4.5 5.0 5.5 6.0 6.5 7.0 7.5 8.0AC Content (%)
Air
Vo
ids
Drawing a best fit line.
Typical design set at 4% air voids.
Looks like 5.9% AC will give us the voids we
want.
Verify your optimum
5
6

10. Preparing Graphs & Selecting Optimum
4
• Plot the rest of the data (VMA, VFA, Unit Weight, Stability, and Flow) to observe the mixture behavior and make sure the mix will meet specifications.
• Most mixes we design have a VMA spec.
• What is the VMA spec for:
411-D?
307-BM2? Min. 14%
Min. 13.5%
7
8

10. Preparing Graphs & Selecting Optimum
5
• VMA graphs are typically U-shaped curves.
• As we add hot AC to mixtures, it “lubricates” the aggregate and helps it compact, thus reducing the Voids in the Aggregate structure.
• However, at some point, adding AC only “spreads” the aggregate out, then increasingVMA.
• As a result, we prefer to select an optimum AC that lands on the LEFT side of the VMA curve.
VMA vs % AC
12.0
13.0
14.0
15.0
16.0
17.0
18.0
19.0
20.0
21.0
22.0
3.0 3.5 4.0 4.5 5.0 5.5 6.0 6.5 7.0 7.5 8.0AC Content (%)
VM
A (
%)
Looks like our optimum of 5.9% AC
is in a good place.
Is our mix going to pass TDOT’s VMA spec. for 411-D?
9
10

10. Preparing Graphs & Selecting Optimum
6
VFA vs % AC
50
60
70
80
90
100
3.0 3.5 4.0 4.5 5.0 5.5 6.0 6.5 7.0 7.5 8.0AC Content (%)
Vo
ids F
ille
d w
/ A
C
Unit Weight vs % AC
125
130
135
140
145
150
155
160
165
3.0 3.5 4.0 4.5 5.0 5.5 6.0 6.5 7.0 7.5 8.0AC Content (%)
Un
it W
eig
ht
(pcf)
11
12
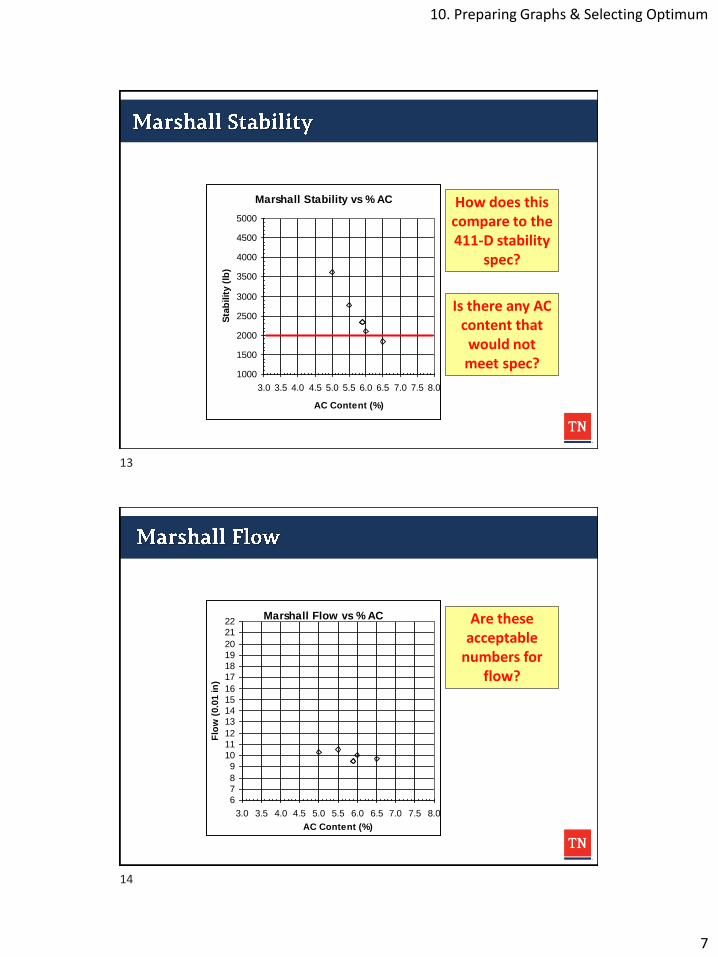
10. Preparing Graphs & Selecting Optimum
7
Marshall Stability vs % AC
1000
1500
2000
2500
3000
3500
4000
4500
5000
3.0 3.5 4.0 4.5 5.0 5.5 6.0 6.5 7.0 7.5 8.0
AC Content (%)
Sta
bilit
y (
lb)
How does this compare to the 411-D stability
spec?
Is there any AC content that would not
meet spec?
Marshall Flow vs % AC
6
7
8
9
10
11
12
13
14
15
16
17
18
19
20
21
22
3.0 3.5 4.0 4.5 5.0 5.5 6.0 6.5 7.0 7.5 8.0
AC Content (%)
Flo
w (
0.0
1 in
)
Are these acceptable
numbers for flow?
13
14

10. Preparing Graphs & Selecting Optimum
8
• Now that an optimum has been selected and checked graphically, there is a need to verify the sensitivity of the mix.
TDOT Specs 407.03, (C), n.
In order to identify critical mixes and make appropriate adjustments, the mix design shall have the required design properties for the bitumen content range of Optimum Asphalt Cement ±0.25%
15
16

10. Preparing Graphs & Selecting Optimum
9
• An AC content versus Air Voids graph that is too steep of a slope should be avoided if possible.
• Otherwise, a slight change in asphalt content could mean a big change in air voids.
Critical Mix Graph
R20.9993 = R20.9993 =
0.0
0.5
1.0
1.5
2.0
2.5
3.0
3.5
4.0
4.5
5.0
5.5
6.0
6.5
7.0
7.5
8.0
8.5
9.0
9.5
3.5 4.0 4.5 5.0 5.5 6.0 6.5 7.0 7.5 8.0
AC (X)
VT
M
(Y
)
Optimum AC = 5.9%
+/- 0.25%
Production Air Void
Range = 3.0 – 5.5%
17
18

10. Preparing Graphs & Selecting Optimum
10
• Are any of the plots outside of the allowable void content for production when 0.25% AC is added or subtracted?
• What could be done to the design to correct it?
Questions?
19
20

11. Testing Mix, Part 2
1
Division of Materials and Tests
Determine the tensile strength of specimens with moisture conditioned specimens and un-conditioned specimens
What is Tensile Strength Ratio Test?
Tensile Strength Ratio (%) = Avg. Wet Tensile Strength
Avg. Dry Tensile StrengthX100
1
2

11. Testing Mix, Part 2
2
Why do we do this?
• TSR indicates the stripping and moisture susceptibility characteristics of the mix.
• TSR can be used to test asphalt mixture:
– the potential for moisture damage,
– effectiveness of anti-stripping additive, and
– optimum anti-stripping dosage rate.
• TSR can be used to test plant produced mixtures
to determine the effectiveness of additives.
How do we do this?
• Prepare six compacted specimens.
• Determine the Gmb and calculate the % air voids
• Verify they are in the acceptable range of 6.0 –8.0 %.
• Record the thickness or height of each specimen.
3
4

11. Testing Mix, Part 2
3
TSR Specimen Fabrication
• Specimens with higher voids (6-8%) are needed for the TSR, which vary from the typical 4%.
• Trial batches will need to be ran to estimate the number of blows needed to achieve specimens within the higher range.
Sample I.D. 15 25 35
Diameter (inches) D 4.0 4.0 4.0
Thickness (inches) t
Dry mass in air A 1145.7 1144.5 1144.2
SSD mass B 1151.9 1148.3 1146.0
Mass in water C 630.4 633.1 636.3
Volume (B-C) E 521.5 515.2 509.7
Bulk Sp. Gr. (A/E) F 2.197 2.221 2.245
Maximum Sp. Gr. G 2.392 2.392 2.392
% Air Void (100((G-F)/G)) H 8.2 7.1 6.2
N/A
For an example, assume that the TSR blow count will be
somewhere between 15 to 35.
This is a good range, which will help
estimate what is needed to get 7%.
TSR Specimen Fabrication
Looks like 25 blows will give us specimens that will
be close to 7% voids.
5
6

11. Testing Mix, Part 2
4
TSR Specimen Fabrication• Specimens with selected number of blows are going to be
the same height as before?
• Specimens for TSR test should be same height (2.5±0.05 in.). If not, material adjustment should be made.
Example
• Initial weight=1200g,
• Measured height=2.6 in.
𝑨𝒅𝒋𝒖𝒔𝒕𝒆𝒅𝑾𝒆𝒊𝒈𝒉𝒕 =𝟐. 𝟓
𝑺𝒆𝒑𝒄𝒊𝒎𝒆𝒏 𝑯𝒆𝒊𝒈𝒉𝒕× 𝑰𝒏𝒊𝒕𝒊𝒂𝒍 𝒘𝒆𝒊𝒈𝒉𝒕
𝑨𝒅𝒋𝒖𝒔𝒕𝒆𝒅𝑾𝒆𝒊𝒈𝒉𝒕 =𝟐. 𝟓
𝟐. 𝟔× 𝟏𝟐𝟎𝟎𝒈 = 𝟏𝟏𝟓𝟒𝒈
How do we do this? (cont’d)• Sort the specimens into two so that average air void
of the two subsets are close to equal.
• Select three to be “wet pills” and the other three will be “dry pills” (unconditioned).
7
8

11. Testing Mix, Part 2
5
How do we do this? (cont’d)
• Saturate the “wet pills” in a container of water by using a vacuum to “pull” water into the specimens for just a few seconds.
• The acceptable saturation range is from 55% to 80 % of the volume of air voids for each specimen.
• If the saturation is less than 55 %, then the vacuum must be reapplied. What if it is greater than 80 %?
How do we do this? (cont’d)
• Place partially saturated “wet pills” in distilled water at 140±1.8°F (60±1.0°C) for 24 hours.
• Meanwhile, the unconditioned “dry pills” sit on a shelf.
Room Temp
Hot
9
10

11. Testing Mix, Part 2
6
How do we do this? (cont’d)
• At the end of the conditioning period of partially saturated “wet pills”, place specimen into water bath for 1 hour at 77±1.8°F (25±1°C).
• “Dry Pills” are also need to be placed in same water bath, but only for 20 minutes.
• Finally, all 6 specimens are tested for tensile strength.
Wet PillsDry Pills
(Note the loading head is different to stability & flow testing)
How do we calculate TSR% Saturation?
• % Saturation = 𝑉𝑜𝑙 𝑜𝑓 𝐴𝑏𝑜𝑠𝑜𝑟𝑏𝑒𝑑 𝑊𝑎𝑡𝑒𝑟
𝑉𝑜𝑙 𝑜𝑓 𝐴𝑖𝑟 𝑉𝑜𝑖𝑑X100
= 𝑆𝑎𝑡𝑢𝑟𝑎𝑡𝑒𝑑 𝑆𝑆𝐷 𝑀𝑎𝑠𝑠−𝐷𝑟𝑦 𝑀𝑎𝑠𝑠
𝑆𝑆𝐷 𝑚𝑎𝑠𝑠−𝐷𝑟𝑦 𝑚𝑎𝑠𝑠 𝑋𝑉𝑜𝑙.𝑜𝑓 𝐴𝑖𝑟 𝑉𝑜𝑖𝑑
100
11
12

11. Testing Mix, Part 2
7
How do we calculate Tensile Strength?
St (psi)=2×𝑀𝑎𝑥𝑖𝑚𝑢𝑚 𝐿𝑜𝑎𝑑 (𝑙𝑏𝑠)
3.14×𝑆𝑝𝑒𝑐𝑖𝑚𝑒𝑛 𝐻𝑒𝑖𝑔ℎ𝑡 𝑖𝑛. ×𝑆𝑝𝑒𝑐𝑖𝑚𝑒𝑛 𝐷𝑖𝑎𝑚𝑒𝑡𝑒𝑟(𝑖𝑛.)
Example
Specimen height 4.06”, Specimen Diameter 4”, Loading at peak point was 2000
How do we calculate TSR?
The Tensile Strength Ratio (TSR) is the ratio of conditioned (wet) strength to unconditioned (dry).
Tensile Strength Ratio (%)= 𝑆𝑡𝑚
𝑆𝑡𝑑X100
Stm = Average conditioned (wet) tensile strength, psi
Std = Average unconditioned (dry) tensile strength, psi
Example
Average conditioned (wet) strength is 181.2 psi. and average conditioned (dry) strength is 195.9 psi. What is the TSR?
TSR = (181.2 / 195.9) x 100 = 92.5%
13
14

11. Testing Mix, Part 2
8
• TSR run for verification of surface and binder mixes.
• Contractor’s Quality Control (TDOT std spec 403.03.D.2)
– If the tensile strength ratio results are not in compliance with the specifications, immediately stop production until mixture adjusts are made.
– TDOT std spec for TSR (TDOT std spec 407.03.E.1)
Why do we do this?• Moisture damage is the result of moisture interaction with
the asphalt binder-aggregate adhesion within a HMA mixture.
• This test is useful as an indicator of the relative susceptibility of asphalt-coated aggregate to water.
• AKA 10 min boiling test
15
16

11. Testing Mix, Part 2
9
How do we do this?
• From a sample of the completed mix, visually select a minimum of 50 grams of the plus No. 4 (4.75 millimeters) material.
• placed in a container of boiling distilled water and boiled for 10 min±15 s.
• pour off water and place coated aggregate on a paper towel.
• The coated aggregate shall not show any evidence of stripping as determined by a visual inspection.
Who run this test?• Test performed by project inspector
This test may be skipped. However, if issues are occurring then it could be useful to have this data.
17
18

11. Testing Mix, Part 2
10
Questions?
19

12. Testing Mix, Part 3
1
Division of Materials and Tests
Why do we do this?
• TDOT’s STANDARD test method for determining the AC Content of either RAP or HMA is T-164-EII, extractions.
• As an alternate method, AASHTO T-308 (Ignition Furnace) may be used, but a comparison to solvent extraction must be performed at least once per month of production.
1
2

12. Testing Mix, Part 3
2
What we need to know about ignition oven.
• Furnace must be calibrated to each different mix. Because each aggregate source has different correction factor.
• Use of the furnace must be backed up monthly with a solvent extraction.
• Test is to be run at 538 ° C unless infrared furnace is used.
• Watch for broken aggregate.
How do we do this?
• Begin by determining the correct sample size for the HMA being tested.
• Please open yellow book Table 1 in Section 6 of AASHTO T-308.
• Split the sample evenly between the two sample baskets.
3
4

12. Testing Mix, Part 3
3
How do we do this?
• Spread the material into a thin, even layer to ensure complete ignition of the binder.
• Stack baskets and lock cover into place.
• Do not forget to record weight of empty basket and material.
How do we do this?• Place the basket/sample
assembly into the furnace.
• Be careful not to let the assembly touch any part of the furnace wall.
• Always recommend to were heat protective glove covering to elbow.
• Enter the sample mass, the testing temperature, and the pre-determined correction factor. Furnace will stop test when AC content is determined.
5
6
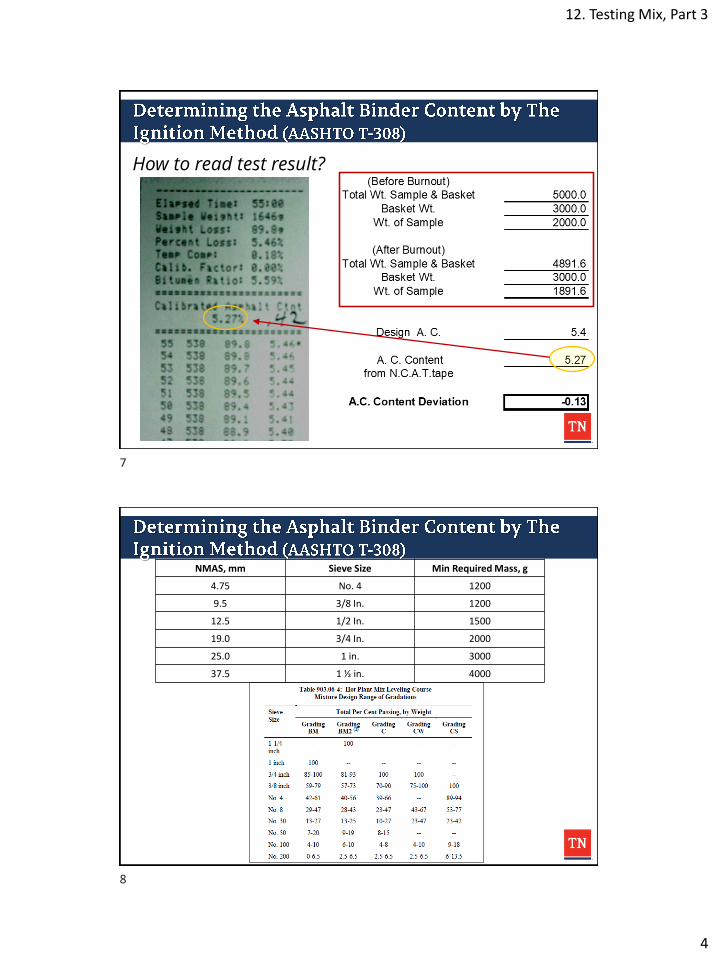
12. Testing Mix, Part 3
4
How to read test result?
NMAS, mm Sieve Size Min Required Mass, g
4.75 No. 4 1200
9.5 3/8 In. 1200
12.5 1/2 In. 1500
19.0 3/4 In. 2000
25.0 1 in. 3000
37.5 1 ½ in. 4000
7
8

12. Testing Mix, Part 3
5
9
10
12. Testing Mix, Part 3
6
Questions?
11

6
Specifications

13. Specification Crash Course
1
Division of Materials and Tests
https://www.tn.gov/tdot/tdot-construction-division/transportation-construction-
division-resources/2021-standard-specifications.html
1
2

13. Specification Crash Course
2
1. Special Provisions
2. Plans
3. Supplemental Specs
4. Standard Specs
1. Special Provisions
2. Plans
3. Supplemental Specs
4. Standard Specs
• Specific Contract Requirements
• Typically modifies a section of the spec book.
• Naming is usually SP###XXX
3
4

13. Specification Crash Course
3
1. Special Provisions
2. Plans
3. Supplemental Specs
4. Standard Specs
e.g. SP411DEN: modifies section 411 density requirements
1. Special Provisions
2. Plans
3. Supplemental Specs
4. Standard Specs
5
6

13. Specification Crash Course
4
1. Special Provisions
2. Plans
3. Supplemental Specs
4. Standard Specs
• Permanent Edits to the Standard Specification
• Has an effective date for when the change is active for all projects let after.
1. Special Provisions
2. Plans
3. Supplemental Specs
4. Standard Specs
7
8

13. Specification Crash Course
5
1. Special Provisions
2. Plans
3. Supplemental Specs
4. Standard Specs
Must use this hand-in-hand with the supplementals
1. Special Provisions
2. Plans
3. Supplemental Specs
4. Standard Specs100 – General/Legal
200 - Subgrades
300 – Base/Sub-base
400 – Flexible Pavements
500 – Rigid Pavements
600 – Structures/Bridges
700 – Signs, guardrail, other stuff
800 – Roadside Development
900 - Materials
9
10

13. Specification Crash Course
6
Standard Specifications
Must use this hand-in-hand with the supplementals
307.03 Composition of Base/Binder Mixtures
407.02 Materials for Mix
407.03(A, B, C, E) Composition of Mix
407.20.C Adjustments (pay)
411.03 Composition of Surface Mixtures
903.06 Aggregate requirements for base
903.11 Aggregate requirements for surface
903.22 Standard Sizes of Processed Aggregate
903.24 Surface Aggregate Requirements
904.01 Asphalt Cement
921.07.B Asphalt Additive
11
12

13. Specification Crash Course
7
Questions?
13

7
Handouts

1) Maximum Specific Gravity of Mix
Gmm = Max Specific Gravity of mix Gb = Gravity of asphalt cement Pmm = Percent by mass of loose mix Ps = Percent (%) Agg. Content Gse = Effective specific gravity of Agg. Pb = Asphalt content % by total mass of mix
2) Volume of Air Voids in Marshall’s
𝑽𝑽𝑽𝑽𝑽𝑽 (𝑽𝑽𝑽𝑽) = 𝟏𝟏𝟏𝟏𝟏𝟏 ×(𝑮𝑮𝑽𝑽𝑽𝑽−𝑮𝑮𝑽𝑽𝑮𝑮)
𝑮𝑮𝑽𝑽𝑽𝑽
Va = Volume of air voids Gmm = Max Specific Gravity of mix Gmb = Bulk gravity of mix
3) Volume of Voids in Mineral Agg.
𝑽𝑽𝑽𝑽𝑽𝑽(𝒆𝒆𝒆𝒆𝒆𝒆. ) = 𝟏𝟏𝟏𝟏𝟏𝟏 − (𝑮𝑮𝑽𝑽𝑮𝑮 × 𝑷𝑷𝑷𝑷)
𝑮𝑮𝑷𝑷𝒆𝒆
Vma = Volume of voids in mineral Agg. Ps = Percent (%) Agg. Content Gse = Effective specific gravity of Agg. Gmb = Bulk gravity of mix
4) Volume of Voids Filled with Asphalt
𝑽𝑽𝒆𝒆𝑽𝑽(𝒆𝒆𝒆𝒆𝒆𝒆. ) = 𝟏𝟏𝟏𝟏𝟏𝟏 ×(𝑽𝑽𝑽𝑽𝑽𝑽− 𝑽𝑽𝑽𝑽)
𝑽𝑽𝑽𝑽𝑽𝑽
Vfa = Voids filled with AC Va = Volume of air voids Vma = Volume of voids in mineral Agg.
5) Effective Asphalt Content by % Mix Mass𝑷𝑷𝑮𝑮𝒆𝒆 = 𝑷𝑷𝑮𝑮 − �𝑷𝑷𝑮𝑮𝑽𝑽𝟏𝟏𝟏𝟏𝟏𝟏� × 𝑷𝑷𝑷𝑷
Pbe = Eff. AC (% by mass of mix) Pba = Absorbed AC (% by mass of Agg.) Pb = % Asphalt Content Ps = % Agg. Content
6) Absorbed Asphalt Content by % Agg.
𝑷𝑷𝑮𝑮𝑽𝑽 = 𝟏𝟏𝟏𝟏𝟏𝟏 ×(𝑮𝑮𝑷𝑷𝒆𝒆 − 𝑮𝑮𝑷𝑷𝑮𝑮)(𝑮𝑮𝑷𝑷𝑮𝑮 − 𝑮𝑮𝑷𝑷𝒆𝒆) × 𝑮𝑮𝑮𝑮
Pba = Absorbed AC (% by mass of Agg.) Gse = Effective specific gravity of Agg. Gb = Gravity of asphalt cement Gsb = Bulk Specific Gravity of Agg.
7) Effective Specific Gravity of Agg.
𝑮𝑮𝑷𝑷𝒆𝒆 =(𝑷𝑷𝑽𝑽𝑽𝑽−𝑷𝑷𝑮𝑮)�𝑷𝑷𝑽𝑽𝑽𝑽𝑮𝑮𝑽𝑽𝑽𝑽−𝑷𝑷𝑮𝑮𝑮𝑮𝑮𝑮�
Gse = Effective specific gravity of Agg. Pb = Asphalt content % by total mass of mix Gmm = Max Specific Gravity of mix Gb = Gravity of AC Pmm = % by mass of loose mix.
8) Blending of Agg. / Proportioning Agg.𝑷𝑷 = 𝑨𝑨𝑽𝑽 + 𝑩𝑩𝑮𝑮 + 𝑪𝑪𝑪𝑪 + ⋯
A,B,C,… = % of Agg.passing a given sieve a,b,c,… = Proportions of Agg. A,B,C,…
9) RAP Blending Calculation
𝑴𝑴(𝒓𝒓𝑽𝑽𝒓𝒓) = (𝑷𝑷(𝒓𝒓𝑽𝑽𝒓𝒓) × 𝑴𝑴(𝑽𝑽𝒕𝒕𝑽𝑽))
M(rap) = Mass of RAP P(rap) = % of RAP in Mix M(tot) = Total mass of Agg. in mix Pb(rap) = % AC contributed by RAP
10) Mass of Virgin Asphalt Needed
𝑴𝑴(𝑽𝑽𝑪𝑪𝒓𝒓𝑮𝑮) = � 𝑴𝑴(𝑽𝑽𝒕𝒕𝑽𝑽)
�𝟏𝟏𝟏𝟏𝟏𝟏−𝑷𝑷𝑮𝑮𝟏𝟏𝟏𝟏𝟏𝟏 �� − ��𝑴𝑴(𝒓𝒓𝑽𝑽𝒓𝒓)×𝑷𝑷𝑮𝑮(𝒓𝒓𝑽𝑽𝒓𝒓)�
𝟏𝟏𝟏𝟏𝟏𝟏� −𝑴𝑴(𝑽𝑽𝒕𝒕𝑽𝑽)
M(acpb) = Mass of Virgin AC M(rap) = Mass of RAP Pb(rap) = % Asphalt Content in RAP Pb = % Asphalt Content M(tot) = Total mass of Agg. in mix
𝑮𝑮𝑽𝑽𝑽𝑽 = 𝑷𝑷𝑽𝑽𝑽𝑽
� 𝑷𝑷𝑷𝑷𝑮𝑮𝑷𝑷𝒆𝒆+𝑷𝑷𝑮𝑮𝑮𝑮𝑮𝑮�
( 100 - Pb(rap) )

Gb
Gmb
Gmm
Gsa
Gsb
Gse
M
MACPb
Magg
Mair
Mb
Mbe
MRAP
Mtot
Mxy
Pb
PbRAP
Pba
Pbe
Piry
Pmm
PRAP
Ps
Px
SSD
Va
Vb
Vba
Vfa
Vma
Vmb
Vmm
Vsb
Vse Volume of Mineral Aggreagte (by Effective Specific Gravity)
Volume of Voids Filled with Asphalt
Saturated Surface Dry
Volume of Air Voids (Percent of total volume)
Volume of Asphalt Binder
ABBREVIATIONS
Volume of Voids in Mineral Aggregate
Bulk Volume of Compacted Mixture
Voidless Volume of Asphalt Mixture (at Theoretical Maximum Gravity)
Volume of Mineral Aggregate (by Bulk Specific Gravity)
Volume of Absorbed Asphalt Binder
Bulk Specific Gravity of an Aggregate (Stone)
Effective Specific Gravity of an Aggregate (Stone)
Total Mass of an Asphalt Mixture
Mass of an Binder at a known Asphalt Content (Pb)
Mass of Aggregate
Mass of Air (Equivalent to zero grams)
Mass of a given aggregate size fraction to the blended pan
Binder Content (Percent by total mass of mixture)
Percent Binder of the RAP
Specific Gravity of an Asphalt Binder
Bulk Specific Gravity of an Asphalt Mixture
Maximum Theoretical Specific Gravity of an Asphalt Mixture (Rice Gravity)
Apparent Specific Gravity of an Aggregate (Stone)
Absorbed Binder Content (Percent by mass of aggregate)
Percent of Aggregate Stockpile contributing to the blend.
Mass of Asphalt Binder
Mass of Effective Asphalt Binder
Mass of RAP material added in the blend.
Total Mass of Aggregate Blend
Effective Binder Content (Percent by total mass of mixture)
Percent Individually Retained on a given sieve "y"
Percent by Mass of Total Loose Mixture (Equivalent to 100%)
Percent of RAP Aggregates contributing to the blend.
Aggregate (Stone) Content (Percent by total mass of mixture)