Investigating the Rutting and Moisture Sensitivity of Warm Asphalt Mix with Varying Contents of...
152
INVESTIGATING THE RUTTING AND MOISTURE SENSITIVITY OF WARM MIX ASPHALT WITH VARYING CONTENTS OF RECYCLED ASPHALT PAVEMENT by Taha Ahmed Hussien Ahmed A thesis submitted in partial fulfillment of the requirements for the Doctor of Philosophy degree in Civil and Environmental Engineering (Transportation) in the Graduate College of The University of Iowa August 2014 Thesis Supervisor: Professor Hosin “David” Lee
Transcript of Investigating the Rutting and Moisture Sensitivity of Warm Asphalt Mix with Varying Contents of...

INVESTIGATING THE RUTTING AND MOISTURE SENSITIVITY OF WARM MIX
ASPHALT WITH VARYING CONTENTS OF RECYCLED ASPHALT PAVEMENT
by
Taha Ahmed Hussien Ahmed
A thesis submitted in partial fulfillment
of the requirements for the Doctor of
Philosophy degree in Civil and Environmental Engineering
(Transportation)
in the Graduate College of
The University of Iowa
August 2014
Thesis Supervisor: Professor Hosin “David” Lee

Copyright by
TAHA AHMED HUSSIEN AHMED
2014
All Rights Reserved

Graduate College
The University of Iowa
Iowa City, Iowa
CERTIFICATE OF APPROVAL
_______________________
PH.D. THESIS
_______________
This is to certify that the Ph.D. thesis of
Taha Ahmed Hussien Ahmed

ii
ACKNOWLEDGMENTS
The author would first like to acknowledge the Korean Institute of Construction
Technology (KICT) and the Mid-America Transportation Center (MATC) for sponsoring
this research project. Also, the author would like to thank the department of Civil and
Environmental Engineering, Public Policy Center and the Petrographic Facilities at the
University of Iowa and the Advanced Asphalt Materials Laboratory at Iowa State
University for providing the laboratory facilities used to conduct the research.
The author wishes to express his gratitude to Dr. Hosin “David” Lee for his support,
advice and assistance during the course of this study. Deepest gratitude is also due to the
members of the Thesis committee, Dr. Paul Hanley, Dr. Wilfrid Nixon, Dr. M. Asghar
Bhatti and Dr. R. Christopher Williams for their knowledge and assistance in the
completion of this research.
The author would like to express his gratitude to Dr. Cheolmin Baek, Korean
Institute of Construction Technology (KICT) for his assistance with this research project
The author would also like to acknowledge the support provided by asphalt paving
contractors LL Pelling Co. in North Liberty Iowa, The Shelly Co. in Lancaster Ohio, and
Valley Paving Inc. in Shakopee Minnesota for supplying research materials and allowing
access to their facilities.
Finally, the author would like to thank Gary Nester, QC/QA Manager at LL Pelling
Co. and the Matthew Wortel, Petrographic Facilities Manager at the University of Iowa for
their assistance with this research project.

iii
ABSTRACT
To evaluate the performance of Warm Mixture Asphalt (WMA) with varying
amounts of recycled asphalt pavement (RAP) in comparison with Hot Mix Asphalt (HMA),
comprehensive laboratory and field evaluations were conducted. Mix designs were
performed for both WMA with a LEADCAP additive and HMA with large amounts of
fractionated RAP materials. Hamburg Wheel Tracking (HWT) test was performed to
evaluate the rutting and moisture susceptibility of both HMA and WMA laboratory
mixtures. HMA mixtures with up to 50% RAP materials by binder replacement exhibited
a better performance than WMA mixtures. However, when RAP materials were increased
to 75% both WMA and HMA mixtures showed a superior performance. When a specially
designed LEADCAP additive for a mixture with a high RAP content called “RAPCAP”
was used, the performance was significantly improved. The existing Asphalt Bond Strength
(ABS) test (AASHTO TP91-11) was modified to better evaluate the adhesion bond
between asphalt binder and aggregate surface. Based on the modified ABS test results, it
was found that the asphalt binder type significantly influenced the adhesion bond.
To evaluate the performance of WMA mixtures in the field, test sections were
constructed in Iowa, Minnesota and Ohio. The test sections were successfully constructed
with less compaction effort than HMA and met the required field densities per each DOT’s
specification. All HMA and WMA mixtures collected from the test sections passed the
HWT and the modified Lottman tests, which indicates high resistance to rutting and
moisture damage. The asphalt binders were then extracted and recovered from the field
samples then re-graded following AASHTO M320 and AASHTO MP19-10. The
recovered asphalt binder grades were found to be higher than the target grades due to the

iv
existence of RAP materials in the mixtures except for asphalt binders extracted from WMA
mixtures produced using “RAPCAP” additive.

v
TABLE OF CONTENTS
LIST OF TABLES ………………………………………………………………..…... viii
LIST OF FIGURES …..................................................................................................... xi
CHAPTER 1 INTRODUCTION .........................................................................................1
1.1. Research Objectives ...........................................................................2 1.2. Scope ..................................................................................................3
CHAPTER 2 LITERATURE REVIEW ..............................................................................5
2.1. Introduction ........................................................................................5 2.2. Rutting in Asphalt Pavement ..............................................................5
2.2.1. Factors Affecting the Rutting Resistance ....................................8 2.2.1.1. Materials Selection .......................................................8 2.2.1.2. Asphalt Mix Type .........................................................9 2.2.1.3. Compaction Effects ....................................................10
2.2.2. Evaluation and Prediction of Rutting ........................................11 2.2.2.1. Static Creep Tests (AASHTO TP9) ............................11 2.2.2.2. Repeated Load Tests ...................................................12 2.2.2.3. Simulative Tests – Laboratory Wheel-Tracking
Devices .......................................................................20 2.3. Moisture Sensitivity in Asphalt Mixtures ........................................22
2.3.1. Asphalt Binder – Aggregate Adhesion Theories ......................23 2.3.1.1. Chemical Adhesion .....................................................23 2.3.1.2. Surface Energy ............................................................24 2.3.1.3. Molecular Orientation .................................................24 2.3.1.4. Mechanical Adhesion .................................................24
2.3.2. Cohesion Theories .....................................................................25 2.3.3. Adhesive Failure versus Cohesion Failure ................................26 2.3.4. Factors Affecting the Moisture Resistance ...............................26
2.3.4.1. Effect of Asphalt Binder Characteristics ....................27 2.3.4.2. Effect of Aggregate Characteristics ............................27 2.3.4.3. Effect of Traffic ..........................................................28 2.3.4.4. Effect of Air Voids .....................................................28 2.3.4.5. Effect of Climate and Construction Weather ..............28
2.3.5. Measuring the Moisture Susceptibility .....................................29 2.3.5.1. Boiling Test (ASTM D3625) ......................................30 2.3.5.2. Static-Immersion Test (AASHTO T182) ...................30 2.3.5.3. Modified Lottman Test (AASHTO T283) ..................31 2.3.5.4. Hamburg Wheel-Tracking (HWT) Test (AASHTO T324) ..............................................................................32
2.3.6. Preventive Actions against Moisture Damage ..........................34 2.3.6.1. Aggregate Selection ....................................................34 2.3.6.2. Reduction of Pavement Permeability .........................34 2.3.6.3. Anti-Strip Additives ....................................................35
2.4. Asphalt Mixtures with Recycled Asphalt Pavement (RAP) ............36 2.4.1. RAP Fractionation Methods ......................................................38
2.4.1.1. Fractionated RAP Method ..........................................38 2.4.1.2. Optimum Fractionated RAP Method ..........................38
2.5. WMA Technologies .........................................................................38

vi
2.5.1. Organic Additives .....................................................................39 2.5.2. Chemical Additives ...................................................................41 2.5.3. Water-Bearing Additives ..........................................................41 2.5.4. Water-Based Additives .............................................................42 2.5.5. Potential Benefits of WMA Technologies ................................43
2.5.5.1. Reduced Fuel Use .......................................................43 2.5.5.2. Late Season (cool weather) Paving .............................44 2.5.5.3. Better Workability and Compaction ...........................44 2.5.5.4. Reduced Plant Emissions of Greenhouse Gases .........44 2.5.5.5. Increased Usage of RAP .............................................44 2.5.5.6. Improved Working Conditions for Plant and
Paving Crew ................................................................45 2.5.6. Mix Design Practices for Warm Mix Asphalt ..........................45
CHAPTER 3 RESEARCH APPROACH ..........................................................................48
3.1. Research Program ............................................................................48 3.1.1. Task One: Primary Laboratory Evaluation ...............................48 3.1.2. Task Two: Secondary Laboratory Evaluation...........................48 3.1.3. Task Three: Primary Field Evaluation ......................................49 3.1.4. Task Four: Secondary Field Evaluation ....................................49
3.2. Performance Tests ............................................................................49 3.2.1. Hamburg Wheel Track (HWT) test (AASHTO T324) .............50 3.2.2. Modified Lottman Test (AASHTO T283) ................................51 3.2.3. Determining the Asphalt Bond Strength (ABS) Using
Adhesion Tester Device (AASHTO TP 91-11 & ASTM D4541) ......................................................................................51
3.2.3.1. Aggregate Sample Preparation for the ABS Test .......53 3.2.3.2. Test Sample Preparation .............................................53 3.2.3.3. Summary of the Evaluated Materials in the ABS
Test .............................................................................55 3.3. Statistical Analysis Techniques ........................................................57 3.4. Pavement Condition Survey Techniques .........................................57
CHAPTER 4 LABORATORY EVALUATIONS’ RESULTS AND ANALYSIS ...........60
4.1. Primary Laboratory Evaluation ........................................................60 4.1.1. Virgin Aggregate & RAP Material Properties ..........................60 4.1.2. Asphalt Binder ..........................................................................67 4.1.3. Mix Design ................................................................................67 4.1.4. Performance Evaluation ............................................................69
4.1.4.1. Hamburg Wheel Track (HWT) Test Results ...............69 4.2. Secondary Laboratory Evaluation ....................................................77
4.2.1. Virgin Aggregate & RAP Material Properties ..........................77 4.2.2. Asphalt Binder Properties .........................................................79 4.2.3. Mix Design ................................................................................80 4.2.4. Performance Evaluation ............................................................81
4.2.5.1. Hamburg Wheel Track Test Results ...........................81 4.2.5.2. Modified Lottman Test Results ...................................81
4.3. Evaluation of the Asphalt Bond Strength (ABS) Test Method ........84
CHAPTER 5 FIELD EVALUATIONS’ RESULTS AND ANALYSIS ...........................90
5.1. State Highway 6 in Iowa City, Iowa ................................................90

vii
5.1.1. Virgin Aggregate, RAP Material and Asphalt Binder Properties of Iowa Test Sections. ..............................................91
5.1.2. Mix Design of Iowa Test Sections ............................................94 5.1.3. Field Compaction and Mat Densities of Iowa Test
Sections .....................................................................................95 5.1.4. Performance Evaluation of Iowa Test Sections ........................96
5.1.4.1. Hamburg Wheel Track Test Results ...........................96 5.1.4.2. Modified Lottman Test Results ...................................97
5.1.5. Assessment of the Iowa Test Sections after Construction and Over Time...........................................................................99
5.2. State Highway TH 169 in Champlin, Minnesota ...........................101 5.2.1. Virgin Aggregate, RAP Material, and Asphalt Binder
Properties of Minnesota Test Sections ....................................102 5.2.2. Mix Design of Minnesota Test Sections .................................102 5.2.3. Field Compaction and Mat Densities of Minnesota Test
Sections ...................................................................................105 5.2.4. Performance Evaluation of Minnesota Test Sections .............106
5.2.4.1. Hamburg Wheel Track Test Results .........................106 5.2.4.2. Modified Lottman Test Results .................................106
5.2.5. Assessment of the Minnesota Test Sections after Construction and Over Time ...................................................108
5.3. State Highway 158 in Lancaster, Ohio ...........................................110 5.3.1. Virgin Aggregate, RAP Materials and Asphalt Binder
Properties of Ohio Test Sections .............................................110 5.3.2. Mix Design Summary of Ohio Test Sections .........................112 5.3.3. Field Compaction and Mat Densities of Ohio Test
Sections ...................................................................................114 5.3.4. Performance Evaluation ..........................................................115
5.3.4.1. Hamburg Wheel Track Test Results of Ohio Test Sections .....................................................................115
5.3.4.2. Modified Lottman Test Results .................................116 5.3.5. Assessment of the Ohio Test Sections after Construction
and Over Time.........................................................................118 5.4. Asphalt Bond Strength (ABS) Evaluation of Extracted Asphalt
Binders ..............................................................................................119 5.4.1. Rheological Properties and Performance Grades of the
Extracted and Recovered Asphalt Binders ..............................120 5.4.2. Asphalt Bond Strength (ABS) Test Results ............................124
CHAPTER 6 SUMMARY OF FINDININGS .................................................................128
6.1. Conclusions ....................................................................................128 6.2. Recommendations for Future Study ...............................................130
REFERENCES ................................................................................................................132

viii
LIST OF TABLES
Table 2.1 Evaluating of Rut Resistance Using RSCH Permanent Shear Strain (13). .......16
Table 2.2 Moisture Susceptibility Tests on Loose Mixtures (22) ......................................29
Table 2.3 Moisture Susceptibility Tests on Compacted Specimens (22) ..........................30
Table 2.4 Potential Benefits of WMA (2) ..........................................................................43
Table 2.5 HMA versus WMA Mix Design Procedure (14) ...............................................46
Table 3.1 Summary of the ABS Test Method Evaluation Study .......................................56
Table 3.2 Summary of the ABS Study of Extracted Asphalt Binder.................................57
Table 3.3 Pavement Condition Index (PCI) Rating Scale .................................................59
Table 4.1 Combined Aggregate Gradation and Mixture Properties with 20% RAP Content. .............................................................................................................62
Table 4.2 Combined Aggregate Gradation and Mixture Properties with 30% RAP Content. .............................................................................................................63
Table 4.3 Combined Aggregate Gradation and Mixture Properties with 40% RAP Content. .............................................................................................................64
Table 4.4 Combined Aggregate Gradation and Mixture Properties with 50% RAP Content. .............................................................................................................65
Table 4.5 Combined Aggregate Gradation and Mixture Properties with 75% RAP Content. .............................................................................................................66
Table 4.6 Mixing and Compaction Temperatures for the Laboratory Evaluated Mixtures. ...........................................................................................................68
Table 4.7 Mix Design Summaries .....................................................................................68
Table 4.8 Hamburg Wheel Test Results for Mixtures Including 20% RAP. .....................71
Table 4.9 Hamburg Wheel Test Results for Mixtures Including 30% RAP. .....................72
Table 4.10 Hamburg Wheel Test Results for Mixtures Including 40% RAP. ...................73
Table 4.11 Hamburg Wheel Test Results for Mixtures Including 50% RAP. ...................74
Table 4.12 Hamburg Wheel Test Results for Mixtures Including 75% RAP. ...................75
Table 4.13 ANOVA Table for HWT SIP Values.................................................................76
Table 4.14 Combined Aggregate Gradation and Mixture Properties with 30% RAP (>5/16”) Content. .............................................................................................78

ix
Table 4.15 Asphalt Binder PG64-28 Test Results (Source: BM&S Co.). .........................79
Table 4.16 Mix design Summary for both HMA and WMA-RAPCAP Mixtures .............80
Table 4.17 Hamburg Wheel Test Results for HMA and WMA-RAPCAP Mixture with 30% RAP. .................................................................................................82
Table 4.18 AASHTO T 283 Test Results for HMA and WMA-RAPCAP with 30% RAP. .................................................................................................................83
Table 4.19 ABS Test Results for Limestone Aggregate Plates. ........................................85
Table 4.20 ANOVA Table for the ABS Values. ..................................................................88
Table 4.21 Summary of t-test Analysis for ABS Data. ......................................................89
Table 5.1 Summary of the Test Sections Properties. .........................................................90
Table 5.2 Combined Aggregate Gradation and Properties for Iowa Test Sections (Source: LL Pelling). .........................................................................................92
Table 5.3 Asphalt Binder PG64-28 Test Results (Source: BM&S Co.). ...........................93
Table 5.4 Mixing and Compaction Temperatures for Iowa Test Sections. ........................94
Table 5.5 Mix Design Summary for Iowa Test Sections (source: LL Pelling). .................94
Table 5.6 Density Data for Iowa HMA Test Section (Source: LL Pelling). ......................96
Table 5.7 Density Data for Iowa WMA Test Section (Source: LL Pelling). ......................96
Table 5.8 Hamburg Wheel Test Results for Iowa Test Sections. ......................................98
Table 5.9 AASHTO T 283 Test Results for Iowa Test Sections. ......................................99
Table 5.10 Combined Aggregate Properties for Minnesota Test Sections. .....................103
Table 5.11 Mixing and Compaction Temperatures for Minnesota Test Sections (Source: MnROAD). ......................................................................................103
Table 5.12 Mix Design Summary Sheet for Minnesota Test Sections (Source: MnROAD). ....................................................................................................104
Table 5.13 Density Data of HMA and WMA mixtures for Minnesota Test Sections .....105
Table 5.14 Hamburg Wheel Test Results for Minnesota Test Sections. .........................107
Table 5.15 AASHTO T 283 Test Results for Minnesota Test Sections. .........................108
Table 5.16 Aggregate Gradation and Properties for Ohio Surface Layer Mixtures (Source: ODOT).............................................................................................111
Table 5.17 Asphalt Binder PG70-22M Test Results (Source: The Shelly Co.). .............112

x
Table 5.18 Density Data of HMA and WMA Test Sections for Surface Layer (ODOT). .........................................................................................................115
Table 5.19 Hamburg Wheel Test Results for Ohio Test Sections. ..................................117
Table 5.20 AASHTO T 283 Test Results for Ohio Test Sections. ..................................118
Table 5.21 Rheological Properties of the Extracted Asphalt Binder from the Iowa HMA Test Section .........................................................................................121
Table 5.22 Rheological Properties of the Extracted Asphalt Binder from the Iowa WMA Test Section ........................................................................................122
Table 5.23 Rheological Properties of the Extracted Asphalt Binder from the Minnesota HMA Test Section .......................................................................122
Table 5.24 Rheological Properties of the Extracted Asphalt Binder from the Minnesota WMA Test Section.......................................................................123
Table 5.25 Rheological Properties of the Extracted Asphalt Binder from the Ohio HMA Test Section .........................................................................................123
Table 5.26 Rheological Properties of the Extracted Asphalt Binder from the Ohio WMA Test Section ........................................................................................124
Table 5.27 ABS Test Results of Extracted Asphalt Binders. ..........................................124
Table 5.28 Summary of All Test Results obtained for Each Test Section ......................127

xi
LIST OF FIGURES
Figure 2.1 Sever Mix Rutting (left), Mix Rutting (middle), and Rutting in the Wheel Path (right) (8). .......................................................................................6
Figure 2.2 Rutting in Subgrade or Base Layer (8). ..............................................................7
Figure 2.3 Corrugation (left) and Shoving (right) in the Asphalt Pavement Surface (8). ......................................................................................................................7
Figure 2.4 Loading Behavior of Aggregate (10). ................................................................8
Figure 2.5 Contrasting Stone Skeletons (10). ......................................................................9
Figure 2.6 SMA Mix Structure versus Dense Graded Mix Structure (10). .......................10
Figure 2.7 Effect of Air Void Content on Estimated ESALs to 15 mm (0.6 in) Rut Depth (10). .......................................................................................................11
Figure 2.8 Typical Creep Stress and Strain Relationships (11). ........................................12
Figure 2.9 Repeated Load Triaxial (RLT) Schematics (13). .............................................13
Figure 2.10 Cumulative Permanent Axial Strain vs. Number of Cycles (13; 14). ............13
Figure 2.11 Superpave Shear Tester (SST) (15). ...............................................................15
Figure 2.12 Typical Repeated Shear at Constant Height (RSCH) Test Data (13). ............16
Figure 2.13 Schematic of a Typical Dynamic Modulus Test (12). ....................................18
Figure 2.14 Superpave Shear Tester, Loading Chamber, Prepared Sample, and Samples after Test (12). .................................................................................20
Figure 2.15 Georgia Loaded Wheel Tester (GLWT) (left), and Asphalt Pavement Analyzer (APA) (right) (16). .........................................................................21
Figure 2.16 Hamburg Wheel Tracking Device (HWTD) (left), and LCPC (French) Wheel Tracker (right) (16). ...........................................................................21
Figure 2.17 Purdue University Laboratory Wheel Tracking Device (PUR Wheel) (left), and one-third scale Model Mobile Load Simulator (MMLS3) (right) (16). ....................................................................................................21
Figure 2.18 Fatigue Cracking Caused by Stripping (18). ..................................................23
Figure 2.19 Effect of Moisture on Resilient Modulus is Reversible (17; 21)....................25
Figure 2.20 Adhesive versus Cohesive Bond Failure based on Asphalt Film Thickness (17). ..............................................................................................26
Figure 2.21 Indirect Tensile Test used for Dry and Conditioned Specimens for AASHTO T283 (24). .....................................................................................32

xii
Figure 2.22 Hamburg Wheel Tracking Device (left) and Specimens Ready for testing (right). ................................................................................................33
Figure 2.23 Dimensions of the Specimen and the Mold. ...................................................33
Figure 2.24 In-place air voids vs. permeability for different nominal maximum aggregate sizes (redrawn from Cooley et al., 2002) (18; 26). .......................35
Figure 2.25 Permeability vs. the lift thickness to NMAS ratio (redrawn from Cooley et al., 2002) (18; 26). .........................................................................35
Figure 2.26 Temperature-Viscosity Behavior of Asphalt Binder Modified with Organic Additive (39). ...................................................................................40
Figure 2.27 Sasobit Pastille (ca 4 mm diameter) & Prill (ca 1 mm diameter) Forms (37). ..................................................................................................................40
Figure 2.28 LEADCAP Warm Mix Asphalt Additive (38). ..............................................40
Figure 2.29 Close-up picture of Advera® (41). .................................................................42
Figure 2.30 Foamed Asphalt Production (43). ...................................................................43
Figure 3.1 Schematic of Pull off Test Method Using a Self-Aligning Tester (46). ...........52
Figure 3.2 PosiTest® Pull-Off Adhesion Tester (46). ........................................................52
Figure 3.3 Pull-out stub for the Asphalt Bond Strength Test (ABS) (all measurements are in mm) (47). .......................................................................55
Figure 3.4 Flexible Pavement Condition Survey Data Sheet (Source: ASTM D6433-09). .......................................................................................................58
Figure 3.5 Pavement Condition Index (PCI), Rating Scale and Suggested Colors According to ASTM D6433-09 .......................................................................59
Figure 4.1 Aggregate Gradation Charts for HMA and WMA Mixtures with LEADCAP .......................................................................................................61
Figure 4.2 Hamburg Wheel Test Results for Mixtures Including 20% RAP. ...................71
Figure 4.3 Hamburg Wheel Test Results for Mixtures Including 30% RAP. ...................72
Figure 4.4 Hamburg Wheel Test Results for Mixtures Including 40% RAP. ...................73
Figure 4.5 Hamburg Wheel Test Results for Mixtures Including 50% RAP. ...................74
Figure 4.6 Hamburg Wheel Test Results for Mixtures Including 75% RAP. ...................75
Figure 4.7 Interaction Plot for HWT Test SIP Values. ......................................................76
Figure 4.8 Aggregate Gradation Chart for HMA and WMA-RAPCAP Mixtures. ...........77

xiii
Figure 4.9 Hamburg Wheel Test Results for HMA and WMA-RAPCAP Mixture with 30% RAP. ................................................................................................82
Figure 4.10 AASHTO T 283 Test Results for HMA and WMA-RAPCAP with 30% RAP. .................................................................................................................83
Figure 4.11 0.8 mm (left), 0.4 mm (middle) and 0.0 mm (right) Pullout Stubs. ...............84
Figure 4.12 ABS Test Results for Limestone Aggregate Plates. .......................................85
Figure 4.13 Asphalt Sample & Aggregate Plate Cross-sectional Cut under the Microscope ....................................................................................................85
Figure 4.14 Samples of Asphalt Film thicknesses Created by Different Pullout Stubs ..............................................................................................................87
Figure 4.15 Test Sample with75% Cohesive Failure. ........................................................87
Figure 4.16 Interaction Plot of the ABS Values. ...............................................................88
Figure 5.1 Iowa Test Sections Location. ...........................................................................91
Figure 5.2 Combined Aggregate Gradation Chart for Iowa Test Sections. .......................93
Figure 5.3 HMA (left), and WMA (right) Emissions during Construction. ......................95
Figure 5.4 Iowa Test Sections after Compaction. ..............................................................95
Figure 5.5 Hamburg Wheel Test Results for Iowa Test Sections. .....................................98
Figure 5.6 AASHTO T 283 Test Results for Iowa Test Sections. .....................................99
Figure 5.7 HMA (Left) and WMA (Right) Conditioned Sets of Iowa Test Sections. .......99
Figure 5.8 Medium Severity Joint Reflection Cracks from Iowa Test Sections. ............100
Figure 5.9 High Severity Reflection Joint Cracks from Iowa Test Sections. ..................100
Figure 5.10 Low Severity Slippage Cracks from Iowa Test Sections. ............................101
Figure 5.11 Minnesota Test Sections Location. ...............................................................101
Figure 5.12 Aggregate Gradation Chart for Minnesota Test Sections (Source: MnROAD). ..................................................................................................103
Figure 5.13 Hamburg Wheel Test Results for Minnesota Test Sections. ........................107
Figure 5.14 AASHTO T 283 Test Results for Minnesota Test Sections. ........................108
Figure 5.15 Medium (left) and High (right) Severity Joint Reflection Cracks from Minnesota Test Sections. .............................................................................109
Figure 5.16 Medium Severity Transverse Cracks from Minnesota Test Sections. .........109

xiv
Figure 5.17 Medium Severity Edge Cracks from Minnesota Test Sections. ...................109
Figure 5.18 Combined Aggregate Gradation Chart for Ohio Surface Layer Mixtures (Source: ODOT). ..........................................................................................111
Figure 5.19 Project Reference Data Sheet for HMA Mixtures of the Surface Layer (Source: ODOT). ..........................................................................................113
Figure 5.20 Project Reference Data Sheet for WMA Mixtures of the Surface Layer (Source: ODOT).............................................................................................114
Figure 5.21 Hamburg Wheel Test Results for Ohio Test Sections. .................................117
Figure 5.22 AASHTO T 283 Test Results for Ohio Test Sections. .................................118
Figure 5.23 HMA (Left) and WMA-LEADCAP (Right) Conditioned Sets of Ohio Mixtures. ......................................................................................................118
Figure 5.24 Sample Pictures for the Pavement Condition of Ohio Test Sections. ..........119
Figure 5.25 ABS Test Results of Extracted Asphalt Binders. .........................................125

1
CHAPTER 1 INTRODUCTION
Hot mix asphalt (HMA) is a generic term that includes many different types of
mixtures of aggregate and asphalt cement (binder). The aggregates and asphalt binder
proportions are determined through a mix design procedure such as the Marshall or
Superpave Mix Design methods. Overall, the goal of determining such proportions is to
establish an HMA mixture that will meet specific performance criteria. In addition, it is
very important to ensure that the asphalt binder would fully coat the aggregates and that
the resulting mixture is workable and compactable. In order to ensure sufficient aggregate
drying and coating, both the asphalt binder and the aggregates are heated to highly elevated
temperatures ranging between 275°F and 350°F (135°C and 176°C). The use of such high
temperatures would lower the viscosity of the asphalt binder which is the main factor
affecting the coating and workability of HMA mixtures.
Recently, new technologies have been introduced to Pavement Industry that allow
producing asphalt mixtures at temperatures 30°F to 100°F (15°C to 50°C) lower than what
is used for HMA. These new technologies are commonly referred to as Warm Mix Asphalt
(WMA). The main goal of WMA is to produce mixtures with similar strength, durability,
and performance characteristics as HMA using substantially reduced production
temperatures (1). Reducing HMA production and placement temperatures will provide
several benefits; including reduced emissions, fumes, odors, and a cooler work
environment. An energy saving from lower production temperatures is evident with the use
of WMA technology (2). Lower production temperatures can also potentially improve
pavement performance by reducing binder aging, which allows for using higher amounts
of recycled asphalt pavement (RAP) without adding any asphalt binder rejuvenators.

2
Some WMA technologies achieve lower mixing and compaction temperatures
through altering the viscosity-temperature relationship of the asphalt binder. However, in
all WMA technologies, the direct measure of mixture coating, workability and
compactability are required to establish the mixing and compaction temperatures (3; 4).
Several research studies reported that WMA may be more susceptible to moisture
damage, which can be attributed to the lower production temperature of WMA resulting in
residual moisture in aggregates (1).
Therefore, a comprehensive laboratory and field experiments must be completed to
investigate the rutting and moisture susceptibility of WMA technology as compared to the
conventional HMA technology. This research evaluates field mixtures from three different
states with varying amounts of recycled asphalt pavements (RAP).
1.1. Research Objectives
The overall objectives of this research study are listed below:
1. To evaluate WMA paving technologies with various contents of RAP to determine
their suitability for use in various applications. This objective was met by
conducting an extensive laboratory experiment to assess the durability (i.e.
resistance to moisture damage, and rutting) of WMA mixtures produced using
different aggregate sources and amounts of RAP materials.
2. To assess the performance of WMA during construction of test sections and over
time. This objective was met through the construction of test sections using the
identified WMA technologies. This effort evaluated the constructability of WMA
mixtures. Field produced mixture was also evaluated in the laboratory for their
resistance to rutting and moisture damage. After the test sections were constructed,

3
their short-term performance was monitored to predict the long-term behavior of
the WMA mixtures.
1.2. Scope
Two laboratory evaluations were performed in this research effort. First laboratory
evaluation included a total of ten mixtures; five HMA as a control mixture and five WMA
mixtures prepared using LEADCAP technology 7-1 (liquid) for comparison. The
laboratory mixtures were designed for a traffic level of 0.3 million ESAL per Iowa DOT
mix design requirements and NCHRP 691 report for WMA mix design. The mixtures used
limestone virgin aggregate and a combination of different percentages of fractionated RAP;
20, 30, 40, 50, and 75% RAP by binder replacement.
After analyzing the results from the first laboratory evaluation, one mix design was
chosen for further laboratory evaluation. The field implementation included two test
sections, one for WMA, and one for HMA in Iowa City, IA in September 2013.
Furthermore, a test section was constructed in Champlin, Minnesota in July 2010,
and another one was constructed in Lancaster, Ohio in September 2013 using LEADCAP
technologies as a part of the field evaluation of WMA technology.
To investigate the impact of WMA technologies on the asphalt mixtures
performance, laboratory testing was conducted to address the following questions:
The impact of warm-mix additives on the resistance of the mixtures to permanent
deformation, or rutting
The impact of warm-mix additives on the resistance of the mixtures to moisture
damage,
The following performance tests were performed in this research study:

4
Performance tests on asphalt mixture
Hamburg Wheel Track test (AASHTO T324)
Modified Lottman test (AASHTO T283)
Performance tests on asphalt binder
Determining the asphalt bond strength (ABS) using adhesion tester device
(AASHTO TP 90-11 & ASTM D4541).

5
CHAPTER 2 LITERATURE REVIEW
2.1. Introduction
Two of the primary failure mechanisms for flexible (asphalt concrete) pavements
are rutting, or permanent deformation, and moisture damage in the surface of the traveled
roadway. Indeed, the concept of creating hot-mix asphalt (HMA) mixes with increased
resistance to permanent deformation was a major driving force behind much of the asphalt-
related research performed by many research institutes. With the introduction of the WMA
technology into the pavement industry, the need to establish more resistant pavements to
those mode of failures became more essential (5).
The use of WMA technology results in less hardening of the asphalt binder, which
reflected in an increasing number of road projects that are built using Warm Mix Asphalt
(WMA) with high reclaimed asphalt pavement (RAP) contents. However, there was no
comprehensive study done to identify the synergistic effects between WMA and high RAP
content which will help understand their interactions and their impacts on rutting under a
moisture condition, and moisture resistance. Therefore, a comprehensive research study is
needed to derive a relationship between fundamental characteristics of WMA and high
RAP for varying contents.
The fundamentals of rutting and moisture failure mechanisms will be discussed in
the following sections.
2.2. Rutting in Asphalt Pavement
Rutting, also known as permanent deformation, can be defined as the accumulation
of small amounts of unrecoverable strains as a result of applied loading to a pavement (6).
Figures 2.1 shows different cases of rutted pavements.

6
Figure 2.1 Sever Mix Rutting (left), Mix Rutting (middle), and Rutting in the Wheel Path
(right) (8).
Rutting occurs when the pavement under traffic loading consolidates and/or there
is a lateral movement of the hot-mix asphalt (HMA). The lateral movement is a shear
failure and generally occurs in the upper portion of the pavement surface. As a result of
rutting, the pavement useful service life is reduced. If the rutting depth is significant, water
may accumulate in the rutted area, which can lead to vehicle hydroplaning and may create
a safety hazard for the traveling public (6; 7). Recently, the potential for rutting has
increased rapidly due to the continuous increase in traffic volumes, and the increase use of
radial tires, which contain higher inflation pressure than other tire types.
Rutting doesn’t only occur due to the permanent deformation in the surface layer,
but it can also happen due to a plastic deformation resulted from over-stressing the base or
the subgrade layer during compaction. Figure 2.2 shows an example for rutting in base or
subgrade layer. Rutting can be classified into four main types:
Mechanical deformation or subgrade displacement of the asphalt pavement,
Plastic deformation of the asphalt mixtures near the pavement surface,
Consolidation or the continued compaction under the action of traffic, and
Surface wear, the actual wearing away of surface particles by traffic.
Determining the mode of failure is important in selecting the right correction to the
asphalt pavement (9).

7
Plastic or permanent deformation is a material failure of the asphalt pavement in
which the mix is displaced from under the tires and typically humps up outside the wheel
tracks. The permanent deformation can happen in the form of shoving or corrugation in the
pavement surface as shown in Figure 2.3. Corrugation is a plastic deformation typified by
ripples. Shoving is an abrupt wave across the pavement surface. The resulted distortion is
usually perpendicular to the traffic direction. Corrugation usually occurs at points where
traffic starts and stops. Shoving occurs in the areas where HMA abuts a rigid object (8; 9).
Figure 2.2 Rutting in Subgrade or Base Layer (8).
Figure 2.3 Corrugation (left) and Shoving (right) in the Asphalt Pavement Surface (8).

8
2.2.1. Factors Affecting the Rutting Resistance
2.2.1.1. Materials Selection
Materials including aggregate and asphalt binder play major role in the potential
for permanent deformation of an asphalt mixture. The rutting resistance of an asphalt mix
depends on the shear resistance of that mix, which comes mainly from aggregate. If the
shear stress created by repeated wheel load applications exceeds the shear strength of the
mix, as shown in Figure 2.4, then permanent deformation or rutting will occur. Thus, good
aggregate properties and gradation increase the shear strength of the asphalt mixture.
Cubical or rough-textured aggregates are more resistant to the shearing action of traffic
than rounded, smooth-textured aggregates, as shown in Figure 2.5. Cubical aggregates also
tend to interlock better, resulting in a more shear resistant mass of material. Additionally,
using higher percentage of coarse aggregate in the aggregate gradation increases the
number of contact points, stone-to-stone contact, in the asphalt mixture, which helps in
reducing pavement rutting (10).
Figure 2.4 Loading Behavior of Aggregate (10).
Similarly, the asphalt binder affects the rut resistance of an asphalt mixtures but not
as significant as aggregate. Mixtures produced with soft binder grade (low in viscosity)
exhibit less rut resistance than those produced using harder binder grade (high in viscosity)

9
at high temperatures. Rutting usually occurs in the early life of pavement, less than 5 years,
when the used binder is still fresh and not aged yet. While the pavement is in service, the
asphalt binder oxidized or aged, and leads to harder or more viscous binder, which
decreases the potential of rutting in this pavement. Also, modified asphalts can provide
higher resistance to rutting at high temperatures than regular asphalts.
Figure 2.5 Contrasting Stone Skeletons (10).
2.2.1.2. Asphalt Mix Type
The asphalt mix type has a significant effect on its resistance to rutting. Increasing
the percentage of coarse aggregate in asphalt mixtures can improve the rutting resistance.
Certain Superpave and Stone Matrix Asphalt (SMA) mixes are designed with high
percentage of coarse aggregates to provide more direct stone-to-stone contact, which
significantly improves the rutting resistance of these mixes. In other mixes such as dense
graded mixes, good rutting resistance can be achieved through compaction. Good
compaction that forces all aggregate particles with high quality rough texture to form better
interlock can produce a dense graded mix with reasonable rutting resistance.
Figure 2.6 illustrates the difference in structure between an SMA mix and a dense
graded asphalt mix. In SMA mixes, the coarse aggregate particles are intended to carry the
load, while the fine aggregate particles are used as a filler. Unlike dense graded mixes,

10
where fine aggregate particles are locked between the coarse aggregate particles, and the
load is carried through the entire uniformly graded mix (10).
Figure 2.6 SMA Mix Structure versus Dense Graded Mix Structure (10).
2.2.1.3. Compaction Effects
Carefully increased compaction effort can improve the rutting resistance of asphalt
mixtures by packing and orienting the aggregate particles into interlocking mass of material
that resists shear deformation. The results from WesTrack study showed that lowering the
air void content due to compaction increased the rutting resistance of most asphalt
pavement sections. Figure 2.7 shows the influence of air void content for the same asphalt
mixture on the predicted number of equivalent single axle loads (ESALs) to a 15 mm (0.6
in.) rut depth. Although reducing the air void contents with compaction can be very
beneficial to rutting resistance, yet the asphalt mix should not be overcompacted to unstable
level. During field compaction, an air void content of 5-6% can be considered as a
reasonable target to achieve good rutting resistance and still can protect the mix from the
instability associated with lower void content (10).

11
Figure 2.7 Effect of Air Void Content on Estimated ESALs to 15 mm (0.6 in) Rut Depth
(10).
2.2.2. Evaluation and Prediction of Rutting
Previous and current research studies related to asphalt permanent deformation are
investigating which test method can most accurately evaluate and/or predict the asphalt
mixture’s potential for rutting. Those methods can be characterized as follow:
2.2.2.1. Static Creep Tests (AASHTO TP9)
In this test, a static load is applied to an asphalt sample then the resulting plastic
strain or deformation is measured. Figure 2.8 showed a typical creep stress and strain
relationships. The creep test can be conducted confined, unconfined, or diametral. The
measured deformation is correlated to the rutting potential, where large number of plastic
deformation shows a higher rutting potential. Creep tests were widely used in the past due
to their simplicity, however their results didn’t accurately correlate with actual in-service
pavement rutting (11; 12).

12
Figure 2.8 Typical Creep Stress and Strain Relationships (11).
2.2.2.2. Repeated Load Tests
During repeated load tests, a repeated load are applied at a specific frequency to an
asphalt test sample for many repetitions, usually until the sample fails, then the sample’s
recoverable and the plastic strains are measured. The test results from repeated load tests
correlate with in-service pavement rutting measurements. The most common used repeated
load tests for evaluating the rutting potential of asphalt mixtures are the flow number test
and the shear repeated load test.
Flow Number Test
During the flow number test, an HMA specimen at a specified temperature is
subject to a repeated haversine axial compressive load pulse (deviator stress) of 0.1 second
loading and 0.9 second of rest time. The FN test can be run with or without a confining
pressure, it is recommended that the test be conducted with a static all around confining
pressure using compressed air to simulate field conditions. The resulting cumulative
permanent axial strain is measured and plotted versus the number of load cycles (13).
The test specimen is a 4-inch diameter by 6-inch high cylindrical sample. The test
is conducted for a certain amount of cycles, usually 12,000 cycles; axial deformations
continuously measured over the middle 4 inches of the sample by two independently

13
monitored linear variable differential transducers (LVDT) placed 180º apart. Also, the
permanent vertical strain in the sample is measured as a function of load cycles using the
Repeated Load Triaxial (RLT) equipment as shown in Figure 2.9. The resulting cumulative
permanent strain can be characterized by the primary, secondary, and tertiary zones, as
shown in Figure 2.10 (11; 13).
Figure 2.9 Repeated Load Triaxial (RLT) Schematics (13).
Figure 2.10 Cumulative Permanent Axial Strain vs. Number of Cycles (13; 14).

14
Under primary flow, there is a decrease in the strain rate with time. Then, with
continuous repeated load application, the next phase is the secondary flow state, which is
characterized by a relatively constant strain rate. The material enters tertiary flow when the
strain rate begins to increase dramatically as the test progresses. Tertiary flow indicates
that the specimen begins to deform significantly and the individual aggregates that make
up the skeleton of the mix move past each other. The point or cycle number at which pure
plastic shear deformation occurs is referred to as the “flow number”. Flow number is based
on the initiation of tertiary flow or the minimum point of the strain rate curve as shown in
Figure 2.10 (3; 11; 13; 14).
The classic power-law model, mathematically expressed by Equation 1, is typically
used to analyze the test results:
𝜀𝑝 = 𝑎𝑁𝑏 Eq. 1
where, 𝜀𝑝 is the plastic/permanent strain, N is the number of load
repetitions/cycles, and a and b are the regression constants. Only the secondary stage can
be mathematically modeled because of the constant strain rate.
Shear Repeated Load Test
The Superpave Shear Tester (SST), as shown in Figure 2.11, is used to perform the
repeated load test in shear or what is called the “Repeated Shear at Constant Height (RSCH)
Test”. Two main mechanisms were assumed in the development of RSCH test. First
mechanism is related to the asphalt binder modulus: stiffer binders increase the mixture
resistance to rutting because they minimize shear strains in the aggregate skeleton under
each load cycle. The rate of accumulation of permanent deformation is strongly related to
the magnitude of the shear strains.

15
The second mechanism is related to the aggregate structure stability: the axial
stresses create a confining pressure which help to stabilize the mixture. A well-compacted
mixture with a strong aggregate structure will develop high axial forces at very low shear
strain levels. Poorly compacted mixtures can also generate similar levels of axial stresses,
but they will require much higher shear strain (12; 15).
During the repeated shear test, those two mechanisms are free to fully develop their
relative contribution to the resistance of rutting, because they are not constrained by
imposed axial or confining stresses.
Figure 2.11 Superpave Shear Tester (SST) (15).
Figure 2.12 shows how the amount of permanent shear deformation accumulates
with increasing load repetitions (11; 15). The development of permanent shear strain with
applied repeated load is similar to the FN test. The specimen deforms quite rapidly during
the first stage, the first several hundreds of load cycles. The rate of unrecoverable
deformation per cycle decreases and becomes quite steady for many cycles in the secondary

16
stage. At some number of loading cycles, the deformation begins to accelerate
dramatically, leading towards failure in the tertiary stage of the curve (11; 15).
The results from the RSHC test showed very good coloration with the in-service
pavement rutting. Asphalt Institute set up criteria, as shown in Table 1, for interpreting
RSCH maximum permanent shear strain (13).
Figure 2.12 Typical Repeated Shear at Constant Height (RSCH) Test Data (13).
Table 2.1 Evaluating of Rut Resistance Using RSCH Permanent Shear Strain (13). RSCH Maximum Permanent Shear Strain, % Rut Resistance
< 1.0 Excellent
1.0 to < 2.0 Good
2.0 to < 3.0 Fair
> 3.0 Poor
Dynamic Modulus Test (AASHTO TP79)
Dynamic Modulus, also known as |E*|, can also be an indicator of the deformation
characteristics of the asphalt mix. The dynamic modulus consists of two main components:
the elastic or storage modulus, and the viscous or loss modulus. On the test, a haversine
axial compressive stress is applied to a specimen at a given temperature and loading
frequency. The test is conducted at a range of frequencies, usually at 25, 10, 5, 0.5, 0.1 Hz,

17
and at a range of temperatures, usually at 40, 70, 100, and 130F (4.4°C, 21.1°C, 37.8°C
and 54°C, respectively). The applied stress and the resulting recoverable and permanent
axial strain responses of the specimen are measured and used to calculate the dynamic
modulus (14).
Dynamic modulus tests differ from the repeated load tests in their loading cycles
and frequencies. While repeated load tests apply the same load several thousand times at
the same frequency, dynamic modulus tests apply a load over a range of frequencies. The
dynamic modulus test is more difficult to perform than the repeated load test since a much
more accurate deformation measuring system is needed (12).
The dynamic modulus test measures a specimen’s stress-strain relationship under a
continuous sinusoidal loading. For linear (stress-strain ratio is independent of the loading
stress applied) viscoelastic materials this relationship is defined by a complex number
called the “complex modulus” (E*) (15) as seen in Equation 2:
Dynamic Modulus,𝐸∗ = |𝐸∗| cos 𝜑 + 𝑖|𝐸∗| sin 𝜑 Eq. 2
where,
|𝐸∗|= Complex/Dynamic modulus,
𝜑 = Phase/Lag angle by which 𝜀0 lags behind 𝜎0, for pure elastic material 𝜑 = 0°, and for
pure viscous material 𝜑 = 90°, and
𝑖= imaginary number.
The absolute value of the complex modulus, |E*|, is defined as the dynamic modulus and
is calculated as shown in Equation 3:
Dynamic Modulus, |𝐸∗| =𝜎0
𝜀0 Eq. 3
where,

18
𝜎0= peak stress amplitude, and
𝜀0= peak recoverable axial strain amplitude.
The dynamic modulus test can be advantageous because it can also measure a
specimen’s phase angle (φ), which is the lag between peak stress and peak recoverable
strain. The complex modulus, E*, is actually the summation of two components: 1) the
storage or elastic modulus component and 2) the loss or viscous modulus. It is an indicator
of the viscous properties of the material being evaluated (12; 15). Figure 2.13 shows a
schematic of a typical dynamic modulus test.
Figure 2.13 Schematic of a Typical Dynamic Modulus Test (12).
The dynamic modulus tests can be conducted confined and unconfined. The
unconfined test mode doesn’t measure the phase angle. Thus, it is recommended to use the
confined test mode to run the dynamic modulus test for permanent deformation evaluation
purposes.
Shear Dynamic Modulus (AASHTO T7)

19
The shear dynamic modulus test, also is known as the frequency sweep at constant
height (FSCH) test, uses the same mathematical concepts as those used by dynamic
modulus. Similarly, the term E* is replace by G* to denote shear dynamic modulus and 𝜎0
and 𝜀0 are replaced by 𝜏0 and 𝛾0 to denote shear stress and axial strain respectively (12;
15). The shear dynamic modulus can be done by using weather the Superpave Shear Tester
(SST) apparatus or by using Field Shear Tester (FST).
The SST FSCH is done in a constant strain mode. On the SST FSCH test, the sample
is prepared with a diameter of 150 mm, and a height of 50 mm, then glued to two plates
and inserted to the SST apparatus. A horizontal strain is applied to the sample at a range of
frequencies, usually from 10 to 0.1 HZ using a haversine load. The sample’s height is kept
constant throughout the test by compressing or pulling it vertically as needed. The SST
FSCH test is highly sophisticated and needs highly trained operators, which makes it
impractical and expensive to run.
The FST FSCH is done in a constant stress mode. The FST FSCH test is a simpler,
less expensive, and less complicated version of the SST FSCH test. Unlike the SST FSCH
test, the samples height during the FST FSCH is kept constant by using rigid spacers
attached to the specimen ends, and shears the sample in the diametral plane. Figure 2.14
shows pictures of the SST apparatus and the samples before and after the test.

20
Figure 2.14 Superpave Shear Tester, Loading Chamber, Prepared Sample, and Samples
after Test (12).
2.2.2.3. Simulative Tests – Laboratory Wheel-Tracking Devices
Recently, laboratory wheel tracking device become more popular among the U.S.
transportation agencies. The wheel tracking devices provide reasonable correlated results
to the in-service pavement rutting. Wheel tracking devices try to simulate the actual rutting
development in the pavement by rolling a small loaded wheel device repeatedly across a
prepared asphalt samples, and measure the resulted rut depth. Some newly developed
wheel tracking devices can capture the moisture susceptibility effect of the tested samples
in addition to measuring the rut depth.
Several laboratory wheel tracking devices currently are being used in the U.S. the
most current laboratory wheel tracking devices used in the U.S. include the Georgia Loaded
Wheel Tester (GLWT), Asphalt Pavement Analyzer (APA), Hamburg Wheel Tracking
Device (HWTD), LCPC (French) Wheel Tracker, Purdue University Laboratory Wheel
Tracking Device (PURWheel), and one-third scale Model Mobile Load Simulator
(MMLS3). Figures 2.15 through 2.17 show pictures of these devices (16).

21
Figure 2.15 Georgia Loaded Wheel Tester (GLWT) (left), and Asphalt Pavement
Analyzer (APA) (right) (16).
Figure 2.16 Hamburg Wheel Tracking Device (HWTD) (left), and LCPC (French) Wheel
Tracker (right) (16).
Figure 2.17 Purdue University Laboratory Wheel Tracking Device (PUR Wheel) (left),
and one-third scale Model Mobile Load Simulator (MMLS3) (right) (16).

22
Cooley et al, 2000 (12; 16) reviewed U.S. loaded wheel testers and found:
Taking the pavement location temperature and environmental conditions into
consideration when running the test can provide results that correlate reasonably
well to actual field performance.
Wheel tracking devices can be used to evaluate the influence the effect of asphalt
binder type on the rutting resistance of the asphalt pavement.
Devices with the capability of running tests in air or in submerged mode can
provide the user with more pavement evaluation options.
Generally, wheel tracking devices results are affected by the test parameters such
as load, number of wheel passes, temperature, or presence of moisture. The users should
identify the test parameters that match their pavement condition.
2.3. Moisture Sensitivity in Asphalt Mixtures
Moisture damage can be defined as the loss of strength and durability of asphalt
mixtures due to the effects of moisture (17). The lake of enough bond strength between the
asphalt binder and the fine aggregate in the asphalt mixture can lead to moisture damage.
Moisture damage is the result of moisture interaction with the asphalt binder-aggregate
adhesion within the asphalt mixture, making it more susceptible to moisture during cyclic
loading (17; 18). This weakening, if severe enough, can result in stripping as shown in
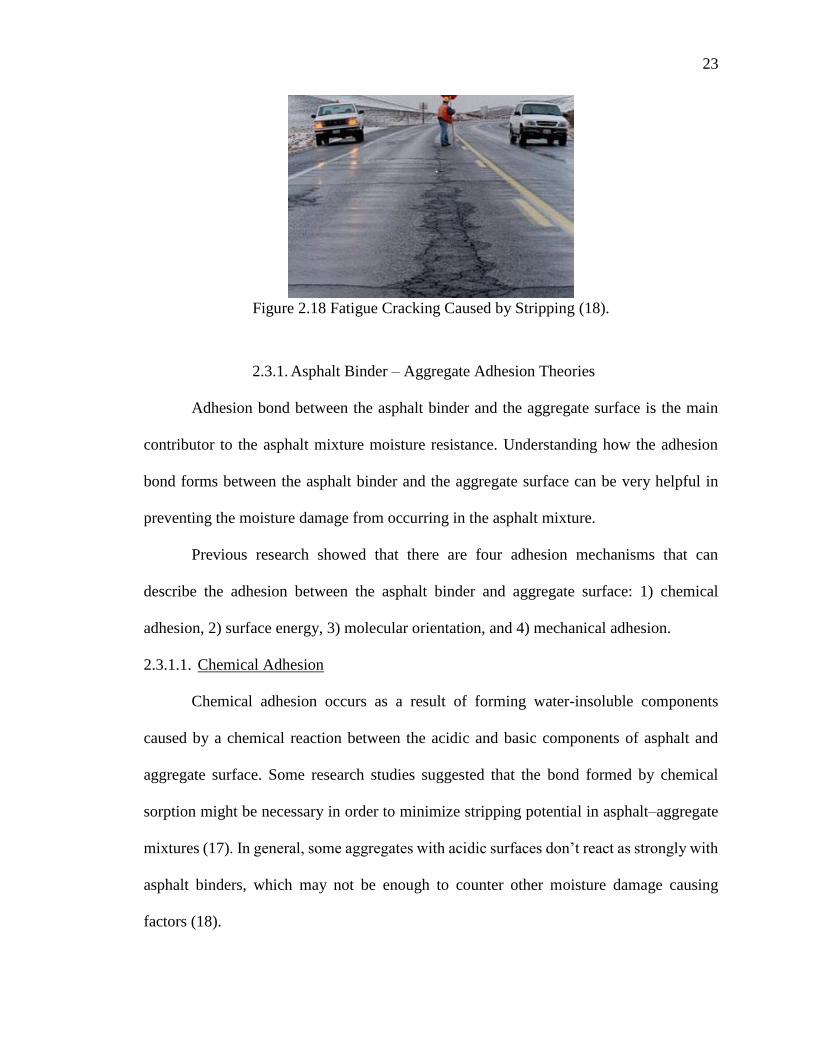
Figure 2.18 (18).
23
Figure 2.18 Fatigue Cracking Caused by Stripping (18).
2.3.1. Asphalt Binder – Aggregate Adhesion Theories
Adhesion bond between the asphalt binder and the aggregate surface is the main
contributor to the asphalt mixture moisture resistance. Understanding how the adhesion
bond forms between the asphalt binder and the aggregate surface can be very helpful in
preventing the moisture damage from occurring in the asphalt mixture.
Previous research showed that there are four adhesion mechanisms that can
describe the adhesion between the asphalt binder and aggregate surface: 1) chemical
adhesion, 2) surface energy, 3) molecular orientation, and 4) mechanical adhesion.
2.3.1.1. Chemical Adhesion
Chemical adhesion occurs as a result of forming water-insoluble components
caused by a chemical reaction between the acidic and basic components of asphalt and
aggregate surface. Some research studies suggested that the bond formed by chemical
sorption might be necessary in order to minimize stripping potential in asphalt–aggregate
mixtures (17). In general, some aggregates with acidic surfaces don’t react as strongly with
asphalt binders, which may not be enough to counter other moisture damage causing
factors (18).

24
2.3.1.2. Surface Energy
Surface energy can be explained in terms of relative wettability of aggregate surface
by water or asphalt. The surface tension between the asphalt binder and the aggregate at
the wetting line is less than the surface tension between the water and the aggregate due to
its higher viscosity. Thus, if all the three are in contact (water, aggregate, and asphalt
binder), water more likely replaces asphalt binder. This will result in less aggregate coating
by asphalt binder and eventual striping. The interfacial tension between aggregate and
asphalt binder depends on the asphalt type, aggregate type, and the aggregate surface
roughness (17; 18).
2.3.1.3. Molecular Orientation
The molecular orientation or the structure of asphalt molecules at the aggregate-
asphalt surface is related to the surface energy of the asphalt binder. When the asphalt
molecules contacts the aggregate surface, they tend to be oriented relatively to the ions on
the aggregate surface, which can cause a weak attraction between the asphalt binder and
the aggregate surface. If the water molecules, which are dipolar, are more polar than the
asphalt binder molecules, they might be able to satisfy the aggregate surface energy and
lead to weak asphalt-aggregate bond ends up with stripping (17; 18).
2.3.1.4. Mechanical Adhesion
Mechanical adhesion depends on the physical properties of the aggregate such as
surface texture, porosity or absorption, surface coatings, surface area, and particle size (17).
Asphalt binder gets into the aggregate surface pores and irregularities, and when it hardens
it causes a mechanical lock. When moisture interferes with the asphalt binder penetration
that can reduce the mechanical lock and lead to stripping (18). Good mechanical lock can

25
improve the nature of the chemical bond between the asphalt binder and aggregate surface
even in the presence of water (17).
2.3.2. Cohesion Theories
Cohesion is developed in the asphalt mastic, asphalt binder mixed with fine
aggregate, and depends on the rheological properties of the asphalt binder. The mastic’s
resistance to microcrack development is highly influenced by the dispersion of the mineral
filler. Therefore, it can be inferred that the cohesive strength is controlled by the
combination and the interaction of asphalt binder and the mineral filler (17; 19). Water can
affect the cohesion of asphalt mastic in several ways such as, weakening the mastic due to
water saturation and void swelling (20).
Schmidt and Graf, 1972 (17; 21), showed that an asphalt mixture will lose about 50
percent of its modulus upon saturation. The loss may continue with time, but upon drying,
the modulus can be completely recovered. This is shown graphically in Figure 2.19.
Figure 2.19 Effect of Moisture on Resilient Modulus is Reversible (17; 21).

26
2.3.3. Adhesive Failure versus Cohesion Failure
The moisture damage in asphalt mixture can be due to a cohesion failure within the
mastic, or due adhesion failure at the aggregate-asphalt binder or mastic interface. Both
failure modes can be related to the nature of the asphalt mastic and the asphalt binder film
thickness around aggregate particles. Thus, it can be said that asphalt mixtures with thin
asphalt film tends to fail in tension by adhesive bond rupture, while asphalt mixture with
thicker asphalt film thickness tends to fail in a cohesive failure mode due to the damage
within mastic. The determination of asphalt film thickness that differentiate the two modes
of failure depends on the rheological properties of the used asphalt binder, the amount of
damage the asphalt or mastic can withstand prior to failure, the rate of loading, and the
temperature at the time of testing (17; 19). Figure 2.20 shows adhesive versus cohesive
bond failure based on asphalt film thickness (17).
Figure 2.20 Adhesive versus Cohesive Bond Failure based on Asphalt Film Thickness
(17).
2.3.4. Factors Affecting the Moisture Resistance
Moisture damage is a complex phenomenon, that can’t be attributed to one single
failure mechanism, rather it is caused by combination of the previously discussed

27
mechanisms. It can be said that any factor that increases the moisture content in the asphalt
mixture, or reduces the adhesion between the asphalt binder and the aggregate surface, can
increase the moisture susceptibility of that mixture. Some of the factors that is found to
have a great influence on the moisture susceptibility of the asphalt mixtures are discussed
in the following section, however none of these factors is proven to be alone the cause of
moisture damage in asphalt mixtures (18).
2.3.4.1. Effect of Asphalt Binder Characteristics
The rheological properties of asphalt binder are important factor in shaping the
moisture sensitivity of the asphalt mixture. For example, high viscosity can indicate a high
concentrations of large polar molecules, or asphaltenes, which can create greater adhesion
tension and molecular orientation adhesion. On the other hand low viscosity indicates a
low concentration of asphaltenes, which results in higher potential of stripping. Similarly,
other asphalt binder components such as sulfoxides, carboxylic acids, phenols and nitrogen
bases can influence the moisture susceptibility of asphalt mixtures (17; 18).
2.3.4.2. Effect of Aggregate Characteristics
Generally, acidic aggregates are considered hydrophobic, repulse water, while
basic aggregates are hydrophilic, attract water (22). However, it can’t be said that all
hydrophobic aggregates are completely resistance to stripping. Other aggregate properties
such as surface chemistry and aggregate porosity and pore size also influence the moisture
susceptibility of asphalt mixtures. Aggregate surfaces with more acidic chemical nature
tend to form asphalt binder-aggregate bond slower than other aggregates. The presence of
some chemical elements in the aggregate surface such as iron, magnesium, calcium and
perhaps aluminum are considered beneficial, while sodium and potassium are considered

28
harmful (18). Aggregate surfaces with large pores size can increase stripping susceptibility.
High porosity leads to high asphalt binder absorption and less available asphalt binder for
coating. If high porosity is ignored during the mix design it can lead to thin asphalt binder
film and less coating, which can cause faster aging and stripping (17; 18; 20; 22).
2.3.4.3. Effect of Traffic
Continuous increase of traffic loading in the presence of water in the asphalt
pavement structure can increase the moisture damage. When the water is trapped in the
aggregate pores, the traffic loads will compress the pores and create a buildup pressure.
The resulted buildup pressure could remove the asphalt binder from the aggregate surface
and lead to stripping. Additionally, the traffic passes tend to move the water in the asphalt
pavement surface, which causes a hydraulic scouring action. Hydraulic scouring could
contribute to the removal of the asphalt binder from aggregate surface (18; 22).
2.3.4.4. Effect of Air Voids
Air void adjustment is very important aspect in mix design, which indirectly affect
the moisture susceptibility of the asphalt mixture. This aspect can be adjusted in the
laboratory by selecting the correct asphalt content. Lake of enough field compaction can
cause a high undesirable air voids content. Asphalt mixtures with high volume of air voids
(usually 8.0% or greater) provide more space for asphalt binder or water molecules to
penetrate into the pavement surface. This can cause higher absorption and lake of enough
coating problems in case of asphalt binder and pore pressure and ice expansion problems
in case of entrapped water (18; 22).
2.3.4.5. Effect of Climate and Construction Weather

29
Cool weather during construction can prevent enough compaction, which leads to
higher air voids, and relatively permeable pavement. This can increase the potential of
moisture damage in the asphalt pavement. Similarly the wet climate, freeze-thaw cycles,
and temperature overbalancing can allow more moisture in the asphalt pavement, which
also can increase probability of moisture damage Incidence (17; 18; 22).
2.3.5. Measuring the Moisture Susceptibility
The test methods used to evaluate the moisture susceptibility of asphalt mixtures
can be dived into two main types: tests to be done on loose mixtures (refer to Table 2.2)
and tests to be done on compacted specimens (refer to Table 2.3) (22).
Table 2.2 Moisture Susceptibility Tests on Loose Mixtures (22) Test ASTM AASHTO Other
Methylene Blue Technical Bulletin 145, International Slurry Seal
Association
Film Stripping (California Test 302)
Static Immersion D1664* T182
Dynamic Immersion
Chemical Immersion Standard Method TMH1 (Road Research Laboratory 1986,
England)
Surface Reaction Ford et al. (1974)
Quick Bottle Virginia Highway and Transportation Research Council
(Maupin 1980)
Boiling Test D3625 Tex 530-C Kennedy et al. 1984
Rolling Bottle Isacsson and Jorgensen, Sweden, 1987
Net Adsorption SHRP A-341 (Curtis et al. 1993)
Surface Energy Thelen 1958, HRB Bulletin 192 Cheng et al., AAPT 2002
Pneumatic Pull-off Youtcheff and Aurilio (1997)
* No longer available as ASTM standard.
30
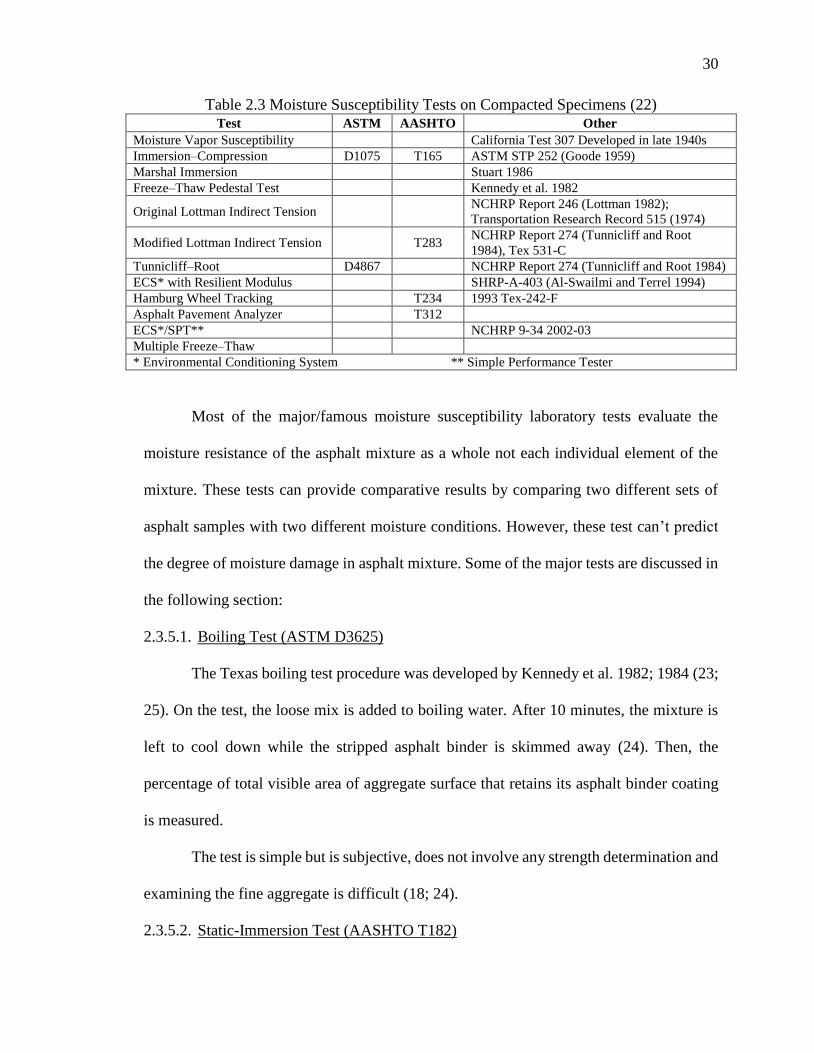
Table 2.3 Moisture Susceptibility Tests on Compacted Specimens (22) Test ASTM AASHTO Other
Moisture Vapor Susceptibility California Test 307 Developed in late 1940s
Immersion–Compression D1075 T165 ASTM STP 252 (Goode 1959)
Marshal Immersion Stuart 1986
Freeze–Thaw Pedestal Test Kennedy et al. 1982
Original Lottman Indirect Tension NCHRP Report 246 (Lottman 1982);
Transportation Research Record 515 (1974)
Modified Lottman Indirect Tension T283 NCHRP Report 274 (Tunnicliff and Root
1984), Tex 531-C
Tunnicliff–Root D4867 NCHRP Report 274 (Tunnicliff and Root 1984)
ECS* with Resilient Modulus SHRP-A-403 (Al-Swailmi and Terrel 1994)
Hamburg Wheel Tracking T234 1993 Tex-242-F
Asphalt Pavement Analyzer T312
ECS*/SPT** NCHRP 9-34 2002-03
Multiple Freeze–Thaw
* Environmental Conditioning System ** Simple Performance Tester
Most of the major/famous moisture susceptibility laboratory tests evaluate the
moisture resistance of the asphalt mixture as a whole not each individual element of the
mixture. These tests can provide comparative results by comparing two different sets of
asphalt samples with two different moisture conditions. However, these test can’t predict
the degree of moisture damage in asphalt mixture. Some of the major tests are discussed in
the following section:
2.3.5.1. Boiling Test (ASTM D3625)
The Texas boiling test procedure was developed by Kennedy et al. 1982; 1984 (23;
25). On the test, the loose mix is added to boiling water. After 10 minutes, the mixture is
left to cool down while the stripped asphalt binder is skimmed away (24). Then, the
percentage of total visible area of aggregate surface that retains its asphalt binder coating
is measured.
The test is simple but is subjective, does not involve any strength determination and
examining the fine aggregate is difficult (18; 24).
2.3.5.2. Static-Immersion Test (AASHTO T182)

31
During the test the loose mixture is cured for 2 hours at 60° C then cooled down to
room temperature. Then, the sample should be immersed in a glass jar filled with 600 mL
of distilled water and kept undisturbed for 16 to 18 hours. A visual observation should be
made through the glass to determine the percentage of total visible area of aggregate surface
that retains its asphalt binder coating.
Solaimanian et al., 2003, (24) stated that “…..the total visible area of the aggregate
is estimated as either less than or greater than 95%. This is a major limitation of the test
because the results are decided purely on the basis of a subjective estimate of less than or
greater than 95%. Test results have indicated that placing samples at 60° C bath rather than
25° C for 18 hours increases the amount of stripping”.
This test is simple but subjective and does not involve any strength determination
(18; 24).
2.3.5.3. Modified Lottman Test (AASHTO T283)
The AASHTO T 283 test procedure is used to evaluate the resistance of the asphalt
mixture to moisture damage. The test is conducted on dry and wet conditioned specimens
measuring 4 inches (100 mm) in diameter and 2.56 inches (65.0 mm) in height. The
specimens are loaded until failure at a rate of 2 inches per minute (50.8 mm per minute).
Two types of data are obtained from this test. The first is the indirect tensile strength (ITS)
of the dry and wet conditioned specimens. The second is the tensile strength ratio (TSR),
calculated by dividing the average ITS values of the wet conditioned specimens by the
average ITS values of the dry conditioned specimens (refer to Figure 2.21). The ITS value
is a measure of the strength and durability of the asphalt mixture, whereas the TSR ratio is
a measure of its resistance to damage from freezing and thawing.

32
Figure 2.21 Indirect Tensile Test used for Dry and Conditioned Specimens for AASHTO
T283 (24).
Although it is expected that the water conditioned samples will have a lower tensile
strength, excessively low values indicate the potential for moisture damage (14; 18; 24).
2.3.5.4. Hamburg Wheel-Tracking (HWT) Test (AASHTO T324)
The Hamburg Wheel Tracking device applies a constant load of 685 N through a
steel wheel with a diameter of 203.5 mm and a width of 47.0 mm. The tests are run in a
water bath that is heated to 50 °C after the test specimens are conditioned for 30 minutes.
Figure 2.22 shows the Hamburg Wheel Tracking device and specimens ready for testing.
The test is completed when the wheel has passed over the specimens 20,000 times for 6.5
hours or when the rut depth exceeds 20 mm.
The Hamburg Wheel Tracking Device measures rut depth throughout the test and
reports four properties: 1) post-compaction consolidation, 2) creep slope, 3) stripping
inflection point, and 4) stripping slope. The post-compaction consolidation occurs at
around 1,000 wheel passes that is normally caused by the densification of the mixture. The
creep slope is used to measure the rutting susceptibility of the mixture that measures the
permanent deformation caused by the wheel passes. The stripping inflection point and the
stripping slope are used to measure damaged caused by moisture. A mixture with a

33
stripping inflection point less than 10,000 passes should be considered as moisture
susceptible.
The specimens had a target air void content of 7.0 ± 2.0 %. Specimens were
compacted with a height of 60 mm to fit the mold for the Hamburg Wheel Tracking device.
7.5 mm of material was removed from one side of the specimen so that they fit together in
the specimen tray. Figure 2.23 shows the dimensions of the specimen and the mold.
Figure 2.22 Hamburg Wheel Tracking Device (left) and Specimens Ready for testing
(right).
Figure 2.23 Dimensions of the Specimen and the Mold.

34
Most of the moisture susceptibility tests tend to lake good repeatability and
reproducibility of test results. Additionally, small variations in any mix design parameters
such as air voids, can substantially influence the test results (18).
2.3.6. Preventive Actions against Moisture Damage
There are several preventive actions that can be taken to prevent or at least reduce
the moisture damage of the asphalt mixture. Some of the available preventive actions or
technics include material selection, construction practices, mix design, or asphalt mixture
additives. Some of the available actions are discussed below;
2.3.6.1. Aggregate Selection
During the design of asphalt mix, the selection of low porosity aggregates with
clean surfaces and rough texture is highly recommended.
2.3.6.2. Reduction of Pavement Permeability
As mentioned before, the adjustment of asphalt pavement in place air voids can
help in the reduction of pavement permeability, which reduces the impact of moisture
penetration and the asphalt pavement surface. This can be achieved during construction by
providing enough compaction to achieve good level of air voids, usually 5.0 to 6.0 % (refer
to Figure 2.24) (18; 26). Also, lift Thickness, and aggregate gradation can influence the
permeability of the asphalt pavement layer (refer to Figure 2.25) (18; 26). Moreover, the
preventive maintenance practices such as slurry seal, chip seal, or surface wearing course
can waterproof the asphalt pavement surface and then reduce the penetration of water
molecules into the surface.

35
Figure 2.24 In-place air voids vs. permeability for different nominal maximum aggregate
sizes (redrawn from Cooley et al., 2002) (18; 26).
Figure 2.25 Permeability vs. the lift thickness to NMAS ratio (redrawn from Cooley et
al., 2002) (18; 26).
2.3.6.3. Anti-Strip Additives
In many cases the addition of an additive is recommend to prevent or reduce the
moisture damage potential of the asphalt mixtures. The most common used anti-strip
additives include chemicals or hydrated lime.

36
Chemicals: They basically reduce the surface tension in the asphalt binder as well
as impart an opposite electrical charge to the aggregate surface’s electrical charge, which
allows for better wetting or coating. Most of the available chemicals are added to the
asphalt binder at a rate of 0.1 to 1.0 % by weight. The recommended practice by the anti-
strip additive manufacture should be carefully followed to guarantee that all the additive
reaches the critical asphalt binder-aggregate interface (18).
Hydrated Lime: When hydrated lime is added to the aggregate surface, it replaces
the negative ions on the aggregate surface with positive calcium ions, which promotes for
better asphalt binder-aggregate adhesion. Moreover, hydrated lime reacts with both asphalt
binder molecules (carboxylic acid) and aggregate molecules (acidic OH groups). This
reaction results in more readily absorbed molecules on the aggregate surface and less likely
to associate with water molecules. Generally, hydrated lime is added to the aggregate at a
rate from 0.5 to 1.5 % by dry weight of aggregate. In order to active the hydrated lime, a
small percentage of moisture should be existed at the time of addition (18). The national
lime association recommends several methods that can be used to add hydrated lime to the
aggregate such as dry injection into drum mixers, dry lime on damp aggregate method, or
slurry method (27).
2.4. Asphalt Mixtures with
Recycled Asphalt Pavement (RAP)
The asphalt pavement industry has always endorse the use of reclaimed asphalt
pavement (RAP). The earliest recycling asphalt pavement dates back to 1915 (28).
However, significant use of RAP in hot-mix asphalt (HMA) really started in the mid-1970s
due to extremely high asphalt binder prices as the result of the oil embargo. Using RAP

37
can significantly reduce the cost of HMA paving, conserve the energy, and help protect the
environment (29). Additionally, many studies concluded that properly designed and
constructed RAP mixes, exhibit similar performance to HMA mixes (30). Moreover, RAP
production and processing technics have greatly enhanced in the past few years. Usually,
RAP is processed into smaller sizes through RAP crushing and fractionation. The
fractionated material is more uniform and more likely to be used in higher percentages with
HMA mixtures. Additionally, fractionated material provides better handling of higher
percentages of RAP at the mix plant without negative outcomes. Therefore, the production
of quality HMA containing 25 percent RAP or more became more available.
However, a recent FHWA report stated, “Average RAP use is estimated at 12% in
HMA…it is unknown why over half of the country uses less than 20 percent RAP in HMA”
(31). The most difficult aspect of high-RAP mix design is meeting the volumetric mix
design criteria due to the large amount of fine aggregate material introduced to the HMA
mix by the RAP materials (32).
High-RAP contents also require changes in the performance grade of the virgin
binder used because of the increased stiffness of the aged RAP binder. McDaniel et al. (33)
reported that, based on indirect tensile strength, the stiffness of mixtures with a high RAP
content (>20%) were so high that they may be susceptible to low temperature cracking.
Beeson et al. (34) recommended that up to 22% RAP can be added to the mixture before
changing the low temperature grade of a -22 binder and up to 40% RAP can be added to a
mixture as long as the virgin binder grade is one grade lower than what is expected.

38
In a 2009 survey conducted by NCDOT, 9 State DOT’s reported requiring
fractionation and Wisconsin is reported to allow an increase of 5 percent binder
replacement for surface mixes if fractionation is used (31).
2.4.1. RAP Fractionation Methods
There are two main methods of RAP fractionation that are widely used;
“Fractionated RAP” method, and “Optimum Fractionated RAP” method. The two methods
are discussed below;
2.4.1.1. Fractionated RAP Method
The fractionated RAP method directly targets the fine RAP particles by physically
removing the smallest of these materials from the original stockpile during the processing
operation. The removed sieve size is determined based on the analysis of the recovered
aggregate gradation of RAP materials retained on each sieve size.
2.4.1.2. Optimum Fractionated RAP Method
The optimum fractionated RAP method splits the original RAP stockpile into two
separate coarse and fine fractionated RAP (FRAP) stockpiles. The new ‘coarse FRAP’ and
‘fine FRAP’ stockpiles can then be re-proportioned to limit the percentage of fine FRAP
included in the mix.
2.5. WMA Technologies
WMA technologies were first introduced at the Bitumen Forum of Germany in
1997 as one way to reduce greenhouse gas emissions (35). The National Asphalt Pavement
Association (NAPA) has been instrumental in bringing these technologies into the United
States with several demonstration projects being constructed since 2004 (1). WMA has
been described as “…a group of technologies which allow a reduction in the temperatures

39
at which asphalt mixtures are produced and placed.” (36). There are many different
processes and products that can be used to achieve this reduction in temperature, but
generally WMA technologies can be classified into four main categories:
1. Organic additives – generally wax additives such as Fischer-Tropsch or Montan
waxes;
2. Chemical additives – surfactants or other chemical additives;
3. Water-bearing additives – synthetic zeolites; and
4. Water-based processes – non-additive processes based on foaming
2.5.1. Organic Additives
Organic additives are waxes that have been used to reduce the viscosity of the
asphalt binder at temperatures higher than their melting points. Figure 2.26 shows the
conceptual behavior of an asphalt binder modified with an organic additive versus an
unmodified binder. It is evident that for the same temperature beyond water evaporation
point, the asphalt binder modified with organic additive has a much lower viscosity than
the unmodified binder. An example of organic additives is Sasobit® supplied by Sasol
Wax Americas, Inc., which is described as a modifier or an “asphalt flow improver,” and
is the most often used organic additive in the United States (37). Figure 2.27 shows
Sasobit® in Pastille (ca 4 mm diameter) & Prill (ca 1 mm diameter) forms. Another
example of organic additives is LEADCAP technology. LEADCAP additive is a new
Polyethylene (PE) Wax-based WMA additive developed by the Korean Institute of
Technology (KICT) (Figure 2.27). The LEADCAP additive works by reducing the
viscosity of the asphalt. Its melting point is 100 °C and crystallization point is 90 °C. The
LEADCAP additive controls the crystallization so that it does not become brittle at low

40
temperature. The LEADCAP additive is positively charged to enhance the bonding of
asphalt binder to negatively charged aggregate surface (38).
Figure 2.26 Temperature-Viscosity Behavior of Asphalt Binder Modified with Organic
Additive (39).
Figure 2.27 Sasobit Pastille (ca 4 mm diameter) & Prill (ca 1 mm diameter) Forms (37).
Figure 2.28 LEADCAP Warm Mix Asphalt Additive (38).

41
2.5.2. Chemical Additives
Chemical additives, also called surfactants, are a relatively new, emerging group of
additives for warm-mix asphalt. These surfactants help the asphalt binder coat the
aggregate at lower temperatures. An example of chemical additives is the Evotherm
Dispersed Asphalt Technology (DAT), which is produced by MeadWestvaco Asphalt
Innovations. The original process was EvothermTM Emulsion Technology (ET) which
consisted of the additive blended in a high asphalt content, water-based asphalt emulsion
(~70% solids) that is mixed with hot aggregates to produce asphalt mixtures with a 100°F
(55°C) reduction in production temperatures. EvothermTM requires no plant modifications
and simply replaces the liquid asphalt in HMA design. The majority of water in the
emulsion flashes off as steam when the emulsion is mixed with the hot aggregates (40).
Evotherm is normally added at a rate of 0.5% by weight of binder.
2.5.3. Water-Bearing Additives
In both water-bearing additives and water-based technologies small amounts of
water is introduced to asphalt binder to form a controlled foaming effect that leads to a
small increase in binder volume and a reduction in its apparent viscosity. Water bearing
additives are those synthetic zeolites that have been used to enhance aggregates coating by
asphalt at lower production temperatures. Zeolite includes approximately 20% of water
trapped in its porous structure. When the zeolite is heated to approximately 85°C, the water
is released, and then foamed asphalt is produced (1). An example of water-bearing
additives is Advera® (Figure 2.29). Advera® is an aluminosilicate or hydrated zeolite
powder, when added to the mixture at a rate up to 0.3% by total weight of mix, asphalt

42
mixtures can be produced at temperatures 50° – 70°F lower than conventional HMA
temperatures with no mix design change (41).
Figure 2.29 Close-up picture of Advera® (41).
2.5.4. Water-Based Additives
In Water-Based process foamed asphalt is achieved by adding small amount of
water to the original heated asphalt through a mean of nozzle or damped aggregates. The
idea of introducing moisture into a stream of hot Asphalt, which causes a spontaneous
foaming of the Asphalt (similar to spilling water into hot oil), is to increase the asphalt
surface area, which extremely lower its viscosity, and making it ideal for mixing with
aggregates; thereby allowing the mix to be handled and worked at lower temperature.
Foaming technology, as shown in Figure 2.30, is believed to be the most cost
effective from among the WMA technologies since it does not require any costly additives
to be added to the mixtures and more importantly it does not require very expensive plant
modifications since the foaming component can be attached to old systems for a reasonable
price, without the need for any additional changes (42).

43
Figure 2.30 Foamed Asphalt Production (43).
2.5.5. Potential Benefits of WMA Technologies
The use of WMA technologies provides a number of potential benefits which may
be categorized into three categories: economic, operational and environmental (2). Table
2.4 summarizes a number of the potential benefits of WMA technology which are
discussed below:
Table 2.4 Potential Benefits of WMA (2) Potential Benefit Economic Operational Environmental
Reduced fuel use X X
Late season (cool weather) paving X
Better workability and compaction X X
Reduced plant emissions of greenhouse gases X
Increased usage of RAP X
Improved working conditions for plant and paving crew X
2.5.5.1. Reduced Fuel Use
Theoretically, a temperature reduction of 50°F leads to fuel saving of 11 percent.
Burner fuel savings with WMA typically range from 11 to 35 percent. It should be known
that the range of fuel saving depends on several factors, such as the WMA type, the
moisture content of the aggregate, and the plant’s design and operation (36).

44
2.5.5.2. Late Season (cool weather) Paving
In-place WMA production temperatures depends on a number of factors such as
haul distance and ambient temperature, but generally are expected to be lower than HMA
production temperatures at the same conditions, which means that WMA is compactable
at lower temperatures than HMA. Therefore WMA mixture can be produced and will
remain compactable for a longer period of time than HMA, which allows paving
contractors in most of the United States to extend paving season further into the year (2).
2.5.5.3. Better Workability and Compaction
European practice for WMA showed that WMA can allow contractors to pave in
cooler temperatures and still gain paving-related benefits such as obtaining density, hauling
the mix longer distances and still have workability to place and compact, and the ability to
compact mixture with less effort (35). Better compaction has been listed as a potential
benefit of WMA comparing to HMA, which can result in more consistent compaction.
WMA users have reported in-place densities comparable to those of HMA (2).
2.5.5.4. Reduced Plant Emissions of Greenhouse Gases
Research studies indicate that the plant emissions are significantly reduced upon
the using of WMA technologies. Typical expected reductions are 30 to 40 percent for
carbon dioxide (CO2) and sulfur dioxide (SO2), 50 percent for volatile organic compounds
(VOC), 10 to 30 percent for carbon monoxide (CO), 60 to 70 percent for nitrous oxides
(NOx), and 20 to 25 percent for dust. Actual reductions vary based on a number of factors.
Technologies that result in greater temperature reductions are expected to have greater
emission reductions (2; 35; 36).
2.5.5.5. Increased Usage of RAP

45
The usage of RAP in HMA mixture has been limited by many highway agencies
because using high amount of RAP will increase the mixture’s aging after production,
which may lead to early cracking. Lower temperature of production in WMA allows for
less aging of the mixture, and thereby increases the usage of RAP in the mixture, which is
considered a potential economic benefit for both user and producer.
In Europe, WMA has been successfully produced with up to 50% RAP. In the
United States, most of the WMA projects containing RAP have used 20% or less (2; 35).
2.5.5.6. Improved Working Conditions for Plant and Paving Crew
Tests for asphalt aerosols/ fumes and polycyclic aromatic hydrocarbons (PAHs)
indicated significant reductions compared to HMA, with results showing a 30 to 50 percent
reduction. That means worker exposure to fumes is lesser in WMA when compared to
HMA. The lower mix temperature and reduction of visible smoke and odor – or perception
thereof – for WMA may contribute to improved working conditions for the paving crew
(2; 35).
2.5.6. Mix Design Practices for Warm Mix Asphalt
HMA mixture design and analysis generally consists of five major steps: 1)
materials selection, 2) design aggregate structure, 3) design binder content selection, 4)
evaluate moisture sensitivity, and 5) performance analysis. Criteria and procedures for
steps 1 through 4 for HMA can be obtained from AASHTO M323, Standard Specification
for Superpave Volumetric Mix Design, and AASHTO R35, Standard Practice for
Superpave Volumetric Design of Hot Mix Asphalt (HMA), respectively (1). Step 5 can be
obtained by using standard practices for performance tests that have been developed for

46
HMA. Performance tests are available for measuring mixture modulus, rutting resistance,
and resistance to fatigue cracking and thermal cracking.
The design of WMA requires some changes to the current HMA mix design
practices. Those modifications resulted in some differences in mix design between WMA
and HMA which are summarized in Table 2.5.
Table 2.5 HMA versus WMA Mix Design Procedure (14)
Criteria Special Mixture Design Consideration
and Methods for WMA
HMA SuperPave
Volumetric Mix Design
WMA Process Producer Selected N/A
Consensus Aggregate
Requirements. AASHTO M323 AASHTO M323
Gyratory
Compactive Effort
Ninitial
AASHTO R35 AASHTO R35 Ndes
Nmax
Mixture
Densification
Ninitial
AASHTO M323 AASHTO M323 Ndes
Nmax
Min. VMA at Ndes
AASHTO M323 AASHTO M323 VFA at Ndes
Dust To Binder Ratio at Ndes
Short-Term Conditioning for
Volumetrics, hours 2 at WMA Compaction Temperature.
2 at HMA Compaction
Temperature.
Short-Term Conditioning for
Performance, hours 2 at WMA Compaction Temperature. 4 at 135° C (275°F)
Binder Selection Modified PG Grade PG Grade
Mixing & Compaction
Temperatures.
Coating Viscosity-Temperature.
Chart Workability
Compactability
Moisture Sensitivity AASHTO T283 AASHTO T283
Rutting Resistance Flow Number Test N/A
The approach that have been used as a mix design procedure is based on the
recommendations from the research conducted under the National Cooperative Highway
Research Program (NCHRP) Project 9-43, Mix Design Practices for Warm Mix Asphalt,
which concluded that only minor modification of current HMA mix design practice is
needed to address WMA. To implement the recommended modifications for WMA, an
appendix to the current dense-graded HMA mix design procedure, AASHTO R35, was

47
developed. This appendix titled “Special Mixture Design Considerations and Methods for
Warm Mix Asphalt (WMA)” (44; 45).

48
CHAPTER 3 RESEARCH APPROACH
This chapter describes the research approach to investigate the rutting and moisture
sensitivity of warm mix asphalt with varying contents of recycled asphalt pavement.
In order to complete this research effort, laboratory and field evaluations were
conducted. A research program consists of four tasks were designed to complete the
evaluation studies. The discussion of the research program is presented in the following
section.
3.1. Research Program
3.1.1. Task One: Primary Laboratory Evaluation
A laboratory evaluation was conducted to evaluate the rutting and moisture
resistance of WMA mixtures with varying contents of RAP using local Iowa materials.
Only HWT test was used to complete this task. A total of ten mixes were designed for this
task; five WMA mixes prepared using LEADCAP 7-1 liquid additive and another five
HMA mixes as control mixes for comparison. The laboratory mixes were designed for a
traffic level of 0.3 million ESAL per Iowa DOT mix design requirements and NCHRP 691
report for WMA mix design. The mixtures used limestone virgin aggregate and
combination of different percentages of fractionated RAP; 20, 30, 40, 50, and 75% by
binder replacement.
3.1.2. Task Two: Secondary Laboratory Evaluation
After analyzing the results from the task one, one mix design was chosen and
evaluated in the laboratory in terms of rutting and moisture susceptibilities to be used for
field implementation. The field implementation included two test sections, one for WMA,

49
and one for HMA. The test sections were constructed in Iowa City, Iowa in September
2013.
3.1.3. Task Three: Primary Field Evaluation
To assess the performance of WMA during construction and over time, three sets
of test sections were evaluated. Each set includes one HMA test section and one WMA test
section. All the test sections were constructed as surface layers. The first set was
constructed in Champlin, Minnesota in July 2010. The second set was constructed in
Lancaster, Ohio in September 2013. The third set was constructed in Iowa City, Iowa in
September 2013. The three projects were constructed using LEADCAP additives as part
of the field evaluation of WMA technology.
Throughout task three, the construction process of the test sections were monitored
and the necessary field data were obtained. Several asphalt cores were extracted to evaluate
the densities of the constructed mats. Loose mixtures were collected in order to run the
necessary performance tests in the laboratory to evaluate the rutting and moisture resistance
of the mixtures used for these test sections.
3.1.4. Task Four: Secondary Field Evaluation
This task includes the assessment of WMA mixture after construction and over
time. Condition surveys of the constructed test sections were conducted after 6 months of
since construction for Iowa and Ohio test sections and after 18 months since construction
for Minnesota test sections in order to evaluate performance of the WMA mixtures.
3.2. Performance Tests
To investigate the impact of WMA technologies on the asphalt mixtures
performance, laboratory testing was conducted to address the following questions:

50
The impact of warm-mix additives on the resistance of the mixtures to rutting.
The impact of warm-mix additives on the resistance of the mixtures to moisture
damage,
The following performance tests were conducted in order to complete this research
study:
Performance tests on asphalt mixture
Hamburg Wheel Track test (AASHTO T324)
Modified Lottman test (AASHTO T283)
Performance tests on asphalt binder
Determining the asphalt bond strength (ABS) using adhesion tester device
(ASTM D4541).
3.2.1. Hamburg Wheel Track (HWT) test (AASHTO T324)
The HWT test procedure was explained earlier in section 2.3.5.4. As explained
earlier, the HWT device applies a constant load of 685 N through a steel wheel. The tests
are run in a water bath that is heated to 50°C after the test specimens are conditioned for
30 minutes. A test is completed when the wheel has passed over the specimens 20,000
times for 6.5 hours or when the rut depth exceeds 20 mm. Prior to the test, the HMA loose
mix was short-term aged for 4 hours at 135°C (275°F) then followed by 2 hours at the
compaction temperature and the WMA loose mix was short-term aged for two hours at the
compaction temperature then aged for 16 hours at 60°C (140°F) as recommended by
NCHRP Report 691 (45).

51
3.2.2. Modified Lottman Test (AASHTO T283)
The AASHTO T 283 test procedure was used to evaluate the resistance of the HMA
and WMA mixtures to moisture damage. As explained earlier in section 2.3.5.5, the test
was conducted on dry and wet conditioned specimens measuring 4 inches (100 mm) in
diameter and 2.56 inches (65.0 mm) in height. The specimens were loaded until failure at
a rate of 2 inches per minute (50.8 mm per minute). Two types of data were obtained from
this test. The first was the indirect tensile strength (ITS) of the dry and wet conditioned
specimens. The second was the tensile strength ratio (TSR), calculated by dividing the
average indirect tensile strength (ITS) values of the wet conditioned specimens by the
average indirect tensile strength (ITS) values of the dry conditioned specimens. The
indirect tensile strength (ITS) is a measure of the strength and durability of the asphalt
mixture, whereas the TSR ratio is a measure of its resistance to damage from freezing and
thawing (14; 18; 24).
3.2.3. Determining the Asphalt Bond Strength (ABS) Using
Adhesion Tester Device (AASHTO TP 91-11 & ASTM
D4541)
This test method is used to measure the pull off force needed to break the bond
strength between the asphalt binder and the aggregate surface. In order to prepare the test
specimens, the asphalt binder is attached to the aggregate surface by means of adhesion at
different controlled environmental (i.e., temperature and humidity) and moisture
conditions. To measure the pull off force needed to detach the asphalt binder samples from
the aggregate surface, a hydraulic pressure is applied to pullout a stub attached to the

52
asphalt sample as shown in Figure 3.1. The test is conducted using PosiTest AT-A
automatic adhesion tester device as shown in Figure 3.2.
Figure 3.1 Schematic of Pull off Test Method Using a Self-Aligning Tester (46).
Figure 3.2 PosiTest® Pull-Off Adhesion Tester (46).
Measuring the bond strength between the asphalt binder and the aggregate surface
can be used to understand the mode of failure during rutting or moisture damage of asphalt
samples. Two modes of failures are considered in this test; 1) failure due to lake of enough
adhesion between the asphalt binder and the aggregate surface, and 2) failure due to lake

53
of enough cohesion within the asphalt binder or asphalt mastic. As mentioned before,
different controlled environmental (i.e., temperature and humidity) and moisture
conditions are designed in order to simulate the real conditions of asphalt mixtures during
rutting and/or moisture damage process.
3.2.3.1. Aggregate Sample Preparation for the ABS Test
Aggregate samples should be cut in regular/geometric shape, plates for example,
with fixed thickness throughout the sample. The top and bottom surfaces of the sample
have to be parallel, clean, and smooth. In order to achieve clean and smooth surface, the
aggregate samples/plates should be cleaned using a lapping wheel machine or any
reasonable way, and then placed in an ultrasonic cleaner for 60 minutes at 60° C to remove
any cutting residues. This process should eliminate roughness from the aggregate sample
surfaces (47).
3.2.3.2. Test Sample Preparation
Before applying the hot asphalt binder to the aggregate surface, both the aggregate
surface and the pull out stubs (dollies) should be degreased with acetone to remove any
moisture and dust that can affect the adhesion of the asphalt sample to the aggregate or the
pull out stub surfaces. In order to simulate the process of applying the asphalt to the
aggregate during mixing, Moraes et al, 2009 (47) recommended the following procedure
to prepare the test samples for the bitumen bond strength test:
1. Heat up pull-out stubs and the aggregate plates in an oven at 150° C for a minimum
of 30 minutes to remove absorbed water on the aggregate surface and provide a
better bond between the asphalt binder and the aggregate surface.

54
2. Remove the aggregate plates from the oven and place them in a second oven at 60°
C for a minimum of 30 minutes to reach the application temperature.
3. Heat up the asphalt binders in the first oven at 150°C for sufficient time.
4. Carefully pour the hot asphalt in a 10.0 mm diameter DSR (Dynamic Shear
Rheometer) silicon molds as shown in Figure 3.4. Cool the sample and the mold
for 30 minutes at room temperature.
5. Remove the stubs from the first oven and immediately place the hot asphalt binder
sample to the surfaces of the stubs for approximately 10 seconds.
6. Remove the aggregate plates from the second oven and then firmly press each stub
with the asphalt binder sample into an aggregate plate surface until the stub reaches
the surface and no excess of asphalt binder is observed to be flowing. Push down
the stubs as straight as possible and avoid any twisting to reduce forming any trap
air bubbles inside the samples.
7. Leave prepared dry samples for 24 hours at room temperature before testing.
8. For wet conditioning, samples are left for 1 hour at room temperature then,
submerged into water tank at 40°C for the specified conditioning time. Leave the
samples at room temperature for 1 hour after conditioning time is complete before
testing.
Additionally, Moraes et al, 2009 (47) recommended new geometry and treatment
to the stub surface used with PATTI Quantum Gold adhesion tester they used in their study
in order to create a rough texture that provides a mechanical interlock and larger contact
area between the asphalt binder and stub. This modifications are shown in Figure 3.3. This

55
new modification could be easily applied to the pull-out stubs (dollies) used with the
PosiTest® Pull-Off adhesion tester device.
Figure 3.3 Pull-out stub for the Asphalt Bond Strength Test (ABS) (all measurements are
in mm) (47).
Similar geometry and treatment to the stub surface to the one recommended in
method one was done to the pullout stubs (dollies) used with the PosiTest® Pull-Off
adhesion tester device. In order to evaluate the AASHTO TP 91-11 standard procedure to
determine the ABS, two asphalt film thicknesses (FT) were studied in addition to the
asphalt FT produced by the 0.8 mm pullout stub thickness used by AASHTO TP 91-
11standard. The studied FTs were produced by pullout stub thickness values of 0.8 mm,
0.4 mm, and no stub or 0.0 mm.
3.2.3.3. Summary of the Evaluated Materials in the ABS Test
Two ABS studies were conducted to evaluate the bond strength between the asphalt
binder and the aggregate surface. The two ABS studies are discussed below;
First Study: Evaluation of the ABS Test Procedure
In this study, un-conditioned samples only were evaluated in order to capture the
effect of sample preparation method using different asphalt FT values produced by

56
different pullout stub thicknesses and the asphalt binder grade on the bond strength between
the asphalt binder and the aggregate surface. One aggregate source and four different binder
grades were tested using three different pullout stub thicknesses (PST). Table 3.1 shows a
summary of the evaluated materials.
Table 3.1 Summary of the ABS Test Method Evaluation Study
Asphalt Binder Type
No WMA Additive
Limestone Aggregate
0.8 mm PST 0.4 mm PST 0.0 mm PST
PG 58-28 X X X
PG 64-22 X X X
PG 64-28M (Polymer Modified) X X X
PG 70-22M (Polymer Modified) X X X
Based on the obtained results from the ABS test method evaluation, it was found
that the no stub or 0.0 mm PST exhibited the most consistent and reasonable ABS values.
All the test results obtained from this study are analyzed and discussed in chapter 4
“Laboratory Evaluation’s Test Results and Analysis".
Second Study: ABS Evaluation of Extracted Asphalt Binders
In this study, the asphalt binders of the collected mixtures from the test sections
were extracted and then evaluated under both conditioning and un-conditioning situations.
This ABS study was designed to evaluate the effects of moisture conditioning, aggregate
type, WMA additives, and RAP content on the bond strength between the asphalt binder
and the aggregate surface.
A total of three aggregate sources and three WMA additives were evaluated in this
research study using the pullout stubs with 0.0 mm thickness. Table 3.2 shows a summary
of the evaluated materials. All the test results obtained from this study are analyzed and
discussed in chapter 5 “Field Evaluations’ Results and Analysis".

57
Table 3.2 Summary of the ABS Study of Extracted Asphalt Binder Project RAP Content, TWM Aggregate Type Mix Type
IA-Surface Layer 38.00% Limestone-IA RAPCAP
38.00% Limestone-IA HMA
MN-Surface Layer 25.00% Granite-MN LEADCAP 6-8
25.00% Granite-MN HMA
OH-Surface Layer 20.00% Limestone-OH LEADCAP 7-1
20.00% Limestone-OH HMA
3.3. Statistical Analysis Techniques
The data obtained from the laboratory tests conducted in the different evaluation
studies were statistically analyzed using means of Analysis of Variance (ANOVA). The
statistical analysis were done utilizing the Statistical Analysis Software (SAS) to examine
the significance of each of the tests’ parameters as well as their interactions on the
evaluated mechanical properties of the asphalt mixtures.
The most frequently used design with multiple factors is a factorial design.
Factorial treatment structure exists when the treatments are the combinations of the levels
of two or more factors. These combination treatments are called factor-level combinations
or factorial combinations. The main elements included in factorial design are the structure
of the statistical model, estimation of the parameters, analysis of variance (ANOVA), and
t-procedure (14).
3.4. Pavement Condition Survey Techniques
In order to evaluate the pavement conditions of the test sections, visual inspections
of these pavements were conducted after certain time periods. The pavement conditions
were determined following the federal guidelines specified in the ASTM D6433-09
“Standard Practice for Roads and Parking Lots Pavement Condition Index Surveys”. The
existed pavement distresses were measured and recorded in a flexible pavement condition

58
survey data sheet as shown in Figure 3.4. Based on the ASTM D6433, the pavement
condition indices (PCIs) were calculated for the pavement condition of each test section.
The PCI ranges from 0 for a failed pavement to 100 for a pavement in excellent condition
(48). Table 3.3 shows an example of PCI rating scale and corresponding general pavement
condition description (49). Figure 3.5 shows the pavement condition index (PCI), rating
scale and suggested colors according to ASTM D6433-09.
Figure 3.4 Flexible Pavement Condition Survey Data Sheet (Source: ASTM D6433-09).

59
Table 3.3 Pavement Condition Index (PCI) Rating Scale
Condition PCI Description
Excellent 86-100 No significant distress.
Very Good 71-85 Little distress, with the exception of utility patches in good condition, or
slight hairline cracks; may be slightly weathered.
Good 56-70 Slight to moderately weathered, slight distress, possibly patching.
Fair 41-55 Severely weathered or slight to moderate levels of distress generally limited
to patches and non-load-related cracking.
Poor 26-40 Moderate to severe distresses including load-related type, such as alligator
cracking.
Very Poor 11-25 Severely distresses or large quantities of distortion or alligator cracking.
Failed 0-10 Failure of the pavement, distress has surpassed tolerable rehabilitation
limits.
Figure 3.5 Pavement Condition Index (PCI), Rating Scale and Suggested Colors
According to ASTM D6433-09

60
CHAPTER 4 LABORATORY EVALUATIONS’
RESULTS AND ANALYSIS
This chapter describes the test results obtained for the primary and secondary
laboratory evaluations explained in task one and two and the test results obtained for the
asphalt bond strength (ABS) test method evaluation described in section 3.3.3.3. In the
primary laboratory evaluation, a total of ten mixtures were designed: five WMA mixtures
using LEADCAP 7-1 liquid additive and five HMA mixtures as control mixtures with
varying amounts of fractionated RAP materials of 20, 30, 40, 50 and 75% by a binder
replacement. The ten laboratory mixtures were designed for a traffic level of 0.3 million
ESALs per Iowa DOT mix design requirements and NCHRP 691 Report for WMA mix
design. Based on the test results from the primary laboratory evaluation and the
recommendations from Iowa DOT, a mix design including 30% fractionated RAP by a
binder replacement was chosen for further evaluation in the secondary laboratory study.
The new mix was designed for a traffic level of 3 to 10 million EASLs. The RAPCAP
(liquid) additive was used for the WMA mixture. Both LEADCAP and RAPCAP additives
were added to the mix at a rate of 1.5% by the optimum asphalt content of the mix.
4.1. Primary Laboratory Evaluation
This section describes the mix designs, and performance tests results of the WMA
mixtures with fractionated RAP materials described in task one of the research program.
4.1.1. Virgin Aggregate & RAP Material Properties
Limestone virgin aggregates of four different stockpiles collected from River
Products quarry located in Coralville, IA along with varying amounts of fractionated RAP
from I-80 rehabilitation project were used for designing the mix with ½ inch nominal

61
maximum size. RAP materials passing the No 16 sieve were removed from the RAP
stockpile. The Virgin aggregate properties, RAP material properties and the combined
gradations for each of five different amounts of RAP materials by a binder replacement of
20, 30, 40, 50 and 75% are summarized in Tables 4.1 through 4.5, respectively. The
combined gradations are plotted on the 0.45 power gradation chart in Figure 4.1.
As can be seen from these tables, due to the less amount of binder available from
the RAP materials than the optimum binder content, the percentage of RAP materials by
weight were significantly higher than the percentage by binder replacement. For example,
as shown in Table 4.5, the 75% replacement by binder content was equivalent to 90%
replacement by weight. As shown in Figures 4.1 all combined gradations met the
Superpave mix design requirements specified by Iowa DOT.
Figure 4.1 Aggregate Gradation Charts for HMA and WMA Mixtures with LEADCAP
0.0
20.0
40.0
60.0
80.0
100.0
% P
ass
ing
Sieve Size
20 % RAP
30 % RAP
40 % RAP
50 % RAP
75 % RAP
3/4
"
1/2
"
#4
#8#1
6
#2
00
3/8
"
#3
0
#5
0
#1
00

62
Table 4.1 Combined Aggregate Gradation and Mixture Properties with 20% RAP Content.
Mix Design Info. Virgin Aggregate Properties RAP Properties
Project
Name WMA-RAP Virgin Agg. Batch Mix Gsb ABS, % Gsa RAP (% Binder Replaced) RAP ID
% of
RAP Gsb ABS, % Gsa % AC
Traffic
ESAL 300,000 Sand 7.0% 2.634 0.47 2.667 20.0% Frac. ≥ #16 100.0% 2.650 1.190 2.736 4.33
Mix Size 1/2" Man. Sand 13.0% 2.649 0.84 2.709 RAP (% Total Mix Weight) 0.0% 0.000 0.000 0.000 0.00
Layer Surface 1/2" to Dust 65.0% 2.638 0.98 2.708 24.3% Combined RAP Mix 2.650 1.190 2.736 4.33
Virgin
Binder PG 64-22 3/8" Chips 15.0% 2.642 1.04 2.717
RAP (% Dry Aggregate
Weight) Combined Mixture
Properties
Gsb ABS, % Gsa % AC
WMA
Additive LEADCAP 7-1 Combined Virgin Mix 2.640 0.900 2.707 23.5% 2.642 0.955 2.713 5.25
Virgin Aggregate Batch Mix and RAP Material Combined Gradation
Sieve Size Stockpile and percentage passing Virgin Agg. RAP Aggregate Gradation Recovered Comb.
Grad.
Design Spec, 12.5
mm
ID mm Sand Man.
Sand
1/2" to
Dust
3/8"
Chips Batch Mix Frac. ≥ #16 0
Agg. Blend
w/RAP @
Pbi Min. Max.
3/4 in 19.0 100.0 100.0 100.0 100.0 100.0 100 0 100.0 100.0 100.0 100.0
1/2 in 12.5 100.0 100.0 95.0 100.0 96.8 96.5 0.0 96.5 96.7 90.0 100.0
3/8 in 9.5 100.0 100.0 80.0 97.0 86.6 91.1 0.0 91.1 87.6 - 90.0
#4 4.75 95.0 98.0 29.0 42.0 44.5 62.6 0.0 62.6 48.8 - -
#8 2.36 90.0 76.0 10.0 10.0 24.2 40.7 0.0 40.7 28.1 28.0 58.0
#16 1.18 79.0 43.0 8.0 9.0 17.7 25.9 0.0 25.9 19.6 - -
#30 0.6 53.0 20.0 7.0 8.0 12.1 18.4 0.0 18.4 13.6 - -
#50 0.3 16.0 8.3 6.5 7.5 7.5 12.0 0.0 12.0 8.6 - -
#100 0.15 2.0 2.8 6.0 7.0 5.5 8.8 0.0 8.8 6.2 - -
#200 0.075 1.0 2.5 5.0 5.5 4.5 7.6 0.0 7.6 5.2 2.0 10.0
% Total weight of mixture 5.3% 9.8% 49.2% 11.4% Surf. Area 24.3% 0.0% Surf.
Area Surf. Area Total
% dry aggregate weight 5.4% 9.9% 49.7% 11.5% 4.00 23.5% 0.0% 6.22 4.52 OK

63
Table 4.2 Combined Aggregate Gradation and Mixture Properties with 30% RAP Content.
Mix Design Info. Virgin Aggregate Properties RAP Properties
Project
Name WMA-RAP Virgin Agg. Batch Mix Gsb ABS, % Gsa
RAP (% Binder
Replaced) RAP ID % of RAP Gsb ABS, % Gsa % AC
Traffic
ESAL 300,000 Sand 7.0% 2.634 0.47 2.667 30.0%
Frac. ≥
#16 100.0% 2.650 1.190 2.736 4.33
Mix Size 1/2" Man. Sand 13.0% 2.649 0.84 2.709 RAP (% Dry Mix
Weight) 0.0% 0.000 0.000 0.000 0.00
Layer Surface 1/2" to Dust 65.0% 2.638 0.98 2.708 37.7% Combined RAP Mix 2.650 1.190 2.736 4.33
Virgin
Binder PG 58-28 3/8" Chips 15.0% 2.642 1.04 2.717
RAP (% Total
Aggregate) Combined Mixture
Properties
Gsb ABS, % Gsa % AC
WMA
Additive
LEADCAP 7-1
Combined Virgin Mix 2.640 0.900 2.707 36.6% 2.643 0.988 2.717 5.42
Virgin Aggregate Batch Mix and RAP Material Combined Gradation
Sieve Size Stockpile and percentage passing Virgin
Agg.
RAP Aggregate
Gradation Recovered
Comb.
Grad.
Design Spec, 12.5
mm
ID mm Sand Man.
Sand
1/2" to
Dust
3/8"
Chips Batch Mix
Frac. ≥
#16 0 Agg. Blend
w/RAP
@ Pbi Min. Max.
3/4 in 19.0 100.0 100.0 100.0 100.0 100.0 100 0 100.0 100.0 100.0 100.0
1/2 in 12.5 100.0 100.0 95.0 100.0 96.8 96.5 0.0 96.5 96.6 90.0 100.0
3/8 in 9.5 100.0 100.0 80.0 97.0 86.6 91.1 0.0 91.1 88.2 - 90.0
#4 4.75 95.0 98.0 29.0 42.0 44.5 62.6 0.0 62.6 51.2 - -
#8 2.36 90.0 76.0 10.0 10.0 24.2 40.7 0.0 40.7 30.2 28.0 58.0
#16 1.18 79.0 43.0 8.0 9.0 17.7 25.9 0.0 25.9 20.7 - -
#30 0.6 53.0 20.0 7.0 8.0 12.1 18.4 0.0 18.4 14.4 - -
#50 0.3 16.0 8.3 6.5 7.5 7.5 12.0 0.0 12.0 9.2 - -
#100 0.15 2.0 2.8 6.0 7.0 5.5 8.8 0.0 8.8 6.7 - -
#200 0.075 1.0 2.5 5.0 5.5 4.5 7.6 0.0 7.6 5.6 2.0 10.0
% dry weight of mixture 4.4% 8.1% 40.5% 9.4% Surf.
Area 37.7% 0.0% Surf. Area
Surf.
Area Total
% of total aggregate 4.4% 8.2% 41.2% 9.5% 4.00 36.6% 0.0% 6.22 4.82 OK

64
Table 4.3 Combined Aggregate Gradation and Mixture Properties with 40% RAP Content.
Mix Design Info. Virgin Aggregate Properties RAP Properties
Project
Name WMA-RAP Virgin Agg. Batch Mix Gsb ABS, % Gsa
RAP (% Binder
Replaced) RAP ID % of RAP Gsb ABS, % Gsa % AC
Traffic
ESAL 300,000 Sand 7.0% 2.634 0.47 2.667 40.0%
Frac. ≥
#16 100.0% 2.650 1.190 2.736 4.33
Mix Size 1/2" Man. Sand 13.0% 2.649 0.84 2.709 RAP (% Dry Mix
Weight) 0.0% 0.000 0.000 0.000 0.00
Layer Surface 1/2" to Dust 65.0% 2.638 0.98 2.708 48.2% Combined RAP Mix 2.650 1.190 2.736 4.33
Virgin
Binder PG 58-28 3/8" Chips 15.0% 2.642 1.04 2.717
RAP (% Total
Aggregate) Combined Mixture
Properties
Gsb ABS, % Gsa % AC
WMA
Additive
LEADCAP
7-1 Combined Virgin Mix 2.640 0.900 2.707 47.1% 2.645 1.017 2.720 5.20
Virgin Aggregate Batch Mix and RAP Material Combined Gradation
Sieve Size Stockpile and percentage passing Virgin
Agg.
RAP Aggregate
Gradation Recovered
Comb.
Grad.
Design Spec, 12.5
mm
ID mm Sand Man.
Sand
1/2" to
Dust
3/8"
Chips
Batch Mix
Frac. ≥
#16 0 Agg. Blend
w/RAP @
Pbi Min. Max.
3/4 in 19.0 100.0 100.0 100.0 100.0 100.0 100 0 100.0 100.0 100.0 100.0
1/2 in 12.5 100.0 100.0 95.0 100.0 96.8 96.5 0.0 96.5 96.6 90.0 100.0
3/8 in 9.5 100.0 100.0 80.0 97.0 86.6 91.1 0.0 91.1 88.7 - 90.0
#4 4.75 95.0 98.0 29.0 42.0 44.5 62.6 0.0 62.6 53.0 - -
#8 2.36 90.0 76.0 10.0 10.0 24.2 40.7 0.0 40.7 31.9 28.0 58.0
#16 1.18 79.0 43.0 8.0 9.0 17.7 25.9 0.0 25.9 21.5 - -
#30 0.6 53.0 20.0 7.0 8.0 12.1 18.4 0.0 18.4 15.0 - -
#50 0.3 16.0 8.3 6.5 7.5 7.5 12.0 0.0 12.0 9.7 - -
#100 0.15 2.0 2.8 6.0 7.0 5.5 8.8 0.0 8.8 7.0 - -
#200 0.075 1.0 2.5 5.0 5.5 4.5 7.6 0.0 7.6 5.9 2.0 10.0
% dry weight of mixture 3.6% 6.7% 33.7% 7.8% Surf.
Area 48.2% 0.0% Surf. Area Surf. Area Total
% of total aggregate 3.7% 6.9% 34.4% 7.9% 4.00 47.1% 0.0% 6.22 5.05 OK

65
Table 4.4 Combined Aggregate Gradation and Mixture Properties with 50% RAP Content.
Mix Design Info. Virgin Aggregate Properties RAP Properties
Project
Name WMA-RAP Virgin Agg. Batch Mix Gsb ABS, % Gsa
RAP (% Binder
Replaced) RAP ID % of RAP Gsb ABS, % Gsa % AC
Traffic
ESAL 300,000 Sand 7.0% 2.634 0.47 2.667 50.0%
Frac. ≥
#16 100.0% 2.650 1.190 2.736 4.33
Mix Size 1/2" Man. Sand 13.0% 2.649 0.84 2.709 RAP (% Dry Mix
Weight) 0.0% 0.000 0.000 0.000 0.00
Layer Surface 1/2" to Dust 65.0% 2.638 0.98 2.708 60.8% Combined RAP Mix 2.650 1.190 2.736 4.33
Virgin
Binder PG 58-28 3/8" Chips 15.0% 2.642 1.04 2.717
RAP (% Total
Aggregate) Combined Mixture
Properties
Gsb ABS, % Gsa % AC
WMA
Additive
LEADCAP
7-1 Combined Virgin Mix 2.640 0.900 2.707 59.7% 2.646 1.053 2.724 5.25
Virgin Aggregate Batch Mix and RAP Material Combined Gradation
Sieve Size Stockpile and percentage passing Virgin
Agg.
RAP Aggregate
Gradation Recovered
Comb.
Grad.
Design Spec, 12.5
mm
ID mm Sand Man.
Sand
1/2" to
Dust
3/8"
Chips
Batch Mix
Frac. ≥
#16 0 Agg. Blend
w/RAP @
Pbi Min. Max.
3/4 in 19.0 100.0 100.0 100.0 100.0 100.0 100 0 100.0 100.0 100.0 100.0
1/2 in 12.5 100.0 100.0 95.0 100.0 96.8 96.5 0.0 96.5 96.6 90.0 100.0
3/8 in 9.5 100.0 100.0 80.0 97.0 86.6 91.1 0.0 91.1 89.3 - 90.0
#4 4.75 95.0 98.0 29.0 42.0 44.5 62.6 0.0 62.6 55.3 - -
#8 2.36 90.0 76.0 10.0 10.0 24.2 40.7 0.0 40.7 34.0 28.0 58.0
#16 1.18 79.0 43.0 8.0 9.0 17.7 25.9 0.0 25.9 22.6 - -
#30 0.6 53.0 20.0 7.0 8.0 12.1 18.4 0.0 18.4 15.9 - -
#50 0.3 16.0 8.3 6.5 7.5 7.5 12.0 0.0 12.0 10.2 - -
#100 0.15 2.0 2.8 6.0 7.0 5.5 8.8 0.0 8.8 7.4 - -
#200 0.075 1.0 2.5 5.0 5.5 4.5 7.6 0.0 7.6 6.3 2.0 10.0
% dry weight of mixture 2.7% 5.1% 25.5% 5.9% Surf.
Area 60.8% 0.0% Surf. Area Surf. Area Total
% of total aggregate 2.8% 5.2% 26.2% 6.0% 4.00 59.7% 0.0% 6.22 5.33 OK
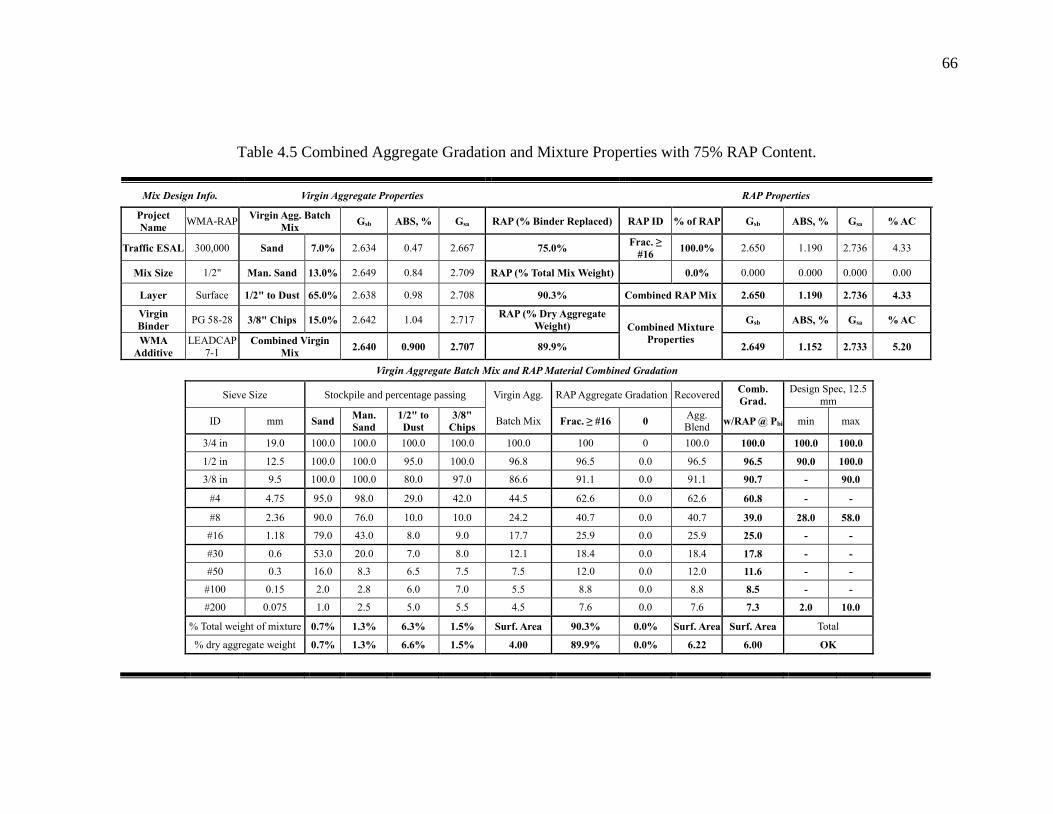
66
Table 4.5 Combined Aggregate Gradation and Mixture Properties with 75% RAP Content.
Mix Design Info. Virgin Aggregate Properties RAP Properties
Project
Name WMA-RAP
Virgin Agg. Batch
Mix Gsb ABS, % Gsa RAP (% Binder Replaced) RAP ID % of RAP Gsb ABS, % Gsa % AC
Traffic ESAL 300,000 Sand 7.0% 2.634 0.47 2.667 75.0% Frac. ≥
#16 100.0% 2.650 1.190 2.736 4.33
Mix Size 1/2" Man. Sand 13.0% 2.649 0.84 2.709 RAP (% Total Mix Weight) 0.0% 0.000 0.000 0.000 0.00
Layer Surface 1/2" to Dust 65.0% 2.638 0.98 2.708 90.3% Combined RAP Mix 2.650 1.190 2.736 4.33
Virgin
Binder PG 58-28 3/8" Chips 15.0% 2.642 1.04 2.717
RAP (% Dry Aggregate
Weight) Combined Mixture
Properties
Gsb ABS, % Gsa % AC
WMA
Additive
LEADCAP
7-1 Combined Virgin
Mix 2.640 0.900 2.707 89.9% 2.649 1.152 2.733 5.20
Virgin Aggregate Batch Mix and RAP Material Combined Gradation
Sieve Size Stockpile and percentage passing Virgin Agg. RAP Aggregate Gradation Recovered Comb.
Grad.
Design Spec, 12.5
mm
ID mm Sand Man.
Sand
1/2" to
Dust
3/8"
Chips Batch Mix Frac. ≥ #16 0
Agg. Blend
w/RAP @ Pbi min max
3/4 in 19.0 100.0 100.0 100.0 100.0 100.0 100 0 100.0 100.0 100.0 100.0
1/2 in 12.5 100.0 100.0 95.0 100.0 96.8 96.5 0.0 96.5 96.5 90.0 100.0
3/8 in 9.5 100.0 100.0 80.0 97.0 86.6 91.1 0.0 91.1 90.7 - 90.0
#4 4.75 95.0 98.0 29.0 42.0 44.5 62.6 0.0 62.6 60.8 - -
#8 2.36 90.0 76.0 10.0 10.0 24.2 40.7 0.0 40.7 39.0 28.0 58.0
#16 1.18 79.0 43.0 8.0 9.0 17.7 25.9 0.0 25.9 25.0 - -
#30 0.6 53.0 20.0 7.0 8.0 12.1 18.4 0.0 18.4 17.8 - -
#50 0.3 16.0 8.3 6.5 7.5 7.5 12.0 0.0 12.0 11.6 - -
#100 0.15 2.0 2.8 6.0 7.0 5.5 8.8 0.0 8.8 8.5 - -
#200 0.075 1.0 2.5 5.0 5.5 4.5 7.6 0.0 7.6 7.3 2.0 10.0
% Total weight of mixture 0.7% 1.3% 6.3% 1.5% Surf. Area 90.3% 0.0% Surf. Area Surf. Area Total
% dry aggregate weight 0.7% 1.3% 6.6% 1.5% 4.00 89.9% 0.0% 6.22 6.00 OK

67
4.1.2. Asphalt Binder
The target performance grade (PG) for the binder used for all mixtures is PG 64-22
and Iowa DOT requires lowering the high temperature grade by one level for the HMA
mixture that includes more than 20% RAP materials. Therefore, two asphalt binder types
were evaluated in this study: PG 64-22 for mixtures with RAP content up to 20% by binder
replacement and PG 58-28 for mixtures with RAP content more than 20% by binder
replacement. As recommended by the Flint Hills Resources, HMA mixing and compaction
temperatures for the PG 64-22 binder were determined as 311° F (155°C) and 293° F
(145°C), respectively, and those for the PG58-28 binder were determined as 300° F
(150°C), and 275° F (135°C), respectively.
4.1.3. Mix Design
Mixing and compaction temperatures were established based on the current Iowa
DOT mix design requirements for HMA mixtures including RAP materials and NCHRP
691 Report for WMA mix design. According to Bonaquist R. (43), WMA minimum mixing
and compaction temperature can be indicated using the aging index (ratio of G*/sin of the
RTFO-aged binder to that of the original binder) of the used asphalt binder without
applying any increase to its performance grade. The mix coatability, workability and
compactability are then used to finalize the mixing and compaction temperature
determination process.
Mixing and compaction temperatures are summarized in Table 4.6 and mix design
properties for the ten mixtures are summarized in Tables 4.7. All mixtures met the mix
design requirements specified by Iowa DOT. The only exceptions from that were the VMA,

68
dust to binder ration, and the film thickness for the mixtures prepared using 75% RAP.
Table 4.6 Mixing and Compaction Temperatures for the Laboratory Evaluated Mixtures. Binder Type Mixture RAP Heat-Up, Max. 2 hours Binder Temp. Mixing Temp. Comp. Temp.
PG 58-28 HMA 302o F (150o C) 302o F (150o C) 302o F (150o C) 285o F (140o C)
PG 58-28 WMA-LEADCAP 275o F (135o C) 300o F (150o C) 275o F (135o C) 250o F (125o C)
PG 64-22/28 HMA 311o F (155o C) 311o F (155o C) 311o F (155o C) 293o F (145o C)
PG 64-22/28 WMA-LEDACAP/RAPCAP 275o F (135o C) 311o F (155o C) 285o F (140o C) 266o F (130o C)
Table 4.7 Mix Design Summaries
Mix Design Properties 20 % RAP 30 % RAP 40 % RAP 50 % RAP 75 % RAP Mix Design
Criteria HMA WMA HMA WMA HMA WMA HMA WMA HMA WMA
Target Air Voids, % 3.67 3.10 3.99 3.81 3.45 3.50 3.36 3.03 3.11 3.33 3.5 ± 0.5
Optimum Binder Content (%)
5.25 5.25 5.2 5.2 5.3 5.1 5.2 5.2 5.2 5.1 ----
Virgin Asphalt Binder
Content (ADD AC %) 4.2 4.2 3.64 3.64 3.18 3.06 2.6 2.6 1.3 1.28 ----
Virgin Aggregate Content
(% Mix Weight) 76 76 64 64 51.7 53.2 40 40 10 11 ----
RAP Content (% Mix
Weight) 24 24 36 36 49.3 46.8 60 60 90 89 ----
RAP Content (% Total
Aggregate) 23 23 35 35 48.2 45.7 59 59 89 88 ----
Aggregate Bulk Specific
Gravity (Gsb) 2.642 2.642 2.64 2.643 2.65 2.645 2.65 2.646 2.65 2.649 ----
Aggregate Effective
Specific Gravity (Gse) 2.669 2.664 2.68 2.666 2.69 2.682 2.71 2.681 2.73 2.724 ----
Aggregate Apparent
Specific Gravity (Gsa) 2.713 2.713 2.72 2.717 2.72 2.72 2.72 2.724 2.73 2.732 ----
Aggregate Water
Absorption (%) 0.955 0.955 0.98 0.984 1.02 1.017 1.05 1.052 1.15 1.146 ----
Asphalt Binder Bulk
Specific Gravity (Gb) 1.043 1.043 1.04 1.036 1.04 1.036 1.04 1.036 1.04 1.036 ----
Bulk Specific Gravity at
Optimum AC (Gmb) 2.376 2.386 2.38 2.37 2.39 2.395 2.41 2.401 2.43 2.431 ----
Maximum Theoretical
Specific Gravity (Gmm) 2.467 2.463 2.47 2.464 2.48 2.481 2.5 2.476 2.51 2.515 ----
Percent Binder Absorption
(Pba %) 0.4 0.32 0.5 0.33 0.62 0.54 0.87 0.51 1.09 1.08 ----
Percent Effective Binder
(Pbe %) 4.87 4.95 4.73 4.89 4.75 4.55 4.38 4.72 4.16 4.08 ----
Comb. Agg. Surface Area
(m2/ Kg.) 4.52 4.52 4.78 4.78 5.07 5.03 5.32 5.32 6 5.96 ----
Comb. Agg. Dust Content (P0.075 %)
5.2 5.2 5.57 5.57 5.97 5.91 6.32 6.32 7.28 7.22 Max. 10%
%Gmm at Nini (7 gyrations) 84.54 84.27 84.6 84.51 86.8 82.12 86.1 83.41 84.7 82.48 ≤ 92.0%
%Gmm at Ndes (68 gyrations) 96.33 96.9 96 96.19 96.6 96.5 96.6 96.97 96.9 96.67 96.5% ± 0.5
%Gmm at Nmax (104
gyrations) 97.8 97.98 97.5 97.77 98 97.67 97.7 97.96 98 97.49 ≤ 98.0%
Voids in Mineral Aggregate
(VMA, %) 14.78 14.42 14.8 15 14.5 14 13.6 13.96 12.9 12.9 Min.14%
Voids Filled with Asphalt
(VFA, %) 75.15 78.52 73.1 74.58 75.8 75 75.2 78.31 75.9 74.19 70% - 80%
Dust to Binder Ratio
(P0.075/Pbe) 1.07 1.05 1.18 1.14 1.26 1.3 1.44 1.34 1.75 1.77 0.6 - 1.4
Film Thickness (μm) 10.77 10.94 9.89 10.22 9.36 9.07 8.24 8.87 6.94 6.84 8.0 - 13 µm

69
4.1.4. Performance Evaluation
4.1.4.1. Hamburg Wheel Track (HWT) Test Results
The HWT Test results for HMA and WMA mixtures are summarized in Tables 4.8
through 4.12 and plotted in Figures 4.2 through 4.6
Mixtures with 20% RAP by Binder Replacement
All HMA specimens successfully passed the test with the average maximum rut
depth of 14.33 mm. WMA mixtures didn’t pass the test and the average number of passes
to failure (20 mm rut depth) was 8,675 passes. The average SIP values were 10,250 passes
for HMA specimens and 4,375 for WMA specimens.
Mixtures with 30% RAP by Binder Replacement
All HMA specimens successfully passed the test with the average maximum rut
depth of 16.2 mm. WMA mixtures didn’t pass the test and the average number of passes to
failure (20 mm rut depth) was 11,450 passes. The average SIP values were 8,000 passes
for HMA specimens and 6,250 for WMA specimens. It is interesting to note that the SIP
value for HMA was lower but the SIP value for WMA was higher when the RAP amount
was increased from 20% to 30% by binder replacement.
Mixtures with 40% RAP by Binder Replacement
All HMA specimens successfully passed the test with the average maximum rut
depth of 12.0 mm. WMA mixtures didn’t pass the test, and the average number of passes
to failure (20 mm rut depth) was 13,075 passes. The average SIP were 10,500 passes for
HMA specimens, and 6,875 for WMA specimens. It should be noted that the SIP value for
HMA was higher but the SIP value for WMA was similar when the RAP amount was

70
increased from 30% to 40% by binder replacement.
Mixtures with 50% RAP by Binder Replacement
Both HMA and WMA specimens successfully passed the test with the average
maximum rut depths of 4.2 mm and 19.0 mm, respectively. The average SIP were 15,000
passes for HMA specimens, and 10,750 for WMA specimens. It should be noted that the
SIP values for both HMA and WMA were significantly higher when the RAP amount was
increased from 40% to 50% by binder replacement.
Mixtures with 75% RAP by Binder Replacement
Both HMA and WMA specimens successfully passed the test with the average
maximum rut depths of 2.5 mm for HMA specimens and 3.8 mm for WMA specimens.
The average SIP values of both HMA and WMA specimens were greater than 20,000 passes
when 75% RAP materials by binder replacement (90% RAP materials by weight) were
used. The two way-factor ANOVA analysis, as shown Table 4.13, conducted to evaluate
the effects of the mix type, and RAP percentage along with their interaction on the SIP
values obtained from the HWT. As seen from Table 4.13, the RAP percentage had a
significant effect on the SIP values. The mix type had a very low effect on the SIP values,
however the interaction between the RAP percentage and the mix type had no effect on the
SIP value, as shown in the interaction plot in Figure 4.7.

71
Table 4.8 Hamburg Wheel Test Results for Mixtures Including 20% RAP.
Mix Type Test ID Air Voids, % Total Number of
Passes
Inverse Creep
Slope (Pass/mm)
Inverse
Stripping Slope
(Pass/mm)
SIP Max. Rut Depth, mm
HMA
HMA 1 6.0 20000 2200 1837 11000 10.9
HMA 2 6.1 20000 4211 856 9500 17.8
Average 6.0 20000 3205 1347 10250 14.3
WMA-LEADCAP7-1
L 1 6.1 8400 938 321 3750 20.0
L 2 6.1 8950 1250 272 5000 20.0
Average 6.1 8675 1094 297 4375 20.0
Figure 4.2 Hamburg Wheel Test Results for Mixtures Including 20% RAP.
-20.00-19.00-18.00-17.00-16.00-15.00-14.00-13.00-12.00-11.00-10.00
-9.00-8.00-7.00-6.00-5.00-4.00-3.00-2.00-1.000.00
0 1000 2000 3000 4000 5000 6000 7000 8000 9000 10000 11000 12000 13000 14000 15000 16000 17000 18000 19000 20000
Ru
t D
epth
, m
m
Number of PassesHMA 1 HMA 2 L 1/7-1 L 2/7-1 HMA-Avg WMA-Avg

72
Table 4.9 Hamburg Wheel Test Results for Mixtures Including 30% RAP.
Mix Type Test ID Air Voids % Total Number of
Passes
Inverse Creep
Slope (Pass/mm)
Inverse Stripping
Slope (Pass/mm) SIP Max. Rut Depth, mm
HMA
HMA 1 6.4 20000 3200 1161 8000 14.3
HMA 2 6.3 20000 3200 853 8000 18.1
Average 6.3 20000 3200 1007 8000 16.2
WMA-LEADCAP7-1
L 1 6.4 10650 1429 377 5000 20.0
L 2 6.2 12250 1364 352 7500 20.0
Average 6.3 11450 1396 364 6250 20.0
Figure 4.3 Hamburg Wheel Test Results for Mixtures Including 30% RAP.
-20.00-19.00-18.00-17.00-16.00-15.00-14.00-13.00-12.00-11.00-10.00
-9.00-8.00-7.00-6.00-5.00-4.00-3.00-2.00-1.000.00
0 1000 2000 3000 4000 5000 6000 7000 8000 9000 10000 11000 12000 13000 14000 15000 16000 17000 18000 19000 20000
Ru
t D
epth
, m
m
Number of Passes
HMA 1 HMA 2 L 1/7-1 L 2/7-1 HMA-Avg WMA-Avg

73
Table 4.10 Hamburg Wheel Test Results for Mixtures Including 40% RAP.
Mix Type Test ID Air Voids % Total Number of
Passes
Inverse Creep
Slope (Pass/mm)
Inverse Stripping
Slope (Pass/mm) SIP Max. Rut Depth, mm
HMA
HMA 1 6.7 20000 4400 1343 11000 9.7
HMA 2 6.6 20000 1667 1274 10000 14.4
Average 6.6 20000 3033 1309 10500 12.0
WMA-LEADCAP7-1
L 1 6.8 14650 1938 468 7750 20.0
L 2 7.35 11500 1304 407 6000 20.0
Average 7.06 13075 1621 438 6875 20.0
Figure 4.4 Hamburg Wheel Test Results for Mixtures Including 40% RAP.
-20.00-19.00-18.00-17.00-16.00-15.00-14.00-13.00-12.00-11.00-10.00-9.00-8.00-7.00-6.00-5.00-4.00-3.00-2.00-1.000.00
0 1000 2000 3000 4000 5000 6000 7000 8000 9000 10000 11000 12000 13000 14000 15000 16000 17000 18000 19000 20000
Ru
t D
epth
, m
m
Number of Passes
HMA 1 HMA 2 L 1/7-1 L 2/7-1 WMA-Avg HMA-Avg

74
Table 4.11 Hamburg Wheel Test Results for Mixtures Including 50% RAP.
Mix Type Test ID Air Voids % Total Number of
Passes
Inverse Creep
Slope (Pass/mm)
Inverse Stripping
Slope (Pass/mm) SIP Max. Rut Depth, mm
HMA
HMA 1 6.6 20000 7500 4202 15000 3.7
HMA 2 6.5 20000 5455 3226 15000 4.8
Average 6.5 20000 6477 3714 15000 4.2
WMA-LEADCAP7-1
L 1 6.2 20000 4500 509 13500 17.0
L 2 6.1 20000 2462 765 8000 20.0
Average 6.2 20000 3481 637 10750 19.0
Figure 4.5 Hamburg Wheel Test Results for Mixtures Including 50% RAP.
-20.00-19.00-18.00-17.00-16.00-15.00-14.00-13.00-12.00-11.00-10.00
-9.00-8.00-7.00-6.00-5.00-4.00-3.00-2.00-1.000.00
0 1000 2000 3000 4000 5000 6000 7000 8000 9000 10000 11000 12000 13000 14000 15000 16000 17000 18000 19000 20000
Ru
t D
epth
, m
m
Number of Passes
HMA 1 HMA 2 L 1/7-1 L 2/7-1 HMA-Avg WMA-Avg

75
Table 4.12 Hamburg Wheel Test Results for Mixtures Including 75% RAP.
Mix Type Test ID Air Voids % Total Number of
Passes
Inverse Creep
Slope (Pass/mm)
Inverse Stripping
Slope (Pass/mm) SIP Max. Rut Depth, mm
HMA
HMA 1 6.2 20000 8929 N/A >20000 2.7
HMA 2 6.1 20000 10870 N/A >20000 2.3
Average 6.1 20000 9899 N/A >20000 2.5
WMA-LEADCAP7-1
L 1 6.5 20000 5970 N/A >20000 3.9
L 2 6.2 20000 6309 N/A >20000 3.7
Average 6.3 20000 6140 N/A >20000 3.8
Figure 4.6 Hamburg Wheel Test Results for Mixtures Including 75% RAP.
-20.00-19.00-18.00-17.00-16.00-15.00-14.00-13.00-12.00-11.00-10.00-9.00-8.00-7.00-6.00-5.00-4.00-3.00-2.00-1.000.00
0 1000 2000 3000 4000 5000 6000 7000 8000 9000 10000 11000 12000 13000 14000 15000 16000 17000 18000 19000 20000
Ru
t D
epth
, m
m
Number of PassesHMA 1 HMA 2 L 1/7-1 L 2/7-1 HMA-Avg WMA-Avg

76
Table 4.13 ANOVA Table for HWT SIP Values
Source Degrees of Freedom Type 1 SS Mean Square F Value P-Value > F
RAP 4 569680750.0 142420187.5 25.28 <.0001
Mix Type 1 22260500.0 22260500.0 3.95 0.0749
RAP*Mix Type 4 12860750.0 3215187.5 0.57 0.6901
Figure 4.7 Interaction Plot for HWT Test SIP Values.

77
4.2. Secondary Laboratory Evaluation
This section describes the mix designs, and performance tests’ results of the WMA
mixtures with fractionated RAP materials described in task two of the research program.
4.2.1. Virgin Aggregate & RAP Material Properties
Limestone virgin aggregates of four different stockpiles and a steel slag stockpile
collected from River Products quarry located in Coralville, Iowa along with 30%
fractionated RAP by binder replacement from I-80 rehabilitation project were used to
design the mix with ½ inch nominal maximum size. In order to meet the aggregate
gradation requirements specified by Iowa DOT, RAP materials passing a sieve with a size
of 5/16 inch were removed from the RAP stockpile. The Virgin aggregate properties, RAP
material properties and the combined aggregate gradation for the designed mixture are
summarized in Table 4.14. The combined gradation is plotted on the 0.45 power gradation
chart in Figure 4.8. The combined aggregate gradation met all the Superpave mix design
requirements specified by Iowa DOT.
Figure 4.8 Aggregate Gradation Chart for HMA and WMA-RAPCAP Mixtures.
0
10
20
30
40
50
60
70
80
90
100
% P
ass
ing
Sieve Size
Max. Density Line
Combined Aggregate
3/4
"
1/2
"
#4
#8#1
6
#2
00
3/8
"
#3
0
#5
0
#1
00
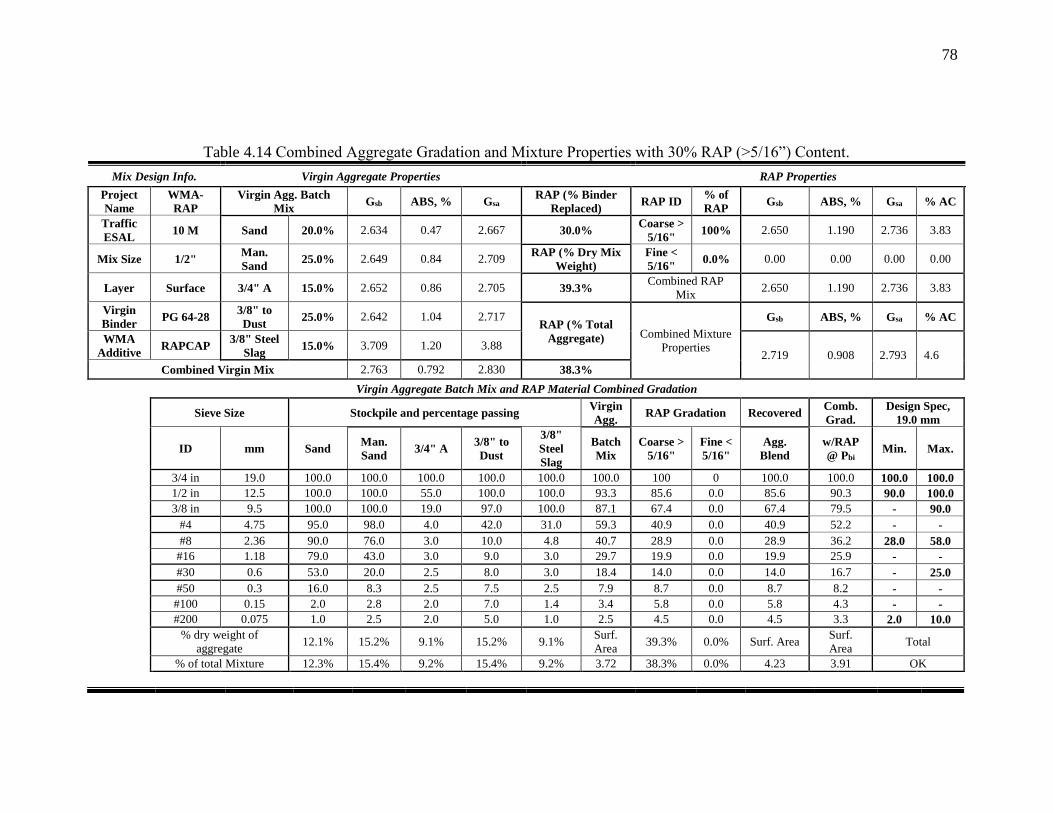
78
Table 4.14 Combined Aggregate Gradation and Mixture Properties with 30% RAP (>5/16”) Content.
Mix Design Info. Virgin Aggregate Properties RAP Properties
Project
Name
WMA-
RAP
Virgin Agg. Batch
Mix Gsb ABS, % Gsa
RAP (% Binder
Replaced) RAP ID
% of
RAP Gsb ABS, % Gsa % AC
Traffic
ESAL 10 M Sand 20.0% 2.634 0.47 2.667 30.0%
Coarse >
5/16" 100% 2.650 1.190 2.736 3.83
Mix Size 1/2" Man.
Sand 25.0% 2.649 0.84 2.709
RAP (% Dry Mix
Weight)
Fine <
5/16" 0.0% 0.00 0.00 0.00 0.00
Layer Surface 3/4" A 15.0% 2.652 0.86 2.705 39.3% Combined RAP
Mix 2.650 1.190 2.736 3.83
Virgin
Binder PG 64-28
3/8" to
Dust 25.0% 2.642 1.04 2.717
RAP (% Total
Aggregate) Combined Mixture
Properties
Gsb ABS, % Gsa % AC
WMA
Additive RAPCAP
3/8" Steel
Slag 15.0% 3.709 1.20 3.88
2.719 0.908 2.793 4.6
Combined Virgin Mix 2.763 0.792 2.830 38.3%
Virgin Aggregate Batch Mix and RAP Material Combined Gradation
Sieve Size Stockpile and percentage passing Virgin
Agg. RAP Gradation Recovered
Comb.
Grad.
Design Spec,
19.0 mm
ID mm Sand Man.
Sand 3/4" A
3/8" to
Dust
3/8"
Steel
Slag
Batch
Mix
Coarse >
5/16"
Fine <
5/16"
Agg.
Blend
w/RAP
@ Pbi Min. Max.
3/4 in 19.0 100.0 100.0 100.0 100.0 100.0 100.0 100 0 100.0 100.0 100.0 100.0
1/2 in 12.5 100.0 100.0 55.0 100.0 100.0 93.3 85.6 0.0 85.6 90.3 90.0 100.0
3/8 in 9.5 100.0 100.0 19.0 97.0 100.0 87.1 67.4 0.0 67.4 79.5 - 90.0
#4 4.75 95.0 98.0 4.0 42.0 31.0 59.3 40.9 0.0 40.9 52.2 - -
#8 2.36 90.0 76.0 3.0 10.0 4.8 40.7 28.9 0.0 28.9 36.2 28.0 58.0
#16 1.18 79.0 43.0 3.0 9.0 3.0 29.7 19.9 0.0 19.9 25.9 - -
#30 0.6 53.0 20.0 2.5 8.0 3.0 18.4 14.0 0.0 14.0 16.7 - 25.0
#50 0.3 16.0 8.3 2.5 7.5 2.5 7.9 8.7 0.0 8.7 8.2 - -
#100 0.15 2.0 2.8 2.0 7.0 1.4 3.4 5.8 0.0 5.8 4.3 - -
#200 0.075 1.0 2.5 2.0 5.0 1.0 2.5 4.5 0.0 4.5 3.3 2.0 10.0
% dry weight of
aggregate 12.1% 15.2% 9.1% 15.2% 9.1%
Surf.
Area 39.3% 0.0% Surf. Area
Surf.
Area Total
% of total Mixture 12.3% 15.4% 9.2% 15.4% 9.2% 3.72 38.3% 0.0% 4.23 3.91 OK

79
4.2.2. Asphalt Binder Properties
The target performance grade (PG) for the binder used for all mixtures is PG 70-
22. As it was mentioned earlier, Iowa DOT requires lowering the high temperature grade
by one level for the HMA mixture that includes more than 20% RAP materials, therefore,
asphalt binder with a performance grade of PG 64-28 was used for this mix design. The
asphalt binder was supplied by Bituminous Materials & Supply (BM&S) Inc. in Tama,
Iowa. The selected asphalt binder met all specifications as shown in Table 4.15. As
recommended by the asphalt binder supplier, HMA mixing and compaction temperatures
for the PG 64-28 binder were determined as 311° F (155°C) and 293° F (145°C),
respectively.
Table 4.15 Asphalt Binder PG64-28 Test Results (Source: BM&S Co.). ORIGINAL BINDER
Test Method Test Results Specifications
Flash Point, ASTM D92-05a/AASHTO T48-04 250+ 230ºC Min.
Rotational Vis @ 135C, ASTM D4402/AASHTO T316-04 1.062 3.000 Pa-s Max.
DSR (Dynamic Shear Rheometer), AASHTO T315-05
Test Temperature, ºC G*, kPa Phase Angle,, degrees G*/sin, kPa
64 2.281 72.02 2.015 1.000 kPa Min.
Fail Temperature 72.25 report, ºC
Density (Pycnometer) ASTM D70-03/AASHTO T228-04 N/A report
RTFO (ROLLING THIN FILM OVEN)
Mass Loss, ASTM D2872-04/AASHTO T240-03 -0.74% 1.000% Max.
DSR (Dynamic Shear Rheometer), AASHTO T315-05
Test Temperature, ºC G*, kPa Phase Angle,, degrees G*/sin, kPa
64 4.868 65.77 5.396 2.200 kPa min
Fail Temperature N/A report, ºC
PAV (PRESSURE AGING VESSEL), 100º C
DSR (Dynamic Shear Rheometer), AASHTO T315-05
Test Temperature, ºC G*, kPa Phase Angle,, degrees G*/sin, kPa
22 5858 40.41 3797 5000 kPa Max.
BBR (Bending Beam Rheometer), ASTM D6648-01/AASHTO T313-05
Test Temperature, ºC
-18 Stiffness, MPa 199.5 300 MPa Max.
m-value 0.319 0.300 Min.
This binder meets the qualifications of a PG 64-28

80
4.2.3. Mix Design
Table 4.6 summarizes the mixing and compaction temperatures for HMA laboratory
samples determined following the Iowa DOT RAP mix design procedure. Mix design
properties for both HMA and WMA with RAPCAP mixtures using 30% RAP amount by
binder replacement are summarized in Table 4.16. Both HMA and WMA-RAPCAP
mixtures met all the Iowa DOT mix design requirements. VMA of the HMA mixture barely
met the minimum requirement (14 %).
Table 4.16 Mix design Summary for both HMA and WMA-RAPCAP Mixtures
Mix Design Properties
30 % RAP
Mix Design Criteria HMA
WMA-
RAPCAP
Target Air Voids, % 4.19 4.39 4.0 ± 0.5
Optimum Binder Content (%) 4.60 4.60 ----
Virgin Asphalt Binder Content (ADD AC %) 3.22 3.22 ----
Virgin Aggregate Content (% Mix Weight) 64 64 ----
RAP Content (% Mix Weight) 36 36 ----
RAP Content (% Total Aggregate) 35 35 ----
Aggregate Bulk Specific Gravity (Gsb) 2.722 2.722 ----
Aggregate Effective Specific Gravity (Gse) 2.767 2.757 ----
Aggregate Apparent Specific Gravity (Gsa) 2.796 2.796 ----
Aggregate Water Absorption (%) 0.898 0.898 ----
Asphalt Binder Bulk Specific Gravity (Gb) 1.036 1.036 ----
Bulk Specific Gravity at Optimum AC (Gmb) 2.462 2.449 ----
Maximum Theoretical Specific Gravity (Gmm) 2.569 2.561 ----
Percent Binder Absorption (Pba %) 0.61 0.48 ----
Percent Effective Binder (Pbe %) 4.01 4.14 ----
Comb. Agg. Surface Area (m2/ Kg.) 3.90 3.90 ----
Comb. Agg. Dust Content (P0.075 %) 3.22 3.22 Maximum 10%
%Gmm at Nini (7 gyrations) 81.88 82.06 ≤ 92.0%
%Gmm at Ndes (96 gyrations) 95.81 95.61 96.0% ± 0.5
%Gmm at Nmax (152 gyrations) 96.21 96.24 ≤ 98.0%
Voids in Mineral Aggregate (VMA, %) 13.73 14.19 Minimum 14%
Voids Filled with Asphalt (VFA, %) 69.46 69.02 70% - 80%
Dust to Binder Ratio (P0.075/Pbe) 0.80 0.78 0.6 - 1.4
Film Thickness (μm) 10.30 10.63 8.0 - 15 µm

81
4.2.4. Performance Evaluation
4.2.5.1. Hamburg Wheel Track Test Results
The Hamburg Wheel Track Test results for HMA and WMA-RAPCAP mixtures are
summarized in Table 4.17 and plotted in Figure 4.9.
Both HMA and WMA specimens successfully passed the test with average
maximum rut depths of 2.8 mm for HMA specimens and 5.4 mm for WMA specimens.
The average SIP values were greater than 20,000 passes for HMA specimens and 14167
passes for WMA specimens. Both HMA and WMA mixtures exhibited high rutting and
moisture resistance during the HWT test.
4.2.5.2. Modified Lottman Test Results
The moisture sensitivity evaluation of HMA and WMA mixtures was conducted
using Modified Lottman test according to “AASHTO T283: Standard Method of Test for
Resistance of Compacted Asphalt Mixtures to Moisture-Induced Damage”. Prior to the
test, the HMA loose mix was short-term aged for 4 hours at 135°C (275°F) then followed
by 2 hours at the compaction temperature and the WMA loose mix was short-term aged for
two hours at the compaction temperature then aged for 16 hours at 60°C (140°F) as
recommended by NCHRP Report 691 (45). A minimum of 80% for retained tensile strength
ratio (TSR) of the mixture is required by Iowa DOT to approve the mix design. Table 4.18
and Figure 4.10 show the results for the indirect tensile strength values (ITS) with the
numbers above the bars representing the average values and the whiskers representing the
standard deviations. Overlapping of the standard deviations implies the similarity in the
measured ITS between the mixtures types.

82
Table 4.17 Hamburg Wheel Test Results for HMA and WMA-RAPCAP Mixture with 30% RAP.
Mix Type Test ID Air Voids % Total Number of
Passes
Inverse Creep
Slope (Pass/mm)
Inverse Stripping
Slope (Pass/mm) SIP Max. Rut Depth, mm
HMA
HMA 1 7.94% 20000 14493 N/A >20000 2.9
HMA 2 7.91% 20000 16393 N/A >20000 3.1
HMA 3 7.15% 20000 17699 N/A >20000 2.3
Average 7.67% 20000 16195 N/A >20000 2.8
WMA-RAPCAP
R 1 7.57% 20000 8611 3982 15500 3.9
R 2 7.05% 20000 7500 1259 15000 5.0
R 3 7.43% 20000 5455 1318 12000 7.4
Average 7.35% 20000 7189 2187 14167 5.4
Figure 4.9 Hamburg Wheel Test Results for HMA and WMA-RAPCAP Mixture with 30% RAP.
-20.0-19.0-18.0-17.0-16.0-15.0-14.0-13.0-12.0-11.0-10.0
-9.0-8.0-7.0-6.0-5.0-4.0-3.0-2.0-1.00.0
0 1000 2000 3000 4000 5000 6000 7000 8000 9000 10000 11000 12000 13000 14000 15000 16000 17000 18000 19000 20000
Rut
Dep
th,
mm
# of passes
HMA 1 HMA 2 HMA 3 R 1 R 2 R 3

83
As can be seen from Table 4.16 and Figure 4.9, the WMA mixture exhibited slightly
lower unconditioned ITS values than those obtained for HMA mixture, however HMA and
WMA mixtures exhibited similar conditioned ITS values. Both HMA and WMA mixtures
met the minimum TSR requirement of 80% specified by the Iowa DOT. The conditioning
process during the test, in which the samples were soaked in heated water at 60° C for 24
hours after freezing for 15 hours at -18° C, caused an activation to the limestone fine
particles in the mixtures similar to the activation of hydrated lime by adding water to it. It
is known that hydrated lime is anti-strip agent, which is used to improve moisture resistance
in asphalt mixtures. The activation process resulted in a higher conditioned ITS values than
the unconditioned ITS values in case of WMA and similar unconditioned ITS values in
case of HMA and lead to TSR values higher than 100%.
Table 4.18 AASHTO T 283 Test Results for HMA and WMA-RAPCAP with 30% RAP.
Mix type Unconditioned ITS, psi Conditioned ITS, psi Average
TSR
Standard Deviation
Unconditioned
ITS
Conditioned
ITS
HMA 173 174 101 10.27 7.56
WMA-RAPCAP 163 175 107 12.14 8.46
Figure 4.10 AASHTO T 283 Test Results for HMA and WMA-RAPCAP with 30% RAP.
173163
174 175
101107
0
20
40
60
80
100
0
20
40
60
80
100
120
140
160
180
200
HMA WMA-RAPCAP
Ten
sile
Str
ength
Rat
io a
t 2
5°C
(7
7°
F),
%
Ten
sile
Str
ength
at
25
°C (
77
°F
) ,
psi
Mixture Type
Unconditioned ITS, psi Conditioned ITS, psi TSR

84
4.3. Evaluation of the Asphalt Bond Strength
(ABS) Test Method
As described in section 3.3.3.3, unconditioned samples only were evaluated in order
to capture the effect of sample preparation method using different AFT values produced by
different pullout stub thicknesses and the asphalt binder grade on the bond strength between
the asphalt binder and the aggregate surface. Limestone aggregate plates were prepared
following AASHTO TP 91-11 to be tested with four different asphalt binder grades; PG
58-28, PG 64-22, PG 64-28M and PG 70-22M, using 0.8 mm, 0.4 mm and 0.0 mm (no
stub) pullout stub thicknesses (PST). Figure 4.11 shows the pullout stubs used for this
study. Table 4.19 and Figure 4.12 show the ABS test results with the numbers above the
bars representing the average values and the whiskers representing the standard deviations.
Overlapping of the standard deviations implies the similarity in the measured ABS values
between the different types of pullout stubs.
As can be seen from the test results, the 0.0 mm pullout stub produced significantly
higher and more consistent ABS values than the other two stubs. In order to measure the
actual film thickness, the aggregate plates were cut across the centerline of the asphalt
samples and investigated under Olympus SZ61 microscope equipped with Olympus DP26
digital camera as shown in Figure 4.13.
Figure 4.11 0.8 mm (left), 0.4 mm (middle) and 0.0 mm (right) Pullout Stubs.

85
Table 4.19 ABS Test Results for Limestone Aggregate Plates.
Asphalt Type PST, mm ABS, Psi
Failure Mode Average St. Dev.
PG 58-28
0.8 135.0 19.5 >50% Cohesion
0.4 129.0 8.2 >50% Cohesion
0.0 329.0 27.6 >50% Adhesion
PG 64-22
0.8 307.3 17.2 >50% Cohesion
0.4 229.0 20.1 >50% Cohesion
0.0 488.0 35.4 >50% Adhesion
PG 64-28
0.8 233.1 16.8 >50% Cohesion
0.4 263.0 9.6 >50% Cohesion
0.0 412.3 17.2 >50% Cohesion
PG 70-22
0.8 259.0 10.5 >50% Cohesion
0.4 249.7 36.1 >50% Cohesion
0.0 454.0 29.6 >50% Cohesion
Figure 4.12 ABS Test Results for Limestone Aggregate Plates.
Figure 4.13 Asphalt Sample & Aggregate Plate Cross-sectional Cut under the Microscope
135.0
307.3
233.1259.0
129.0
229.0
263.0249.7
329.0
488.0
412.3
454.0
100.0
150.0
200.0
250.0
300.0
350.0
400.0
450.0
500.0
550.0
PG 58-28 PG 64-22 PG 64-28 PM PG 70-22 PMAsp
hal
t B
on
d S
tren
gth
at
25
°C (
77
°F
) ,
psi
Asphalt Type
0.8 mm (PST) 0.4 mm (PST) 0.0 mm (PST)

86
The average values of the measured FTs for 0.8 mm, 0.4 mm and 0.0 mm pullout
stubs were 998 μm, 539 μm and 106 μm respectively. Figure 4.14 shows samples of asphalt
film thicknesses (FTs) created by the different pullout stubs after running the test. It was
noticed that the measured FTs values are slightly higher than the real stubs’ thicknesses.
This can be attributed to the irregularity and the pores in the aggregate plates’ surfaces and
the groves made in the stubs’ surfaces in order to create interlocking between the pullout
stubs and the aggregate plates. Also, the asphalt film thicknesses were measured after the
asphalt samples were exposed to a direct tension test during the test, which resulted in a
plastic or non-recoverable elongation in the asphalt samples.
Samples fail in cohesion if more than 50% of the binder is removed after the test is
performed. Otherwise the failure is cohesive. Figure 4.15 shows a sample picture of a test
sample with75% cohesive failure with the yellow areas indicate adhesive failure.
By looking at the measured asphalt FTs and the corresponded mode of failures, it
can be seen that the fact that the higher the asphalt FT the more likely the asphalt mixture
will fail in cohesive mode is illustrated. This explains why all the asphalt samples created
using 0.8 mm, and 0.4 mm stubs failed in cohesive mode. On the other hand, the asphalt
samples created by 0.0 mm stub showed both cohesive and adhesive failure modes
depending on the asphalt performance grade. The fact that the ABS values obtained for 0.0
mm pullout stubs are significantly higher than others can be related to the more direct
contact points between the pullout stub and the aggregate plate created by the 0.0 mm stubs
than the other two stubs.

87
Figure 4.14 Samples of Asphalt Film thicknesses Created by Different Pullout Stubs
Figure 4.15 Test Sample with75% Cohesive Failure.
Tow way ANOVA analysis, as shown Table 4.20, was conducted to evaluate the
impact of PST type, the asphalt performance grade and their interaction on the measured
ABS values between the asphalt binders and the aggregate surface.
0.8 mm PST
0.4 mm PST
0.0 mm PST

88
It can be seen from the two way ANOVA analysis that, the PST type, the asphalt
performance grade as well as their interaction, as shown in Figure 4.14, had significant
impacts on the measure ABS values between the asphalt binders and the aggregate surface
Table 4.20 ANOVA Table for the ABS Values.
Source Degrees of Freedom Type 1 SS Mean Square F Value P-Value > F
Asphalt Performance Grade
(PG) 3 120048.2222 40016.0741 59.96 <.0001
Pullout Stub (PS) 2 329435.0556 164717.5278 246.83 <.0001
PG*PS 6 16502.2778 2750.3796 4.12 0.0055
Figure 4.16 Interaction Plot of the ABS Values.
A paired mean comparison analysis at a significance level of 0.05 using t-test
procedure, as shown in Table 4.21, was conducted to determine whether there are any
statistical differences between the ABS values of the different pullout stubs obtained for
the same asphalt type.
Based on the t-test analysis, it can be concluded that there are high significant
differences between the 0.0 mm stubs and the other two stubs for all asphalt types. The 0.8

89
mm and 0.4 mm stubs showed no statistical differences between each other for all the
asphalt binder types except for asphalt binder PG 64-28M, the statistical difference was
very low.
In general, using the 0.0 mm pullout stubs produced more consistent and realistic
ABS values by creating reasonable asphalt film thickness, and providing more direct
contact points between the pullout stub and the aggregate surface.
Table 4.21 Summary of t-test Analysis for ABS Data.
Asphalt Type Treatment, PST
ABS Values
Pr >│t│ *Significance
PG 58-28
0.8 mm vs 0.4 mm 0.7269 NS
0.8 mm vs 0.0 mm <0.0001 HS
0.4 mm vs 0.0 mm <0.0001 HS
PG 64-22
0.8 mm vs 0.4 mm 0.0366 LS
0.8 mm vs 0.0 mm 0.0004 HS
0.4 mm vs 0.0 mm <0.0001 HS
PG 64-28M
0.8 mm vs 0.4 mm 0.048 LS to NS
0.8 mm vs 0.0 mm <0.0001 HS
0.4 mm vs 0.0 mm <0.0001 HS
PG 70-22M
0.8 mm vs 0.4 mm 0.6935 NS
0.8 mm vs 0.0 mm 0.0001 HS
0.4 mm vs 0.0 mm 0.0001 HS
* NS - Not Significant LS - Low Significant HS – High Significant

90
CHAPTER 5 FIELD EVALUATIONS’
RESULTS AND ANALYSIS
This chapter describes the test results obtained for the primary and secondary field
evaluations explained in task three and four of the research program and the test results
obtained for the asphalt bond strength (ABS) values of the extracted asphalt binders
described in section 3.3.3.3. Table 5.1 summarizes the properties of the evaluated test
sections.
Table 5.1 Summary of the Test Sections Properties.
Test Section Binder
Type
RAP Content,
TWM
Aggregate
Type WMA Additive
Layer
Thickness
Construction
Date
Iowa-Surface 64-28/M 38% Limestone RAPCAP 1.5 inch 9/9/2013
Minnesota-Surface 64-28/M 25% Granit LEADCAP 6-8 2.0 inch 7/10/2012
Ohio-Surface 70-22M 20% Limestone LEADCAP 7-1 1.25 inch 9/16/2013
5.1. State Highway 6 in Iowa City, Iowa
Two test sections were constructed for the field evaluation study; one HMA section
with approximately 0.3 mile long, and one WMA section with approximately 0.5 mile long.
The two test sections consisted of surface layer with a thickness of 1.5 inch. The HMA mix
was placed on the inside lane and the WMA mix was placed on the outside lane. As shown
in Figure 5.1, the test sections are located on the west bound of Highway 6 started from
south of Lakeside drive towards the downtown of Iowa City, Iowa. The two mixtures were
used for comparison: HMA as a control mixture and WMA mixture prepared using
LEADCAP additive. The mixtures were designed according to Superpave mix design
procedure for a high traffic level of 10 million ESALs per Iowa DOT mix design
requirements and NCHRP 691 report “Mix Design Practices for Warm Mix Asphalt”. The

91
mixtures used Limestone virgin aggregate and 30% fractionated RAP by binder
replacement. The LEADCAP technology used for this research effort was RAPCAP
(liquid). RAPCAP (liquid) additive was added to the mix with a rate of 1.5% by optimum
asphalt content of the mix.
Figure 5.1 Iowa Test Sections Location.
5.1.1. Virgin Aggregate, RAP Material and Asphalt Binder
Properties of Iowa Test Sections.
The aggregate gradation for this project was designed with ½ inch nominal
maximum size using 6 different stockpiles collected from River Products Quarry in
Coralville, Iowa. All virgin aggregate properties met Iowa DOT specifications. Table 5.2
shows the combined aggregate gradation information for the designed mixes and Figure
5.2 shows a plot of gradation on the 0.45 power gradation chart. The Fractionated RAP
from I-80 Interstate Highway was used for building the test sections. In order to meet the
mix design requirements, all RAP materials smaller than the 5/16-inch size from the RAP
stockpile were removed.
The target performance grade (PG) for the binder used for all mixtures was PG70-
WMA
HMA

92
22. Iowa DOT requires lowering the PG for the binder used with any mixture includes
more 20% RAP by one grade level. Therefore, asphalt binder with PG64-28 was used for
the constructed test sections. The asphalt binder properties were evaluated according to
AASHTO M320 standard. The selected asphalt binder met all specifications as shown in
Table 5.3. Asphalt mixing temperature for the PG 64-28 was determined as 155° C (311°
F), as recommended by the binder supplier company.
Table 5.2 Combined Aggregate Gradation and Properties for Iowa Test Sections (Source:
LL Pelling).
Material % in
Mix Producer & Location Type (A or B) Friction Type Gsb %Abs
Sand 11.0% Williams/S&G Materials Inc. A 4 2.634 0.47
TAT4 Man. sand 14.0% Klein/River Products Co A 4 2.649 0.84
3/4" A 11.0% Klein/River Products Co A 4 2.652 0.86
3/8" slag 14.0% Montpelier/Blackheart Slag A 2 3.709 1.20
3/8 W. chips 12.0% Columbus Junction/River Products Co A 4 2.583 3.23
Classified RAP 38.0% 38% ABC13-0119 (3.38 % AC) A 2 2.662 1.30
Individual Aggregates Sieve Analysis - % Passing (Target)
Material 1" 3/4" 1/2" 3/8" #4 #8 #16 #30 #50 #100 #200
Sand 100 100 100 100 95 90 79 53 16 2.0 1.0
TAT4 Man. sand 100 100 100 100 98 76 43 20 8.3 2.8 2.5
3/4" A 100 100 55 19 4.0 3.0 3.0 2.5 2.5 2.0 2.0
3/8" slag 100 100 100 100 31 1.8 1.6 1.5 1.5 1.4 1.0
3/8 W. chips 100 100 100 95 50 15 4.0 2.7 2.6 2.5 2.3
Classified RAP 100 100 93 80 51 36 27 20 14 10 8.8
Preliminary Job Mix Formula Target Gradation
Upper Tolerance 100 100 99 90 61 42 21 6.4
Comb Grading 100 100 92 83 54 37 26 17 9.0 5.1 4.4
Lower Tolerance 100 100 85 76 47 32 13 2.4
S. A. sq. m/kg Total 4.47 +0.41 0.22 0.30 0.43 0.49 0.55 0.62 1.44

93
Figure 5.2 Combined Aggregate Gradation Chart for Iowa Test Sections.
Table 5.3 Asphalt Binder PG64-28 Test Results (Source: BM&S Co.).
ORIGINAL BINDER
Test Method Test Results Specifications
Flash Point, ASTM D92-05a/AASHTO T48-04 250+ 230ºC Min.
Rotational Vis @ 135C, ASTM D4402/AASHTO
T316-04 1.062 3.000 Pa-s Max.
DSR (Dynamic Shear Rheometer), AASHTO T315-05
Test G*, kPa
Phase Angle, G*/sin, kPa
Temperature, ºC , degrees
64 2.281 72.02 2.015 1.000 kPa Min.
Fail Temperature 72.25 report, ºC
Density (Pycnometer) ASTM D70-03/AASHTO
T228-04 n/a Report
RTFO (ROLLING THIN FILM OVEN)
Mass Loss, ASTM D2872-04/AASHTO T240-03 -0.74% 1.000% Max.
DSR (Dynamic Shear Rheometer), AASHTO T315-05
Test G*, kPa
Phase Angle, G*/sin, kPa
Temperature, ºC , degrees
64 4.868 65.77 5.396 2.200 kPa min
Fail Temperature N/A report, ºC
PAV (PRESSURE AGING VESSEL), 100C
DSR (Dynamic Shear Rheometer), AASHTO T315-05
Test G*, kPa
Phase Angle, G*/sin, kPa
Temperature, ºC , degrees
22 5858 40.41 3797 5000 kPa Max.
BBR (Bending Beam Rheometer), ASTM D6648-01/AASHTO T313-05
Test
Temperature, ºC
-18 Stiffness, MPa 199.5 300 MPa Max.
m-value 0.319 0.300 Min.
This binder meets the qualifications of a PG 64-28
0
10
20
30
40
50
60
70
80
90
100
Per
cent
Pas
sing,
%
#200 #100 #50 #30 #16 #8 #4 3/8" 1/2" 3/4" 1"
Comb. Grad. Max. Dens. Warn. Zone Control Points Control Point
Sieve Size

94
5.1.2. Mix Design of Iowa Test Sections
Mixing and compaction temperatures for the two mixtures were established
following Iowa DOT RAP mix design procedure and they are summarized in Table 5.4.
The mix design for the HMA with 30% RAP materials by binder replacement is
summarized in Table 5.5. The mix design met all requirements except VMA and the
optimum binder content was relatively low (4.33%). Since 30% of the optimum binder
content (4.33%) is to be provided by the binder from the RAP materials, only 3.1% virgin
asphalt was added.
Table 5.4 Mixing and Compaction Temperatures for Iowa Test Sections.
Table 5.5 Mix Design Summary for Iowa Test Sections (source: LL Pelling). Adjust grade to PG 64-28 Gyratory Data
% Asphalt Binder 3.9 4.33 4.6 4.9
Number of Gyrations
Gmb @ N-Des. 2.491 2.501 2.508 2.529 N-Initial
Max. Sp.Gr. (Gmm) 2.625 2.606 2.594 2.585 8
% Gmm @ N- Initial 86.7 87.9 88.6 89.2 N-Design
%Gmm @ N-Max 96.5 96
% Air Voids 5.1 4 3.3 2.2 N-Max
% VMA 13.1 13.2 13.2 12.7 OUT 152
% VFA 61.2 69.7 74.9 83
Gsb for Angularity Method A
Film Thickness 7.43 8.43 9.08 9.62 2.646
Filler Bit. Ratio 1.33 1.17 1.08 1.02
Gse 2.801 2.8 2.799 2.803 Pba / %Abs Ratio
Pbe 3.32 3.77 4.06 4.3 0.46
Pba 0.6 0.59 0.57 0.63
% New Asphalt Binder 67.9 71.3 73 74.7 Slope of Compaction Curve
Combined Gb @ 25°C 1.0296 1.0296 1.0296 1.0296 13.6
Aggregate Type Used A Combined From RAM Excellent
Gsb 2.756 % Friction Type 4 (+4) 62.6 24 Pb Range Check
Gsa 2.859 Or Better 89.1 29 1
% Water Abs 1.31 % Friction Type 3 (+4) 0 0 RAM Check
S.A. m2 / Kg. 4.47 Or Better 26.5 5 OK
Angularity-method A 43 % Friction Type 2 (+4) 26.5 5 % Flat & Elongated 0.6 % Friction Type 2 (-4) 9 0.9 Specification Check
Sand Equivalent 91 Type 2 Fineness Modulus 2.4 1.6 OUT Does Not Comply
Virgin Gb @ 25°C 1.0294 % Crushed 83 31.6
Disposition : An asphalt content of 4.30% is recommended to start this project.
Data shown in 4.33% Column is interpolated from test data. The % ADD AC to start project is 3.10%
Binder Type Mixture Binder Temp. Mixing Temp. Comp. Temp.
PG 64-28 HMA 300o F (150o C) 300o F (150o C) 285o F (140o C)
PG 64-28 WMA 300o F (150o C) 275o F (135o C) 250o F (125o C)

95
5.1.3. Field Compaction and Mat Densities of Iowa Test
Sections
The construction of the HMA, and WMA test sections started at 7 pm on the 8th
and the 9th of September, 2013 respectively. The construction process went very well in
terms of field compaction. As shown in Figure 5.3, the HMA mixture produced more
emission and smoke than the WMA mixture that produced little smoke or emission. Figure
5.4 shows pictures of the test sections after construction is completed.
Figure 5.3 HMA (left), and WMA (right) Emissions during Construction.
Figure 5.4 Iowa Test Sections after Compaction.
The target air voids during construction was 5.0 to 6.0%. A total number of 6 cores
were collected from each test section to measure the filed densities of the test sections. The

96
average densities of the HMA and WMA test sections were 94.3%, and 93.9%, respectively.
Tables 5.6 and 5.7 show the density data for HMA and WMA, respectively.
Table 5.6 Density Data for Iowa HMA Test Section (Source: LL Pelling).
COMPACTED MAT_HMA TEST SECTION
Core Station CL Reference W1 Dry (g) W2 in H20 (g) W3 Wet (g) Diff. Gmb % of Gmm Pa (%) Thickness (in.)
1 234+65 3.0 S\W Pass 819.5 479.5 820.0 340.5 2.407 92.3 7.7 1.63
2 229+88 4.6 S\W Pass 867.8 516.5 868.3 351.8 2.467 94.6 5.4 1.75
3 229+33 8.0 S\W Pass 814.9 487.5 815.1 327.6 2.487 95.3 4.7 1.50
4 216+40 7.6 S\W Pass 715.3 422.9 715.9 293.0 2.441 93.6 6.4 1.50
5 213+89 1.0 S\W Pass 701.3 417.2 701.9 284.7 2.463 94.4 5.6 1.25
6 209+39 7.2 S\W Pass 650.4 389.9 650.8 260.9 2.493 95.6 4.4 1.25
Course Placed: Surface (Travel Lane) Thickness QI: 0.96
Intended Lift Thickness: 1.50
Avg. Mat Density: 2.460
Date Placed: 09/08/13 Avg. % of Gmm: 94.300
Test Date/By: 09/08/13 Avg. % Field Voids: 5.70
Table 5.7 Density Data for Iowa WMA Test Section (Source: LL Pelling).
COMPACTED MAT_WMA TEST SECTION
Core Station CL Reference W1 Dry (g) W2 in H20 (g) W3 Wet (g) Diff. Gmb % of Gmm Pa (%) Thickness (in.)
1 268+00 6.9 S\W Drv 767.2 460.5 776.7 316.2 2.426 92.9 7.1 1.50
2 262+74 9.6 S\W Drv 836.4 496.2 837.0 340.8 2.454 94.0 6.0 1.75
3 260+65 9.8 S\W Drv 793.0 468.2 793.7 325.5 2.436 93.3 6.7 1.63
4 256+63 1.0 S\W Drv 791.0 471.6 791.6 320.0 2.472 94.6 5.4 1.50
5 250+69 2.6 S\W Drv 772.8 460.5 773.4 312.9 2.470 94.6 5.4 1.50
6 244+98 7.6 S\W Drv 832.3 494.2 832.8 338.6 2.458 94.1 5.9 1.75
Course Placed: Surface (Travel Lane) Thickness QI: 2.42
Intended Lift Thickness: 1.50
Avg. Mat Density: 2.453
Date Placed: 09/09/13 Avg. % of Gmm: 93.917
Test Date/By: 09/09/13 Avg. % Field Voids: 6.08
5.1.4. Performance Evaluation of Iowa Test Sections
5.1.4.1. Hamburg Wheel Track Test Results
HWT Test results of HMA and WMA mixtures are summarized in Table 5.8 and
plotted in Figure 5.5. As it can be seen from the test results, both HMA and WMA
specimens successfully passed the test with average maximum rut depths of 2.6 mm for
HMA specimens and 4.5 mm for WMA specimens. The average SIP were greater than

97
20,000 passes for both HMA and WMA specimens. It can be concluded that both HMA
and WMA mixtures exhibited similar high resistance to rutting and moisture damage.
5.1.4.2. Modified Lottman Test Results
Table 5.9 and Figure 5.6 show the results for the indirect tensile strength values
(ITS) with the numbers above the bars representing the average values and the whiskers
representing the standard deviation. Overlapping of the standard deviation implies the
similarity in the measured ITS between the mixtures types. Figure 5.7 shows pictures of
the HMA and WMA conditioned samples after performing the test.
As can be seen from the AASHTO T 283 test results, the WMA mixture prepared
using RAPCAP exhibited significantly lower ITS values than those obtained for HMA
mixtures. Also, the WMA mixture showed significantly lower conditioned ITS values than
its unconditioned ITS values, which shows less resistance to moisture damage. On the other
hand, HMA mixture exhibited similar unconditioned and conditioned ITS values, which,
showed no sensitivity to moisture damage in the modified Lottman test. A closer look at
the WMA and HMA conditioned samples after the test, we can see the broken aggregate
particles with a small amount of stripping in case of HMA samples, and more broken
aggregate with higher amount of striping in case of WMA samples. This can be attributed
to the softening effect of the RAPCAP additive even with the existence of high RAP
amount in the mix, unlike the HMA samples which showed higher stiffness due to the
existence of high RAP amount in the mix. Both HMA and WMA mixtures met the
minimum TSR requirement of 80% specified by the Iowa DOT.

98
Table 5.8 Hamburg Wheel Test Results for Iowa Test Sections.
Mix Type Test ID Air Voids % Total Number of
Passes
Inverse Creep
Slope (Pass/mm)
Inverse Stripping
Slope (Pass/mm) SIP Max. Rut Depth, mm
HMA
HMA 1 7.94% 20000 13072 N/A >20000 2.8
HMA 2 7.91% 20000 9699 N/A >20000 3.3
HMA 3 7.15% 20000 18692 N/A >20000 1.6
Average 7.67% 20000 13821 N/A >20000 2.6
WMA-RAPCAP
R 1 7.57% 20000 7117 N/A >20000 4.1
R 2 7.05% 20000 4374 N/A >20000 5.7
R 3 7.43% 20000 10638 N/A >20000 3.7
Average 7.35% 20000 7377 N/A >20000 4.5
Figure 5.5 Hamburg Wheel Test Results for Iowa Test Sections.
-20.00-19.00-18.00-17.00-16.00-15.00-14.00-13.00-12.00-11.00-10.00
-9.00-8.00-7.00-6.00-5.00-4.00-3.00-2.00-1.000.00
0 1000 2000 3000 4000 5000 6000 7000 8000 9000 10000 11000 12000 13000 14000 15000 16000 17000 18000 19000 20000
Ru
t D
epth
, m
m
# of passes
HMA 1 HMA 2 HMA 3 R 1 R 2 R 3

99
Table 5.9 AASHTO T 283 Test Results for Iowa Test Sections.
Mix type Unconditioned ITS, psi Conditioned ITS, psi Average TSR
Standard Deviation
Unconditioned
ITS
Conditioned
ITS
HMA 208 200 96 24.19 10.42
WMA-RAPCAP 168 142 84 6.14 6.20
Figure 5.6 AASHTO T 283 Test Results for Iowa Test Sections.
Figure 5.7 HMA (Left) and WMA (Right) Conditioned Sets of Iowa Test Sections.
5.1.5. Assessment of the Iowa Test Sections after
Construction and Over Time
A condition survey was conducted in April 2014 in order to evaluate the WMA
mixtures performance after 6 months of service and after exposing to a severe winter
season. The condition survey was conducted and the pavement condition indices (PCIs)
were calculated following the ASTM D6433 standards as described earlier in section 3.5.
208
168
200
142
9684
0
20
40
60
80
100
120
140
160
180
200
220
240
HMA RAPCAP
Ten
sile
Str
ength
Rat
io a
t 2
5°C
(7
7°
F),
%
Ten
sile
Str
ength
at
25
°C (
77
°F
), p
si
Mixture Type
Uncond. ITS, psi Cond. ITS, psi TSR

100
The test sections of Iowa were constructed on top of old deteriorated concrete pavement.
Both HMA and WMA pavements performed well during the severe winter season of 2014,
however medium and high severity joint reflection cracks with densities of 1.83% for High,
and 3.67% for medium by surveyed area, were developed from the concrete joints
underneath the asphalt pavement layer. The occurrence of joint reflection cracks in the
pavement surface dropped its condition for both HMA and WMA test sections from
“Good” condition with PCIs of 100 right after construction to “Satisfactory” condition with
PCIs of approximately 72 after 6 months since construction. Figure 5.8 and 5.9 show
samples of medium and high severities joint reflection cracks from Iowa test sections.
Additionally, small amounts of low severity slippage cracks with a density of 0.83% by
surveyed area were observed in both HMA and WMA test sections, as shown in Figure
5.10.
Figure 5.8 Medium Severity Joint Reflection Cracks from Iowa Test Sections.
Figure 5.9 High Severity Reflection Joint Cracks from Iowa Test Sections.

101
Figure 5.10 Low Severity Slippage Cracks from Iowa Test Sections.
5.2. State Highway TH 169 in Champlin, Minnesota
Two test sections were constructed on July 10th, 2012 in Champlin, Minnesota; one
for WMA and another one for HMA for comparison. Two-inch mill and overlay was
applied on the southbound outside lane of TH 169 state highway in Champlin between the
Mississippi River and Hayden Lake Road. Figure 5.11 shows the location of Minnesota
test sections.
Figure 5.11 Minnesota Test Sections Location.
The HMA and WMA mixtures were designed according to Superpave mix design
procedure for a medium traffic level of 3 to 10 million ESALs according to MnROAD mix
design requirements. The mixtures used Granite virgin aggregate and 25% traditional RAP
by total weight of mix. The LEADCAP technology used for this project was LEADCAP 6-

102
8. LEADCAP 6-8 additive was added to the mix with a rate of 1.5% by optimum asphalt
content of the mix.
5.2.1. Virgin Aggregate, RAP Material, and Asphalt Binder
Properties of Minnesota Test Sections
The aggregate gradation for this project was designed with ½ inch nominal
maximum size using 5 different stockpiles collected from Valley Paving, Inc. quarry
located in Shakopee, MN. The used RAP for this project was collected from different
milling projects in Minnesota by Valley Paving Inc. All virgin aggregate and RAP
properties met MnROAD specifications. Table 5.10 shows the combined aggregate
gradation information for the designed mixes and Figure 5.12 shows a plot of gradation on
the 0.45 power gradation chart. A polymer modified asphalt binder with PG 64-28 was used
for both WMA and HMA test sections. The asphalt binder was supplied by Flint Hills
Resources in Rosemount, Minnesota. The used asphalt binder properties met all the
requirements for PG 64-28. Asphalt mixing temperature for the PG 64-28 was determined
as 155° C (311° F), as recommended by the binder supplier company. As mentioned before,
the LEADCAP technology used for this project was LEADCAP 6-8.
5.2.2. Mix Design of Minnesota Test Sections
Mixing and compaction temperatures for the two mixtures were established
following MnROAD SuperPave mix design procedure and they are summarized in Table
5.11 MnROAD. The mix design verification and summary for both HMA and WMA
mixtures is shown in Table 5.12. All the mix design requirements for both HMA and WMA
mixtures were met.

103
Table 5.10 Combined Aggregate Properties for Minnesota Test Sections.
% Pit Source of Material Total Sp. G.
Minus # 4
% Passing Sp. G.
30.0% 71002 Barton Elk River 9/16 Clear 2.751 6.0% 2.751
24.0% 71002 Barton Elk River Washed Man Sand 2.728 99.0% 2.728
15.0% 19106 Kramer Burnsville Washed Sand (Limestone) 2.700 99.0% 2.700
25.0% Plant Milling 2.656 76.0% 2.656
6.0% 71059 Barton Elk River #2 Screened Sand 2.639 93.0% 2.639
Mix Aggregate Specific Gravity at the Listed Percentages = 2.707 2.639
Sieve Size Combined Gradation
Design Spec, NMAS 1/2 inch
ID mm Min. Max.
3/4 in 19 100 100 100
1/2 in 12.5 94 85 100
3/8 in 9.5 83 35 90
#4 4.75 65 30 80
#8 2.36 48 25 65
#16 1.18 33 - -
#30 0.6 22 - -
#50 0.3 11 - -
#100 0.15 5 - -
#200 0.075 3.1 2.0 7.0
Spec. Voids 4.0 3.0 5.0
% AC 5.4 5.0 PG 64-28
Figure 5.12 Aggregate Gradation Chart for Minnesota Test Sections (Source: MnROAD).
Table 5.11 Mixing and Compaction Temperatures for Minnesota Test Sections (Source:
MnROAD).
0.0
20.0
40.0
60.0
80.0
100.0
% P
ass
ing
Sieve Size
Theoretical Grade
Max. Density Line
3/4
"
1/2
"
#4
#8
#1
6
#2
00
3/8
"
#3
0
#5
0#
10
0
Binder Type Mixture Binder Temp. Mixing Temp. Comp. Temp.
PG 64-28 HMA 311o F (155o C) 311o F (155o C) 285o F (140o C)
PG 64-28 WMA 311o F (155o C) 275o F (135o C) 255o F (125o C)

104
Table 5.12 Mix Design Summary Sheet for Minnesota Test Sections (Source:
MnROAD).

105
5.2.3. Field Compaction and Mat Densities of Minnesota
Test Sections
The construction of the HMA, and WMA test sections started at 7 pm on the 9th
and the 10th of July, 2012 respectively. During compaction, the mix temperature measured
using PAVE-IR device was more consistent with the WMA than the HMA.
HMA required 6 passes of breakdown roller (vibratory steel double drum), then
pneumatic rubber tire and finish rollers, while WMA mixtures required 4 passes of
breakdown roller, then pneumatic and finish rollers to achieve the same required density
range measured by PQI non-nuclear device. This shows how the addition of LEADCAP 6-
8 additive resulted in more workable mixtures and less compaction effort.
The average density of WMA-LEADCAP 6-8 cores was 93.6%., while the average
density of HMA cores was 94.5%. Table 5.13 shows the measured cores’ densities of both
WMA and HAM mixtures for Minnesota test sections.
Table 5.13 Density Data of HMA and WMA mixtures for Minnesota Test Sections Core # Core Thickness (inches) Bulk Sp. G. (Gmb) Density (% of Gmm)
HMA
Contractor 1.1 54.0 2.408 95.6
Contractor 1.2 52.0 2.427 96.4
Agency 1.1C 54.0 2.393 95.0
Agency 1.2C 52.0 2.43 96.5
Contractor 2.1 45.0 2.392 95.0
Contractor 2.2 52.0 2.324 92.3
Agency 2.1C 45.0 2.36 93.7
Agency 2.2C 52.0 2.295 91.1
WMA
Contractor 3.1 54.0 2.361 94.0
Contractor 3.2 55.0 2.305 91.8
Agency 3.1C 54.0 2.362 94.0
Agency 3.2C 55.0 2.279 90.7
Contractor 4.1 47.0 2.373 94.5
Contractor 4.2 56.0 2.372 94.4
Agency 4.1C 47.0 2.377 94.6
Agency 4.2C 56.0 2.373 94.5

106
5.2.4. Performance Evaluation of Minnesota Test Sections
5.2.4.1. Hamburg Wheel Track Test Results
HWT Test results of HMA and WMA mixture are summarized in Table 5.14 and
plotted in Figure 5.13. As it can be seen from the test results, both HMA and WMA
specimens successfully passed the test with average maximum rut depths of 5.4 mm for
HMA specimens and 8.2 mm for WMA specimens. The average SIP were greater than
20,000 passes for HMA specimens and 16333 passes for WMA specimens. It can be
concluded that both HMA and WMA mixtures exhibited high resistance to rutting and
moisture damage, however the HMA mixture shows higher resistance than the WMA
mixture prepared using LEADCAP 6-8.
5.2.4.2. Modified Lottman Test Results
Table 5.15 and Figure 5.14 show the results for the indirect tensile strength values
(ITS) with the numbers above the bars representing the average values and the whiskers
representing the standard deviation. Overlapping of the standard deviation implies the
similarity in the measured ITS between the mixtures types.
As can be seen from the AASHTO T 283 test results, both HMA and WMA
mixtures exhibited similar low ITS values in both conditioned and unconditioned samples.
However, both HMA and WMA mixtures met the minimum TSR requirement of 80%
specified by the MnROAD. WMA mixture exhibited higher moisture sensitivity in the
modified Lottman test than HMA mixture.

107
Table 5.14 Hamburg Wheel Test Results for Minnesota Test Sections.
Mix Type Test ID Air Voids % Total Number of
Passes
Inverse Creep
Slope (Pass/mm)
Inverse Stripping
Slope (Pass/mm) SIP Max. Rut Depth, mm
HMA
HMA 1 7.21 20000 6061 N/A >20000 5.3
HMA 2 7.88 20000 4878 N/A >20000 6.1
HMA 3 7.83 20000 6173 N/A >20000 4.7
Average 7.64 20000 5704 N/A >20000 5.4
WMA-LEADCAP
L 1 6.64 20000 8000 N/A >20000 5.2
L 2 7.05 20000 6296 N/A >20000 9.5
L 3 6.83 20000 6400 N/A >20000 9.9
Average 6.38 20000 6899 N/A >20000 8.2
Figure 5.13 Hamburg Wheel Test Results for Minnesota Test Sections.
-20.00-19.00-18.00-17.00-16.00-15.00-14.00-13.00-12.00-11.00-10.00-9.00-8.00-7.00-6.00-5.00-4.00-3.00-2.00-1.000.00
0 1000 2000 3000 4000 5000 6000 7000 8000 9000 10000 11000 12000 13000 14000 15000 16000 17000 18000 19000 20000
Ru
t D
epth
, m
m
# of passes
HMA 1 HMA 2 HMA 3 L 1 L 2 L 3

108
Table 5.15 AASHTO T 283 Test Results for Minnesota Test Sections.
Mix type Unconditioned ITS, psi Conditioned ITS, psi Average TSR
Standard Deviation
Unconditioned
ITS
Conditioned
ITS
HMA 139 133 95 10.78 2.85
WMA-RAPCAP 130 108 83 4.49 7.12
Figure 5.14 AASHTO T 283 Test Results for Minnesota Test Sections.
5.2.5. Assessment of the Minnesota Test Sections after
Construction and Over Time
A condition survey was conducted in March 2014 in order to evaluate the WMA
mixtures performance after 19 months of service and exposing to a severe winter seasons.
The condition survey were conducted and the pavement condition indices (PCIs) were
calculated according to ASTM D6433 standards as described earlier in section 3.5. The test
sections were constructed on top of an old deteriorated concrete pavement. Both HMA and
WMA pavements didn’t perform as good as expected during the severe winter seasons of
2013 and 2014, which resulted in the development of high and medium severities joint
reflection cracks, medium severity transverse cracks and medium severity edge cracks. The
densities of the joint reflection cracks were 7.3% for high severity and 3.7% for medium
severity, respectively. The density of the medium severity transverse cracks was 8.3% and
139130133
108
95
83
0
10
20
30
40
50
60
70
80
90
100
0
20
40
60
80
100
120
140
160
180
200
HMA WMA-LEADCAP 6-8
Ten
sile
Str
ength
Rat
io a
t 2
5°C
, %
Ten
sile
Str
ength
at
25
°C, p
si
Mixture TypeDry ITS, psi Wet ITS, psi TSR

109
the density of the medium severity edge cracks was 3.7%. The occurrence of these
distresses in the pavement surface dropped its condition for both HMA and WMA test
sections from “Good” condition with PCIs of 100 right after construction to “Poor”
condition with PCIs of approximately 42 after 19 months since construction. Figure 5.15
shows samples of medium and high severities joint reflection cracks, Figure 5.16 shows
samples of medium severity transverse cracks, and Figure 5.17 shows samples of medium
severity edge cracks from Minnesota test sections.
Figure 5.15 Medium (left) and High (right) Severity Joint Reflection Cracks from
Minnesota Test Sections.
Figure 5.16 Medium Severity Transverse Cracks from Minnesota Test Sections.
Figure 5.17 Medium Severity Edge Cracks from Minnesota Test Sections.

110
5.3. State Highway 158 in Lancaster, Ohio
Two test sections, one for WMA and one for HMA as a control mix, were
constructed on State Highway 158 at the milepost of 75.5 in Lancaster, Ohio. The WMA
test section has a total length of 1 mile. The HMA mixtures were applied at the section
adjacent to the WMA test section at mile post 85.5. A 3.0-inch asphalt layer was constructed
that consisted of two layers; the intermediate layer with a thickness of 1.75 inch and the
surface layer with a thickness of 1.25 inch.
The two mixtures designed for this research study were: HMA as a control mixture
and WMA mixture prepared using LEADCAP 7-1 additive. The LEADCAP 7-1 additive
were added to the mix with a rate of 1.5% by optimum asphalt content. The mixtures were
designed according to Marshall mix design procedure following Ohio Department of
Transportation (ODOT) mix design specifications and NCHRP 691 report “Mix Design
Practices for Warm Mix Asphalt”. The mixtures used a blend of Limestone and Natural
gravel aggregates and 25% RAP materials by weight for the intermediate layer and 20 %
RAP by weight for the surface layer. Only surface layer mixtures were evaluated in this
research study.
5.3.1. Virgin Aggregate, RAP Materials and Asphalt Binder
Properties of Ohio Test Sections
The aggregate gradation for the surface layer was designed with 1/2 inch nominal
maximum size using 4 different stockpiles collected from the Shelly Company Quarry in
Lancaster, Ohio. All virgin aggregate properties met ODOT mix design requirements. The
combined aggregate gradation is summarized in Table 5.16 and plotted on a 0.45 power

111
gradation chart in Figure 5.18.
Table 5.16 Aggregate Gradation and Properties for Ohio Surface Layer Mixtures (Source:
ODOT).
Sieve Size Stockpile and percentage passing Design Spec,
NMAS 1/2 inch
ID mm Limestone
/Gravel
Natural
Sand
Limestone
Sand RAP
Combined
Gradation Min. Max.
1 in 25 100.0 100.0 100.0 100.0 100 100 100
3/4 in 19 100.0 100.0 100.0 100.0 100 100 100
1/2 in 12.5 100.0 100.0 100.0 98.0 100 100 100
3/8 in 9.5 92.0 100.0 100.0 89.5 94 90 100
#4 4.75 20.0 99.0 94.0 65.3 55 45 57
#8 2.36 3.0 87.0 66.0 49.0 38 30 45
#16 1.18 3.0 68.0 40.0 35.8 28 17 35
#30 0.6 3.0 47.0 26.0 26.8 20 12 15
#50 0.3 3.0 16.0 17.0 16.8 10 5 18
#100 0.15 2.0 4.0 10.0 12.0 5 2 10
#200 0.075 2.0 3.0 5.7 9.3 4
% of Each
stockpile 47.0% 23.0% 10.0% 20.0% 100.0% Check Total
Figure 5.18 Combined Aggregate Gradation Chart for Ohio Surface Layer Mixtures
(Source: ODOT).
The asphalt binder used for the surface layer of HMA, and WMA mixtures was PG
70-22M. The asphalt binder properties were evaluated according to AASHTO M320
0
10
20
30
40
50
60
70
80
90
100
% P
ass
ing
Sieve Size
Combined Gradation Max. Density Line
3/4"
1/2
"
#4#8
#1
6
#2
00
3/8
"
#3
0
#5
0
#1
00
1"

112
standard. The results were provided by The Shelly Company. The selected asphalt binder
met all specifications as shown in Table 5.17. Asphalt mixing temperature for the PG 70-
22M was determined as 160° C (320° F), as recommended by the binder supplier company.
5.3.2. Mix Design Summary of Ohio Test Sections
Mixing and compaction temperatures for the two mixtures were established based
on ODOT mix design recommendations. Mix design summary is included in the project
reference data sheet. The project reference data sheets for HMA and WMA mixtures of the
surface layer are shown in Figure 5.19, and Figure 5.20 respectively.
Table 5.17 Asphalt Binder PG70-22M Test Results (Source: The Shelly Co.). Quality Control Laboratory
Date Entered Binder Test Results
File
17-Sep-13 603
Binder ID Sample Date Date Received Liquid Division Tank Gallons ODOT
Sample
1694 16-Sep-13 16-Sep-13 0
Project Plant Plant Tank # Barge # Sampler
293-13 0 62
Binder Type Blend Date tested Tester
PG 70-22 1.8% LEADCAP 16-Sep-13
Original Binder
Flash point Viscosity 135 C CP Dynamic Shear C Original Binder phase Angle
0 0 1.61 69
RTFO Binder
Mass loss % Dynamic Shear C RTFO Binder phase Angle
0 3.84 66.1
PAV Binder
Dynamic Shear C M-Value Stiffness (S) PAV Residue phase Angle
1930 0.328 137 49.9
Additional Tests
Specific Gravity Ductility Force Ratio Penetration Absolute Viscosity Solubility
0 0 0 68 0 0
Electric Recovery
0
Summary
Pass/Fail temperature Binder is A
0 PG 70-22
Comments BINDER -TOLEDO (1.8% LEADCAP ADDITIVE)
All required Tests Completed √

113
Figure 5.19 Project Reference Data Sheet for HMA Mixtures of the Surface Layer
(Source: ODOT).

114
Figure 5.20 Project Reference Data Sheet for WMA Mixtures of the Surface Layer
(Source: ODOT).
5.3.3. Field Compaction and Mat Densities of Ohio Test
Sections
The construction of the HMA, and WMA test sections started at 7 am on the 14th,
and the 16th of September, 2013 respectively. The WMA mixtures showed better
workability during construction, which resulted in less compaction effort than the

115
compaction effort needed for HMA mixture. The target field air voids during compaction
was 6.0%. The nuclear gauge method was used to measure the mat densities during
construction. Three cores were extracted and used to calibrate the nuclear gauge. Four to
Six different locations per mile were selected to measure the densities of the asphalt mat.
The average densities of the HMA, and WMA test sections were 94.6%, and 95.2%
respectively. Table 5.18 shows the density data for HMA and WMA test sections.
Table 5.18 Density Data of HMA and WMA Test Sections for Surface Layer (ODOT).
9/16/13/ LEADCAP Gauge Reading (Contractor QC)
Longitudinal Location Transverse Location Actual Gauge Reading, pcf % Density
336100 NB L 143.2 95.7
326100 NB C 144.3 96.5
316100 NB R 140.9 94.2
306100 NB L 140.1 93.7
296100 NB C 143.5 95.9
286100 NB R 142 94.9
ODOT QA Tests Pcfs L C R Ave % Density ODOT Initials
326100 NB 139.2 144.3 140.9 141.5 94.6
306100 NB 141.7 144.4 141.6 142.6 95.3
9/14/13/ HMA Gauge Reading (Contractor QC)
Longitudinal Location Transverse Location Actual Gauge Reading, pcf % Density
376100 NB L 141.8 95.6
366100 NB C 142.6 94.1
356100 NB R 140.9 95
346100 NB L 141.8 93.6
ODOT QA Tests Pcfs L C R Ave % Density ODOT Initials
356100 NB 144.7 149.1 140.9 144.9 95.6
346100 NB 141.8 144.7 141.7 142.7 94.2
5.3.4. Performance Evaluation
5.3.4.1. Hamburg Wheel Track Test Results of Ohio Test Sections
HWT Test results of HMA and WMA mixture are summarized in Table 5.19 and
plotted in Figure 5.21. As it can be seen from the test results, both HMA and WMA

116
specimens successfully passed the test with average maximum rut depths of 3.2 mm for
HMA specimens and 8.2 mm for WMA specimens. The average SIP were greater than
20,000 passes for HMA specimens and 12083 passes for WMA specimens. It can be
concluded that both HMA and WMA mixtures exhibited high resistance to rutting and
moisture damage, however the HMA mixture shows higher resistance than the WMA
mixture prepared using LEADCAP 7-1.
5.3.4.2. Modified Lottman Test Results
Table 5.20 and Figure 5.22 show the results for the indirect tensile strength values
(ITS) with the numbers above the bars representing the average values and the whiskers
representing the standard deviation. Overlapping of the standard deviation implies the
similarity in the measured ITS between the mixtures types.
As can be seen from the AASHTO T 283 test results, WMA and HMA mixtures
exhibited similar ITS values in both conditioned and unconditioned samples. HMA
mixtures exhibited significantly higher ITS values than those obtained for WMA mixtures,
which showed less sensitivity to moisture damage than what WMA mixture showed. A
closer look at the WMA and HMA conditioned samples after the test, we can see the broken
aggregate particles with a small amount of stripping in case of HMA samples, and less
broken aggregate with higher amount of striping in case of WMA samples, as shown in
Figure 5.23. This can be attributed to the softening effect of the LEADCAP 7-1 additive
even with the existence of RAP in the mix, unlike the HMA samples which showed higher
stiffness due to the RAP existence in the mix. However, both HMA and WMA mixtures
met the minimum TSR requirement of 80% specified by the ODOT.

117
Table 5.19 Hamburg Wheel Test Results for Ohio Test Sections.
Mix Type Test ID Air Voids % Total Number of
Passes
Inverse Creep
Slope (Pass/mm)
Inverse Stripping
Slope (Pass/mm) SIP Max. Rut Depth, mm
HMA
HMA 1 6.79 20000 11173 N/A >20000 3.4
HMA 2 6.80 20000 14184 N/A >20000 2.9
HMA 3 6.71 20000 10471 N/A >20000 3.2
Average 6.77 20000 11943 N/A >20000 3.2
WMA-LEADCAP
L 1 6.53 20000 4141 2395 13250 7.8
L 2 6.43 20000 3194 3295 11500 8.1
L 3 6.61 20000 3286 2566 11500 8.8
Average 6.52 20000 3540 2763 12083 8.2
Figure 5.21 Hamburg Wheel Test Results for Ohio Test Sections.
-20.00-19.00-18.00-17.00-16.00-15.00-14.00-13.00-12.00-11.00-10.00
-9.00-8.00-7.00-6.00-5.00-4.00-3.00-2.00-1.000.00
0 1000 2000 3000 4000 5000 6000 7000 8000 9000 10000 11000 12000 13000 14000 15000 16000 17000 18000 19000 20000
Ru
t D
epth
, m
m
# of passes
HMA 1 HMA 2 HMA 3 L 1 L 2 L 3

118
Table 5.20 AASHTO T 283 Test Results for Ohio Test Sections.
Mix type Unconditioned ITS, psi Conditioned ITS, psi Average TSR
Standard Deviation
Unconditioned
ITS
Conditioned
ITS
HMA 187 180 96 5.90 8.11
WMA-LEADCAP 149 151 101 6.49 5.06
Figure 5.22 AASHTO T 283 Test Results for Ohio Test Sections.
5.3.5. Assessment of the Ohio Test Sections after
Construction and Over Time
A condition survey was conducted in April 2014 in order to evaluate the WMA
mixtures performance after 6 months of service and exposing to a severe winter seasons.
The condition survey were conducted and the pavement condition indices (PCIs) were
187
149
180
151
96101
0
20
40
60
80
100
0
20
40
60
80
100
120
140
160
180
200
HMA LEADCAP 7-1 Ten
sile
Str
ength
Rat
io a
t 2
5°C
(7
7°
F),
%
Ten
sile
Str
ength
at
25
°C (
77
°F
) ,
psi
Mixture Type
Uncond ITS, psi Cond ITS, psi TSR
Figure 5.23 HMA (Left) and WMA-LEADCAP (Right) Conditioned Sets of Ohio Mixtures.

119
calculated according to ASTM D6433 standards as described earlier in section 3.5. Both
HMA and WMA_LEDCAP test sections performed very well during the severe winter
season of 2014. No signs of distresses were observed during the condition survey. The
pavement condition indices (PCIs) of both HMA and WMA_LEADCAP kept the same
values of 100 after 6 months of construction. Figure 5.24 shows sample pictures for the
pavement condition of Ohio test sections.
Figure 5.24 Sample Pictures for the Pavement Condition of Ohio Test Sections.
5.4. Asphalt Bond Strength (ABS) Evaluation
of Extracted Asphalt Binders
Asphalt bond strength (ABS) was improved by using a 0.0 mm pullout stub when
running the test as shown in section 4.3. Thus, the 0.0 mm pullout stubs were used to
conduct the ABS evaluation for the extracted asphalt binders from all the HMA and WMA
mixtures used for the test sections. The extraction process was done per ASTM
D2172/D2172M-11 “Standard Methods for Quantitative Extraction of Bitumen from
Bituminous Paving Mixtures”, and ASTM D5404/D540M-12 “Standard Practice for
Recovery of Asphalt from Solution Using the Rotary Evaporator”. After the extraction and

120
recovery of asphalt binders were done, a full performance grading were done following
AASHTO M 320 “Standard Specification for Performance-Graded Asphalt Binder” and
AASHTO MP19-10 “ Performance Graded Asphalt Binder Using Multiple Stress Creep
Recovery (MSCR) Test”.
5.4.1. Rheological Properties and Performance Grades of the
Extracted and Recovered Asphalt Binders
Tables 5.21 through 5.26 show summaries of the performance grading results for
the different extracted and recovered asphalt binders.
The target performance grade of the asphalt binder for Iowa mixtures was 70-22
with 30% RAP by asphalt binder’s replacement, which required using a lower grade of PG
64-28 to produce the mix. The extracted asphalt binder from the HMA mixtures of Iowa
test section was graded as PG 82-16 with a standard traffic “S” level, while the extracted
asphalt binder from the WMA mixtures produced using RAPCAP was graded as PG 70-28
with a heavy traffic “H” level. The RAPCAP additive reduced the impact of aging on the
asphalt binder during construction. The RAPCAP additive improved the high and low
temperature grades of the extracted asphalt binder. Also, the RAPCAP additive improved
the asphalt binder characteristics during the MSCR test by decreasing the non-recoverable
creep compliance, which resulted in a higher qualified asphalt binder for a higher traffic
level “H” instead of a standard traffic level “S”, which was obtained for the extracted
asphalt PG 82-16 from the HMA mixture.
The target asphalt binder performance grade for Minnesota mixtures was 70-22
with 25% RAP by total weight of mix, which required using a lower grade of PG 64-28 to
produce the mix. The extracted asphalt binder from the HMA and WMA mixtures of

121
Minnesota test sections were both graded as PG 76-22 with a standard traffic “S” level.
Similarly, the target asphalt binder performance grade for Ohio mixtures was 70-
22 with 20% RAP by total weight of mix, which didn’t require lowering the performance
grade of asphalt when producing the mix. The extracted asphalt binder from the HMA and
WMA mixtures of Ohio test sections were both graded as PG 82-16 with a standard traffic
“S” level.
It was expected that the LEADCAP additive would improve the performance grade
of the recovered asphalt binder however, this goal was not achieved. This can be attributed
to the existence of RAP materials in the asphalt mixtures as the LEADCAP additive was
not originally created to improve the aged asphalt binder in the RAP materials.
Table 5.21 Rheological Properties of the Extracted Asphalt Binder from the Iowa HMA
Test Section Property Test Results Specification Test Method
Tests on Original Binder
Flash Point, °C NT 230 Min AASHTO T48
Solubility NT 99% Min AASHTO T44
Rotational viscosity at 135°C, Pa-s NT 3.0 Max AASHTO T316
Dynamic shear, G*/sin at 82°C (10 rad/s), kPa 1.363 1.00 Min AASHTO T315
Tests on Residue from RTFO, AASHTO T240
Mass loss, % NT 1.00% Max AASHTO T240
Dynamic shear, G*/sin at 82°C (10 rad/s), kPa 2.3255 2.20 Min AASHTO T315
Multiple Stress Creep and Recovery (MSCR) of Asphalt Binder at 82°C AASHTO TP 70-11
Non-recoverable creep compliance, Jnr3.2, kpa-1 3.95 Max, 4.0 kpa-1 Standard Traffic "S"
Percent difference between Jnr3.2
and J
nr0.1, J
nrdiff, % 39.7 Max, 75%
Tests on Residue from Pressure Aging Vessel, AASHTO R28 @ 100°C
Dynamic shear, G*sin at 28°C (10 rad/s), kPa 3675.5 5000 Max AASHTO T315
Creep Stiffness at -6°C
AASHTO T313 S-value, MPa 80.95 300 Max
m-value 0.367 0.300 Min
The Performance Grade of this Asphalt Binder is PG 82-16

122
Table 5.22 Rheological Properties of the Extracted Asphalt Binder from the Iowa WMA
Test Section Property Test Results Specification Test Method
Tests on Original Binder
Flash Point, °C NT 230 Min AASHTO T48
Solubility NT 99% Min AASHTO T44
Rotational viscosity at 135°C, Pa-s NT 3.0 Max AASHTO T316
Dynamic shear, G*/sin at 70°C (10 rad/s), kPa 1.12 1.00 Min AASHTO T315
Tests on Residue from RTFO, AASHTO T240
Mass loss, % NT 1.00% Max AASHTO T240
Dynamic shear, G*/sin at 70°C (10 rad/s), kPa 2.6875 2.20 Min AASHTO T315
Multiple Stress Creep and Recovery (MSCR) of Asphalt Binder at 70°C AASHTO TP 70-11
Non-recoverable creep compliance, Jnr3.2, kpa-1 1.815 Max, 2.0 kpa-1 Heavy Traffic "H"
Percent difference between Jnr3.2
and J
nr0.1, J
nrdiff, % 33.7 Max, 75%
Tests on Residue from Pressure Aging Vessel, AASHTO R28 @ 100°C
Dynamic shear, G*sin at 22°C (10 rad/s), kPa 4726.5 5000 Max AASHTO T315
Creep Stiffness at -18°C
AASHTO T313 S-value, MPa 226 300 Max
m-value 0.3125 0.300 Min
The Performance Grade of this Asphalt Binder is PG 70-28
Table 5.23 Rheological Properties of the Extracted Asphalt Binder from the Minnesota
HMA Test Section
Property Test Results Specification Test Method
Tests on Original Binder
Flash Point, °C NT 230 Min AASHTO T48
Solubility NT 99% Min AASHTO T44
Rotational viscosity at 135°C, Pa-s NT 3.0 Max AASHTO T316
Dynamic shear, G*/sinδ at 76°C (10 rad/s), kPa 1.914 1.00 Min AASHTO T315
Tests on Residue from RTFO, AASHTO T240
Mass loss, % NT 1.00% Max AASHTO T240
Dynamic shear, G*/sinδ at 76°C (10 rad/s), kPa 3.26 2.20 Min AASHTO T315
Multiple Stress Creep and Recovery (MSCR) of Asphalt Binder at 76°C AASHTO TP 70-11
Non-recoverable creep compliance, Jnr3.2, kpa-1 2.755 Max, 4.0 kpa-1 Standard Traffic "S"
Percent difference between Jnr3.2
and J
nr0.1, J
nrdiff, % 34.65 Max, 75%
Tests on Residue from Pressure Aging Vessel, AASHTO R28 @ 100°C
Dynamic shear, G*sinδ at 25°C (10 rad/s), kPa 3929.5 5000 Max AASHTO T315
Creep Stiffness at -12°C
AASHTO T313 S-value, MPa 161 300 Max
m-value 0.3165 0.300 Min
The Performance Grade of this Asphalt Binder is PG 76-22

123
Table 5.24 Rheological Properties of the Extracted Asphalt Binder from the Minnesota
WMA Test Section Property Test Results Specification Test Method
Tests on Original Binder
Flash Point, °C NT 230 Min AASHTO T48
Solubility NT 99% Min AASHTO T44
Rotational viscosity at 135°C, Pa-s NT 3.0 Max AASHTO T316
Dynamic shear, G*/sinδ at 76°C (10 rad/s), kPa 1.78 1.00 Min AASHTO T315
Tests on Residue from RTFO, AASHTO T240
Mass loss, % NT 1.00% Max AASHTO T240
Dynamic shear, G*/sinδ at 76°C (10 rad/s), kPa 2.30426 2.20 Min AASHTO T315
Multiple Stress Creep and Recovery (MSCR) of Asphalt Binder at 76°C AASHTO TP 70-11
Non-recoverable creep compliance, Jnr3.2, kpa-1 3.405 Max, 4.0 kpa-1 Standard Traffic "S"
Percent difference between Jnr3.2
and J
nr0.1, J
nrdiff, % 25.85 Max, 75%
Tests on Residue from Pressure Aging Vessel, AASHTO R28 @ 100°C
Dynamic shear, G*sinδ at 28°C (10 rad/s), kPa 3548.5 5000 Max AASHTO T315
Creep Stiffness at -12°C
AASHTO T313 S-value, MPa 188 300 Max
m-value 0.3055 0.300 Min
The Performance Grade of this Asphalt Binder is PG 76-22
Table 5.25 Rheological Properties of the Extracted Asphalt Binder from the Ohio HMA
Test Section Property Test Results Specification Test Method
Tests on Original Binder
Flash Point, °C NT 230 Min AASHTO T48
Solubility NT 99% Min AASHTO T44
Rotational viscosity at 135°C, Pa-s NT 3.0 Max AASHTO T316
Dynamic shear, G*/sinδ at 82°C (10 rad/s), kPa 2.2219 1.00 Min AASHTO T315
Tests on Residue from RTFO, AASHTO T240
Mass loss, % NT 1.00% Max AASHTO T240
Dynamic shear, G*/sinδ at 82°C (10 rad/s), kPa 3.3917 2.20 Min AASHTO T315
Multiple Stress Creep and Recovery (MSCR) of Asphalt Binder at 82°C AASHTO TP 70-11
Non-recoverable creep compliance, Jnr3.2, kpa-1 2.87 Max, 4.0 kpa-1 Standard Traffic "S"
Percent difference between Jnr3.2
and J
nr0.1, J
nrdiff, % 70.4 Max, 75%
Tests on Residue from Pressure Aging Vessel, AASHTO R28 @ 100°C
Dynamic shear, G*sin at 28°C (10 rad/s), kPa 4399.5 5000 Max AASHTO T315
Creep Stiffness at -6°C
AASHTO T313 S-value, MPa 119 300 Max
m-value 0.372 0.300 Min
The Performance Grade of this Asphalt Binder is PG 82-16

124
Table 5.26 Rheological Properties of the Extracted Asphalt Binder from the Ohio WMA
Test Section Property Test Results Specification Test Method
Tests on Original Binder
Flash Point, °C NT 230 Min AASHTO T48
Solubility NT 99% Min AASHTO T44
Rotational viscosity at 135°C, Pa-s NT 3.0 Max AASHTO T316
Dynamic shear, G*/sinδ at 82°C (10 rad/s), kPa 2.43695 1.00 Min AASHTO T315
Tests on Residue from RTFO, AASHTO T240
Mass loss, % NT 1.00% Max AASHTO T240
Dynamic shear, G*/sinδ at 82°C (10 rad/s), kPa 3.06645 2.20 Min AASHTO T315
Multiple Stress Creep and Recovery (MSCR) of Asphalt Binder at 82°C AASHTO TP 70-11
Non-recoverable creep compliance, Jnr3.2, kpa-1 3.745 Max, 4.0 kpa-1 Standard Traffic "S"
Percent difference between Jnr3.2
and J
nr0.1, J
nrdiff, % 62.85 Max, 75%
Tests on Residue from Pressure Aging Vessel, AASHTO R28 @ 100°C
Dynamic shear, G*sinδ at 28°C (10 rad/s), kPa 4330 5000 Max AASHTO T315
Creep Stiffness at -6°C
AASHTO T313 S-value, MPa 109 300 Max
m-value 0.3835 0.300 Min
The Performance Grade of this Asphalt Binder is PG 82-16
5.4.2. Asphalt Bond Strength (ABS) Test Results
As described earlier, the test was done on all the extracted asphalt binders from all
HMA and WMA mixtures used for test sections. Both unconditioned and moisture
conditioned cases were considered during the ABS test. The ABS test results are shown in
Table 5.27 and plotted in Figure 5.25 with the numbers above the bars representing the
average values and the whiskers representing the standard deviation. Overlapping of the
standard deviation implies the similarity in the measured ABS between the asphalt types.
Table 5.27 ABS Test Results of Extracted Asphalt Binders.
Mix Type/Asphalt Grade Unconditioned Samples Conditioned Samples
Average, psi St. Dev. Failure Mode Average, psi St. Dev. Failure Mode
Iowa_HMA/PG82-16 490.0 50.3 76% Cohesion 269.7 38.7 80% Adhesion
Iowa_RAPCAP/PG70-28 519.7 12.6 76% Cohesion 322.3 5.5 65% Cohesion
Minnesota _HMA/PG76-22 488.7 52.3 53% Cohesion 426.0 32.2 85% Cohesion
Minnesota _LEADCAP/PG76-22 490.7 41.0 73% Cohesion 391.3 22.0 73% Cohesion
Ohio_HMA/PG82-16 567.0 16.5 76% Cohesion 200.7 12.5 77% Adhesion
Ohio_LEADCAP/PG82-16 475.3 14.5 76% Cohesion 192.0 12.2 78% Adhesion

125
Figure 5.25 ABS Test Results of Extracted Asphalt Binders.
As can be seen from the ABS test results, the following observations can be made;
Iowa Test Sections
Both HMA and WMA samples exhibited similar unconditioned ABS values and
significantly lower conditioned ABS values than the unconditioned ABS values. However
the WMA samples exhibited significantly higher conditioned ABS values than those
obtained for HMA samples. Both HMA and WMA mixtures are susceptible to moisture
damage, however the WMA shows less susceptibility to moisture damage, which can be
attributed to the RAPCAP additive ability to improve the non-recoverable creep
compliance and the percent recovery of the recovered asphalt binder.
Minnesota Test Sections
Both HMA and WMA samples exhibited similar unconditioned ABS values and
slightly lower conditioned ABS values comparing to those obtained for unconditioned ABS
490.0519.7
488.7 490.7
567.0
475.3
269.7
322.3
426.0
391.3
200.7 192.0
140.0
190.0
240.0
290.0
340.0
390.0
440.0
490.0
540.0
590.0
640.0
690.0
Iowa_HMA Iowa_WMA Minnesota _HMAMinnesota _WMA Ohio_HMA Ohio_WMA
Bo
nd
Str
ength
at
25
°C (
77
°F
) ,
psi
Mix Type
Unconditioned Conditioned
Limestone Agg_IA & 38%RAP Granite Agg_MN & 25%RAP Limestone Agg_OH & 20%RAP

126
values. WMA samples exhibited slightly lower conditioned ABS values than those
obtained for the HMA samples, however both HMA and WMA samples from Minnesota
showed higher conditioned ABS values than Iowa and Ohio test sections samples, which
shows their high resistance to moisture damage during the ABS test.
Ohio Project Test Sections
HMA samples from Ohio exhibited the highest unconditioned ABS values among
all other samples from other test sections. Also, HMA samples exhibited significantly
higher unconditioned ABS values than those obtained for WMA samples. Both HMA and
WMA samples exhibited similar conditioned ABS values and significantly lower than
unconditioned ABS values. The conditioned ABS values obtained from OHP for both HMA
and WMA samples were the least ABS values among all other samples from other test
sections, which shows their very low resistance to moisture damage during the ABS test.
All test results obtained for each test section are summarized in Table 5.28

127
Table 5.28 Summary of All Test Results obtained for Each Test Section
Test Results
Iowa Test Sections Minnesota Test Sections Ohio Test Sections
RAPCAP HMA LEADCAP
6-8 HMA
LEADCAP
7-1 HMA
Field Density, % 93.9 94.3 93.6 94.5 94.6 95.2
HWT Total Rut Depth, mm 4.5 2.6 8.2 5.4 8.8 3.2
SIP, Passes >20000 >20000 >20000 >20000 >20000 >20000
Modified
Lottman
Test
Unconditioned ITS, psi 168 208 130 139 149 187
Conditioned ITS, psi 142 200 108 133 151 180
TSR, % 84 96 83 95 101 96
Asphalt
Bond
Strength
(ABS)
Unconditioned ABS, psi 519.7 490 490.7 488.7 475.3 567
Unconditioned Mode of Failure, % 76%
Cohesion
76%
Cohesion
73%
Cohesion
53%
Cohesion
76%
Cohesion
76%
Cohesion
Conditioned ABS, psi 322.3 269.7 391.3 426 192 200.7
Conditioned Mode of Failure, % 65%
Cohesion
80%
Adhesion
73%
Cohesion
85%
Cohesion
78%
Adhesion
77%
Adhesion
Extracted Asphalt Performance Grade PG70-28 PG82-16 PG76-22 PG76-22 PG82-16 PG82-16
MSCR
Test
Non-recoverable Creep Compliance, Jnr3.2, kpa-1 1.82 3.95 3.41 2.76 3.75 2.87
Percent difference between Jnr3.2
and J
nr0.1, J
nrdiff, % 33.7 39.7 25.85 34.65 62.85 70.4
Pavement Condition, Index (PCI), % 72 72 42 42 100 100

128
CHAPTER 6 SUMMARY OF FINDININGS
This study presents both laboratory and field evaluation of the rutting and the
moisture sensitivity of WMA mixtures, which contain varying amounts of RAP materials.
The performance of the WMA mixtures was compared against the conventional HMA
mixtures prepared using the same materials with regard to rutting and moisture-induced
damage. This study used aggregate and RAP sources from three different states; Iowa,
Minnesota and Ohio along with three different WMA technologies; RAPCAP, LEADCAP
6-8 and LEADCAP 7-1, respectively. Combinations of the aggregate types, RAP contents
and WMA additives were evaluated in the laboratory and in the field to study their effect
on the performance of WMA mixtures compared to HMA. Test sections were constructed
in three different geographical locations in Iowa, Minnesota and Ohio. The conclusions
and future study recommendations are discussed below.
6.1. Conclusions
Based on the experimental test results, the following conclusions can be made:
For Hamburg Wheel Tracking (HWT) test, it was found that RAP content had a
significant impact on the moisture susceptibility of both HMA and WMA mixtures.
With RAP materials less than 50% by binder replacement, WMA mixture with
LEADCAP did not perform as well as HMA mixtures. However, with RAP
materials of 50% or more, both WMA and HMA performed well with little or no
rutting. It can be concluded that RAP materials improve the moisture susceptibility
of both WMA and HMA mixtures.
It was also found that, for the given RAP amount, WMA mixture with a RAPCAP

129
additive exhibited less moisture susceptibility than the other WMA mixtures.
Based on the modified Lottman test, it was found that both HMA and WMA mixture
with RAPCAP additive had a high resistance to moisture damage.
Based on the asphalt bond strength (ABS) test following AASHTO TP 91-11, it can
be concluded that removing the pullout stub’s edge (i.e. 0.0 mm thickness)
produced more consistent and reasonable test results by producing a thin layer of
asphalt as expected.
Asphalt binder type had a significant impact on the ABS test results.
The test sections of WMA using LEADCAP/RAPCAP were successfully
constructed in three different states and met field density requirements by each state
DOT.
All WMA mixtures in the three test sections were found to be workable and easy to
compact while producing less fumes and emissions during construction.
All HMA and WMA field samples from the test sections passed the HWT test and
exhibited high resistance to rutting and moisture damage.
Both WMA and HMA Iowa test sections in Iowa exhibited joint reflection cracking
after 6 months of construction due to a severe winter season However, the WMA
test section exhibited less joint reflection cracking than the HMA test section. Both
WMA and HMA test sections in Minnesota exhibited a similar level of distress after
19 months since construction that include joint reflection cracking and edge
cracking.
Both WMA and HMA Ohio test sections exhibited a good condition after 6 months
since construction. It should be noted that the Ohio test sections were constructed

130
on top of an old asphalt pavement layer, which has no joint reflection cracks unlike
the other two test sections in Iowa and Minnesota.
The high and low temperature grades of the recovered asphalts from test locations
were higher than the targeted temperature grade due to the presence of RAP in the
mixtures except for the asphalt binder extracted from the WMA with a RAPCAP
additive.
It can be concluded that the RAPCAP additive significantly improves the
rheological properties of the extracted asphalt binder from RAP materials while
lowering the production temperature of the mix.
RAPCAP additive significantly improved the non-recoverable creep compliance
and percent recovery of the asphalt binder during the MSCR test.
Based on the Asphalt Bond Strength (ABS) test, HMA conditioned samples from
Iowa and both HMA and WMA_LEADCAP conditioned samples from Ohio test
sections failed in adhesion mode whereas all unconditioned samples failed in
cohesion mode.
The repeatability of the ABS test method was poor due to the wide variability of
the test materials such as aggregate plates, asphalt binder and pullout stubs.
6.2. Recommendations for Future Study
Since WMA additive known as “RAPCAP” significantly improved the
rheological properties of the aged asphalt binder within the RAP materials, more detailed
asphalt binder analysis mixed with extracted asphalt binders from RAP materials should
be performed.
In order to predict a long-term performance of WMA with a RAPCAP additive,

131
WMA pavements with varying RAP amounts should be constructed on well-prepared
based layer
In order to improve the repeatability of ABS test, more tests should be performed
on various aggregate surfaces, different asphalt binders, and different conditioning
methods.

132
REFERENCES
1. Bonaquist, R., Advanced Asphalt Technologies, LLC, “Mix Design Practices for
Warm Mix,” Interim Report NCHRP 9-43, National Cooperative Highway Research
Program, Transportation Research Board, 2008.
2. Anderson, R.M.; Baumgardner, G.; May, R.; Reinke, G, “Engineering Properties,
Emissions, and Field Performance of Warm Mix Asphalt Technologies,” Interim
Report NCHRP 9-47, National Cooperative Highway Research Program on Project,
October 2008.
3. Ahmed, Taha A.; Hajj, Elie Y.; Sebaaly, Peter E.; Majerus, Nate, “Influence of
Aggregate Source and Warm-Mix Technologies on the Mechanical Properties of
Asphalt Mixtures,” Advances in Civil Engineering Materials, Vol. 2, No. 1, 2013, PP.
1–19.
4. Hanz, A.; Faheem, A.; Mahmoud, E.; Bahia, H, “Measuring Effects of Warm-Mix
Additives Using a Newly Developed Asphalt Binder Lubricity Test for DSR,”
Transportation Research Board of the National Academies, Washington, DC, 2010,
PP. 85-92.
5. Kevin D. Hall; Stacy G. Williams, “Acquisition and Evaluation of Hamburg Wheel-
Tracking Device,” Technical Report MBTC FR-1044, Mack-Blackwell
Transportation Center, University of Arkansas, Fayetteville, AR, April 1999.
6. Kandhal, P.S.; Cooley, L.A., Jr., “Accelerated Laboratory Rutting Test: Evaluation of
the Asphalt Pavement Analyzer,” NCHRP Report 508, Transportation Research
Board, Washington, D.C., 2003.
7. G. W. Maupin, Jr.; David W. Mokarem, “Investigation of AASHTO Rut Test
Procedure Using the Asphalt Pavement Analyzer,” Report No. VTRC 07-R11,
Virginia Department of Transportation, October 2006.
8. Pavement Interactive, “Pavement Management, Pavement Distresses, Flexible
Pavement Distress, Rutting,” Obtained from
http://www.pavementinteractive.org/article/rutting/. Site last accessed November
2013.
9. Flexible Pavements of Ohio, “Preventing and Correcting Rutting in Asphalt
Pavements,” Ohio Asphalt Newsletter, Volume 1, Issue 3, 2004, pp. 12–16. Obtained
from http://www.flexiblepavements.org/ohio-asphalt?page=1. Site last accessed
November 2013.
10. Larry Santucci, “Rut Resistant Asphalt Pavements,” Technical topics article,
Technology Transfer Program, UC Berkeley’s Institute of Transportation Studies,
2001. Obtained from http://www.techtransfer.berkeley.edu/techtopics/. Site last
accessed November 2013.

133
11. Brown, E.R.; Kandhal, P.S.; Zhang, J., “Performance Testing for Hot Mix Asphalt,”
NCAT Report No. 01-05, National Center for Asphalt Technology, Auburn,
November 2001.
12. Pavement Interactive, “HMA Performance Tests,” Obtained from
http://www.pavementinteractive.org/article/hma-performance-tests/. Site last accessed
November 2013.
13. Ulloa, A. C., “Characteristic of Dynamic Triaxial Testing of Asphalt Mixtures,” MSc.
Thesis, University of Nevada, Reno, December 2009.
14. Taha A. Ahmed, “Laboratory Evaluation of Warm Mix Asphalt Mixtures in South
Dakota, USA,” MSc. Thesis, University of Nevada, Reno, August 2011.
15. Witczak, M. W.; Kaloush, K.; Pellinen, T.; El-Basyouny, M.; Von Quintus, H.,
“Simple Performance Test for Superpave Mix Design,” Report No NCHRP 465,
National Cooperative Highway Research Program, Transportation Research Board,
2002.
16. Cooley, L.A.; Kandhal, P.S.; Buchanan, M.S.; Fee, F.; Epps, A., “Loaded Wheel
Testers in the United States: State of the Practice,” NCAT Report No. 2000-4,
National Center for Asphalt Technology, Auburn, 2000.
17. Little, D. N. Jr.; Jones, D. R. IV., “Chemical and Mechanical Processes of Moisture
Damage in Hot-Mix Asphalt Pavements,” National Seminar, TRB Committee on
Bituminous–Aggregate Combinations to Meet Surface Requirements Transportation
Research Board (TRB), San Diego, CA, February 2003, pp. 37–74.
18. Pavement Interactive, “Moisture Susceptibility,” Obtained from
http://www.pavementinteractive.org/article/moisture-susceptibility/. Site last accessed
November 2013.
19. Kiggundu, B. M.; Roberts, F. L., “The Success/Failure of Methods Used to Predict
the Stripping Potential in the Performance of Bituminous Pavement Mixtures,”
NCAT Report No. 88-03, National Center for Asphalt Technology, Auburn, January
1988.
20. Terrel, R. L.; Al-Swailmi, S., “Water Sensitivity of Asphalt–Aggregate Mixes: Test
Selection,” SHRP Report A-403, Strategic Highway Research Program, National
Research Council, Washington, D.C. June 1994.
21. Schmidt, R. J.; Graf, P. E., “The Effect of Water on the Resilient Modulus of Asphalt
Treated Mixes,” Proc., Association of Asphalt Paving Technologists, Vol. 41, 1972,
pp. 118–162.

134
22. Tarrer, A. R.; Wagh, V., “The Effect of the Physical and Chemical Characteristics of
the Aggregate on Bonding,” Strategic Highway Research Program, National Research
Council, Washington, D.C, 1991.
23. Kennedy, T. W.; Roberts, F. L.; Lee, K. W., “Evaluation of Moisture Susceptibility of
Asphalt Mixtures Using the Texas Freeze–Thaw Pedestal Test,” Proc., Association of
Asphalt Paving Technologists, Vol. 51, February 1982, pp. 327–341.
24. Solaimanian, M.; Harvey, J.; Tahmoressi, M.; Tandon, V., “Test Methods to Predict
Moisture Sensitivity of Hot-Mix Asphalt Pavements,” National Seminar, TRB
Committee on Bituminous–Aggregate Combinations to Meet Surface Requirements
Transportation Research Board (TRB), San Diego, CA, February 2003, pp. 77–113.
25. Kennedy, T. W.; Roberts, F. L.; Anagnos, J. N., “Texas Boiling Test for Evaluating
Moisture Susceptibility of Asphalt Mixtures,” Research Report 253-5. Center for
Transportation Research, University of Texas at Austin, Jan 1984.
26. Cooley, Jr.; Prowell, B. D.; Hainin, M. R.; Buchanan, M. S.; Harrington, J., “Bulk
Specific Gravity Round Robin Using the Corelok Vacuum Sealing Device,” National
Center for Asphalt Technology (NCAT) Report No. 02-11. November 2002.
27. National Lime Association, “Adding Hydrated Lime to Hot Mix Asphalt,” obtained
from http://www.lime.org/uses_of_lime/construction/asphalt.asp. Site last accessed
December 2013.
28. Kandhal, P.; Mallick, R. B., “Pavement Recycling Guidelines for State and Local
Governments Participant’s Reference Book,” Report No. FHWA-SA-98-042, Federal
Highway Administration, Washington, D.C., 1997. Obtained from
http://www.fhwa.dot.gov/pavement/recycling/98042/. Site last accessed November
2013.
29. Fujie Zhou; Sheng Hu; Gautam Das; Tom Scullion, “High RAP Mixes Design
Methodology with Balanced Performance,” Report No. 0-6092-2, Texas Department
of Transportation, November 2011.
30. R. West, “Performance Studies of Asphalt Pavements with Greater than 25% RAP,”
Presented at RAP ETG meeting in December 2009. Obtained from
http://www.morerap.us/files/meetings/12-09/west-performance-studies-asphalt-
pavements.pdf. Site last accessed November, 2013.
31. Copeland, A., “Reclaimed Asphalt Pavement in Asphalt Mixtures: State of the
Practice,” FHWA-HRT-11-021, April 2011.
32. Federal Highway Administration (FHWA), “User Guidelines for Waste and
Byproduct Materials is Pavement Construction,” FHWA-RD-97-148, 2008. Obtained
from

135
https://www.fhwa.dot.gov/publications/research/infrastructure/structures/97148/intro.
cfm. Site last accessed November 2013.
33. McDaniel, R.; Soleymani, H.; Anderson, R.; Turner, P.; Peterson, R., “Recommended
Use of Reclaimed Asphalt Pavement in the Superpave Mix Design Method,” NCHRP
Web Document 30, Transportation Research Board, October 2000.
34. Beeson, M.; Prather, M.; Huber, G., “Characterization of Reclaimed Asphalt
Pavement in Indiana: Changing INDOT Specification for RAP,” Paper Number 11-
1055, Transportation Research Board, July 2010.
35. D'Angelo, J.; Harm, E.; Barloszek, J.; Baumgardner, G.; Carrigan, M.; Cowsert, J,
“Warm-Mix Asphalt: European Practice,” Alexandria, VA: Federal Highway
Administration, FHWA-PL-08-007, 2008.
36. Prowell, B. D.; Hurley, G. C., “Warm-Mix Asphalt: Best Practices,” Quality
Improvement Series 125, National Asphalt Pavement Association, NAPA: Lanham,
MD, 2007.
37. Sasol Wax North America Corporation, “Sasobit Asphalt Technology,” Obtained
from http://www.sasolwax.us.com/index.html. Site last accessed November 2013.
38. Lee, H.; Glueckert, T.; Ahmed, T.; Kim, Y.; Baek, C.; Hwang, S., “Laboratory
Evaluation and Field Implementation of Polyethylene Wax-Based Warm Mix Asphalt
Additive in USA”, International Journal of Pavement Research and Technology,
Vol.6 No.5 September 2013, pp. 547-553.
39. Hurley, G.C.; Prowell, B.D., “Evaluation of Sasobit for Use in Warm Mix Asphalt,”
NCAT Report 05-06, National Center for Asphalt Technology, 2005.
40. MeadWestvaco Asphalt Innovations, “Evotherm Warm Mix,” Obtained from
https://www.meadwestvaco.com/Products/MWV002106. Site last accessed
November 2013.
41. PQ Corporation, “Advera® WMA Warm Mix Asphalt,” Obtained from
http://www.pqcorp.com/Literature/adverawmapamphlet.pdf. Site last accessed
November 2013.
42. Ala R. Abbas; Ayman Ali, “Mechanical Properties of Warm Mix Asphalt Prepared
Using Foamed Asphalt Binders,” Report No. FHWA/OH-2011/6, Ohio Department
of Transportation, 2011.
43. Wirtgen GmbH, “Wirtgen Cold Recycling Manual, Windhagen,” Germany, 2nd
edition, 2004.

136
44. Bonaquist, R., Advanced Asphalt Technologies, LLC, “Mix Design Practices for
Warm Mix,” Report No NCHRP 691, National Cooperative Highway Research
Program, Transportation Research Board, 2011.
45. American Association of State Highway and Transportation Officials, “Standard
Specifications of Transportation Materials and Methods of Sampling and Testing,”
29th Edition [CD-ROM], 2009.
46. Defelsko Company, “PosiTest, Pull-off Adhesion Tester Operational Manual,”
Obtained from http://www.defelsko.com/adhesion-tester/adhesiontester.htm. Site last
accessed November 2013.
47. Raquel, M; Raul, V.; Bahia, H. U., “Measuring the Effect of Moisture on Asphalt–
Aggregate Bond with the Bitumen Bond Strength Test,” Transportation Research
Board, Washington, DC, 2009, PP. 70-81.
48. US Army Corps of Engineers, “User Manual MicroPaver 6.5.1,” March 2011.
49. “City of Glendale Pavement Management System Update,” Final Report, MNIS
Incorporated, February 2010.