Project conducted at: Danish Road Institute WARM MIX ASPHALT INVESTIGATION
111
Project conducted at: TECHNICAL UNIVERSITY OF DENMARK Department of Civil Engineering Home university: RIGA TECHNICAL UNIVERSITY Faculty of Civil Engineering Institute of Transportation In cooperation with: Danish Road Institute Martins ZAUMANIS Student number (RTU): 041RBK019 Student number (DTU): s094256 WARM MIX ASPHALT INVESTIGATION Master of Science Thesis Revised after presentation Supervisors: J. M. Jansen (DTU) J. Smirnovs (RTU) Consultants: E. Olesen (Danish Road Institute) E. Nielsen (Danish Road Institute) Kgs.Lyngby, Denmark 2010
-
Upload
independent -
Category
Documents
-
view
6 -
download
0
Transcript of Project conducted at: Danish Road Institute WARM MIX ASPHALT INVESTIGATION
Project conducted at: TECHNICAL UNIVERSITY OF DENMARK
Department of Civil Engineering
Home university: RIGA TECHNICAL UNIVERSITY
Faculty of Civil Engineering Institute of Transportation
In cooperation with:
Danish Road Institute
Martins ZAUMANIS Student number (RTU): 041RBK019
Student number (DTU): s094256
WARM MIX ASPHALT INVESTIGATION
Master of Science Thesis
Revised after presentation
Supervisors: J. M. Jansen (DTU) J. Smirnovs (RTU)
Consultants:
E. Olesen (Danish Road Institute) E. Nielsen (Danish Road Institute)
Kgs.Lyngby, Denmark
2010

2

Acknowledgments
3
ACKNOWLEDGMENTS I would like to sincerely thank everyone who has helped me complete my thesis. First I must thank for the life time opportunity to develop my research in DTU and Danish Road Directorate and for all the trouble I have caused them. All the help and guidance form laboratory stuff was invaluable. But mostly I am grateful to my supervisors, Erik Nielsen, Erik Olesen and Jan Jansen for their guidance and advices during the development of my thesis and for all the hours spent in discussions on asphalt in general.
I would also like to thank Juris Krievs, because without his help I would not be able to develop my thesis in Denmark at the first place.
Finally, I would like to thank my family and friends for their support.

4
Abstract
5
ABSTRACT Warm Mix Asphalt (WMA) is a technology that allows significant lowering of the production and paving temperature of conventional Hot Mix Asphalt (HMA). By reducing the viscosity of bitumen and/or increasing the workability of mixture, some WMA technologies can reduce the temperature to 100oC and even lower without compromising the performance of asphalt. This promises various benefits over HMA, e.g. lowering the greenhouse gas emissions, lowering energy consumption, improved working conditions, better workability and compaction, etc. This thesis provides detailed review of these benefits and the possible specialisations for implementation of WMA.
Despite the promising performance in comparison with HMA, this technology has not yet gained acceptance in asphalt industry. In order to reach widespread implementation it is necessary to prove that WMA has the same or better characteristics and long term performance as HMA. The potential problem areas and the results from research on the performance of different WMA technologies are discussed. A total of twenty two WMA products are reported including a description of the temperature reduction principle, the basic characteristics and for most of them also production technology.
A laboratory study was conducted to evaluate two different WMA technologies – Sasobit and Rediset WMX. At first the properties of bitumen were evaluated after modification with these products. The results of the study indicated that the two warm asphalt additives affected the binder differently. It was observed that the addition of Sasobit reduced the viscosity of the binder at high temperatures and lowered it at intermediate temperatures, whereas the addition of Rediset WMX changed the bitumen properties only slightly.
The mixture characteristics for these products were evaluated at four different temperatures after using two different compaction methods. The density results were found to be dependent on the compaction method, suggesting that further testing should be performed to evaluate the impact of the mechanical test results from the way of compaction. The results also indicated that curing of the mixture is necessary to provide adequate evaluation of WMA compared to HMA. The testing results of stiffness and permanent deformations suggested that it is possible to lower the compaction temperature of both products to at least 125oC without significant changes in the results of these properties compared to reference HMA.
A Life Cycle Inventory calculation for the energy consumption by the asphalt industry was performed in order to assess the differences between different WMA processes and conventional HMA. The results showed 5% to 18% energy gain for the WMA and indicated that the amount of reduction is mostly attributed to the reduction in heating temperature of the production plant. Since fossil fuel is mostly used as the energy source it was also proved that the reduction has direct effect on the reduction of greenhouse gases in the atmosphere.
There are 111 pages in the thesis, including 33 tables, 62 figures, 6 equations, 92 literature sources and 4 appendices. Five different binder types were prepared and 37 test results are reported. Three different asphalt mixtures were prepared, 31 asphalt specimens were compacted and 78 test results are included in the research.
Abstract
6
ABSTRACT Beskrivele af “Varnm Mix”asphalt.
Varm Mix Asfalt (WMA) er en teknologi, der tillader en signifikant reduktion af blandings- og udlægningstemperaturen af varmblandet asfalt (HMA). Ved at reducere viskositeten af bitumen og/eller hæve bearbejdeligheden af blandingen, kan nogle WMA teknologier reducere temperaturen til 100 °C eller lavere, uden at gå på kompromis med kvaliteten af asfaltarbejdet. Dette resulterer i forskellige fordele for asfaltarbejdet, f. eks sænke udledningen af drivhusgasser, sænker energiforbruget, bedre arbejdsmiljø, bedre bearbejdelighed og komprimering osv. Denne afhandling indeholder en detaljeret gennemgang af disse fordele og de mulige omstændigheder for implementeringen af WMA.
På trods af lovende resultater i forhold til HMA, er teknologien endnu ikke implementeret i branchen. Før dette er det nødvendigt at dokumentere, at WMA har den samme eller bedre egenskaber samt funktionsevne som HMA. De potentielle problemområder, og resultaterne fra undersøgelser af forskellige WMA teknologier diskuteres. I alt 22 WMA produkter er rapporteret herunder en beskrivelse af princippet for reduktion af temperaturen, de grundlæggende egenskaber og for de fleste af dem også produktionsteknologien.
En laboratorieundersøgelse blev udført for at evaluere to forskellige WMA teknologier - Sasobit og Rediset WMX. Indledende blev egenskaber af bitumen undersøgt efter modifikation med disse additiver. Resultaterne af undersøgelsen viste, at de to WMA additiver påvirkede bindemiddel forskelligt. Det blev observeret, at tilsætningen af Sasobit reducerede viskositeten af bindemidlet ved høje temperaturer mens tilsætning af Rediset WMX kun i begrænset omfang ændret bitumenegenskaberne.
Blandings karakteristika for disse produkter er blevet vurderet ved fire forskellige temperaturer efter at have brugt to forskellige komprimeringsmetoder. Densiteten er fundet til at være afhængig af komprimeringsmetoden, hvilket tyder på, at yderligere undersøgelser bør udføres for at undersøge de to metoders indflydelse på komprimeringen. Resultaterne viser også, at hærdning af blandingen er nødvendigt for at opnå en passende bedømmelse af WMA i forhold til HMA. Testresultaterne af stivhed og permanent deformationer viste, at det er muligt at reducere komprimeringstemperaturen for begge produkter til mindst 125°C uden væsentlige ændringer i resultaterne af disse egenskaber i sammenligning med HMA som reference.
En ”Life Cycle Inventory” beregning af energiforbruget ved asfaltproduktion blev udført med henblik på at vurdere forskellene mellem forskellige WMA processer og traditionel HMA. Resultaterne viste mindst 5 % mindre energiforbrug for WMA, og indikerede, at yderligere reduktioner er mulige med reduktion af blandetemperaturen på asfaltanlægget.
Da fossile brændstoffer som regel bruges som energikilde blev det også vist, at reduktionen har direkte virkning for nedbringelsen af drivhusgasser i atmosfæren.
Rapporten har 111 sider, herunder 33 tabeller, 62 figurer, 6 ligninger, 92 litteraturhenvisninger og 4 bilag. Der er præpareret 5 forskellige bindemidler og der er rapporteret 37 testresultater. Der er præpareret 5 forskellige asfaltblandinger. Der blev fremstillet 31 asfaltprøver og 78 testresultater er inkluderet i undersøgelsen.
Abstrakts
7
ABSTRAKTS Nosaukums latviešu valodā: „Silto Asfalta Maisījumu Izpēte”.
Tehnoloģijas, kas būtiski ļauj samazināt karsto asfalta maisījumu (HMA) ražošanas un ieklāšanas temperatūru tiek sauktas par siltiem asfalta maisījumiem (WMA). Pateicoties samazinātai bitumena viskozitātei un uzlabotai iestrādājamībai, dažas WMA tehnoloģijas dod iespēju pazemināt temperatūru līdz 100oC un pat vēl zemāk, nepasliktinot asfalta mehāniskās īpašības. Tas rada vairākas priekšrocības pār tradicionālajiem HMA, piemēram, samazināta atmosfēras piesārņošana, zemāks enerģijas patēriņš, uzlaboti darba apstākļi, vieglāka ietrādājamība un sablīvējamība u.c. Šis darbs piedāvā detalizētu šo priekšrocību izklāstu un iespējamas specializācijas WMA ieviešanai.
Neskatoties uz veiksmīgiem testēšanas rādītājiem salīdzinot ar HMA, šīs tehnoloģijas vēl nav guvušas lielu ievērību asfalta ražošanas industrijā. Lai nodrošinātu plašu ieviešanu komerciālajā ražošanā, ir nepieciešams pierādīt, ka WMA nodrošina tādas pašas vai labākas asfalta īpašības un ilgmūžību kā tradicionālie karstie asfalta maisījumi. Šajā darbā ir apskatītas potenciālās problēmas, kas saistītas ar WMA tehnoloģijām, kā arī ietverti rezultāti no dažādiem zinātniskiem pētījumiem. Kopskaitā ir aplūkoti 22 WMA produkti, norādīti temperatūras samazināšanas principi, produkta pamatīpašības un lielākajai daļai no tiem apskatīta arī ražošanas tehnoloģijas.
Lai izanalizētu divas WMA tehnoloģijas – Sasobit un Rediset WMX, tika veikts pētnieciskais darbs laboratorijā. Vispirms tika analizētas bitumena īpašības pēc dažāda daudzuma šo piedevu pievienošanas. Pētījuma rezultāti parādīja atšķirīgu ietekmi uz bitumenu katram no šiem produktiem un pie dažādām dozācijām. Sasobit pievienošana samazināja bitumena viskozitāti pie augstām temperatūrām, bet pazemināja pie vidējām un zemām. Savukārt Rediset WMX izmainīja bitumena īpašības tikai nedaudz.
Bituminētā maisījuma īpašības tika pētītas pie četrām dažādām temperatūrām un paraugi tika sagatavoti ar divām dažādām blīvēšanas metodēm. Tika noskaidrots, ka paraugu blīvums ir atkarīgs no sablīvēšanas metodes, kas norāda, ka nepieciešama papildu izpēte, lai noskaidrotu mehānisko testu rezultātu ietekmi no sablīvēšanas metodes un noteiktu korelāciju ar reāliem blīvēšanas darbiem uz ceļa. Testu rezultāti norādīja, ka, lai nodrošinātu adekvātu WMA un HMA salīdzzināšanu, ir nepieciešama maisījuma žāvēšana sablīvēšanas temperatūrā vismaz divas stundas. Stinguma un paliekošo deformāciju testa rezultāti norādīja, ka ir iespējams samazināt sablīvēšanas temperatūru abiem produktiem līdz vismaz 125oC nepasliktinot šo īpašību rādītājus.
Tika veikts aprēķins, lai noskaidrotu enerģijas patēriņu asfalta industrijas maisījuma ražošanas un ieklāšanas ciklam. Tika salīdzināts WMA un HMA enerģijas patēriņš septiņiem dažādiem modeļiem. Rezultāti uzrādīja 5% līdz 18% ietaupījumu kopējā ciklā un norādīja, ka ietaupījumu apjoms ir vislielākajā mērā atkarīgs no maisījuma ražošanas un ieklāšanas temperatūras samazinājuma. Tā kā šim procesam pārsvarā tiek lietota fosilā degviela, tad tika arī pierādīts, ka enerģijas samazināšana atstāj tiešu iespaidu uz atmosfēras piesārņojuma samazināšanu.
Darbā ir 111 lapaspuses, ieskaitot 33 tabulas, 62 attēlus, 6 formulas, 92 literatūras avotus un 4 pielikumus. Tika sagatavoti pieci dažādi bitumena paraugi un darbā iekļauti 37 testa rezultāti. Tika sagatavoti trīs dažādi asfalta maisījumi, sablīvēts 31 paraugs un ir iekļauti 78 testu rezultāti.
Table of contents
8
TABLE OF CONTENTS Acknowledgments ............................................................................................................ 3
Abstract ............................................................................................................................. 5
Abstract ............................................................................................................................. 6
Abstrakts ........................................................................................................................... 7
1. Introduction ............................................................................................................... 10 1.1. History ............................................................................................................................................ 10 1.2. Aims and tasks of the research ....................................................................................................... 10 1.3. Scope of the research .................................................................................................................... 10
2. Potential benefits and drawbacks ........................................................................... 12 2.1. Benefits .......................................................................................................................................... 12 2.2. Drawbacks ..................................................................................................................................... 13 2.3. Possible specialisation for WMA implementation............................................................................. 14
3. WMA technologies and description of products ................................................... 16 3.1. Classification of WMA technologies ................................................................................................ 16 3.2. Summary of WMA products ............................................................................................................ 16 3.3. Foaming technologies .................................................................................................................... 18 3.4. Organic or wax additives ................................................................................................................ 19 3.5. Chemical additives ......................................................................................................................... 20
4. WMA production technologies ................................................................................ 22 4.1. Principles ....................................................................................................................................... 22 4.2. Description of production technologies for specific products ............................................................ 24
5. Bitumen ..................................................................................................................... 31 5.1. Properties of bitumen ..................................................................................................................... 31 5.2. Consistency at intermediate and high temperatures ........................................................................ 32 5.3. Consistency at low temperatures .................................................................................................... 35 5.4. Durability - resistance to hardening ................................................................................................. 35 5.5. Connection between test methods and performance related properties ........................................... 39
6. Properties of WMA .................................................................................................... 42 6.1. Mixture evaluation methods ............................................................................................................ 42 6.2. Compaction .................................................................................................................................... 43 6.3. Curing ............................................................................................................................................ 45 6.4. Moisture sensitivity ......................................................................................................................... 47 6.5. Mixture stiffness ............................................................................................................................. 50 6.6. Permanent deformations ................................................................................................................ 52 6.7. Low temperature behaviour ............................................................................................................ 55
7. Mix design methods for WMA.................................................................................. 56 7.1. Traditional mix design methods ...................................................................................................... 56 7.2. Considerations regarding WMA design ........................................................................................... 57
8. Comparative costs .................................................................................................... 61 8.1. Savings .......................................................................................................................................... 61 8.2. Increases ....................................................................................................................................... 61
9. Environmental benefits of WMA .............................................................................. 62
Table of contents
9
10. Calculation of energy demand for WMA ................................................................. 64 10.1. Defining the system boundaries ..................................................................................................... 64 10.2. Energy demand of asphalt LCI processes ...................................................................................... 64 10.3. Variables ....................................................................................................................................... 67 10.4. Calculation principle....................................................................................................................... 67 10.5. Results and discussion .................................................................................................................. 68
11. Bitumen testing ......................................................................................................... 72 11.1. Objective ....................................................................................................................................... 72 11.2. Experimental plan .......................................................................................................................... 72 11.3. Preparation of test samples ........................................................................................................... 73 11.4. Standard specification test results .................................................................................................. 73 11.5. Rheological measurements with DSR ............................................................................................ 76 11.6. Conclusions and future research .................................................................................................... 80
12. Bituminous mixture testing ...................................................................................... 81 12.1. Objective ....................................................................................................................................... 81 12.2. Testing plan ................................................................................................................................... 81 12.3. Composition of mixture .................................................................................................................. 82 12.4. Preparation of test samples ........................................................................................................... 83 12.5. Curing ........................................................................................................................................... 84 12.6. Density .......................................................................................................................................... 87 12.7. Stiffness ........................................................................................................................................ 89 12.8. Permanent deformations ................................................................................................................ 91 12.9. Conclusions and future research .................................................................................................... 95
13. Conclusion ................................................................................................................. 97
References ....................................................................................................................... 98
Appendices .................................................................................................................... 103
Appendix A: Glossary ................................................................................................... 104
Appendix B: Bitumen test results ................................................................................ 105
Appendix C: Mixture test results .................................................................................. 107
Appendix D: LCI results ................................................................................................ 111
Introduction
10
1. INTRODUCTION
1.1. History The concept of using lower temperatures to produce asphalt mixes is not new. First attempt to produce asphalt with bitumen that was foamed by steam was carried out in 1956 by Prof. Ladis Csanyi at Iowa State University, US Since then foaming technology has been used in different countries, including US, Australia and Europe. For the last twenty years, waxes have been used as viscosity modifier in Germany; initially they were not used for lowering the temperature, but for better workability of mastic asphalt and only about fifteen years ago, reduction of production and paving temperatures was declared a priority. Fischer-Tropsch wax, fatty acid amide and montan wax was used as viscosity changing additives in Germany. Modern foaming technologies were introduced at the same time as experiments with zeolite started in Germany and Shell Bitumen patented a foaming technology that was later developed as WAM-Foam. Since then, different new foaming principles have been introduced to the market that allows reduction in production temperature even below the boiling point of water. The newest Warm Mix Asphalt (WMA) production technology that involves chemical modification of the bitumen was developed in US and is known as Evotherm. It was followed by different modifications of the same technology as well as new chemical additives from other companies.
Since the start of developing modern WMA technologies, a lot of experiments have been carried out to establish potential benefits of using WMA and evaluating the performance compared to traditional Hot Mix Asphalt (HMA). First research reports are from Europe from mid 90’ies and starting from 2002 a lot of testing and field trials have been conducted in US with publically available reports.
1.2. Aims and tasks of the research The aim of this thesis is to investigate the technology of Warm Mix Asphalts by considering the local specifics and climate of Scandinavian countries and Baltic states. To achieve this aim, the following tasks were set:
1) Analysing the potential benefits and drawbacks of the WMA technologies and determine possible specialisations for WMA implementation.
2) Investigation of WMA technologies and products. 3) Analysing the principles of WMA production. 4) Determining the bitumen modification properties for different WMA processes and analysing the
suitability of existing test methods for characterisation of modified binder. 5) Analysing the reports from different researches on different WMA product properties, determining
potential problem areas and evaluating the existing test methods for WMA characterisation. 6) Analysing the comparative costs of conventional HMA and WMA technologies. 7) Evaluating the potential environmental benefits from WMA implementation. 8) Developing a life cycle inventory model for calculation of WMA energy demand, and comparing the
results with reference HMA. 9) Investigation of the changes in bitumen consistency at intermediate and high temperatures after
modification with WMA additives. 10) Determining the properties of asphalt, modified with WMA additives and comparing the results with
conventional HMA. 11) Determining the suitability of different compaction methods for densification of WMA. 12) Determining necessary adjustments in mixture preparation for adequate evaluation of WMA
properties.
1.3. Scope of the research For the literature review of WMA in this thesis mostly independent literature sources were used, like governmental research programmes and independent researchers’ publications in conference proceedings. Manufacturers’ promotion materials and homepages were used only for some specific purposes, such as identifying the offered production technology and to recognize some components and characteristics of
Introduction
11
products. The different WMA production technologies in the context of this thesis were categorised as foaming processes, organic additives and chemical processes. In total twenty two products were identified in literature review and for fourteen reports of usage in Europe were found. This thesis summarises the main characteristics of these products and describes the production technologies for the most widely used of them. For WMA to be practical it must use the existing infrastructure, therefore the necessary modifications to asphalt production plants are described. The traditions of asphalt industry, geographical locations and local climate characteristics of Scandinavian and Baltic countries that might affect implementation of WMA in the respective region were taken into account for the literature study.
One of the main objectives of WMA technologies is the possibility to reduce carbon footprint of asphalt thus supporting the demands of Kyoto protocol for lowering greenhouse gas emissions in the atmosphere. Review from other researches is included in the thesis and to verify the potential ecological benefits of the WMA process compared to conventional HMA, a calculation of energy requirement for the asphalt industry was performed. The processes, that can be influenced by choosing WMA technology instead of HMA were analysed, including the production of components materials, transportation, mixing, paving and compaction of asphalt. Seven different modules were created in order to determine and compare the total energy consumption, energy sources and significance of modifying different processes of the industry.
Despite the promising benefits, the asphalt industry has reservations concerning WMA implementation. This is mostly connected with concerns on the long term performance of pavements. There are concerns from some researchers who report premature rutting and potential moisture damage for some of the WMA products in laboratory experiments. However no such problems are reported from the existing field trials. The potential problem areas and the results from different researches on the performance of different WMA technologies are discussed in the literature review as well as in the experimental part of the research.
Two WMA products were tested in the context of this thesis – Sasobit, which is an organic additive and Rediset WMX which is a chemical additive. At first, rheological properties of bitumen at intermediate and high temperatures were determined. Testing for penetration, softening point, dynamic viscosity and kinematic viscosity was performed. Bitumen 40/60 with two different dosages of each of the additives was tested and compared with pure bitumen. A total of thirty seven tests were conducted on binder.
After completing the bitumen tests and from the results obtained, the desirable amount of additives for each product was chosen and, two types of WMA and a control mixture of stone mastic asphalt (SMA) were prepared. Then properties of density, compactibility, curing, stiffness and permanent deformations were tested for two different compaction methods – Marshall hammer and gyratory compactor. The two WMA products were compared to conventional HMA to determine changes in volumetric and physical properties of the mixtures at four different temperatures and to determine the optimum compaction temperature of each of the WMA products. A total of thirty one test specimens were prepared in the research and seventy eight test results are included in the report.
Potential benefits and drawbacks
12
2. POTENTIAL BENEFITS AND DRAWBACKS Warm Mix Asphalt (WMA) technologies use technological advances that reduce the temperature of compaction and production, but also promises a number of other benefits that will be discussed in this chapter. Some concerns are identified as well. They are mostly subjected to a relatively short WMA implementation period and insufficient accessibility of in-situ performance results. These subjects will be discussed more specific in the following chapters of this thesis, but this section gives a good concept of the WMA technology.
2.1. Benefits WMA technologies promise a number of benefits, when used. The specific benefits and the degree of the benefits depend upon which specific WMA technology is used. However, according to the research literature overview the benefits can be categorized in four groups:
Environmental; Production; Paving; Economic;
2.1.1. Environmental: Reduced emissions of CO2 (carbon dioxide) and other greenhouse gasses because of
reduced temperature needed to produce and compact asphalt; Improved working conditions for production and paving workers due to reduced fumes,
emissions and odours.
2.1.2. Production: Higher Reclaimed Asphalt Pavement (RAP) percentage in mixes is possible because of
decreased viscosity of the stiff binder in RAP. Thus the effort for aggregate coating and pavement compaction is reduced;
Less ageing of binder during the production and pavement process, thus improving longevity of pavement service life;
Easier permitting for a plant site in urban areas, because of reduced emissions, dust and noise.
2.1.3. Paving: Improved workability because of lower bitumen viscosity at paving temperature; Improved compaction possibility, which is achieved through the reduction in viscosity of
binder; Cold weather paving. As the difference with the ambient temperature is smaller for WMA
than for Hot Mix Asphalt (HMA), the drop in temperature with time is less significant allowing longer time for paving and compaction;
Improved working conditions for the paving crew because of lower paving temperature, which means enhanced productivity and improved quality;
Longer haul distances due to possibility to pave at lower temperature; Reduced time of pavement cooling because of lower initial temperature; Less inconvenience to public near production and work sites as emissions of fume and
odour are reduced.
2.1.4. Economical: Reduced energy consumption, thus lowering energy costs; Less wear on asphalt plant due to reduced temperature.
Potential benefits and drawbacks
13
Different techniques of producing WMA promise varying energy savings for production - this mainly depends on how much the production temperature was lowered and what kind of fuel was used. The economical benefit from energy saving should be discussed together with the cost and type of energy used, since higher energy prices promise greater savings. And again, the savings depend on production technique as some WMA technologies require only initial investment for plant modification, some require continuous additional cost for the additives, and some require both form of additional cost. (1) There may be some technology licensing costs as well.
Economical benefits should be evaluated together with environmental benefits. If stricter emission standards are implemented, there may be higher economic potential for WMA. In this case the potential benefits may not be completely economically quantifiable and should be evaluated together with environmental regulations.
2.2. Drawbacks A large number of questions regarding the implementation of this technology, especially about the specifications and quality control need to be answered.
Potential drawbacks should be considered in context with the specific technology as different methods have particular flaws, but to generalize, there are some concerns about the performance and implementation of WMA. They are listed below.
2.2.1. Rutting Premature rutting has been reported for surface asphalt concrete in different studies. This has been mostly related to decreased ageing at lower production temperatures and increased moisture content for foaming technologies.
2.2.2. Insufficient data for evaluation Since the field test sections constructed in United States are less than seven years old and the sites in Europe (Germany and Norway) are somewhat over ten years old, it is too early to comment on long term performance. To date, in US no notable negative long term performance has been reported (1), and in Europe the trial sections of WMA have performed the same or better than HMA overlays (2; 3). It must be noted that in the US there are number of government programmes for WMA evaluation, whereas in Europe examinations mostly depend on private companies which means significantly less independent review of different WMA technologies.
2.2.3. Long term performance Theoretically, because the better compaction possibilities may result in higher density for WMA, this could result in problems due to insufficient number of air voids in the mixture to ensure desirable bitumen content. This may lead to problems with moisture susceptibility, cracking and oxidative ageing.
A similar problem is connected with lower mixing temperatures indicates less binder absorption into the aggregates, which may lead to the same faults as described above.
2.2.4. Water presence Foaming and some of the chemical WMA technologies are somewhat connected with the introduction of water in the initial mixing process. Because of possible incomplete vaporization of water during the mixing and laying process residual water in the mixtures may cause problems of premature rutting and stripping of pavements. Therefore special attention must be paid to the evaluation of potential moisture damage in the laboratory. This is especially important with any foaming technologies and although most of them use chemical antistripping additives to improve coating and adhesion different initial material moisture content together with poor water resistant mix formula may cause some coating problems.
Potential benefits and drawbacks
14
2.2.5. Economical There are some concerns about the implementation of WMA production technology because of its cost. It is necessary to prove the potency of WMA compared to HMA so that the use of this technology becomes widespread. It must be established whether reduced energy consumption will reduce the overall costs of WMA production. If no proof of lower production costs are established, it may be possible that contractors will not choose this technology for its other benefits alone, and if no stricter emission regulations are obligated, the WMA technology could not become widespread. Increase in costs may arise from:
The investment and the depreciation of plant modification; The costs of additives; Possible costs for technology licensing.
2.2.6. Low temperature behaviour The low temperature properties of bitumen used in organic WMA technologies can be slightly different than expected for conventional HMA. Through this attention should be given to change in low temperature behaviour if it is relevant for the given climate conditions. This change in performance can be explained through the crystallisation of waxes that tend to increase the viscosity and stiffness of the binder. Therefore low temperature binder properties should be evaluated to predict the possible changes of bitumen in WMA.
2.2.7. Life cycle assessment Good and easy to use life cycle assessment tool would be necessary to verify the statement of potential environmental benefits. There are concerns that some of the environmental benefits may be offset due to the carbon footprint embodied for producing additives and/or any additional equipment supporting the production of WMA. Since there are still some concerns about the WMA long term performance compared to Hot Mix Asphalt (HMA), life cycle assessment would require information on the longevity of WMA.
2.2.8. Use with SBS polymer modified bitumen Although WMA technologies are fully compatible with Styrene-Butadiene-Styrene (SBS) modified bitumen, (4) states, that modification of bitumen with both SBS polymer and Fischer Tropsch (FT) wax might not be reasonable for performance improvement as the benefit from adding wax to SBS modified bitumen is less than when adding it to pure bitumen, but the results achieved in SUPERPAVE applicable temperature range Penetration Grade (PG) are almost the same, thus somewhat “overlapping” the benefits and increasing the costs. However it does not reduce the effects of lower temperature production and paving so it still might be beneficial to use FT-wax with modified binders.
2.3. Possible specialisation for WMA implementation There are principally no limitations of WMA production and usage and the technologies can be used for the same asphalt compositions as HMA. However WMA technology promises various benefits as explained in 2.1 Benefits. These advantages over traditional HMA mixtures can be put in use for some specific paving or producing circumstances and allow to use WMA technology not only as substitute for conventional HMA, but also for use in circumstances, where use of HMA would not be eligible.
2.3.1. Increased RAP percentage Because of the lower viscosity of bitumen in the working conditions, WMA mixtures containing higher RAP percentage than usual remain with the same degree of workability. Another aspect is that the lower production temperatures compensate the aged (stiffer) RAP binder with less aged one from WMA production process.
In Germany trials have been conducted with as high RAP percentage as 90 to 100; Aspha-min zeolite and Sasobit were used in the trials (2).
Potential benefits and drawbacks
15
2.3.2. Plant sites location in urban areas The WMA production plants could be slightly easier to introduce to urban areas because of the lower environmental pollution and fumes.
2.3.3. Faster construction/opening times Faster operation times can be achieved since less time is needed for cooling the mixture. This promises to be beneficial for high maintenance roads or intersections that need to be opened as soon as possible. Less time is needed before the next lift is placed or road can be opened for traffic. (5) indicates some areas that allowed traffic as soon as two hours after the paving operation.
This can be particularly important at airports, where the stretch of time for construction can be very tight. Sometimes even several lifts are required to be placed during the night. This was done in the Frankfurt airport project during the years 2003 and 2005. As stated in (6), the existing concrete runaway was successfully replaced by asphalt during working hours between 10:30PM and 6:00AM, with the temperature at the opening of runaway less than 80oC.
2.3.4. Cold weather paving A longer paving season and/or paving during the nights can be accomplished through use of WMA technologies. Through reduction of binder viscosity, WMA can be compacted at lower temperatures with the same density as HMA and as the difference between mix and ambient temperature is smaller than for HMA, a longer compaction window is provided. Additionally, producing WMA at HMA temperatures will permit even longer compaction time. It is reported (2) that field trials were conducted in Germany with Sasobit at temperatures ranging from +1oC to + 3oC and better density was achieved compared to HMA mixture.
For other technologies no reports of field tests that have been performed in cold weather were found, but bitumen viscosity changing data for other waxes promises to have the same effect for other technologies as well.
2.3.5. Accessibility of non-attainment areas Similar to cold weather paving, longer haul distances are possible because mixtures can be compacted at lower temperature. Therefore producing WMA technology mixtures at temperatures traditional for HMA, more distant sites can be served without losing workability. This means expanded market areas and decreased mobilisation cost and accessibility of large urban areas.
It is reported in (2), that WAM-Foam was stored in a silo for 48 hours and still had the properties to be placed and compacted to a normal level. Similar data is reported in (7) for Low Energy Asphalt (LEA). It states that LEA was maintained in trucks at a temperature of 70-90oC for a time of 5 to 6 hours and had no problems with paving or compaction.
WMA technologies and description of products
16
3. WMA TECHNOLOGIES AND DESCRIPTION OF PRODUCTS This chapter describes the existing and most widely used Warm Mix Asphalt (WMA) technologies and gives a short explanation of basic characteristics of the main products on the market.
3.1. Classification of WMA technologies The WMA technologies can be classified in several ways.
One is to classify the technologies by the degree of temperature reduction. Warm asphalt mixes are separated from half-warm asphalt mixtures by the resulting mix temperature. There is a wide range of production temperatures within warm mix asphalt, from products that promise 10oC to 20oC below Hot Mix Asphalt (HMA) to temperatures slightly above 100oC and for some technologies even below the boiling point of water. Common asphalt classification by the production temperature is this (2):
Cold mix (0-30oC); Half warm asphalt (65-100oC); Warm mix asphalt (100-140oC); Hot mix asphalt (above 140oC).
Another way to classify WMA is by the technologies used to reduce temperature. This classification method allows for a more descriptive discussion of the process. No general or commonly used technology classification was found during the literature review. The following classification was made after making an overview of technologies on the market, by generalizing the different terms used in other studies and after consultation with chemical engineers (8; 9) to meet the producing technique adequacy to technology classification. Three different techniques were found:
Foaming techniques (which are divided into water-based and water containing); Organic or wax additives; Chemical additives.
All of the existing products use at least one of these technologies, but there may be combination of them as well.
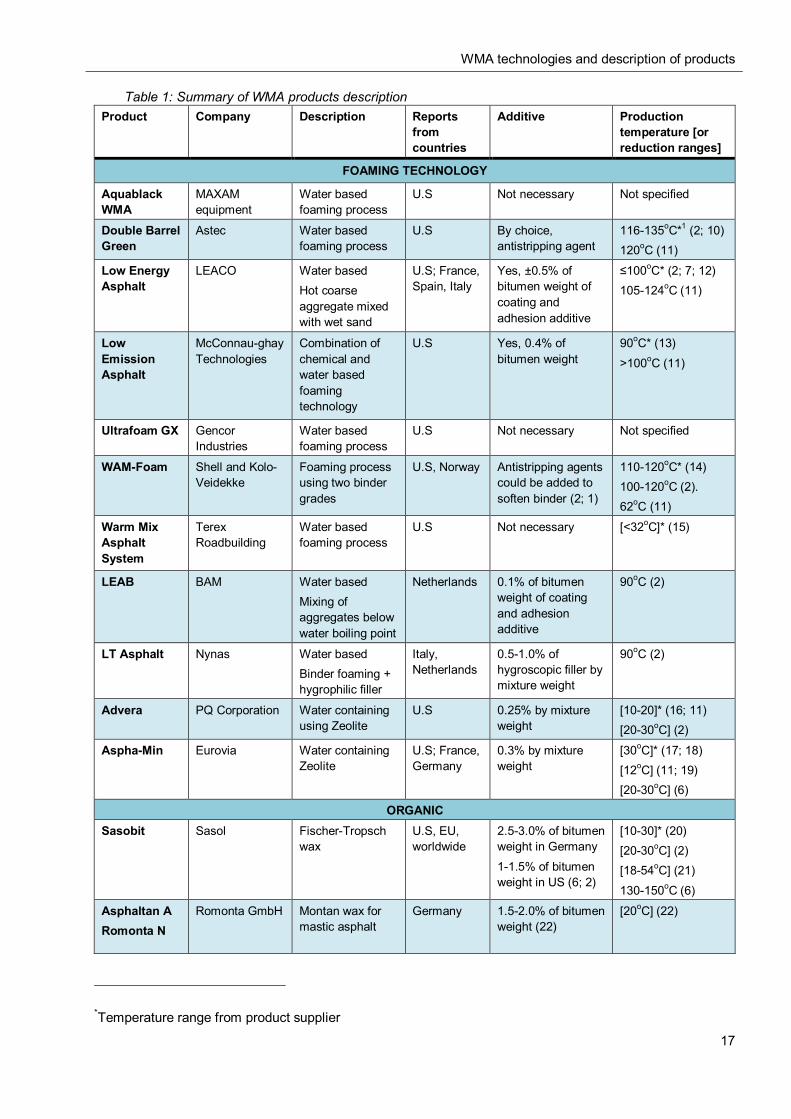
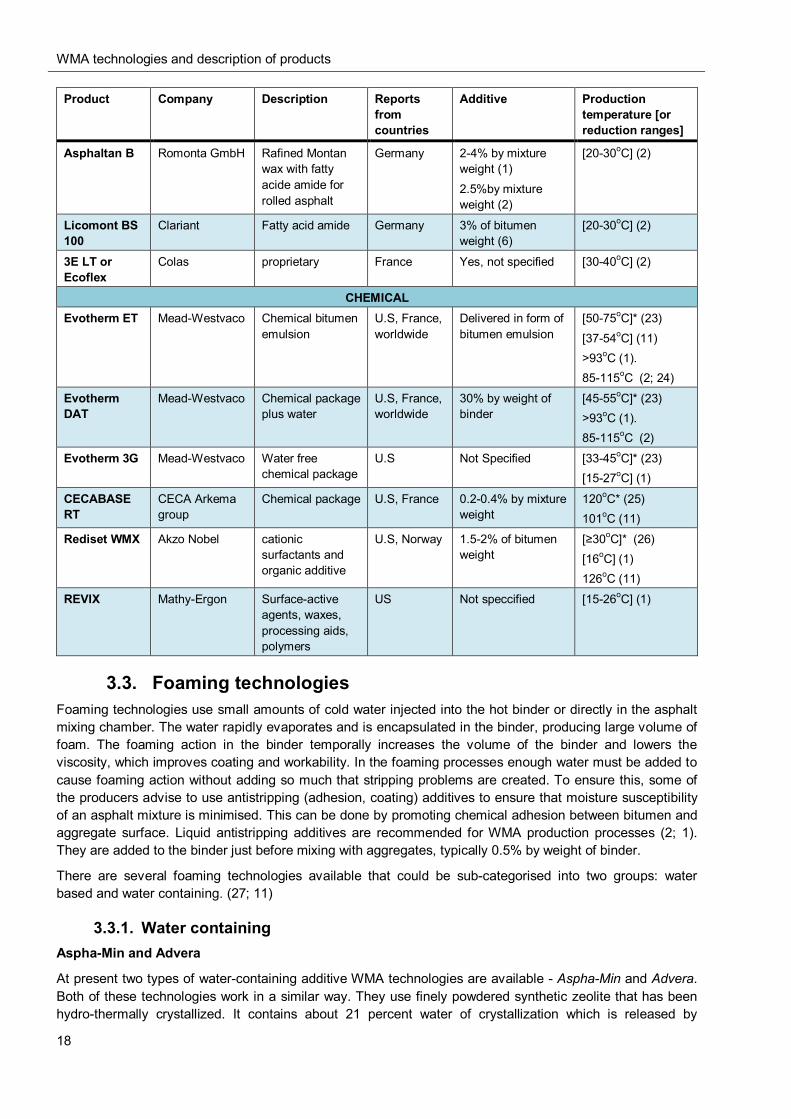
3.2. Summary of WMA products The most widely used products available on the market and their descriptions are listed in Table 1. It also contains the reported regions of the use for corresponding products from the literature. As the reported values of production temperatures were not the same in all the reports, the most commonly reported data or data supported by the production company are listed first and the data from different research after. The differences in the reports may be caused by different factors, such as type and the amount of additives used, humidity of materials, mix design method, climatic conditions, materials used, etc. The amount of WMA additive usually depends on the materials used, their proportion and especially the grade and type of bitumen used.
WMA technologies and description of products
17
Table 1: Summary of WMA products description Product Company Description Reports
from countries
Additive Production temperature [or reduction ranges]
FOAMING TECHNOLOGY
Aquablack WMA
MAXAM equipment
Water based foaming process
U.S Not necessary Not specified
Double Barrel Green
Astec Water based foaming process
U.S By choice, antistripping agent
116-135oC*1 (2; 10) 120oC (11)
Low Energy Asphalt
LEACO Water based Hot coarse aggregate mixed with wet sand
U.S; France, Spain, Italy
Yes, ±0.5% of bitumen weight of coating and adhesion additive
≤100oC* (2; 7; 12) 105-124oC (11)
Low Emission Asphalt
McConnau-ghay Technologies
Combination of chemical and water based foaming technology
U.S Yes, 0.4% of bitumen weight
90oC* (13) >100oC (11)
Ultrafoam GX Gencor Industries
Water based foaming process
U.S Not necessary Not specified
WAM-Foam Shell and Kolo-Veidekke
Foaming process using two binder grades
U.S, Norway Antistripping agents could be added to soften binder (2; 1)
110-120oC* (14) 100-120oC (2). 62oC (11)
Warm Mix Asphalt System
Terex Roadbuilding
Water based foaming process
U.S Not necessary [<32oC]* (15)
LEAB BAM Water based Mixing of aggregates below water boiling point
Netherlands 0.1% of bitumen weight of coating and adhesion additive
90oC (2)
LT Asphalt Nynas Water based Binder foaming + hygrophilic filler
Italy, Netherlands
0.5-1.0% of hygroscopic filler by mixture weight
90oC (2)
Advera PQ Corporation Water containing using Zeolite
U.S 0.25% by mixture weight
[10-20]* (16; 11) [20-30oC] (2)
Aspha-Min Eurovia Water containing Zeolite
U.S; France, Germany
0.3% by mixture weight
[30oC]* (17; 18) [12oC] (11; 19) [20-30oC] (6)
ORGANIC Sasobit Sasol Fischer-Tropsch
wax U.S, EU, worldwide
2.5-3.0% of bitumen weight in Germany 1-1.5% of bitumen weight in US (6; 2)
[10-30]* (20) [20-30oC] (2) [18-54oC] (21) 130-150oC (6)
Asphaltan A Romonta N
Romonta GmbH Montan wax for mastic asphalt
Germany 1.5-2.0% of bitumen weight (22)
[20oC] (22)
*Temperature range from product supplier
WMA technologies and description of products
18
Product Company Description Reports from countries
Additive Production temperature [or reduction ranges]
Asphaltan B Romonta GmbH Rafined Montan wax with fatty acide amide for rolled asphalt
Germany 2-4% by mixture weight (1) 2.5%by mixture weight (2)
[20-30oC] (2)
Licomont BS 100
Clariant Fatty acid amide Germany 3% of bitumen weight (6)
[20-30oC] (2)
3E LT or Ecoflex
Colas proprietary France Yes, not specified [30-40oC] (2)
CHEMICAL Evotherm ET Mead-Westvaco Chemical bitumen
emulsion U.S, France, worldwide
Delivered in form of bitumen emulsion
[50-75oC]* (23) [37-54oC] (11) >93oC (1). 85-115oC (2; 24)
Evotherm DAT
Mead-Westvaco Chemical package plus water
U.S, France, worldwide
30% by weight of binder
[45-55oC]* (23) >93oC (1). 85-115oC (2)
Evotherm 3G Mead-Westvaco Water free chemical package
U.S Not Specified [33-45oC]* (23) [15-27oC] (1)
CECABASE RT
CECA Arkema group
Chemical package U.S, France 0.2-0.4% by mixture weight
120oC* (25) 101oC (11)
Rediset WMX Akzo Nobel cationic surfactants and organic additive
U.S, Norway 1.5-2% of bitumen weight
[≥30oC]* (26) [16oC] (1) 126oC (11)
REVIX Mathy-Ergon Surface-active agents, waxes, processing aids, polymers
US Not speccified [15-26oC] (1)
3.3. Foaming technologies Foaming technologies use small amounts of cold water injected into the hot binder or directly in the asphalt mixing chamber. The water rapidly evaporates and is encapsulated in the binder, producing large volume of foam. The foaming action in the binder temporally increases the volume of the binder and lowers the viscosity, which improves coating and workability. In the foaming processes enough water must be added to cause foaming action without adding so much that stripping problems are created. To ensure this, some of the producers advise to use antistripping (adhesion, coating) additives to ensure that moisture susceptibility of an asphalt mixture is minimised. This can be done by promoting chemical adhesion between bitumen and aggregate surface. Liquid antistripping additives are recommended for WMA production processes (2; 1). They are added to the binder just before mixing with aggregates, typically 0.5% by weight of binder.
There are several foaming technologies available that could be sub-categorised into two groups: water based and water containing. (27; 11)
3.3.1. Water containing Aspha-Min and Advera
At present two types of water-containing additive WMA technologies are available - Aspha-Min and Advera. Both of these technologies work in a similar way. They use finely powdered synthetic zeolite that has been hydro-thermally crystallized. It contains about 21 percent water of crystallization which is released by
WMA technologies and description of products
19
increasing temperature above 85oC. When the additive is added to the mixture at the same time as the binder, water is released as a fine mist, which foams the binder. The viscosity of the binder at high temperatures is lowered and thus made possible the reduction of mixing and paving temperatures. These materials are purported to not change the performance grade of binder. Controlled foaming effect of 6 to 7 hours of increased workability is reported (1; 2; 6).
3.3.2. Water based Water based technologies use a foaming process which is created by injecting cold water into hot asphalt binder using special equipment or technology (more specifically described in section 4 WMA production technologies). The water rapidly evaporates, producing a large volume of foam, which slowly collapses. (27; 11)
Double Barrel Green, Ultrafoam GX, Aquablack WMA, Warm Mix Asphalt System
All these WMA processes use some type of nozzle to inject water into asphalt binder stream. Each technology uses equipment developed by the individual company. The nozzles are computer controlled to adjust the foaming rate. A small amount of water is added in order to microscopically foam the binder. The water creates steam which is encapsulated in the binder resulting in foaming and a large volume increase of the binder, which decreases the viscosity thus allowing to coat the aggregates at lower temperatures. (11)
Low Energy Asphalt
Low Energy Asphalt uses wet fine aggregate. A key to energy savings in this process is that it takes five times more energy to turn water into steam than it takes to heat aggregate from 0oC -100oC. The coarse aggregate and a portion of fine aggregate are heated to normal HMA temperatures (approx.150oC) and mixed with the binder containing coating and adhesion additives. After the coarse aggregate is coated with the binder, it is mixed with the cold, wet fine aggregate. It results in foaming action that aids in the coating of the fine aggregate (27; 11; 2). This method has been used widely for the last years and although the results are promising, the suitability for Nordic countries still has to be verified as the use reports are mostly from countries with slightly warmer climate.
Low Emission Asphalt
This is a further development of Low Energy Asphalt. It is a combination of chemical and water based foaming technology. The process relies on sequential mixing of the binder containing a chemical additive being added to the hot coarse aggregates, followed by the introduction of wet sand, which creates a foaming action (13).
WAM-Foam
This technology differs slightly from the others. It uses two component binder systems that introduces nominally a soft and a hard foamed binder at different times in the mixing cycle. The aggregate is heated to about 130oC and then coated with the soft binder, which is typically 20 to 30 percent of the total binder. The hard binder is then foamed into the mixture by adding cold water (2% to 5% of mass of the hard bitumen) at about 180oC. Coating the coarse aggregate with the softer binder acts to satisfy the asphalt absorption of the coarse aggregate that may not otherwise occur with the stiffer binder at low temperature. (2; 1)
LT-Asphalt
This technology foams the binder with special nozzles just before adding to mixture chamber with the heated (to about 90oC) aggregates. 0.5-1.0% of hydrophilic filler is added to hold and control the latent moisture from foaming. (2)
3.4. Organic or wax additives Organic or wax additives are used to achieve the temperature reduction by reducing viscosity of binder. The processes show a decrease of viscosity above the melting point of the wax making it possible to produce asphalt mixes at lower temperatures. After crystallisation, they tend to increase the stiffness of the binder

WMA technologies and description of products
20
and asphalt’s resistance against deformation. The type of wax must be selected carefully so that the melting point of the wax is higher than expected in service temperatures and to minimize embrittlement of the asphalt at low temperatures. (2; 11)
Sasobit
Sasobit is a Fischer-Tropsch (FT) wax in a form of white powder or granulate (also “ready-to-use” bitumen in Germany). It is a by-product from the synthetic petrol production process called Fischer-Tropsch process, where the wax content is about 10%. It is a long-chain aliphatic hydrocarbon wax with a melting range between 85oC and 115oC, high viscosity at lower temperatures, and low viscosity at higher temperatures. When it cools down the crystallization begins at 105oC and is completed at 65oC forming into regularly distributed, microscopic, stick-shaped particles. At service temperatures, Sasobit forms a lattice structure in the asphalt binder that gives the mixture stability. According to (6), with addition of 3% by binder mass, the softening point is decreased by 20-35oC and the penetration falls by 15-25 1/10mm. This accounts for the reported resistance to rutting of Sasobit-modified mixes. (2; 11; 6)
Asphaltan A and Romonta N
Asphaltan A and Romonta N are Montan waxes with the congealing point at 78oC and 125oC respectively. It is a hard wax obtained by solvent extraction of certain types of lignite or brown coal. They have similar effect on asphalt as FT-waxes. The stiffness is increased after cooling, like with fatty acid amide. They have been used as an additive for mastic asphalt (gussasphalt) in Germany, because of the possibility to modify consistency of binder and improve adhesion between binder and minerals. (22; 6)
Asphaltan B
Asphaltan-B is a refined Montan wax blended with a fatty acid amide. The melting point of Asphaltan B is just below 100oC (2; 1). Similarly to Fischer-Tropsch waxes it acts to improve asphalt flow at low temperatures although it is somewhat less than FT-waxes. The producer of the product reports increased compactibility, resistance to rutting and moisture resistance of asphalt mixes. (28)
Licomont BS 100
Licomont BS 100 is a fatty acid amide. Fatty acid amides ate manufactured synthetically by reacting amines with fatty acids. Typically, the melting point is between 14°C and 145°C and the solidification range from 135°C to 145oC. According to (6) an addition of 3% to the binder increases the softening point by 40-45oC. During the cooling, the fatty acid amides also form crystals which lend the binder a greater stiffness and penetration is decreased by 10 to 15 1/10 mm. (2)
3.5. Chemical additives Chemical additives are the third type of WMA technology that is commonly used. A variety of chemical packages are used for different products. They usually include a combination of emulsification agents, surfactants, polymers and additives to improve coating, mixture workability, and compaction, as well as adhesion promoters (antistripping agents). The added amount and temperature reduction depends on the specific product used. The chemical additive package is used either in the form of an emulsion or added to bitumen in mix production process and then mixed with hot aggregate. This results in relatively minor modifications needed to the asphalt plant or to the mix design process. (1; 11)
Evotherm
There are three technologies produced by Evotherm – Evotherm ET (often referred as just Evotherm) which has eventually been replaced by Evotherm DAT and Evotherm 3G.
Evotherm ET
Evotherm ET (Emulsion Technology) uses a chemical package of emulsification agents and antistripping agent additives to improve aggregate coating, mixture workability and compaction. Evotherm makes up 30 percent mass of the binder and it decreases the viscosity of the binder at lower mixing temperatures, which leads to fully coated aggregates at the same temperature. It is delivered in the form of bitumen emulsion.
WMA technologies and description of products
21
Different chemical packages are available for different aggregate types (with different adhesion agents). The majority of the water in the emulsion flashes off as steam when the emulsion is mixed with the aggregates. This process reduces the production temperature by 30 percent. (29; 2)
Evotherm DAT
Evotherm DAT (Dispersed Asphalt Technology) is the same chemical package diluted with a small amount of water which is injected into the asphalt line just before the mixing chamber. It decreases the viscosity of the binder at lower mixing temperatures, which leads to fully coated aggregates. This process reduces the production temperature by 30%. (30; 2)
Evotherm 3G
Evotherm 3G it is water-free form of Evotherm. Since this is a relatively new product, there is no information available about its properties from independent research.
Rediset WMX
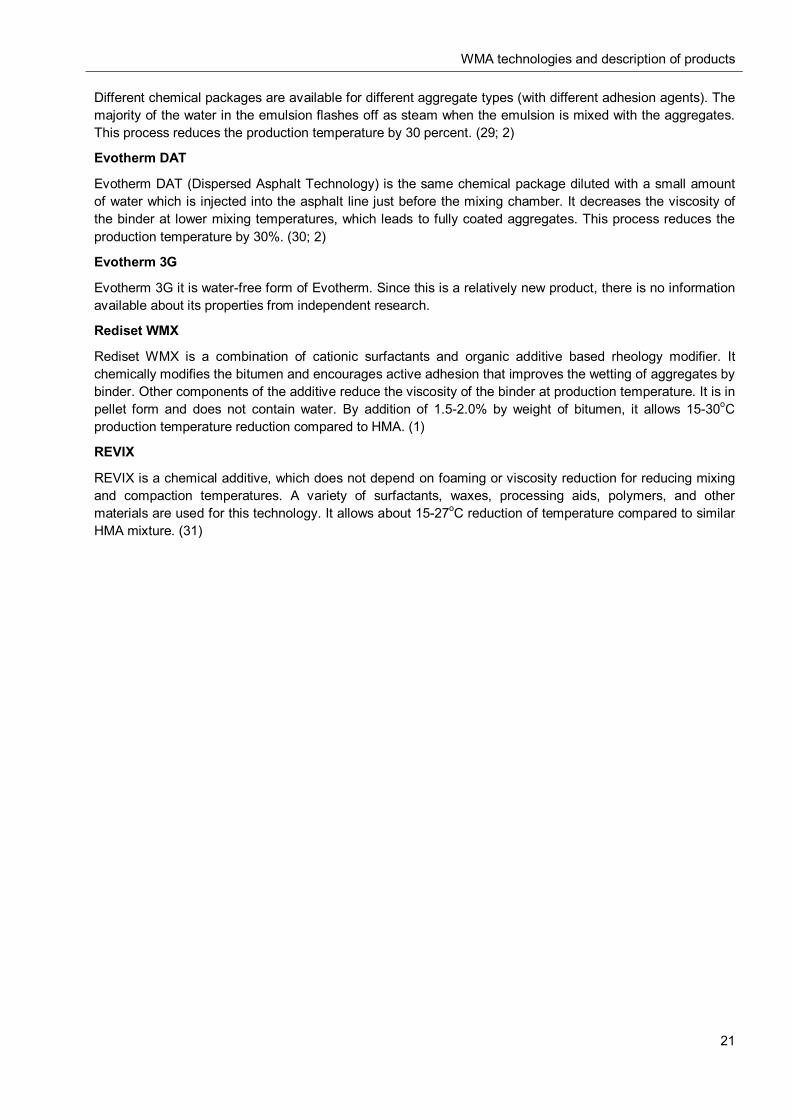
Rediset WMX is a combination of cationic surfactants and organic additive based rheology modifier. It chemically modifies the bitumen and encourages active adhesion that improves the wetting of aggregates by binder. Other components of the additive reduce the viscosity of the binder at production temperature. It is in pellet form and does not contain water. By addition of 1.5-2.0% by weight of bitumen, it allows 15-30oC production temperature reduction compared to HMA. (1)
REVIX
REVIX is a chemical additive, which does not depend on foaming or viscosity reduction for reducing mixing and compaction temperatures. A variety of surfactants, waxes, processing aids, polymers, and other materials are used for this technology. It allows about 15-27oC reduction of temperature compared to similar HMA mixture. (31)
WMA production technologies
22
4. WMA PRODUCTION TECHNOLOGIES The production principles of different Warm Mix Asphalt (WMA) technologies will be discussed in this chapter. In the region of Scandinavia and the Baltic states two methods of asphalt production are used – batch plants and drum plants. The batch plant is the most popular by far in the region, therefore mostly modifications on this type will be discussed. In order for WMA technologies to be practical they must use the existing infrastructure, so necessary modifications to Hot Mix Asphalt (HMA) production plants for accommodation of WMA technologies are described.
4.1. Principles
4.1.1. Addition technologies Additives are a vitally important part in most techniques of producing WMA, where viscosity of binder is changed by addition of different additive packages allowing a reduction in the production temperature. Often the packages provided by the supplier are a combination of viscosity reducing substances and chemical additives that improve the adhesion bounds or aggregate coating. In other cases, there are recommendations of what additional chemical additives are advised to be used with the specific product. There are several ways of introducing additives to mixture. The first: bitumen is modified by the producer and ready-to-use bitumen is delivered to the asphalt mixing plant. The second method involves some kind of addition technology used at the plant site. Additive is delivered to the plant separately from binder and is mixed together with the rest of the mix directly in the plant. There are two main methods for adding additives in the asphalt plant:
Wet method; Dry method.
The difference between the two methods is the addition in the asphalt plant production system. In the wet method, the additive is mixed homogenously together with binder and then mixed together with aggregates in the mixing chamber.
In the dry method additive is injected into the asphalt line just before or directly in the mixing chamber, thus mixing it together with other materials.
The choice of technology for introducing additives has to be done considering all aspects concerning quality. As the additives usually add up to a relatively small part of the mixture mass, homogenous mixing together with other components of mix is an important issue when choosing the right technology. Relatively short mixing time in the mixing plant can, in some cases, be insufficient for attainment of homogenous distribution for WMA additives and can lead to unsatisfactory results for asphalt performance.
The modifications needed may vary depending on plants type, year of production and the already installed material addition technologies.
4.1.2. Special equipment for foaming technologies The main part of the foaming technologies is the water addition system and/or principle of foaming nozzles. Most of the foaming WMA technology producers offer their own production kit that can be fitted to contractors’ plant. The foaming nozzle has to be installed in-line with the binder addition system. It has to be supported by a water supply system (water pump, reservoir tank) and water metering system. A bitumen expansion chamber is required in some cases. The water addition processes can be controlled through a control unit from the plant operation centre. Special attention should be given to the possibility to change between the WMA and HMA production systems. The maintenance of the nozzles is another important issue as they may require special treatment and/or cleaning between the batches or after each production may be required.
WMA production technologies
23
4.1.3. Equipment for additive dosage Liquid additives
A stirring unit for bitumen is necessary, if additive it is introduced into the bitumen tank. Low motion stirrers are reported to be suitable.
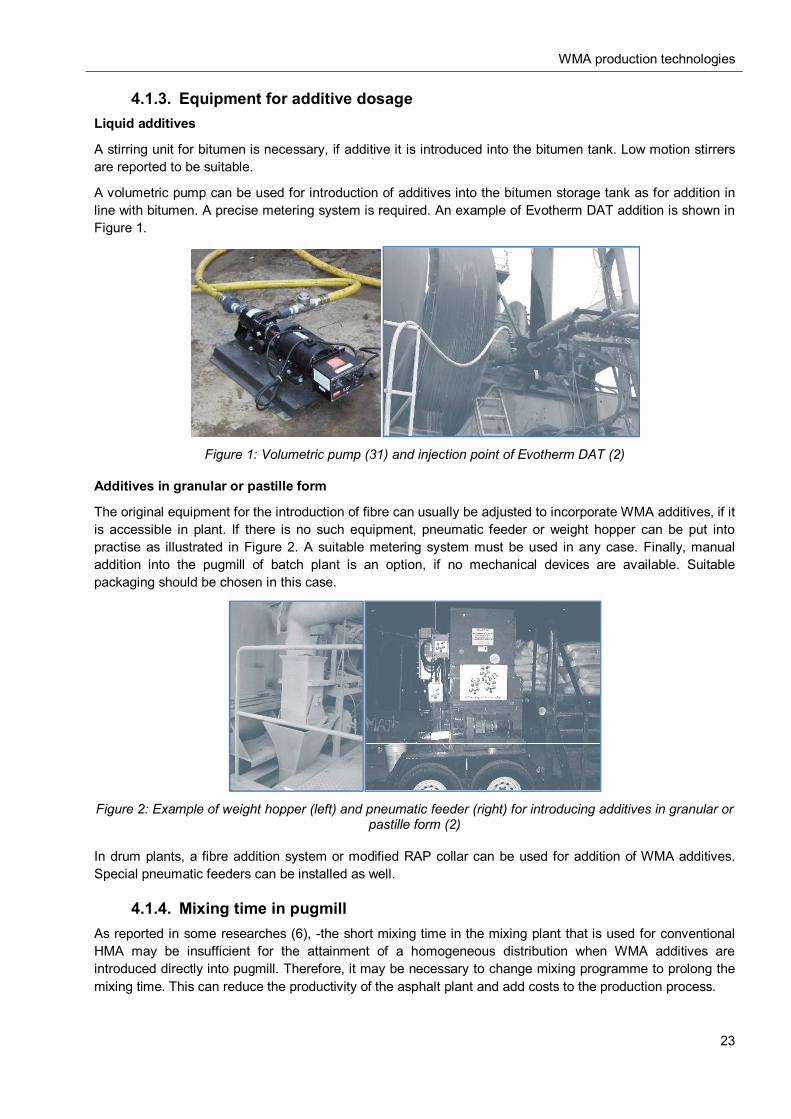
A volumetric pump can be used for introduction of additives into the bitumen storage tank as for addition in line with bitumen. A precise metering system is required. An example of Evotherm DAT addition is shown in Figure 1.
Figure 1: Volumetric pump (31) and injection point of Evotherm DAT (2)
Additives in granular or pastille form
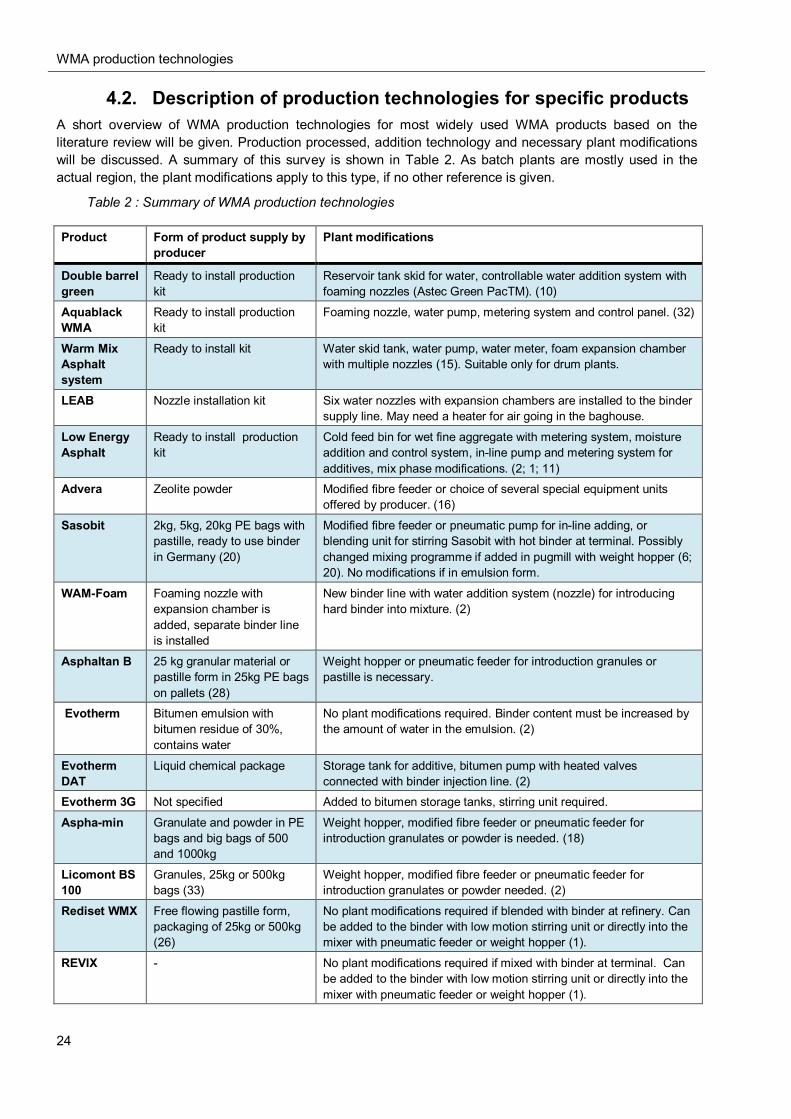
The original equipment for the introduction of fibre can usually be adjusted to incorporate WMA additives, if it is accessible in plant. If there is no such equipment, pneumatic feeder or weight hopper can be put into practise as illustrated in Figure 2. A suitable metering system must be used in any case. Finally, manual addition into the pugmill of batch plant is an option, if no mechanical devices are available. Suitable packaging should be chosen in this case.
Figure 2: Example of weight hopper (left) and pneumatic feeder (right) for introducing additives in granular or
pastille form (2)
In drum plants, a fibre addition system or modified RAP collar can be used for addition of WMA additives. Special pneumatic feeders can be installed as well.
4.1.4. Mixing time in pugmill As reported in some researches (6), -the short mixing time in the mixing plant that is used for conventional HMA may be insufficient for the attainment of a homogeneous distribution when WMA additives are introduced directly into pugmill. Therefore, it may be necessary to change mixing programme to prolong the mixing time. This can reduce the productivity of the asphalt plant and add costs to the production process.
WMA production technologies
24
4.2. Description of production technologies for specific products A short overview of WMA production technologies for most widely used WMA products based on the literature review will be given. Production processed, addition technology and necessary plant modifications will be discussed. A summary of this survey is shown in Table 2. As batch plants are mostly used in the actual region, the plant modifications apply to this type, if no other reference is given.
Table 2 : Summary of WMA production technologies
Product Form of product supply by producer
Plant modifications
Double barrel green
Ready to install production kit
Reservoir tank skid for water, controllable water addition system with foaming nozzles (Astec Green PacTM). (10)
Aquablack WMA
Ready to install production kit
Foaming nozzle, water pump, metering system and control panel. (32)
Warm Mix Asphalt system
Ready to install kit Water skid tank, water pump, water meter, foam expansion chamber with multiple nozzles (15). Suitable only for drum plants.
LEAB Nozzle installation kit Six water nozzles with expansion chambers are installed to the binder supply line. May need a heater for air going in the baghouse.
Low Energy Asphalt
Ready to install production kit
Cold feed bin for wet fine aggregate with metering system, moisture addition and control system, in-line pump and metering system for additives, mix phase modifications. (2; 1; 11)
Advera Zeolite powder Modified fibre feeder or choice of several special equipment units offered by producer. (16)
Sasobit 2kg, 5kg, 20kg PE bags with pastille, ready to use binder in Germany (20)
Modified fibre feeder or pneumatic pump for in-line adding, or blending unit for stirring Sasobit with hot binder at terminal. Possibly changed mixing programme if added in pugmill with weight hopper (6; 20). No modifications if in emulsion form.
WAM-Foam Foaming nozzle with expansion chamber is added, separate binder line is installed
New binder line with water addition system (nozzle) for introducing hard binder into mixture. (2)
Asphaltan B 25 kg granular material or pastille form in 25kg PE bags on pallets (28)
Weight hopper or pneumatic feeder for introduction granules or pastille is necessary.
Evotherm Bitumen emulsion with bitumen residue of 30%, contains water
No plant modifications required. Binder content must be increased by the amount of water in the emulsion. (2)
Evotherm DAT
Liquid chemical package Storage tank for additive, bitumen pump with heated valves connected with binder injection line. (2)
Evotherm 3G Not specified Added to bitumen storage tanks, stirring unit required.
Aspha-min Granulate and powder in PE bags and big bags of 500 and 1000kg
Weight hopper, modified fibre feeder or pneumatic feeder for introduction granulates or powder is needed. (18)
Licomont BS 100
Granules, 25kg or 500kg bags (33)
Weight hopper, modified fibre feeder or pneumatic feeder for introduction granulates or powder needed. (2)
Rediset WMX Free flowing pastille form, packaging of 25kg or 500kg (26)
No plant modifications required if blended with binder at refinery. Can be added to the binder with low motion stirring unit or directly into the mixer with pneumatic feeder or weight hopper (1).
REVIX - No plant modifications required if mixed with binder at terminal. Can be added to the binder with low motion stirring unit or directly into the mixer with pneumatic feeder or weight hopper (1).
WMA production technologies
25
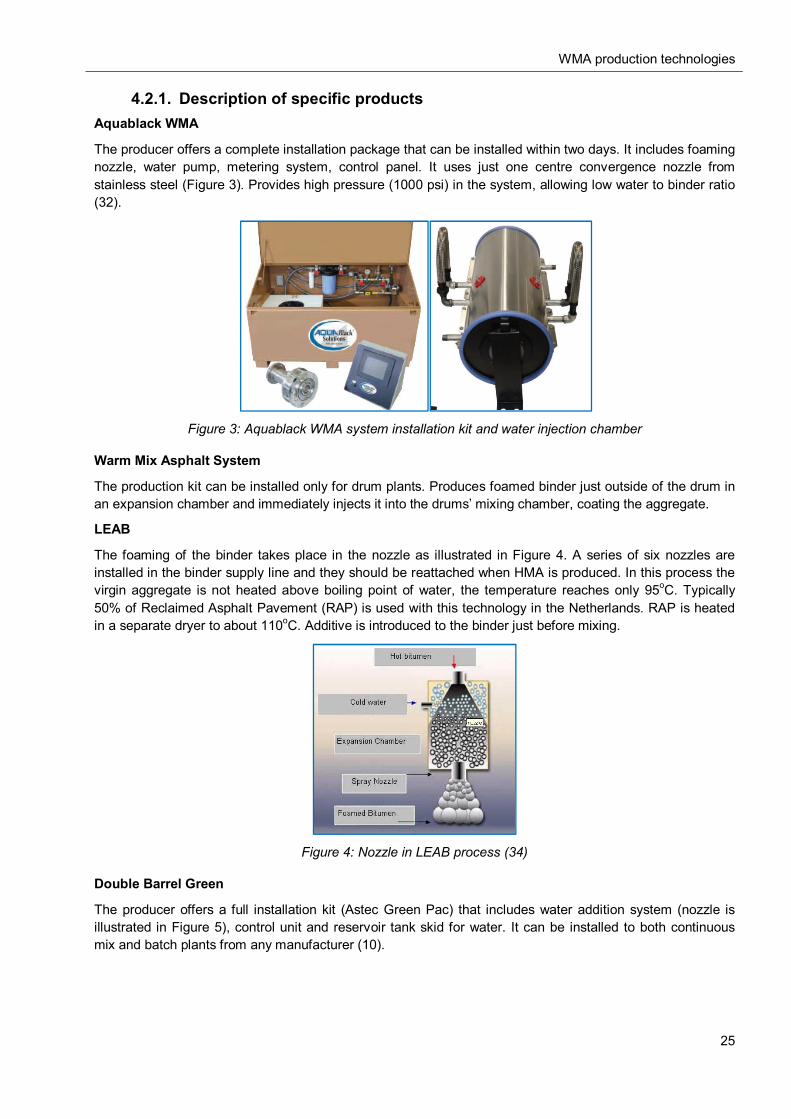
4.2.1. Description of specific products Aquablack WMA
The producer offers a complete installation package that can be installed within two days. It includes foaming nozzle, water pump, metering system, control panel. It uses just one centre convergence nozzle from stainless steel (Figure 3). Provides high pressure (1000 psi) in the system, allowing low water to binder ratio (32).
Figure 3: Aquablack WMA system installation kit and water injection chamber
Warm Mix Asphalt System
The production kit can be installed only for drum plants. Produces foamed binder just outside of the drum in an expansion chamber and immediately injects it into the drums’ mixing chamber, coating the aggregate.
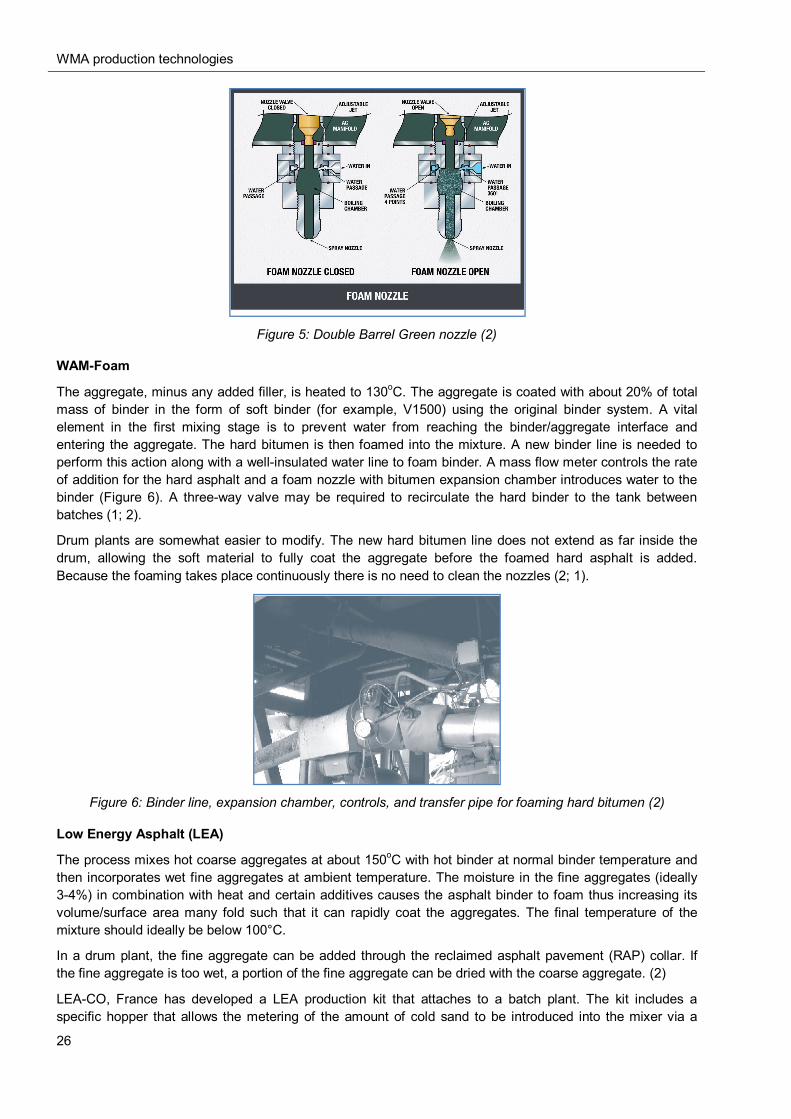
LEAB
The foaming of the binder takes place in the nozzle as illustrated in Figure 4. A series of six nozzles are installed in the binder supply line and they should be reattached when HMA is produced. In this process the virgin aggregate is not heated above boiling point of water, the temperature reaches only 95oC. Typically 50% of Reclaimed Asphalt Pavement (RAP) is used with this technology in the Netherlands. RAP is heated in a separate dryer to about 110oC. Additive is introduced to the binder just before mixing.
Figure 4: Nozzle in LEAB process (34)
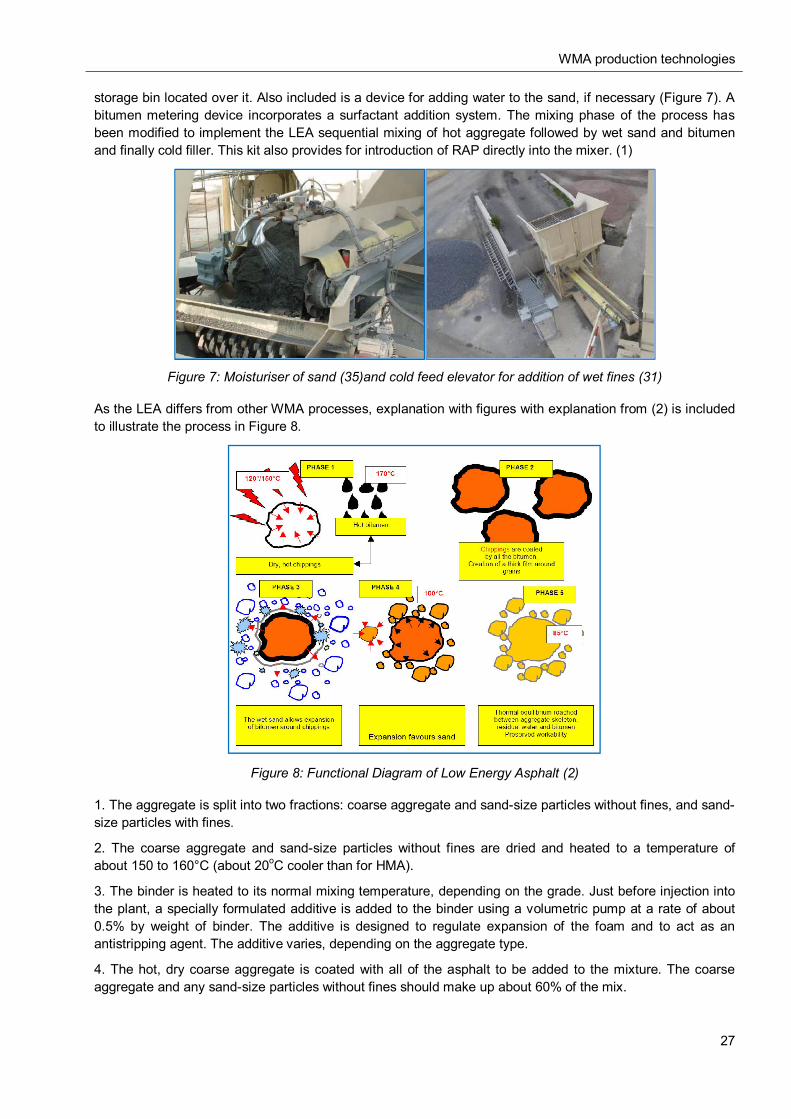
Double Barrel Green
The producer offers a full installation kit (Astec Green Pac) that includes water addition system (nozzle is illustrated in Figure 5), control unit and reservoir tank skid for water. It can be installed to both continuous mix and batch plants from any manufacturer (10).
WMA production technologies
26
Figure 5: Double Barrel Green nozzle (2)
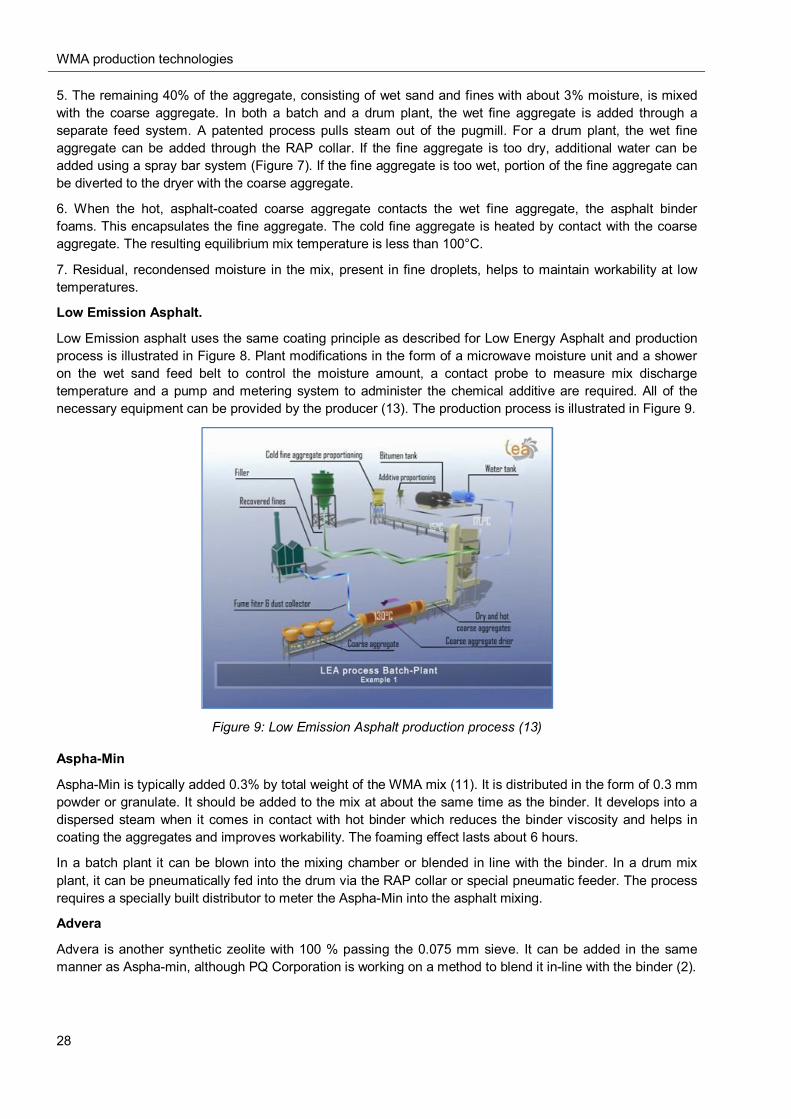
WAM-Foam
The aggregate, minus any added filler, is heated to 130oC. The aggregate is coated with about 20% of total mass of binder in the form of soft binder (for example, V1500) using the original binder system. A vital element in the first mixing stage is to prevent water from reaching the binder/aggregate interface and entering the aggregate. The hard bitumen is then foamed into the mixture. A new binder line is needed to perform this action along with a well-insulated water line to foam binder. A mass flow meter controls the rate of addition for the hard asphalt and a foam nozzle with bitumen expansion chamber introduces water to the binder (Figure 6). A three-way valve may be required to recirculate the hard binder to the tank between batches (1; 2).
Drum plants are somewhat easier to modify. The new hard bitumen line does not extend as far inside the drum, allowing the soft material to fully coat the aggregate before the foamed hard asphalt is added. Because the foaming takes place continuously there is no need to clean the nozzles (2; 1).
Figure 6: Binder line, expansion chamber, controls, and transfer pipe for foaming hard bitumen (2)
Low Energy Asphalt (LEA)
The process mixes hot coarse aggregates at about 150oC with hot binder at normal binder temperature and then incorporates wet fine aggregates at ambient temperature. The moisture in the fine aggregates (ideally 3-4%) in combination with heat and certain additives causes the asphalt binder to foam thus increasing its volume/surface area many fold such that it can rapidly coat the aggregates. The final temperature of the mixture should ideally be below 100°C.
In a drum plant, the fine aggregate can be added through the reclaimed asphalt pavement (RAP) collar. If the fine aggregate is too wet, a portion of the fine aggregate can be dried with the coarse aggregate. (2)
LEA-CO, France has developed a LEA production kit that attaches to a batch plant. The kit includes a specific hopper that allows the metering of the amount of cold sand to be introduced into the mixer via a
WMA production technologies
27
storage bin located over it. Also included is a device for adding water to the sand, if necessary (Figure 7). A bitumen metering device incorporates a surfactant addition system. The mixing phase of the process has been modified to implement the LEA sequential mixing of hot aggregate followed by wet sand and bitumen and finally cold filler. This kit also provides for introduction of RAP directly into the mixer. (1)
Figure 7: Moisturiser of sand (35)and cold feed elevator for addition of wet fines (31)
As the LEA differs from other WMA processes, explanation with figures with explanation from (2) is included to illustrate the process in Figure 8.
Figure 8: Functional Diagram of Low Energy Asphalt (2)
1. The aggregate is split into two fractions: coarse aggregate and sand-size particles without fines, and sand-size particles with fines.
2. The coarse aggregate and sand-size particles without fines are dried and heated to a temperature of about 150 to 160°C (about 20oC cooler than for HMA).
3. The binder is heated to its normal mixing temperature, depending on the grade. Just before injection into the plant, a specially formulated additive is added to the binder using a volumetric pump at a rate of about 0.5% by weight of binder. The additive is designed to regulate expansion of the foam and to act as an antistripping agent. The additive varies, depending on the aggregate type.
4. The hot, dry coarse aggregate is coated with all of the asphalt to be added to the mixture. The coarse aggregate and any sand-size particles without fines should make up about 60% of the mix.
WMA production technologies
28
5. The remaining 40% of the aggregate, consisting of wet sand and fines with about 3% moisture, is mixed with the coarse aggregate. In both a batch and a drum plant, the wet fine aggregate is added through a separate feed system. A patented process pulls steam out of the pugmill. For a drum plant, the wet fine aggregate can be added through the RAP collar. If the fine aggregate is too dry, additional water can be added using a spray bar system (Figure 7). If the fine aggregate is too wet, portion of the fine aggregate can be diverted to the dryer with the coarse aggregate.
6. When the hot, asphalt-coated coarse aggregate contacts the wet fine aggregate, the asphalt binder foams. This encapsulates the fine aggregate. The cold fine aggregate is heated by contact with the coarse aggregate. The resulting equilibrium mix temperature is less than 100°C.
7. Residual, recondensed moisture in the mix, present in fine droplets, helps to maintain workability at low temperatures.
Low Emission Asphalt.
Low Emission asphalt uses the same coating principle as described for Low Energy Asphalt and production process is illustrated in Figure 8. Plant modifications in the form of a microwave moisture unit and a shower on the wet sand feed belt to control the moisture amount, a contact probe to measure mix discharge temperature and a pump and metering system to administer the chemical additive are required. All of the necessary equipment can be provided by the producer (13). The production process is illustrated in Figure 9.
Figure 9: Low Emission Asphalt production process (13)
Aspha-Min
Aspha-Min is typically added 0.3% by total weight of the WMA mix (11). It is distributed in the form of 0.3 mm powder or granulate. It should be added to the mix at about the same time as the binder. It develops into a dispersed steam when it comes in contact with hot binder which reduces the binder viscosity and helps in coating the aggregates and improves workability. The foaming effect lasts about 6 hours.
In a batch plant it can be blown into the mixing chamber or blended in line with the binder. In a drum mix plant, it can be pneumatically fed into the drum via the RAP collar or special pneumatic feeder. The process requires a specially built distributor to meter the Aspha-Min into the asphalt mixing.
Advera
Advera is another synthetic zeolite with 100 % passing the 0.075 mm sieve. It can be added in the same manner as Aspha-min, although PQ Corporation is working on a method to blend it in-line with the binder (2).
WMA production technologies
29
Sasobit
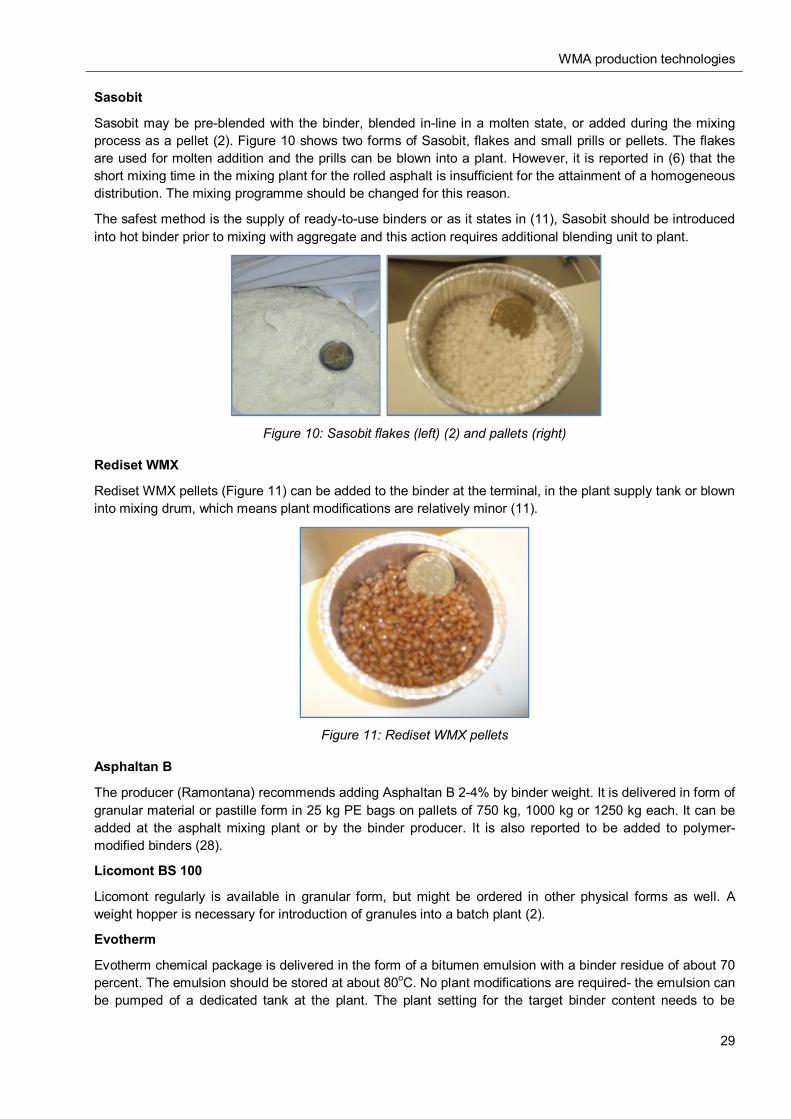
Sasobit may be pre-blended with the binder, blended in-line in a molten state, or added during the mixing process as a pellet (2). Figure 10 shows two forms of Sasobit, flakes and small prills or pellets. The flakes are used for molten addition and the prills can be blown into a plant. However, it is reported in (6) that the short mixing time in the mixing plant for the rolled asphalt is insufficient for the attainment of a homogeneous distribution. The mixing programme should be changed for this reason.
The safest method is the supply of ready-to-use binders or as it states in (11), Sasobit should be introduced into hot binder prior to mixing with aggregate and this action requires additional blending unit to plant.
Figure 10: Sasobit flakes (left) (2) and pallets (right)
Rediset WMX
Rediset WMX pellets (Figure 11) can be added to the binder at the terminal, in the plant supply tank or blown into mixing drum, which means plant modifications are relatively minor (11).
Figure 11: Rediset WMX pellets
Asphaltan B
The producer (Ramontana) recommends adding Asphaltan B 2-4% by binder weight. It is delivered in form of granular material or pastille form in 25 kg PE bags on pallets of 750 kg, 1000 kg or 1250 kg each. It can be added at the asphalt mixing plant or by the binder producer. It is also reported to be added to polymer-modified binders (28).
Licomont BS 100
Licomont regularly is available in granular form, but might be ordered in other physical forms as well. A weight hopper is necessary for introduction of granules into a batch plant (2).
Evotherm
Evotherm chemical package is delivered in the form of a bitumen emulsion with a binder residue of about 70 percent. The emulsion should be stored at about 80oC. No plant modifications are required- the emulsion can be pumped of a dedicated tank at the plant. The plant setting for the target binder content needs to be
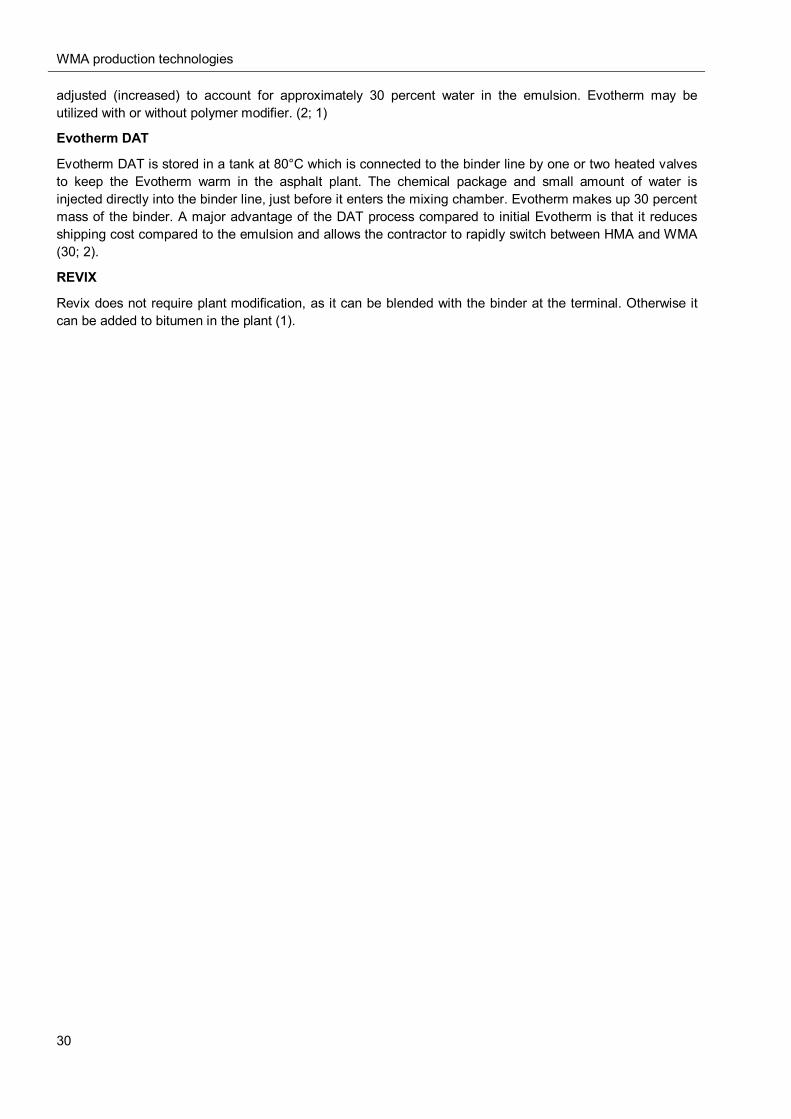
WMA production technologies
30
adjusted (increased) to account for approximately 30 percent water in the emulsion. Evotherm may be utilized with or without polymer modifier. (2; 1)
Evotherm DAT
Evotherm DAT is stored in a tank at 80°C which is connected to the binder line by one or two heated valves to keep the Evotherm warm in the asphalt plant. The chemical package and small amount of water is injected directly into the binder line, just before it enters the mixing chamber. Evotherm makes up 30 percent mass of the binder. A major advantage of the DAT process compared to initial Evotherm is that it reduces shipping cost compared to the emulsion and allows the contractor to rapidly switch between HMA and WMA (30; 2).
REVIX
Revix does not require plant modification, as it can be blended with the binder at the terminal. Otherwise it can be added to bitumen in the plant (1).
Bitumen
31
5. BITUMEN In this chapter bitumen, its properties and their relevance to Warm Mix Asphalt (WMA) production will be discussed, by taking into account the specific climatic conditions. Only the properties that are reported to have influence on specifics of production or evaluation of WMA mixtures will be discussed. The testing methods used for bitumen evaluation in Europe will be considered and, in theoretical terms, the possible adjustments to test methods and result expression principles to allow a more precise characterisation of bitumen that has been modified for WMA production will be proposed.
The specifics in the production process for the foaming processes may require a completely different approach to binder evaluation regarding WMA and this will be discussed in section 7.2 Considerations regarding WMA design.
5.1. Properties of bitumen Bitumen is a complex material with a complex response to stress. The response of bitumen to stress is dependent on both temperature and loading time and the degree to which their behaviour is viscous and elastic is a function of both temperature and loading time. At high temperatures or long loading times, bitumens behave as viscous liquids whereas at very low temperatures or short times of loading they behave as elastic (brittle) solids. The more typical conditions in service result in visco-elastic behaviour (36).
Changing bitumens’ visco-elastic characteristics in production and in-service temperatures is the main part of most of the WMA technologies. Bitumen modification with additives and/or reduction of the bitumen viscosity in production and paving temperatures allows to reduce the temperature in which bitumen is still workable. For this reason it is vitally important to have solid knowledge about bitumen properties and their influence on the visco-elastic behaviour of binder in order to determine the right production and paving temperature and predict asphalts behaviour for long term in-service life. Therefore a short description of bitumen testing methods and their relation to evaluating and/or designing WMA mixtures will be given below.
5.1.1. Approach to assessment of bitumen properties Specifications of bitumen characteristics in Europe are based upon traditional test methods that were invented mostly in first half of the 20th century and with only some modifications are still used today. As a result there can arise problems in evaluating the performance of “modern” bitumens that have been modified with different additives as it is with most of the WMA technologies.
Although work programs are being undertaken to develop more directly performance related test methods, EN specifications for paving grade binders today are based on traditional, empirical testing methods. The requirements for the binder properties in EN are specified by their penetration grades.
In the US the SUPERPAVE mix design system binder categorisation is based on “Superpave asphalt binder specification” which is more directly performance-related. The test methods in this system allow more direct determination of bitumen properties and prediction of its performance in given climate conditions. Therefore it can be easier to explain the WMA modified bitumens for use with the SUPERPAVE mix design system and predict the potential behaviour in-situ conditions. The European standard methods and interpretation of the results may require various adjustments and some adoptions of test methods and result interpretation from US This will be also included in the discussion.
5.1.2. Mechanical testing European standards describe performance required for a number of properties for binders and the specifications for paving grade binders are regulated by EN 12591. Some of the properties are required by specific countries or regions, but this report will concentrate on general, most common properties and on those, that have direct influence on the production and characteristics of WMA mixtures.
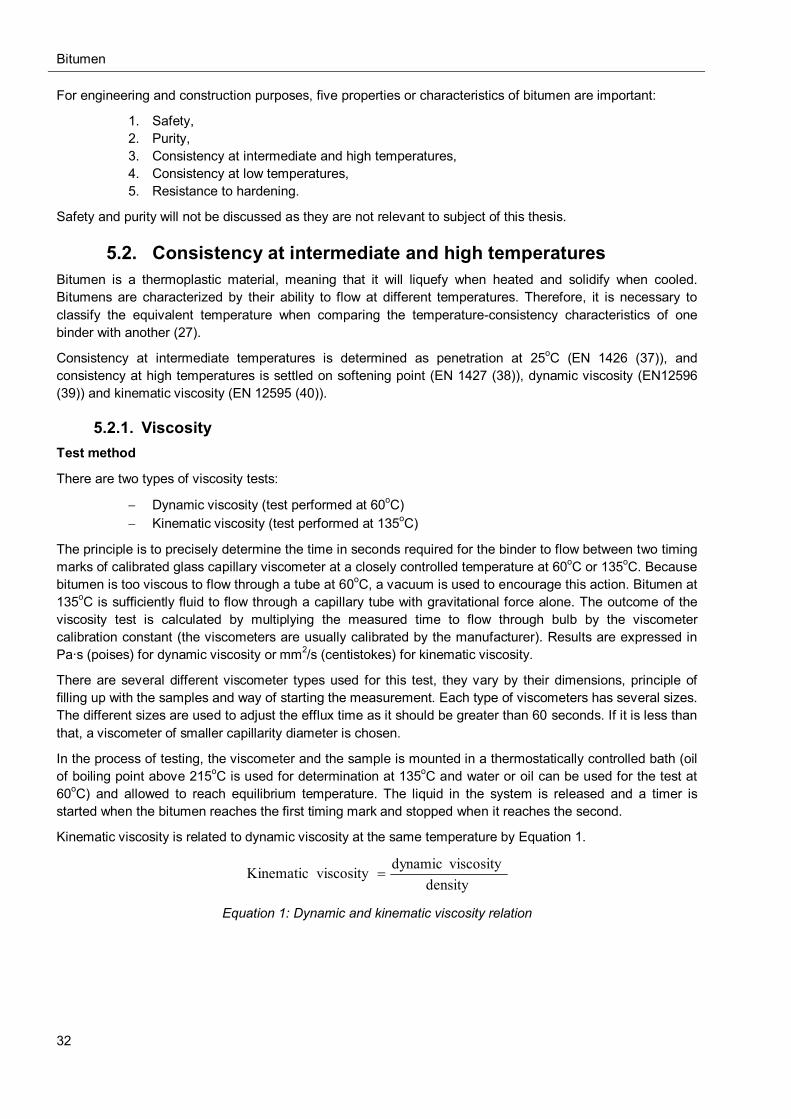
Bitumen
32
For engineering and construction purposes, five properties or characteristics of bitumen are important:
1. Safety, 2. Purity, 3. Consistency at intermediate and high temperatures, 4. Consistency at low temperatures, 5. Resistance to hardening.
Safety and purity will not be discussed as they are not relevant to subject of this thesis.
5.2. Consistency at intermediate and high temperatures Bitumen is a thermoplastic material, meaning that it will liquefy when heated and solidify when cooled. Bitumens are characterized by their ability to flow at different temperatures. Therefore, it is necessary to classify the equivalent temperature when comparing the temperature-consistency characteristics of one binder with another (27).
Consistency at intermediate temperatures is determined as penetration at 25oC (EN 1426 (37)), and consistency at high temperatures is settled on softening point (EN 1427 (38)), dynamic viscosity (EN12596 (39)) and kinematic viscosity (EN 12595 (40)).
5.2.1. Viscosity Test method
There are two types of viscosity tests:
Dynamic viscosity (test performed at 60oC) Kinematic viscosity (test performed at 135oC)
The principle is to precisely determine the time in seconds required for the binder to flow between two timing marks of calibrated glass capillary viscometer at a closely controlled temperature at 60oC or 135oC. Because bitumen is too viscous to flow through a tube at 60oC, a vacuum is used to encourage this action. Bitumen at 135oC is sufficiently fluid to flow through a capillary tube with gravitational force alone. The outcome of the viscosity test is calculated by multiplying the measured time to flow through bulb by the viscometer calibration constant (the viscometers are usually calibrated by the manufacturer). Results are expressed in Pa·s (poises) for dynamic viscosity or mm2/s (centistokes) for kinematic viscosity.
There are several different viscometer types used for this test, they vary by their dimensions, principle of filling up with the samples and way of starting the measurement. Each type of viscometers has several sizes. The different sizes are used to adjust the efflux time as it should be greater than 60 seconds. If it is less than that, a viscometer of smaller capillarity diameter is chosen.
In the process of testing, the viscometer and the sample is mounted in a thermostatically controlled bath (oil of boiling point above 215oC is used for determination at 135oC and water or oil can be used for the test at 60oC) and allowed to reach equilibrium temperature. The liquid in the system is released and a timer is started when the bitumen reaches the first timing mark and stopped when it reaches the second.
Kinematic viscosity is related to dynamic viscosity at the same temperature by Equation 1.
density viscositydynamic viscosityKinematic
Equation 1: Dynamic and kinematic viscosity relation
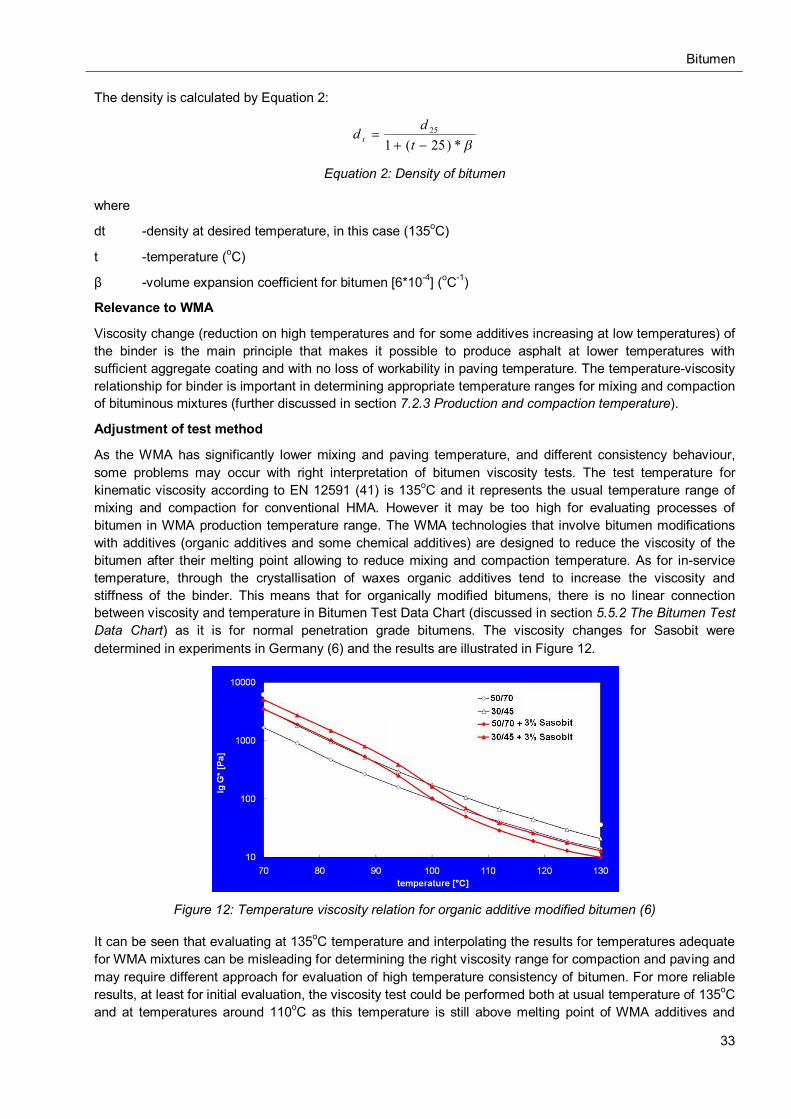
Bitumen
33
The density is calculated by Equation 2:
*)25(125
tdd t
Equation 2: Density of bitumen
where
dt -density at desired temperature, in this case (135oC)
t -temperature (oC)
β -volume expansion coefficient for bitumen [6*10-4] (oC-1)
Relevance to WMA
Viscosity change (reduction on high temperatures and for some additives increasing at low temperatures) of the binder is the main principle that makes it possible to produce asphalt at lower temperatures with sufficient aggregate coating and with no loss of workability in paving temperature. The temperature-viscosity relationship for binder is important in determining appropriate temperature ranges for mixing and compaction of bituminous mixtures (further discussed in section 7.2.3 Production and compaction temperature).
Adjustment of test method
As the WMA has significantly lower mixing and paving temperature, and different consistency behaviour, some problems may occur with right interpretation of bitumen viscosity tests. The test temperature for kinematic viscosity according to EN 12591 (41) is 135oC and it represents the usual temperature range of mixing and compaction for conventional HMA. However it may be too high for evaluating processes of bitumen in WMA production temperature range. The WMA technologies that involve bitumen modifications with additives (organic additives and some chemical additives) are designed to reduce the viscosity of the bitumen after their melting point allowing to reduce mixing and compaction temperature. As for in-service temperature, through the crystallisation of waxes organic additives tend to increase the viscosity and stiffness of the binder. This means that for organically modified bitumens, there is no linear connection between viscosity and temperature in Bitumen Test Data Chart (discussed in section 5.5.2 The Bitumen Test Data Chart) as it is for normal penetration grade bitumens. The viscosity changes for Sasobit were determined in experiments in Germany (6) and the results are illustrated in Figure 12.
Figure 12: Temperature viscosity relation for organic additive modified bitumen (6)
It can be seen that evaluating at 135oC temperature and interpolating the results for temperatures adequate for WMA mixtures can be misleading for determining the right viscosity range for compaction and paving and may require different approach for evaluation of high temperature consistency of bitumen. For more reliable results, at least for initial evaluation, the viscosity test could be performed both at usual temperature of 135oC and at temperatures around 110oC as this temperature is still above melting point of WMA additives and
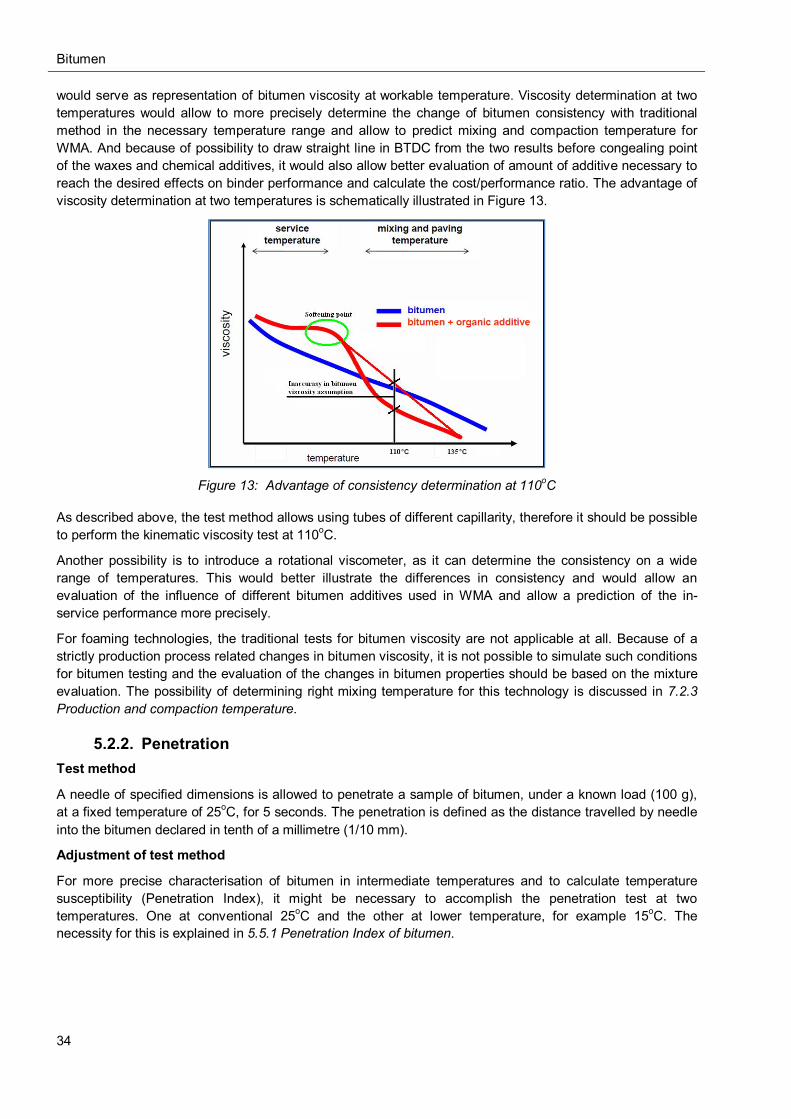
Bitumen
34
would serve as representation of bitumen viscosity at workable temperature. Viscosity determination at two temperatures would allow to more precisely determine the change of bitumen consistency with traditional method in the necessary temperature range and allow to predict mixing and compaction temperature for WMA. And because of possibility to draw straight line in BTDC from the two results before congealing point of the waxes and chemical additives, it would also allow better evaluation of amount of additive necessary to reach the desired effects on binder performance and calculate the cost/performance ratio. The advantage of viscosity determination at two temperatures is schematically illustrated in Figure 13.
Figure 13: Advantage of consistency determination at 110oC
As described above, the test method allows using tubes of different capillarity, therefore it should be possible to perform the kinematic viscosity test at 110oC.
Another possibility is to introduce a rotational viscometer, as it can determine the consistency on a wide range of temperatures. This would better illustrate the differences in consistency and would allow an evaluation of the influence of different bitumen additives used in WMA and allow a prediction of the in-service performance more precisely.
For foaming technologies, the traditional tests for bitumen viscosity are not applicable at all. Because of a strictly production process related changes in bitumen viscosity, it is not possible to simulate such conditions for bitumen testing and the evaluation of the changes in bitumen properties should be based on the mixture evaluation. The possibility of determining right mixing temperature for this technology is discussed in 7.2.3 Production and compaction temperature.
5.2.2. Penetration Test method
A needle of specified dimensions is allowed to penetrate a sample of bitumen, under a known load (100 g), at a fixed temperature of 25oC, for 5 seconds. The penetration is defined as the distance travelled by needle into the bitumen declared in tenth of a millimetre (1/10 mm).
Adjustment of test method
For more precise characterisation of bitumen in intermediate temperatures and to calculate temperature susceptibility (Penetration Index), it might be necessary to accomplish the penetration test at two temperatures. One at conventional 25oC and the other at lower temperature, for example 15oC. The necessity for this is explained in 5.5.1 Penetration Index of bitumen.
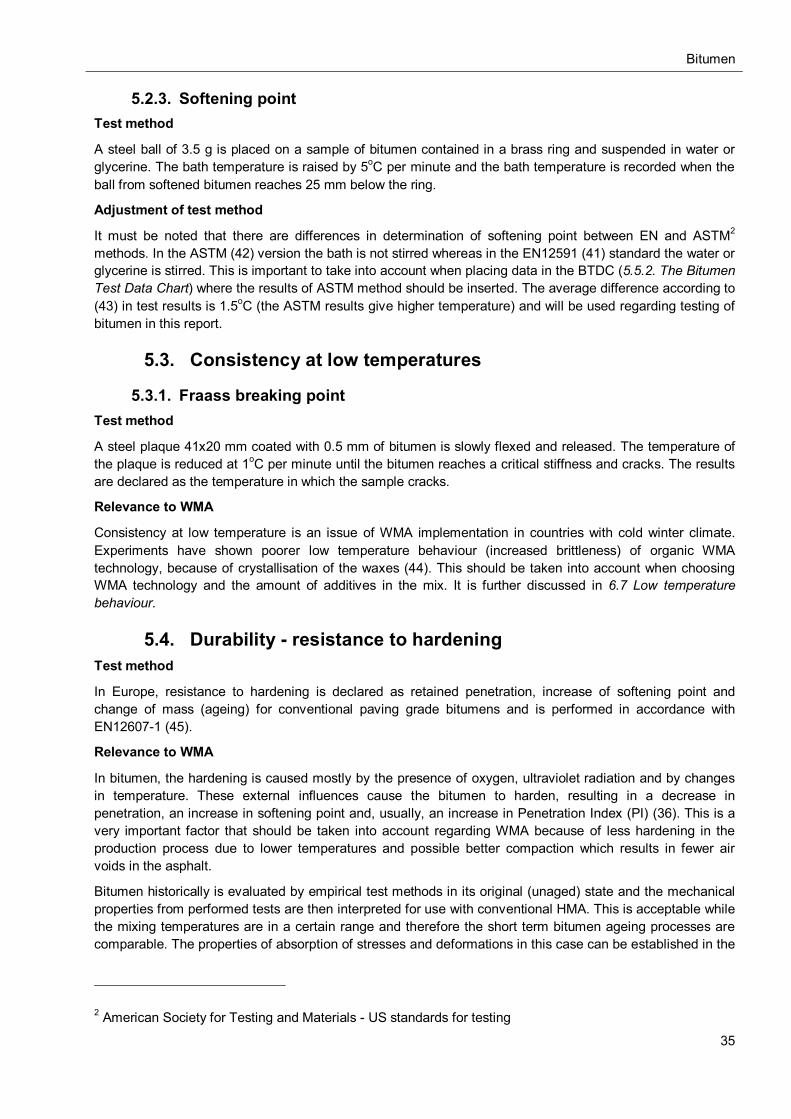
Bitumen
35
5.2.3. Softening point Test method
A steel ball of 3.5 g is placed on a sample of bitumen contained in a brass ring and suspended in water or glycerine. The bath temperature is raised by 5oC per minute and the bath temperature is recorded when the ball from softened bitumen reaches 25 mm below the ring.
Adjustment of test method
It must be noted that there are differences in determination of softening point between EN and ASTM2 methods. In the ASTM (42) version the bath is not stirred whereas in the EN12591 (41) standard the water or glycerine is stirred. This is important to take into account when placing data in the BTDC (5.5.2. The Bitumen Test Data Chart) where the results of ASTM method should be inserted. The average difference according to (43) in test results is 1.5oC (the ASTM results give higher temperature) and will be used regarding testing of bitumen in this report.
5.3. Consistency at low temperatures
5.3.1. Fraass breaking point Test method
A steel plaque 41x20 mm coated with 0.5 mm of bitumen is slowly flexed and released. The temperature of the plaque is reduced at 1oC per minute until the bitumen reaches a critical stiffness and cracks. The results are declared as the temperature in which the sample cracks.
Relevance to WMA
Consistency at low temperature is an issue of WMA implementation in countries with cold winter climate. Experiments have shown poorer low temperature behaviour (increased brittleness) of organic WMA technology, because of crystallisation of the waxes (44). This should be taken into account when choosing WMA technology and the amount of additives in the mix. It is further discussed in 6.7 Low temperature behaviour.
5.4. Durability - resistance to hardening Test method
In Europe, resistance to hardening is declared as retained penetration, increase of softening point and change of mass (ageing) for conventional paving grade bitumens and is performed in accordance with EN12607-1 (45).
Relevance to WMA
In bitumen, the hardening is caused mostly by the presence of oxygen, ultraviolet radiation and by changes in temperature. These external influences cause the bitumen to harden, resulting in a decrease in penetration, an increase in softening point and, usually, an increase in Penetration Index (PI) (36). This is a very important factor that should be taken into account regarding WMA because of less hardening in the production process due to lower temperatures and possible better compaction which results in fewer air voids in the asphalt.
Bitumen historically is evaluated by empirical test methods in its original (unaged) state and the mechanical properties from performed tests are then interpreted for use with conventional HMA. This is acceptable while the mixing temperatures are in a certain range and therefore the short term bitumen ageing processes are comparable. The properties of absorption of stresses and deformations in this case can be established in the
2 American Society for Testing and Materials - US standards for testing

Bitumen
36
bitumen’s original state by taking the ageing processes into account. As it is with conventional bituminous mixtures where due to many years of testing and in-field observations, a correlation between original bitumen performance and performance of the bituminous mixtures is established. The requirements that are based on this knowledge for unaged bitumen performance is applied for use with different types of HMA through standards and national specifications and take into account the ageing processes.
However in general the behaviour of the original bitumen is irrelevant and in connection with the absorption of stresses in mixes it is necessary to know the bitumen in the state in which it occurs in the mixes. All bitumens change their properties after ageing in the production process, but the degree of ageing depends mostly on the mixing temperature. This is important in respect to differences in temperatures between HMA and WMA. The production and paving of WMA at lower temperatures tends to reduce permeability and binder hardening due to reduced ageing and can increase the rutting potential of WMA. Therefore it may be necessary to chose stiffer binder for working with WMA (1).
5.4.1. Retained penetration and increase of softening point Test method
The ratio of penetration and softening point in the hardened state over the original state is the expression of retained penetration.
Relevance to WMA
The most important difference in the production process of WMA compared to HMA is the temperature reduction, which can affect the values of retained penetration and softening point. But depending on the technology there may also be changes in the mixing cycle and possibly in the bitumen amount (bitumen film thickness), which can also influence bitumen hardening. This indicates significant differences between bitumen properties in WMA in comparison with conventional HMA. The retained penetration and increase in softening point for the short-term aged binder may be a good method of comparing the changes in properties of binder in WMA and HMA after production. This would allow to determine the necessity to use stiffer binder in order to avoid problems of permanent deformation.
5.4.2. Ageing Test method
Ageing is one of the evaluations of resistance to hardening. It is performed at 163oC for 85 minutes (EN 12607-1 (46)) using the Rolling Thin Film Oven Test (RTFOT) or the Thin Film Oven Test (TFOT) ageing method according to EN 12607-2 (47). It is expressed as the absolute change of mass for the bitumen before and after the test (either positive or negative).
Relevance to WMA
It is recognized that while the physical properties of binders may be the same initially, when influenced by different external factors may lead to a different in-service performance (27). This is referred as binder hardening. The behaviour of bitumen hardening can be classified as short term and long term ageing:
Short term - oxidation and volatilization that occurs during use and mixing in a hot facility and subsequent placement on the road (simulated with RTFOT and TFOT methods in laboratory)
Long term - hardening of the bitumen on the road because of constant supply of fresh air, influence of high temperatures and photo oxidation of the bitumen by ultraviolet radiation. In laboratory simulated with Pressure Ageing Vessel (PAV) method.
An example of ageing processes during the life cycle of bituminous mixture is illustrated in Figure 14.
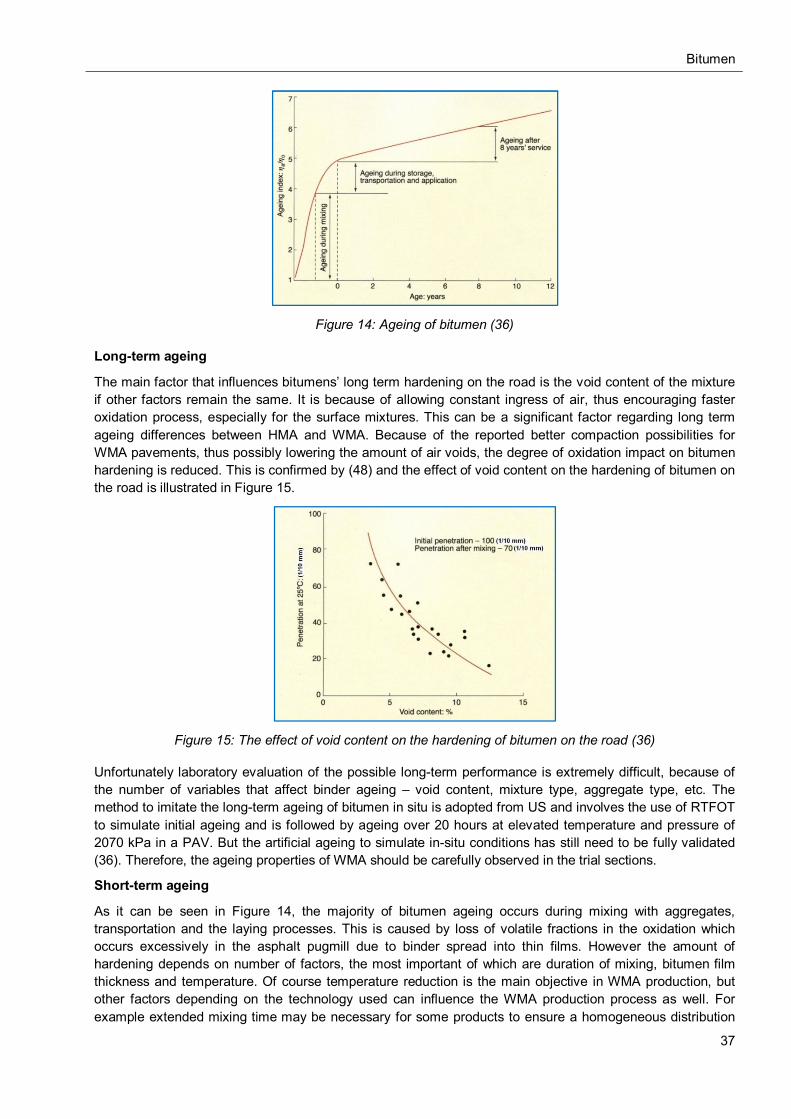
Bitumen
37
Figure 14: Ageing of bitumen (36)
Long-term ageing
The main factor that influences bitumens’ long term hardening on the road is the void content of the mixture if other factors remain the same. It is because of allowing constant ingress of air, thus encouraging faster oxidation process, especially for the surface mixtures. This can be a significant factor regarding long term ageing differences between HMA and WMA. Because of the reported better compaction possibilities for WMA pavements, thus possibly lowering the amount of air voids, the degree of oxidation impact on bitumen hardening is reduced. This is confirmed by (48) and the effect of void content on the hardening of bitumen on the road is illustrated in Figure 15.
Figure 15: The effect of void content on the hardening of bitumen on the road (36)
Unfortunately laboratory evaluation of the possible long-term performance is extremely difficult, because of the number of variables that affect binder ageing – void content, mixture type, aggregate type, etc. The method to imitate the long-term ageing of bitumen in situ is adopted from US and involves the use of RTFOT to simulate initial ageing and is followed by ageing over 20 hours at elevated temperature and pressure of 2070 kPa in a PAV. But the artificial ageing to simulate in-situ conditions has still need to be fully validated (36). Therefore, the ageing properties of WMA should be carefully observed in the trial sections.
Short-term ageing
As it can be seen in Figure 14, the majority of bitumen ageing occurs during mixing with aggregates, transportation and the laying processes. This is caused by loss of volatile fractions in the oxidation which occurs excessively in the asphalt pugmill due to binder spread into thin films. However the amount of hardening depends on number of factors, the most important of which are duration of mixing, bitumen film thickness and temperature. Of course temperature reduction is the main objective in WMA production, but other factors depending on the technology used can influence the WMA production process as well. For example extended mixing time may be necessary for some products to ensure a homogeneous distribution
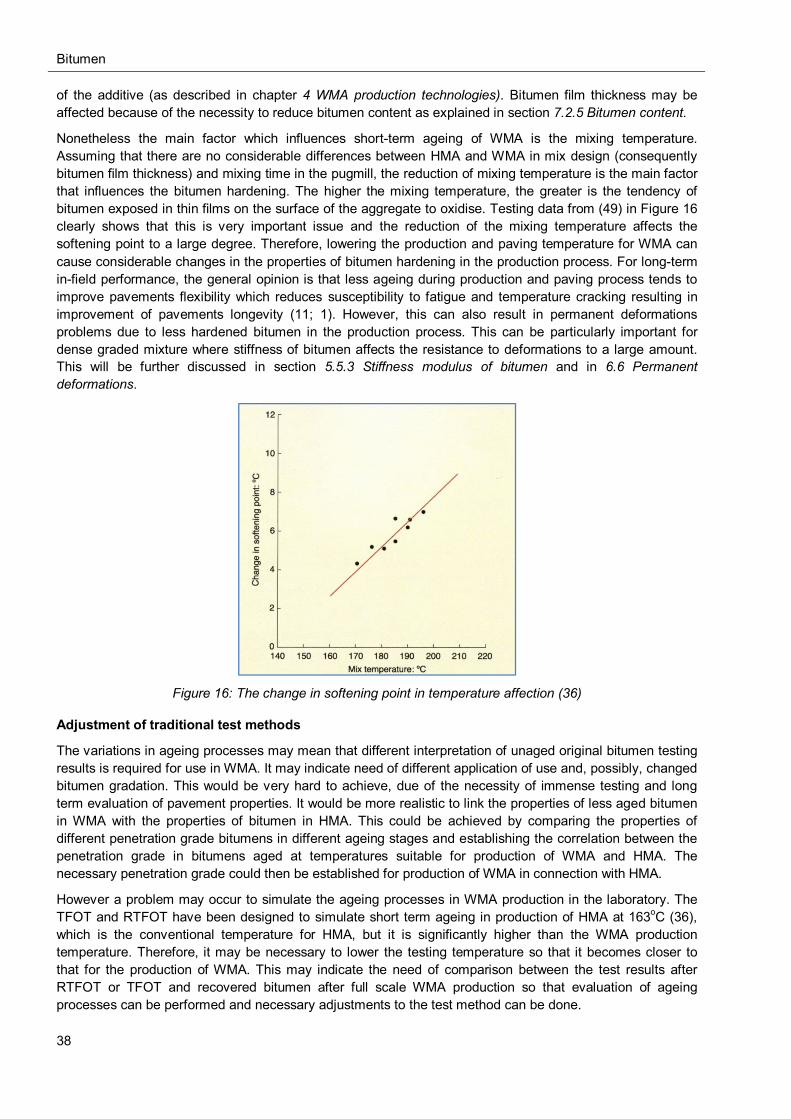
Bitumen
38
of the additive (as described in chapter 4 WMA production technologies). Bitumen film thickness may be affected because of the necessity to reduce bitumen content as explained in section 7.2.5 Bitumen content.
Nonetheless the main factor which influences short-term ageing of WMA is the mixing temperature. Assuming that there are no considerable differences between HMA and WMA in mix design (consequently bitumen film thickness) and mixing time in the pugmill, the reduction of mixing temperature is the main factor that influences the bitumen hardening. The higher the mixing temperature, the greater is the tendency of bitumen exposed in thin films on the surface of the aggregate to oxidise. Testing data from (49) in Figure 16 clearly shows that this is very important issue and the reduction of the mixing temperature affects the softening point to a large degree. Therefore, lowering the production and paving temperature for WMA can cause considerable changes in the properties of bitumen hardening in the production process. For long-term in-field performance, the general opinion is that less ageing during production and paving process tends to improve pavements flexibility which reduces susceptibility to fatigue and temperature cracking resulting in improvement of pavements longevity (11; 1). However, this can also result in permanent deformations problems due to less hardened bitumen in the production process. This can be particularly important for dense graded mixture where stiffness of bitumen affects the resistance to deformations to a large amount. This will be further discussed in section 5.5.3 Stiffness modulus of bitumen and in 6.6 Permanent deformations.
Figure 16: The change in softening point in temperature affection (36)
Adjustment of traditional test methods
The variations in ageing processes may mean that different interpretation of unaged original bitumen testing results is required for use in WMA. It may indicate need of different application of use and, possibly, changed bitumen gradation. This would be very hard to achieve, due of the necessity of immense testing and long term evaluation of pavement properties. It would be more realistic to link the properties of less aged bitumen in WMA with the properties of bitumen in HMA. This could be achieved by comparing the properties of different penetration grade bitumens in different ageing stages and establishing the correlation between the penetration grade in bitumens aged at temperatures suitable for production of WMA and HMA. The necessary penetration grade could then be established for production of WMA in connection with HMA.
However a problem may occur to simulate the ageing processes in WMA production in the laboratory. The TFOT and RTFOT have been designed to simulate short term ageing in production of HMA at 163oC (36), which is the conventional temperature for HMA, but it is significantly higher than the WMA production temperature. Therefore, it may be necessary to lower the testing temperature so that it becomes closer to that for the production of WMA. This may indicate the need of comparison between the test results after RTFOT or TFOT and recovered bitumen after full scale WMA production so that evaluation of ageing processes can be performed and necessary adjustments to the test method can be done.
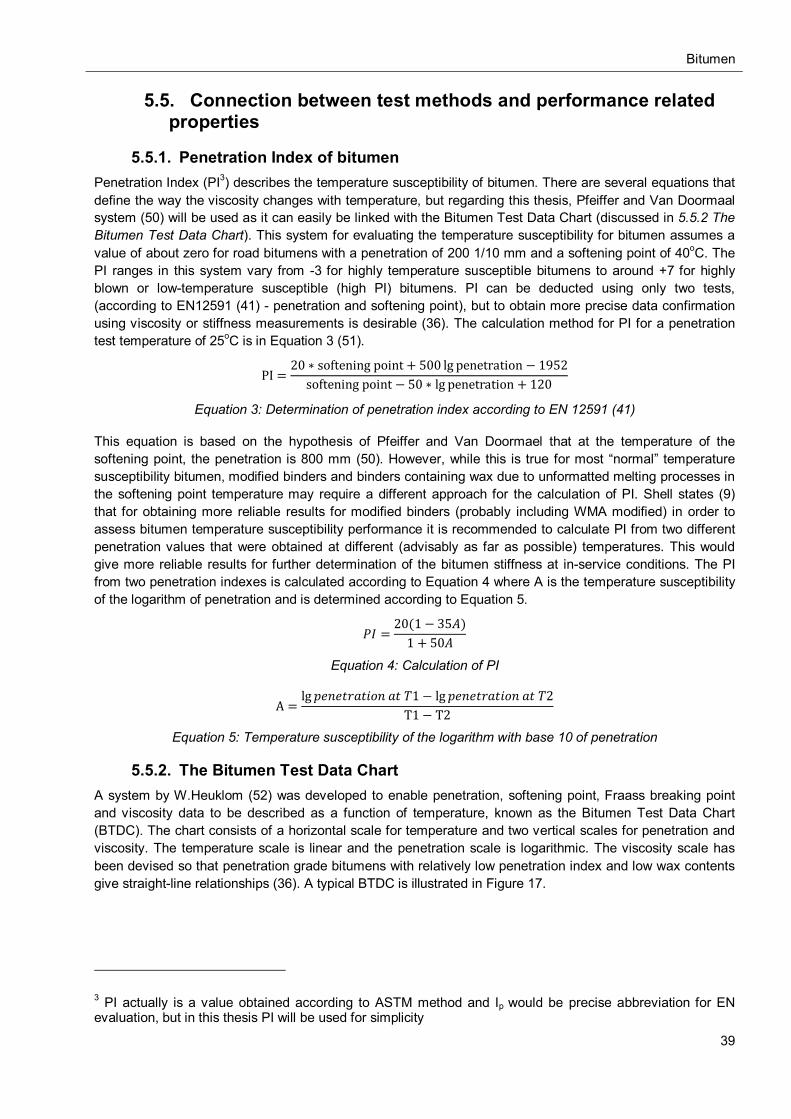
Bitumen
39
5.5. Connection between test methods and performance related properties
5.5.1. Penetration Index of bitumen Penetration Index (PI3) describes the temperature susceptibility of bitumen. There are several equations that define the way the viscosity changes with temperature, but regarding this thesis, Pfeiffer and Van Doormaal system (50) will be used as it can easily be linked with the Bitumen Test Data Chart (discussed in 5.5.2 The Bitumen Test Data Chart). This system for evaluating the temperature susceptibility for bitumen assumes a value of about zero for road bitumens with a penetration of 200 1/10 mm and a softening point of 40oC. The PI ranges in this system vary from -3 for highly temperature susceptible bitumens to around +7 for highly blown or low-temperature susceptible (high PI) bitumens. PI can be deducted using only two tests, (according to EN12591 (41) - penetration and softening point), but to obtain more precise data confirmation using viscosity or stiffness measurements is desirable (36). The calculation method for PI for a penetration test temperature of 25oC is in Equation 3 (51).
PI =20 ∗ softening point + 500 lg penetration − 1952
softening point − 50 ∗ lg penetration + 120
Equation 3: Determination of penetration index according to EN 12591 (41)
This equation is based on the hypothesis of Pfeiffer and Van Doormael that at the temperature of the softening point, the penetration is 800 mm (50). However, while this is true for most “normal” temperature susceptibility bitumen, modified binders and binders containing wax due to unformatted melting processes in the softening point temperature may require a different approach for the calculation of PI. Shell states (9) that for obtaining more reliable results for modified binders (probably including WMA modified) in order to assess bitumen temperature susceptibility performance it is recommended to calculate PI from two different penetration values that were obtained at different (advisably as far as possible) temperatures. This would give more reliable results for further determination of the bitumen stiffness at in-service conditions. The PI from two penetration indexes is calculated according to Equation 4 where A is the temperature susceptibility of the logarithm of penetration and is determined according to Equation 5.
푃퐼 =20(1 − 35퐴)
1 + 50퐴
Equation 4: Calculation of PI
A =lg 푝푒푛푒푡푟푎푡푖표푛 푎푡 푇1 − lg 푝푒푛푒푡푟푎푡푖표푛 푎푡 푇2
T1 − T2
Equation 5: Temperature susceptibility of the logarithm with base 10 of penetration
5.5.2. The Bitumen Test Data Chart A system by W.Heuklom (52) was developed to enable penetration, softening point, Fraass breaking point and viscosity data to be described as a function of temperature, known as the Bitumen Test Data Chart (BTDC). The chart consists of a horizontal scale for temperature and two vertical scales for penetration and viscosity. The temperature scale is linear and the penetration scale is logarithmic. The viscosity scale has been devised so that penetration grade bitumens with relatively low penetration index and low wax contents give straight-line relationships (36). A typical BTDC is illustrated in Figure 17.
3 PI actually is a value obtained according to ASTM method and Ip would be precise abbreviation for EN evaluation, but in this thesis PI will be used for simplicity
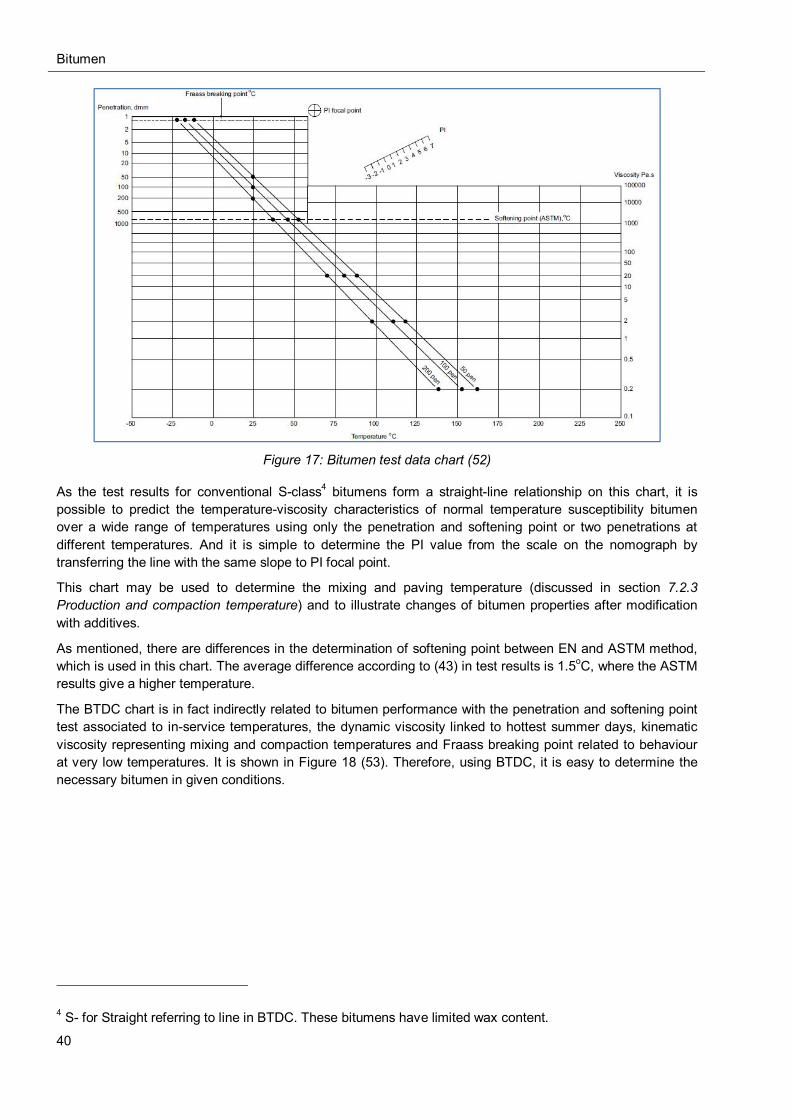
Bitumen
40
Figure 17: Bitumen test data chart (52)
As the test results for conventional S-class4 bitumens form a straight-line relationship on this chart, it is possible to predict the temperature-viscosity characteristics of normal temperature susceptibility bitumen over a wide range of temperatures using only the penetration and softening point or two penetrations at different temperatures. And it is simple to determine the PI value from the scale on the nomograph by transferring the line with the same slope to PI focal point.
This chart may be used to determine the mixing and paving temperature (discussed in section 7.2.3 Production and compaction temperature) and to illustrate changes of bitumen properties after modification with additives.
As mentioned, there are differences in the determination of softening point between EN and ASTM method, which is used in this chart. The average difference according to (43) in test results is 1.5oC, where the ASTM results give a higher temperature.
The BTDC chart is in fact indirectly related to bitumen performance with the penetration and softening point test associated to in-service temperatures, the dynamic viscosity linked to hottest summer days, kinematic viscosity representing mixing and compaction temperatures and Fraass breaking point related to behaviour at very low temperatures. It is shown in Figure 18 (53). Therefore, using BTDC, it is easy to determine the necessary bitumen in given conditions.
4 S- for Straight referring to line in BTDC. These bitumens have limited wax content.
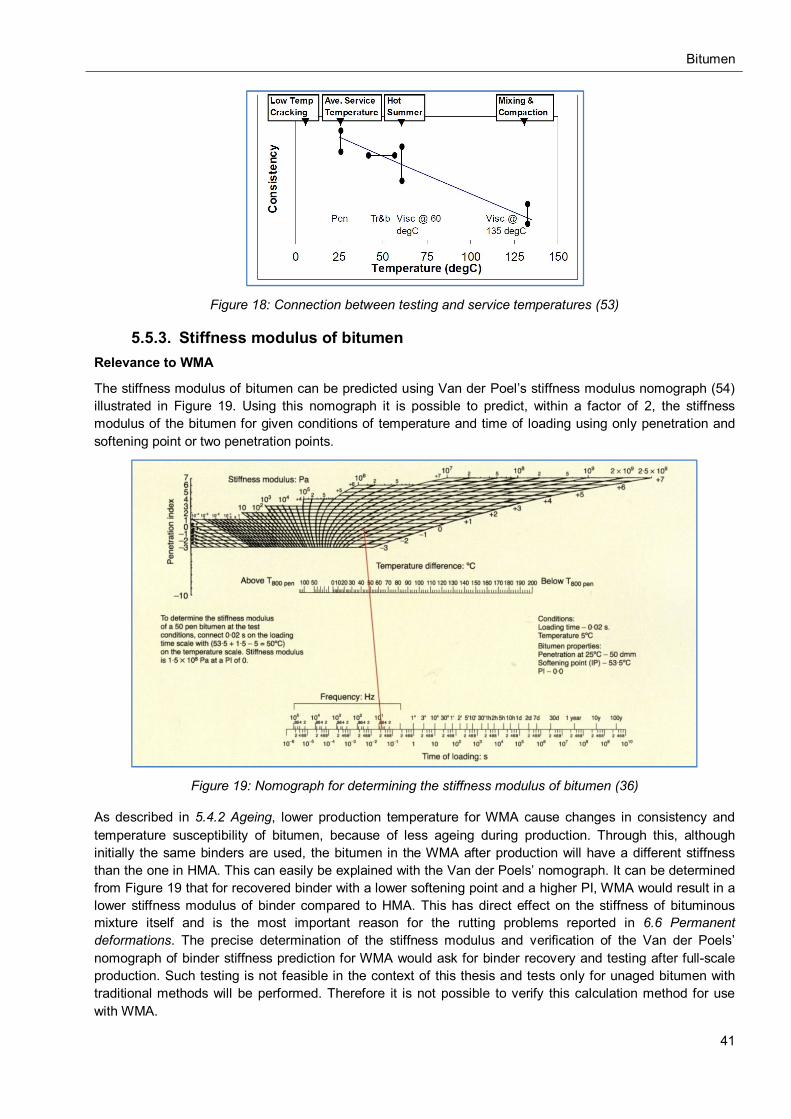
Bitumen
41
Figure 18: Connection between testing and service temperatures (53)
5.5.3. Stiffness modulus of bitumen Relevance to WMA
The stiffness modulus of bitumen can be predicted using Van der Poel’s stiffness modulus nomograph (54) illustrated in Figure 19. Using this nomograph it is possible to predict, within a factor of 2, the stiffness modulus of the bitumen for given conditions of temperature and time of loading using only penetration and softening point or two penetration points.
Figure 19: Nomograph for determining the stiffness modulus of bitumen (36)
As described in 5.4.2 Ageing, lower production temperature for WMA cause changes in consistency and temperature susceptibility of bitumen, because of less ageing during production. Through this, although initially the same binders are used, the bitumen in the WMA after production will have a different stiffness than the one in HMA. This can easily be explained with the Van der Poels’ nomograph. It can be determined from Figure 19 that for recovered binder with a lower softening point and a higher PI, WMA would result in a lower stiffness modulus of binder compared to HMA. This has direct effect on the stiffness of bituminous mixture itself and is the most important reason for the rutting problems reported in 6.6 Permanent deformations. The precise determination of the stiffness modulus and verification of the Van der Poels’ nomograph of binder stiffness prediction for WMA would ask for binder recovery and testing after full-scale production. Such testing is not feasible in the context of this thesis and tests only for unaged bitumen with traditional methods will be performed. Therefore it is not possible to verify this calculation method for use with WMA.
Properties of WMA
42
6. PROPERTIES OF WMA Findings from the literature study about the most important properties of WMA and the differences from conventional Hot Mix Asphalt (HMA) will be discussed in this chapter. The indications of possible problem areas of Warm Mix Asphalt (WMA) performance from laboratory and field researches will be discussed as well. Observation of the main test methods for evaluation of these problems and other important WMA properties will be briefly discussed. Where necessary, adjustments to traditional test methods and/or result expression to give better characterisation of WMA will be proposed.
6.1. Mixture evaluation methods
6.1.1. Field trials Ideally, to establish the mechanical properties of asphalt, in-situ testing would be required. However, full-scale trial sections are impractical in most cases because of high expenses. Therefore, field testing is usually performed only during the final part of the evaluation of the mix and engineers have to rely on laboratory testing to determine mixture properties and establish optimal mix design.
Field testing is extensively used in US while in Europe mostly reports from laboratory testing were found. In Germany, however, there is an evaluation system to assess and approve new products. This process combines laboratory performance tests and field trials that are monitored for five years. The trials must meet the following conditions- high traffic, right hand (slow) line and section lengths of more than 500 m. During the five year evaluation period, the sections are monitored for transverse profile, layer thickness, and surface condition. The sections are constructed in conjunction with a control section. Several such projects for evaluation of WMA are undertaken now, but the results are not available yet.
6.1.2. Empirical The traditional empirical requirements for bituminous mixtures are based on long term knowledge about the combination of requirements for composition and component materials together with performance-related (e.g. Marshall properties) requirements for bituminous mixtures and asphalt layer. Because WMA is a relatively new technology, the knowledge of empirical properties for this type of asphalt is significantly smaller than for HMA. Therefore, the evaluation of mixture cannot be based only on the empirical requirements. Application of specifications for HMA can be misleading, because of the differences in WMA production temperature and/or technology that may include modification of bitumen and aggregate adhesion properties and changes in the binder consistency in short and long term. This may indicate the need of modification of methodology for performing tests and differences in characterisation and specification requirements of WMA. However until now, most of the research is conducted with the same mix compositions and evaluated for the same criteria for both WMA and HMA.
6.1.3. Fundamental The fundamental test methods predict the performance of asphalt (e.g. stiffness, fatigue properties) and appears in primary performance prediction relationships, therefore only minor adjustments towards sample preparation temperatures and curing time may be necessary for WMA testing.
6.1.4. Simulative The simulative test methods are designed to simulate some specific in-situ conditions, like wheel tracking test or gyratory compaction to simulate the densification process of pavement. Because stress conditions in a pavement are extremely complex and cannot be repeated in laboratory testing with any precision (36), these tests are used to compare the performance of different mixtures one with another. This comparison between WMA and conventional HMA could be very useful in establishing the mechanical performance of WMA.
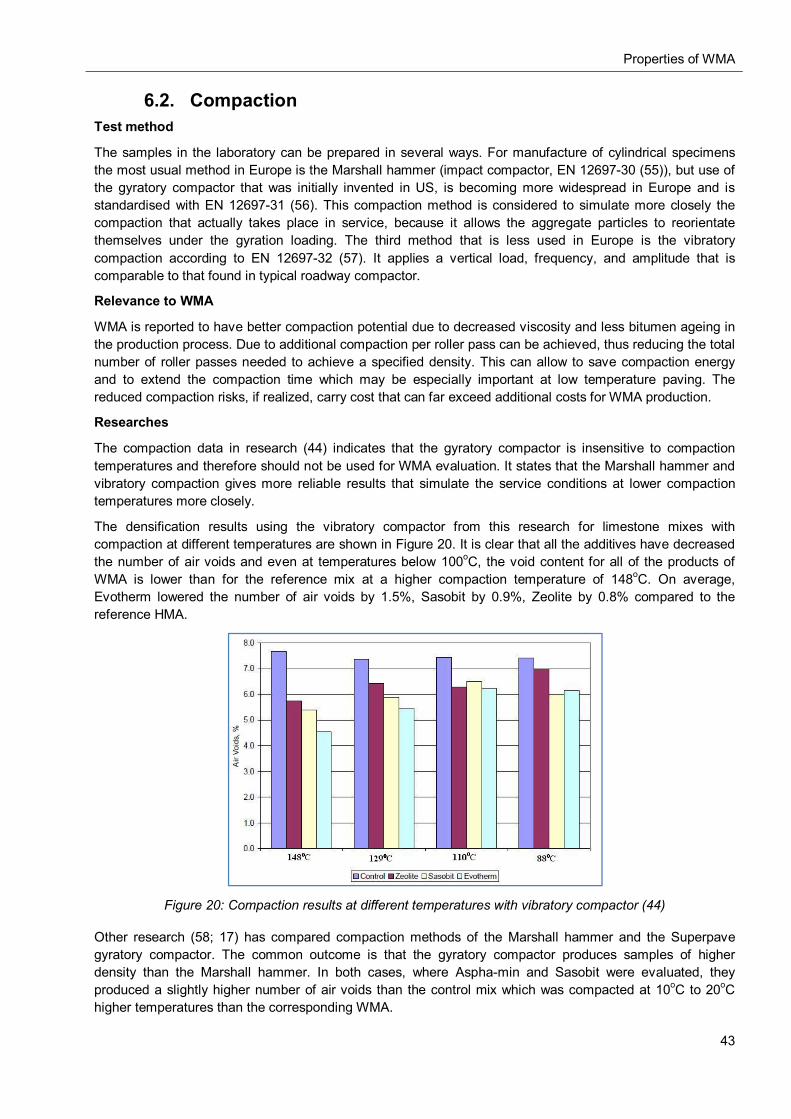
Properties of WMA
43
6.2. Compaction Test method
The samples in the laboratory can be prepared in several ways. For manufacture of cylindrical specimens the most usual method in Europe is the Marshall hammer (impact compactor, EN 12697-30 (55)), but use of the gyratory compactor that was initially invented in US, is becoming more widespread in Europe and is standardised with EN 12697-31 (56). This compaction method is considered to simulate more closely the compaction that actually takes place in service, because it allows the aggregate particles to reorientate themselves under the gyration loading. The third method that is less used in Europe is the vibratory compaction according to EN 12697-32 (57). It applies a vertical load, frequency, and amplitude that is comparable to that found in typical roadway compactor.
Relevance to WMA
WMA is reported to have better compaction potential due to decreased viscosity and less bitumen ageing in the production process. Due to additional compaction per roller pass can be achieved, thus reducing the total number of roller passes needed to achieve a specified density. This can allow to save compaction energy and to extend the compaction time which may be especially important at low temperature paving. The reduced compaction risks, if realized, carry cost that can far exceed additional costs for WMA production.
Researches
The compaction data in research (44) indicates that the gyratory compactor is insensitive to compaction temperatures and therefore should not be used for WMA evaluation. It states that the Marshall hammer and vibratory compaction gives more reliable results that simulate the service conditions at lower compaction temperatures more closely.
The densification results using the vibratory compactor from this research for limestone mixes with compaction at different temperatures are shown in Figure 20. It is clear that all the additives have decreased the number of air voids and even at temperatures below 100oC, the void content for all of the products of WMA is lower than for the reference mix at a higher compaction temperature of 148oC. On average, Evotherm lowered the number of air voids by 1.5%, Sasobit by 0.9%, Zeolite by 0.8% compared to the reference HMA.
Figure 20: Compaction results at different temperatures with vibratory compactor (44)
Other research (58; 17) has compared compaction methods of the Marshall hammer and the Superpave gyratory compactor. The common outcome is that the gyratory compactor produces samples of higher density than the Marshall hammer. In both cases, where Aspha-min and Sasobit were evaluated, they produced a slightly higher number of air voids than the control mix which was compacted at 10oC to 20oC higher temperatures than the corresponding WMA.

Properties of WMA
44
Field tests
Compaction in field trials for a mixture containing 3% Sasobit that was performed in Germany (6) is shown in Figure 21. It confirms the assumption that above the melting point of wax, the compaction requires less effort and can be done at a lower temperature compared to HMA. After only one roller pass, a compaction degree of approximately 96% was obtained and with two roller passes almost the highest possible density was reached - after that compaction increases only slightly. The phenomenon of gritting after three roller passes is attributed to the reorientation of the mineral skeleton in the pavement and to measurement procedure errors with Troxler. Similarly, better compaction results are reported in the NCAT test track (59) where Evotherm modified WMA had reduced air voids by almost 40% at a compaction temperature which was almost 38oC lower. However, it has to be mentioned that slightly different aggregate gradation and higher binder content (of about 1%) may partially be reason for that.
Figure 21: Compaction data from field trial for mix with 3% Sasobit (6)
The benefit of better workability and compaction has also been used for stiff HMA to overcome problems of reaching the desired compaction degree. (58) reports that in Massachusetts Sasobit was used as a compaction aid. The target density of 96% could not be achieved with contractors’ equipment. However with an addition of 1.56% of Sasobit not only the temperature was lowered by 10oC, but also the target density was reached by using less compaction effort compared to HMA. Laboratory testing did not show a significant difference between mechanical properties of conventional HMA and WMA in this experiment.
The only research from the observed literature that found an increased number of air voids for WMA compared to HMA was performed by California Department of Transportation (29), where WMA products Sasobit, Evotherm and Advera were tested in trial sections. The air void content was determined for field cores and the mean difference in WMA amounted to 1.3% for Sasobit, 1.6% for Advera and 2% for Evotherm higher than the reference HMA section with 6.8% of air voids.
In Virginia (60), field trials with Sasobit (in two sections) and Evotherm (one section) included assessment of compaction during a period of two years. The air void content was determined at the time of the placement of asphalt and after a 3 months, 6 months, 1 year and 2 year period after construction to determine whether further compaction is a problem for WMA. The results show that although the air void content varied through time for all of the trial sections, no correlation between time and void content could be established. And no significant differences between any of WMA sections and control sections of HMA were observed. The results were also plotted versus the core location to determine if the results were correlating with the wheelpath or none-wheelpath locations. The analysis indicated no such correlation for any of the tested sections. These results suggest that after initial placement there are no significant differences in further compaction between HMA and WMA mixtures.
Adjustment of test method
Determination of the right compaction method is relevant in all further evaluation of WMA. The density and volumetric properties depend strongly on the compaction method and must be considered when applying the requirements of standards for the mix. It is also reported that different compaction methods have various sensitivity to change in compaction temperature.
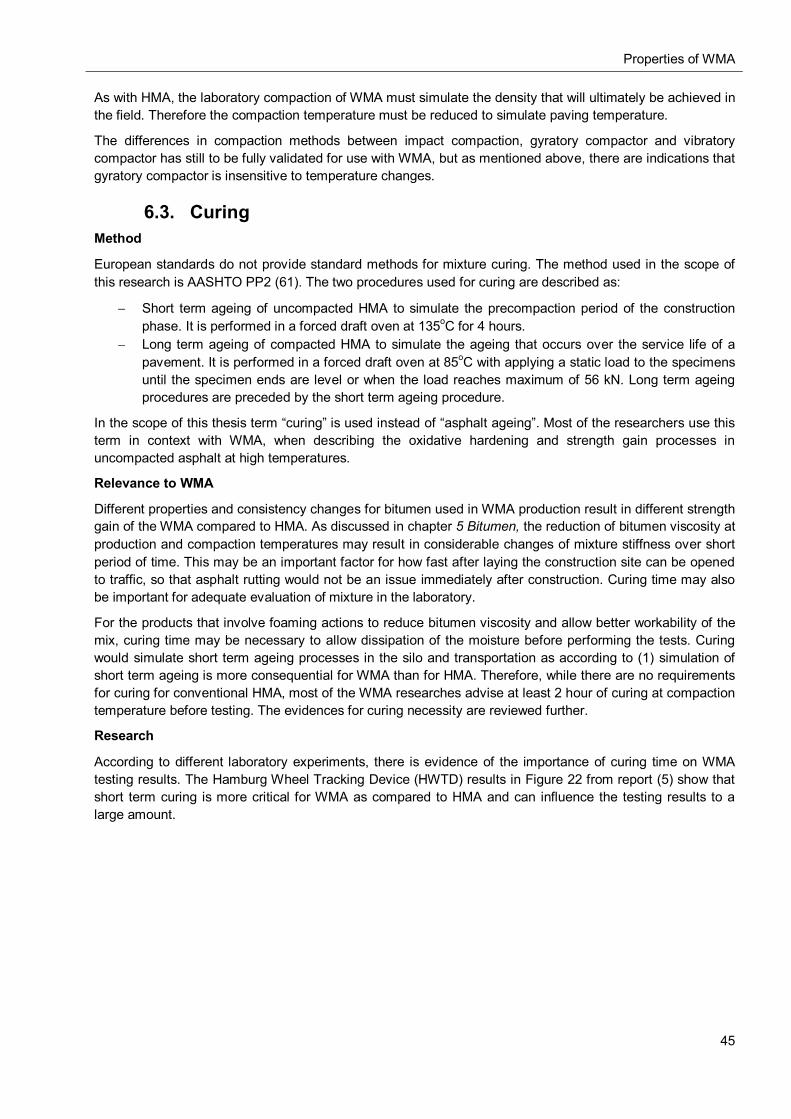
Properties of WMA
45
As with HMA, the laboratory compaction of WMA must simulate the density that will ultimately be achieved in the field. Therefore the compaction temperature must be reduced to simulate paving temperature.
The differences in compaction methods between impact compaction, gyratory compactor and vibratory compactor has still to be fully validated for use with WMA, but as mentioned above, there are indications that gyratory compactor is insensitive to temperature changes.
6.3. Curing Method
European standards do not provide standard methods for mixture curing. The method used in the scope of this research is AASHTO PP2 (61). The two procedures used for curing are described as:
Short term ageing of uncompacted HMA to simulate the precompaction period of the construction phase. It is performed in a forced draft oven at 135oC for 4 hours.
Long term ageing of compacted HMA to simulate the ageing that occurs over the service life of a pavement. It is performed in a forced draft oven at 85oC with applying a static load to the specimens until the specimen ends are level or when the load reaches maximum of 56 kN. Long term ageing procedures are preceded by the short term ageing procedure.
In the scope of this thesis term “curing” is used instead of “asphalt ageing”. Most of the researchers use this term in context with WMA, when describing the oxidative hardening and strength gain processes in uncompacted asphalt at high temperatures.
Relevance to WMA
Different properties and consistency changes for bitumen used in WMA production result in different strength gain of the WMA compared to HMA. As discussed in chapter 5 Bitumen, the reduction of bitumen viscosity at production and compaction temperatures may result in considerable changes of mixture stiffness over short period of time. This may be an important factor for how fast after laying the construction site can be opened to traffic, so that asphalt rutting would not be an issue immediately after construction. Curing time may also be important for adequate evaluation of mixture in the laboratory.
For the products that involve foaming actions to reduce bitumen viscosity and allow better workability of the mix, curing time may be necessary to allow dissipation of the moisture before performing the tests. Curing would simulate short term ageing processes in the silo and transportation as according to (1) simulation of short term ageing is more consequential for WMA than for HMA. Therefore, while there are no requirements for curing for conventional HMA, most of the WMA researches advise at least 2 hour of curing at compaction temperature before testing. The evidences for curing necessity are reviewed further.
Research
According to different laboratory experiments, there is evidence of the importance of curing time on WMA testing results. The Hamburg Wheel Tracking Device (HWTD) results in Figure 22 from report (5) show that short term curing is more critical for WMA as compared to HMA and can influence the testing results to a large amount.
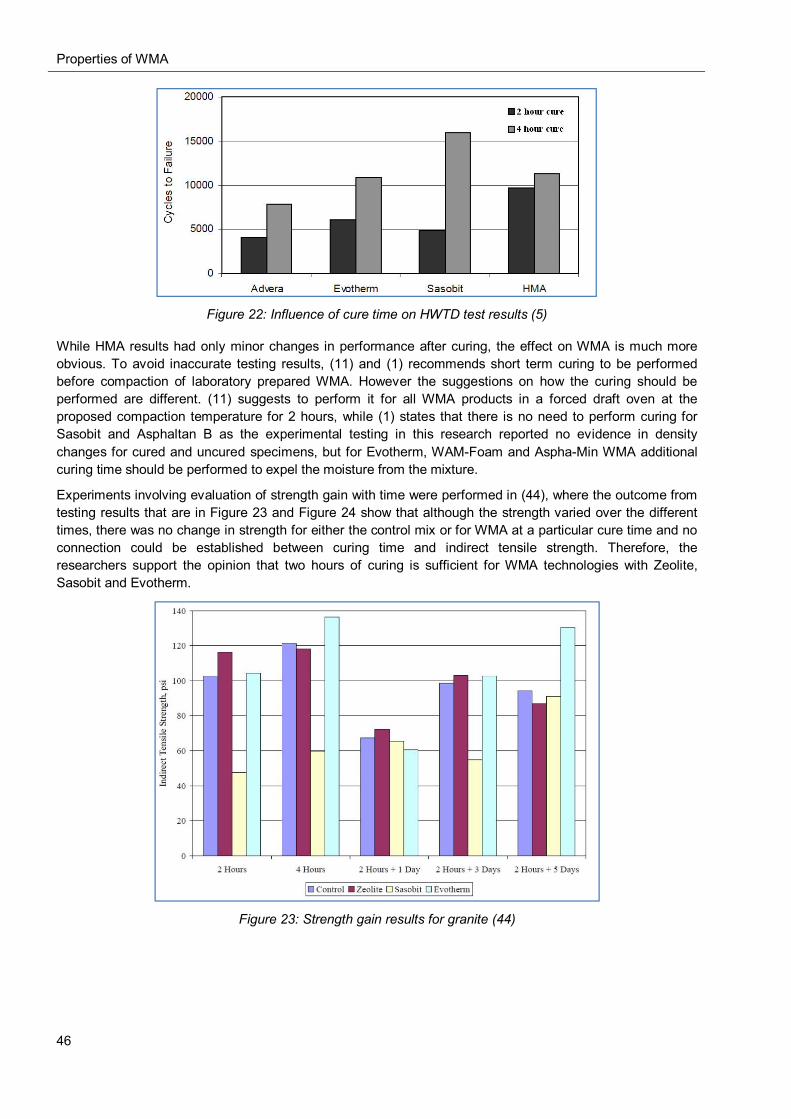
Properties of WMA
46
Figure 22: Influence of cure time on HWTD test results (5)
While HMA results had only minor changes in performance after curing, the effect on WMA is much more obvious. To avoid inaccurate testing results, (11) and (1) recommends short term curing to be performed before compaction of laboratory prepared WMA. However the suggestions on how the curing should be performed are different. (11) suggests to perform it for all WMA products in a forced draft oven at the proposed compaction temperature for 2 hours, while (1) states that there is no need to perform curing for Sasobit and Asphaltan B as the experimental testing in this research reported no evidence in density changes for cured and uncured specimens, but for Evotherm, WAM-Foam and Aspha-Min WMA additional curing time should be performed to expel the moisture from the mixture.
Experiments involving evaluation of strength gain with time were performed in (44), where the outcome from testing results that are in Figure 23 and Figure 24 show that although the strength varied over the different times, there was no change in strength for either the control mix or for WMA at a particular cure time and no connection could be established between curing time and indirect tensile strength. Therefore, the researchers support the opinion that two hours of curing is sufficient for WMA technologies with Zeolite, Sasobit and Evotherm.
Figure 23: Strength gain results for granite (44)
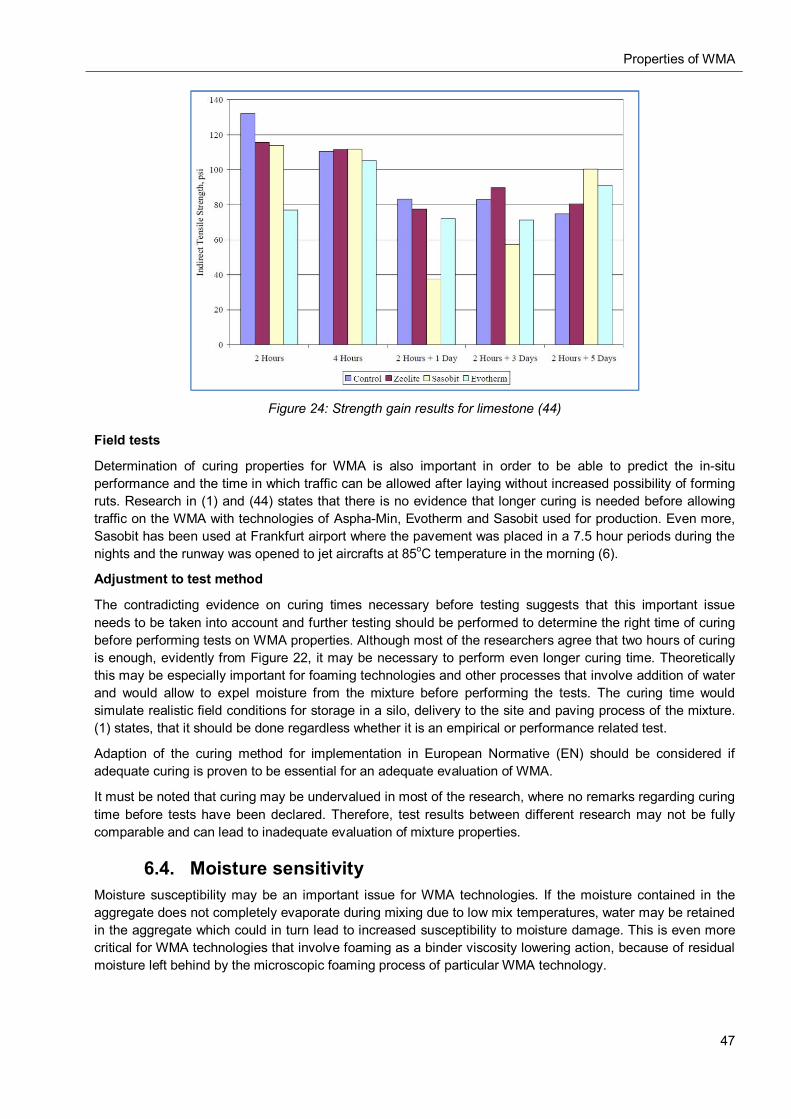
Properties of WMA
47
Figure 24: Strength gain results for limestone (44)
Field tests
Determination of curing properties for WMA is also important in order to be able to predict the in-situ performance and the time in which traffic can be allowed after laying without increased possibility of forming ruts. Research in (1) and (44) states that there is no evidence that longer curing is needed before allowing traffic on the WMA with technologies of Aspha-Min, Evotherm and Sasobit used for production. Even more, Sasobit has been used at Frankfurt airport where the pavement was placed in a 7.5 hour periods during the nights and the runway was opened to jet aircrafts at 85oC temperature in the morning (6).
Adjustment to test method
The contradicting evidence on curing times necessary before testing suggests that this important issue needs to be taken into account and further testing should be performed to determine the right time of curing before performing tests on WMA properties. Although most of the researchers agree that two hours of curing is enough, evidently from Figure 22, it may be necessary to perform even longer curing time. Theoretically this may be especially important for foaming technologies and other processes that involve addition of water and would allow to expel moisture from the mixture before performing the tests. The curing time would simulate realistic field conditions for storage in a silo, delivery to the site and paving process of the mixture. (1) states, that it should be done regardless whether it is an empirical or performance related test.
Adaption of the curing method for implementation in European Normative (EN) should be considered if adequate curing is proven to be essential for an adequate evaluation of WMA.
It must be noted that curing may be undervalued in most of the research, where no remarks regarding curing time before tests have been declared. Therefore, test results between different research may not be fully comparable and can lead to inadequate evaluation of mixture properties.
6.4. Moisture sensitivity Moisture susceptibility may be an important issue for WMA technologies. If the moisture contained in the aggregate does not completely evaporate during mixing due to low mix temperatures, water may be retained in the aggregate which could in turn lead to increased susceptibility to moisture damage. This is even more critical for WMA technologies that involve foaming as a binder viscosity lowering action, because of residual moisture left behind by the microscopic foaming process of particular WMA technology.
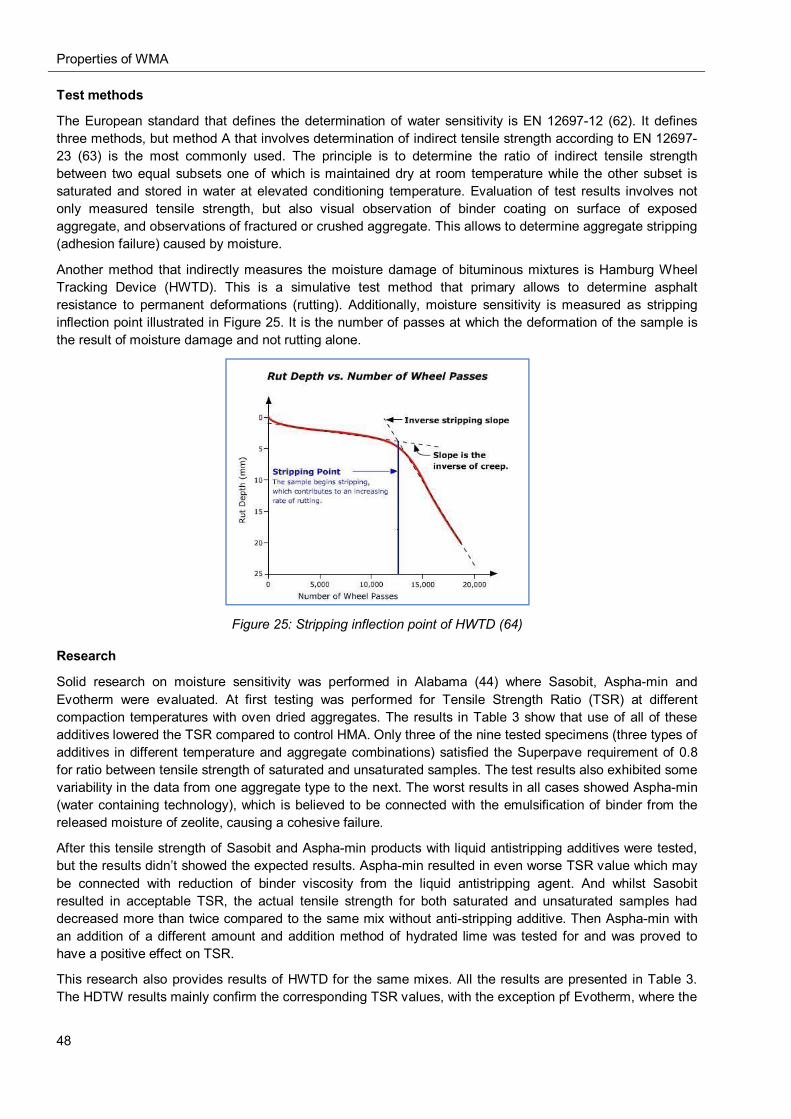
Properties of WMA
48
Test methods
The European standard that defines the determination of water sensitivity is EN 12697-12 (62). It defines three methods, but method A that involves determination of indirect tensile strength according to EN 12697-23 (63) is the most commonly used. The principle is to determine the ratio of indirect tensile strength between two equal subsets one of which is maintained dry at room temperature while the other subset is saturated and stored in water at elevated conditioning temperature. Evaluation of test results involves not only measured tensile strength, but also visual observation of binder coating on surface of exposed aggregate, and observations of fractured or crushed aggregate. This allows to determine aggregate stripping (adhesion failure) caused by moisture.
Another method that indirectly measures the moisture damage of bituminous mixtures is Hamburg Wheel Tracking Device (HWTD). This is a simulative test method that primary allows to determine asphalt resistance to permanent deformations (rutting). Additionally, moisture sensitivity is measured as stripping inflection point illustrated in Figure 25. It is the number of passes at which the deformation of the sample is the result of moisture damage and not rutting alone.
Figure 25: Stripping inflection point of HWTD (64)
Research
Solid research on moisture sensitivity was performed in Alabama (44) where Sasobit, Aspha-min and Evotherm were evaluated. At first testing was performed for Tensile Strength Ratio (TSR) at different compaction temperatures with oven dried aggregates. The results in Table 3 show that use of all of these additives lowered the TSR compared to control HMA. Only three of the nine tested specimens (three types of additives in different temperature and aggregate combinations) satisfied the Superpave requirement of 0.8 for ratio between tensile strength of saturated and unsaturated samples. The test results also exhibited some variability in the data from one aggregate type to the next. The worst results in all cases showed Aspha-min (water containing technology), which is believed to be connected with the emulsification of binder from the released moisture of zeolite, causing a cohesive failure.
After this tensile strength of Sasobit and Aspha-min products with liquid antistripping additives were tested, but the results didn’t showed the expected results. Aspha-min resulted in even worse TSR value which may be connected with reduction of binder viscosity from the liquid antistripping agent. And whilst Sasobit resulted in acceptable TSR, the actual tensile strength for both saturated and unsaturated samples had decreased more than twice compared to the same mix without anti-stripping additive. Then Aspha-min with an addition of a different amount and addition method of hydrated lime was tested for and was proved to have a positive effect on TSR.
This research also provides results of HWTD for the same mixes. All the results are presented in Table 3. The HDTW results mainly confirm the corresponding TSR values, with the exception pf Evotherm, where the
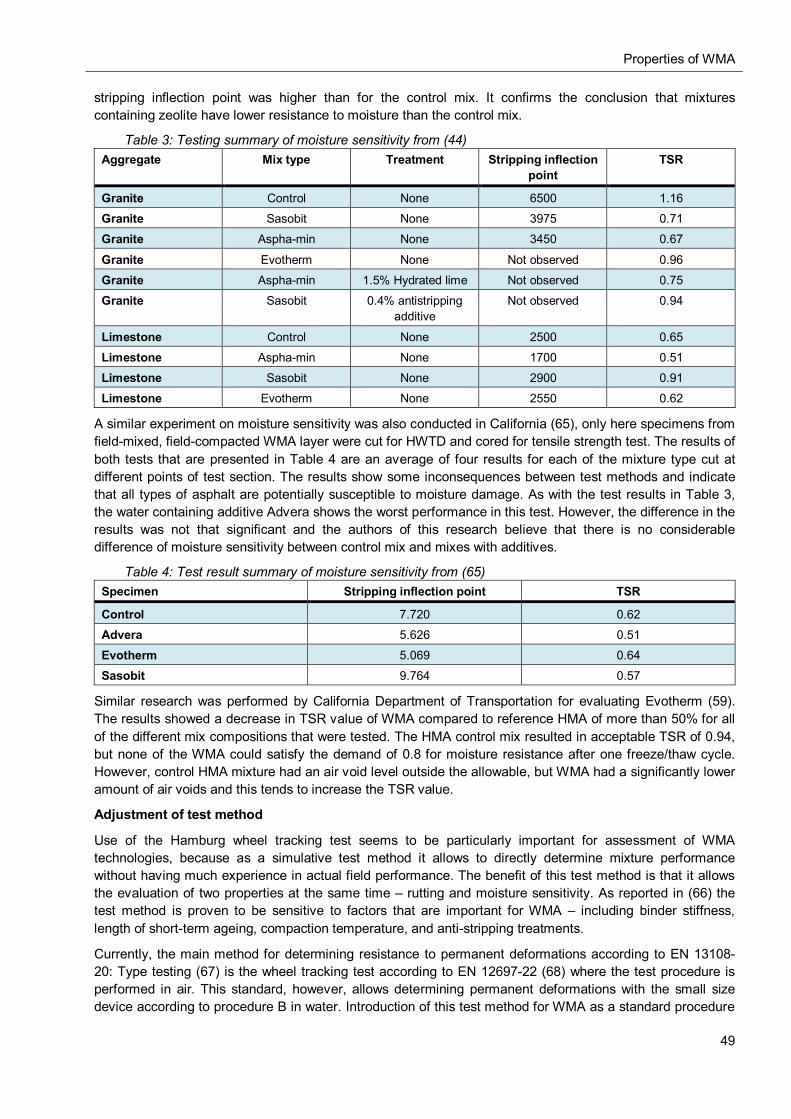
Properties of WMA
49
stripping inflection point was higher than for the control mix. It confirms the conclusion that mixtures containing zeolite have lower resistance to moisture than the control mix.
Table 3: Testing summary of moisture sensitivity from (44) Aggregate Mix type Treatment Stripping inflection
point TSR
Granite Control None 6500 1.16
Granite Sasobit None 3975 0.71
Granite Aspha-min None 3450 0.67
Granite Evotherm None Not observed 0.96
Granite Aspha-min 1.5% Hydrated lime Not observed 0.75
Granite Sasobit 0.4% antistripping additive
Not observed 0.94
Limestone Control None 2500 0.65
Limestone Aspha-min None 1700 0.51
Limestone Sasobit None 2900 0.91
Limestone Evotherm None 2550 0.62
A similar experiment on moisture sensitivity was also conducted in California (65), only here specimens from field-mixed, field-compacted WMA layer were cut for HWTD and cored for tensile strength test. The results of both tests that are presented in Table 4 are an average of four results for each of the mixture type cut at different points of test section. The results show some inconsequences between test methods and indicate that all types of asphalt are potentially susceptible to moisture damage. As with the test results in Table 3, the water containing additive Advera shows the worst performance in this test. However, the difference in the results was not that significant and the authors of this research believe that there is no considerable difference of moisture sensitivity between control mix and mixes with additives.
Table 4: Test result summary of moisture sensitivity from (65) Specimen Stripping inflection point TSR
Control 7.720 0.62
Advera 5.626 0.51
Evotherm 5.069 0.64
Sasobit 9.764 0.57
Similar research was performed by California Department of Transportation for evaluating Evotherm (59). The results showed a decrease in TSR value of WMA compared to reference HMA of more than 50% for all of the different mix compositions that were tested. The HMA control mix resulted in acceptable TSR of 0.94, but none of the WMA could satisfy the demand of 0.8 for moisture resistance after one freeze/thaw cycle. However, control HMA mixture had an air void level outside the allowable, but WMA had a significantly lower amount of air voids and this tends to increase the TSR value.
Adjustment of test method
Use of the Hamburg wheel tracking test seems to be particularly important for assessment of WMA technologies, because as a simulative test method it allows to directly determine mixture performance without having much experience in actual field performance. The benefit of this test method is that it allows the evaluation of two properties at the same time – rutting and moisture sensitivity. As reported in (66) the test method is proven to be sensitive to factors that are important for WMA – including binder stiffness, length of short-term ageing, compaction temperature, and anti-stripping treatments.
Currently, the main method for determining resistance to permanent deformations according to EN 13108-20: Type testing (67) is the wheel tracking test according to EN 12697-22 (68) where the test procedure is performed in air. This standard, however, allows determining permanent deformations with the small size device according to procedure B in water. Introduction of this test method for WMA as a standard procedure
Properties of WMA
50
for evaluation of both moisture susceptibility and rutting would help to implement WMA as pass/fail specifications could be applied to contractors from road authorities.
6.5. Mixture stiffness The stiffness of asphalt depends both on the bitumen properties and mineral skeleton, where the bitumen is responsible for the visco-elastic properties whilst the mineral skeleton influences elastic and plastic properties. The proportion of each depends on the time of loading and the temperature at which the load was applied.
Test methods
The stiffness of the mixture can be measured by a variety of methods, for example bending and vibration tests on a beam specimen or direct uniaxial and triaxial tests on cylindrical specimens or as it is conducted in this experiment - indirect tensile tests on cylindrical specimens (36). The European standard that defines assessment and expression of stiffness is EN 12697-26 (69).
Relevance to WMA
Mixture components and compositions can be extremely diverse, which makes prediction of the properties of a particular mixture difficult. Nevertheless is clear that one of the key factors that influence the final stiffness of a mixture is the stiffness of bitumen. This is a significant issue regarding differences between HMA and WMA, because, as discussed in the chapter 5 Bitumen, the stiffness of bitumen in WMA is affected by the differences in temperature of production, mixing process and, possibly, by changes in mixture design.
The prediction of the stiffness modulus could be a useful tool for designing the WMA in respect to choosing bitumen stiffness, predicting pavement stiffness and possible problems with permanent deformations, and suggesting possible adjustments in the pavement thickness of WMA. There are several prediction methods for asphalt stiffness and they could be used to determine the differences between HMA and WMA, and help to design the mixture and/or choosing the right bitumen. The Shell prediction model (70) which in the form of a nomograph is illustrated in Figure 26 requires three parameters:
the stiffness modulus of the bitumen the percentage volume of bitumen the percentage volume of mineral aggregate
For adequate calculation of the mixture stiffness modulus it would require data of retained bitumen stiffness after WMA production, as discussed in 5.5.3 Stiffness modulus of bitumen. Then by changing the parameters that influence mix stiffness and comparing the stiffness of WMA with conventional HMA it can give a hint on the direction in which the mixture composition or components (mainly bitumen) should be changed in order to achieve the necessary stiffness of reference HMA.

Properties of WMA
51
Figure 26: Nomograph for predicting stiffness modulus of asphalts (36)
In another prediction model (71), improvements were made to earlier models, by taking into account hardening effects from short- and long-term ageing, as well as extreme temperature conditions. The outcome was calculation formula in Equation 6. This equation has to be verified for use with WMA, since it was a result of processing large amounts of data from different HMA and the decreased ageing in the WMA process might not be fully validated in the equation. But if proved to be valid for WMA mixtures, it could be a useful tool in predicting the mixture stiffness of WMA from mixture composition data.
Equation 6: Calculation of asphalt mix complex modulus
Where the parameters5 required are:
E* -asphalt mix complex modulus, in 105 psi η -bitumen viscosity, in 106 poise f -load frequency, in Hz
5 The sieve numbers in this equation are in accordance with US system
Properties of WMA
52
va -percent air voids in the mix, by volume, vbeff -percent air voids in the mix, by volume, P34 -percent retained on 19.0mm (3/4 inch) sieve, by total aggregate weight, P38 -percent retained on 9.51mm (3/8 inch) sieve, by total aggregate weight, P4 -percent retained on 4.76mm (No.4) sieve, by total aggregate weight P200 -percent retained on 0.029mm (No.200) sieve, by total aggregate weight
Research
The resilient modulus of Evotherm WMA was compared with reference HMA in (72). The testing was performed at four different temperatures from 0oC to 22oC. The performance of both mixtures was almost equal. The statistical variation between the samples was also the same, meaning that the structure of WMA was as homogeneous as for HMA.
An experiment (44) with testing resilient modulus for WMA products – Sasobit, Aspha-min and Evotherm - at a wide range of temperatures and with two different aggregate types was performed. It was concluded from the researchers that the use of these additives does not significantly change the value of resilient modulus and the designed pavement thickness would not be affected from the use of these WMA technologies.
6.6. Permanent deformations The permanent deformations of asphalt form in the low stiffness response of the material, when the stiffness of the bitumen is less than 0.5 MPa (36). This behaviour of viscous stiffness occurs in asphalt at high temperatures or long loading times and is much more complex than it is in the elastic zone of mixture. The stiffness in this phase is a function of:
bitumen stiffness, voids in mineral aggregate, aggregate type, shape, grading, texture, interlock ect., compaction (void content, method of compaction, ect.), confining conditions.
Test methods
The resistance of mixtures to permanent deformation according to EN13108-20: Type testing (67) should be determined with such methods:
Wheel tracking (EN12697-22 (68)) for Asphalt Concrete (AC), Stone Mastic Asphalt (SMA) and Hot Rolled Asphalt (HRA),
Marshall test (EN 12697-34 (73)) for AC for use in airports, Cyclic compression test (EN-12697-25 (74)) for AC (triaxial method) and Mastic Asphalt (MA)
(uniaxial method).
Rut tests using the Hamburg wheel tracking device (HWTD) in water measures rutting and moisture susceptibility of an asphalt paving mixture by rolling a steel wheel (in EN method it is a rubber wheel) across the surface of an asphalt concrete slab that is immersed in hot water (generally held at 50°C.) Susceptibilities to rutting and moisture can be determined with this test. Much of the WMA research from US involve assessment of mixture using this test method.
The Asphalt Pavement Analyzer (APA) is another test method that allows predicting permanent deformations and moisture susceptibility using repeated wheel passes. Different shapes of specimens can be tested with this method, including cylindrical specimens prepared with gyratory of vibratory compactor. The method is mostly used in US
Relevance to WMA
There is a general concern for WMA rutting performance that is connected with the decreased mixing temperature which may lead to incomplete drying of aggregates and insufficient coating with bitumen. Another aspect that may influence decreased resistance to permanent deformations is the decreased
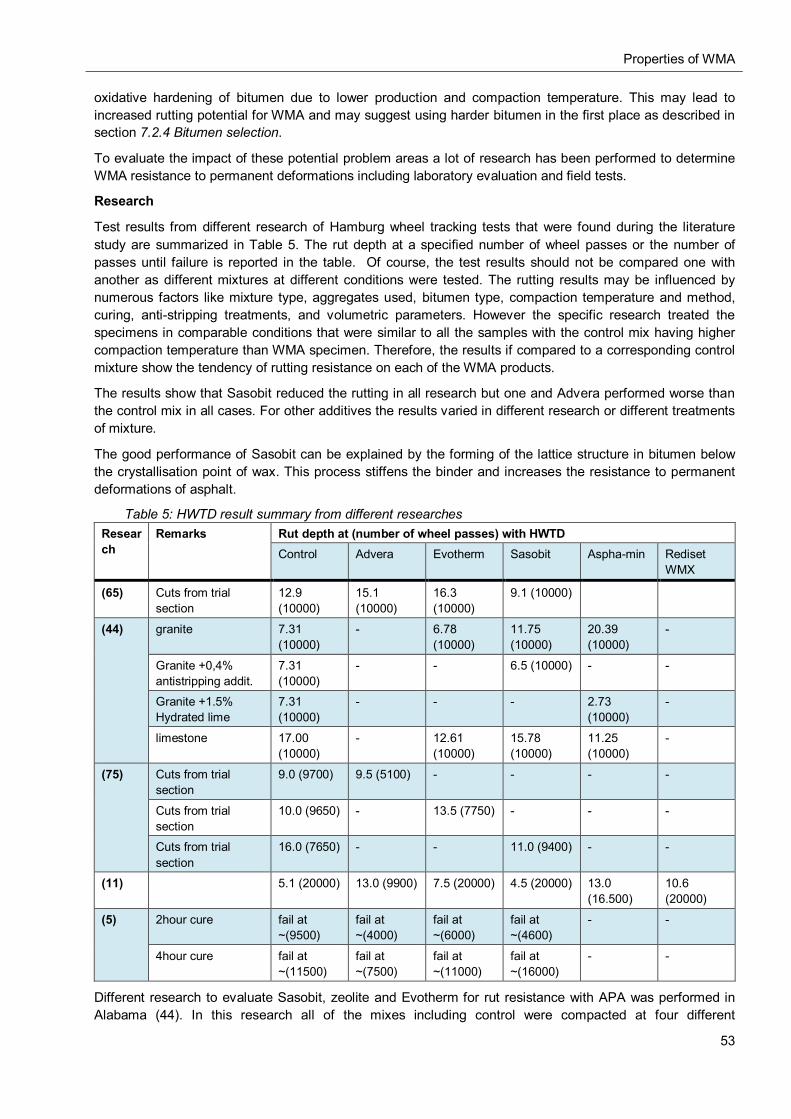
Properties of WMA
53
oxidative hardening of bitumen due to lower production and compaction temperature. This may lead to increased rutting potential for WMA and may suggest using harder bitumen in the first place as described in section 7.2.4 Bitumen selection.
To evaluate the impact of these potential problem areas a lot of research has been performed to determine WMA resistance to permanent deformations including laboratory evaluation and field tests.
Research
Test results from different research of Hamburg wheel tracking tests that were found during the literature study are summarized in Table 5. The rut depth at a specified number of wheel passes or the number of passes until failure is reported in the table. Of course, the test results should not be compared one with another as different mixtures at different conditions were tested. The rutting results may be influenced by numerous factors like mixture type, aggregates used, bitumen type, compaction temperature and method, curing, anti-stripping treatments, and volumetric parameters. However the specific research treated the specimens in comparable conditions that were similar to all the samples with the control mix having higher compaction temperature than WMA specimen. Therefore, the results if compared to a corresponding control mixture show the tendency of rutting resistance on each of the WMA products.
The results show that Sasobit reduced the rutting in all research but one and Advera performed worse than the control mix in all cases. For other additives the results varied in different research or different treatments of mixture.
The good performance of Sasobit can be explained by the forming of the lattice structure in bitumen below the crystallisation point of wax. This process stiffens the binder and increases the resistance to permanent deformations of asphalt.
Table 5: HWTD result summary from different researches Research
Remarks Rut depth at (number of wheel passes) with HWTD Control Advera Evotherm Sasobit Aspha-min Rediset
WMX
(65) Cuts from trial section
12.9 (10000)
15.1 (10000)
16.3 (10000)
9.1 (10000)
(44) granite 7.31 (10000)
- 6.78 (10000)
11.75 (10000)
20.39 (10000)
-
Granite +0,4% antistripping addit.
7.31 (10000)
- - 6.5 (10000) - -
Granite +1.5% Hydrated lime
7.31 (10000)
- - - 2.73 (10000)
-
limestone 17.00 (10000)
- 12.61 (10000)
15.78 (10000)
11.25 (10000)
-
(75) Cuts from trial section
9.0 (9700) 9.5 (5100) - - - -
Cuts from trial section
10.0 (9650) - 13.5 (7750) - - -
Cuts from trial section
16.0 (7650) - - 11.0 (9400) - -
(11) 5.1 (20000) 13.0 (9900) 7.5 (20000) 4.5 (20000) 13.0 (16.500)
10.6 (20000)
(5) 2hour cure fail at ~(9500)
fail at ~(4000)
fail at ~(6000)
fail at ~(4600)
- -
4hour cure fail at ~(11500)
fail at ~(7500)
fail at ~(11000)
fail at ~(16000)
- -
Different research to evaluate Sasobit, zeolite and Evotherm for rut resistance with APA was performed in Alabama (44). In this research all of the mixes including control were compacted at four different
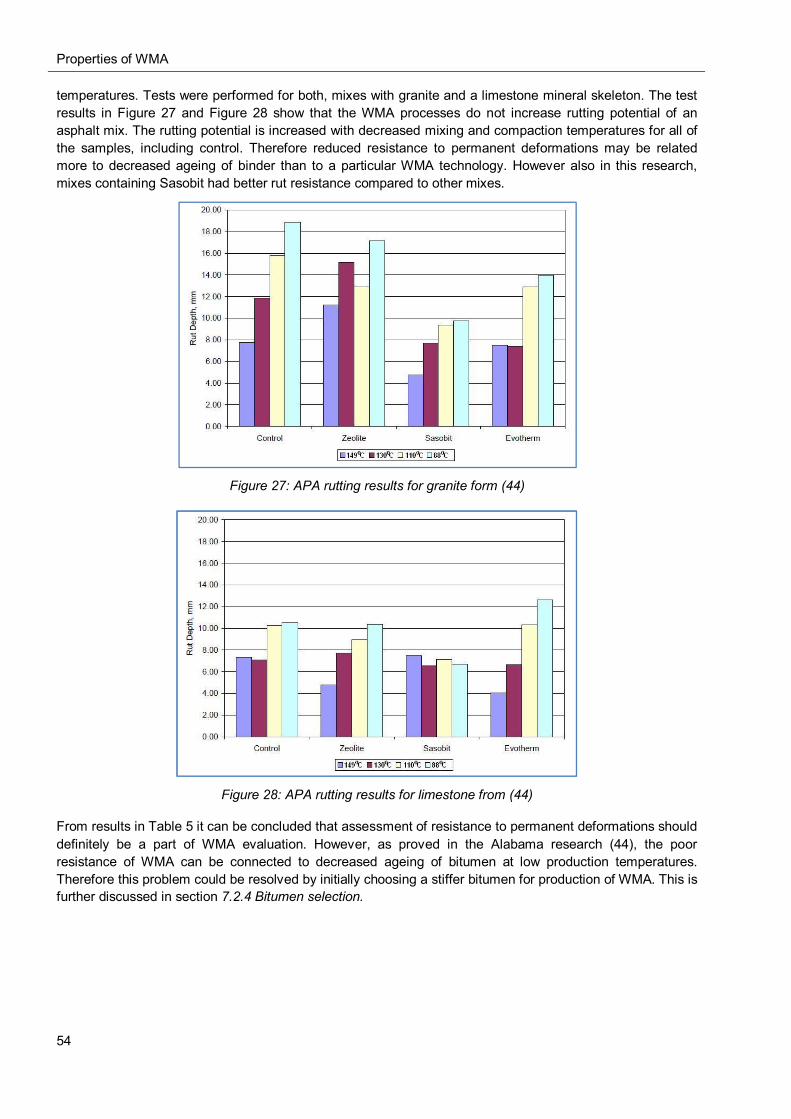
Properties of WMA
54
temperatures. Tests were performed for both, mixes with granite and a limestone mineral skeleton. The test results in Figure 27 and Figure 28 show that the WMA processes do not increase rutting potential of an asphalt mix. The rutting potential is increased with decreased mixing and compaction temperatures for all of the samples, including control. Therefore reduced resistance to permanent deformations may be related more to decreased ageing of binder than to a particular WMA technology. However also in this research, mixes containing Sasobit had better rut resistance compared to other mixes.
Figure 27: APA rutting results for granite form (44)
Figure 28: APA rutting results for limestone from (44)
From results in Table 5 it can be concluded that assessment of resistance to permanent deformations should definitely be a part of WMA evaluation. However, as proved in the Alabama research (44), the poor resistance of WMA can be connected to decreased ageing of bitumen at low production temperatures. Therefore this problem could be resolved by initially choosing a stiffer bitumen for production of WMA. This is further discussed in section 7.2.4 Bitumen selection.
Properties of WMA
55
Field tests
Evaluation of Evotherm at the NCAT test track (59) included measurements after 513,333 ESALs6 in a 43 day period (Equivalent Single Axle Loadings) to assess rutting performance. Three readings were taken in each wheel path and two different compositions of Evotherm both resulted in the same or slightly better performance than reference HMA that had an average of 1.1 mm rut depth.
Roadway projects with WAM Foam wearing course has been completed in Norway, year 2000. It is reported by (76) that the rut depth measurements for WMA and control HMA were similar in both cases through the following observation period from October 2000 to June 2003. It was also noted that although a large increase was observed after the first winter, it is due to use of studded tires and the results were similar to both - WMA and HMA.
6.7. Low temperature behaviour Low temperature behaviour of bitumen can be relevant to Nordic countries with low winter temperatures. There are some considerations that should be taken into account when choosing the bitumen for WMA technology. The evidence that is described below indicates that if relevant to given climatic conditions, the low temperature behaviour of bitumen should be closely examined before choosing a suitable binder and production technology for WMA.
It is reported in (4) that the use of FT-wax (it could apply to all other WMA waxes) for tests with the Bending Beam Rheometer (BBR) increases the bitumen stiffness and reduces relaxing abilities at low temperature regimes (-24oC to -6oC). Accordingly, wax modification leads to a worsening of the low temperature behaviour and it was determined that the threshold of SUPERPAVE (described in section 7.1.1 Superpave) concept PG bitumen leads to worsening of low temperature grade of 2-3oC and the bitumens ability to creep is worsened by 6-9oC.
A similar problem is reported in (44; 1). Changes in PG low temperature performance after production of WMA were compared to binder used in HMA. While the less short-term aged WMA modified binder performance corresponds to PG 58-28 (where -28 is indicating the low temperature range in oC), the resulting low-temperature properties miss the -28oC grade by about 2 degrees. The explanation of this problem could be the same as stated above as Sasobit was also used for the experiment.
6 Equivalent Single Axle Loading
Mix design methods for WMA
56
7. MIX DESIGN METHODS FOR WMA Warm Mix Asphalt (WMA) has been used in all types of asphalt materials, including dense graded, stone mastic, porous, and mastic asphalt. It has been used with different aggregates and all grades of binder as well as polymer modified bitumens and Reclaimed Asphalt Pavement (RAP), and a variety of layer thicknesses and traffic levels have been applied for WMA. Based on these findings, there are generally no restrictions on WMA implementation. But there are some considerations on WMA design procedures that may be different from HMA and should be taken into account to ensure equal or better performance than Hot Mix Asphalt (HMA). These findings will be provided in this chapter.
7.1. Traditional mix design methods The traditional mix design procedures for HMA can serve as a framework for WMA, therefore a short description of two most commonly used methods will be given. The Marshall method with some regional differences is used in Europe and Superpave is mostly used in US
Many experiments with WMA are conducted in US and there are a large number of reports available from US Federal Highway Administration and Departments of Transportation in different states. Although the mix design method is not applicable to Europe, there are several references in this report to mix design concepts that are used in US – the SUPERPAVE (SUperior PERforming asphalt PAVEment) mix design method. The references are good indications on WMA production processes and possible problems with WMA implementation that can be taken into consideration when designing and testing the WMA in Europe. Since this mix design system is not commonly used in Europe shot review of the relevant parts of Superpave mix design method will be given in order to describe the testing and designing principles that are mentioned in this thesis.
7.1.1. Superpave Since there are references to the Superpave system, and specifically to the binder specification and the compaction method, in this thesis, the basic principles of these parts of the mix design system will be discussed. The principles of choosing mineral aggregates and mixture design specifics will not be discussed as they are not relevant to the context of this thesis. The following description is a summary from Superpave mix design handbook of Asphalt Institute (77).
Bitumen
The Superpave binder specification differs from EN bitumen specifications in that the tests used to measure properties can be directly related to field performance. The Superpave mix design system integrates material selection and the mix design procedures based on the project’s climate and design traffic. A unique feature of the Superpave binder specification is that instead of performing a test at constant temperature and varying the specified value, the specified value is constant and the test temperature at which this value must be achieved is varied. The equipment used for determining the binder properties is listed in Table 6. Performance Graded (PG) binders are defined by the high and low temperature grade. As an example for PG 64-22, means adequate physical properties from +64oC to -22oC.This corresponds to pavement temperature in the climate in which the binder is expected to serve. The tests can be performed in three different conditions of bitumen:
original, after Rolling Film Thin Oven Test (RTFOT) which simulates initial ageing in production and
paving process, after Pressure Aged Vessel (PAV) test which simulates long time hardening of the bitumen
in asphalt pavement.
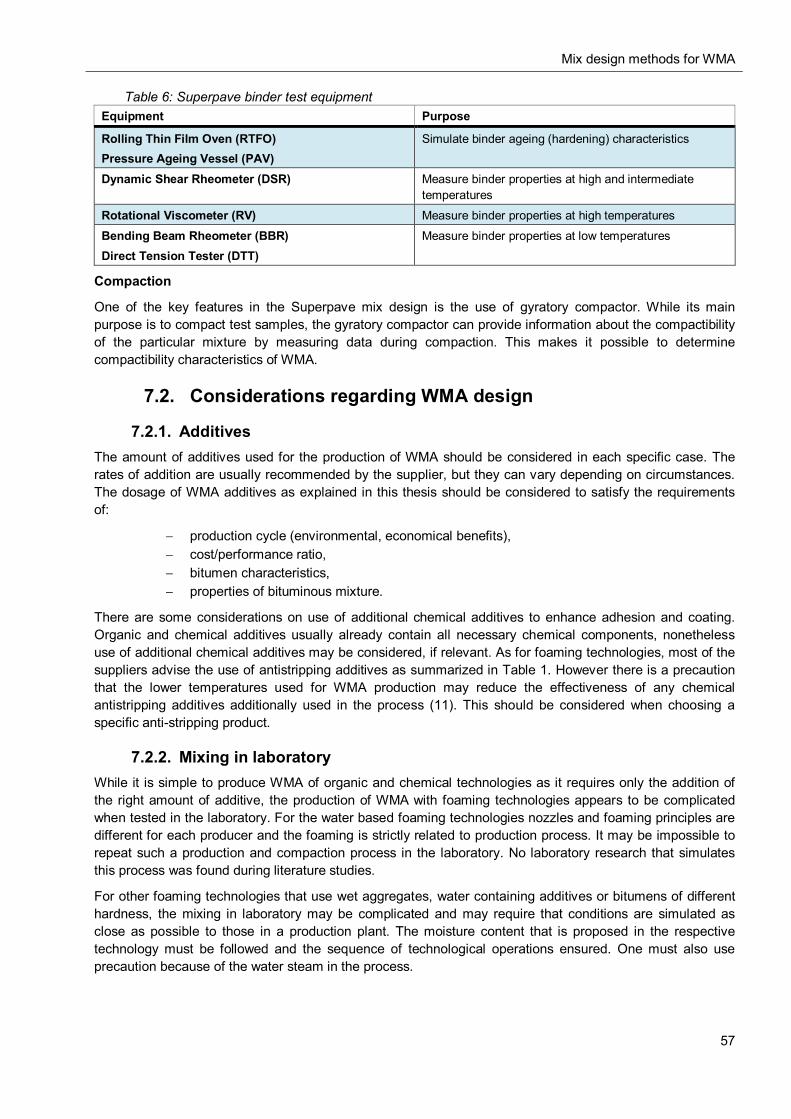
Mix design methods for WMA
57
Table 6: Superpave binder test equipment Equipment Purpose
Rolling Thin Film Oven (RTFO) Pressure Ageing Vessel (PAV)
Simulate binder ageing (hardening) characteristics
Dynamic Shear Rheometer (DSR) Measure binder properties at high and intermediate temperatures
Rotational Viscometer (RV) Measure binder properties at high temperatures
Bending Beam Rheometer (BBR) Direct Tension Tester (DTT)
Measure binder properties at low temperatures
Compaction
One of the key features in the Superpave mix design is the use of gyratory compactor. While its main purpose is to compact test samples, the gyratory compactor can provide information about the compactibility of the particular mixture by measuring data during compaction. This makes it possible to determine compactibility characteristics of WMA.
7.2. Considerations regarding WMA design
7.2.1. Additives The amount of additives used for the production of WMA should be considered in each specific case. The rates of addition are usually recommended by the supplier, but they can vary depending on circumstances. The dosage of WMA additives as explained in this thesis should be considered to satisfy the requirements of:
production cycle (environmental, economical benefits), cost/performance ratio, bitumen characteristics, properties of bituminous mixture.
There are some considerations on use of additional chemical additives to enhance adhesion and coating. Organic and chemical additives usually already contain all necessary chemical components, nonetheless use of additional chemical additives may be considered, if relevant. As for foaming technologies, most of the suppliers advise the use of antistripping additives as summarized in Table 1. However there is a precaution that the lower temperatures used for WMA production may reduce the effectiveness of any chemical antistripping additives additionally used in the process (11). This should be considered when choosing a specific anti-stripping product.
7.2.2. Mixing in laboratory While it is simple to produce WMA of organic and chemical technologies as it requires only the addition of the right amount of additive, the production of WMA with foaming technologies appears to be complicated when tested in the laboratory. For the water based foaming technologies nozzles and foaming principles are different for each producer and the foaming is strictly related to production process. It may be impossible to repeat such a production and compaction process in the laboratory. No laboratory research that simulates this process was found during literature studies.
For other foaming technologies that use wet aggregates, water containing additives or bitumens of different hardness, the mixing in laboratory may be complicated and may require that conditions are simulated as close as possible to those in a production plant. The moisture content that is proposed in the respective technology must be followed and the sequence of technological operations ensured. One must also use precaution because of the water steam in the process.

Mix design methods for WMA
58
7.2.3. Production and compaction temperature As described in section 5.5.2 The Bitumen Test Data Chart the temperature-viscosity relationship for binder is important in determining appropriate temperature ranges for mixing and compaction of bituminous mixtures. Optimum bitumen viscosity for mixing and compaction has to be followed in order to fully coat the aggregates and maintain good workability. The range of appropriate mixing and compaction temperature can be determined from the viscosity line in relation to temperature in the Bitumen Test Data Chart (BTDC). For satisfactory coating during mixing, the viscosity should be approximately 0.2 Pa·s and for compaction optimal viscosity is between 2-20 Pa·s (36). An example for determining mixing and paving temperature for 200 penetration bitumen is illustrated in Figure 29 in the BTDC chart.
Figure 29: BTDC table for optimum mixing and compaction temperature (78)
As WMA technologies are different from each other and can use different binders, it is necessary to determine the right temperature range of mixing and compaction. Theoretically, this is a method for doing that. However, the BTDC was developed for pure bitumens, and as it is with polymer modified bitumens, this method might be unusable for WMA additives. Many of the WMA technologies depend not only on viscosity reduction, but also on bitumen-aggregate interaction so direct assessment of production and paving temperature might require different methods. Different determination of adequate temperature is also necessary for the WMA technologies that involve foaming action of bitumen in the mixing chamber to enhance coating. As these methods depend on short time viscosity change and the foaming action is caused by introducing water just before mixing the binder with aggregates, it requires a different approach to determine the right mixing and compaction temperature.
The right compaction temperature in other way can be determined by comparing the bulk density of WMA and the reference HMA. By taking the bulk density of the HMA after compaction as a reference and comparing it with the density of WMA at various temperatures, the temperature at which both densities are the same can be determined. Therefore the right compaction temperature can be defined to achieve similar densities. This is illustrated in Figure 30.
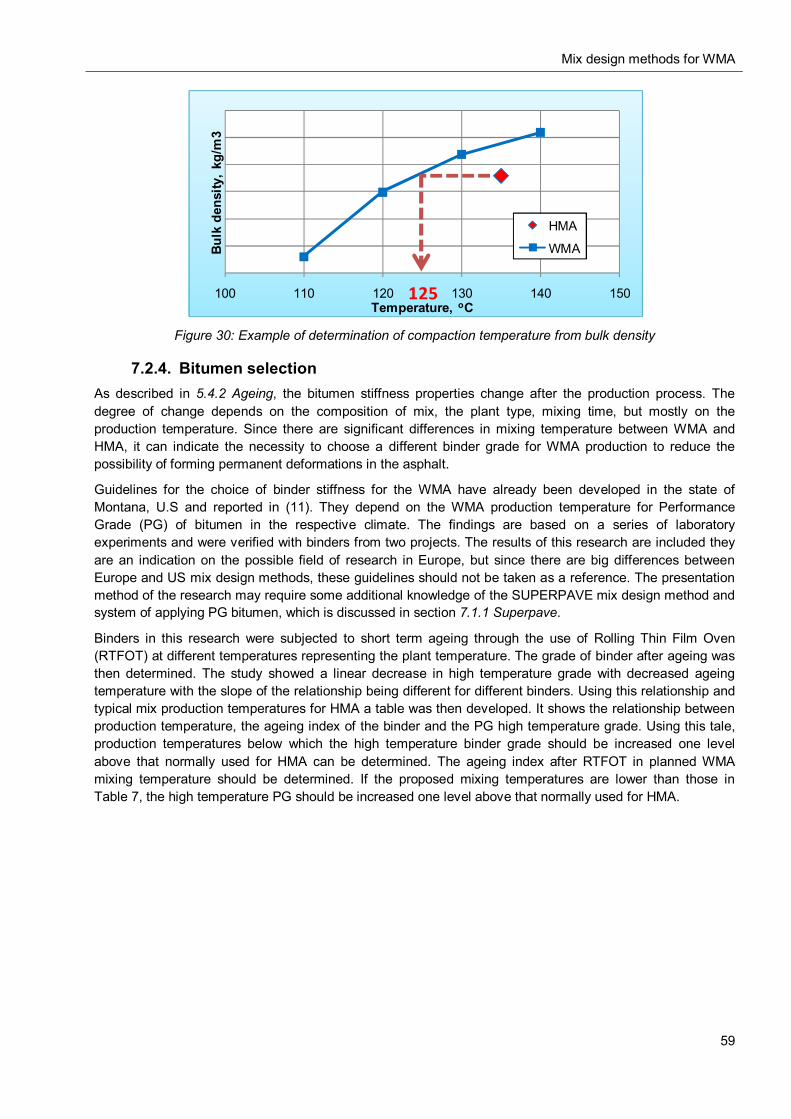
Mix design methods for WMA
59
Figure 30: Example of determination of compaction temperature from bulk density
7.2.4. Bitumen selection As described in 5.4.2 Ageing, the bitumen stiffness properties change after the production process. The degree of change depends on the composition of mix, the plant type, mixing time, but mostly on the production temperature. Since there are significant differences in mixing temperature between WMA and HMA, it can indicate the necessity to choose a different binder grade for WMA production to reduce the possibility of forming permanent deformations in the asphalt.
Guidelines for the choice of binder stiffness for the WMA have already been developed in the state of Montana, U.S and reported in (11). They depend on the WMA production temperature for Performance Grade (PG) of bitumen in the respective climate. The findings are based on a series of laboratory experiments and were verified with binders from two projects. The results of this research are included they are an indication on the possible field of research in Europe, but since there are big differences between Europe and US mix design methods, these guidelines should not be taken as a reference. The presentation method of the research may require some additional knowledge of the SUPERPAVE mix design method and system of applying PG bitumen, which is discussed in section 7.1.1 Superpave.
Binders in this research were subjected to short term ageing through the use of Rolling Thin Film Oven (RTFOT) at different temperatures representing the plant temperature. The grade of binder after ageing was then determined. The study showed a linear decrease in high temperature grade with decreased ageing temperature with the slope of the relationship being different for different binders. Using this relationship and typical mix production temperatures for HMA a table was then developed. It shows the relationship between production temperature, the ageing index of the binder and the PG high temperature grade. Using this tale, production temperatures below which the high temperature binder grade should be increased one level above that normally used for HMA can be determined. The ageing index after RTFOT in planned WMA mixing temperature should be determined. If the proposed mixing temperatures are lower than those in Table 7, the high temperature PG should be increased one level above that normally used for HMA.
100 110 120 130 140 150
Bulk
dens
ity, k
g/m
3
Temperature, oC
HMA
WMA
125
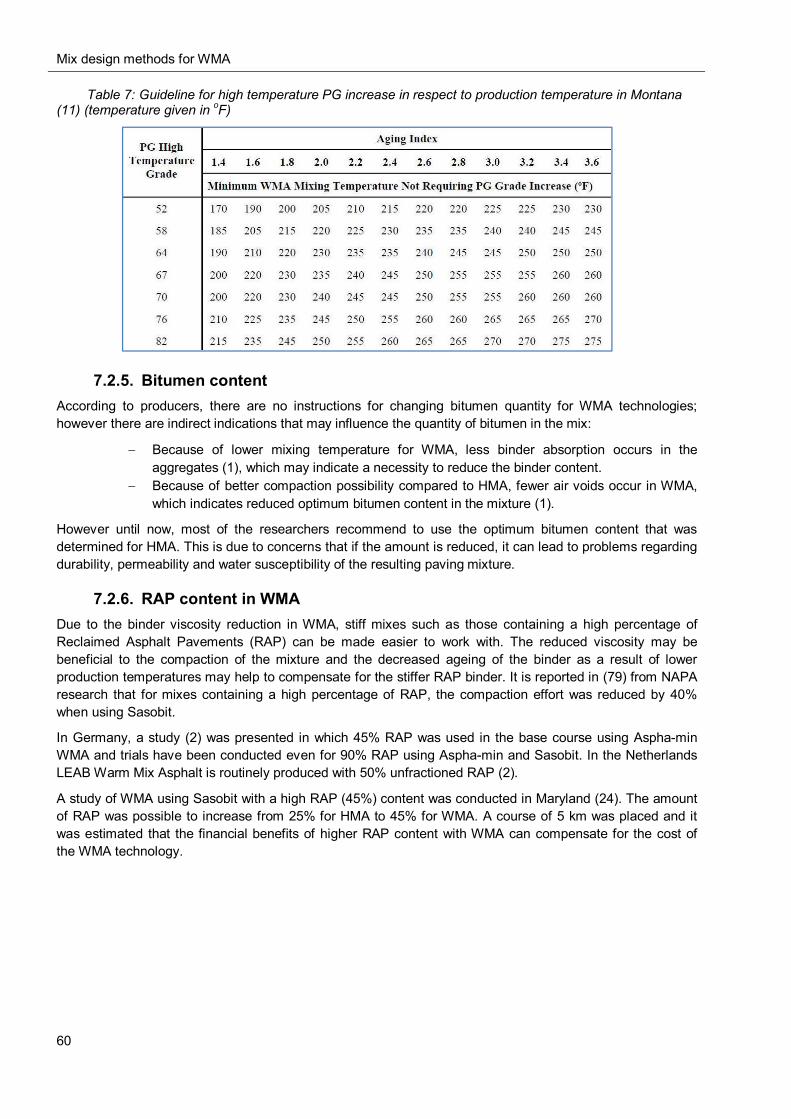
Mix design methods for WMA
60
Table 7: Guideline for high temperature PG increase in respect to production temperature in Montana (11) (temperature given in oF)
7.2.5. Bitumen content According to producers, there are no instructions for changing bitumen quantity for WMA technologies; however there are indirect indications that may influence the quantity of bitumen in the mix:
Because of lower mixing temperature for WMA, less binder absorption occurs in the aggregates (1), which may indicate a necessity to reduce the binder content.
Because of better compaction possibility compared to HMA, fewer air voids occur in WMA, which indicates reduced optimum bitumen content in the mixture (1).
However until now, most of the researchers recommend to use the optimum bitumen content that was determined for HMA. This is due to concerns that if the amount is reduced, it can lead to problems regarding durability, permeability and water susceptibility of the resulting paving mixture.
7.2.6. RAP content in WMA Due to the binder viscosity reduction in WMA, stiff mixes such as those containing a high percentage of Reclaimed Asphalt Pavements (RAP) can be made easier to work with. The reduced viscosity may be beneficial to the compaction of the mixture and the decreased ageing of the binder as a result of lower production temperatures may help to compensate for the stiffer RAP binder. It is reported in (79) from NAPA research that for mixes containing a high percentage of RAP, the compaction effort was reduced by 40% when using Sasobit.
In Germany, a study (2) was presented in which 45% RAP was used in the base course using Aspha-min WMA and trials have been conducted even for 90% RAP using Aspha-min and Sasobit. In the Netherlands LEAB Warm Mix Asphalt is routinely produced with 50% unfractioned RAP (2).
A study of WMA using Sasobit with a high RAP (45%) content was conducted in Maryland (24). The amount of RAP was possible to increase from 25% for HMA to 45% for WMA. A course of 5 km was placed and it was estimated that the financial benefits of higher RAP content with WMA can compensate for the cost of the WMA technology.
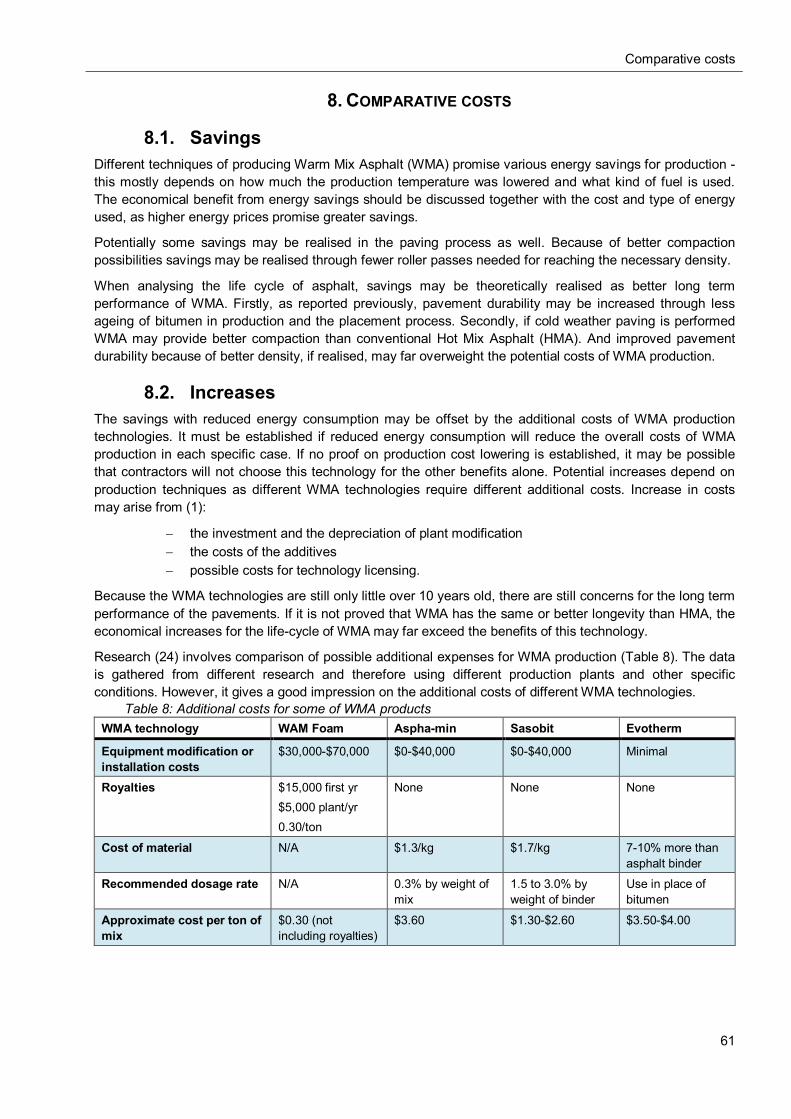
Comparative costs
61
8. COMPARATIVE COSTS
8.1. Savings Different techniques of producing Warm Mix Asphalt (WMA) promise various energy savings for production - this mostly depends on how much the production temperature was lowered and what kind of fuel is used. The economical benefit from energy savings should be discussed together with the cost and type of energy used, as higher energy prices promise greater savings.
Potentially some savings may be realised in the paving process as well. Because of better compaction possibilities savings may be realised through fewer roller passes needed for reaching the necessary density.
When analysing the life cycle of asphalt, savings may be theoretically realised as better long term performance of WMA. Firstly, as reported previously, pavement durability may be increased through less ageing of bitumen in production and the placement process. Secondly, if cold weather paving is performed WMA may provide better compaction than conventional Hot Mix Asphalt (HMA). And improved pavement durability because of better density, if realised, may far overweight the potential costs of WMA production.
8.2. Increases The savings with reduced energy consumption may be offset by the additional costs of WMA production technologies. It must be established if reduced energy consumption will reduce the overall costs of WMA production in each specific case. If no proof on production cost lowering is established, it may be possible that contractors will not choose this technology for the other benefits alone. Potential increases depend on production techniques as different WMA technologies require different additional costs. Increase in costs may arise from (1):
the investment and the depreciation of plant modification the costs of the additives possible costs for technology licensing.
Because the WMA technologies are still only little over 10 years old, there are still concerns for the long term performance of the pavements. If it is not proved that WMA has the same or better longevity than HMA, the economical increases for the life-cycle of WMA may far exceed the benefits of this technology.
Research (24) involves comparison of possible additional expenses for WMA production (Table 8). The data is gathered from different research and therefore using different production plants and other specific conditions. However, it gives a good impression on the additional costs of different WMA technologies.
Table 8: Additional costs for some of WMA products WMA technology WAM Foam Aspha-min Sasobit Evotherm
Equipment modification or installation costs
$30,000-$70,000 $0-$40,000 $0-$40,000 Minimal
Royalties $15,000 first yr $5,000 plant/yr 0.30/ton
None None None
Cost of material N/A $1.3/kg $1.7/kg 7-10% more than asphalt binder
Recommended dosage rate N/A 0.3% by weight of mix
1.5 to 3.0% by weight of binder
Use in place of bitumen
Approximate cost per ton of mix
$0.30 (not including royalties)
$3.60 $1.30-$2.60 $3.50-$4.00
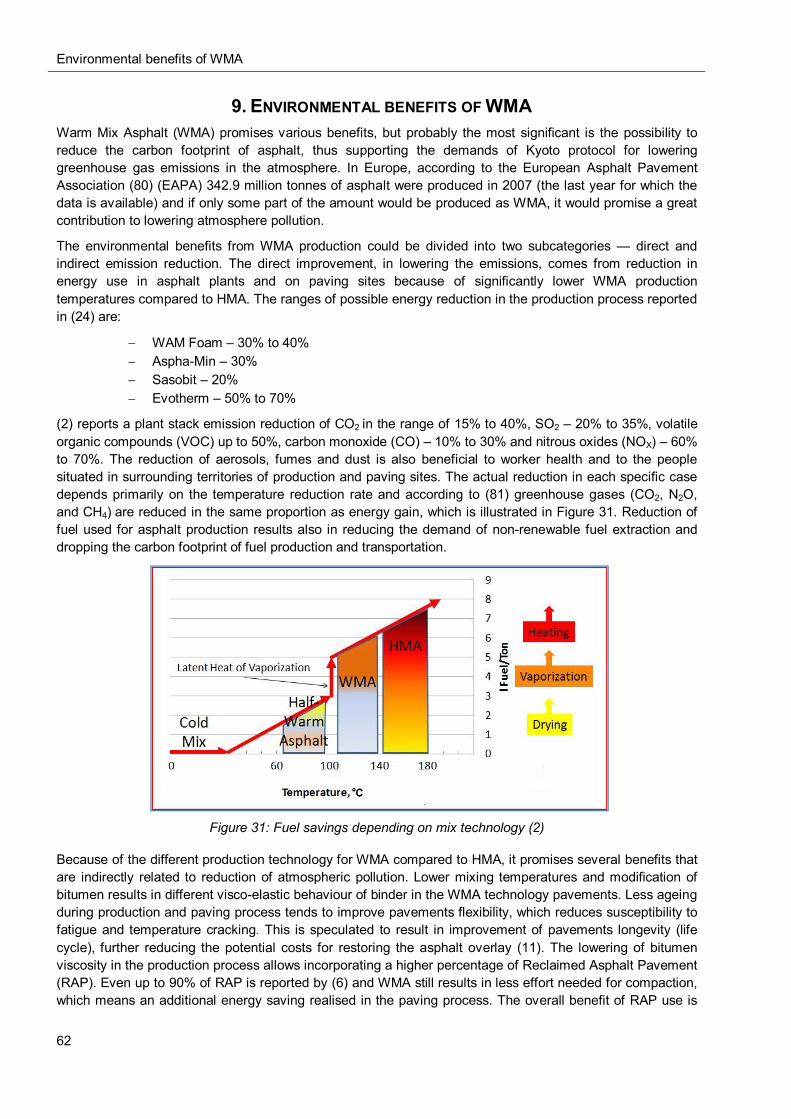
Environmental benefits of WMA
62
9. ENVIRONMENTAL BENEFITS OF WMA Warm Mix Asphalt (WMA) promises various benefits, but probably the most significant is the possibility to reduce the carbon footprint of asphalt, thus supporting the demands of Kyoto protocol for lowering greenhouse gas emissions in the atmosphere. In Europe, according to the European Asphalt Pavement Association (80) (EAPA) 342.9 million tonnes of asphalt were produced in 2007 (the last year for which the data is available) and if only some part of the amount would be produced as WMA, it would promise a great contribution to lowering atmosphere pollution.
The environmental benefits from WMA production could be divided into two subcategories — direct and indirect emission reduction. The direct improvement, in lowering the emissions, comes from reduction in energy use in asphalt plants and on paving sites because of significantly lower WMA production temperatures compared to HMA. The ranges of possible energy reduction in the production process reported in (24) are:
WAM Foam – 30% to 40% Aspha-Min – 30% Sasobit – 20% Evotherm – 50% to 70%
(2) reports a plant stack emission reduction of CO2 in the range of 15% to 40%, SO2 – 20% to 35%, volatile organic compounds (VOC) up to 50%, carbon monoxide (CO) – 10% to 30% and nitrous oxides (NOX) – 60% to 70%. The reduction of aerosols, fumes and dust is also beneficial to worker health and to the people situated in surrounding territories of production and paving sites. The actual reduction in each specific case depends primarily on the temperature reduction rate and according to (81) greenhouse gases (CO2, N2O, and CH4) are reduced in the same proportion as energy gain, which is illustrated in Figure 31. Reduction of fuel used for asphalt production results also in reducing the demand of non-renewable fuel extraction and dropping the carbon footprint of fuel production and transportation.
Figure 31: Fuel savings depending on mix technology (2)
Because of the different production technology for WMA compared to HMA, it promises several benefits that are indirectly related to reduction of atmospheric pollution. Lower mixing temperatures and modification of bitumen results in different visco-elastic behaviour of binder in the WMA technology pavements. Less ageing during production and paving process tends to improve pavements flexibility, which reduces susceptibility to fatigue and temperature cracking. This is speculated to result in improvement of pavements longevity (life cycle), further reducing the potential costs for restoring the asphalt overlay (11). The lowering of bitumen viscosity in the production process allows incorporating a higher percentage of Reclaimed Asphalt Pavement (RAP). Even up to 90% of RAP is reported by (6) and WMA still results in less effort needed for compaction, which means an additional energy saving realised in the paving process. The overall benefit of RAP use is
Environmental benefits of WMA
63
the resolving of the problem of RAP utilisation, saving of landfill space, reduction of virgin aggregates and energy used for mining.
It is also worth to mention that while most of WMA additives are produced specially for this purpose, some may be by-products of other production processes. For example wax that is used for production of Sasobit is a by-product of Fischer-Tropsch process and if not used in road industry it may become a waste material. Therefore use of this product gives benefit to reduction of waste materials and indirectly reduces the pollution from possible production of other WMA additives.
It must be noted that some of the environmental benefits may be offset with the carbon footprint embodied for producing additives and/or any additional equipment supporting the production of WMA. However no such information could be found during this research meaning either no such data has been gathered or the information is not publically available.
The degree of emission reductions, of course, depends on the technology used for producing WMA and the fuel used in the process therefore development of an effective life cycle assessment tool to calculate environmental effects is vital in proving the environmental benefits gained from WMA.
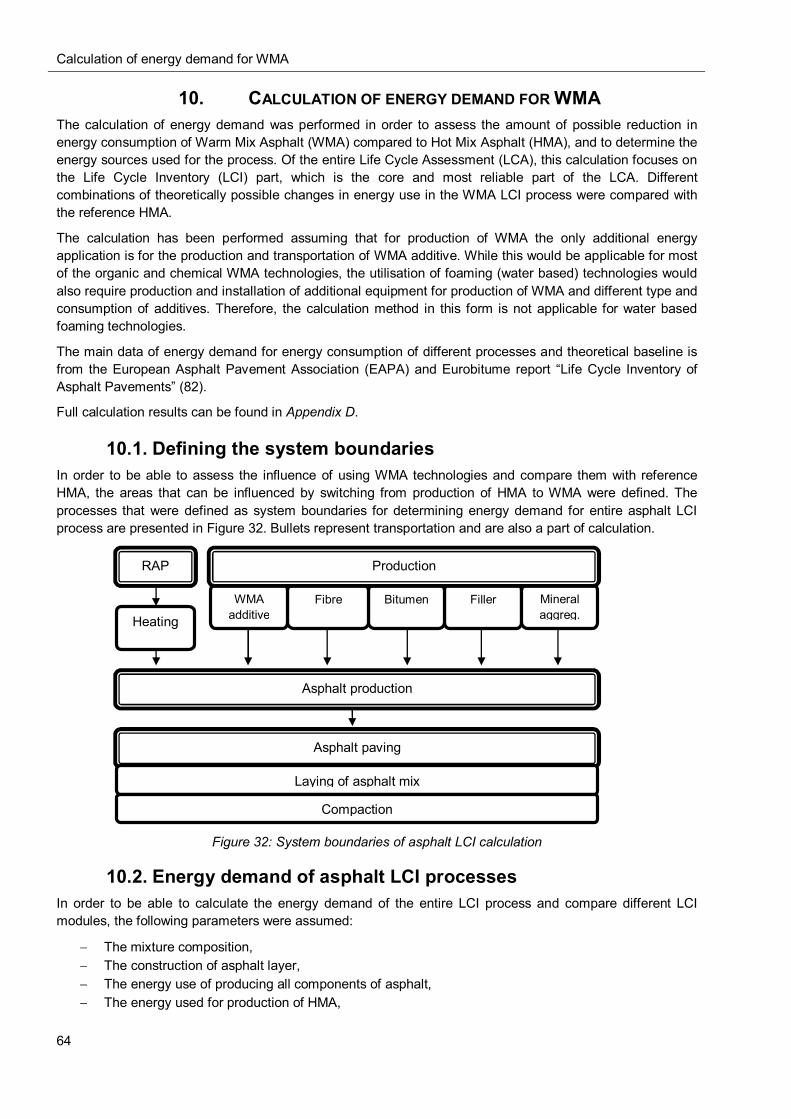
Calculation of energy demand for WMA
64
10. CALCULATION OF ENERGY DEMAND FOR WMA The calculation of energy demand was performed in order to assess the amount of possible reduction in energy consumption of Warm Mix Asphalt (WMA) compared to Hot Mix Asphalt (HMA), and to determine the energy sources used for the process. Of the entire Life Cycle Assessment (LCA), this calculation focuses on the Life Cycle Inventory (LCI) part, which is the core and most reliable part of the LCA. Different combinations of theoretically possible changes in energy use in the WMA LCI process were compared with the reference HMA.
The calculation has been performed assuming that for production of WMA the only additional energy application is for the production and transportation of WMA additive. While this would be applicable for most of the organic and chemical WMA technologies, the utilisation of foaming (water based) technologies would also require production and installation of additional equipment for production of WMA and different type and consumption of additives. Therefore, the calculation method in this form is not applicable for water based foaming technologies.
The main data of energy demand for energy consumption of different processes and theoretical baseline is from the European Asphalt Pavement Association (EAPA) and Eurobitume report “Life Cycle Inventory of Asphalt Pavements” (82).
Full calculation results can be found in Appendix D.
10.1. Defining the system boundaries In order to be able to assess the influence of using WMA technologies and compare them with reference HMA, the areas that can be influenced by switching from production of HMA to WMA were defined. The processes that were defined as system boundaries for determining energy demand for entire asphalt LCI process are presented in Figure 32. Bullets represent transportation and are also a part of calculation.
Figure 32: System boundaries of asphalt LCI calculation
10.2. Energy demand of asphalt LCI processes In order to be able to calculate the energy demand of the entire LCI process and compare different LCI modules, the following parameters were assumed:
The mixture composition, The construction of asphalt layer, The energy use of producing all components of asphalt, The energy used for production of HMA,
RAP
Asphalt production
Asphalt paving
Laying of asphalt mix
Compaction
Heating
Filler Bitumen Fibre WMA additive
Mineral aggreg.
Production
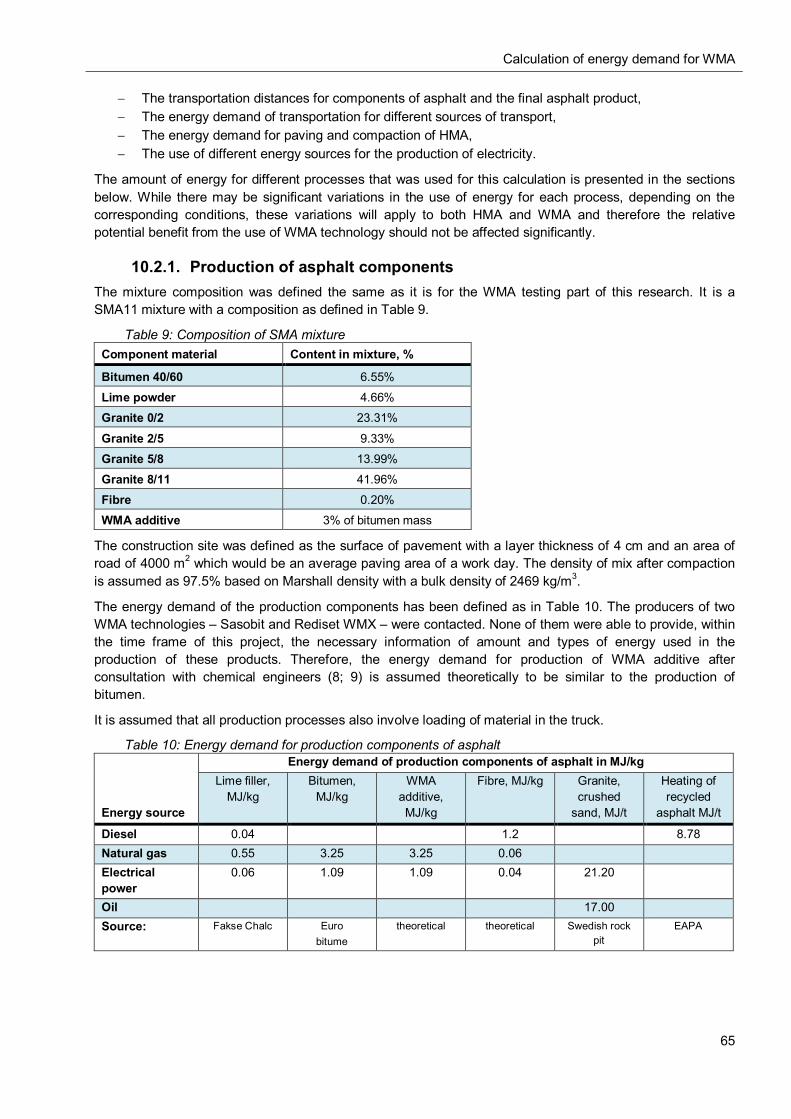
Calculation of energy demand for WMA
65
The transportation distances for components of asphalt and the final asphalt product, The energy demand of transportation for different sources of transport, The energy demand for paving and compaction of HMA, The use of different energy sources for the production of electricity.
The amount of energy for different processes that was used for this calculation is presented in the sections below. While there may be significant variations in the use of energy for each process, depending on the corresponding conditions, these variations will apply to both HMA and WMA and therefore the relative potential benefit from the use of WMA technology should not be affected significantly.
10.2.1. Production of asphalt components The mixture composition was defined the same as it is for the WMA testing part of this research. It is a SMA11 mixture with a composition as defined in Table 9.
Table 9: Composition of SMA mixture Component material Content in mixture, %
Bitumen 40/60 6.55%
Lime powder 4.66%
Granite 0/2 23.31%
Granite 2/5 9.33%
Granite 5/8 13.99%
Granite 8/11 41.96%
Fibre 0.20%
WMA additive 3% of bitumen mass
The construction site was defined as the surface of pavement with a layer thickness of 4 cm and an area of road of 4000 m2 which would be an average paving area of a work day. The density of mix after compaction is assumed as 97.5% based on Marshall density with a bulk density of 2469 kg/m3.
The energy demand of the production components has been defined as in Table 10. The producers of two WMA technologies – Sasobit and Rediset WMX – were contacted. None of them were able to provide, within the time frame of this project, the necessary information of amount and types of energy used in the production of these products. Therefore, the energy demand for production of WMA additive after consultation with chemical engineers (8; 9) is assumed theoretically to be similar to the production of bitumen.
It is assumed that all production processes also involve loading of material in the truck.
Table 10: Energy demand for production components of asphalt
Energy source
Energy demand of production components of asphalt in MJ/kg Lime filler,
MJ/kg Bitumen,
MJ/kg WMA
additive, MJ/kg
Fibre, MJ/kg Granite, crushed
sand, MJ/t
Heating of recycled
asphalt MJ/t
Diesel 0.04 1.2 8.78 Natural gas 0.55 3.25 3.25 0.06 Electrical power
0.06 1.09 1.09 0.04 21.20
Oil 17.00 Source: Fakse Chalc Euro
bitume theoretical theoretical Swedish rock
pit EAPA
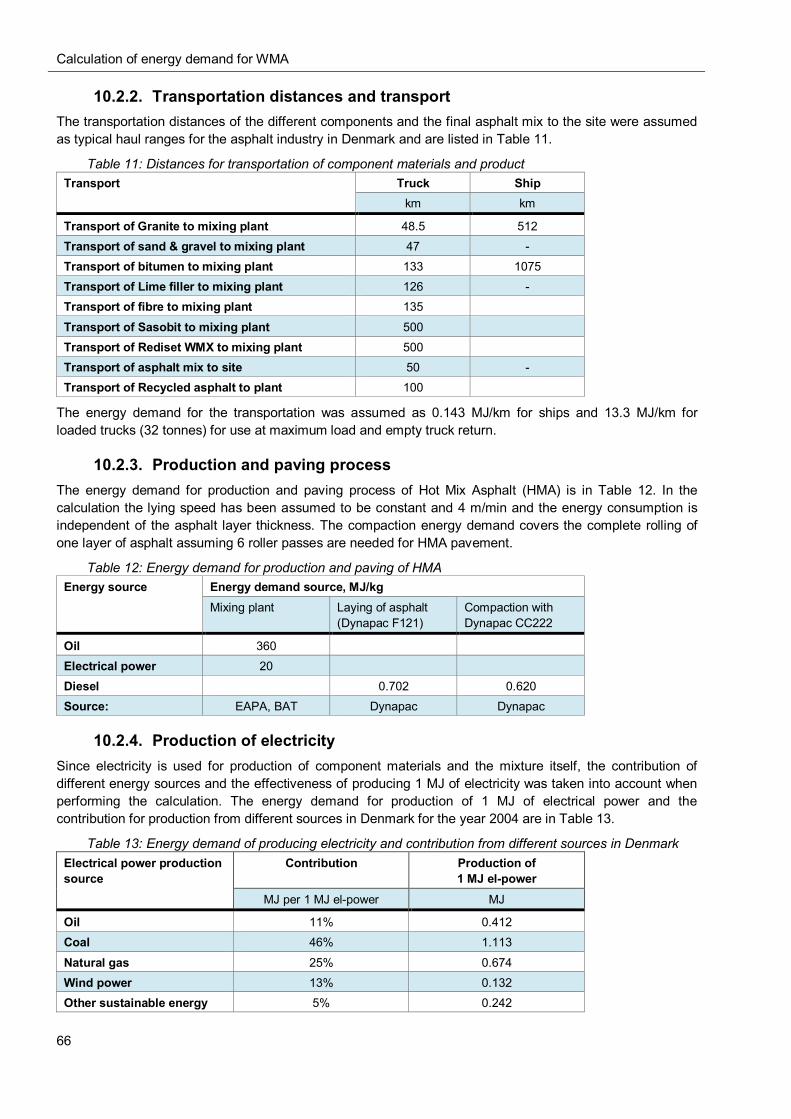
Calculation of energy demand for WMA
66
10.2.2. Transportation distances and transport The transportation distances of the different components and the final asphalt mix to the site were assumed as typical haul ranges for the asphalt industry in Denmark and are listed in Table 11.
Table 11: Distances for transportation of component materials and product Transport Truck Ship
km km
Transport of Granite to mixing plant 48.5 512 Transport of sand & gravel to mixing plant 47 - Transport of bitumen to mixing plant 133 1075 Transport of Lime filler to mixing plant 126 - Transport of fibre to mixing plant 135
Transport of Sasobit to mixing plant 500 Transport of Rediset WMX to mixing plant 500 Transport of asphalt mix to site 50 - Transport of Recycled asphalt to plant 100
The energy demand for the transportation was assumed as 0.143 MJ/km for ships and 13.3 MJ/km for loaded trucks (32 tonnes) for use at maximum load and empty truck return.
10.2.3. Production and paving process The energy demand for production and paving process of Hot Mix Asphalt (HMA) is in Table 12. In the calculation the lying speed has been assumed to be constant and 4 m/min and the energy consumption is independent of the asphalt layer thickness. The compaction energy demand covers the complete rolling of one layer of asphalt assuming 6 roller passes are needed for HMA pavement.
Table 12: Energy demand for production and paving of HMA Energy source Energy demand source, MJ/kg
Mixing plant Laying of asphalt (Dynapac F121)
Compaction with Dynapac CC222
Oil 360 Electrical power 20 Diesel 0.702 0.620 Source: EAPA, BAT Dynapac Dynapac
10.2.4. Production of electricity Since electricity is used for production of component materials and the mixture itself, the contribution of different energy sources and the effectiveness of producing 1 MJ of electricity was taken into account when performing the calculation. The energy demand for production of 1 MJ of electrical power and the contribution for production from different sources in Denmark for the year 2004 are in Table 13.
Table 13: Energy demand of producing electricity and contribution from different sources in Denmark Electrical power production source
Contribution Production of 1 MJ el-power
MJ per 1 MJ el-power MJ
Oil 11% 0.412 Coal 46% 1.113
Natural gas 25% 0.674 Wind power 13% 0.132 Other sustainable energy 5% 0.242
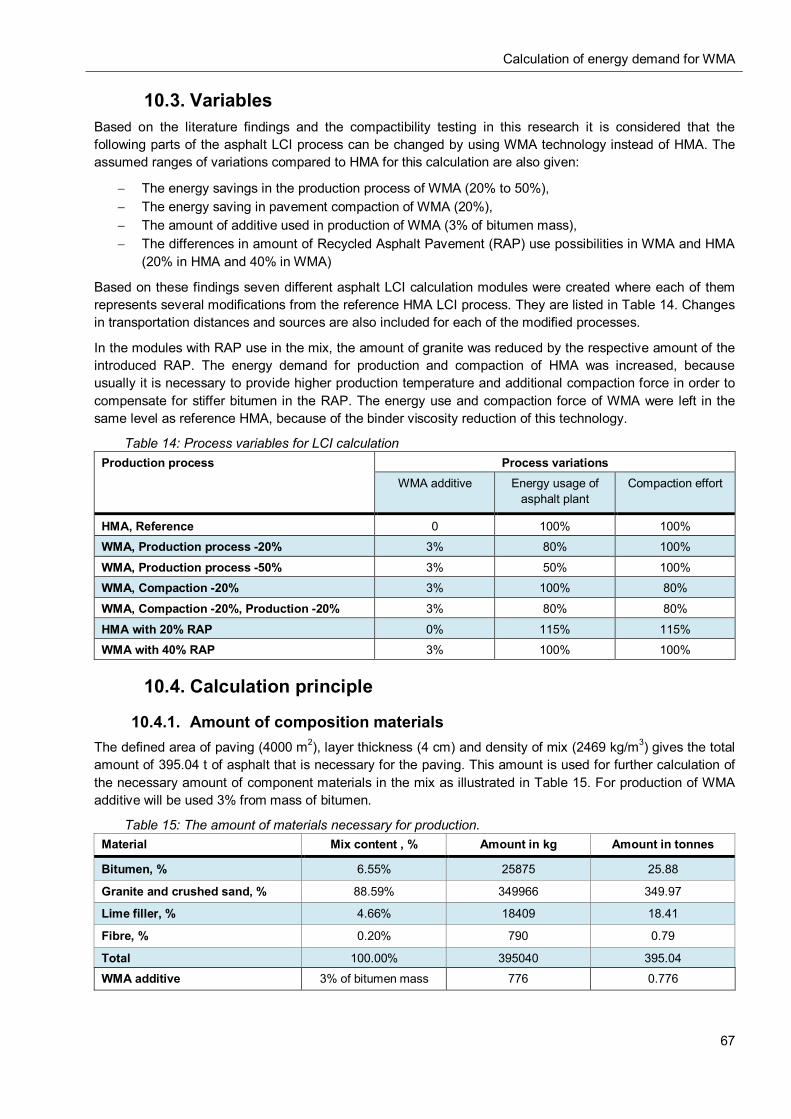
Calculation of energy demand for WMA
67
10.3. Variables Based on the literature findings and the compactibility testing in this research it is considered that the following parts of the asphalt LCI process can be changed by using WMA technology instead of HMA. The assumed ranges of variations compared to HMA for this calculation are also given:
The energy savings in the production process of WMA (20% to 50%), The energy saving in pavement compaction of WMA (20%), The amount of additive used in production of WMA (3% of bitumen mass), The differences in amount of Recycled Asphalt Pavement (RAP) use possibilities in WMA and HMA
(20% in HMA and 40% in WMA)
Based on these findings seven different asphalt LCI calculation modules were created where each of them represents several modifications from the reference HMA LCI process. They are listed in Table 14. Changes in transportation distances and sources are also included for each of the modified processes.
In the modules with RAP use in the mix, the amount of granite was reduced by the respective amount of the introduced RAP. The energy demand for production and compaction of HMA was increased, because usually it is necessary to provide higher production temperature and additional compaction force in order to compensate for stiffer bitumen in the RAP. The energy use and compaction force of WMA were left in the same level as reference HMA, because of the binder viscosity reduction of this technology.
Table 14: Process variables for LCI calculation Production process Process variations
WMA additive Energy usage of asphalt plant
Compaction effort
HMA, Reference 0 100% 100%
WMA, Production process -20% 3% 80% 100%
WMA, Production process -50% 3% 50% 100%
WMA, Compaction -20% 3% 100% 80%
WMA, Compaction -20%, Production -20% 3% 80% 80%
HMA with 20% RAP 0% 115% 115%
WMA with 40% RAP 3% 100% 100%
10.4. Calculation principle
10.4.1. Amount of composition materials The defined area of paving (4000 m2), layer thickness (4 cm) and density of mix (2469 kg/m3) gives the total amount of 395.04 t of asphalt that is necessary for the paving. This amount is used for further calculation of the necessary amount of component materials in the mix as illustrated in Table 15. For production of WMA additive will be used 3% from mass of bitumen.
Table 15: The amount of materials necessary for production. Material Mix content , % Amount in kg Amount in tonnes
Bitumen, % 6.55% 25875 25.88
Granite and crushed sand, % 88.59% 349966 349.97
Lime filler, % 4.66% 18409 18.41
Fibre, % 0.20% 790 0.79
Total 100.00% 395040 395.04
WMA additive 3% of bitumen mass 776 0.776
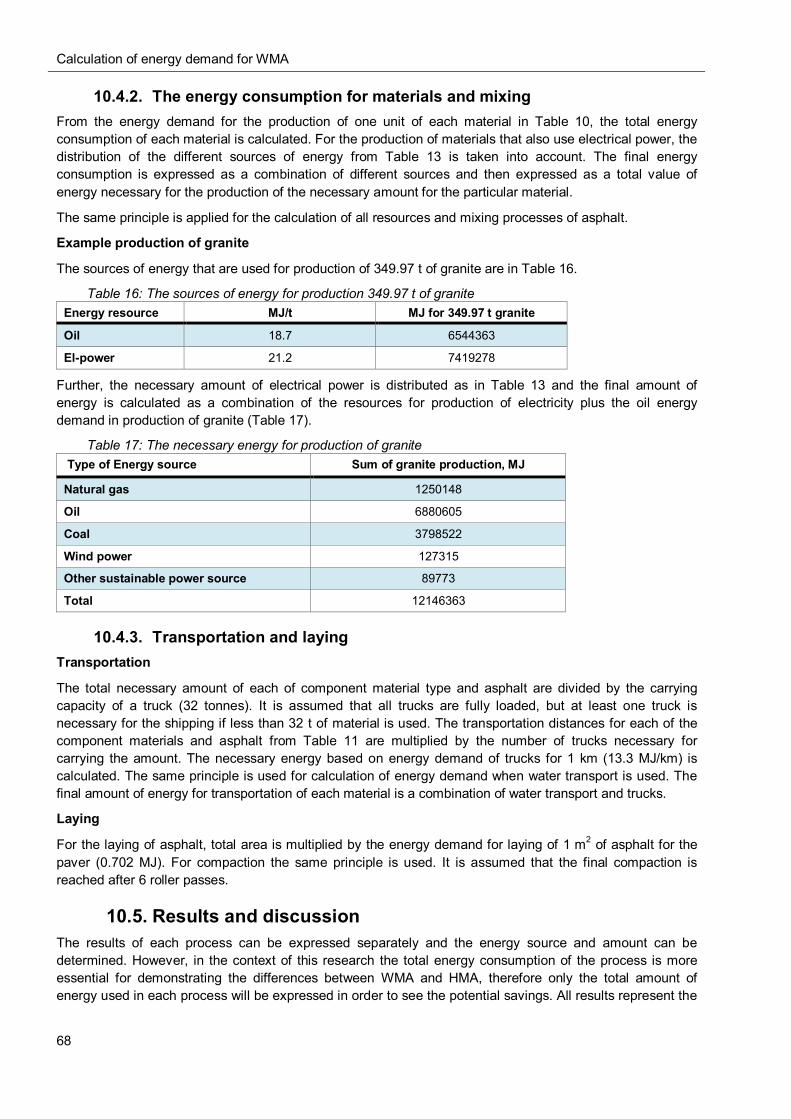
Calculation of energy demand for WMA
68
10.4.2. The energy consumption for materials and mixing From the energy demand for the production of one unit of each material in Table 10, the total energy consumption of each material is calculated. For the production of materials that also use electrical power, the distribution of the different sources of energy from Table 13 is taken into account. The final energy consumption is expressed as a combination of different sources and then expressed as a total value of energy necessary for the production of the necessary amount for the particular material.
The same principle is applied for the calculation of all resources and mixing processes of asphalt.
Example production of granite
The sources of energy that are used for production of 349.97 t of granite are in Table 16.
Table 16: The sources of energy for production 349.97 t of granite Energy resource MJ/t MJ for 349.97 t granite
Oil 18.7 6544363
El-power 21.2 7419278
Further, the necessary amount of electrical power is distributed as in Table 13 and the final amount of energy is calculated as a combination of the resources for production of electricity plus the oil energy demand in production of granite (Table 17).
Table 17: The necessary energy for production of granite Type of Energy source Sum of granite production, MJ
Natural gas 1250148
Oil 6880605
Coal 3798522
Wind power 127315
Other sustainable power source 89773
Total 12146363
10.4.3. Transportation and laying Transportation
The total necessary amount of each of component material type and asphalt are divided by the carrying capacity of a truck (32 tonnes). It is assumed that all trucks are fully loaded, but at least one truck is necessary for the shipping if less than 32 t of material is used. The transportation distances for each of the component materials and asphalt from Table 11 are multiplied by the number of trucks necessary for carrying the amount. The necessary energy based on energy demand of trucks for 1 km (13.3 MJ/km) is calculated. The same principle is used for calculation of energy demand when water transport is used. The final amount of energy for transportation of each material is a combination of water transport and trucks.
Laying
For the laying of asphalt, total area is multiplied by the energy demand for laying of 1 m2 of asphalt for the paver (0.702 MJ). For compaction the same principle is used. It is assumed that the final compaction is reached after 6 roller passes.
10.5. Results and discussion The results of each process can be expressed separately and the energy source and amount can be determined. However, in the context of this research the total energy consumption of the process is more essential for demonstrating the differences between WMA and HMA, therefore only the total amount of energy used in each process will be expressed in order to see the potential savings. All results represent the
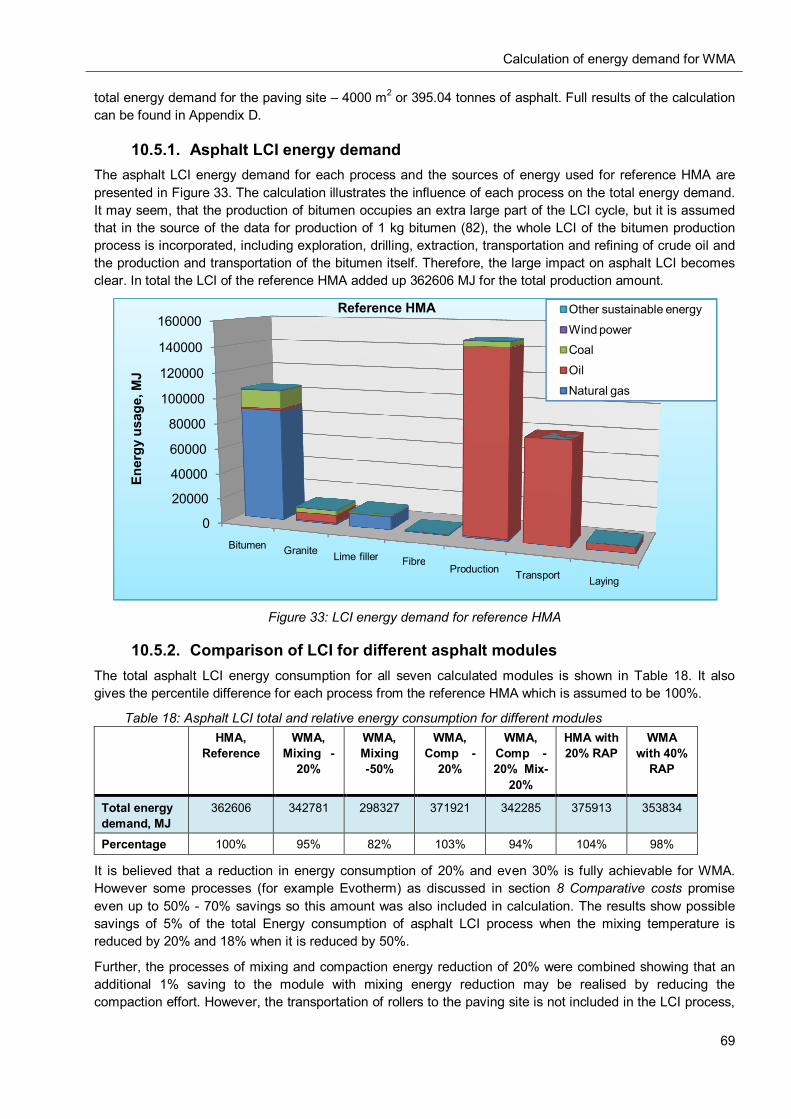
Calculation of energy demand for WMA
69
total energy demand for the paving site – 4000 m2 or 395.04 tonnes of asphalt. Full results of the calculation can be found in Appendix D.
10.5.1. Asphalt LCI energy demand The asphalt LCI energy demand for each process and the sources of energy used for reference HMA are presented in Figure 33. The calculation illustrates the influence of each process on the total energy demand. It may seem, that the production of bitumen occupies an extra large part of the LCI cycle, but it is assumed that in the source of the data for production of 1 kg bitumen (82), the whole LCI of the bitumen production process is incorporated, including exploration, drilling, extraction, transportation and refining of crude oil and the production and transportation of the bitumen itself. Therefore, the large impact on asphalt LCI becomes clear. In total the LCI of the reference HMA added up 362606 MJ for the total production amount.
Figure 33: LCI energy demand for reference HMA
10.5.2. Comparison of LCI for different asphalt modules The total asphalt LCI energy consumption for all seven calculated modules is shown in Table 18. It also gives the percentile difference for each process from the reference HMA which is assumed to be 100%.
Table 18: Asphalt LCI total and relative energy consumption for different modules HMA,
Reference WMA,
Mixing -20%
WMA, Mixing -50%
WMA, Comp -
20%
WMA, Comp -20% Mix-
20%
HMA with 20% RAP
WMA with 40%
RAP
Total energy demand, MJ
362606 342781 298327 371921 342285 375913 353834
Percentage 100% 95% 82% 103% 94% 104% 98%
It is believed that a reduction in energy consumption of 20% and even 30% is fully achievable for WMA. However some processes (for example Evotherm) as discussed in section 8 Comparative costs promise even up to 50% - 70% savings so this amount was also included in calculation. The results show possible savings of 5% of the total Energy consumption of asphalt LCI process when the mixing temperature is reduced by 20% and 18% when it is reduced by 50%.
Further, the processes of mixing and compaction energy reduction of 20% were combined showing that an additional 1% saving to the module with mixing energy reduction may be realised by reducing the compaction effort. However, the transportation of rollers to the paving site is not included in the LCI process,
0
20000
40000
60000
80000
100000
120000
140000
160000
Bitumen Granite Lime filler FibreProduction Transport Laying
Ener
gy u
sage
, MJ
Reference HMA Other sustainable energy
Wind powerCoal
Oil
Natural gas
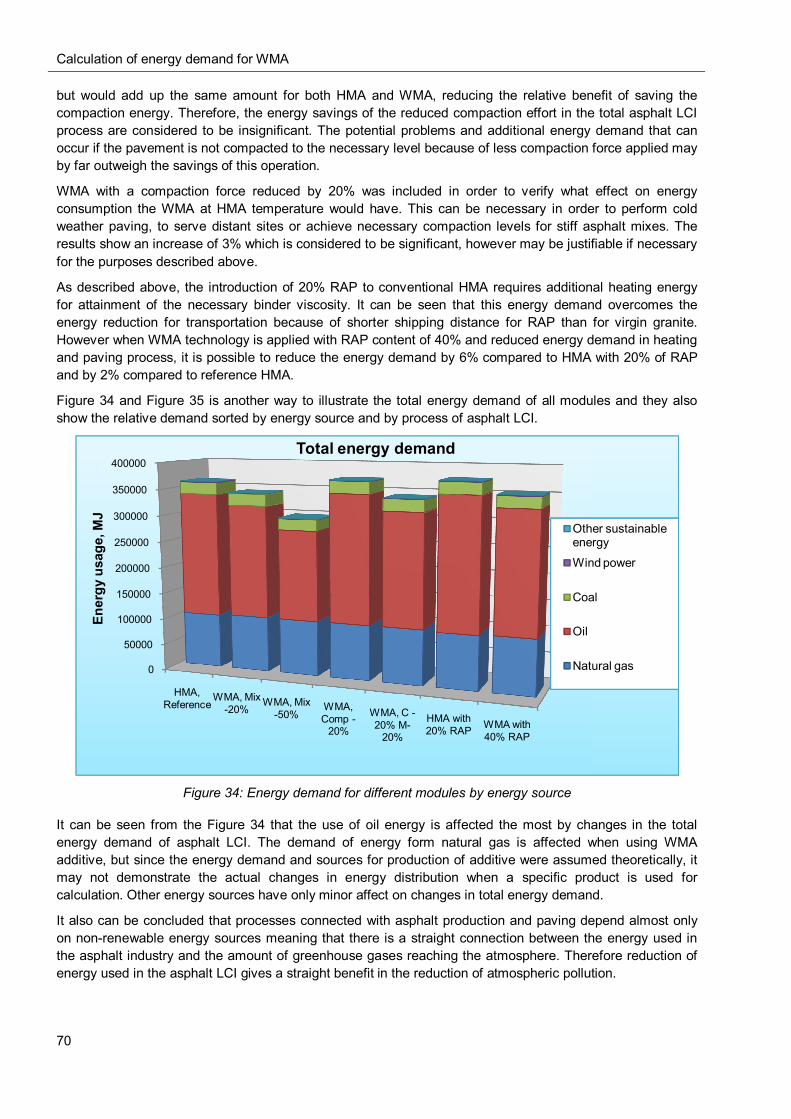
Calculation of energy demand for WMA
70
but would add up the same amount for both HMA and WMA, reducing the relative benefit of saving the compaction energy. Therefore, the energy savings of the reduced compaction effort in the total asphalt LCI process are considered to be insignificant. The potential problems and additional energy demand that can occur if the pavement is not compacted to the necessary level because of less compaction force applied may by far outweigh the savings of this operation.
WMA with a compaction force reduced by 20% was included in order to verify what effect on energy consumption the WMA at HMA temperature would have. This can be necessary in order to perform cold weather paving, to serve distant sites or achieve necessary compaction levels for stiff asphalt mixes. The results show an increase of 3% which is considered to be significant, however may be justifiable if necessary for the purposes described above.
As described above, the introduction of 20% RAP to conventional HMA requires additional heating energy for attainment of the necessary binder viscosity. It can be seen that this energy demand overcomes the energy reduction for transportation because of shorter shipping distance for RAP than for virgin granite. However when WMA technology is applied with RAP content of 40% and reduced energy demand in heating and paving process, it is possible to reduce the energy demand by 6% compared to HMA with 20% of RAP and by 2% compared to reference HMA.
Figure 34 and Figure 35 is another way to illustrate the total energy demand of all modules and they also show the relative demand sorted by energy source and by process of asphalt LCI.
Figure 34: Energy demand for different modules by energy source
It can be seen from the Figure 34 that the use of oil energy is affected the most by changes in the total energy demand of asphalt LCI. The demand of energy form natural gas is affected when using WMA additive, but since the energy demand and sources for production of additive were assumed theoretically, it may not demonstrate the actual changes in energy distribution when a specific product is used for calculation. Other energy sources have only minor affect on changes in total energy demand.
It also can be concluded that processes connected with asphalt production and paving depend almost only on non-renewable energy sources meaning that there is a straight connection between the energy used in the asphalt industry and the amount of greenhouse gases reaching the atmosphere. Therefore reduction of energy used in the asphalt LCI gives a straight benefit in the reduction of atmospheric pollution.
0
50000
100000
150000
200000
250000
300000
350000
400000
HMA, Reference
WMA, Mix -20%
WMA, Mix -50%
WMA, Comp -
20%
WMA, C -20% M-
20%
HMA with 20% RAP WMA with
40% RAP
Ener
gy u
sage
, MJ
Total energy demand
Other sustainable energy
Wind power
Coal
Oil
Natural gas

Calculation of energy demand for WMA
71
Figure 35: Energy demand for different modules by LCI process
Figure 35 presents the relative part of each asphalt LCI process in different calculation modules. From this image it is clear that the changes in the energy consumption for asphalt production are by far the most important part regarding comparison of LCI for HMA and WMA. While for LCI of the reference HMA the production of asphalt adds up 40.9% of total energy demand, for WMA with 20% reduction production process it is only 34.6% and for WMA with 50% reduction – 24.8% of total energy demand.
The figure also shows the influence of WMA additive which, depending on the module varies from 0.9-1.1% of total energy demand. However, since the energy demand can vary for production of different WMA additives and the recommended dosage is also different for each product, the relative part in the total process may be influenced when actual data is used.
When the energy use for compaction is examined, it becomes clear why the reduction in rolling force does not give significant effect on the total energy reduction as this process for reference HMA ads up only 1.5%.
It must be noted that this calculation model of asphalt LCI interprets only the demand of energy that is necessary for asphalt LCI and does not take into account the environmental or economical aspects. For example although use of RAP may require additional energy in the process, it saves the amount of necessary virgin aggregates thus reducing the asphalt price and resolving the problem with RAP utilisation. Similarly, the different technologies for production of WMA additives may be reason for discussions as some of the technologies use waste material from other processes (like Sasobit and the Fischer Tropsch process) while others may require special production of chemical additives meaning further atmospheric pollution. However, a calculation is necessary to verify this statement. It could be performed with a similar calculation method for all asphalt LCI, but this would require the gathering of data of the amounts of emissions from each process.
0
50000
100000
150000
200000
250000
300000
350000
400000
HMA, Reference
WMA, Mix -20%
WMA, Mix -50%
WMA, Comp -
20%
WMA, C -20% M-
20%
HMA with 20% RAP WMA with
40% RAP
Ener
gy u
sage
, MJ
Total energy demand
Laying
Transport
Asphalt production
Heating of RAP
Lime filler
Fibre
Granite
WMA additive
Bitumen
Bitumen testing
72
11. BITUMEN TESTING This chapter involves the preparation, results and discussion of the bitumen testing. It is based on the theory discussed in section 5. Bitumen and should therefore be evaluated together with that part of the thesis. Complete results of the testing can be found in Appendix B.
11.1. Objective The research on bitumen was performed in order to accomplish the following objectives:
Compare the consistency of pure bitumen and binders with different amount of additives at intermediate and high temperatures,
Evaluate the suitability of Bitumen Test Data Chart (BTDC) for expression of modified binder properties,
Determine rheological properties of pure bitumen and binder with different amount of additives at different temperatures and frequencies with the Dynamic Shear Rheometer (DSR),
Determine the optimum amount of additive for the mixture evaluation, Determine the mixing and paving temperatures of modified bitumen.
11.2. Experimental plan The bitumen testing is performed for two Warm Mix Asphalt (WMA) products – Sasobit and Rediset WMX.
Testing was performed in three stages (B for Bitumen) and is illustrated in Figure 36:
Stage B1: Bitumen 40/60 was mixed with the desired amount of additive a. Pure b. 2% and 3% of Sasobit c. 1% and 2% of Rediset WMX
Stage B2: Bitumen was tested for: a. Penetration at 25oC (EN 1426), b. Softening point (EN 1427), c. Dynamic viscosity at 60oC (EN12596), d. Kinematic viscosity at 135oC(EN 12595) e. Rheological properties with DSR at eight different temperatures and eleven frequencies at
each temperature. Stage B3: Evaluation of the results:
a. Comparison of the additives, b. Comparison of the results in BTDC, c. Prediction of the theoretical compaction temperature, d. Choice of the dosage for mix design for each product, e. Comparison of complex modulus, phase angle and viscosity for modified binders and pure
bitumen.

Bitumen testing
73
Figure 36: Experimental plan for testing bitumen
11.3. Preparation of test samples The additives according to producers can be stirred with bitumen and are completely soluble in bitumen at production temperatures. The initial stirring of additives with bitumen was performed at ~175oC. All the binder cans were stirred thoroughly prior to pouring the sample to ensure the test specimen was homogeneous.
Stirring was performed at ~175oC. The melting of Sasobit was fast and the bitumen was homogeneous after mixing with pastilles. Mixing with Rediset WMX appeared to take significantly longer and require additional heating before homogeneous distribution was achieved. The appearance of the bitumen after initial mixing is shown in Figure 37. This may be an indication of longer mixing time required in the plant if the additive is added straight in the pugmill.
Figure 37: Appearance of not dissolved Rediset WMX pastilles after initial mixing
11.4. Standard specification test results
11.4.1. Method The bitumen testing was performed according to requirement for test methods in “EN 12591: Specifications for paving grade bitumens” (41). This allows an evaluation of the bitumen by conventional methods that are accessible to most contractors. The respective test method and conditions are given below:
Original
B1 Bitumen 40/60
Sasobit
2% 3%
Rediset WMX
1% 2%
Dynamic viscosity
Kinematic viscosity
Softening point
Penetration
B3 Bitumen test data chart
Dynamic Shear
Rheometer
G* and δ
B2 Testing
Bitumen testing
74
Penetration: according to EN 1426 with automatic apparatus at 25oC, result expressed as mean of three measurements;
Softening point: according to EN 1427 with automatic apparatus in water, result expressed as mean of two measurements;
Dynamic viscosity: according to EN 12596 with Asphalt Institute capillary viscometer at 60oC, result expressed as mean of two measurements;
Kinematic viscosity: according to EN 12595 with Cannon-Fenske opaque viscometer at 135oC, result expressed as mean of two measurements;
11.4.2. Results and discussion Test results for bitumen with 3% of Sasobit additive resulted in a difference of 25.8% between two testing results for dynamic viscosity. The test procedure was repeated to verify the accuracy of the test results. The second test showed slightly less difference between the test results (21.9%) which is still considered to be a very high variance. However three out of four samples showed a very high correlation coefficient (0.99-1.00) within one capillary viscometer meaning that the tests were performed accurately. Therefore, although visually no such evidence was found, the poor comparison between the results is attributed to inhomogeneous mixing of the additive with the binder or to “structure” in the binder. This suggests that when WMA modified bitumen is tested, extra care should be given to stirring the bitumen before testing is performed. None of these problems was observed for any other amount or type of additive. The result presented in the table for bitumen with 3% Sasobit is the mean value of the second test results.
The summary of results obtained in bitumen testing is given in Table 19.
Table 19: Bitumen testing results Bitumen type Penetration
at 25oC Softening
point Dynamic
viscosity at 60oC
Kinematic viscosity at
135oC
Penetration Index, IP
Standard: EN 1426 EN 1427 EN12596 EN 12595 EN 12591
Unit: 1/10mm oC Pa s mm2/s -
Original bitumen 48.0 50.4 440.0 544.8 -1.2
3% Sasobit 32.6 78.8 2416.6 421.7 3.1
2% Sasobit 33.3 64.0 1147.7 467.8 0.8
2% Rediset WMX 37.3 52.2 551.5 477.5 -1.3
1% Rediset WMX 43.0 51.4 445.5 507.6 -1.2
The test results show the expected tendency of consistency reduction at high temperatures and increase at intermediate. As expected, the degree of viscosity changes depends on the amount of the additive in the bitumen. However while the results for Sasobit show considerable changes, addition of Rediset WMX has only minor effect on the bitumen characteristics. This can be explained with the different technologies of these additives. Sasobit has direct influence on the bitumen charecteristics depending on the crystalisation of the wax. Rediset WMX is a chemical additive and as stated in the producer’s description, the viscosity modification of bitumen is only one of the properties for this additive. Other charecteristics that are not represented in bitumen testing involve interraction of bitumen and aggregates by improving chemical adhesion between them. The assesment of these properties requires for testing of mixture.
The analysis of properties below the cogealing point of wax shows different tendencies for Sasobit. The results for penetration show that by introducing different dosages of Sasobit to the bitumen, the result drops significantly, but the reduction rate is similar to both additive amounts. However when the softening point and dynamic viscosity are analysed, there is a clear difference between the amounts of 2% and 3% Sasobit addition, where the highest amount of additive had much larger influence on the test results. This suggests that a higher dose of Sasobit is especially benefical to increasing the viscosity at temperatures that would be met at pavements on the hottest summer days. This explains the reported resistance to rut deformations of
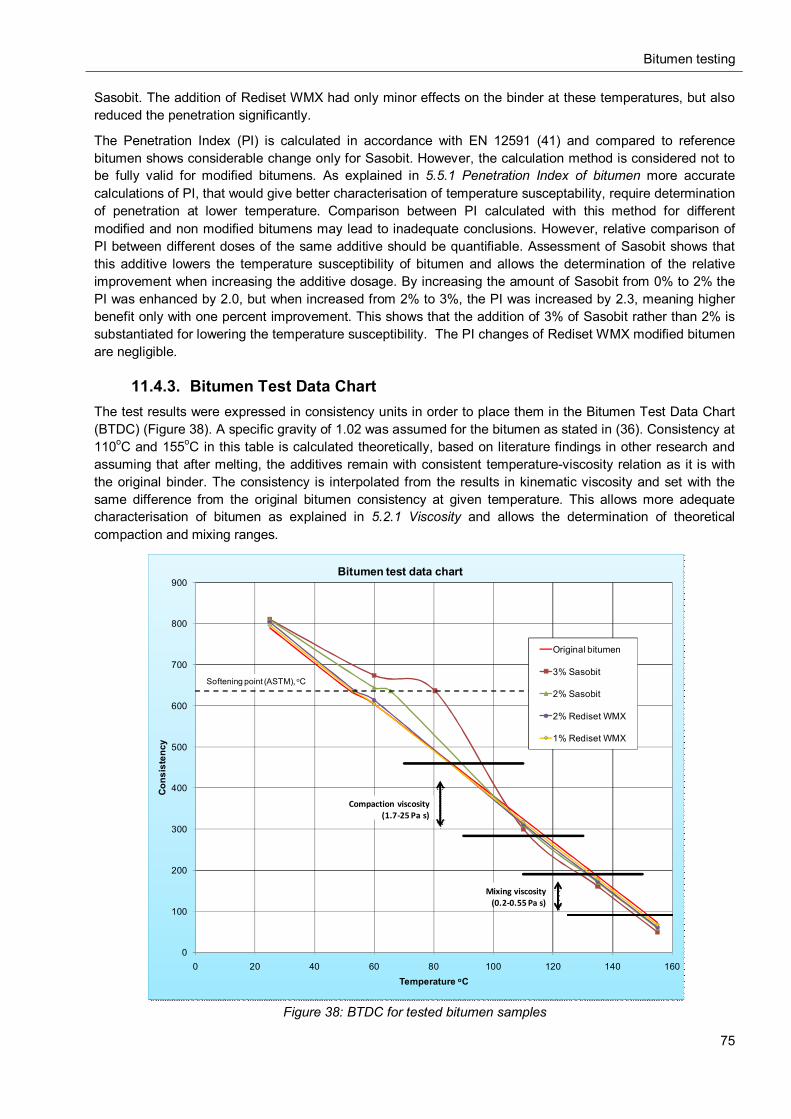
Bitumen testing
75
Sasobit. The addition of Rediset WMX had only minor effects on the binder at these temperatures, but also reduced the penetration significantly.
The Penetration Index (PI) is calculated in accordance with EN 12591 (41) and compared to reference bitumen shows considerable change only for Sasobit. However, the calculation method is considered not to be fully valid for modified bitumens. As explained in 5.5.1 Penetration Index of bitumen more accurate calculations of PI, that would give better characterisation of temperature susceptability, require determination of penetration at lower temperature. Comparison between PI calculated with this method for different modified and non modified bitumens may lead to inadequate conclusions. However, relative comparison of PI between different doses of the same additive should be quantifiable. Assessment of Sasobit shows that this additive lowers the temperature susceptibility of bitumen and allows the determination of the relative improvement when increasing the additive dosage. By increasing the amount of Sasobit from 0% to 2% the PI was enhanced by 2.0, but when increased from 2% to 3%, the PI was increased by 2.3, meaning higher benefit only with one percent improvement. This shows that the addition of 3% of Sasobit rather than 2% is substantiated for lowering the temperature susceptibility. The PI changes of Rediset WMX modified bitumen are negligible.
11.4.3. Bitumen Test Data Chart The test results were expressed in consistency units in order to place them in the Bitumen Test Data Chart (BTDC) (Figure 38). A specific gravity of 1.02 was assumed for the bitumen as stated in (36). Consistency at 110oC and 155oC in this table is calculated theoretically, based on literature findings in other research and assuming that after melting, the additives remain with consistent temperature-viscosity relation as it is with the original binder. The consistency is interpolated from the results in kinematic viscosity and set with the same difference from the original bitumen consistency at given temperature. This allows more adequate characterisation of bitumen as explained in 5.2.1 Viscosity and allows the determination of theoretical compaction and mixing ranges.
Figure 38: BTDC for tested bitumen samples
0
100
200
300
400
500
600
700
800
900
0 20 40 60 80 100 120 140 160
Cons
iste
ncy
Temperature oC
Bitumen test data chart
Original bitumen
3% Sasobit
2% Sasobit
2% Rediset WMX
1% Rediset WMX
Compaction viscosity (1.7-25 Pa s)
Mixing viscosity (0.2-0.55 Pa s)
Softening point (ASTM), oC
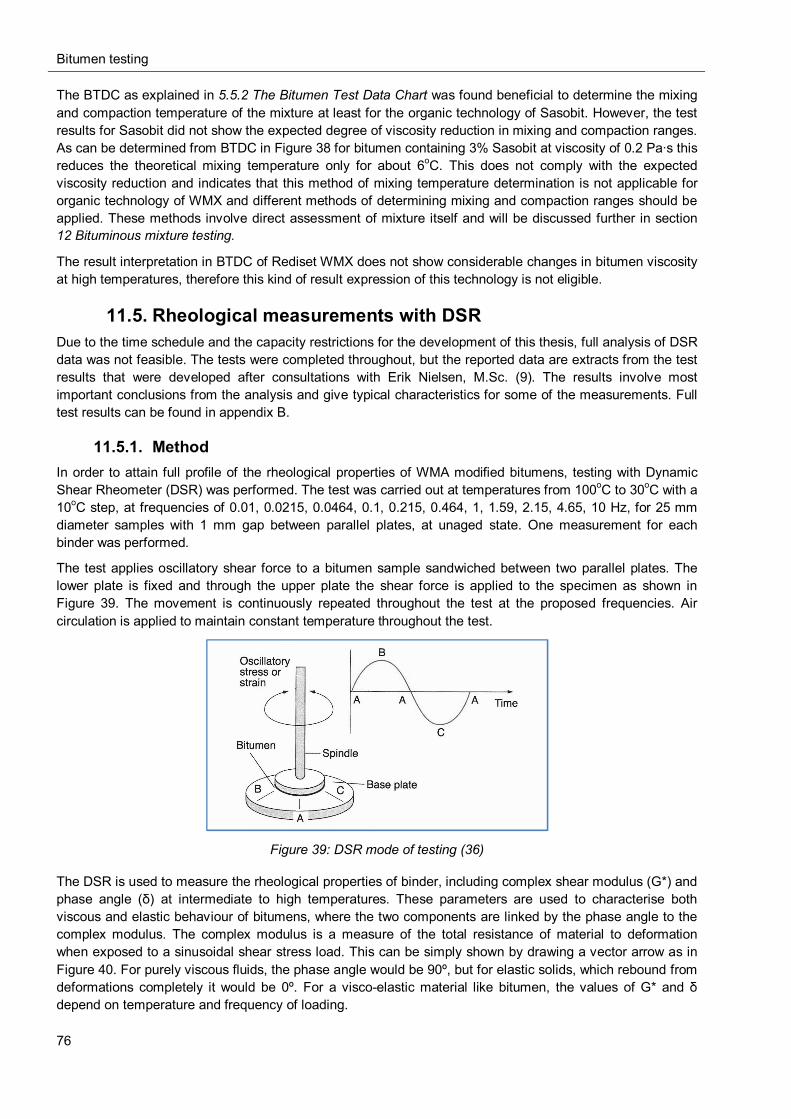
Bitumen testing
76
The BTDC as explained in 5.5.2 The Bitumen Test Data Chart was found beneficial to determine the mixing and compaction temperature of the mixture at least for the organic technology of Sasobit. However, the test results for Sasobit did not show the expected degree of viscosity reduction in mixing and compaction ranges. As can be determined from BTDC in Figure 38 for bitumen containing 3% Sasobit at viscosity of 0.2 Pa·s this reduces the theoretical mixing temperature only for about 6oC. This does not comply with the expected viscosity reduction and indicates that this method of mixing temperature determination is not applicable for organic technology of WMX and different methods of determining mixing and compaction ranges should be applied. These methods involve direct assessment of mixture itself and will be discussed further in section 12 Bituminous mixture testing.
The result interpretation in BTDC of Rediset WMX does not show considerable changes in bitumen viscosity at high temperatures, therefore this kind of result expression of this technology is not eligible.
11.5. Rheological measurements with DSR Due to the time schedule and the capacity restrictions for the development of this thesis, full analysis of DSR data was not feasible. The tests were completed throughout, but the reported data are extracts from the test results that were developed after consultations with Erik Nielsen, M.Sc. (9). The results involve most important conclusions from the analysis and give typical characteristics for some of the measurements. Full test results can be found in appendix B.
11.5.1. Method In order to attain full profile of the rheological properties of WMA modified bitumens, testing with Dynamic Shear Rheometer (DSR) was performed. The test was carried out at temperatures from 100oC to 30oC with a 10oC step, at frequencies of 0.01, 0.0215, 0.0464, 0.1, 0.215, 0.464, 1, 1.59, 2.15, 4.65, 10 Hz, for 25 mm diameter samples with 1 mm gap between parallel plates, at unaged state. One measurement for each binder was performed.
The test applies oscillatory shear force to a bitumen sample sandwiched between two parallel plates. The lower plate is fixed and through the upper plate the shear force is applied to the specimen as shown in Figure 39. The movement is continuously repeated throughout the test at the proposed frequencies. Air circulation is applied to maintain constant temperature throughout the test.
Figure 39: DSR mode of testing (36)
The DSR is used to measure the rheological properties of binder, including complex shear modulus (G*) and phase angle (δ) at intermediate to high temperatures. These parameters are used to characterise both viscous and elastic behaviour of bitumens, where the two components are linked by the phase angle to the complex modulus. The complex modulus is a measure of the total resistance of material to deformation when exposed to a sinusoidal shear stress load. This can be simply shown by drawing a vector arrow as in Figure 40. For purely viscous fluids, the phase angle would be 90º, but for elastic solids, which rebound from deformations completely it would be 0º. For a visco-elastic material like bitumen, the values of G* and δ depend on temperature and frequency of loading.
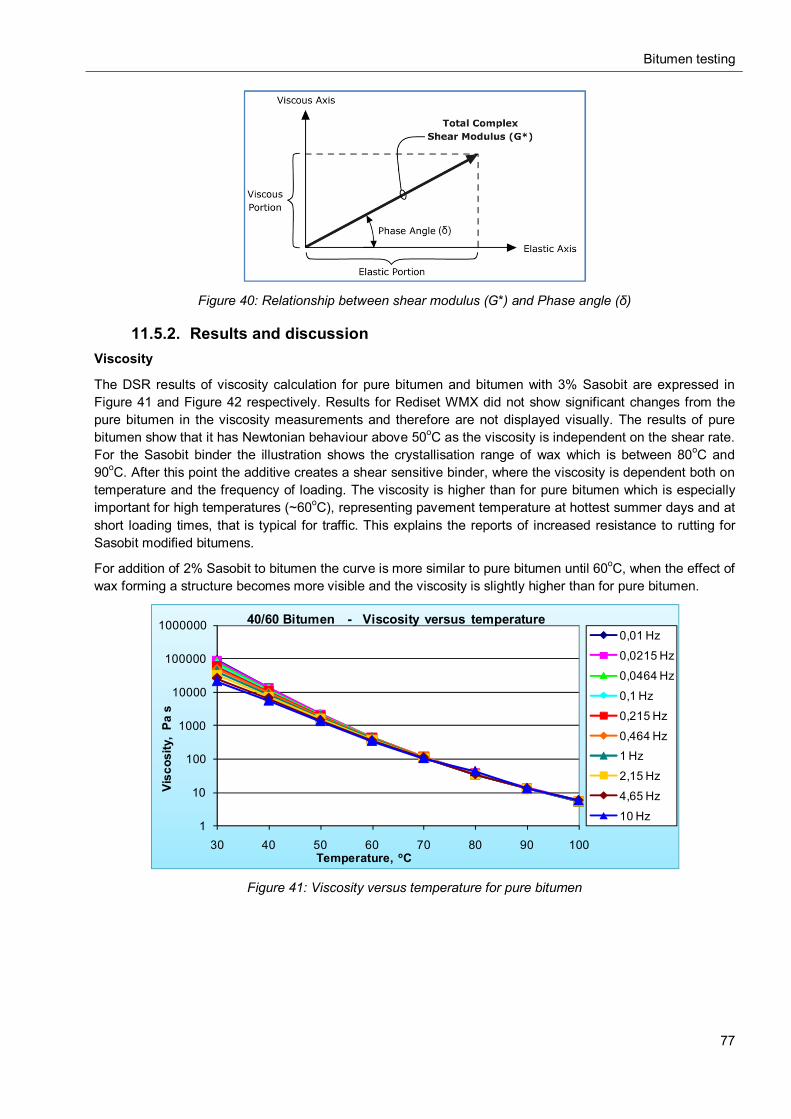
Bitumen testing
77
Figure 40: Relationship between shear modulus (G*) and Phase angle (δ)
11.5.2. Results and discussion Viscosity
The DSR results of viscosity calculation for pure bitumen and bitumen with 3% Sasobit are expressed in Figure 41 and Figure 42 respectively. Results for Rediset WMX did not show significant changes from the pure bitumen in the viscosity measurements and therefore are not displayed visually. The results of pure bitumen show that it has Newtonian behaviour above 50oC as the viscosity is independent on the shear rate. For the Sasobit binder the illustration shows the crystallisation range of wax which is between 80oC and 90oC. After this point the additive creates a shear sensitive binder, where the viscosity is dependent both on temperature and the frequency of loading. The viscosity is higher than for pure bitumen which is especially important for high temperatures (~60oC), representing pavement temperature at hottest summer days and at short loading times, that is typical for traffic. This explains the reports of increased resistance to rutting for Sasobit modified bitumens.
For addition of 2% Sasobit to bitumen the curve is more similar to pure bitumen until 60oC, when the effect of wax forming a structure becomes more visible and the viscosity is slightly higher than for pure bitumen.
Figure 41: Viscosity versus temperature for pure bitumen
1
10
100
1000
10000
100000
1000000
30 40 50 60 70 80 90 100
Visc
osity
,Pa
s
Temperature, oC
40/60 Bitumen - Viscosity versus temperature0,01 Hz
0,0215 Hz
0,0464 Hz
0,1 Hz
0,215 Hz
0,464 Hz1 Hz
2,15 Hz
4,65 Hz
10 Hz
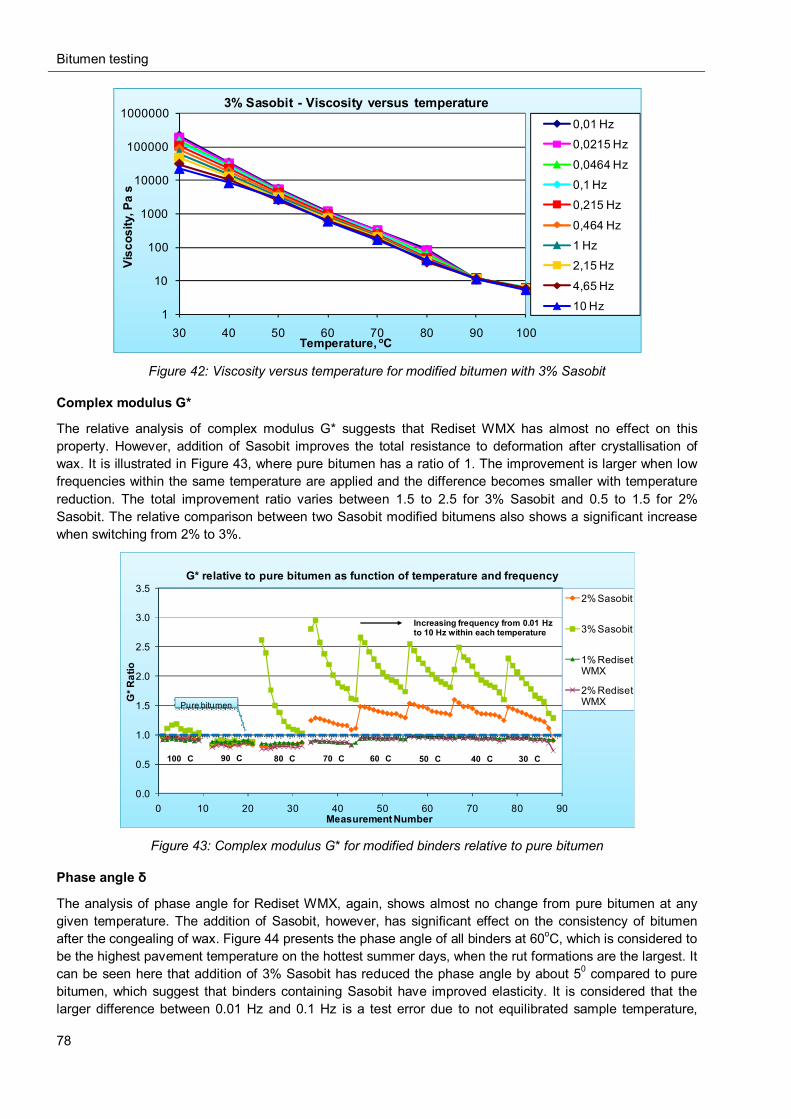
Bitumen testing
78
Figure 42: Viscosity versus temperature for modified bitumen with 3% Sasobit
Complex modulus G*
The relative analysis of complex modulus G* suggests that Rediset WMX has almost no effect on this property. However, addition of Sasobit improves the total resistance to deformation after crystallisation of wax. It is illustrated in Figure 43, where pure bitumen has a ratio of 1. The improvement is larger when low frequencies within the same temperature are applied and the difference becomes smaller with temperature reduction. The total improvement ratio varies between 1.5 to 2.5 for 3% Sasobit and 0.5 to 1.5 for 2% Sasobit. The relative comparison between two Sasobit modified bitumens also shows a significant increase when switching from 2% to 3%.
Figure 43: Complex modulus G* for modified binders relative to pure bitumen
Phase angle δ
The analysis of phase angle for Rediset WMX, again, shows almost no change from pure bitumen at any given temperature. The addition of Sasobit, however, has significant effect on the consistency of bitumen after the congealing of wax. Figure 44 presents the phase angle of all binders at 60oC, which is considered to be the highest pavement temperature on the hottest summer days, when the rut formations are the largest. It can be seen here that addition of 3% Sasobit has reduced the phase angle by about 50 compared to pure bitumen, which suggest that binders containing Sasobit have improved elasticity. It is considered that the larger difference between 0.01 Hz and 0.1 Hz is a test error due to not equilibrated sample temperature,
1
10
100
1000
10000
100000
1000000
30 40 50 60 70 80 90 100
Visc
osity
,Pa
s
Temperature, oC
3% Sasobit - Viscosity versus temperature0,01 Hz
0,0215 Hz
0,0464 Hz
0,1 Hz
0,215 Hz
0,464 Hz
1 Hz
2,15 Hz
4,65 Hz
10 Hz
0.0
0.5
1.0
1.5
2.0
2.5
3.0
3.5
0 10 20 30 40 50 60 70 80 90
G*R
atio
Measurement Number
G* relative to pure bitumen as function of temperature and frequency
2% Sasobit
3% Sasobit
1% Rediset WMX
2% Rediset WMX
100 C 90 C 80 C 70 C 60 C 50 C 40 C 30 C
Increasing frequency from 0.01 Hz to 10 Hz within each temperature
Pure bitumen
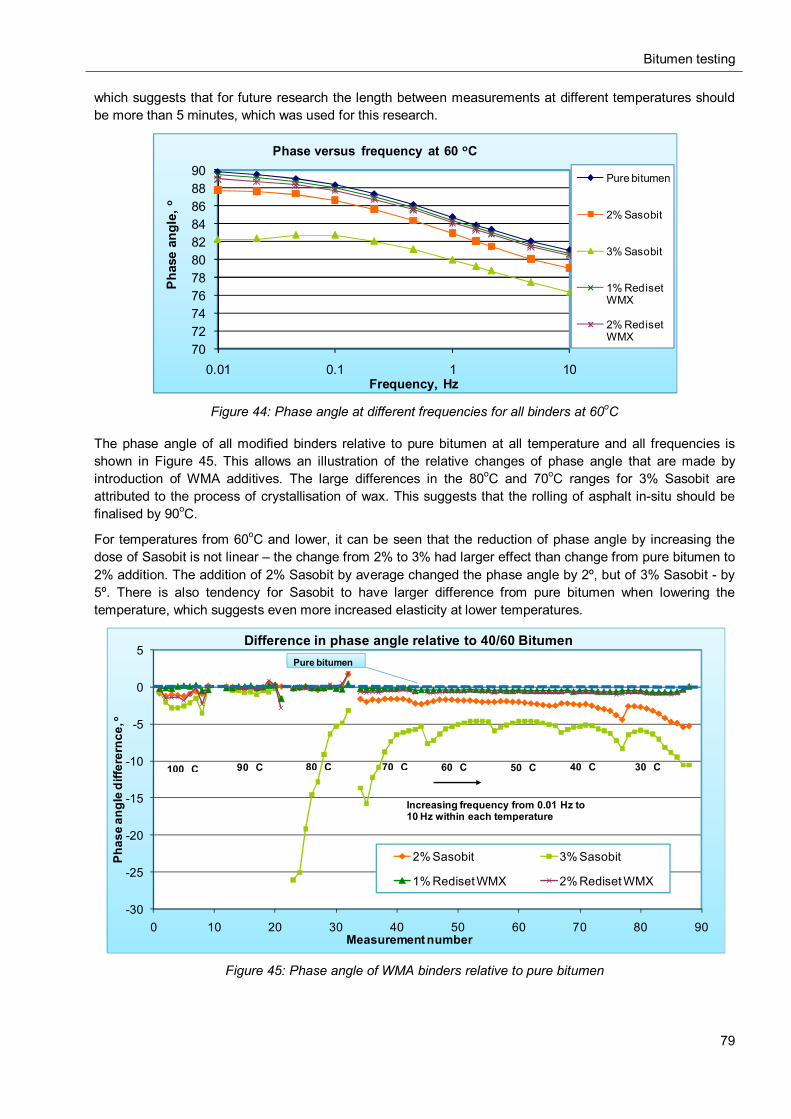
Bitumen testing
79
which suggests that for future research the length between measurements at different temperatures should be more than 5 minutes, which was used for this research.
Figure 44: Phase angle at different frequencies for all binders at 60oC
The phase angle of all modified binders relative to pure bitumen at all temperature and all frequencies is shown in Figure 45. This allows an illustration of the relative changes of phase angle that are made by introduction of WMA additives. The large differences in the 80oC and 70oC ranges for 3% Sasobit are attributed to the process of crystallisation of wax. This suggests that the rolling of asphalt in-situ should be finalised by 90oC.
For temperatures from 60oC and lower, it can be seen that the reduction of phase angle by increasing the dose of Sasobit is not linear – the change from 2% to 3% had larger effect than change from pure bitumen to 2% addition. The addition of 2% Sasobit by average changed the phase angle by 2º, but of 3% Sasobit - by 5º. There is also tendency for Sasobit to have larger difference from pure bitumen when lowering the temperature, which suggests even more increased elasticity at lower temperatures.
Figure 45: Phase angle of WMA binders relative to pure bitumen
7072747678808284868890
0.01 0.1 1 10
Phas
e an
gle,
o
Frequency, Hz
Phase versus frequency at 60 oC
Pure bitumen
2% Sasobit
3% Sasobit
1% Rediset WMX
2% Rediset WMX
-30
-25
-20
-15
-10
-5
0
5
0 10 20 30 40 50 60 70 80 90
Phas
e an
gle
diffe
rern
ce, o
Measurement number
Difference in phase angle relative to 40/60 Bitumen
2% Sasobit 3% Sasobit
1% Rediset WMX 2% Rediset WMX
Increasing frequency from 0.01 Hz to 10 Hz within each temperature
100 C 90 C 80 C 70 C 60 C 50 C 40 C 30 C
Pure bitumen
Bitumen testing
80
11.6. Conclusions and future research
11.6.1. Conclusions: Addition of Rediset WMX had almost no effect on the consistency of bitumen at any given
temperature. This suggests that this chemical additive changes the interaction between bitumen and aggregates rather than bitumen itself and therefore should be evaluated in this respect.
Addition of Sasobit significantly increases the bitumen viscosity below the crystallisation point of wax. This is especially important for temperatures of 50º to 60º meaning higher resistance to deformations of asphalt.
Addition of Sasobit increases the complex modulus and lowers the phase angle after crystallisation of wax at any given frequency and temperature (within frame of this research). This suggests better resistance to deformations as well as improved elasticity.
Changing the dosage of Sasobit from 2% to 3% gives a logarithmic increase in temperature susceptibility, viscosity and the measurements of phase angle and complex modulus.
Sasobit lowers the viscosity of bitumen after the melting of wax, however the decrease is not sufficient to determine the possible temperature reduction for asphalt mixture.
Bitumen Test Data Chart can be used to visually interpret the modification results by organic additives; however, deduction of mixing and compaction temperature for asphalt is not possible with this method.
11.6.2. Future research Further analysis of the effect of WMA additives on bitumen properties should involve:
Analysis of low temperature behaviour of modified bitumen. This is especially important to regions with cold winter climate and with wax additives, like Sasobit, as research reports increased brittleness at low temperatures,
Analysis of high temperature behaviour to show a possible connection between mixing and compaction temperatures and the modification of bitumen,
Analysis of modification for other types of bitumen, Analysis of other amounts of additives to establish the relative effect of modification. Closer comparison of standard specification test results and DSR measurements is
necessary to determine the relation between test results.
Bituminous mixture testing
81
12. BITUMINOUS MIXTURE TESTING This chapter presents the experimental results obtained in mixture testing which was performed according to experimental plan described in 12.2 Testing plan. The properties of Warm Mix Asphalt (WMA) mixtures with Sasobit and Rediset WMX additives are evaluated and compared to the properties of conventional Hot Mix Asphalt (HMA). Densification characteristics, stiffness modulus and resistance to permanent deformations are evaluated for uncured as well as cured WMA and HMA samples. The optimum mixing and compaction temperature and properties of curing are also discussed.
Preparation of samples and testing were performed according to respective EN standards, but some deviations from standard methods occur that are connected to an insufficient amount of test samples for statistically valid test results.
The complete test results are reported in Appendix C.
12.1. Objective The proposed research was carried out to accomplish the following objectives:
Determination of importance of curing and differences in curing between reference mixture and WMA;
Determination of the optimum mixing and compaction temperature for each of the WMA additives;
Examination of the differences in test results between samples that are prepared with Marshall hammer and gyratory compactor;
Study of the performance of WMA and comparison to HMA in terms of densification characteristics, stiffness, and permanent deformations.
12.2. Testing plan In order to accomplish these tasks, a test plan was designed (Figure 46) and the evaluation was performed in five stages (M for Mixture):
Stage M1: Mixture composition is defined. Three type of mixtures are produced in the laboratory: a. Reference mixture, b. Mixture with 3% of Sasobit, c. Mixture with 2% of Rediset WMX,
Stage M2: The primary compaction temperature is defined for each mixture. The compaction temperature of 155oC is defined for the reference mixture according to EN 12697-35 (83) for bitumen 40/60 and additionally the temperature of 135oC is applied. Compaction temperatures of 115oC, 125oC, and 135oC is defined for the modified mixture. Three different mixtures are prepared of mixtures of reference HMA and WMA:
a. one with no curing, b. one with 2 hour curing at compaction temperature, c. one with 4 hour curing at compaction temperature,
Stage M3: Compaction is performed for test samples a. one sample with the Gyratory compactor, b. two samples with the Marshall hammer.
Stage M4: Testing is performed for: a. bulk density, b. stiffness modulus, c. dynamic creep test (with cyclic loading), d. Marshall test.
After determining the stiffness modulus for samples from the gyratory compactor, the necessary curing time is defined and compaction for the other WMA mixtures at 115oC and 125oC is performed after at curing the
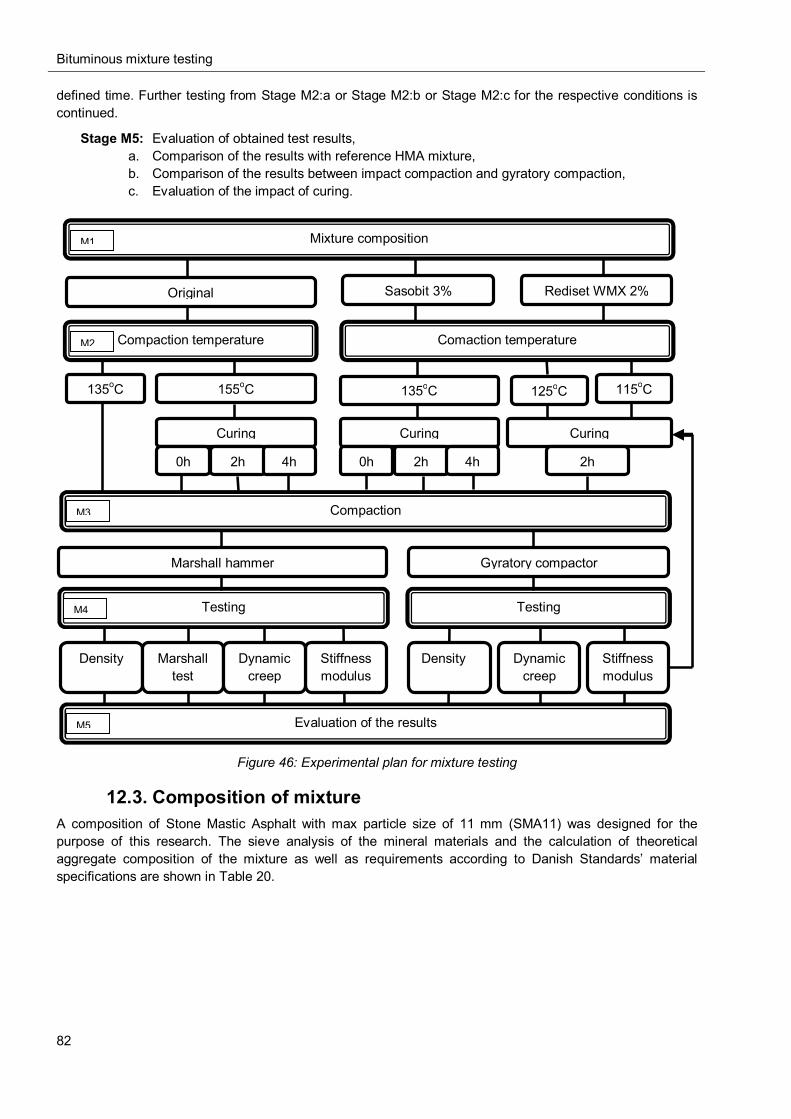
Bituminous mixture testing
82
defined time. Further testing from Stage M2:a or Stage M2:b or Stage M2:c for the respective conditions is continued.
Stage M5: Evaluation of obtained test results, a. Comparison of the results with reference HMA mixture, b. Comparison of the results between impact compaction and gyratory compaction, c. Evaluation of the impact of curing.
Figure 46: Experimental plan for mixture testing
12.3. Composition of mixture A composition of Stone Mastic Asphalt with max particle size of 11 mm (SMA11) was designed for the purpose of this research. The sieve analysis of the mineral materials and the calculation of theoretical aggregate composition of the mixture as well as requirements according to Danish Standards’ material specifications are shown in Table 20.
Compaction
Gyratory compactor
Testing
Dynamic creep
Stiffness modulus
Density
Marshall hammer
Testing
Stiffness modulus
Density Marshall test
Dynamic creep
Evaluation of the results
Original
135oC
Mixture composition
Curing
Compaction temperature
155oC
0h 2h 4h
Sasobit 3% Rediset WMX 2%
115oC
Comaction temperature
125oC
Curing Curing
135oC
2h 0h 2h 4h
M1
M3
M4
M5
M2
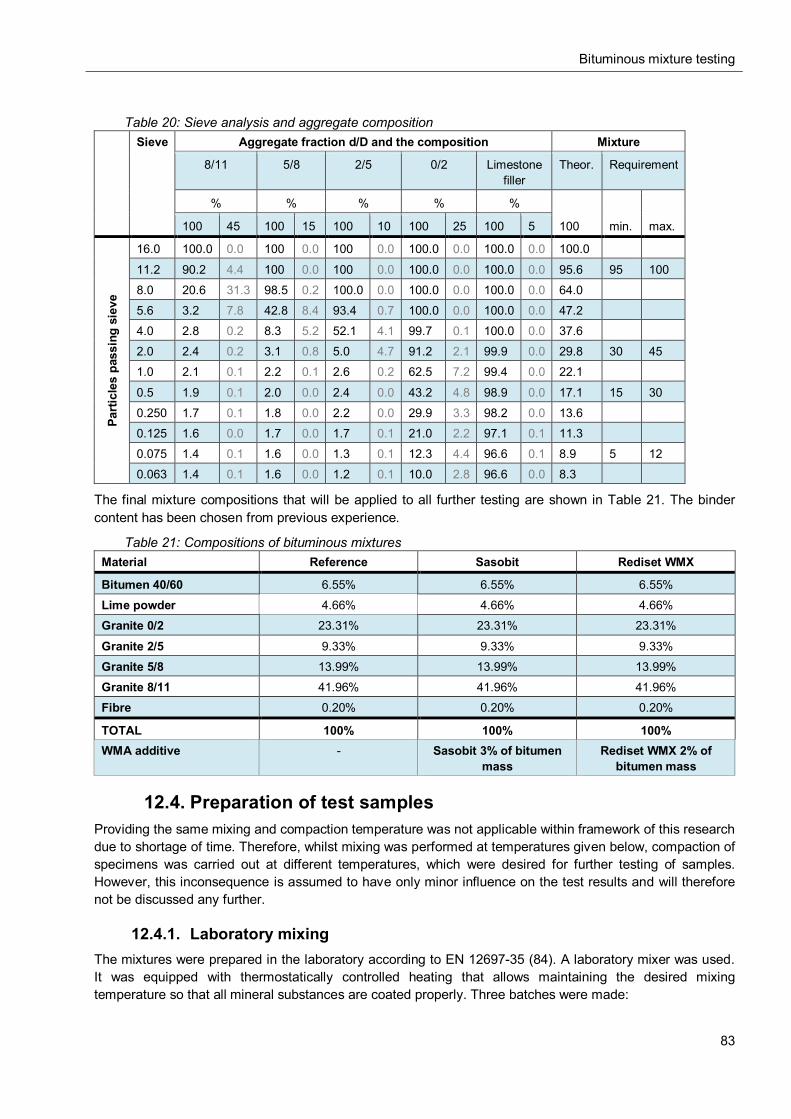
Bituminous mixture testing
83
Table 20: Sieve analysis and aggregate composition Sieve Aggregate fraction d/D and the composition Mixture
8/11 5/8 2/5 0/2 Limestone filler
Theor. Requirement
% % % % %
100 min. max. 100 45 100 15 100 10 100 25 100 5
Part
icle
s pa
ssin
g si
eve
16.0 100.0 0.0 100 0.0 100 0.0 100.0 0.0 100.0 0.0 100.0
11.2 90.2 4.4 100 0.0 100 0.0 100.0 0.0 100.0 0.0 95.6 95 100
8.0 20.6 31.3 98.5 0.2 100.0 0.0 100.0 0.0 100.0 0.0 64.0
5.6 3.2 7.8 42.8 8.4 93.4 0.7 100.0 0.0 100.0 0.0 47.2
4.0 2.8 0.2 8.3 5.2 52.1 4.1 99.7 0.1 100.0 0.0 37.6
2.0 2.4 0.2 3.1 0.8 5.0 4.7 91.2 2.1 99.9 0.0 29.8 30 45
1.0 2.1 0.1 2.2 0.1 2.6 0.2 62.5 7.2 99.4 0.0 22.1
0.5 1.9 0.1 2.0 0.0 2.4 0.0 43.2 4.8 98.9 0.0 17.1 15 30
0.250 1.7 0.1 1.8 0.0 2.2 0.0 29.9 3.3 98.2 0.0 13.6
0.125 1.6 0.0 1.7 0.0 1.7 0.1 21.0 2.2 97.1 0.1 11.3
0.075 1.4 0.1 1.6 0.0 1.3 0.1 12.3 4.4 96.6 0.1 8.9 5 12
0.063 1.4 0.1 1.6 0.0 1.2 0.1 10.0 2.8 96.6 0.0 8.3
The final mixture compositions that will be applied to all further testing are shown in Table 21. The binder content has been chosen from previous experience.
Table 21: Compositions of bituminous mixtures Material Reference Sasobit Rediset WMX
Bitumen 40/60 6.55% 6.55% 6.55%
Lime powder 4.66% 4.66% 4.66%
Granite 0/2 23.31% 23.31% 23.31%
Granite 2/5 9.33% 9.33% 9.33%
Granite 5/8 13.99% 13.99% 13.99%
Granite 8/11 41.96% 41.96% 41.96%
Fibre 0.20% 0.20% 0.20%
TOTAL 100% 100% 100% WMA additive - Sasobit 3% of bitumen
mass Rediset WMX 2% of
bitumen mass
12.4. Preparation of test samples Providing the same mixing and compaction temperature was not applicable within framework of this research due to shortage of time. Therefore, whilst mixing was performed at temperatures given below, compaction of specimens was carried out at different temperatures, which were desired for further testing of samples. However, this inconsequence is assumed to have only minor influence on the test results and will therefore not be discussed any further.
12.4.1. Laboratory mixing The mixtures were prepared in the laboratory according to EN 12697-35 (84). A laboratory mixer was used. It was equipped with thermostatically controlled heating that allows maintaining the desired mixing temperature so that all mineral substances are coated properly. Three batches were made:
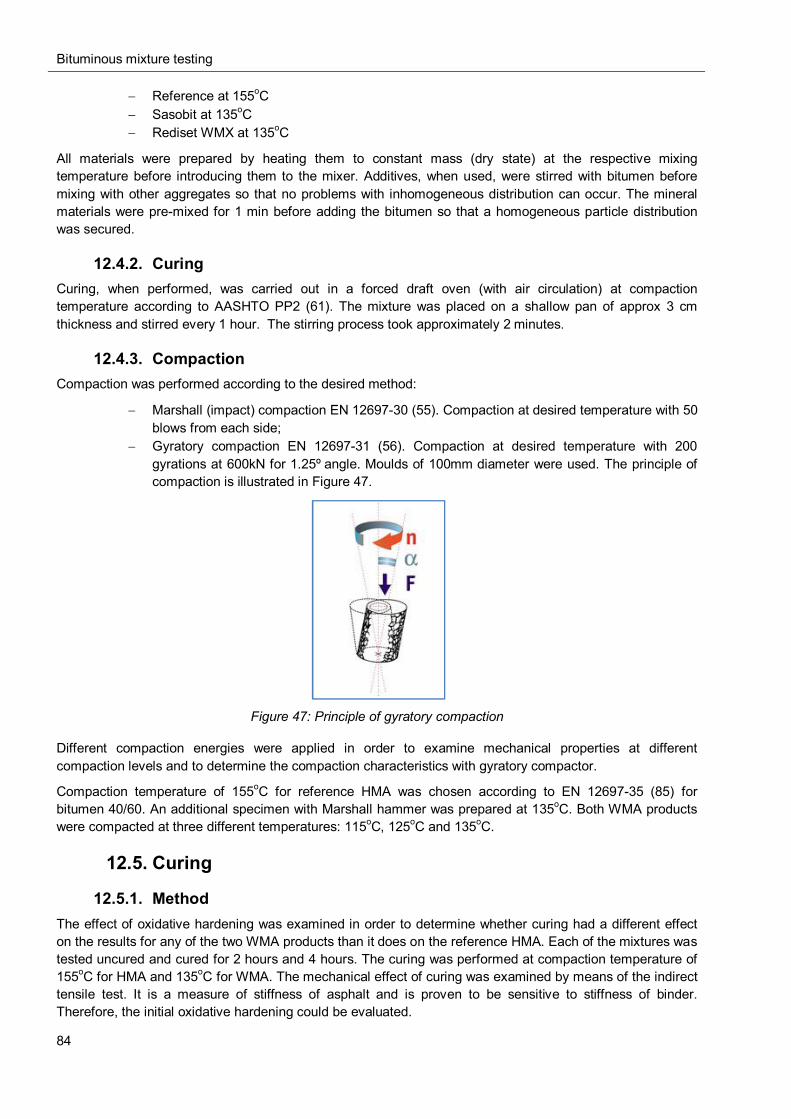
Bituminous mixture testing
84
Reference at 155oC Sasobit at 135oC Rediset WMX at 135oC
All materials were prepared by heating them to constant mass (dry state) at the respective mixing temperature before introducing them to the mixer. Additives, when used, were stirred with bitumen before mixing with other aggregates so that no problems with inhomogeneous distribution can occur. The mineral materials were pre-mixed for 1 min before adding the bitumen so that a homogeneous particle distribution was secured.
12.4.2. Curing Curing, when performed, was carried out in a forced draft oven (with air circulation) at compaction temperature according to AASHTO PP2 (61). The mixture was placed on a shallow pan of approx 3 cm thickness and stirred every 1 hour. The stirring process took approximately 2 minutes.
12.4.3. Compaction Compaction was performed according to the desired method:
Marshall (impact) compaction EN 12697-30 (55). Compaction at desired temperature with 50 blows from each side;
Gyratory compaction EN 12697-31 (56). Compaction at desired temperature with 200 gyrations at 600kN for 1.25º angle. Moulds of 100mm diameter were used. The principle of compaction is illustrated in Figure 47.
Figure 47: Principle of gyratory compaction
Different compaction energies were applied in order to examine mechanical properties at different compaction levels and to determine the compaction characteristics with gyratory compactor.
Compaction temperature of 155oC for reference HMA was chosen according to EN 12697-35 (85) for bitumen 40/60. An additional specimen with Marshall hammer was prepared at 135oC. Both WMA products were compacted at three different temperatures: 115oC, 125oC and 135oC.
12.5. Curing
12.5.1. Method The effect of oxidative hardening was examined in order to determine whether curing had a different effect on the results for any of the two WMA products than it does on the reference HMA. Each of the mixtures was tested uncured and cured for 2 hours and 4 hours. The curing was performed at compaction temperature of 155oC for HMA and 135oC for WMA. The mechanical effect of curing was examined by means of the indirect tensile test. It is a measure of stiffness of asphalt and is proven to be sensitive to stiffness of binder. Therefore, the initial oxidative hardening could be evaluated.
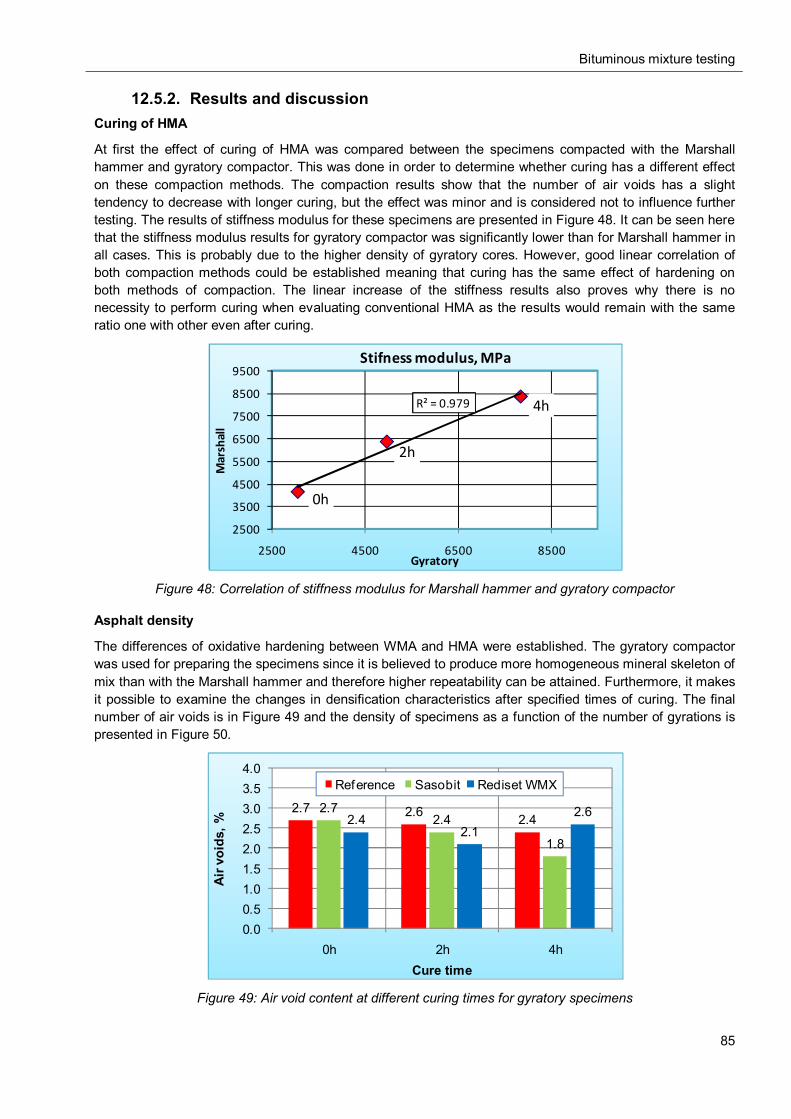
Bituminous mixture testing
85
12.5.2. Results and discussion Curing of HMA
At first the effect of curing of HMA was compared between the specimens compacted with the Marshall hammer and gyratory compactor. This was done in order to determine whether curing has a different effect on these compaction methods. The compaction results show that the number of air voids has a slight tendency to decrease with longer curing, but the effect was minor and is considered not to influence further testing. The results of stiffness modulus for these specimens are presented in Figure 48. It can be seen here that the stiffness modulus results for gyratory compactor was significantly lower than for Marshall hammer in all cases. This is probably due to the higher density of gyratory cores. However, good linear correlation of both compaction methods could be established meaning that curing has the same effect of hardening on both methods of compaction. The linear increase of the stiffness results also proves why there is no necessity to perform curing when evaluating conventional HMA as the results would remain with the same ratio one with other even after curing.
Figure 48: Correlation of stiffness modulus for Marshall hammer and gyratory compactor
Asphalt density
The differences of oxidative hardening between WMA and HMA were established. The gyratory compactor was used for preparing the specimens since it is believed to produce more homogeneous mineral skeleton of mix than with the Marshall hammer and therefore higher repeatability can be attained. Furthermore, it makes it possible to examine the changes in densification characteristics after specified times of curing. The final number of air voids is in Figure 49 and the density of specimens as a function of the number of gyrations is presented in Figure 50.
Figure 49: Air void content at different curing times for gyratory specimens
0h
2h
4hR² = 0.979
2500
3500
4500
5500
6500
7500
8500
9500
2500 4500 6500 8500
Mar
shal
l
Gyratory
Stifness modulus, MPa
2.7 2.6 2.42.7
2.4
1.8
2.42.1
2.6
0.00.51.01.52.02.53.03.54.0
0h 2h 4h
Air v
oids
, %
Cure time
Reference Sasobit Rediset WMX
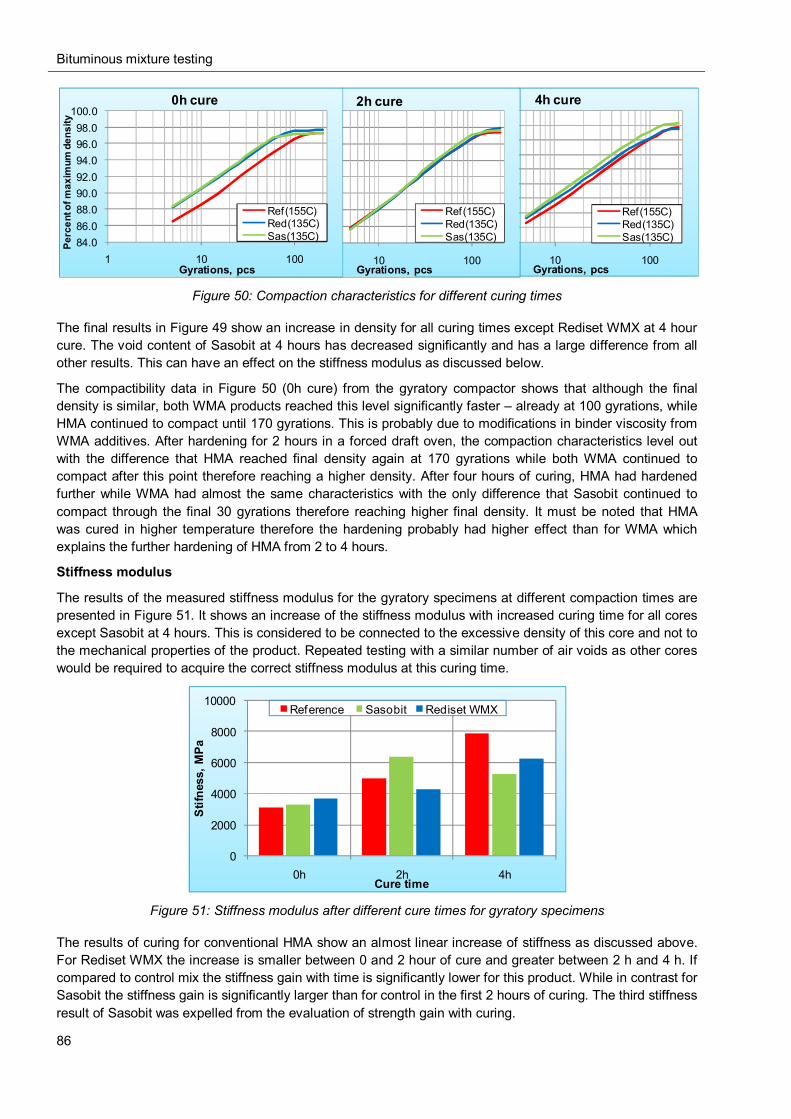
Bituminous mixture testing
86
Figure 50: Compaction characteristics for different curing times
The final results in Figure 49 show an increase in density for all curing times except Rediset WMX at 4 hour cure. The void content of Sasobit at 4 hours has decreased significantly and has a large difference from all other results. This can have an effect on the stiffness modulus as discussed below.
The compactibility data in Figure 50 (0h cure) from the gyratory compactor shows that although the final density is similar, both WMA products reached this level significantly faster – already at 100 gyrations, while HMA continued to compact until 170 gyrations. This is probably due to modifications in binder viscosity from WMA additives. After hardening for 2 hours in a forced draft oven, the compaction characteristics level out with the difference that HMA reached final density again at 170 gyrations while both WMA continued to compact after this point therefore reaching a higher density. After four hours of curing, HMA had hardened further while WMA had almost the same characteristics with the only difference that Sasobit continued to compact through the final 30 gyrations therefore reaching higher final density. It must be noted that HMA was cured in higher temperature therefore the hardening probably had higher effect than for WMA which explains the further hardening of HMA from 2 to 4 hours.
Stiffness modulus
The results of the measured stiffness modulus for the gyratory specimens at different compaction times are presented in Figure 51. It shows an increase of the stiffness modulus with increased curing time for all cores except Sasobit at 4 hours. This is considered to be connected to the excessive density of this core and not to the mechanical properties of the product. Repeated testing with a similar number of air voids as other cores would be required to acquire the correct stiffness modulus at this curing time.
Figure 51: Stiffness modulus after different cure times for gyratory specimens
The results of curing for conventional HMA show an almost linear increase of stiffness as discussed above. For Rediset WMX the increase is smaller between 0 and 2 hour of cure and greater between 2 h and 4 h. If compared to control mix the stiffness gain with time is significantly lower for this product. While in contrast for Sasobit the stiffness gain is significantly larger than for control in the first 2 hours of curing. The third stiffness result of Sasobit was expelled from the evaluation of strength gain with curing.
82.084.086.088.090.092.094.096.098.0
100.0
1 10 100
Per
cent
of m
axim
um
dens
ity
Gyrations, pcs
4h cure
Ref(155C)Red(135C)Sas(135C)84.0
86.088.090.092.094.096.098.0
100.0
1 10 100P
erce
nt o
f max
imum
de
nsity
Gyrations, pcs
2h cure
Ref(155C)Red(135C)Sas(135C)84.0
86.088.090.092.094.096.098.0
100.0
1 10 100
Perc
ent o
f max
imum
den
sity
Gyrations, pcs
0h cure
Ref(155C)Red(135C)Sas(135C)
0
2000
4000
6000
8000
10000
0h 2h 4h
Stif
ness
, MPa
Cure time
Reference Sasobit Rediset WMX
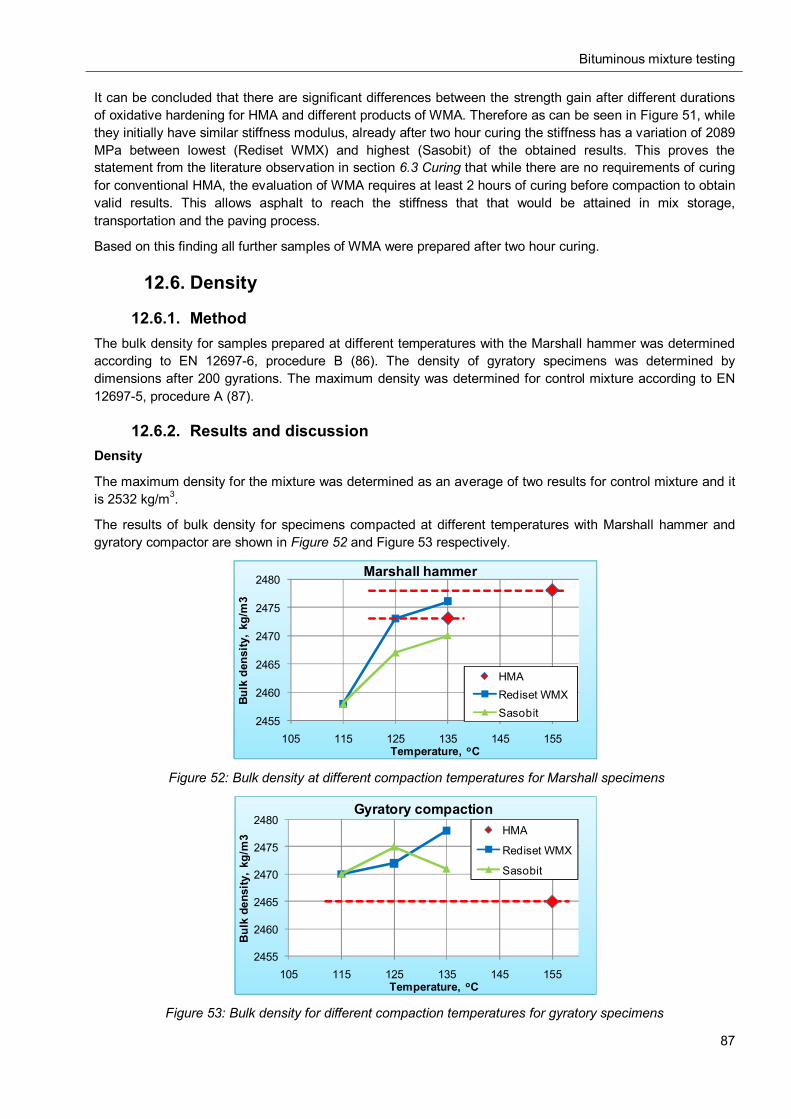
Bituminous mixture testing
87
It can be concluded that there are significant differences between the strength gain after different durations of oxidative hardening for HMA and different products of WMA. Therefore as can be seen in Figure 51, while they initially have similar stiffness modulus, already after two hour curing the stiffness has a variation of 2089 MPa between lowest (Rediset WMX) and highest (Sasobit) of the obtained results. This proves the statement from the literature observation in section 6.3 Curing that while there are no requirements of curing for conventional HMA, the evaluation of WMA requires at least 2 hours of curing before compaction to obtain valid results. This allows asphalt to reach the stiffness that that would be attained in mix storage, transportation and the paving process.
Based on this finding all further samples of WMA were prepared after two hour curing.
12.6. Density
12.6.1. Method The bulk density for samples prepared at different temperatures with the Marshall hammer was determined according to EN 12697-6, procedure B (86). The density of gyratory specimens was determined by dimensions after 200 gyrations. The maximum density was determined for control mixture according to EN 12697-5, procedure A (87).
12.6.2. Results and discussion Density
The maximum density for the mixture was determined as an average of two results for control mixture and it is 2532 kg/m3.
The results of bulk density for specimens compacted at different temperatures with Marshall hammer and gyratory compactor are shown in Figure 52 and Figure 53 respectively.
Figure 52: Bulk density at different compaction temperatures for Marshall specimens
Figure 53: Bulk density for different compaction temperatures for gyratory specimens
2455
2460
2465
2470
2475
2480
105 115 125 135 145 155
Bulk
dens
ity,
kg/m
3
Temperature, oC
Marshall hammer
HMARediset WMXSasobit
2455
2460
2465
2470
2475
2480
105 115 125 135 145 155
Bul
kde
nsity
, kg
/m3
Temperature, oC
Gyratory compactionHMA
Rediset WMX
Sasobit

Bituminous mixture testing
88
As explained in section 7.2.3 Production and compaction temperature, the comparison between bulk density of HMA at reference temperature and WMA technology at different temperatures can be a way to determine the optimum compaction temperature for the specific technology.
The results between the compaction methods do not correlate which is probably due to different compaction energies used. The density of the reference HMA at 155oC for gyratory specimens was lower than for WMA whilst for Marshall specimens it was higher in all cases. This can be explained with the lower viscosity of binder, which allows further densification when continuing to apply compaction force. The temperature sensitivity of each compaction method could be another explanation. Whilst the Marshall hammer historically is proven to be very sensitive, the gyratory compactor is speculated to be insensitive to temperature changes (44). However, it must be noted that numerically the difference between all of the WMA specimens and HMA, except Marshall at 115oC, is minor and the cores can be attributed to have almost the same density. The small variety in results also explains the decrease in Sasobit density after raising the temperature from 125oC to 135oC, as it can be attributed to statistical error in test method.
It must be noted that the compaction method itself can be important regarding this research, as it is considered to be especially important for SMA asphalts to simulate the actual field compaction. The final density and mechanical characteristics for this type of asphalt depends on the aggregate orientation and the interlocking of the mineral skeleton and gyratory movements allow particles to reorientate themselves thus reproducing the actual in-situ compaction more adequately than by impact compaction of Marshall method.
It must also be noted that in actual field compaction, a temperature of 155oC is considered to be very high and usually compaction takes place at lower temperatures. Therefore, it can be concluded that the compaction temperature can be reduced to at least 125oC if not to 115oC without losing the compactibility and similar density can be achieved with the same compaction effort.
Densification characteristics
The gyratory compactor allows an illustration of how the density of the asphalt mixture increases with increasing number of gyrations. The compaction in percent of maximum density for both WMA products and the control mix at different temperatures is illustrated in Figure 54. All specimens in this case were compacted after 2 hour of curing.
At first it was verified, how the volumetric characteristics of mixtures comply with the requirements of the Superpave mix design system. It requires to verify three different compaction levels – Ninitial, Ndesired and Nmax. Ensuring that the density at these compaction forces does not exceed the Superpave requirements makes it possible to design mixtures that do not exhibit classic tender mix behaviour and do not compact to dangerously low air void contents under traffic action (77). The necessary compaction parameters at these levels depend on the transport intensity of the road. It was assumed that the highest intensity (>30 ESALs) would be applied to the section with the tested mixture, so compaction parameters at 9, 125 and 205 (reduced to 200 at this study) gyrations are required. The results that are listed in Table 22 show that the density at designed compactive effort is higher than the required for 1.1% for the Reference mix and for 1.4% by average for WMA. The initial and maximum compaction levels are within the necessary range. This means that no excessive hardening will occur at traffic much greater than the designed.
Table 22: Number of air voids at different gyratory compactive efforts
Mix type: Superpave requirement
Reference Sasobit Rediset WMX
Temperature, oC: Depending on bitumen type
155oC 135 oC 125 oC 115 oC 135 oC 125 oC 115 oC
Ninitial (9), % of max ≤89.0 87.4 87.3 86.7 88.2 87.3 87.4 88.9 Ndesign (125), % of max 96.0 97.1 97.5 97.2 97.4 97.3 97.4 97.4
Nmax (200), % of max ≤98 97.4 97.6 97.7 97.5 97.9 97.6 97.5
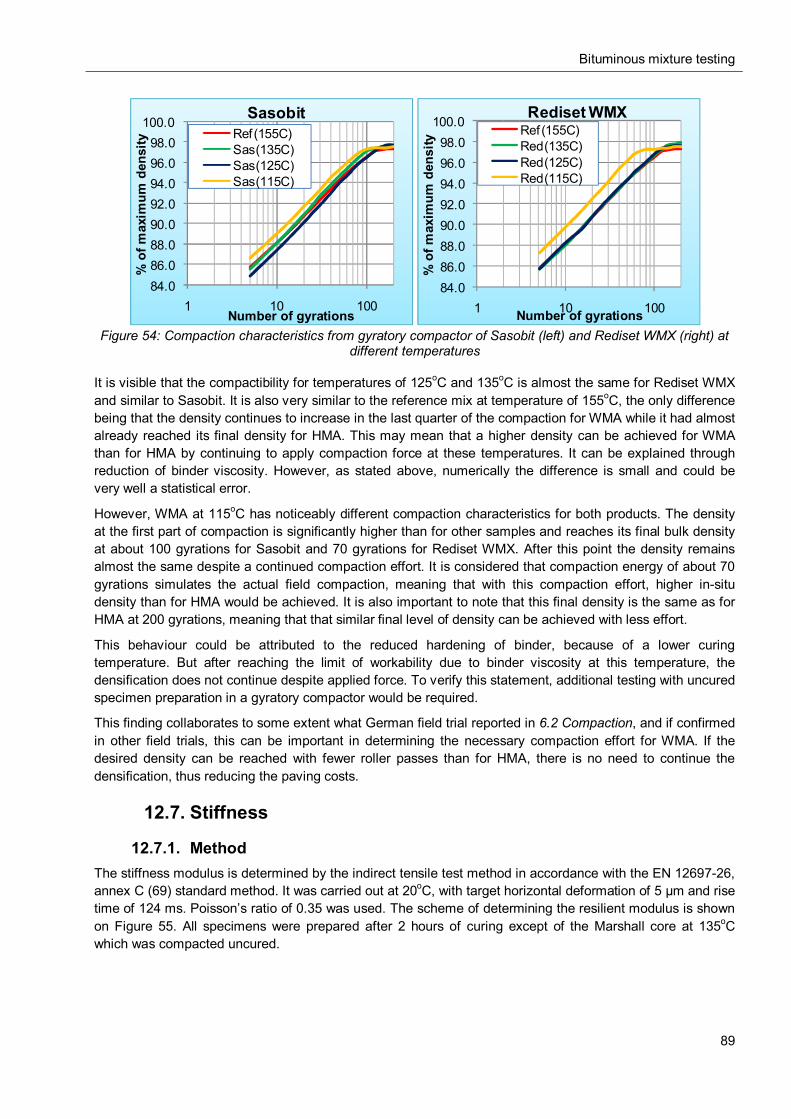
Bituminous mixture testing
89
Figure 54: Compaction characteristics from gyratory compactor of Sasobit (left) and Rediset WMX (right) at different temperatures
It is visible that the compactibility for temperatures of 125oC and 135oC is almost the same for Rediset WMX and similar to Sasobit. It is also very similar to the reference mix at temperature of 155oC, the only difference being that the density continues to increase in the last quarter of the compaction for WMA while it had almost already reached its final density for HMA. This may mean that a higher density can be achieved for WMA than for HMA by continuing to apply compaction force at these temperatures. It can be explained through reduction of binder viscosity. However, as stated above, numerically the difference is small and could be very well a statistical error.
However, WMA at 115oC has noticeably different compaction characteristics for both products. The density at the first part of compaction is significantly higher than for other samples and reaches its final bulk density at about 100 gyrations for Sasobit and 70 gyrations for Rediset WMX. After this point the density remains almost the same despite a continued compaction effort. It is considered that compaction energy of about 70 gyrations simulates the actual field compaction, meaning that with this compaction effort, higher in-situ density than for HMA would be achieved. It is also important to note that this final density is the same as for HMA at 200 gyrations, meaning that that similar final level of density can be achieved with less effort.
This behaviour could be attributed to the reduced hardening of binder, because of a lower curing temperature. But after reaching the limit of workability due to binder viscosity at this temperature, the densification does not continue despite applied force. To verify this statement, additional testing with uncured specimen preparation in a gyratory compactor would be required.
This finding collaborates to some extent what German field trial reported in 6.2 Compaction, and if confirmed in other field trials, this can be important in determining the necessary compaction effort for WMA. If the desired density can be reached with fewer roller passes than for HMA, there is no need to continue the densification, thus reducing the paving costs.
12.7. Stiffness
12.7.1. Method The stiffness modulus is determined by the indirect tensile test method in accordance with the EN 12697-26, annex C (69) standard method. It was carried out at 20oC, with target horizontal deformation of 5 µm and rise time of 124 ms. Poisson’s ratio of 0.35 was used. The scheme of determining the resilient modulus is shown on Figure 55. All specimens were prepared after 2 hours of curing except of the Marshall core at 135oC which was compacted uncured.
84.086.088.090.092.094.096.098.0
100.0
1 10 100
% o
f max
imum
den
sity
Number of gyrations
SasobitRef(155C)Sas(135C)Sas(125C)Sas(115C)
84.086.088.090.092.094.096.098.0
100.0
1 10 100
% o
f max
imum
den
sity
Number of gyrations
Rediset WMXRef(155C)Red(135C)Red(125C)Red(115C)
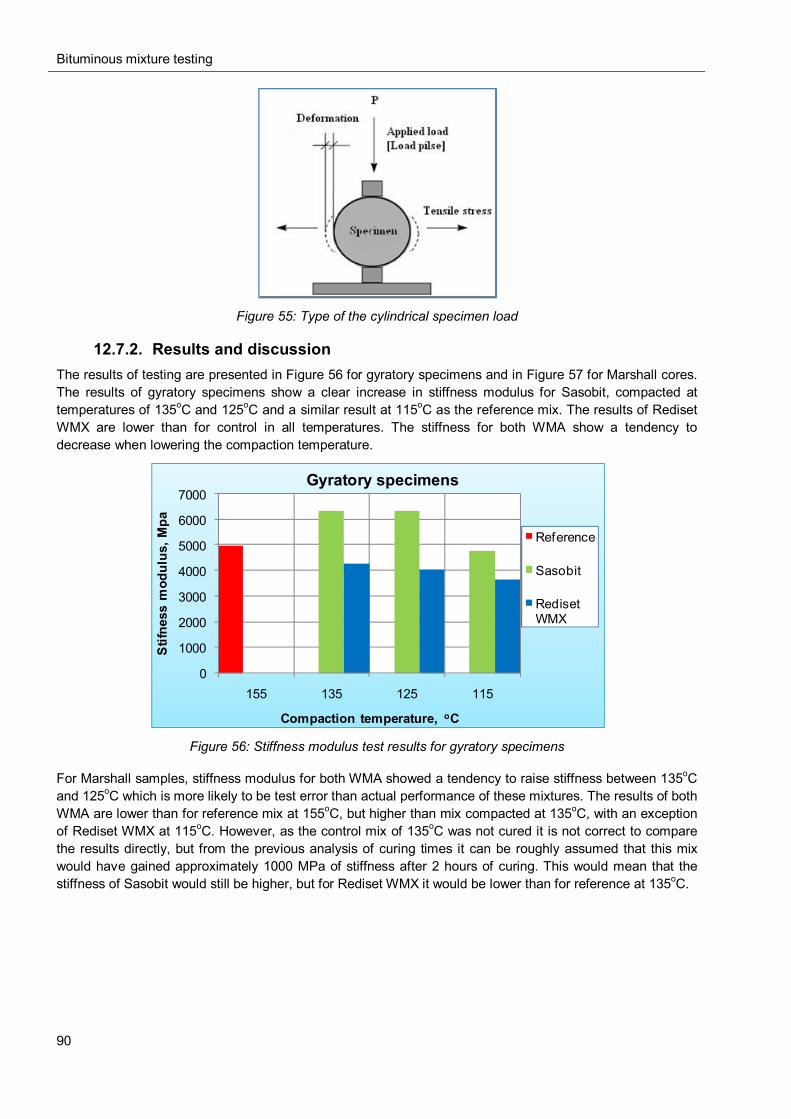
Bituminous mixture testing
90
Figure 55: Type of the cylindrical specimen load
12.7.2. Results and discussion The results of testing are presented in Figure 56 for gyratory specimens and in Figure 57 for Marshall cores. The results of gyratory specimens show a clear increase in stiffness modulus for Sasobit, compacted at temperatures of 135oC and 125oC and a similar result at 115oC as the reference mix. The results of Rediset WMX are lower than for control in all temperatures. The stiffness for both WMA show a tendency to decrease when lowering the compaction temperature.
Figure 56: Stiffness modulus test results for gyratory specimens
For Marshall samples, stiffness modulus for both WMA showed a tendency to raise stiffness between 135oC and 125oC which is more likely to be test error than actual performance of these mixtures. The results of both WMA are lower than for reference mix at 155oC, but higher than mix compacted at 135oC, with an exception of Rediset WMX at 115oC. However, as the control mix of 135oC was not cured it is not correct to compare the results directly, but from the previous analysis of curing times it can be roughly assumed that this mix would have gained approximately 1000 MPa of stiffness after 2 hours of curing. This would mean that the stiffness of Sasobit would still be higher, but for Rediset WMX it would be lower than for reference at 135oC.
0
1000
2000
3000
4000
5000
6000
7000
155 135 125 115
Stif
ness
mod
ulus
, Mpa
Compaction temperature, oC
Gyratory specimens
Reference
Sasobit
Rediset WMX
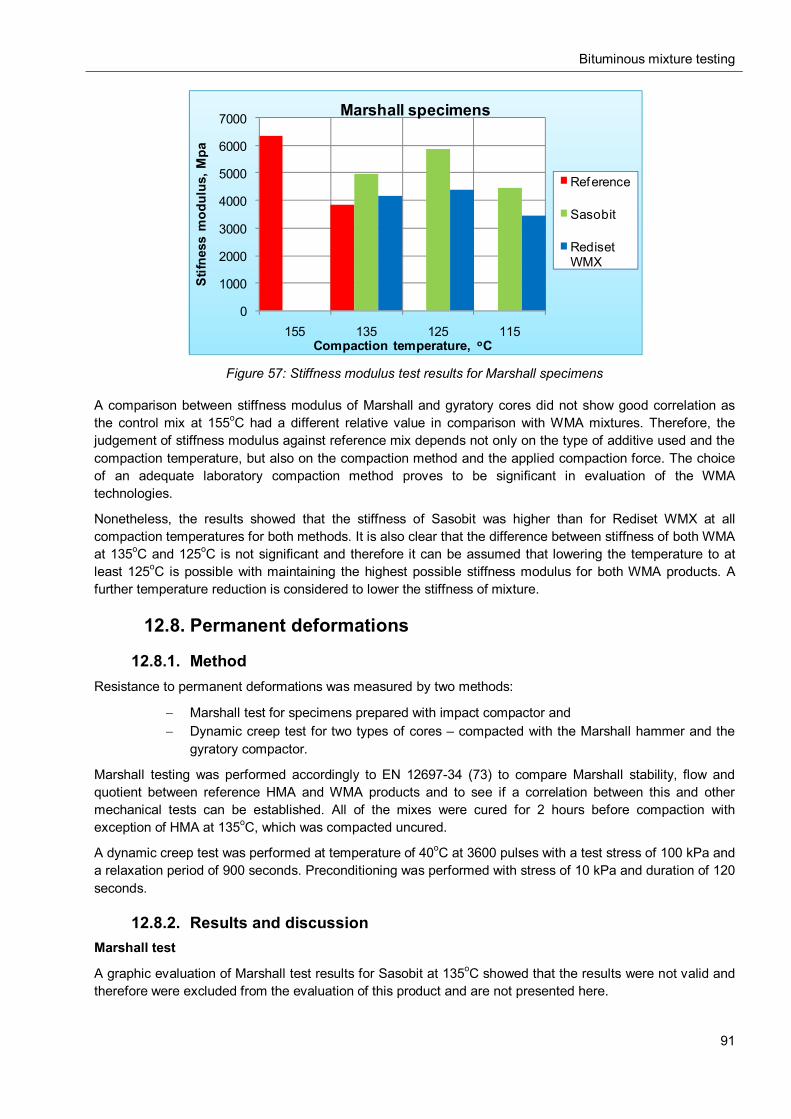
Bituminous mixture testing
91
Figure 57: Stiffness modulus test results for Marshall specimens
A comparison between stiffness modulus of Marshall and gyratory cores did not show good correlation as the control mix at 155oC had a different relative value in comparison with WMA mixtures. Therefore, the judgement of stiffness modulus against reference mix depends not only on the type of additive used and the compaction temperature, but also on the compaction method and the applied compaction force. The choice of an adequate laboratory compaction method proves to be significant in evaluation of the WMA technologies.
Nonetheless, the results showed that the stiffness of Sasobit was higher than for Rediset WMX at all compaction temperatures for both methods. It is also clear that the difference between stiffness of both WMA at 135oC and 125oC is not significant and therefore it can be assumed that lowering the temperature to at least 125oC is possible with maintaining the highest possible stiffness modulus for both WMA products. A further temperature reduction is considered to lower the stiffness of mixture.
12.8. Permanent deformations
12.8.1. Method Resistance to permanent deformations was measured by two methods:
Marshall test for specimens prepared with impact compactor and Dynamic creep test for two types of cores – compacted with the Marshall hammer and the
gyratory compactor.
Marshall testing was performed accordingly to EN 12697-34 (73) to compare Marshall stability, flow and quotient between reference HMA and WMA products and to see if a correlation between this and other mechanical tests can be established. All of the mixes were cured for 2 hours before compaction with exception of HMA at 135oC, which was compacted uncured.
A dynamic creep test was performed at temperature of 40oC at 3600 pulses with a test stress of 100 kPa and a relaxation period of 900 seconds. Preconditioning was performed with stress of 10 kPa and duration of 120 seconds.
12.8.2. Results and discussion Marshall test
A graphic evaluation of Marshall test results for Sasobit at 135oC showed that the results were not valid and therefore were excluded from the evaluation of this product and are not presented here.
0
1000
2000
3000
4000
5000
6000
7000
155 135 125 115
Stifn
ess
mod
ulus
, Mpa
Compaction temperature, oC
Marshall specimens
Reference
Sasobit
Rediset WMX
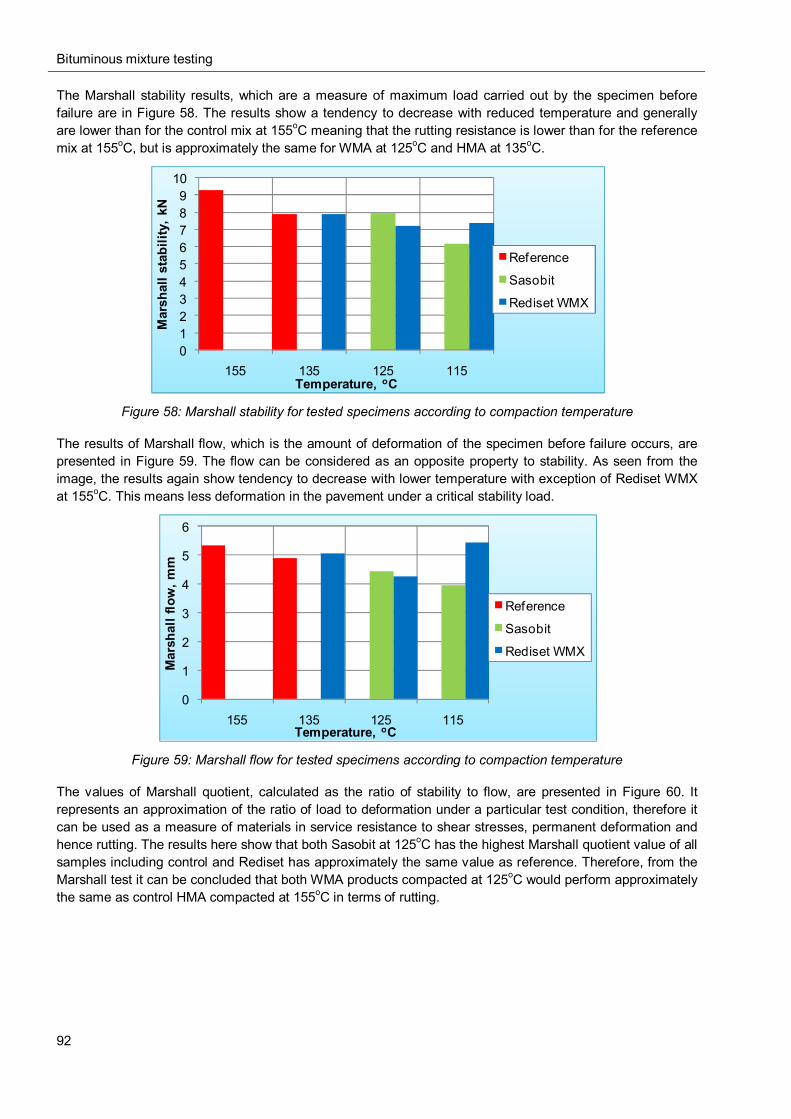
Bituminous mixture testing
92
The Marshall stability results, which are a measure of maximum load carried out by the specimen before failure are in Figure 58. The results show a tendency to decrease with reduced temperature and generally are lower than for the control mix at 155oC meaning that the rutting resistance is lower than for the reference mix at 155oC, but is approximately the same for WMA at 125oC and HMA at 135oC.
Figure 58: Marshall stability for tested specimens according to compaction temperature
The results of Marshall flow, which is the amount of deformation of the specimen before failure occurs, are presented in Figure 59. The flow can be considered as an opposite property to stability. As seen from the image, the results again show tendency to decrease with lower temperature with exception of Rediset WMX at 155oC. This means less deformation in the pavement under a critical stability load.
Figure 59: Marshall flow for tested specimens according to compaction temperature
The values of Marshall quotient, calculated as the ratio of stability to flow, are presented in Figure 60. It represents an approximation of the ratio of load to deformation under a particular test condition, therefore it can be used as a measure of materials in service resistance to shear stresses, permanent deformation and hence rutting. The results here show that both Sasobit at 125oC has the highest Marshall quotient value of all samples including control and Rediset has approximately the same value as reference. Therefore, from the Marshall test it can be concluded that both WMA products compacted at 125oC would perform approximately the same as control HMA compacted at 155oC in terms of rutting.
0123456789
10
155 135 125 115
Mar
shal
l sta
bilit
y, k
N
Temperature, oC
Reference
Sasobit
Rediset WMX
0
1
2
3
4
5
6
155 135 125 115
Mar
shal
l flo
w, m
m
Temperature, oC
Reference
Sasobit
Rediset WMX
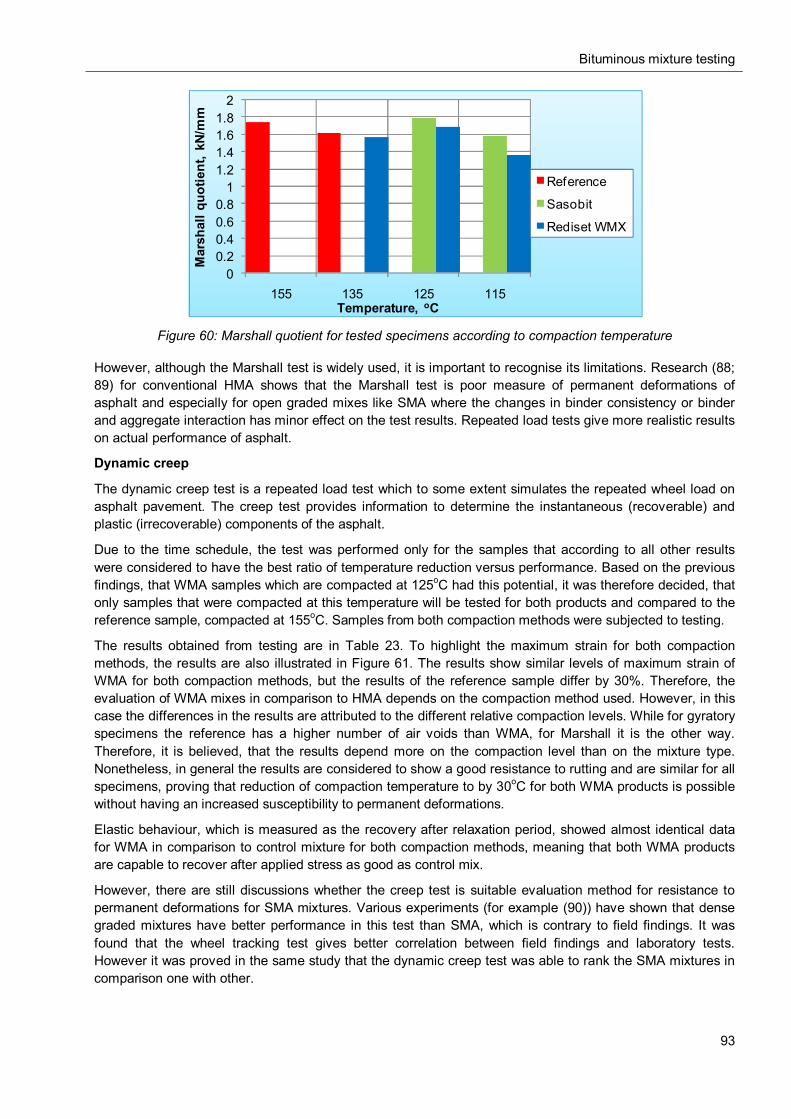
Bituminous mixture testing
93
Figure 60: Marshall quotient for tested specimens according to compaction temperature
However, although the Marshall test is widely used, it is important to recognise its limitations. Research (88; 89) for conventional HMA shows that the Marshall test is poor measure of permanent deformations of asphalt and especially for open graded mixes like SMA where the changes in binder consistency or binder and aggregate interaction has minor effect on the test results. Repeated load tests give more realistic results on actual performance of asphalt.
Dynamic creep
The dynamic creep test is a repeated load test which to some extent simulates the repeated wheel load on asphalt pavement. The creep test provides information to determine the instantaneous (recoverable) and plastic (irrecoverable) components of the asphalt.
Due to the time schedule, the test was performed only for the samples that according to all other results were considered to have the best ratio of temperature reduction versus performance. Based on the previous findings, that WMA samples which are compacted at 125oC had this potential, it was therefore decided, that only samples that were compacted at this temperature will be tested for both products and compared to the reference sample, compacted at 155oC. Samples from both compaction methods were subjected to testing.
The results obtained from testing are in Table 23. To highlight the maximum strain for both compaction methods, the results are also illustrated in Figure 61. The results show similar levels of maximum strain of WMA for both compaction methods, but the results of the reference sample differ by 30%. Therefore, the evaluation of WMA mixes in comparison to HMA depends on the compaction method used. However, in this case the differences in the results are attributed to the different relative compaction levels. While for gyratory specimens the reference has a higher number of air voids than WMA, for Marshall it is the other way. Therefore, it is believed, that the results depend more on the compaction level than on the mixture type. Nonetheless, in general the results are considered to show a good resistance to rutting and are similar for all specimens, proving that reduction of compaction temperature to by 30oC for both WMA products is possible without having an increased susceptibility to permanent deformations.
Elastic behaviour, which is measured as the recovery after relaxation period, showed almost identical data for WMA in comparison to control mixture for both compaction methods, meaning that both WMA products are capable to recover after applied stress as good as control mix.
However, there are still discussions whether the creep test is suitable evaluation method for resistance to permanent deformations for SMA mixtures. Various experiments (for example (90)) have shown that dense graded mixtures have better performance in this test than SMA, which is contrary to field findings. It was found that the wheel tracking test gives better correlation between field findings and laboratory tests. However it was proved in the same study that the dynamic creep test was able to rank the SMA mixtures in comparison one with other.
00.20.40.60.8
11.21.41.61.8
2
155 135 125 115
Mar
shal
l quo
tient
, kN/
mm
Temperature, oC
Reference
Sasobit
Rediset WMX
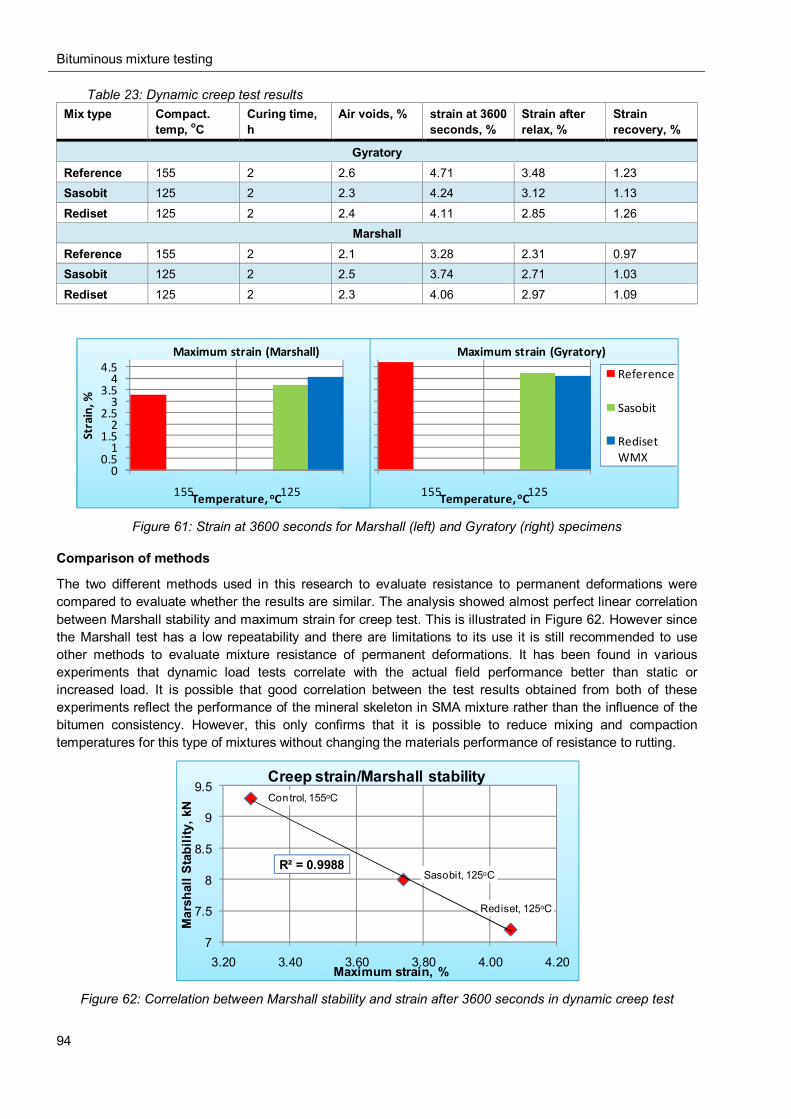
Bituminous mixture testing
94
Table 23: Dynamic creep test results Mix type Compact.
temp, oC Curing time, h
Air voids, % strain at 3600 seconds, %
Strain after relax, %
Strain recovery, %
Gyratory Reference 155 2 2.6 4.71 3.48 1.23 Sasobit 125 2 2.3 4.24 3.12 1.13
Rediset 125 2 2.4 4.11 2.85 1.26 Marshall
Reference 155 2 2.1 3.28 2.31 0.97 Sasobit 125 2 2.5 3.74 2.71 1.03
Rediset 125 2 2.3 4.06 2.97 1.09
Figure 61: Strain at 3600 seconds for Marshall (left) and Gyratory (right) specimens
Comparison of methods
The two different methods used in this research to evaluate resistance to permanent deformations were compared to evaluate whether the results are similar. The analysis showed almost perfect linear correlation between Marshall stability and maximum strain for creep test. This is illustrated in Figure 62. However since the Marshall test has a low repeatability and there are limitations to its use it is still recommended to use other methods to evaluate mixture resistance of permanent deformations. It has been found in various experiments that dynamic load tests correlate with the actual field performance better than static or increased load. It is possible that good correlation between the test results obtained from both of these experiments reflect the performance of the mineral skeleton in SMA mixture rather than the influence of the bitumen consistency. However, this only confirms that it is possible to reduce mixing and compaction temperatures for this type of mixtures without changing the materials performance of resistance to rutting.
Figure 62: Correlation between Marshall stability and strain after 3600 seconds in dynamic creep test
00.5
11.5
22.5
33.5
44.5
155 125
Stra
in, %
Temperature, oC
Maximum strain (Gyratory)
Reference
Sasobit
Rediset WMX
00.5
11.5
22.5
33.5
44.5
155 125
Stra
in, %
Temperature, oC
Maximum strain (Marshall)
Control, 155oC
Sasobit, 125oC
Rediset, 125oC
R² = 0.9988
7
7.5
8
8.5
9
9.5
3.20 3.40 3.60 3.80 4.00 4.20
Mar
shal
l Sta
bilit
y, k
N
Maximum strain, %
Creep strain/Marshall stability
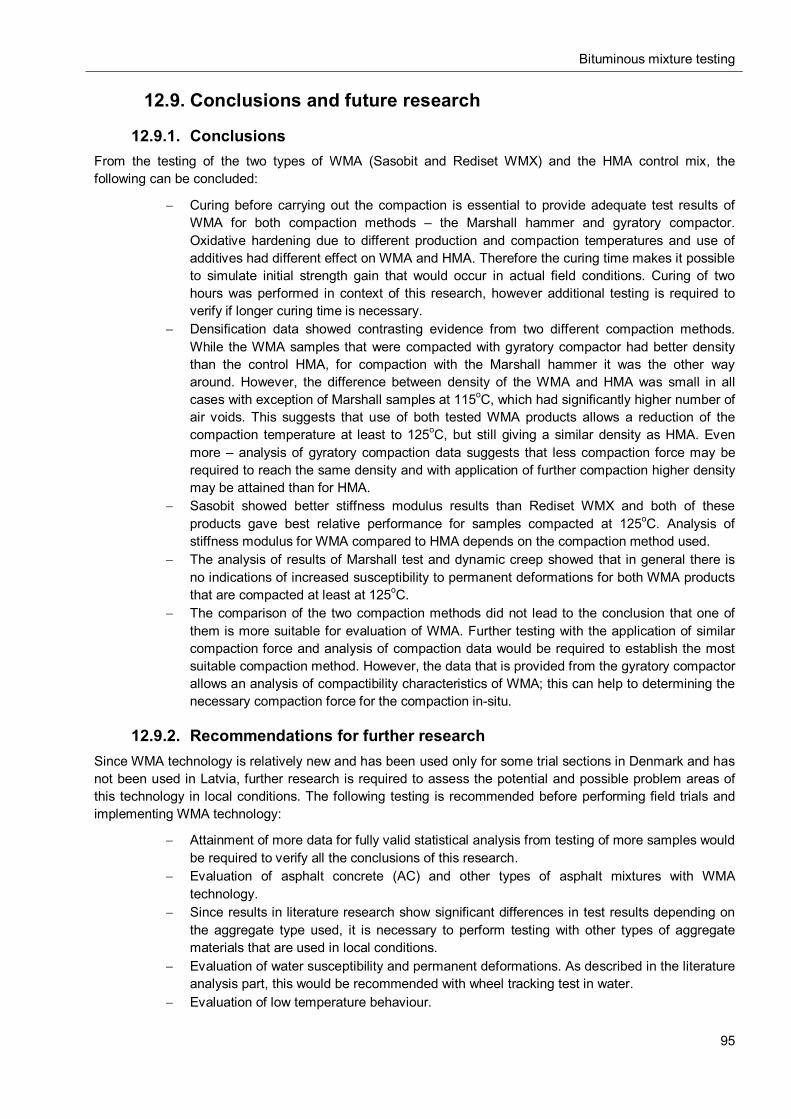
Bituminous mixture testing
95
12.9. Conclusions and future research
12.9.1. Conclusions From the testing of the two types of WMA (Sasobit and Rediset WMX) and the HMA control mix, the following can be concluded:
Curing before carrying out the compaction is essential to provide adequate test results of WMA for both compaction methods – the Marshall hammer and gyratory compactor. Oxidative hardening due to different production and compaction temperatures and use of additives had different effect on WMA and HMA. Therefore the curing time makes it possible to simulate initial strength gain that would occur in actual field conditions. Curing of two hours was performed in context of this research, however additional testing is required to verify if longer curing time is necessary.
Densification data showed contrasting evidence from two different compaction methods. While the WMA samples that were compacted with gyratory compactor had better density than the control HMA, for compaction with the Marshall hammer it was the other way around. However, the difference between density of the WMA and HMA was small in all cases with exception of Marshall samples at 115oC, which had significantly higher number of air voids. This suggests that use of both tested WMA products allows a reduction of the compaction temperature at least to 125oC, but still giving a similar density as HMA. Even more – analysis of gyratory compaction data suggests that less compaction force may be required to reach the same density and with application of further compaction higher density may be attained than for HMA.
Sasobit showed better stiffness modulus results than Rediset WMX and both of these products gave best relative performance for samples compacted at 125oC. Analysis of stiffness modulus for WMA compared to HMA depends on the compaction method used.
The analysis of results of Marshall test and dynamic creep showed that in general there is no indications of increased susceptibility to permanent deformations for both WMA products that are compacted at least at 125oC.
The comparison of the two compaction methods did not lead to the conclusion that one of them is more suitable for evaluation of WMA. Further testing with the application of similar compaction force and analysis of compaction data would be required to establish the most suitable compaction method. However, the data that is provided from the gyratory compactor allows an analysis of compactibility characteristics of WMA; this can help to determining the necessary compaction force for the compaction in-situ.
12.9.2. Recommendations for further research Since WMA technology is relatively new and has been used only for some trial sections in Denmark and has not been used in Latvia, further research is required to assess the potential and possible problem areas of this technology in local conditions. The following testing is recommended before performing field trials and implementing WMA technology:
Attainment of more data for fully valid statistical analysis from testing of more samples would be required to verify all the conclusions of this research.
Evaluation of asphalt concrete (AC) and other types of asphalt mixtures with WMA technology.
Since results in literature research show significant differences in test results depending on the aggregate type used, it is necessary to perform testing with other types of aggregate materials that are used in local conditions.
Evaluation of water susceptibility and permanent deformations. As described in the literature analysis part, this would be recommended with wheel tracking test in water.
Evaluation of low temperature behaviour.

Bituminous mixture testing
96
Evaluation the WMA performance with reclaimed asphalt. Evaluation of fatigue properties. Testing with other amounts of additives to establish the optimum amount of additive in each
specific case.
Conclusion
97
13. CONCLUSION A comprehensive literature study forms the basis for the theory reported, where whole cycle of Warm Mix Asphalt (WMA) implementation is examined. In the first part different WMA production technologies and characteristics of specific products are described. In the second part, the focus is on evaluation methods, experimental results, potential problem areas and WMA design methods from different studies. Description of test methods and the basis of bitumen characteristics are given in order to interpret these findings with theoretical substantiation.
The findings from research, that are included in this study discuss the potential problem areas of WMA compared to conventional Hot Mix Asphalt. The research results show varying performance for different WMA products, but in general none of the technologies were found to be unusable as a WMA process. However, it was found that the performance of WMA products varies depending on circumstances. Therefore, careful examination should be performed with the local materials and in the given climatic conditions to examine the characteristics of a particular WMA product before implementation in local asphalt industry. The assessment also involves selection of the right test methods that would give appropriate evaluation compared to conventional HMA. Based on literature findings, some changes in the methods or conditions for evaluation of WMA are proposed. However most of them are only theoretical. Due to shortage of time and/or unavailable testing equipment or other resources (for example full scale production process), it was not able to verify the proposed changes and it would require additional examination to prove or decline the necessity of such modifications.
Two WMA products – Sasobit and Rediset WMX were tested in the laboratory. The research for bitumen was performed in order to evaluate the consistency changing properties for each product and to verify the theoretical assumption that asphalt mixing and compaction temperature can be determined from the results. The test results showed that this prediction method is considered to be unusable with WMA modified bitumen with these additives, as the viscosity changes were smaller than expected. However, the testing showed the relative performance for different additive dosages for both products and based on these findings, the dosage for testing of asphalt mixtures was applied.
The testing of asphalt mixture was performed in order to verify the performance of both WMA products in comparison to a reference HMA and to verify some of the theoretical findings for the changes in test methods or conditions. It was found that both WMA products allow a reduction of compaction temperature to 125oC without significant changes in density, mixture stiffness or resistance to permanent deformations. It was also established that curing has different effects on WMA and HMA and in order to obtain adequate test results that would correlate with field performance, it should be considered to implement this action as a routine procedure for evaluation of WMA properties. Two hour curing was used in this research, but additional testing would be required to establish, whether it is not necessary to provide even longer curing times in order to perform adequate evaluation of WMA.
The main benefit of WMA technology is the ability to reduce the amount of greenhouse gas emissions to the atmosphere. The savings from different research are reported in the literature review part. The reduction rate, however, is strongly connected with the energy amount that is used in the asphalt plant and other processes that are connected with the production and laying of WMA. To verify the amount of potential energy savings in the entire asphalt industry, life cycle inventory (LCI) calculation was performed. The calculation of seven different modules showed various degrees of energy reduction potential depending on the WMA product and conditions of application. However it was established that at least 5% energy savings are possible in the LCI process when WMA is used instead of HMA.
It can be concluded that WMA has a potential to replace conventional HMA and in special circumstances it even has advantages over HMA. However more data that proves the comparison of WMA to HMA technology would help to overcome the caution in the road building industry for implementation of this technology. Introduction of EN standards for WMA and national specifications that would allow to adequately evaluate WMA would also stimulate the usage of WMA technologies. Finally, application of stronger environmental regulations will stimulate faster development of WMA technologies and usage in actual commercial projects.
<References
98
REFERENCES 1. Chowdhury, Arif and Button, Joe. A Review of Warm Mix Asphalt. Texas Transportation Institute. Springfield, Virginia : National Technical Information Service, December 2008. Technical report.
2. D'Angelo, John, et al. Warm-Mix Asphalt: European Practise. American Trade Iniatives. Washington, DC : U.S. Department of Transportation, February 2008.
3. Erfahrungssammlung über die Verwendung von Fertigprodukten und Zusätzen zur Temperaturabsenkung von Asphalt. Straßenwesen, Bundesanstalt für, [ed.]. Bergisch-Gladbach : Bundesanstalt für Straßenwesen, 2008.
4. Fischer-Tropsch parrafin modified bitumen - performance parameter and reduction of energy consumprion. Wanger, Michael, Stangl, Klaus and Blab, Ronald. Zurich : International society for asphalt pavements, 2008. Asphalt pavements and invironment. pp. 197-206.
5. Lee, Robert. A Summary of Texas' Experience with Warm Mix Asphalt. Shreveport, LA : Presentation at Louisiana Warm-Mix Demonstration, 2008.
6. Drüschner, Lotar. Experience with Warm Mix Asphalt in Germany. Sønderborg : NVF-rapporter, 2009. guest report in conference.
7. Low energy asphalt LEA: new half-warm mix asphalt for minimizing impacts from asphalt plant to job site. Olar, et al. Zurich : International sociary for asphalt pavements, 2008. Asphalt Pavements and Environment. pp. 207-230.
8. M.Sc.(Chem.Eng.) Erik Olesen, personal conversation. Project manager, Research and Development department, Danish Road Institute.
9. M.Sc.(Chem.Eng.) Erik Nielsen, personal conversation. Research and Development department, Danish Road Institute.
10. Double barrel green. product home page. [Online] [Cited: 5 April 2010.] http://www.astecinc.com/index.php?option=com_content&view=article&id=117&Itemid=188.
11. Perkins, Steven. Synthesis of warm mix asphalt paving strategies for use in Montana highway construction. Montana : the state of Montana, department of transportation, November 2009. final report.
12. Low Energy Asphalt. product web page. [Online] LEA-CO. [Cited: 5 April 2010.] http://www.lea-co.com/lea_co/index2.php?lang=en.
13. Low Emission Asphalt. product home page. [Online] [Cited: 5 April 2010.] http://www.mcconnaughay.com/lowemissionasphalt_intro.php.
14. WAM Foam. product web page. [Online] Shell. [Cited: 5 April 2010.] http://www-static.shell.com/static/bitumen/downloads/business/shell_wamfoam_brochure.pdf.
15. Warm Mix Asphalt system. product home page. [Online] [Cited: 5 April 2010.] http://www.terexrb.com/default.aspx?pgID=308.
16. Advera. product home page. [Online] [Cited: 5 April 2010.] http://www.adverawma.com/.
17. Hurley, G.C. and Prowell, B.D. Evaluation of Aspha-Min zeolite for use in warm mix asphalt. Auburn : National Center for Asphalt Technology, 2005. Report 05-04.
18. Aspha-Min. product home page. [Online] [Cited: 5 April 2010.] http://www.aspha-min.com/asphamin-en.html.
19. U.S.Department of Transportation, Federal Highway Administration. Warm Mix Aphalt Technologies and Research. [Online] 10 November 2008. [Cited: 3 March 2010.] http://www.fhwa.dot.gov/pavement/asphalt/wma.cfm.
20. Sasobit. product web page. [Online] [Cited: 8 March 2010.] http://www.sasolwax.com/sasolwaxmedia/Downloads/Bitumen_Modification-p-409/Sasobit_since_1997.pdf.

<References
99
21. Hrley, G.C. and Browell, B.D. Evaluation of Sasobit for use in warm mix asphalt. Auburn : National Center for Asphalt Technology, 2005. Report 05-06.
22. Damm, Klaus-Werner, et al. Asphalt Flow Improvers As 'Intelligent Fillers' For Hot Asphalts - A New Chapter In Asphalt Technology. Hamburg : Sasol Wax GmbH, 2003. Sasobit product informatios.
23. Evotherm. product home page. [Online] [Cited: 5 April 2010.] http://www.meadwestvaco.com/SpecialtyChemicals/AsphaltAdditives/MWV002106.
24. Warm Mix Asphalt Technology Adoption. Kristjansdottir, Olof. Trondheim : s.n., 2007. NVF 33 Annual Meeting.
25. Cecabase RT. Product home page. [Online] [Cited: 5 April 2010.] http://www.cecachemicals.com/sites/ceca/en/business/bitumen_additives/warm_coated_material/warm_coated_material.page.
26. Akzo Nobel Asphalt Applications. [Online] Akzo Nobel. [Cited: 3 March 2010.] http://www.surfactants.akzonobel.com/asphalt/newwarmmixsystem.cfm.
27. Institute, Asphalt. Asphalt handbook MS-4 7th edition. USA : Asphalt Institute, 2007, pp. 765-767.
28. Romonta officcial web site. Asphaltan B product information. [Online] Romonta. [Cited: 8 March 2010.] accesible only with Microsoft Explorer. http://www.romonta.de/ie4/english/romonta/i_wachse.htm.
29. Jones, David. Warm-Mix Asphalt Study: Test Track Construction and First-Level Analysis of Phase 1 HVS and Laboratory Testing. California : California Department of Transportation, December 2008. Research Report.
30. Sargand, Shad, et al. Performance Assessment of Warm Mix Asphalt (WMA) Pavements. Ohio : Ohio Department of Transportation, September 2009. Technical report.
31. Prowell, Brian and Hurley, Graham. Warm-Mix Asphalt: Best Practies, presentation. Lanham, Maryland : National Asphalt Pavement Association, 2007.
32. Aquablack WMA . product home page. [Online] [Cited: 05 April 2010.] http://maxamequipment.com/AQUABlackWMA.htm.
33. Clariant official web site. Licomont BS100 product information. [Online] [Cited: 8 March 2010.] http://additives.clariant.com/C1256A2A001CD33A/vwWebPDSbyID/0E0A2A00E67C41A9C12575C5002D5E46.
34. The use of Warm Mix Asphalt. Brussels : European Asphalt Pavement Association, 2010. EAPA - Position paper.
35. Warm Mix Asphalt Scan Tour presentation. Anderson, Mike. Idaho : Asphalt Institute, 2007. Annual Idaho Asphalt Conference. Vol. 48.
36. Whiteoak, David and Read, John. The Shell Bitumen Handbook. Fifth edition. London : Thomas Telford Publishing, 2003.
37. EN 1426 Bitumen and bituminous binders – Determination of needle penetration.
38. EN 1427 Bitumen and bituminous binders – Determination of the softening point – Ring and Ball method.
39. EN 12696 Bitumen and bituminous binders – Determination of dynamic viscosity by vacuum capillary.
40. EN 12595 Bitumen and bituminous binders – Determination of kinematic viscosity.
41. EN 12591 Bitumen and bituminous binders – Specifications for paving grade bitumens.
42. ASTM D36 / D36M - 09 Standard Test Method for Softening Point of Bitumen (Ring-and-Ball Apparatus).
43. Determination of the ring and ball softening point of asphaltic bitumens with and without stirring. Krom, C J. J Inst Pet, London : Institute of Petroleum, 1950, Vol. 36.
<References
100
44. Hurley, Graham and Prowell, Brian. Evaluation of Potential Processes for Use in Warm Mix Asphalt. Alabama : National Center for Asphalt Technology, Auburn University, 2006. NCAT report Nr.06-02.
45. EN 12697-1 Bituminous mixtures – Test methods for hot mix asphalt – Part 1: Soluble binder content.
46. EN 12607-1 Bitumen and bituminous binders – Determination of the resistance to hardening under the influence of heat and air – Part 1: RTFOT method.
47. EN 12608-2 Bitumen and bituminous binders – Determination of the resistance to hardening under the influence of heat and air – Part 2: TFOT Method.
48. Lubbers, H.E. Bitumen in de weg- en waterbouw. Gouda : Nederlands Adviesbereau voor Bitumentoepassingen, 1985.
49. Asphalt workability, its measurment, and how it can be done. Whiteoak, C.D. and Fordyce, D. London : Shell International Petroleum Company Ltd, 1989. Shell Bitumen Review . Vol. 64, pp. 14-17.
50. The rheological properties of asphaltic bitumens. Pfeiffer, J. and Van Doormaal, P. London : Institute of Petroleum, 1936. Vol. 22, pp. 414-440.
51. Bitumen and bituminous binders - Specifications for paving grade bitumens. s.l. : Dansk standard, 2009. DS/EN 12591.
52. A btumen test data chart for showing the effect of temperature on the mechanical behaviour of asphaltic bitumens. Heuklom, W. London : Journal of the Institute of Petroleum Technologists, 1969, Vol. 55, pp. 404-417.
53. Concepts used for development of bitumen specifications. van de Ven, M.F.C., Jenkins, K.J. and Bahia, H.U. Sun City : s.n., 2004. Conference on Asphalt Pavements for Douth Africa. Vol. 8. only development of Europe specifications (Section 2.1.) used in the thesis.
54. A general system describing the visco-elastic properties of bitumen and its relation to routine test data. Van der Poel, V. s.l. : Shell Bitumen, 1954, J. Appl. Chem., Vol. No.4, pp. 221-236.
55. EN 12697-30 Bituminous mixtures – Test methods for hot mix asphalt – Part 30: Specimen preparation by impact compactor.
56. EN 12697-31 Bituminous mixtures – Test methods for hot mix asphalt – Part 31: Specimen preparation by gyratory compactor.
57. Bituminous mixtures – Test methods for hot mix asphalt – Part 32: Laboratory compaction of bituminous mixtures by vibratory compactor.
58. Laboratory and Field Evaluation of Warm Mix Asphalt Technology. Walaa, S. and Mogawer, P.E. Zurich : International society for asphalt pavements, 2008. ISAP International Symposium on Asphalt Pavements and Environment. pp. 173-184.
59. Prowell, Brian D., Hurley, Graham C and Crews, Everett. Field performance of warm mix asphalt at the NCAT test track. Paper No. 07-2514.
60. Diefenderfer, Stacey D. and Hearin, Amy J. Performance of Virginia's Warm-Mix Asphalt Trial Sections. Virginia Department of Transportation. Charlottesville : Virginia Transportation Research Council, 2010.
61. AASHTO PP2: Standard Practise for Short and Long Term Aging of Hot Mix Asphalt (HMA). 1994.
62. EN 12697-12 Bituminous mixtures - Test methods for hot mix asphalt - Part 12: Determination of the water sensitivity of bituminous specimens.
63. EN 12697-23 Bituminous mixtures – Test methods for hot mix asphalt – Part 23: Determination of the indirect tensile strength of bituminous specimens.
64. Pavement interractive. Laboratory Wheel Tracking Devices. [Online] [Cited: 17 April 2010.] http://pavementinteractive.org/index.php?title=Laboratory_Wheel_Tracking_Devices.
<References
101
65. Jones, David, et al. Warn-Mix Asphalt Study: Test track Construction and first- Level Analysis of Phalse 1 HVS and Laboratory Testing. University of California, Pavement Research Center. California : California Department of Transportation, 2008. UCPRC-RR-2008-11.
66. Achenbrener, Tim. Evaluation of Hamburg Wheel Tracking Device to Predict Moisture Damage in Hot Mic Asphalt. Transportation Research Record 1492. Washinghton D.C. : Transportation Research Board, National Academy of Sciences, 1995. pp. 193-201.
67. EN 13108-20 Bituminous mixtures - Material specifcations- Part 20: Type testing.
68. EN 12697-22 Bituminous mixtures - Test methods for hot mix asphalts - Part 22: Wheel tracking.
69. EN 12697-26 Bituminous mixtures - Test methods for hot mix asphalt - Part 26: Stifness.
70. A new method of predicting the stiffness of asphalt paving mixtures. Bonnaure, F., et al. Seattle : Association of Aphalt Paving Technologists, 1977. Asphalt Pavement Technologies. Vol. 46, pp. 64-104.
71. Revised Predictive Model for Dynamic (Complex) Modulus of Asphalt Mixtures. Witczak, M.W. and Fonseca, O.A. 1996, U.S. : Transportation Research Board of the National Academies, 2007, Transportation Research Record: Journal of the Tranportation Research Board, Vol. 1540, pp. 15-23.
72. Environmental/Structural Evaluation of Warm Asphalt in the Canadian Climate. Tighe, Susan L. Zurich : Intrnational Society for Asphalt Pavements, 2008. ISAP Iternational Symposium on Asphalt Pavement and Environment.
73. EN 12697-34 Bituminous mixtures - Test methods for hot mix asphalts - Part 34: Marshall test.
74. EN 12697-25 Bituminous mixtures - Test methods for hot mix asphalts - Part 25: Cyclic compression test.
75. Warm Mix for a Cold Climate: Update on Colorado DOT's 2007 WMA Project on I-70. s.l. : Colorado Department of Transportation, 2009. Presentation at the 2009 Rocky Mountain Conference and Equippment Show.
76. WAM-Foam Asphalt Production t Lower Operating Temperatures as an Environmental Frendly Alternative to HMA. Larsen, O.R., et al. Vienna : s.n., 2004. 3rd Euroasphalt & Eurobitume Congress.
77. Superpave Mix Design, Superpave Series No.2. Lexington : Asphalt Institute, 2001.
78. Whiteoak, David. Shell Bitumen Handbook. Fourth Edition. Chertsey : Shell Bitumen, 1990.
79. Gandhi, Tejash. Effects of warm mix asphalt additives on asphalt binder and mixture properties. Clemson University : Doctor dissertation thesis, 2008.
80. European asphalt pavement association. [Online] [Cited: 2 May 2010.] http://eapa.org/default_news.htm.
81. Warm asphalt mixes: overview of this new technology in France. Brosseaud, Y. and Saint Jacques, M. Ljubljana : s.n., 2008. Transport Research Arena Europe. p. Paper 0309.
82. Stripple, Hakan. Life Cycle Inventory of Asphalt Pavements. European Asphalt Pavement Association (EAPA) and Eurobitume. Gothenburg : IVL Swedish Environmental Research Institute Ltd, 2000.
83. EN 12697-30+A1 Bituminous mixtures - Test methoods for hot mix asphalt - Part 35: Laboratory mixing.
84. EN 12697-35 Bituminous mixtures – Test methods for hot mix asphalt – Part 35: Laboratory mixing.
85. EN 12697-35 Bituminous mixtures – Test methods for hot mix asphalt – Part 35: Laboratory mixing.
86. EN 12697-6 Bituminous mixtures – Test methods for hot mix asphalt – Part 6: Determination of bulk density of bituminous specimens.
87. EN 12697-5: Bituminous mixtures – Test methods for hot mix asphalt – Part 5: Determination of the maximum density.
<References
102
88. Mechanical properties of bituminous materials for pavement design. Brown, S.F., Cooper, K.E. and Pooley, Graham. Cannes : Institute of Asphalt teshnology, 1981. Eurobitume Symposium. pp. 143-147.
89. Brown, Helmut Manglokar. Evaluation of laboratory properties of SMA mixtures. Auburn : National Center for Asphalt Technology, 1993.
90. Design Stone Matrix Asphalt Mixture for Rut-Resistant Pavements. National cooperative highway research program. Washington : Transportation Research Board, National Research Council, 1999.
91. GmbH, Romonta. Asphaltan B. Romonta GmbH official web site. [Online] Romonta GmbH. [Cited: 3 March 2010.] accessble only with internet explorer. http://www.romonta.de/ie4/english/romonta/i_wachse.htm.
92. Radiset WMX: Improved performance at lowe temperature, promotion material. Akzo Nobel Asphat Applications. [Online] 2008. [Cited: 15 March 2010.] http://www.surfactants.akzonobel.com/asphalt/pdf/Rediset%20Brochure_0907.PDF.

Appendices
103
APPENDICES
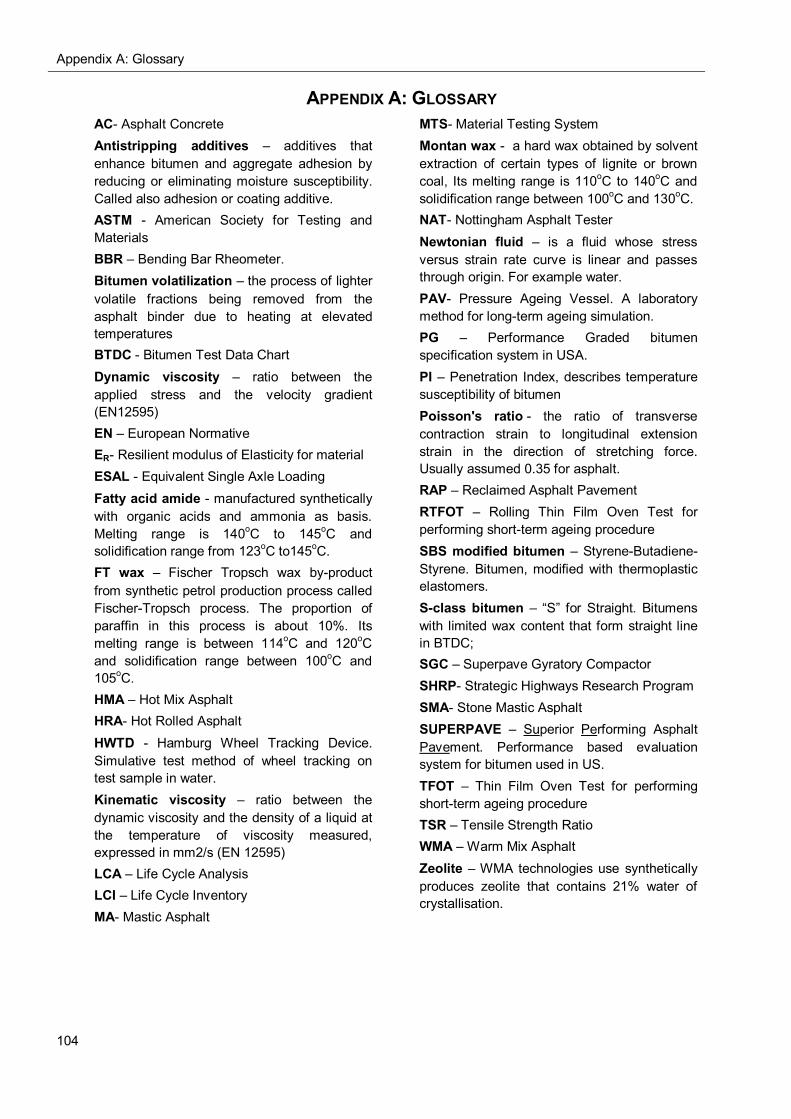
Appendix A: Glossary
104
APPENDIX A: GLOSSARY AC- Asphalt Concrete Antistripping additives – additives that enhance bitumen and aggregate adhesion by reducing or eliminating moisture susceptibility. Called also adhesion or coating additive. ASTM - American Society for Testing and Materials BBR – Bending Bar Rheometer. Bitumen volatilization – the process of lighter volatile fractions being removed from the asphalt binder due to heating at elevated temperatures BTDC - Bitumen Test Data Chart Dynamic viscosity – ratio between the applied stress and the velocity gradient (EN12595) EN – European Normative ER- Resilient modulus of Elasticity for material ESAL - Equivalent Single Axle Loading Fatty acid amide - manufactured synthetically with organic acids and ammonia as basis. Melting range is 140oC to 145oC and solidification range from 123oC to145oC. FT wax – Fischer Tropsch wax by-product from synthetic petrol production process called Fischer-Tropsch process. The proportion of paraffin in this process is about 10%. Its melting range is between 114oC and 120oC and solidification range between 100oC and 105oC. HMA – Hot Mix Asphalt HRA- Hot Rolled Asphalt HWTD - Hamburg Wheel Tracking Device. Simulative test method of wheel tracking on test sample in water. Kinematic viscosity – ratio between the dynamic viscosity and the density of a liquid at the temperature of viscosity measured, expressed in mm2/s (EN 12595) LCA – Life Cycle Analysis LCI – Life Cycle Inventory MA- Mastic Asphalt
MTS- Material Testing System Montan wax - a hard wax obtained by solvent extraction of certain types of lignite or brown coal, Its melting range is 110oC to 140oC and solidification range between 100oC and 130oC. NAT- Nottingham Asphalt Tester Newtonian fluid – is a fluid whose stress versus strain rate curve is linear and passes through origin. For example water. PAV- Pressure Ageing Vessel. A laboratory method for long-term ageing simulation. PG – Performance Graded bitumen specification system in USA. PI – Penetration Index, describes temperature susceptibility of bitumen Poisson's ratio - the ratio of transverse contraction strain to longitudinal extension strain in the direction of stretching force. Usually assumed 0.35 for asphalt. RAP – Reclaimed Asphalt Pavement RTFOT – Rolling Thin Film Oven Test for performing short-term ageing procedure SBS modified bitumen – Styrene-Butadiene-Styrene. Bitumen, modified with thermoplastic elastomers. S-class bitumen – “S” for Straight. Bitumens with limited wax content that form straight line in BTDC; SGC – Superpave Gyratory Compactor SHRP- Strategic Highways Research Program SMA- Stone Mastic Asphalt SUPERPAVE – Superior Performing Asphalt Pavement. Performance based evaluation system for bitumen used in US. TFOT – Thin Film Oven Test for performing short-term ageing procedure TSR – Tensile Strength Ratio WMA – Warm Mix Asphalt Zeolite – WMA technologies use synthetically produces zeolite that contains 21% water of crystallisation.
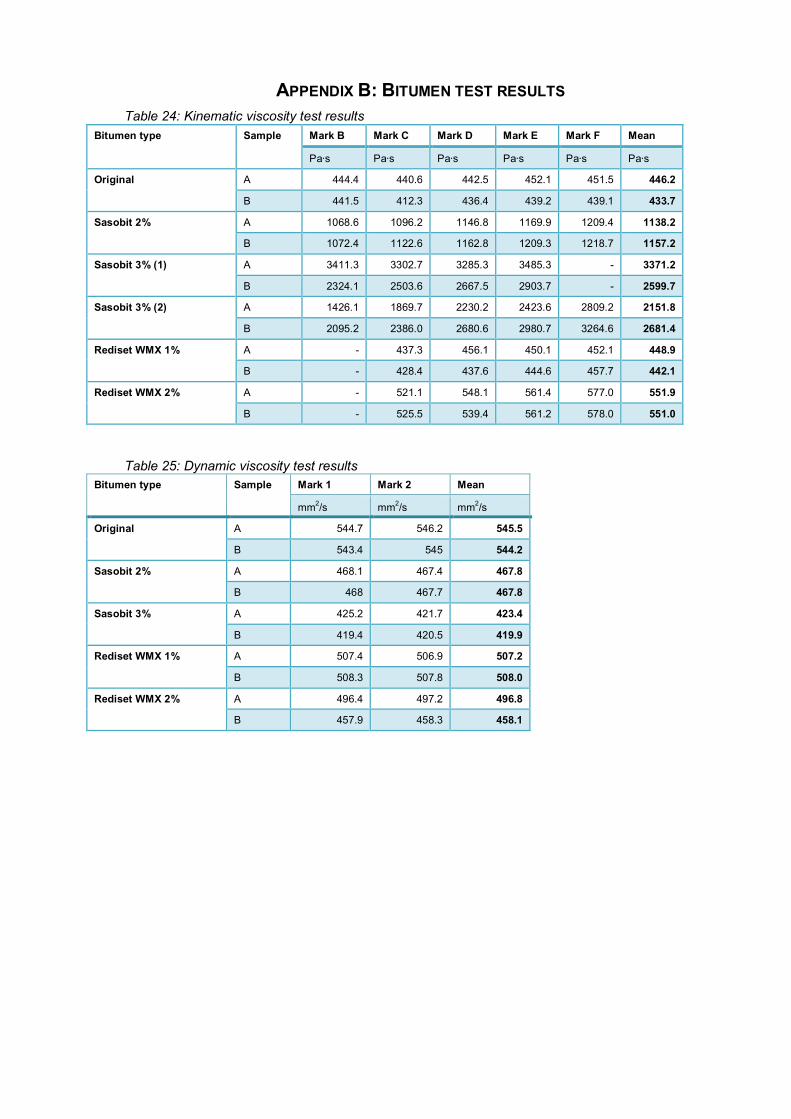
APPENDIX B: BITUMEN TEST RESULTS Table 24: Kinematic viscosity test results
Bitumen type Sample Mark B Mark C Mark D Mark E Mark F Mean
Pa·s Pa·s Pa·s Pa·s Pa·s Pa·s
Original A 444.4 440.6 442.5 452.1 451.5 446.2
B 441.5 412.3 436.4 439.2 439.1 433.7
Sasobit 2% A 1068.6 1096.2 1146.8 1169.9 1209.4 1138.2
B 1072.4 1122.6 1162.8 1209.3 1218.7 1157.2
Sasobit 3% (1) A 3411.3 3302.7 3285.3 3485.3 - 3371.2
B 2324.1 2503.6 2667.5 2903.7 - 2599.7
Sasobit 3% (2) A 1426.1 1869.7 2230.2 2423.6 2809.2 2151.8
B 2095.2 2386.0 2680.6 2980.7 3264.6 2681.4
Rediset WMX 1% A - 437.3 456.1 450.1 452.1 448.9
B - 428.4 437.6 444.6 457.7 442.1
Rediset WMX 2% A - 521.1 548.1 561.4 577.0 551.9
B - 525.5 539.4 561.2 578.0 551.0
Table 25: Dynamic viscosity test results Bitumen type
Sample Mark 1 Mark 2 Mean
mm2/s mm2/s mm2/s
Original A 544.7 546.2 545.5
B 543.4 545 544.2
Sasobit 2% A 468.1 467.4 467.8
B 468 467.7 467.8
Sasobit 3% A 425.2 421.7 423.4
B 419.4 420.5 419.9
Rediset WMX 1% A 507.4 506.9 507.2
B 508.3 507.8 508.0
Rediset WMX 2% A 496.4 497.2 496.8
B 457.9 458.3 458.1
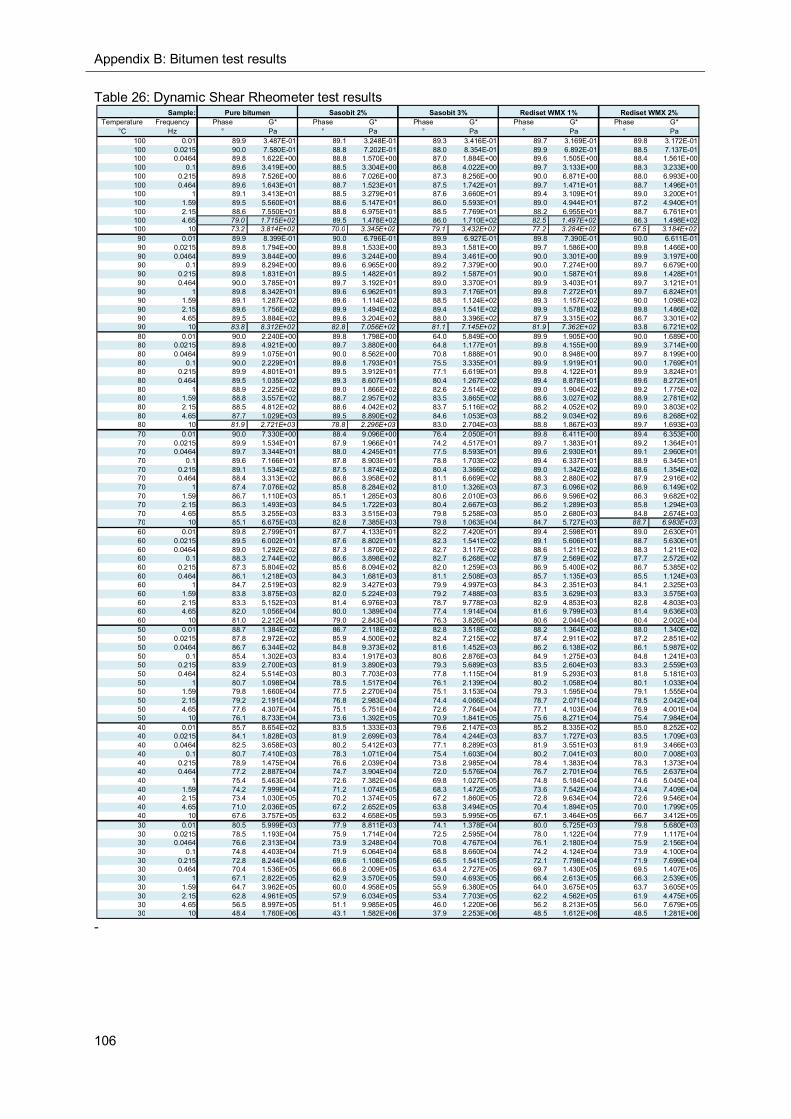
Appendix B: Bitumen test results
106
Table 26: Dynamic Shear Rheometer test results
-
Temperature Frequency Phase G* Phase G* Phase G* Phase G* Phase G*°C Hz ° Pa ° Pa ° Pa ° Pa ° Pa
100 0.01 89.9 3.487E-01 89.1 3.248E-01 89.3 3.416E-01 89.7 3.169E-01 89.8 3.172E-01100 0.0215 90.0 7.580E-01 88.8 7.202E-01 88.0 8.354E-01 89.9 6.892E-01 88.5 7.137E-01100 0.0464 89.8 1.622E+00 88.8 1.570E+00 87.0 1.884E+00 89.6 1.505E+00 88.4 1.561E+00100 0.1 89.6 3.419E+00 88.5 3.304E+00 86.8 4.022E+00 89.7 3.133E+00 88.3 3.233E+00100 0.215 89.8 7.526E+00 88.6 7.026E+00 87.3 8.256E+00 90.0 6.871E+00 88.0 6.993E+00100 0.464 89.6 1.643E+01 88.7 1.523E+01 87.5 1.742E+01 89.7 1.471E+01 88.7 1.496E+01100 1 89.1 3.413E+01 88.5 3.279E+01 87.6 3.660E+01 89.4 3.109E+01 89.0 3.200E+01100 1.59 89.5 5.560E+01 88.6 5.147E+01 86.0 5.593E+01 89.0 4.944E+01 87.2 4.940E+01100 2.15 88.6 7.550E+01 88.8 6.975E+01 88.5 7.769E+01 88.2 6.955E+01 88.7 6.761E+01100 4.65 79.0 1.715E+02 89.5 1.478E+02 86.0 1.710E+02 82.5 1.497E+02 86.3 1.498E+02100 10 73.2 3.814E+02 70.0 3.345E+02 79.1 3.432E+02 77.2 3.284E+02 67.5 3.184E+0290 0.01 89.9 8.399E-01 90.0 6.796E-01 89.9 6.927E-01 89.8 7.390E-01 90.0 6.611E-0190 0.0215 89.8 1.794E+00 89.8 1.533E+00 89.3 1.581E+00 89.7 1.586E+00 89.8 1.466E+0090 0.0464 89.9 3.844E+00 89.6 3.244E+00 89.4 3.461E+00 90.0 3.301E+00 89.9 3.197E+0090 0.1 89.9 8.294E+00 89.6 6.965E+00 89.2 7.379E+00 90.0 7.274E+00 89.7 6.679E+0090 0.215 89.8 1.831E+01 89.5 1.482E+01 89.2 1.587E+01 90.0 1.587E+01 89.8 1.428E+0190 0.464 90.0 3.785E+01 89.7 3.192E+01 89.0 3.370E+01 89.9 3.403E+01 89.7 3.121E+0190 1 89.8 8.342E+01 89.6 6.962E+01 89.3 7.176E+01 89.8 7.272E+01 89.7 6.824E+0190 1.59 89.1 1.287E+02 89.6 1.114E+02 88.5 1.124E+02 89.3 1.157E+02 90.0 1.098E+0290 2.15 89.6 1.756E+02 89.9 1.494E+02 89.4 1.541E+02 89.9 1.578E+02 89.8 1.486E+0290 4.65 89.5 3.884E+02 89.6 3.204E+02 88.0 3.396E+02 87.9 3.315E+02 86.7 3.301E+0290 10 83.8 8.312E+02 82.8 7.056E+02 81.1 7.145E+02 81.9 7.362E+02 83.8 6.721E+0280 0.01 90.0 2.240E+00 89.8 1.798E+00 64.0 5.849E+00 89.9 1.905E+00 90.0 1.689E+0080 0.0215 89.8 4.921E+00 89.7 3.880E+00 64.8 1.177E+01 89.8 4.155E+00 89.9 3.714E+0080 0.0464 89.9 1.075E+01 90.0 8.562E+00 70.8 1.888E+01 90.0 8.948E+00 89.7 8.199E+0080 0.1 90.0 2.229E+01 89.8 1.793E+01 75.5 3.335E+01 89.9 1.919E+01 90.0 1.769E+0180 0.215 89.9 4.801E+01 89.5 3.912E+01 77.1 6.619E+01 89.8 4.122E+01 89.9 3.824E+0180 0.464 89.5 1.035E+02 89.3 8.607E+01 80.4 1.267E+02 89.4 8.878E+01 89.6 8.272E+0180 1 88.9 2.225E+02 89.0 1.866E+02 82.6 2.514E+02 89.0 1.904E+02 89.2 1.775E+0280 1.59 88.8 3.557E+02 88.7 2.957E+02 83.5 3.865E+02 88.6 3.027E+02 88.9 2.781E+0280 2.15 88.5 4.812E+02 88.6 4.042E+02 83.7 5.116E+02 88.2 4.052E+02 89.0 3.803E+0280 4.65 87.7 1.029E+03 89.5 8.890E+02 84.6 1.053E+03 88.2 9.034E+02 89.6 8.268E+0280 10 81.9 2.721E+03 78.8 2.296E+03 83.0 2.704E+03 88.8 1.867E+03 89.7 1.693E+0370 0.01 90.0 7.330E+00 88.4 9.096E+00 76.4 2.050E+01 89.8 6.411E+00 89.4 6.353E+0070 0.0215 89.9 1.534E+01 87.9 1.966E+01 74.2 4.517E+01 89.7 1.383E+01 89.2 1.364E+0170 0.0464 89.7 3.344E+01 88.0 4.245E+01 77.5 8.593E+01 89.6 2.930E+01 89.1 2.960E+0170 0.1 89.6 7.166E+01 87.8 8.903E+01 78.8 1.703E+02 89.4 6.337E+01 88.9 6.345E+0170 0.215 89.1 1.534E+02 87.5 1.874E+02 80.4 3.366E+02 89.0 1.342E+02 88.6 1.354E+0270 0.464 88.4 3.313E+02 86.8 3.958E+02 81.1 6.669E+02 88.3 2.880E+02 87.9 2.916E+0270 1 87.4 7.076E+02 85.8 8.284E+02 81.0 1.326E+03 87.3 6.096E+02 86.9 6.149E+0270 1.59 86.7 1.110E+03 85.1 1.285E+03 80.6 2.010E+03 86.6 9.596E+02 86.3 9.682E+0270 2.15 86.3 1.493E+03 84.5 1.722E+03 80.4 2.667E+03 86.2 1.289E+03 85.8 1.294E+0370 4.65 85.5 3.255E+03 83.3 3.515E+03 79.8 5.258E+03 85.0 2.680E+03 84.8 2.674E+0370 10 85.1 6.675E+03 82.8 7.385E+03 79.8 1.063E+04 84.7 5.727E+03 88.7 6.983E+0360 0.01 89.8 2.799E+01 87.7 4.133E+01 82.2 7.420E+01 89.4 2.598E+01 89.0 2.630E+0160 0.0215 89.5 6.002E+01 87.6 8.802E+01 82.3 1.541E+02 89.1 5.606E+01 88.7 5.630E+0160 0.0464 89.0 1.292E+02 87.3 1.870E+02 82.7 3.117E+02 88.6 1.211E+02 88.3 1.211E+0260 0.1 88.3 2.744E+02 86.6 3.898E+02 82.7 6.268E+02 87.9 2.569E+02 87.7 2.572E+0260 0.215 87.3 5.804E+02 85.6 8.094E+02 82.0 1.259E+03 86.9 5.400E+02 86.7 5.385E+0260 0.464 86.1 1.218E+03 84.3 1.681E+03 81.1 2.508E+03 85.7 1.135E+03 85.5 1.124E+0360 1 84.7 2.519E+03 82.9 3.427E+03 79.9 4.997E+03 84.3 2.351E+03 84.1 2.325E+0360 1.59 83.8 3.875E+03 82.0 5.224E+03 79.2 7.488E+03 83.5 3.629E+03 83.3 3.575E+0360 2.15 83.3 5.152E+03 81.4 6.976E+03 78.7 9.778E+03 82.9 4.853E+03 82.8 4.803E+0360 4.65 82.0 1.056E+04 80.0 1.389E+04 77.4 1.914E+04 81.6 9.799E+03 81.4 9.636E+0360 10 81.0 2.212E+04 79.0 2.843E+04 76.3 3.826E+04 80.6 2.044E+04 80.4 2.002E+0450 0.01 88.7 1.384E+02 86.7 2.118E+02 82.8 3.518E+02 88.2 1.364E+02 88.0 1.340E+0250 0.0215 87.8 2.972E+02 85.9 4.500E+02 82.4 7.215E+02 87.4 2.911E+02 87.2 2.851E+0250 0.0464 86.7 6.344E+02 84.8 9.373E+02 81.6 1.452E+03 86.2 6.138E+02 86.1 5.987E+0250 0.1 85.4 1.302E+03 83.4 1.917E+03 80.6 2.876E+03 84.9 1.275E+03 84.8 1.241E+0350 0.215 83.9 2.700E+03 81.9 3.890E+03 79.3 5.689E+03 83.5 2.604E+03 83.3 2.559E+0350 0.464 82.4 5.514E+03 80.3 7.703E+03 77.8 1.115E+04 81.9 5.293E+03 81.8 5.181E+0350 1 80.7 1.098E+04 78.5 1.517E+04 76.1 2.139E+04 80.2 1.058E+04 80.1 1.033E+0450 1.59 79.8 1.660E+04 77.5 2.270E+04 75.1 3.153E+04 79.3 1.595E+04 79.1 1.555E+0450 2.15 79.2 2.191E+04 76.8 2.983E+04 74.4 4.066E+04 78.7 2.071E+04 78.5 2.042E+0450 4.65 77.6 4.307E+04 75.1 5.751E+04 72.6 7.764E+04 77.1 4.103E+04 76.9 4.001E+0450 10 76.1 8.733E+04 73.6 1.392E+05 70.9 1.841E+05 75.6 8.271E+04 75.4 7.984E+0440 0.01 85.7 8.654E+02 83.5 1.333E+03 79.6 2.147E+03 85.2 8.335E+02 85.0 8.252E+0240 0.0215 84.1 1.828E+03 81.9 2.699E+03 78.4 4.244E+03 83.7 1.727E+03 83.5 1.709E+0340 0.0464 82.5 3.658E+03 80.2 5.412E+03 77.1 8.289E+03 81.9 3.551E+03 81.9 3.466E+0340 0.1 80.7 7.410E+03 78.3 1.071E+04 75.4 1.603E+04 80.2 7.041E+03 80.0 7.008E+0340 0.215 78.9 1.475E+04 76.6 2.039E+04 73.8 2.985E+04 78.4 1.383E+04 78.3 1.373E+0440 0.464 77.2 2.887E+04 74.7 3.904E+04 72.0 5.576E+04 76.7 2.701E+04 76.5 2.637E+0440 1 75.4 5.463E+04 72.6 7.382E+04 69.8 1.027E+05 74.8 5.184E+04 74.6 5.045E+0440 1.59 74.2 7.999E+04 71.2 1.074E+05 68.3 1.472E+05 73.6 7.542E+04 73.4 7.409E+0440 2.15 73.4 1.030E+05 70.2 1.374E+05 67.2 1.860E+05 72.8 9.634E+04 72.6 9.546E+0440 4.65 71.0 2.036E+05 67.2 2.652E+05 63.8 3.494E+05 70.4 1.894E+05 70.0 1.799E+0540 10 67.6 3.757E+05 63.2 4.658E+05 59.3 5.995E+05 67.1 3.464E+05 66.7 3.412E+0530 0.01 80.5 5.999E+03 77.9 8.811E+03 74.1 1.378E+04 80.0 5.725E+03 79.8 5.680E+0330 0.0215 78.5 1.193E+04 75.9 1.714E+04 72.5 2.595E+04 78.0 1.122E+04 77.9 1.117E+0430 0.0464 76.6 2.313E+04 73.9 3.248E+04 70.8 4.767E+04 76.1 2.180E+04 75.9 2.156E+0430 0.1 74.8 4.403E+04 71.9 6.064E+04 68.8 8.660E+04 74.2 4.124E+04 73.9 4.100E+0430 0.215 72.8 8.244E+04 69.6 1.108E+05 66.5 1.541E+05 72.1 7.798E+04 71.9 7.699E+0430 0.464 70.4 1.536E+05 66.8 2.009E+05 63.4 2.727E+05 69.7 1.430E+05 69.5 1.407E+0530 1 67.1 2.822E+05 62.9 3.570E+05 59.0 4.693E+05 66.4 2.613E+05 66.3 2.539E+0530 1.59 64.7 3.962E+05 60.0 4.958E+05 55.9 6.380E+05 64.0 3.675E+05 63.7 3.605E+0530 2.15 62.8 4.961E+05 57.9 6.034E+05 53.4 7.703E+05 62.2 4.562E+05 61.9 4.475E+0530 4.65 56.5 8.997E+05 51.1 9.985E+05 46.0 1.220E+06 56.2 8.213E+05 56.0 7.679E+0530 10 48.4 1.760E+06 43.1 1.582E+06 37.9 2.253E+06 48.5 1.612E+06 48.5 1.281E+06
Rediset WMX 2%Sample: Pure bitumen Sasobit 2% Sasobit 3% Rediset WMX 1%
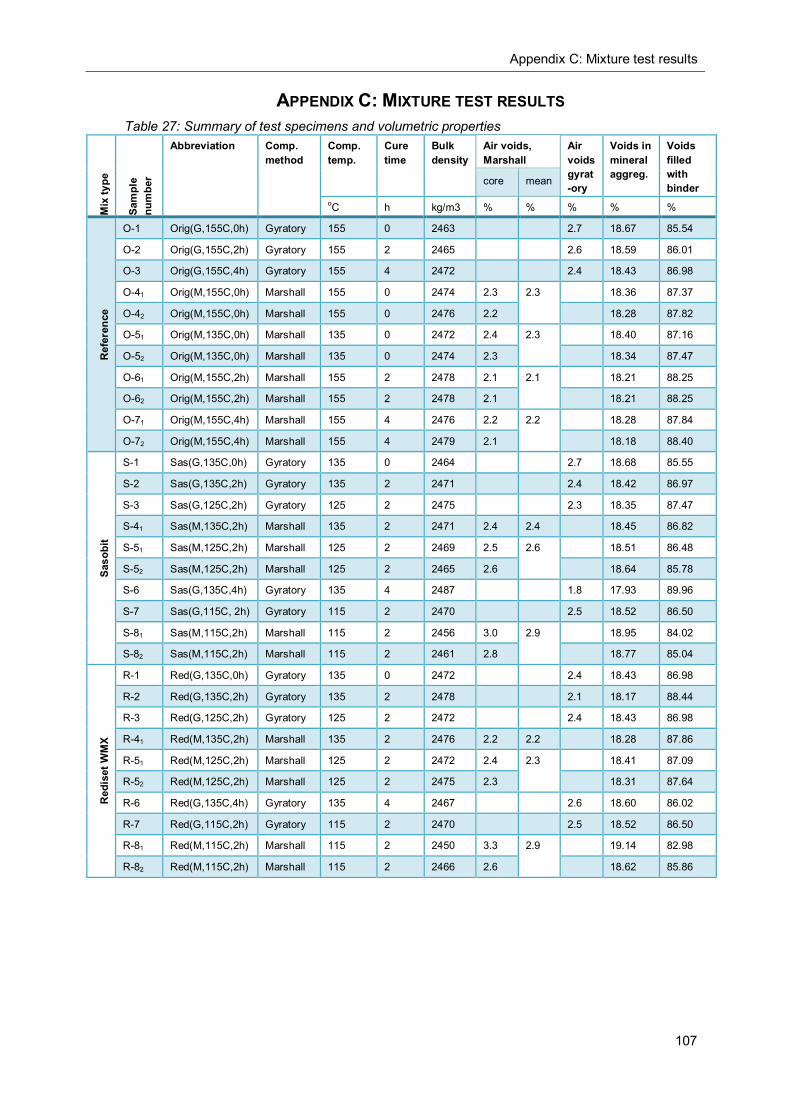
Appendix C: Mixture test results
107
APPENDIX C: MIXTURE TEST RESULTS Table 27: Summary of test specimens and volumetric properties
Mix
type
Sam
ple
num
ber
Abbreviation Comp. method
Comp. temp.
Cure time
Bulk density
Air voids, Marshall
Air voidsgyrat-ory
Voids in mineral aggreg.
Voids filled with binder
core mean
oC h kg/m3 % % % % %
Ref
eren
ce
O-1 Orig(G,155C,0h) Gyratory 155 0 2463 2.7 18.67 85.54
O-2 Orig(G,155C,2h) Gyratory 155 2 2465 2.6 18.59 86.01
O-3 Orig(G,155C,4h) Gyratory 155 4 2472 2.4 18.43 86.98
O-41 Orig(M,155C,0h) Marshall 155 0 2474 2.3 2.3 18.36 87.37
O-42 Orig(M,155C,0h) Marshall 155 0 2476 2.2 18.28 87.82
O-51 Orig(M,135C,0h) Marshall 135 0 2472 2.4 2.3 18.40 87.16
O-52 Orig(M,135C,0h) Marshall 135 0 2474 2.3 18.34 87.47
O-61 Orig(M,155C,2h) Marshall 155 2 2478 2.1 2.1 18.21 88.25
O-62 Orig(M,155C,2h) Marshall 155 2 2478 2.1 18.21 88.25
O-71 Orig(M,155C,4h) Marshall 155 4 2476 2.2 2.2 18.28 87.84
O-72 Orig(M,155C,4h) Marshall 155 4 2479 2.1 18.18 88.40
Saso
bit
S-1 Sas(G,135C,0h) Gyratory 135 0 2464 2.7 18.68 85.55
S-2 Sas(G,135C,2h) Gyratory 135 2 2471 2.4 18.42 86.97
S-3 Sas(G,125C,2h) Gyratory 125 2 2475 2.3 18.35 87.47
S-41 Sas(M,135C,2h) Marshall 135 2 2471 2.4 2.4 18.45 86.82
S-51 Sas(M,125C,2h) Marshall 125 2 2469 2.5 2.6 18.51 86.48
S-52 Sas(M,125C,2h) Marshall 125 2 2465 2.6 18.64 85.78
S-6 Sas(G,135C,4h) Gyratory 135 4 2487 1.8 17.93 89.96
S-7 Sas(G,115C, 2h) Gyratory 115 2 2470 2.5 18.52 86.50
S-81 Sas(M,115C,2h) Marshall 115 2 2456 3.0 2.9 18.95 84.02
S-82 Sas(M,115C,2h) Marshall 115 2 2461 2.8 18.77 85.04
Red
iset
WM
X
R-1 Red(G,135C,0h) Gyratory 135 0 2472 2.4 18.43 86.98
R-2 Red(G,135C,2h) Gyratory 135 2 2478 2.1 18.17 88.44
R-3 Red(G,125C,2h) Gyratory 125 2 2472 2.4 18.43 86.98
R-41 Red(M,135C,2h) Marshall 135 2 2476 2.2 2.2 18.28 87.86
R-51 Red(M,125C,2h) Marshall 125 2 2472 2.4 2.3 18.41 87.09
R-52 Red(M,125C,2h) Marshall 125 2 2475 2.3 18.31 87.64
R-6 Red(G,135C,4h) Gyratory 135 4 2467 2.6 18.60 86.02
R-7 Red(G,115C,2h) Gyratory 115 2 2470 2.5 18.52 86.50
R-81 Red(M,115C,2h) Marshall 115 2 2450 3.3 2.9 19.14 82.98
R-82 Red(M,115C,2h) Marshall 115 2 2466 2.6 18.62 85.86
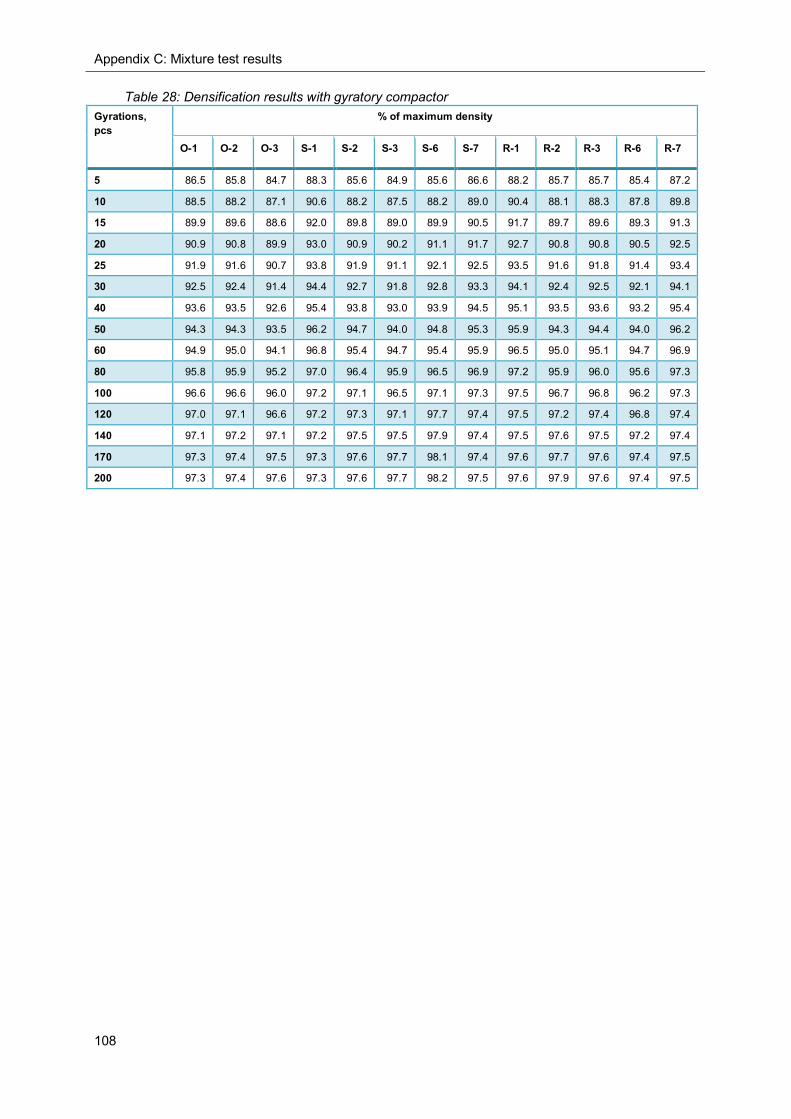
Appendix C: Mixture test results
108
Table 28: Densification results with gyratory compactor Gyrations, pcs
% of maximum density
O-1 O-2 O-3 S-1 S-2 S-3 S-6 S-7 R-1 R-2 R-3 R-6 R-7
5 86.5 85.8 84.7 88.3 85.6 84.9 85.6 86.6 88.2 85.7 85.7 85.4 87.2
10 88.5 88.2 87.1 90.6 88.2 87.5 88.2 89.0 90.4 88.1 88.3 87.8 89.8
15 89.9 89.6 88.6 92.0 89.8 89.0 89.9 90.5 91.7 89.7 89.6 89.3 91.3
20 90.9 90.8 89.9 93.0 90.9 90.2 91.1 91.7 92.7 90.8 90.8 90.5 92.5
25 91.9 91.6 90.7 93.8 91.9 91.1 92.1 92.5 93.5 91.6 91.8 91.4 93.4
30 92.5 92.4 91.4 94.4 92.7 91.8 92.8 93.3 94.1 92.4 92.5 92.1 94.1
40 93.6 93.5 92.6 95.4 93.8 93.0 93.9 94.5 95.1 93.5 93.6 93.2 95.4
50 94.3 94.3 93.5 96.2 94.7 94.0 94.8 95.3 95.9 94.3 94.4 94.0 96.2
60 94.9 95.0 94.1 96.8 95.4 94.7 95.4 95.9 96.5 95.0 95.1 94.7 96.9
80 95.8 95.9 95.2 97.0 96.4 95.9 96.5 96.9 97.2 95.9 96.0 95.6 97.3
100 96.6 96.6 96.0 97.2 97.1 96.5 97.1 97.3 97.5 96.7 96.8 96.2 97.3
120 97.0 97.1 96.6 97.2 97.3 97.1 97.7 97.4 97.5 97.2 97.4 96.8 97.4
140 97.1 97.2 97.1 97.2 97.5 97.5 97.9 97.4 97.5 97.6 97.5 97.2 97.4
170 97.3 97.4 97.5 97.3 97.6 97.7 98.1 97.4 97.6 97.7 97.6 97.4 97.5
200 97.3 97.4 97.6 97.3 97.6 97.7 98.2 97.5 97.6 97.9 97.6 97.4 97.5
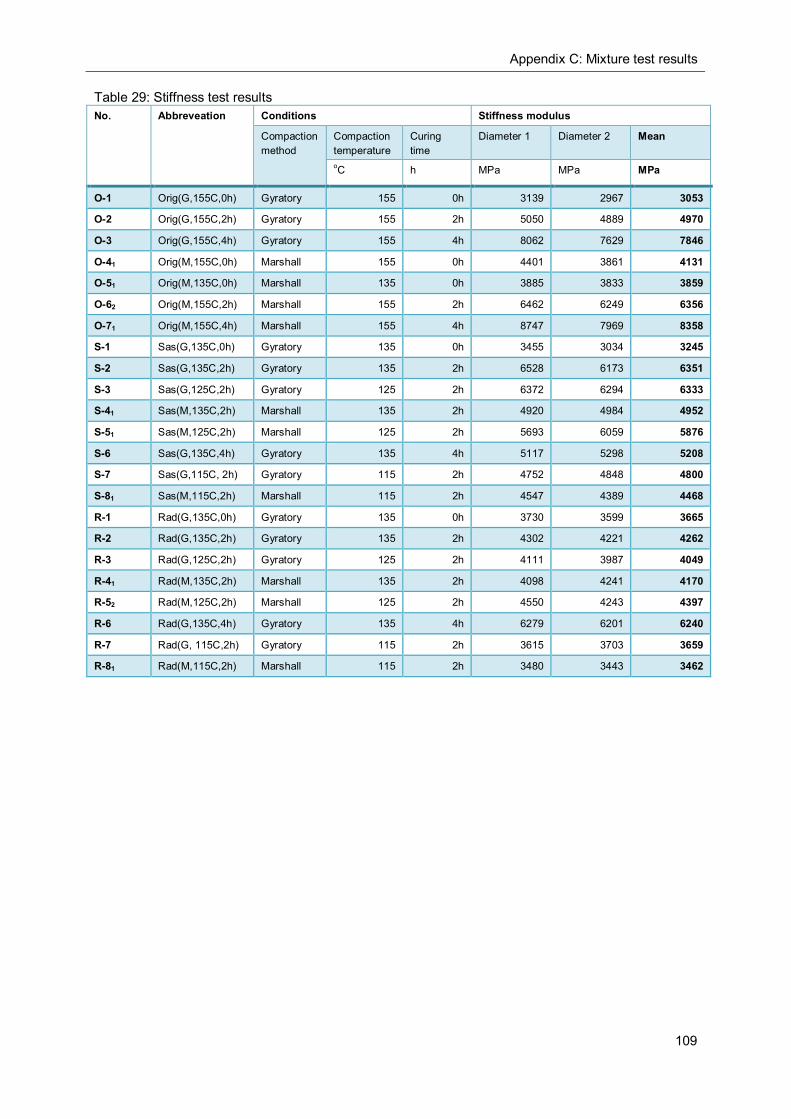
Appendix C: Mixture test results
109
Table 29: Stiffness test results No. Abbreveation Conditions Stiffness modulus
Compaction method
Compaction temperature
Curing time
Diameter 1 Diameter 2 Mean
oC h MPa MPa MPa
O-1 Orig(G,155C,0h) Gyratory 155 0h 3139 2967 3053
O-2 Orig(G,155C,2h) Gyratory 155 2h 5050 4889 4970
O-3 Orig(G,155C,4h) Gyratory 155 4h 8062 7629 7846
O-41 Orig(M,155C,0h) Marshall 155 0h 4401 3861 4131
O-51 Orig(M,135C,0h) Marshall 135 0h 3885 3833 3859
O-62 Orig(M,155C,2h) Marshall 155 2h 6462 6249 6356
O-71 Orig(M,155C,4h) Marshall 155 4h 8747 7969 8358
S-1 Sas(G,135C,0h) Gyratory 135 0h 3455 3034 3245
S-2 Sas(G,135C,2h) Gyratory 135 2h 6528 6173 6351
S-3 Sas(G,125C,2h) Gyratory 125 2h 6372 6294 6333
S-41 Sas(M,135C,2h) Marshall 135 2h 4920 4984 4952
S-51 Sas(M,125C,2h) Marshall 125 2h 5693 6059 5876
S-6 Sas(G,135C,4h) Gyratory 135 4h 5117 5298 5208
S-7 Sas(G,115C, 2h) Gyratory 115 2h 4752 4848 4800
S-81 Sas(M,115C,2h) Marshall 115 2h 4547 4389 4468
R-1 Rad(G,135C,0h) Gyratory 135 0h 3730 3599 3665
R-2 Rad(G,135C,2h) Gyratory 135 2h 4302 4221 4262
R-3 Rad(G,125C,2h) Gyratory 125 2h 4111 3987 4049
R-41 Rad(M,135C,2h) Marshall 135 2h 4098 4241 4170
R-52 Rad(M,125C,2h) Marshall 125 2h 4550 4243 4397
R-6 Rad(G,135C,4h) Gyratory 135 4h 6279 6201 6240
R-7 Rad(G, 115C,2h) Gyratory 115 2h 3615 3703 3659
R-81 Rad(M,115C,2h) Marshall 115 2h 3480 3443 3462
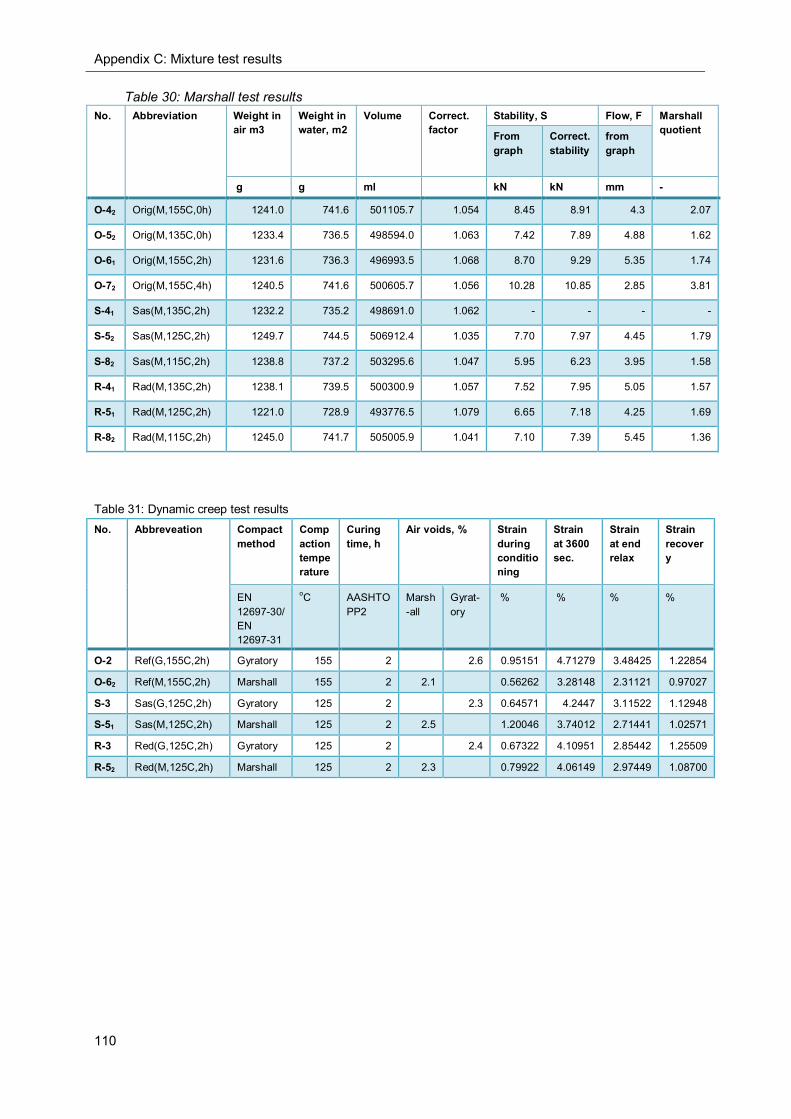
Appendix C: Mixture test results
110
Table 30: Marshall test results No. Abbreviation Weight in
air m3 Weight in water, m2
Volume Correct. factor
Stability, S Flow, F Marshall quotient From
graph Correct. stability
from graph
g g ml kN kN mm -
O-42 Orig(M,155C,0h) 1241.0 741.6 501105.7 1.054 8.45 8.91 4.3 2.07
O-52 Orig(M,135C,0h) 1233.4 736.5 498594.0 1.063 7.42 7.89 4.88 1.62
O-61 Orig(M,155C,2h) 1231.6 736.3 496993.5 1.068 8.70 9.29 5.35 1.74
O-72 Orig(M,155C,4h) 1240.5 741.6 500605.7 1.056 10.28 10.85 2.85 3.81
S-41 Sas(M,135C,2h) 1232.2 735.2 498691.0 1.062 - - - -
S-52 Sas(M,125C,2h) 1249.7 744.5 506912.4 1.035 7.70 7.97 4.45 1.79
S-82 Sas(M,115C,2h) 1238.8 737.2 503295.6 1.047 5.95 6.23 3.95 1.58
R-41 Rad(M,135C,2h) 1238.1 739.5 500300.9 1.057 7.52 7.95 5.05 1.57
R-51 Rad(M,125C,2h) 1221.0 728.9 493776.5 1.079 6.65 7.18 4.25 1.69
R-82 Rad(M,115C,2h) 1245.0 741.7 505005.9 1.041 7.10 7.39 5.45 1.36
Table 31: Dynamic creep test results No. Abbreveation Compact
method Compaction temperature
Curing time, h
Air voids, % Strain during conditioning
Strain at 3600 sec.
Strain at end relax
Strain recovery
EN 12697-30/ EN 12697-31
oC AASHTO PP2
Marsh-all
Gyrat-ory
% % % %
O-2 Ref(G,155C,2h) Gyratory 155 2 2.6 0.95151 4.71279 3.48425 1.22854
O-62 Ref(M,155C,2h) Marshall 155 2 2.1 0.56262 3.28148 2.31121 0.97027
S-3 Sas(G,125C,2h) Gyratory 125 2 2.3 0.64571 4.2447 3.11522 1.12948
S-51 Sas(M,125C,2h) Marshall 125 2 2.5 1.20046 3.74012 2.71441 1.02571
R-3 Red(G,125C,2h) Gyratory 125 2 2.4 0.67322 4.10951 2.85442 1.25509
R-52 Red(M,125C,2h) Marshall 125 2 2.3 0.79922 4.06149 2.97449 1.08700
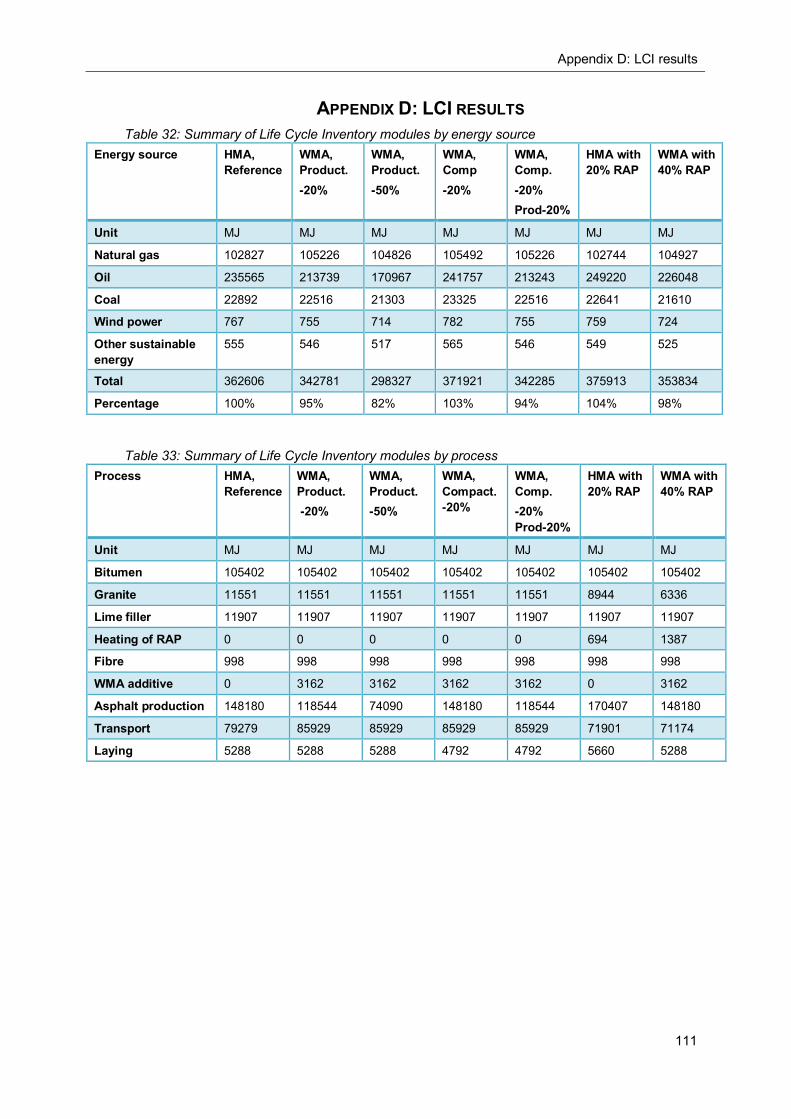
Appendix D: LCI results
111
APPENDIX D: LCI RESULTS Table 32: Summary of Life Cycle Inventory modules by energy source
Energy source HMA, Reference
WMA, Product. -20%
WMA, Product. -50%
WMA, Comp -20%
WMA, Comp. -20% Prod-20%
HMA with 20% RAP
WMA with 40% RAP
Unit MJ MJ MJ MJ MJ MJ MJ
Natural gas 102827 105226 104826 105492 105226 102744 104927
Oil 235565 213739 170967 241757 213243 249220 226048
Coal 22892 22516 21303 23325 22516 22641 21610
Wind power 767 755 714 782 755 759 724
Other sustainable energy
555 546 517 565 546 549 525
Total 362606 342781 298327 371921 342285 375913 353834
Percentage 100% 95% 82% 103% 94% 104% 98%
Table 33: Summary of Life Cycle Inventory modules by process Process HMA,
Reference WMA, Product. -20%
WMA, Product. -50%
WMA, Compact. -20%
WMA, Comp. -20% Prod-20%
HMA with 20% RAP
WMA with 40% RAP
Unit MJ MJ MJ MJ MJ MJ MJ
Bitumen 105402 105402 105402 105402 105402 105402 105402
Granite 11551 11551 11551 11551 11551 8944 6336
Lime filler 11907 11907 11907 11907 11907 11907 11907
Heating of RAP 0 0 0 0 0 694 1387
Fibre 998 998 998 998 998 998 998
WMA additive 0 3162 3162 3162 3162 0 3162
Asphalt production 148180 118544 74090 148180 118544 170407 148180
Transport 79279 85929 85929 85929 85929 71901 71174
Laying 5288 5288 5288 4792 4792 5660 5288