End Market Demand for Recycled Plastic OCTOBER2017
26
End Market Demand for Recycled Plastic OCTOBER 2017 Prepared by More Recycling with input from Plastic Forming Enterprises MORE RECYCLING • P.O. BOX 358 • SONOMA CA 95476 • 844.687.4757 Next Generation of Moore Recycling Associates Inc.
-
Upload
khangminh22 -
Category
Documents
-
view
0 -
download
0
Transcript of End Market Demand for Recycled Plastic OCTOBER2017

End Market Demand for Recycled Plastic
OCTOBER 2017Prepared by More Recycling with input from Plastic Forming Enterprises
MORE RECYCLING • P.O. BOX 358 • SONOMA CA 95476 • 844.687.4757 Next Generation of Moore Recycling Associates Inc.
End Market Demand for Recycled Plastic 2
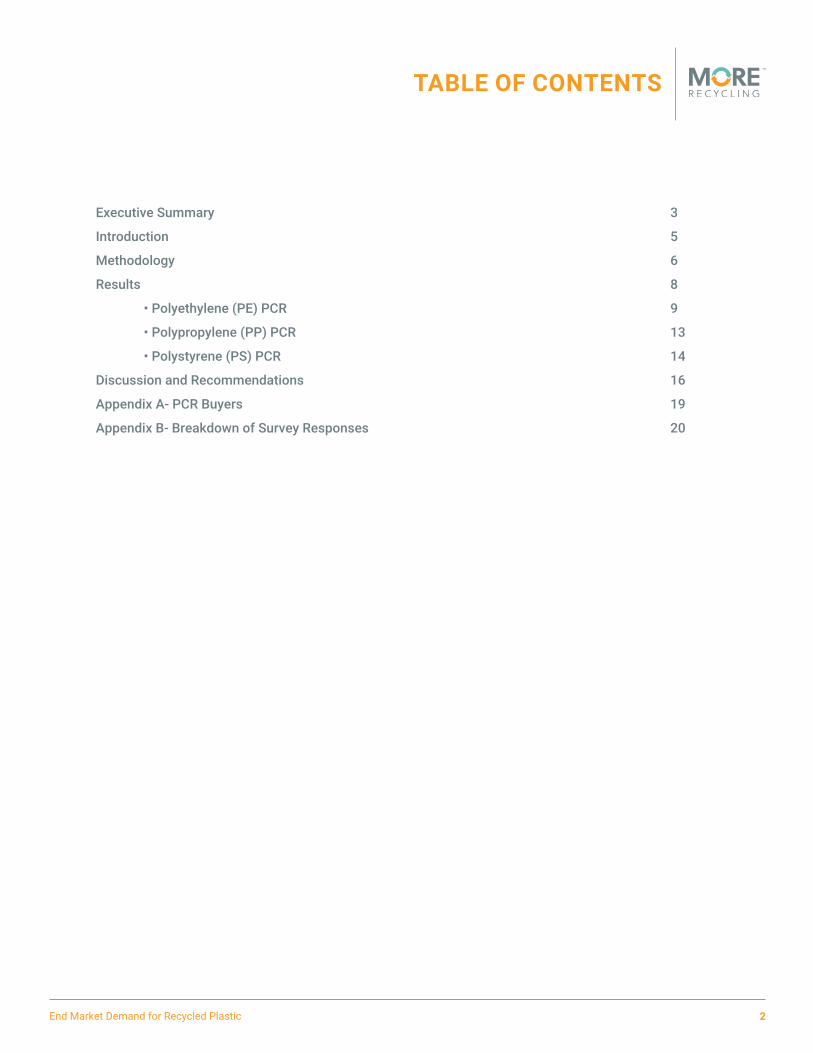
TABLE OF CONTENTS
Executive Summary 3
Introduction 5
Methodology 6
Results 8
• Polyethylene (PE) PCR 9
• Polypropylene (PP) PCR 13
• Polystyrene (PS) PCR 14
Discussion and Recommendations 16
Appendix A- PCR Buyers 19
Appendix B- Breakdown of Survey Responses 20
End Market Demand for Recycled Plastic 3
EXECUTIVE SUMMARY
The American Chemistry Council (ACC), the Association of Plastic Recyclers (APR) and the Sustainable Packaging Coalition (SPC) spearheaded this comprehensive study to document end market demand for post-consumer resin (PCR). In addition to funding the study, each organi-zation engaged their members and industry contacts to stimulate participation in a voluntary survey. This report covers the results of the survey for polyethylene (PE), polypropylene (PP) and polystyrene (PS)1 PCR use in 2016 among brand companies and manufacturers/converters. It also evaluates the opportunity for market expansion.
The study partners distributed the survey to members of nine different trade associations, captured data from 11 different types of converters and seven industry sectors, and collected responses from 126 companies, including many of the largest global brand companies. Despite the reach of the survey distribution, not all end-users participated in the study. Since most of the respondents were packaging manufacturers/converters, and a large portion of recycled plastic is used in applications beyond new packaging, more material was likely purchased for use in end products than was captured by this study. Participation in the survey was strong among large brand companies and converters.
The study findings include the following:
• The most commonly-cited barriers to using PCR are as follows: ‘not enough price advantage
overvirginresin’and‘notenoughPCRavailablethatmatchesourspecifications.’
•Themostcommonlyreportedequipmentneedwasventedorvacuum-degassingextruders.
• Lumber and fencing had the highest level of PCR content among the reported products – at
closeto100%onaverage.
• Rigid plastic applications (such as carts and plumbing products) had similarly high levels of
PCRcontent,althoughtheyexhibitedabroaderrangeinthepercentofPCRuse,at25-100%.
• Bottles and bags had the lowest level of PCR content among the reported products – at 25%
PCRonaverage.
•EighteencompaniesoptedtopubliclysharetheirinterestinpurchasingPCR(seeAppendixA).
•TotalreportedPCRpurchasesin2016were1.16billionpounds.
• The survey revealed the following capacity to purchase PE, PP and PS PCR—that meets both
thepriceandspecificationscompetitivewithvirginresin.
- 2,098-million pounds Polyethylene (PE)
- 444-million pounds Polypropylene (PP)
- 312-million pounds Polystyrene (PS)
1 The survey included five resins: polyethylene (PE), polystyrene (PS), polypropylene (PP), polyethylene terephthalate (PET), and polyvi-nyl chloride (PVC). PP responses were gathered to add to data APR received as part of their PP Fit For Use Study in 2016. Results for PET and PVC are not provided due to a lack in responses for those two resins.

End Market Demand for Recycled Plastic 4
EXECUTIVE SUMMARY
Comparing to reported pounds purchased for recycling in 20152, end market demand for the cur-rent level of PE and PP scrap plastic acquired in the United States for recycling is not adequate. The total capacity to purchase PE PCR that meets both price and specification requirements is 76% of the total reported as acquired for recycling in 2015. Even with the narrowing of that delta with yield loss in the reclamation process, if we want recycling rates to increase, demand for recycled content will need to increase to absorb that supply. The fundamental economics of plastic recycling are stressed while the cost of virgin resin is low. This stress on the system has a ripple effect. Without adequate end use demand there are fewer investments in maintaining collection, separation, and processing operations. To ensure the longevity of the plastic recycling sector in the United States, we must find ways to support the recycling system while the eco-nomics of recycling are stressed.
Market Demand for PE PCR in 2016
Purchased PCR in 2016 equivalent to 48% of 2015 US lbs. of post consumer plastic reclaimed
Capacity to Purchase PCR
equivalent to 76% of 2015 US lbs. of post consumer plastic acquired for recycling
76% of Total Material Acquired for Recycling
Reclaimed1.89 Blbs.
Exported0.87 Blbs.
2015Total PE Acquired
for Recycling2.76 Blbs.
0.9 Blbs.
2.06 Blbs.48%of Reclaimed
2016PE PCR
Purchased
2016 PE PCRCapacity2.1 Blbs.
(right price and meets specs)
Those only purchasingvirgin resin
Those purchasing
PE PCR
Source: 2015 Annual Plastics
Recycling Survey and Reports
Source: 2016 End Market Demand Study
Source: 2016 End Market Demand Study
0.04 Blbs.
Exports of reclaimed PE,
voluntary survey, incomplete responses,yield loss
2 Data from More Recycling’s 2015 Annual Plastic Recycling Survey. Reports available at MoreRecycling.com.2015 US National Post-Consumer Plastics Bottle Recycling Report, 2015 National Post-Consumer Plastic Bag & Film Recycling Report, 2015 National Post-Consumer Non-Bottle Rigid Plastic Recycling Report.

End Market Demand for Recycled Plastic 5
INTRODUCTION
LOWER COST SHALE GAS HAS PAVED THE WAY FOR A BOOM IN CAPACITY FOR VIRGIN POLYETHYLENE EXTRACTION, WHICH IS THE RESIN FOUND COMMONLY IN BALES OF FILM OR NON-BOTTLERIGIDPLASTICS.VIRGIN POLYETHYLENE PRODUCTION IS EXPECTED TO INCREASEBY50%INTHENEXT10YEARS.
More Recycling, formerly known as Moore Recycling Associates, has tracked the amount of plastic purchased for recycling in the US for over 10 years as a service to the American Chemis-try Council (ACC) and the Association of Plastic Recyclers (APR) as well as in Canada for seven years for the Canadian Plastics Industry Association (CPIA). Overall, the pounds acquired for recycling have increased steadily year after year. A common misconception among consumers is that most recyclable plastic is shipped overseas for processing, but in 2015, more than 70% of the material acquired for recycling was sold to domestic markets. Plastic bottles are largely domestically processed, particularly HDPE; however, 34% of the non-bottle rigid plastics and 52% of the film scrap material was purchased by export buyers in 2015. Restrictions in China on the import of scrap plastic, along with lower energy and virgin resin prices, pose challenges for plastic recycling, in partic-ular for those in the industry selling scrap plastic or cover-ing the cost of collection, sorting and processing material to create marketable post-consumer resin (PCR).
There has been more plastic scrap supply than domestic3 reclamation capacity for film and non-bottle rigid plastics for the last few years. Without increased demand for PCR in products, the capacity to reclaim plastic scrap is unlikely to grow. Historically it was the competitive cost advantage of PCR that drove its use over virgin resin when virgin resin prices were relatively high, provided there was PCR available that met the needed specifications.
Fortunately, several large brand companies have made strong commitments to increasing their use of PCR. If the value of PCR increases through increased demand for its use in an end prod-uct, post-consumer plastic is less likely to become litter or marine debris and is more likely to get sorted for market.
Programs such as Materials Recovery for the Future, the Wrap Recycling Action Program, pro-grams through The Recycling Partnership and many other recycling initiatives support increased collection and processing to create more and better quality supply of recycling feedstock. This End Market Demand (EMD) study documents the 2016 demand for PCR and sheds light on the potential challenges and opportunities that may be encountered when stimulating end market demand to meet the growing supply of materials acquired for recycling.
3 Domestic includes reclamation capacity in the United States and Canada

End Market Demand for Recycled Plastic 6
METHODOLOGY
PARTICIPATING TRADE ASSOCIATIONSThe following Trade Associations were integral to this study: • Association of Plastic Recyclers (APR) • EPS Industry Alliance (EPS-IA)• Sustainable Packaging Coalition (SPC) • Western Plastics Association (WPA)• American Chemistry Council (ACC) • Institute of Scrap Recycling Industries (ISRI)• Canadian Plastics Association (CPIA) • Vinyl Institute (VI)
More Recycling customized a survey instrument with input from Plastic Forming Enterprises, funding associations (ACC, APR, and SPC) and other industry experts. The survey asked about purchases in 2016 (also referred to as ‘purchased demand’), 2016 capacity to use PCR (if price and specification requirements are met) and the desired specifications for PCR and virgin resin. This voluntary study ran from early February 2017 through mid-June 2017.
Given the large number of survey targets, the initial strategy was to rely on the funders and industry contacts to disseminate the survey by way of trade associations, with members that are manufacturers or converters that are currently purchasing plastic resin.
There was also a link to the survey on PlasticsMarkets.org, a free resource that connects buyers and suppliers of recycled plastics. Additionally, social media (Twitter, Facebook, and LinkedIn) was used to share information about the study. Plastic News, Resource Recycling and Waste Dive provided coverage of the study, which helped to gain recognition for the study during out-reach and follow-up.
To improve the survey response rate, direct outreach to target companies was employed in addition to trade association dissemination. Several industry influencers supported the study by encouraging their peers and customers to respond to the survey, with a particular focus on the largest converters and known buyers of PCR. Though far more time-consuming than the initial dissemination strategy, direct outreach yielded far better response rates and more complete responses, as indicated by the unique bit.ly links that were tracked. It is estimated that the survey reached over 400 companies through direct email and more than 1,000 through online and social media sharing. Those that responded within the first few weeks of the study qualified for free spotlighting on PlasticsMarkets.org.
Respondent data were aggregated to provide company confidentiality. Furthermore, if less than 3 companies responded within a given category, the data were combined with other categories, if appropriate, or excluded to avoid revealing individual company data.
End Market Demand for Recycled Plastic 7
METHODOLOGY
The responses were vetted for double counting. Data control checks queried for multiple entries from the same company (since companies received the survey from multiple sources) and for pounds reported by a converter, which could constitute double counting from a brand company that buys the product from a converter.
The progress of the study was tracked by comparing the 2016 PCR purchased for each resin to the recycled plastic commodity quantities that were indicated as purchased in the 2015 Annual Plastic Recycling Reports. While there were yearly changes in demand that impacted reclaimers’ ability to purchase more bales, knowing the range of material purchased provides an indication of the potential demand in specific markets. It also helps expose obvious gaps in data or significant changes in demand.
Sensitive to survey fatigue, only companies that were not already captured in the Annual Recycling Studies were targeted. The survey also incorporated data from vertically-integrated companies that responded to the annual recycling survey to collect data on the end products that they produce.
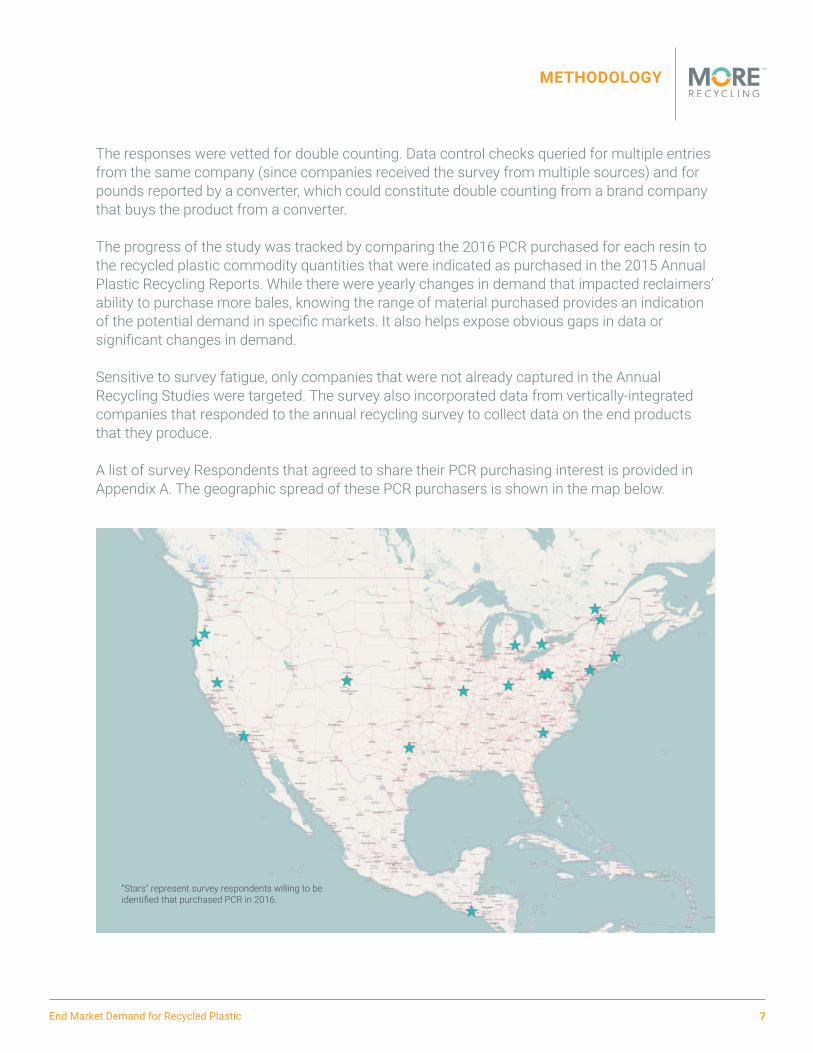
A list of survey Respondents that agreed to share their PCR purchasing interest is provided in Appendix A. The geographic spread of these PCR purchasers is shown in the map below.
“Stars” represent survey respondents willing to be identified that purchased PCR in 2016.
End Market Demand for Recycled Plastic 8
RESULTS
This study yielded 126 total unique responses, representing a broad cross-section of the plastics industry. The survey categorized the responses by trade association membership, manufacturing process type and industry sector, as outlined in Appendix B. Robust responses for PE, PP and PS indicate that the study captured a large percentage of the current market share for PCR and demonstrated the potential to absorb all the 2016 U.S. reclaimed material, if barriers such as price and quality are addressed. However, this does not include all of the material currently acquired and sold to export markets.
BARRIERS
The survey included questions about barriers, which were directed at both manufacturers that are already using PCR, as well as those that are currently only using virgin resin. PCR barriers were relatively consistent among the different resins studied. The most commonly-cited barriers were as follows:
• ‘Not enough price advantage over virgin resin’
•‘NotenoughPCRavailablethatmatchesourspecification’
In addition to price and quality, the other barriers included the following:
• ‘Variability of supply’
• ‘Contamination’
• ‘Lack of demand from customers’
The most commonly-cited barrier by virgin manufacturers was ‘FDA restrictions’; in other words, the inability to use PCR in food contact and/or medical applications. The difference between the barriers perceived by virgin manufacturers and those using PCR highlights the potential opportu-nity to bring new companies into the PCR marketplace.
EQUIPMENT AND TECHNOLOGY IMPROVEMENTS
Respondents were asked what, if any, additional equipment or technology options would improve their operational and financial capacity to use PCR in their products. Of the 20 Respondents that answered this question, the most commonly reported equipment need was vented or vacuum-degassing extruders. Other responses included metal detection and removal, improved melt filtration, washing and optical sorting.

End Market Demand for Recycled Plastic 9
RESULTS
PERespondents 2016Qty.PCR 2016Capacityto 2015U.S.Material Purchased (lbs) Purchase* PCR (lbs) Reclaimed (lbs)
HDPE TOTAL 455,000,000 591,000,000 1,310,000,000
FDA-Certified 53,000,000 100,000,000 NA
LDPE/LLDPE TOTAL 449,000,000 1,475,000,000** 580,000,000
FDA-Certified NA NA NA
Other/Unspecified NA 32,000,000 NA
TOTAL PE 904,000,000 2,098,000,000 1,890,000,000
POLYETHYLENE (PE) PCR
PE Overview
Of the 126 total survey respondents, 70 identified themselves as PE users – 41 were PE PCR users and 21 were virgin PE users; there were eight incomplete responses. For the PE results, the PCR and virgin user data were mutually exclusive. Of the 41 PE PCR users, 33 companies provid-ed their current purchasing demand for PCR, which was equivalent to 48% of the total amount of PE reclaimed in the U.S. The capacity of these companies to purchase material—that meets their pricing and specifications—is equivalent to 111% of the U.S. reclaimed PE4, which does not include the postconsumer PE film, bottles, and non-bottle rigid plastics acquired for recycling that was sold to export buyers. The capacity to purchase PE PCR is equivalent to 76% of all U.S. acquired PE, including that which was sold to export buyers. A large majority (98%) of the capac-ity to purchase PCR came from companies that are currently purchasing PCR. Only 2% of the capacity to purchase PCR came from brand companies or manufacturers/converters that are currently only using virgin resin.
The following table further outlines the demand for the sub-resins that were surveyed in this sec-tion: High Density Polyethylene (HDPE), Low Density Polyethylene (LDPE) and Linear Low Density Polyethylene (LLDPE). Capacity to purchase serves as a proxy for actual 2016 demand, if price and specification requirements were met.
Table 1. Total Polyethylene (PE) PCR 2016 Quantity Purchased and Proxy for Actual Demand
Source: More Recycling
*Capacity to purchase if PCR met price and specification requirements**Includes one statistical outlier given a 5% significance level.
4 Total U.S. PE reclamation is comprised of 54% bottle, 15% non-bottle and 31% film material. This data comes from More Recycling’s 2015 Annual Plastic Recycling Survey.
End Market Demand for Recycled Plastic 10
RESULTS
The ratio of HDPE to LDPE/LLDPE PCR purchased aligns closely with the American Chemistry Council Plastic Industry Producers’ Statistics (PIPS) Resin Review 2017 virgin sales data. As shown in the table above, HDPE PCR purchased comprises 50% of the total recycled PE purchas-es. The PIPS data indicate that HDPE comprises 47% of PE virgin resin sales. However, the sub resin breakdown of capacity to purchase PE PCR differs significantly from the PIPS data, in large part due to a statistical outlier. The study found that the capacity to purchase LDPE/LLDPE PCR (if price and specifications are met) was 72% of the overall capacity to purchase PE PCR, where-as the PIPS data indicate that LDPE/LLDPE sales comprise only 53% of the virgin resin market.
The fact that the 2015 U.S. reported PE reclamation, as shown in Table 1, is two-times larger than the reported PCR quantity purchased in 2016 by the EMD study respondents is a result of several factors. Twelve companies that reported using PE PCR did not provide purchasing data, and fourteen companies using PE in their products did not report whether they use PCR or virgin material. It is also possible that PE that was reclaimed in the U.S. was purchased for use outside of the U.S. Furthermore, the survey was voluntary and not all end-users participated.
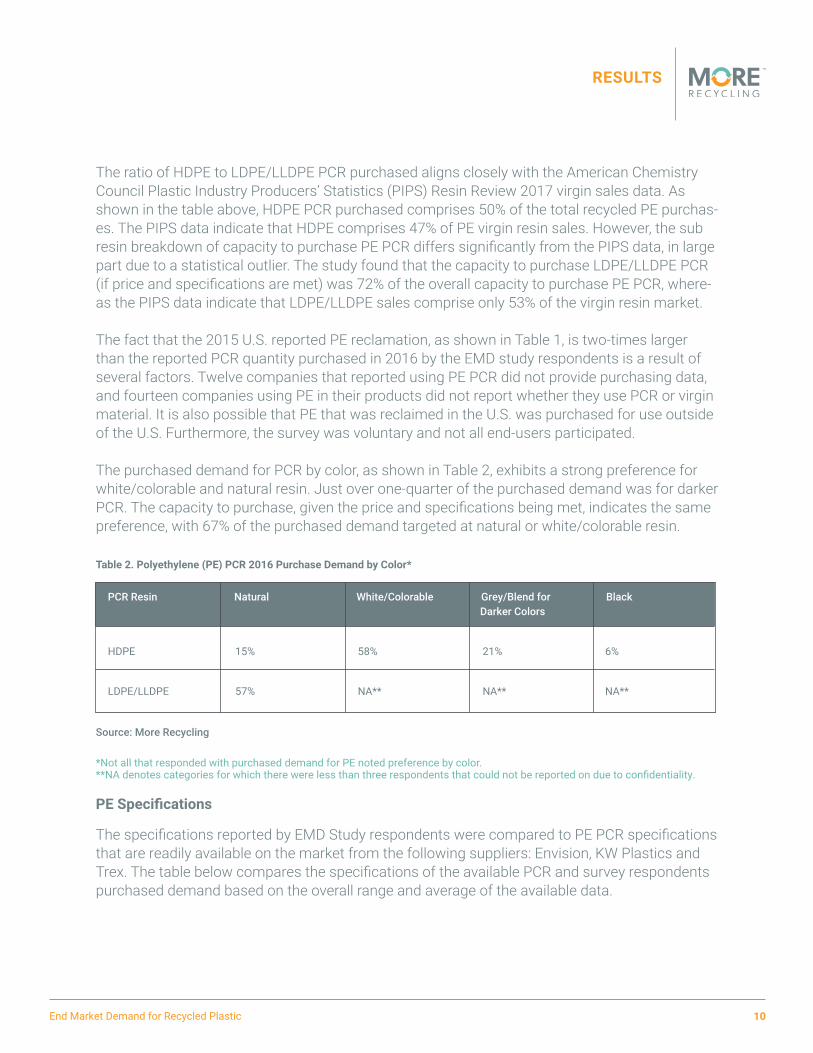
The purchased demand for PCR by color, as shown in Table 2, exhibits a strong preference for white/colorable and natural resin. Just over one-quarter of the purchased demand was for darker PCR. The capacity to purchase, given the price and specifications being met, indicates the same preference, with 67% of the purchased demand targeted at natural or white/colorable resin.
Table 2. Polyethylene (PE) PCR 2016 Purchase Demand by Color*
Source: More Recycling
*Not all that responded with purchased demand for PE noted preference by color.**NA denotes categories for which there were less than three respondents that could not be reported on due to confidentiality.
PE Specifications
The specifications reported by EMD Study respondents were compared to PE PCR specifications that are readily available on the market from the following suppliers: Envision, KW Plastics and Trex. The table below compares the specifications of the available PCR and survey respondents purchased demand based on the overall range and average of the available data.
PCR Resin Natural White/Colorable Grey/Blend for Black Darker Colors
HDPE 15% 58% 21% 6%
LDPE/LLDPE 57% NA** NA** NA**

End Market Demand for Recycled Plastic 11
RESULTS
Table 3. Comparing 2016 Polyethylene (PE) PCR Existing Supply Specifications to EMD Study Respondents PE PCR Specifications**
Source: More Recycling
* Not all that responded with purchased demand for PE provided specifications for their application.
The specifications reported by HDPE PCR respondents (demand) closely matched the specifica-tions for PCR pellets, which are readily available on the market (supply) from 3 major suppliers. The average density on the demand side was only 0.004 g/cc lower than the average on the supply side. Demand clustered tightly around 0.948-0.96 g/cc. The demand-side average tensile strength trended higher than the supply side by about 200 psi, although there is PCR on the market that meets the higher tensile strength requirement. In terms of the flexural modulus, the supply-side specifications were marginally (2,500 psi) lower than those of demand. The non-PE, moisture and ash content (not shown in Table 3 due to low response rates) were rela-tively consistent between supply and demand, with non-PE and ash content at marginally higher levels on the supply side of PCR. Beyond contamination, PCR must counteract its added heat history, which causes the slight degradation of the resin every time it is extruded to pellet form or otherwise heated and mechanically stressed. Taking this into account, PCR must then meet the general manufacturing desire for matching performance at a lower cost than virgin resin.
PE Markets
Respondents were asked how their PE purchases changed from 2015 to 2016. The amount of PE PCR purchased in 2016 increased compared to 2015 purchases for 74% of the respondents. Of the virgin PE users, only 42% reported an increase in 2016 virgin PE purchases. Because this study did not look at the magnitude of the changes in purchases from 2015 to 2016, the survey could not be used to conclude that PE PCR purchases are growing at a faster rate overall com-
Specification Existing Existing Survey Survey %EMDStudySpecs.Matching Supply Range Supply Average Respondents Range Respondents Average SupplierSpecs.
Density (g/cc) 0.97 - 0.918 0.953 0.98 - 0.912 0.949 100%
Tensile Strength (psi) 3,700 – 3,000 3,250 3,900 – 3,000 3,450 100%
Flex Mod (psi) 165K – 125K 137.5K 165K – 100K 140K 100%
Melt Flow (g/10min) 4 – 0.3 1.2 9 – 0.1 1.8 73%, >4
Non-PE Content (%) 15% - 0.12% 5% 25% - 0% 5.6% 92%, >15%
Moisture Content (%) 0.07% - 0.02% 0.05% 10% - 0% 3.4% 100%
PCR MUST MEET THE GENERAL MANUFACTURING DESIRE FOR MATCHING PERFORMANCE AT A LOWERCOSTTHANVIRGINRESIN.

End Market Demand for Recycled Plastic 12
RESULTS
pared to virgin PE purchases. The data does indicate that PCR users were significantly more likely to increase purchases compared to virgin users in 2016, as shown in Table 4 below.
Table 4. Change (in number of companies) in PE PCR and Virgin Resin Purchases from 2015 to 2016
Source: More Recycling
Looking at the PE PCR use by product application indicates a spectrum of ability to incorporate PCR, as shown in Table 5 below. The front-runners that were able to incorporate the highest level of PCR included lumber and fencing manufacturers, who were able to use close to 100% PCR in their products. Rigid plastic applications were similarly high, although they did exhibit a broader range of percent PCR use, from 25-100%. The data indicate that on average bottles and bags can incorporate roughly 25% PCR.
Table 5. Percent (by Weight) of Polyethylene (PE) PCR Incorporated into New Products as Reported by Survey Respondents
Source: More Recycling
PE Discussion
The similarity of the supply and purchased demand specifications can be interpreted as a sign of a relatively mature market. Processing technology that can produce near drop-in quality HDPE PCR exists and is economical in certain applications that require recycled content. Market pene-tration is partly hampered by pricing and by a dearth of drop-in quality PCR.
2015-2016 Change in # of PE PCR Users % of PE PCR Users # of Virgin PE Users % of Virgin PE UsersQuantity Purchased
Increase 20 74% 5 41.5%
Decrease 2 7% 2 17%
No Change 5 19% 5 41.5%
Product Type Average % PCR Range in % PCR used in New Products
Bottle 26% 25-28%
Bags 27% 25-40%
Other Rigids 82.5% 25-100%
End Market Demand for Recycled Plastic 13
RESULTS
According to conversations with reclaimers, there is likely a threshold of PCR use (e.g., 30%) that ranges for each company that justifies investments or changes in manufacturing, which are necessary to accommodate the potential variation in PCR. In other words, the cost savings or other driving factors resulting from the addition of small percentages of PCR to a product may not outweigh the added operational costs.
The shift to lighter, highly-engineered packaging by brand companies striving to meet sustain-able materials management goals increases the difficulty of using PCR in that same packaging. Most PCR from LLDPE or LDPE applications have a mixture of virgin resin types that make it difficult to achieve the high specification level of engineered virgin LLDPE or LDPE. Some brand companies reported the exploration of PCR use in non-packaging applications, such as pallets, crates and other rigid applications.
POLYPROPYLENE (PP) PCR
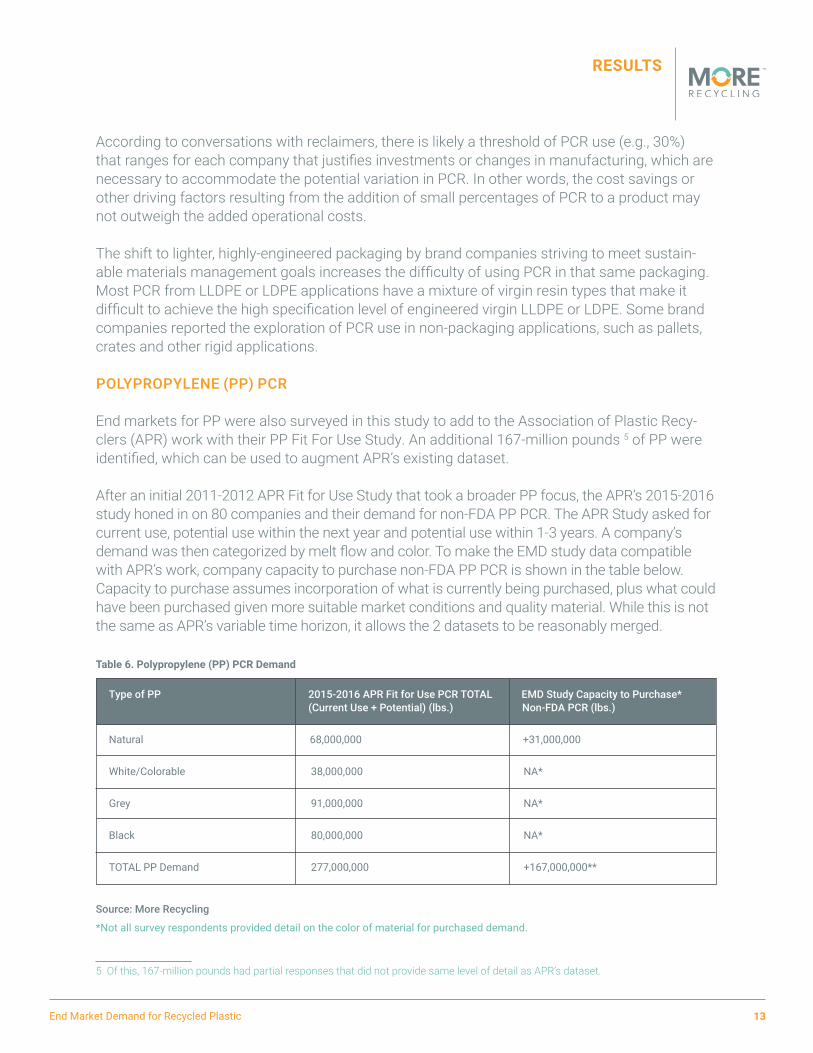
End markets for PP were also surveyed in this study to add to the Association of Plastic Recy-clers (APR) work with their PP Fit For Use Study. An additional 167-million pounds 5 of PP were identified, which can be used to augment APR’s existing dataset.
After an initial 2011-2012 APR Fit for Use Study that took a broader PP focus, the APR’s 2015-2016 study honed in on 80 companies and their demand for non-FDA PP PCR. The APR Study asked for current use, potential use within the next year and potential use within 1-3 years. A company’s demand was then categorized by melt flow and color. To make the EMD study data compatible with APR’s work, company capacity to purchase non-FDA PP PCR is shown in the table below. Capacity to purchase assumes incorporation of what is currently being purchased, plus what could have been purchased given more suitable market conditions and quality material. While this is not the same as APR’s variable time horizon, it allows the 2 datasets to be reasonably merged.
Table 6. Polypropylene (PP) PCR Demand
Source: More Recycling
*Not all survey respondents provided detail on the color of material for purchased demand.
5 Of this, 167-million pounds had partial responses that did not provide same level of detail as APR’s dataset.
Type of PP 2015-2016 APR Fit for Use PCR TOTAL EMD Study Capacity to Purchase* (CurrentUse+Potential)(lbs.)Non-FDAPCR(lbs.)
Natural 68,000,000 +31,000,000
White/Colorable 38,000,000 NA*
Grey 91,000,000 NA*
Black 80,000,000 NA*
TOTAL PP Demand 277,000,000 +167,000,000**
End Market Demand for Recycled Plastic 14
RESULTS
Of the 126 total survey respondents, 55 responded as PP users – six as PP PCR users, seven as virgin PP users and 42 with incomplete responses for PP. In 2016, the companies currently us-ing PCR purchased the equivalent of 36% of U.S. reclaimed PP. Including companies’ current use of PP from APR’s dataset; verified PCR purchases were equivalent to 70% of the U.S. reclaimed PP. The capacity of surveyed companies to purchase material that met their pricing and speci-fications in 2016 was equivalent to 49% of the U.S. reclaimed PP. The capacity to purchase PP PCR is equivalent to 39% of all U.S. acquired PP, including that which was sold to export buyers. A majority (75%) of the capacity to purchase was derived from companies currently using PCR, with the remaining 25% coming from companies that currently only use virgin PP.
The majority of the surveyed PP PCR market was tolerant of some level of odor. Most of the companies surveyed incorporated PCR into injection-molded products, whereas the virgin PP users that were surveyed mostly manufactured extruded sheets to make thermoformed food-service ware.
Based on the EMD study, the amount of PP PCR purchased in 2016 increased for 50% of respondents. Of the virgin PP users, 60% reported an increase in virgin PP purchases. Current virgin users exhibited a capacity to purchase PP PCR equal to 30% of their virgin purchases in 2016.
POLYSTYRENE (PS) PCR
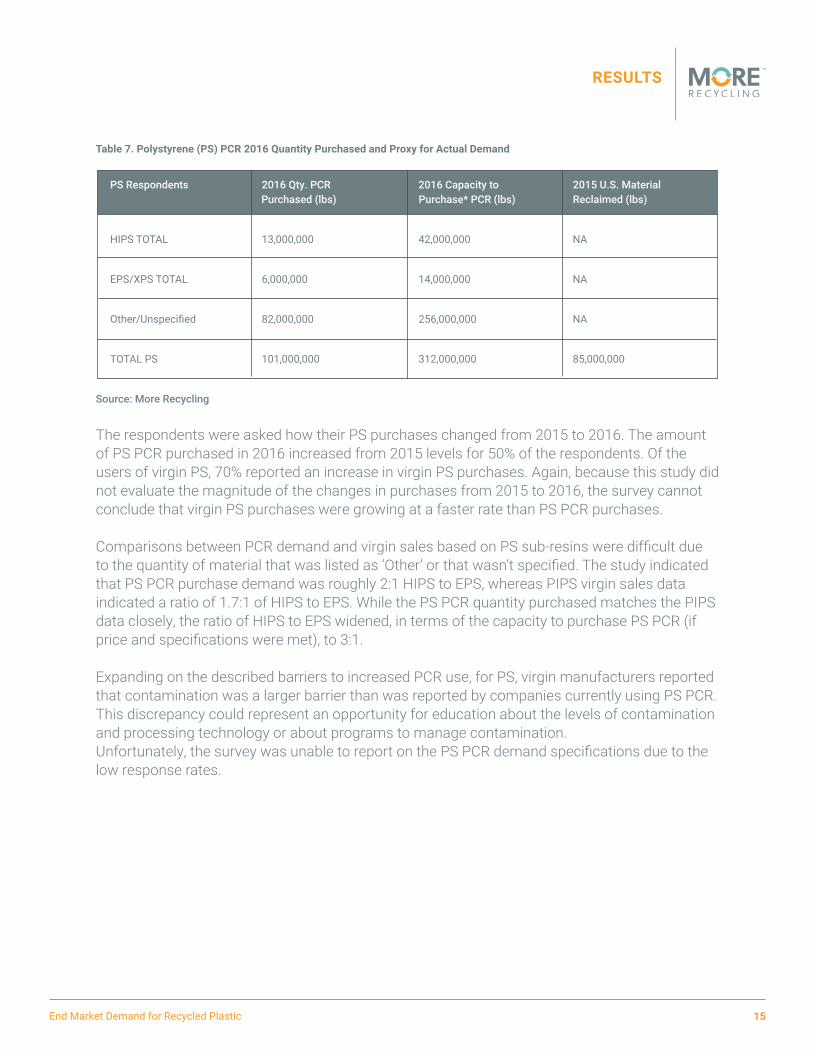
Of the 126 total survey respondents, 33 responded as PS users – eight PS PCR users, 17 virgin PS users and eight incomplete responses for PS. Of the eight PS PCR users, seven companies provided their current purchasing demand for PCR, which was equivalent to over 100% of the total amount of PS reclaimed in the U.S. 6. The capacity of these companies to purchase ma-terial that meets their pricing and specification requirements is equivalent to 366% of the U.S. reclaimed PS. The capacity to purchase PS PCR is equivalent to 316% of all U.S. acquired PS, in-cluding that which was sold to export buyers. A small majority, 53%, of the capacity to purchase derived from companies currently only using virgin PS resin, the rest was accounted for by companies that could expand their current PCR use by effectively addressing the barriers that are discussed below. Current virgin resin users exhibited a capacity to purchase PS PCR equal to 46% of their virgin purchases in 2016. The following chart further lays out this demand based on the sub-resins that were surveyed in this section: High Impact Polystyrene (HIPS), General Purpose Polystyrene (GPPS) and Expanded Polystyrene (EPS/XPS). Due to the low response rates, GPPS was combined with ‘Other/Unspecified’. The capacity to purchase serves as a proxy for actual 2016 demand—if price and specification requirements were met.
6 U.S. reclamation data comes from the EPS Industry Alliance’s 2013 EPS Recycling Rate Report and More Recycling’s Annual Plastic Recycling Survey. MORE’s Annual Plastic Recycling Survey is voluntary and represents the minimum quantity of material recycled.
End Market Demand for Recycled Plastic 15
RESULTS
Table 7. Polystyrene (PS) PCR 2016 Quantity Purchased and Proxy for Actual Demand
Source: More Recycling
The respondents were asked how their PS purchases changed from 2015 to 2016. The amount of PS PCR purchased in 2016 increased from 2015 levels for 50% of the respondents. Of the users of virgin PS, 70% reported an increase in virgin PS purchases. Again, because this study did not evaluate the magnitude of the changes in purchases from 2015 to 2016, the survey cannot conclude that virgin PS purchases were growing at a faster rate than PS PCR purchases.
Comparisons between PCR demand and virgin sales based on PS sub-resins were difficult due to the quantity of material that was listed as ‘Other’ or that wasn’t specified. The study indicated that PS PCR purchase demand was roughly 2:1 HIPS to EPS, whereas PIPS virgin sales data indicated a ratio of 1.7:1 of HIPS to EPS. While the PS PCR quantity purchased matches the PIPS data closely, the ratio of HIPS to EPS widened, in terms of the capacity to purchase PS PCR (if price and specifications were met), to 3:1.
Expanding on the described barriers to increased PCR use, for PS, virgin manufacturers reported that contamination was a larger barrier than was reported by companies currently using PS PCR. This discrepancy could represent an opportunity for education about the levels of contamination and processing technology or about programs to manage contamination.Unfortunately, the survey was unable to report on the PS PCR demand specifications due to the low response rates.
PSRespondents 2016Qty.PCR 2016Capacityto 2015U.S.Material Purchased (lbs) Purchase* PCR (lbs) Reclaimed (lbs)
HIPS TOTAL 13,000,000 42,000,000 NA
EPS/XPS TOTAL 6,000,000 14,000,000 NA
Other/Unspecified 82,000,000 256,000,000 NA
TOTAL PS 101,000,000 312,000,000 85,000,000

End Market Demand for Recycled Plastic 16
DISCUSSION AND RECOMMENDATIONS
This section presents Discussion and Recommendations that reflect More Recycling’s expertise and industry knowledge.
While this EMD Study demonstrated an appetite from manufacturers to purchase PCR, it also identified significant barriers that prevent this demand from being realized in the marketplace. According to most survey respondents, the price of PCR must be competitive with the price of virgin resin; PCR must also meet the quality specifications of virgin resin. Fortunately, the equipment and technology exists to produce a PCR feedstock meeting many products’ specifi-cations; however, this innovative equipment is rarely utilized when cost outpaces the return on investment. Reclaimers will be more likely to invest in the needed equipment if there is increased purchasing of PCR, or “realized” demand. The fundamental economics of plastic recycling are challenged when the cost of virgin resin is low. With global factors in mind, the most sustainable solution to our plastics recycling challenge is to increase the demand for PCR, raising the value on its end usage, and creating the necessary pull through to get more material recycled.
China’s National Sword, a policy restricting the import of scrap plastic, further strains the supply and demand balance in the U.S. and beyond. In 2015, approximately 52% of post-consumer film plastic and 34% of post-con-sumer non-bottle rigid plastic acquired in the U.S. were exported primarily to China. Even if demand from end users was currently strong, the U.S. lacks the domestic sorting and reclamation capacity to absorb all the material that has been previously consumed by the export market. Again, as stated above, investment in new domestic
capacity given current demand is unlikely. The demand side, as well as the supply side, of the equation must grow for plastic recycling to improve economically. If the goal of plastics manufacturers, converters, or users is successful plastic recycling, then it is essential for stakeholders to find solutions which support increased quantity and quality within the plastic recycling collection, separation, processing, and marketing system. The recycling system as a whole must be optimized to better capture and sort mixed plastic into discrete resins allowing reclaimers to make PCR from the mixed plastic, economically.
One critical solution in raising the quality and quantity of material collected curbside is the How2Recycle label. This packaging label supports a system in which manufacturers and producers are more vested in the outcome of their product post-use.
Those concerned about the long-term viability of plastic recycling must turn their focus toward stimulating more demand for recycled content in applications that are more tolerant of the PCR currently available on the market and in packaging that can evolve to embrace PCR. Consumers often expect a perfect product appearance, but there are many examples where visibly display-ing recycled content improves consumer perception of the product and the brand behind it.
“I BELIEVE THE BRANDS ARE GOING TO HAVE TO SHOW SUSTAINED COMMITMENT TO INCORPORATING RECYCLED MATERIALS IN THEIR MARKETPLACE, OR FACE THE POTENTIAL OF BEING REQUIRED TO BY EITHER LEGISLATIVE ORREGULATORYACTIVITY.”
–STEVE ALEXANDER, APR
End Market Demand for Recycled Plastic 17
DISCUSSION AND RECOMMENDATIONS
There are great examples in which companies, such as Green Toys, have opted to pay a premium for recycled content. Even with increased raw material costs, companies like PakTech have shift-ed to 100% PCR while enjoying dramatic growth. Founded through the fusion between an interest to use a growing waste stream and create an attractive commercial product, Trex Company is a long-standing recycling success story. Trex was originally a division of Mobile Chemical which made upfront investments in developing a way to handle scrap plastic in a more beneficial way than landfilling it. Today, it’s the world’s largest manufacturer of wood-alternative decking prod-ucts. For companies with sustainability goals, increasing PCR usage in products and packaging and then marketing such usage will support and increase end market demand.
A regulatory solution is recycled content legislation, which has stimulated demand for PCR as seen in California’s Rigid Plastic Packaging Container (RPPC) law. However, the current reg-ulation needs stronger government enforcement and a better culture of compliance among regulated companies to be effective. While recycled content legislation has the potential to be a driver for end market demand, there are likely other constructive drivers that should also be explored. One example of a market-based alternative to legislation that recognizes recycled content incorporation is Cradle to Cradle’s product certification.
Fortunately, organizations, such as the North America Plastic Recycling Alliance (NAPRA), are exploring other potential end market drivers. NAPRA is a new group that was formed to increase collaboration between trade associations working on efforts to drive the recovery of plastic products. Some states also have market development initiatives such as South Caroli-na’s Recycled Market Development Advisory Council, Pennsylvania Recycling Markets Center, and Minnesota Recycling Development Program. The fact is there is no quick, easy fix for the present set of fundamental economic barriers to recycling. With support from the American Chemistry Council (ACC), More Recycling (MORE) has produced a decision model to help navigate the tough tradeoffs in developing drivers for end market demand. The model helps to understand where some drivers may be more effective but costly.
MORE recommends government agencies move beyond tonnage based diversion goals for waste and recycling and into adoption of sustainable materials management in which there are market drivers that reduce the overall impact of our consumption choices and rewards compa-nies that use recycled content as a means of reducing their products’ greenhouse gas emis-sions. Rewarding companies that reduce their impact through use of PCR requires accountabil-ity and verification of PCR content claims. If government agencies cannot create a program to verify companies’ PCR content claims, an organization like APR or SPC may need to fill this need. As such a system requires time to design and implement, there is need for im-mediate action. Engaging consumers and brand companies in a “buy recycled” campaign is a good start. With greater emphasis on buying recycled in the “I want to be...” Keep America Beautiful campaigns, we may see greater sup-port for the brands striving for more PCR in their products especially if the campaign gains broad support from organi-zations like ACC, SPC, APR, The Recycling Partnership, the Institute of Scrap Recycling Industries, The Plastic Industry Association, etc. An effective campaign will need significant
“AT PROCTER & GAMBLE, WE UNDERSTAND STRONG PCR DEMAND IS ESSENTIAL TO A RO-BUSTRECYCLINGSUPPLYCHAIN.WEHAVEBEENUSING PCR IN PLASTIC PACKAGING FOR 29 YEARS AND ARE PROGRESSING TOWARDS OUR GOAL OF DOUBLINGOURPCRUSEBY2020.AND,ASPARTOFTHE NEW APR DEMAND CHAMPION PROGRAM, WE LOOK TO FURTHER DRIVE PCR DEMAND IN ‘WORK INPROCESS’ITEMS.
–STEVE SIKRA, PROCTOR & GAMBLE
End Market Demand for Recycled Plastic 18
DISCUSSION AND RECOMMENDATIONS
resources and research to gather critical consumer insight data. In the meantime, MORE is developing a recycled content products directory on behalf of ACC and other supporting orga-nizations to recognize companies using PCR in products. The directory will be available in early 2018 and provide a platform for others to recognize companies that are reducing their impact by using PCR.
Now is the time for public policy and private investment in recycling to come together and ensure continued growth in our country’s resource management system.
End Market Demand for Recycled Plastic 19
APPENDIX A - PCR BUYERS
Company Name Contact Name Contact Email Contact Phone Resins Purchased Number in 2016
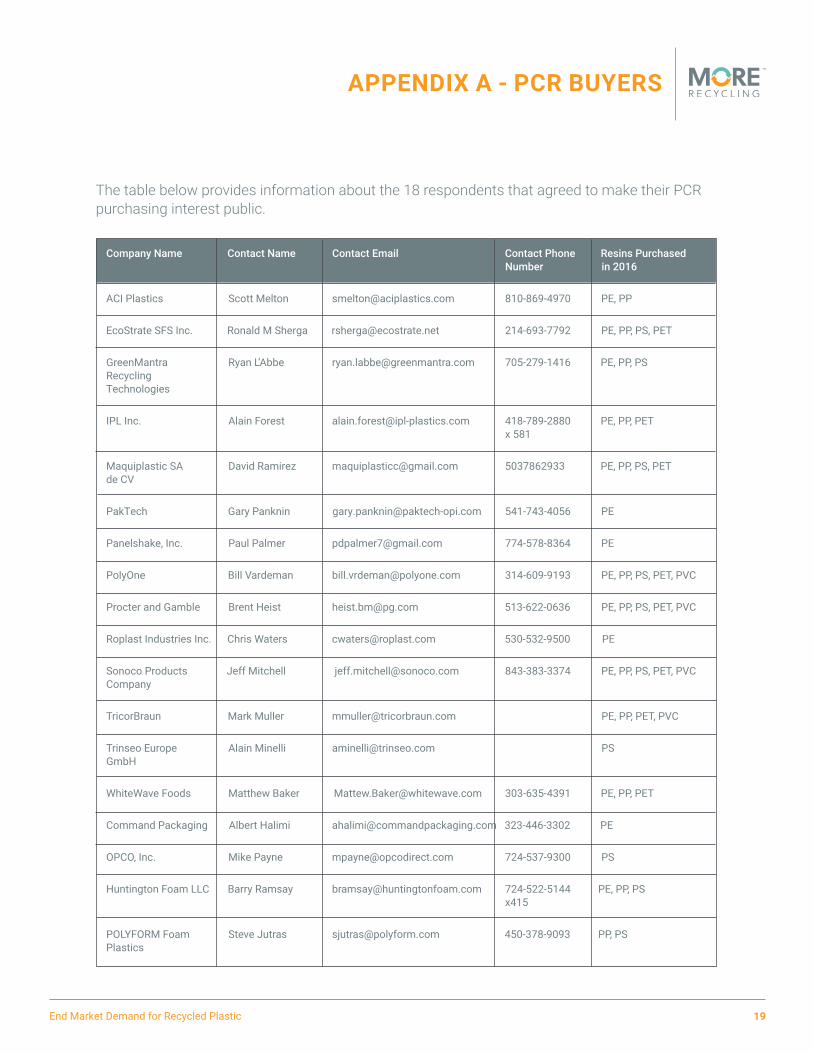
ACI Plastics Scott Melton [email protected] 810-869-4970 PE, PP
EcoStrate SFS Inc. Ronald M Sherga [email protected] 214-693-7792 PE, PP, PS, PET
GreenMantra Ryan L’Abbe [email protected] 705-279-1416 PE, PP, PSRecycling Technologies
IPL Inc. Alain Forest [email protected] 418-789-2880 PE, PP, PET x 581
Maquiplastic SA David Ramirez [email protected] 5037862933 PE, PP, PS, PETde CV
PakTech Gary Panknin [email protected] 541-743-4056 PE
Panelshake, Inc. Paul Palmer [email protected] 774-578-8364 PE
PolyOne Bill Vardeman [email protected] 314-609-9193 PE, PP, PS, PET, PVC
Procter and Gamble Brent Heist [email protected] 513-622-0636 PE, PP, PS, PET, PVC
Roplast Industries Inc. Chris Waters [email protected] 530-532-9500 PE
Sonoco Products Jeff Mitchell [email protected] 843-383-3374 PE, PP, PS, PET, PVCCompany
TricorBraun Mark Muller [email protected] PE, PP, PET, PVC
Trinseo Europe Alain Minelli [email protected] PSGmbH
WhiteWave Foods Matthew Baker [email protected] 303-635-4391 PE, PP, PET
Command Packaging Albert Halimi [email protected] 323-446-3302 PE
OPCO, Inc. Mike Payne [email protected] 724-537-9300 PS
Huntington Foam LLC Barry Ramsay [email protected] 724-522-5144 PE, PP, PS x415
POLYFORM Foam Steve Jutras [email protected] 450-378-9093 PP, PSPlastics
The table below provides information about the 18 respondents that agreed to make their PCR purchasing interest public.

End Market Demand for Recycled Plastic 20
APPENDIX B - BREAKDOWN OF SURVEY RESPONSES
Association of Plastic Recyclers 24%
Canadian Plastics Industry Association 6%
Flexible Packaging Association 2%
International Assoc. of Plastic Distributors 1%
Plastics Industry Association 7%
Plastic Pipe Institute 1%
Retail Packaging Association 2%
Society of Plastics Engineers* 21%
Sustainable Packaging Coaltion 20%
Vinyl Institute 1%
Western Plastics Association 7%
American Chemistry Council 8%
•••••••••••
This appendix provides a breakdown of EMD Study respondents by trade association member-ship, process type and industry sector.
Chart 1. Responding Companies by Trade Association Membership
Source: More Recycling
*A member of the Society of Plastics Engineers facilitated survey distribution to appropriate contacts.
MANUFACTURING PROCESS TYPES
The survey categorized responses by process type to better understand differences in their abili-ty to incorporate PCR. The following processing types were the most commonly reported among all respondents:
• Injection molding
• Extruded sheet
• Blow molding
End Market Demand for Recycled Plastic 21
APPENDIX B - BREAKDOWN OF SURVEY RESPONSES
Polyethylene (PE)
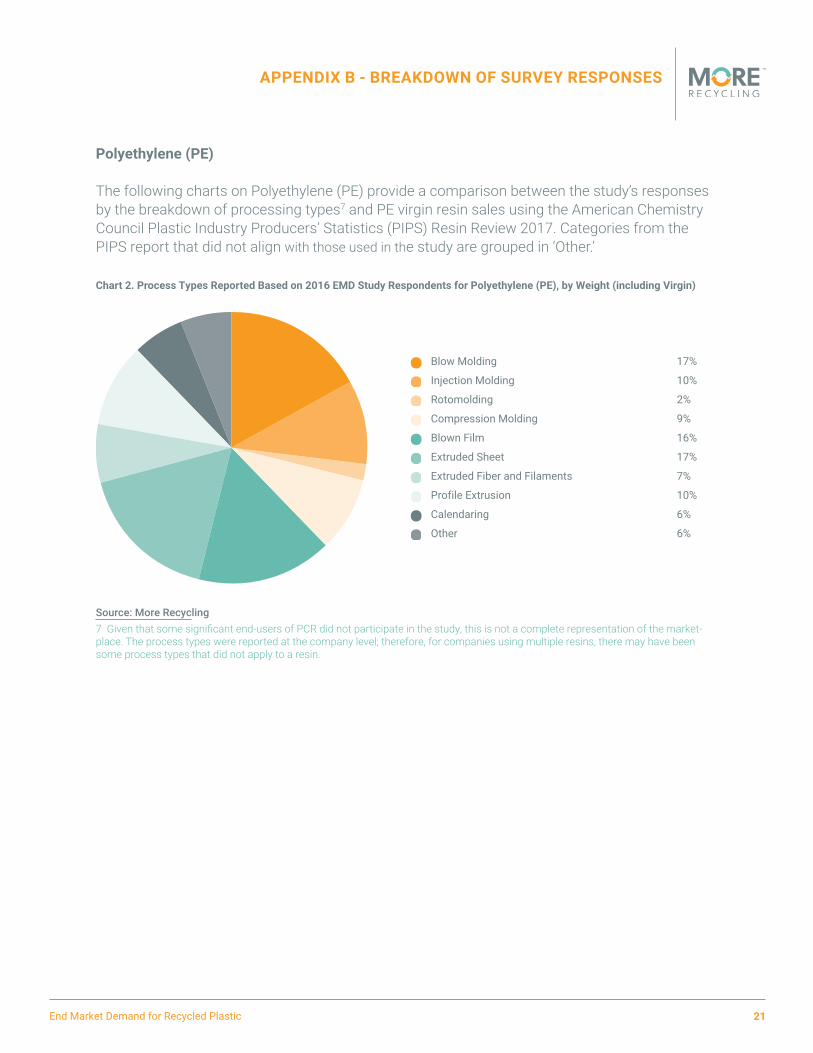
The following charts on Polyethylene (PE) provide a comparison between the study’s responses by the breakdown of processing types7 and PE virgin resin sales using the American Chemistry Council Plastic Industry Producers’ Statistics (PIPS) Resin Review 2017. Categories from the PIPS report that did not align with those used in the study are grouped in ‘Other.’
Chart 2. Process Types Reported Based on 2016 EMD Study Respondents for Polyethylene (PE), by Weight (including Virgin)
Blow Molding 17%
Injection Molding 10%
Rotomolding 2%
Compression Molding 9%
Blown Film 16%
Extruded Sheet 17%
Extruded Fiber and Filaments 7%
Profile Extrusion 10%
Calendaring 6%
Other 6%
••••••••••Source: More Recycling7 Given that some significant end-users of PCR did not participate in the study, this is not a complete representation of the market-place. The process types were reported at the company level; therefore, for companies using multiple resins, there may have been some process types that did not apply to a resin.
End Market Demand for Recycled Plastic 22
APPENDIX B - BREAKDOWN OF SURVEY RESPONSES
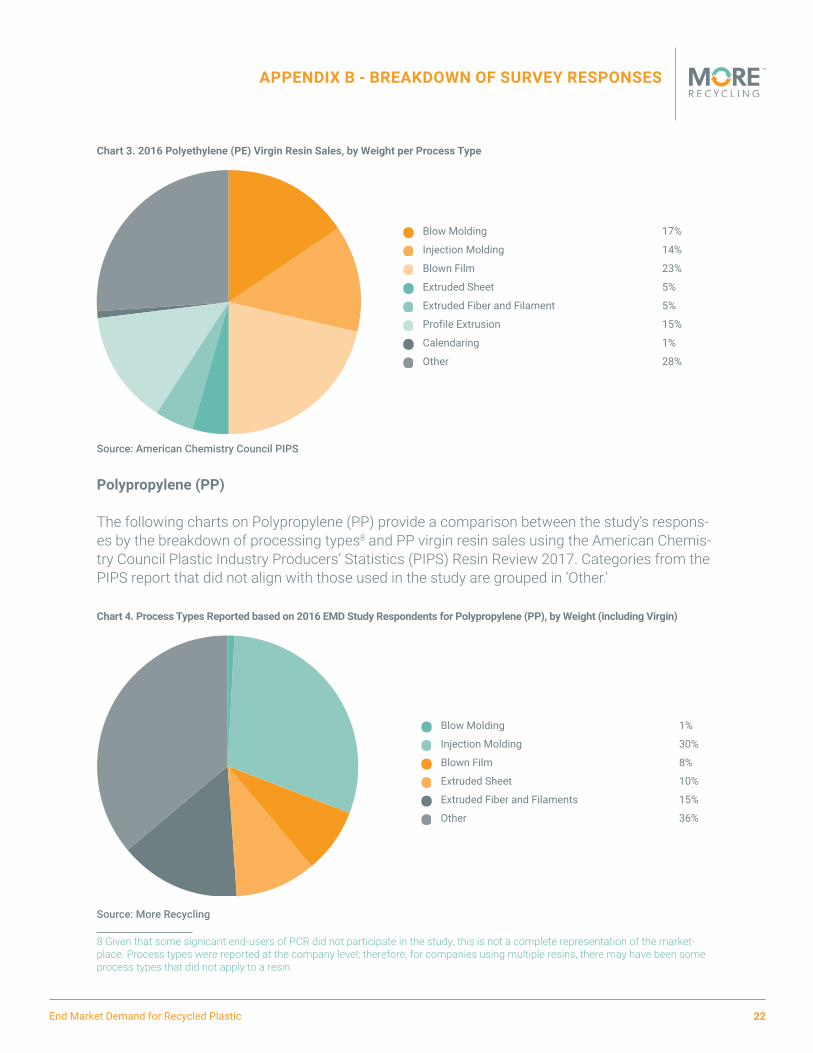
Chart 3. 2016 Polyethylene (PE) Virgin Resin Sales, by Weight per Process Type
Source: American Chemistry Council PIPS
Polypropylene (PP)
The following charts on Polypropylene (PP) provide a comparison between the study’s respons-es by the breakdown of processing types8 and PP virgin resin sales using the American Chemis-try Council Plastic Industry Producers’ Statistics (PIPS) Resin Review 2017. Categories from the PIPS report that did not align with those used in the study are grouped in ‘Other.’
Chart 4. Process Types Reported based on 2016 EMD Study Respondents for Polypropylene (PP), by Weight (including Virgin)
Source: More Recycling
8 Given that some signicant end-users of PCR did not participate in the study, this is not a complete representation of the market- place. Process types were reported at the company level; therefore, for companies using multiple resins, there may have been some process types that did not apply to a resin.
Blow Molding 17%
Injection Molding 14%
Blown Film 23%
Extruded Sheet 5%
Extruded Fiber and Filament 5%
Profile Extrusion 15%
Calendaring 1%
Other 28%
••••••••
Blow Molding 1%
Injection Molding 30%
Blown Film 8%
Extruded Sheet 10%
Extruded Fiber and Filaments 15%
Other 36%
••••••
End Market Demand for Recycled Plastic 23
APPENDIX B - BREAKDOWN OF SURVEY RESPONSES
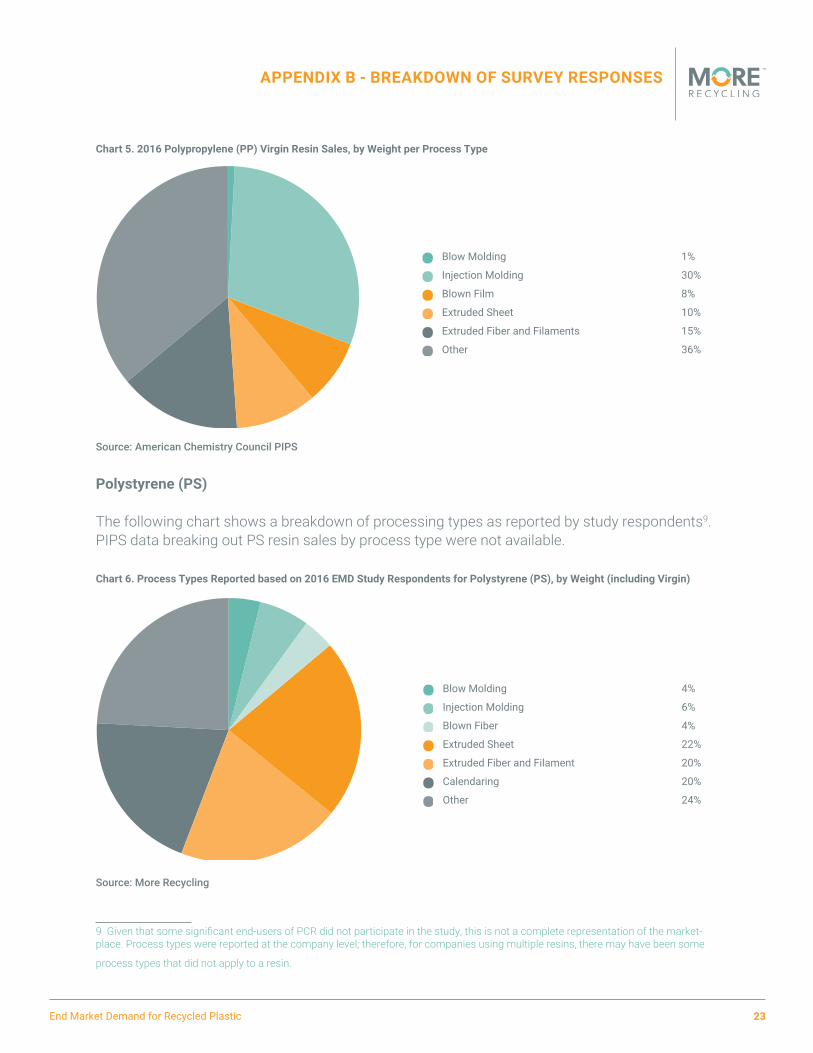
Chart 5. 2016 Polypropylene (PP) Virgin Resin Sales, by Weight per Process Type
Source: American Chemistry Council PIPS
Polystyrene (PS)
The following chart shows a breakdown of processing types as reported by study respondents9. PIPS data breaking out PS resin sales by process type were not available.
Chart 6. Process Types Reported based on 2016 EMD Study Respondents for Polystyrene (PS), by Weight (including Virgin)
Source: More Recycling
9 Given that some significant end-users of PCR did not participate in the study, this is not a complete representation of the market-place. Process types were reported at the company level; therefore, for companies using multiple resins, there may have been some
process types that did not apply to a resin.
Blow Molding 1%
Injection Molding 30%
Blown Film 8%
Extruded Sheet 10%
Extruded Fiber and Filaments 15%
Other 36%
••••••
Blow Molding 4%
Injection Molding 6%
Blown Fiber 4%
Extruded Sheet 22%
Extruded Fiber and Filament 20%
Calendaring 20%
Other 24%
•••••••
End Market Demand for Recycled Plastic 24
APPENDIX B - BREAKDOWN OF SURVEY RESPONSES
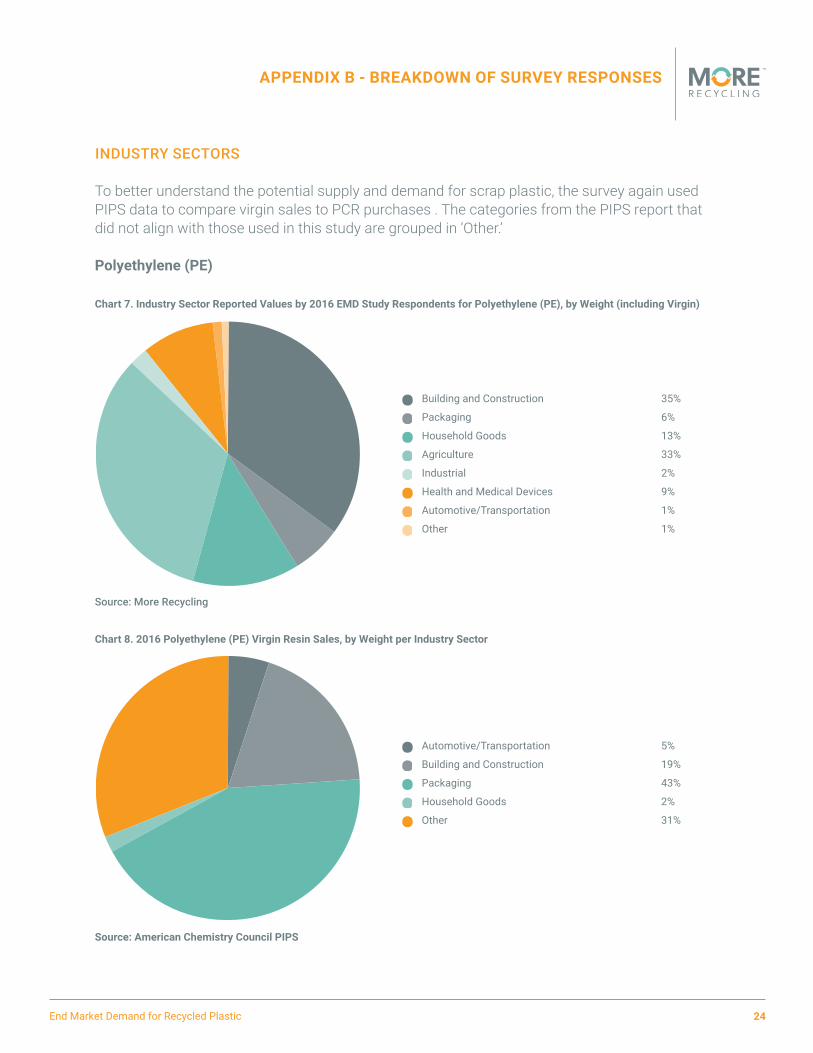
INDUSTRY SECTORS
To better understand the potential supply and demand for scrap plastic, the survey again used PIPS data to compare virgin sales to PCR purchases . The categories from the PIPS report that did not align with those used in this study are grouped in ‘Other.’
Polyethylene (PE)
Chart 7. Industry Sector Reported Values by 2016 EMD Study Respondents for Polyethylene (PE), by Weight (including Virgin)
Source: More Recycling
Chart 8. 2016 Polyethylene (PE) Virgin Resin Sales, by Weight per Industry Sector
Source: American Chemistry Council PIPS
Building and Construction 35%
Packaging 6%
Household Goods 13%
Agriculture 33%
Industrial 2%
Health and Medical Devices 9%
Automotive/Transportation 1%
Other 1%
••••••••
Automotive/Transportation 5%
Building and Construction 19%
Packaging 43%
Household Goods 2%
Other 31%
•••••
End Market Demand for Recycled Plastic 25
APPENDIX B - BREAKDOWN OF SURVEY RESPONSES
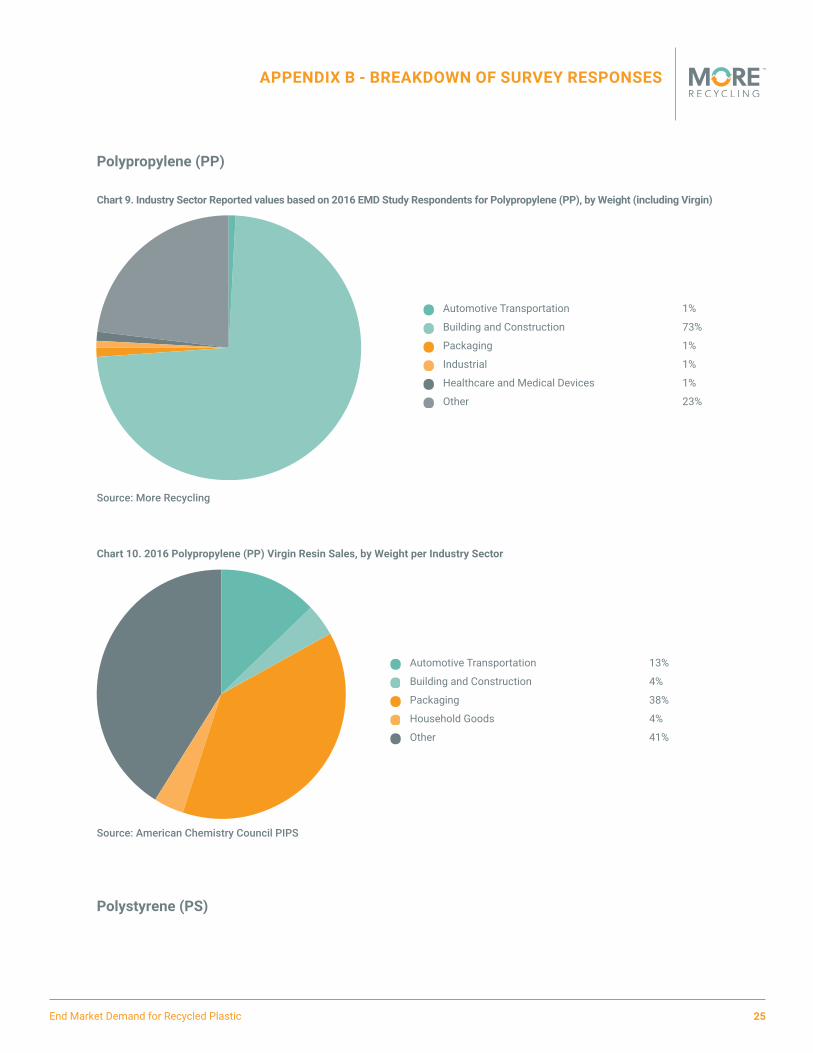
Polypropylene (PP)
Chart 9. Industry Sector Reported values based on 2016 EMD Study Respondents for Polypropylene (PP), by Weight (including Virgin)
Source: More Recycling
Chart 10. 2016 Polypropylene (PP) Virgin Resin Sales, by Weight per Industry Sector
Source: American Chemistry Council PIPS
Polystyrene (PS)
Automotive Transportation 1%
Building and Construction 73%
Packaging 1%
Industrial 1%
Healthcare and Medical Devices 1%
Other 23%
••••••
Automotive Transportation 13%
Building and Construction 4%
Packaging 38%
Household Goods 4%
Other 41%
•••••

End Market Demand for Recycled Plastic 26
APPENDIX B - BREAKDOWN OF SURVEY RESPONSES
Chart 11. Industry Sector Reported values based on 2016 EMD Study Respondents for Polystyrene (PS), by Weight (including Virgin)
Source: More Recycling
Chart 12. 2016 Polystyrene (PS) Virgin Resin Sales, by Weight per Industry Sector
Source: American Chemistry Council PIPS
Automotive/Transportation 13%
Building and Construction 15%
Packaging 14%
Household Goods 14%
Agriculture 13%
Industrial 14%
Health and Medical Devices 14%
Other 3%
••••••••
Building and Construction 11%
Packaging 30%
Household Goods 2%
Other 57%
••••