System-level Fiscal Capacity for Funding Education ... - TN.gov
28
System-level Fiscal Capacity for Funding Education in Tennessee Prepared by Harry A. Green, Ph.D. Executive Director Lynnisse Roehrich-Patrick, J.D. Director of Special Projects September 2004 Tennessee Advisory Commission on Intergovernmental Relations
-
Upload
khangminh22 -
Category
Documents
-
view
0 -
download
0
Transcript of System-level Fiscal Capacity for Funding Education ... - TN.gov

System-level Fiscal Capacity for Funding Education
in Tennessee
Prepared by
Harry A. Green, Ph.D. Executive Director
Lynnisse Roehrich-Patrick, J.D. Director of Special Projects
September 2004
Tennessee Advisory Commission on Intergovernmental Relations
1
Prototype System-level Fiscal Capacity Model How We Got Here
August 1990: TACIR staff’s initial exposition of the difficulties of determining fiscal capacity for school systems in Tennessee published in a staff report titled Fiscal Capacity of Public School Systems in Tennessee.
February 16, 1995: Supreme Court of Tennessee finds for the smalls schools plaintiffs that
exclusion of teachers' salary increases from the equalization formula is of such magnitude that it would substantially impair the objectives of the plan; consequently, the plan must include equalization of teachers' salaries according to the BEP formula.
February 27, 1995: Brent Poulton, Executive Director of the State Board of Education, writes expressing concern about the use of a county fiscal capacity model and suggesting that the overall BEP funding formula would be improved “if we could establish an index for each of the 139 school systems.”
March 8, 1995: Jane Walters, Commission of Education, writes in relation to the department’s review of teachers’ salary equalization, asking that Dr. Green to “review the issue [of fiscal capacity] and make a proposal on how [it] can be done at the school system level.”
June 1995: Requests to revise the TACIR fiscal capacity formula are brought before the Commission. Commissioner Walters notes that
if the department could distribute BEP funds on a fiscal capacity index that more accurately reflected the situation in each district, it would aid in the quest for equalization, be as fair as possible, and help the department in its continual battle over salaries and other issues where there is such great disparity.
Dr. Poulton notes that
The original premise of the BEP was that the responsibility for funding schools was split between the state and local governments. Given that local governments had different abilities to pay, local responsibility would be divided according to ability to pay. Conceptually at least, the

2 H:\FISCAP\2005fc\BEPRC08Sep04\System-level Fiscal Capacity for Funding Education in Tennessee.doc
notion was that there were 139 school systems and there would be 139 splits of that local responsibility.
Chairman Bragg asked TACIR staff to meet with department and board staff to discuss the issue further and report back at the next meeting.
June 1997: With full funding of the BEP formula set for the upcoming year, at the Commission’s request, Asst. Commissioner Roehrich-Patrick, Department of Education, presents information to the Commission as evidence of real differences in ability to pay between counties and other systems within counties. With few exceptions, city systems and special school districts have higher salaries and expenditures per student. Chairman Rochelle notes that TACIR will review the fiscal capacity model, but notes that the lack of data for income at the city and special school district level limits the effort.
June 1998: Intent to develop sub-county model included in TACIR work program.
Summer/Fall 1998: Initial development of one-tier and two-tier sub-county models. Staff proceeds with development of two-tier model.
Summer/Fall 2000 through Fall 2002: Discussion of municipal overburden as it relates to sub-county model; significant cross-research with Comptroller’s Office of Education Accountability (OREA).
September 2001: Prototype two-tier model presented to Commission.
Fall 2001: favorable review of draft model by outside experts in school finance and statistics, including OREA staff.
October 2002: Supreme Court of Tennessee strikes down current funding scheme for funding/establishing teachers’ salaries; work on sub-county fiscal capacity model begins again in earnest.
Fall 2002: First one-tier algebraic prototype developed by TACIR staff.
Winter 2003: TACIR staff explore alternatives to sub-county model at request of Comptroller of the Treasury.
June 2003: Commission updated on development of prototype model; concern about developing income measure at the sub-county level highlighted.

3 H:\FISCAP\2005fc\BEPRC08Sep04\System-level Fiscal Capacity for Funding Education in Tennessee.doc
June 2003: OREA staff experimenting with two-tier, regression based, sub-county model; request feedback.
September 2003: OREA and TACIR staff begin in working in concert on sub-county prototype; develop four basic alternatives:
two two-tier models, both w/regression-based county tier
one w/algebraic second tier based solely on tax bases
one w/regression second tier
two one-tier models
one algebraic based solely on tax bases
one full regression
October 2003: Four basic alternatives submitted to external reviewers for comments; one-tier regression version most favored; submitted to Governor’s office.
October 7, 2003: Governor’s salary equity task force drafts framework for recommendation of ten principles including this one: “The proposal will include a new district-level fiscal capacity model in order to provide a fairer method of determining local contribution.”
October 30, 2003: TACIR submits consensus prototype system-level model to Governor’s office.
Winter 2004: Governor’s office submits salary equity proposal to legislature that does not include prototype model.
Spring 2004: General Assembly enacts and Governor signs salary equity bill that includes request that BEP Review Committee give special consideration to, among other things, a system-level fiscal capacity model; requires annual report each November 1.
Summer 2004: BEP Review Committee establishes subcommittees to prepare proposal for, among other things, a system-level fiscal capacity model in order to comply with legislation.

4
Tennessee’s Unique Challenge How to Handle Disparate Fiscal Entities
in a Single Model
Measuring fiscal capacity for Tennessee’s 136 school systems presents
Two Significant Challenges
different authority to tax and raise revenue
different fiscal relationships among systems
County governments*
Must levy county-wide tax for schools • May tax property • May tax sales • May tax other activities (e.g., wheel tax)
Must share school taxes with other systems in county
May use revenue from state-shared taxes for schools without sharing
City governments
May make general fund transfers for schools (some do; some don’t) • May tax property • May tax sales • May tax other activities
Need not share school funds with any other system
May use revenue from state-shared taxes for schools without sharing
Receive share of county governments’ school revenue
Special School Districts
May only tax property
Need not share school funds with any other system
Receive share of county governments’ school revenue * County governments are not required to operate schools (if all students in the county can attend a city system or special school district), but if they do so, must establish education taxes for them.

5
Disparate Fiscal Entities Different Revenues, Different Sharing Requirements
Different kinds of school systems have access to different revenue sources
Different kinds of school systems have different sharing obligations when accessing their revenue sources for schools
Revenue Source
County School Systems
City School Systems
Special School Districts
Property
Shared Yes—retain portion of county taxes based on share of WFTEADA
Yes—receive from county based on share
of WFTEADA
Yes—receive from county based on share
of WFTEADA
Unshared No—county revenue
for education must be shared *
Yes—at individual city’s discretion or through general
fund transfer
Yes—based on rate established by
legislature
Taxable Sales
Shared Yes—retain portion of county taxes based on share of WFTEADA
Yes—receive from county based on share
of WFTEADA
Yes—receive from county based on share
of WFTEADA
Unshared No—county revenue
for education must be shared *
Yes—at individual city’s discretion or through general
fund transfer
No--not authorized by legislature
State-shared Tax Revenue
Yes—no sharing
requirement Yes—no sharing
requirement No-not eligible to
receive
A note about values included in the fiscal capacity model: All systems have values greater than zero for tax base variables that generate county education revenue that must be shared, including the resident tax burden variable that is based on the county-area property tax base. If the table above indicates that a particular revenue source is not available, then the fiscal capacity model will include zeros for those kinds of systems. For example, special school districts receive zeros unshared taxable sales and zero state-shared taxes. Similarly, county school systems receive zero unshared property and sales tax revenues and have a zero for the resident tax burden associated with unshared property tax revenues.
* Except in very limited circumstances (i.e., to support countywide transportation fund or to repay rural education debt).

6 H:\FISCAP\2005fc\BEPRC08Sep04\System-level Fiscal Capacity for Funding Education in Tennessee.doc
New Model versus Current Model—Highlights
Provides system-level fiscal capacity for use in equalizing system-level funding formula
Retains regression-based modified representative tax system approach
Retains and enhances pupil and taxpayer equity measures Tax base variables include state-shared tax revenue available to fund school
systems Per Capita Income replaced by
Median Household Income for county area—eliminates problem of group quarters and outliers in smaller counties
Child Poverty Rate for school systems—only income-related data available at that level
Remains a fiscal behavioral model—does not set normative standards for local revenue
Own-source revenue includes state-shared tax revenue used to fund school systems
More comprehensive—state-shared tax revenue substitutes for local revenues Improves data integrity— state-shared tax revenue cannot be separated out of city general fund transfers
Service Burden (public school students divided by population) no longer needed—covered by more comprehensive BEP Formula (separately funds academic, vocational and special education plus additional funds for English language learners and at-risk students)

7 H:\FISCAP\2005fc\BEPRC08Sep04\System-level Fiscal Capacity for Funding Education in Tennessee.doc
New Model versus Current Model Comparison of Variables
Variables Current Model New Model
Local Revenue Does not include state-shared
tax revenue except in City General Fund Transfers
Includes state-shared tax revenues used to fund school systems
Property per Pupil County area County area & school systems
Sales per Pupil County area County area & school systems
State-shared Tax Revenue
per Pupil Does not include Includes state-shared tax revenues
available to fund school systems
Ability to Pay County-area Per Capita Income
County-area Median Household Income
System Child Poverty Rate
Resident Tax Burden/Tax Exportability
County-area residential & farm assessment divided by
total assessment
Business-related* property assessment divided by total assessment
County-area ratio System ratio
Service Burden Public School Students (ADM) divided by Population
Not included because BEP has become more comprehensive
* Commercial, industrial, utility and personal property.
8 H:\FISCAP\2005fc\BEPRC08Sep04\System-level Fiscal Capacity for Funding Education in Tennessee.doc
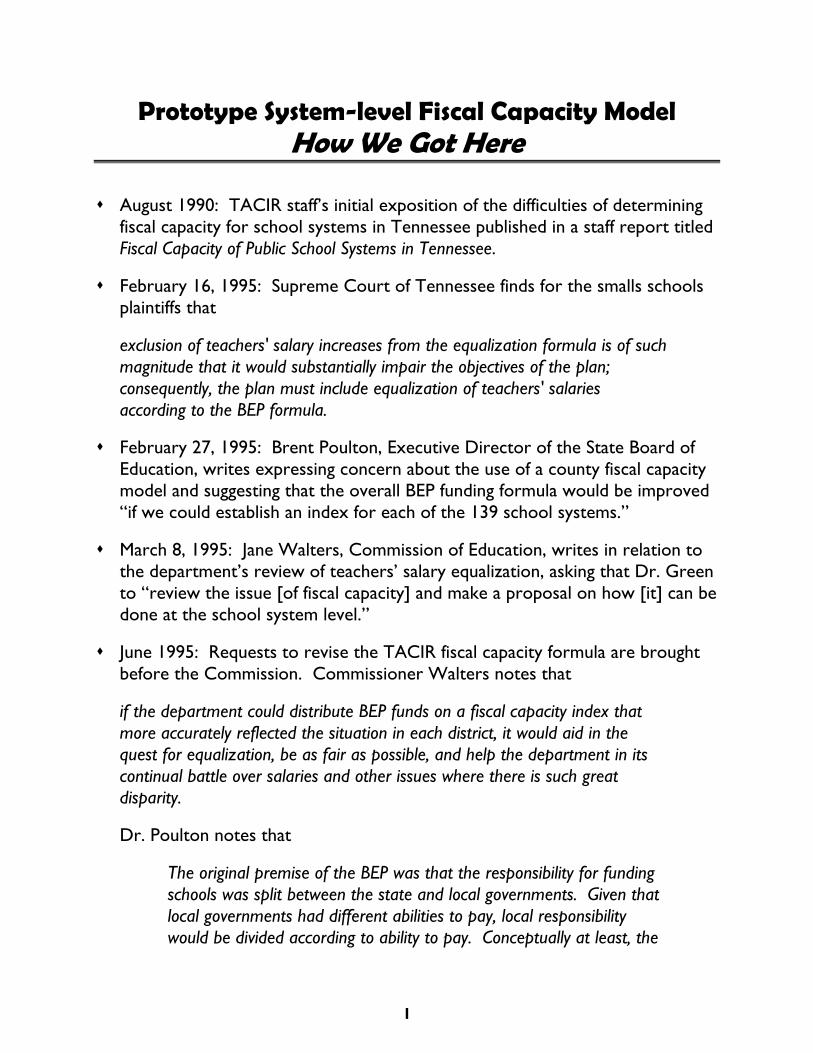
Schedule of Data Availability
1999 2000 2001 2002 2003 2004 2005 2006
BEP Funding Year X
Student Counts (ADM) X X X
Local Revenue X X X
Taxable Sales X X X
Taxable Property X X X
State-shared Tax Revenue X X X
Median Household Income X X X
Child Poverty Rates X X X
Calculations of funding through the Basic Education Program (BEP) formula are made during the fiscal year prior to the year in which funding is to be provided. Because the calculations are made before the end of the prior fiscal year, no figures for the year during which those calculations are made are available for that purpose; therefore, the latest available data is always from two years prior to the year being funded. Moreover, data reported on a calendar year basis, which includes property, median household income and child poverty, will always be another six months behind. And figures from the federal government, which include median household income and child poverty, will lag further behind because they are based on a wide array of data and complex estimation processes.
Three-year averages are used for each factor by agreement with the BEP Review Committee appointed by the State Board of Education in order to mitigate any volatility that might be inherent in the data. The most volatile data is typically the property tax base because of periodic and unpredictable challenges to the assessed valuations established by county appraisers.
9 H:\FISCAP\2005fc\BEPRC08Sep04\System-level Fiscal Capacity for Funding Education in Tennessee.doc
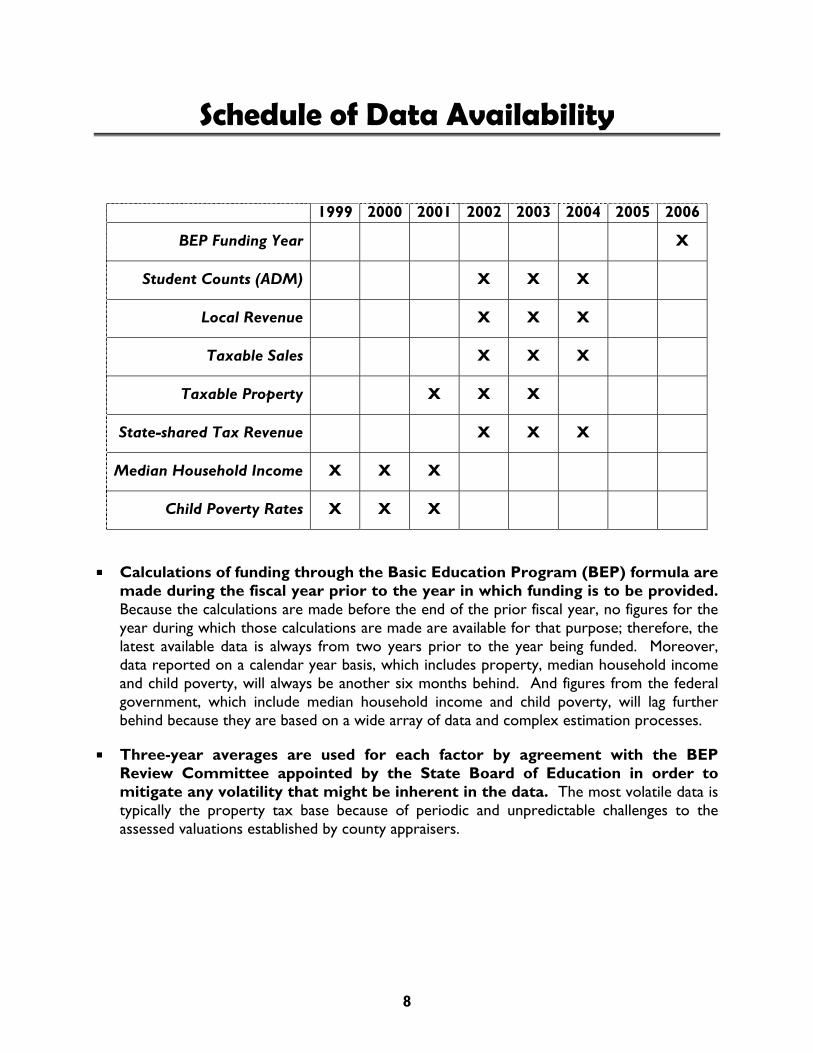
Volunteer County Example
School Systems in Volunteer County
Fiscal Capacity Measurement Volunteer
County Polk City Best SSD
Revenue per Pupil $2,254 $3,140 $2,612
Shared Property per Pupil $100,823 $100,823 $100,823
Unshared Property per Pupil $0 $131,912 $74,638
Shared Taxable Sales per Pupil $64,001 $64,001 $64,001
Unshared Taxable Sales per Pupil $0 $134,287 $0
Shared Tax Exportability Ratio 44.17% 44.17% 44.17%
Unshared Tax Exportability Ratio 0.00% 58.97% 40.96%
State-shared Tax Revenue per Pupil $177 $612 $0
County Median Household Income $33,953 $33,953 $33,953
System Child Poverty Rate 15.73% 19.89% 17.03%
System-level Fiscal Capacity per Pupil $2,229 $3,089 $2,690
Old County-area Fiscal Capacity $2,405 $2,405 $2,405

10 H:\FISCAP\2005fc\BEPRC08Sep04\System-level Fiscal Capacity for Funding Education in Tennessee.doc
New Model versus Current Model—Ability to Pay
Correlation Coefficients for Alternative Measures Based on Most Current Three-year Averages
Per Capita
Personal Income
1999-2001
Median Household
Income 1998-2000
Poverty Rate for All Ages 1998-2000
Poverty Rate for
Ages 5-17 1998-2000
Per Capita
Personal Income
1.0000
Median Household
Income 0.8188 1.0000
Poverty Rate for All Ages
(0.7104) (0.8662) 1.0000
Poverty Rate for
Ages 5-17 (0.7039) (0.8797) 0.9770 1.0000
Median Household Income
Highly correlated with Per Capita Personal Income (PCPI used in the current county model)
Does not include populations in group quarters (group quarters includes college students, prison inmates, etc.)
Child Poverty
Only measure available for school systems
Highly correlated with Median Household Income

Prototype System-level Fiscal Capacity Variables and Index
LEA Property per Pupil Sales per Pupil LEA Tax Exportability* County LEA FiscalRevenue Shared Unshared Shared Unshared State-shared Shared Unshared Median % Child Capacity Total Fiscal Percent of TotalPer Pupil (County) (City/SSD) (County) (City) Taxes (County) (City/SSD) HH Inc Poverty Per Pupil ADMs Capacity Fiscal Capacity
Anderson County $2,478 $84,696 $0 $52,700 $0 $124.09 42.97% 0.00% $36,670 16.89% $1,946 6,956 13,537,866$ 0.6312% Clinton City $2,556 $84,696 $206,917 $52,700 $129,154 $794.93 42.97% 64.02% $36,670 18.91% $3,116 928 2,890,524 0.1348% Oak Ridge City $4,508 $85,556 $126,286 $52,303 $115,992 $574.93 41.47% 48.26% $36,321 14.37% $2,788 4,408 12,286,618 0.5728%Bedford County $1,370 $81,717 $0 $37,954 $0 $92.42 40.84% 0.00% $35,072 15.59% $1,605 6,343 10,177,554 0.4745%Benton County $1,911 $61,564 $0 $38,349 $0 $427.75 28.70% 0.00% $28,308 22.14% $1,316 2,502 3,291,631 0.1535%Bledsoe County $899 $81,489 $0 $17,794 $0 $190.98 25.19% 0.00% $28,786 21.83% $973 1,779 1,731,240 0.0807%Blount County $2,006 $109,084 $0 $61,220 $0 $128.34 37.87% 0.00% $37,878 12.55% $2,265 10,812 24,484,023 1.1415% Alcoa City $4,330 $109,084 $231,585 $61,220 $340,401 $465.76 37.87% 76.57% $37,878 16.59% $3,988 1,301 5,188,058 0.2419% Maryville City $3,399 $109,084 $113,937 $61,220 $90,101 $487.35 37.87% 53.24% $37,878 12.84% $3,015 4,341 13,088,164 0.6102%Bradley County $1,724 $92,495 $0 $54,687 $0 $108.83 41.80% 0.00% $35,626 12.07% $2,031 9,012 18,303,556 0.8534% Cleveland City $2,664 $92,495 $153,081 $54,687 $141,383 $742.61 41.80% 60.51% $35,626 18.83% $3,005 4,376 13,149,102 0.6131%Campbell County $1,156 $70,471 $0 $38,286 $0 $149.37 33.26% 0.00% $25,110 26.54% $1,250 6,210 7,760,884 0.3618%Cannon County $973 $68,290 $0 $17,863 $0 $122.50 17.97% 0.00% $32,395 16.38% $1,014 2,103 2,132,809 0.0994%Carroll County $1,579 $53,971 $53,930 $26,225 $0 $129.82 28.86% 28.86% $30,755 0.00% $1,519 4,940 709,310 0.0331% Hollow Rock-Bruceto $1,235 $53,971 $42,282 $26,225 $0 $0.00 28.86% 30.57% $30,755 13.12% $1,377 784 1,079,169 0.0503% Huntingdon SSD $1,566 $53,971 $59,397 $26,225 $0 $0.00 28.86% 33.55% $30,755 19.38% $1,391 1,327 1,846,334 0.0861% McKenzie SSD $1,372 $53,971 $58,632 $26,225 $0 $0.00 28.86% 40.40% $30,755 15.06% $1,446 1,306 1,888,610 0.0881% South Carroll Co SSD $1,206 $53,971 $51,915 $26,225 $0 $0.00 28.86% 10.56% $30,755 12.95% $1,343 396 532,569 0.0248% West Carroll Co SSD $1,349 $53,971 $51,081 $26,225 $0 $0.00 28.86% 12.31% $30,755 20.02% $1,290 1,121 1,446,492 0.0674%Carter County $1,225 $60,194 $0 $30,652 $0 $114.25 29.62% 0.00% $27,967 20.02% $1,152 5,993 6,904,001 0.3219% Elizabethton City $2,229 $60,194 $69,739 $30,652 $87,784 $529.97 29.62% 52.69% $27,967 22.88% $1,737 2,199 3,819,327 0.1781%Cheatham County $1,131 $67,807 $0 $19,819 $0 $59.46 21.01% 0.00% $44,615 9.84% $1,365 6,869 9,376,912 0.4372%Chester County $875 $58,035 $0 $27,596 $0 $114.87 29.13% 0.00% $33,041 17.50% $1,206 2,450 2,954,112 0.1377%Claiborne County $1,478 $69,169 $0 $25,077 $0 $150.66 32.81% 0.00% $26,027 24.75% $1,009 4,624 4,667,347 0.2176%Clay County $1,260 $63,829 $0 $25,324 $0 $169.75 27.18% 0.00% $23,524 25.01% $922 1,200 1,106,421 0.0516%Cocke County $1,227 $63,602 $0 $39,124 $0 $120.51 38.33% 0.00% $25,550 26.65% $1,260 4,666 5,880,551 0.2742% Newport City $1,898 $63,602 $145,783 $39,124 $249,997 $872.83 38.33% 69.48% $25,550 27.11% $2,535 683 1,730,552 0.0807%Coffee County $1,823 $69,784 $0 $58,137 $0 $169.54 42.84% 0.00% $34,738 12.19% $1,993 4,169 8,309,977 0.3874% Manchester City $2,631 $69,784 $106,288 $58,137 $136,453 $588.33 42.84% 63.15% $34,738 19.71% $2,799 1,194 3,343,646 0.1559% Tullahoma City $2,969 $70,383 $76,075 $57,491 $80,465 $433.45 42.32% 50.42% $34,734 20.11% $2,515 3,604 9,064,419 0.4226%Crockett County $969 $65,617 $0 $15,508 $0 $172.98 32.26% 0.00% $29,951 17.11% $943 1,715 1,617,792 0.0754% Alamo City $802 $65,617 $54,133 $15,508 $30,520 $362.82 32.26% 60.08% $29,951 25.62% $1,321 539 711,922 0.0332% Bells City $884 $65,617 $77,241 $15,508 $23,686 $453.72 32.26% 68.48% $29,951 22.71% $1,434 391 561,193 0.0262%Cumberland County $1,453 $117,382 $0 $64,518 $0 $130.90 28.37% 0.00% $30,050 20.22% $2,113 6,735 14,232,122 0.6635%Davidson County $4,307 $191,472 $0 $139,037 $0 $665.01 57.27% 0.00% $40,359 16.29% $4,285 68,203 292,264,354 13.6263%Decatur County $1,488 $76,758 $0 $44,494 $0 $263.51 30.68% 0.00% $28,442 18.86% $1,530 1,601 2,449,207 0.1142%DeKalb County $1,029 $106,278 $0 $34,497 $0 $130.16 32.17% 0.00% $30,218 20.32% $1,474 2,600 3,831,134 0.1786%Dickson County $1,890 $85,820 $0 $49,948 $0 $77.40 38.89% 0.00% $37,654 14.03% $1,924 7,965 15,326,508 0.7146%Dyer County $2,283 $73,031 $0 $45,376 $0 $174.39 42.69% 0.00% $32,924 11.61% $1,715 3,236 5,549,706 0.2587% Dyersburg City $2,215 $73,031 $70,998 $45,376 $78,434 $434.26 42.69% 60.04% $32,924 26.40% $2,205 3,487 7,688,676 0.3585%Fayette County $1,416 $137,517 $0 $29,949 $0 $190.90 24.73% 0.00% $37,669 16.03% $1,682 3,473 5,841,040 0.2723%Fentress County $1,181 $66,786 $0 $36,052 $0 $194.17 28.91% 0.00% $22,947 28.01% $1,122 2,326 2,608,696 0.1216%
TACIR 11

Prototype System-level Fiscal Capacity Variables and Index
LEA Property per Pupil Sales per Pupil LEA Tax Exportability* County LEA FiscalRevenue Shared Unshared Shared Unshared State-shared Shared Unshared Median % Child Capacity Total Fiscal Percent of TotalPer Pupil (County) (City/SSD) (County) (City) Taxes (County) (City/SSD) HH Inc Poverty Per Pupil ADMs Capacity Fiscal Capacity
Franklin County $1,676 $87,369 $0 $39,184 $0 $161.58 27.62% 0.00% $34,629 15.66% $1,607 5,788 9,303,341 0.4338% Humboldt City $1,612 $67,755 $71,814 $30,820 $51,851 $469.33 39.18% 60.06% $31,122 21.34% $1,827 1,657 3,026,303 0.1411% Milan SSD $2,016 $67,755 $72,158 $30,820 $0 $0.00 39.18% 52.44% $31,122 17.43% $1,697 2,002 3,398,043 0.1584% Trenton SSD $1,507 $67,755 $64,284 $30,820 $0 $0.00 39.18% 33.64% $31,122 16.92% $1,615 1,441 2,327,325 0.1085% Bradford SSD $1,280 $67,755 $53,782 $30,820 $0 $0.00 39.18% 16.70% $31,122 18.03% $1,517 642 973,759 0.0454% Gibson County SSD $1,346 $67,755 $67,675 $30,820 $0 $0.00 39.18% 21.37% $31,122 12.30% $1,623 2,607 4,229,845 0.1972%Giles County $1,744 $80,937 $0 $40,101 $0 $145.25 41.21% 0.00% $34,646 15.23% $1,642 4,516 7,417,896 0.3458%Grainger County $823 $54,431 $0 $14,968 $0 $210.44 19.26% 0.00% $28,537 21.84% $782 3,272 2,559,007 0.1193%Greene County $1,282 $92,751 $0 $44,557 $0 $126.68 36.72% 0.00% $29,834 16.61% $1,656 6,918 11,455,031 0.5341% Greeneville City $4,216 $92,751 $127,883 $44,557 $129,918 $570.13 36.72% 64.59% $29,834 21.43% $2,544 2,635 6,704,206 0.3126%Grundy County $832 $49,492 $0 $19,279 $0 $139.92 25.64% 0.00% $23,943 28.35% $717 2,284 1,636,544 0.0763%Hamblen County $2,313 $106,368 $0 $66,909 $0 $86.79 51.55% 0.00% $33,113 17.06% $2,271 8,985 20,410,037 0.9516%Hamilton County $3,275 $130,342 $0 $90,437 $0 $79.32 50.86% 0.00% $37,396 14.87% $2,951 40,747 120,258,114 5.6068%Hancock County $701 $59,270 $0 $12,657 $0 $166.69 27.96% 0.00% $20,618 33.87% $518 1,102 570,687 0.0266%Hardeman County $1,291 $57,769 $0 $25,746 $0 $129.76 33.55% 0.00% $27,442 21.64% $1,031 4,540 4,681,058 0.2182%Hardin County $1,697 $102,899 $0 $45,787 $0 $194.29 36.25% 0.00% $27,899 23.36% $1,631 3,835 6,253,161 0.2915%Hawkins County $1,573 $83,903 $0 $28,332 $0 $127.92 38.96% 0.00% $32,187 18.34% $1,333 7,154 9,536,909 0.4446% Rogersville City $1,790 $83,903 $108,980 $28,332 $156,853 $607.42 38.96% 64.70% $32,187 20.73% $2,241 633 1,418,704 0.0661%Haywood County $1,459 $79,639 $0 $25,381 $0 $198.14 39.46% 0.00% $27,483 21.64% $1,136 3,574 4,060,208 0.1893%Henderson County $1,177 $63,720 $0 $38,244 $0 $182.03 37.69% 0.00% $32,423 14.85% $1,481 3,442 5,099,504 0.2378% Lexington City $1,587 $63,720 $148,000 $38,244 $142,685 $630.96 37.69% 63.22% $32,423 19.61% $2,458 933 2,294,183 0.1070%Henry County $2,316 $86,947 $0 $55,419 $0 $383.58 35.68% 0.00% $29,694 17.92% $1,847 3,150 5,819,095 0.2713% Paris SSD $2,458 $86,947 $97,289 $55,419 $0 $0.00 35.68% 68.71% $29,694 22.82% $2,325 1,458 3,389,398 0.1580%Hickman County $963 $62,430 $0 $19,077 $0 $147.67 24.11% 0.00% $31,688 17.34% $1,011 3,798 3,840,817 0.1791%Houston County $992 $53,031 $0 $19,612 $0 $181.43 28.15% 0.00% $29,016 20.23% $918 1,419 1,302,665 0.0607%Humphreys County $1,305 $95,095 $0 $34,088 $0 $324.54 48.55% 0.00% $33,631 15.05% $1,590 3,003 4,774,301 0.2226%Jackson County $1,068 $65,943 $0 $15,725 $0 $159.37 27.56% 0.00% $26,657 19.35% $848 1,659 1,406,444 0.0656%Jefferson County $1,220 $91,148 $0 $36,380 $0 $112.57 30.01% 0.00% $32,029 17.42% $1,503 6,849 10,292,643 0.4799%Johnson County $1,411 $73,962 $0 $27,847 $0 $181.66 25.55% 0.00% $23,734 25.66% $1,010 2,286 2,309,038 0.1077%Knox County $3,414 $119,402 $0 $105,309 $0 $82.22 44.34% 0.00% $38,126 13.44% $3,214 51,850 166,667,069 7.7706%Lake County $1,274 $67,369 $0 $26,143 $0 $170.94 33.34% 0.00% $22,031 29.51% $905 883 798,656 0.0372%Lauderdale County $1,105 $55,193 $0 $25,703 $0 $97.11 39.59% 0.00% $28,428 20.55% $1,065 4,568 4,865,786 0.2269%Lawrence County $1,224 $65,917 $0 $38,186 $0 $94.51 38.46% 0.00% $30,647 17.26% $1,431 6,782 9,706,514 0.4525%Lewis County $761 $60,907 $0 $27,868 $0 $122.61 30.31% 0.00% $28,689 19.19% $1,123 1,947 2,185,229 0.1019%Lincoln County $1,334 $69,169 $0 $37,295 $0 $143.86 28.41% 0.00% $33,353 13.36% $1,487 4,025 5,985,196 0.2790% Fayetteville City $1,956 $69,169 $105,832 $37,295 $156,321 $605.21 28.41% 65.71% $33,353 29.13% $2,280 1,046 2,384,044 0.1112%Loudon County $1,756 $116,458 $0 $40,503 $0 $202.59 33.50% 0.00% $39,104 12.63% $1,892 4,877 9,224,577 0.4301% Lenoir City $2,643 $116,458 $51,690 $40,503 $90,302 $295.45 33.50% 64.78% $39,104 21.98% $2,397 1,990 4,770,238 0.2224%McMinn County $1,601 $103,333 $0 $45,688 $0 $126.84 55.00% 0.00% $32,330 13.97% $1,850 5,794 10,717,482 0.4997% Athens City $2,313 $103,333 $169,807 $45,688 $159,719 $644.44 55.00% 72.07% $32,330 24.42% $2,920 1,741 5,085,724 0.2371% Etowah City $1,622 $103,333 $90,029 $45,688 $92,468 $742.17 55.00% 46.32% $32,330 27.05% $2,417 381 921,223 0.0430%McNairy County $1,187 $65,383 $0 $28,448 $0 $122.58 39.14% 0.00% $29,780 19.96% $1,196 4,111 4,915,076 0.2292%
TACIR 12

Prototype System-level Fiscal Capacity Variables and Index
LEA Property per Pupil Sales per Pupil LEA Tax Exportability* County LEA FiscalRevenue Shared Unshared Shared Unshared State-shared Shared Unshared Median % Child Capacity Total Fiscal Percent of TotalPer Pupil (County) (City/SSD) (County) (City) Taxes (County) (City/SSD) HH Inc Poverty Per Pupil ADMs Capacity Fiscal Capacity
Macon County $1,029 $55,387 $0 $29,984 $0 $105.00 33.78% 0.00% $29,930 18.40% $1,184 3,566 4,223,462 0.1969%Madison County $2,971 $106,807 $0 $92,104 $0 $71.34 51.42% 0.00% $35,847 16.45% $2,844 13,668 38,871,952 1.8123%Marion County $1,404 $82,957 $0 $45,415 $0 $195.68 33.79% 0.00% $31,460 18.31% $1,648 4,119 6,787,438 0.3165% Richard City SSD $1,533 $82,957 $24,006 $45,415 $0 $0.00 33.79% 43.49% $31,460 25.75% $1,798 319 573,758 0.0268%Marshall County $2,050 $86,053 $0 $36,943 $0 $94.63 46.64% 0.00% $37,469 12.50% $1,694 4,793 8,119,489 0.3786%Maury County $1,960 $88,909 $0 $54,123 $0 $88.52 37.07% 0.00% $40,074 13.23% $2,074 11,219 23,263,069 1.0846%Meigs County $915 $70,215 $0 $17,426 $0 $263.63 21.57% 0.00% $29,322 22.59% $917 1,821 1,670,250 0.0779%Monroe County $1,471 $82,524 $0 $39,604 $0 $219.00 40.67% 0.00% $30,019 19.03% $1,514 5,035 7,622,329 0.3554% Sweetwater City $1,473 $82,524 $55,876 $39,604 $62,346 $294.92 40.67% 58.27% $30,019 27.71% $1,955 1,448 2,830,892 0.1320%Montgomery County $1,761 $65,511 $0 $48,050 $0 $43.57 42.47% 0.00% $38,335 13.70% $1,828 24,286 44,384,490 2.0693%Moore County $1,795 $114,978 $0 $13,774 $0 $238.77 41.54% 0.00% $36,972 13.96% $1,315 950 1,248,878 0.0582%Morgan County $805 $48,564 $0 $11,401 $0 $129.53 25.93% 0.00% $27,724 20.05% $699 3,242 2,265,398 0.1056%Obion County $1,958 $75,120 $0 $47,821 $0 $138.36 39.67% 0.00% $33,670 14.62% $1,754 4,035 7,077,724 0.3300% Union City $3,593 $75,120 $107,176 $47,821 $148,777 $671.82 39.67% 56.67% $33,670 22.34% $2,573 1,392 3,580,730 0.1669%Overton County $1,050 $64,956 $0 $27,801 $0 $126.17 29.91% 0.00% $27,469 20.31% $1,103 3,152 3,476,118 0.1621%Perry County $1,184 $85,175 $0 $22,938 $0 $398.17 38.77% 0.00% $28,347 19.53% $1,152 1,155 1,329,804 0.0620%Pickett County $1,219 $85,796 $0 $30,738 $0 $216.47 21.11% 0.00% $24,781 25.28% $1,131 714 807,860 0.0377%Polk County $1,274 $80,107 $0 $21,395 $0 $254.36 29.32% 0.00% $29,716 17.74% $1,108 2,406 2,664,555 0.1242%Putnam County $1,937 $96,158 $0 $76,881 $0 $73.50 43.55% 0.00% $31,899 15.94% $2,390 9,528 22,772,996 1.0617%Rhea County $1,278 $75,933 $0 $33,377 $0 $206.27 36.18% 0.00% $30,334 18.71% $1,356 3,770 5,111,687 0.2383% Dayton City $1,248 $75,933 $136,814 $33,377 $129,755 $631.79 36.18% 67.40% $30,334 23.25% $2,283 745 1,700,478 0.0793%Roane County $1,871 $92,922 $0 $48,903 $0 $148.63 28.64% 0.00% $33,331 17.84% $1,785 7,250 12,941,961 0.6034%Robertson County $1,601 $80,876 $0 $34,168 $0 $60.41 29.92% 0.00% $42,126 11.74% $1,669 9,704 16,194,189 0.7550%Rutherford County $2,243 $91,214 $0 $55,584 $0 $58.59 42.92% 0.00% $46,085 7.51% $2,300 26,876 61,807,262 2.8817% Murfreesboro City $2,727 $91,214 $222,060 $55,584 $219,667 $978.50 42.92% 54.08% $46,085 14.44% $3,657 5,760 21,067,713 0.9822%Scott County $1,120 $51,994 $0 $32,333 $0 $188.60 41.68% 0.00% $24,053 26.40% $1,059 2,619 2,772,472 0.1293% Oneida SSD $1,442 $51,994 $37,103 $32,333 $0 $0.00 41.68% 70.13% $24,053 23.90% $1,417 1,240 1,756,722 0.0819%Sequatchie County $1,692 $75,149 $0 $28,775 $0 $142.30 27.38% 0.00% $30,185 21.23% $1,207 1,867 2,254,001 0.1051%Sevier County $3,101 $165,620 $0 $148,391 $0 $99.98 45.25% 0.00% $33,011 16.47% $4,150 12,512 51,927,616 2.4210%Shelby County $2,600 $91,166 $0 $60,856 $0 $216.44 49.57% 0.00% $38,596 4.43% $2,301 44,976 103,497,455 4.8254% Memphis SSD City $3,190 $91,166 $82,013 $60,856 $63,566 $510.90 49.57% 60.91% $38,596 23.14% $2,767 116,651 322,781,651 15.0491%Smith County $1,046 $74,981 $0 $29,319 $0 $151.73 36.40% 0.00% $34,702 15.50% $1,385 3,148 4,359,396 0.2032%Stewart County $1,239 $67,356 $0 $20,461 $0 $727.39 22.73% 0.00% $31,858 15.62% $1,100 2,073 2,280,819 0.1063%Sullivan County $2,840 $106,366 $0 $67,661 $0 $129.04 48.07% 0.00% $34,227 12.46% $2,338 12,850 30,046,722 1.4009% Bristol City $3,692 $106,366 $110,701 $67,661 $90,758 $611.73 48.07% 56.21% $34,227 15.00% $3,078 3,584 11,030,273 0.5143% Kingsport City $4,589 $104,616 $167,592 $64,597 $162,724 $645.98 47.36% 64.64% $34,068 23.40% $3,306 6,353 20,999,996 0.9791%Sumner County $1,764 $95,039 $0 $34,651 $0 $52.27 31.51% 0.00% $44,982 10.18% $1,814 22,887 41,509,262 1.9353%Tipton County $898 $50,843 $0 $18,972 $0 $53.95 27.24% 0.00% $38,190 15.33% $1,118 10,938 12,228,234 0.5701%Trousdale County $943 $62,043 $0 $20,399 $0 $293.95 31.52% 0.00% $30,902 16.28% $1,057 1,277 1,350,182 0.0629%Unicoi County $1,223 $79,810 $0 $26,149 $0 $99.31 33.82% 0.00% $30,346 17.69% $1,222 2,487 3,039,982 0.1417%Union County $826 $54,683 $0 $14,268 $0 $221.90 21.11% 0.00% $28,132 22.84% $759 3,057 2,318,969 0.1081%Van Buren County $1,262 $78,176 $0 $18,134 $0 $270.44 13.26% 0.00% $29,110 19.69% $959 777 744,807 0.0347%
TACIR 13

Prototype System-level Fiscal Capacity Variables and Index
LEA Property per Pupil Sales per Pupil LEA Tax Exportability* County LEA FiscalRevenue Shared Unshared Shared Unshared State-shared Shared Unshared Median % Child Capacity Total Fiscal Percent of TotalPer Pupil (County) (City/SSD) (County) (City) Taxes (County) (City/SSD) HH Inc Poverty Per Pupil ADMs Capacity Fiscal Capacity
Warren County $1,724 $78,624 $0 $45,472 $0 $113.71 39.75% 0.00% $31,349 18.49% $1,641 6,184 10,146,728 0.4731%Washington County $2,145 $108,732 $0 $82,305 $0 $115.38 41.21% 0.00% $33,657 15.45% $2,588 8,562 22,155,108 1.0329% Johnson City $3,752 $108,732 $157,187 $82,305 $171,500 $713.18 41.21% 54.91% $33,657 15.86% $3,672 6,731 24,714,463 1.1523%Wayne County $889 $55,813 $0 $20,071 $0 $224.88 29.21% 0.00% $26,265 21.08% $880 2,633 2,316,399 0.1080%Weakley County $1,240 $73,993 $0 $35,504 $0 $120.78 38.16% 0.00% $30,992 15.85% $1,429 4,900 7,003,213 0.3265%White County $1,016 $67,916 $0 $30,124 $0 $117.08 31.94% 0.00% $29,122 18.58% $1,216 3,850 4,680,826 0.2182%Williamson County $3,136 $159,336 $0 $80,416 $0 $88.33 36.16% 0.00% $69,352 4.21% $3,578 20,277 72,557,784 3.3829% Franklin SSD $5,234 $159,336 $109,162 $80,416 $0 $0.00 36.16% 32.80% $69,352 9.71% $3,986 3,797 15,134,469 0.7056%Wilson County $1,807 $109,159 $0 $46,517 $0 $93.71 31.98% 0.00% $48,596 6.89% $2,217 11,820 26,209,226 1.2220% Lebanon SSD $2,446 $109,159 $179,601 $46,517 $0 $0.00 31.98% 56.71% $48,596 19.20% $2,873 2,891 8,304,900 0.3872%
Statewide $2,454 $100,673 $98,404 $62,547 $88,911 $247.00 43.79% 41.59% $35,191 16.06% $2,383 900,152 $2,144,855,363 100.0000%
System Averages $1,803 $81,845 $32,116 $40,997 $25,982 $235.24 35.80% 16.57% $32,815 18.34% $1,803 6,655 $15,770,995
* The percentage of the property tax base that is not residential or farm property.
TACIR 14

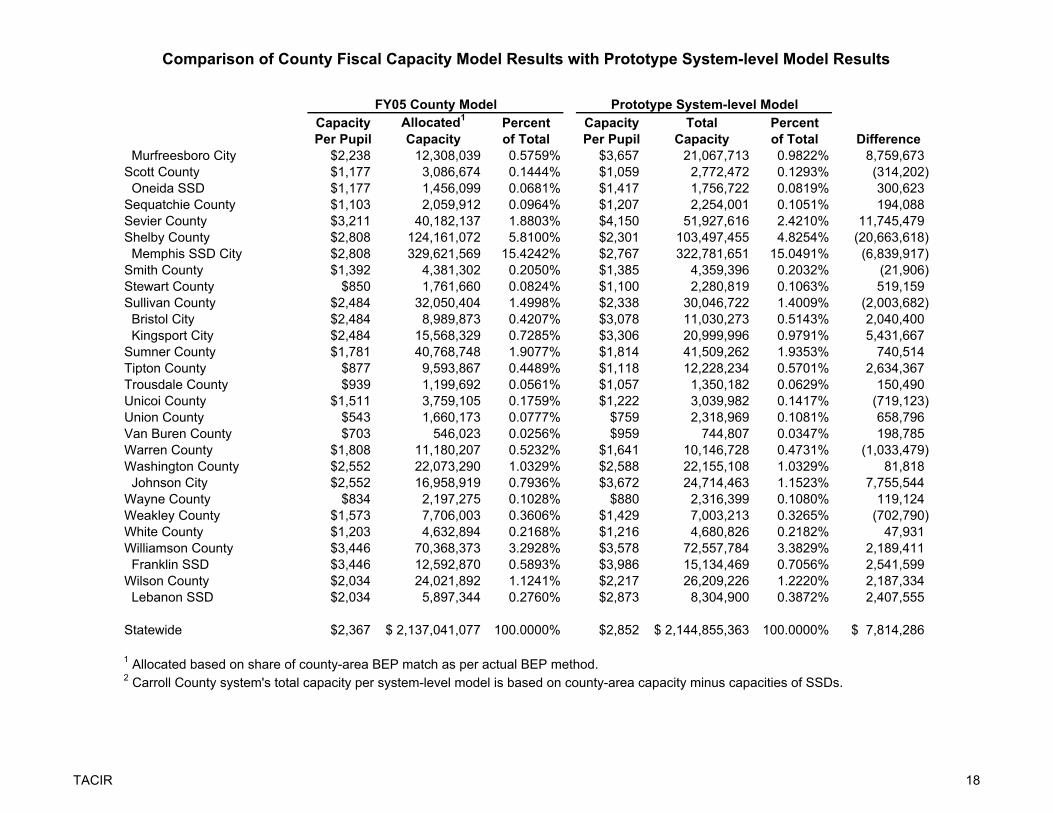
Comparison of County Fiscal Capacity Model Results with Prototype System-level Model Results
FY05 County Model Prototype System-level ModelCapacity Allocated1 Percent Capacity Total PercentPer Pupil Capacity of Total Per Pupil Capacity of Total Difference
Anderson County $2,240 15,829,910$ 0.7407% $1,946 13,537,866$ 0.6312% (2,292,044)$ Clinton City $2,240 2,034,083 0.0952% $3,116 2,890,524 0.1348% 856,441 Oak Ridge City $2,240 9,666,063 0.4523% $2,788 12,286,618 0.5728% 2,620,555 Bedford County $1,656 10,503,684 0.4915% $1,605 10,177,554 0.4745% (326,130) Benton County $1,448 3,621,752 0.1695% $1,316 3,291,631 0.1535% (330,121) Bledsoe County $885 1,574,741 0.0737% $973 1,731,240 0.0807% 156,499 Blount County $2,218 24,164,533 1.1307% $2,265 24,484,023 1.1415% 319,489 Alcoa City $2,218 2,701,489 0.1264% $3,988 5,188,058 0.2419% 2,486,568 Maryville City $2,218 9,620,125 0.4502% $3,015 13,088,164 0.6102% 3,468,038 Bradley County $2,180 19,875,522 0.9300% $2,031 18,303,556 0.8534% (1,571,965) Cleveland City $2,180 9,314,686 0.4359% $3,005 13,149,102 0.6131% 3,834,416 Campbell County $1,263 7,841,983 0.3670% $1,250 7,760,884 0.3618% (81,099) Cannon County $1,069 2,247,960 0.1052% $1,014 2,132,809 0.0994% (115,151) Carroll County2 $1,304 1,207,680 0.0565% $1,519 709,310 0.0331% (498,370) Hollow Rock-Bruceton SSD $1,304 1,807,674 0.0846% $1,377 1,079,169 0.0503% (728,505) Huntingdon SSD $1,304 3,082,019 0.1442% $1,391 1,846,334 0.0861% (1,235,685) McKenzie SSD $1,304 3,105,096 0.1453% $1,446 1,888,610 0.0881% (1,216,486) South Carroll Co SSD $1,304 1,048,707 0.0491% $1,343 532,569 0.0248% (516,138) West Carroll Co SSD $1,304 2,623,050 0.1227% $1,290 1,446,492 0.0674% (1,176,557) Carter County $1,248 7,712,971 0.3609% $1,152 6,904,001 0.3219% (808,970) Elizabethton City $1,248 2,511,528 0.1175% $1,737 3,819,327 0.1781% 1,307,799 Cheatham County $1,223 8,397,471 0.3929% $1,365 9,376,912 0.4372% 979,441 Chester County $1,211 2,967,152 0.1388% $1,206 2,954,112 0.1377% (13,040) Claiborne County $1,243 5,749,427 0.2690% $1,009 4,667,347 0.2176% (1,082,080) Clay County $1,045 1,254,227 0.0587% $922 1,106,421 0.0516% (147,806) Cocke County $1,420 6,677,741 0.3125% $1,260 5,880,551 0.2742% (797,190) Newport City $1,420 919,120 0.0430% $2,535 1,730,552 0.0807% 811,432 Coffee County $2,031 8,624,223 0.4036% $1,993 8,309,977 0.3874% (314,246) Manchester City $2,031 2,511,548 0.1175% $2,799 3,343,646 0.1559% 832,098 Tullahoma City $2,031 7,077,766 0.3312% $2,515 9,064,419 0.4226% 1,986,653 Crockett County $1,185 2,105,887 0.0985% $943 1,617,792 0.0754% (488,095) Alamo City $1,185 559,517 0.0262% $1,321 711,922 0.0332% 152,406 Bells City $1,185 469,686 0.0220% $1,434 561,193 0.0262% 91,507 Cumberland County $1,859 12,521,849 0.5859% $2,113 14,232,122 0.6635% 1,710,272 Davidson County $4,415 301,108,013 14.0899% $4,285 292,264,354 13.6263% (8,843,660) Decatur County $1,617 2,589,093 0.1212% $1,530 2,449,207 0.1142% (139,886)
TACIR 15

Comparison of County Fiscal Capacity Model Results with Prototype System-level Model Results
FY05 County Model Prototype System-level ModelCapacity Allocated1 Percent Capacity Total PercentPer Pupil Capacity of Total Per Pupil Capacity of Total Difference
DeKalb County $1,427 3,710,641 0.1736% $1,474 3,831,134 0.1786% 120,493 Dickson County $1,888 15,040,845 0.7038% $1,924 15,326,508 0.7146% 285,663 Dyer County $1,805 6,202,482 0.2902% $1,715 5,549,706 0.2587% (652,775) Dyersburg City $1,805 5,932,976 0.2776% $2,205 7,688,676 0.3585% 1,755,700 Fayette County $1,621 5,631,542 0.2635% $1,682 5,841,040 0.2723% 209,498 Fentress County $1,380 3,209,975 0.1502% $1,122 2,608,696 0.1216% (601,278) Franklin County $1,531 8,862,721 0.4147% $1,607 9,303,341 0.4338% 440,620 Humboldt City $1,583 2,483,352 0.1162% $1,827 3,026,303 0.1411% 542,951 Milan SSD $1,583 3,166,113 0.1482% $1,697 3,398,043 0.1584% 231,930 Trenton SSD $1,583 2,286,994 0.1070% $1,615 2,327,325 0.1085% 40,331 Bradford SSD $1,583 1,042,109 0.0488% $1,517 973,759 0.0454% (68,350) Gibson County SSD $1,583 4,240,307 0.1984% $1,623 4,229,845 0.1972% (10,462) Giles County $1,900 8,581,124 0.4015% $1,642 7,417,896 0.3458% (1,163,228) Grainger County $753 2,463,893 0.1153% $782 2,559,007 0.1193% 95,114 Greene County $1,863 12,853,080 0.6014% $1,656 11,455,031 0.5341% (1,398,049) Greeneville City $1,863 4,944,874 0.2314% $2,544 6,704,206 0.3126% 1,759,332 Grundy County $1,015 2,318,006 0.1085% $717 1,636,544 0.0763% (681,462) Hamblen County $2,434 21,869,840 1.0234% $2,271 20,410,037 0.9516% (1,459,803) Hamilton County $3,258 132,745,590 6.2117% $2,951 120,258,114 5.6068% (12,487,475) Hancock County $530 583,556 0.0273% $518 570,687 0.0266% (12,869) Hardeman County $1,001 4,546,529 0.2127% $1,031 4,681,058 0.2182% 134,528 Hardin County $1,701 6,522,133 0.3052% $1,631 6,253,161 0.2915% (268,972) Hawkins County $1,410 10,143,036 0.4746% $1,333 9,536,909 0.4446% (606,126) Rogersville City $1,410 837,981 0.0392% $2,241 1,418,704 0.0661% 580,723 Haywood County $1,247 4,455,609 0.2085% $1,136 4,060,208 0.1893% (395,401) Henderson County $1,570 5,315,090 0.2487% $1,481 5,099,504 0.2378% (215,586) Lexington City $1,570 1,553,069 0.0727% $2,458 2,294,183 0.1070% 741,114 Henry County $1,938 6,119,781 0.2864% $1,847 5,819,095 0.2713% (300,686) Paris SSD $1,938 2,808,322 0.1314% $2,325 3,389,398 0.1580% 581,075 Hickman County $884 3,355,922 0.1570% $1,011 3,840,817 0.1791% 484,895 Houston County $863 1,224,240 0.0573% $918 1,302,665 0.0607% 78,425 Humphreys County $1,552 4,660,409 0.2181% $1,590 4,774,301 0.2226% 113,892 Jackson County $1,055 1,750,762 0.0819% $848 1,406,444 0.0656% (344,318) Jefferson County $1,412 9,672,927 0.4526% $1,503 10,292,643 0.4799% 619,716 Johnson County $885 2,023,748 0.0947% $1,010 2,309,038 0.1077% 285,290 Knox County $3,251 168,558,918 7.8875% $3,214 166,667,069 7.7706% (1,891,849)
TACIR 16

Comparison of County Fiscal Capacity Model Results with Prototype System-level Model Results
FY05 County Model Prototype System-level ModelCapacity Allocated1 Percent Capacity Total PercentPer Pupil Capacity of Total Per Pupil Capacity of Total Difference
Lake County $945 834,135 0.0390% $905 798,656 0.0372% (35,479) Lauderdale County $1,084 4,951,600 0.2317% $1,065 4,865,786 0.2269% (85,815) Lawrence County $1,534 10,404,958 0.4869% $1,431 9,706,514 0.4525% (698,443) Lewis County $983 1,912,879 0.0895% $1,123 2,185,229 0.1019% 272,351 Lincoln County $1,436 5,835,623 0.2731% $1,487 5,985,196 0.2790% 149,573 Fayetteville City $1,436 1,443,826 0.0676% $2,280 2,384,044 0.1112% 940,218 Loudon County $1,832 8,896,631 0.4163% $1,892 9,224,577 0.4301% 327,946 Lenoir City $1,832 3,683,400 0.1724% $2,397 4,770,238 0.2224% 1,086,838 McMinn County $1,856 10,789,838 0.5049% $1,850 10,717,482 0.4997% (72,356) Athens City $1,856 3,127,359 0.1463% $2,920 5,085,724 0.2371% 1,958,365 Etowah City $1,856 772,536 0.0361% $2,417 921,223 0.0430% 148,687 McNairy County $1,407 5,784,702 0.2707% $1,196 4,915,076 0.2292% (869,626) Macon County $1,132 4,037,345 0.1889% $1,184 4,223,462 0.1969% 186,117 Madison County $2,923 39,954,819 1.8696% $2,844 38,871,952 1.8123% (1,082,867) Marion County $1,656 6,778,685 0.3172% $1,648 6,787,438 0.3165% 8,753 Richard City SSD $1,656 569,702 0.0267% $1,798 573,758 0.0268% 4,056 Marshall County $1,866 8,944,365 0.4185% $1,694 8,119,489 0.3786% (824,876) Maury County $1,949 21,860,077 1.0229% $2,074 23,263,069 1.0846% 1,402,992 Meigs County $684 1,246,528 0.0583% $917 1,670,250 0.0779% 423,722 Monroe County $1,393 7,123,200 0.3333% $1,514 7,622,329 0.3554% 499,128 Sweetwater City $1,393 1,905,594 0.0892% $1,955 2,830,892 0.1320% 925,298 Montgomery County $1,965 47,727,035 2.2333% $1,828 44,384,490 2.0693% (3,342,545) Moore County $1,145 1,087,605 0.0509% $1,315 1,248,878 0.0582% 161,273 Morgan County $640 2,074,684 0.0971% $699 2,265,398 0.1056% 190,714 Obion County $1,966 7,936,369 0.3714% $1,754 7,077,724 0.3300% (858,644) Union City $1,966 2,732,298 0.1279% $2,573 3,580,730 0.1669% 848,432 Overton County $1,135 3,577,234 0.1674% $1,103 3,476,118 0.1621% (101,115) Perry County $1,375 1,588,178 0.0743% $1,152 1,329,804 0.0620% (258,374) Pickett County $1,076 768,237 0.0359% $1,131 807,860 0.0377% 39,623 Polk County $1,087 2,615,619 0.1224% $1,108 2,664,555 0.1242% 48,936 Putnam County $2,444 23,288,271 1.0897% $2,390 22,772,996 1.0617% (515,275) Rhea County $1,305 5,008,103 0.2343% $1,356 5,111,687 0.2383% 103,584 Dayton City $1,305 883,028 0.0413% $2,283 1,700,478 0.0793% 817,450 Roane County $1,730 12,540,935 0.5868% $1,785 12,941,961 0.6034% 401,026 Robertson County $1,596 15,488,691 0.7248% $1,669 16,194,189 0.7550% 705,498 Rutherford County $2,238 60,736,773 2.8421% $2,300 61,807,262 2.8817% 1,070,489
TACIR 17
Comparison of County Fiscal Capacity Model Results with Prototype System-level Model Results
FY05 County Model Prototype System-level ModelCapacity Allocated1 Percent Capacity Total PercentPer Pupil Capacity of Total Per Pupil Capacity of Total Difference
Murfreesboro City $2,238 12,308,039 0.5759% $3,657 21,067,713 0.9822% 8,759,673 Scott County $1,177 3,086,674 0.1444% $1,059 2,772,472 0.1293% (314,202) Oneida SSD $1,177 1,456,099 0.0681% $1,417 1,756,722 0.0819% 300,623 Sequatchie County $1,103 2,059,912 0.0964% $1,207 2,254,001 0.1051% 194,088 Sevier County $3,211 40,182,137 1.8803% $4,150 51,927,616 2.4210% 11,745,479 Shelby County $2,808 124,161,072 5.8100% $2,301 103,497,455 4.8254% (20,663,618) Memphis SSD City $2,808 329,621,569 15.4242% $2,767 322,781,651 15.0491% (6,839,917) Smith County $1,392 4,381,302 0.2050% $1,385 4,359,396 0.2032% (21,906) Stewart County $850 1,761,660 0.0824% $1,100 2,280,819 0.1063% 519,159 Sullivan County $2,484 32,050,404 1.4998% $2,338 30,046,722 1.4009% (2,003,682) Bristol City $2,484 8,989,873 0.4207% $3,078 11,030,273 0.5143% 2,040,400 Kingsport City $2,484 15,568,329 0.7285% $3,306 20,999,996 0.9791% 5,431,667 Sumner County $1,781 40,768,748 1.9077% $1,814 41,509,262 1.9353% 740,514 Tipton County $877 9,593,867 0.4489% $1,118 12,228,234 0.5701% 2,634,367 Trousdale County $939 1,199,692 0.0561% $1,057 1,350,182 0.0629% 150,490 Unicoi County $1,511 3,759,105 0.1759% $1,222 3,039,982 0.1417% (719,123) Union County $543 1,660,173 0.0777% $759 2,318,969 0.1081% 658,796 Van Buren County $703 546,023 0.0256% $959 744,807 0.0347% 198,785 Warren County $1,808 11,180,207 0.5232% $1,641 10,146,728 0.4731% (1,033,479) Washington County $2,552 22,073,290 1.0329% $2,588 22,155,108 1.0329% 81,818 Johnson City $2,552 16,958,919 0.7936% $3,672 24,714,463 1.1523% 7,755,544 Wayne County $834 2,197,275 0.1028% $880 2,316,399 0.1080% 119,124 Weakley County $1,573 7,706,003 0.3606% $1,429 7,003,213 0.3265% (702,790) White County $1,203 4,632,894 0.2168% $1,216 4,680,826 0.2182% 47,931 Williamson County $3,446 70,368,373 3.2928% $3,578 72,557,784 3.3829% 2,189,411 Franklin SSD $3,446 12,592,870 0.5893% $3,986 15,134,469 0.7056% 2,541,599 Wilson County $2,034 24,021,892 1.1241% $2,217 26,209,226 1.2220% 2,187,334 Lebanon SSD $2,034 5,897,344 0.2760% $2,873 8,304,900 0.3872% 2,407,555
Statewide $2,367 2,137,041,077$ 100.0000% $2,852 2,144,855,363$ 100.0000% 7,814,286$
1 Allocated based on share of county-area BEP match as per actual BEP method.2 Carroll County system's total capacity per system-level model is based on county-area capacity minus capacities of SSDs.
TACIR 18

LakeObion Weakley Henry
DyerGibson Carroll
LauderdaleCrockett
MadisonHenderson
HaywoodTipton
Shelby Fayette Hardeman
Chester
McNairy
Benton
Decatur
Hardin Wayne
Perry
Humphreys
Stewart Montgomery
Dickson
Hickman
Lewis
LawrenceGiles Lincoln
Moore
Bedford
Maury
Marshall
WilliamsonRutherford
DavidsonWilson
Marion Hamilton
Coffee
Grundy
Sequatchie
Bledsoe
VanBuren
CannonWhite
DeKalb
PutnamSmith
Jackson
Macon Clay
TrousdaleOverton
FentressScott
Pickett
Campbell
Morgan
Cumberland
Anderson
Roane
Knox
Loudon Blount
PolkBradley
McMinn
Rhea
Meigs
ClaiborneHancock
HawkinsSullivan
Union Grainger
Sevier
JeffersonCocke
GreeneHamblen Washington Johnson
Carter
Warren
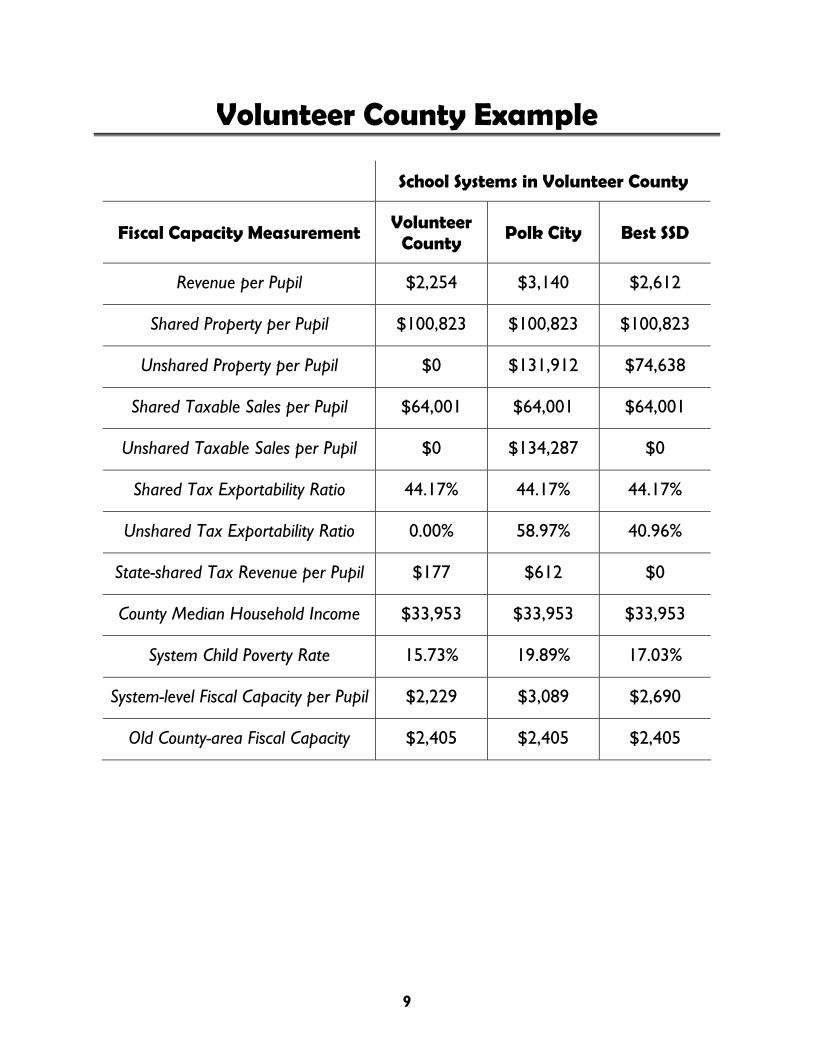
Change in State BEP Funding w/Prototype by County Area TotalFiscal Year 2005 vs. Fiscal Year 2004
Key to County-area Change
12% to 30% less
0% to 4% less*
0% to 5% more*
6% to 10% more*
11% to 18% more
Statewide = 6% more*Dotted patterns mean county is being held harmless for actual decline from 2005 to 2004—prototype is more favorable to these counties.TACIR
∗ ∗
∗∗∗
∗
∗∗
∗
∗
∗
∗ ∗ ∗∗∗
∗∗
∗
∗∗∗ ∗
∗ ∗∗ ∗
∗Memphis
Dyersburg
Union City Paris SSD
Lexington FayettevilleRichard City SSD Cleveland
∗ ∗∗∗∗ ∗
∗∗∗
∗Crockett
Gibson CarrollAlamo
S. Carroll Co. SSD
McKenzie SSD
Huntingdon SSD
Hollow Rock Bruceton SSD
W. Carroll Co. SSD
Bells
Humboldt
Milan SSD
Gibson Co. SSD
Trenton SSD
Bradford SSD
Franklin SSDMurfreesboro
Lebanon 10th SSD
Dayton
Oneida SSD
EtowahAthens
SweetwaterMonroe
Rogersville KingsportBristol
Johnson City
GreenevilleNewport
Elizabethton
Anderson
Loudon
∗∗∗
Clinton
Oak Ridge
Alcoa
Lenoir City
Maryville
Manchester
Tullahoma
Franklin
Robertson
∗
Chea
tham
Sumner
Unicoi
∗∗
∗
Key to Multi-System Change
city/SSD gain
city/SSD loss < county system gain
city/SSD loss > county system gain
∗
∗
∗∗∗∗∗∗ ∗∗
∗∗
∗
∗
∗
Houston
19

Table 1. Change in State BEP Funding w/Prototype by County Area Total
Number of Actual PercentCounty Area Systems FY2003-04 w/Prototype w/Prototype Change
Anderson 3 38,388,000$ 38,264,000$ (124,000)$ 0%Bedford 1 20,366,000 23,487,000 3,121,000 15%Benton 1 8,191,000 8,975,000 784,000 10%Bledsoe 1 6,884,000 8,113,000 1,229,000 18%Blount 3 47,601,000 45,852,000 (1,749,000) -4%Bradley 2 37,040,000 37,902,000 862,000 2%Campbell 1 20,442,000 22,540,000 2,098,000 10%Cannon 1 7,449,000 8,614,000 1,165,000 16%Carroll 6 17,266,000 17,880,000 614,000 4%Carter 2 26,955,000 29,309,000 2,354,000 9%Cheatham 1 22,382,000 24,186,000 1,804,000 8%Chester 1 8,197,000 9,325,000 1,128,000 14%Claiborne 1 16,759,000 19,105,000 2,346,000 14%Clay 1 4,564,000 5,115,000 551,000 12%Cocke 2 17,586,000 19,332,000 1,746,000 10%Coffee 3 25,653,000 25,045,000 (608,000) -2%Crockett 3 9,062,000 10,465,000 1,403,000 15%Cumberland 1 20,446,000 21,161,000 715,000 3%Davidson 1 151,400,000 149,031,000 (2,369,000) -2%Decatur 1 5,216,000 5,750,000 534,000 10%DeKalb 1 8,537,000 9,278,000 741,000 9%Dickson 1 23,728,000 25,761,000 2,033,000 9%Dyer 2 19,532,000 20,657,000 1,125,000 6%Fayette 1 10,950,000 12,299,000 1,349,000 12%Fentress 1 8,234,000 9,291,000 1,057,000 13%Franklin 1 19,725,000 20,453,000 728,000 4%Gibson 5 25,859,000 27,852,000 1,993,000 8%Giles 1 13,392,000 14,701,000 1,309,000 10%Grainger 1 12,128,000 13,674,000 1,546,000 13%Greene 2 29,583,000 31,930,000 2,347,000 8%Grundy 1 8,527,000 9,893,000 1,366,000 16%Hamblen 1 23,880,000 26,472,000 2,592,000 11%Hamilton 1 87,690,000 93,594,000 5,904,000 7%Hancock 1 4,482,000 4,832,000 350,000 8%Hardeman 1 16,189,000 18,262,000 2,073,000 13%Hardin 1 11,641,000 12,541,000 900,000 8%Hawkins 2 26,025,000 28,667,000 2,642,000 10%Haywood 1 11,909,000 13,577,000 1,668,000 14%Henderson 2 14,083,000 14,920,000 837,000 6%Henry 2 13,703,000 14,613,000 910,000 7%Hickman 1 13,807,000 15,265,000 1,458,000 11%Houston 1 5,281,000 6,005,000 724,000 14%Humphreys 1 9,694,000 10,439,000 745,000 8%Jackson 1 6,223,000 7,035,000 812,000 13%Jefferson 1 22,421,000 24,565,000 2,144,000 10%Johnson 1 8,679,000 9,548,000 869,000 10%Knox 1 111,187,000 112,277,000 1,090,000 1%Lake 1 3,361,000 3,862,000 501,000 15%Lauderdale 1 16,294,000 17,902,000 1,608,000 10%Lawrence 1 21,261,000 23,428,000 2,167,000 10%
FY2004-05 Change
TACIR 20

Table 1. Change in State BEP Funding w/Prototype by County Area Total
Number of Actual PercentCounty Area Systems FY2003-04 w/Prototype w/Prototype Change
FY2004-05 Change
Lewis 1 6,817,000 7,382,000 565,000 8%Lincoln 2 16,003,000 16,462,000 459,000 3%Loudon 2 20,321,000 20,809,000 488,000 2%McMinn 3 23,856,000 23,410,000 (446,000) -2%McNairy 1 13,334,000 15,469,000 2,135,000 16%Macon 1 12,487,000 13,518,000 1,031,000 8%Madison 1 33,256,000 34,522,000 1,266,000 4%Marion 2 14,003,000 15,346,000 1,343,000 10%Marshall 1 14,068,000 15,774,000 1,706,000 12%Maury 1 34,404,000 34,715,000 311,000 1%Meigs 1 6,927,000 7,569,000 642,000 9%Monroe 2 21,305,000 22,793,000 1,488,000 7%Montgomery 1 70,915,000 79,361,000 8,446,000 12%Moore 1 3,455,000 3,728,000 273,000 8%Morgan 1 12,142,000 13,722,000 1,580,000 13%Obion 2 15,912,000 16,916,000 1,004,000 6%Overton 1 11,423,000 13,154,000 1,731,000 15%Perry 1 4,160,000 4,777,000 617,000 15%Pickett 1 2,746,000 2,896,000 150,000 5%Polk 1 8,748,000 9,718,000 970,000 11%Putnam 1 25,848,000 28,066,000 2,218,000 9%Rhea 2 14,827,000 15,785,000 958,000 6%Roane 1 23,526,000 25,521,000 1,995,000 8%Robertson 1 29,231,000 32,583,000 3,352,000 11%Rutherford 2 92,369,000 95,033,000 2,664,000 3%Scott 2 13,514,000 14,682,000 1,168,000 9%Sequatchie 1 6,739,000 7,734,000 995,000 15%Sevier 1 28,953,000 20,434,000 (8,519,000) -29%Shelby 2 433,673,000 476,208,000 42,535,000 10%Smith 1 10,181,000 11,119,000 938,000 9%Stewart 1 7,847,000 8,288,000 441,000 6%Sullivan 3 58,264,000 56,004,000 (2,260,000) -4%Sumner 1 71,182,000 77,801,000 6,619,000 9%Tipton 1 38,290,000 41,588,000 3,298,000 9%Trousdale 1 5,044,000 5,545,000 501,000 10%Unicoi 1 8,419,000 9,831,000 1,412,000 17%Union 1 11,804,000 13,068,000 1,264,000 11%Van Buren 1 3,188,000 3,526,000 338,000 11%Warren 1 18,793,000 20,594,000 1,801,000 10%Washington 2 40,100,000 35,336,000 (4,764,000) -12%Wayne 1 9,727,000 10,746,000 1,019,000 10%Weakley 1 15,267,000 17,068,000 1,801,000 12%White 1 12,896,000 14,417,000 1,521,000 12%Williamson 2 64,350,000 61,589,000 (2,761,000) -4%Wilson 2 42,735,000 43,533,000 798,000 2%
2,552,901,000$ 2,701,184,000$ 148,283,000$ 6%
TACIR 21

Table 2. Change in State BEP Funding w/Prototype
ActualSystem Name FY2003-04 w/Prototype w/Prototype
Anderson County 21,822,000$ 24,089,000$ 2,267,000$ Clinton City 3,076,000 2,372,000 (704,000) Oak Ridge City 13,490,000 11,803,000 (1,687,000) Bedford County 20,366,000 23,487,000 3,121,000 Benton County 8,191,000 8,975,000 784,000 Bledsoe County 6,884,000 8,113,000 1,229,000 Blount County 31,503,000 33,251,000 1,748,000 Alcoa City 3,672,000 1,883,000 (1,789,000) Maryville City 12,426,000 10,718,000 (1,708,000) Bradley County 25,051,000 28,115,000 3,064,000 Cleveland City 11,989,000 9,787,000 (2,202,000) Campbell County 20,442,000 22,540,000 2,098,000 Cannon County 7,449,000 8,614,000 1,165,000 Carroll County 1,407,000 1,415,000 8,000 H Rock-Bruceton SSD 2,528,000 2,528,000 - Huntingdon SSD 4,254,000 4,301,000 47,000 McKenzie SSD 4,210,000 4,324,000 114,000 South Carroll Co SSD 1,307,000 1,547,000 240,000 West Carroll Co SSD 3,560,000 3,765,000 205,000 Carter County 20,131,000 23,001,000 2,870,000 Elizabethton City 6,824,000 6,308,000 (516,000) Cheatham County 22,382,000 24,186,000 1,804,000 Chester County 8,197,000 9,325,000 1,128,000 Claiborne County 16,759,000 19,105,000 2,346,000 Clay County 4,564,000 5,115,000 551,000 Cocke County 15,358,000 17,560,000 2,202,000 Newport City 2,228,000 1,772,000 (456,000) Coffee County 12,035,000 12,842,000 807,000 Manchester City 3,616,000 3,196,000 (420,000) Tullahoma City 10,002,000 9,007,000 (995,000) Crockett County 5,881,000 7,164,000 1,283,000 Alamo City 1,811,000 1,783,000 (28,000) Bells City 1,370,000 1,518,000 148,000 Cumberland County 20,446,000 21,161,000 715,000 Davidson County 151,400,000 149,031,000 (2,369,000) Decatur County 5,216,000 5,750,000 534,000 DeKalb County 8,537,000 9,278,000 741,000 Dickson County 23,728,000 25,761,000 2,033,000 Dyer County 9,872,000 11,279,000 1,407,000 Dyersburg City 9,660,000 9,378,000 (282,000) Fayette County 10,950,000 12,299,000 1,349,000 Fentress County 8,234,000 9,291,000 1,057,000 Franklin County 19,725,000 20,453,000 728,000 Humboldt City 4,986,000 4,947,000 (39,000) Milan SSD 6,139,000 6,665,000 526,000 Trenton SSD 4,597,000 4,868,000 271,000
ChangeFY2004-05
TACIR 22

Table 2. Change in State BEP Funding w/Prototype
ActualSystem Name FY2003-04 w/Prototype w/Prototype
ChangeFY2004-05
Bradford SSD 2,008,000 2,264,000 256,000 Gibson County SSD 8,129,000 9,108,000 979,000 Giles County 13,392,000 14,701,000 1,309,000 Grainger County 12,128,000 13,674,000 1,546,000 Greene County 21,126,000 24,185,000 3,059,000 Greeneville City 8,457,000 7,745,000 (712,000) Grundy County 8,527,000 9,893,000 1,366,000 Hamblen County 23,880,000 26,472,000 2,592,000 Hamilton County 87,690,000 93,594,000 5,904,000 Hancock County 4,482,000 4,832,000 350,000 Hardeman County 16,189,000 18,262,000 2,073,000 Hardin County 11,641,000 12,541,000 900,000 Hawkins County 23,991,000 26,876,000 2,885,000 Rogersville City 2,034,000 1,791,000 (243,000) Haywood County 11,909,000 13,577,000 1,668,000 Henderson County 11,011,000 11,911,000 900,000 Lexington City 3,072,000 3,009,000 (63,000) Henry County 9,383,000 10,318,000 935,000 Paris SSD 4,320,000 4,295,000 (25,000) Hickman County 13,807,000 15,265,000 1,458,000 Houston County 5,281,000 6,005,000 724,000 Humphreys County 9,694,000 10,439,000 745,000 Jackson County 6,223,000 7,035,000 812,000 Jefferson County 22,421,000 24,565,000 2,144,000 Johnson County 8,679,000 9,548,000 869,000 Knox County 111,187,000 112,277,000 1,090,000 Lake County 3,361,000 3,862,000 501,000 Lauderdale County 16,294,000 17,902,000 1,608,000 Lawrence County 21,261,000 23,428,000 2,167,000 Lewis County 6,817,000 7,382,000 565,000 Lincoln County 12,719,000 13,720,000 1,001,000 Fayetteville City 3,284,000 2,742,000 (542,000) Loudon County 14,402,000 15,251,000 849,000 Lenoir City 5,919,000 5,558,000 (361,000) McMinn County 17,498,000 18,311,000 813,000 Athens City 5,146,000 3,870,000 (1,276,000) Etowah City 1,212,000 1,229,000 17,000 McNairy County 13,334,000 15,469,000 2,135,000 Macon County 12,487,000 13,518,000 1,031,000 Madison County 33,256,000 34,522,000 1,266,000 Marion County 12,967,000 14,146,000 1,179,000 Richard City SSD 1,036,000 1,200,000 164,000 Marshall County 14,068,000 15,774,000 1,706,000 Maury County 34,404,000 34,715,000 311,000 Meigs County 6,927,000 7,569,000 642,000 Monroe County 16,653,000 18,318,000 1,665,000
TACIR 23

Table 2. Change in State BEP Funding w/Prototype
ActualSystem Name FY2003-04 w/Prototype w/Prototype
ChangeFY2004-05
Sweetwater City 4,652,000 4,475,000 (177,000) Montgomery County 70,915,000 79,361,000 8,446,000 Moore County 3,455,000 3,728,000 273,000 Morgan County 12,142,000 13,722,000 1,580,000 Obion County 11,775,000 13,204,000 1,429,000 Union City 4,137,000 3,712,000 (425,000) Overton County 11,423,000 13,154,000 1,731,000 Perry County 4,160,000 4,777,000 617,000 Pickett County 2,746,000 2,896,000 150,000 Polk County 8,748,000 9,718,000 970,000 Putnam County 25,848,000 28,066,000 2,218,000 Rhea County 12,512,000 13,880,000 1,368,000 Dayton City 2,315,000 1,905,000 (410,000) Roane County 23,526,000 25,521,000 1,995,000 Robertson County 29,231,000 32,583,000 3,352,000 Rutherford County 75,856,000 84,005,000 8,149,000 Murfreesboro City 16,513,000 11,028,000 (5,485,000) Scott County 9,157,000 10,192,000 1,035,000 Oneida SSD 4,357,000 4,490,000 133,000 Sequatchie County 6,739,000 7,734,000 995,000 Sevier County 28,953,000 20,434,000 (8,519,000) Shelby County 121,656,000 138,866,000 17,210,000 Memphis City 312,017,000 337,342,000 25,325,000 Smith County 10,181,000 11,119,000 938,000 Stewart County 7,847,000 8,288,000 441,000 Sullivan County 32,652,000 35,446,000 2,794,000 Bristol City 9,253,000 8,060,000 (1,193,000) Kingsport City 16,359,000 12,498,000 (3,861,000) Sumner County 71,182,000 77,801,000 6,619,000 Tipton County 38,290,000 41,588,000 3,298,000 Trousdale County 5,044,000 5,545,000 501,000 Unicoi County 8,419,000 9,831,000 1,412,000 Union County 11,804,000 13,068,000 1,264,000 Van Buren County 3,188,000 3,526,000 338,000 Warren County 18,793,000 20,594,000 1,801,000 Washington County 22,426,000 23,191,000 765,000 Johnson City 17,674,000 12,145,000 (5,529,000) Wayne County 9,727,000 10,746,000 1,019,000 Weakley County 15,267,000 17,068,000 1,801,000 White County 12,896,000 14,417,000 1,521,000 Williamson County 53,761,000 53,408,000 (353,000) Franklin SSD 10,589,000 8,181,000 (2,408,000) Wilson County 34,077,000 35,945,000 1,868,000 Lebanon SSD 8,658,000 7,588,000 (1,070,000)
Statewide 2,552,901,000$ 2,701,184,000$ 148,283,000$
TACIR 24

25
Glossary
Ability to Pay—the ability of individuals in a certain jurisdiction to pay taxes relative to those in other jurisdictions, generally based on a measure of income. The TACIR school system fiscal capacity model uses county per capita income and school district poverty rates, which are based on income, to measure ability to pay.
Child Poverty Rate—the percentage of related children living in families below the federal poverty line—as used here, it refers to school-aged children, those between the ages of five and seventeen inclusive.
Fiscal Capacity—the potential ability of the school systems’ to raise revenues from their own sources to pay for public education.
Fiscal Effort—the degree to which a school system utilizes the revenue bases available to it, typically measured as the ratio of between the actual amount of revenues collected or used for a particular purpose to a related measure of fiscal capacity.
Local Revenue—the amount of money provided at the discretion of local officials to support school systems, such as property taxes, and state-shared tax revenues that substitute for local revenue.
Median Household Income—the middle value among households (i.e., the value above and below which lie an equal number of households) for money income received in the previous calendar year by all household members 15 years old and over, including household members not related to the householder, people living alone, and others in non-family households.
Ordinary Least Squares Multiple Linear Regression—a statistical process used to predict the values of a dependent variable, such as local revenue for education, based on the values of a set of explanatory variables, called independent variables.
Property per Pupil—the equalized assessed valuation of property subject to taxation by local officials divided by the number of students in average daily membership.
Representative Tax System—as a measure of fiscal capacity, a method of calculating the amount of revenue that a region or government would collect if it were to exert average fiscal effort; hypothetical tax system that is representative or typical of all the taxes actually levied by the state and local governments of a federation intended to be descriptive of the state-local tax system.
Resident Tax Burden—the portion of property tax payments for which owners of homes and farms are responsible; the equalized assessed valuation of residential and farm property divided by the total taxable value of all property.
Sales per Pupil—the value of all sales subject to taxation by cities and counties divided by the number of students in average daily membership.
Service Burden—the cost of providing for public education.

26 H:\FISCAP\2005fc\BEPRC08Sep04\System-level Fiscal Capacity for Funding Education in Tennessee.doc
Shared Property—the value of property subject to county education taxes, all of which must be shared among all school systems in the county based on the proportion of students in each system. Note: all county education revenue must be shared with any and all other school systems in the county.
Shared Taxable Sales— the value of sales subject to countywide taxes, all of which must be shared among all school systems in the county based on the proportion of students in each system. Note: all county education revenue must be shared with any and all other school systems in the county.
State-shared Tax Revenue per Pupil—funds provided by the State from state revenues to cities and counties to supplement funds from local sources used to provide city and county services divided by the number of students in average daily membership. Revenue sources include state sales, excise, income, beer, mixed drink, and alcoholic beverage taxes, as well as TVA payments in lieu of taxes. Note: Special school districts are not eligible to receive this revenue.
Tax Exportability—the portion of property tax payments for which owners of homes and farms are not responsible; the equalized assessed valuation of business-related property (commercial, industrial, utility and personal property) divided by the total taxable value of all property.
Unshared Property—the value of property subject to taxes that generate revenue that is not required to be shared with other school systems. Note: County school systems’ revenue from this source is restricted to retirement of rural education debt and support of pupil transportation under certain specific circumstances. Such revenue cannot be used for general support of the county school system; therefore, the value of unshared property for county school systems is zero.
Unshared Taxable Sales—the value of sales subject to taxes that generate revenue that is not required to be shared with other school systems. Note: County school systems’ revenue from this source is restricted to retirement of rural education debt and support of pupil transportation under certain specific circumstances. Such revenue cannot be used for general support of the county school system; therefore, the value of unshared taxable sales for county school systems is zero. Special school districts do not have authority to tax sales; therefore, the value of unshared taxable sales for special school districts is zero.
27
Data Sources
Local Revenue Tennessee Department of Education, Annual Financial Reports from public school systems, fiscal years 2000-01 through 2002-03. The most recent available data will be for the fiscal year immediately preceding the year during which the Department of Education establishes funding for schools. For example, the Department establishes funding for 2004-05 during 2003-04; therefore, the most current available data on local revenue for use in that process is for 2002-03.
Student Counts—Average Daily Membership Tennessee Department of Education, Annual Statistical Reports for school years 2000-01 through 2002-03. http://www.state.tn.us/education/mreport.htm The most recent available data will be for the fiscal year immediately preceding the year during which the Department of Education establishes funding for schools. For example, the Department establishes funding for 2004-05 during 2003-04; therefore, the most current available student counts for use in that process are for 2002-03.
Sales Tax Base & State-shared Tax Revenues Tennessee Department of Revenue, fiscal years 2000-01 through 2002-03. The most recent available data will be for the fiscal year immediately preceding the year during which the Department of Education establishes funding for schools. For example, the Department establishes funding for 2004-05 during 2003-04; therefore, the most current available data on the sales tax base and state-shared taxes for use in the funding process is for 2002-03.
Property Tax Base & Ratio of Business-related Property Assessment to Total Assessment Tennessee Board of Equalization, Tax Aggregate Report of Tennessee, calendar years 2000 through 2002. http://www.comptroller.state.tn.us/pa/taxaggr.htm The most recent available data will be for the calendar year ended prior to the fiscal year during which the Department of Education establishes funding for schools. For example, the Department establishes funding for 2004-05 during 2003-04; therefore, the most current available data for use in that process is for 2002.
Median Household Income U.S. Census Bureau, Housing and Household Economic Statistics Division, Small Area Estimates Branch, Small Area Income and Poverty Estimates—Tables for States and Counties by Income Year and Statistic, 1998 through 2000. http://www.census.gov/hhes/www/saipe/stcty/estimate.html The most recent available data will be for the calendar year ended three years prior to the beginning of the fiscal year in which the Department of Education establishes funding for schools. For example, the Department establishes funding for 2004-05 during 2003-04; therefore, the most current available data for use in that process is for 2000, released October 2003.
Child Poverty Rates U.S. Census Bureau, Housing and Household Economic Statistics Division, Small Area Estimates Branch, Small Area Income and Poverty Estimates—School District Estimates, 1997, 1999 and 2000. http://www.census.gov/hhes/www/saipe/schooltoc.html The most recent available data will be for the calendar year ended three years prior to the beginning of the fiscal year in which the Department of Education establishes funding for schools. For example, the Department establishes funding for 2004-05 during 2003-04; therefore, the most current available data for use in that process is for 2000, released November 2003.