Inland Waterways Funding Mechanisms Synthesis
34
Inland Waterways Funding Mechanisms Synthesis Research Report KTC -14-14/MTIC4-14-1F Kentucky Transportation Center
Transcript of Inland Waterways Funding Mechanisms Synthesis

Inland Waterways Funding Mechanisms Synthesis
Research ReportKTC -14-14/MTIC4-14-1F
KentuckyTransportation
Center

Our MissionWe provide services to the transportation community through research,
technology transfer and education. We create and participate in partnerships to promote safe and effective transportation systems.
Kentucky Transportation Center176 Oliver H. Raymond Building
Lexington, KY 40506-0281(859) 257-4513
fax (859) 257-1815
www.ktc.uky.edu
© 2014 University of Kentucky, Kentucky Transportation CenterInformation may not be used, reproduced, or republished without our written consent.

Inland Waterways Funding Mechanisms Synthesis
Prepared for:
11/21/2014
Multimodal Transportation & Infrastructure Consortium by the Kentucky Transportation Center

This Page Left Intentionally Blank.

Authors:
Principal Investigator:
Researcher(s):
Multimodal Transportation and Infrastructure Consortium P.O. Box 5425
Huntington, WV 25703-0425
Phone: (304) 696-2313 • Fax: (304) 696-6088
Inland Waterways Funding Mechanisms Synthesis
Doug Kreis, PE, MBA, PMP
Bryan Gibson, PhD Research Associate
Christopher Van Dyke, MA
Research Analyst
Candice Wallace, MPA Research Analyst
Sarah McCormack, MSc, CTL
Research Engineer
Disclaimer:
The contents of this report reflect the views of the authors, who are responsible for the facts and the accuracy of the information presented herein. This document is disseminated under
the sponsorship of the U.S. Department of Transportation’s University Transportation Centers Program, in the interest of information exchange. The U.S. Government assumes no
liability for the contents or use thereof.

This page intentionally left blank.

1
Table of Contents
Executive Summary......................................................................................................................... 2
I. Introduction ............................................................................................................................... .. 3
II. Inland Waterways Trust Fund..................................................................................................... 4
III. Potential Funding/Inland Waterway Trust Fund Reforms....................................................... 12
IV. Current State of the System .................................................................................................... 20
V. Conclusion............................................................................................................................... .. 24
List of Tables and Figures
Table 1: List of Taxable Inland Waterways ..................................................................................... 8
Table 2: Congressional Budget Office (1992) Inland Waterway User Funding Options............... 15
Table 3: Cost Sharing Options Considered as Part of IMTS Capital Projects Business ModelReport ............................................................................................................................... ............ 19
Figure 1: Inland Waterways Fuel Tax.............................................................................................. 6
Figure 2: Taxable Inland Waterways............................................................................................... 7
Figure 3: Inland Waterways Trust Fund Revenues ......................................................................... 9
Figure 4: Inland Waterways Trust Fund Balances......................................................................... 10
Figure 5: Average Delay at Locks on Inland Waterway System (in hours) ................................... 22
Figure 6: Number of Scheduled and Unscheduled Unavailability on Inland Waterway System . 23
Figure 7: Scheduled and Unscheduled Unavailability on Inland Waterway System (in hours) ... 23

This page intentionally left blank.

2
Executive Summary
The inland waterway system is a vital part of the nation’s multi modal freight network.Although less visible than other modes, inland waterways allow shippers to transport bulkcommodities in a relatively cheap and environmentally friendly method. To ensure thistransportation mode remains a feasible option and accommodates growth, it must continue tobe safe, efficient, and functional. This synthesis provides comprehensive perspective on thefinancial prospects of the inland waterways system. It analyzes current funding levels, alongwith proposed funding changes and reforms.
Financial support for the inland waterways system comes from the Inland Waterways TrustFund (IWTF). Historical data gathered provides evidence that the IWTF resources have rapidlydeclined in recent years, limiting the number of infrastructure projects that can be undertaken.Some of this is can be attributed to the lack of a fuel tax increase since 1995. The fuel taxserves as the primary revenue source for the IWTF. The purchasing power of each dollar istherefore eroded due to the increase of construction costs, coupled with the tax revenue notincreasing. In order to reinforce the IWTF and deal with a mounting project backlog, severalfunding reforms have been proposed in addition to changes in project delivery andprioritization. Many reforms include raising the fuel tax and changing the current cost sharestructure. Other proposals lay out different options, such as tolling locks and dams orinstituting license fees. In order to reverse the decline of the IWTF, it appears that substantivechanges may be required.
The past and current state of the system also provides insight as to how previous investmentlevels have impacted reliability. Measures of lock performance, such as the number of outages(both scheduled and unscheduled) and the duration of lock outages, are used to assess systemdependability. These reveal that in recent years there has been an increase in outages andoutage durations. Possible factors include a reduction in funding for construction andmaintenance projects, which compounds the increasing infrastructure age issue. Unexpectedclosures impact shippers by causing unplanned delays. These delays increase costs of inlandwaterway shipments by idling freight and reducing reliability. In turn, reduced system reliabilitymay prompt modal shifts as freight shippers seek more consistent modes of transport.
This synthesis provides valuable information for stakeholders and policymakers regardingcurrent funding levels and investments in the inland waterway system. The initial evidence inthis report shows that declining funding levels, coupled with aging locks and dams, are likelycontributing to increases in lock outages. If such issues are to be rectified, the reforms detailedhere provide a starting point for changing the current funding regime.

3
I. Introduction
The 12,000 commercially navigable miles of the U.S. inland waterway system constitute a vitalcog in the nation’s transportation system, carrying over 800 million tons of domestic goodsannually (U.S. Army Corps of Engineers, 2012). The inland waterway system provides a morefuel efficient and environmentally friendly way to transport freight compared to other modesof transportation. For each gallon of fuel, a barge can carry one ton of freight 530 miles, ascompared to 420 via train and 70 via truck (U.S. Army Corps of Engineers, 2008). Barge cargocapacities are 15 times greater than rail transport, and 60 times greater than truck transport.With increasing fuel costs, environmental issues, and projected increases in freight shipments1,the inland waterway system is likely to become increasingly utilized for the movement of bulkcommodities such as coal and grain.2
To adequately discuss the future of the inland waterway system and its ability to accommodateincreased traffic, the current funding structure for maintaining and improving the system mustbe comprehensively examined. The adequacy of funding levels is likely to determine the extentto which the inland waterway system will be used in the future. This synthesis summarizescritical information related to the current status of inland waterway funding, funding reformsthat could be implemented, and the present condition of the system.
1 See the Federal Highway Administration’s Freight Analysis Framework athttp://www.ops.fhwa.dot.gov/freight/freight_analysis/faf/.2 Bray, Murphree, and Dager (2011) note the importance of the Ohio River system to coal shipments and the Mississippi Riverto grain shipments.
Barge on the Ohio River, in Northern Kentucky

4
All of this information has been collected to inform decision makers and maximize the ability ofthe inland waterways to catalyze sustained economic growth. Although the project selectionprocess and regulatory budgeting are integral to the funding process (each is discussed brieflyin this report), the focus is primarily on funding mechanisms. Despite the importance ofadequate funding for the inland waterway system, this is often neglected when infrastructuredollars are scarce. As noted by many researchers and government officials, the currenttransportation system infrastructure is aging and deteriorating. The average lock and damfacility is approaching 50 years old (U.S. Army Corps of Engineers, 2012). In an era of tightbudgets for infrastructure investment, it is vital to evaluate how the inland waterway system iscurrently funded and whether this funding is sufficient for maintaining the system in thepresent, albeit tenuous, operational state.
Other funding issues arise from increased costs due to project delays, the increasing cost ofnew projects, and delayed maintenance. Insufficient funding causes inland waterway systemperformance to suffer, which decreases reliability and increases shipping times. This situationcontributes to industry reticence regarding the maximization of transportation capabilities.Despite the cost advantage of shipping via the inland waterways, many shippers could opt totransport commodities using another method if inland waterway funding is inadequate. If thisoccurs, additional strain will be placed on highway and rail lines. As a result of limited fundingand concerns about system reliability, there is a mounting interest in looking for flexible andinnovative funding alternatives. This involves identifying proposals that reform or completelytransform the current funding regime.
The information outlined in this synthesis provides a thorough overview of funding for theinland waterway system and recommends potential avenues of reform that will informpolicymakers’ and stakeholders’ decisions moving forward. The paper then reviews the IWTF,proposed changes to the current funding system, and examines the inland waterway systemwith an emphasis on lock outages.
II. Inland Waterways Trust Fund
The Inland Waterways Trust Fund (IWTF) currently serves as the primary funding source formuch of the construction and rehabilitation work on the inland waterways system. The fund isfinanced with a 20 cent per gallon fuel tax levied on barge and towing companies. Currentconstruction and major rehabilitation projects3 are funded on a 50/50 basis from the trust fundand the federal government.
3 Defined in USACE Civil Works Direct Program based on following criteria: approval by Secretary of Army, minimum of twofiscal years for completion, capital costs are over $14.5 million for reliability improvement projects or over $1.8 million forefficiency improvements, and includes structural improvements that extend working life or increase operational efficiency.

5
However, operations and maintenance along the system are funded entirely by the federalgovernment (Pointon, 2013). These costs have consistently exceeded construction andrehabilitation costs, averaging over $500 million annually (Stern, 2013). Interest is also earnedon unspent balances in the fund. The IWTF was established as part of the Inland WaterwaysRevenue Act of 1978, which created a fuel tax at 4 cents per gallon and designated 26waterways that would be subject to this levy. In 1986, the Water Resources Development Act(WRDA) established the Inland Waterways Users Board4 and created the precedent for the50/50 cost share. The Users Board’s responsibility is to prioritize projects and make spendingrecommendations, and it consists of 11 members chosen by the Secretary of the Army.Membership on the board is designed to be representative of shipping interests, geographicalareas served by the waterways, and tonnage shipped on individual waterways (Stern, 2013).
Additionally, the WRDA authorized a gradual increase in the fuel tax to 20 cents per gallon in1995, and added the Tennessee Tombigbee Waterway to the list of taxable waterways(Pointon, 2013). The law also mandated that Congress authorize construction projects andfund them using annual appropriations:
“Together, the acts of 1978 and 1986 established a fuel tax on commercial barges, cost sharerequirements for inland waterway projects, and a trust fund to hold these revenues and fundinvestments in construction. The overall effect of these changes was a greater financial anddecision making responsibility for commercial operators on the inland waterway system.”(Stern, 2013, p. 4)
Figure 1 illustrates price changes in the fuel tax (1980 2012). Congressional authorization isgenerally required to fund projects, but these authorizations do not include planning for futurefunding of multi year projects. This often produces significant uncertainty over future fundinglevels. Such an approach leads to inefficiencies and needlessly prolonged constructiontimelines, which increases costs and diminishes the amount of funding available for otherprojects.
4 Section 302 of the Water Resources Development Act 1986 specifies that the Users Board consist of up to 11 membersappointed by the Secretary of the Army.

6
Figure 1: Inland Waterways Fuel Tax
It is important to note the tax has remained unchanged since 1995 and thus remains unadjustedto account for inflation. If the fuel tax were indexed to inflation—as measured by the ConsumerPrice Index—fuel would currently be taxed at 31 cents per gallon.
Figure 2 shows a map of the taxable waterways in the United States. The majority of activitycenters on the Ohio and Mississippi Rivers and their tributaries.
$0.00
$0.05
$0.10
$0.15
$0.20
$0.25
Cen
ts p
er g
allo
n
7
Figure 2
Source: Inland Waterways Users Board Annual Report (2012)
The inland waterways depicted in Figure 2 are described in Table 1 on the following page. TheU.S. Army Corps of Engineers (USACE) maintains responsibility for these waterways, whichencompass 38 states and carry over 8 percent of all national freight traffic (Stern, 2013).

8
Table 1: List of Taxable Inland Waterways
1. Alabama Coosa Rivers: From junction with the Tombigbee River at river mile (hereinafter referred to as RM) 0 to junction with Coosa River atRM 314.2. Allegheny River: From confluence with the Monongahela River to form the Ohio River at RM 0 to the head of the existing project at East Brady,Pennsylvania, RM 72.3. Apalachicola Chattahoochee and Flint Rivers (ACF): Apalachicola River from mouth at Apalachicola Bay (intersection with the Gulf IntracoastalWaterway) RM 0 to junction with Chattahoochee and Flint Rivers at RM 107.8. Chattahoochee River from junction with Apalachicola and FlintRivers at RM 0 to Columbus, Georgia at RM 155 and Flint River, from junction with Apalachicola and Chattahoochee Rivers at RM 0 to Bainbridge,Georgia, at RM 28.4. Arkansas River (McClellan Kerr Arkansas River Navigation System): From junction with Mississippi River at RM 0 to Port of Catoosa, Oklahoma,at RM 448.2.5. Atchafalaya River: From RM 0 at its intersection with the Gulf Intracoastal Waterway at Morgan City, Louisiana, upstream to junction with RedRiver at RM 116.8.6. Atlantic Intracoastal Waterway: Two inland waterway routes approximately paralleling the Atlantic coast between Norfolk, Virginia, and Miami,Florida, for 1,192 miles via both the Albemarle and Chesapeake Canal and Great Dismal Swamp Canal routes.7. Black Warrior Tombigbee Mobile Rivers: Black Warrior River System from RM 2.9, Mobile River (at Chickasaw Creek) to confluence withTombigbee River at RM 45. Tombigbee River (to Demopolis at RM 215.4) to port of Birmingham, RM's 374 411 and upstream to head of navigationon Mulberry Fork (RM 429.6), Locust Fork (RM 407.8), and Sipsey Fork (RM 430.4).8. Columbia River (Columbia Snake Rivers Inland Waterways): From the Dalles at RM 191.5 to Pasco, Washington (McNary Pool), at RM 330,Snake River from RM 0 at the mouth to RM 231.5 at Johnson Bar Landing, Idaho.9. Cumberland River: Junction with Ohio River at RM 0 to head of navigation, upstream to Carthage, Tennessee, at RM 313.5.
10. Green and Barren Rivers: Green River from junction with the Ohio River at RM 0 to head of navigation at RM 149.1.
11. Gulf Intracoastal Waterway: From St. Mark's River, Florida, to Brownsville, Texas, 1,134.5 miles.
12. Illinois Waterway (Calumet Sag Channel): From the junction of the Illinois River with the Mississippi River RM 0 to Chicago Harbor at LakeMichigan, approximately RM 350.13. Kanawha River: From junction with Ohio River at RM 0 to RM 90.6 at Deepwater, West Virginia.
14. Kaskaskia River: From junction with Mississippi River at RM 0 to RM 36.2 at Fayetteville, Illinois.
15. Kentucky River: From junction with Ohio River at RM 0 to confluence of Middle and North Forks at RM 258.6.
16. Lower Mississippi River: From Baton Rouge, Louisiana, RM 233.9 to Cairo, Illinois, RM 953.8.
17. Upper Mississippi River: From Cairo, Illinois, RM 953.8 to Minneapolis, Minnesota, RM 1,811.4.
18. Missouri River: From junction with Mississippi River at RM 0 to Sioux City, Iowa, at RM 734.8.
19. Monongahela River: From junction with Allegheny River to form the Ohio River at RM 0 to junction of the Tygart and West Fork Rivers,Fairmont, West Virginia, at RM 128.7.20. Ohio River: From junction with the Mississippi River at RM 0 to junction of the Allegheny and Monongahela Rivers at Pittsburgh, Pennsylvania,at RM 981.21. Ouachita Black Rivers: From the mouth of the Black River at its junction with the Red River at RM 0 to RM 351 at Camden, Arkansas.
22. Pearl River: From junction of West Pearl River with the Rigolets at RM 0 to Bogalusa, Louisiana, RM 58.
23. Red River: From RM 0 to the mouth of Cypress Bayou at RM 236.
24. Tennessee River: From junction with Ohio River at RM 0 to confluence with Holstein and French Rivers at RM 652.
25. White River: From RM 9.8 to RM 255 at Newport, Arkansas.
26. Willamette River: From RM 21 upstream of Portland, Oregon, to Harrisburg, Oregon, at RM 194.
27. Tennessee Tombigbee Waterway: From its confluence with the Tennessee River to the Warrior River at Demopolis, Tennessee.
Source: USACE
9
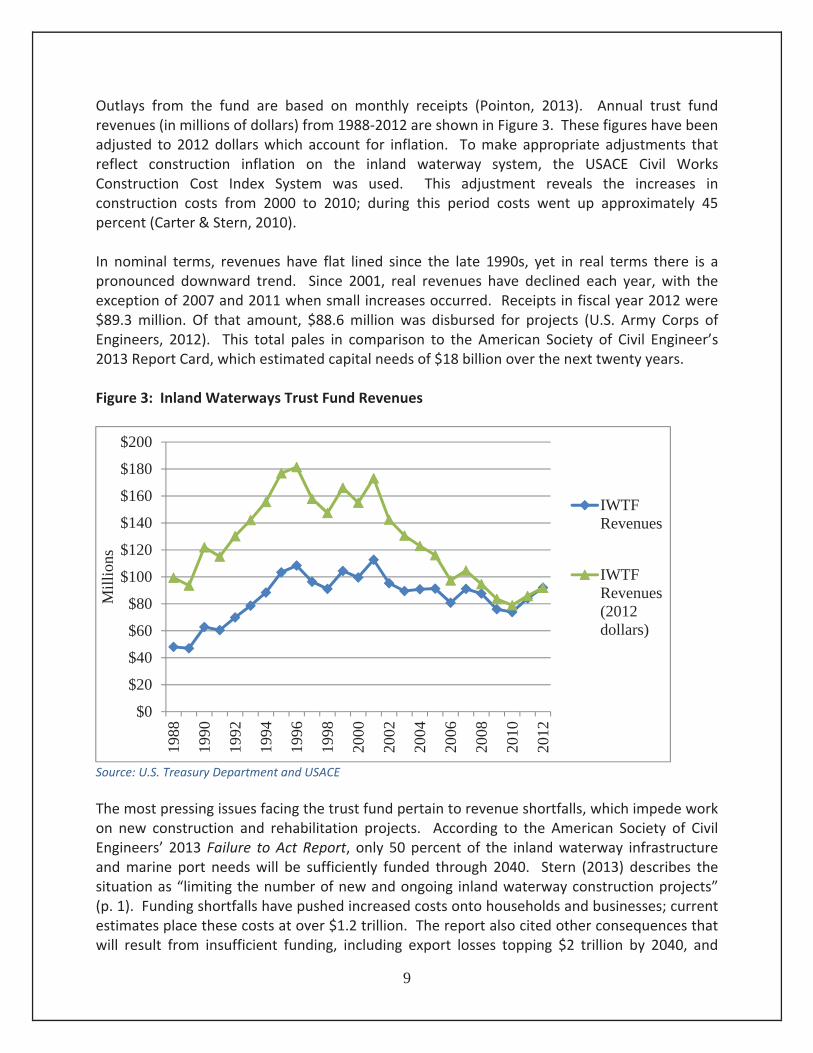
Outlays from the fund are based on monthly receipts (Pointon, 2013). Annual trust fundrevenues (in millions of dollars) from 1988 2012 are shown in Figure 3. These figures have beenadjusted to 2012 dollars which account for inflation. To make appropriate adjustments thatreflect construction inflation on the inland waterway system, the USACE Civil WorksConstruction Cost Index System was used. This adjustment reveals the increases inconstruction costs from 2000 to 2010; during this period costs went up approximately 45percent (Carter & Stern, 2010).
In nominal terms, revenues have flat lined since the late 1990s, yet in real terms there is apronounced downward trend. Since 2001, real revenues have declined each year, with theexception of 2007 and 2011 when small increases occurred. Receipts in fiscal year 2012 were$89.3 million. Of that amount, $88.6 million was disbursed for projects (U.S. Army Corps ofEngineers, 2012). This total pales in comparison to the American Society of Civil Engineer’s2013 Report Card, which estimated capital needs of $18 billion over the next twenty years.
Figure 3: Inland Waterways Trust Fund Revenues
Source: U.S. Treasury Department and USACE
The most pressing issues facing the trust fund pertain to revenue shortfalls, which impede workon new construction and rehabilitation projects. According to the American Society of CivilEngineers’ 2013 Failure to Act Report, only 50 percent of the inland waterway infrastructureand marine port needs will be sufficiently funded through 2040. Stern (2013) describes thesituation as “limiting the number of new and ongoing inland waterway construction projects”(p. 1). Funding shortfalls have pushed increased costs onto households and businesses; currentestimates place these costs at over $1.2 trillion. The report also cited other consequences thatwill result from insufficient funding, including export losses topping $2 trillion by 2040, and
$0
$20
$40
$60
$80
$100
$120
$140
$160
$180
$200
1988
1990
1992
1994
1996
1998
2000
2002
2004
2006
2008
2010
2012
Mil
lion
s
IWTFRevenues
IWTFRevenues(2012dollars)

10
projected job losses in excess of 700,000. Inadequate funding will also reverberate in the priceof goods and negatively affect disposable income for many Americans.
Figure 4 displays IWTF balances from 1988 2012 in both nominal and 2012 dollars. It is evidentthat balances have precipitously declined. Nominal balances have dropped nearly 90 percent(from a high of $412.6 million in 2002, to $44.8 million in 2012). In real dollars, the decline hasbeen even greater. Using 2012 currency values as the baseline, trust fund balances have fallenover this period nearly $600 million dollars, although there has not been a smooth downwardtrend. Balance declines in the early 1990s were offset by a subsequent rebound; but the falls inrecent years have been more sharply felt because the IWTF is nearing a zero balance.
Figure 4: Inland Waterways Trust Fund Balances
Source: U.S. Treasury Department
Sharp balance declines stem from increased project appropriations, declining receipts, and costoverruns (Stern, 2013). Due to a lack of funding and a viable cost sharing mechanism, newconstruction projects must be prioritized. Increases in appropriations began in 2005, as greaterinvestments in IWTF projects were approved. This produced a situation where expendituresoutpaced revenues, contributing to the abrupt decrease in balances in subsequent years (Stern,2013). The decline in revenues has also contributed to project backlogs. When coupled withincreasing costs and extended project times, these developments have placed the viability ofthe current business model in doubt (Hammond, 2013).
$0
$100
$200
$300
$400
$500
$600
$700
1988
1990
1992
1994
1996
1998
2000
2002
2004
2006
2008
2010
2012
Mil
lion
s
IWTFBalances(2012dollars)IWTFBalances

11
Congress has taken several steps to slow the rapid decline in the IWTF including:
1) Exempting rehabilitation projects from cost sharing
2) Exempting cost share requirements for $400 million in construction funds appropriated viathe American Recovery and Reinvestment Act
3) Prohibiting new construction contracts
4) Limiting appropriations so they match anticipated revenues.
Additional funding concerns, outside of the IWTF, center on annual appropriations foroperations and maintenance. While capital expenditures are an important component ofinland waterway funding, maintaining the system in good working order is critical to preserveits reliability and efficiency. In FY 2010, $2.5 billion was requested for operations andmaintenance. However, only $2.4 billion was appropriated (GAO, 2010).
Given that operations and maintenance appropriations are drawn from general federalrevenues, uncertainty can arise if there is a lack of consensus between Congress andPresidential administrations over funding levels (Grier, 2002). Additional cost issues centeraround the Olmstead Lock and Dam on the Ohio River. Olmstead has received a significantproportion of funds due to cost overruns. Total project costs have shot up from an estimated$1 billion to over $3 billion as of 2012 (Stern, 2013). Cost overruns and lengtheningconstruction timelines produce a cascade effect, which leaves other key projects underfundedor not funded at all.

12
III. Potential Funding/Inland Waterway Trust Fund Reforms
Although the current revenue structure of the IWTF, which is comprised of fuel taxes, appearsto have been sufficient at one time, there are issues of great concern. The lack of inflationindexing, increasing project needs due to aging infrastructure, and the current state of thefund, all underline the importance of adopting policy changes to improve the IWTF’s fiscalposition, along with identifying new ways to increase operations and maintenance funding.
Given the IWTF’s plummeting balance, there have been a number of proposals offered byvarious organizations and the federal government to alleviate revenue shortfalls. Althoughsome reforms have been implemented, further policy shifts are necessary. Many of theproposed changes seek to improve the project identification and delivery process while raisingadditional funds, either by replacing the fuel tax outright or increasing it above the current rate.Based on the trajectory of past reform proposals, the impetus to alter the current fundingstructure or develop new revenue sources has been a source of conversation for some time.
Olmstead Lock and Dam – Louisville, Kentucky District

13
When evaluating whether to change funding structures, Case and Lave (1977) note that severalcriteria that should be enhanced through user charges that include efficiency5, equity, andadministrative simplicity. They describe a number of user charge regimes including fuel taxes,annual license fees, segment tolls, lockage fees, and congestion tools, many of which remainsalient given the current funding issues facing the inland waterways system. Increasing the fueltax, an option many reform proposals contain today, is cited as beneficial due to administrativesimplicity. However, it fails to meet the efficiency criterion as it would subsidize waterways withlower traffic volumes at the expense of higher traffic segments. Additionally, raising the fueltax could reduce congestion by shifting freight to other modes if the cost differential of the taxincrease was significant. Annual license fees could be levied on barges. This could beaccomplished with costs determined by the annual operation and maintenance needs dividedby total traffic, or by revenues needed to fund priority construction projects.
5 Defined by the Congressional Budget Office (1992) as “charging users a price equal to marginal social cost” (p.63).
Hickman-Fulton County Riverport (Hickman, Kentucky)

14
In terms of administration, Case and Lave noted that this policy is similar to the fuel tax, yet thetax incidence does not necessarily fall on the waterway incurring the usage. This situationleaves the criteria of equity and efficiency unmet. Another possibility, segment tolling, wouldimpose charges at certain points along the system. This would efficiently distribute the costsbased on usage. The main benefit of this structure is the administrative simplicity. Likesegment tolling, lockage fees are collected each time a vessel transits a lock. The efficiency andequity of such scenarios hinge on the pricing structure. If volume determines charges, thensegments and locks with higher traffic flows would have lower rates than less travelledsegments and locks. This could reduce individual costs in already congested areas, leading tono impact on congestion, and potentially increase congestion. Distributing costs evenly acrossthe system would not solve the problems of efficiency and equity in a fair manner.
Finally, congestion tolling is proposed with three different structures: auctioning queue spots,charging individual barges a per hour delay fee for each barge that is waiting (vessels wouldhave the option to vacate their position), and a per hour delay fee with no option to vacatequeue position. No one proposal meets all of the evaluation criteria. Balancing desiredoutcomes with needed funding levels will likely remain the overriding litmus test of anyproposed reform. Case and Lave detailed which proposals are more likely to meet eachcriterion previously defined by stating “If efficiency is the prime concern, a segment toll pluslocking fee and congestion toll suitably average to attain administrative simplicity are best. Ifequity and simplicity are the prime concerns, the segment toll might be set to bring totalreceipts up to the maintenance and investment cost associated with each segment.” (Case andLove, p. 818)
The Congressional Budget Office’s (1992) analysis of waterways funding featured a number ofproposals, including some highlighted previously by Case and Lave (1977). The study presentscriteria used to assess proposals with a variety of potential funding options. The first step indeciding what charges to extract is done by determining whether to levy a charge on the entireinland waterway system, or if the fee structure should be designed based on the characteristicsof individual waterways. This approach would increase efficiency by reducing subsidizationfrom low cost waterways to higher cost waterways. Secondly, the funding structure must bedefined to distinguish between charging to recover operation and maintenance costs, or therecovery of project capital costs to determine which of funding alternative is most practical.

15
The individual funding arrangements identified by the Congressional Budget Office are listedbelow:
Table 2: Congressional Budget Office (1992) Inland Waterway User Funding Options
Recovery of Operation and Maintenance Costs
Annual License Fees Equal to operation and maintenance costs divided bynumber of barges using the waterway
Charge Equal to Operation and MaintenanceCost per Ton Mile
Operation and maintenance costs divided by ton milesand charged to users on that basis
Per Lockage Fee Operation and maintenance costs divided by totallockages
Increase Fuel Tax Increase fuel tax sufficient to cover operation andmaintenance costs
Charge Based on Demand Factors Charges vary based on availability of alternative routes;pricing sufficient to cover operation and maintenancecosts
Combination Tolls Utilize fuel tax and ton mile charges by waterwayLock and Dam Congestion Charge Charges based on users willing to pay for first access at
congested locks and damsRecovery of Capital Costs
Annual Fee Annualized Capital Costs Divided by UsersPer Use Charge Capital Costs Divided by Number of UsesCharge Based on Demand Factors Charges vary based on availability of alternative routes;
pricing sufficient to cover capital costs
The report concludes by observing that:
“Existing taxes imposed on users of inland waterways does not raise enough revenue to coveroperation and maintenance costs, let alone costs of new construction” (p. 71).
Given that the main revenue source has remained unchanged since 1995, the fundingdifficulties and issues raised by this report are even more pertinent today than when the reportwas published in 1992. The Waterways Council, a national policy organization comprised ofwaterway users that advocates on behalf of the inland waterway system, has put forward aCapital Development Plan to improve infrastructure on the nation’s inland waterways.

16
The Waterways Council lobbied to incorporate this plan into the Water ResourcesDevelopment Act (WRDA), which is currently before the 113th Congress. The goal of the planis to:
1) Prioritize projects over the system
2) Improve USACE project management and abilities to deliver projects on time and budget
3) Change funding mechanisms to ensure the system’s future viability
Source: (Colbert, 2013)
These changes would increase cost efficiencies on delayed projects and avoid cost increasesassociated with longer project times (Hammond, 2013). Underwriting these changes are thegoals of funding projects efficiently, finishing projects in a timely manner, and using a systemwide context when conducting project analysis. This plan argues for ranking projects based oncondition, likelihood of declining performance, consequences of that decline, and return oninvestments affecting performance levels. Rankings would then be used to prioritize projects.
This type of change in prioritization reflects concerns Grier (2002) raises, which suggests lookingat the threshold for project funding and the potential return on investments for lock and damprojects, rather than singularly focusing on benefit cost ratios (National Academy of PublicAdministration, 2007). This plan would require the Users Board to collaborate with USACE toimprove the current model and develop a long term funding strategy (Hammond, 2013).Outside of using simulations, such a coordinated approach seems applicable to the inlandwaterway system. The USACE is working within budgetary constraints to optimize thedistribution of available funding across a spectrum of potential projects (Wang & Schonfeld,2005).
The traditional cost sharing structure would also be overhauled. Construction and majorrehabilitation projects over $100 million would still be shared 50/50 between the federalgovernment and the IWTF. Rehabilitation projects less that $100 million would be completelyfunded by the federal government. Implementing these changes would require outlays of $270million from the federal side and $110 million from the IWTF. This increase in expenditureswould call for an increase in the fuel tax, or devising some other method of industry funding(Hammond, 2013). As previously noted, tax rate increases not indexed for future inflation willeventually erode purchasing power and impair the system by reducing the number fundedprojects. Revenue structures that account for such impacts, even if it is not explicitly linked toindexing, will shore up short and medium term project funding for the inland waterway system.

17
Stern (2013) examines potential changes to the current financing system for inland waterwaysfrom two perspectives, the Users Board and the Executive Branch. Starting with anexamination of policies implemented by the Bush Administration,6 Stern details approaches toIWTF funding. Initial proposals focused on replacing the fuel tax with lockage fees. The feeswould be tied to the balance in the IWTF, with fees rising when the balance fell below $25million and decreasing when it surpassed $75 million. This change was touted as improvingequity of inland waterway investments, as most capital projects involve locks. Congressrejected this proposal due to the increasing burdens it would place on lock users compared tothe current fuel tax structure.
The Obama Administration has proposed replacing the fuel tax with user fees to boost revenuesand increase efficiency. This proposal would also allow the USACE to increase fees at hightraffic locks. A more comprehensive option put forward would have maintained the fuel taxand levied annual fees to meet a revenue target (Stern, 2013). Expansion of the current systemso that a larger number of waterways would be subject to user fees was another policysuggestion that was advanced. However, this plan was not anticipated to generate significantnew revenues.
Although often at odds with administration attempts to change the current financing structureof the IWTF, the Users Board has offered several alternative proposals. These include raisingthe fuel tax and altering the current cost sharing structure. The Users Board has proposedincreasing the fuel tax by 6 9 cents per gallon, while requiring the federal government toincrease its cost share to 100 percent for dams, cost overruns, and projects between $8 and$99 million (Stern, 2013). The increase in the fuel tax would be indexed, and increased tocompensate if revenues fall short of expected levels.
Appropriations would also be deferred to let the IWTF balance recover and stabilize. Outside ofchanges to the revenue and cost sharing structures, the Users Board offered a project prioritylist that recommended increasing involvement regarding IWTF projects. This could be done byrequiring board approval and appointing representatives for each project team (Stern, 2013).This method would change the way projects are currently selected (by the USACE and thecurrent Administration and Congress) while implementing a priority ranking system.
When determining an optimal investment strategy, it is imperative to account for averagemaintenance costs (Congressional Budget Office, 1992). Infrastructure projects that reduce theaverage maintenance cost (as well as transit times via reduced congestion, thus benefittingshippers as well) will often prove cost beneficial over the long run. Including these measures aspart of the decision making process is likely to yield future benefits for the IWTF and system asa whole. Adding such considerations to the deliberation process will improve project selectionand execution.
6 For a brief summary of additional administration proposals dating back to FY 1996, see Kruse, Ellis, Protopapas, and Norboge, 2013 p.13-23.

18
A study commissioned by the United Soybean Board (Kruse, Ellis, Protopapas, and Norboge,2013)7 developed a bonding alternative to fund waterway projects. This approach allows largecapital intensive projects to be undertaken immediately, rather than facing interminable delaysuntil sufficient revenues have been collected.8 The authors cite several advantages of fundingprojects through bonds, including the cost reductions that result from beginning constructionmore quickly and the ability to use future revenues to deliver improvements to the currentsystem. Three possible methods of applying this funding approach are also discussed: bondagainst IWFT revenue, raise the Inland Waterway Fuel Tax by 4 cents and bond against entirenew revenue streams, raise the Inland Waterway Fuel Tax by 4 cents and bond only against theincrease. Estimates suggest that the three bonding approaches could generate $1.3 billion(plan 1), $1.6 billion (plan 2), or $275 million (plan 3) in financing proceeds in their first year.Additional case studies in the report using non domestic examples reveal that alternativefinancing mechanisms are often available and can provide necessary funding to assist inmeeting more expedited project timelines.
The Inland Marine Transportation Systems (IMTS) Capital Projects Business Model (2010)argues for an annual funding level of $380 million (half of which is to come from the IWTF, andthe other half from the federal government). This would require 50 cents per gallon increase inthe fuel tax. IMTS recognizes a dramatic increase over the current 20 cents is unrealistic.However, the disparity reveals the pressing nature of needs facing the system and the inabilityof the current funding regime fulfill them. Given that such an increase is currently unfeasible,the report settles on a recommended increase in the fuel tax to at least 26 cents per gallon.The report also includes a table with different cost sharing options to consider as part of a moresweeping business model, with certain exemptions for high dollar projects such as Olmsted andLower Mon. Those options are shown in Table 3.
7 The authors also conducted a stakeholder survey for various positions related to the inland waterways. Theresults can be found in Appendix A.8 The lack of project funding for completion is listed as a budgeting deficiency by the National Academy of Public Administration(2007).

19
Table 3: Cost Sharing Options Considered as Part of IMTS Capital Projects Business ModelReport
Baseline Option – 50% Federal and 50% IWTF50/50 for New Construction, 100% Federal for Major Rehabilitation50/50 for New Construction and Major Rehabilitation above $50M, 100% Federal for Major Rehabilitationbelow $50M50/50 for Locks, 100% Federal for Dams50/50 for New Construction, and 75/25 for Major Rehabilitation60% Federal, 40% IWTF65% Federal, 35% IWTF75% Federal, 25% IWTF50% Federal, 50% IWTF on all projects except Lower Mon and Olmsted50% Federal, 50% IWTF for New Construction and Major Rehabilitation above $50M (Locks); 75% Federal,25% IWTF for New Construction and Major Rehabilitation above $50M (Dams); 100% Federal for MajorRehabilitation below $50M50% Federal, 50% IWTF for Lock New Construction and Major Rehabilitation above $100M; 100% Federalfor Dams and Lock Major Rehabilitation below $100M (with cap on Lower Mon)50% Federal, 50% IWTF for Lock New Construction and Major Rehabilitation above $50M; 100% Federalfor Dams and Lock Major Rehabilitation below $50M50% Federal, 50% IWTF for Locks; 75/25 for Dams50% Federal, 50% IWTF for Locks; 75/25 for Dams; 100% Federal for remaining Lower Mon50% Federal ,50% IWTF for Locks; 80/20 for Dams
Source: IMTS Capital Projects Business Model Report (2010), p.69
The report suggests funding new lock constructions through a 50/50 cost share agreementbetween the IWTF and federal government, where any major rehabilitation over $100 millionare funded at the same rate. For dam construction / rehabilitations, and lock rehabilitationscosting under $100 million, the report endorses a 100 percent federal funding from generalappropriations. Other proposals include establishing cost share caps to cope with potentialcost increases and overruns. While raising additional revenues for the IWTF is the focus ofmany proposals, the allocation and cost sharing issues dealing with current funding has comeunder scrutiny, as noted in the IMTS Capital Business Projects Model Report (2010). Faced withlimited funds, the choice to allocate money can impact trends in system usage by altering itscondition and efficiency. Grier (2002) critiques using ton miles to make budget decisionsbecause it is a measure that does not provide tributaries with enough credit for freightshipments. Without such tributaries, many trips would not be possible. Thus Grier proposesthat funding allocations by waterways use system ton miles.9 Additional considerations mayalso center on shipper savings derived from waterways, including those with lower usage rates.
9 “System ton miles are computed by identifying every commercial cargo carrying vessel that has plied the inland waterway andsumming the products of the tons times the total trip miles for each vessel trip. The total trip miles represent the total distancefrom origin to destination” (p. 14).
20
Although the lack of funding has been highlighted as an obstacle to maintaining the inlandwaterway system in a functional state, the way in which current projects are undertaken mayalso impact funding levels. Kruse, Ellis, Protopapas, and Norboge (2013) developed a newapproach to construction and maintenance on the inland waterway system that operates as analternative to the current “build and expand” approach. The authors proposed a new strategycoined as “repair and sustain”, which includes some elements of past strategies.10 This newapproach privileges maintenance designed to avoid critical failures, allows for majorconstruction projects only when performance levels dips—permanently—below acceptedthresholds, and staging necessary equipment to hasten repairs when they are needed.However, implementing this option seems unlikely given the current lack of funding.
The proposals reviewed here offer plans with different funding methods in an attempt toincrease inland waterway expenditures and therefore preserve the system in a good state ofrepair. However, the level of desired expenditures and investment in the system has not beenaddressed. Is it acceptable to maintain the status quo? If not, what metrics should be used toidentify a target level of performance? Also, what level of investment is required to meet andsustain the targets identified? These questions must be parsed within context with of thesystem’s present state, and the residual impact of past funding levels on the system.
IV. Current State of the System
The rapid IWTF decline underscores the funding issues confronting the inland waterway system,while also raising questions about the current system’s infrastructure resiliency. The USACE11
runs 239 lock chambers at 193 sites along the waterway system (U.S. Army Corps of Engineers,2012). The average age of these active locks is over fifty years, which calls into question theirreliability. Aging infrastructure also requires additional investment to remain operational, yetproject authorization currently exceeds available funds (Carter & Stern, 2010). Many olderlocks lack the size and capacity needed for today’s barge tows. Older facilities typically have600 foot chambers, half the size of today’s 1,200 feet standard. Due to spatial constraints,many barge tows are separated and moved through these older locks piecemeal, and thenreassembled on the other side.
This adds to transit times, increasing costs12 and making inland waterways a less cost effectivemode for freight transport. The Inland Waterways Users Board Annual Report (2012) describedtheir concerns by stating: “The Board is increasingly concerned about the worsening conditionof critically important locks and dams on our nation’s waterways and about the growinginability of our current inland waterways modernization program to adequately address this
10 The past strategies noted by the authors are: fix when it fails, advance maintenance, and rehabilitation.11 For more on the fiscal challenges facing the USACE as a whole including appropriations, project backlogs, authorizations anddirection, and trust funds, see Carter and Stern (2010).12 See Kruse, Ellis, Protopapas, and Norboge, 2013 Tables 18, 19, and 20 for calculations on the additional costs of double cuts.

21
situation” (p.3). According to Carter and Stern (2010), the construction backlog facing theUSACE would cost in excess of $62 billion to eliminate.
The 2013 Report Card for America’s Infrastructure by the American Society of Civil Engineersdescribed the dire condition of the inland waterway system and assigned a grade of D 13
because:
“Barges are stopped for hours each day with unscheduled delays, preventing goods from gettingto market and driving up costs. There is an average of 52 service interruptions a day throughoutthe system. Projects to repair and replace aging locks and dredge channels take decades toapprove and complete, exacerbating the problem further.” (p. 6)
Unscheduled delays impose higher costs on shippers because they are unable to plan aroundthem appropriately. When barge tows are forced to separate to move through a lock,congestion and delays emerge. It also increases lockage times, particularly at high traffic locksor during periods of heavy traffic. Preventative maintenance designed to sustain locks andprevent breakdowns is not adequately funded, leading to a reactionary mentality when locks dofail (Grier, 2009). When outages on the system occur, disruptions to barge traffic can havesignificant economic repercussions. Grier (2009) observed that:
“An aging inland waterway infrastructure is not necessarily a concern as long as timelyinvestments are made in maintenance and major rehabilitations, with some capacity andmodernization improvements where needed.” (p. 3)
Based on the status quo, many projects will remain incomplete for decades, some as far out as2090 (Colbert, 2013), which aggravates the current situation–where important projects gounfunded (Hammond, 2013). The delays caused by limited funds perpetuate congestion issuesand a decrease the long term benefit of using the system while increasing construction costs.The mounting backlog of projects represents a trend that, if not addressed, will have significantramifications for the inland waterway system in the years ahead as the effects of deferredconstruction and maintenance multiply and compound.
Examining trends in lock unavailability14 illustrates the effects of limited funding on the inlandwaterway system. Grier (2002) gathered data on lock outages in the 1990s and found thataggregate outage duration has doubled in just a decade. Shipping itineraries can be modified ifcarriers know in advance about an outage, but those that are unscheduled can result inexpensive modal shifts and delayed shipments. The American Society of Civil Engineers 2013Report Card emphasizes unscheduled delays and some of the main drivers of these delays arecited:
13 A grade of D is defined as: poor, where the infrastructure “is in poor to fair condition and mostly below standards, with manyelements approaching the end of their service life.”14 Defined by Grier (2009) as time over a year in which the lock could not accommodate traffic due to a variety of reasons whichmay include weather, water levels, lock problems, etc.

22
“Unscheduled delay is most often the result of high volumes at transit points, as well asoccasional failures in equipment, resulting in increased operating costs.” (p.39)
In 2011, total lock outages accounted for 9 percent of operational time, of which 3 percentwere unscheduled outages (U.S. Army Corps of Engineers, 2012). This may represent a smallpercentage of total operational time, but the impact of an unscheduled outage at a high trafficlock for a long period of time can decrease system efficiency. Over a long period of time, thisscenario will grow more problematic. Additionally, 90 percent of locks and dams experiencedat least one unscheduled delay in 2009. Figure 5 shows the average delay vessels encounteredat locks. The trend until 2009 appeared to be steady, if not slightly declining, but the mostrecent years reveal steep increase in average delays.
Figure 5: Average Delay at Locks on Inland Waterway System (in hours)
Source: USACE Lock Performance Monitoring System
Figures 6 and 7 illustrate scheduled and unscheduled outages by number and duration for theUS inland waterway system. Due to scheduled outages generally being more manageable,much of the attention is directed toward unscheduled outages that can disrupt shipping andcreate myriad issues for waterway users. The number and time of unscheduled outages hasvaried, but the general trend line is one of increasing unavailability.
0
0.5
1
1.5
2
2.5
1993 1995 1997 1999 2001 2003 2005 2007 2009 2011
AverageDelay(Tows)(Hrs)

23
Figure 6: Number of Scheduled and Unscheduled Unavailability on Inland Waterway System
Source: USACE Lock Performance Monitoring System
Figure 7: Scheduled and Unscheduled Unavailability on Inland Waterway System (in hours)
Source: USACE Lock Performance Monitoring System
0
5,000
10,000
15,000
20,000
25,00019
9219
9319
9419
9519
9619
9719
9819
9920
0020
0120
0220
0320
0420
0620
0720
0820
0920
1020
11
UnscheduledUnavailabilities
ScheduledUnavailabilities
0
20,000
40,000
60,000
80,000
100,000
120,000
140,000
160,000
180,000
200,000
1992
1993
1994
1995
1996
1997
1998
1999
2000
2001
2002
2003
2004
2006
2007
2008
2009
2010
2011
UnscheduledUnavailable Time
ScheduledUnavailable Time

24
Along the Ohio River from 2002 to 2011, unscheduled outages—measured in hours— increasednearly 98 percent, while the number of total unscheduled outages increased 145 percent.15
Grier (2009) provides a possible explanation of increased outage times:
“Scheduled maintenance and repairs are occurring more often, at more locations, and aretaking longer to complete; and unscheduled closures due to failures of a lock component, orsome other incident, are occurring more often, at more locations, and are likewise taking longerto fix.” (p. 4)
Longer and/or more frequent lock outages (especially unscheduled ones) can significantlyimpact system reliability. In turn, shippers may decrease their usage of the system by shiftingfreight to other more reliable modes.
V. Conclusion
The evidence compiled in this synthesis indicates several alarming trends, but also ampleopportunities for reform. Problems with the sufficiency of current funding levels have erodedsystem condition and led to declining reliability. Some proposals argue for making changes tothe USACE’s budget process and the way projects are prioritized, which should merit attention.However, the most pressing issue appears to be securing a reliable and sufficient fundingstream for the inland waterways system. Coordinated investments will be necessary in thecoming years to maintain system performance through individual locks and dams that functioninterdependently as part of the larger system.
Waterways currently enjoy 100 percent federal funding for operations and maintenance, alongwith cost sharing on capital construction and major rehabilitation projects. The fundingarrangements are ostensibly beneficial, yet uncertainty over the federal budget and concernsover deficit spending may negatively impact this less visible transportation mode. Aging locksand dams will need increased maintenance if system reliability is to be maintained at currentlevels, and other financial sources may have to be tapped to provide the required funding.Increases in lock outages disrupting freight shipments have economic impacts and can reducethe use of a mode that already has unused capacity and could accommodate increased traffic.
The IWTF serves as the key funding mechanism for capital construction and major rehabilitationprojects. However, its balances have fallen close to zero in recent years and annual receiptscannot meet existing project needs. Because the fuel tax that has gone unadjusted since 1995,nominal revenues have remained stagnant while inflation has decreased purchasing power realdollars. As such, unfunded projects continue to grow in number, which increases competitionfor funding and a produces a significant project backlog. As needs go unmet, costs rises andinfrastructure deterioration goes on unimpeded.
15 Data gathered from the U.S. Army Corps of Engineers Lock Performance Monitoring System (LPMS), available at: http://corpslocks.usace.army.mil/lpwb/f?p=121:1:1267106300118359.

25
However, there have been proposals to increase funding levels and secure a reliable stream offuture revenues that will be sufficient to meet potential increases in demand. These should becarefully considered by policymakers to ensure that the inland waterways system remains aresilient mode of transportation able to keep pace with the nation’s growing economy.

26
References
American Society of Civil Engineers. 2013. Failure to Act: The Economic Impact of CurrentInvestment Trends in Airports, Inland Waterways, and Marines Ports Infrastructure.http://www.asce.org/uploadedFiles/Infrastructure/Failure_to_Act/ASCE%20Failure%20to%20Act%20Ports%20Report%20FINAL.pdf.
American Society of Civil Engineers. 2013. Report Card for America’s Infrastructure.http://www.infrastructurereportcard.org/a/documents/2013 Report Card.pdf.
Bray, Larry, Michael Murphree, and Chrisman Dager. 2011. “Toward a Full Accounting of theBeneficiaries of Navigable Waterways.”http://www.lrd.usace.army.mil/Portals/73/docs/Navigation/PCXIN/Beneficiaries%20of%20Navigable%20Waterways%20January%202011.pdf.
Case, Leland, and Lester Lave. 1977. “Tolls: Efficiency and Equity Issues for Inland Waterways.”Management Science, 23(8): 811 819.
Colbert, Debra. 2013. “Implementing the Capital Development Plan in the WRDA.” Presentationat 2013 Barge and Rail Symposium, Louisville, KY.
Congressional Budget Office. 1992. Paying for Highways, Airways, and Waterways: How CanUsers Be Charged?
Government Accountability Office. 2010. “Army Corps of Engineers Budget Formulation ProcessEmphasizes Agencywide Priorities but Transparency of Budget Presentation Could BeImproved.” Report to Subcommittee on Energy and Water Development, Committee onAppropriations, House of Representatives.
Grier, David. 2002. “Measuring the Service Levels of Inland Waterways: Alternative Approachesfor Budget Decision Making.” TR News 221, July August.
Grier, David. 2009. “The Declining Reliability of the U.S. Inland Waterway System.” Institute forWater Resources, U.S. Army Corps of Engineers.
Hammond, Mark. 2013. “Envisioning and Implementing Viable Initiatives for the Inland MarineTransportation System.” Presentation at 2013 Barge and Rail Symposium, Louisville, KY.
Inland Marine Transportation Systems. 2010. Capital Projects Business Model. IMTS CapitalInvestment Strategy Team.

27
http://www.iwr.usace.army.mil/Portals/70/docs/Wood_doc/IMTS_Final_Report_13_April_2010_Rev_1.pdf.
Kruse, C. James, David Ellis, Annie Protopapas, Nick Norboge. 2012. “New Approaches for U.S.Lock and DamMaintenance and Funding.” Center for Ports and Waterways, TexasTransportation Institute. Prepared for United Soybean Board.
National Academy of Public Administration. 2007. Prioritizing America’s Water ResourcesInvestments. Prepared for The U.S. Congress and the U.S. Army Corps of Engineers.
Inland Waterways Users Board. 2012. 25th Annual Report. Available at:http://www.iwr.usace.army.mil/Portals/70/docs/IWUB/annual/IWUB_Annual_Report_2012.pdf.
Pointon, Mark. 2013. “Envisioning and Implementing Viable Initiatives for the Inland MarineTransportation System: Inland Waterways Trust Fund.” Presentation at 2013 Barge and RailSymposium, Louisville, KY.
Stern, Charles. 2013. “Inland Waterways: Recent Proposals and Issues for Congress.”Congressional Research Service Report R41430.
U.S. Army Corps of Engineers. 2012. The U.S. Waterway System: Transportation Facts andInformation. Navigation and Civil Works Decision Support Center. Available at:http://www.navigationdatacenter.us/factcard/factcard12.pdf.
U.S. Army Corps of Engineers. 2008. Final Re evaluation of the Recommended Plan: UMR IWWSystem Navigation Study. Interim Report.http://www2.mvr.usace.army.mil/UMRS/NESP/Documents/NESP%20Economic%20Revaluation%20Interim%20Report%20 %20Final%2020080324.pdf.
Wang, Shiaa Lir, and Paul Schonfled. 2005. “Scheduling Interdependent Waterway Projectsthrough Simulation and Genetic Optimization.” Journal of Waterway, Port, Coastal, and OceanEngineering, 131(3): 89 97.