THE BEHAVIOUR OF RADIUM IN WATERWAYS AND ...
249
IAEA-TECDOC-301 THE BEHAVIOUR OF RADIUM IN WATERWAYS AND AQUIFERS FINAL REPORT OF THE CO-ORDINATED RESEARCH PROGRAMME ON SOURCE, DISTRIBUTION, MOVEMENT AND DEPOSITION OF RADIUM IN INLAND WATERWAYS AND AQUIFERS SPONSORED BY THE INTERNATIONAL ATOMIC ENERGY AGENCY FROM 1976 TO 1980 A TECHNICAL DOCUMENT ISSUED BY THE INTERNATIONAL ATOMIC ENERGY AGENCY. VIENNA, 1984
-
Upload
khangminh22 -
Category
Documents
-
view
1 -
download
0
Transcript of THE BEHAVIOUR OF RADIUM IN WATERWAYS AND ...

IAEA-TECDOC-301
THE BEHAVIOUR OF RADIUMIN WATERWAYS AND AQUIFERS
FINAL REPORT OF THECO-ORDINATED RESEARCH PROGRAMME ON
SOURCE, DISTRIBUTION, MOVEMENT AND DEPOSITION OF RADIUMIN INLAND WATERWAYS AND AQUIFERS
SPONSORED BY THEINTERNATIONAL ATOMIC ENERGY AGENCY
FROM 1976 TO 1980
A TECHNICAL DOCUMENT ISSUED BY THEINTERNATIONAL ATOMIC ENERGY AGENCY. VIENNA, 1984

THE BEHAVIOUR OF RADIUM IN WATERWAYS AND AQUIFERSIAEA, VIENNA, 1984IAEA-TECDOC-301
Printed by the IAEA in AustriaJanuary 1984

PLEASE BE AWARE THATALL OF THE MISSING PAGES IN THIS DOCUMENT
WERE ORIGINALLY BLANK

The IAEA does not maintain stocks of reports in this series. However,microfiche copies of these reports can be obtained from
INIS ClearinghouseInternational Atomic Energy AgencyWagramerstrasse 5P.O. Box 100A-1400 Vienna, Austria
Orders should be accompanied by prepayment of Austrian Schillings 60.00in the form of a cheque or in the form of IAEA microfiche service couponswhich may be ordered separately from the INIS Clearinghouse.

FOREWORD
In 1975, radium was known to be a significant contaminant in theliquid and solid wastes from uranium mining and milling and so the IAEAbegan a coordinated research programme on "The source, distribution,movement and deposition of radium in inland waterways and aquifers".
The primary aim of this coordinated research programme was toproduce a report on radium behaviour in the aquatic environment from thepoint of view of health protection. It was no easy matter to draft thisreport as each principal author of a chapter was required to submit anintegrated report on the work produced by the other laboratoriesparticipating in the programme and to place all of this in the context ofthe work published in the literature.
All the authors set about doing this on the basis of the dataavailable to them at the time, and the chapters thus forced together canin general, albeit with varying degrees of success, be considered tocover the most important aspects of the subject.
Technical and administrative aspects are dealt with in the relevantchapter, so at this point we shall only mention that the ScientificSecretaries were, successively: P.A. Bonhote (1975-1976), L. Farges(1976-1979) and R. Kirchmann (1980).
It is hoped that the data produced by the various laboratoriesparticipating in the programme will be of great value to thoseauthorities responsible for assessing the consquences of radium releasesto inland waters and to those responsible for setting discharge limits.
René KIRCHMANN1982-10-01

TABLE OF CONTENTS
PREFACE.......................................................................................................................... 9
HISTORY........................................................................................................................... 12
INTRODUCTION............................................................................................................... 13
1. RADIUM: A HISTORICAL INTRODUCTION AND OVERVIEW............................ 151.1. The discovery of radium ..................................................................................... 171.2. Using the properties of radium ........................................................................... 171.3. Awaking to the consciousness of dangers ........................................................ 18
1.3.1. Realizing health hazards of radium ......................................................... 181.3.2. Considering environmental effects of radium .......................................... 19
References.......................................................................................................................... 20
2. ANALYTICAL METHODS (I. Kobal, A.R. Williams) ................................................ 232.1. Methods for measuring 226Ra .............................................................................. 25
2.1.1. Direct measurement of radium activity................................................... 252.1.2. Spectrometry of radium decay products .................................................. 252.1.3. Gross counting methods ......................................................................... 26
2.2. Methods for preparing and analysing samples...................................................... 302.2.1. Waters..................................................................................................... 302.2.2. Soil, sediment, ore, tailings ..................................................................... 332.2.3. Food ...................................................................................................... 342.2.4. Animal materials..................................................................................... 35
2.3. Interpretation of results ..................................................................................... 362.3.1. Components of the random precision error ............................................ 362.3.2. Inter-laboratory comparison ................................................................... 38
2.4. Conclusions and recommendations ..................................................................... 39References.......................................................................................................................... 44
3. DISTRIBUTION IN NATURE (M.A.R. lyengar)........................................................ 573.1. Introduction ....................................................................................................... 593.2. Groundwaters ..................................................................................................... 60
3.2.1. 226Ra distribution in selected geographic regions .................................... 603.2.2. Discussion............................................................................................... 61
3.3. Surface waters .................................................................................................... 623.3.1. Baseline 226Ra levels in surface waters in mining areas ............................ 623.3.2. Discussion .............................................................................................. 63
3.4. Stream sediments ................................................................................................ 643.4.1. 226Ra distribution and movement behaviour in stream sediments ........... 643.4.2. Discussion .............................................................................................. 65
3.5. Biota................................................................................................................... 653.5.1. Rshes ..................................................................................................... 653.5.2. Algae and plankton................................................................................. 673.5.3. Aquatic macrophytes.............................................................................. 683.5.4. Mollusca.................................................................................................. 69
3.6. Conclusions......................................................................................................... 70References.......................................................................................................................... 85

4. TECHNOLOGICAL ENHANCEMENT (A.S.M. de Jesus) .......................................... 874.1. Introduction ....................................................................................................... 894.2. Source term ........................................................................................................ 90
4.2.1. Uranium ................................................................................................ 904.2.2. Phosphates.............................................................................................. 904.2.3. Coal........................................................................................................ 914.2.4. Others..................................................................................................... 91
4.3. Uranium mining and milling................................................................................ 914.3.1. Economic aspects ................................................................................... 914.3.2. Acid vs. alkaline leaching ........................................................................ 924.3.3. Underground vs. open-pit mining ............................................................ 924.3.4. Climatological considerations.................................................................. 924.3.5. Site-specific aspects ................................................................................ 934.3.6. Tailings and effluents.............................................................................. 93
4.4. Ra-226 distribution in the aqueous environment................................................ 934.4.1. Ground water .......................................................................................... 944.4.2. Surface water.......................................................................................... 984.4.3. Stream sediment..................................................................................... 1024.4.4. Biota....................................................................................................... 1054.4.5. Models.................................................................................................... 107
4.5. Recommendations .............................................................................................. 107References.......................................................................................................................... 114
5. MIGRATION OF RADIUM IN TERRESTRIAL HYDROSPHERE (P. Benes) ........... 1175.1. Introduction........................................................................................................ 1195.2. Release of radium from its sources...................................................................... 119
5.2.1. Release of radium with radioactive water ............................................... 1205.2.2. Release of radium from solids produced by man..................................... 1245.2.3. Leaching of radium in groundwaters ...................................................... 129
5.3. Migration of radium in groundwaters .................................................................. 1325.3.1. Information gained on the infiltration process........................................ 1325.3.2. Information on migration of radium in aquifers ..................................... 1345.3.3. Physico-chemical form of radium in groundwaters.................................. 135
5.4. Migration of radium in surface waters................................................................. 1365.4.1. Migration in waste water channel............................................................ 1365.4.2. Mixing with receiving natural waters ; the deviations from the
mixing law and the role of solid-liquid interactions ................................ 1375.4.3. Migration in natural streams.................................................................... 1395.4.4. Migration in water reservoirs................................................................... 1435.4.5. Migration in estuaries.............................................................................. 1445.4.6. Migration in bottom sediments................................................................ 144
5.5. Distribution of radium between water and freshwater sediments........................ 1455.5.1. Different approaches for studying interaction of radium with freshwater
sediments................................................................................................ 1455.5.2. Studies concerned with uptake of radium by sediments.......................... 1465.5.3. Studies concerned with release of radium from sediments ...................... 148
5.6. Conclusions and recommendations ..................................................................... 151References.......................................................................................................................... 168

6. BIOLOGICALUPTAKE AND TRANSPORT(A.R. Williams) .................................... 1756.1. Introduction........................................................................................................ 1776.2. The mechanism of radium uptake....................................................................... 1776.3. Concentration factors ......................................................................................... 178
6.3.1. Algae....................................................................................................... 1796.3.2. Aquatic vascular plants ........................................................................... 1806.3.3. Insects..................................................................................................... 1806.3.4. Fish ........................................................................................................ 1816.3.5. Mussels.................................................................................................... 181
6.4. Variation in concentration factors ...................................................................... 1826.5. Time behaviour of radium uptake....................................................................... 182
6.5.1. Models for radium uptake....................................................................... 1826.5.2. Equilibrium times and food-chain transfer.............................................. 184
6.6. Major ion effects................................................................................................. 1856.7. Biological transport ............................................................................................ 187
6.7.1. Animal migration .................................................................................... 1876.7.2. Macrophyte-sediment interactions .......................................................... 188
6.8. Summary and recommendations......................................................................... 188Acknowledgements............................................................................................................. 189References.......................................................................................................................... 197
7. DOSE ASSESSMENT64.S. Paschoa) ......................................................................... 2037.1. Basic concepts .................................................................................................... 205
7.1.1. Absorbed dose and dose equivalent ........................................................ 2057.1.2. Dosimetric and dose assessment models.................................................. 2067.1.3. Dose assessment based upon ICRP Publication 26 .................................. 2077.1.4. The concept of collective dose equivalent............................................... 2077.1.5. Earlier ICRP concepts............................................................................. 208
7.2. Applications of collective dosimetry to uranium mining and milling................... 2107.2.1. Risk assessment and cost-benefit analysis................................................ 212
7.3. National standards .............................................................................................. 2177.3.1. General objectives................................................................................... 2177.3.2. Comparison of national standards .......................................................... 219
7.4. Summary and conclusions................................................................................... 219References.......................................................................................................................... 229
8. POLLUTION ABATEMENT f/.S. Silhanek, Y. Kurokawa) ........................................ 2378.1. Introduction ....................................................................................................... 2398.2. Radium in the aqueous environment and its removal.......................................... 239
8.2.1. Levels of radium-226 groundwater sources in USA ................................ 2398.2.2. Radium removal in public water supply systems..................................... 2398.2.3. Impact on groundwaters from uranium mills .......................................... 240
8.3. Radium pollution abatement on liquid effluents from uranium mines................ 2418.3.1. Information on French experience.......................................................... 2418.3.2. Information on Japanese experience....................................................... 241
References.......................................................................................................................... 243

9. ADMINISTRATIVE AND TECHNICAL ANNEXES.................................................. 2459.1. Purpose and scientific scope of the programme................................................... 2479.2. Programmes of participating laboratories............................................................ 247
9.2.1. Australia................................................................................................. 2479.2.2. Brazil...................................................................................................... 2489.2.3. Czechoslovakia ...................................................................................... 2489.2.4. France .................................................................................................... 2489.2.5. India....................................................................................................... 2499.2.6. Japan...................................................................................................... 2509.2.7. South Africa ........................................................................................... 2509.2.8. United States of America........................................................................ 2509.2.9. Yugoslavia .............................................................................................. 251
9.3. Organization of the programme .......................................................................... 2519.4. Progress of the programme ................................................................................. 251
9.4.1. First research co-ordination meeting....................................................... 2519.4.2. Second research co-ordination meeting................................................... 2529.4.3. Third research co-ordination meeting ..................................................... 2529.4.4. Fourth research co-ordination meeting ................................................... 253
9.5. Recommendations .............................................................................................. 253History of research contracts and agreements ..................................................................... 255Participants in research co-ordination meetings................................................................... 257

PREFACE
At the first coordination meeting of this Coordinated ResearchProgramme, "The Source, Distribution, Movement and Deposition of Radiumin Inland Waterways and Aquifers" (CRP Radium 1), the participants agreedthat a joint report should be published at the end of the programme -indeed, a preliminary outline of the contents of the final report wasdrawn up. It was for this reason that the participants decided at thefourth and last coordinating meeting to produce the present document•
The following procedure was adopted at that meeting: two editors -the Scientific Secretary at the time (R. Kirchmann) and the Chairman ofthe last meeting (A. Williams) - were to be responsible for puttingtogether the different contributions from certain participants who wouldact as principal authors»
The two editors circulated a letter to the authors in which theymade recommendations regarding the essential points to be dealt with inthe chapters submitted, and provided references and reports on thesubject Which they had available at the time.
The first draft comprising eight scientific chapters was thusprepared and discussed at a meeting of the group held during theKnoxville symposium in July 1981. In the light of the contributions andin order to avoid repetition, the two editors felt at that time that anattempt should be made to recast the report.
The second, remodelled draft aimed at being a type of monograph onthe subject. Unfortunately, this attempt was not supported unanimouslyby the participants, who did not wish to accept the arrangement proposedby the editors. In addition, there proved to be fundamental shortcomingswhich it has not yet been possible to remedy.
It is for these reasons that, in conjunction with the authors, theAgency's Secretariat, represented by Mr. J. Molinari, in charge of theAgency's radium programme, took the following decisions:
(a) Each chapter foreseen in the first draft would be publishedunder the sole responsibility of its principal author, whocould at any time call on the assistance of a. colleague who hadparticipated in the programme if he felt it necessary;
(b) In view of the number and extent of the shortcomings and of thediversity of the information gathered, the document should bepublished in the form of a TECDOC, instead of a TechnicalReport as initially planned;
(c) The present document constitutes a. framework of a kind for afuture report to be written at the end of the new coordinatedresearch programme (CRP), entitled "Environmental migration ofradium and other contaminants present in liquid and solidwastes from the mining and milling of uranium" (CRP Radium II),whose first meeting was held in Ottawa, 17-21 May 1981.

At the first coordinating meeting of the CRP (Coordinated ResearchProgramme) the participants agreed that a joint report should bepublished at the end of the programme - indeed, a preliminary outline ofthe contents of the final report was drawn up* It was for this reasonthat the participants decided at the fourth and last coordinating meetingto produce the present document.
The following procedure was adopted at that meeting: twoeditors -the Scientific Secretary at the time (R. Kirchmann) and theChairman of the last meeting (A. Williams) - were to be responsible forputting together the different contributions from certain participantswho would act as principal authors.
The two editors circulated a letter to the authors in which theymade recommendations regarding the essential points to be dealt with inthe chapters submitted, and provided references and reports on thesubject which they had available at the time.
The first draft comprising eight scientific chapters was thusprepared and discussed at a meeting of the group held during theKnoxville symposium in July 1981. In the light of the contributions andin order to avoid repetition, the two editors felt at that time that anattempt should be made to recast the report.
The second, remodelled draft aimed at being a type of monograph onthe subject. Unfortunately, this attempt was not supported unanimouslyby the participants, who did not wish to accept the arrangement proposedby the editors. In addition, there proved to be fundamental shortcomingswhich it has not yet been possible to remedy.
It is for these reasons^ that the Agency's Secretariat^ took thefollowing decisions:
(a) Each chapter foreseen in the first draft would be publishedunder the sole responsibility of its principal author, whocould at any time call on the assistance of a colleague who hadparticipated in the programme if he felt necessary;
(b) In view of the number and extent of the shortcomings and of thediversity of the information gathered, thedocument should bepublished in the form of a TECDOC, instead of a TechnicalReport as initially planned;
(c) The present document constitutes a framework of a kind for afuture report to be written at the end of the new coordinatedresearch programme (CRP), entitled "Environmental migration ofradium and other contaminants present in liquid and solidwastes from the mining and milling of uranium" (CRP Radium II),whose first meeting was held in Ottawa, 17-21 May 1981.
1 In conjunction with the authors.2 Represented by J. Molinari, successor in charge of the
Agency's radium programme.
10

It is with this in mind that each chapter of this document ispreceded by an editor's note intended to bring out both the chapter'sgood points and shortcomings as well as to make a number of usefulsuggestions concerning the future report, which is to be the highlight ofthis coordinated programme - a programme in which a number of prominentlaboratories have so actively participated for many years.
This report being considered by the Secretariat as well by theauthors as a working document, observations, comments and additional datawill be welcomed and should be addressed to:
International Atomic Energy AgencyWaste Management Section
Division of Nuclear Fuel CycleWagramerstrasse 5, Box 100
A-1400 Vienna, Austria
René KIRCHMANNProject Officer of the CRP
"Radium 1"(from 1980-01-01 to 1981-08-31)
Jacques MOLINARIProject Officer of the CRP
"Radium 2"(from 1981-09-01)
11

HISTORY
16-20 June 1980Fourth and last Research Coordination Meeting (RCM) of theCoordinated Research Programme (CRP) "Radium 1" (ScientificSecretary, R. KIRCHMANN)16 December 1980Circular letter from the Scientific Secretary (R. KIRCHMANN) toeach participant requesting each contributor of the finalreport to produce a specific chapter with cooperation of otherparticipants if needed, with the final version being co-editedby A. WILLIAMS and R. KIRCHMANN30 August 1981During the IAEC/CEC/OECD-NEA International Symposium onMigration in the Terrestrial Environment of the Long-livedRadionuclides from the Nuclear Fuel Cycle, Knoxvllle, a meetingof a group of CRP participants was realized [A. WILLIAMS(Australia), P. BENES (CSSR), N. FOURCADE (France), D. VAN AS(South Africa), M.L. MARPLE (U.S.A.), P- STEGNAR (Yugoslavia)]to exchange Information on the first draft, followed with areview by A. WILLIAMS and R. KIRCHMANN of this first draft inorder to produce a second draft to be circulated to allparticipants15 April 1982Second draft, result of the modifications made by theco-editors of the original chapters in an attempt to realize amonograph, sent for comments to authors, and for information toparticipants of the first RCM of the CRP "Radium 2"(J. MOLINARI, Technical Officer)17-21 May 1982At the first RCM of the CRP "Radium 2", was arranged a meetingof a group of participants from the CRP "Radium 1" [A. PASCHOA(Brazil), P. BENES (CSSR), N. FOURCADE (France), KUROKAWA(Japan), M.L. MARPLE (U.S.A.)] to exchange information on thesecond draft. (J. MOLINARI, Scientific Secretary)16 June 1982Circular letter to all participants of CRP "Radium I" and CRP"Radium II". Taking into account the comments received andconsidering the difficulties in integrating and harmonizing thevarious contributions, the Technical Officer, J. MOLINARIinforms authors and participants that decision was taken todiscontinue the edited monograph and to produce instead, as aTECDOC, the chapters prepared by the authors under their solere sponsibility29-30 September 1982Reconstitution by R. KIRCHMANN, as IAEA consultant, of thechapters in their previous format, and agreement with theScientific Secretary (J. MOLINARI) on the final shape of thereport6 May 1983Dispatch to each author of the retyped version of manuscriptsaccompanied by editorial comments (J. MOLINARI)8 September 1983Reception of the last author's correction.
12

INTRODUCTION
Radium is element 88 in group HA of the Periodic Table. It canexist in the form of 25 different isotopes, none of which are stable.Among the naturally occurring isotopes, Ra-226 ( a-emitter, half-lifeyears and Ra-228 ( ß-emitter, half-life 5.8 years) are the most abundant,being daughters of the naturally most abundant isotopes of uranium(U-238) and thorium (Th-232) respectively. From the health point of viewthe two are also the most radiotoxic; when they are ingested over a longperiod of time they deliver the highest radiation doses to bone, whereradium tends to be accumulated.
Because uranium is the basis of the present nuclear industry, Ra-226is the most important isotope for present concern, and this report dealsalmost exclusively with this isotope. The other naturally occurringisotopes are Ra-223 ( a-emitter, half-life 11.4 days) coming from Ü-235,and Ra-224 ( a- and ~ft -emitter, half-life 3.6 days) coming also fromTh-232.
Radium was first discovered in 1898 by Marie and Pierre Curie whoisolated it from the uranium ore, pitchblende (Curie et al. 1898). Itwas subsequently used extensively in medicine and in Industry as a sourceof radiation because it has a high specific activity. Thus, from itsdiscovery up until World War II, uranium ores were mined primarily fortheir radium content. Uranium has also been mined since Renaissancetimes, in association with silver, at Jachymov in Czechoslovakia, wherethe oxide was used as a glazing pigment. During World War II, uraniumdeveloped military and energy value and, since then, it has been minedextensively on every continent, with the associated radium usually beingdiscarded with the tailings.
Radium was first identified as a significant environmental pollutantfrom the uranium industry in the 1950's by Tsivoglou and others workingin the Colorado Plateau area of the U.S.A. (Tsivoglou et al. 1958). Inthe early I9601s, Havlik reported significant radium pollution fromuranium mining in Czechoslovakia (Havlik 1970 with references) andKirchmann et al. (1973 with references) reported radium pollution from aradium extraction plant and a phosphate mill in Belgium. Since thensignificant radium pollution has been identified in many other places,coming from uranium, phosphate and even gold mining and millingoperations, and from coal ash.
The early impetus for considering radium to be the most radio-toxicdaughter product of uranium and thus the most critical in managinguranium wastes, was the ingestion limits for radionuclides set by theInternational Commission on Radiological Protection (ICRP) in 1959 (ICRP1960). The maximum permissible concentration for Ra-226 was set 10 timeslower than that of any other long-lived uranium daughter, and 200 timeslower than the least restrictive one (Th-230). This very restrictivelimit was based on a simple exponential uptake and retention model whichindicated a long residence time for radium in human bone (44 yearsbiological half-life). However in reviewing the data on human retentionof the alkaline earth elements, Marshall et al. (ICRP 1973) developed a
13

more complex model in which the initial rate of loss from bone was muchmore rapid than previously thought, and the rate of loss decreased withtime. The subsequently revised ICRP ingestion limits (ICRP 1979-80) nowput all four of the long-lived uranium daughters (Th-230, Ra-226, Pb-210,Po-210) within a range of a factor of 5 of each other, with Ra-226 nowbeing the second restrictive nuclide following Pb-210.
This report on radium is the outcome of international concern forresponsible management of uranium mine and mill wastes. Its scopeappears somewhat narrow from the point of view of health protection;however the material covered here is at least necessary, if notsufficient, to this end. As the first monograph of its kind on theenvironmental behaviour of long-lived uranium daughters, it points theway to the further work that needs to be done.
Alex WILLIAMS
14

Chapter 1
RADIUM:A HISTORICAL INTRODUCTION
AND OVERVIEW

1.1. THE DISCOVERY OF RADIUM
The discovery of radium in 1898 was the result of an intensiveresearch program by Marie and Pierre Curie. During her systematicinvestigation of possible photographic emissions from many substances,Mme. Curie observed that the activity of the uranium ore pitchblende wasabout four times as great as the uranium it contained. She thought theore must contain some substance with a much higher activity. Working atthe Sorbonne in Paris, the Curies obtained two highly radioactiveelements (M. Curie, P. Curie & Bémont, 1898) - polonium and radium, by achemical separation based on relative activities of these elements. Themuch higher activity of radium allowed it to be traced throughout theprocess by its stronger ionizing effects.
In 1902 using approximately 5 tons of pitchblende residues from themines at Joachimsthal in Czechoslovakia, Mme. Curie separated radium fromthe barium it was associated with. Working in poor conditions, shelaboured long and hard, finally arriving at the first pure salt, radiumchloride, by a fractional crystallization method (M. Curie, 1902). Thistechnique was later modified to yield the bromide.
The commercial production process is similar to that used by theCuries, and for this purpose Pitchblende was later mined in rich depositsin the Congo and Canada while carnotite from Colorado was the US source.The name radium was originally used only for the most stable isotope(226) but now represents element 88 of the periodic table. Radium-226has a relatively long half-life of 1600 years. Its high activity isindicated by the luminosity observed by the Curies.
In 1899 they observed "induced" radioactivity in solid substancesplaced near radium (P. & M. Curie, 1900) that, later, Dorn explained interms of "radium emanation" (radon gas Rn). Radium itself was found tobe 2 million times as active as uranium, emitting a, ß and <f radiationwhen in equilibrium with Rn, its daughter element. In 1910 M. Curie andA. Debierne prepared the pure metal by electrolysis of the fused salt(M. Curie and Debierne, 1910). In 1911 she was awarded a Nobel Prize,her second, in chemistry.
The discovery of radium was largely responsible for the volume ofresearch into radioactivity that followed, with experiments on itsspectroscopic, physical and chemical properties e.g. hydrolysis of water(M. Curie, 1925). Other radioactive elements were found andinvestigations by Thomson, Soddy and Rutherford, among others, onemissions enhanced the understanding of matter.
1.2. USING THE PROPERTIES OF RADIUM
The recognition of radium as a source of therapeutic radiationdates from Becquerel. He noticed a burn on his skin adjacent to where hecarried a vial of radium in his vest pocket. Pierre Curie deliberatelyinduced a similar burn on his arm which was identified by a dermatologistas being analogous to X-ray burns. Thus a therapeutic use similar to
17

X-rays (in use for several years) seemed logical. The Curies supplieddermatologists in Paris with radium who used it to treat skin cancers.Using filters to emit only if radiation, Dominici buried large tubes ingrowths. Regaud by 1910 had developed the use of smaller amounts inneedles which were implanted interstitially. Later he used radium as asource in a "bomb" apparatus, for external administration. Other medicaluses included treatment of certain psychoses by implantation in thebrain, as a source of localised radiation. This practice was soonabandoned.
Another major early use was in luminescent paints for clock andmeter dials; by mixing with an inert scintillator e.g. ZnS and alacquer. This resulted later in many cases of occupational cancer fromingestion of paint or radon, due to the lack of safety precautions andthe method of applying the paint (Evans, 1933).
Later industry used radium in radiography for determination ofthickness of flaws in rolled or cast metal. This entailed enclosure ofradium in concentric spheres of Inert material e.g. Fe, Al, Ag or morerecently platinum/iridium alloy. Radium was also incorporated intomanufacture of static electricity eliminators and electronic valves. Inall the above cases, radium was used in the bromide or sulphate form.However now it is largely replaced by substitutes owing to the dangers weare now aware of. Radium combined with beryllium is used as a neutronsource in limited amounts for research, material analysis and oil-wellmapping.
1.3. AWAKING TO THE CONSCIENCOUSNESS OF DANGERS
1.3.1. Realizing Health Hazards of Radium
Although a slow and lethal poison when administered internally,correct procedures gave radium a prominence In radiology. However thedangers of exposure were realised only after some time (Evans, 1933,Laborde, 1911). Early workers, patients and even Marie Curie succumbedto the effects of the new substance. Although both she and her husbandhad their hands badly burnt and were in chronic ill-health, Mme. Curiewas apparently reluctant to admit the dangers of radium.
Observations upon the occupational health hazard of radium wereoriginally made with workers in the luminescent paint Industry. Many whoused their lips to form pointed ends on their brushes were later found tobe suffering from necrosis of the jaw or cancer of the mouth. This oftenproved fatal (Flinn, 1926; Martland, 1929). Radium dial painting was thefirst area to indicate the more acute dangers of radium ingestion. Thiswas the only large scale contact by workers at this time, so it is notsurprising to note a relative lack of warnings in the early literature.The radiological use of X-rays pointed to the dangers therein earlier, soprotection standards had been put forward. Studies on workers,volunteers, animals and plants revealed such severe consequences as gammaburns, cancers of skin and bone, pernicious anaemia, hemolysis, sterilityand others.
18

Quite early, laboratory safety was questioned (Eve, 1905) andstudies demonstrated the persistence of Ra in body tissue, especiallybone (Meyer, 1906; Pusey, 1911; Dominici and Faure-Beaulieu, 1910;Dominici, Petit and Jaboin, 1910 and 1911). Carcinogenesis involvingradium was then illustrated (Brancati, 1926; Daels and Bacten, 1926).
These hazards created considerable scientific interest in the fieldof medicine, and in control of paint activity (Schlundt, Barker andFlinn, 1929). Following on from earlier X-ray safety proposals, theBritish X-ray and Radium Protection Committee was established in 1921.This disparity was largely due to cancer surgeons using radium while moreexperienced radiologists used X-rays. By the end of the decade similarAmerican and international bodies were set up. These bodies advised ontolerance or maximum permissible doses (MPD) per day or year, ofradiation. Clinical procedures were put forward to ensure safety forboth patient and worker. However, these doses have been progressivelylowered as detection equipment became more sensitive to damage over longand short terms. For example:
Year
192619281928193219341936194919501957
Body
SolomonBarclay & CoxBXR Comm.Fa iliaICRPNCRPNCRPICRPNCRP
MPD (rem/day)
2.00.040.20.10.20.10.050.05 (.3 rem/week)0.0014 (1.4xlO~3)
(Modified after Braestrup & Wyckoff, 1958)MPD : Maximum permis sable doseBXR Co mm. : British X-ray and Radium Protection CommissionICRP : International Commission on Radiological ProtectionNCRP : National Council on Radiation Protection
1.3.2. Considering Environmental Effects of Radium
The effect of radioactive elements within the environment wasnot considered until after the second world war. With the realisation ofthe scale of "fallout" from nuclear weapons testing, researchers began totrace the fate of " Sr and "lj in food chains. However, in aquaticstudies, radium was considered to be merely a naturally occurringradionuclide, with little impact (Rona and Urry, 1962).
In the fifties however, E.C. Tsivoglou worked on the problem ofwater pollution from uranium milling wastes (Tsivoglou et al. 1956, 1958)and in particular on the Animas River in New Mexico (Tsivoglou et al.
19
1959, 1960). In these studies Ra was identified as a major waste,occurring in tailings piles dumped around the site, which led todangerous levels in the river water. Radium has a prominence inenvironmental studies of proposed U-mining sites, and its pathway throughthe biosphere has been studied (Havlik et al 1968 and 1973). As aresult, measures for stabilizing tailings piles and control of leakage torivers were put forward (U.S. Dept. of HEW, 1962).
REFERENCES
BECQUEREL H. & CURIE P., Compt. Rend. 132 p. 1287 (1901).
BETT T.H., "On a fatal pulmonary fibrosis from Industrial RadiumInjury" Frankfurt Z. Path., 42, 170-87 (1931).
BRAESTRUP C.B. & WYCKOFF H.O., in "Radiation Protection" Charles C.Thomas, Springfield (1958).
BRANCATI R., "Experimental Production of Rare Tumours by Stimulation(tar and radium)" Bull. Atti Accad. Med. Roma, (2) , 52, 47-52 (1926).
BRUES A.M., LISCO H., & FINKEL M., "Carcinogenic Action of someSubstances which may be a problem in certain future industries"Radiology, 4J3, 361-3 (1947) (MDDC-145).
CURIE M., CURIE P. and BEMONT G., "Another new Radio-active Element"Compt. Rend., 127, 1215-17 (1898).
CURIE M. and DEBIERNE A., "Metallic Radium". Compt. Rend., 151,523-5 (1910).
CURIE M., "Atomic Weight of Radium" Compt. Rend., 135, 161-3 (1902).
CURIE M. & CURIE P., "Radioactive Bodies" Bull. Soc. Franc. Phys.,142, 6 (1900).
DAELS F. & BACTEN G., "A Note on the Different Kinds of MalignantTumors Experimentally obtained by means of radium", Lancet, 211,666-9 (1926).
DOMINICI H., PETIT G. & JABOIN A., "The Existence and Applicationsof Radioactivity Persisting in the Organism after IntravenousInjection of an insoluble salt of radium" Compt. Rend., 150, 726-8(1910).
DOMINICI H., PETIT G. & JABOIN A., "Persisting Radioactivity ofOrganism under Influence of Injection of Insoluble Ra Compounds.Radioactive Serotherapy" Compt. Rend., 153, 1509-11 (1911).
20

DOMINICI H. & FAURE-BEAULIEU M., '"Oie Arrest and the Prolonged Storyof Radium in the Living Tissues for a Period Exceeding a Year"Compt. Rend. Soc. Biol., 68, 46-8 (1910).
EVANS R.D., "Radium Poisoning. A Review of Present Knowledge" Am.J. Pub. Health, 23, 101-123 (1933).
EVE A.S., Infection of Laboratories by Radium", Nature, 71, 460-1(1905).
FLINN F.B., "Radioactive Material & Industrial Hazard?" J. Am. Med.Assoc., 87, 2078-81 (1926).
HAVLIK B., GRAFOVA J., NYCOVA B., "Ra226 Liberation from Uraniumore Processing Mill Waste Solids & Uranium Rocks into SurfaceStreams - I". Health Physics, 14, 417-422 (1968).
HAVLIK B. & ROBERTSON E., "Radium uptake by F.W. Algae", Hygiene,Epiderm, Micro & Immunology, 17, 393-405 (1973).
MARTLAND H.S., "Occupational poisoning in manufacture of luminouswatch dials", J.A.M.A., 92, 466-73, 552-59 (1929).
MEYER M., "The Fate of radium after its introduction in the animalorganism, with some remarks on excretion of barium", J. Biol.Chem, _2_, 461-79 (1906).
P U S E Y W . A . , "Biological effects of radium", Science, 33, 1001-5(1911).
RONA E. & URRY W.D. , "Radioactivity of ocean sediments VIII Radiumand uranium content of ocean and river waters" Am. J. Sei., 250,241-262 (1962, April).
SCHLUNDT H, BARKER H.H. , & FLINN F.B., "The detection and estimationof Mesothorium in living persons" Am. J. Rotengenol RadiumTherapy, 21, 345-54 (1929).
SILBERSTEIN H.E., "Radium Poisoning. A survey of the literaturedealing with the toxicity and metabolism of absorbed radium", (1945)University of Rochester, AECD-2122, 41 p (1945).
TAYLOR L.S., "Radiation Protection Standards" CRC London 1971,Butterworth.
TSIVOGLOU E .G. , BARTSCH A.F., RUSHING D.E. , HOLADAY D.A., (U.S. Pub.Health Service) "Effects of Uranium Ore Refinery Wastes on ReceivingWaters, Sewage and Industrial Wastes", 30, 8, 1012 (1958).
TSIVOGLOU E.G., BARTSCH A.F., RUSHING D.E., HOLADAY D.A., "Report ofSurvey of Contamination of Surface Waters by Uranium RecoveryPlants". U.S. Public Health Service, R.A., Taft SanitoryEngineering Centre, Cincinnati, Ohio (1956).
21

TSIVOGLOU E.G. , SHEARER S.D., SHAW R.M., JONES J.D., ANDERSON J.B.,SPONANGLE C.E. , CLARK D.A. , "Survey of Interstate Pollution of theAnimas River, Colorado-New Mexico". U.S. Public Health Service, R.A.Taft Sanitary Engineering Centre, Cincinnati, Ohio (1959).
TSIVOGLOU B.C., STEIN M., and TOWNE W.W. , Control of radioactivepollution of the Animas River, Journal of the Water PollutionControl Federation, 32, 3, 262-287 (1960).
U.S. DEPT. OF HEALTH, EDUCATION AND WELFARE, (1962) "Waste Guide forthe Uranium Milling Industry", Public Health Service, TechnicalReport W62-12.
22

Chapter 2
ANALYTICAL METHODS
I. KOBALJoXef Stefan Institute,E. Kardelj University,Ljubljana, Yugoslavia
A.R. WILLIAMSEnvironmental Science Division,
Australian Atomic Energy CommissionResearch Establishment,
Lucas Heights Research Laboratories,Sutherland, NSW, Australia

2.1. METHODS FOR MEASURING 226Ra
For a better understanding of the numerous analyticalprocedures available for 22 Ra determination, let us first look at itsdecay series in Table 2.1.
If the degree of radioactive equilibrium between radium and itsdecay products is known, apart from radium any one of the products can bedetected in order to determine the radium activity; Thus, a lot ofanalytical methods for radium exist [Furnica (1969); Weigel (1977b)].They are based on
- direct identification of radium- identification of radium decay products- measurement of gross alpha, gross beta and gross gamma activityof radium together with decay products, or only those of itsdecay products.
2.1.1. Direct Measurement of Radium Activity
can be determined directly by alpha and gammaspectrometric methods, which in addition to 22^Ra activity also give usthe isotopic composition of radium present (isotopes 228, 226, 224 and223).
In alpha spectrometry, the 4.78 MeV 22 Ra alpha peak is analysed[aebesta et al. (1978); Durrance et al., (in press); Smith, Mercer(1970)].
In gamma spectrometry, the 226] J86 KeV peak is used [Durrance etal., (in press); Parks, Pool, Williams (1978); Papastefanou, Charalamous(1978)]. The abundance of this gamma peak is only 4 %, hence one shouldbe aware of possible interference from the 235jj 185 KeV peak, with anabundance of 54 % [Powers, Turnage, Kanipe (1980)].
226] can aiso be determined directly when it is isolated from thesample in the form of Ba-Ra sulphate, the sulphate heated to 700°C toremove radon and then radium alpha activity counted on a silver activatedzinc sulphide detector [Rao, Borkar, Shah (1970)].
Instead of precipitation, radium can be isolated byelectro-plating. The radium containing planchet is heated to removeradon, and radium alpha activity measured on a surface barrier detector[Koide, Bruland (1975)].
2.1.2. Spectrometry of radium decay products
There are several methods of radium determination viaidentification of its decay products using alpha, beta or gammaspectrometry.
25

2.1.2.1. Aljslia spectrometryAlpha spectrometry is usually performed for Identification of
radium decay products in isolated radium-barium coprecipitates [Sebestaet al. (1978); Bland (1980)].2.1.2.2.
For beta spectrometry liquid scintillation counting Isperformed. The water phase containing 22^Ra s mixed with a toluene[Prichard, Gesell, Meyer, draft] or dioxane based [Havlik (1971), Havlik(1973)] liquid scintillator, or only 222Rn is extracted and sorbed Inthe liquid scintillator and then analysed [Levins, Ryan, Strong (1978);Homma, Murakami (1977); Parks, Tsuboi (1978); Darrall, Richardson, Tyler(1973)]. A special version Is time interval liquid scintillationspectrometry [Cross, McBeth (1976a)].2.1.2.3. jGamm a_ spectrometry_
In gamma spectrometry of active samples radium is determined byanalysing the 2- BI 1.76 MeV gamma peak [Momeni, Rosenblatt, Jow(1976); Kirchmann et al. (1975); Vernet et al. (1975)], but generally thefollowing peaks are taken Into consideration:
- only 21 BI 609 keV fPrestwich, Kenneth (1979)],- often this one and 214Pb 352 keV [Sebesta et al. (1978);Roessler et al. (1979); Okubo, Furuyama, Sakanove (1979);Kirchmann, Darcheville, Koch (1980); Powers, Turnage, Kanipe(1980); Ekpechi, Van Middlesworth, Cole (1975)],
- sometimes also 2 ^Pb 295 keV [Okubo, Furuyama, Sakanove(1979)], and 214Bi higher energy peaks at 1120 and 1764 keV.
Rarely, preferably in cases of nonequllibrium between radium and itsdecay products [Thomas et al. (nondated separatum); Thomas, Malatova(1970); Lenger, Thomas (1970)1, the whole spectrum of the sample Isanalysed including also the 226Ra 186 keV peak [Sebesta et al. (1978);Sebesta et al. (1980)].
2.1.3. Gross Counting Methods
Gross activity determination of radium together with its decayproducts, or those of decay products only is often carried out.
2.1.3.1.
Radium can be isolated from a dissolved sample by coprecipitationafter an appropriate chemical procedure. As the precipitate in mostcases a radium-barium sulphate occurs [Schuttelkopf , Kiefer (1979);Yamamoto, Yunoki, Ishida (1977); Asikainen, Kahlos (1977); Asikainen,Kahlos (1979); Asikainen, Kahlos (1980); Levins, Ryan, Strong (1978);Rao, Borkar, Shah (1970); Gregory (1974); Ivan et al. (1976); Martin,Helm, Sigler (1969); Vilenskil (1969); Pietrzak-Flis (1972); Popova,Kyrchanova (1971); Vilenskii, Anikiev (1974); APHA (1974); HASL (updated1980)], and sometimes also radium-lead sulphate [Baltakmens, (1976);Sladkova et al. (1974); Wlodek, Grzybowska, Bysiek (1970)], andradium-calcium carbonate [Justyn (1973); Justyn, Stanek (1974)].
26

The alpha activity of the precipitate is usually measured with silveractivated zinc sulphide alpha scintillator [HASL (updated 1980); APHA(1974); Smithson (1979)], but some authors also use proportional gas flowcounters [APHA (1974); Yamamoto, Yunoki, Ishida (1977); Ivan et al.,(1976); Martin, Helm, Sigler (1969); Sladkova et al. (1974)], surfacebarrier detectors [Smithson (1979)] and Geiger-Müller tubes [Sladkova etal. (1974); Justyn (1973); Justyn, Stanek (1974)].To improve counting efficiency, the zinc sulphide scintillator can bemixed with the precipitate during precipitation [Kelkar, Joshi (1969)].For the same reason, gelatine plates with radium-barium sulphate are usedaccording to the sorbemulsion method [Havlik (1971)].
2.1.3.2. Determinat±pn. by_ema_noireJ^ry_
(a) Principle
Maybe the most widely used method for 226jja determination isemanometry [APHA (1974); HASL (updated 1980); Rushing, Garcia, Clark(1964); Smithson (1979)]. According to references available to theauthor, about a half of all investigations use this method.The principle of the method is deemanation and isolation of radon ingrownfrom radium in solution in a known time, and measurement of the activityof radon and its short-lived decay products. The radium containingsolution is closed in a vessel, called the radon bubbler, freed of radonby bubbling, stored for 1-30 days, depending on the expected radiumactivity [Sedlaéek, âebesta, Beneg (1980); APHA (1974)], and radon purgedfrom the bubbler into a counting cell.
(b) Measurements
Frequently Rushing type [Rushing, Garcia, Clark (1964)] 15-25 cm3glass bubblers are used [Sedlaëek, Sebesta, Benes' (1980); APHA (1974);HASL (updated 1980); Smithson (1979)]. In this case the bubbler issimply connected to an evacuated counting cell. A carrier gas is allowedto pass through the solution in the bubbler at a low flow rate (severalbubbles per second); it is dried in an ascarite and drier!te tube, andcollected in the counting cell. In a simplified procedure, the dryingtube is not included [SedlaSek, Sebesta, BeneS (1980)]. Due tohydrostatic pressure and tube resistence, the final pressure in thecounting cell is usually slightly below atmosphere pressure.As the carrier gas the following are used;
- helium [Michel, Moore (1980a); Felmlee, Cadigan (1978); Holtzmanet al. (1979); Smithson (1979); Miyaké, Sugimura, Saruhashi(1980); Haywood et al. (1980); Ku, Lin (1976); Ku et al. (1970)],
-argon [Sladkova et al. (1974); Sedlaiek, Sebesta, BeneS (1980)],- aged nitrogen [Smithson (1979); Holtzman et al. (1979);Scheibel, Porstendorfer, Wicke (1979); El-Daoushy (1978)],
- aged air [Szabo, Tokes, Pall (1973); Levins et al., (1978);Holtzman et al. (1979); Johns et al. (1979)],
- forming gas (15 % H2, 85 % N2) [HASL (updated 1980)],- and PR gas (90 % Ar, 10 % Methane) [Kametani (1975b)].
Helium gives a few percent better counting efficiency than nitrogen[Smithson (1979)].
The alpha activity of radon and its decay products is measured atleast 3 to 4 hours after filling the counting cell, when radioactiveequilibrium has been reached. For the activity measurements, are used:
27

- scintillation cells [Rushing, Garcia, Clark (1964); APHA (1974);Sedlaëek, Sebesta, Benes" (1980); Michel, Moore (1980a); Johns etal. (1979); Paschoa et al. (1979); Smithson (1979); Miyaké,Sugimura, Saruhashi (1980); Powers, Turnage, Kanipe (1980);Szabo, Tokes, Pall (1973)],
- ionization chambers [Ohno, Watanabe (Non-dated report); HASL(updated 1980); El-Daoushy (1978)],
- proportional counters [Kametani (1975); Martin, Helm, Sigler(1969)]
- and liquid scintillation counters [Levins, Ryan, Strong (1978);Homma, Murakami (1977); Darrall, Richardson, Tyler (1973).
Scintillation cells are mostly of Lucas type [Lucas (1957)] availableon the market [Smithson (1979)], or produced with some modifications inlaboratories using them [Sedla£ek, Sebesta, BeneS (1980); Kristan, Kobal(1973); Mastinu (1980); Szy, Urban (1971)]. Instead of glass, cell wallscan be made of stainless steel [Scheibel, Porstendorfer, Wicke (1979)] oracrylic plastic [Key et al. (1979)]. The volume of scintillation cellsis usually 0.15 to 0.20 dm^, but there are also smaller [Key et al.(1979)] and larger ones [Mastinu (1980); Szy, Urban (1971)]. The insidewalls of the scintillation cells are covered with silver activated zincsulphide scintillator. The bottom of the cell is transparent and serveas the optical contact with the photomultiplier tube of a low-backgroundscintillation probe.(c) Low radium concentrations measurements
Apart from conventional pulse height ionization chambers [HASL(updated 1980)], some specially designed chambers are also in use[Sladkova et al. (1974)].
The efficiency of radon transfer from the bubbler into the countingcell is mainly dependent on the volume ratio between the counting celland the bubbler. Lower radium concentrations require larger samplevolumes. In order to keep the small volume Rushing type bubbler, watersamples must be concentrated by evaporation, by sorption of radium on acationic exchange resin or manganese-oxide impregnated acrylic fibers, orby coprecipitation followed by dissolution.
If larger volumes of water or other solubilized samples cannot beavoided, radon from the stored sample is extracted and collected in thecounting cell with a carrier gas using radon-transfer apparatus. In thiscase, a larger volume of carrier gas is used, the expelled gas ispurified and dried, radon is isolated from the carrier gas and collectedin a previously evaculated counting cell. Depending on the volume andshape of the bubbler, the carrier gas volume ranges from a few [Kobal,Kristan (1972)] to 30 litres [Scheibel, Porstendorfer, Wicke (1979)].
The expelled gas is purified from water by ascarite and drierite[Johns et al. (1979); Miyaké, Sugimura, Saruhashi (1980)], concentratedsulphuric acid [Kobal, Kristan (1972)], silica gel and soda lime [Homma,Murakami (1977)], calcium chloride and copper filaments at -78,5°C[Scheibel, Porstendorfer, Wicke (1979)].
Radon is isolated from the carrier gas on a liquid nitrogen cooledtrap [Kobal, Kristan (1972); Miyake, Sugimura, Saruhashi (1980); Haywoodet al. (1980); Homma, Murakami (1977); HASL (updated 1980)], on a
28

charcoal trap cooled at -78.5°C [Levins, et al., (1978); Kirchmann et al.(1975); Holtzman et al. (1979); Key et al. (1979); Schelbel,Porstendorfer, Wicke (1979)], or on an activated molecular sieve at dryIce temperature [Chung (1976)].
To Improve trapping efficiency, fine bronze wool [Key et al. (1979)]or glass beads [Kobal, Kristan (1972)] are used as trap filling. In caseof a nitrogen trap, radon expands into the counting cell after warmingthe trap to room temperature, while desorption from charcoal is caused byheating the trap up to 300 [Key et al. (1979)] or 450°C [Holtzman et al.(1979)].
To assure complete transfer, the radon isolated in a trap can berecondensed in a smaller, additional so-called 'volume reduction trap'and then collected in the counting cell [Key et al. (1979)]. For thesame reason, the carrier gas containing the radon is made to circulate inthe radon transfer system by means of a dyaphragm type pump [Homma,Murakami (1977)].The radon transfer system is usually made of glass, but when made ofstainless steel tubing it slightly reduces liquid nitrogen consumption[Key et al. (1979)].To extract radon efficiently from a very large sample volume (55an additional recirculating device speeds up radon release [Broecker,Goddard, Sarmiento (1976)].
Instead of concentrating low activity samples, some authors proposelarger and specially shaped scintillation [Mastinu (1980); Szy, Urban(1971)] and ionization cells [Sladkova et al. (1974)].
It Is also possible to connect an evacuated scintillation cell to alarger water sample (up to 1 dm-*) and from the activity of radonextracted in this one cell, calculate the total activity of radon presentby making an extrapolation [Raghavayya (1968); Kobal, Kristan (1972)].
For liquid scintillation counting, radon is trapped on silica gel atliquid nitrogen temperature [Darrall, Richardson, Tyler (1973)] or at-80°C [Levins, Ryan, Strong (1978)], and then transferred into atoluene-based liquid scintillator at 0°C, or after drying it is directlycondensed in the scintillator at liquid nitrogen temperature [Homma,Murakami (1977)]. According to the 'isopiestic1 method [Parks, Tsuboi(1978)], the radium containing water sample is directly attached to avessel with a liquid scintillator, or the sample and solvent can becombined in the scintillation vial [Cooper, Wilks (1981)].
2.1.3.3. _Cpunting_of_ _radpji a_fteT_ £x_t.ra_c.tion_by_Instead of deemanation, radon at a known degree of equilibrium with
radium present in a water or solubilized sample can be extracted bydissolution in hexane or toluene which is added to the sample andshaken. Gross gamma activity of the solvent is measured after separation[Terning (1970)], or a and ß activity is measured via liquidscintillation counting [Gessel, Prichard, Haygood (1978)].
This was a short review of analytical methods for the determinationof radium.
29

2.2. METHODS FOR PREPARING AND ANALYSING SAMPLES
2.2.1. Waters
2.2.1.1. Fre_sh_ wateryWater samples are taken in the field and transported to an
analytical laboratory. The required volume of sample depends on theactivity expected and the analytical procedure used. The time intervalbetween sampling and analysing should be as small as possible to preventradium from adsorbing onto the container walls, as this may result inconsiderable error [Vdovenko and Dubasov (1975); El-Daoushy (1978)].This adsorption can be lowered by acidification or by a choice ofcontainer material, as illustrated by the work of Sebesta et al, (1980)in Figure 2.1. This shows the percentage adsorption of 224ga onto thewalls of glass and polythylene containerrs as a function of pH. Glassadsorbs more radium than the plastic but, at a pH of 3 or less,adsorption on both types of surface is negligible.
In related work by Sebesta et al. (1980) samples of river water andtreated uranium mining waste water were spiked with 224]ja. nosignificant sorption losses occurred within 4 days. The effect ofstoring these waters, in plastic bottles, on the distribution ofdissolved and suspended "Oga was also investigated over a period of 53days; no change was detected in river water samples but the particulatefraction of the waste water increased by 46%, probably due to the delayedformation of Ba(Ra)S04 particles (the waste waters had been treatedwith BaCl2 In order to remove the Ra as Ba(Ra)S04 co-precipitate).
The importance of filtration loss was also examined by the CRPCzechoslovakian group, however the amount of radium retained on themembrane filter was negligible (< 2%) for river water, treated wastewater and mine water (1-1000 pg dm"3 226Ra). BeneS et al. (1981)have developed a method of selective dissolution for characterizing theparticulate forms of radium in natural and waste waters.
Depending on the radium concentration in a water sample and on theanalytical equipment, radium is determined:
- directly, without concentration of radium- by extracting radon ingrown from radium for a known time ina closed vessel
- by concentrating radium from a larger sample (to severaltens of dm3) and its subsequent determination according toone of the former methods.
(a) Direct determinationRadium at concentrations of several tens of Bq/m3 can be determined
by gamma spectrometrie methods using 0.5 dm3 Marinelli beakers. Thesample Is sealed for about two weeks and the 295.2, 352.0, and 609.4 keVpeaks of 2-*-^Pb and 214g analysed on a Ge-Li detector [Roessler etal. (1979)].Frequently, only the 214gi 609.4 keV peaks is taken into account, butin the case of higher activities, counts under the 214ߣ 1.76 MeV peakare enough [Kirchmann et al. (1973)].
30

When spring water is transferred to a specially shaped sphericalvessel and gamma analysis is carried out, counting for 180 minutes,concentrations down to a few tens of Bq/m3 can be determined [Bizollon,Moret, Molgatini (1971)].Using larger (1.5 dm3) and specially constructed scintillation cells, asensitivity of 1.8 [Szy, Urban (1971)] or 3.7 Bq/m3 [Mastinu (1980)]can be reached.Larger ionization chambers (2.3 dm3) are also sensitive enough tomeasure 5.5 mBq of radium in water without reconcentration [Sladkova etal. (1974)].Expelling radon from a solution into a gas proportional counter can be asuitable method for activities above 50 mBq [Kametani (1975b)].
(b) Determination by transferring radon in an appropriate counting cell
For lower concentrations, the Rushing type bubbler is too small tocontain enough activity to be detected by ordinary counters. In suchcases larger bubblers (0.5 to 0.8 dm3) are used and the radon,extracted by a carrier gas, is transferred to a counting cell by one ofthe procedures mentioned above [Michel, Moore (1980a)], Paschoa (1977);Paschoa et al. (1979); Scheibel, Porstendorfer, Wicke (1979); Miyaké,Sugimura, Saruhashi (1980)].
(c) Determination after concentrating radium
In the majority of cases of environmental water samples, usuallyhaving low radium concentrations, radium is first concentrated and thendetermined. For concentrating radium the following procedures are used:
- evaporation- coprecipitation- sorption on ion exchange resins- sorption on manganese-impregnated acrylic fibres
(i) EvaporationThe sample volume can be simply reduced by evaporation [Kirchmann etal. (1975); Holtzman et al. (1979); Rao, Borkar, Shah (1970); Haywoodet al. (1980); Havlik (1971); Havlik (1967); Zettwoog (1978);Saumande, Reix, Beck (1973)] to a final volume suitable for a directemanation into the counting cell.(ii) CoprecipitationThe most widely used method for concentrating radium iscoprecipitation on barium sulphate [De Jesus, Malan, Basson (1978);Johns et al. (1979); Smithson (1979); Rao, Borkar, Shah (1970);Felmlee, Cadigan (1978); HASL (updated 1980); Rushing, Garcia, Clark(1964)], lead sulphate [Olteanu (1975)], barium chromate [HASL(updated 1980)], calcium carbonate [Kurosawa (1978); Justyn (1973);Justyn, Stanek (1974)] or ternary phosphomolybdate in polyethyleneglycol [Sedlaëek, £ebesta, Benea (1980)]. An appropriate carriershould be added to obtain the radiochemical yield. After washing andappropriate chemical purification, the precipitate is either storedfor a known time and measured by gamma spectrometry [Sebesta et al.(1978)] or by alpha counting [Schuttelkopf, Kiefer (1979); Asikainen,Kahlos (1977); Asikainen, Kahlos (1979); Asikainen, Kahlos (1980);Smithson (1979); Martin, Helm, Sigler (1969); Vilenskii (1969);Kelkar, Joshi (1969); Wlodek, Grzybowska, Bysiek (1970); Khademi,Mahdavi (1974); Sladkova et al. (1974); Vilenskii, Anikiev (1974);
31

APHA (1974); HASL (updated 1980)], or dissolved, transferred to aRushing type bubbler, and radium determined by emanation [Sedla£ek,äebesta, Beneä (1980); Kurosawa (1978); Feimlee, Cadigan (1978);Johns et al. (1979); Smithson (1979); Olteanu (1975); APHA (1974);HASL (updated 1980); Rushing, Garcia, Clark (1964)] as described inprevious chapters.
(iii) Sorption on ion exchange resinsRadium from a 20 dnp (or larger) water sample can be concentratedby sorption on a cationic exchange resin. The resin is stored for adesired time and then bubbled with a carrier gas. The ingrown radonis then transferred to a counting cell and measured [Kobal et al.(1974)].
(iv) Sorption on manganese-impregnated acrylic fibresIn fresh water radium can also be successfully concentrated bysorption on manganese impregnated acrylic fibres [Bland (1980)],though this method was developed [Moore, Reid (1973)] and is widelyused for analysing sea water samples. Radium is removed from thefibre by boiling in concentrated hydrochloric acid and the extractedsolution transferred to a Rushing type bubbler.
2.2.1.2. Sea_ wate_r
In the case of sea water, the sample volume ranges from 20 [Reid(1979); Ku, Lin (1976); Olteanu (1975)] up to 1000 dm3 [Okubo,Furuyama, Sakanove (1979)].
Generally, methods for 226 determination in sea water can bedevided into three types.
(a) Radon extraction
Radon extraction from water and measurement of its alpha activity[Michel, Moore (1980b)], Chung (1976); Ku, Lin (1976); Broecker, Goddard,Sarmiento (1976); Kelkar, Joshi (1969)]. In order to speed up radonextraction, an auxiliary bubbling device can be added to thebubbling container [Broecker, Goddard, Sarmiento (1976)], and for moreefficient isolation of radon from the expelled gas, an activated charcoalmolecular sieve is used [Chung (1976)].(b) Radium concentration
Radium is concentrated from a larger volume of sea water byadsorption on manganese-oxide impregnated acrylic fibres [Key et al.(1979), Moore, Reid (1973); Reid (1979)]; then the fibres are leachedwith acid and the radium containing solution transferred to a bubbler andradium determined emanometrically.(c) Radium extraction
Radium is isolated from sea water by chemical procedures. Ifradium-barium coprecipitate is analysed on a Ge-Li detector, radium canbe determined from the 295 and 352 keV peaks of 214Pb and a 609 keVpeak of 21*Bi [Okubo, Furuyama, Sakanove (1979)].By a more complex chemical treatment [Koide, Bruland (1975)], radium canbe isolated in a form suitable for electroplating. The planchet with
32

radium is ignited (in order to remove radon) and radium is alpha countedon a pulse height analyser connected to a surface barrier detector.
2.2.2. Soil, Sediments, Ore, Tailings
These samples can be analysed either in their solid form or theyare solubilized and radium determined by one of the previously mentionedmethods, or a selective dissolution can be made [Benes et al. (1981)].2.2.2.1. So 11 d_ sample^
The radium content can be evaluated from a gross beta count of asolid sample on a low level beta counter [Paul, Londhe, Pillai (1980)].
For a crude approximation, a solid sample is placed in distilledwater for a time, and the radium in the water determined [Bnerson,Hesslein (1973)]. This procedure is also used to determine only theactivity of radium adsorbed on sediment particles [Key et al. (1979);Rao, Borkar, Shah (1970)].
Using Nal or Ge(Li) detectors in gamma spectrometry, radium can bedetermined in intact solid samples [Roessler et al. (1979); Schuttelkopf,Kiefer (1979); Durrance et al. (In press); Haywood et al. (1980);Yasstrebov (1973); Vernet et al. (1975); Baltakmens, (1976); Dobbs,Matthews (1976); Miller, Fix, Bramson (1980); Kirchmann, Darcheville,Koch (1980)]. In anticoincident gamma spectrometry, the interference of^OK can be eliminated [Prestwich, Kenneth (1979)]. Samples are sealedand stored until radioactive equilibrium between radium and its decayproducts is reached. To prevent radon from possibly escaping from sealedbags, powdered samples can be mixed with charcoal which adsorbs it[Kirchmann, Darcheville, Kock (1980)].
2.2.2.2. Disjsolved_ samples_More often solid samples are solubilized [HASL (updated 1980);
Rushing, Garcia, Clark (1964)]. Depending on the chemical composition ofthe sample this process can be simple, but in some cases it is verycomplex and time-consuming. Special care should be paid to the removalof silicon, which, when present, decreases the recovery yield of radium[Zimmerman, Armstrong (1975); Terning (1970); Kirchmann et al. (1973)].In the dissolved sample, radium can be determined by:
(a) Deemanation technique [Ryan, Levins (1980); Ohno, Watanabe(Non-dated report); Kirchmann et al. (1975); ïyengar (1980);Fisenne et al. (1979); Fisenne et al. (1980); Johns et al.(1979); Borole, Somoyalulu (1977); Kametani (1975a); Martin,Helm, Sigler (1969); Popova, Kyrchanova (1971); El-Daoushy(1978); Justyn (1973); Justyn, Stanek (1974); Rushing, Garcia,Clark (1964)], extracting radon by bubbling and transferring itto a counter cell.
(b) Radium is electroplated on a planchet, the planchet ignited toremove radon and then the gross alpha activity of the planchetis counted or alpha spectrometric analysis based on 4.78 KeVradium peak performed [Koide, Bruland (1975)].
33

(c) Coprecipitation of radium in the form of radium-barium sulphatefollowed by gross alpha measurement [Baltakmens, (1976); Rao,Borkar, Shah (1970); Yamamoto, Yunoki, Ishida (1977)] or alphaspectrometry [Zimmerman, Armstrong (1975)] of the precipitate.
(d) Extraction of radon from the radium bearing solution by hexaneand subsequent measurement of the gamma activity of the radonand its daughters [Terning (1970)].
(e) Sorbemulsion method using gelatine plates with radium-bariumsulphate counted on an alpha scintillation counter [Vlc'ek(1962)].
2.2.3. Food
2.2.3.1.content in milk can be determined by a direct
deemanation of radon from the milk [Kirchmann et al. (1973); Kirchmann etal. (1972)], or milk is firstly evaporated, dried and ashed, and then theash can be analysed by gamma spectrometry [Schuttelkopf , Kiefer (1979)].Alternatively, it is firstly solubilized and radium determined bydeamanation of radon [Khademi, Mahdavl (1974)] or by electroplating radondaughters followed by alpha scintillation measurement [Treuelle (1977)].2.2.3.2. Solid food
(a) Techniques involving ashingFood and vegetables samples are dried and ashed. The ash istreated as follows:(i) The ash is analysed by gamma spectrometry using a Ge(Li)
detector [Schuttelkopf, Kiefer (1979)].(ii) The ash is dissolved and radium determined by
- coprecipitation with barium sulphate and subsequentmeasurement of alpha activity of the precipitate usingsilver activated zinc sulphide [Smithson (1979)] or alow background gas-flow proportional counter [Ivanet al., (1976)]
- electroplating radon daughters from the solutionfollowed by alpha scintillation counting of the planchet[Treuelle (1977)].
(b) Techniques involving pulverizationPlant samples are dried and pulverized.(i) Ready pulverized samples can be analysed by gamma
spectrometry [Miller, Fix, Bramson (1980)], or samples arefirst ashed and gamma spectrometry of the ash carried out[Schuttelkopf, Kiefer (1979)].
(ii) The ash is dissolved and radium determined by- emanometry [Holtzman et al. (1979); Bloch et al. (1980);Popova, Kyrchanova (1974)]
- alpha spectrometry of the electroplated radium [Smithson(1979)]
- sorbemulsion method with alpha scintillation countingradium-barium sulphate gelatine [Havlik (1971)]
- alpha scintillation counting of the radium-bariumoprecipitate [Smithson (1979)].
34

2.2.4. Animal Materials
2.2.4.1. Bone£(a) 226ga<jium content of bone samples (bones, teeth, fossils,
corals) is often obtained by nondestructive gamma spectrometryof powdered samples [Moment, Rosenblatt, Jow (1976); Komura,Sakanove, Konishi (1978); Charalambous, Papastefanou (1977);Papastefanou, Charalambous (1978)].
(b) If samples are ashed and dissolved, radium is determined by- emanometry with [HASL (updated 1980)] or withoutcoprecipitation with barium sulphate [Kirchmann et al.(1975)] or
- alpha scintillation counting of radium-barium sulphate[Gregory (1974)].
(c) Radium retained in animal bones can also be determined by wholebody gamma spectrometry [Momeni, Rosenblatt, Jow (1976); Parks,Pool, Williams (1978)].
2.2.4.2. U.rine_,_blpod(a) Urine samples are filtered and chemically treated in order to
obtain a clear solution in which radium is determined by adirect emanometry [Lucas, Marschal, Barrer (1970)], or radium isfirstly extracted by barium sulphate coprecipitation [HASL(updated 1980)]; Smith, Mercer (1970)].
(b) Also liquid scintillation technique can be successfully used fordetermination of the radium content of urine [Parks, Tsuboi(1978)].
(c) Similar procedures can be used for radium determination in blood[Lucas, Marschal, Barrer (1970)].
2.2.4.3. Exc_re_ta_Excreta samples are first dried and ashed, the ash is dissolved
and radium determined by(a) Emanometry [Lucas, Marschal, Barrer (1970)] or(b) Coprecipitation of radium-barium sulphate followed by
gamma spectrometric analysis of the precipitate[Vanderborght, Colard, Boulenger (1972)],
- dissolution of the precipitate and emanometricdetermination [HASL (updated 1980); Smith, Mercer (1970)].
2.2.4.4. Whp_le_ b_ody_counti_n£High activities of 226] retained in the animal and human body
by ingestion can also be measured by gamma spectrometry using a wholebody counting system [Lucas, Marschal, Barrer (1970)]; Vanderborght,Colard, Boulenger (1972); Thomas et al. (nondated separatum); Lenger,Thomas (1970)].
35

2.3. INTERPRETATION OF RESULTS
2.3.1. Components of the Random Precision Error
A quantitative estimate of the uncertainty associated with anyradiochemical analysis is necessary in three important applications:
- comparing monitoring data with prescribed standards,- intercomparison of different methods of analysis, and- estimating the lower limit of determination in a given method.
Handbooks on radiochemistry outline the methods involved in estimatingthis uncertainty and Donn and Wolke (1977) with the correction of Barry(1979) have provided the means of determining the sample size required tomake correct decisions on low-level monitoring data. However thesemethods all assume that the error is due only to a simple, random,radioactive decay process, approximated by the Poisson distribution, andfor two reasons this is invalid for common methods of radium analysis.
Firstly, the time intervals commonly used in radon counting are longcompared to the half-life of 218Po (3 minutes) and 21 Po (1.64 x10~ seconds, Table 2.1) and this means that, for example, each 222Rndecay will almost certainly be followed by a 218po decay within 15-20minutes, and so the total number of counts recorded are not allindependent, random events. Lucas and Woodward (1964) examined thisproblem theoretically and derived a correction factor as follows:
<f = "V JNwhere <f = standard deviation of N counting events. They found that Jvaries between 1 and 2.9 depending on the counting interval and thecounting efficiency, and they provided Tables and Figures that evaluate Jfor a range of conditions. Sarmiento et al. (1976) independentlyexamined this problem and introduced an approximation to simplifycalculation. Key (1977) compared the two methods and concluded that theSarmiento approximation was useful for counting times in excess of 300minutes, otherwise the Lucas method was preferred. Jonassen and Clements(1974) used the simple expedient of estimating the counts due to 222Rnalone and taking the square root of that as the standard deviation. Theythen obtained some experimental values for the standard deviation ofradon-in-air measurements and found that these were consistently higherthan the simple Poisson estimate based on total counts (3.9% coefficientof variation), and on average (4.7%), were below the estimate based on222Rn activity alone (6.4%). It is unfortunate that the theoreticalworks of Lucas and Woodward (1964) and Sarmiento et al. (1976) were notalso compared with experimental data.
The second reason why the simple Poisson model is inadequate is thaterror sources other than radioactive decay always influence radiochemicalanalysis and thus should be included in the estimate of precision error.Sarmiento et al. (1976) recognized this and included empirical terms intheir model for the variance of the background, the blank, the volumetricmeasurement and the calibration; in a typical sample of seawater, inwhich the activity of 222gn Was 1 mBq kg"-'- and the coefficient of
36
variation was 6.32, they found the following contributions to the totalvariance:
Calibration 58.4%Radon decay 32.1%Blank 7.4%Background 1.4%Volume 0.7%
The Australian group [Williams, O'Brien, Mears (1981)] alsoapproached error estimation from this point of view in studying theroutine performance of their method for ^ "Ra analysis in water using acharcoal radon trap and plastic scintillation cell. Their findings wereas follows:
- The empirical precision error ranged from 7% (coefficient ofvariation) at 1 mBq to 4% at 100 Bq, and this was approximatedby the simple Poisson error model only at activities below100 mBq.
- The background of the scintillation cells did not increase overa period of 1.5 years, contrary to some findings elsewhere[Powers, Turnage, Kanipe (1980)].
- The system carried over about 0.35% of the radon from one sampleto another, which could lead to significant error if lowactivity samples are analysed directly following high activitysamples without flushing in between.
- A large component of the error (7% coefficient of variation) wasdue to calibration, and was normally distributed (i.e. not dueto counting error).
- Gross errors were sufficiently common to require analysis of allsamples at least in duplicate, to ensure 90% probability that agiven result falls within a 95% confidence interval of the truevalue.
- As the Poisson error model failed to explain the observederrors, a combined Poisson and Normal model was derived whichdid explain what was observed. This model predicted that, with200 counting events and/or a counting time of 200 minutes, theprecision error will range between 7% and 12% (coefficient ofvariation) for sample activities greater than 10 mBq andbackground less than 0.5 cpm (min~l). For lower activities,fewer counting events, shorter counting times or higherbackgrounds,the precision error becomes much larger. The lower limit ofdetermination was estimated by an iterative method and was foundto be mainly dependent on counting error; long counting timesand low backgrounds giving an increasingly lower limit, whilevariation in blank errors and calibration errors had littleeffect; the limit was % 1 mBq for a counting time of 200 minutesand background of 0.05 cpm (min~l).
Because the errors found by Williams, O'Brien, Mears (1981) werelarger than those found or predicted by Lucas he pointed out theirneglect of his theoretical "J" correction and of his specification ofmetal rather than plastic scintillation cells (Lucas, 1982). In reply,Williams and O'Brien (1982) defended the performance of plastic cells andpointed out that the existence of the non-counting errors can nullify theusefulness of the "J" correction, using the intercomparison data[Williams (1981)] as a prime example.
37

There is an obvious need for a synthesis of these different points ofview and in the light of the present discussion, we recommend the use ofthe Poisson-Normal model of Williams, O'Brien, Hears (1981), but with acorrection included to account for the lack of independence in the222Rn_daughter decay; to this latter end we recommend a comparisonbetween the methods of Lucas and Woodward (1964), Sarmiento et al. (1976)and Jonassen and Clements (1974) based on adequate experimental data from
analysis of water.
2.3.2. Inter-Laboratory Comparison
As part of the IAEA Coordinated Research Program, an intercomparisonof 226 analysis of water was carried out and is reported in Williams(1981). Eight countries participated in analysing three replicates oftwo water samples (0.17 Bq L~^ and 22 Bq L~ ). Four countries usedmethods which involved pre-concentration of radium followed by directde-emanation of radon into a scintillation cell [denoted "Method C", e.g.Rushing, Garcia, Clark (1964); SedlaSek, Sebesta, Benefi (1980)], and fourcountries used methods which involved direct de-emanation of radon froman unprocessed sample, with [Lucas (1957); Kobal, Kristan (1972)], orwithout a radon trap intervening before transfer to a scintillation cell(denoted method D).
The result of the intercomparison was that the C methods were moreprecise than the D methods. The C method results all clustered withinthe range of the within-laboratories variation (i.e. there was notgreater variation between laboratories than within laboratories); thestandard deviations were 10% for the 0.17 Bq dm~l sample and 6% for the22 Bq dm"-*- sample. The D method however contained extra randomvariation that could only be explained by a standard deviation of 12% forboth samples.
Other intercomparisons of 226ga analysis in water have been carriedout. The U.S. Environmental Protection Agency has reportedintercomparison data [Jarvis, Smiecinski, Easterly (1976); Shawver(1980)] using the Rushing method [Johns et al. (1979)]. In bothstudies 80% of laboratories fell within the +_ 3 cf range of the knownvalue for ^^^Ra; the precision errors were, respectively, 19-20% and17-25% coefficient of variation.
An intercomparison of 226 analysis in sea water, under theGEOSECS program, has also been reported by Chung et al. (1974); Chung(1976); Broecker, Goddard, Sarmiento (1976); and Ru, Lin (1976). A largenumber of samples were analysed, not necessarily from an homogenisedstock, and the data were not thoroughly analysed. However, a typicalresult was that of Table 2 in Chung et al. (1974) where 6 samples wereanalysed by each of three laboratories; the average concentration of226Ra was i mBq kg-1 and the pooled within-laboratory precision error(based on replicate analysis of each sample) was 9% coefficient ofvariation. The expected precision error due to radioactive decay in 20mBq of 226 (20 dm-* samples were used) for a 200 minute countingtime would be in the range of 9-11%. A systematic error was evidentbetween the laboratories but it did not at any time exceed +_ 2 <£ based onthe within-laboratory precision error of 9% (the previously mentionedstudies used a _+ 3 <T definition of agreement). Thus all threelaboratories were able to maintain their accuracy well within the limitsof their precision.
38

The seawater intercomparison therefore provided by far the bestresults with a precision error no larger than that attributable toradioactive decay and a range of agreement spanning a factor of 1.4OJL 2 x 9%). In contrast the U. S.E.P.A. studies found a range ofagreement of a factor of 4 (+. 3 x 20%) and the present IAEA study founda range of agreement of a factor of 2 (i 3 x 12%). It is notpossible within the scope of this document to examine the reasons behindthis large variation in performance, however it is clear that goodagreement can be achieved, and so we recommend that a between-laboratoryrandom error of < 10% is a realistic goal and an error as high as 20%should not be accepted.
2.4. CONCLUSIONS AND RECOMMENDATIONS
As was shown in the previous sections, we may conclude that eachmethod can be appropriate for radium determination provided that it iscarried out skillfully and that all precautionary measures are taken intoconsideration.
Direct nondestructive methods are preferred, but radium concentrationin environmental samples is seldom high enough to allow it to beapplied. These methods can be used for analysing uranium ores, tailings,water from tailing ponds, some sediments and other more active samples.
In the majority of cases, radium should be firstly concentrated(and/or isolated) from the sample and then determined according to one ofthe methods described already. For water samples, evaporation,co-precipitation and adsorption are used for concentration. Eachprocedure has its advantages and disadvantages. Most frequently bariumis used for coprecipitation, but calcium-barium precipitate is moreconvenient for filtration and centrifugation [Kurosawa (1978)].Coprecipitation with the ternary complex of calcium phosphomolybdate andpolyethylene glycol facilitates dissolution of radium [Sedlac'ek, Sebesta,Beneg (1980)].
Radium once dissolved (water samples or solutions afterpreconcentration or after isolation from solid samples) can be determinedby direct emanation measuring radon gas, or by reprecipitation andmeasurement of the activity of the precipitate.Emanation Is preferred because it is specific for 222Rn gas, andmeasuring its own and its daughters' alpha activity enables us todetermine 226 ±n tne presence of even high activities of 223 an(j224ßa. it is much less sensitive to this interference thanalpha-counting of the precipitate [Smithson (1979); Rushing, Garcia,Clark (1964)].
A promising new method of Ra analysis is low-background liquidscintillation a -counting [McDowell (1980] using pulse shape as well aspulse height discrimination, and utilizing the high solubility of radonin organic solvents such as toluene. We recommend further development ofthese concepts.
But the main point on which one can decide which method to use is thenature of the sample (water, soil, ore, biological material, etc.) andthe radium concentration in it. Thus the choice lies with the lowerlimit of detection of a method - LLD [HASL (updated 1980)].
39

With gamma spectrometry of water samples (0.5 dm3, 8 h counting) anLLD of 1.2 to 2.6 kBqm~3 is obtained (depending on the efficiency ofGe-LL detector) while the emanation method gives (200 min count)1.5 Bqm~3 [Powers, Türnage, Kanipe (1980)]. For soil both methods havean LLD of the same order of magnitude, namely 0.7 Bq kg~ - withemanation and from 1.1 to 2.6 Bq kg~l with gamma spectrometry[ibidem]. Certainly, the LLD is dependent on the measuring equipment aswell as on counting times and background [Sebesta et al. (1980)1. Thus,according to other sources, LLD in emanation method is 3.7 Bqm~3 for100 min counting [Smithson (1979)], from 1.1 to 1.9 Bqm~3 [APHA(1974)], 3 m Bq for 400 min and 1.7 m Bq for 1000 min count [HASL(updated 1980)].Determination of radium by measuring alpha activity of the precipitatefrom a 0.5 dm3 water sample has (for a 100 min count) an LLD of3.7 Bqm~3 [Smithson (1979)], but for a 400 min count it is 3 mBq, andfor 1000 min count 1.7 mBq [HASL (updated 1980)].Where preconcentration of radium is carried out, the LLD can be loweredby taking larger sample volumes.
The analytical procedure should be also chosen in accordance with theaims of the investigation, namely which forms of radium, for instance inwater, are to be determined: soluble radium, insoluble radium, radiumadsorbed on solid particulates, weakly adsorbed radium, total radium, andso forth [Sebesta et al. (1978); Sebesta et al. (1980) Benes et al.(1981)]. To this aim, it is not enough to take care of the appropriateprocedures and equipment, but special precautions should also beundertaken in sample collection, treatment and storage before analysis[Sebesta et al. (1980)].
In order to be able to compare the results of radium determinationsamong different publications, authors should treat their resultsstatistically and give details of the procedure used.Interlaboratory comparison has shown that it is possible for laboratoriesto operate within the limits of error determined by radioactive decay(2-10% coefficient of variation) and thus we recommend that this be setas a goal of quality control.Some of the existing data on 226 jn the international literature maybe subject to error beyond that attributable to radioactive decay andranging between 12-20% coefficient of variation; this should be takeninto account when comparing such results.
In gross counting methods (i.e. "ORa and/Or 222^ piusdaughters) the precision error should not be estimated from the simplePoisson model because 222 daughter decay is not independent of222Rn decay, and because non-Poisson errors also occur in samplehandling and machine operation. An optimum error model has yet to bedevised and we recommend a synthesis of the Poisson-Normal model with thesimplest decay correction that fits the experimental data. Once such asatisfactory error model is devised it should be used to estimate theprecision of individual sample analyses, to estimate the limit ofdetermination of the method, and to test monitoring data againstprescribed limits.
Gross error is common in radiochemical analysis; we recommendduplicate analysis of important samples and rejection of outliers(especially if the frequency of gross error exceeds 5% in yourlaboratory) .
40

Table
Decay modes and energies
2.1
of 226^3 and its maindaughter products, in order [from Weast
Isotope
226^
222^
218Po
214Pb
214B1
Half-life Decay Particle Particlemode energy
(MeV)
1600 a(*) a 4.7814.5984.3404.1944.160
3.823 d a 5.4864.9844.824
3.05 min « 6.0025.181
ß-
26.8 min ß- 0.590.651.03
19.7 min ß- 0.821.061.141.411.501.511.881.982.653.26
a 4.941(0.04%) 5.023
5.1845.2685.4485.512
intensity%
94.55.50.0060.00090.0003
100.0.080.0005
99.90.00110.019
6.
2.8.5.8.
19.19.10.2.5.
19.0.250.210.65.8
53.939.2
(1978)]
Gammaenergy(MeV)
0.1860.2600.4200.4500.610
0.510
0.0530.1960.2060.2420.2590.2720.2750.2790.2950.3520.4810.5340.5490.777
0.0630.1910.4500.6090.6660.7030.7210.7690.7870.8060.8210.8250.8740.9350.9601.050
Gammaintensity
%
100.0.290.0210.0090.033
0.07
3.7
36.
1.47.
2.0.80.75.31.21.5
0.43.30.50.5
(*) 1617a [Weigel (1977a)]41

Isotope Half-life
214B1
214Po 1.64 x10~4S
210pb 21 a
21°Bi 5.01 d
Table 2.1 (cont.)
Decay Particle Particle Gammamode energy intensity energy
(Me V) % (MeV)
1.1201.1551.2071.2381.2811.379
1.39-1.401.4161.5091.5411.5831.6001.6611.6811.7281.7641.8361.8481.8771.8972.0172.0902.1172.1622.2042.4352.7002.7702.8902.9903.070
« 7.687 99. 0.8006.905 0.01+ longrange a
ß- 0.015 81. 0.0470.061 19.
a 3.72 1.7xlO~6
ß- 1.160 99.a 4.654 0.00013
4.691
Gammaintensity
16.1.80.66.01.74.84.2.40.80.90.61.20.23.217.0.32.30.20.30.071.3
6.2.0.040.040.040.040.040.014
4.1
42

Table 2.1 (cont.)
Isotope Half-life Decay Particle Particle Gamma Gammamode energy intensity energy intensity
(MeV) % (MeV) %
210Po206Pb
138.4 d
stable
a 5.305 0.803 0.0012
Note: 218At, 218Rn, 210T1 and 206T1 also occur in the decaychain but with yields ^ 0.(
60
%s4O
20
8 10 12pH
14
Fig.2.1 Adsorption of radium on glass (1) and polyethylene (2)as a function of the pH value of the solution.Initial concentration of 224Ra 20 pg IT1, ionicstrength of the solution 0.01 (as NaCl); pH adjustedwith HC1 and NaOH; data points represent means of 2-6replicates, bars represent standard deviations from 4replicates. Data of Sebesta et al (1980).

REFERENCES
APHA"Standard Methods for the examination of water and wastewater",American Public Health Association, Washington D.C., 13th Ed.,(1974).ASIKAINEN M., KAHLOS H."Pohja-ja Dintavesien Luonnollinen Radioaktiivisuus Suomessa".Institute of Radiation Protection, Helsinki, Finland,Raporrtti STL-A24 (1977).
ASIKAINEN M., KAHLOS H."Anomalously high concentrations of uranium, radium and radon inwater from drilled wells in the Helsinki region".Geochem. Cosmochim. Acta jt.3, 1681 (1979).
ASIKAINEN M., KAHLOS H."Natural radioactivity of drinking water in Finland",Health Phys. 3_9_, 77 (1980).
BALTAKMENS T.Uranium-238 and Radium-226 equilibrium and thorium: uraniumratio in New Zealand soil - their relationship to iron andpotassium contentNew Zealand J. Sei. 19, 375 (1976).
BARRY B.J.Comments on "The statistical interpretation of counting datafrom measurements of low-level radioactivity" by J.J. Donn andR.L. Wolke,Health Phys. 36, 208-9 (1979).BENEé P., SEDLACEK J., SEBESTA F., SANDRIK R. and JOHN J."Method of selective dissolution for characterization ofparticulate forms of radium and barium in natural and wastewaters".Water Res. 15_, 1299-1304 (1981).BIZOLLON C.A., MORET R., MOLGATINI J.P."Methode de mesure directe des teneurs en radium et en radon deseaux de source à l'aide de la spectrométrie gamma".Ann. Phys. Biol. Med. 5_, (1971) 45.
BLAND C.J."Measurements of radium in water using impregnated fibres".Natural Radiation Environment III (Proc. Symp., Houston, Texas,USA, 1978), CONF-780422, 3 , 458 (published 1980).
BLOCK E.W., DESAI N., ROESSLER C.E., KAUTZ R.S."Determination of radon flux from complex media: virgin andreclaimed lands in Florida Phosphate Region".Natural Radiation Environment III, (Proc. Symp., Houston, Texas,USA, 1978) CONF-780422, 2, 1673 (publ. 1980).
44

BOROLE D.V., SOMOYALÜLÜ B.L.K."Radium and lead-210 in marine barite".Marine Chem. 5_, 291 (1977).
BROECKER W.S., GODDARD J., SARMIENTO J.L."The distribution of 226Ra in the Atlantic Ocean".Earth Planet. Sei. Lett. J52, 220 (1976).
CHARALAMBOUS S., PAPASTEFANOÜ C."On the radioactivity of fossil bones".Nucl. Instrum. Methods 142, 581 (1977).
CHUNG Y., CRAIG H., KU T.L., GODDARD J., BROECKER W.S."Radium-226 measurements from three Geosecs intercalibrationstations".Earth Planet. Sei. Lett. 23, (1), 116 (1974).CHUNG Y.C."A deep 226Ra maximum in the Northeast Pacific".Earth Planet. Sei. Lett. 32, 249 (1976).COOPER M.B., WILKS, M.T.An analytical method for radium (22 Ra) in environmentalsamples by the use of liquid scintillation counting.Australian Radiation Laboratory, Yallambie, ARL/TR040 (1981).CROSS P., McBETH G.W."Absolute determination of trace quantities of theseries by time interval analysis".Nucl. Instrum. Methods 137, 135 (1976).
CROSS P., McBETH G.W."Liquid scintillation alpha particle assay with energy and pulseshape discrimination",Health Phys. 30, 303 (1976).DARRALL K.G., RICHARDSON P.J., TYLER J.F.C."An emanation method for determining radium using liquidscintillation counting". Analyst 98, 610 (1973).DAY P.R."Report of the Committee on Physical Analyses, 1954-55".Soil Science Society of An erica, Soil Sei. Soc. Proc. 20,167-169 (1956).DE JESUS A.S.M., MALAN J.J., BASSON J.K."Movement of radium from South African gold/uranium mine dumpsinto the aqueous environment".Report at the IAEA Third Coordination Meeting of "The Source,Distribution, Movement and Deposition of Radium In InlandWaterways and Aquifers", Las Vegas, Nevada, USA, October 1978.
DOBBS J.E., MATTHEWS K.M."A survey of naturally occurring radionuclide concentration inNew Zealand soils".New Zealand J.Sci. 19, 243 (1976).
45

DONN J.J., WOLKE R.L."The statistical interpretation of counting datameasurements of low level radioactivity",Health Phys. _32, 1-14 (1977).DURRANCE E.M., MEADS R.E., BRINDLEY R.K., STARK A.G.W."Radioactive disequilibrium in uranium-bearing nodules from the NewRed Sandstone (Permian-Triassic) of Budlegh Salterton, Devari".(In press).EKPECHI O.L.V., VAN MIDDLESWORTH L., COLE G."Natural 226Ra and 228Th in thyroids of cattle from Nigeria,W. Africa".Int.J.Nucl.Med.Biol. 2, 31 (1975).EL-DAOUSHY M.F.A.F."The determination of Pb-210 and Ra-226 in lake sediments anddating applications".Upsala University Institute of Physics,Report UUIP-979 (1978).EMERSON S., HESSLEIN R."Distribution and uptake of artificially introduced radium-226in a small lake".J. Fisheries Res. Board Canada J30, 10, 1485 (1973).EPA"Environmental radioactivity laboratory intercomparison studiesprogram 1978-79 Environmental Monitoring and Support Laboratory,Las Vegas, USA",Report EPA-600/4-78-032 (1978).FELMLEE J.K., CADIGAN R.A."Radium and uranium data of mineral springs in eight WesternStates".U.S. Department of the Interior, Geological Survey, Open-FileReport 78-561 (1978).
FISENNE I.M., WELFORD G.A., PERRY P., BAIRD R., KELLER H.W."Distribution of 234U, 238U, 226Ra, 210Pb and 210Po £nsoil".Environment Int. 1 5 245 (1979).
FISENNE I.M. PERRY P.M., KELLER H.W."Wet and dry deposition of 226radium, 210lead and stablelead in an urban environment".Environmental Measurements Laboratory, U.S. Department ofEnergy, New York, Environmental Quarterly Report EML 371, 1-51 (1980).
FURNI£A G."Principii metodologice in determinarea elementului radim".Stud. Cere. Chim. 17 (4), 307 (1969).
GESSEL T.F., PRICHARD H.M., HAYGOOD J.R.Applications of commercial liquid scintillation counters toradon-222 and radium-226 analyses.Proc. Health Phys. Soc. Symp. on Radiation Instrumentation, Ed.W. Wadman III, CONF-780110, 258-271 (1978).
46

GREGORY L.P."The determination of strontium,-90, radium-226, and lead-210 inhuman bone".National Radiation Laboratory, New Zealand, Report No. NRL-RM/4(1974).
HASL"Procedures Manual" (Ed. by J.H. Barley)U.S.Atomic Energy Commission, Health and Saf. Lab., HASL 300(updated 1980).
HAVLIK B."Cumulation of radioactive substances by organisms of naturalbiocenosis of surface waters and its significance fordetermination of radioactive load."J.Hyg. Epidemiol. Microbiol.Lmnunol. 11, 229 (1967).
HAVLIK B."Radioactive pollution of rivers in Czechoslovakia."Health Phys. 19, 617 (1970).
HAVLIK B."Radium in aquatic food chains: radium uptake by fresh wateralgae".J.Hyg.Epidemiol.Microbiol.Immunol. 17, 393 (1973).HAWOOD F.F., PERDUE P.T., SHINPAUGH W.H., ELLIS B.S., CHOU K.D."Radiological survey of the active uranium-mill tailings atDurango, Colorado".Oak Ridge National Laboratory, USA, Report ORNL-5451 (1980).
HOMMA Y., MURAKAMI Y."Study on the applicability of the integral counting method forthe determination of 226 ±n various sample forms using aliquid scintillation counter".J.Radioanal.Chem. 36, 173 (1977).
HOLTZMAN R.B., URNEZIS P.W., PADOVA A., BOBULA III C.M."Contamination of the human food chain by uranium mill tailingspiles".Argonne National Laboratory, Argonne, Illinois, USA:Report NUREG/CR-0758, ANL/ES-69 (1979).
IVAN J., SLOVAK M., ABEL E., PATZELTOVA N."The Intake of 226Ra<jium by ingestion and its evaluation in aselected group of population".6s. Hyg. 2±, (8), 328 (1976).
IYENGAR M.A.R."Radium in natural and processing areas and its impact on humanenvironment".Report at the IAEA Forth Coordination Meeting on "The Source,Distribution, Movement and Deposition of Radium in InlandWaterways and Aquifers", Vienna, Austria, (June 1980).
47

JARVIS A.N., SMIECINSKI R. F. , EASTERLY D. G."The status and quality of radiation measurements of water".Environmental Monitoring and Support Laboratory, Las Vegas,Nevada, USA, Report EPA-600/ 4-7 6-01 7 (1976).JOHNS F.B., HAHN P.B. , THOME D.J. , BRETHAUER E.W."Radiochemical analytical procedures for analysis ofenvironmental samples".Environmental Monitoring and Support Laboratory, Las Vegas,Nevada, USA, Report EMSL-LV-0539-17 (1979).JONASSEN N., CLEMENTS W.E."Determination of radon-222 concentrations by an integratedcount method".Health Phys. 27_, 347-351 (1974).
JUSTYN J."uptake of natural radioisotopes by aquatic organisms".Radiobiol.Stud. _3_, 145 (1973).
JUSTYN J., STANEK Z."Accumulation of natural radionuclides in the bottom sedimentsand by aquatic organisms of streams".Int.Rev.Ges.Hydrobiol. _59 ( 5 > > 563 (1974).
KAMETANI K."Analytical methods for determination of Ra-226 is soil".Radioisotopes 24 (3), 59 (1975).
KAMETANI K."Determination of Ra-226 by means of measurement of Rn-222radioactivity with a proportional counter".Radioisotopes 24_ (3), 59 (1975).KELKAR D.N. , JOSHI P.V."A rapid method for estimating radium and radon in water".Health Phys. 17. 253 (1969).
KEY R.M."Estimating the standard deviation for 222Rn scintillationcounting - a note concerning the paper by Sarmiento et al."Earth Planet. Sei. Lett. 35, 184-187 (1977).
KEY R.M. , BREWER R.L. , STOCKWELL J.H. , GUINASSO Jr. N.L. ,SCHINK D.R."Some improved techniques for measuring radon and radium inmarine sediments and in seawater".Marine Chem._7, 251 (1979).KHADEMI B., MAHDAVI A."Increase of 226 ±n t e water intake by sheep".Health Phys. _2_7_, 522 (1974).KIRCHMANN R., LAFONTAINE A., VAN DEN HOEK J. , KOCH G."Comparaison du taux de transfert au lait de vache du 226]l'eau d'abreuvage et du ^2ÔRa incorporé dans le foin".Compt. Rend. Sciences Soc.Biol. , 166 (11), 1557 (1972).
48

KIRCHMANN R., LAFONTAINE A., CANTILLON G., BOULENGER R."Etude du cycle biologique parcouru par la radioactivité".Centre d'Etude de l'Energie Nucléaire, Mol, Belgique.Rapport BLG 477, vol.II, Annexe Technique, (1973)KIRCHMANN R., DARCHEVILLE, M., KOCH G."Accumulation of radium-226 from phosphate fertilizers incultivated soils and transfer to crops"."Natural Radiation Environment III", (Proc.Symp. Houston, Texas,USA, 1978), CONF-780422, 2> 1667 (publ.1980).KOBAL I., KRISTAN J."Determination of 222jjn concentration in hot spring watersusing a scintillation chamber".Radioanal.Lett. £, 291 (1972).
KOBAL I., KRISTAN J."Extension of Raghavayya's method for the determination of radonin water".Mikrochim.Acta (Wien) (1973), 219 (1973).KOBAL I., SHAHIN M., KRISTAN J., SENEGACNIK M."Sorption-emanation method for soluble radium in waters".Health Phys. 27, 381 (1974).
KOIDE M., BRULAND K.W."The electrodeposition and determination of radium by isotopicdilution in sea water and sediments simultaneously with othernatural radionuclides".Anal.Chim.Acta 75_, 1 (1975).
KOMURA K., SAKANOVE M.. KONISHI K."Nondestructive 226Rg/238u dating of quartenary corals bygamma-spectormetry".Proc.Japan Acad.Sci. 5± (9), 505 (1978).
KRISTAN J. KOBAL I."A modified scintillation cell for the determination of radon inuranium mine atmosphere".Health Phys. 24, 103 (1973).
KU T.L., LI Y.H., MATHIEU G.G., WONG H.K.Radium in the Indian-Antarctic Ocean south of Australia".J.Geophys. Res. 75_ (27), 5286 (1970).KU T.L., LIN M.C."226Ra distribution in the Antarctic Ocean".Earth Planet.Sei.Lett. 32, 236 (1976).KUROSAWA R."Error estimation of ionization method on the secondinter^comparison of IAEA".Report at the IAEA Third Coordination Meeting on "The Source,Distribution, Movement and Deposition of Radium in InlandWaterways and Aquifers", Las Vegas, Nevada, USA, October 1978.
49

LENGER V., THOMAS J."226Ra activity determination in nonequilibrium state byscintillation gamma spectroscopy".Radioisotopy JU, (5), 797 (1970).LEVINS D.M., RYAN R.K., STRONG K.P."Leaching of radium from uranium tailings".Paper presented at the OCED-NEA Seminar on "Management,Stabilization and Environmental Impact of uranium MillTailings",Albuquerque, New Mexico, USA, July 1978.
LUCAS H.F."Improved low-level alpha scintillation counter for radon".Rev.Sci.Instrum. 28, 680 (1957).
LUCAS H.F."What is the 'Lucas emanation method for 226Ra ••Health Phys. 43, 278-279 (1982).LUCAS H.F., WOODWARD D.A.Effect of long decay chains on the counting statistics in theanalysis of radium-224 and radon-222.J. Appl. Phys. _35, 452-456 (1964).LUCAS H.F., MARSCHAL J.H., BARRER L.A."The level of radium in human blood forty years after ingestion.Radiatn. Res. 4 (3), 637 (1970).LUCAS H.F., MARKUN F."228 3 an(j 226fta ±n bone from radium cases".Unpublished paper.
MARTIN S.S., HELM W.T. , SIGLER W.F."Accumulation of 226Ra in two aquatic systems".Proc. Second Nat. Symp. on Radioecology, CONF-670503, 307(Publ.1969).
MASTINU G.G."An emanation apparatus with simple operational procedure formeasurements of low levels of 22"Ra".Health Phys. 20, 97 (1975).
MASTINU G.G."Scintillation detector for radon-222 in air and water".Natural Radiation Environment III (Proc.Symp., Houston, Texas,USA, 1978), CONF-780422, _!, 700 (publ.1980).
McDOWELL W.J."Alpha liquid scintillation counting: past, present and future",Liquid Scintillation Counting, Recent Applications andDevelopments. Vol. 1. Physical Aspects (Peng C.T., HorrocksD.L., Alpen E.L., Eds) Academic Press, New York (1980) 315-332.
SO

MICHEL J., MOORE W."Sources and behaviour of natural radioactivity in Fall Lineaquifers near Leesville, South Carolina".Clemson University Water Resources Research Institute, TechnicalReport, No. 83, February 1980.MICHEL J., MOORE W.S."228Ra and 226Ra content of ground water in Fall Line aquifers".Health Phys. 38, 663 (1980).MILLER M.L., FIX J.J., BRAMSON P.E."Lognormal analyses of naturally occurring radionuclides in soil andvegetaton of the Hanford Area".Natural Radiation Environment III (Proc.Symp., Houston, Texas, USA,1978), CONF-780422, !_, 826 (publ.1980).
MIYAKE Y., SUGIMURA Y., SARUHASHI K."The distribution of radon and radium in the ocean and itsbearing on some océanographie problems"."Natural Radiation Environment III" (Proc.Symp., Houston, Texas,USA, 1978), CONF-780422, _!, 458 (publ.1980).MOMENI M.H., ROSENBLATT L.S., JOW N."Retention and distribution of 226Ra in beagles".Health Phys. 30, 369 (1976).
MOORE W.S., REID D.F."Extraction of radium from natural waters using manganeseimpregnated acrylic fibres".J.Geophys.Res. _78 (36), 8880 (1973).MOORE W.S., COOK L.M."Radium removal from drinking water".Nature 253 (5489), 262 (1975).OHNO S., WATANABE H."Measurement of radium-226 in bone of Japanese people".National Institute of Radiological Sciences, undated report.
OKUBO T., FURUYAMA K., SAKANOVE M.i> 9 9 RDistribution of z°Ra in surface sea water of the East IndianOcean".Geochem.J. 13, 201 (1979).
OLTEANU M."A method for the determination of Ha22** in water".Igiena XXIV (1), 15 (1975).PAPASTEFANOU C., CHARALAMBOUS S."226Ra leaching from fossil bones".Nucl.Instrum.Methods 151, 599 (1978).PARKS N.J., TSUBOI K.K."Emulsion scintillation counting of radium and radon",Int.J.Appl.Radiatn.Isotopes 29, 77 (1978).
51

PARKS N.J., POOL R.R., WILLIAMS J.R."Variation of radon retention parameters for radium burdened dogskeletons as a function of exposure age and dosage level".Radiatn.Res. 73, 274 (1978).PASCHOA A.S."Preliminary results of concentration of radium-226 in waters ofthe Pocos de Caldas Region".Report at the IAEA Second Meeting on "The Source, Distribution,Movement and Deposition of Radium in Inland Aquifers", Japan(1977).
PASCHOA A.S., BATISTA G.B., MONTENEGRO E.G., MIRANDA A.C.,SIGAUD G.M."Ra-226 concentrations in the hydrographie basins near uraniummining and milling in Brazil".Pontificia Universidade Catolica, Rio de Janeiro.Nota Cientifica 02/79 (1979).PAUL A.C., LONDHE V.S., PILLAI K.C."Radium-228 and radium-226 levels in a river environment and itsmodification by human activities".Natural Radiation Environment III (Proc.SymposiumHouston, Texas, USA, 1978), CONF-780422, 2, 1633 (publ.1980).PIETRZAK-FLIS Z."Radium-226 in Polish diet and foodstuffs".Nuklonika XVII, (3-4), 227 (1972).POPOVA O.N., KYRCHANOVA A.N."Analiz pasoki kak sredstvo izucheniya migratsli Ra^26 vsisteme poshva-rastenie".Ekologiya (6), 33 (1971).POPOVA O.N., KYRCHANOVA A.N."Formy deponirovaniya Ra-226 v rasteniyah".Agronomiya, 2, 110 (1974).
POWERS R.P., TURNAGE N.B., KANIPE L.G."Determination of radium—226 in environmental samples"."Natural Radiation Environment III" (Proc.Symp. Houston, Texas,USA, 1978), CONF-780422, JU 640 (publ.1980).PRESTWICH W.V., KENNETH T.J."Radium determination In soil samples using a gamma-raycoincidence spectrometer".J.Radioanal.Chem. _50 (1-2), 249 (1979).
PRICHARD H.M., GESELL T.F., MEYER C.R."Liquid scintillation analyses for Radium-226 and Radon-222 inpotable waters".Liquid Scintillation Counting, Recent Applications andDevelopments, Vol.1, Physical Aspects. Academic Press, NewYork, 347-355 (1980).
52

RAGHAVAYYA M.Proc.Region.Seminar, Bombay, India, 1968, SM-114/17, p.227(1968).
RAO S.R., BORKAR M.D., SHAH S.M."Distribution of 220Ra n son aruj water".Proc.National Symposium on Radiation Physics, Trombay, India,507 (1970).REID D.F."Radium, thorium, and actinium extraction from seawater using animproved manganese-oxide-coated fibre".Earth Planet.Sei.Lett. 43, 223 (1979).
ROESSLER C.E., SMITH Z.A., BOLCH W.E., PRINCE R.J."Uranium and radium-226 in Florida phosphate materials".Health Phys. 37, 269 (1979).RUSHING D.R., GARCIA W.J., CLARK D.A."The analysis of effluents and environmental samples fromuranium mills and biological samples for radium, polonium anduranium".Radiological Health and Safety in Mining and Milling of NuclearMaterials, (Proc.Symp. Vienna, Austria 1963), vol.2, p.187(published 1964).
RYAN R.K., LEVINS D.M.Extraction of radium from uranium tailings".CIM Bulletin, 126-133 (1980).
SARMIENTO J.L., HAMMOND D.E., BROECKER W.S."The calculation of the statistical counting error forscintillation counting". Earth Planet. Sei. Lett. 32, 351-356(1976).
SAUMANDE P., REIX F., BECK C."Etude de la radioactivité des eaux naturelles du Limousin;le Radium 226, l'uranium et le radon".Bull. Soc. Pharmacie Strasbourg XVI, (2), 141 (1973).SCHEIBEL H.G., PORSTENDORFER J., WICKE A."A device for the determination of low natural 222]jn ancj226ga concentrations".Nue1.Instrum.Methods 165, 345 (1979).
SCHUTTELLKOPF H., KIEFER H."Die Dosisbelastung der Umgebungs bevölkerung durch naturlischeund aus einer Uranunter suchungsrube emittiertes Ra-226."Kernforschungzentrum Karlsruhe, Report KfK 2866 (1979).SEBESTA F., BENE§ p., SEDLACEK j., HAVLIK B."Studies on the source, distribution, movement and deposition ofradium in inland waterways and aquifers".Report at the IAEA third Coordination meeting on "The Source,Distribution, Movement and Deposition of Radium in InlandWaterways and Aquifers",Las Vegas, Nevada, USA, (October 1978).
53

éEBESTA F., BENE§ P., SEDLACEK J. , HAVLIK B."Studies on the source, distribution, movement and deposition ofradium in inland waterways and aquifers".Report at the IAEA fourth Coordination meeting on "The Source,Distribution, Movement and Deposition of Radium in InlandWaterways and Aquifers",Vienna, Austria, (June 1980).
SEDLAC'EK J., SEBESTA F., BENE§ p."Scintillation emanometric determination of radium-226 in watersusing a new method of radium preconcentration".J. Radioanal. Chem. 5 (*)> 45 (1980).SHAWVER J.M."The status and quality of radiation measurements in water -1977",Effluent and Environmental Radiation Surveillance, ASTM STP 698(J.J. Kelly, Ed.) American Society for Testing and Materials,Philadelphia, 270-281 (1980).SILL C.W. and WILLIAMS R.L."Rapid identification and determination of alpha emitters inenvironmental samples",Rapid Methods for Measuring Radioactivity in the Environment(Proc. Int. Symp. Neuherberg bei München, 1971) InternationalAtomic Energy Agency, Vienna 201-211 (1971).
SLADKOVA M. , ABEL E. , IVAN J. , CHRAPAN J. , ORAVEC J. , HOLY K."Determination of low activities of radium-226 in water".Cs.Hyg. 19, 480 (1974).
SMITH K.A. , MERCER E.R."The determination of radium-226 and radium-228 in soils andplants, using radium-225 as a yield tracer".J. Radioanal. Chem. _5_, 303 (1970).
SMITHSON G.L."Radiochemical procedures for determination of selected membersof the uranium and thorium series".Canada Center for Mineral And Energy Technology,CANMET Report, No. 78-22, (1979).
SZABO E., TOKES B., PALL M."Continutul in 222Rn, 226Ra si activitatea beta-gama globalaa apei instalatiilar centrale, a unor microcentrale, a unormicrocentrale si a apelor de suprafata urai impartente dinjudetele Mures si Harghita".Hidrotechnica (Bucaresti) 18, 191 (1973).
SZY D., URBAN A."Über die Messung geringer Mengen Radium und Radon".Mikrochim.Acta (Wien), 1971, 131 (1971).
TERNING J.A."Radiochemical analyses of radium, thorium, and protactinium inuranium milling process samples".Int. J. Appl. Radiât. Isotopes 21, 507 (1970).
54

THOMAS J., MALATOVA I.,"Evaluation method of the gamma spectrometrical determination ofradium in state of non-equilibrium".Radioisotopy .U, (5), 815 (1970).THOMAS J., ROTH Z., MALATOVA I., LENGER V."Analysis of gamma spectra of 226 or 224] ±nnon-equilibrium with their decay products".Health Physics Problems of Internal Contamination, (undatedseparatum).TREUELLE M.A."Content of 26 n selected food produced in theSouth-Bohemian Region".Ös.Hyg. 2,2, 141 (1977).
VANDERBORGHT 0.. COLARD J., BOULENGER R."Human faecal 2^6Ra excretion shortly after a RaSU4 dustcontamination, with alginate treatment".Health Phys. _23, 240 (1972).
VDOVENKO V.M. and DUBASOV Y.V."Analytical chemistry of radium"(Transi. Ed. Malament D.) Wiley, New York (1975).
VERNET J.P., DAVAND E., COSANDEY M., BERLIE J."Analyse de la radioactivité gamma des sédiments des lacs Lémanet de Moret".Eclogae Geol. Helv. 68/1, 87 (1975).
V1LENSKII V.D."Raspredelenie svinca-210 i radya-226 v nekaterih pochvah".Geokhimiya, (12), 1507 (1969).
VILENSKII V.D., ANIKIEV V.V."Svinets-210 i radii-226 v vodnih otlozheniya presnyh vodoemov".Geokhim. _8_, 1259 (1974).
VLCEK B."Radiochemical analyses by means of adsorption plates, I. Methodand determination of radium".Collect. Czech. Chem. Commun. 28, 3326 (1962).
WEAST R.C."CRC Handbook of Chemistry and Physics".CRC Press, Cleveland, 58th Ed. (1978) B.
WIEGEL F."Radium".Gmelin Handbuch der Anorganischen Chemie: 31.Springer-Verlag, Berlin (1977a).
WEIGEL F."Radium".Chimiker Z., Sonderdrick 101, 486 (1977b).
55

WILLIAMS A.R."An international comparison of 22oRa analyses by theemanation method".Health Physics, 41, 178-183 (1981).
WILLIAMS A.R. , O'BRIEN B.C., MEARS K.P."Random errors in radiochemistry: the Lucas emanation methodfor 226Ra ".Health Physics, 41, 47-57 (1981).
WILLIAMS A.R., O'BRIEN B.C."Reply to H.F. Lucas"Health Phys. 43, 279-280 (1982).
WLODEK S., GRYZBOWSKA D., BYSIEK M."Influence of human activity upon 226] migration in theenvironment".Nukleonika, XV (9-10), 675 (1970).
YAMAMOTO T., YUNOKI E., ISHIDA T."Determination of uranium and radium in soil."(in Japanese with a summary in English).Annual Report of Okayama Prefectural Research Center ofEnvironment and Public Health, No. 1, 159 (1977).
YASSTREBOV M.T."Natural radioactivity of some soils and landscapes of TambovForest-Steppe".Vestn. Mosk. Univ. Biol. Pachv. (6), 91 (1973).
ZETTWOOG, P."Intercomparison of analytical methods for radium within theIAEA Coordinated Research Program on the Source, Distribution,Movement and Deposition of Radium in Inland Waterways andAquifers".Report at the IAEA Third Coordination Meeting on "The Source,Distribution, Movement and Deposition of Radium in InlandWaterways and Aquifers", Las Vegas, New Mexico, USA (1978).
ZIMMERMAN J.B., ARMSTRONG V.C.Canada Center for Mineral and Energy Technology,CANMET Report 76-11 (1975).
56
Chapter 3
DISTRIBUTION IN NATURE
M.A.R. IYENGARHealth Physics Division,
Bhabha Atomic Research Centre,Trombay, Bombay, India

3.1. INTRODUCTION
With nuclear energy acquiring a significant role in the energymap of the world, there is a growing emphasis on increased Uraniumproduction. As a consequence, more and more process wastes from theUranium industry are building up in tailings dams or impoundment basinsin various parts of the world. Although each of the radionuclidespresent in the tailings, i.e. Natural U, 230Th, 226Ra, 222Rn,210pb and 210po is of equal concern, 22"Ra forms the criticalnuclide in setting permissible standards for members of the public (ICRP1959). This is based on the fact that 226Ra has a high degree ofradiotoxicity, is bone-seeking, has a long half life of 1620 years and asan alpha emitter has a high potential for biological damage. As ahomologue of Ca, an essential metabolic element, Ra closely follow Cametabolism in man with eventual deposition in bone followed by decay to222Rn and a series of shortlived Rn daughters, causing significantradiation exposure.
In the context of environmental disposal of the active wastes fromuranium processing facilities, the surface waterways constitute a vitallink in the migration and build-up of Ra in various environmentalcomponents, such as sediments, biota, dietary materials, etc., ofrelevance to human exposure. To some extent the ground waters also playan important role in receiving the effluent seepage from tailings ponds,causing Ra to move in the ground water system. Besides the Raoriginating from the first stage of the nuclear fuel cycle, areas ofhigher background radioactivity due to occurrence of uranium and thoriumcontaining minerals, are also sources of elevated Ra levels in theneighbouring environment. Therefore a study of the distribution of22"Ra in the natural aquatic environment, in particular itsbiogeochemical cycle, is of considerable importance in the evaluation andcontrol of population exposures.
Under this coordinated programme, the main emphasis has been confinedto groundwaters, surface streams and stream biota. The data included inthis review, is also generally confined to those of the participatingcountries, namely, Australia, India, Japan, Czechoslovakia, France,Yugoslavia, Brazil, South Africa, USA and Belgium, as a complete overviewof the worldwide data has not been planned at this stage. However it ishoped that such review will be possible in future, under the Agency'sprogramme.
However in the context of natural distribution data of 22%a inthese environments, the information available is not fully satisfactoryfor most components. Wherever such information exists, as in the case ofground and surface water, the data is presented with supportinginformation. But in the case of sediments and biota much of the datacomes from contaminated situations with a few observations made as partof a baseline survey.
59

3.2. GROUND WATERS
3.2.1. 226Ra Distribution in Selected Geographic Regions
In the aquatic domain, the ground waters play an important rolefrom the viewpoint of their exploitation by man for a variety ofpurposes. In many areas of the world the ground waters find extensiveapplication in agriculture, and in areas of scarce surface waterresources the ground waters form the main source of drinking water forthe community, besides meeting it's industrial and recreationalrequirements. In view of these, and in addition due to the highly toxicnature of 226 ±n public water supplies, the study of 226 ±nground waters has assumed considerable significance; for e.g. the USEPA(1976) has laid down that in community water supplies 226fta anc[ 228together must not exceed 0.185 Bq/l(5.0 pCi/1). As a guideline it isalso recommended that if water contains greater than 0.185 Bq/1 alphaactivity, 226 must be determined and if 220Ra ±s greater than 0.111Bq/1 (3 pCi/1), 228Ra must be determined. However in cases ofsuggested presence of 228 ^ States are recommended to determine228 3 and/or 226Ra -^f gross-alpha is greater than 0.074 Bq/1 (2pCi/1).
Radium in groundwaters can arise from natural sources, resulting frominteraction of groundwaters with Ra bearing materials like rocks, soils,orebodies etc. It can also arise indirectly from man's exploitation ofradioactive minerals of uranium, thorium etc. for nuclear powergeneration. Besides there is considerable radioactivity in otherconventional minerals of commercial importance such as phosphaticminerals, apatite (Ca5(P04)3F, C1,OH), copper, gold, lignite, coal,bauxite and such other ores due to the presence of uranium and itslonglived daughter products, like 226Ra, 230Th, 210Pb, 210Poetc. Mining and processing of these minerals for metal recovering canalso bring about enhancement of the Ra levels in the environment wellabove the normal background levels. In the case of natural unmined oredeposits Ra can enter the ground waters by way of leaching of the Rabearing rock strata by the ground water aquifer. Geothermal springs areconsidered to be another source of natural radioactivity, including amongothers, 226 an(j 222 . Considerable attention is being devoted byrecent investigations towards studying the radiological exposuresignificance of thermal springs and spas, which serve as touristattractions in many countries.
In common with any other mineral processing industry, the mining andmilling of large quantities of uranium ores, increasingly in practice inmany areas of the world to meet growing energy needs, leaves behind alarge volume of wastes. Although these wastes are not characterised byhigh specific activity, the main concern arises from the nearquantitative presence of 226 ±n the waste effluents and its possibleimpact on environmental health. If the waste treatment and controlpractices are not efficient, most of the dissolved 226Ra
60

eventually find Its way through mill tailing flow, reaching the nearbystreams (Tslvoglou E.G., et al., 1964). Even where large tailingsImpoundment ponds are maintained as part of environmental controlmeasures Ra can reach groundwaters by direct seepage of the pondeffluents. Besides leaching of residual tailings by rain water andpercolation of these waters into the ground water system, can also raisethe background Ra levels in ground waters.In view of these the study of Ra in the aquatic environment would beincomplete without a detailed reference to its occurrence and movement inground waters. The main areas of study in different parts of the worldunder the Coordinated Programme and their study context are given inTable 3.1.
The large body of data generated by these studies have geen processedusing the statistical data concentration programme (ZCH 2 and ZCH 3/2)developed at the Zentralabteilung für Chemische Analysen, KFA Jülich,West Germany (Sansoni B., et al, 1981). Examples of the processed dataare presented as (1) areawise histogram (Fig. 3.1), (2) lognormalprobability plots (Fig. 3.2), (3) relative frequency plots of each study(Fig. 3.3). The range of concentrations and their central values withdispersion and the type of frequency distribution are given for thecomposite data in Table 3.2.
3.2.2. Discussion
The 226Ra levels in the Florida Study are in the range of lessthan lower limit of detection to 2.8 Bq/1. Extensive application ofstatistical methods on the Florida 226 data analysis (Kaufmann R. F.and Bliss J.D., 1977), has shown no impact on the Upper and LowerFloridan aquifers, either as a result of phosphate mining and wastemanagement practices, or due to unmined mineralised areas. However whereoccasional high 226 concentrations are noticed as in Lower Floridanaquifer, they are stated to be associated with natural factors unrelatedto phosphate mineralisation or the Central Florida phosphate industry.Tanner (1964) has pointed to elevated levels of 26 in ground waterswith chloride enrichment. The Florida study also demonstrates that ingeneral 226 levels increase with salinity, which in turn varies withwell depth and position in the well regime within the Floridan aquifersystem.
concentrations in ground waters of Sarasota county were foundto be two orders of magnitude greater than in the primary study area forthe water table and almost an order of magnitude greater for the Floridanaquifer. Ra in the water table aquifer is significantly greater in thecoastal area compared to inland area. Occurrence of monazite sands inthe beaches near Venice in Sarasota county has been indicated as apotential 228 SOurce. The study speculates on the possible effect ofincreased concentration of dissolved solids, calcium in particular onenhanced Ra levels. Good correlation of 226jja concentration with totaldissolved solids is indicated ( ï$ =0.82), tending to support acause^effect relationship.
Investigation of radioactivity associated with geothermal waters inWestern united States (O'Connel and Kaufmann 1976), covers the hotsprings and wells located in Arizona, California, Colorado, Idaho,
61

Nevada, New Mexico, Oregon and Utah. The 226 distribution data forexample, from hot springs in northern California approximates to astraight line fit on a lognormal frequency distribution plot (Fig. 3.4).The linearity implies that the data are from a single population (Denhamand Waite, 1975). However there appears a slope change around 0.1 pCi/1(0.1137 Bq/1), which could indicate an outside influence or variation inthe existing source. In the case of ground waters, according to authors,such a change may be attributed to variations in the flow system,regional rock type or nearby magmatic activity. 226jja concentrationsfor geothermal waters as a whole are in the range of 0.0015 to 55.5Bq/1. No definite conclusion regarding radioactivity associations in thegeothermal waters could be obtained according to the study report.
The Australian data from Yeelirrie (Brownscombe, A.J. et al.. 1978)show a wide range of 226Ra concentrations (0.019 -33.4 Bq/1). 2*6Ralevels tended to be generally high in the region of ore body. Whilemaking a concluding reference to Table 3.2, it is observed that theconcentration data for 22%a in groundwaters for the study areas liesin a large range, of 0.0005 to 55.5 Bq/1. The data approximates to alognormal distribution within a statistical probability of 95% (« =0.05)for most areas with a single exception, i.e. geothermal waters. TheKolmogorov-Smirnov goodness-of-fit test also supports this observation.Hence the arithmetic mean "x", cannot be used reliably for characterisingthe central value of the data distribution. Taking the median x as thecentral value of choice, some conclusions can be drawn. They are:(a) The 226 concentrations in groundwaters are increasing in theorder of:
Brazil < Grants < GeothermalTexas <Florida < Yeelirrie < Florida-Sarasota.
(b) Within a narrow range of concentrations, from 0.0059 to 0.0139 Bq/1,are Brazil, Grants and Geothermal; these are followed by Texas andFlorida with 0.0444 and 0.0518 Bq/1 respectively. The two areas with thehighest 22^Ra concentrations are Yeelirrie and Florida (Sarasota), at0.303 and 0.381 Bq/1 respectively.
3.3. SURFACE WATERS
3.3.1. Baseline 22"Ra Levels in Surface Waters in Some Mining Areas
Surface Waters, unlike ground waters are the immediaterecipients of land run offs, industrial and municipal effluents,residuals from agricultural applications of fertilizers, pesticidesetc. At the same time they are also sources of nearly unlimitedpotential for human usage such as in community water supplies,agriculture, industry, transportation, recreation etc.. However with therising population and growing industrialisation many waterways are beingincreasingly polluted carrying a variety of pollutant loads and toxicmaterials.
The surface streams play a vital role in the biogeochemical cyclingof many essential and toxic elements in the environment. In view ofthese and with the aim of carrying out radiation exposure assessments of
62

the population, surface streams monitoring has received considerableattention in uranium mill environment studies, particularly withreference to Ra. However there is still paucity of background Ra datafor non-polluted surface waters. Wherever such data exist they are few,from site specific studies and usually are available, while describing apre-operational situation of a projected uranium mining operation. Someof these data coming from Brazil, Australia and Yugoslavia are given inTable 3.3. Examples of frequency distribution for two of the three datasets are given in Fig. 3.5 and 3.6.
3.3.2. Discussion
concentrations of Brazilian river waters in the vicinityof uranium mining area at Pocos de Caldas have been measured as abaseline study in 1977-78 (Paschoa A.S. et al., 1979). Theconcentrations are within a range of 0.0074 to 0.222 Bq/1. But in mostof the river water samples, 26 ievels were generally under 0.037Bq/1 with the exception of small streams, originating in the region ofexploratory uranium mining where the 226Ra concentration was 1.1 Bq/1.Limited seasonal studies did not appear to show much variation in Raconcentrations in these waters.
The Yugoslavian data, also part of a baseline study conducted in1977, come from the surface waters of Sava River and other minor riversin the region of Slovenia, the site of an explorative uranium mine at2irovski Vrh (Kobal I., et al., 1978). The 226Ra levels are in therange of 0.00037 to 0.115 Bq/1 in the surface waters of the area.These values are comparatively lower than 226Ra concentrationsgenerally observed in surface waters in the region of uranium depositselsewhere. Negligible contamination of Sava river is concluded from thestudy. The Australian studies relating to the Alligator Rivers area ofthe Northern Territory Uranium Province (Davy D.R. and Conway N.F., 1974)show 226 3 concentrations in surface waters in the range of 0.0033 to0.3 Bqhl. The central values are also very much above the Brazilian andYugoslavian data. Ra levels tend to rise during the dry season but morestudies are needed to draw meaningful conclusions on seasonal variations.
Although the areas of study as well as the number of samples are fartoo few for surface waters compared with ground waters, a statisticalanalysis has been attempted. A reference to Table 3.3 with median valuex as the choice parameter, shows that Yugoslavia has the leastconcentration, followed by Brazil and Australia. The Brazil valueperhaps ought to be much closer to Yugoslavian figure than it appears,but the situation lacks clarity, because of the higher detection limit of0.0074 Bq/1 in the Brazilian data; again the Australian data have some ofthe highest concentrations.Some of the background measurements in the Jaduguda and Alwaye surfacewaters in India, show dissolved 226 concentrations in the range of0.005 to 0.07 Bq/1 respectively (lyengar M.A.R. and Markose P.M. 1970,Paul A.C. et al 1978).
In the context of investigations on natural distribution of Ra insurface waters in general and not bound with any site specific industrialor technological activity, the case study of Miyaké et al (1964) inJapanese rivers is of considerable value. The study involved ten riversspread over four Japanese islands, namely Hokkaido, Honshu, Shikoku and
63

Kyushu, and was aimed at measuring U, Ra and Th distribution in riverwaters with a view to understand their geochemical cycles. The studyyielded Ra concentrations In the range of 0.0014 to 0.0051 Bq/1. Theweighted mean of 0.003 Bq/1 for Ra in Japanese rivers, according to theauthors, does not appear greatly different from the mean value of 0.0026Bq/1 reported for continental rivers. The result showed further thatradium content of the river waters is equivalent to only 34 percent ofthe uranium supported radium in the equilibrium state. However slightlyenhanced dissolved Ra concentrations were observed in river waters fromgranitic region, as compared with those from regions covered by volcaniceruptives.
_In_conclus_ion, surface waters display a more regulated and a narrowrange of~ °Ra concentrations unlike ground waters, where theconcentration spread is fairly large. In addition ground waters in manyregions are rich in Radon concentrations posing problems of humanexposure. High concentrations of 230xh, 210p|>t and 210pOj otherimportant members of uranium decay series, are also not uncommon incertain ground water supplies.
3.4. STREAM SEDIMENTS
3.4.1. ßg Distribution and Movement Behaviour in Stream Sediments
In a natural stream environment, many dissolved elements, includingsome of the toxic trace metals, tend to associate themselves with theparticulate phase, by a process of sorption on the settled or suspendedparticulate materials normally present in the stream. The mechanism bywhich this is brought about can be broadly termed as processes ofadsorption, exchange, and coprecipitation. The rapidity and efficiencywith which this takes place depends, apart from the physico-chemicalbehaviour of the element in question, largely on the characterisation onthe particulates existing in natural stream conditions. In general thestream particulates can be categorised as detrital, authigenous, andbiogenous following their origin; and under naturally obtaining streamconditions, each of the above type of sediment material normally presentin various proportions, displays a certain sorption capacity for a givenelement. A sum total of their capacity for the uptake of a specificelement is normally reported as the Kd factor for a stream environmentunder study, which is the ratio of concentration of the element in theparticulate material and in the water medium.
However in most water bodies there is a certain degree of equilibriumbetween the dissolved and particulate elemental forms. Therefore a studyof the particulate associated element is of considerable importance inunderstanding the nature, behaviour and movement of the element ofinterest. In case of radium, it has been the general experience that thestream sediments account for a substantially large fraction of Ra in thestream environment, in the vicinity of uranium mining and millingoperations. Here the ore tails following uranium recovery, are led intolarge impoundment basins and in course of time, there is a gradualseepage of 226 aruj other radiotoxins into the nearby flowing streamsboth in the dissolved and suspended forms. The finely suspended
64

material, which is relatively rich in Ra, compared to the coarsefraction, eventually settles down in the lower reaches of the river incourse of time. The Ra present initially in the dissolved state alsotends to adsorb on to the suspended or settled particulates, and undermost natural stream conditions this takes place quite effectively, thusmaking the stream sediment as the major reservoir of Ra reaching theaquatic environment.
In the ecological context and with reference to the populationexposure, the sediment phase offers an effective medium for the transferof radium up the food chain. The bottom sediment environment providesthe ideal habitat and food requirements for aquatic biota, such as clams,prawns, crabs, and certain types of fishes. The degree and state ofenrichment of Ra in the sediment may be expected to reflect in the tissueconcentrations of Ra in these organisms. Some of the results of streamsediment studies from Australia, Belgium and India are summarised in Fig.3.7. (Dafy D.R. and Conway N.F. 1974, Kirchman R. et al 1979, MarkoseP.M. et al 1978, Paul A.C. et al 1978). The Kd factors, from theAustralian and Indian data are given in Table 3.4.
3.4.2. Discussion
The range of 226 concentrations in different geographiclocations appear to be more or less in a uniform range, with exceptionalvalues where contamination sources are present. Briefly the 226contents of the stream sediments given in Fig. 3.7. are:
Jaduguda, India: 0.015 - 2.0 Bq/gPeriyar River, Alwaye, India: 0.001 - 1.5 Bq/gAlligator Rivers, Australia: 0.001 - 0.093 Bq/gMonsin, Belgium: 0.033 - 0.452 Bq/g
The data however consists of both background and operational data,particularly from India. Hence the maximum values here should beregarded as technologically enhanced concentrations due to mining andmilling activities. The Kd factors are in the range of(0.03 - 1.57) x 103 for Australia and (5.4 - 7.1) x 103 forJadaguda. However the Australian data belongs to two different types ofwater environments, but the data do not indicate any significantdeparture between them. Tsivoglou et al (1964) after analysis ofin hundreds of stream sediments of Western United States, found thenatural distribution of 226Ra in these sediments as 0.059 Bq/g. Inview of the consistent data, the study concluded that stream sedimentscould play a very sensitive role as pollution indicators of riverstreams, in uranium mill neighbourhoods. Kirchmann (Pers. Comm.) hasreported that in the Albert Canal of Belgium, upstream 226concentrations in bottom sediments ranged from 0.015 Bq/g at 0-10 cmdepth to 0.011 Bq/g at 40-50 cm depth.
3.5. BIOTA
3.5.1. Fishes
In view of the widely differing Ra activities in waters in arange of aquatic environments, highly fluctuating Ra concentrations canbe expected in the resident biota of such waterbodies. Among the various
65

samples of biota normally examined, fishes have an important place ofinvestigation for two reasons. Firstly, fishes occupy a higher trophiclevel in an aquatic ecosystem and therefore their tissue Raconcentrations may be expected to reflect a cumulative series of eventsin the movement of Ra through the aquatic food chain leading to eitherits gradual accumulation or discrimination, at the higher trophic level.Secondly fish constitutes one of the very important components of humandiet and therefore a study of Ra distribution in fish tissues is of vitalsignificance in evaluating the radiological exposure of the population.
226 3 contents of a variety of fish species mostly fromfresh-waters, from the study regions under this programme, are presentedin Table 3.5. For comparison however 226ßa levels in a nearshoremarine environment are also included.
In these studies there appears a wide range ofconcentrations. For muscle, it ranges from 0.019 to 5.9 Bq/kg (wet),and for bone from 0.55 to 51.8 Bq/Kg (wet). Tissuewise however bonedisplays higher concentration levels which is understandable consideringthe analogous behaviour of Ra with Ca. However, whether the differencesin the activity levels among the samples from the same study region couldbe attributed to temporal, seasonal or species factors, needs elucidation.
As part of this study, an investigation conducted at Jaduguda, India,shold be of interest in understanding the concentration of 226ßa ^n asingle fish species, in a steady stream environment over an extendedperiod of time, i.e. about a month. Having observed that a particulartype of fishes of Ophiocephalus sp. were inhabiting the mine waterstream, wire mesh screens were placed 200 metres apart at the streamlocation, to restrict the movement of fish within this area, but withoutinterfering with the natural flow characteristics of the stream.Periodically samples of the fish species were drawn from the area andanalysed for their muscle and bone 226ga concentrations. Analyses ofsix catches of the fish species carried out during the month-long studyare given in Table 3.6.
The results demonstrate an interesting range ofconcentrations obtained under natural field conditions; Muscle from 2.6to 7.9 Bq/kg (wet); bone from 20.6 to 39.8 Bq/kg (wet). However the moststriking aspect of the data is the ratio of Ra content in bone andmuscle, which remained remarkably constant in a narrow range of 5 to 6.1,barring a single case, where it was 7.9. The concentration factors alsoappear to be in a reasonably close range, for muscle they vary from 5 to15 and for bone from 40 to 77.
Similarly, a study has been carried out in Australia to observe thepattern of 226 accumulation in fishes under premining and postminingconditions. The results are given in Table 3.7. The data reportedhowever do not bring out any marked contrast between the two situations.Speaking of intraspecie differences for Barramundi, there is a wide rangeof concentrations tissuewise, in both the operational situations. As awhole there appears in general, relatively little enhancement of 226gain the fishes in the postmining phase. This is to be attributed to thepractically very little change in dissolved 220Ra concentrations in thestream waters. The range of concentration factors are quite wide;premining: 11 to 350; postmining: 36 to 646. There appears a slightlyhigher concentration level of 22oRa for the Black Bream, but the datais meagre for a definite inference.
66

Because Ra and Ca are chemically similar, a study of the Ra/Ca ratiosin the environment and in fishes would be of considerable interest. DeBortoli et al (1972) have studied 226Rg distribution with respect to Cain fishes of some of the lakes in Italy. The data are reported in Table3.8. Considering the movement of Ra in the biological chain, the ratioof Ra concentration relative to Ca should be independent of somevariables which affect the absolute concentration ratio, thus reflectingthe very biological discrimination of Ra against Ca. In this context,the observed ratio, O.R., has been found to be useful. By definition:
O.R. = (Bq/g Ca in sample)/(Bq/g Ca in precursor).
In the above study, the O.R. between fish-water is 0.20, which isderived as an average of four lakes and whose range is pretty large, 0.09to 0.31. It seems therefore that the fish-water concentration factor isrelated to the Ca concentrations in the different lakes. Thiscorrelation is shown in Fig. 3.8, from which it is observed that lakeMonate deviates markedly from the other three lakes. A correlationcoefficient of 0.998, makes the study significant at an OC =0.05probability level. For comparison purposes, 90gr data taken fromanother study (Gaglione P., et al., 1969) are also shown in the samefigure.
As the available fish data come largely from a mixture of pollutedand non-polluted environments no precise conclusions could be drawn aboutthe natural level of 226 distribution in fishes.
3.5.2. Algae and Plankton
3.5.2.1. _Alga£Of the various biological media useful in environmental
monitoring, algae offers itself as possibly one of the most sensitivebio-indicators in studying stream pollution situations. With theexception of stream locations where the physical and chemical conditionsof the stream do not support the growth of algal mass, in most situationsit is relatively easy to locate and sample algal material for studyingthe pollution status of the stream. Among the various stream biota,algae has a unique quality in that it concentrates from the medium,primarily the dissolved form of the element under study. In manypollution monitoring requirements, with a view to control public healthhazards, the permissible standards are based on the actual dissolvedconcentrations of the toxic element. The property of algae inconcentrating mainly the dissolved fraction of the pollutant nuclidewould be of considerable significance and advantage in pollutionassessment and control measures in uranium mining and milling activités.
Among the early studies, Tsivoglou et al (1964) used filamentousalgae in monitoring the Animas River radioactivity In the vicinity ofuranium mills at Colorado, U.S.A. 226&a concentrations of the order of0.148 Bq/g of algal ash were recorded for uncontaminated streams whilstconcentrations as high as 129.5 Bq/g of algal ash were observed for thepolluted locations of Animas river, which showed concentration potentialof algae of a high order for "6 f Following this, uranium millenvironment studies in general have utilised algae radioactivity to serveas a useful indicator of the environmental Impact from uranium milleffluent discharges.
67

Results of one such study from Jaduguda, India, is given in Table 3.9(Markose P.M. et al 1978). From the data one could observe widelydiffering 226Ra concentrations in the algae as well as in the streamwater, depending upon the proximity of the location with respect to thetailings pond effluents or minewater stream which are the sources 226Rain the stream environment. It could generally be seen that there is agradual fall in 22*>Ra concentrations in algae as one proceedsdownstream with a corresponding fall in 22°Ra concentrations in thewater medium. The concentration factors (CF's) calculated for eachsample location are also given in the table. These CF's are found to bein a reasonably good range of 800 to 3100, which are in general agreementwith those of Tsivoglou, et al., (1964) i.e. 500 - 1000. Theserelatively high concentration factors (about 103) serve to demonstratethe role of algae, Spirogyra sp. in particular, as a good indicator of Racontamination of the aquatic environment.
3.5.2.2. P.lanktp_n_Since plankton constitutes an important component of mussel's
diet, 22°Ra concentrations of plankton would be of significance.22^Ra levels in the nearshore marine plankton have been studied atKalpakkam, India, and the results are as follows:
Sample type
Phytoplankton( composite )
Zooplankton( composite )
22*Ra inPlanktonBq/Kg (wet)
1.32
1.55
WaterBq/1
0.0016
0.0016
ConcentrationFactor
(CF)
825
968
Kirchmann, et al., (1973, 1971) have reported a concentration figure of2.78 Bq/g (wet) for 22"Ra in plankton in the Tessenderlo region ofBelgium. However the 22 Ra concentrations in these fresh waters arereported in the range of 0.040 Bq/1 - 1.0 Bq/1. Accordingly the CF worksout to 2775 - 6820 which is much higher than observed in the marinelocation at Kalpakkam.
Since phytoplankton are primary producers and have a highconcentration potential for many toxic trace elements, more data areessential in elucidating their role in the migration of Ra in the aquaticenvironment.
3.5.3. Aquatic Macrophytes
Aquatic macrophytes are aquatic plants characterized by a highorder of metabolic activity. It was seen earlier in the Indian studythat certain types of algae display a high degree of uptake of 22°Rafrom ambient waters with concentration factors of about 103. It wouldbe therefore interesting to examine the 22°Ra activity concentrationsin the aquatic macrophytes and assess their potential for a possible role
68

in environmental investigations on the migration of Ra. However, withthe exception of some data from Belgium and France, information on thisclass of biota is sparse. Kirchmann et al (1973) have reported 226ßalevels in some of the aquatic macrophytes from Tessenderlo region ofBelgium:
Sparganium: 6.66 and 40.7 Bq/g (dry)Callitriche: 14.8 Bq/g (dry)Ranunculus aquatilis: 7.4 Bq/g (dry)concentrations in the Tessenderlo waters are reportedly
between 0.41 and 1.0 Bq/1. In the absence of the water content data andthe corresponding fresh weights for these samples the actualconcentration factors, cannot be derived. However in a similar study on
Callitriche species carried out in France (Progress Report to IAEA, 1977)was found to be 49.95 Bq/g (dry) or 1.41 Bq/g (wet) and with aconcentration of 14.06 Bq/1 in water, the concentration factor
was calculated to be 100. Applying this dry to wet ratio on the Belgiandata, one can obtain the concnetration factors for the above threespecies as follows, assuming an average water concentration of 226 a as0.7 Bq/1:
Sparganium (a) 266 (b) 1628Callitriche 592Ranunculus aquatilis 296
A comparison of these concentration levels and concentration factors(CF's) with the earlier algal data tends to show generally a lower Rauptake capacity of the aquatic macrophytes. However with CF's in therange of 266-1628, these macrophytes could be still useful inenvironmental surveillance in addition to or in the absence of othersamples of biota.
3.5.4. Molluscs
3.5.4.1. £_ _Ra_ ^l^tribution_char_acteri_s_ti£s_in marine_and_f resh_watermollu_sc_s_Among the aquatic fauna, relatively higher radioactivity
concentrations are observed in general in shell fishes, when comparedwith fishes. This phenomenon of higher activity incorporation may be dueeither to their special food habits or some characteristic concentratingmetabolic properties or by an active combination of both processes.Hence the shell fish has found increasing utility in environmentalradioactivity measurements. For instance in the UK studies at BradwellNuclear Power Station, oysters were found to be extremely usefulindicators of ^^Zn in the aquatic environment, with a concentrationlevel of 0.166 Bq/g (wet), (Mitchell, 1969). Oyster sampling is nowroutinely used for monitoring many reactor environments for radioactivitydue to 65Zn, 32P, 110mAg, 55Fe, etc.
3.5.4.2. Dls_cuss_ion_
However, there is possibly little information on the naturalradioactivity in shell fishes particularly in a freshwater environment.In this context the Australian data of Conway, Davy et al (1974) is ofconsiderable interest. The results are part of a study in the Alligator
69

Rivers area of the uranium province in northern territory. Arepresentative cross section of these data is given in Table 3.10. Avery wide range of 226 concentrations from (1.1 to 165.8 Bq/kg, wet)and concentration factors of 10 to 12100 are observed. However the highdegree of scatter in the data points to factors other than merelyenvironmental concentration of Ra- The analyses did not also demonstrateany conclusive evidence of discrimination of Ra in the organism duringthe matabolism of Mg and Ca.
The nearshore marine environment is a familiar habitat for manyaquatic organisms including mussels, clams, snails, etc. commonly groupedunder mulluscs. The natural distribution of 226jja n these organismswould be interesting to study. Some of the data from the Kalpakkamenvironment in India are given in Table 3.11.
It is observed from the presented data that, in comparison withfreshwater data from Australia, the 26ga levels in these organisms arein a narrow range; soft tissues range from detection limit to 0.10 Bq/kg(wet); shell, from 0.25 to 1.12 Bq/kg. The concentration factors arealso in a close range, particularly in the case of soft tissues, from 46to 63. This may possibly be attributed to the highly steady 226jjalevels normally existing in the waters of a marine environment. Theshell expectedly accumulated more Ra due to its higher Ca uptake. Ratiosof Ra in shell and soft tissue vary from 2.5 to 10.
3.6. CONCLUSIONS
Whilst the "Oj ieveis are low for surface waters and lie ina relatively narrow range of concentrations, the ground waters display awide range, even of a higher activity order depending upon the sourcecharacteristics in the region of study. 26 distributions in thestream matrices - sediment and biota, were found to be of considerableinterest as a majority of the samples showed high concentration factorsin a range of environments. The stream sediment was found to beparticularly useful in detecting stream pollution from uranium milleffluents. Among the biota, the algae Spirogyra Sp exhibits aremarkable concentration potential for bRa (CF: 800-3100) and thuscould serve as a highly useful indicator species for environmentalradium. Other samples of biota like mussels, fish, aquatic macrophytesalso appear to possess good monitoring qualities.
However the information presented here is a small cross section ofthe available data and is neither complete nor adequate formenvironmental modelling and dosimetric considerations. Such an attemptrequires a reasonably large body of data collected by a number oflaboratories using mutually comparable methods of sampling, analysis anddata evaluation. In this context the following suggestions may be worthyof consideration:1) The natural distribution data for 226 are comparatively few andneeds reinforcement for a variety of environmental media from differentenvironments, to make baseline exposure evaluations realistic.
70

2) The data coming from operational investigations have served well inhighlighting the contamination aspects of many an ecosystem,demonstrating the interesting Ra uptake behaviour of some species ofbiota. Besides studying these species more intensely, attention shouldbe directed to other additional varieties of flora and fauna, specific toeach aquatic environment, to obtain an intimate understanding ofenvironmental concentration pathways. The contaminated stream situationsnear uranium mills and tailings dams, and the contiguous backgroundregions, should provide excellent opportunities for these studiessupported by control experiments in the laboratory, towards a betterunderstanding and evaluation of the ecological parameters.3) In addition to 226Ra, other nuclides of importance such as 228Ra-particularly in high natural background areas - 230Th, 210Pb,210PO) 222 u (nat), Th (nat), etc., should be also investigated onsimilar lines to get a comprehensive coverage of the environmentalnatural activity as a whole for a proper avaluation of environmentalradiation exposures.
Table 3.1. Ra in Groundwaters-Study Areas
Area of study Purp'ose of study
1.
2.
3.
4.
5.
6.
7.
Grants Mineral Belt areaNew Mexico, USA (Eadie G.G.and Kaufmann, R.F., 1977)
Geothermal waters in theWestern United States(O'Connel M.F. and KaufmannR.P., 1976)
Brazilian mineral waters(Hainberqer P.L., et al, 1974)
Uranium mining and milling activitiesevaluation of possible radioactivecontamination of groundwater supplies due to226Ra, 230,'Th, 210Po.Radiological evaluation of geothermal springsand wells for identifying potential environ-mental or health effects, following large scaledevelopment for energy, recreation, mineral recoveryor agriculture.Radioactivity measurements for Ra and Raactivities in mineral waters from various partsof Brazil, to study natural activity levels.
Florida, USA West-Central Florida is a major centre of phosphate(Kaufmann R.F. and Bliss J.D. 1977) production in USA. Study aim was to relate Ra con-
centration in groundwaters with phosphate deposits,including their mining and processing activities.
Florida, Sarasota Extension of the same study as at No. 4(Kaufmann R.F. and Bliss J.D. 1977) but the site location is at the extremesouthern end of the Central Floridan phos-
phate district.Texas (Wukash M.C. andCook L.W. 1972)Australia. Yeelirrie, WesternAustralia.(Giles M.S., 1978)
Uranium mining and milling region of South Texas;study of impact on ground water supplies.Part of the baseline study in the environment ofuranium deposits at Yeelirrie, Western Australia.
71

226Table 3.2« Data Summary of Ra Distribution in Ground Uaters»
Parameter
Number of Values,Range ( m Bq/l) :MinimumMaximumCentral Values '•( m Bq/l)Median "x"Geometric mean xçArithmetic mean "x
Grants
(N)72
1.851961.0
9.8113.957.4
Geotharmal,Uestern USA136
1.5255500
13.8829.17870.97
Brazil
268
0.523481.7
5.927.4878.85
Florida
246
02812.0
51.813.998.03
FloridaSarasota49
55.5902.8
381.1326.79406.02
Texas
24
11.16290.0
44.470.6679.4
AustraliaYeelirrie53
18.533374.0
303.4367.252293.7
Confidence Intervals:(oC-0.05) (m Bq/l)of the,MedianGeometric mean
Arithmetic mean
7.4-13.6910.12-19.072.63-112.18
9.99-22.5719.62-43.420.86-1721.08
4.07-7.45.91-9.4634.29-123.41
44.4-64.7536.92-51.1669.99-129.30
270.1-458.8 (b)265.78401.8335.6476.5
(b)31.56-157.945.79-1404.6
133.2-540.2314.17-629.7759.5-3827.9
Shape of Distribution;Skeuneaa g1Kurtosis 92
7.7304363.48997
9.91398107.1287
8.0997371.341
8.4121788.09111
0.53B672.28209
2.53017.80B18
4.0569421.09286
Type of Distribution (a) :NormalLognormal
_+
_-
•*•
+_+ (c)
•f+
-+
-—
a) Analysis by Kolmogorov-Smirnov test, +• positive, -: negativeb) N 'b) N < 50, hence not reliable.c) Calculated after omitting 4 zero values.
72

Table 3.3. Data Summary of 226Ra Distribution in Surface Waters
Parameters
Number of Values, NRange (m Bq/1)MinimumMaximum
Central Values(m Bq/1)Median, *)TGeometric Mean, XQArithmetic Mean, x*
Confidence Intervals(«t=O.O5) (m Bq/1)for theMedianGeometric MeanArithmetic Mean
Shape of DistributionSkewness g^Kurtosis 92
Type of Distribution (NormalLognormal
Brazil(Pocos de Caldas)
78
7.4222.0
7.414.5228.13
7.4-11.111.61-18.1618.06-38.19
2.78221O.289O
a)-™
Yugoslavia(Ziroski Vrh)
32
0.37114.7
1.481.916.31
O. 74-4. 071.02-3.580.885-13.51
5.232428.9367
+
Australia(Northern Terri tory)
82
3.33314.5
27.5629.2252.49
20. 7-37. O22.88-37.3238.52-66.44
2.292O8.6298
+
a) Analysis by Kolmogorov-Smirnov Test, + : positive, -: negative.
73

Table 3.A. 226Ra Concentration in Stream Sediments
Area
Australia:Sawcut Creek
n n
n M
GeorgetownBillabong
N
II
India: •Jaduguda, Jurianala, downstreamUranium mill.
n
Gara River bed.downstream
Water(m Bq/1)
0.059O.O1150.0137
O.O481O.13O0.034
ofO.3O0.11
O.O22
Sediment(m Bq/g)
92.55.21.9
15.54.416.7
2038.0784
118
Kd
1.570.45O.14
0.32
factor
x 103x 1O3x 1O3
x 103O.O34 x 1O30.49
6.87.1
5.4
x 103
x 103x 103
x 103
226,Kd factor: '""Ra concn. in sediment (m Bq/g)226.——————————————————————Ra concn. in water (m Bq/1)
74

Table 3.5. Ra-226 Distribution In Fishes
S. No. Description
(1) (2)
BELGIUM:Fish from River Meuse
1 Bream
2 Barbel
3 Trout
INDIA:
Jaduguda, Blhar:
4 Catla Catla(Subarnarekha river)
5 Labeo rohita6
7 Fish (species not indicated)from mine water drains
8
Alwaye, Kerala:
9 Ghana (ophiocephalus sp)upstream of industrialoutfall area
10 Clupea longicepsIndustrial outfall area
11 EtroplusIndustrial outfall area
12
Kalpakkam, Tamil Nadu:13 Sole14 Mackerel15 Oil Sardine
* Eviscerated Whole(3), (4), (5) relates to wet weights
Soft Tissue(Bq/kg)
(3)
7.62*1.77*2.83*
0.2
0.0190.03
2.96
5.9
0.074
0.37
0.240.15
0.0790.170.19
Bone Bone(Bq/kg) SoftTlssue
(«) (5)
---
12.95 64.8
0.55 28.9
0.56 18.7
51.8 17.536.26 6.1
0.703 9.5
0.89 2.4
4.26 17.88.54 56.9
0.55 7.0-
0.91 4.8
75

OOfiTable 3.6. Ra Distribution in Ophiocephalus sp.,
Jaduguda, India
Catch No.
123456
226Ra Concentration (Bq/kg, wet)Muscle
2.596.05.597.927.515.55
Bone
20.5736.1833.8539.7737.7734.11
RatioRa, in bone
2 n £Ra,in muscle
7.96.06.15.05.06.1
Cone. Factor(CF)
Muscle
51111151511
Bone
4o7065777266
i 2 ? fiA number of Ra analyses of streamwater have given an average concentrationof O.518 Bq/1, on the basis of which the cone. factors have been derived.
Table 3.7. 226Ra Distribution in Fish Muscle,
Australia.
Fish Species Pre-mininq dataTissue(Bq/kg, wet)
Barramundi O.9250.370.1852.592.598.51
11
n
Black Bream 2.963.7
H _
Water(Bq/1)
0.0136O.O34O.O1O.OO740.0170.1095
O.O410.03—
Concn.Factor(CF)
68111935015278
72123—
Post-mininq dataTissue( Bq/kg , wet)
4.444.07O.370.372.220.370.7412.95
3.332.963.7
Water(Bq/1)
O.O888O.OO63O.O103O.OO63O.OOB90.00630.01720.0294
O.OO74O.O405O.O296
Concn.Fator(CF)
5064636592495943440
45073125
76

Table 3.8.226Ra Concentrations in Lake Water Fishes, Perça Fluviatilis, L.,Italy.
Area/Sample Ra-226 Concentration (Bq/1 or Bq/kg (wet),Arithmetic mean and range ( Bq/g Ca*)
Cone. Factor(CF)
Lake maggioreWaterFishLake VareseWaterFish
Lake ComambbioWaterFishLake monateWaterFish
O.OO052 (O.OOO19-O.OOO74) O.O270.1184 (0.1073-0.1295) O.OO85
O.OOO74 (O.OOO7-O.OOO78) O.O226O.O518 (O.O481-O.O518) O.OO37
O.OOO56 (O.OOO52-O.OO056) O.O2180.0777 (0.0629-0.0888) O.O052
O.OOO52 (O.OOO44-O.OOO89) O.O5180.0666 (0.03626-0.0814) O.OO44
228
7o
139
128
Ca concentrations are derived average concentrations of a number ofSamples analysed by the authors.
226.Table 3.9. Ra Concentration in Algae, Spirogyra sp.
Jaduguda, India.
226 226Location Ra in Algae Ra in water Cone Factor(Bq/kg, wet) (Bq/1)
Tailings outfall 8928.1 5.o3Stream
7424.8 2.86Mines stream 3169.8 1.22Juria Nala 2kmdownstream oftailings outfall 2061.6 O.67Gara Nala 2.7 kmDownstream oftailings outfall 473.23 O.58Gara Nala 3.25 kmdownstream of ,tailings outfall 251.23 O.ll
1.77 x 10³
2.6 x 1032.6 x 103
..3.1 x 10J
..O.82 x 1O
,2.3 x 10J
77

Table 3.10 Ra-226 In Freshwater Mussels.Alligator Rivers, Australia
Location
1-196535
2-196486
4-812269
3-680997
3-599762
3-599762
3-599762
3-752975
3-752975
2-843924
Ra-226 Concentrations InMussel Water(Bq/kg) (Bq/1)
12.2
2.6
165.8
5.2
56.6
2.2
3.3
71.0
1.1
18.1
0.0178
0.0681
0.0137
0.2257
0.037
0.0096
0.0389
0.3127
0.111
0.0174
Cone. Factor(CF)
685
38
12100
23
1530
230
85
227
10
1040
Table 3.11 Ra-226 In Nearshore Marine Molluscs,Kai pakkam, India.
Ra-226 Concentration InDescription Molluscs Water
(Bq/kg, wet) (Bq/1)
Oyster, Ostrea sp.a) soft partsb) shell
Green musselPerna vtridlsa) soft partsb) shell
Clam Meretrix sp.a) soft partsb) shell
Snail, Thais sp.a) soft partsb) shell
Snail,Petal la radlataa) soft partsb) shell
0.080.80
0.0740.67
ND1.12
0.100.25
0.070.41
0.00160.0016
0.00160.0016
0.00560.0056
0.00160.0016
0.00160.0016
Cone. Factor(CF)
50500
46419
200
63156
44256
ND : Not Detected
78

140
120
80
40
0
280
240
160
80
0
u 42 -
•
0
36 -GEOTHERMAL
24 -
»2 -
^ ^i _____ i ___ — t 020 40 60
70
BRAZIL go(VARIOUS)
40
20
21AUSTRALIA ,8
(YEELIRRIE)
12
6
fci • » i — i 00 12 24 36
210
GRANTS 180
120
60
• ——— 1 ————— m_ 0
•
-
'.
TEXAS
i >• l • •0 1-5 3 4-5 6
14
FLORIDA 12
8
La —— H ————— 1 ——— 0
FLORIDA. _ SARASOT
M
I0 0-5 1
Fig. 3.1 Frequency distribution of Ra-226 in some ground-waters,[Geothermal (Western states, USA), Yeelirrie (WesternAustralia), Texas (USA), various sources (Brazil), Grants(New Mexico, USA), Florida (USA), Sarasota (Florida, USA)](X axis = Ra-226 in Bq/1, Y axis = frequency in %).
79

1090e
1000
X X
188
ie
Fig. 3.2 Lognormal plot of Ra-226 concentrations relative in Grantsgroundwaters (New Mexico, USA) [X axis = relative frequencyin %, Y axis = Ra-226 in mBq/1].
80

10e
28
node I(a) Grants (New Mexico, USA),
28
12
(d) Sarasota (Florida, USA),
node 1
node 2 node 3node 4T T T node 6
nod« 3m0 200 400 «88 888 1000 1200 1400 1£00 1800 28M • 180 208 388 488 388 600 700 600 908 1008
188 nom i
88
68
28
(b) Geothermal waters (Western USA),
nod« 2
100
88
68
28
0 7000 14008 21080 28080 33888 4288e 49898 36888
nod« I
,32e
(e) Texas (USA),
node 2m .
node 3 nodem . m
396e <«„ S28e „«„
100
60
48
node 1
(c) Various sources of Brazil,
nodc2
98
72
34
36
18
node I
(f) Yeelirrie (Western Australia)
nod« 2__, PH "Z* 3 nod* 4 nod«14 J_ i t i i i i i « i • * » * * * 'i1
8 400 000 1280 1688 2000 2408 2080 3208 3688 « 3£ae 7288 18800 14408 18000 21608 23200 28800 32488 36888
Fig. 3.3 Relative frequency distribution of Ra-226 concentrations insome groundwaters (X axis = Ra-226 in mBq/1, Y axis =relative frequency in %)
81

10-
10-
20 80 95 96
Fig. 3.4 Lognormal cumulative frequency distribution for Ra-226 in hotsprings in Northern California, USA (from O'Connel M.F. ,Kaufmann R.F., 1976) [X axis = cumulative frequency in %, Yaxis = Ra-226 in pCi/1].
82

58
40
10
Fig. 3.5
90 120 150 180 218
Frequency distribution of Ra-226 concentrations in surfacewaters of Brazil (Poços de Caldas) [X axis = Ra-226 in mBq/1,Y axis = frequency in %].
1000
100
10
98
Fig« 3.6. Lognormal plot of Ra-226 concentrations in surface waters ofNorthern Territory in Australia [X axis = relative frequencyin %, Y axis = Ra-226 in mBq/1].
83

24
20
16
12
8
4
0
ALWAYE —INDIA
8
6
4
2
ALLIGATOR RIVERSAUSTRALIA
0 8 12 1-6 0 002 004 006 008
8
6
4
MONSIN -BELGIUM
JADUGUDAINDIA
0 005 015 0-25 0-35 0-45
Fig. 3.7 Frequency distribution of Ra-226 in some stream sediments[X axis = Ra-226 in Bq/g, Y axis = frequency].
Fis
h-W
ater
C
once
ntra
tion
Fact
or(P
erca
fl
uvi
ati
lis,
L)
280
240
200
160
120
80
40
\ Strontium-90Ni \ Y04J-703X
>v \ (broken lineN \ and triangles)X \ rrO 989
- Radium -2 20 N \ l ———————— -1
- Y:460-1183X s\. (solid line and "\
circles ) A- r = 0-999 V^
'-^Excluded from \ N^the calculation \ NX
Monate Maggiore Comambbio \. . ». Var.se1 1 1 i 1 1 1 T l i
Fig. 3.8
5 10 15 20 25 30 35 40mgCa/l
Correlation between concentration factor of Ra-226 in fishesand Ca level in Italian lake waters (from De Bortoli M.,Gaglione P., 1972).
84

REFERENCES
BROWNSCOMBE A.J., DAVY D.R., GILES M.S., WILLIAMS A.R., "Ground waterquality in the general area of the Yeelirrie Uranium deposit", in ThreeBaseline Studies in the Environment of the Uranium Deposit atYeelirrie, Western Australia, Australian Atomic Energy commission,Lucas Heights. AAEC/E442 (1978).
DAVY D.R. and CONWAY N.F., "Environmental Studies, Northern TerritoryUranium Province in the Alligator Rivers Area, Fact Finding Study".Four AAEC reports, Australian atomic Energy Commission, Lucas Heights.AAEC/E305 (1974).
DAVY D.R., O'BRIEN B.C., "Radiological aspects in Rum Jungleenvironmental studies". (DAVY D.R., Ed) Australian Atomic EnergyCommission, Lucas Heights, AAEC/E365 (1975).DE BORTOLI M., GAGLIONE P., "226Ra in environmental materials andfoods". Health Physics, _22_ (Jan) (1972) 43-48.
DENHAM D.H., WAITE D.A., "Some practical applications of the lognormaldistribution for interpreting environmental data". 20th Annual HealthPhysics Society Meeting, July 14-15, 1975, Buffalo, New York pp. 31.
EADIE G.G., KAUFMANN R.F., "Radiological evaluation of the effects ofuranium mining and milling operations on selected groundwater suppliesin the Grants Mineral Belt, New Mexico". Health Physics 32, (1977)231-241.
GAGLIONE P., MOLLER F., POLVANI C., Proc. Symp. International deRadioecologie Cadarache, France, September 8-12, (1369).
GILES M.S., "Groundwater quality in the general area of the Yeelirrieuranium deposit", in Three Baseline Studies in the Environment of theUranium Deposit at Yeelirrie, Western Australia. (BROWNSCOMBE A.J.,DAVY D.R., GILES M.S., WILLIAMS A.R., ed). Australian Atomic EnergyCommission, Lucas Heights, AAEC/E442 (1978).HAINBERGER P.L., DE OLIVEIRA PAIVA I.R., SALLES ANDRADE H.A.,ZINDEL G., CULLEN T.L., "Radioactivity in Brazilian mineral waters".Radiation Data and Reports, 15. (1974) 483-488.,INTERNATIONAL COMMISSION ON RADIOLOGICAL PROTECTION, Report ofI.C.R.P. Committee II on Permissible Dose for Internal Radiation(1959). Publication 2. Pergamon Press.IYENGAR M.A.R., MARKOSE P.M., "Monitoring of the aquatic environmentin the neighbourhood of uranium mill at Jaduguda Bihar". Proc.National Symp. on Radiation Physics, Trombay, Bombay(1970) 473-484.
KAUFMANN R.F., BLISS J.D., "Effects of phosphate mineralisation andthe phosphate industry on ^2*>Ra jn ground water of CentralFlorida". Environmental Protection Agency, Las Vegas, USA (1977).EPA/520-6-77-010.
85

MIYAKE Y., SUGIMURA Y., TSUBOTA H., "Content of Uranium, Radium andThorium in River Waters in Japan", in the Natural RadiationEnvironment, Rice University, Houston, USA (1964).MITCHELL N.T., "Monitoring of the aquatic environment of the UnitedKingdom and its application to hazard assessment". (Proc. IAEASeminar on Environmental Contamination by Radioactive Materials,March 24-28, 1969) IAEA, Vienna (1969).
O'CONNELL M.F., KAUFMANN R.F., "Radioactivity associated withgeothermal waters in the Western United States: Basic data". U.S.Environmental Protection Agency, Las Vegas (1976) ORP/LV-75-8A.PASCHOA A.S., BAPTISTA G.B., MONTENEGRO E.G., MIRANDA A.C., SIGAUDG.M., "226Ra concentrations in the hydrographie basins near uraniummining and milling in Brazil". In Low level Radioactive WasteManagement, Health Physics Society Symp. Williamsburg (1979).
PAUL A.C., LONDHE V.S., PILLAI K.C., "228Ra and 226Ra levels in ariver environment and its modification by human activities". In theNatural Radiation environment III, Rice University Houston,USA (1978).SANSONI B., IYER R.K., KURTH R., "Concentration of analytical data aspart of data processing in trace element analysis". Fresenius Z.Anal. Chem. 306, (1981) 212-232.TANNER A.B., "Physical and chemical control on distributionof 222Rn in ground water near Great Salt Lake, Utah". In theNatural Radiation Environment, Rice University, Houston, USA (1964).TSIVOGLOU B.C., "Environmental monitoring in the vicinity of Uraniummills". Proc. of IAEA Symp. on Radiological health and safety inmining and milling of nuclear materials Vol. II, August 26-31, 1963,Vienna (1964).
TSIVOGLOU B.C., O'CONNELL R.L., "Nature, volume and activity ofuranium mill wastes", Proc. of IAEA Symp. on Radiological Health andSafety in Mining and Milling of Nuclear Materials Vol. II, August26-31, 1963, Vienna (1964).UNITED STATES ENVIRONMENTAL PROTECTION AGENCY. Drinking WaterRegulations (Radionuclides), Federal Register V. 41, No. 133,July 9, (1976), p. 28402-28409.WUKASH M.C., COOK L.W., "Environmental Surveillance in South Texas".In the Natural Radiation environment II, Rice University, Houston,USA (1972).
86

Chapter 4
TECHNOLOGICAL ENHANCEMENT
S.M. de JESUSAtomic Energy Board,
Pelindaba, Pretoria, South Africa

4.1. INTRODUCTION
One cubic metre of soil in somebody's backyard will contain onaverage 70 000 Bq of ^Ra whereas the gold/uranium tailings damsspread over the highly populated area of the Witwatersrand , in SouthAfrica, are estimated to contain some 2 500 TBq of 226Ra. High asthese figures may appear to be, put In the right perspective it willreadily be seen that the former corresponds to 0.037 Bq/g, which is themean radium concentration in the earth's crust, while the latter figurecan also be expressed as 3 000 million tonnes of tailings with a meanradium concentration of 0.8 Bq/g. In one case one has the naturalenvironmental situation where man has evolved since primordial times andin the other a more or less localised enhancement of radium brought aboutby man's technological activities.
Clearly, there are many sites of natural high radium concentrationssuch as hot springs and outcrops of uraniferous minerals, but theworldwide concern with the Impact which radium may have on environmentalwaters is more specifically directed at activities concerned with thenuclear fuel cycle, particularly the front end, i.e. the mining andmilling of uranium.
The expansion of the uranium industry since the fifties hasnecessarily given rise to a greater availability of radium capable offinding its way into surface and ground waters. With it came also agreater awareness, albeit slowly, of the potential impact whichcontamination of such waters could have on man, particularly because22^Ra is the most restrictive nuclide amongst uranium daughters from aradiological point of view [1], considering the food-chain pathways.
Until not too long ago, the demand for Ra, mainly for medicalpurposes, was such that in many processes where radium happened to bepresent as a secondary element it was economically advantageous toextract it. The picture has, however, changed drastically as radium has,in most applications, been superseded by more suitable radioisotopes.Radium is, therefore, considered as waste product to be disposed of onits own or in conjunction with other plant wastes.
Most investigations to date have, in the majority of countries,consisted of site-specific studies of relatively short duration,conducted during the operational phase and emphasizing the influence ofsurface discharge or subsurface seepage on water quality. Rarely arewater,, soil, stream sediment and biological samples collected in thep re -operational period for radiological analysis. And even when this isdone, assessment of risk due to technological enhancement is difficultbecause in most cases the difference between the natural radium levels inenvironmental waters and the slightly increased levels due totechnological enhancement Is relatively small. In the case of uraniummill tailings, for example, the volumes involved are usually large, sothat the options available to adequately isolate the tailings dams fromthe environment over very long periods of time compatible with thehalf-lives of the radiosiotopes involved become limited. Thus, one ofthe greatest problems facing the uranium mining industry In general isthat of control of radionuclides, particularly
89

4.2. SOURCE TERM
Technologically enhanced contamination of surface and groundwaters by radium is not exclusive to uranium mining. It occurs also as aresult of mining for certain base metals such as copper (India, SouthAfrica, USA) and tin (Cornwall, England); gold (South Africa); monaziteores and phosphatic minerals. Coals are also known to contain radium invarious concentrations, which could lead to the ash residues discarded atpower stations becoming enriched in radium.
The main sources of contamination of environmental waters are thefollowing:
(i) Plant effluentsGenerally, a portion of process waters enriched in dissolved andsuspended materials is discharged to the environment,
(ii) Solid wastesLeaching and/or seepage through the solid wastes can carryappreciable amounts of radium to the aqueous environment.Wind-blown dust is deposited over a considerable distance aroundthe solid wastes impoundment but this is not considered to be amajor contributor to the radium levels in water. Erosion couldalso be a problem, particularly in the long run.
4.2.1. Uranium
In underground uranium mining the solid wastes are deposited onthe surface, either as waste rock piles, sand dumps or slimes dams. Inthe case of open-pit mining the same procedure is often used, althoughthe trend in recent years, for hot and dry climates, is to refill themined areas with waste material and cover it with the original top-soil.However, this procedure may not be suitable for some mined areas insubtropical regions, where the original mining sites become lakesunfitted to be filled with the original top soil.
Whereas past practices of tailings management were in many casesinadequate, serious efforts have been made during the last few years byprivate and public sectors as well as the IAEA to find ways to improvethe design and management of tailings impoundments with the latesttechnology available, as reflected in pertinent symposia held recently[2, 3]. The general criterion has been to keep releases not only ofradium but also of other detrimental substances as low as reasonablyachievable.
4.2.2. Phosphates
£s known to occur in areas of phosphate mineralization asa result of the presence of uranium and its progeny. In the USA, forexample, the concentration of natural radium in phosphate ore minedranges from 0.2 to 10 Bq/g [4). The most common method of benef iciationis by treating the mineral with sulphuric acid to produce phosphoricacid. Whereas most of the uranium remains with the phosphoric acid theradium and its daughters are discharged with the tailings.
90

4.2.3. Coal
Uranium and its daughter products are often present in coal inrelatively low concentrations. While the coal remains unused there isusually little danger that radium will have any significant contributionto the contamination of environmental waters. However, during thecombustion process the radium concentration will increase substantiallyas it follows the ash fraction. For this reason, concentrations offly-ash, such as those which exist in the vicinity of conventional powerstations, could constitute a significant source of pollution ofenvironmental waters.
4.2.4. Others
Uranium and its decay products are known to occur fairlyfrequently as a by-product with minerals mined for their metal content.The relevance of such mining activities as a source of radium availablefor dissemination into the aqueous environment is essentially similar tothe case of uranium mining: uranium concentration, hydrogeologicalfactors and tailings management practices are the determinant factors.Plants used for the extraction of radium for commercial purposes, such asHoboken, in Belgium, also have a considerable influence on radiumconcentration in environmental waters as a result of the effluentsreleased. However, because this commercial activity has almost becomeobsolete, its future influence is expected to be small.
4.3. URANIUM MINING AND MILLING
The environmental pollution aspects of uranium mining andmilling are to a certain extent similar to those of other metal miningoperations. The unique feature lies on the emphasis that must be givento the radioactive releases experienced not only through the entire lifeof the mine but also for many years after cessation of operations.According to Swift et al [5], the solid tailings contain about 90% of allthe radioactivity present in the original ore. The extracted uraniumaccounts for the other 10%. From that radioactivity, generally less than1% of the radioactivity discharged from a uranium mill is in the tailingssolutions, with 99% or more within the solids.
4.3.1. Economic Aspects
Analogous to management of nuclear power stations, releases ofradium and other contaminants can be increasingly reduced at an everincreasing cost. This can be roughly quantified and the optimal pointdetermined on a cost—benefit bases. The difficulty lies not only inadequately quantifying the health impact of low radium concentrations butalso in establishing whether reduction of releases must be compatiblewith planning for hundreds or thousands of years. The long half-life of
91

other radioisotopes in the tailings, such as -J^Th, m2rkes control along term problem. Furthermore, the radium which is recovered may createanother problem of high-level waste disposal.
4.3.2. Acid vs. Alkaline Leaching
The two main methods used in the leaching process are acid andalkaline leaching. Whereas the former uses sulphuric acid and is rathernon-selective in its leaching action, in the latter method a solution ofsodium carbonate, sodium bicarbonate and an oxidizing agent to dissolvethe uranium are employed.
Because the alkaline process is less violent, it requires greatercomminution of the ore and the tailings contain therefore morefines [6]. Also, because the process is carried out at pH 10-11 thereare fewer mobile constituents. In the case of acid leaching (pH 1.7 -2.0) much of the radium and other elements present in the original oreare dissolved in the effluent but will eventually interact with the soiland water under different pH conditions and precipitate or adsorb ontothe surface of soil particles.
4.3.3. Underground vs. Open-Pit Mining
From the point of view of radium impact on environmental waters,the two methods differ chiefly on the way tailings are disposed of. Inunderground mining the tailings are piled above ground level, albeit inlocations carefully chosen after topographical, geological andhydrogeological studies. Such tailings dams are nevertheless exposed towind erosion, possibility of catastrophic failure and sheet run-off. Inopen-pit mining these effects are practically eliminated if the depletedpits are used for disposal of the tailings, but the problem of seepagecould be considerably more relevant than in the case of tailings piles.This is particularly true when the bottom of the pit is situated belowthe regional water table. Clay liners can be used to limit seepage butthe fact remains that very little is known about the impact of such typeof disposal on underground water [7].
4.3.4. Climatological Considerations
The type of climate prevailing in a specific uranium mining areadetermines the nature of the impact which the radium contained in theliquid and solid wastes will have on the environment. If the climate Isdry, as in New Mexico and on the Witwatersrand, most of the waterdischarged onto the tailings dams will evaporate, resulting in drying outof the tailings and radon will be the radionuclide of concern. In wetclimates, such as that of Canada, there will be relatively little radonescape but radium will very likely find its way into surface and groundwaters.
92

4.3.5. Site-Specific Aspects
Every ore deposit or tailings dam has its own peculiarities interms of associated uranium grade and mineral composition, permeabilityand sorption capacity, relation to the water table, and physical,chemical and hydrogeological properties of the underlying soil.Therefore, situations which at a first glance may appear similar couldhave the radium behaving in quite different ways. Also, for a givenradium concentration in environmental waters the importance of the netimpact is largely dependent on population distribution as well a land andwater usage in the area.
4.3.6. Tailings and effluents
Uranium tailings are essentially the same material as theoriginal ore mineralization, with two exceptions: a large surface areais produced as a result of grinding and most of their uranium has beenextracted by chemical treatment. Acid tailings are usually neutralizedby lime addition before they are deposited in piles (tailings dams)formed from a slurry containing anything up to 80-90% water. The damsconsist of interbedded layers of materials ranging from clay to coarsesand in texture. The neutralization causes the precipitation of a largeportion of the radium and many of the dissolved salts and metals. Thenet result is that most of the radium from the ores appears in thetailings [8]. However, there is good reason to doubt whether liming willbe of much benefit on the long-term when sulphides are present [9J.Liming is only a short-term measure and eventually the aciditiy resultingfrom the oxidation of the sulphides will be the determining factor in thecreation of a low pH environment which could result in serious leachingproblems.
The liquid wastes usually have their pH adjusted but this alone doesnot necessarily reduce the radium concentration to acceptable levels.Thus, they are often subsequently treated with flocculants [10] toprecipitate the suspended radium and/or with barium chloride toprecipitate the soluble radium before they are released to surface andground water (see Ch. 8).
4.4. Ra-226 DISTRIBUTION IN THE AQUEOUS ENVIRONMENT
Perhaps spurred by the potential health hazard inherent toradium contamination of the environment caused by uranium mining andmilling, several countries are making a larger effort in terms ofstudies, surveys and monitoring programmes aimed at assessing the sizeand nature of the impact which radium is having on environmental waters.In what follows the most important findings concerning technologicallyenhanced concentration levels of 22o£a ^n waters will be described.For the sake of clarity, the results obtained at each site will begrouped under the headings "ground water", "surface water", "stream
93

sediment" and "biota". Sites in the following regions have beeninvestigated:
_ .__Mining has not yet started but an extensive pre-operationalimpact study has been carried out [11]« Ore grade ranges from 1300to 18 000 g/t U308.
_ _ _ _ _Regions housing a radium extraction plant and factory wherenatural phosphates are treated, respectively.
Npr_th_er_n_Bo_h£miai Czechoslovakia^Uranium mine situated in region of high natural radiumconcentration (25% of water supplies and wells measured by Martinecand Havlik [12] contained more than 0.12 Bq/1 226Ra).
i Ve ndee_a nd_Fore_Zj,_Three regions where uranium is mined and milled
, __Ind J_a_«_Jaduguda has the oldest uranium mine in India and Alwaye amonazite and a rock phosphate processing plant.
Mining and milling or uranium is undertaken.
_ _ _ ^ _A few dozen gold/uranium mines are intermingled with highlypopulated urban areas.
an<[ Florida^ £eg_ionsThe Grants Mineral Belt includes several uranium mines spreadover a sparsely populated area, while uranium-bearing phosphate oreis mined in North Carolina and Florida.
Poc_os_ d _ . . _ .Mining area and future milling facilities are planned [26].
Yugps_lavia_._There are two sources of radium pollution, namely an exploratoryuranium mine of Zirovok vrh, a phosphate mill and a coal separationplant at Zasavje.
4.4.1. Ground Water
4.4.1.1. Me::hmisinsof co tit aminat . n c>f
Technologically enhanced contamination of ground waters byradium takes place as a result of leaching of waste materials by rainwater or as a result of seepage of already contaminated surface watersflowing over or contained in permeable soils. Seepage of rain waterfalling on contaminated ground or sediments will, obviously, also lead toenhanced radium concentrations in the ground water. However, uranium
94

tailings impoundments, owing to the relatively large total amounts ofradium which they contain, are perhaps the most significant singlecontributors to the enhanced radium levels in ground water. Even when atailings dam is decommissioned, seepage into the underlying soil couldcontinue for many years [13], the quantity of seepage release beingdependent not only on the seepage control system but also on theproperties of the foundation soil or rock beneath the impoundment and thenature of the ground water in the area. According to Klute et al [14],the general sequence of water-flow events may be described as follows:
1. An initial period of drainage from complete saturation, withevaporation at the surface;
2. Infiltration of various amounts of rain at regular intervals; and3. Periods of evaporation and drainage from the profile and
redistribution of water within the profile between rainfallevents.
The same author further maintains that the initial drainage fromsaturation, if not disturbed by rainfall events, could last for severalyears.. This opinion Is supported by that of other workers [13].
4.4.1.2. Spe_cif lc__si_te_ studies^
Ground water concentrations of radium in areas included in thisstudy are as follows:
(a) Yeellrrie_
The natural ^ "Ra concentration of underground water can be ashigh as 30 Bq/1. However, owing to the low rainfall (200 mm/a) andthe relatively high level of natural contaminants in ground water theenvironmental impact of mining is expected to be small [11].
(b)
No specific study of ground waters was conducted but it wasestablished that "Ra dissolved in water from domestic wells andbore-holes drilled in an area contaminated by liquid effluents was,in most cases, below 0.37 Bq/1 [15].
(c)
The uranium mine at Jaduguda has ore of fairly low grade but hasbeen in operation for many years. A brief survey, conducted alreadyin the late sixties, of several wells in and around the mine premiseswhose water is used for domestic purposes, gave concentration levelswhich varied between 0.16 and 0.02 Bq/1 26 , jjo conclusionregarding the possibility of contamination could be made. Asubsequent and more comprehensive survey carried out over four years,produced more meaningful results. These are shown in Table 4.1. Inthe case of both wells, it may clearly be seen that while theCl-, 804= and Mn levels have increased considerably over the fouryears, there has hardly been any movement of radium. A furtherinteresting aspect is that there are no significant differencesbetween the values found for the well adjacent to the tailings pondand those for the well 500 m away. Dispersion considerations would
95

(e
have led one to expect a lower concentration In the latter if theseepage originates In the tailings pond itself. The values obtainedare those that might be expected from seepage through contaminatedupperlying soil.
(d)A similar situation of low radium mobility seems to exist at
least in one of the South African gold/uranium mines situated in adolomitic area. The tailings impoundment is about 25 years old. Inspite of the high sulphate and manganese levels recently measured inground water at approximately 1 km from the impoundment, the radiumconcentration levels in several boreholes located hydraulically downgradient from the impoundment never exceeded 0.03 Bq/1 of dissolvedradium. Unfortunately the data available are still too few to drawany meaningful conclusions.
Several studies concerning the effects of uranium mining onground waters have been conducted in the USA [7, 16, 18],particularly in the State of New Mexico where, due to the scarcity ofperennial surface water bodies, ground water is the main source ofwater in the mining areas. Industrial, municipal, stock and privatedomestic wells tap both bedrock and aluvial aquifers [7].
(i) Grants Mineral Belt
Although previously there had not been much interest in groundwater contamination, subsequent investigations in the Grants MineralBelt involved sampling 72 wells and various mine drainages in thearea, review of hydrogeological conditions and a check of waterbalances for two tailings pond complexes [17]. The study revealedthat from the 72 ground water sampling locations, seven locationsshowed dissolved 226 concentrations above the 0.12 Bq/1 drinkingwater standard used in the USA. However, only two potable watersupplies contained 226 jn excess of the water standard.Concentrations in municipal water supplies varied between 0.005 and0.025 Bq/1. Lack of pre-operational data failed to indicate whetherthe higher radium concentrations are due to mining.
Seepage from the Anaconda mill tailings pond alone averages 183million litres per year and enter an aquifer used for domestic andIrrigation purposes. On this basis it is estimated that between 1960and 1970 about 15 GBq of radium were introduced into the aquiferthrough seepage alone. At the Kerr-Mcgee mill some 30% of the wasteschannelled into the evaporation ponds escape by seepage. Althoughnearby wells revealed high levels of ammonia and nitrate the maximumradium concentration observed was 0.24 Bq/1. An estimated 30 GBq ofradium has been introduced into ground waters in this area. Again,lack of "true" background or ambient values prior to uranium miningmake adequate evaluation of radium enhancement well-nigh impossible.
Whether mines in the Grants Mineral Belt region contaminateground waters by means of ground water leaching or by rechargethrough contacting exposed oxidised ore bodies is poorly documented.
96

Preliminary studies by the US Geological Survey indicate good qualitywater from one inactive underground mine in the Churchrock area andit may well be that this water could be considered as sufficientlypotable to be used as municipal water supply.
Because of the co-location of mining and milling facilities inNew Mexico it is difficult to identify impacts from one versus theother. A monitoring well network to determine temporal and spatialtrends in ground water has nevertheless been installed.
(ii) North CarolinaA study carried out by Strain et al [4] around a phosphate
mining and manufacturing facility in North Carolina revealed thatalthough four wells had dissolved 226Ra concentrations ranging from0.35 to 5.5 Bq/1 most of the remaining 22 wells had concentrationsbelow 0.074 Bq/1. Perhaps interesting is that another well situatedno more than 40 m from that containing 5.5 Bq/1 gave a 226Ra valueof only 0.044 Bq/1. Their radon concentrations were 700 and 12 Bq/1,respectively. Water from many of the wells has been used byresidents for domestic purposes and, according to the authors,continuous intake of water from the well with a radon concentrationof 700 Bq/1 would result in a dose equivalent rate to the stomach of20 mSv/y. The equilibrium bone burden from the 226Ra Wouldcorrespond to a dose equivalent of about 48 mSv/y.
(iii) Central Florida
Kaufmann and Bliss [19] studied the effects of phosphate miningin Central Florida on 226 contents of ground water and concludedthat there was no difference in the radium content in the water tableaquifer in mined and non-mined mineralized areas when compared withthat in non-mineralized areas. They concluded, therefore, thatmining as well as mineralization have not given rise to widespreadand/or significant increases in the radium content of such anaquifer. Dissolved radium concentrations in the discharges rangedfrom 0.0008 to 0.08 Bq/1 and total radium never exceeded 0.12 Bq/1 atany one facility. It is, however, presumed that seepage to groundwater could contain higher total radium, depending on the transportroute and the suspended solids content of the waste water. The meanradium concentration dissolved in ground water for the area studiedgave averages ranging from 55 to 550 Bq/1, most of it originatingfrom the high natural levels of radium prevailing in the area.
In mining areas where the natural concentrations of radium areof the same order of magnitude of those corresponding to the limitsset for the public, the capacity to absorb additional quantities issometimes almost nil. Under such circumstances there is a seriousproblem in how to dispose of the radioactive wastes during mineralextraction of ores having uranium associated with them.
4.4.1.3. jCpmnents_From the above studies it is not clear that technological
enhancement was responsible for the higher radium values found in groundwaters as little background data is available.
97

4.4.2. Surface Waters
4.4.2.1. Mechanls mso f ntamlnatln
Most of the radium enhancement in surface waters seems to becaused by discharge of mine and milling effluents into watercourses.Other possible causes are wind and water erosion of tailings dams,occasional flood waters from mill areas and seepage water from tailingsimpoundments, which may conceivably reach the surface through openfountains. However, their contribution must be regarded as minor incomparison with that by effluents discharged.
Treatment of the effluents by barium chloride has the effect ofremoving most of the dissolved radium by precipitation. However, if themean residence times of the treated effluents in the settling ponds isnot sufficiently long to allow the radium to settle, large quantities ofradium in the form of fine suspended material may still be released intothe environment and be eventually deposited as sediment.
The ratio of dissolved to suspended radium in the effluents dependson their history and previous treatment. From the time they are releasedto any stream or aquifer the further behaviour of radium is influenced byvarious factors, the effects of which are not yet fully understood. Someof the most important are pH, type and concentration of ions, dilutionfactors, oxidation potential of the water medium as well aschemico-physlcal composition and hydrogeological properties of theriver/resorvoir bed and underlying soil. Their influence is subject toappreciable changes caused mainly by seasonal variations in the behaviourof surface waters.
The impact which radium in surface waters may have on a specificenvironment depends on how that environment relates to man. Such watersare usually more accessible to man and other biological systems and, inthe case of rivers, can lead to widespread contamination of adjacentareas. The majority of countries involved in uranium mining are alsoactively involved in studies, surveys and monitoring programmes designedto gather information on and to learn more about the behaviour of radiumin surface waters. In most cases, however, those steps have been takenonly after mining and milling had been in operation for several years.
4.4.2.2. Specif ic S it e_ j[tudi_e s_
The following 2 26] concentrations in surface waters have beenfound in this study:
(a ) Al.li,ga.tpr_ River_s_reg_ipn_
This region is a wilderness area of great natural beauty, whichis intended for a major natural park. Practically all ore bodies areto be mined by open-pit. The average rainfall of the region is 1300mm while evaporation is about 2200 mm. Except for one mine, alluranium development plans envisage no release of contaminated waters[11]. Only 0.1-0.3% of the radium will be released into solution andits concentration in waste liquours after lime treatment is expectedto be 0.1-0.5 Bq/1. In order to keep the annual radium intake by the
98

local population under the limit of 300 MBq, the allowable increasein the radium concentration of a local creek used by the aboriginalpopulation will not be higher than 0.02 Bq/1.
( b )
As part of a survey carried out in an area contaminated byn the effluents of a radium processing plant, the
concentration in dissolved and suspended 226ßa fn the stream intowhich the effluents were discharged was measured [15]. Theauthors found that the total 226Ra concentration in the streamwater tended to increase downstream at least over a distance ofapproximately 1.5 km. The concentration increased from 0.075-0.4Bq/1 to 0.022-0.81 Bq/1. The cause for these variations is notclear, particularly considering that the second measuring point wasin a zone of drainage canals, with practically no horizontal movementof the waters. What they have further verified is that in spite ofthe lack of turbulance in this zone, the activity due to the radiumadsorbed onto suspended matter was considerably higher than that dueto dissolved radium. They found no correlation between theappreciable variations in the ratio solid/suspended radium and the pHor Ca++ concentration. They also observed an increase in theconcentration of soluble radium at the point where the stream joinsthe river and this they attribute to the possibility of elutiontaking place.
Measurements carried out by the same workers in the Tessenderloregion, have shown that the effluents from the phosphate plantdischarged into two rivers gave rise to dissolved radiumconcentrations as high as 0.4 and 1.0 Bq/1, respectively. Incontrast with the Olen region, in this case most of the radium seemsto be present in dissolved form.
(c) Northern Boheinia
Radium contamination of surface waters in the uranium miningarea studied results mainly from two sources of waste water:drilling waters, which are pumped out of aquatic sandstones aroundthe mine, and mine waters, which are pumped out directly from themine. Their 26 ,, COntent varies and it can be as high as 37Bq/1. While most of the radium content in drilling waters is insolution (about 97%), that in mine waters shows a greater abundanceof the suspended form (between 3% and 35%). Assessment of the effectof mining on the radium content of surface waters has been madepossible because data corresponding to the period prior to the startof uranium mining is available. These data have been reportedelsewhere [20, 21].
The situation concerning radium concentrations in surface watersis illustrated in Fig. 4.1 and Tables 4.2 and and 4.3. Table 4.2,which refers to the outlet of effluents from the sedimentation pond,clearly shows large non-seasonal fluctuations in the total amount aswell as in the forms of radium released to the Ploucnice river. Thepercentage of dissolved radium is in all cases quite small. Releasesof 5.5 Bq/1 226Ra (Table 4.3) led to concentrations of 1.5 Bq/1 inthe river just after the release point and 0.86 Bq/1 12 km furtherdownstream, most of it still in the suspended form.
99

(d)
The liquid effluents from the uranium mills, after sedimentationin the settling ponds, can have radium concentrations well above 10Bq per litre. A radium balance carried out over several years in theVendée region has shown that 1% of the radium entering the mill isreleased as dissolved radium. In Table 4.4 the quantities releasedduring 1975 in the La Crouzille, Vendée and Forez regions arecompared with the soluble radium concentration in the respectivereceiving rivers. It may clearly be seen that the enhanced radiumconcentration due to mining is indeed small.
The dilution of the effluents in the rivers varies from a factor2 to 10 depending on the size of the rivers. The ratio of insolubleto soluble radium contents in one of the rivers was found to varybetween 1.4 and 3.2 and to decrease with distance due to dilution andsedimentation. For example 15 km downstream the ratio was 0.6, whichis very similar to the ratio of 0.5 that prevails upstream from therelease point.
(e ) ad_ug_uda_and_Alwa_ye_
The natural radium dissolved in surface waters in the Jadugudaregion, as measured before the start of mining activities, rangedfrom trace levels to 0.07 Bq/1. Measurements conducted during1977/78 have revealed that the concentration of dissolved 22oRa ^nthe Juria Nala river at a point just after the release of theeffluents from the tailings pond average 1.7 Bq/1, reached a maximumof 2.4 Bq/1 at about 1.5 km further downstream, where the Juria Nalameets the Gara Nala river. At 6 km downstream from the release pointthe average radium concentration has come down to 0.03 Bq/1. As inthe case of wells, the local population makes intensive use of waterfrom both rivers for domestic consumption. Measurements carried outat three different times of the year, monsoon season, late winter andsummer, have shown that during the monsoon season the radiumconcentration levels are considerably diluted by the heavy water-flow.
The liquid effluents from the monazite processing plant in theAlwaye region are discharged into the Palar river. To study theimpact of this industrial activity on the river water, the river wasdivided into three zones. These are given below, together with thedissolved radium (^^'Ra, 228 ) concentrations measured.(i) Background zone - where impact of industrial operations is
not considered significant.Dissolved radium: 0.002 - 0.122 Bq/1Suspended radium: 0.02 - 0.190 Bq/1
(ii) Industrial zone - where the river is directly subjected toindustrial effluents.
Dissolved radium: 0.002 - 0.089 Bq/1Suspended radium: 0.096 - 2.7 Bq/1
(iii) Backwater zone - downstream from industrial zone and inclose proximity to the sea.
Dissolved radium: 0.005 - 0.026 Bq/1Suspended radium: 0.089 - 7.2 Bq/1
No discernable enhancement of dissolved radium has been noticed,albeit the concentrations of suspended radium in the industrial andbackwater zones have increased appreciably.
100

(f)
The mine has been In operation since 1974 and in-place leachingis used. Measurements carried out regularly show not only anextremely low radium concentration in the effluents from theprecipitation pond but also a continuous decrease In meanconcentrations between 1974 and 1977, as may be seen from Table 4.5.These concentrations are of the same order or perhaps even lower thanthose measured in river and well waters.
In order to Investigate the general behaviour of radium in riverwater, a river fed by a hot spring was selected as model. Throughmeasurements of the concentration of SO^ Cl~, Fe, Mn, and226Ra at various points along the river and a mass balance exercisethe conclusion was drawn that depletion or enhancement of ratios suchRa/Cl would reflect the behaviour of radium along the stream in termsof its deposition or re-dissolution.
(g)
A preliminary survey of environmental surface waters wasconducted in the gold/uranium mining areas, particularly in thoseareas which have either a high population density or are intensivelycultivated. The measured total radium concentration in rivers, damsand lakes with free access to the public are shown in Table 4.6, fromwhere it may readily be seen that concentration levels of total226Ra £n environmental waters seem to be remarkably low,particularly considering that there are some 2500 TBq ofcontained in the tailings impoundments spread throughout the area.The only high value (1163 Bq/1), at the Rietspruit site, is caused bythe liquid effluents discharged by a uranium mill situated some 5 kmupstream. It Is regrettable that no data on natural radiumconcentrations are available but this is understandable if it Isrealised that mining activities in many of the areas surveyed havecontinued uninterruptedly since the turn of the century. The 0.11Bq/1 measured in the Nigel Dam site results from the fact that thislake used to receive some of the effluents from a mine. Its outletflows through a town for almost 2 km and at the end of this distancethe radium concentration had dropped to only 0.092 Bq/1.
(h) ra_nt s_Mi_nera_l_Belt and
In the Grants Mineral Belt most of the uranium mills dischargetheir liquid effluents into streams after barium chloride treatment.Those with no discharge utilise evaporation ponds or use the waterfor dust control. In some mines and milling sites the water volumeof streams into which mine effluents are discharged decreasesconsistently with flow distance but water quality changes areerratic. Infiltration can account for 90% or more of the water lost,the balance being by evaporation. One case was observed wheredissolved 226] decreased from 0.52 to 0.035 Bq/1 over a distanceof 27 km. Based on the limited flow and other measurementsconcerning water quality, It appears that radium is strongly sorbedonto the stream sediments. This type of studies have led to theconclusion that 226 s removed from surface waters at rates of0.02 to 0.11 Bq/1 per kilometre of stream. Final concentrations areof the order of 0.009 Bq/1. Redissolution in successive surfaceflows seems to occur but not significantly.
101

It has also been observed that water pumped from the mines hassome impact on shallow ground water in alluvial aquifers althoughthis is not properly documented. It would appear that most of themine effluent infiltrates within short distances and recharges theshallow water table. The dissolved, generally non-reactivecontaminants such as chloride and sulphate are expected to reach thewater table, but reactive contaminants such as radium and most tracemetals would sorb or precipitate in the soil in the course ofinfiltration. Although no cases of gross, widespread contaminationof surface waters seem to have been found in the Grants Mineral Beltthere are some cases of local contamination of water.
At the North Carolina phosphate plant the overflow of thesettling pond is dispersed into the Pamlic river. Although thedissolved radium concentration in the river water was less than 0.02Bq/1, the mean concentration downstream from the plant wasconsistently higher than upstream, i.e. 0.01 an 0.005 Bq/1,respectively.
(i) Zir_koys_ki_ vrh_ .reg_ip_n_
Measurements conducted in 1977 on the Brebovscica river beforefull-scale uranium mining operations started show the radium
y 9 ficoncentrations of dissolved "°Ra to have increased from a mean of0.002 Bq/1 to approximately 0.006 Bq/1 in the vicinity of the pointwhere effluents are discharged. The radium contents of the effluentsranged between 0.037 and 1.8 Bq/1. Further measurements conducted inthe Sava river, which has the Brebovscica as one of its tributaries,showed no contamination caused by the mining activities as such.What appears to have had a slight contribution to the radium contentof the Sava are the liquid effluents from a phosphate mill and coalseparation plant situated some 80 km downstream from the uranium mine.
4.4.2.3. _Cpmment!B_
In spite of insufficient information regarding radiumconcentrations in surface waters prior to starting of mining or millingoperations there is, in a few cases, clear evidence of radium enhancementcaused by such activities.
4.4.3. Stream Sediment
4.4.3.1. Mech an is mso tr ansf erThe behaviour of the radium discharged into a river is strongly
influenced by the organic and inorganic substances already present in theriver and in the effluent itself. If the pH of the effluent is of theorder of 6 to 7, as is often the case, when the effluents mix with riverwater the pH is usually increased and this leads to the precipitation ofhydroxides of Fe , Al and Mn. The radium precipitates with thesehydroxides as well as with the sulphates which are present, in particularthose of barium. The presence of plant life will enhance retention ofthe hydroxide particles by capturing them.
102

Further downstream, part of the contamination of bottom sediments canbe attributed to fixation of the radium onto clay particles. Wherestreams are slow moving, the deposition of fine particles is favoured.In the same zone, the sedimentation of organic debris enriches thedeposit of organic matter on the river bed and the resulting consumptionof the available oxygen can give rise to reduction of sulphates tosulphides.
During seasonal floods radium attached to the sediments can beredissolved and redeposited again, often over long distances, oncefavourable conditions are reached. If the river overflows its banksradium -carrying sediments may be deposited onto the flooded areas. Heavyrains can cause tailings material, which is often spread in the vicinityof tailings impoundments, to be carried into a receiving stream.
4.4.3.2.
(a ) 01e_n__an_d_Tte_ss_end_erlp_
The main purpose of the study [15] conducted in this area hadbeen to establish whether the effluents discharged into streams whichperiodically overflowed their banks had led to contamination of soilbeing considered for agricultural purposes. The study revealed thatthe top layer of soil, consisting mainly of turf, was highlycontaminated by radium. An area of 0.66 ha gave values of 37 Bq/g226 while in some 9 ha the concentration levels ranged from 3.7to 37 Bq/g. According to the authors "the degree of adsorption ofthe radium onto the turf is such that its migration is extremelylimited and the present situation will hardly change within severalcenturies" •
(b)
Stream sediment in the mining area as well as along thePloucnice river were investigated in 1977 and again in 1979 fortheir radium content. From the results in Table 4.7 (1979 study) itcan be seen that the radium content decreases significantly as thedistance from the source of radium increases. The only exception tothis regular decrease in radium at one of the sampling sites can beexplained by the higher abundance of the "fine" fraction at thissite. The regular decrease is caused by the rapid sedimentation ofsuspended forms of radium and by mixing of radioactive sediments withan increasing portion of sediments of low radioactivity. It furtherfollows from the data in Table 4.7 that the fine particles of thesediments contain the largest portion of the radium. A goodcorrelation was found between the radium content of the sediment andthat of water, specially as regards the particulate form. Therelatively small reduction in weight after ignition shows that verylittle organic material was present in the sediments. Comparison ofthese results with those obtained during an earlier study showed thatthere has been an increase in the content of radium in the sedimentsduring the preceeding five years. However, no significant increasewas observed between 1977 and 1979.
103

(c) I^_Crpuz_ll_l_e,_ V_end_e_e_aiKl_Forez__Results concerning sandy sediments in a river valley at one of
the sites gave values between 0.13 and 0.24 Bq/g ash, with hardly anydifference between two sampling points situated 0.2 and 5.0 kmdownstream, respectively.
(d) Jaduguda
Measurements on bottom sediments along the Juria Nala rivershowed that from a mean 226 content of 9.9 Bq/g in the zone up to1.5 km downstream, the concentration decreased to 2.0 Bq/g at 2.5 kmand to 0.78 Bq/g in the zone down to 30 km from the point whereeffluents are released.
(e) Wi._t_wat_er_srand_Radium contents in bottom sediments of rivers and lakes situated
in mining areas and used for recreation or with free access to thepublic ranged from 0.02 to 0.26 Bq/g.
(f)In this region the radium content of the tailings is almost two
orders of magnitude higher than those measured in the backgroundsoils. Thus, the most prominent indicator from above-ground mineralstorage in decommissioned mines is the "Ra measured in stream bedsediments. Measurements have also shown that the distance over whichmost tailings material settles can vary appreciably. Whereas at onesite the radium concentration diminished to twice the backgroundvalue in a distance of approximately 100 m at another site thedistance was about 500m.
(g)has been measured in sediments (in fractions below 250
u) at 8 sampling points from the uranium mining area in 1979 to 1981[22, 23, 24], the results ranging from 27.9 to 120.6 Bq/kg dry weight(on average around 100 Bq/kg dry weight). The results obtained wereapproximately one order of magnitude higher than those frombackground areas (the river Sava in its upper reaches - near Bohinj -around 10 Bq/kg d.w.) and approximately 10 times lower as compared tothe 226 activities (around 700 Bq/kg d.w.) of sediments in theriver Sava influenced by the pollution from classic technologies(coal mines, thermal power plants).
4.4.3.3. _Comment_s_As regards sediments in the sites investigated, it is fairly
clear that practically in all cases sediments lying downstream from thepoint where liquid effluents are released have become contaminated.
104

A.4.4. Biota
4.4.4.1. Mechanisms_pf_ transf£T_thr£>ug_h_bipj:a_
Owing to the similarity between the chemical behaviour of radiumand calcium, the former is easily metabolised by biological systems.Also, fine suspended material in water streams, particularly those whichare flocculant, tend to absorb onto plant life growing in the stream.Successive uptake in the biological chain can thus lead to radiumreaching man.
4.4.4.2. Specif ic_case_ etud^es_(a) V.end£.e_
The existence of several dams on the river produced specificenvironments which, having little exchange with each other, could beconsidered as being inhabited by homogenous ichthyologicalpopulations. Considerable differences in radium concentration levelswere found to exist between the species living upstream anddownstream from the release point. These differences varied betweena factor 15 for the eel and 120 for the rouch. In the case of thelatter, the actual concentrations were 0.37 Bq/kg fresh weightupstream and 44 Bq/kg downstream. As regards plant life, It wasestablished that the contamination of terrestrial plants is fairlyweak (1.1 to 3.7 Bq/g dry weight) in relation to aquatic plants (upto 50 Bq/g dry weight).
Cattle is often raised in the vicinity of uranium mines andmills for both milk and meat production. The mean radium content ofmilk over a five year period which started three years after thebeginning of milling at a certain mine, were 0.078 H^ 0.019 Bq/1 and0.28 + 0.09 Bq/1 at 6 km and 1.5 km, respectively, downstream fromthe mill. Although measurements carried out 13 years later showed nochange, the levels were nevertheless high when compared with the 0.01Bq/1 prevailing in the surrounding areas. They are, however,considerably below the 1.3 Bq/1 which is a derived limit for 226RaIn milk.
A further experiment carried out with two sheep and one cow,which over a period of 30 days drank only mine water containing 35-55Bq/1 22^Ra, showed that approximately 99% of the ingested radiumwas excreted in the feces. The remaining radium was divided betweenthe urine and the milk. The mean radium content in the milk duringthe experiment was 0.10 to 0.17 Bq/1 for the sheep and 0.19 Bq/1 forthe cow. After 20 days of consuming normal water again, the radiumcontents of the milk dropped to less than 0.01 Bq/1.
(b) Jadug_ud_a_
Extensive measurements of various biological systems in the areapossibly affected by the uranium mine have been carried out. Theyshow, for example, that the radium content of algae collected in theJuria Nala river, 2 km downstream from the release point, is about2.1 Bq/g wet weight, with an enrichment factor of 3 x 10 , while
105

that in fish from river water containing 0.52 Bq/1 226 COuld beas high as 7.9 Bq/g fresh weight of soft parts, with an enrichmentfactor of about 15. Algae such as Spirogyra sp. could conceivably beused as good indicators in assessing the pollution status ofcontaminated streams as a result of the good correlation foundbetween the radium content of this species and that in the ambientwater. The radium concentration in grass growing in soils containingbetween 0.01 and 4.3 Bq/g 226 has also been measured. Areasonably good correlation between radium contents of grass and soilwas found as is evident from Table 4.8. Radium concentrations inmilk and vegetables measured in 1967 and again in 1972 showed anincrease from 0.059 to 0.34 Bq/1 in the case of milk and 0.21 to 2.3Bq/kg in the case of vegetables.
(c)
A few measurements conducted on samples of grass growing in thevicinity of decommissioned tailings impoundments gave values rangingfrom 0.14 to 0.32 Bq/g 226 ashed weight. This high value is,however, attributed to visible contamination of the grassed area withtailings dust blown from the impoundments.
(d)has been measured in some selected environmental
samples. Slightly increased activities of radium were found insome grasses from the area of a spent ore deposit, as well as in someplants with large leaf surfaces (Tussilage farfara and Petasiteshyb ridus ) [25]. In both types of samples the radium content rangedfrom 0.018 up to 0.74 Bq/g dry weight, but external contaminationcannot be excluded in spite of careful sample preparation.
226Ra in fish [24] (mainly trout - Salmo trutta m.fario)measured at the same time as sediments, was low at all five samplingpoints investigated, in general »below 0.8 Bq/kg whole body freshweight (range from 0.28 to 0.93 Bq/kg f .w. ) , with two exceptions fromthe most contaminated sites in the uranium mining area (2.5 and 2.0Bq/kg f.w.).
226]ja(jium activities of some representative specimens of fishfood [22] (Trichoptera sp. larvae and Gammarus fossarum) were onaverage of the same range (60 and 50 Bq/kg d.w., respectively) as insediments from the uranium mining area.
4.4.4.3. Comment_s__
The most important deduction which can be made in connectionwith radium contamination of the biota in watercourses is that relativelylarge enrichment by some forms of plant life, particularly algae growingin media known to be contaminated with radium, was observed.
106

4.4.5. Models
The quantitative description of the behaviour of radium inwastes from uranium mining and milling is essential if short as well aslong-term predictions have to be made when planning the design of thewaste disposal system in any uranium mining venture. This isparticularly true In respect of tailings impoundments as a result of thelong term implications. Several models of various degrees of complexityhave been proposed recently by a number of authors [13, 14, 18] in anattempt to identify and quantify In a sufficiently precise manner therole played by the various parameters. Although a great deal of successhas been achieved much has still to be done before a sufficientlygeneralized model i-s available to cope with most situations. Adding tothe complexity of the problem is that fact that It does not suffice to beable to predict water movement in and out of a tailings impoundment andin the underlying soil. The chemico-physical interactions between thecomponents of the system radium/water/tailings (and/or soil) under avariety of conditions have to be properly defined in order to makeacceptable predictions regarding the behaviour of radium.
In an attempt to analyse radium migration in the earthen dam of thetailings pile at Forez after 20 years of tailings accumulation, a simplemodel based on the one-dimensional diffusion equation was used. The mainaspect addressed was, for a certain barrier thickness, to determine thetime for the concentration of radium in the water which crosses thebarrier to reach a certain value. Assuming a steady-state situation andfor a barrier thickness of 30 m it was arrived at a time of 19.9 yearsfor penetration of the dam, which agrees well with the experimental dataavailable.
4.5. RECOMMENDATIONS
(I) The effect which weathering, seepage and leaching may have on themovement of radium in the subsurface has not yet been adequatelyestablished neither is the influence of the lithographic andhydrogeologic environments on radium mobility well understood. Suchinformation Is much needed, particularly considering the effect thatthese phenomena may have on the long-term water quality in the watertable.The apparent immobility of radium in ground water found in some cases iscause for optimism in recommending burial of tailings. However, furtherexperimental evidence under a variety of conditions is needed. The datacan also be used as inputs in the cross-validation of mathematical models.Having in view possible long-term effects, the behaviour of radium in andaround decommissioned tailings impoundments should be examined moreclosely.
(ii) Pollution of surface water has been extensively documented but dataon the volumes involved, which is necessary to fully describe theprocess, is generally lacking. Such data should be obtained.More work should also be done on short and long-term effects of radium onagricultural ground contaminated by flood waters.
107

(ill) Streams sediment are the main repository of radium. Yet, theprocess of precipitation and redissolution of radium in field conditionsis not yet fully understood. The process of redistribution and itssignificance to the benthic fauna and flora should be examined.
(iv) In order to make valid predictions, valid mathematical models areneeded. Research on the following types of predictive models should beundertaken:
Movement of radium in ground waterTransport of radium in the biological cycleLong-term trends of potential changes that would result from anincrease (or decrease) in mining activities.
It may be worth to try to identify further areas where research,development and field investigations may reasonably contribute to abetter understanding of the behaviour of radium in environmental waters.
TABLE 4.1. DISSOLVED RADIUM IN GROUND WATERS IN THE JADUGUDA REGION
Description
1 . Well adjacent to tailings pond22'Ra <Bq/£)Mi (mg/l)
S0„ (mg/£)Ct (ms/l)
Hardness (rag/£ )2. Hell 500 m away from Tailings pond
22sRa (Bq/£)Mn ftng/C )S0% (MJ/t)
Ct <mg/£)Hardness (mg/ 1)
1st year
0.0170.15
155.7206.9885.0
0.0150.14
125.0199.1790.5
2nd year
0.0170.36
816.4312.51232.0
0.0160.33
970.7319.11180.5
3rd year
0.0170.40
614.4295.31172.0
0.0150.36
509.3304.9853.6
4th year
0.0181.89
1245.0390.01410.0
0.0160.74
1158.0384.71380.0
108

TABUE A.2. RESULTS OP ANALYSES OF EFFLUENTS FROM SEDIMENTATION POND AT
URANIUM MINE, NORTHERN BOHEMIA
Date of sampling
Water temperature
pH of the waterSuspended solids
(mg/-Q
Total content ofRa-226 (Bq/C)Dissolved Ra
(Bg/t)Suspended Ra
(Bg/e)Dissolved Ra (%)
August Cctob.24 251976 1976
10.5
6.748
10.8 1.7
0.12 0.21
10.7 1.51 12
Novem.221976
8
6.6311
9.1
0.70
8.48
Jan. Feb. March6 17 151977 1977
8 10 9
6.84 6.65 6.6624 13 9
5.8 2.8 3.1
0.13 0.44 0.21
5.7 2.4 2.92 16 7
May171977
13
7.0214
5.1
0.11
5.02
TABLE A.3. RESULTS OF ANALYSES OF WKTER SAMPLES TAKEN AT URANIUM MINE,
NORTHERN BOHEMIA
Sampling place
Water tenperature (°C)pH of the waterSuspended solids (rng/£)
Total content of Ra-226(Bq/i)
Dissolved Ra (Bg/C)Suspended Ra (Bq/Z)Dissolved Ra (%)
Outlet ofsettlingpond
9.86.76 0.0613.2 _+ 2.4
5.5 jf 1.20.28+0.085.2 i 1.36.9 _+ 2.1
Effluentsprior to discharge intoriver
9.17.03+0.0918. 5.+ 3.8
4.1 j+ 0.60.35+0.063.8 0.68.3 + 1.0
River justafter ef =fluentdischarge
5.57.28+0.0421.3 i 3.7
1.5 i 0.20.20+0.031.29+0.2011.5 + 1.3
12 km down=stream fromdischargepoint
5.37.44+0.0624.0 + 4.8
0.86 + 0.110.20+0.040.65+0.1427.2 + 7.0
109

TABLE 4.4. COMPARISON OF THE RADIUM REI£ftSED WITH THE SOLUBIE RADItMCCNCENTRATICN IN THREE FREfCH RIVERS
Miningregion
I£L CrouzilleVendéeForez
226Ra ineffluentbeforeBaC£2treat=ment(Bg/C)
161010
Recei=vingriver
Meanflow=rate^ -l.(m-.s ;
GartenpeSevréBesbre
8,195,440,25
Gone, of solubleradium in river
(Bq/£)
Upstream
0.0400.0400.078
Appr. 12km down=stream
0.100.130.31
Amount of solubleradium discharged
into river(Bg/i)
Occur=ringnatural=iy
18112
Due touraniummining
373718
TABLE 4.5.RADIUM CONCENTRATION IN THE EFFLUENT FROM THE PRECIPITATION
POND AT TONO MINE
Unit:
Jan.Feb.Mar.Apr.MayJuneJul.Aug.Sep.Oct.Nov.Dec.
1972 1973 1974
0.0100.0200.0940.0200.0070.0410.0300.030
< 0.004 0.0780.030 0.080
0.0780.030 0.167
1975
0.0100.0440.0300.0440.0300.0400.0440.0400.0400.0300.0400.020
1976
0.0600.0300.0100.0070.0300.0100.0100.0200.0200.0200.030
< 0.004
1977
0.0100.0070.0070.0100.0070.0100.0100.020
110

TABLE 4.6.TOCM. 226Ra CONCENTRATIONS IN «MER USED FOR RECREATION OR WITH FREEACCESS BY THE PUBLIC IN THE WITWRTERSPAND REGION
Sample No
Vie 101/79/6WEB 103/79/6WEB 104/79/6WEB 106/79/6WOR 1/79/1 2WOR 3/79/1 2WOR 4/79/12WOR 5/79/1 2WOR 6/79/1 2WOR 9/79/1 2WOR 10/79/12WOR 11/79/12WOR 12/79/1 2WOR 1 3/79/1 2WOR 1 4/79/1 2W
SV 1/79/1 OWSV 2/79/1 OWSV 5/79/1 OW
B1/79/10WB2/79/10WB3/79/10WB4/79/10WB5/79/10WB6/79/10WB7/79/10WB8/79/10W
Sanpling Site
EAST BAND:
Victoria LakeElsburg StreamElsburg DamBoksburg LakeMiddle LakeJan Smuts LakeGeduld DamCowles DamVogelstruisbult LakeNigel DamNigel Dam outlet (2 km down)WithokspruitRLetspruit (from Sallies)Van Dyk Dam (outlet)Rietspruit (Rooikraal)KLERKSDORP:Vaal River (downstream)Vaal River (upstream)Jagspruit
ORANGE FREE STATE:Bosluisspruit (Beisa Mine)Bore-hole (pt. 2) (Beisa Mine)Bore-hole (pt. 4) (Beisa Mine)Bore-hole (pt. 6) {Beisa Mine)Bosluisspruit (Beisa Mine)Sand River (pt. 1)Sand River (pt. 2)Sand River (pt. 4)
22SRa concentration(Bq/t)
0.0070.0630.0200.0040.0100.0070.0200.0300.1000.1100.0920.0071.6300.0100.044
0.0200.0100.240
0.0070.0070.0200.0070.0040.0100.0200.010
111

TABUS 4.7. BASIC DATA CN THE ANALYSED SEDIMENT AND WATER SAMPLES TAKEN CN 30TH JULY, 1979 AT URANIUM MINEIN NORTHERN BCHEMIA
Sairple*No
4578A910
Radiumconcentration
(Bq/£)
984.70180.7012.1025.010.610.37
Loss ofweight(% w/w)
3.413.36.414.58.24.2
"Fine"fraction
(% w/w)
.9528573428
Radium content (Bq/g)in the fraction
"fine"
.194.5043.5938.671.251.12
"coarse"
.75.961.897.550.330.17
Bariumcontent
(% w/w)
5011.21.51.5
~ 0.05< 0.05
Radium concentrationin water (Bq/l)
dissolved
6.221.220.110.110.030.03
particulate
16.742.411.482.110.160.14
* see sampling places on Fig. 4.1.

TABLE 4.8. RADIUM CONTENT
Sample Ra-226 in soilNo. (Bq/g)
1. 0.10
2. 0.12
3. 0.18
4. 0.22
5. 0.28
6. 0.337. 0.49
8. 0.529. 0.70
10. 4.30
OF SOIL AND GRASS AT
Ra-226 in grass(Bq/kg)
2.10
0.49
4.18
2.00
4.9810.01
11.5711.519.13
101.20
JADUGUDA
Transfer factorGrass x 10~3
21.553.97
13.6
22.03
17.8630.2
23.75
22.03
13.123.56
LEGENDSite 1:Site 2:Site 3:Site 4:Site 5:Site 6:Site 7:Site 8:Site 8A:Site 9:Site 10:
drilling water before purificationdrilling water after purificationmining water before BaSOi, precipitationmining water after BaSO» precipitationoutlet of settling pondwaste channel before discharge into Ploucnice riverPloucnice river below Strazpod RalskemPloucnice river at Mimon ( 12 km downstream)Ploucnice river appr. 3 km downstreamPloucnice river before waste-channel dischargePloucnice river appr. 30 km downstream
DRILLINGWATER MINING
WATER
Neu SO,L k
PLOUCNICERIVER
O 5km
Figure 4.1. Voter system analysed, with sanpling places at uranium mine in Northern Bohemia.(From Progress Report to IAEA entitled "Studies on the source, distribution,movement and deposition of radium in inland waterways and aquifers", byF. Sebesta, P. Benes, J. Sedlacek and B. Havlik. June 1980).
113
REFERENCES
[I] ICRP Report of Committee II on Permissible Dose for InternalRadiation (1959) - Publication 2.
[2] Management, Stabilization and Environmental Impact of Uranium MillTailings (Proc. NEA Seminar, Albuquerque, July 1978).
[3] Uranium Mining Waste Disposai (Proc. 1st Int. Conf., Vancouver,May 1980).
[4] STRAIN C.D., WATSON JR., J.E., FONG S.W., An evaluation of 226Raand 222Rji concentrations in ground and surface water near aphosphate mining and manufacturing facility, Health Phys. 37 (1979)779.
[5] SWIFT J.J., HARDIN J.M., CALLEY H.W., Potential radiological impactof airborne releases and direct gamma radiation to individualsliving near inactive uranium mill tailings piles, U.S. Envir.Protection Agency Rep. EPA-520/1-76-001(1976).
[6] SHREVE JR. J.D., "Putting tailings in perspective radiologically,environmentally and managerially", Management, Stabilization andEnvironmental Impact of Uranium Mill Tailings (Proc. NEA Seminar,Albuquerque, July, 1978).
[7] STAUB W.P., TRIEGEL E.K., "Analysis of disposal of uranium milltailings in a mined out open pit", Ibid.
[8] LAKSHMANAN V.l., ASHBROOK A.W., "Radium balance studies at theBeaverlodge mill of Eldorado Nuclear Limited", Ibid.
[9] MOFFETTD., ZAHARY G., CAMPBELL M.C., INGLES J.C., "CANMET'senvironmental and process research on uranium", Ibid.
[10] MOFFETT D., VIVYURKA A.J., "Control of radium-226 releases inliquid effluents", Ibid.
[II] LEVINS D.M., "Environmental impact of uranium mining and milling inAustralia", Canadian Institute of Mining and Metallurgy (Proc. 9thAnnual Metallurgical Meeting, Toronto, November IS79).
[12] MARTINEC M., HAVLIK B., Private communication.
[13] NELSON J.D., McWHORTER D.B., "Influence of impoundment andsubstractum configuration on seepage from impoundments", UraniumMining Waste Disposal (Proc. 1st Int. Conf., Vancouver, May 1980).
[14] KLUTE A., HEERMANN D.F., Water Movement in Uranium Mill TailingsProfiles, U.S. Envir. Protection Agency Technical Note ORP/LV-78-8(1978).
114

[15] KIRCHMANN R., LAFONTAINE A., CANTILLON G., BOULANGER R., Etüde ducycle biologique parcouru par la radioactivité, Centre d'EtudesNucléaires de Mol - CEN/SCK - Belgique. BLG 477 (1973).
[16] KAUPMANN R.F., EADIE G.G., RUSSELL C.R., Effects of uranium miningand milling on ground water in the Grants Mineral Belt, New Mexico,Ground Water, 14 5 (1976).
[17] EADIE G.G., KAUFMANN R.F., Radiological evaluation of the effectsof uranium mining and milling operations on selected ground watersupplies in the Grants Mineral Belt, New Mexico, Health Phys. 32(1977) 231.
[18] GUREGHIAN A.B., BESKID N.J., MARMER G.J., "Predictive capabilitiesof a two-dimensional model in the ground water transport ofradionuclides, Management, Stabilization and Environmental Impactof Uranium Mill Tailings (Proc. NEA Seminar, Albuquerque, July1978).
[19] KAUFMANN R.F., BLISS J.D., Effects of phosphate mineralization andthe phosphate industry on radium-226 in ground water in CentralFlorida, U.S. Envir. Protection Agency Rep. EPA/520-6-77-010 (1977)
[20] JUSTYN J., STANEK Z., Studies on the contamination of streams bynaturally radioactive substances, Rep. Institute for WaterResearch, Prague 1968 (in Czech).
[21] RUZICKA J., Protection of waters from radioactive contamination,7th Panel about the Problems of Radioactive Waters, CVTS, Prague1971 (in Czech).
[22] STEGNAR P., KOBAL I.: Radioecology of uranium and radium withspecial reference to a uranium mining area. IAEA-TECDOC-229,Vienna, Febr. 1980.
[23] STEGNAR P., MIHAILOVIC M., KOBAL I., BRAJNIK D.: Radioecology ofuranium and radium with special reference to a uranium mining area,presented at the Res. Coord. Meeting on the Radioecology of theDanube River, München, Oct. 1980.
[24] STEGNAR P., KOBAL I.: Uptake and distribution of radium anduranium in the aquatic food chain, IAEA International Symposium onMigration in the Terrestrial Environment of Long-LivedRadionuclides from the Nuclear Fuel Cycle", Knoxville, USA, July1981.
[25] STEGNAR P., KOSTA L., RAVNIK V., DERMELJ M., BYRNE A.R., KOBAL I.:Radioecology of uranium and radium with special reference to auranium mining area, presented at the 2nd Res. Coord. Meeting onthe Radioecology of the Danube River, Vienna, Nov. 1978.
[26] PASCHOA A.S., BAPTISTA G.B., MONTENEGRO E.G., MIRANDA A.C.,SIGAUD G.M., Ra-226 Concentrations in the hydrographie basins nearuranium mining and milling in Brazil, Low-Level Radioactive WasteManagement Proceedings of Health Physics Society Midyear TopicalSymposium. February 11-15, 1979. Williamsburg, Virginia, U.S.A.EPA-520/3-79-002.
115

Chapter 5
MIGRATION OF RADIUMIN THE TERRESTRIAL HYDROSPHERE
P. BENESDepartment of Nuclear Chemistry,
Technical University of Prague,Prague, Czechoslovakia

5.1. INTRODUCTION
The main migration pathways of radium in terrestrialhydrosphere are outlined in Fig.5.1. Radium can enter natural waters bya number of routes including leaching of uranium ores by ground andprecipitation water, discharge of waste waters containing radium indissolved and/or suspended form, seepage from tailings ponds and leachingof radium from waste solids. Radium released by these processescontaminates ground and surface waters, where it can undergo varioustransformations, can be fixed on the aquifer, deposited in bottomsediments or transported to the sea. The migration of radium proceeds bya combination of natural processes which are, however, often stronglyinfluenced by man. Transport via surface waters is susceptible tochanges induced by industrial or municipal contamination of these watersand by their use for irrigation or technological purposes. Theunderground movement of radium can be affected by mining and explorationactivities, for instance by mine dewatering, by hydraulic effects ofwater released from mines, by interaquifer connections via exploratoryboreholes, etc.
The migration pathways depicted in Fig.5.1 represent a complex,where quite a number of possible combinations exist. In order tosimplify discussion of the pathways it appears more useful to look at theindividual migration media and processes separately, rather than tosystematically describe the overall radium migration in specific sites.As the problems concerning radium migration can be easily groupedaccording to three main topics treated, the following paragraphs willdiscuss the processes of radium release from its sources, radiummigration in ground waters and in surface waters, respectively.
It has been well established that an important role in the migrationof a trace element in an aquatic system is played by the interaction ofthe element with solid phase in contact with the water phase. Of primaryimportance are also physico-chemical forms in which the element exists inwater or in the solid phase. Consequently, both the physico-chemicalstate of radium and the interaction of radium with solid phase are givenspecial attention in this chapter.
5.2. RELEASE OF RADIUM FROM ITS SOURCES
The various sources of radium have been briefly treated inChapters 3 and 4. The aim of this paragraph is to discuss processes bywhich radium is released into the hydrosphere. For this purpose theradium sources can be divided into three groups, listed here in thesequence of their probable environmental Importance as the sources ofcontamination of the hydrosphere with radium:
1. Radioactive waste waters and springs, unless efficientpurification methods are more widely used, waste waters fromuranium mining and milling will continue to be the mostimportant source of radium to surface waters.
119

2. Solids produced or modified by man, containing radium. Themost important sources of this type include uranium orestockpiles, solid wastes from uranium mining and milling,fertilizers, ash from burning fossil fuels, etc. From thepoint of view of radium release to the hydrosphere, thesesources can be subdivided to point sources, like piles orponds, and nonpoint sources, represented by solid particlescontaining radium, dissipated over large areas of earth surface.
3. Natural solids undisturbed by man, like uranium ores and otherores, subores and rocks containing radium. These sourcesrelease radium mainly to ground waters, only exceptionally,when exposed on earth surface, they are leached byprecipitation and surface waters.
5.2.1. Release of Radium With Radioactive Waters
There are three main aquatic sources of radium contaminatingnatural waters: waste waters from uranium and phosphate milling, uraniummine drainage waters and radioactive springs. Particularly the uraniummine drainage waters have a great potential for adverse environmentalimpacts. The fate of radium contained in the water sources depends onthe handling and treatment of the waters, schematically shown inFig. 5. 2., and also on the physico-chemical forms in which radium existsin the original or treated waters.5.2.1.1. Wa_s_te_ water_ f_ro_m__ura rii ™(a) Uranium milling process
Waste water from uranium milling process represents theraffinate from solvent extraction mixed with tailings. Most of theradium contained in this mixture (slurry) is bound to tailingsparticles. Typical ratio of dissolved to particulate forms of radiumranges from 0.5.10"3 to 3.10"3 (Pradel, 1976, Levins, 1979). Theslurry is usually conveyed to a tailing pond where solid particles settleout. The slurries from acid leaching process are often neutralized topH 8—9 by lime addition. The neutralization removes most of dissolvedsulfates and radium (Bakhurov et al., 1965), in the presence of tailings,however, the concentration of dissolved radium can even increase (Levins,1979). Typical ranges of concentrations of radium and other dissolvedcontaminants in the waste waters derived from uranium milling process aregiven in Table 5.1.
(b) Physico-chemical forms of radium in such watersVery little information exists on the physico-chemical forms in
which radium exists in such waters. However, because of the high sulfateconcentration remaining in the water even after its neutralization(2-8 g.l"1 according to Levins, 1979), a significant part of thedissolved radium must be present as neutral ion pair RaSO^. From thedata given in Table 5.1. the percentage abundance of the ion pair amongthe dissolved forms of radium can be calculated using the stabilityconstant K1(RaS04)= 102' 3 (Benes et al., 1982). A roughcalculation, neglecting the effect of ionic strength and of other
120

equilibria In which sulfate anions participate, leads to the values of70% for 2 g «I"1 S0$~ and 98% for 50 g.l"1. The calculationindicates that the predominant form of radium dissolved in uranium millwaste waters can be neutral ion pair RaSU4 rather than Ra "*" cation,which may have important consequences (see below). It should beemphasized that formation of solid phase consisting of radium sulfateonly is impossible at the concentrations of radium typical for the wastewaters, since neither the solubility product (Kso=10~l0.37f Sillenand Martell, 1964) nor the molecular solubility (as RaS04,
O"7'94, Benes et al., 1982) of radium sulfate can be exceeded.
(c) Uranium tailing ponds; a possible source of contamination of groundand surface watersBecause of the high concentration of dissolved radium in uranium
mill waste waters these waters should be purified before the discharge tonatural watercourses. However, there remains a possibility ofcontamination of ground and surface waters by seepage of the unpurifiedwater through the tailings dam. The seepage can reach as much as 10000m- .d"! from one tailings dam (design data, Levins, 1979), butgenerally the seepage flow will be substantially lower. Klute andHeermann (1978) worked out a mathematical model of water movement inuranium mill tailings profiles which considers hydraulic conductivity andwater retention of several fractions of tailings material (clay, silt andsand sized particles). Although the model is not designed to predict theseepage rate from a tailings pond, the data gathered and their treatmentprovide useful information on the seepage.
In order to prevent contamination of surface and ground waters,seepage from tailings ponds is sometimes drained or collected and theneither pumped back to the pond or purified before discharging towatercourses. Even if such precautions are omitted, however, the adverseimpact of the seepage is often lessened due to significant adsorption ofradium on the tailings. For instance the analysis of seepage returnwater of a tailings pond in New Mexico revealed rather low concentrationof radium (0.18 Bq.l~l), contrasting with very high activity ofthorium-230 and uranium in the same water (Eadie and Kaufmann, 1977).Rahn and Mabes (1978) found a few hundred times faster migration of waterthan of radium in tailings impoundments. Marple and Zettwoog (1980)reported that water passing through tailings dam contained about the sameconcentration of chlorides as the tailings pond water but its radiumcontent was much lower. The radium retention probably depends on thematerial and construction of the dam. That is why in other cases theconcentrations of radium in seepage were rather high (see, e.g., Kaufmannet al., 1976, who reported 1.9 Bq.l"1 and U.S. EPA, 1975, 2.4 Bq.l"1).
Several attempts have been made to mathematically analyze radiummovement in tailings dam. Zettwoog (1980) recently devised a model basedon one-dimensional diffusion equation considering also the adsorption(*)of radium on particles of a watertight barrier. Using this model a good
(*) To avoid confusion it is noteworthy that the term adsorption denotesin this chapter any process leading to concentration of radium fromsolution onto the surface of solids except for co-precipitation andbiological uptake, i.e. it includes physical adsorption,chemisorption and electrostatic adsorption (including also ionexchange, cf. Benes and Majer, 1980).
121

agreement between calculated radium concentrations in seepage water andexperimental data was obtained (Marple and Zettwoog, 1980). Modelsuitable for the solution of radium transport in lined and unlinedtailings pond was described by Gureghian (1979). It is worthwhile toemphasize that when using mathematical models, the effect of thecomposition of seeping water on the physico-chemical form of radium andon the adsorption of radium on tailings has to be considered.Particularly the concentration of sulfates and of cations mightsubstantially influence the migration of radium, through its effect onthe formation of RaS04 ion pair and on radium adsorption,respectively. Consequently, the input data for the model cannot be basedon experiments carried out in other conditions than those encountered inthe specific site.
(d) Waste water from mining and milling of phosphatesFurther important aquatic source of radium are waste waters from
mining and milling of phosphates. Particularly waters in gypsum ponds(byproduct from phosphate milling) contain high concentrations ofdissolved radium (1.8-3.7 Bq.l~l) and can contaminate ground waters byseepage and sinkhole collapse (Kaufmann and Bliss, 1977). Suchcontamination, however, remains poorly documented.
5.2.1.2. U.ra_ni.u2. m_ine_draJLnage^ water_s_
(a) Origin and natureMine drainage waters can be subdivided into mining waters,
flowing from a mine shaft/pit and directly affected by mining activities,and drilling waters from relief dewatering boreholes around the mine.The main difference between the two types of water lies in the content ofsuspended solids, which is very low in drilling waters and sometimes veryhigh in mining waters. Consequently, the drilling wa ers contain radiummainly in dissolved forms, whereas a large percentage of radium in miningwaters can exist in particulate form (see Table 5.II.). The chemical andphase compositions of drainage waters are variable and depend on themineral being mined, its geological and hydrologie environment, miningmethods and phases. Drilling waters are usually representative ofambient conditions in the ore body or in its proximity, whereas thecomposition of mining waters is affected by the disruptive nature ofmining and by chemical or bacterial processes, mainly oxidation. Thelatter fact explains why, although rather stable in time, the compositionof mining waters strongly depends on the mining phase and technology.
Typical variables characterizing or determining the physico-chemicalstate of radium in uranium mine drainage waters are shown in Table 5.II.,based on the data presented by Bakhurov et al. (1965), Justyn and Stanek(1968), Hanslik and Mansfeld (1970), U.S.EPA (1975, 1979) and Sebesta etal. (1981). It is noteworthy that due to the paucity of availableinformation the values presented are internally inconsistent and onlyillustrate possible variations in the parameters listed.
The particulate forms of radium in mining waters probably representmainly radium bound to suspended particles of uranium ore or radiumadsorbed on the dispersed rock. Sebesta et al. (1981) found a goodcorrelation between the contents of the particulate radium and ofsuspended solids in mining waters from an underground mine. This was
122

considered as an indication of a nearly constant content of uranium orein the solids. Analysis by the method of selective dissolution (Benes etal., 1981) showed that about 24% of the radium contained in the samesolids was soluble in IM HC1 and 21% of the radium was probablyincorporated in insoluble rocks as it could not be liberated even by hotalkaline solution of ethylenediamineteraacetic acid.
(b) Purification of mine drainage waters and its effectsIf significant concentrations of radium and other dangerous
contaminants are present in mine drainage waters, an efficientpurification should be applied before these waters are discharged towatercourses. Prior to the purification, mining waters are oftenconveyed to sedimentation pond to remove suspended solids which couldinterfere with the purification process. Concentration andphysico-chemical forms of radium in purified mine drainage waters dependon the nature of waters to be purified and on the purification methodemployed. For instance dissolved radium has been shown to remain thepredominant form of radium after ion exchange purification of drillingwaters, whereas radium forms in mining waters changed towardspredominance of particulate radium after purification of the waters bycoprecipitation with barium sulfate and sedimentation (Sebesta et al.,1981, see also Table 5.II.). Analysis of the particulate radium in thelatter case revealed that mainly barium-radium sulfate remained in thepurified water, other particulate forms of radium being effectivelyremoved by the sedimentation (Benes et al., 1980). The ratio ofsuspended to dissolved radium has been shown to be in linear correlationwith the same ratio found for barium (Sebesta et al., 1981), indicatingthe validity of homogeneous distribution (Chlopin) law forcoprecipitation of radium with barium sulfate (cf. Benes and Majer,1980). It appears that concentration of barium is the main factordetermining the form of particulate radium in such waters.
From the average sulfate concentration in purified and unpurifiedmine drainage waters, assumed equal to 100 mg.l~l, and from thestability constant of RaS04 ion pair (see above) it can be calculatedthat the relative abundance of the ion pair among dissolved radium formsin such waters will be equal to or less than 10.5%. Carbonate complexesof radium can probably be entirely neglected* since their stabilityconstants are too low (Benes et al., 1982). Thus Ra^+ ion appears tobe the predominant form of dissolved radium in mine drainage waters.
5.2.1.3. Radio_ac_tiye_The environmental impact of radioactive springs is generally
believed to be rather small, despite the sometimes large concentrationsof radium in such waters (up to tens or hundreds Bq.l"-'-, see forinstance Belousova and Shtukkenberg, 1961, and O'Connell and Kaufmann,1976). This is because the occurrence and water flow of highlyradioactive springs are comparatively low. However, the associatedpollution of the hydrosphere with radium might prove significant in thecase of a large scale development of these waters for production ofgeothermal energy as well as for recreational and other purposes. Thephysico-chemical forms of radium in spring waters are very little known.Iwasaki (1969) tried to explain the mechanism of precipitation of radiumcontained in Japanese hot springs by coprecipitation with insolublecarbonates and ferric hydroxide.
123

5.2.2 Release of Radium From Solids Produced By Man
5.2.2.1. The^ Importance_of_ l eachlng_P£p
The processes leading to the release of radium from solidsproduced or modified by man can be schematically depicted as shown InFig.5.3. Although the physico-chemical mechanism of radium release frompoint and nonpoint sources may be essentially the same, the differentcharacters of these sources create different conditions for the releaseand thus it is worthwhile to distinguish them.
By far the greatest attention has been paid to the release of radiumfrom uranium mine and mill tailings, as these sources represent thelargest body of accumulated radium contained in solids produced by manand a potential source of the hydrosphere contamination long after themining and milling activity that created them ceased. In some places,transport of radioactivity from uranium tailings has been identified as amajor cause of radioactive pollution of surrounding watercourses (see forinstance Roy and Keller, 1976, and Mansfeld and Hanslik, 1980).
Further important point sources of radium are ore and suborestockpiles, slime tailings from phosphate mining (Guimond and Windham,1975), gypsum wastes associated with phosphoric acid plants (U.S.EPA,1973), solid wastes from water purification processes like barium-radiumsulfate (sometimes stored in lagoons - see Bryant et al., 1979) andsludges from municipal water treatment plants (Schliekelman, 1976), etc.Release of radium from the latter sources, however, has been onlyscarcely studied.
Very little information exists particularly on radium release fromdissipated solids, as investigation of this process in nature isdifficult to carry out. Furthermore, contribution of the process to thecontamination of the hydrosphere with radium is often believed to besmall which, however, need not be always true. For instance phosphatefertilizers can contain significant amounts of radium (about 1.6 Bq.g~laccording to Guimond and Windham, 1975). Also the windblown dust fromtailings and uranium ores can represent a substantial contribution ofradium to surface runoff.
5.2.2.2. Research_on l_eaching_pro£essetsjcarri£d_out_in_ labor_a_tpr_y_throug_hba_tch_exp^riments_Most of the research concerned with leaching of radium from
various solids was carried out in laboratory. The main factors affectingthe extent and kinetics of radium release were investigated,predominantly in batch experiments. These factors include the nature,composition, pretreatment and dispersity of solids, composition, volumeand flow rate of the leaching solution. The first three factors largelydetermine the form and bond of radium in the solids and significantlyinfluence the overall chemical composition of the leachate due todissolution of macro-components of the solids.(a) Effects of the nature of solids
The effect of the nature of solids was demonstrated by lyengar et al.(1979) who found that river water and distilled water leached virtually
124

no radium from monazite ore, whereas leachability of uranium ore rangedfrom 0.005% to 0.018% of the radium contained in the sample and that ofuranium ore tailings was about ten times higher. Solutions of IMammonium acetate and 0.05M hydrochloric acid leached more than one orderof magnitude higher amount of radium from uranium ore tailings than fromlignite fly ash. The higher leachability of uranium ore tailings wasexplained by a labile state of radium in ore attacked by milling and bychemicals. Havlik et al. (1968) also found higher leachability ofuranium mill tailings than of uranium ore.
(b) Effects of the leaching conditions
Most of the leaching experiments were carried out with uranium milltailings from the acid leach process. It has been found that kinetics ofradium liberation from the tailings is very rapid, maximum liberationbeing achieved after 90 s - 30 min if the suspension is well stirred(Shearer and Lee, 1964, Havlik et al., 1968, Levins et al., 1978, Levins,1979). With the exception of the first quoted paper, the authorsobserved decrease in the concentration of liberated radium after themaximum. Ryan and Levins (1979) interpreted the rapid initialdissolution of radium as being controlled by mass transfer either fromthe surface of the particles or from readily accessible pores. Thesubsequent decrease was explained by the increase of sulfateconcentration in solution due to dissolution of sulfates from tailings,which induced reprecipitation of radium. These findings suggest that asignificant part of radium rests on the surface of tailings particles.No direct data on the chemical form of the surface radium is availablebut it can be assumed that the radium is coprecipitated with barium orcalcium sulfate.
The primary factor affecting the percentage of radium leached fromtailings has proved to be the ratio of the volume (V) of the leachingsolution to the weight (m) of the leached sample, V/m or liquid/solidratio. According to Levins et al. (1978) the almost linear increase withV/m of the percentage of radium leached by demineralized water, observedby them (see Fig.5.4.), is analogous to dissolution of sparingly solublesalt. Shearer and Lee (1964) found a more complicated effect of V/m.The amount of radium leached with distilled water did not increase untila certain threshold value of V/m was reached. The increase above thisvalue was rather steep but it slowed down reaching eventually a maximumleached amount. The effect of liquid/solid ratio was greater for acidleach mill tailings than for tailings from alkaline leach process,probably due to different quantitites of sulfates associated with the twosorts of tailings. The percentage of radium leached at a given V/m ratiowas reported by the authors to depend on the quantity of solids (or thetotal radium reservoir), which is difficult to explain.
Several authors studied repetitive leaching of one sample of tailingswith fresh portions of leaching solution (Misawa et al., 1964, Shearerand Lee, 1964, Levins et al., 1978, Ryan and Levins, 1979). From theresults reported it can be concluded that the amount of radium leachedwith consecutive portions of the solution generally decreases and thecharacter of the decrease depends on the leached sample, composition ofthe leaching solution and the liquid/solid ratio. For instance Shearerand Lee (1964) and Levins et al. (1978) observed the largest drop in theconcentration of radium in leachate in the first leaching stages, whereasMisawa et al. (1964) found such drop only after eight leaching stages.
125

The latter authors explained the drop as being due to complete removal ofcalcium sulfate containing the easily soluble part of radium. The closeinterrelation of cummulative amount of radium leached and of the V/mratio is demonstrated in Fig.5.5.
(c) Effects of the nature of the leaching solutionsMost of the leaching experiments were carried out with water, either
pure (distilled, demineralized) or natural. It is certain, however, thatthe composition and pH of the water changes in contact with the tailingsdue to dissolution of tailings soluble components. In order to check thepossible effects of such changes as well as the effects of variablecomposition of natural or waste waters, experiments were undertaken withleaching solutions of variable composition and pH. Analysis of thepH-effect carried out by Havlik et al. (1968) and lyengar et al. (1979)has led to the conclusion that radium liberation from tailings onlymoderately depends on pH in the pH region 2-13, whereas a substantialincrease in the liberation was observed at pH 1-1.6. On the other hand,Levins et al. (1978) described a more pronounced pH-effect, dependingalso on the liquid/solid ratio and concentration of sulfates (seeFig.5.6.). The difference between the two findings may be due todifferent type of tailings studied as well as to different V/m ratio.
Havlik et al. (1968) studied the effect of several cations at 0.01,0.1 and IM concentrations on the leachability of radium from tailings.They found that almost all radium present in tailings can be liberated byIM solutions of potassium and sodium chlorides. The leaching abilitydecreased in the order KC1> NaCl> CaCl2> MgCl2, the addition ofbarium chloride to water actually diminished the release of radium. Theauthors explained their results by the assumption that radium is bound intailings by adsorption on clay minerals. However, besides of thecompetitive effect of added cations in such adsorption the results mightalso be explained by the effect of added salts on the solubility ofbarium sulfate, carrying radium. The latter explanation is supported bysome data published by Ryan and Levins (1979), indicating increasedrelease of barium from tailings due to addition of sodium chloride whilerelease of calcium and strontium remained almost unchanged after theaddition.
Levins et al. (1978) and Ryan and Levins (1979) investigated theeffect of certain salts in more detail. They clearly demonstrated thatincreased concentration of sulfates in leaching solution stronglysuppresses radium release from tailings (see Fig.5.7.). This correlateswell with another finding by the same authors that a larger content ofsulfates in tailings is connected with lower leachability of radium. Thelinear dependence of the percentage of radium leached on theconcentration of sulfates (Fig.5.7.) can serve as further argument infavour of the release of radium via the mechanism of barium sulfatedissolution. Negative effect of sulfates on radium leachability wasfound also by Shearer and Lee (1964) who reported that more radium wasreleased from tailings contacted with distilled water than from the sametailings contacted with river water, containing sulfates.(d) Effects of the composition of tailings
Very few concrete data can be found on the effects of tailingscomposition and pretreatment on radium leachability, although previousdiscussion has indicated at least some qualitative differences among
126

various tailings. Ryan and Levins (1979) found difference amongdifferent samples of tailings in the percentage of radium that cannot beextracted from the tailings even after prolonged, multistage treatmentwith 3-5M Nad. These effects merit further study, in which particularlythe bond of radium in tailings should be quantitatively characterized.Method of selective dissolution (Benes et al., 1981) can be used for thispurpose.(e) Effects of natural processes and biota
Leachability of tailings might be significantly influenced also bynatural processes, for instance by bacterial oxidation or ageing oftailings. The bacteria (for instance Thiobacillus f errooxidans) areassumed to promote the oxidation of ferrous ion to the ferric state,leading in the presence of pyrite to the formation of sulfuric acid. Inorder for T. f errooxidans to function in biological oxidation of sulfides,the pH must be below 4 (preferably in the range from 1.5 to 3) and oxygenmust be available. The biological leaching is also affected by thetemperature, the rate of leaching decreasing as the temperature decreases(below 35°C).
Bacterial activity has been noticed as deep as three metres intailings piles (Mrost and Lloyd, 1971). Some laboratory experiments toassess the effect of bacterial oxidation on radium release from tailingsare currently being conducted in South Africa (De Jesus et al., 1980).The ageing effect has been observed by Levins et al. (1978), who havealso shown that the dispersity of tailings particles and temperature haveonly a small influence on the percentage of radium leached.
The laboratory experiments have proved that significant amounts ofradium could enter water phase if uranium tailings were discharged into ariver. Although the rate of the release would be probably low due to thesulfate content of natural water and the leached amount would decreasewith time, the tailings particles deposited on river bed and scouredduring high water flows would represent a long lasting source of radiumto the water environment. Therefore it is imperative to prevent bothintended and inadvertent discharge of uranium tailings to watercourses.5.2.2.3. Research_o ri _leachi ng_pr_o ce s s__c arjri ed out iii labpr_a_tpry_throu_gh
s imulat e_d_pi_le_ cp nd ijt ipns_Several model experiments were undertaken to study the leaching
in simulated pile conditions. These experiments consisted of packing thematerial to be leached in column. The content of radium in the effluentfrom the column was measured as a function of the time or the volume ofwater passed and as a function of composition of solids or leachate.
A rather extensive study of this type was done by Bryant et al.(1979), who investigated leaching of radium with water (the flow rateequivalent to 41, 82 or 460 mm precipitation per month) from abandoneduranium mine tailings, lime treated abandoned tailings, abandonedtailings with top layer of Ba(Ra)SU4 sediment, fresh tailings,chemically fixed fresh tailings, mixture of sewage sludges andrevegetated tailings and mixture of chemically fixed and sludgedrevegatated tailings. The composition of the abandoned tailings wasquartz, pyrite, calcium sulfate (from neutralization by lime atdischarge), metal hydroxides etc., the pH value of seepage or runoff
127

water from these tailings ranged from 1 to 3. The fresh tailings werecharacterized by a substantially higher pH of water in contact with them:the pH of leachate from untreated tailings was about 7.5, the chemicallyfixed tailings stabilized it at about 12. The leaching experiments weresupplemented with the study of radium release from untreated orchemically fixed sediments of Ba(Ra)S04 in a simulated settling pond.The sediments came from the purification of seepage and runoff watersfrom abandoned mine tailings carried out by the addition of lime (topH 9) and barium chloride. No details of the chemical fixation are givenbut the fixation was probably done by the method proposed by Rubinsky(1975). The authors arrived at the following findings and conclusions:
1) Leaching of radium from abandoned (treated or untreated)tailings was approximately constant for the first 12 months,radium-226 activity ranging from 0.7 to 3.7 Bq.l"1. Duringthe next five months the activity of radium in leachateincreased to 3.7-6.5 Bq.l"1. The water flow rate (41 or 82mm) exerted little influence on the leachability of radium inthe first 12 months, whereas the higher water rate leached moreradium in the next five months. However, the highest water flowrate led eventually to the same activities of radium in leachateas those found with the lowest rate (see Table 5.III.).Addition of lime to the top of column had no apparent effect onthe leachability of radium. On the other hand, the top layer ofBa(Ra)SO sediment increased radium activity in the leachateby about 30% or more except at the highest flow rate.Consequently, lime applied to the surface of abandoned tailingssites at rates recommended to support revegetation should haveno effect on the radium leaching, whereas recycling Ba(Ra)S04sediments resulting from the treatment of seepage and runofffrom abandoned mine tailings back to the surface of these sitesis not an acceptable disposal method.
2) Leachability of radium-226 from the chemically fixed freshtailings was considerably lower than from the non-fixedtailings. The application of sludge to the fresh tailings (bothfixed and non-fixxed) resulted in an increased activity ofradium in leachate, probably due to degradation of the organicsin the sludge(Table 5.IV.).
3) Leachability of radium-226 from the sediment Ba(Ra)S04 wasrather low: activities in the leachate did not exceed 0.33Bq.l"1 226] . Chemical fixation of the sediment resulted insubstantial decrease of the leachability.
Levins et al. (1978) found, in similar experiments with uranium milltailings leached with demineralized water, that radium concentration inleachate decreased initially but after a few months approached a constantvalue of 0.9-11 Bq.l"1. This concentration was approximately the sameas that measured in aged, neutralized tailings slurries. The volume ofwater that passed through the column was the most significant factoraffecting the amount of radium leached.
Kurokawa and Kurosawa (1980a) compared leachability, by rain water,of untreated uranium ore and of the same ore preliminary leached withsulfuric acid. About one ton of the ore was placed in cylinder 0.6-1 min diameter and exposed to natural precipitation. Rain water passing
128

through the ore column was collected and analyzed monthly for radium. Ithas been found that relative solubility of radium, expressed as Bq.l~lper ^ig of radium in the ore, amounted to 1.5.10~2 ±n the first 600 1of rain water passing through the treated ore, whereas it was about1.1.10"* after more than 2000 1 of rain water passed through theuntreated ore. The easier elution of radium from the treated ore wasexplained by the porous structure after the treatment and by the sulfuricacid remaining in the ore, which decreased pH value of the passing waterfrom 7.5-8.7 to 2.7-3.7. The difference found, however, might also be atleast partially ascribed to the different volumes of water passed throughthe treated and untreated ores.
Movement of rain water in tailings piles was mathematically modelledby Klute and Heermann (1978). The authors came to the conclusion thatunder limited rainfall conditions, any significant vegetative cover onthe tailings pile would use all the available precipitation, leavinglittle or no water to flow to greater depths in the pile. They alsoconcluded that rainfall could penetrate to the watertable even in aridclimates.
5.2.2.4. J[n_si. tu £tjjidiesData on actual release processes from solids occurring in nature
are scarce. They are mostly confined to random observations in thevicinity of uranium mines or mills, indicating local surface watercontamination immediately downstream from tailings or spoils piles (seefor instance Mansfeld and Hantflik, 1980, Shinpaugh et al., 1980b). Anindication of radium release from point solid sources need not be soughtonly by the analysis of waters related to the source. Because of theability of soil to bind radium (see 5.3.), the data on radium content insoil underlying the source or close to it can also be used for thispurpose. For instance Shinpaugh et al. (1980ab) detected in this wayspread of radium around an inactive uranium mill site. Similar findingswere made elsewhere (U.S.EPA, 1979). De Jesus et al. (1980), on theother hand, analyzed the underlying soil of a 40 years old tailingsimpoundment and concluded that the contamination of the soil by radiumfrom the tailings was very low, indicating a low mobility of radium inthe tailings.
Analyses of soil and water samples in the neighborhood of tailingspiles revealed that tailings particles are sometimes transported by water(Shinpaugh et al., 1980a, U.S.EPA, 1979, Kribek et al., 1979). Theparticle transport depends on erosion of the pile and therefore can begreatly reduced by revegetation or other stabilization of the pile(U.S.EPA, 1979).
5.2.3. Leaching of Radium in Ground Waters
5.2.3.1. jfetural. £rp_ce_s es_ leadi_ng_ tp_the_re_leas_e_Processes leading to the release of radium from rocks to ground
waters are sometimes denoted as "primary" migration, in contrast to"secondary" migration of the released radium in ground waters, minedrainage waters and surface waters. From the general knowledge of thefactors affecting dissolution of minerals in ground waters (see, e.g.,
129

Posokhov, 1969, and Garreis, 1976), it can be deduced that transition ofradium from a rock to ground water will be determined by the type of therock (due to variable solubility of rocks or variable physico-chemicalstate of radium in rocks), by composition of ground water,characteristics of the water movement, temperature and time interval ofcontact of the water with the rock. The release can be studied either bymodel experiments or by correlating radium contents found in groundwatersamples« Because of the very complex character of natural processesleading to the release, the analysis of the effect of individual factorson the release can be more easily done by model experiments and thereforemost of the information discussed here was obtained in the laboratory.
5.2.3.2. .Influe nce_ of _th_e_nat ure_ and_ of _the_tjx_tu £e_of_ the_ r_O£kj3jj>tudies)
Some results of experiments with uranium and thorium ores havealready been mentioned in the previous paragraph (5.2.2.). Starik andcoworkers (Starik, 1959, Starik and Lazarev, 1959) found thatleachability of radium from different minerals considerably differs. Thesame conclusion can be drawn if the results obtained by different authorsare compared: for instance Starik 's data with those published by Havliket al. (1968) and lyengar et al. (1979). In the comparison, it isnecessary to take into account possible effect of the liquid/solid ratio,discussed in 5.2.2.
Zaborenko et al. (1959) and Starik and Lazarev (1960) observed apronounced effect of particle size of monazite on the leachability ofradium. The percentage of radium leached for instance with 0.2Mhydrochloric acid (without a significant dissolution of the ore)increased from 0.39% for 3-5 mm particle size to 3.0% for less than 0.07mm. The effect was explained as due to the greater surface area ofcrushed ore and to a change in adsorption properties of the surface, andwithout doubt represents one of main reasons why the release of radiumfrom rocks is enhanced by weathering process.5.2.3.2. nfluence
Considerable discrepancy exists among the results of variousauthors as to the effect of leaching solution composition. Severalauthors reported an enhanced release of radium due to increasingconcentration of salts in leaching solution, but the order of cationsobtained by comparing their leaching effect was very different. Starik(1959) reported the order
H+ > Ba2+ > Pb2+ > Sr2+ > Ca2+ > K+^a+for unspecified minerals, whereas data by Havlik et al. (1968) correspondto the order (Table 5.V. ):
K+>Na+>Li+~ Ca2+~Mg2+> Sr2+~ Ba2+.All the authors explained the effect by the desorption action of thecations added. Lazarev (1959) found that leachability of radium frommonazite increased with the concentration of salts only to a certainlimit, which depended on the acidity of the solution and was differentfor 224Ra and 226 (see Table 5. VI. ). The difference between thetwo isotopes was probably due to their different bond in the mineral.Acidity of water was also reported to affect solubility of radium fromminerals. Starik (1959) found a pronounced increase in radiumleachability from monazite at pH lower than 4, Havlik et al. (1968)observed only moderate effect with uraninite (Table 5.V.).
130

Study of the kinetics of radium release has revealed (Havlik et al.,1968) that the release in laboratory conditions is a rapid process,maximum amount of radium being leached after about 30 min. contact. Theauthors described a decrease in radium concentration after the maximum.The time course of concentration of a species dissolved in solutionpassing through a maximum is quite common in leaching and dissolution ofminerals and soils, particularly at low liquid/solid ratios (Lerman,1979). It indicates simultaneous occurrence of dissolution andadsorption or precipitation. Lerman (1979) presented a general theory ofthis phenomenon.
Starik's (1959) results pointed to an important role of diffusion inthe leaching process. The leached amount rapidly decreased in a seriesof consecutive leachings with fresh portions of solution, but it reachedthe original value after the leached sample was left to recover for 1.5year. The latter effect and other results led Starik (1959) to theconclusion that mechanism of radium release from minerals (rocks) withoutdissolution of the minerals is characterized by three stages:
1) Radium migrates from crystal lattice of the mineral, where it isformed in an interstitial position (except for 228] ), to thincapillaries or pores in the mineral. The migration is due torecoil energy of the formation or due to diffusion.
2) Adsorption equilibrium is established between radium in thecapillary water of the mineral and radium on the capillary wall,whereby most of radium is adsorbed on the wall.
3) During the contact of the mineral with ground water, radiumcontained in the capillary water diffuses out of the capillaries(if suitable concentration gradient exists) and can be desorbedfrom the capillary walls.
The combined effect of the recoil and diffusion explains differencesfound between relative leachability of genetically bound isotopes ofradium from the same rock specimen (monazite, uraninite, see Starik,1959, and Zaborenko et al., 1959).5.2.3.3. I n s t i
When extending the conclusions drawn from laboratory experimentsto ground waters it must be kept in mind that the rate and magnitude ofin situ leaching will be probably lower than those found in laboratoryexperiments, as the partial degradation of rocks during their mining orlaboratory grinding, oxidation of the rocks in contact with theatmosphere and their possible bacterial attack in laboratory experimentscan substantially increase leachability of the rocks. However, some ofthe conclusions were corroborated by analyses of ground waters. Forinstance Kaufmann and Bliss (1977) found that radium-226 levels in groundwaters from Sarasota Country in Florida increase with salinity of thewaters, in accordance with the results of laboratory experimentsmentioned above. Tanner's (1964) results indicated an increasedconcentration of radium in ground waters enriched in chlorides, pointingto the role of chloride anion in dissolution of radium from rocks.Kanroji et al. (1979) came to the conclusion that increased concentrationof calcium in thermal springs of Shirahama spa can be the principalfactor of occurrence of radium in the spring water.
131

According to Tokarev and Scherbakov (1956), concentration of radiumin natural waters is determined by a complex of physico-géographie,geologic, hydrogeologic, physico-chemical, physical and biologicalfactors. In a rough analysis of available data on radium content innatural waters, the authors distinguished ground waters from sedimentaryrocks, siliceous igneous rocks and uranium deposits. The secondimportant parameter considered was whether the corresponding aquifersystem was stagnant or circulating. The highest value of mean radiumconcentration was reported for stagnant ground waters from sedimentaryrocks ( ~ 11 Bq.l"-'- 226 3) whereas stagnant waters from siliceousigneous rocks were found to contain an average 0.15 Bq.l~l 226&a an(jcirculating waters from both the types of rocks contained only 0.07Bq.l~l. The average content of radium-226 presented for waters fromuranium deposits was 2.2-3.0 Bq.l~l. Further data but without anextensive analysis can be found in Scott and Barker (1962), White etal.(1963), Mansfeld and Zajicek (1969) and Kaufmann and Bliss (1977).
Apart from the uranium ores and other rocks untouched by man thegroundwater leaching of radium can also take place in underground or openpit mines and in abandoned mines backfilled with tailings. Impact ofsuch leaching on ground water quality can be enhanced by the higherleachability of disrupted, oxidized ore in mine as well as of thetailings than of the undisturbed ore (cf. above). These processes,although likely, remain little documented. Similarly, the ground waterquality impacts of in situ (solution) mining are poorly known. Someindication of the occurrence of such processes can be found from data onradium concentration in waters from abandoned mines and in water fromwells adjacent to mines. For instance Wukasch and Cook (1972) found alarge radium activity in a well situated close to an active uranium mineand in water from inactive mines filled with ground water. In contrast,water in an exploratory well drilled into an unmined ore body containedten times less radium.
5.3. MIGRATION OF RADIUM IN GROUND WATERS
Our knowledge of radium migration in ground waters is notsatisfactory. Of the relatively few data published on this problem, mostwere obtained by analyzing water samples from wells in proximity ofsurface point sources of radium. The information gained in this way isrelated mainly to the infiltration process, some conclusions can bedrawn, however, also on the lateral migration.
5.3.1. Information Gained on the Infiltration Process
5.3.1.1. RemovaL of radium àuri nginf iltr»t onThe infiltration of radium containing water through soil,
subsoil and rocks represents probably the most important kind ofgroundwater migration from the point of view of contamination of groundwaters with radium caused by man. The Information gathered as yet seemsto indicate that such contamination has been relatively low, particularly
132

when compared to the contamination of ground waters with othercontaminants from the same sources. For instance Kamath et al. (1972)and lyengar et al. (1979) found very little increase of radium activityin wells adjacent to uranium mill tailings pond during 3-4 years, whileconcentration of uranium, sulfates, chlorides and water hardnessincreased very significantly (see Table 5. VII.). An extensive study ofthe impact of uranium mining and milling on ground waters was undertakenby U.S. Environmental Protection Agency in New Mexico, where a largeseepage from tailings ponds occurred (U.S. EPA, 1975, 1979). Despite theseepage, little contamination of shallow aquifers was found. Similarly,data on radium concentration in ground waters indicated that extensivephosphate mining and milling in Florida probably did not appreciablychange radium-226 levels in Florida ground waters (Kaufmann and Bliss,1977).
The low contamination cannot be explained only by the dilution ofinfiltrating waste waters with ground waters and therefore points to anefficient mechanism of radium removal from the infiltrating water. Thismechanism is generally believed to be the high adsorption of radium onsoil, subsoil and rocks (see, e.g., Justyn and Stanek, 1968, and U.S. EPA,1979).5.3.1.2.
Laboratory experiments on radium adsorption by soil wereundertaken by Kirchmann et al. (1973) who determined distributionconstant (Kp) of radium between solution and two types of soil andfound that radium adsorbs more on peat (Kp = 1500-2500 cm .g"!)than on sand (KD = 150-200 crn g"1).
Strong binding of radium in soil has been documented by leachingexperiments with soil samples containing high amounts of radium, eithernatural (Shuktomova et al., 1978), or from uranium refinery wastedisposal (Phillips and Nathwaniyi, 1978). In the first case, three kindsof radium bond were distinguished in turf-meadow and gley-highly podzolicsoils. The authors came to the conclusion that proportions of thesebonds vary in depth and depend on the physico-chemical properties of thegenetic horizons, but most of the radium in soil is well fixed. Thisconclusion well corresponds with findings by the latter authors thatleaching of radium from soils under simulated natural conditions israther slow and diffusion-controlled.
5.3.1.3. ield daaandnodellingon vert±caltransferKribek et al. (1979) studied vertical distribution of radium in
soil profiles in an area of uranium mining. They found that thedistribution depends on the type of soil profile. In the case offlood plain soil significantly contaminated by radium due to periodicalflooding with river water receiving mine effluents, about 79% of theradium contained in the top 60 cm of the soil was cumulated in thesurficial layer (0-10 cm) and 18% was in the 10-25 cm layer. Latterfinding seems to substantiate results obtained by Justyn and Stanek(1968) who calculated the movement rate of radium during seepage of waterthrough a soil layer using relations suggested by Boenzi et al. (1965)and Dlouhy (1967). Applying the value of 2000-3000 cm3 "1 for thedistribution constant Kp and 3-5 g.cm~3 for ratio of mass to porevolume of the soil, they arrived at the rate of radium movement equal to
]33

or less than 10~7-10~8 cm.s~*. The authors stated that themigration rate could be further slowed down by soil clogging andswelling. The calculation related to the case of seepage of neutralwater and did not consider the effect of acidity which could enhancemobility of radium in soil (see Phillips and Nathwani, 1978). However,the retardation of the migration in ground waters of radium released withacid wastes would be aided by rapid neutralization of the wastes in soillayer or by mixing with ground waters (Kaufmann and Bliss, 1977).
A mathematical model of radium migration considering the adsorptionand neutralization effects during seepage of acid wastes through anonhomogeneous aquifer has been suggested by Gureghian (1979). Theauthor calculated isopleths for several relative concentrations of radium(C/C0 = 0.005, 0.05 and 0.8 where C/CO is the ratio of radiumconcentration at a given site to its original concentration at thebeginning of migration) and for the migration periods of 5, 20 and 30years. Analysis of the results has shown that the rate of migration ofradium from surface acid wastes can be quite appreciable for the initialperiod of 5 years after which it decreases. The calculated migrationpath for C/C0 = 0.005 and 20 years does not exceed several hundredmeters. Rather low Kp values were assumed ( SI100 cm .g-l).Similar calculation quoted by U.S.EPA (1979) resulted in much smallermovement of radium in ground water beneath and adjacent to a uranium milltailings pond: several meters after 20 years.
The conclusions drawn above for seeping waste waters can be extendedfor the infiltration of dissolved radium coming from other, nonpolntsources like irrigation, fertilizers, radium containing dust etc., sincethe migration mechanism is the same. Because particulate radium is alsoretained in soil due to filtration effect, the soil layer appears to bean efficient barrier preventing or reducing contamination of groundwaters from all kinds of surface radium sources. Where the soil layer islacking, the route of radium from surface sources to ground waters isprobably easier. Although this is poorly documented, the easiest routeof radium to shallow ground waters should be infiltration through barestream beds, whereas seepage from settling ponds does not seem torepresent so easy route because of the self-sealing effect of finesediments (U.S.EPA, 1979).
5.3.2. Information on Migration of Radium in Aquifers
5.3.2.1. Fieia_ d_a_ta_jon Ipngitud±nal_migration_Information on the lateral migration of radium can be derived
from data related to locations where seepage from surface point sourcesevidently contaminated the underlying or adjacent ground waters« Radiumcontent in samples of well water is to be evaluated as a function ofdistance from the surface source and of the direction. However, areliable analysis of radium migration from such data can be made only ifsufficient information on movement of ground water and on the propertiesof aquifer is available and if the "background" activity of radium in thegiven area is low and sufficiently stable. Generally such an analysis isimpeded by the fact that a high radium content in ground water can alsobe a natural phenomenon and not necessarily indicative of the migrationfrom the surface source (Kaufmann and Bliss, 1977). Natural radium
134

concentrations from 0.0037 to 370 Bq.l~* were reported for groundwaters (Tokarev and Shcherbakov, 1956).
Several cases of local contamination of ground waters with radiumfrom surface sources have been described in the literature (Bakhurov etal., 1965, Justyn and Stanek, 1968, Kaufmann et al., 1976). In all thecases, the extent of contamination rapidly decreased with distance fromthe source, indicating rapid immobilization of radium, probably due toadsorption on soil. A strong interaction of radium with rock followsalso from the experience gained from injection of radium containingwaters into deep wells. Lynn and Arlin (1962) found that 0.028 m3 ofrock is capable of adsorbing about 10~'g of radium by ion exchange.
To the author's knowledge, no distant groundwater migration of radiumfrom surface sources has been described. However, the occurrence ofradioactive waters sometimes found in a large distance from theirprobable natural source might indicate a long range migration of radium.Determining role in this respect belongs mainly to the hydrogeologicconditions in the aquifer, such an occurrence being more probable inaquifers with a large water circulation, for instance in sedimentary rockaquifers (Mansfeld and Zajicek, 1969). The migration of radium will alsodepend on the physico-chemical form of radium and on the composition ofground waters. Salinity of some types of ground water which is known toenhance radium solubility from rocks (cf. 5.2.3.) probably promotes themobility of radium due to suppressing its adsorption on aquifer.5.3.2.2. Inte r_a jjulf £r
Interaquifer migration of radium is very poorly known. From thedata published so far it can be concluded that the natural infiltrationof surface waters contaminates only shallow aquifers. It is improbablethat radium thus added will reach deep bedrock aquifers (U.S. EPA, 1979).An example of the interaquifer migration of radium imposed by man can befound in the data presented by Kaufmann et al. (1976). Monitoring thechloride and uranium concentrations in the vicinity of an injection wellwhere waste waters containing large amounts of contaminants includingradium were injected, the authors detected leakage from the injectionzone, situated more than 100 m beneath the monitoring well. Theconcentration of radium in the monitoring well was 10 times higher thanthe average background in that area, indicating upward movement ofradium. The interaquifer movement of contaminants casts doubts on thesuitability of the injection as a disposal method for radioactive wastes(Kaufmann et al., 1976).
5.3.3. Physico-chemical Form of Radium in Groundwaters
Almost no data exist on the physico-chemical form of radium inground waters. It is very likely that the particulate or colloidal formsof radium will be rare in undisturbed ground waters due to the filtrationeffect and due to the large surface area of aquifer available for surfaceadsorption and precipitation processes. A large underground reservoirwith a small solid surface to water volume ratio may be an exception asfar as colloidal forms are considered. Water samples taken from wells orfrom springs need not represent the actual state in ground waters since
135

they can be affected by contact with atmosphere and by dispersion ofsolid particles during sampling. Eadie and Kaufmann (1977) determinedthe average abundance of particulate forms of radium in water taken fromthree wells to be 24%. The data given for drilling waters in Table 5.II.were much lower. Among the soluble forms of radium the RaSO^ ion paircan again prove important as sulfate concentrations in ground waters maybe rather high (values as high as 9.23 g.l were reported by White etal., 1963). Because of the extremely high content of HC03 ion insome waters (up to 15.2 g.!"-"- according to White et al., 1963), neitherthe formation of hydrogencarbonate and carbonate complexes of radium canbe ruled out.
5.4. MIGRATION OF RADIUM IN SURFACE WATERS
Quite an amount of data has been published on the concentrationof radium in surface waters, both unaffected by man and contaminated withradium due to uranium mining and milling or due to other human activities(see Chapters 3 and 4). Much less information exists on principal lawsdetermining radium migration in surface waters and very little attentionhas been paid to the physico-chemical state of radium in surface waters,althouth the state and its changes form a necessary basis for betterunderstanding the migration.
Natural concentrations of radium in surface waters tend to be ratherlow, varying between 0.001 and 0.3 Bq.l~l for 226 (Tokarev andShcherbakov, 1956, Belousova and Shtukkenberg, 1961, Miyaké et al.,1964). Discharge or seepage of radium containing waters and runoff fromradium-contaminated areas can add to surface waters significant amountsof radium, whose further fate is determined by many factors. In order tofacilitate discussion of the effects of these factors, migration ofradium in surface waters can be subdivided into several stagesschematically depicted in Fig.5.8. (As virtually no data are availableon the migration of radium in runoff water from radium-contaminatedareas, this type of migration has not been included in the scheme). Thediscussion will follow the sequence of the framed processes. Due to theimportance of sediments for radium migration in surface waters, theradium interaction with sediments will be discussed in detail separately(see 5.5.).
5.4.1. Migration in Wastewater Channel
Experience shows that wastewater channel need not be only astream conducting waste water to natural recipient but also a site wheresignificant changes in concentration and/or forms of radium can takeplace. Many waste waters represent disequilibrium systems where rapidchemical reactions occur. For Instance mine drainage waters oftencontain ferrous ions which are oxidized in contact with air. The ferricIron formed in this way hydrolyzes and gives rise to floes of ferrichydroxide coprecipltating part of radium present in waste water indissolved form (Benes et al., 1978). Analysis of waste water purified byprecipitation of barium sulfate and flowing from a settlement pond
136

revealed that the precipitation of barium sulfate can continue inwastewater channel, resulting in significant changes in the abundance ofsuspended forms of radium with time (Sebesta et al., 1980).
Several authors noticed a decrease in radium concentration along thewastewater flow. U.S.Environmental Protection Agency conducted study ofradium movement in mine drainage water in an arid area of New Mexicowhere uranium mine dewatering or mill discharge caused the only flow in adry river channel. Dissolved radium was found to rapidly decrease withdistance (e.g. from 1.1 Bq.l"1 to 0.03 Bq.l"1 in 9.2 km), probablydue to strong adsorption onto the stream sediments (U.S.EPA, 1975,1979). An analysis of migration of radium released with tailings pondwater during an accident in New Mexico also led to the conclusion thatradium was rapidly removed from the waste water by sorption orprecipitation (U.S.EPA, 1979).
The radium removal in wastewater channel can strongly depend on thecharacter of the channel. For instance Sebesta et al. (1978) noted asignificant change in sedimentation of radium in a wastewater channel dueto regulation of the channel. After the regulation most of the sedimentswhich originally settled down in the channel were transported intoreceiving river.
5.4.2. Mixing With Receiving Natural Waters; the Deviations From theMixing Law and the Role of Solid-liquid Interactions
The process of mixing (waste) waters containing dissolved andparticulate radium with natural receiving waters is connected with twoimportant effects on the concentration and forms of the radium: effect ofdilution and of change in water composition. Dilution has been shown tobe the principal factor leading to decrease of radium concentration inriver systems (see for instance lyengar et al., 1978, Kobal et al., 1978,U. S. EPA, 1979, Sebesta et al. , 1981). The effect of dilution with streamwater can be generally expressed by the formula (mixing law)
where cx is the concentration of radium (total or of some of its forms)after the dilution and cw, cs, Qw, Qs are the correspondingconcentrations of radium in waste water (w) and in stream water (s)before the mixing and the corresponding flow rates, respectively.Validity of this formula for dilution of radium containing waters wasexamined by several authors. Justyn and Stanek (1968) analyzed theeffect of dilution of uranium mine effluents with river water on theconcentration of radium downstream from the effluent discharge at severallocalities in Czechoslovakia and claim that the cx value calculatedusing the above formula has to be multiplied by a correction factorranging from 1.2 to 2.5 in order to get the correct (measured) radiumconcentration. The authors did not discuss why the mixing law was notvalid in the studied cases. Sebesta et al. (1981) found a goodcoincidence between the calculated and measured values of cx fordissolved, particulate and total radium at the confluence of uranium minewaste waters purified by precipitation of barium sulfate and of a smallriver (see Table 5. VIII.). The coincidence indicated that other factorsthan the dilution were unimportant there or their effects werecounterbalanced. Such processes as adsorption of radium on river water
137

suspended solids or stabilization of the concentration of dissolvedradium by dissolution of its particulate forms were probably too slow tosignificantly affect the concentration about 1 km downstream of theconfluence.
Both these processes are, however, frequently encountered during thedilution and are responsible for changes in concentration andphysico-chemical forms of radium sometimes extending far downstream fromthe mixing point. They are caused by a change in the composition ofwater containing radium which can occur in the mixing. On one hand,radium dissolved in waste water comes into contact with solid particlessuspended in natural water and can adsorb on them. Because of theadsorption, concentration of dissolved radium sometimes rapidlydecreases. For instance Pradel (1976) reported more than 70% decrease ofdissolved radium in river water only 2 km below the discharge of uraniummine and mill effluents. Similar, although not so pronounced decreasewas described by Tsivoglou et al. (1960), lyengar et al. (1978) and DeJesus et al.(1980) . Kirchmann et al.(1973) found that the ratio ofdissolved to particulate forms of radium in river water decreased withdistance from the point where the river water was contaminated with wastewaters containing mainly dissolved radium.
On the other hand, composition of water phase can be significantlychanged by the mixing which can lead to a change in the dissolved formsof radium and/or to a change in the abundance and nature of particulateforms of radium. These effects are poorly documented for radium buttheir probability follows from common principles and from the possibilityof radium release from sediments, discussed in the next paragraph. It isto be expected, for instance, that dilution of waste waters containinghigh percentage of radium in particulate forms with natural water willcause dissolution or desorption of radium from suspended solids resultingin a decrease in abundance of the particulate forms. This effect isdifficult to detect as the decrease in abundance of the particulate formsis usually ascribed to their sedimentation. However, it can be sometimestraced from an increase in the absolute concentration of dissolved radiumwith distance from the discharge point (see for instance lyengar et al.,1978) or from unexpectedly low effect of dilution on the concentration ofdissolved radium.
The effect can explain why Justyn and Stanek (1968) found higherconcentrations of radium in river water below discharge of waste watersthan those calculated from mixing rule, or why Bouquieaux (1968) observeddecrease in abundance of particulate forms of radium from 75-99% to 20%after dilution of water containing 1.6 Bq.l~-^ 226fta withuncontaminated river water. An evidence of dissolution andreprecipitation of particulate forms of radium induced by dilution hasbeen given by Sebesta et al.(1981). The authors found an equilibriumdistribution of radium and barium between dissolved and particulate formsto exist in mine drainage waters purified by precipitation of bariumsulfate. The equilibrium distribution obeyed homogeneous distributionlaw valid for isomorphous coprecipitation of radium with barium sulfate(Benes and Majer, 1980). Soon after dilution of the purified waters withriver water the distribution of both elements was significantlydistorted, but the original distribution was restored 13 km downstreamfrom the dilution point. The restoration could take place only due torecrystallization of barium-radium sulfate.
138

5.4.3. Migration in Natural Streams
5.4.3.1. Dissolved ami art culate rms of radium nnat uralsr eaiasThere are two basic forms of radium migration in surface
streams: migration in solution and migration in suspended solids. Thesemigration forms, corresponding to dissolved and particulate radium , areclosely interrelated and are obviously connected with bottom sediments ofstreams via sedimentation of suspended solids and resuspension of bottomsediments. Any advanced study of radium migration therefore has toinvolve differentiation between the dissolved and particulate forms ofradium. Perhaps it is worthwhile to mention in this connection thatfiltration through filter paper is not suitable for such adifferentiation as paper can adsorb significant amounts of dissolvedradium (Erbacher and Nikitin, 1932).
(a) Mechanisms of interaction occurring during migrationThe ratio of the migration forms of radium in streams is largely
determined by the processes of adsorption of dissolved radium on streamsuspended solids and by dissolution or desorption of radium from thesolids. These processes were discussed in previous paragraph. Theirkinetics and other quantitative characteristics are poorly known, sincerelatively few data are available on the changes observed in naturalstreams and even the existing data are sometimes difficult to interpretbecause of complicating effects of dilution and other natural processes.Precipitation of sparingly soluble radium compounds can be excluded as aprocess affecting radium migration in surface waters for the same reasonsas already mentioned in paragraph 5.2.1. However, coprecipitation ofradium with foreign solids is possible, for instance coprecipitation withferric hydroxide is probable in river water receiving untreated minedrainage waters (Pradel, 1976).(b) Nature of dissolved and particulate forms
Very few data exist on the nature of dissolved and particulate formsof radium in surface waters. Many authors have assumed that radium isdissolved in such waters only as hydrated cations Ra^+, which is notcorrect in view of the presence of sulfates in most surface waters and,consequently, of the possible formation of radium sulfate ion pair (cf.5.2.1.). Simple calculation suggests that the abundance of the ion paircan be significant ( >5%) in waters containing more than 43 mg.l"~^ freesulfates. Benes and Obdrzalek (1980) analyzed the dissolved forms ofradium in little polluted river water and in river water contaminatedwith purified (by precipitation of 83804 and sedimentation) uraniummine effluents. Radiotracer method in combination with free-liquidelectrophoresis was employed. The results indicated presence of someelectrophoretically immobile (neutral) forms in amounts exceeding maximumpossible abundances of RaSO^ ion pair. Very probably some organiccomplexes or radium were present whose abundances were = 14% in theunpolluted river and =11% in the contaminated water.
Benes et al. (1980) analyzed particulate forms of radium in the sameriver water samples as indicated above using method of selectivedissolution (Benes et al., 1981). Four different forms of particulateradium were distinguished: "loosely bound" (L.B.), "acid soluble" (A.S.),
139

radium coprecipltated with barium sulfate (BaSO ) and radium "incrystalline detritus (C.D.). The results shown in Table 5.IX. revealedthat particulate radium was predominantly barium-radium sulfate in theriver water contaminated with purified mine effluents. The sameconclusion has been drawn for the same samples from other results(Sebesta et al., 1981). The bond of radium in solids suspended in theunpolluted river water was considerably different. The main form herewas "acid soluble" form or radium "in crystalline detritus" indicatingprevalence of radium adsorbed on natural solids or incorporated ininsoluble rock particles, respectively.
From the point of view of further migration of radium it is importantthat the proportion of the "loosely bound" form of radium was very low.This form represented radium liberated with 0.1M solution of sodiumchloride and its low abundance suggested that radium would not be easilyredissolved from suspended solids of the given type due to an increase inionic strength of surface water. The same particulate forms of radiumwere further characterized by electrophoretic method. Suspended solidscarrying ^^^Ra were labelled with radium 224 and their electrophoreticmobility was determined (Benes and Obdrzalek, 1980). The lowelectrophoretic mobility found indicated very low surface charge (zetapotential) of the solids.
5.4.3.2. Sedimentation^ a_nd_ r_e_su_spensi n__pr_o_ce_ss s_Among the most important natural processes affecting migration
of radium in streams belong sedimentation of suspended solids andresuspension of bottom sediments. Both the processes strongly depend onthe velocity and turbulence of stream flow, and their relative importancefor radium migration is proportional to radium content in suspendedsolids and in bottom sediments. Some information on the processes can bederived from general knowledge of factors affecting suspended load ofstreams. For instance Lerman (1979) described concentration of suspendedsolids in streams C as a function of river discharge Q using equation
log C = log A + m.log Qwhere m and A are constants highly varying from one river to another.
(a) Analysis of radium content in river bottom sediments
Importance of sedimentation for radium migration has been clearlydemonstrated by a number of authors who found that radium content inriver bottom sediments is strongly enhanced below the discharge of radiumcontaining waters into a river (see, e.g., Tsivoglou et al., 1960,Pradel, 1976, lyengar et al., 1978, U.S.EPA, 1979). Consequently, radiumcontent in sediments has been suggested as a good indicator for waterpollution with radium (Tsivoglou, 1963). Particularly the fine dispersedfractions of sediments are well suitable for this purpose (Mansfeld andHanslik, 1980).
Several authors described a pronounced decrease in radium content ofriver bottom sediments with distance from the discharge point (see Table5.X. and lyengar and Markose, 1970, Parsont, 1967, Kirchmann et al.,1973, Sebesta et al., 1978, 1980, Kurokawa and Kurosawa, 1980b).Character of the decrease generally depends on the character of theriver. In the areas of uniform velocity of river flow and in the absenceof significant time variations in the flow rate (absence of flood
140

scouring) the decrease tends to be monotonous, usually exponential(Parsont, 1967, Kurokawa and Kurosawa, 1980b). If, on the other hand,the stream velocity varies with distance due to varying character of theriver, fluctuations in radium content of sediments can be observed (e.g.Marple and Zettwoog, 1980, Sebesta et al., 1980). All these findings areeasily explainable in terms of common sedimentation principles (see forinstance Lerman, 1979).
The irregular distribution of radium in river bed sediments along theriver can also be due to resuspension, transportation andre-sedimentation of the sediments during high flow rates or floods. Thescouring and transportation of sediments containing radium were detectedin many places but are poorly understood. Their extent is rather sitespecific. For instance Parsont (1967) observed no significant movementof radium containing sediments in a creek system during periods of highflow rate which was reflected in the lack of seasonal variations inradium concentration in the sediments. On the other hand, lyengar etal.(1978) found much higher contents of radium in river bed sedimentsbefore monsoon flood than after it (see Table 5.X.). Temporal variationsof radium in sediments indicative of successive scouring and removal inflood flows were also detected in Shirley Basin area in Wyoming (U.S.EPA,1979). A long range transportation of radium containing sediments hasbeen reported by Tsivoglou (1963) and Pradel (1976).
The "leap frog" mechanism of radium transport in sediments isparticularly important in arid areas where radium is concentrated in drysedimentts during dry periods and resuspended and transported in floods(Australia, New Mexico, Wyoming - see Williams, 1976, U.S.EPA, 1979).The U.S. Environmental Protection Agency developed model pertaining forsuch a case which describes movement of radium in a river basin.Calculations using the model for conditions prevailing in Wyoming or NewMexico have shown that radium 226/228 dissolved in flood water due toscouring of the sediments would not exceed 0.26 Bq.l"-"-.
(b) Analysis of data on radium concentration in river waterThe sedimentation and resuspension processes can also be studied by
analysis of data on radium concentration in river water. Either changesin the radium concentration with water flow rate at one site or changesalong the stream can be evaluated. Although the analysis of some ofavailable data is complicated by simultaneous effect of dilution and/orby uncertainty as to whether dissolved or total radium was measured, thedata corroborate common rule that for a given system, increasing flowrate tends to diminish the sedimentation and to increase theresuspension. For instance Stanek (1973) found approximately linearincrease in radium concentration in river water with increasing riverflow rate at a river profile far downstream of discharge of uranium mineand mill effluents.
A number of authors described a decrease in radium concentrationalong a stream which could not be explained by dilution (Parsont, 1967,Justyn and Stanek, 1968, Hanslik and Mansfeld, 1973, Kurokawa andKurosawa, 1980b, Sebesta et al., 1981). The decrease can be ascribed tosedimentation of particulate radium. Re suspension of sedimentscontaining radium was first noticed by Tsivoglou et al. (1958) who founda direct relationship between suspended activity and stream flow rate.
141

Similar relationship is demonstrated in Table 5.XI. by data adopted fromHanslik and Mansfeld (1973) and Sebesta et al.(1981). The resuspensionis also indicated by the downstream increase of radium concentration inriver water during periods of high water flow (see Table 5.XI. and databy lyengar and Markose, 1970).
The effect of sedimentation and resuspension can be most easilyanalyzed from the changes in the ratio of dissolved to particulate radiumin water. As shown in Table 5.XI. the ratio decreases with increasingflow rate at a given site. Below certain ("critical") flow rate theratio increases along the stream due to sedimentation of particulateradium. Above the critical value resuspension of bottom sedimentsprevails and the ratio decreases with distance. The critical value offlow rate without doubt depends on the character of stream and also onthe amount of bottom sediment which accumulated at the given rate (conferthe different ratios in Table 5.XI. at sites A and B and those measuredseveral years apart at the same stream). The latter fact can alsoexplain why for instance the ratio of dissolved to particulate radiumfound at the end of the spring high flow was substantially higher thanthat observed at the beginning of the spring flow or during a flashflood, although the flow rate was approximately the same (Benes et al.,1980). The reason lay in exhaustion of transportable radium-containingsediments after the prolonged high flow. It is interesting that thedifference was accompanied at one site by a significant difference in thecharacter of radium bond in suspended solids.
Because of many factors influencing it, the ratio of dissolved toparticulate radium in streams considerably varies from time to time andfrom site to site (Hanslik and Mansfeld, 1973, Kirchmann et al., 1973,Sebesta et al., 1981). Values from 0.01 (for a small river receivingeffluents from phosphoric acid plant - Bouquieaux, 1968) to 24 (forlittle polluted river - Kurokawa and Kurosawa, 1980b) have beenreported. However, no distinct seasonal variations have been foundexcept for the effect of river flow rate discussed above.
A closer analysis of the data presented in Table 5.XI. reveals thatthe concentration of dissolved radium in the river water little dependson flow rate, except for the lowest values of the flow rate. At higherflow rates the concentration increases along the stream, although noadditional source of dissolved radium was present in the studied system.These findings point to redissolution of radium from resuspended bottomsediments, which counterbalances the effect of dilution and brings aboutthe downstream Increase in dissolved radium concentration. Theredissolution was assumed already by Tsivoglou et al.(1960) who claimedthat a large fraction of dissolved 226 ±n Animas river downstream ofuranium mill resulted from leaching of river bed deposits. Similarly,lyengar et al. (1979) explained the comparatively high radiumconcentration in river waters during monsoon periods by solubilization ofradium bound in sediments.
The redissolution of radium gives rise to the question how largequantities of radium can be released in this way. This problem has beenstudied by laboratory experiments and will be treated in paragraph5.4.7. From the laboratory and field (New Mexico) data U.S.EPA(1979)concluded that only 10% of radium deposited in sediments will go backinto solution in flood waters. The importance of the redissolution innature is probably diminished by sediment burial and dilution. It can
142

also be assumed that certain leachability limit exists, after reaching ofwhich no more radium can be removed regardless of duration, frequency orintensity of agitation.
5.4.4. Migration in Water Reservoirs
Relative importance of sedimentation and resuspension processesis entirely shifted in favour of sedimentation in water reservoirs ascompared with streams. Sedimentation of particulate radium in reservoirscan be strongly enhanced due to absence of larger streaming. It istherefore to be expected that average ratio of dissolved to particulateforms of radium in reservoirs will be higher than in streams. Thisassumption in supported for instance by data by Marple and Zettwoog(1980) who found this ratio more than three times higher in waterreservoir than in river feeding the reservoir. Iskra et al.(1969)determined that the ratio varied from 27.3 to 2.0 in the case of radiumadded to lake water in a glass cylinder, depending on whether bottomsediments were absent or present, respectively. The results alsoindicated possible effect of water plants on the ratio.
Radium distribution and forms in reservoirs are probably moresusceptible to seasonal changes due to stratification, upwelling andbiologic effects, but experimental data demonstrating the changes arevirtually missing. Possible effects of the mentioned processes on radiummigration in reservoirs can be at least partially derived from thegeneral theory of sedimentation in lakes treated comprehensively byLerman (1979). The author quoted (p.367) unpublished data by Imbodenaindicating a uniform distribution of radium with depth in a freshwaterlake.
Natural resuspension of bottom sediments in deep reservoirs is veryunlikely and therefore such sediments represent a nearly permanent sinkfor radium. A larger probability of radium release from sediments existsin shallow reservoirs (several meters deep), particularly in thosecharacterized by a variable water level or by well developed watercurrents. Justyn (1973) compared radium concentrations at the inlet andoutlet of a shallow pond contaminated with waste solids from uranium mineeffluents and found about 10% release of radium from the pond. Therelease was dependent on scouring of sediments whose intensity increasedwith decreasing water level.
Stanek (1973) determined concentrations of radium in water and bottomsediments of a reservoir created by river dam. The variations in theconcentrations along the reservoir profile from river inlet to dam outletwere rather low, the highest concentrations were found near the riverinlet. The latter finding indicates partial sedimentation of radium inthe reservoir. The average retention of riverborn radium in thereservoir found by the author was 18%. However, relative abundance ofsuspended forms of radium increased from 27% at the river inlet to 30% inthe water leaving the reservoir (below the dam), which points to somecomplicating effect, probably to scouring bottom sediments in a vicinityof the near-bottom outlet of the dam.
143
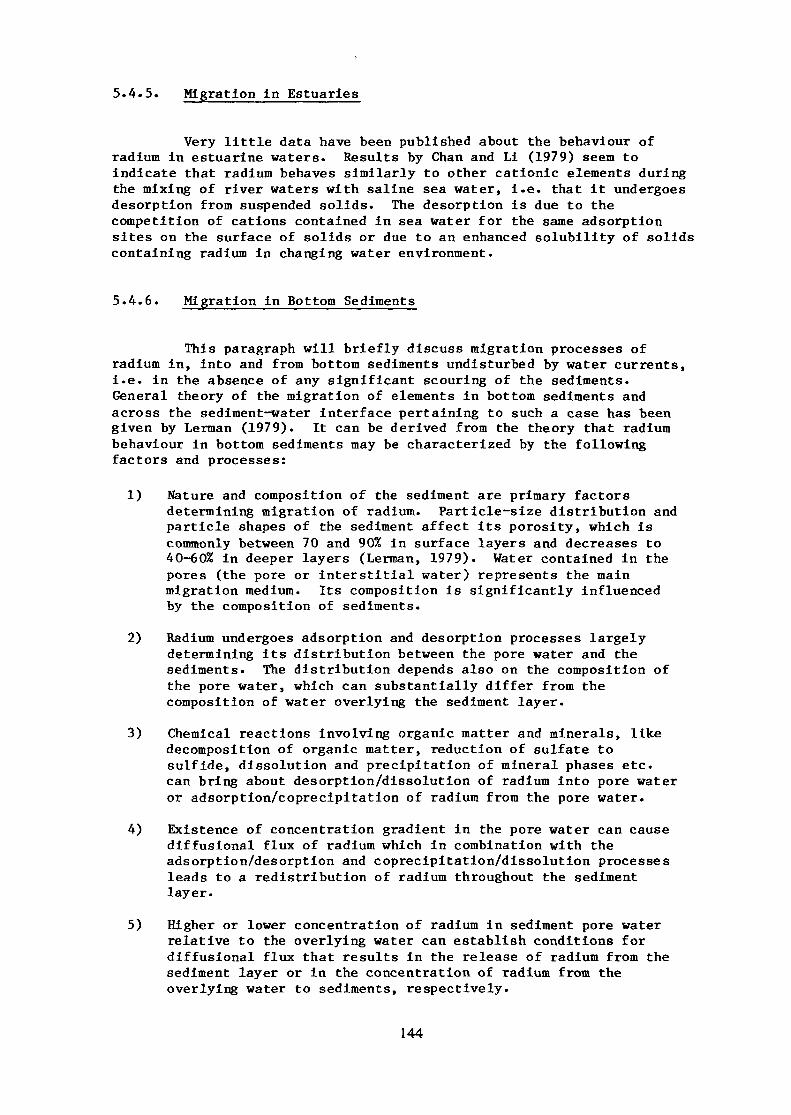
5.4.5. Migration in Estuaries
Very little data have been published about the behaviour ofradium in estuarine waters. Results by Chan and Li (1979) seem toindicate that radium behaves similarly to other cationic elements duringthe mixing of river waters with saline sea water, i.e. that it undergoesdesorption from suspended solids. The desorption is due to thecompetition of cations contained in sea water for the same adsorptionsites on the surface of solids or due to an enhanced solubility of solidscontaining radium in changing water environment.
5.4.6. Migration in Bottom Sediments
This paragraph will briefly discuss migration processes ofradium in, into and from bottom sediments undisturbed by water currents,i.e. in the absence of any significant scouring of the sediments.General theory of the migration of elements in bottom sediments andacross the sediment-water interface pertaining to such a case has beengiven by Lerman (1979). It can be derived from the theory that radiumbehaviour in bottom sediments may be characterized by the followingfactors and processes:
1) Nature and composition of the sediment are primary factorsdetermining migration of radium. Particle-size distribution andparticle shapes of the sediment affect its porosity, which iscommonly between 70 and 90% in surface layers and decreases to40-60% in deeper layers (Lerman, 1979). Water contained in thepores (the pore or interstitial water) represents the mainmigration medium. Its composition is significantly influencedby the composition of sediments.
2) Radium undergoes adsorption and desorption processes largelydetermining its distribution between the pore water and thesediments. The distribution depends also on the composition ofthe pore water, which can substantially differ from thecomposition of water overlying the sediment layer.
3) Chemical reactions involving organic matter and minerals, likedecomposition of organic matter, reduction of sulfate tosulfide, dissolution and precipitation of mineral phases etc.can bring about desorption/dissolution of radium into pore wateror adsorption/coprecipitation of radium from the pore water.
4) Existence of concentration gradient In the pore water can causediffusional flux of radium which in combination with theadsorption/desorption and coprecipltation/dissolution processesleads to a redistribution of radium throughout the sedimentlayer.
5) Higher or lower concentration of radium in sediment pore waterrelative to the overlying water can establish conditions fordiffusional flux that results In the release of radium from thesediment layer or in the concentration of radium from theoverlying water to sediments, respectively.
144

6) Sediment deposition rate, which can vary from milimeters per1000 yr in the pelagic ocean to centimeters per year in lakes,man-made reservoirs and near-shore oceanic areas, significantlyaffects probability of radium release from the sedimentts as itdetermines the rate of burial of deeper sediment layers.
7) Groundwater inflow to a stream or reservoir can bring about anupward flow of sediment pore water and release of radium fromsediments, significant in case of a continuing dissolution ordesorption of radium from sediments to the pore water.
8) Activity of bacteria and benthic organisms (generally confinedto the upper few centimeters of the sediment column) may affectradium migration due to radium uptake by these organisms, totheir effect on the chemical reactions in sediments or tobioturbation of sediments.
The relative importance of these factors and processes for radiummigration remains little documented by field data. There exists only anindication that the vertical redistribution of radium in sediment column(ad 4) is rather slow: several authors reported that radium discharged tosurface waters contaminated only the surficial layers of sediments(Justyn, 1973, Stanek, 1973, Kirchmann et al., 1973, Kribek et al.,1979). Stanek (1973) studied vertical migration of radium in sédimentlayers taken from bottom sediments of river dam arid placed in glasscylinder in the same sequence as was that in the dam. Some of theexperiments were carried out with addition of 226 into the toplayer. Both the "labelled" and unlabelled experiments led to theconclusion that the downward migration of radium was very slow. Forinstance only 3.6% of the radium added to the homogenized top 20 cm ofthe sediments migrated in one month to the 20-30 cm layer and 1.6% to the30-40 cm layer. Some additional information can be obtained from studiesof radium interaction with sediments, discussed in the followingparagraph.
Mathematical models similar to those describing the groundwatermigration of radium can also be construed for migration in bottomsediments (Lerman, 1979). However, the complicated nature of themigration and scarceness of input data pertaining for radium makeusability of such models very problematic.
5.5. DISTRIBUTION OF RADIUM BETWEEN WATER AND FRESHWATER SEDIMENTS
5.5.1. Different Approaches for Studying Interaction of Radium WithFreshwater Sediments
In view of the well established importance of sediments forradium migration in surface waters a number of authors tried to obtaindata characterizing interaction of radium with freshwater sediments. Theefforts have been directed towards investigation of uptake (mainlyadsorption) of radium by sediments and release (desorption ordissolution) of radium from sediments. Some of the data obtained werediscussed above, other investigations were based on the analysis ofcorrelation between radium contents in natural sediments and composition
145

or other properties of the sediments. However, major part of theinvestigations has been carried out by laboratory experiments. Ttoogeneral approaches have been adopted:
1) investigation of radium distribution between natural water oraqueous solution and natural sediments;
2) study of radium distribution between water phase and modelsolids representing components of natural sediments»
Principal advantage of the second approach lies in simpler interpretationof the distribution but data obtained in this way can usually serve onlyas complementary for data characterizing natural sediments.
Distribution of radium between water phase and sediment can beinfluenced by the following factors:
- duration of contact between water and sediment,- ratio of volume of water to the amount of sediment (liquid/solidratio or V/m),
- composition and granulometric properties of sediment,- composition of water phase,- nature of radium bond in sediment.
For the discussion of the effects of these factors it is worthwhile todistinguish between studies concerned with uptake and release of radium.
5.5.2. Studies Concerned With Uptake of Radium by Sediments
Uptake of radium by sediments can proceed by several mechanisms:adsorption of radium on the surface of sediment particles,coprecipitation of radium with foreign solids coating the surface ofsediment particles, incorporation of radium into components of sedimentduring their recrystallization and biological uptake of radium byorganisms living in sediment. Relative importance of these mechanisms islittle known, as most studies carried so far were confined to rathersimple investigation of radium distribution between water and sedimentsas a function of several main factors. More can be expected in thisrespect from a detailed study of the distribution and particularly fromthe analysis of radium bond in sediments, for instance by the method ofselective dissolution (Sebesta et al., 1980).
5.5.2.1. umti ying olid-llquji mt er acti onsLaboratory studies of radium uptake by sediments have dealt
mainly with radium adsorption as can be seen from rather rapid kineticsof radium uptake in well mixed systems, reflected in uptake of more than90% of the "equilibrium" value during the first 10 min. - 2h contact(Hanslik and Mansfeld, 1973, Stanek, 1973, Mansfeld, 1977). Biologicaluptake and incorporation by recrystallization would be probably muchslower processes, coprecipitation from artificially prepared solutions orfrom natural water can mostly be excluded in laboratory experiments.Hanslik and Mansfeld (1973) and Mansfeld (1977) found that kinetics ofradium adsorption on sediments depends on pre treatment of sediment.Drying of sediments generally slowed down the subsequent adsorption butthe effect was rather low. Furthermore, moderate effects of sedimentparticle size and of liquid/solid ratio on the kinetics were noted.
The liquid/solid ratio (V/m) has again been identified as a primaryfactor affecting the extent of radium adsorption by sediments (Hanslikand Mansfeld, 1973, Mansfeld, 1977, Mansfeld and Hanslik, 1980). The
146

effect of V/m on ionic adsorption is generally expressed using relationKD fc (ma/ms).V/m
where ma and ms are amounts of radium adsorbed and remaining insolution, respectively, and Kp is distribution constant. Consequently,many authors used Kp also for characterization of radium distributionbetween water and solids (see 5.3. and Stanek, 1973, U.S. EPA, 1979,Marple and Zettwoog, 1980). However, the effect of V/m on radiumadsorption by sediments is not simple, as demonstrated in Table 5. XII.It can be seen that the distribution constant Kj> increases withincreasing V/m.
From the inconstancy of KQ value pertaining to one type ofsediment, Mansfeld (1977) concluded that the distribution constant Kpis not suitable parameter for characterizing adsorption properties ofsediments for radium. In a thorough study of radium adsorption on 25different river sediments the author came to the conclusion that for eachsediment certain maximum percentage of radium adsorption (A x) existswhich cannot be exceeded by further decreasing V/m. He suggested toexpress the effect of V/m on percentage of radium adsorption (A) bysediments using adsorption isotherm
m/VA = K/A^x + m/VA^where K is a constant (equal to m/V at A = 0.5 Ajj,ax). By a statisticalanalysis of available data the author corroborated validity of theisotherm and concluded that A^ax and K are parameters well suitable forcharacterization of the ability of sediments to adsorb radium.Alternatively, modified distribution constant can be used for the samepurpose, defined as (Mansfeld and Hanslik, 1980)
KD = A. ax-Ari.V.aT1.The values of K found for 25 river bed sediments lay in the range from14.8 to 2866 mg.l"1, Kp varied between 360 and 17400 cm3.g~1for 5river sediments.
Statistical analysis of available data revealed significantcorrelation between parameter K and content of fine fraction in thestudied sediments (Mansfeld, 1977). Dependence of K (in mg. l"1) onpercentage abundance in sediment of particles smaller than 0.1 mm(FO.I) was described by equation
K = (0.0012 F0>1 + 0.0081)-1.This finding agrees well with data characterizing relation between radiumcontent in fractions of natural sediments and granulometric properties ofthe fractions. Parsont (1967), Hanslik and Mansfeld (1973) and Sebestaet al. (1978, 1980) found that fine fractions of river bed sedimentscontained more radium per gram than coarser fractions of the samesediments. Consequently, radium is concentrated mainly in fine fractionsin accordance with common rule that adsorption per gram increases withincreasing specific surface area of adsorbent. Shearer and Lee (1964)reported an independence of radium content of sediment particle size forriver sediments contaminated with uranium mill waste solids. Reason forthis difference probably lies in the different mechanism of sedimentscontamination .5.5.2.2. Roleof
Little is known about the effect of composition of sediments ontheir ability to adsorb radium. Mansfeld (1977) came to the conclusionthat no significant correlation exists between this ability, expressed
147

via parameter K, and content of organic matter in 25 differentsediments. Similar conclusion was drawn by Justyn and Stanek (1968) andSebesta et al.(1980) from data on radium content in river bed sedimentsand on percentage weight loss by ignition of the sediments. In contrast,Parsont (1967) found direct relationship between the radium and organicscontents.
Several authors tried to elucidate the effect of sediment compositionby analysis of radium adsorption on model substrates representingindividual components of sediments. Kribek et al.(1979) studiedadsorption of radium on ferric hydroxide, which is an important componentof sediments in waters receiving mine effluents. It has been found thatthe adsorption ability of ferric hydroxide is larger than that of soilsbut it decreases with the age of ferric hydroxide. Benes etal.(unpublished results) compared adsorption of radium on ferrichydroxide, kaolinite, quartz sand and silica in a broad range ofconditions and concluded that the adsorption increases in the order
kaolinite> ferric hydroxide > quartz sand> silica at pH 6and
ferric hydroxide >kaolinite ~quartz sand ~silica at pH 8.An extensive study of this type was carried out by Mansfeld and Hanslik(1980). Table 5.XIII. presents data by the authors characterizingadsorbability of radium on 8 minerals. It has been found that the orderof minerals according to their ability to adsorb radium is different fordistilled water and tap water, which was explained by different effect ofions present in tap water on radium adsorption by different substrates.
5.5.2.3. .Influence_ oi:_waj:jïr_comp_o£îit_ip_n_Data shown in Tables 5.XII. and 5.XIII. demonstrate that radium
adsorption on sediments can be significantly affected by watercomposition. In accordance with common principles (see e.g. Benes andMajer, 1980), it is to be expected that increasing salinity of water willreduce radium adsorption, particularly if polyvalent cations arepresent. The effect of pH may also prove significant. For instanceadsorption of radium on ferric hydroxide strongly depends on pH in the pHregion 6-8 (Benes et al., unpublished results). Stanek (1973) studiedradium adsorption on lake sediments from lake water whose pH value wasadjusted with hydrochloric acid or ammonium hydroxide to 1-10. Thehighest adsorption was found at pH 3-5, significant decrease was observedtowards the extreme values of pH. Mansfeld (1977) did not find anysubstantial effect of pH on radium uptake by river sediments in the pHregion 5-7.
5.5.3. Studies Concerned With Release of Radium From Sediments
Although several attempts have been made to study desorption ofradium preliminary adsorbed in laboratory on river bed sediments or theircomponents (Hanslik and Mansfeld, 1973, Stanek, 1973, Benes et al.,unpublished results), most of experimental studies dealt with release ofradium already present in natural sediments.
148

5.5.3.1.It has been shown that kinetics of the radium release from wet
sediments is rapid, an equilibrium being reached in less than 20min.(Hanslik and Mansfeld, 1973, Stanek, 1973, Sebesta et al., 1978).Preliminary drying of sediments tends to slower down the kinetics(Sebesta et al., 1978). Intensity of agitation has been shown to haveonly a small effect on the kinetics of radium release, the "equilibrium1amount of radium that can be released little depends on temperature inthe range of 10-20°C(Stanek, 1973). Shearer and Lee (1964) detected noincrease in the leachability of radium as a result of grinding of riversediments.
5.5.3.2. EquiMbriuin solifr-l±Quid_aind_natural_condjltions_In natural stream conditions sediments are in contact with
flowing water whose radium content can significantly change with time.In order to model the situation when a sediment is continuously broughtinto contact with fresh portions of water having low radium content(model of stream leaching of sediments), release of radium duringconsecutive contacts of one portion of sediment with several freshportions of water was investigated. Shearer and Lee (1964) reported amoderate decrease in the radium release in three consecutive leachingswith distilled water from river bed sediments contaminated with uraniummill waste solids. Sebesta et al. (unpublished results) found that nosubstantial change occurred in the percentage of radium leached fromsediments contaminated with Ba(Ra)SC>4 with number of consecutiveleachings up to 10 except for the first three steps (V/m ratio during theleachings was 731-899 cn .g"1).
Data obtained by Hanslik and Mansfeld (1973) on the cumulativerelease of radium preliminary adsorbed on river bed sediment are shown inFïg. 5.9. Constant V/m ratio was used, equal to 25 cm'.g"!. As canbe seen the course of the release can be roughly predicted using asuitable distribution constant. The authors suggested using KQobtained from desorption experiments for calculating minimum time orwater volume necessary for total radium desorption from river bedsediments after cessation of radium discharge into river. It must bekept in mind, however, that the release of radium contained in naturalsediments can significantly differ from the desorption of radiumpreliminary adsorbed on the same sediments. For instance Stanek (1973)found about twice as large percentage desorption of radium additionallyadsorbed on a lake sediment as the release of radium contained in thesediment. The difference was also reflected in Kp values which wereequal to 520-890 cm .g"1 for the former case and to 1150-1770cm .g"! for the latter case.
Fig.5.9 represents graphical illustration of the possible effect ofthe liquid/solid ratio on radium desorption from sediments. Similardemonstration of the effect of V/m on radium leaching from river bedsediments is given in Fig.5.10, where relative amount of radium leachedis seen to linearly increase with the liquid/solid ratio. Sebesta etal.(1978) explained this fact by dissolution of barium-radium sulfatecontained in the sediment.
149

5.5.3.3. Eff_ect_of_ compositipji o/_se_d iments_An important role in the release of radium undoubtedly belongs
to the composition of sediments. However, data illustrating the role arescarce (see, e.g., difference between the results reported by Shearer andLee, 1964, Stanek, 1973, and Sebesta et al., 1978, who worked withdifferent sediments). Justyn and Stanek (1968) observed easier releaseof radium from sediments containing 8% of organic matter than from thosewith only 1% of organic matter. Benes et al.(unpublished results), in astudy of radium desorption from model components of river sediments,found that radium adsorbed on ferric hydroxide can be desorbed with 0.01M sodium chloride solution more easily than radium adsorbed on quartzsand.
5.5.3.4. Ef.fect_of_ coTnpos±t±on_ of_wat r_pha e_Effect of composition of water phase on the release of radium
from sediments was studied by several authors. According to Tanner(1964) extractability of radium from sediments is aided by the followingfactors:
1) pH value of water low enough to dissolve alkaline earthcarbonates;
2) availability of chelate agents for dissolution of othermetallic coatings in which radium is trapped;
3) presence of other cations in sufficient concentration todisplace radium adsorbed on sediments.
Shearer and Lee (1964) found that the addition of monovalent andbivalent cations in 0.01 molar concentrations to water enhancedleachability of radium from river sediment. The effect of cationsincreased in the order KCK HCK CaCl2< SrCl2< BaCl2» which wasexplained by the authors as due to increasing ability of the cations toexchange with radium bound in the sediment. An essentially linearrelationship has been observed between the amount of radium leached andbarium cloride concentration in the range 0.001-0.015 molar. Stanek(1973) studied desorption of radium from lake sediments as a function ofpH of lake water, adjusted by addition of acid or hydroxide to 1-10. Thedesorption passed through a single maximum at pH 3-4.
Data characterizing the effect of water composition on leachabilityof radium from bed sediments of a river receiving uranium mine effluentspurified by precipitation of barium sulfate have been reported by Sebestaet al.(1978) . From the data, shown in Table 5.XIV., follows entirelydifferent sequence of the effect of cations on radium leachability thanthat found by Shearer and Lee (1964). This difference as well as otherdifferences discussed above very probably arises from different nature ofradium bond in the sediments used for the investigation.
Sebesta et al.(1980) studied radium bonding in river bed sedimentsusing method of selective dissolution. The results indicated that themain form of radium in sediments affected by discharge of purified minewaters was Ba(Ra)S04, which was formed during purification of minewaters and sedimented in river. Abundance of this form decreased withdistance from the discharge point but irregularly, showing a maximum in asite where river flow was slow. The latter finding suggests that thefraction of sediments containing Ba(Ra)S04 was rather fine. The secondmost important form of radium in the sediments was soluble in 1 molar
150

hydrochloric acid and probably represented radium adsorbed on the surfaceof sediment particles» This form prevailed in sections of the same riverlittle affected by waste waters or receiving radium mainly in dissolvedform.
The data presented in Table 5.XIV. were obtained with the riversediment affected by the discharge as mentioned above. It has beenpostulated that radium release from such sediment is to a great partdetermined by dissolution of Ba(Ra)SU4. This hypothesis has beenchecked by simultaneous study of radium liberation from artificiallyprepared barium-radium sulfate (see Table 5.XIV.). The amount ofBa(Ra)S04 roughly corresponded to its content in the sediments. It canbe seen that the sequence of leachabilities of Ba(Ra)S(>4by differentelectrolytes is similar to that found with natural sediments, althoughthe values differ to some extent. The differences may be either due tosome screening effect in the sediments or due to a significant effect ofrelease of other forms of radium from the sediments.
5.6. CONCLUSION AND RECOMMENDATIONS
Water is undoubtedly the most important agent in transporting,concentrating and dispersing of radium on the earth. Our knowledge ofradium behaviour in the hydrosphere is still very imperfect. The manygaps existing in the knowledge have been shown above. As the knowledgeis important not only from purely scientific reasons but especially forpractical purposes of protection of the environment and of radiation doseassessment, it is necessary to fill in the gaps in our knowledge byfurther investigation of the factors and processes influencing radiummigration in aquatic environments. In this connection use has to be madeof all pertinent physico-chemical and geochemical laws. It must also beemphasized that a substantial progress can be achieved only if mostadvanced analytical methods are employed. These methods have to involvea sufficiently detailed analysis of the physico-chemical forms of radiumin water and relevant solids. Development of such methods belongs to theforemost tasks for the future research.
As regards the radium migration itself, further studies are neededparticularly of the following problems:
1) uptake and release of radium by freshwater suspended solids andbottom sediments - field and laboratory studies of the effect ofbasic factors and of the mechanism of both processes;
2) character of radium bond in freshwater suspended solids andbottom sediments - dependence on the type of solid and water;
3) effect of sedimentation on radium deposition in bottom sedimentsand on properties of the sediments - field studies of therelation between composition of suspended solids and bottomsediments, kinetics of sedimentation, stratification ofsediments, etc.;
151

4) transport of radium-containing bottom sediments in streams viaresuspension and resedimentation - field investigation of maineffects: type of stream, type of sediment, water flow rate,seasonal variations, etc.;
5) leaching of radium from mill tailings, mine spoils and gypsumpiles in relation to climatic conditions and pile state - fieldstudies of the effects of weathering, erosion, revegetation, etc.
6) effect of radium bond in waste solids and bacterial oxidation onleachability of radium from the solids - laboratory studiesusing method of selective dissolution;
7) groundwater migration of radium released during conventional andin situ (solution) mining of uranium ores - field studies;
8) effect of radium speciation on movement of radium in porousmedia: seepage in tailings dam, migration in aquifers and soilprofiles - laboratory and field studies;
9) interaquifer migration of radium injected or seeped into groundwaters.
TABLE 5.1. COMPOSITION OF WATER PHASE IN ACID ANDALKALINE LEACH URANIUM MILL TAILINGS POND*
Component Acid
Dl ssolvedRa (Bq.l-1) 1.4
S04 (rng.l"1) 2000
Cl " 10
HC03 "
C03 •
Ba " 0.1
Ca " 100
Fe " 0.5
Mg " 1500
Mn " 0.4
Na 25
NH4 " 69
pH (untreated 2.1rafflnate)
* based on data reported by Tsivoglouand Levins (1979).
+ data based on one sample only
leach Alkaline leach
- 178 1.3 - 74
- 50000 1500 - 4300
- 3700 100 - 400
0 1100+
0 4600+
-1
- 700 10+
- 5000 0.1 - 0.5
- 5000 10+
- 4500 0.15+
- 19000 3000 - 4300
- 500 4.4+
- 4.1 9.6 - 10.8
and O'Connell (1964), U.S. EPA (1979)
152

TABLE 5. I I. COMPOSITION OF WATER FROM URANIUM NINES
Component
TotalRa (Bq.l-1)
DissolvedRa (2)
TotalBa (mg. 1-1)
DissolvedBa (%)
Ca (mg.1-1)
Fe
Mg
Na
Cl
HC03
S04
Suspendedsolids (mg.l-1)
PH
* data for one
** mining water
Mining waters Drilling
0.3 - 113 0.007
11 - 97 97
0.05 - 0.80 0.08
35 - 79* 92
10 - 300
0.5 - 21 0.1
5 - 4 9 7
5 - 500 1.0
0.5 - 358 2.1
20 - 400 89
10 - 935 < 5
2.6 - 3000 1
6.4 - 8.6
specimen only
purified by coprecipitation with
waters Purified
- 24 0.004
2- 99* 81
- 0.30* 0.17
4-> 93* 40
24+ 1
- 1.5* 0.1
- 9* 0.5
- 4.6 39
- 3.2 49
- 99* 82
- 144 17
- 9 1
6.4* 3.
barium sulfate
waters
- 11
- 17**- 99+
- 8.4
_ 5**- > 89+
- 158
- 3.3
- 47
- 360
- 238
- 160
- 1045
- 145
9 - 8.3
+ drilling water purified with cation exchange resin
153
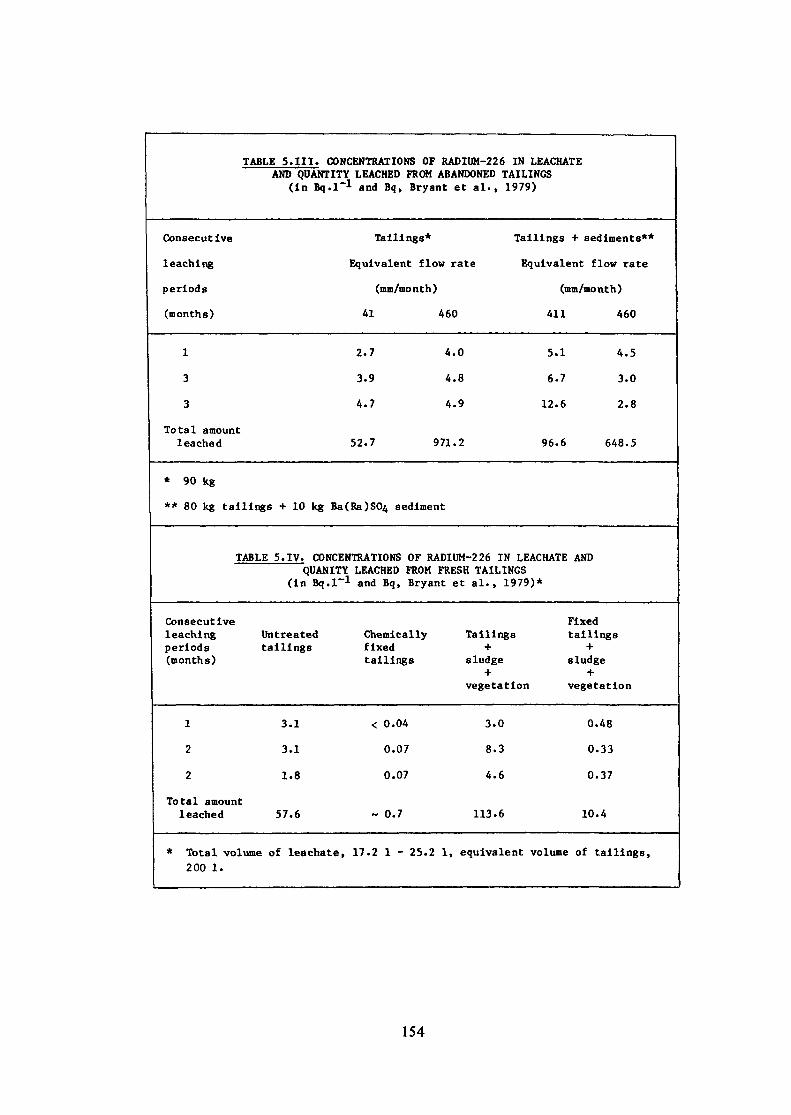
TABLE 5.III. CONCENTRATIONS OF RADIUM-226 IN LEACHATEAND QUANTITY LEACHED FROM ABANDONED TAILINGS
(in Bq.l"1 and Bq, Bryant et al-, 1979)
Consecutiveleachingperiods(months)
Tailings*Equivalent flow rate
(mm/month)41 460
Tailings + sediments**Equivalent flow rate
(mm/month)411 460
1
33
Total amountleached
2.7
3.9
4.7
52.7
4.0
4.8
4.9
971.2
5.1
6.7
12.6
96.6
4.5
3.0
2.8
648.5
* 90 kg
** 80 kg tailings + 10 kg Ba(Ra)S04 sediment
TABLE 5.IV. CONCENTRATIONS OF RADIUM-226 IN LEACHATE ANDQUANITY LEACHED FROM FRESH TAILINGS
(In Bq.l"1 and Bq, Bryant et al., 1979)*
Consecutiveleaching Untreated Chemicallyperiods tailings fixed(months) tailings
Tailings+
sludge+
vegetation
Fixedtailings
+sludge
+vegetation
1
2
2
Total amountleached
3.1
3.1
1.8
57.6
< 0.04
0.07
0.07
~ 0.7
3.0
8.3
4.6
113.6
0.48
0.33
0.37
10.4
* Total volume of leachate, 17.2 1 - 25.2 1, equivalent volume of tailings,200 1.
154

TABLE 5. V. MAXIMUM AMOUNTS OF RADIUM-226 LIBERATEDFROM 3 g OF URANINITE ORE WITH 30 ml OF SOLUTION OF VARIABLE COMPOSITION*
Leachingsolution
distilled water
0.001M HC1
0.1MHC1
0.001M NaOH
IM KC1
0.1M KC1
0.01M KC1
0.01M NaCl
0.01M L1C1
0.01M MgCl2
0.01M CaCl2
0.01M SrCl2
0.01M Bad 2
0.1M Bad 2
IM BaCl2
Percent Ra-226 liberated from ore containing
3.1 Bq.g-1
3.6
4.4
4.5
2.3
31.
15.
9.
3.1
1.7
1.3
1.9
0.3
0.3
0.3
0.3
20.0 Bq.g-1
0.7
1.3
2.9
1.1
22.
5.7
2.6
2.3
-
0.8
0.6
0.3
0.6
0.1
0.1
* data published by Havlik et al., (1968), corresponding to the maximumsfound on the time course of the leaching
_ - _ - __ ——————————————————————————————————————————————————————————— i
155

TABLE 5. VI. PERCENTAGE OF RADIUM ISOTOPES LEACHEDFROM MONAZITE AS A FUNCTION OF LEACHING SOLUTION COMPOSITION
(LAZAREV, 1959)
Solutions Isotope Concentrationof salt (M)
Neutral 224Ra 0.010.10.51.0
1.5 - 4.0+Acidic " 0.01(0.05M HC1)
0.11.0
1.5 - 4.0+226Ra 0.01
0.11.0
1.5 - 4.0+
* particle size, < 0.25 mm, liquid/solid ratio, 40
+ 1.5M for BaCl2, 3.0M for KC1 and 4.0M for NaCl
Composition of saltNaCl KCL BaCl2
0.050.230.420.450.812.12.52.92.65.25.46.06.3
I.kg'1,
0.200.560.910.901.182.22.82.92.75.67.17.17.4
contact
1.261.291.171.321.122.62.63.02.76.36.68.1
time, 9h
Monitoringyear
1st2nd3rd4th
TABLE 5. VI I.IN A VICINITY
226R3(Bq.l-1)
Well
0.0170.0170.0170.018
MONITORING OF GROUNDWATER CONTAMINATIONOF A TAILINGS POND (IYENGAR et
S04(mg.l-1)
adjacent
155.7816.4614.4
1245.0
Well 500 m away
1st2nd3rd4th
0.0150.0160.0150.016
125.0970.7509.3
1158.0
Cl(mg.l-1)
to tailings pond
206.9312.5295.3390.0
from tailings pond
199.1319.1309.4384.7
al., 1979)
Hardness(mg.l-1)
885.01232.1172.01410.0
790.51180.5
853.61380.0
156

TABLE S.VIII. CHECK OF VALIDITY OF MIXING RULE FOR MIXING OFRADIUM IN WASTE WATER WITH RIVER WATER
Sampling date
76-10-2576-11-2277-01-0677-02-1777-03-1577-05-17mean value
Dissolvedmeasured
0.130.240.350.130.110.130.18+0.04
^concentrations In Bq.l~*, m
226R,calculated
0.130.190.160.150.110.180.15+0.01
Ixlng ratio 1:2
(SEBESTA et al
Fartlculatemeasured
0.701.292.221.220.781.481.28+0.22
- 1:3
., 1981)*
226Racalculated
0.701.181.851.411.041.261.24+0.16
TABLE 5. IX. DISTRIBUTION OF RADIUM 226 (IN *) AMONG FORMSDISTINGUISHED BY SELECTIVE DISSOLUTION OF SOLIDS SUSPENDED
IN RIVER WATER (BENES et al., 1980)
Sampling dateWater Radiumsample* form
AAAA
BBBB
CCCC
*A -B -
C -
L.B.A.S.BaS04C.D.
L.B.A.S.BaS04C.D.
L.B.A.S.BAS04C.D.
78-03-06
< 0.140.725.433.9
0.18.0
87.94.0
0.115.484.30.2
little polluted river water upstreachannel;river water 1 kmchannel conveyingof barium sulfateriver water 13 km
downstream of the
79-04-18
3.5.17.75.
0.39.2
84.26.3
0.919.572.67.0
m of confluenceconfluence with
uranium mine effluents purified
79-07-30
3.955.326.314.5
0.113.679.86.5
0.611.481.36.7
with wastewaterwastewaterby precipitation
and subsequent sedimentation;downstream of the confluence.
157

TABLE S.X. RADIUM CONCENTRATIONSSEDIMENTS OF PERIYAR RIVER AT ALWAYE,
(IN Bq.l"1) IN BOTTOMINDIA (IYENGAR et al., 1978)
Sampling place Pre-monsoon228,^ 22ÔR3
Ferry, 1.3 km upstream of AlwayeIndustrial outfall areaFerry, 0.3 km downstream of AlwayeMethanam, 1.8 km downstream of Alwaye
0.12 0.0411.84 1.500.98 0.130.17 0.01
Post-monsoon228Ra 226R,,
0.090.420.220.06
0.000.080.100.24
TABLE 5. XI. EFFECT OF FLOW RATE (IN m^.s'1) ON THE CONCENTRATION(IN Bq.l-1) OF DISSOLVED AND PARTICULATE RADIUM 226 IN RIVER
WATER RECEIVING PURIFIED URANIUM MINE EFFLUENTS
Flow rateat site A*
0.77 (1)1.07 (1)1.33 (1)1.97 (1)3.00 (1)3.45 (1)3.90 (1)
0.91 (2)1.23 (2)2.09 (2)
| *Site B was /»/ 12 kmand B did not exceed(1) calculated from(2) calculated from
i
DissolvedSite A
0.270.070.050.110.080.070.07
0.210.120.18
Site B
0.160.100.070.140.130.100.09
0.200.210.17
downstream of the24Z
data bydata by
ParticipateSite A Sice B
0.10 0.060.07 0.070.02 0.110.16 0.260.15 0.400.19 0.500.31 0.57
1.42 0.521.00 0.702.96 1.11
site A, Increase of
Dlss./partlcul.Site A
2.770.962.180.660.560.400.23
0.150.120.06
Site B
2.671.390.660.540.320.190.16
0.590.300.15
flow rate between A
Hansllk and Mansfeld (1973).Sebesta et al., (1981).
158

TABLE 5. XI I.ON RADIUM
V/m<c»3.g-l)
105050010505001050500
* little contaminatedadsorption prepared
EFFECT OF LIQUID/SOLID RATIO AND BARIUM IONSADSORPTION BY SEDIMENTS (MANSFELD,
CBa2+(molar)
10-5M
*•
10-«N
M
10-3M
*"
river bed sediment,from distilled water
Adsorption(*)
93.781.942.891.170.342.277.748.412.8
particle size
1977)*
KD(c»3.g-D
149225374103118365354773
< 2mm, solution for, original concentration of
226Ra In the solution 740 Bq.l"1
TABLE 5.XIVSEDIMENTS AND
Leachingsolution
0.01M HC10.01M CaCl20.01M KC10.01M NaCl0.01M Bad 2
* leaching time 1 h,10 mg of Ba(Ra)S04
. LEACHING OFBARIUM-RADIUM
Wet sediment
31.115.88.55.11.2
RADIUM (IN Z) FROM RIVERSULFATE (SEBESTA et al. ,
Dry sediment
28.«13.06.43.62.3
450 ca3 of leaching solution, 0.5 g of
BED1978).
Ba(Ra)SOA
13.613.5
10.90.3
sediment,
159

TABLE 5. XIII. DATA CHARACTERIZING ADSORPTION OF RADIUMON MODEL COMPONENTS OF RIVER BED SEDIMENTS (MANSFELD AND HANSLIK, 1980)*
Substrate(mg.
D i sQuartz
Feldspar
Calclte
Dolomite
Kaollnlte
Blotlte
Bentonlte
Phlogopite
Quartz
Feldspar
Calclte
Dolomite
Kaollnlte
Bi otite
Bentonlte
Phlogoptte
* explanations of symbolsless that 0.1 mm
KI"1)
t i l l e d
346
34
584
60
29
34
3.4
165
T a p v2021
1187
8333
362
7009
138
277
604
see in text,
V.X(*>
95.6
95.6
93.1
95.8
96.4
97.3
98.1
98.1
a t e r79.3
95.7
84.4
98.6
95.2
99.7
73.8
97.2
particle size of all
<c»3K'p.l
3020 +
13400 +
1730 +
23700 +
61800 +
33200 +
393000 +
8100 +
480 +
670 +
96 +
2300 +
139 +
6660 +
2710 +
1370 +
substrates
)
290
8500
90
5200
29700
5800
84000
2200
200
60
10
170
21
620
600
170
was
160

SOURCES
RELEASE PROCESSES LEACHING
WASTE WATERS SOLIDS PRODUCED BY MAN
\ /INFILTRATION, DISCHARGE, LEACHING +SINKHOLECOLLAPSE
SEEPAGE INFILTRATION
MIGRATION MEDIAAND MECHANISMS
NATURAL OR MAN-CAUSEDPHASE TRANSITIONS | DEPOSITION
SINKS
I
\
SEEPAGE, SPRINGS
INFILTRATION
TECHNOLOGICAL USE,IRRIGATION
SOIL ANDOTHER SOLIDS
LEACHING,PARTICLE RUNOFF
RESUSPENSIONDISSOLUTION
Fig. 5.1. Migration pathways of radium in inland waterways and aquifers.
MINING WATERS
SETTLING POND
PURIFICATION
RADIOACTIVESPRINGS
INFILTRATION
Fig. 5.2. Migration pathways of radium from radioactive wastewaters andsprings to surface and ground waters.
161

ASHDUSTFERTILIZERS
PRECIPITATION AND/ORSURFACE WATERS
NONPOINT SOURCE(DISSIPATED SOLIDS)
RADIUM LEACHING+ INFILTRATION
WIND
SURFACE WATERS
GROUNDWATERS
RADIUM LEACHINGAND/OR
PARTICLE RUNOFF
MININGMILLING
TECHNOLOGICALPROCESSES
POINT SOURCE(PILE OR POND)
RADIUM LEACHING+ INFILTRATION
Fi g. 5.3. Migration pathways of radium from solids produced by man tosurface and ground waters.
•oCMCN
I2DQ
0.110
LIQUID/SOLID RATIO (I kg"' )
100
FIG. 5.4. Effects of solid/liquid ratio on leaching of radium-226 from"" uranium mill tailings. Contact time, 3h, pH of leachate,
4.4-5.1, temperature, 25°C. (Reprinted from Levins et al.,1978, by permission of the author).
162

100
o80
70
S 60Z3O50
40atLU> 30
S.3
20
10
L I Q U I D / S O L I D R A T I O• lA SO 20
2 3 4NUMBER OF STAGES
FIG. 5.5. Repetitive leaching of radium-226 from uranium mill tailings withIM NaCl. Contact time, 0.5 h, pH of leachate, 3.8-5.2,temperature, 25°C. (Reprinted from Levins et al. , 1978, bypermission of the author).
100
•oCXnI
S3
o.i
A HCI
5 6pH
9 10 11 12
FIG. 5.6. Effect of pH on leachability of radium-226 from uranium milltailings. Leaching solution, demineralized water with added acidor hydroxide, liquid/solid ratio, 30 l.kg"*, contact time,1.5 h, temperature, 25°C. (Reprinted from Levins et al., 1978,by permission of the authors).
163

100
10
•OC4CM
t3
O<at
X) noSULPHATE CONCENTRATION (mg/'1)
1000
FIG. 5.7. Effect of sulfate concentration on leaching of radium-226 fromuranium mill tailings with IM NaCl. Contact time, 1 h,liquid/solid ratio, 5 I.kg"1, pH 4.0-4.6, temperature, 24°C.(Reprinted from Ryan and Levins, 1979, by permission of theauthors).
164

WASTE WATERiMIGRATION INWASTEWATERCHANNEL
lMIXING OFWATERS
1MIGRATION INNATURAL STREAM
MIGRATION INFRESHWATERRESERVOIR
MIGRATION INESTUARY
RADIOACTIVESPRING WATER
NATURAL RECEIVINGWATER
MIGRATION INBOTTOM SEDIMENTS
Fig. 5.8. Block scheme of radium migration in surface waters.
165

100ovho 230
10
3100 1000 V 10000
FIG. 5.9. Cumulative desorption of radium (%) preliminary adsorbedon river bed sediment as a function of total (cumulativewater) volume V (in cm-*): 1 - experimental data for 24h desorption from 10 g of sediment by uncontaminatedriver water; 2 - equilibrium desorption calculatedassuming Kn = 576 cm^.g"1.(From Hanslik and Mansfeld, 1973, by permission of theauthors).
166

•/IIS
o
10
5
00 5000 V/ 10000/m
FIG. 5.10. Effect of liquid/solid ratio (in cm- .g"1) on radiumleaching (%) with distilled water from river bed sedimentscontaminated with Ba(Ra)SU4 from purified uranium mine drainagewaters.Leaching time 1 h, sediment contained 13.1 Bq.g"1 Ra-226.[From Sebesta et al., (1980), by permission of the authors].
167

REFERENCES
BAKHUROV V.G., et al., Radioactive Wastes of Uranium Plants (inRussian), Atomizat, Moscow (1965)BELOUSOVA I.M., SHTUKKENBERG J.M., Natural Radioactivity (in Russian)MEDGIZ, Moscow (1961).
BENES P., MAJER V., Trace Chemistry of Aqueous Solutions, Elsevier,Amsterdam (1980).BENES P., OBDRZALEK M., The use of radiotracer method for analysis ofthe state of radium in waste and surface waters (in Czech), Proceedingsof the Seminar "Hydrochèmia '80," Water Research Institute, Bratislava(1980) 139.BENES P., et al., Study of the state and behaviour of radium in surfaceand waste waters (in Czech), Proceedings of the IX. Conference onRadionuclides and Ionizing Radiation in Water Technology, CSVTS,Libérée (1978) 99.
BENES P., et al., Analysis of the suspended forms of radium and bariumin surface waters using the method of selective dissolution (in Czech),Proceedings of the Seminar "Hydrochèmia '80," Water Research Institute,Bratislava (1980) 157.BENES P., et al., Method of selective dissolution for characterizationof particulate forms of radium and barium in natural and waste waters,Water Res., 15_ (1981) 1299.
BENES P., et al., The physicochemical forms of traces of radium inaqueous solutions containing chlorides, sulfates and carbonates,Radiochem.Radioanal. Letters, _5_0 (1982) 227.
BOENZI D., et al., A Study on the Sorption in the Lake Bracciano Region(Rome), Comitato Nazionale Energia Nucleare, Rome (1965).
BOUQUIAUX J., Redissolution du radium insoluble d'origine rèsiduairedans un fleuve, Trib. CEEEDAU 2± 291 (1968) 66.BRYANT D.N., et al., Leachability of Radioactive Constituents fromUranium Mine Tailings, Status Report, Environmental Protection Service,Environment Canada, EPS4HWP-79-4 (1979).CHAN L.H., LI Y.H., Desorption of Ba and 226Ra from river-bornesediments in the Hudson estuary, Earth Planet. Sei. Lett. 43 3(1979) 343.
DE JESUS A.S.M., et al., Movement of Radium from South AfricanGold/Uranium Mine Dumps into the Aqueous Environment, Progress Reportto the International Atomic Energy Agency, Pelindaba, South Africa(1980).
168

DLOUHY Z., Movement of Radionuclides in the Aerated Zone. Report tothe IAEA, Vienna (1967).
EADIE G.G., KAUFMANN R.F., Radiological evaluation of the effects ofuranium mining and milling operations on selected ground water suppliesin the Grants Mineral Belt, New Mexico, Health Physics _3^ (1977) 231.ERBACHER 0., NIKITIN B., Bestimmung der Loeslichkeit von Radiumsulfatin Wasser bei 20°, Z. Physik. Chem. 158A 3/4 (1932) 216.
GARRELS R.M., "A Survey of low temperature water - mineral relations",Interpretation of Environmental Isotope and Hydrochemical Data inGroundwater Hydrology, International Atomic Energy Agency, Vienna(1976) 6.5.
GUIMOND R.I., WINDHAM S.T., Radioactivity Distribution in PhosphateProducts, By-products, Effluents and Wastes, U.S.EPA Technical NoteORP/CDS-75-3 (1975).
GUREGHIAN A.B., A Two-Dimensional Finite Element Solution for theSimultaneous Transport of Water and Solutes through a Non-homogenousAquifer under Transient Saturated Unsaturated Flow Conditions,Permeability and Groundwater Containment Transport Symposium,Philadelphia (1979).HANSLIK E., MANSFELD A., Natural Radionuclides in the System of MineWaters, Their Distribution and Mutual Relations (in Czech), FinalReport S-R-30-263, Water Research Institute, Prague (1970).HANSLIK E., MANSFELD A., Investigation of Trends In RadioactiveContamination in Selected Streams (In Czech), Final Report No.R-502004, Water Research Institute Prague (1973).HAVLIK B., et al., Radium-226 liberation from uranium ore processingmill waste solids and uranium rocks into surface streams-1,11, HealthPhys. J_4 (1968) 417, 423.ISKRA A.A., et al., On the behaviour of natural radioactive elements Instationary water reservoir (in Russian), Atomnaya Energiya 27 2 (1969)134.
IWASAKI I., Distribution of radium (226Ra) in hot springs andevolution mechanism of radioactive springs (in Japanese), OnsenKogakkaishi 1_ 1 (1969) 16.
IYENGAR M.A.R., MARKOSE P.M., Monitoring of the aquatic environment inthe neighbourhood of uranium Tiill at Jaduguda, Bihar, Proc. of NationalSymposium on Radiation Physics, Trombay (1970) 473.
IYENGAR M.A.R., et al., Radium in natural and processing areas and itsImpact on human environment, Status Report to the IAEA ResearchContract No. 1788/RB (1978, 1979).
169

JUSTYN J., Investigation of processes affecting the content andbehaviour of natural radionuclides in water reservoirs. I. ReservoirHorka (in Czech), Final Report, Water Research Institute, Prague (1973).JUSTYN J., STANEK Z., Investigation of streams contamination by naturalradioactive substances (in Czech), Final Report No. S-R-30-238/4, WaterResearch Institute, Prague (1968).KAMATH P.R., et al., "The changing radiation environment", Symposium onthe Natural Radiation Environment, II, Rice University, Houston (1972).KANROJI Y., et al., Geochemical study on the occurence of Ra and Rn inShirahama Spa (in Japanese), Onsen Kagaku 29 4 (1979) 175.KAUFMANN R.F., BLISS J.D., Effects of phosphate mineralization and thephosphate industry on Radium-226 in ground water of Central Florida,U.S.Environmental Protection Agency Report EPA/520-6-77-010, Las Vegas(1977).
KAUFMANN R.F., et al., Effects of uranium mining and milling on groundwater in the Grants Mineral Belt, New Mexico, Ground Water 14_ 5 (1976).KIRCHMANN R., et al«, Etude du cycle biologique parcouru par laradioactivité, Report BLG 477, Centre d'Etudes Nucléaires de Mol,Bruxelles (1973).KLUTE A., HEERMANN D.F., Water Movement in Uranium Mill TailingsProfiles, U.S.EPA Technical Note ORP/LV-78-8 (1978).KOBAL I., Determination of 226jja ±n surface and drinking water,Progress Report to the IAEA Research Contract No. 1700/RB (1978).KRIBEK B., et al., Sorption of radionuclides on natural sorbents, (inCzech), Final Report No. P-09-125-012-7/4, Faculty of Natural Science,Charles University, Prague (1979).KUROKAWA Y., KUROSAWA R., Elution of uranium and radium from uraniumores to rain water, IAEA Meeting on the Source, Distribution, Movementand Deposition of Radium In Inland Waterways and Aquifers, Vienna(1980a).
KUROKAWA Y., KUROSAWA R., Movement and deposition of radium in modelriver, IAEA Meeting on the Source, Distribution, Movement andDeposition of Radium in Inland Waterways and Aquifers, Vienna (1980b).LAZAREV K.F., Methods of determination of limiting leachability ofradioéléments from minerals (In Russian), Radiokhimiya 1^ 5 (1959) 603.LERMAN A., Geochemical Processes. Water and Sediment Environments,Wiley-Interscience, New York (1979).LEVINS D.M., et al., Leaching of radium from uranium tailings,Proceedings of OECD/NEA Seminar on Management, Stabilization andEnvironmental Impact of Uranium Mill Tailings, Albuquerque, New Mexico(1978) 271.
170

LEVINS D.M., Environmental impact of uranium mining and milling inAustralia, Presented at the Ninth Annual Hydrometallurgical Meeting,Canadian Institute of Mining and Metallurgy, Toronto (1979).LYNN R.D., ARLIN Z.E., Anaconda successfully disposes uranium millwaste water by deep well injection, Mining Eng. 14 7 (1962) 49.MANSFELD A., Natural radionuclides in waters, their occurence andbehaviour (in Czech), Ph.D. Thesis, Institute of Chemical Technology,Prague (1977).MANSFELD A., HANSLIK E., The effect of mining radioactive raw materialson the quality of surface waters (in Czech), Final Report No.C16-331-112-03-04, Water Research Institute, Prague (1980).MANSFELD A., ZAJICEK V., An Investigation of the radioactivity ofpotable water sources (in Czech), Final Report No. S-R-30-238/5, WaterResearch Institute, Prague (1969).MARPLE M.L., ZETTWOOG P., Environmental pathways of Radium-226 inFrench regions of uranium mining and milling, Presented at the IAEAMeeting on the Source, Distribution, Movement and Deposition of Radiumin Inland Waterways and Aquifers, Vienna (1980).MISAWA H., et al., "Solid and liquid wastes at the Ningyo-Toge Mine",Radiological Health and Safety in Mining and Milling of NuclearMaterials, IAEA Proceeding Series (1964).MIYAKE Y., et al., "Content of uranium, radium and thorium in riverwaters in Japan", The Natural Radiation Environment (ADAMS J.A.S.,LOWDER W.M. Eds), Rice University, Houston (1964) 219.MROST M., LLOYD P.J., Bacteria oxidation of Witwatersrand slimes,Report IAEA-SM-135/32 (1971).O'CONNELL M.F., KAUFMANN R.F., Radioactivity associated with geothermalwaters in the Western United States, U.S. Environmental ProtectionAgency Technical Note ORP/LV-75-8A, Las Vegas (1976).PARSONT M.A. , The Distribution of 226Ra in Aquatic Environment, Ph.D.Thesis, Colorado State University (1967).PHILLIPS C.R., NATHWANI J.S., Rates of leaching of radium fromcontaminated soils: an experimental investigation of radium bearingsoils from Port Hope, Ontario, Water Air Soil Pollut. 2 * (1978) 453.POSOKHOV E.B., Formation of Chemical Composition of Ground Waters (inRussian), Gidrometeorol. Izd., Moscow (1969).PRADEL J., French Contribution to the IAEA Panel on the Distribution,Movement and Deposition of Radium in Inland Waterways and Aquifers,Mortagne (1976).
RAHN P.H., MAßES D.L., "Seepage from uranium tailings ponds and itsimpact on ground water", Proc. Seminar on Management, Stabilization andEnvironmental Impact of Uranium Mill Tailings, NEA, Albuquerque (1978).
171

ROY A.C., KELLER W., Water Pollution in the Serpent River, StatusReport, Ontario Ministry of the Environment, Toronto (1976).RUBINSKY E.I., Thickened discharge - a new approach to tailingsdisposal, Canad. Mining Metal. Bull. (December 1975) 47.RYAN R.K., LEVINS D.M., "Extraction of radium from uranium tailings",Ninth Annual Hydrometallurgical Meeting, Canadian Institute of Miningand Metallurgy, Toronto (1979).SCHLIEKELMAN R.J., Determination of radium removal efficiencies in Iowawater supply treatment processes, U.S. Environmental Protection Agency,Technical Note ORP/TAD-76-1, Washington (1976).SCOTT R.C., BARKER F.B., Data on uranium in radium in ground water inthe United States, U.S. Geological Survey Professional Paper 426 (1962),SEBESTA F., et al., Studies on the source, distribution, movement anddeposition of radium in inland waterways and aquifers, Progress Reportof the IAEA Research Contract No. 1729/RB, Technical University ofPrague (1978, 1980).SEBESTA F., et al., Behaviour of radium and barium in a systemincluding uranium mine waste waters and adjacent surface waters,Environ. Sei. Technol. 15.1, 71 (1981).SHEARER S.D., Jr., LEE, G.F., Leachability of radium-226 from uraniummill solids and river sediments, Health Phys. 10, 217 (1964).SHINPAUGH W.H. , et al., Radiological survey of the inactiveuranium-mill tailings at Tuba City, Arizona, Report ORNL-5450 (1980a).SHINPAUGH W.H., et al., Radiological survey of the inactive uranium -mill tailings at Naturita, Colorado, Report ORNL-5454 (1980b).SHUKTOMOVA I.I., et al., Forms of 226Ra in soil horisons with itshigh concentration (in Russian), Pochvovedenie 2, 18 (1978).SILLEN L.G., MARTELL A.E., Stability Constants, Special Publication No.17, The Chemical Society, London (1964).STANEK Z., Investigation of processes affecting content and behaviourof natural radionuclides in water reservoirs (Brno-Dam Reservoir) (inCzech), Final Report No. R-606001, Water Research Institute, Prague(1973).STARIK I.E., Principles of Radiochemistry (in Russian), PublishingHouse of the Academy of Sciences of the USSR, Moscow (1959).,Chapter 1. English translation, U.S.AEC Report AEC-tr-6314 (1964).
STARIK I.E., LAZAREV K.F., On the form of uranium and thorium atoms inradioactive minerals (in Russian), Radiokhimiya 1 1, 60 (1959).STARIK I.E., LAZAREV K.F., Effect of crushing of minerals onleachability of radioactive elements (in Russian), Radiokhimiya 6,749 (1960).
172

TANNER A.B., "Physical and chemical controls on distribution ofradium-226 and radon-222 in ground water near Great Salt Lake, Utah",The Natural Radiation Environment (ADAMS J.A.S., LOWDER W.M., Eds),Rice University, Houston 253 (1964).
TOKAREV A.N., SHCHERBAKOV A.V., Radiohydrology (in Russian),Gosgeoltekhizdat. Moscow (1956). English Translation, U.S. AEC ReportAEC-tr-4100 (1960).
TSIVOGLOU E.C., Research for the control of radioactive pollutants,J.Water Pollut .Control Fed. _35_ 2, 242 (1963).
TSIVOGLOU E.G., O'CONNELL R.L., Nature, volume and activity of uraniummill wastes, International Atomic Energy Agency Report STI/PUB/78,Vienna (1964).
TSIVOGLOU E.G., et al., Effect of uranium ore refining wastes onreceiving waters, Sew. Industr. Wastes _30_ 8, 1012 (1958).
TSIVOGLOU E.G. , et al., Control of radioactive pollution of the Animasriver, J.Water Pollut. Control Fed. 3_2 3, 262 (1960).
U.S.EPA, Reconnaissance study of radiochemical pollution from phosphaterock mining and milling, U.S. Environmental Protection Agency, Denver(1973).U.S.EPA, Water quality impacts of uranium mining and milling activitiesin the Grant Mineral Belt, New Mexico, U.S. Environmental ProtectionAgency Report EPA 906/9-75-002, Dallas (1975).
U.S.EPA, Potential health and environmental hazards of uranium minewastes, U.S. Environmental Protection Agency, Draft Report, Washington(1979).WHITE D.E., et al., "Chemical composition of subsurface waters", Dataof Geochemistry (FLEISCHER M., Ed.), Chapter F, Geological SurveyProfessional Paper 440-F, U.S. Government Printing Office, Washington(1963).WILLIAMS A.R., The Movement of Radium in the Sub-coastal plains ofNorthern Australia, Presented at the IAEA Panel on the Distribution,Movement and Deposition of Radium In Inland Waterways and Aquifers,Mortagne (1976).WUKASCHM.C., COOK L.M., Environmental surveillance In South Texas,Paper Presented at the Symposium on the Natural Radiation EnvironmentRice university, Houston (1972).
ZABORENKO K.B., et al., Study of the emanation and leaching of radiumisotopes from monazite (in Russian), Radiokhimiya 1^ 6 (1959) 738.
ZETTWOOG P., Migration des radioéléments solubles des boues résiduairesdes usines de traitement des minerais d'uranium au travers d'unebarrière géologique, Commissariat à l'Energie Atomique, Rapport InterneSPT n° 182 (1980).
173

Chapter 6
BIOLOGICAL UPTAKE AND TRANSPORT
A.R. WILLIAMSEnvironmental Science Division,
Australian Atomic Energy CommissionResearch Establishment,
Lucas Heights Research Laboratories,Sutherland, NSW, Australia

6.1. INTRODUCTION
All aquatic organisms that have so far been studied appear toaccumulate radium above its concentration in water. That is, theconcentration factor (F) exceeds unity
F = Bq kg~l fresh weight/Bq kg"-'- water.The reason for this and the mechanism by which it occurs are dealt within the first section of this chapter; subsequent sections deal with thequantitative description of radium uptake and transfer.
6.2. THE MECHANISM OF RADIUM UPTAKE
From the chemical properties of the elements it can be predictedthat radium may be taken up by cells via the same mechanism as calciumand the other alkaline earth elements (Mg, Sr, Ba). If this is the case,then there should be evidence of radium uptake across membranes and/orits distribution within tissues which can be correlated with that ofcalcium.
This appears to be the case for animals. In man, for example, 99%of the body calcium is distributed in the skeleton. The relativeproportions of other elements are: Sr - 99%, Pb - 92%, Ba - 91%,P - 90%, Ra - 87%, Mg - 58%, but all other natural elements have lowerpropertions in the skeleton (ICRP 1975). Fish have a high proportion ofbody radium in the skeleton (e.g. Andersen et al. 1963); freshwatermussels accumulate Ra together with Ca, Mg, Ba, Mn, Fe and P in granulesthat are dispersed throught their body and, on the whole-body basis, theradium concentration is positively correlated with Ca and Baconcentrations but not correlated with the Mg concentration (Jeffree,Australia). For plants, there is a somewhat different but less welldocumented situation. Among 40 samples of aquatic and semi-aquaticmacrophytes representing 19 species, Williams (Australia) found that theRa distribution was not significantly correlated with that of Ca, Mg, Na,Cu, Zn, Fe or S but was positively correlated with that of Mn; among 18samples of five organs (lamina, petiole, fruit, peduncle, rhizome), froma single species, Nymphaea gigantea, Ra distribution was not correlatedwith that of Ca, Mg, Na, Zn, U or S but was positively correlated withthat of K and P. For terrestrial plants, the data of Smith (1971 a,b)show that the distribution of Ra is least like that of Ca among thealkaline earth elements, but any similarity between radium and otherelements is still open to question. There is enough evidence to suggestthat radium may behave differently in plants, so the matter should befurther investigated.
Another way of investigating the mechanism of radium uptake is toexamine its transfer through foodchains. If radium is taken up as if itwere calcium, then it should be evenly distributed with calcium in thefoodchain, and the observed ratio O.R. (O.R. = RarCa ratio in one trophiclevel /Ra:Ca ratio in the preceding trophic level) would be unity.However, if cells can distinguish Ra from Ca, then the observed ratioought to be less than unity, because calcium is a major nutrient and Rais a non-nutrient.
177

In terrestrial soil-plant transfer, the observed ratio ranges from0.05 (Kirchmann et al. 1968) to 0.5 (Bhujbal et al. 1970). In wetlandplants, Williams (Australia) found an observed ratio of 0.06. Inreference man the observed ratio is 0.015 (ICRP 1975). In terrestrialherbivores such as sheep, an observed ratio of ~ 0.1 can be inferred(Brownscombe et al. 1978). Unfortunately, the necessary dietary data foraquatic animals are lacking. However, in a summary of the available dataon radium in the human foodchain, Williams (1981) found that among 9generalized trophic-level transfers in the aquatic links of the chain, 8showed a decrease in concentration; this supports the general conclusionthat plant and animal cells are able to discriminate against radiumrelative to calcium.
When this observation is taken In conjunction with the previousobservation that in animals, at least, the radium distribution in thebody is similar to that of calcium, it must be concluded that radium maybe taken up and metabolised in the same way as calcium; but there is adiscrimination mechanism for excluding radium which operates with anefficiency ranging from ~ 50 to 98%.
Although it is beyond the scope of this chapter to inquire into thephysiology of mineral uptake, three distinct physico-chemical mechanismsshould be mentioned: adsorption (a surface process); absorption (ametabolically controlled process); and association (a structuralfactor). Havlik (1971) found that 5 out of 7 species of unicellularalgae accumulated more radium by adsorption than by absorption. Thereason for this is probably two-fold: unicellular algae have a highsurface area-to-volume ratio, and radium has a strong adsorption capacity(chapter 5, this volume). Absorption Is the dominant process in higherorganisms where the surface area-to-volume ratio is smaller and wheredistribution between organs (e.g. between flesh and bone) becomesimportant. Radium uptake by association can occur where contaminatedmaterial is associated with a food item without being a direct part ofit. For example, submerged aquatic macrophytes accumulate sediment ontheir structural surfaces, hence radium in this sediment may become partof a herbivore diet simply by association; likewise, animals withdigestive systems carry undigested material in their gut at any giventime, and even though the radium may be discriminated against in thedigestive process, it still becomes part of the diet of any predatorwhich feeds on the whole animal.
The interaction of uptake mechanisms is illustrated in Section 6.6where the effect of major ions is examined.
6.3. CONCENTRATION FACTORS
Most of the available data on the biological uptake of radiumconsist of field survey results on radium concentration on diet items (Q)and in the supporting water or sediment (C). All that can generally becalculated from such data is the concentration factor (F):
F = Q/C (6.1)and the variation of Q with C. It is frequently assumed (e.g. ICRP 1979,USNRC 1980) that there Is a linear relationship between Q and C (i.e.
178

F is independent of C). In the following sections this class of data isassembled in log Q v. log C plots and the linearity is tested bycomparing the slope of the line against unity using the standard error ofregression.
It frequently happens that an organism takes up radium from eitheror both of two sources; for example, fish are exposed via water and food,and aquatic macrophytes are exposed via water and sediment. If theconcentration factors are independent of the concentrations in bothsources, then
(6.2)The two concentration factors aj and 32 can be estimated from amultiple regression of Q on C^ and G£» constrained through theorigin. An important application of this model is to irrigation;Myttenaere et al. (1969) showed that transfer of cesium and cobalt torice from irrigation water was 10-100 times greater than from soil, butthere is insufficient data on radium to describe its transfer duringirrigation (Williams 1981).
In the following section, the goodness of fit of the regressions isestimated by the coefficient of determination r2, expressed as apercentage; this indicates the percentage of the variance that isaccounted for by the regression. The statistical significance of theregression is taken from the square root of the coefficient ofdetermination, which is the correlation coefficient r, using tabulatedvalues calculated on the basis of the sample size; the significance isshown as a p value, being the probability that the r value occured bychance.
6.3.1. Algae
The data in Figure 6.1 cover a very wide concentration range (7orders of magnitude) and give a very good fit to the regression:
Q = 441 C1-02 (6.3)
With r2 = 94% (p « 0.001). The values above 3 x 10²Bq IT1 inwater are all taken from laboratory experiments at equilibrium (7-14 daysof exposure). The value of the regression coefficient (b = 1.02) is notsignificantly different from 1, so it can be concluded that uptake ofradium from water by algae (including blue-green, unicellular andmacroalgae) is a linear process. The equivalent linear regression is
Qa = 432 C (6.4)and the concentration factor
F = Q/C = 432 (6.5)
179

6.3.2. Aquatic Vascular Plants
Aquatic vascular plants (macrophytes) may take up radium fromwater (w) via foliage and from sediment (s) via roots. Figure 6.2illustrates the relationship between foliage and sediment. Theregression is:
Q = 0.39 Cs °'49 (6.6)with r2 = 22% and p < 0.001. The slope of the regression coefficient,b = 0.49, is also significantly different from 1 with p 0.001. Therelationship between foliage and water is shown in figure 6.3, where theregression is:
Q = 81 Cw 1'21 (6.7)with r2 = 50% and p < 0.001. The regression coefficient, b = 1.21, isnot significantly different from 1 and the corresponding linear equationis:
Q - 55 C„ . (6.8)The two-source model (equation 6.2) can also be fitted to these
data. The regression is:Q = 8.56 C„ + 0.014 Cs (6.9)
for which r2 = 51% and p = 0.01 for a^ and p = 0.02 for a 2(N = 37). This model is linear, of course, and does not take intoaccount the non-linearity suggested by the plant-sediment relationship inFigure 6.2. It accounts for no more of the variance than the plant-waterregression, so it is of questionable value; however, because severaldifferent data sets have been pooled, the large variance works against adetailed analysis. In future studies with macrophytes, a furtherexamination should be made of the contribution of the two sources. As itstands this model suggests that at an average water concentration of 0.21Bq L~l and average sediment concentration of 94 Bq kg~^, 58% of theradium comes from water and 42% comes from sediment.
It is well known that total sediment concentration of an element(Cs) is not a good index of the amount actually available to plantroots, so the non-linearity noted above may be due to the physical andchemical differences between the natural and effluent streams from whichthe data are taken. From this point of view a systematic study ofsediments has been initiated by the Czechoslovak group and a theoreticalmodel has been proposed by van Dorp et al. (1979) which may be useful ininterpreting the results.
6.3.3. Insects
The data in Figure 6.4 are all from field surveys and give a goodfit to the regression:
Q = 186 C°-91 (6.10)
180

with r2 = 81.2% and P « 0.001. The regression coefficient b = 0.91is not significantly different from 1 and the corresponding linearregression model is
Q = 247 C (6.11)
for which the concentration factor is 247. Thus it can be assumed thatin the region of 10~2 to 10^ Bq IT*, the uptake process for insectsin water is linear.
6.3.4. Fish
The data in Figure 6.5 are all from field surveys and/or fieldexperiments, and give a good fit to the regression
Q = 13 C0-68 (6.12)
with r2 = 54.5% and p « 0.001. The regression coefficient b = 0.68 issignificantly different from 1 (p < 0.001), so the concentration factorwill be
F - Q/C = 13 C -°'32 (6.13)
This function varies from 119 at 0.001 Bq L"1 to 13 at 1 Bq L"1, soit is highly non-linear.
Fish vary widely in their diets and behaviour and some of theindividual data sets that are pooled in Figure 6.5 have significantlydifferent intercepts and/or slopes; however pooling is justified on thegrounds that it produces a significant general trend, and that thevariation in some data sets spans the whole range (e.g. Davy and Conway1974, Davy and O'Brien 1975).
6.3.5. Mussels
Freshwater mussels (Velesumio angasi) are a significant dietaryitem for the Aboriginal people in the Arnhem Land region of NorthernAustralia, where uranium mining is being developed on a large scale (Foxet al. 1977). The available field data for this single species arepresented in Figure 6.6. The best-fit regression is
Q = 203 C0'78 (6.14)with r2 = 39.2% and p < 0.001. The regression coefficient b = 0.78 isnot significantly different from 1 and the equivalent linear model is
Q = 347 C (6.15)These mussels are apparently second only to algae in their ability toaccumulate radium.
181

6.4. VARIATION IN CONCENTRATION FACTORS
For the human dietary items, fish and mussel flesh (Figures 6.5,6.6), the data are scattered either side of the regression lines by afactor of + 10. This level of uncertainty suggests that the averagevalues for the concentration factor are of little use in dose assessmentwithout the availability of site specific data that may reduce thevariance. In the case of fish, the variance may possibly be explained bythe variety of fish diets, feeding habits and migration patterns; howeverin the freshwater mussels, the data (Figure 6.6) refer to a singlespecies in a single region and thus constitute site and species specificdata. The cause of this extraordinary variation is being investigated(Jeffree, Australia).
In contrast to the fish and mussel variation, the algal data areremarkably uniform (Figure 6.1). Although they spread within a range ofa factor of + 3 of the regression line, the data represent many differentspecies and habitats, including laboratory culture. It may well be thatsite and species specific data are much less variable. The insect andmacrophyte data (Figures 6.2, 6.3, 6.4) fall between these extremes ofvariation.
In the following section, it is shown that algae equilibrate veryrapidly with radium in water (1-3 days) but fish and mussels have muchlonger equilibration times; it is therefore suggested that algae beinvestigated as a monitoring medium, because of their rapid linear andpredictable response to variations in the water concentration.
Another source of error in concentration factors calculated from thedata assembled here is the difference between the linear and non-linearmodels. McDowell-Boyer et al. (1980) assumed linearity and calculatedconcentration factors from the arithmetic mean of the available data on226Ra in the terrestrial food-chain; however Williams (1981) showedthat by using this approach overestimation by a factor of 3 andunderestimation by a factor of 30 were possible within the existingaquatic and terrestrial data on radium.
6.5. TIME BEHAVIOUR OF RADIUM UPTAKE
6.5.1. Models for Radium uptake
When data are available on radium uptake or excretion with time,somewhat more information can be gathered about the process. Thesimplest theoretical model that can be applied is that of a singlecompartment subject to linear uptake and loss processes (e.g. ICRP 1959,Hiyama and Shimizu 1969:
£Q = uC -X Q (6.16)dt
182

Where u is the uptake rate coefficient and ^ is the loss ratecoefficient. The solution to this equation, assuming that Q == 0 whent = 0, is
Q = - C (l-e~X fc) (6.17)A.At equilibrium this simplifies to
Q - - C . (6.18)A.
where - equals the concentration factor F.A
This model adequately describes the uptake of radium in the algaScenedesmus obliquus, as shown in Figure 6.7 (in the absence of barium,curve M = 0). The biological half-life (Tj/2) or this process was
Tl/2 = —— = °-64 davs (6.19)A.
Havlik (1971) found that algae fall into two groups with regard toradium uptake behaviour; one group responds with a monotonie increase inradium concentration with time, achieving equilibrium in about 3 days;the other group shows a maximum uptake after 1 day followed by a decline,lasting about 5 days, to equilibrium. When the adsorbed and absorbedfractions are separated out, in the former species absorption is thedominant process, whereas, in the latter, adsorption is the dominantprocess. The rapid uptake and subsequent decline in the adsorptiondominant process (similar to the response of S. obliquus in the presenceof barium, Figure 6.7) can be explained by a rapid surface exchangemechanism which reverses as the radium concentration in water declines asa result of uptake by the algae; the radium concentration in water variedinversely with that in the algae, even in the continuous cultureexperiments (Havlik and Robertson 1971). A full explanation of radiumuptake in algae therefore requires a two-compartment rather than asingle-compartment model.
Multi-compartment models are also required in higher organisms, forexample in vertebrates in which the skeleton and soft tissues have verydifferent radium retention characteristics. Such models have been usedto describe radium uptake and retention in man (ICRP 1973) and in rats(Loevinger et al. 1956), however none have yet been applied to radiumuptake in aquatic organisms.
Some data are available on radium retention in fish. Lucas et al.(1979) conducted radium injection experiments on bluegill (Lepomismacrochirus) and, on the basis of results from 2 fish, constructed thefollowing whole-body retention function:
R = 0.8 t'0-15 (6.20)where R is the fraction remaining after 5 days. After 230 days, 35% ofthe Ra remained, indicating that equilibrium would be achieved only aftera somewhat longer period. As fish are an important dietary item in mostcultures, their radium retention characteristics need to be defined moreclearly. By comparison, strontium studies in fish have yielded a varietyof results; Lucas et al. (1979), quoting other sources, estimated aretention function for the marine grouper which gives 62% retention after200 days, an Lebedeva (1962) found an experimental equilibrium within
183

60-120 days in yearling carp. Obviously fish need to be studied forperiods of more than a year.
For a simple, linear, one-compartment model, uptake and loss ratesof radium can be calculated from the equilibrium time and theconcentration factor by using equation (6.19) and assuming that thehalf-life is about a fifth of the equilibrium time (5 half-lives yield97% equilibrium in equation 6.17). For example, the 3-day equilibrium inalgae yields a half-life of 0.6 days and thus a loss rate of
In2 .\ = —— = 1.16 day"1 (6.21)0.6since F = - = 432 (from Figure 6.1)
X.'. u = 501 day"1
For aquatic macrophytes, Iskra et al. (1970) found an equilibriumtime of 12-15 days. A similar equilibrium period (4-12 days) was foundby El-Shinawy and Abdel-Malik (1980) for the uptake of phosphorus (amajor nutrient), cobalt (a trace nutrient) and cesium (a tracenon-nutrient) in 3 aquatic vascular plants, so a common rate of uptake issuggested. From Equation (6.21), an equilibrium time of 12 days yields abiological half-life of 2.4 days, hence a loss rate coefficient of 0.29days""1, and with a concentration factor of 55 (Figure 6.3) gives anuptake rate coefficient of 16 day"1. This means that algae take upradium about 30 times more rapidly than macrophytes, and lose it 4 timesmore rapidly, which explains the difference of the factor of 7 betweentheir concentration factors.
6.5.2. Equilibrium Times and Food-Chain Transfer
Radium uptake by organisms that belong to the human food-chain isa dynamic process, and equilibrium is not necessarily achieved at eachtrophic level (Williams 1981). The degree of equilibrium that isachieved can be assessed by comparing the equilibrium time with thefood-chain transfer time. The food—chain transfer time is the intervalbetween the initiation of radium uptake and ingestion by the next link inthe food chain.
Algae have the shortest equilibrium time (~ 3 days) and, as this iscommensurate with their growth rate, equilibrium can normally beassumed. For macrophytes with their ~ 12 day equilibrium time,equilibrium can be assumed for mature foliage, but for animals whichgraze exclusively on young growing tissue, equilibrium would not beestablished.
No data are available on the rate of radium uptake in insects.For freshwater mussels, Jeffree (Australia) has observed that the
radium concentration in flesh continues to increase with age (size) inedible mature animals from a single location, which indicates thatequilibrium is not achieved in the harvestable lifetime of the animal;28^day experiments in which radium uptake was induced also failed toreach equilibrium.
184

For fish, the Lucas et al. (1979) data analysed previously suggestthat radium may be accumulated throughout much of the range of thefood-chain transfer time (2-6 years); however this result needs furtherexperimental confirmation.
6.6. MAJOR ION EFFECTS
Uranium mill effluent usually contains high concentrations ofdissolved Ca, Mg, 804, Mn and/or Cl and thus will change the salinityof the receiving freshwater as well as the radium concentration. Thepresence or absence of major ions in solution has a strong influence onthe biological uptake of non-nutrient trace substances (Polikarpov 1966)and so this effect needs to be quantified for radium uptake.
In a study of four Italian lakes, de Bortoli and Gaglione (1972)found that the calcium concentration (M, mg L"1) influenced the radiumconcentration factor in fish (F) as follows:
F = 460 - 11.83 M (6.22)
A similar effect on strontium was also observed with the followingequation:
F = 347 - 7.33 M (6.23)For radium, this implies that, if the linear model is correct, thepresence of 10 mg L~l of Ca would reduce radium uptake by 26%, and aconcentration of ~ 40 mg L~^ Ca would suppress accumulationaltogether. In agreement with this type of result, Jeffree (Australia)found that uptake of radium by the freshwater mussel Velesunio angasi wassuppressed in the presence of 5 mg L~^ Ca, but not in the presence of0.5 mg IT1 Ca.
More detailed data were obtained by Sebesta et al. (Czechoslovakia)during experiments on the effect of barium concentration on radium uptakein three species of unicellular algae. Figure 6.7 shows the results forScenedesmus obliquus in the presence of 0, 0.1, 1.0 and 10 mg L"1 ofBa. The data have been normalized to a concentration factor of 440 (fromFigure 6.1) since the original data were presented as percentages. Theradium concentration in the medium at the beginning of the staticexperiment was 4000 Bq L~l, and the results shown are the means ofrepeated experiments.
Equation 6.17 was fitted to the "no barium" data, with u / X = 440,C = 1 and X = 1.09 day1, and r2 = 96% for the fit; the half-time ofthis uptake process is ~ 15 hours. The effect of barium was estimated byfitting a linear regression to the (log) equilibrium concentrations foreach of the 3 non-zero treatments (for which r2 = 99%) and substitutingthis regression for u/A in equation (6.17) to give
Q = (43 - 33.5 log M) (1 - e~1.09t) (6.24)
185

This model was then used to predict the uptake behaviour of the bariumtreatments. As the Figure 6.7 shows, the equilibrium concentrations arewell predicted by the model (from 3 days onwards); however, the behaviourat 6 hours was greatly underestimated in all treatments. Havlik (1971)and Havllc and Robertson (1971) found that in some algae rapid adsorptionoccurred (within 1 day), but absorption did not become significant untilafter 3 days. The result indicated in Figure 6.7 could therefore beexplained if the presence of barium has a greater suppressive effect onradium absorption than it has on radium adsorption.
Several factors may cause the suppression of radium uptake bycalcium and barium. Calcium is essential for both the structure andfunction of membranes, therefore variation in calcium concentration willinduce both a Ca-membrane interaction and a Ca-Ra interaction. Activesolute uptake through membranes is thought to occur at specific locationswhere a specialized protein structure acts as a gate (Klingenberg 1981).Kyte (1981) claims that there are only 3 basic "pumps" or types of uptakemechanism: Na+- K+, Ça**, and IT1"- K+. It is therefore likelythat Ra and other alkaline-earth elements are taken up via the Ca gate.
The simplest Ca-Ra interaction would be that of isotopic dilution,Ra being taken up as if it were Ca. However, this predicts an observedratio of 1 and thus fails to explain discrimination against Ra relativeto Ca (Section 6.2); it also fails to explain why there is an absolutedecrease in the amount of radium uptake when there is an increase incalcium uptake. This latter phenomenon might be explained if it could beshown that the discriminatory power of the membrane increased as the Caconcentration increased; this behaviour has been observed in plants(Epstein 1972).
Figure 6.7 shows that increased Ba also suppresses Ra uptake inAlgae. This cannot be explained by a Ca-membrane interaction as it isnot likely that Ba (a non-nutrient) could make up for a Ca deficiency.Another explanation of the Ba effect can be derived from the fact thatthe protein gate structures in the cell membrane operate at a finiterate, and hence become saturated as the ion concentration increases.This saturation behaviour has been widely observed and, in the case ofplants, was first described theoretically by the Michaelis-Mentenenzyme-kinetic equation (Epstein 1972):
V = VmC/(C4K) (6.25)
where V is the rate of uptake, Vm is the maximum rate of uptake and Kis the Michaelis constant, equal to the value of C at Vm/2. If V issubstituted for uC in equation (6.16), then at equilibrium theconcentration factor for Ca (and presumably for other solutes taken upvia the Ca"*"4" gate) will be
F = -£- (6.26)XCThis equation predicts that when the concentration is low (C K), V willincrease in proportion to C and the value of F will remain constant as Cincreases; however, as the uptake system saturates and C continues toincrease (C> K), F will decrease in proportion to 1/C. The increasingdilution of Ra among those elements passing the Ca"*"1" gate will thereforecause its uptake to decrease as C increases beyond the saturation point.Presumably Ba could saturate the mechanism and thus reduce Ra uptake justas well as Ca.
186

In summary, it is clear that Ca and Ba, at least, have a majorinfluence on Ra uptake, and the concentration factor for radium is notindependent of the concentration of these elements. Other elements thatmay also influence Ra uptake are at present unknown.
6.7. BIOLOGICAL TRANSPORT
So far, the discussion has assumed a geographical equilibrium inthe distribution of effluent radium, but this is not necessarily arealistic assumption. Effluent streams move with hydrological, chemicaland erosion processes, and there is also a biological transportcontribution. Two of these biological transport processes are nowconsidered : animal migration and macrophyte - sediment interactions.
6.7.1. Animal Migration
Animal migration has been largely neglected in studies of radiumcontamination of waterways so there are few site studies that haveincluded relevant information.
In northern Australia, a significant commercial and game fishery isbased on barramundi (Lates calcarifer), a migratory species which spendsmuch of its life in freshwaters receiving drainage from uranium miningdevelopments (Pollard 1974). The adults live in the freshwater reaches ofthe coastal rivers and in their associated streams and waterholes; theymigrate down-stream at the beginning of the wet season (December) to spawnin the tidal waters of the estuary. After the eggs hatch and thejuveniles develop in the estuary for 1-2 years, they migrate upstream atthe end of the wet season (April). As these times of migration are alsothe best times for catching barramundi, animals from contaminated watersmay be taken 50-100 kilometres away from the pollution site. When caughtin the estuary, fish which normally live in a polluted, upsteam area couldtherefore carry a significant percentage of the radium burden of fishcaught further upstream, at the site of maximum contamination.
In contrast, another migratory fish of northern Australia is thetarpon, or ox-eye herring (Megalops cyprinoides). It inhabits estuariesbut moves into freshwater in summer (wet season) to spawn (Pollard 1974).Fingerlings are often found in freshwater creeks at the end of the wetseason but larger juveniles are found back in the estuaries. The exposurethat the tarpon might encounter as a fingerling in contaminated freshwateris therefore likely to be minimal since its major growth period is spentelsewhere.
Another example of radium transfer via animal movement is the Asianwater buffalo (Bubalis bubalis) which inhabits the freshwater wetlands ofNorthern Australia; although it is a territorial species (Tulloch 1978),its grazing and camping areas can be several kilometres apart. The meatis used for human consumption, so the feeding habits of family groups needto be monitored. Also the animals defecate, primarily around thecampsite, and thus contaminated faeces may lead to a local accumulation ofradium in soil. Bird colonies were suggested by Klechkovskii et al.(1973) as a similar source of local accumulation of radionuclides indroppings.
187

6.7.2. Macrophyte - Sediment Interactions
Radium is very rapidly adsorbed onto sediment in surface waters(see Chapter 5, this volume). Concentrations of up to 35 kBq kg~1Ra-226in polluted sediments have been reported (lyengar et al. India, 1978progress report), however the highest contaminated sediment concentrationfor which we have corresponding plant data is that of Havlik et al. (1980)where the average concentration is ~ 500 Bq kg"1 (Figure 6.2). Themacrophyte radium concentration under these conditions was 8 Bq kg"1.If an annual macrophyte production of 10 kg m~2 is assumed (Likens 1975)which is dispersed in a 1 metre deep water column, it would amount to 0.08Bq L"1 in the water, which is about 3 times background; by comparison,sediment containing 500 Bq kg"1 is contaminated to ~ 40 times background.
It is not possible at this stage to asses the significance of thistype of vegetative recycling but it is an effect worthy of further study;it has been identified by Carignan and Kalff (1980) as a nutrientrecycling mechanism. Radium transfer in the opposite direction may alsobe possible, when the water only is contaminated. Mortimer and Kudo(1974) found a doubling of mercury content in sediment supporting Elodeain contaminated water, compared with plant-free sediment, and this mayalso be possible with radium.
Other possible interactions between vegetation and sediment includethe uptake of radium by vegetation, thus making it unavailable foradsorption on sediment; free-floating phytoplankton transporting theradium downstream at a faster rate than it can be adsorbed on sediment;and rooted macrophytes temporarily immobilizing the radium until thefoliage begins to decay, thus enabling radium to enter the detritus poolswhich hydrologically is generally more mobile than mineral sediment. Theextent of organic complexation of radium in natural waters is unknown butmetal—organic complexes are usually more soluble (Lasheen 1974) andbiologically more available (George and Coombs 1977) than surface-adsorbedmetals, so it is possible that the radium, after decay of the plantmaterial, is also chemically more mobile than that adsorbed onto sediments.
6.8. SUMMARY AND RECOMMENDATIONS
For animals, at least, it appears that radium is taken up andmetabolized in the same way as calcium, however, there seems to be amechanism in all cells for excluding radium, with an efficiency of50-98%. There is some evidence that radium behaves differently to calciumin plants. Radium concentration generally decreases with trophic level inthe human food-chain.
Algae have a remarkable uptake response to radium; the response Islinear over 7 orders of magnitude, rapidly establishes equilibrium and ishighly predictable, with 94% of the variance being explained by the linearmodel. Insects, fish, mussels and macrophytes all have a more variableresponse.
Throughout the world fish are of key importance in human diet, butshow a nonlinear and non-equilibrium radium uptake response, it therefore
188

seems unwise to use a generic model for fish. As an example of locallyimportant dietary item, freshwater mussels also have a greatly variableand non-equilibrium uptake response. Fish, mussels and algae have areduced radium uptake in the presence of excess Ca or Ba; this effectshould not be ignored in fresh waters contaminated by uranium mill wastecontaining high levels of alkalith elements. The relative contribution ofwater and diet to radium uptake by any aquatic organism has not beenstudied.
Animal migration is not a significant factor in mass transport ofradium, except for local concentration in faeces produced by colonialanimals. Radium may possibly be retained in fish for long periods; thiscould be significant if a large proportion of seasonal catch has migratedfrom a polluted area.
There are several ways in which plants interact with sediment; radiumincorporated in phytoplankton and/or macrophyte detritus may betransported more rapidly than that Incorporated in mineral sediment;radium absorbed from water by macrophyte foliage may be accumulated insediment more rapidly than in the absence of macrophytes.
It is recommended that future research on the biological uptake andtransport of radium be as follows:
a. Obtain site^specific experimental data on radium uptake in fishand other human dietary items (e.g. mussels) with specialemphasis on the rate of uptake, the relative contributions offood and water, and the effects of increased Ca, Mg, 804 and/orBa concentrations (the latter when Ba(Ra)SC>4 is used in wastewater treatment plants).
b. Conduct field and laboratory studies on radium uptake ininvertebrates that are significant in fish diets.
c. Evaluate algae as a monitoring medium for radium in fresh waters.d. Investigate macrophyte-sediment-water interactions to quantify
the relative importance of the possible flow directions takinginto account seasonal and life-cycle variations and theavailability of radium in sediment and water.
e. Conduct comparative studies on plants using radium and calciumand a variety of other nutrient and non-nutrient elements toidentify the factors affecting radium uptake and translocation inplants.
f. More thoroughly investigate radium uptake by crops fromirrigation water.
ACKNOWLEDGEMENTS
Comments on the first draft were provided by participants fromthe IAEA program B. Havlik and D.R. Davy; extensive comment and discussionby D.R. Davy was particularly helpful.
189

"ft-•H
fres
h
enX
S
<üCn
slO04IN
w7.
10
1C*
103J
102-
10°-
103 1Ö"2 Iff1 10° 101 102 103 104 105
226Ra in water ( Bq iT1}
Figure 6.1 The relationship between radium concentration in algaeand in the supporting water. Q = Anderson et al. 1963,0= Martin et al. 1969, -f~= Justyn et al. 1979,0= Markoseet al. 1980,O= de Jesus, s. Africa, ^= lyengar et al. 1980,O = Havlik 1971 and Havlik and Robertson 1971 (expérimentaldata). For thé régression, N = 71, X = -0.409, Y = 2.226,S = 0.030, r = 0.971, p « 0.001. The dotted line representsthe linear function. Weight conversions were based on 10%
dry matter and 2% ash content.
190

,4 100-&-H
3>
j» 10-Po.
* 1-01
S
3 ^*" cO
«2 0.1-
INOJ
, >^ 0?"o o ^-ft
O x " ® ®^-^
o o ° -6 _^-^^® ®OA ^DOs-^V ®
o ^ o f Ä % çp " o3M#$o o
^-^ß l' •'rv'20-' >-O ^/^-*"VJ*-' ^^Q. ^ o
.-oX
0
^
o0
10 100 1000226Ra in sediment (Bq kg * wet weight)
Figure 6.% Relationship between radium concentration in aquaticmacrophytes and in supporting sediment. For the regression,N = 59, X = 1.387, Y = 0.264, S = 0.121, r = 0.472, p < 0.001.The dotted line represents the linear function. Sedimentassumed to contain 40% dry matter and 30% ash, plants assumedto contain 10% dry matter, 2% ash. O = Havlik 1967,0= Havlik 1970,0= Havlik et al. 1980,0= Williams, Australia.
191

103.
a 10eW
o\ io«ta§ 'v nU S? 10 HS -••-l o
<£>(Mc\l
o
0.01 0.1 1226Ra in water (Bq L l}
10
Figure 6.3 Relationship between radium concentration inaquatic macrophytes and in supporting water. For theregression, N = 62, X = -0.797, Y = 0.941, S = 0.158,r = 0.705, p < 0.001. The dashed line represents thelinear function. Plants assumed to contain 10% drymatter and 2% ash. 0 = Havlik 1967,0 = Havlik 1970,0= Havlik et al. 1980,0= Pradel, France,0 = Justynet al. 1979.
192

01%«M
01•Po0)WcH
•H
u>CMCM
100
10-
& 1 -
0.01 0.1226 -l
Ra in water (Bq L )
Figure 6.4 Relationship between radium in aquatic insectsand in the surrounding water. Q = Andersen et al. 1963,(9 = Martin et al. 1969,0= Tsivoglou et al. 1960,(5) = Stegnar and Kobal 1980, 1981. For the regressionN = 35, X = 1.395, Y = 1.054, S^ = 0.079, r = 0.873,p < 0.001. The dotted line represents the linearfunction. Weight conversions were based on 2% ash and10% dry weight.
193

100 T
•s(UÖ»
S1
•s0)
01•ri
ö•ri
10-
1-
0.1
0.01
O *'
0.001 0.01 0.1— i
in water (Bq L 1)
Figure 6.5 Relationship between radium concentration in fish fleshand in the surrounding water. O= Anclerson et al. 1963,Martin et al. 1969, de Bortoli and Gaglione 1972, Ettenhuberet al. 1975, Justyn et al. 1979, Paul et al. 1980, Markose et al.1980, lyengar et al. 1980, lyengar-India, Pradel-France, Stegnarand Kobal 1981, Fourcade et al. 1981; 0= Davy and Conway 1974,Davy and O'Brien 1975. For thé régression, N = 108, 5E = -1.627,Y = 0.01, S, = 0.062, r = 0.719, p < 0.001. The dashed linerepresents the linear function.
194

W
S
01
ftIQ0)
rH«H
<U0)01
G•H
10CMCM
100-
0.01 0.1226Ra in water (Bq
Figure 6.6 Relationship between radium in mussel flesh and insurrounding water.0 = Davy and Conway 1974, • = Jeffree, Australia,9 = Noranda 1978. For the regression, N = 50,X = -1.07, Y = 1.47, S = 0.140, r = 0.626, p < 0.001.The dotted line represents the linear function.
195

50Ch
SH
I&
.o....
0 1TIME (days)
Figure 6.7 The effect of barium concentration (M, mg iT1)on the uptake of radium by Scenedesmus cibliguus.The solid curves represent the model predictions,the dotted lines join the data points. Data ofSebesta et al. (Czechoslovakia).
196

REFERENCES
ANDERSON J.B., TSIVOGLOU E.G., and SHEARER S.D.,"Effects of uranium mill wastes on biological fauna of the AnimasRiver (Colorado - New Mexico)".Radioecology (Proc. First Nat. Symp. on Radioecology, FortCbllins, 1961, ed. V. Schultz and A.W. Klement) Rheinhold andA.I.B.S., Washington (1963) 373-383.BHUJBAL B.M., D'SOUZA T.J. and MISTRY K.B.,"Discrimination between radium and calcium in the soil-plantsystem".Radiation and Radioisotopes in Soil Studies and Plant Nutrition(Proc. Symp. Bangalore, 1970) FAO and Indian Dept. of AtomicEnergy, Bombay (1971) 155-165.BROWNSCOMBE A.J., DAVY D.R., GILES M.S. and WILLIAMS A.R.,Three Baseline Studies in the Environment of the Uranium Depositat Yeelirrie, Western Australia.Australian Atomic Energy Commission, Lucas Heights, AAEC/E442(1978).CARIGNAN R. and KALFF J.,Phosphorus sources for aquatic weeds: water or sediment?Science 207 (1980) 987-989.DAVY D.R. and CONWAY N.F.,"Environmental studies, Northern Territory uranium province1971/73".The Alligator Rivers Area Fact Finding Study - Four AAEC Reports,Australian Atomic Energy Commission, Lucas Heights, AAEC/E305(1974) III.
DAVY D.R. and O'BRIEN B.C.,"Radiological aspects".Rum Jungle Environmental Studies (ed. D.R. Davy), AustralianAtomic Energy Commission, Lucas Heights AAEC/E365 (1975) Ch. 9.
DE BORTOLI M. and GAGLIONE P. ,Radium-226 in environmental materials and foods,Health Physics 22. (1972) 43-48.EL-SHINAWY R.M.K. and ABDEL-MALIK W.E.Y.,Retention of radionuclides by some aquatic freshwater plants.Hydrobiologia 69 (1980) 125-129.EPSTEIN E.,Mineral Nutrition of Plants: Principles and Perspectives,John Wiley, New York (1972) Ch. 6.
ETTENHUBER E., CLAJUS P. and ROEHNSCH W.,Bestimmung der Akkumulationfactoren Fisch/Wasser einiger fur dieStrahlenbelastung des Menschen Wichtiger Radionuklide.Staatliches Amt Für Atomsicherheit Und Strahlenschutz SAAS-175(1975).
197

FOURCADE N., MARPLE M.L. and ZETTWOOG P.,"Le radium-226 dans la chaîne alimentaire au voisinage d'une mineet d'usine de traitement d'uranium situées dans le centre de laFrance".Migration in the Terrestrial Environment of Long-livedRadionuclides from the Nuclear Fuel Cycle (Proc. Int. Symp.Knoxville, 1981) International Atomic Energy Agency, Vienna,IAEA-SM-257 (1981) paper 97P.
FOX R.W., KELLEHER G.G. and KERR C.B.,Ranger Uranium Environmental Inquiry. Second report,Australia Govt. Publishing Service. Canberra (1977).GEORGE S.G. and COOMBS T.L.,The effects of chelating agents on the uptake and accumulation ofcadmium by Mytilus edulis.Marine Biology J3£ (1977) 261-268.HAVLIK B.,Cumulation of radioactive substances by organisms of naturalbiocenosis of surface waters and its significance fordetermination of radioactive load.J. Hyg. Epidem. Microbiol. Immunol. 11^ (1967) 229-245.
HAVLIK B.,Radioactive pollution of rivers in Czechoslovakia.Health Physics 19 (1970) 617-624.HAVLIK B. and ROBERTSON E.,"Radium uptake by freshwater algae".Radionuclides in Ecosystems (Proc. Illrd National Symp. onradioecology, Oak Ridge 1971), CONF-710501-P1 (1971) 372-380.HAVLIK B., HANUSOVA J. and MARTINEC M.,Radioactivity of surface water in the Ploucnice River Basin.Ceskoslovenska Hygiena 25 (1980) 77-83 (In Czech).HIYAMA Y. and SHIMIZU M.,"Uptake of radionuclides by aquatic organisms: the application ofthe exponential model".Environmental Contamination by Radioactive Materials (Proc. ofSeminar, Vienna, 1969) International Atomic Energy Agency, Vienna(1969) 463-476.ICRP,Permissible Dose for Internal Radiation.International Commission on Radiological Protection, Pergamon,Oxford, Publication No. 2 (1959) 16.ICRP,Alkaline Earth Metabolism in Adult Man.International Commission on Radiological Protection, Pergamon,Oxford, Publication No. 20 (1973).
ICRP,Report of the Task Group on Reference Man.International Commission on Radiological Protection, Pergamon,Oxford, Publication No. 23 (1975) Ch. 2.
198

ICRP,Radlonuclide Release in the Environment: Assessment of Doses toMan.International Commission on Radiological Protection, PublicationNo. 29, Annals of the ICRP 2, 2(1979) C.ISKRA A.A., KULIKOV N.V. and BAKHURÖV V.G.,Role of freshwater vegetation in processes of migration anddistribution of natural radioactive elements in the reservoir.Transi, from Ekologiya ï_ (1970) 83-89, in Soviet J. Ecology (1970) 157-162.IYENGAR M.A.R., RAJAN M.P., GANAPATHY S. and KAMATH P.R.,"Sources of radiation exposure in a low monazite environment".The Natural Radiation Environment - III (Symp. Proc., Houston,1978). Technical Information Centre, Springfield, CONF-780422(1980) 1090-1106.JUSTYN J., MARVAN P. and ROSOL J.,Radioactive wastes and aquatic organisms.Vydal Vyzkumny ustav vodohospodarsky ve Statnim zemedelskemnakladatelstvi, Praha, Prace and Studie Sesit 151 (1979) 43-214(In Czech).KIRCHMANN, R., BOULENGER R., LAFONTAINE A.,"Absorption du "Ra par les plantes cultivées".Proc. First Int. Cong. of Radiation Protection (Rome, 1966)Pergamon, Oxford (1968) 1045-1051.KLECHKOVSHII V.M., POLIKARPOV G.G., ALEKSAKHIN R.M. (Eds),Radioecology.(Transi. Ed. D. Greenberg) Wiley, New York (1973) 251.KLINGENBERG M.,Membrane protein oligomeric structure and transport function.Nature 290 (1981) 449-454.KYTE J.,Molecular considerations relevant to the mechanism of activetransport.Nature 292 (1981) 201-204.
LASHEEN M.R.M.W.,Factors influencing metal uptake and release by sediments inaquatic environments.Ph.D. Thesis, University of Michigan, Ann Arbor (1974).LEBEDEVA G.D.,Principal points of entry of strontiutn-89 into benthos-eatingfishes in freshwater.Radiobiologiya 2_ 1 (1962) 43-49 (AEC-TR-5428, 62-71).LIKENS G.D.,"Primary production of inland aquatic ecosystems"Primary Productivity of the Biosphere, Ed. H. Leith, R.H.Whittaker, Springer-Verlag, Berlin (1975) Ch. 9.
199

LOEVINGER R., HOLT J.G., HINE G.J.,"Internally administered radiosiotopes".Radiation Dosimetry, Ed. G.J. Hine, G.L. Brownell, AcademicPress, New York (1956) Ch. 17.
LUCAS H.F., SIMMONS J., MARKÜN F., FARNHAM J. and KEENAN M.,Radon and radium retention in the bluegill.Health Physics 36 (1979) 147-152.MARKOSE P.M., EAPPEN K.P., VENKATARAMAN S. and KAMATH P.R.,"Distribution of radium and chemical toxins in the environment ofa uranium complex".Natural Radiation Environment III (Proc. Symp. Houston, 1978)Technical Information Centre, Springfield, CONF-780422 (1980)1655-1667.
MARTIN S.S., HELM W.T. and SIGLER W.F.,"Accumulation of 26 3 £n two aquatic ecosystems".Symposium on Radioecology (Proc. 2nd Nat. Symp., Ann Arbor, 1967,D.J. Nelson and F.C. Evans eds.) CONF-670503 (1969) 307-318.McDOWELL-BOYER L.M., WATSON A.P. and TRAVIS, C.C.,A review of parameters describing food-chain transport oflead-210 and radium-226.Nuclear Safety 1 4 (1980) 486.
MORTIMER D.C. and KUDO A.,"Interaction between aquatic plants and river bed sediments inthe uptake of mercury from flowing water".Proc. Int. Conf. on Transport of Persistent Chemicals in AquaticEcosystems (Ottawa, 1974) National Research Council of Canada,Ottawa (1974) III 11-15.
MYTTENAERE C., BOURDEAU P. and BITTEL R.,"Importance relative de l'eau et du sol dans la contaminationindirecte en radiocesium et radiocobalt de rivières irriguées".Environmental Contamination by Radioactive Materials (Proc.Seminar Vienna, 1969) International Atomic Energy Agency, Vienna(1969) 175-182.
NORANDA, KOONGARRA PROJECT,Draft Environmental Impact Statement.Noranda Australia Ltd., Melbourne (1978) Appendix I.
PAUL A.C., LONDHE V.S. and PILLAI K.C.,"Radium-228 and radium-226 levels in river environment and itsmodification by human activities".Natural Radiation Environment III (Proc. Symp. Houston 1978)Technical Information Centre, Springfield, CONF-780422 (1980)1633-1654.
POLIKARPOV G.C. ,"Regularities of uptake and accumulation of radionuclides inaquatic organisms". Radioecological Concentration Processes(Proc. Int. Sym. Stockholm, 1966) Pergamon, Oxford (1967) 819.
200

POLLARD D.A.,"Freshwater fishes of the Alligator Rivers "Uranium Province'area (Top End, Northern Territory) with particular reference tothe Magela Creek Catchment (East Alligator River System)".The Alligator Rivers Area Fact Finding Study: Four AAEC Reports,Australian Atomic Energy Commission, Lucas Heights, AAEC/E305(1974) I 1-71.
SMITH K.A.,The comparative uptake and translocation by plants of calcium,strontium, barium and radium, 1. Bertholletia excelsa (BrazilNut Tree).Plant and Soil _34 (1971) 369-379.SMITH K.A.,The comparative uptake and translocation by plants of calcium,strontium, barium and radium, II. Triticum vulgäre (wheat).Plant and Soil 3 (1971) 643-651.STEGNAR P., KOBAL I.,Radioecology of uranium and radium with special reference to auranium mining area".International Studies on the Radioecology of the Danube River1976-1979, International Atomic Energy Agency IAEA-TECDOC-229(1980) 175.STEGNAR P., KOBAL I.,"Uptake and distribution of radium and uranium in the aquaticfood chain".Migration in the Terrestrial Environment of Long-livedradionuclides from the Nuclear Fuel Cycle (Proc. Int. Symp.Knoxville, 1981). International Atomic Energy Agency, ViennaIAEA-SM-257 (1981) paper 87P.
TSIVOGLOU B.C. , STEIN M., and TOWNE W.W.,Control of radioactive pollution of the Animas River.J. Water Poll. Control Fed. 32^ (1960) 262-287.
TULLOCH D.,The water buffalo, Bubalis bubalis, in Australia: grouping andhome range.Aust. Wildl. Res. _5_ (1978) 327-354.
USNRC,Final Generic Environmental Impact Statement on Uranium Milling.U.S. Nuclear Regulatory Commission, Washington, NUREG-0706 (1980)Vol.3.
VAN DORP F., ELEVELD R. and FRISSEL M.J.,"A new approach for soil-plant transfer calculations".Biological Implications of Radionuclides Released from NuclearIndustries (Proc. Int. Symp.; Vienna, 1979) International AtomicEnergy Agency, Vienna (1979) 399-406.
201

WILLIAMS A.R.,"Biological uptake and transfer of ^^Ra: a review".Migration in the Terrestrial Environment of Long-livedRadionuclides from the Nuclear Fuel Cycle (Proc. Int. Symp.Knoxville, 1981) International Atomic Energy Agency, ViennaIAEA-SM-257 (1981) paper 92.
202

Chapter 7
DOSE ASSESSMENT
A.S. PASCHOADepartamento de Fisica,
Pontificia Universidade Catölicado Rio de Janeiro,
Rio de Janeiro, Brazil

7.1. BASIC CONCEPTS
The basic concepts associated with radiation protection hâvebeen under development for many years now. The doses to total body andto bone from a body burden of "ogg have an historical interest, sincein the development of the basic concepts for radiation protection thebody burdens of other radionuclides were compared to that of radium bythe Committee II or the International Commission of RadiologicalProtection (ICRP, 1960).
7.1.1. Absorbed Dose and Dose Equivalent
The internal radiation dose absorbed per Bq( ) deposited inany part of the human body depends upon the decay scheme of theradionuclide, its distribution throughout the body or organ, and the timeintegral of the radioactive concentration at a time t, which takes intoaccount the residence time of the radionuclide in the human body. Inaddition to the concept of absorbed dose(**), D, just mentioned, theconcept of dose-equivalent' ', H, has also been introduced in thefield of radiation protection to improve the correlation between thedeleterious effects of exposure to radiation and the absorbed dose.
The conceptual basis for the determination of dose equivalent isdiscussed in the ICRU Report 25 (1976) . An excerpt from this ICRU reportis presented below."In the case of internal irradiation, estimates are made of the value ofthe dose equivalent in real, though stylized, human bodies by calculationfrom one or more of the following three kinds of information:
(i) environmental or dietary information, leading to estimates ofthe intake of radioactive materials into the body;
(ii) measurements of radiation emitted from the body or activity inbody fluids, leading to estimates of activity in the body orparts of the body;
(iii) measurements of the activity of excreta or exhaled air, leadingto estimates of the rate of loss of activity from the body andthus of the activity in the body."
(*) 1 Bq (bequerel) = 27 pCi.(**) The absorbed dose D is defined by the International Commission
on Radiation Units_and Measurements^ Report 33 (ICRU, 1980) as:"The quotient of dc^ by dm, where dç^ is the mean energy impartedby ionizing radiation to matter of mass dm. D = d^" / dm", andthe special name for the unit for absorbed dose is gray (Gy).[1 Gy = 100 rad].
(***) The dose equivalent H is defined by the ICRU Report 33 (1980)as: "the product of D, Q and N at the point of Interest intissue where D is the absorbed dose, Q is the quality factor,and N is the product of all other modifying factors.H = DQN", and the special name for the unit of dose equivalentis sievert (Sv), [1 Sv = 100 rem].
205

7.1.2. Dosimetric and Dose Assessment Models
The dose equivalent is usually estimated from a dosimetricmodel. This implies the existence of human metabolic model describingthe uptake of a nuclide from ingestion, deposition in various organs, andthe resulting radiation dose equivalent to these organs, afterdiscounting the excretion from the body.
The ICRP Publication 29 (1979a) states the following:"The dose limits for individual members of the public apply no matter howmany individuals are exposed, but the requirement to keep doses as low asreasonably achievable necessarily involves consideration of the number ofpeople exposed and the dose distribution among them."
As a consequence, a dose assessment model also becomes necessary.This model describe the radionuclide source, the exposure pathways andthe population of exposed persons, and should yield an estimate of doseequivalent for a given source strength. In some cases when the basicdata are available the exposed biota can also be included in the doseassessment model. Simplified pathways between radioactive materialsreleased to ground or surface waters and human beings can be seen inFigure 1.
Computational dosimetric models to biota are scattered in theliterature (Woodhead 1973, 1974, Blaylock and Witherspoon 1975, Le Clareet al. 1975, Preston 1975, IAEA 1976, Till 1978, Paschoa and Baptista1978, Paschoa et al. 1979b, Templeton 1979, IAEA 1979b, Paschoa et al.1981a), however, the diversity, specificity and complexity of most ofsuch models make particularly difficult the adoption of a standardizedmethodology to calculate dose to biota.
The ICRP Publication 29 (1979a) admonished prudently the following:"In almost all situations, the need to limit doses to man to low levelswill ensure that doses to other organisms will not be large enough tocause ecological changes. Nevertheless, the possibility should always bereviewed in the preoperational assessments of proposed or expectedreleases. "
The range of environmental dose rates experienced by aquatic biotawas shown earlier to be 10~7 to 10~2 Gy.h"1 (IAEA 1979), when wasalso emphasized that irradiation experiments with aquatic organismswithin this range would be most relevant to environmental studies. Morerecently the range of internal dose rate to plankton from natural andman-made alpha emitters was estimated to be 10~6 to lO
(Paschoa et al. 1981a). These authors suggested that since five ordersof magnitude are covered by the range of estimated internal alpha doserates, further research should be undertaken in the direction of theknowledge of the internal distribution of the alpha doses to plankton todistinct species in order to allow realistic predictions of the potentialeffects on these organisms resulting from routine or accidental releasesof alpha emitters from the nuclear fuel cycle.
206

7.1.3. Dose Assessment Based Upon ICRP Publication 26
The ICRP dose limits are designed to protect individual workers,and by extension, individual members of the public. Thus the firstpriority in waste release to the environment is to keep the dose toindividual members of the public below the specified limits. The conceptof collective dose was later introduced by the ICRP Publication 26(1977b) to provide quantitative information for radiation protection ofpopulations. The practical application of the concepts associated withcollective dosimetry to the front end of the nuclear fuel cycle, however,it still very limited, as pointed out by Paschoa et al. (1981b).
As mentioned by Paschoa et al. (1981b), the relatively new conceptsintroduced by the ICRP Publication 26 (1977b), and promptly adopted as apolicy by the IAEA, Safety Series No. 45 (IAEA, 1978), seem to be moredifficult to apply to the case of 226 dose limits to the front end ofthe nuclear fuel cycle than anticipated, because time-varying parametersmay have to be treated as constants while other parameters may beignored, and uncertainties associated with extrapolations from Inaccuratedata may not be taken properly into account in the evaluation of thecollective dose equivalent associated with the front end of the nuclearfuel cycle.
7.1.4. The Concept of Collective Dose Equivalent
There are several shortcomings involved in formulating a complexdose assessment model, as the ICRP Publication 26 (1977b) points outclearly; the paragraph 22 defines the concept of collective doseequivalent in a carefully worded statement as follows:"The relationship between detriment and the distribution of doseequivalent in an exposed population is not simple, and no single quantitycan adequately represent the distribution for the purpose of assessingdetriment. Nevertheless, there are many situations in which availableuse can be made of the quantity called collective dose equivalent. Thecollective dose equivalent (S) in a population is defined by theexpression
S = IjHiPi (1)
where % is the per caput dose equivalent in the whole body or anyspecified organ or tissue of the P^ members of sub group (i) of theexposed population."
Paragraph 219 of ICRP Publication 26 acknowledges the difficulties inapplying the system of dose limitation to cases such as, for example, theexposure due to dispersion in the environment of radioactive materials,the exposure due to a natural source of radiation or to practices ineveryday life that cause an increase in the level of dose resulting fromthe natural background of radiation; they use the following carefulword ing :"Because of its complexity, assessment of collective dose equivalentinvolve the use of simplifications and approximations, particularly whena large population is irradiated at low dose levels. Because of this,they may involve considerable uncertainties and these must be borne inmind when the assessment are being used to appraise the detrimentassociated with practice."
207

7.1.5. Earlier ICRP Concepts
7.1.5.1. Re callon theThe ICRP has used for a number of years the following concept
associated with risk (ICRP 1966c):"...any exposure to radiation may carry some risks for the development ofsomatic effects, including leukaemia and other malignancies, and otherhereditary effects." Thus, "The probability of radiation damagemanifesting itself during the lifetime of an individual varies with theparticular tissue or tissues exposed, with the importance of the functionof the constituent cells, with the capacity of the impaired cells toreplicate, and possibly, with the means of disposal or replacement ofdamaged cells."
The concept of maximum permissible dose (MPD) was introduced toquantify a degree of risk associated with a limit of radiation dose atwhich the assumed risk was deemed to be acceptable to the individual andto society in view of the benefits derived from activities involvingexposures to ionizing radiation.
These earlier concepts associated with risk are somewhat related tothe UNSCEAR reports (1964, 1966) and to the ICRP publications 2, 8 and 9(1960, 1966 b,c).
The historical reasons behind the ICRP recommendations were examinedby Morgan (1973a) who also called the attention to the possibility thatthe linear model might not be the most conservative one to evaluate risksfrom ionizing radiation (Morgan 1973b).
7.1.5.2. Cale ula_t_ip ri of _Ma_x i_mtm_Pe_rmi jss _ible__Conce nt r_ati on£ f_r om_MI>C_-__thecaseof
The MPD concept gave rise to the maximum permissibleconcentrations in air (MPC)a and in water (MPC)W. Both the (MPC)aand the (MPC)W can be calculated based upon either the power functionor the exponential model (ICRP 1960). For comparison purposes the ICRPcomputed the MPC values according to the power function and theexponential model for the radionuclides of Sr, Ra, Pu and U, which havean effective half-life exceeding 20 days. For 226Ra the (MPC)Ccalculated by the power function was lxlO~°uCi/cm3(*) , however, theadopted values for radiation protection were 4xlO~7uCi/cm3(**) forsoluble 226gaj selecting bone as the critical organ, and assuming amaximum permissible body burden MPBB of O.ljuCl ( 0.1 ig 226 or about3.7 x 10* Bq).
(*) IxlO-uuCi/cm3 = lx!03pCi/l = 37 Bq/1.(**) 4xlO-/uCi/cm = 400 pCi/1 = 15 Bq/1.
208

The direct comparison between the body burden q of a specificradionuclide and that body burden of 226] qRa was ma<je based uponthe energy deposited in bone by 226 an(j the specific radionuclide inquestion. Thus, the quantity q could be written as follows (ICRP 1960):
qRa f2 Ra £Ra nq = ________ . —————— = ————— (2)f2 6 f2E
with 6 = %i E£ F(RBE)-£ n±
where - q 3 (= 0.1 ;uCi) is the maximum permissible body burden of- f2 is the fraction of radionuclide in the skeleton of that in
the total body (f1*3 = 0.99);- G is the effective absorbed energy per disintegration of aradionuclide ( 6Ra = no MeV);
- E is the energy (MeV) deposited in skeleton per disintegration;- RBE is the relative biological effectiveness ( 1 for X, ß~,0+, e~, it is set equal to 1.7 if the maximum energyEU ä 0.03 MeV for ß~, ß+ or e~, equal to 10 for a , and 20for recoil atoms);
- F is the fraction of disintegrations of daughter todisintegrations of parent.
The ICRP (1960) assumed that the total energy deposited in theskeleton per disintegration of 226 pius 39 percent of its daughterproducts is 11 MeV, and thus the effective energy deposited in theskeleton is Z E F (RBE)n = 110 MeV.An average absorbed dose rate (see Appendix I, ICRP 1960) to the bone of0.06 rad/week or a rate of dose equivalent to the bone of 0,56 rem/weekwas calculated from a body burden of 0.1 jaCi/^^Ra and its daughterproducts.
7.1.5.3. Eol lit i n f c rite ria or eal uati onof the Maximum Pe rmissi ble
The ICRP Publication 1 (1960) called the attention to the factthat "although tumors have not been observed in persons with body burdensof radium as low as 0.1 iiCi, the factor of safety may not be as large as10 because tumors have occured in persons having a body burden less than1 tiCi of radium at the time the tumor was first detected." However, themaximum permissible body burden of O.l^uCi^ORg was then maintained bythe ICRP Publication 2 based upon the following reasoning:
(a) radium does not Irradiate the entire hematopoietic system;(b) body burdens of 0.1 tCi of 226Ra probably produce detectable
changes In the bone but are not known to have caused seriousdamage (demonstrable harm to the individual);
(c) the principal recognizable damage from 226ßa ±s the productionof bone tumors, but the lowest body burden that has resulted in atumor Is 0.5 uCi;
(d) all radium-produced tumors have occured in persons whose originalbody burdens has been much greater than at the time the tumorswere discovered;
209

(e) most bone tumors arising in radium dial painters may beattributed to 226Ra + 228Ra in which the integrated RBE dosewas much greater than would be indicated by the 22&Ra burden atthe time the tumors were discovered; and
(f) the maximum permissible body burden of a bone-seekingradionuclide corresponding to 0.1 ;uCi of 22 Ra £s not reachedexcept following continuous exposure at the MPC values."
Thus, the dose limits recommended by the ICRP Publication 2 were basedupon the assumption that a body burden of O.luCi 22^Ra carried "noeffect" as far as bone tumors were concerned.
The ICRP Publication 9 (1966c) established that the MPD foroccupational exposure should be regarded as upper limits and the annualdose limits for members of the public should be one-tenth of thecorresponding annual occupational MPD.
A precise definition for "members of the public" was unfeasible fordosimetric purposes because it would depend on factors such as differencesin age, size, metabolism, customs, and environmental variations. Then,the concept of critical groups within the population was introduced,assuming that any such critical group was "small enough to be homogeneouswith respect to age, diet and those aspects of behaviour that affect thedose received" (ICRP 1966c). Among the factors which might affect thedesign of a routine survey for radioactivity outside the boundaries of anuclear installation should be included the population distribution andhabits of the critical group (ICRP 1966a).
7.2. APPLICATION OF COLLECTIVE DOSIMETRY TO URANIUM MINING AND MILLING
Uranium mining and milling is a practice in which exposure mayoccur due to dispersion in the environment of uranium daughter products,in particular 230Th, 226Ra, 222Rn, 210Pb and 210Po. Relevantdata for the internal dose estimates to an individual from intake of thoseradionuclides are published and summarized in the open literature (Wrenn1977, ICRP 1979b, ICRP 1980). However, the literature presents only veryfew examples of estimations of collective exposure of populations due tospecific uranium mining and/or milling operations.
Ra-226 is considered to be the most significant nuclide In waterreleases from mining and milling operations (Kristan et al. 1974).Contamination of water an aquatic biota near uranium mining and millingsites has been reported on a number of occasions (Tsivoglou 1963, Havliket al. 1968a,b, Havlik 1970, lyengar and Markose 1970b, Kirchmann et al.1971, Pradel and Zettwoog 1974, Kaufmann et al. 1975, Siek 1977, UNSCEAR1977, APS 1978, Sebesta et al. Czechoslovakia, Kurokawa and Kurosawa,Japan, de Jesus et al. , South Africa, Marple and Zettwoog, France), andbaseline studies prior to the beginning of uranium operations have alsobeen performed (Brownscombe et al. 1978, Paschoa et al. 1979).
Table 7.1 shows simplified estimates of collective dose commitmentsfrom mining and milling operations taken from United Nations ScientificCommittee on the Effects of Atomic Radiation (UNSCEAR 1977) and AmericanPhysical Society (APS, 1978). The estimates presented in Table I arebased upon incomplete dose assessment models.
210

The site of occurence of a uranium deposit economically feasible to bemined depends on geological parameters unbound to any of the criteria usedfor site selection for location of other facilities of the nuclear fuelcycle. As a consequence, dose assessment models for uranium mining inparticular have to be based upon site specific environmental models whichmay not apply to more than one situation. The impact of millingfacilities located near the uranium mining sites may take advantage of thesame site specific environmental models developed for uranium miningoperations. In any case, an effort to make more realistic estimates ofcollective dose commitments from mining and milling operations ought to bemade if the decision-making processes are to be based upon those estimates.
The ICRP recommendations have been tentatively applied to estimate thecollective dosimetry for surface waters in the uranium mining
region of Poços de Caldas (Paschoa et al. 1980), and the followingobservations were made:
1. The annual collective dose equivalents rather than the doseequivalent commitments or the collective dose equivalentcommitments for the predicted time of operation of the uraniummine of the Poços de Caldas region were calculated, because therewere several intrinsic uncertainties in the parameters availablefor the calculations.
2. The fluctuations expected to occur in the data on populationaldistribution, irrigational practices, agricultural production,and food consumption in developing regions, like the Poços deCaldas plateau, make the quantitative assessment of thecollective dose equivalent commitments meaningless, unlessreliable long range predictions can be made on the varyingparameters to enable time integration.
3. Linear models can be used to estimate the annual collective doseequivalents as a function of the 226ßa concentration, based onparameters which may be valid at a particular time, but theactual collective dose equivalent commitment is difficult topredict.
4. Dosimetric models based upon site specific environmental modelsare helpful to estimate collective dose equivalents topopulations from a particular practice, but extreme care shouldbe exercised by competent national authorities when using suchestimates in decision-making processes.
5. Paragraphs 22, 219, 221 and 232 of ICRP26 should be taken intofull account when estimating collective dose equivalents."
In spite of the shortcomings involved in the application of theconcepts of collective dose equivalent, dose-equivalent commitment andcommited dose equivalent to uranium mining and milling, one must bear inmind that the accepted aims of radiation protection are:
f it N(i) to prevent detrimental non-stochastic *• ' effects, and(ii) to limit the probability of stochastic' ' effects to an
acceptable level.
(*) Non-stochastic effects are defined by the ICRP Publication 26(1977b) as "those for which the severity of the effect varieswith the dose, and for which a threshold may therefore occur".
(**) Stochastic effects are defined by the ICRP Publication 26(1977b) as "those for which the probability of an effectoccurring, rather than its severity, is regarded as a functionof dose, without threshold.
211

On the one hand, the detriment in a population is defined by the ICRPPublication 26 (1977b) as "the mathematical expectation of the harmincurred from an exposure to radiation, taking into account not only theprobability of eacfi type of deleterious effect, but also the severity ofthe effect." On the other hand, the concept of detriment is tentativelyrelated to the collective dose equivalent (see paragraph 22 of ICRPPublication 26, quoted earlier); and further according to the ICRPPublication 26 (1977b) "the assessment of the total population detrimentdue to radiation from a given exposure should also take account of thetotal risk of hereditary damage that may be expressed in all subsequentgenerations". Thus, based upon this series of concepts introduced by theICRP a risk assessment becomes mandatory for radiation protection ofpopulations.
7.2.1. Risk Assessment and Cost-Benefit Analysis
Here it must be mentioned that this work restricts itself toaddress the problem of risk assessment for 226ßa releases from uraniummining and milling operations. The ICRP Publication 24 (1977a) discussesoccupational risks and radiation protection of workers in uranium andother mines.
The system of risk assessment as devised in ICRP 26 (1977b) may beused as the basis to evaluate the potential total population detrimentfrom human intake of 226ga from uranium mining and milling operations.
It should be emphasised here that the systems of dose limitationsrecommended earlier by the ICRP (1960), based upon a body burden of0.1 ^Ci^ORa^ had already an assumed risk built into them deemed to beacceptable to the individual and to society in view of the benefitsderived from activities, such as uranium mining and milling, involvingexposure to ionizing radiation.
Thus, the concept of acceptable risk is implicitly used when the doselimitation system of a country for 226jja js Dased on calculating thedose as a fraction of either of the (MPC)W introduced by the ICRPPublication 2 (1960) or the Annual Limits on Intake (ALI) as recommendedby the ICRP Publication 30 (1979b, 1980).
The ALI of a radionuclide is a secondary limit designed to meet thebasic requirements for limiting occupational exposure. Accordingly theALI of a radionuclide Is the greatest value of the annual intake I whichsatisfies the following inequalities (ICRP 1979b):
I Eco T (HSO T per unit intake) 0.05 Sv (3)T 'and
I(H50>i per unit intake) s 0.5 Sv (4)
where I(in Bq) is the annual intake of the specified radionuclide eitherby ingestion or inhalation; coj is the weighing factor for tissue (T)and has value as shown in Table 7.2.; and 1150,7 Per unit intake (inSv Bq~l) is the committed dose equivalent in tissue (T) from Intake ofunit activity of the radionuclide by the specified route for 50 yearsafter intake.
212

The ICRP Publication 30 (1979b) considered the period of 50 years asappropriate for an occupational lifetime, and emphasised that the HJQ is "the dose equivalent which a Reference Man is assumed to receive if helives for 50 years after his intake of the radioactive material and if nosteps are taken to accelerate the removal of the radionuclide from hisbody.
According the the ICRP Publication 26 (1977b): "a review of theradiosensitivity of bone in relation to the development ofradiation-induced cancer indicates that, per unit dose equivalent, it ismuch less sensitive than breast, red bone marrow, lung and thyroid. Forpurposes of radiation protection the risk factor for bone cancer is takento be 5 x IQ-4 SV~IM.
Table 7.3. presents the risks per unit dose. The ICRP risks arerelated to the weighting factors of presented in Table 7.2. and used inequation (3) to estimate the ALL
The ICRP in its publication 26 (1977b) inferred that the continuanceof the former genetic dose limit of 5 rem in 30 years from all sourcesadditional to the dose from the natural background radiation and frommedical procedures (ICRP 1966c) could be understood as a suggestion of"the acceptability or a higher population exposure than is eithernecessary or probable, and a higher risk than is justified by any presentor easily envisaged future development".
Assuming that risks regularly accepted in everyday life could beconsidered as a basis for the level of acceptability for fatal risks tothe general public, and taking into account that the latter are an orderof magnitude lower than for occupational risks, the ICRP Publication 26(1977b) considered that "a risk in the range of 10~6 to 10~5 per yearwould be likely to be acceptable to any individual member of thepublic." Taking into account this range for fatal risk, the ICRP (1977b)estimates that "the application of an annual dose-equivalent limit of5mSv to individual members of the public is likely to result In averagedose equivalent of less than O.SmSv, provided that the practices exposingthe public are few and cause little exposure outside the criticalgroups".
The risk assessment procedures proposed by the ICRP Publication 26 isin essence the result of an evolution in concepts. The concern with theprevention of occurrence of health effects (assumed to be non-stochasticat first) in the ICRP Publication 1 (1959) soon developed in therecommendations of the ICRP Publication 2 (1960) and ICRP Publication 9(1966c) states in its paragraph 47 after initial considerationsthat:"...The risks to members of the public from man-made sources ofradiation should be less than or equal to other risks regularly acceptedIn everyday life, and should not be justifiable in terms of benefits thatwould not otherwise be received." Unfortunately, the ICRPrecommendations could not resolve the imprécisions regarding therecipients of risks and the benefits, mainly when the exposure toradiation were not medical purposes. Trying to improve the effectivenessof the statement, the ICRP added in paragraph 52 of Publication 9 thefollowing: "as any exposure may involve some degree of risk, theCommission recommends that any unnecessary exposure be avoid, and thatall doses be kept as low as readily achievable, economic and socialconsiderations being taken into account." This recommendation was
213

further elaborated at the end of paragraph 7 of the ICRP Publication 22(1973) as follows: "...The word possible has been successively replacedby practicable and readily achievable. The recommendation (i.e.,paragraph 52 of ICRP Publication 9) has also been expanded to identifytwo specific considerations that are to be taken into account indetermining levels of exposure that may be considered as low as readilyachievable. These considerations are economic and social. Otherconsiderations, such as ethical ones, are not excluded by this wordingand may indeed be considered to be included by the adjective social."
The techniques of cost-benefit analysis to conform dose reductionsrecommended in the paragraphs 47 and 52 of ICRP Publication 9 andparagraph 7 of ICRP Publication 22 were described and discussed inAppendices II and III of ICRP Publication 22. However, the ICRPPublication 26 published in 1977 supersede the ICRP Publication 22. Thesystem of dose limitation suggested in the ICRP Publication 26 has been(IAEA 1979a) and still is (IAEA 1981) under discussion by the IAEA andother international organizations.
The cost benefit methodology has been used for a long time inrestricted cases of economics based upon previous studies incost-effectiveness. However, the application of the cost benefit analysisto the field of radiation protection Implied some degree of extrapolationas well as a built in cost-effectiveness in the cost curve associated withthe collective dose equivalent. The differential cost-benefit analysishas been interpreted in radiation protection as a cost-effectivenessanalysis in such a way that the cost curves should be made up of optionswhich are themselves cost-effective (Beninson 1977, Webb 1979).
The ICRP Publication 26 (1977b) defines the net benefit B of a productor an operation involving irradiation as
B = V - (P + X + Y) (5)where V is the gross benefit; P Is the basic production cost (excludingprotection); X is the cost of achieving a selected level of production; YIs the cost of the detriment involved in the operation or in theproduction, use and disposal of the product; and the word cost includesboth social and purely economic costs.
The ICRP Publication 26 considers on the one hand the increase ofbenefit from a "reasonably achievable" radiation exposure and, on theother hand, the increase of cost in the achievement of this increase ofbenefit. The maximization of B In equation (5) In relation to theindependent variable collective dose equivalent S from a practice isconsidered to correspond to the attainment of the optimum net-benefit B,so that:
dVdS"
(dP dX dY)(dS~ + dS" + "dS") 0 (6)
Considering now V and P as constants in relation to S for a givenpractice, the optimum net benefit B is attained at a values such that
dXd? S*
dYdS S* (7)
The IAEA Safety series No. 45 (IAEA 1978) examines in great detail theapplication of the optimization techniques to determination of dischargelimits. In particular, this IAEA publication makes special considerations
214

inherent in the application of cost benefit techniques, and in itsparagraphs IV-26 to IV-29 states the following:
"IV-26. The finite nature of expenditures for current healthprotection or risk reduction provides a useful index for comparison,but these expenditures may not be strictly proportional to thecollective detriment to the population as they are determined bypolitical and social processes. Use has recently been made, however,of an assumed range of acceptable values for expenditures for riskreduction to establish radiation standards(*). Direct estimates havealso been made of the worth that professionals in the radiationprotection field would assign to a unit of collective dose(dollar/man-rem)(**). These estimates apply only uniform whole-bodyirradiation and equivalent estimates may be required for the cost ofthe detriment from collective dose commitments in other organs. Thesecosts would be expected to be correspondingly smaller for other organsbecause of the lower detriment per rem for partial body irradiation.
IV-27. Since the monetary value of radiation exposure reductionsmight vary among nations, national authorities might have to determinethese values for their own population protection, but hopefully, anacceptable internationally agreed-on approach can be developed forglobal commitments. Care should be exercised when using a monetaryvalue for the unit radiation detriment or unit collective dosecommitment that is not out of proportion to implicit or explicitvalues in use for other sources order to use cost-benefit technique totheir greatest potential.
IV-28. All humans activities involve some inequities in thedistribution of benefits and detriments to different populationgroups. For example, the general public incurs the detriment fromautomobile emissions, and pedestrians are subjected to higher riskswithout receiving direct benefits. Similar situations exist forradiation exposure. For example, individuals residing near a fuelfabrication facility may not receive any of the primary benefits fromthis practice, i.e. the electric power generated by the fuel.Secondary benefits such as those deriving from tax payments by thefacility might accrue to the local population, but the primarybenefits from the practice might be only received by a distant groupthat does not receive any of the detriment. The release of long-livedradionuclides to the environment, as, for example, from spent fuelreprocessing plants could result in detriments received by the world's
(*) The U.S. Environmental Protection Agency (USEPA) recently used arange of values for risk reduction of US$ 200 000 - US$ 500 000per projected serious health effect eliminated in establishingenvironmental radiation standards for normal releases from USfacilities comprising the nuclear fuel cycle (USEPA 1977).
(**) The values reported (1976) for both methods of determinationrange between US$ 10 and US$ 980 (Otway 1972). The US NuclearRegulatory Commission (USNRC 1975) has used a conservativeinterim value of US$ 1000/man rem reduction for the purpose ofcost-effectiveness analysis of light-^water reactor effluentreduction.
215
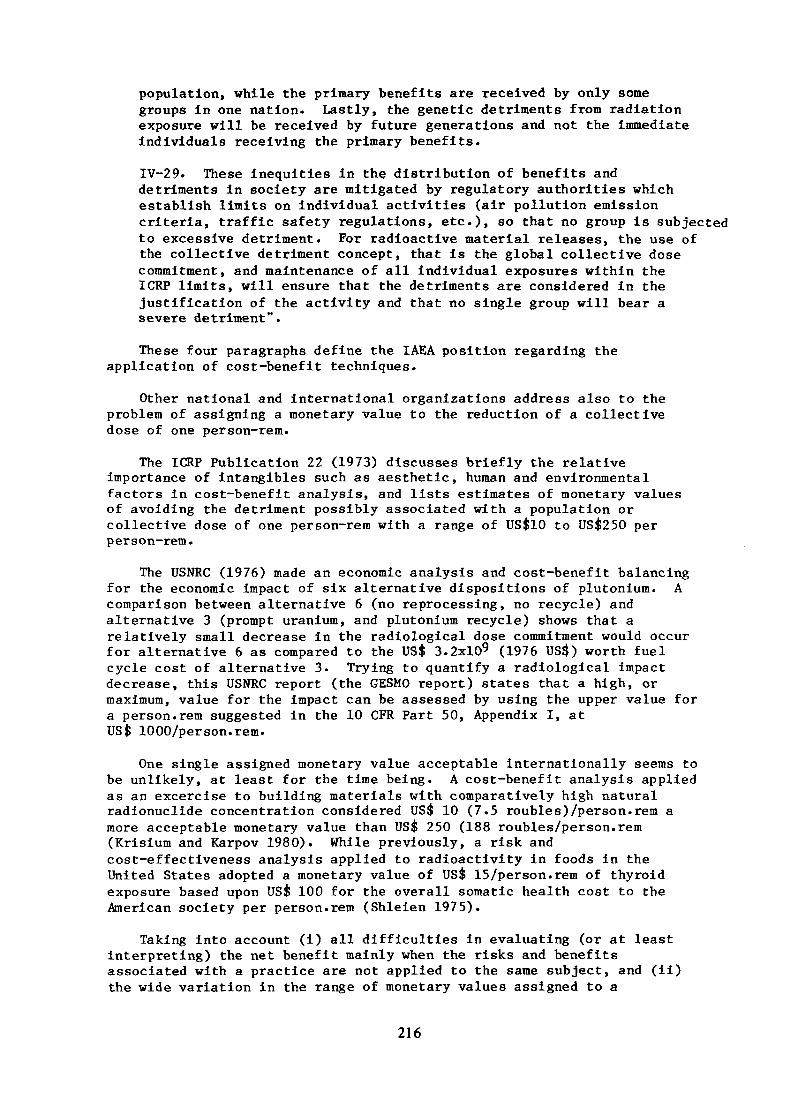
population, while the primary benefits are received by only somegroups in one nation. Lastly, the genetic detriments from radiationexposure will be received by future generations and not the immediateindividuals receiving the primary benefits.
IV-29. These inequities in the distribution of benefits anddetriments in society are mitigated by regulatory authorities whichestablish limits on individual activities (air pollution emissioncriteria, traffic safety regulations, etc.), so that no group is subjectedto excessive detriment. For radioactive material releases, the use ofthe collective detriment concept, that is the global collective dosecommitment, and maintenance of all individual exposures within theICRP limits, will ensure that the detriments are considered in thejustification of the activity and that no single group will bear asevere detriment".
These four paragraphs define the IAEA position regarding theapplication of cost-benefit techniques.
Other national and international organizations address also to theproblem of assigning a monetary value to the reduction of a collectivedose of one person-rem.
The ICRP Publication 22 (1973) discusses briefly the relativeimportance of intangibles such as aesthetic, human and environmentalfactors in cost-benefit analysis, and lists estimates of monetary valuesof avoiding the detriment possibly associated with a population orcollective dose of one person-rem with a range of US$10 to US$250 perperson—rem.
The USNRC (1976) made an economic analysis and cost-benefit balancingfor the economic impact of six alternative dispositions of plutonium. Acomparison between alternative 6 (no reprocessing, no recycle) andalternative 3 (prompt uranium, and plutonium recycle) shows that arelatively small decrease in the radiological dose commitment would occurfor alternative 6 as compared to the US$ 3.2xl09 (1976 US$) worth fuelcycle cost of alternative 3. Trying to quantify a radiological impactdecrease, this USNRC report (the GESMO report) states that a high, ormaximum, value for the impact can be assessed by using the upper value fora person.rem suggested in the 10 CFR Part 50, Appendix I, atUSfe 1000/person.rem.
One single assigned monetary value acceptable internationally seems tobe unlikely, at least for the time being. A cost-benefit analysis appliedas an excercise to building materials with comparatively high naturalradionuclide concentration considered US$ 10 (7.5 roubles)/person.rem amore acceptable monetary value than US$ 250 (188 roubles/person.rem(Krisium and Karpov 1980). While previously, a risk andcost-effectiveness analysis applied to radioactivity in foods in theUnited States adopted a monetary value of US$ 15/person.rem of thyroidexposure based upon US$ 100 for the overall somatic health cost to theAmerican society per person.rem (Shleien 1975).
Taking into account (i) all difficulties in evaluating (or at leastinterpreting) the net benefit mainly when the risks and benefitsassociated with a practice are not applied to the same subject, and (ii)the wide variation in the range of monetary values assigned to a
216

collective dose of one person.rem, national authorities should exerciseextreme care to avoid using the estimated net benefit and a cost reductioncriterion as non-written ethical guides for decision-making processesinvolving the nuclear industry and other sources of radiation exposure.
Direct applications of the concepts of net benefit and cost reductionassociated with radiation protection involving present uranium miningand/or milling operations were not available in the open literature at thetime this report was prepared. However, an effort is expected to improvethe use of such concepts for the radiological impact assessment of futureuranium mining and milling operations. Difficulties in calculatingcollective dose equivalent commitments inherent in the fact that uraniummines are sometimes located in sites of developing regions with fastchanging parameters like population distribution, irrigational practices,agricultural production and food consumption should not be underestimated(Paschoa et al. 1980). However the usefulness of concepts like riskassessment and cost-benefit analysis should not be ruled by nationalauthorities. In applying such concepts the national authorities should beaware that improvements are still needed for the actual applicaton of someof these concepts, as mentioned for example, in the paragraph IV-27 of theIAEA document or the principles for establishing limits for the release ofradioactive materials into the environment (IAEA 1978) quoted earlier inthis section.
7.3. NATIONAL STANDARDS
There are a number of national standards for limiting radiationexposure from "Ra in waters.
7.3.1. General Objectives
The general objectives of national standards as understood hereare to observe the limitations of radiation exposure, taking into accountthe basic and operational principles of radiation protection. Mostnational legislations on radiation protection reflect earlierrecommendations of the ICRP.
The basic principles underlying the recommendations of ICRP are statedin the paragraph 2 of Publication 9(1966c) as follows:
"The policy adopted by the Commission in preparing its recommendationsis to consider the fundamental principles upon which appropriateradiation(*) protection measures can be based, while leaving to thevarious national protection bodies the responsiblity of formulating thespecific advice, codes of practice of regulations that are best suited tothe needs of their individual countries. The Commission wishes toemphasize that its recommendations are intended to guide the expertsresponsible for putting radiation protection into practice. Because oftheir advisory character, the form in which the recommendations are wordedwill not necessarily be suitable for direct assimilation into regulationsor codes of practices."
(*) The word "radiation" refers exclusively to ionizing radiation.
217

The IAEA Safety Series No. 45 (1978) states the objectives ofradiation protection for environmental releases of radioactivity withbasis on the ICRP Publications 22 and 26 (1973, 1977b). In particular,the paragraph 1-3 of the IAEA publication (1978) reads as follows:
"1-3. The basic objectives of radiation protection are to prevent theoccurence of acute effects and to limit the probabilities of occurrence oflate somatic and genetic effects to levels deemed to be acceptable. Thefirst of these objectives is easily met since acute effects occur onlysubsequent to large doses as high dose rates. The second objectiverelates to much more complicated problems, mainly due to the absence ofhuman data at the levels of exposure which are currently permitted. Ithas been the normal practice in radiation protection to assume that anon-threshold direct proportionality relationship exists between the doseand the probability of such late effects as the induction of malignanciesand deleterious hereditary effects. Furthermore, it is assumed that therisk per unit dose deduced from observations as high doses and dose ratesapply to the low dose range and low dose rates relevant for radiationprotection. Thus, for small dose increments above natural background, itmay be assumed as a first approximation that the increment of risk isproportional to the increment of dose(*). This assumption may, however,not necessarily form the most appropriate basis for estimates of theactual risk associated with the low dose".
The 1977 UNSCEAR report (1977) mentioned, as a remark made by Kristan,Kobal and Legat (1974), that 226Ra should be considered the mostsignificant nuclide in water releases from uranium mining and millingoperations. However, an up to date UNSCEAR working paper (1981), stillunpublished at the time this present report was being prepared, considersthat today's practice is to contain all uranium mining and milling liquideffluents and either partially recycle or evaporate the water.Furthermore, this UNSCEAR (1981) working paper asserts that there isessentially no liquid discharges or radiological significance from uraniummining and milling, and refers, in support of this assertion, toenvironmental surveys made in the United States in regions of hot and dryclimate (Snelling and Shearer 1969, Snelling 1970, 1971). Here one shouldnot deemphasize that there is still the possibility of human exposureto 226Ra through ingestion of drinking water or food irrigated withwaters contaminated by liquid effluents of uranium mining and milling.
Studies on the biological cycle of 226Ra (Kirchmann et al. 1975) andthis present IAEA coordinated research program have brought up enoughexperimental evidences to show that a comprehensive dose assessment of allstages of the nuclear fuel cycle should include, a fortiori, the potentialcontribution to human exposure from the 22 Ra content of the releasesfrom uranium mining and milling.
(*) Under this assumption, each probability p .» of suffering an effecti, in a population group j, will be directly proportional to theaverage dose in the range of interest
Pij = rij Hjwhere r-M is a risk factor, the value of which is not known withcertainty, and ¥j is the per caput dose received by individuals inthe group j.
218

The main criteria used in general to establish national standards forliquid releases of radionuclides into the environment are the following:maximum permissible concentration in water (MPC)W; annual limit ofintake (ALI); maximum permissible dose (MPD); and maximum permissibledischarge of radionuclides based upon factors determining theenvironmental capacity for receiving liquid releases from nuclearfacilities.
7.3.2. Comparison of National Standards
An overall comparison of national legislations of nineteencountries on protection against ionizing radiation has been made by theWorld Health Organization (WHO 1972). The IAEA and WHO organized ameeting with the support of UNEP in 1974 on the population dose evaluationand standards for man and his environment, where many views and criteriaon population exposure were presented (IAEA 1974). More recently an IAEAtopical seminar on the practical implications of the ICRP Publication 26recommendations and the revised IAEA basic standards was held in Vienna(IAEA 1979a). Some papers related to the application of therecommendations of the ICRP Publication 26 were presented in the fifthcongress of the International Radiation Protection Association (IRPA 1980).
Table 7.4. summarizes the criteria adopted in a number of countries toestablish national standards for liquid radioactive releases into theenvironment, and lists the limit values for 226Ra whenever available inthe literature consulted. Table 7.4. shows clearly that the criteria varyfrom country to country, depending mostly on the interpretation given bynational authorities to the earlier ICRP recommendations.
On the one hand one can confidently say the recommendations of theICRP Publications 2 and 9 (1960, 1966c) are tentatively followed in mostcountries, irrespective of differences in interpretation, on the otherhand, the relatively new concepts introduced by the ICRP Publications 22and 26 (1973, 1977b), and adopted as a policy by the IAEA (1978), have notyet permeate the national legislations as far as the 226] dose limitsare concerned. Whether or not the national standards will be alteredaccording to the principles for establishing limits for the release ofradioactive materials into the environment, as recommended by the IAEA(1978), is a matter to be considered by the competent nationalauthorities. However, one must bear in mind, as mentioned earlier, thatthe concepts on which the present national standards are based, carryintrinsically an assumed risk deemed to be acceptable to the individualand to society in view of the benefits derived from activities such asuranium mining and milling.
7.4. SUMMARY AND CONCLUSIONS
The basic concepts associated with dose assessment for radiationprotection were reviewed, taking into account the evolution of suchconcepts in the last 25 years. The difficulties in applying therelatively new concepts of collective dose equivalent commitment andcommited dose equivalent to the case of uranium mining and milling werebriefly examined.
219

Computational doslmetric models to biota were mentioned but notexamined in any detail. Sanges of environmental dose rates to aquaticbiota were given, however, there is a lack of a standardized methodologyfor calculating dose to biota.
The system of risk assessment as devised by the ICRP Publication 26was discussed in view of the earlier ICRP Publication 2 recommended doselimits. The unescapable conclusion points out that the concept ofacceptable risk is implicitly used when the dose limitation system for""Ra is based on calculating the dose as a fraction of either of the(MPC)W introduced by the ICRP Publication 2 or the ALI recommended bythe ICRP Publication 30, the latter to be used only in the framework ofthe recommendations described in the ICRP Publication 26.
The technique of cost-benefit analysis was briefly presented anddiscussed as far as the assignment of a monetary value to the reduction ofa collective dose of one person-rem is concerned. The main conclusions ofthe discussion just mentioned are the following:
(i) national authorities should exercise extreme care to avoidusing the extimated net benefit and a cost reduction criterionas non-written ethical guides for decision-making processesinvolving the nuclear industry and other sources of radiationexposure ;
(ii) the usefulness of concepts like risk assessment, collectivedose equivalent, and cost-benefit analysis should not be ruledout by the national authorities; and
(iii) improvements are still needed for the actual application ofsome of the concepts introduced in radiation protection by theICRP Publication 26.
Limitation of radiation exposure, taking into account the basic andoperational principles of radiation protection is in the framework ofnational standards which reflect, in general, the recommendations of theICRP. A review of the criteria adopted for each of a number of countriesfor establishing national standards was presented. Although the earlyICRP recommendations (1960, 1966c) are usually incorporated in thenational legislations, the most recent concepts introduced by the ICRP(1973, 1977b) and adopted as a policy by the IAEA (1978) are not used yetin the national standards for the 226ßa dose limitation system.
A symposium to examine specifically the state of art of the doselimitation system for the case of uranium mining and milling should bejointly convoked by the IAEA, WHO, ICRP and UNEP in view of the fact thatthe national standards for Ra dose limitation do not follow ingeneral the IAEA adopted policy.
220
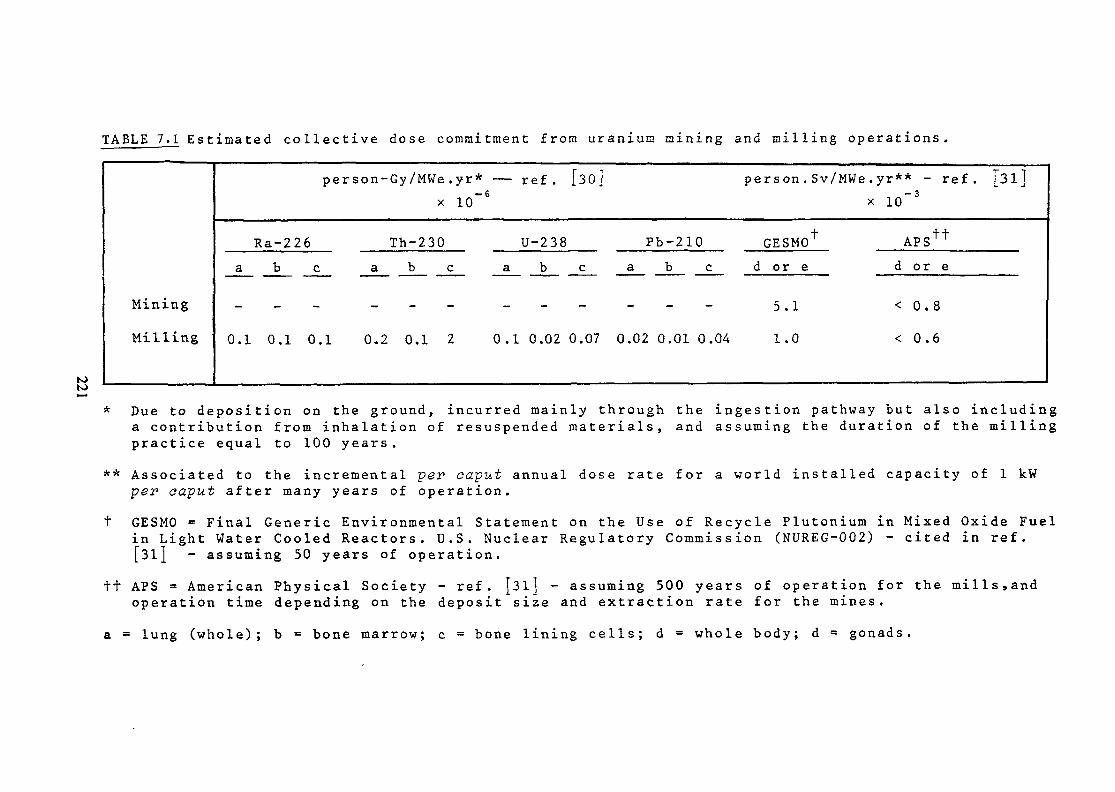
TABLE 7 .1 E s t i m a t e d c o l l e c t i v e dose c o m m i t m e n t f r o m uranium m i n i n g and m i l l i n g o p e r a t i o n s .
Mining
Milling
p e r s o n - G y / M W e .yr* — r é f . [so]x 10~6
Ra-226 Th-230 U-238 Pb-210
a b c a b c a b c a b c
_ _ _ _ _ _ _ _ _ _ _ _
0.1 0.1 0.1 0,2 0.1 2 0.1 0.02 0.07 0.02 0.01 0.04
person .
GESMO
d o r e
5.1
1.0
S v / M W e . y r * * - r é f .x 10~3
* APS f t
d o r e
< 0.8
< 0.6
[31]
K)K)
* Due to deposition on the ground, incurred mainly through the ingestion pathway but also includinga contribution from inhalation of resuspended materials, and assuming the duration of the millingpractice equal to 100 years.
** Associated to the incremental per caput annual dose rate for a world installed capacity of l kWper oaput after many years of operation.
t GESMO = Final Generic Environmental Statement on the Use of Recycle Plutonium in Mixed Oxide Fuelin Light Water Cooled Reactors. U.S. Nuclear Regulatory Commission (NUREG-002) - cited in réf.[Si] - assuming 50 years of operation.
tt APS = American Physical Society - réf. [3l] - assuming 500 years of operation for the mills,andoperation time depending on the deposit size and extraction rate for the mines.
a = lung (whole); b = bone marrow; c = bone lining cells; d = whole body; d = gonads.

TABLE 7.2 Weighting factors u recommended by the ICRP for stochasticrisks. From réf. LÏ9J.*
Organ and tissue
Conads
BreastRed bone marrow
LungThyroid
Bone surfaces**Remainder***
0.25
0. 15
0.12
0.12
0.030.030.30
*See also Table 7-3
**Relates to endosteal cells and to the epithelium on bonesur fa ces.
***a value of OJ of 0.06 is applicable to each of the fiveorgans or tissues of this remainder receiving the greatestdose equivalents and the exposure to all other tissues inthis group is neglected. Skin and lens are not considered aspart of the remainder tissue for limiting stochastic effectsWhen the gastrointestinal tract is irradiated, the stomach,small intestine, upper large intestine and lower largeintestine arc considered as four separate organs.
222

TABLE 7.3 Quantitative risk factors recommended by the BEIR [58] ,————•——————^~~ .LICRP 0.7]* and UNSCEAR JJ30] , taking into account age-andsex-dependency whenever it is significant.
Organ or tissue
Gonads
Breast**Red bone marrow
Lung
Thyroid
BonePulmonary lymphoidG.I. track
All other tissues
Risk per unit dose (Sv )
BEIR
—
9.0xlo"3
2.5xlO~3
3.9xlO~3
-6.0X10"3
—
3.0xlO~33
3.0X10
ICRP
io"22.5X10"3
2.0xlO"3
2.0xlO~3
5 .OxlO~5.0x10""
32 xlO-
_3j " i. U
UNSCEAR
—
6.0xlO"3
(1.5-2.5)xlO~3
(2.5-5.0)xlO~3
(0.5-1.5)xlO~3
(2.0-5.0)xlO~3
—2.5xlO~3
32.5X10"
"^Taken from ref . |59 1
*The ICRP recommendations for dose limitations is based on theprinciple that the risk should be equal whether the whole bodyis irradiated uniformly or whether there is non-uniformirradiation. The condition £ w H £ H where u) is givenl l T wb . L Tin Table II and represents the proportion of the stochasticrisk resulting from tissue (T) to the total risk, when thewhole body is irradiated uniformly; H is the annual dose—-equivalent limit in tissue (T); H , T is the recommendedi. wb, Lannual dose-equivalent limit for uniform irradiation of thewhole body, namely 50 mSv (5 rem).
**Significant age-and sex-dependency.
223

Table 7.4 Criteria adopted to establish national standards for liquid radioactive releases, and the limit values forRa-226 whenever available.
226
Country CriteriaRa
limit Succint description and/or remarks Ref.Australia
Belgium
Brazil
(MPC)
(MPC)
ALI
ALI
w
K)K>
10(0.37 Bq.£
n. a.*
1 yCi .yr(37K Bq yr"1)9.6xlO~3pCi.yr~1
(356 Bq)
Bulgaria (MPC) n. a.w
Canada (MPC) n. a.
Czechoslovakia (MPC) n. a.
ingested by a member of the public in the neighborhood of a mine or CDH**mill exposed continuously for 168 hours per week. (1975)(i) for occupational exposure (168 - h. week) for discharges into the WHOsoil; (ii) (1/10) x (MPC)W for discharges into most surface waters, and (1972)into sewers and underground conduits.
estimated maximum dietary intake for a critical group of humans (i.e. Kirchmann135 times the ICRP 1959 limit [l]). (1975)per organ, based upon established MPD's for individual members of CNEN***public - this limit is considered to be approximately equivalent to (1973)10 pCi.X," ,depending upon drinking and dietary habits, and metabolicmodel •prohibit the discharge of liquid radioactive wastes into pits or wells WHOor on to fields for irrigation purposes, as well as the discharge of (1972)waters contaminated with radioactive substances into body of waterintended for pisciculture or the breeding of birds, or into watercourseflowing into such bodies of water.the permissible release rate of radionuclides is... in accordance with WHOthe results of environmental studies leading to knowledge of the (1972)dilution capacity of the environment, thus ensuring that the provisionsrelating to MPD to critical groups are fulfilled.based upon the water use downstream from the release and a total annual Sebestarelease limit. et al.
Denmark MPD n.a. efforts must be made at all times to ensure that radiation exposure is WHOkept well below the maximum permissible doses and that the number of (1972)persons exposed is as small as possible.

Table 7.4 (cont. 2)
CountryFederal Republicof Germany
Finland
France
India
Italy
Japan
Netherlands
226RaCriteria limit Succint description and/or remarks(MPC)w n.a. water originating from controlled areas must not, if there
is any possibility of its escaping, contain a concentrationof radioactive substances higher than 1/10 of the (MPC) .
(MPC) n.a. facilities from which radioactive substance may be dischargedw into watercourses or groundvater may not be installed unless
measured.(MPC) 10 pCi.Ä drinking water must not have a radioactivity level greater
(0.37 Bq jj, ) than that laid down by the regulations in force and testsfor radioactive elements must be carried out by laboratoriesapproved by the Minister of Social Affairs after consulationwith the Central Service for Protection against IonizingRadiations;the (MPC)W for soluble radium concerns only to the drinkingwater, not to the liquid releases.
(MPC) n.a. from considerations of radiotoxicity the average intake of226Ra near the uranium ore processing facility of Juduguda,Bihar is much below permissible intake.
(MPC) n.a. the MPD's to the various organs and tissues and the (MPC)Wfor radionuclides in drinking water for three kind populationcategories are prescribed according to the pertinentinternational standards.
(MPC)W 10 pCi.Ä the concentrations of 2'">Ra in the drinking water and river(0.37 Bqfc ) in the vicinity of the uranium mining and milling sites aret monitored periodically.
(MPC) 10 pCi.î. - in the case of discharge into water the concentration at thew (0.37 Bqjf ) point of discharge is less than 10 pCi.£~ for substances
emitting alpha radiation.
Ref.
WHO(1972)
WHO(1972)
WHO(1972)
CanetZettwooglyengarMarkose(I970a)WHO(1972)
Iwata(undated)
WHO(1972)

Table 7.4 (cont. 3)
NJ«s>OS
226RaCountry Criteria limit Succint description and/or remarks
Spain (MPC) n, a. the (MPC)W of radioactive isotopes in drinking water are 1/10 ofthose prescribed for controlled areas.
South Africa MPD n.a. in the case of waste disposal of radioactive material meticulosecare shall be taken by the holder of the authority in the disposalof radioactive waste, and such disposal shall be made only in amanner approved by the Atomic Energy Board from time to time,either generally or in any particular case.
Sweden (MPC) n.a. maximum permissible discharges of radioactive substances intpw waters are formally subject to decision by the Crown (which
delegates this function to the National Institute of RadiationProtection acting in consultation with the EnvironmentalProtection Agency) in connexion with the authorization procedureunder the Atomic Energy Law.
Switzerland (MPC) n.a. the concentration of radioactive substances contained in the wastewaters of an undertaking must not exceed the prescribed values.
USSR (MAPC) n.a. (MAPC)W = mean annual permissible concentration in water;MPI = maximum permissible annual intake - the annual intake ofradioactive isotopes by the body, rather than their mean dailyconcentration in water shall be determinant in evaluating theexposure dose to individual members of the public.
U.K. (MPC) n.a. standards do not have any legal force as such in the UnitedW Kingdom, however, they may be taken into consideration by
government inspectors in their overall assessment of anestablishment.
United States (MPC) 3 pCi.jf1 U.S. Public Health Service 1962 limit for the 226Ra concentrationof America w (0.11 Bqjj, ~1) in driking water, without mentioning 228Ra.
5 pCi.Ä l U.S. Environmental Protection Agency current limit for combined(0.19 Bqfc"1) concentration of 226Ra and 228Ra in community water systems.
Ref.WHO(1972)
WHO(1972)
WHO(1972)
WHO(1972)WHO(1972)
WHO(1972)
USPHS(1962)USEPA(1975)

Table 7.4 (cont, 4)
Country
United Statesof America
Yugoslavia
226RaCriteria limit
(MPC) 15 pCi.A"1w (0.56 Bq JT1)
ALI 9.6J<10~3viCi.yr~1(356 Bqyr-1)
Succint description and/or remarks
U.S. Environmental Protection Agency current limit for grossalpha particle activity (including 226Ra but excluding radonand uranium) .maximum permissible annual intake by ingestion for member ofthe public — this limit is estimated to be equivalent to a(MPC)W of 4 pCi226Ra.JT in rivers with fish.
Ref.
USEPA(1975)
Kristanet al.(1974)
toto
*n.a. » not available in the literature consulted.^Commonwealth Department of Health***Comissao Nacional de Energia Nuclear

DIRECT RADIATION
FI3HIN6* AND SPORTS
GEAR
DIRECT RADIATION,
IN6ESTION
Fig.7.1 Simplified pathways between radioactive materialsreleased to ground or surface waters and human beings.From ICRP 29 (I979a) p. 3.
228

REFERENCES
AMERICAN PHYSICAL SOCIETY,LWR-assessment of radiation exposure, Report to the APS by the StudyGroup on Nuclear Fuel Cycle and Waste Management,Reviews of Modern Physics 50. 1 PI1 (1978) 571.BENINSON D.,Implementation of radiation protection requirements in the limitationof the release of radioactive effluents,Application of Environmental Impact Analysis to the Nuclear PowerIndustry (Proc. Reg. Semin. Buenos Aires, 1977) IAEA-212, Vienna(1978) 37.
BLAYLOCK B.C., WITHERSPOON J.P.,Dose estimation and predition of radiation effects on aquatic biotaresulting from radioactive releases from the nuclear fuel cycle,Impacts of Nuclear Releases into the Aquatic Environment (Proc. Symp.Otaniemi, 1975) IAEA, Vienna (1975) 377.BROWNSCOMBE A.J., DAVY D.R., GILES M.S., WILLIAMS A.R.,Three baseline studies in the environment of the uranium deposit atYeerlirrie, Western Australia,Australian Atomic Energy Commission, AAEC/E442, ISBN 0 642 59650 6(1978).CANET A., ZETTWOOG P.,private communication.COHEN B.L.,The cancer risk from low-level radiation,Health Phys. 3£ (1980) 659.COMISSAO NACIONAL DE ENERGIA NUCLEAR,Normas Basicas de Proteçao Radiologica,Resoluçao CNEN - 6/73 (1973) 100 pp.COMMONWEALTH DEPARTMENT OF HEALTH,Code of Practice on Radiation Protection in the Mining and Milling ofRadioactive Ores,Canberra, A.C.T. (1975).DE JESUS A.S.M., MALAN J.J., BASSON J.K. ,private communication.HAVLIK B.,Radioactive pollution of rivers of Czechoslovakia,Health Phys. 19. (1970) 617.
HAVLIK B., GRAFOVA J., NYCOVA A.,Radium-226 liberation from uranium ore processing mill waste solidsand uranium rocks into surface streams - I.Health Phys. 14 (1968a) 417; II., Health Phys. 14 (1968b) 423.
229

INTERNATIONAL ATOMIC ENERGY AGENCY,Population Dose Evaluation and Standards for Man and His Environment(proc. Sem. Portoroz, 1974), IAEA, Vienna (1974) 648 pp.INTERNATIONAL ATOMIC ENERGY AGENCY,Effects of Ionizing Radiation on Aquatic Organisms and Ecosystems,Technical Reports Series No. 172, IAEA, Vienna (1974) 648 pp.INTERNATIONAL ATOMIC ENERGY AGENCY,Principles for Establishing Limits for the Release of RadioactiveMaterials into the Environment,Safety Series No. 45, IAEA, Vienna (1978) 91 pp.INTERNATIONAL ATOMIC ENERGY AGENCY,Practical Implications of the ICRP Recommendations (1977) and RevisedIAEA Basic Standards for Radiation Protection.(Proc. Top. Semin. Vienna, 1979) IAEA/ILO/WHO/OECD/ICRP, Vienna(1979a).INTERNATIONAL ATOMIC ENERGY AGENCY,Methodology for Assessing Impacts of Radioactivity on AquaticEcosystems,Technical Reports Series No. 190, IAEA, Vienna (1979b) 416 pp.INTERNATIONAL ATOMIC ENERGY AGENCY,Application of the Dose Limitation System in Nuclear Fuel CycleFacilities and Other Radiation Practices,(Int. Symp. Madrid, 1981). IAEA/WHO/OECD/ICRP (In press).
INTERNATIONAL COMMISSION ON RADIATION UNITS AND MEASUREMENTS,Conceptual Basis for the Determination of Dose Equivalent(ICRU Report 25), Washington, D.C. (1976) 21 pp.
INTERNATIONAL COMMISSION ON RADIATION UNITS AND MEASUREMENTS,Radiation Quantities and Units(ICRU Report 33). Washington D.C. (1980) 25pp.INTERNATIONAL COMMISSION ON RADIOLOGICAL PROTECTION,Recommendations of the International Commission on RadiologicalProtection(ICRP Publication 1) Pergamon Press (1959).INTERNATIONAL COMMISSION ON RADIOLOGICAL PROTECTION,Report of ICRP Committee II on Permissible Dose for Internal Radiation(1959), with Bibliography for Biological, Mathematical and PhysicalData(ICRP Publication 2), Health Physics 3_ (1960) 380 pp.
INTERNATIONAL COMMISSION ON RADIOLOGICAL PROTECTION,Principles of Environmental Monitoring Related to the Handling ofRadioactive Materials.(ICRP Publication 7), Pergamon Press, Oxford (1966a) 11 pp.INTERNATIONAL COMMISSION ON RADIOLOGICAL PROTECTION,The evaluation of Risks from Radiation,(ICRP, Publication 8) Pergamon Press, Oxford (1966b) 60 pp.
230

INTERNATIONAL COMMISSION ON RADIOLOGICAL PROTECTION,Recommendations of the International Commission on RadiologicalProtection,(ICRP Publication 9) Pergamon Press, Oxford (1966e) 27pp.INTERNATIONAL COMMISSION ON RADIOLOGICAL PROTECTION,Implications of Commission Recommendations that Doses be kept as Lowas Readily Achievable,(ICRP Publication 22) Pergamon Press, Oxford (1973) 18 pp.
INTERNATIONAL COMMISSION ON RADIOLOGICAL PROTECTION,Radiation Protection in Uranium and Other Mines(ICRP Publication 24), Annals of the ICRP, Pergamon Press, Oxford ^ 1(1977a) 28 pp.
INTERNATIONAL COMMISSION ON RADIOLOGICAL PROTECTION,Recommendations of the International Commission on RadiologicalProtection,(ICRP Publication 26), Annals of the ICRP, Pergamon Press, Oxford j^ 3(1977b) 53 pp.
INTERNATIONAL COMMISSION ON RADIOLOGICAL PROTECTION,Radionuclide Release into the Environment: Assessment of Doses to Man.(ICRP Publication 29), Annals of the ICRP, Pergamon Press, Oxford, 2_ 2(1979a) 76 pp.INTERNATIONAL COMMISSION ON RADIOLOGICAL PROTECTION,Limits for Intakes of Radionuclides by Workers.(ICRP Publication 30, Part I), Annals of the ICRP, Pergamon Press,Oxford, 2_ 3/4 (1979b) 116 pp.INTERNATIONAL COMMISSION ON RADIOLOGICAL PROTECTION,Statement and Recommendations of the 1980 Brighton Meeting of the ICRP- Limits for Intakes of Radionuclides by Workers.(ICRP Publication 30, Part 2) Annals of the ICRP, Pergamon Press,Oxford, 4_ 3/4 (1980) 71 pp.INTERNATIONAL RADIATION PROTECTION ASSOCIATION,(Proc. Conf. Jerusalem 1980) Vol. Ill (1980).IWATA I., KITAHARA Y., TAKENAKA S., KUROKAWA Y.,Mill tailings disposal and environmental monitoring at the Ningyo-Togeuranium processing pilot plant,Power and Nuclear Fuel Development Corporation, Tokyo (undated).
IYENGAR M.A.R., MARKOSE P.M.,An investigation into the distribution of uranium and daughters in theenvironment of a uranium ore processing facility,Radiation and Radioisotopes in Soil Studies and Plant Nutrition (Proc.Symp. Bangalore, 1970). Department of Atomic Energy (1970 a) 143.
IYENGAR M.A.R., MARKOSE P.M.,Monitoring of the aquatic environment in the neighborhood of uraniummill at Jaduguda, Bihar,Radiation Physics (Proc. Symp. Trombay, 1970b) 473.
231

KAUFMANN R.F., EADIE G.G., RÜSSEL C.R.,Ground water quality impacts of uranium mining and milling in theGrants Mineral Belt, New Mexico.U.S. Environmental Protection Agency, E.P.A. 906/9-75-002 (1975).KIRCHMANN R., LAFONTAINE A., CANTILLON G., BOULENGER R.,Tranfert dans la chaîne alimentaire de l'homme, du radium-226provenant d'effluents industriels diverses dans les cours d'eau,(Proc. Symp. Rome, 1971).KIRCHMANN R., LAFONTAINE A., CARTILLON G., BOULENGER R.,Etude du cycle biologique parcouru par la radioactivité.Centre d'Etudes Nucléaires, Mol, BLG 477, Vol. II (1975) 124 pp.KRISIUK E.M., KARPOV V.l.,Cost-benefit analysis applied to building materials with comparativelyhigh natural radionuclide concentration,Health Phys. 39 (1980) 578.
KRISTAN J., KOBAL I., LEGAT F.,Measurements of radon under various working conditions in theexplorative mining of uraniumPopulation Dose Evaluation and Standards for Man and His Environment(Proc. Semin. Portoroz, 1974) IAEA, Vienna (1974) 217.
KUROKAWA Y., KUROSAWA R.,private communication.LECLARE P., HAIRR L., SCHMIRL L., PHILBIN T., STOECKER R., EISENBUD M.,Standard methodology for calculating radiation dose to lower formbiota,Atomic Industrial Forum Inc., AIF/NESP-006 (1975) 109 pp.
MARPLE M.L., ZETTWOOG P.,private communication.MORGAN K.Z.,History of damage and protection from ionizing radiation,Principles of Radiation Protection (MORGAN, K.Z., TURNER, J.E., Eds.)Robert E. Krieger Publishing Company, Huntington, New York (1973a) 1.
MORGAN K.Z.,The need for radiation protection,Radiological Technology 44_ (1973b) 385.
NATIONAL ACADEMY OF SCIENCES (USA),The Effects of Populations of Exposure to Low Level of IonizingRadiation,Report of the BEIR Advisory Committee, Washington, D.C. (1972) 217 pp.OTWAY H.,The quantification of social values, Risk-Benefit: Solution or Dream,Los Alamos National Laboratory Rep. LA-4860-MS (Feb. 1972) 1.PASCHOA A.S., BAPTISTA G.B.,Method for calculation of upper limit internal alpha dose rates toaquatic organisms with application to plutonium-239 in plankton,Health Phys. 3£ (1978) 404.
232

PASCHOA A.S., BAPTISTA G.B., MONTENEGRO E.G., MIRANDA A.C.,SIGAUD G.M.,Ra-226 concentrations in the hydrographie basins near uranium miningand milling in Brazil,Low-Level Radioactive Waste Management (Proc. Symp. Williamsburg,1979) EPA 520/3-79-002 (1979a) 337.
PASCHOA A.S., BAPTISTA G.B., WRENN M.E . , EISENBUD M.,Dosimetry of natural and man-made alpha emitters in plankton,Impacts of Radionuclide Releases into the Marine Environment (Proc.Symp. Vienna, 1980) IAEA, Vienna (1981a) 695.
PASCHOA A.S., SIGAUD G.M., MONTENEGRO E.G. , BAPTISTA G.B.,Ra-226 collective dosimetry for surface waters in the uranium miningregion of Poços de Caldas(Proc. 5th IRPA congress, Jerusalem, 1980) International RadiationProtection Association Vol. Ill (1980) 335.
PASCHOA A.S., SIGAUD G.M., BAPTISTA G.B., LATHAM E.C.H.Y.,The concept of collective dose equivalent and the front end of thenuclear fuel cycle,The Application of the Dose Limitation System in Nuclear Fuel CycleFacilities and Other Radiation Practices (Proc. Symp. Madrid 1981)IAEA, WHO, OECD/NEA, ICRP, Vienna (1981b) In press.
PASCHOA A.S., WRENN M.E., EISENBUD M.,Natural radiation dose to Gammarus from Hudson River,Radioprotection 14_ (1979b) 99.
PRADEL J., ZETTWOOG P. ,La radioprotection dans l'extraction et le traitement de l'uranium etdu thorium.(Proc. Symp. Bordeaux, 1974) Labour Office éd., Genève (1974) 249.
PRESTON A.,The radiological consequences of releases from nuclear facilities tothe aquatic environment,Impacts of Nuclear Releases into the Aquatic Environment (Proc. Symp.Otaniemi, 1975) IAEA, Vienna (1975) 3.SEBESTA F., BENES P., SEDLACEK J., JOHN J., SANDRIK R.,private communication.
SHLEIEN B.,A risk and cost effectiveness analysis of United States guidelinesrelative to radioactivity in foods,Health Phys. 2j> (1975) 307.
SIEK R.D.,Review of environmental aspects of uranium mill operations.Methods for Measuring Radiation in and Around Uranium (Workshop NewYork 1977).
SNELLING R.N. ,Environmental survey of uranium mill tailings pile, Monument Valley,Arizona,Radiol. Health Data _11 (1970) 511.
233

SNELLING R.N.,Environmental survey of uranium mill tailings pile, Mexican Hat, Utah,Radiol. Health Data 12_ (1971) 17.SNELLING K.M., SHEARER S.D.,Environmental survey of uranium mill tailing pile, Tuba City, Arizona,Radiol. Health Data 1£ (1969) 457.
TEMPLETON W.L.,Ecological effects of transuranics in the marine environment,Radiation Effects on Aquatic Organisms (EGAMI, N., Ed.) JapanScientific Society Press, Tokyo, University Park Press, Baltimore (1979) 3.
TILL L.E.,The effect of chronic exposure to 238pu (iv) citrate on theembroyonic development of carp and fathead minnow eggs,Health Phys. 34_ (1978) 333.TSIVOGLOU E.G.,Environmental monitoring in the vicinity of uranium mills,Radiological Health and Safety in Mining and Milling of NuclearMaterials, (Proc. Symp., Vienna, 1963) IAEA, Vienna (1963).
UNITED NATIONS SCIENTIFIC COMMITTEE ON THE EFFECTS OF ATOMIC RADIATION,General Assembly Records: 19th Session,Supplement No. 14 (A/5814), U.N. New York, (1964).
UNITED NATIONS SCIENTIFIC COMMITTEE ON THE EFFECTS OF ATOMIC RADIATION,General Assembly Records: 21st Session,Supplement No. 14 (A/6314), U.N. New York, (1966) 153 pp.
UNITED NATIONS SCIENTIFIC COMMITTEE ON THE EFFECTS OF ATOMIC RADIATION,Source and Effects of Ionizing Radiation.(1977 Report to the General Assembly) United Nations (1977) 725 pp.UNITED NATIONS SCIENTIFIC COMMITTEE ON THE EFFECTS OF ATOMIC RADIATION,Exposures resulting from nuclear power production,Annex F, 30th session of UNSCEAR - Vienna 6-10 July 1981, A/AC.82/R.386 (Unpublished).UNITED STATES ENVIRONMENTAL PROTECTION AGENCY,Interim primary drinking water regulations,Title 40 of the United States Code of Federal Regulations, FederalRegister 158, Washington, D.C., (1975) 34323.UNITED STATES ENVIRONMENTAL PROTECTION AGENCY,Environmental Radiation Protection Standards for Nuclear PowerOperations,Title 40 part 190, Code of Federal Regulations, Federal Register Vol.42, No. 9 (13 Jan. 1977) 2858; and Final Environmental Statement on 40CFR 190, Rep. No. EPA 520/4-76-016 (1976).
UNITED STATES NUCLEAR REGULATORY COMMISSION,Opinion on Numerical Guidelines for Achieving as Low as is ReasonablyAchievable Levels of Radioactive Materials in Light Water ReactorEffluents,Federal Register Vol. 40, No. 137 (5 May 1975).
234

UNITED STATES NUCLEAR REGULATORY COMMISSION,Final Generic Environmental Statement on the Use of Recycle Plutoniumin Mixed Oxide Fuel in Light Water Cooled Reactor (GESMO),Summary, Vol. 1, NUREG-0002 (1976) 69 pp.UNITED STATES PUBLIC HEALTH SERVICE,Drinking Water Standards.(USPHS Publication 956) Washington D.C. (1962).WEBB G.A.M.,Practical implementation of differential cost-benefit analysis inwaste management studies,Waste Disposal and Other Radiation Problems in Nuclear Industry (Proc.Summer School, Dubrovnik, 1979) (VUKOVIC, Z., Ed.) Boris KidricInstitute of Nuclear Sciences, Belgrade (1979) 240.
WOODHEAD D.S.,Levels of radioactivity in the marine environment and the dosecommitment to marine organisms,Radioactive Contamination of the Marine Environment (Proc. Symp.Seattle, 1972) IAEA, Vienna (1973) 499.
WOODHEAD D.S.,The estimation of radiation dose rates to fish in contaminated aquaticenvironments, and the assessment of the possible consequences,Population Dose Evaluation and Standards for Man and His Environment(Proc. Semin. Portoroz, 1974) IAEA, Vienna (1974) 555.WORLD HEALTH ORGANIZATION,Protection Against Ionizing Radiations: A Survey of Current WorldLegislation,Geneva (1972) 328 pp.WRENN M.E.,Internal dose estimates,Areas of High Natural Radioactivity (Proc. Symp. Poços de Caldas,1975, CULLEN, T.L., PENNA FRANCA, E., Eds.) Academia Brasileira deCiencias (1977) 131.
235

Chapter 8
POLLUTION ABATEMENT
J.S. SILHANEKCriteria and Standards Division,
Office of Radiation Programs, USEPA,Washington, D.C., United States of America
Y. KUROKAWAHealth and Safety Office,
Power Reactor and Nuclear FuelDevelopment Corporation,
Tokyo, Japan

8.1. INTRODUCTION
The reports concerning radium removal techniques of aqueoussolutions are presented by the delegations of several countries. Thesereports can be divided into two groups. One group concerns removalproblems to reduce radium concentrations in underground drinking watersupplies found in the United States. Another group is related toenvironmental hazard controls with the uranium mine operations in France,Japan and United States, etc.
8.2. RADIUM IN THE AQUEOUS ENVIRONMENT AND ITS REMOVAL
8.2.1. Levels of Radium-226 Groundwater Sources in U.S.A
Levels of Radium-236 are quite high in some groundwater sourcesthroughout the United States. Most of this contamination is due tonatural radioactivity as a result of aqueous leaching from uranium ores.Since control at the source is very difficult or impossible, attemptswere made to remove the radioactivity from underground drinking watersupplies. This was usually done when it was not practical to switch toanother source of drinking water as in the case of well water supplies insmall towns.
8.2.2. Radium Removal in Public Water Supply Systems
8.2.2.1. Rempva_l_ using_ £Pnye_n _i n£l_water_sof_tening_meth_od_s_In the state of Illinois, the U.S. Environmental Protection
Agency (EPA) conducted a study to determine the efficiency of radiumremoval using conventional water softening methods (reference 1). Thewater softening equipment at these locations utilized both ion exchangeand lime softening processes. Five locations were chosen withpopulations ranging from 235 to 58,000 people. The smallest water supplywas the Dwight Correctional Center near the village of Dwight, Illinois.The other locations were at the city of Peru, (12,000), the village ofHerscler (1,000), the city of Elgin (58,000), and the village of Lynwood(4,000). The Radium-226 levels in the raw water ranged from 3.3 to 14.7pCi/1.
In general, the ion exchange softening process removed Radium-226more efficiently (70.2% to 98.2%) as compared to 70% to 92% for limesoftening. The advantage of the lime softener process was that there wasnot the problem of breakthrough as at the end of a run through an ionexchange system. Both systems, however, have the disadvantage of theneed for disposal of radioactive solid waste. Significant amounts ofradium are concentrated in the brine rinse and the lime sludges. Theyare discharged into sewers, watercourses or placed on land. Althoughthis may not present a problem similar to the waste from uranium minesand mills, a more satisfactory solution should be found.
239

8.2.2.2. jRemp v_a_l_ u_s_ing_ majiganese—cp_at_e_d_a_cryl_lc f ib er s
A more unique technique for removing radium from groundwater hasbeen utilized in Texas. A contract was given by EPA to the state ofTexas to determine the feasibility of using manganese-coated acrylicfibers to decontaminate groundwater with high levels of radium due toleaching of uranium ore bodies or to treat effluents from the uraniummining and milling industry. The study was conducted utilizing the watersupply of Flatonia, Texas with a population of 1108 (reference 2).Radium-226 levels at four wells ranged from 3 to 16 pCi/1. If one filterstage is utilized, the process is at least 80% efficient.The recommendation of the study was that the efficiency of Radium-226removal should be at least 95% which means using two filter stages. Thecost of this process is about 45 US cents per thousand gallons of waterbeing filtered. The cost of laboratory analysis, overhead, amortizationand installation was not included.
The Flatonia study does not deal with the disposal problem of theacrylic filters. The filters could be immersed in nitric acid or apotassium salt and used again. However, then the radium is in aconcentrated liquid phase which is a more difficult form for disposal.Persons experienced in health physics procedures would then be necessaryat the water treatment plant which is not practical for a municipalutility. It may be that these filters could be buried in a land fill.This could be a potential contamination problem however. The state ofTexas does not have a solution for this waste disposal problem.
8.2.3. Impact on Groundwaters of Uranium Mills
The U.S. Nuclear Regulatory Commission (NRC) has done anextensive study on the environmental effects of uranium mills(reference 3). One of the major concerns was the seepage of radioactiveisotopes such as radium into groundwater supplies from active andinactive uranium tailings piles. Very few field studies have beenconducted so a theoretical analysis by Rahn and Mabes (reference 4) wasused by NRC to estimate the impact of contamination from tailings ponds.This study concluded that there would not be any contamination ofgroundwater from radioactive material. However, non-radioactivesubstances such as arsenic, selenium, molybdenum, cyanide, and chromiumcould contaminate water supplies over the lifetime of a uranium mill.After termination of mill operation, seepage would not continue sinceprecipitation in the southwestern part of the United States is sparse.
Due to the potential contamination of groundwater supplies, the NRCrequire the uranium tailings piles to have clay or synthetic liners toprevent seepage during the operation of the mill. Other alternatives tocontrol seepage such as dewatering and fixation were considered butare usually too expensive compared to the lining of the evaporationpond. Neutralization of the tailings can also be considered if the pondis located in an area where precipitation is greater than evaporation andthus provides a force for seepage after the mill ceases operation.
A field study by the EPA (reference 5) did confirm the NRC conclusionthat radioactivity was not seeping very far from uranium mines andmills. None of the municipal supplies near the uranium mining and
240

milling area had radium concentrations above the drinking waterstandard. The study concentrated on radionuclide contamination but thedata did indicate there was selenium contamination of a domestic well inthe area.
8.3. RADIUM POLLUTION ABATEMENT ON LIQUID EFFLUENTS FROM URANIUM MINES
Various types of radium-barium coprecipitation processes havebeen conducted by the owners of uranium mines. Some difficult problemsof the coprecipitation process are the choice of solid waste disposalmethods and sites to prevent radiological hazards, and the treatment ofthe residual harmful substances such as barium ions in process watersince these materials may present new water pollution problems.
8.3.1. Information on French Experience
According to the French reports (references 6, 7, and 8),experiments have been carried out with the introduction of bariumchloride solutions into a clarified effluent discharged from the tailingspond of uranium mine under various conditions. Sufficient sulfatecontent, (2 to 3 g/1), to allow complete precipitation of barium sulfatewas present in the mine effluent. A sulfate content of 0.6 g/1 isnecessary to ensure removal of soluble radium. A mine effluent of about450 pCi/1 of Radium-226 was treated with 15 mg/1 of barium chlorideresulting in a final concentration of less than 5 pCi/1 of Radium-226.The linear relationship between decontamination coefficient C(concentration of soluble radium in inlet water / concentration ofsoluble radium in outlet water) and an added amount of barium chloridewas determined experimentally. For the purpose of efficient settling ofbarium-radium sulfate precipitation, effects of fatty organic acids andFA20-H (an anionic flocculent) were tested in a pilot pond. A settlingefficiency of 75% was achieved in 2 hours of retention time withmechanical floculation by 11 baffles in the pond with the addition of 1.6mg/1 of FA20-H chemical flocculent. Under the same conditions, but usingonly 7 baffles, the settling efficiency was 57%. The efficiency wasfurther reduced to 54% when the flocculent was not added. Allexperiments utilizing fatty organic acids as an additive indicated poorresults. The barium concentration in the treated water was0.2 - 0.8 mg/1.
8.3.2. Information on Japanese Experience
Similar reports (references 9 and 10) were provided by Japanesedelegations. The radium removal techniques for the dam overflow or minewater of a Japanese uranium mine were presented. A barium chloridesolution was added to the dam overflow at the rate of 0.05 kg of solutionper cubic metre of dam overflow. The dam overflow containing enoughsulfate for precipitation, radium in the water was coprecipitated withthe barium. The experiments indicated that, when the addition of barium
241

chloride was 0.02 kg/m3, the radium concentration in the dam overflow(70 - 500 pCi/1) was reduced below 5pCi/l, and that, when 0.05 kg/m3 ofbarium chloride was added to the water, the 0.5 pCi/1 radium includingtreated water was achieved. However, a problem is developed since theprimary effluent had barium sulfate particles which were so small indiameter as 1 to 2^/um, that the sedimentation velocity is so low as 0.2mm/min. Since it was technically difficult to separate the radium by afiltering process after the addition of barium chloride, 0.1 kg/m3 ofBentonite was also added to form larger flocks to increasesedimentation. A concentration of 0.01 kg/m3 of another precipitantwas also added to increase the sedimentation velocity to 2.4 mm/min.
Recently, five settling ponds (total area 2200m^) and ten sandfilters (total area 930m2) were constructed at radium decontaminationfacilities near the Ningyo-toge mine. Two such systems were provided tomaintain sufficient treatment capacity (6m3/min) during the heavyrainfall period. Each individual system had an effluent treatingcapacity of 1 m3/min under ordinary conditions.
Another kind of experiment was performed to remove radium with bariteminerals. The barite was supplied from a Japanese mine and estimated tohave about 62% barium sulfate. Two sizes of barite blocks (10 to 32 meshand 32 to 65 mesh), were prepared. Glass columns, which had a 29mmdiameter, were filled with 300g of above these barite blocks. About 97%of radium in the mine water was removed at a flow-rate of 100 ml/min byusing a column containing the large size barite blocks and 99.7%efficiency was reached with a flow rate of 5 ml/min by using the smallerbio ck s.
242

REFERENCES
[1] BENNETT D.L., BELL C.R. and MARKWOOD Ira M., Determination ofRadium removal efficiencies in Illinois water supply treatmentprocesses, Illinois Environmental Protection Agency, TechnicalNote ORP/TAD-76-2, Office of Radiation Programs, EPA Washington,D.C. 20460 (May 1976).
[2] COOK L.M., Advanced technology for radium removal from drinkingwater: The Flatonia Water Treatment Project, EPA Contract No.68-01-3985, Division of Occupational Health and RadiationControl, Texas Department Health, Austin, Texas (1979).
[3] U.S. Nuclear Regulatory Commission, Final Generic EnvironmentalImpact Statement on Uranium Milling, NUREG-0706, Vol. I-III,Office of Nuclear Material, Safety and Safeguards (September1980).
[4] RAHN P.H. and MABES D.L., Seepage from uranium tailings pondsand its impact on ground water, Seminar on Management,Stabilization and Environmental Impact of Uranium Mill Tailings,Albuquerque, New Mexico (July 1978).
[5] KAUFMANN R.F., EADIE G.G. and RUSSELL C.R., Effects of uraniummining and milling on ground water in the Grants Mineral Belt,New Mexico, Ground Water, Volume 14, Number 5 (September 1976).
[6] FOURNIER P.M., Current Research and development on Radium-226Control at the French Atomic Energy Commission (1977) .
[7] CANET A. and ZETTWOOG P., Elimination du radium des effluentsd'usines de traitement de minerai d'uranium et d'eau d'exhaurede mines par le procédé au chlorure de Baryum (1977).
[8] CANET A., Etude en bassin pilote de la coprécipitation du radiumsoluble par le chlorure de barium et de la décantation duprécipité des sulphates de baryum-radium, dans les effluents del'usine SIMO-Vendée et dans l'eau d'exhaure de la mine del'Ecarpière (1976).
[9] IWATA I., KITOHARA Y., TAKENAKA S., KUROKAWA, Y., Mill tailingsdisposai and environmental monitoring the Ningyo-toge uraniumprocessing pilot plant, (1978).
[10] KUROKAWA Y., The Source, distribution, measurement anddeposition of radium in Japan, (1976).
243

Chapter 9
ADMINISTRATIVE AND TECHNICAL ANNEXES

9.1. PURPOSE AND SCIENTIFIC SCOPE OF THE PROGRAMME
As indicated by the title, this programme was designed todevelop systematic information on the form and movement of radium inwater under a range of environmental conditions, this information beingof great value to those authorities responsible for assessing theconsequences of radium releases to water and to those responsible forsetting discharge limits.
Scientific Scope
The scientific scope of this Coordinated Research Programme was givenas follows:
"(a) Selection and standardization of methods for determination ofradium in water. The methods must provide an acceptable methodfor differentiating between soluble and insoluble radium;
(b) The distribution of soluble and insoluble radium in naturalwaters and those affected by mining or milling operations willbe studied, and the changes over time and distance will bedetermined. The cause of the changes should be elucidated.Deposition, sorption, resolution and resuspension phenomena willbe studied;
(c) The factors affecting the leaching rate from ore heaps andtailings piles will be investigated. Of particular importanceis the investigation of the effect of revegetation of tailingspiles on the leach rate;
(d) The uptake of radium by biological systems, especially thosewhich form part of man's food chain."
9.2. PROGRAMMES OF PARTICIPATING LABORATORIES
In order to fulfill the aims of the programme - development ofsystematic information on the source, distribution, movement anddeposition of radium in inland waterways and aquifers - the role oflaboratories was to carry out a variety of projects under a range ofenvironmental conditions.
9.2.1. Australia
Two sub-coastal flood plains in northern Australia were examined forradium content and distribution. Both plains are subject to extensiveannual flooding, they have uranium mineralization within their catchmentsand they both support a pastoral industry. Uranium has already beenmined from the catchment of one plain and it was planned to begin miningin the second catchment in the near future.
The aim of the programme was to describe radium flow, both fromnatural arisings and from past mining operations, so that effluentstandards and surveillance procedures could be set up and monitored whenfurther uranium mining was embarked upon.
247

9.2.2. Brazil
In Brazil, the research objectives were the following:1) Studies on the pH and radiochemical characteristics of water
leaching of radium in tailings from uranium mining andmilling operations;
2) Identification of the sources of Ra-226 in inland waterwaysin the Poços de Caldas region;
3) Investigation of the fate of Ra-226 produced in mining andmilling operations in existing facilities and in theirvicinities in relation to man's food chain;
4) Tentative evaluation of the population dose due to Ra-226incorporated in the environment as a result of mining andmilling operations.
9.2.3. Czechoslovakia
In Czechoslovakia, the research objectives were the following:1) Selection, development and improvement of suitable methods
for determination of radium and its chemical forms inwater. These methods included emanometric, sorbemulsion,extraction, ultrafiltration, centrifugation, ion exchangeand other methods;
2) Investigation of the chemical forms of existence of radiumin selected natural waters in relation to the source ofradium, distance from the source and hydrobiologicalconditions. Interpretation of the possible influence ofindividual factors;
3) Investigation and characterization of the distributionprocesses of radium in river or lake water, suspendedparticles and bottom sediments. Assessment of main factorsinfluencing these processes;
4) Study of the uptake of different forms of radium bybiological systems, especially those forming part of man'sfood chain, in relation to their health impact.
9.2.4. France
In France, a study programme was set up with the intention ofpreparing a document on the transport of radium from the beginning oftreatment to the rivers and the ground. The programme contained fourpoints:
1) Observation of radium in plant studies to determine thecauses of the fluctuations observed in the concentration atthe level of the discharge, and to investigate thepossibility of accidental discharges during certainmaintenance operations (resins, filter sludges, etc.).Examination of the conditions assuring minimumsolubilization;
248

2) Study of the abatement of the radium in the basins. Studyof the cost of reduction to 10pCi/l at the level of thedischarge;
3) Neutralization trials in model plants with the water beforeand after transit into the basin;
4) Study of the consequences of the present discharge.Completion of the study by evaluation of the doses thatreached the critical group of the population for the presentdischarges.
9.2.5. India
In India, three phases were planned:1) First Phase:
(a) Survey of coastal discharges in the south, from Madrason the east coast to Mangalore on the west coast;sampling of coastal sediment and of the most commonfishes;
(b) Comparison of the Madras thermal project residues ofcoal ash with original lignite samples;
(c) Examination at the mine site of effluents, drinkingwater, fish and dissolved and atmospheric radon; Searchfor indicator vegetation.
2) Second Phase:(a) Chemical examination of samples (about 3-6 months);(b) Sampling of air, dust, soil and plants in central and
upper India regions (foot hill areas) in collaborationwith the Division of Atomic Minerals; survey ofphosphatic minerals and fertilizers;
(c) Dietary analyses; body burden measurements; drinkingwater, milk, diet, grass, soil-vegetation, grass-milk,sediment-fish relationships.Study of food chains and bioaccumulation.
3) Third Phase:(a) Completion of analyses; Data analyses.(b) Exposure evaluation
i) Calculationii) Urine and fecal examination of
occupational workers,iii) National average Ra burden.
(c) Confirmatory bone and teeth analyses.
This itemization indicates the line of approach and not a schedule.The programme of examination was also to determine the type, location andspecies of the organic-bound incorporated radium - whether it is easilylabile in soil - and to determine the ecological relationships.
It was also of interest to find the influence of other elements andfertilizers on the lowering of radium intake. For example, the southernareas are known for the production of coconuts grown on beaches and fedby sandy soils. These soils often contain monazite. As a result, thecoconut kernel and water have been found to contain radium.
249

9.2.5.
In Japan, environmental surveillance for radium from uranium miningor milling operations is sufficient to ensure that the concentration innatural water is less than the regulation value, because environmentalproblems have recently come under stricter control in Japan. PNC plansto continue mining and milling operations at the Ningyo-Toge Mine, andmining operations only at the Tono Mine. The distribution of radium inwaterways has been periodically monitored at fixed monitoring points inmine effluents, river water, river sediments or soil as a link in thechain of the PNC's environmental monitoring programme around the uraniummine. The radium concentration in the waterways has been monitored since1967 at the Ningyo-Toge Mine and since 1971 at the Tono Mine. Theresults of environmental monitoring so far indicate that no impact can befound in the vicinity of the mine.
The same programme of environmental surveillance is to be continuedin order to watch the trend of radium distribution from the uranium mine.
9.2.7. South Africa
In South Africa, uranium occurs in varying concentrations togetherwith the gold in South African gold mines. Consequently, radium ispresent in the very large mine dumps which are exposed to the severeenvironmental conditions pertaining on the Highveld. These lead toleaching, distribution by water and wind, re-precipitation and uptake instreams and aquifers. Human exposure may result through a variety ofpathways and a careful analysis is necessary to determine which arecritical.
Because these mines have been in operation for many decades beforethe discovery and extraction of uranium, the environmental survey ofradium in the various components of this stable situation, should provideimportant scientific data which may also be applied to newer and moreisolated uranium producers, e.g. at Phalaborwa.
This project was aimed at studying this rather unique situation,which is also of considerable practical importance in view of theincreasing number as well as extent of uranium mining and processingactivities in South Africa.
9.2.8. United States of America
In the United States of America, the Environmental Protection Agencyhad assessed the impact of waste discharges from uranium mining andmilling on surface and ground waters of the Grants Mineral Belt nearGrants, New Mexico. In proximity to the mines and mills shallowground-water contamination resulted from the infiltration of effluentsfrom mill tailings ponds and mine drainage water. This study in additionto previous EPA studies of inactive uranium mill tailings sites hasprompted a programme to evaluate the environmental radiation impact fromactive uranium mining and milling activities. This information is of
250

great value in assessing the consequences of radium releases to water andhelp setting the discharge limits. The Environmental Protection Agencyhas recently proposed regulations to limit radioactivity in the UnitedStates drinking water supplies. The proposed maximum level for radium is5 picocurles per litre of water.
9.2.9. Yugoslavia
In Yugoslavia, the programme was designed:1) to obtain information about natural radioactivity in surface
and drinking waters;2) to evaluate the population dose from uptake of radium through
drinking water;3) to determine the changes in the environment due to uranium
mining and milling effluents.
9.3. ORGANIZATION OF THE PROGRAMME
In order to promote transfer of knowledge and to stimulateinterchange and cooperation between participants, the organizationincluded at each meeting discussion and follow-up of studies that wereunder way or in preparation.
The first goal of the programme was to select and to standardizemethods for the determination of radium in water. Two intercomparisonruns took place and there was good agreement between laboratories (seechapter 2, section 2.3).
The second aim of the programme was to publish a report, the motiveof which evolved in the course of the successive Research CoordinationMeetings until the present document was arrived at.
9.4. PROGRESS OF THE PROGRAMME
9.4.1. First Research Coordination Meeting
The initial year was October 1975 and it was intended to holdthe first research coordination meeting soon after the commencement ofthe programme in order to select and standardize the methods of analysisto be used. This meeting was held in spring 1976, in France (Nantes),sixteen participants from six countries attended this meeting, and theScientific Secretary was Mr. Bonhote. It is worth recalling that theScientific Secretary indicated that the aim of the project was to publisha report summarizing and discussing the results achieved in the light ofenvironmental and public health protection. The participants agreed thatsuch a report was necessary and a draft outline of chapter headings forsuch a report, together with an indication of which countries wereworking in each area, was prepared at that time.
251

9.4.2. Second Research Coordination Meeting
The second coordination meeting was held at the invitation of theJapanese Government in Yonago City, in October 1977. Participants fromeight countries attended this meeting, of which Mr. Farges was theScientific Secretary; they had the opportunity to visit the veryefficient purification plant of the main uranium mine in Japan (NingyoToge). During the sessions of the meeting, papers were presented onresearch performed during the past year, and again the idea of presentingall the data in a booklet at the end of the programme, seemed veryattractive to the participants.
9.4.3. Third Research Coordination Meeting
The third coordination meeting was held in Las Vegas and Albuquerque,in October 1978, and a scientific visit was organized to uranium minesand mills in the Grants Belt. According to Mr. Farges, the ScientificSecretary, this meeting was very productive and a gratifying exchange ofinformation took place.
In the Agency Coordinated Research Programmes, a formal review ismade by the Committee for Contractual Scientific Services (CCSS) of eachcoordinated programme, at three-year intervals, in order to ensure thatreasonable progress is being made towards the programme goals and thatthe goals themselves remain valid in relation to the Agency's overallprogramme. The evaluation prepared in this connection by Mr. Farges,Project Officer, authorized the progress to date (March 1979):
- The first goal of the programme had been reached in selectingand standardizing methods for the determination of radium inwater. All the laboratories were using the emanation methodwith some variants. Two intercomparison runs had taken placeand there was now good agreement between laboratories;
- The study on distribution of soluble and insoluble radium wasprogressing, but some more problems had to be clarified;
- Leaching rates from ore heaps and tailings piles had beeninvestigated, but no major study had been completed;
- The uptake of radium by biological systems had been extensivelystudied and many results corresponding to various climatic andgeological conditions were available;
- Studies of the economic feasibility of radium removal facilitieshad shown the interest of economic data for possiblecost-benefit analysis.
Mr. Farges1s evaluation also depicted the programme to be carried outduring 2 additional years (1980-81):
- Finalization of the statistical analysis on intercomparison of226Ra;
- Study of the chemical form and adsorption behaviour of radium inaqueous solutions containing sulfates;
- Study of radium fixation in process effluents;- Continuation of the investigation of the significance ofsediment in the migration of radium in aquatic environments;
- Monitoring of radium in particularly interesting areas:Czechoslovakian and South African mines;
252

- Ecological studies of radium in various climatic conditions;- Issue of a booklet entitled "Behaviour of radium in aquifers andwaterways".
9.4.4. Fourth Research Coordination Meeting
The fourth and last coordination meeting, of which R. Kirchmannwas the Scientific Secretary, was held in Vienna in June 1980.The first part of the scientific sessions dealt with the findings of thevarious laboratories during the past twelve months.The second part was devoted to the preparation of the final draft report.
The future of this coordinated research programme was discussed andthe proposals from the participants helped to define the scientific scopeand the proposed "new" programme goals.
During the three previous coordination meetings, a technical visithad each time been organized for the participants, so a visit to theSeibersdorf Laboratories seemed appropriate, as the Agency's Laboratoryhad provided, about two years before, the radium solution standard to theparticipating laboratories. As the Agency's laboratory is located in theAustrian Research Center, Mr. Hefner, Head of the Health PhysicsDepartment, kindly arranged a visit to some of the Austrian laboratories.
9.5. RECOMMENDAT10 NS
Recommendations from this coordinated research programme wereformulated, the main points being:
(a) Field studies and experiments on the leaching and seepage of Rafrom tailings piles should be conducted;
(b) Biological uptake of Ra is often species- and site-specific andso more experimental work should be carried out, particularlywith reference to the physico-chemical form of the Ra; in thisrespect wider use should be made of the methods developed duringthe previous CRP for distinguishing the various forms of Ra inwat er;
(c) Effects of revegetation of tailings piles on the migration ofradium should be studied where examples are available; and
(d) Environmental models should be more widely used- to calculateannual ingestion rates for individuals and for populations.
Future work on these problems should include radionuclides other thanRa-216 such as Th-230, Ra-228, Th-228, Po-210 and chemically toxicmaterials if they are present.
253

HISTORY OF RESEARCH CONTRACTS AND AGREEMENTS
Agreement No.Project Officer:Chief Investigator;Institute:
Title:
Period of Contract
1698/R3/CFFARCES L.KUROKAWA, Y.Power Reactor and Nuclear Fuel Development Corporation.Tokyo, JapanStudies on the Distribution of Radium in Surface andWaste Water of the Uranium Mines in JapanR3 01/05/96 - 30/04/80RO 01/02/78 - 31/01/79Rl 15/12/76 - 14/12/77RO 15/10/75 - 14/10/76
Agreement No.Project Officer:Chief Investigator:Institute:Title:Period of Contract:
1699/R4/CFKIRCHMANN, R.ZETTWOOG, P.Commissariat a l'Energie Atomique, Fontenay-aux-Roses,FranceContamination of the Environment by Radium from TailingPiles of Uranium Mineral Processing FactoriesR4 01/06/80 - 01/05/79R3 01/05/79 - 30/04/80R2 01/03/78 - 28/02/79Rl 01/02/77 - 30/01/78RO 15/10/75 - 14/10/76
Contract No.Project Officer:Chief Investigator:Institute:Title:Period of Contract:
1700/R3/RBFARCES, L.KOBAL, I.Josef Stefan Institute, Ljubljana, YugoslaviaDetermination of Ra-226 in Surface and Drinking WaterR3 15/05/79 - 14/05/80R2 15/04/78 - 15/04/79Rl 01/12/76 - 30/11/77RO 01/12/75 - 30/11/76
Contract No.Project Officer:Chief Investigator:Institute:
Title:
Period of Contract:
1729/R3/RBFARCES, L.SEBESTA, F.Faculty of Nuclear Science and Physical Engineering,Technical University of Prague, Prague, CzechoslovakiaResearch Within the Framework of A Coordinated Programmeon Studies on the Source, Distribution, Movement andDeposition of Radium in Inland Waterways and AquifersR3 15/05/79 - 14/05/80R2 15/12/77 - 14/12/78Rl 15/12/76 - 14/12/77RO 15/12/75 - 14/12/76
255

Agreement No.Project Officer:Chief Investigator:Institute:
Title:
Period of Contract:
1769/R3/CFKIRCHMANN, R.WILLIAMS, A.Australian Atomic Energy Commission, ResearchEstablishment, Lucas Heights, Sutherland, N.S.W.,AustraliaThe Movement of Radium in the Sub-Coastal Plains ofNorthern AustraliaR3 01/02/80 - 31/01/81R2 01/07/78 - 30/06/79Rl 01/06/77 - 31/05/78RO 01/04/76 - 31/03/77
Contract No.Project Officer:Chief Investigator:Institute:Title:Period of Contract:
1788/R2/RBFARCES, L.IYENGAR, M.Bhabha Atomic Research Centre, Trombay, Bombay, IndiaRadium in Natural and Processing Areas and its Impact onHuman EnvironmentR2 01/07/79 - 30/06/80Rl 01/07/77 - 30/06/78RO 01/04/76 - 31/03/77
Ag reeme n t No.Project Officer:Chief Investigator:Institute:
Title:
Period of Contract:
1864/R2/CFRICHTER, D.SILHANEK, J.Office of Radiation Programs, US EnvironmentalProtection Agency, Washington, D.C., U.S.A.Research within the framework of a Coordinated Programmeon Studies on the Source, Distribution, Movement andDeposition of Radium in Inland Waterways and AquifersR2 16/06/79 - 15/06/80Rl 15/04/78 - 14/04/79RO 01/11/76 - 31/10/77
Contract No.Project Officer:Chief Investigator:Institute:
Title:
Period of Contract:
1865/R2/RBFARCES, L.PASCHOA, A.Pontificia Universidade Catolica, Departamanto deFisica, Rio de Janeiro, BrazilStudy of Ra-226 Wastes From Uranium mining and MillingOperationsR2 01/05/79 - 30/04/80Rl 01/12/77 - 30/11/78RO 01/11/76 - 31/10/77
Agreement No.Project Officer:Chief Investigator:Institute:Title:
Period of Contract:
2295/R1/CFKIRCHMANN, R.BASSON, J.Atomic Energy Board, Pretoria, South AfricaMovement of Radium from South African Gold/Uranium MineDumps into the Aqueous EnvironmentRl 01/02/80 - 31/01/81RO 01/12/78 - 30/11/79
256

PARTICIPANTS IN RESEARCH COORDINATION MEETINGS

FIRST RESEARCH COORDINATION MEETING, Mortagne near Nantes, France, 30 March -2 April 1976______________________
PARTICIPANTS
AUSTRALIAMr. Alex R. WilliamsAustralian Atomic Energy CommissionResearch EstablishmentPrivate Mail BagSutherland 2232, N.S.W.
CZECHOSLOVAKIADr. P. BenesDepartment of Nuclear ChemistryTechnical University of PragueBrehovà 7115 19 Prague
FRANCEMr. Jacques Pradel
(Liaison Officer)C.E.A.Department de ProtectionB.P. 6F-92260 Fontenay-aux-Roses
INDIAMr. M.A.R. lyengarEnvironmental Survey Lab. (ESL)Bhabha Atomic Research CentreKalpakkam Post, Chingleput Dt.,Tamil Nadu 603 102JAPANDr. Yoshiyasu KurokawaHealth and Safety OfficePower Reactor and Nuclear Fuel
Development Corporation9-13, 1-Chome, Akasaka, Minato-kuTokyo
YUGOSLAVIADr. Ivan KobalInstitute "Jozef Stefan"P.O. Box 19961001 Ljublajana
INTERNATIONAL ATOMIC ENERGY AGENCY. ViennaMr. P.A. Bonhote
(Scientific Secretary)
SECOND RESEARCH COORDINATION MEETING, Yonago City, Japan, 17-21 October 1977
PARTICIPANTS
AUSTRALIAMr. Alex R. WilliamsHealth Physics Research StationAustralian Atomic Energy CommissionResearch EestablishmentPrivate Mail BagSutherland 2232, N.S.W.
CZECHOSLOVAKIADr. P. BenesTechnical University of PragueFaculty of Nuclear Sciences andPhysical Engineering
Brehovà 7115 19 Prague
BRAZILProf. A. Salles PaschoaPontificia Universidade CatolicaÜepartamento de FisicaCx Postal 38071Rio de Janeiro ZC 19
FRANCEMr. Jacques PradelC.E.A.Centre d'Etudes Nucléaires de
Fontenay-aux-RosesB.P. 6F-92260 Fontenay-aux-Roses
259

INDIAMr. M.A.R. lyengarBhabha Atomic Research CentreEnvironmental Survey LaboratoriesKalpakkam Post, Chingleput DistrictTamil Nadu 6031 02JAPANDr. Yoshiyasu Rurokawa
(Liaison Officer)Health and Safety OfficePower Reactor and Nuclear Fuel
Development Corporation9-13, 1-Chome, Akasaka, Minato-kuTokyo
U.S.A.Dr. Robert F. KaufmannOffice of Radiation ProgramsUS Environmental Protection AgencyP.O. Box 15027Las Vegas, Nevada 89114
YUGOSLAVIADr. Ivan KobalInstitute "Jozef Stefan"P.O. Box 19961000 Ljublajana
INTERNATIONAL ATOMIC ENERGY AGENCY, ViennaMr. L. Farges
(Scientific Secretary)
OBSERVERS
FRANCEMr. Pierre ZettwoogC.E.A. Centre d'Etudes Nucléaires
de Fontenay-aux-RosesB.P. No. 6F-92260 Fontenay-aux-Roses
JAPAN
Mr. Yoshihisa KitaharaMr. Tsuneo HiroseMr. Satoru FukushimaDr. Ryuhei KurosawaMr. Tatsumi TakahashiMr. Yozo SugitsueMr. Ichiro IwataMr. Shuichiro HironoMr. Noboru SugitaMr. Takayuki IgarashiMr. Yoshiaki Tajima
(Secretary)
PNCPNCPNCWaseda UniversityPNCPNCPNCPNCPNCPNCPNC
260

THIRD RESEARCH COORDINATION MEETING, Albuquerque, New Mexico, U.S.A.,23-27 October 1978
PARTICIPANTS
AUSTRALIADr. R.D. SimpsonAustralian Atomic Energy CommissionNuclear Science & Technology BranchPrivate Mail BagSutherland 2232, N.S.W.
BRAZILProf. A. Salles PaschoaPontificia Universidade CatolicaDepartamento de FisicaRua Marqués de Sao Vicente 225 Z.C. 19Rio de Janeiro
CZECHOSLOVAKIADr. F. SebestaTechnical University of PragueFaculty of Nuclear Sciences and
Technical EngineeringBrehovà 7Prague 115 19FRANCEDr. Jacques PradelCentre d'Etudes Nucléaires de
Fo nt enay-a ux-Ro sesB.P. No. 6F-92260 Fontenay-aux-Roses
INDIAMr. M.A.R. lyengarBhabha Atomic Research CentreEnvironmental Survey Lab.Kalpakkam Post, Chingleput DistrictTamil Nadu 603102
JAPANDr. Yoshiyasu KurokawaHealth and Safety OfficePower Reactor and Nuclear Fuel
Development Corporation9-13, 1-Chome, Akasaka, Minato-kuTokyoU.S.A.
INTERNATIONAL ATOMIC ENERGY AGENCY. Vienna
Mr. L. Farges(Scientific Secretary)
Dr. Robert F. KaufmannUS Environmental Protection Agency
(Liaison Officer)Office of Radiation ProgramsP.O. Box 15027Las Vegas, Nevada 89114
OBSERVERS
BRAZILDr. G.B. BaptistaPontificia Universidade CatolicaDepartamento de FisicaRua Marques de Sao Vicente 225 Z.C. 19Rio de Janeiro
CZECHOSLOVAKIAProf. I. StollTechnical University of PragueFaculty of Nuclear Sciences andPhysical Engineering
Brehovà 7Prague 115 19
FRANCEDr. P. ZettwoogCentre d'Etudes Nucléaires de
Fontenay-aux-RosesB.P. No. 6F-92260 Fontenay-aux-Roses
U.S.A.Dr. L. CookDivision of Occupational Health and
Radiation ControlTexas Department of Health
U.S.A.Dr. A. TannerU.S. Geological SurveyReston, Virginia
261

FOURTH RESEARCH COORDINATION MEETING, Vienna, Austria, 16-20 June 1980
PARTICIPANTS
AUSTRALIADr. Alex R. WilliamsAustralian Atomic Energy CommissionResearch EstablishmentPrivate Mail BagSutherland 2232, N.S.W.BRAZILProf. A. S. PaschoaPontificia Universidade CatolicaDepartamento de FisicaRua Marqués de Sao Vicente, 225Cx Postal 38071Rio de JaneiroCZECHOSLOVAKIADr. F. SebestaTechnical University of PragueFaculty of Nuclear Sciences andPhysical Engineering
Brehovà 7Prague 115 19FRANCEMr. Mary Lynn MarpleCentre d'Etudes Nucléaires de
Fontenay-aux-RosesDépartement de ProtectionB.P. No. 6F-92260 Fontenay-aux-Roses
INDIAMr. M.A.R. lyengarBhabha Atomic Research CentreEnvironmental Survey LaboratoriesKalpakkam Post, Chingleput DistrictTamil Nadu 6031 02
JAPANDr. Yoshiyasu KurokawaHealth and Safety OfficePower Reactor and Nuclear Fuel
Development Corporation9-13, 1-Chome, Akasaka, Minato-kuTokyoSOUTH AFRICADr. A.S.M. de JésusAtomic Energy BoardPrivate Bag X256Pretoria 0001
U.S.A.Dr. J.S. SilhanekOffice of Radiation ProgramsEnvironmental Protection Agency401 M. Street S.W.Washington, D.C. 20460YUGOSLAVIADr. Ivan KobalInstitute Jozef StefanP.O. Box 19961001 Ljublajana
INTERNATIONAL ATOMIC ENERGY AGENCY, ViennaMr. R.J. Kirchmann
(Scientific Secretary)
OBSERVERS
BRAZILProf. G.B. BaptistaPontificia Universidade CatolicaDepartamento de FisicaRua Marqués de Sao Vicente, 225Cx Postal 38071Rio de Janeiro
CZECHOSLOVAKIADr. P. BenesDepartment of Nuclear ChemistryTechnical University of PragueBrehovà 7115 19 Prague
JAPANDr. R. KurosawaWaseda UniversityScience and Research Lab.17 Kikui-cho, Shinjuku-kuTokyo 162
SOUTH AFRICADr. D. Van AsAtomic Energy BoardPrivate Bag X256Pretoria 0001
262

HOW TO ORDER IAEA PUBLICATIONSAn exclusive sales agent for IAEA publications, to whom all orders
and inquiries should be addressed, has been appointedin the following country:
UNITED STATES OF AMERICA UNIPUB, P.O. Box 433, Murray Hill Station, New York, NY 10157
In the following countries IAEA publications may be purchased from thesales agents or booksellers listed or through yourmajor local booksellers. Payment can be made in localcurrency or with UNESCO coupons.
ARGENTINA
AUSTRALIABELGIUM
CZECHOSLOVAKIA
FRANCE
HUNGARY
INDIA
ISRAEL
ITALY
JAPANNETHERLANDS
PAKISTANPOLAND
ROMANIASOUTH AFRICA
SPAIN
SWEDEN
UNITED KINGDOM
U.S.S.R.YUGOSLAVIA
Comisiôn Nacional de Energi'a Atomica, Avenida'del Libertador 8250,RA-1429 Buenos AiresHunter Publications, 58 A Gipps Street, Collingwood, Victoria 3066Service Courrier UNESCO, 202, Avenue du Roi, B-1060 BrusselsS.N.T.L., Spélenâ 51, CS-113 02 Prague 1Alfa, Publishers, Hurbanovo namestie 6, CS-893 31 BratislavaOffice International de Documentation et Librairie, 48, rue Gay-Lussac,F-75240 Paris Cedex 05Kultura, Hungarian Foreign Trading CompanyP.O. Box 149, H-1389 Budapest 62Oxford Book and Stationery Co., 17, Park Street, Calcutta-700 016Oxford Book and Stationery Co., Scindia House, New Delhi-110 001Heiliger and Co., Ltd., Scientific and Medical Books, 3, Nathan StraussStreet, Jerusalem 94227LibreriaScientifica, Dott. Lucio de Biasio "aeiou",Via Meravigli 16, 1-20123 MilanMaruzen Company, Ltd., P.O. Box 5050, 100-31 Tokyo InternationalMartinus Nijhoff B.V., Booksellers, Lange Voorhout 9-11, P.O. Box 269,NL-2501 The HagueMirza Book Agency, 65, Shahrah Quaid-e-Azam, P.O. Box 729, Lahore 3Ars Polona-Ruch, Centrala Handlu Zagranicznego,Krakowskie Przedmiescie 7, PL-00-068 Warsawllexim, P.O. Box 136-137, BucarestVan Schaik's Bookstore (Pty) Ltd., Libri Building, Church Street,P.O. Box 724, Pretoria 0001Diaz de Santos, Lagasca 95, Madrid-6Dia2 deSarttos, Balmes 417, Barcelona-6AB C.E. Fritzes Kungl. Hovbokhandel, Fredsgatan 2, P.O. Box 16356,S-103 27 StockholmHer Majesty's Stationery Office, Publications CentreP.O. Box 276, London SW8 5DRMezhdunarodnaya Kniga, Smolenskaya-Sennaya 32-34, Moscow G-200Jugoslovenska Knjiga, Terazije 27, P.O. Box 36, YU-11001 Belgrade
Orders from countries where sales agents have not yet been appointed andrequests for information should be addressed directly to:
Division of PublicationsInternational Atomic Energy AgencyWagramerstrasse 5, P.O. Box 100, A-1400 Vienna, Austria