Radon and radium isotope assessment of submarine groundwater discharge in the Yellow River delta,...
14
Radon and radium isotope assessment of submarine groundwater discharge in the Yellow River delta, China Richard N. Peterson, 1 William C. Burnett, 1 Makoto Taniguchi, 2 Jianyao Chen, 3 Isaac R. Santos, 1 and Tomotoshi Ishitobi 2 Received 15 February 2008; revised 12 June 2008; accepted 7 July 2008; published 11 September 2008. [1] Naturally occurring chemical tracers were used to assess the magnitude of submarine groundwater discharge (SGD) during two different sampling periods at a coastal site south of the Yellow River delta, China. We used salinity and pH as indicators of the terrestrial and recirculated seawater components of discharging groundwater and radium isotopes to quantify offshore transport rates. We then used an hourly time series of multiple radium isotopes ( 224 Ra, 223 Ra, and 226 Ra) to quantify SGD rates and also used 222 Rn and seepage meters to independently quantify SGD rates as a comparison to the radium results. Offshore transport rates were found to range from 3.3 to 4.7 cm s 1 . Modeled time series radium activities indicated average SGD rates ranging from 4.5 to 13.9 cm d 1 in September 2006 and from 5.2 to 11.8 cm d 1 in July 2007. Temporal trends associated with the radium approach agree with SGD patterns revealed by automated seepage meters deployed nearby, but the absolute fluxes are about 70% lower than those determined by the seepage meters. Modeled SGD rates based on 222 Rn (mean = 13.8 cm d 1 in 2006 and 8.4 cm d 1 in 2007) agree with those determined by the radium analysis. Differences in derived SGD rates between the different radium isotopes ( 226 Ra highest; 224 Ra lowest) are likely results of uncertainties in the background activities and our limited selection of appropriate groundwater/pore water end-member values. Scaling our results to the entire Yellow River delta, we find SGD fluxes (and corresponding nitrate fluxes) 2–3 times that of the Yellow River. Citation: Peterson, R. N., W. C. Burnett, M. Taniguchi, J. Chen, I. R. Santos, and T. Ishitobi (2008), Radon and radium isotope assessment of submarine groundwater discharge in the Yellow River delta, China, J. Geophys. Res., 113, C09021, doi:10.1029/2008JC004776. 1. Introduction [2] Submarine groundwater discharge (SGD) is now regarded as an important pathway that transports dissolved substances from subseabed fluids to the coastal ocean. Being both spatially and temporally variable, SGD is very difficult to measure and therefore its relative importance in coastal ocean chemical budgets is often unknown [Burnett et al., 2006a]. Nonetheless, nutrient fluxes via SGD have been shown to rival those from rivers in some locations [Slomp and Van Cappellen, 2004; Kim et al., 2005; Swarzenski et al., 2007a]. Providing an additional nutrient source to the coastal ocean can often be beneficial to the coastal ecology [e.g., Santos et al., 2008], but effects from SGD can also be harmful in areas where terrestrial groundwaters are contam- inated from anthropogenic sources [Hu et al., 2006]. [3] By definition, SGD includes all water moving across the sediment-water interface and into the overlying water column, regardless of composition or driving force [Burnett et al., 2003a]. This designation includes both fresh, terres- trial groundwater and saline, recirculated seawater. The hydraulic gradient is the main driving force that results in fresh, terrestrial aquifer waters discharging at the coastline. Driving forces controlling recirculated seawater include tidal pumping, wave setup, and convective circulation caused by subterranean aquifer density differences [Michael et al., 2005; Charette, 2007]. [4] The Yellow River delta is an area where these driving forces can interact uniquely because of some unusual geological characteristics. The high rate of sediment supply from the Yellow River results in an annual progradation of the delta into the Bohai Sea by 20–25 km 2 [Chen et al., 2007]. This growth creates large expanses of low-lying land extending into the Bohai Sea each year. The result is a dampening of the hydraulic gradient between the land and ocean, thereby increasing the relative influence of marine effects as a driving force. This high sediment supply, however, has also created a perched riverbed in the lower reaches of the river, so the Yellow River lies up to 11 m JOURNAL OF GEOPHYSICAL RESEARCH, VOL. 113, C09021, doi:10.1029/2008JC004776, 2008 Click Here for Full Articl e 1 Department of Oceanography, Florida State University, Tallahassee, Florida, USA. 2 Research Institute for Humanity and Nature, Kyoto, Japan. 3 School of Geography Sciences and Planning, Sun Yat-sen University, Guangzhou, China. Copyright 2008 by the American Geophysical Union. 0148-0227/08/2008JC004776$09.00 C09021 1 of 14
-
Upload
independent -
Category
Documents
-
view
1 -
download
0
Transcript of Radon and radium isotope assessment of submarine groundwater discharge in the Yellow River delta,...

Radon and radium isotope assessment of submarine groundwater
discharge in the Yellow River delta, China
Richard N. Peterson,1 William C. Burnett,1 Makoto Taniguchi,2 Jianyao Chen,3
Isaac R. Santos,1 and Tomotoshi Ishitobi2
Received 15 February 2008; revised 12 June 2008; accepted 7 July 2008; published 11 September 2008.
[1] Naturally occurring chemical tracers were used to assess the magnitude ofsubmarine groundwater discharge (SGD) during two different sampling periods at acoastal site south of the Yellow River delta, China. We used salinity and pH asindicators of the terrestrial and recirculated seawater components of discharginggroundwater and radium isotopes to quantify offshore transport rates. We then used anhourly time series of multiple radium isotopes (224Ra, 223Ra, and 226Ra) to quantifySGD rates and also used 222Rn and seepage meters to independently quantify SGD rates as acomparison to the radium results. Offshore transport rates were found to range from3.3 to 4.7 cm s�1. Modeled time series radium activities indicated average SGD ratesranging from 4.5 to 13.9 cm d�1 in September 2006 and from 5.2 to 11.8 cm d�1 inJuly 2007. Temporal trends associated with the radium approach agree with SGDpatterns revealed by automated seepage meters deployed nearby, but the absolutefluxes are about 70% lower than those determined by the seepage meters. ModeledSGD rates based on 222Rn (mean = 13.8 cm d�1 in 2006 and 8.4 cm d�1 in 2007)agree with those determined by the radium analysis. Differences in derived SGD ratesbetween the different radium isotopes (226Ra highest; 224Ra lowest) are likely results ofuncertainties in the background activities and our limited selection of appropriategroundwater/pore water end-member values. Scaling our results to the entire YellowRiver delta, we find SGD fluxes (and corresponding nitrate fluxes) 2–3 times that ofthe Yellow River.
Citation: Peterson, R. N., W. C. Burnett, M. Taniguchi, J. Chen, I. R. Santos, and T. Ishitobi (2008), Radon and radium isotope
assessment of submarine groundwater discharge in the Yellow River delta, China, J. Geophys. Res., 113, C09021,
doi:10.1029/2008JC004776.
1. Introduction
[2] Submarine groundwater discharge (SGD) is nowregarded as an important pathway that transports dissolvedsubstances from subseabed fluids to the coastal ocean. Beingboth spatially and temporally variable, SGD is very difficultto measure and therefore its relative importance in coastalocean chemical budgets is often unknown [Burnett et al.,2006a]. Nonetheless, nutrient fluxes via SGD have beenshown to rival those from rivers in some locations [Slompand Van Cappellen, 2004;Kim et al., 2005; Swarzenski et al.,2007a]. Providing an additional nutrient source to the coastalocean can often be beneficial to the coastal ecology [e.g.,Santos et al., 2008], but effects from SGD can also beharmful in areas where terrestrial groundwaters are contam-inated from anthropogenic sources [Hu et al., 2006].
[3] By definition, SGD includes all water moving acrossthe sediment-water interface and into the overlying watercolumn, regardless of composition or driving force [Burnettet al., 2003a]. This designation includes both fresh, terres-trial groundwater and saline, recirculated seawater. Thehydraulic gradient is the main driving force that results infresh, terrestrial aquifer waters discharging at the coastline.Driving forces controlling recirculated seawater includetidal pumping, wave setup, and convective circulationcaused by subterranean aquifer density differences [Michaelet al., 2005; Charette, 2007].[4] The Yellow River delta is an area where these driving
forces can interact uniquely because of some unusualgeological characteristics. The high rate of sediment supplyfrom the Yellow River results in an annual progradation ofthe delta into the Bohai Sea by 20–25 km2 [Chen et al.,2007]. This growth creates large expanses of low-lying landextending into the Bohai Sea each year. The result is adampening of the hydraulic gradient between the land andocean, thereby increasing the relative influence of marineeffects as a driving force. This high sediment supply,however, has also created a perched riverbed in the lowerreaches of the river, so the Yellow River lies up to 11 m
JOURNAL OF GEOPHYSICAL RESEARCH, VOL. 113, C09021, doi:10.1029/2008JC004776, 2008ClickHere
for
FullArticle
1Department of Oceanography, Florida State University, Tallahassee,Florida, USA.
2Research Institute for Humanity and Nature, Kyoto, Japan.3School of Geography Sciences and Planning, Sun Yat-sen University,
Guangzhou, China.
Copyright 2008 by the American Geophysical Union.0148-0227/08/2008JC004776$09.00
C09021 1 of 14

above its surroundings. This effect creates the potential forthe river to recharge the groundwater, enhancing thehydraulic gradient between the river and the coast [Yu,2006].[5] The Yellow River delta is a location where SGD can
potentially introduce contaminated groundwater to thecoastal ocean. As a result of China’s growing population,more people are inhabiting the delta than ever before andare contributing to groundwater contamination, mainlythrough agricultural practices and sewage disposal. Thegroundwater environment around the delta contains ele-vated nitrate levels (concentrations up to 3.8 mmol),mainly in shallow aquifers [Chen et al., 2007]. Thesenitrate-rich zones often coincide with agricultural land usepatterns and concentrated population centers. Zhang et al.[2004] determined that within the last 40 years, DINconcentrations have increased tenfold, coincident withreductions in phosphorus (50–60%) and silica (75%) inthe central Bohai Sea. This trend has led to portions of theBohai Sea shifting to a phosphate-limited ecosystem. Thesource of the excess nitrogen, however, remains unknown.[6] One potential source of this nitrogen could be SGD.
Because Chen et al. [2007] found excessively high concen-trations of nitrate in contaminated groundwater, even arelatively small volumetric flux of SGD could provide a
significant input of nitrate to the coastal ocean. Once thesenutrients are introduced to the coastal zone via SGD, theymust be transported offshore to the central Bohai Sea tocontribute to the increasing nitrogen concentrations. Inaddition to quantifying SGD rates, knowledge of dissolvedcomponent transport rates in this region is thus an importantfactor for determining whether SGD can be a significantsource of these nutrients on a regional basis.[7] Taniguchi et al. [2008] used automated heat-type
benthic seepage meters [Taniguchi and Iwakawa, 2001] tomeasure SGD in a down-gradient area of the delta approx-imately 40 km south of the Yellow River estuary (Figure 1).Combining the results from the seepage meters with con-ductivity (salinity) measured inside the chambers allows forthe separation of fresh SGD from total SGD. They foundthat fresh groundwater fluxes are between 1 and 5% of totalflow, and integrating their results over the estimated zone ofdischarge in the delta yielded freshwater SGD flow esti-mates that ranged from 4.5 to 7.0% of the Yellow Riverdischarge.[8] The goals of the work presented here are to use
naturally occurring geochemical tracers (e.g., radiumisotopes, 222Rn, salinity, pH) to examine patterns andfluxes of SGD in the same area studied by Taniguchi etal. [2008]. This paper represents one of the first to use a
Figure 1. Map showing the Yellow River delta, monitoring wells (circles), and the SGD study site.
C09021 PETERSON ET AL.: SGD IN THE YELLOW RIVER DELTA
2 of 14
C09021

24-hour high-resolution time series of multiple radium iso-topes in order to quantify SGD rates. Beck et al. [2007, 2008]have made similar attempts, but only over�6-hour intervals.We also use parallel 222Rn and benthic seepage metermeasurements to provide an independent comparison ofthese fluxes.[9] Chemical tracers measured in the water column inte-
grate the SGD signal over much larger spatial scales thanindividual benthic chambers, and are thus an appropriateway to handle the large spatial variability inherent ingroundwater discharge patterns. In addition, horizontaloffshore transects of radium isotopes allow us to quantifythe transport rates of the discharged groundwater offshore.Radon and radium isotopes have been shown to be effectivetracers of SGD because they are concentrated in ground-water relative to surface water, and the decay rates of the222Rn and the short-lived radium isotopes are on the sametemporal scale as the processes in question [Burnett andDulaiova, 2003; Kim et al., 2005; Dulaiova et al., 2006;Burnett et al., 2008; Swarzenski et al., 2007a]. We use threeradium isotopes in this study, with half-lives that cover alarge temporal range: 224Ra (T1/2: 3.6 days); 223Ra (T1/2:11.3 days); and 226Ra (T1/2: 1600 years). In freshwater,radium will be found mostly adsorbed onto the surface ofparticles, but once introduced to saltwater, ion exchangeprocesses displace the radium off particles and into solution[Li and Chan, 1979; Nozaki et al., 2001].
2. Methods
2.1. Measurements
[10] Samples were collected in September 2006 and July2007 from a coastal site located 40 km south of the YellowRiver mouth (small square on the west side of Laizhou Bay,Figure 1) in an area toward which groundwater contoursindicate subsurface flow should occur [Chen et al., 2007;Taniguchi et al., 2008]. In September 2006, we collected acontinuous 25-hour time series (TS-1; 1 km offshore;average depth: 1.4 m) of radium isotopes, 222Rn, pH, andconductivity. During the July 2007 sampling, these tracerswere measured in both a 23-hour time series (TS-2; 2 kmoffshore; average depth: 1.7 m) and a 12 km shore-normaltransect.[11] Radium isotopes were collected according to the
methods established by Moore and Reid [1973]. Largevolume samples (�100 L) were pumped slowly (1 L min�1)through columns containing acrylic fibers impregnated withmanganese dioxide. This Mn-fiber quantitatively sorbs thedissolved radium from the water. These fibers were thenwashed thoroughly to remove all particles and counted forthe short-lived radium isotopes via a delayed coincidencecounting system [Moore and Arnold, 1996]. 226Ra wascounted by either gamma spectrometry [Dulaiova andBurnett, 2004] or by measuring 222Rn and its daughtersafter sealing the fiber in airtight columns to allow foringrowth. These columns were later mounted to a radonemanation line or a commercially available radon-in-airmonitor (RAD7, Durridge Co.) to measure 222Rn as aproxy for the 226Ra [Kim et al., 2001]. All samples fromTS-1 were counted by gamma spectrometry, while thesamples from July 2007 were analyzed for 226Ra using
the ingrowth method. Cross-calibration shows that themethods agree within 20%.[12] 222Rn in water was measured continuously in the
field using a modified RAD7 radon-in-air monitor [Burnettet al., 2001]. Surface water (�0.5 m below the surface) waspumped to an air/water equilibrium exchanger system. Inthis system, the headspace air is circulated to the RAD7 foranalysis of 222Rn activity in the air, and recycled back to theexchanger, creating a closed air loop. Applying a tempera-ture-dependent solubility coefficient for 222Rn, we canconvert from measured radon in air to the correspondingvalue in the water. Each data point attained represents anintegrated value over 30 to 60 min, depending upon thedesired measurement uncertainty.[13] Groundwater samples for 222Rn and radium were
collected on land using a peristaltic pump from boreholesaround the delta, and pore water samples from offshore(�50 cm below the sediment-water interface) were collectedfrom a push-point piezometer [Charette and Allen, 2006].Groundwater and pore water samples for radon weremeasured using a RAD-H2O system that uses the internalpump of the RAD7 to sparge radon from a 250 mLvolume and circulate it to the counter for measurement.The pH and electrical conductivity were measured using ahandheld YSI Model 85 probe.
2.2. Transport Rate Model
[14] Moore [2000] described a method of using radiumisotope activity ratios (AR) to determine the apparentradium age of water masses. The ages represent the relativetime that has elapsed since the radium first entered thesystem. They are based on the exponential decay of theshort-lived radioisotopes from their original input signature.If radium is input to the coastal ocean with a constant short-lived to long-lived AR over time, and no additional sourcesof radium exist, we can examine the difference between theinitial activity ratio (ARi) and a measured ratio (ARobs) tocalculate the apparent radium age (t):
t ¼ LnARi
ARobs
� �*
1
l224 � l226
ð1Þ
where l224 and l226 represent the decay constants of theshort-lived radium isotope (e.g., 224Ra) and that of thelonger-lived isotope (e.g., 226Ra), respectively. Definingthe ARs as the activity of a short-lived isotope to that of alonger-lived isotope dictates that they always decreasewith time.[15] The relative differences between the radium ages
across a transect should indicate the actual mixing timesrequired to distribute the observed isotope ratios. Therefore,plotting the apparent radium ages against their distance fromshore (assuming the source is near the shoreline) can yieldan estimate of the offshore linear transport rate of radium[Moore and Krest, 2004; R. Peterson et al., Determinationof transport rates in theYellowRiver—Bohai Seamixing zonevia natural geochemical tracers, submitted toContinental ShelfResearch, 2008] and all conservative constituents dissolved inthe water.
2.3. Radium Time Series Model
[16] In addition to determining coastal transport rates, wecan use radium as a tracer to quantify SGD rates. At our
C09021 PETERSON ET AL.: SGD IN THE YELLOW RIVER DELTA
3 of 14
C09021

study sites, the only inputs of radium should be from theBohai Sea shelf waters (assumed to be very low), desorptionfrom suspended sediments, desorption and subsequent dif-fusion from bottom sediments, and advection of groundwa-ter into the overlying water column. The only importantsink for radium on an hourly basis is mixing.[17] We have assumed that we can neglect riverine inputs
at this location because the seasonal currents in the BohaiSea carry the Yellow River freshwater plume away from oursite and because there are no other significant riversdischarging in this area. Several authors have demonstratedthat during the summer months, the monsoonal winds blowfrom the south in this region, thus creating a cyclonic gyrewithin the Bohai Sea [Hainbucher et al., 2004; Wang et al.,2007]. Since the Yellow River is located 40 km north of ourstudy site and its plume is directed further to the north in thesummer, it is very likely that it has no influence over thetracers at our study site.[18] Our model to quantify SGD from radium adjusts the
measured radium activities (per square meter of seabed) foroffshore mixing contributions and sedimentary inputs todefine an excess radium inventory that must be supplied bySGD. It is difficult to accurately assess the effect of mixing onour measured inventories, because we are sampling at onepoint within a large, shallow continental shelf. Currents andtidal forces move water in all directions, so determining anoffshore ‘‘end-member’’ value for radium activity is inap-propriate. Instead, we choose to use the lowest activitymeasured during the course of each time series as an indicatorof the shelf-wide ‘‘background’’ radium activity. As some ofthis radium may be supplied by SGD, this should represent amaximum estimate of non-SGD sources of radium andtherefore will lead to conservative SGD estimates.[19] Desorption from sediments is likely a significant
source of radium to these shelf waters, especially for theshort-lived isotopes. These waters are saline (S � 29), sowe can assume that any radium initially present uponoriginal input of the sediments has already been desorbed.Therefore, the only source of desorbable radium on boththe suspended and bottom sediments is from decay of theradium parents (insoluble thorium). By accounting for the‘‘background’’ radium activity as described above weshould have already accounted for diffusive and desorptiveinputs from sediments.[20] The following steps were used to derive SGD rates
from a time series of radium samples:[21] 1. Adjust each measured radium activity (Ratotal) to
represent the excess radium activity by subtracting out theshelf background radium activity (Rabkgd; taken as thelowest measured concentration for each time series). Thiscorrection also accounts for the contribution from bottomand suspended sediments as described above.[22] 2. Multiply by the measured water depth (d) to
convert from excess activities to excess radium inventoriesper unit area of seabed. We assume that the shallow (<3 m)water column is well mixed.[23] 3. Divide the excess radium inventory for each time
step by the estimated residence time (t) to convert to radiumfluxes.[24] 4. Finally, divide this radium flux by the groundwater
end-member radium activity (Ragw) to convert to a water
Figure 2. Profile of (a) seafloor bottom and distributionof (b) salinity, (c) pH, (d) 224Ra, (e) 223Ra, (f) 226Ra, and(g) 222Rn along offshore transect from the study site. Errorbars reflect 1-s measurement uncertainties.
C09021 PETERSON ET AL.: SGD IN THE YELLOW RIVER DELTA
4 of 14
C09021

flux. This approach may be expressed by the followingequation:
SGD m=dayð Þ ¼Ratotal dpm m�3ð Þ � Rabkgd dpm m�3ð Þ� �
� d mð Þ� �
t daysð Þ*Ragw dpm=m3ð Þð2Þ
2.4. Radon Time Series Model
[25] The model used to quantify SGD using 222Rn isdescribed in detail by Burnett and Dulaiova [2003]. Briefly,each excess radon inventory (activity minus the radonsupported by dissolved 226Ra) is adjusted for atmosphericlosses [MacIntyre et al., 1995]. The changes in inventoriesbetween time steps are then taken to be the net radon fluxover each sample interval. The maximum negative fluxesare assumed to be a conservative estimate of offshoremixing losses. These mixing losses are then added backinto the radon flux, which is divided by the groundwaterradon activity to achieve an SGD flux for each time step.This model has proven effective in many different environ-ments, and therefore serves as a useful comparison [e.g.,Burnett et al., 2006b, 2007].
3. Results
3.1. Offshore Transport
[26] Horizontal transects of our tracers reveal some inter-esting patterns. Figure 2 shows the bathymetry (Figure 2a) aswell as the distribution of salinity (Figure 2b), pH (Figure 2c),radium isotope activities (Figures 2d, 2e, and 2f), and 222Rnactivity (Figure 2g) along our offshore transect in July 2007.These plots suggest that nearshore, a source of watercontributes relatively fresh water, with lower pH andgenerally higher radium content. According to the sampledgroundwater parameters shown in Table 1, most ground-waters have lower salinity and pH than the coastal waters.Also, water table contours on land [Chen et al., 2007;
Taniguchi et al., 2008] indicate flow in this direction.Therefore, groundwater seepage is likely in this coastalregion. The short-lived radium isotopes also reveal possiblegroundwater inputs around 7.5 km and between 10 and 12 kmoffshore.[27] Applying the model represented by equation (1) to
the radium transect results in a general increase in apparentradium ages in the offshore direction (Figure 3). For this
Table 1. All Groundwater Samples Collected for Radium Isotopesa
GroundwaterSample
DateSampled Location
ScreenedDepth (m)
Salinity(psu) pH
224Ra(dpm/m3)
223Ra(dpm/m3)
226Ra(dpm/m3)
222Rn(dpm/m3)
DO-34 18 Sep 2004 37�33.2680N, 118�43.6370E 3.0 3.0 6.34 1600 ± 120 69 ± 25 710 ± 110 -DO-33 18 Sep 2004 37�35.3570N, 118�32.5350E 12.0 0.7 6.15 441 ± 45 16 ± 10 32 ± 82 -N-10 18 Sep 2004 37�43.7370N, 118�45.8620E 4–10, 14–19 3.2 7.44 1620 ± 98 49 ± 18 440 ± 120 -N-10 8 May 2005 37�43.7370N, 118�45.8620E 4–10, 14–19 12.4 7.65 3170 ± 190 39 ± 13 726 ± 54 -N-8 8 May 2005 37�42.3440N, 118�53.2240E 1–6, 8–19 16.3 - 4100 ± 300 88 ± 20 685 ± 30 -N-12 22 Sep 2006 37�35.6980N, 118�43.6870E 20 55.0 6.96 2950 ± 210 102 ± 16 590 ± 21 -N-6b 19 Jul 2007 37�39.5310N, 118�55.7530E 2–6, 12–20 21.0 7.18 1900 ± 120 72 ± 16 189 ± 18 244,000 ± 23,000N-7b 19 Jul 2007 37�40.5910N, 118�53.9640E 1.5–7, 8–12,
16–209.1 7.19 2100 ± 120 31 ± 11 805 ± 80 390,000 ± 60,000
N-8b 19 Jul 2007 37�42.3440N, 118�53.2240E 1–6, 8–19 15.8 6.96 7180 ± 410 158 ± 21 344 ± 24 351,000 ± 21,000N-10b 19 Jul 2007 37�43.7370N, 118�45.8620E 4–10, 14–19 17.9 7.18 3060 ± 150 60 ± 12 950 ± 57 361,000 ± 22,000PW-1 20 Jul 2007 37�34.0540N, 118�59.2640E 0.5 - - - - - 127,000 ± 36,000PW-2c 20 Jul 2007 37�34.0540N, 118�59.2640E 0.5 27.1 7.1 15,000 ± 660 311 ± 52 780 ± 110 137,000 ± 48,000PW-3 20 Jul 2007 37�35.6050N, 119�02.3700E 0.5 - - - - - 226,000 ± 58,000PW-4a 22 Jul 2007 37�36.4320N, 119�00.8660E 0.5 28.3 7.15 4750 ± 270 217 ± 46 560 ± 120 193,000 ± 31,000PW-4b 22 Jul 2007 37�36.4320N, 119�00.8660E 0.5 - - - - - 192,000 ± 29,000PW-5 22 Jul 2007 37�36.2340N, 119�01.1970E 0.5 - - - - - 269,000 ± 30,000aSamples included in upper portion of table were collected from boreholes throughout the Yellow River delta. Samples named ‘‘PW’’ are collected pore
water samples from the study site. All radionuclide activities have been decay corrected to the time of sampling. Uncertainties shown are at the 1-s level.psu, practical salinity units.
bDenotes groundwater samples used to determine ARi and end-member values.cDenotes pore water sample used to determine uncertainty range in SGD.
Figure 3. Distribution of apparent radium ages offshorebased on the (a) 224Ra/223Ra AR and the (b) 224Ra/226Ra AR.Dashed lines represent the 95% confidence level of the linearregression. Transport rates are converted into units of cm s�1
from the reciprocal of the slope of the linear regression.
C09021 PETERSON ET AL.: SGD IN THE YELLOW RIVER DELTA
5 of 14
C09021

calculation, the initial AR was taken as the average AR ofthe saline groundwater wells sampled in 2007 (N-6 throughN-10; Table 1). Even if a different initial AR was chosen,the absolute ages would change but the trend offshorewould remain the same. We calculated radium ages onthe basis of both the 224Ra/223Ra AR (a; initial AR = 44.3)and the 224Ra/226Ra ratio (b; initial AR = 6.23) in Figure 3.Fitting a linear regression through these data yields a time-
integrated average horizontal transport rate of dissolvedsubstances in the surface water [Moore and Krest, 2004].The resulting transport rates of 4.7 and 3.3 cm s�1 based onthe inverse of the slope of the respective regression lines arenot significantly different. Peterson et al. (submitted man-uscript, 2008) determined that the coastal mixing rates offthe mouth of the Yellow River (1.4–1.6 cm s�1) did notvary significantly with river discharge within the range ofdischarges studied (81–568 m3 s�1), and concluded thatmixing was tidally driven. Because there are no othersignificant advective mixing forces in this study area, wefind that tidal forces must have an even greater effect attransporting dissolved substances offshore in the shallowtidal flats where this study was conducted.
3.2. Radium Time Series
[28] Radium samples were collected hourly for 25 hoursin September 2006 (TS-1) at a fixed location 1 km fromshore, and for 23 hours in July 2007 (TS-2) at anotherstation along the same line but located 2 km from shore.These sample sets are useful in that they are not simply asnapshot image of tracer concentrations at this site, butallow us to examine how the tracers behave over a completetidal cycle. One might expect, for example, to find thehighest SGD rates during low tide, as has been found inseveral other settings [e.g., Burnett et al., 2007; Swarzenskiet al., 2007b]. The low tides here during TS-1 correspondwith increases in salinity and pH (Figures 4a and 4b), so thecomposition of the enhanced SGD during low tide, asindicated by the peaks in radium (Figures 4c, 4d, and 4e),appears to be influenced by recirculated seawater and salinegroundwater. The peak salinity and pH values during thelow tides are very similar to those sampled offshore (>5 km,Figure 2).[29] The radium trends indicate input during the low/ebb
tides. Sharp peaks occur in the short-lived radium isotoperecord at the low tides, while the 226Ra tends to peak on thefalling tide. The model is based on calculating radiumfluxes, so the greatest change in inventories actually occursduring the downgoing tide. Because the tidal range in thisarea is nearly 2 m, this shallow environment is greatlyinfluenced by tidal forces.[30] The tracer record from TS-2 (Figure 5) shows little
temporal variability in the salinity record, but indicatesdecreases in pH corresponding with the low tides. Thesebehaviors suggest a more significant fraction of terrestrialwater in the discharging groundwater than that observedduring the 2006 time series when the salinity and pHincreased at low tide. This terrestrial component is notnecessarily fresher than the overlying water. Severalgroundwaters sampled (Table 1) show saline to hypersalineconditions while still maintaining relatively low pH.[31] The short-lived radium trends seen in these data are
similar to those from TS-1. All three radium isotopes showsharp increases at or shortly before low tide, i.e., generallyon the falling tides. Although 226Ra tended to precede theshort-lived radium peaks in TS-1, it behaved much morelike 223Ra and 224Ra during TS-2 by maintaining a baselineactivity throughout the high tides. One interesting observa-tion from these data, however, is that the radium peaksoccur during the falling tide, whereas the peaks in pHappear a few hours earlier in TS-2.
Figure 4. (right) Temporal variability of the water level aswell as (a) salinity, (b) pH, (c) 224Ra, (d) 223Ra, (e) 226Ra,and (f) 222Rn during TS-1 in September 2006. Error barsrepresent 1-s measurement uncertainties.
C09021 PETERSON ET AL.: SGD IN THE YELLOW RIVER DELTA
6 of 14
C09021

[32] We used the radium isotopic data with the modeldescribed in section 2.3 (equation 2) to quantify the ground-water discharge rates. The calculations are based on a unitarea of sea bottom, and give results in terms of specificfluxes (m3 m�2 d�1) or vertical velocities of the advectingwater (m d�1). Table 2 summarizes important parametersused in the calculations. The following section details each
of the calculations steps, as well as the choice of theparameters reported in Table 2.3.2.1. Adjust Measured Radium Activities forBackground Radium[33] The time series radium trends indicate that each
isotope achieves a baseline or ‘‘background’’ activitythroughout the tidal cycle, but always remains presentabove detection. We elect to use the lowest activity mea-sured for each radium isotope during the course of each timeseries sampling to represent this ‘‘background.’’ In otherwords, we interpret these activities as those that would bepresent with no SGD signal, i.e., 100% of the radium isderived from other sources such as desorption from particlesand shelf waters mixing into the sampling area. Using thelowest measured activity thus represents a conservativeestimate of the background activity, because these samplescould still contain some groundwater-derived radium. Theselected shelf background activities for TS-2 are uniformlylower than TS-1 (Table 2). This difference is likely areflection of its location being further offshore. Thesebackground values are subtracted from all other measure-ments within the time series to correct each sample for theshelf contribution to yield an excess radium activity.[34] Diffusive inputs from bottom sediments and desorp-
tion of radium from suspended sediments are alreadyconsidered when subtracting out the background activityas described above. These input rates are assumed to beuniform over time and space. There is no direct source ofsuspended sediments to our study site, so we assume thatthe suspended sediments in this area are derived fromresuspended bottom sediments and no further sedimentaryradium input corrections are necessary.3.2.2. Convert From Excess Radium Activity to ExcessRadium Inventory[35] In order to remove the effect of different water
depths associated with these samples, we multiply eachexcess radium activity concentration by the water depth atthe time of sampling to convert to an excess radiuminventory. This correction allows for a direct comparisonof the absolute radium activities per unit area of seabed.3.2.3. Divide the Excess Radium Inventories by theWater Residence Time[36] In order to convert excess inventories to a flux rate,
we must divide by the effective residence time of the coastal
Figure 5. Temporal variability of the water level (rightaxis) as well as (a) salinity, (b) pH, (c) 224Ra, (d) 223Ra,(e) 226Ra, and (f) 222Rn during TS-2 in July 2007. Errorbars represent 1-s measurement uncertainties.
Table 2. Radium Time Series Model Parameter Summarya
TS-1 (dpm m�3) Common (dpm m�3) TS-2 (dpm m�3)
Shelf Background Activity224Ra 625 77.8223Ra 24.7 1.5226Ra 143 28.8
Groundwater End-Member Radium Activity224Ra 3560223Ra 80226Ra 570
Pore Water End-Member Radium Activity224Ra 15,000223Ra 311226Ra 780
aThe values found in the central column between TS-1 and TS-2 arecommon to both time series.
C09021 PETERSON ET AL.: SGD IN THE YELLOW RIVER DELTA
7 of 14
C09021

waters. We elect to use an average apparent radium age ofthe waters sampled along the offshore transect based on the224Ra/226Ra AR (Figure 3). The measurement uncertaintyassociated with 226Ra (�10%) is much better than that of223Ra (�25%), so this provides the best residence timeestimate available (4.7 days).[37] While we think this is a reasonable estimate on the
basis of the data available, there are some uncertainties. Themodel used to calculate the apparent radium ages fromwater samples (equation 1) assumes only one source ofradium with a fixed isotopic composition. However, theoffshore radium trends reveal possible groundwater inputsaround 7.5 km and between 10 and 12 km offshore (Figure 2).If these are indeed related to groundwater inputs, our as-sumption would still hold as long as the radium signature isthe same. Unfortunately, we do not have any means to assesssuch variations at this time. In view of these difficulties, welater address the model effects of different effective residencetimes in a section on uncertainties (4.3).
3.2.4. Divide by the End-Member Value to ConvertInto a Water Flux[38] Table 1 presents a wide range in possible groundwa-
ter end-members found throughout the delta that couldconstitute the advecting groundwater fluids. Only smallvolumes (�10 L) of sediment pore water could be collectedfor radium analysis, so we feel that the large range found inpore water radium results are at least partially due toanalytical difficulties associated with insufficient samplevolumes. We have elected to use the average of the salinewells measured in July 2007 (N-6 through N-10). Thesewells are all directly up-gradient of the study site and werecollected immediately after one of our time series (TS-2), solikely represent the terrestrial source water component ofthe SGD. No detectable freshening of the surface watersduring the apparent discharge intervals of the time seriesoccurred, so the use of fresh groundwater end-members(e.g., wells sampled in 2004, Table 1) is not appropriate.The initial groundwater ARs used to find the radium ages
Figure 6. Radium time series results for SGD fluxes during (a) TS-1 and (b) TS-2 as well as thecorresponding water level recorded at the study site. Results from 224Ra are shown by the black circles,those from 223Ra are shown by gray squares, and those from 226Ra analysis are shown by white triangles.The results shown represent a three-point smoothing.
C09021 PETERSON ET AL.: SGD IN THE YELLOW RIVER DELTA
8 of 14
C09021
from the offshore transect are also based on the average ofthese selected groundwater samples.[39] Dividing the radium fluxes by the groundwater end-
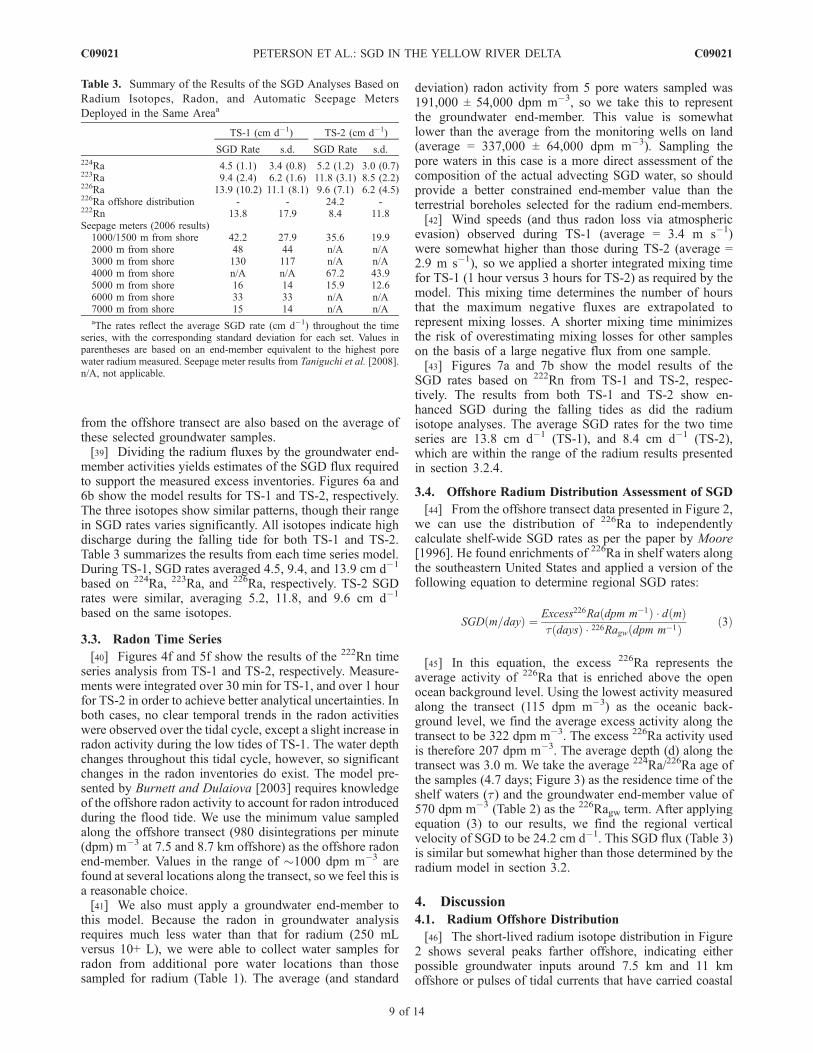
member activities yields estimates of the SGD flux requiredto support the measured excess inventories. Figures 6a and6b show the model results for TS-1 and TS-2, respectively.The three isotopes show similar patterns, though their rangein SGD rates varies significantly. All isotopes indicate highdischarge during the falling tide for both TS-1 and TS-2.Table 3 summarizes the results from each time series model.During TS-1, SGD rates averaged 4.5, 9.4, and 13.9 cm d�1
based on 224Ra, 223Ra, and 226Ra, respectively. TS-2 SGDrates were similar, averaging 5.2, 11.8, and 9.6 cm d�1
based on the same isotopes.
3.3. Radon Time Series
[40] Figures 4f and 5f show the results of the 222Rn timeseries analysis from TS-1 and TS-2, respectively. Measure-ments were integrated over 30 min for TS-1, and over 1 hourfor TS-2 in order to achieve better analytical uncertainties. Inboth cases, no clear temporal trends in the radon activitieswere observed over the tidal cycle, except a slight increase inradon activity during the low tides of TS-1. The water depthchanges throughout this tidal cycle, however, so significantchanges in the radon inventories do exist. The model pre-sented by Burnett and Dulaiova [2003] requires knowledgeof the offshore radon activity to account for radon introducedduring the flood tide. We use the minimum value sampledalong the offshore transect (980 disintegrations per minute(dpm) m�3 at 7.5 and 8.7 km offshore) as the offshore radonend-member. Values in the range of �1000 dpm m�3 arefound at several locations along the transect, so we feel this isa reasonable choice.[41] We also must apply a groundwater end-member to
this model. Because the radon in groundwater analysisrequires much less water than that for radium (250 mLversus 10+ L), we were able to collect water samples forradon from additional pore water locations than thosesampled for radium (Table 1). The average (and standard
deviation) radon activity from 5 pore waters sampled was191,000 ± 54,000 dpm m�3, so we take this to representthe groundwater end-member. This value is somewhatlower than the average from the monitoring wells on land(average = 337,000 ± 64,000 dpm m�3). Sampling thepore waters in this case is a more direct assessment of thecomposition of the actual advecting SGD water, so shouldprovide a better constrained end-member value than theterrestrial boreholes selected for the radium end-members.[42] Wind speeds (and thus radon loss via atmospheric
evasion) observed during TS-1 (average = 3.4 m s�1)were somewhat higher than those during TS-2 (average =2.9 m s�1), so we applied a shorter integrated mixing timefor TS-1 (1 hour versus 3 hours for TS-2) as required by themodel. This mixing time determines the number of hoursthat the maximum negative fluxes are extrapolated torepresent mixing losses. A shorter mixing time minimizesthe risk of overestimating mixing losses for other sampleson the basis of a large negative flux from one sample.[43] Figures 7a and 7b show the model results of the
SGD rates based on 222Rn from TS-1 and TS-2, respec-tively. The results from both TS-1 and TS-2 show en-hanced SGD during the falling tides as did the radiumisotope analyses. The average SGD rates for the two timeseries are 13.8 cm d�1 (TS-1), and 8.4 cm d�1 (TS-2),which are within the range of the radium results presentedin section 3.2.4.
3.4. Offshore Radium Distribution Assessment of SGD
[44] From the offshore transect data presented in Figure 2,we can use the distribution of 226Ra to independentlycalculate shelf-wide SGD rates as per the paper by Moore[1996]. He found enrichments of 226Ra in shelf waters alongthe southeastern United States and applied a version of thefollowing equation to determine regional SGD rates:
SGD m=dayð Þ ¼ Excess226Ra dpm m�1ð Þ � d mð Þt daysð Þ � 226Ragw dpm m�1ð Þ ð3Þ
[45] In this equation, the excess 226Ra represents theaverage activity of 226Ra that is enriched above the openocean background level. Using the lowest activity measuredalong the transect (115 dpm m�3) as the oceanic back-ground level, we find the average excess activity along thetransect to be 322 dpm m�3. The excess 226Ra activity usedis therefore 207 dpm m�3. The average depth (d) along thetransect was 3.0 m. We take the average 224Ra/226Ra age ofthe samples (4.7 days; Figure 3) as the residence time of theshelf waters (t) and the groundwater end-member value of570 dpm m�3 (Table 2) as the 226Ragw term. After applyingequation (3) to our results, we find the regional verticalvelocity of SGD to be 24.2 cm d�1. This SGD flux (Table 3)is similar but somewhat higher than those determined by theradium model in section 3.2.
4. Discussion
4.1. Radium Offshore Distribution
[46] The short-lived radium isotope distribution in Figure2 shows several peaks farther offshore, indicating eitherpossible groundwater inputs around 7.5 km and 11 kmoffshore or pulses of tidal currents that have carried coastal
Table 3. Summary of the Results of the SGD Analyses Based on
Radium Isotopes, Radon, and Automatic Seepage Meters
Deployed in the Same Areaa
TS-1 (cm d�1) TS-2 (cm d�1)
SGD Rate s.d. SGD Rate s.d.224Ra 4.5 (1.1) 3.4 (0.8) 5.2 (1.2) 3.0 (0.7)223Ra 9.4 (2.4) 6.2 (1.6) 11.8 (3.1) 8.5 (2.2)226Ra 13.9 (10.2) 11.1 (8.1) 9.6 (7.1) 6.2 (4.5)226Ra offshore distribution - - 24.2 -222Rn 13.8 17.9 8.4 11.8Seepage meters (2006 results)
1000/1500 m from shore 42.2 27.9 35.6 19.92000 m from shore 48 44 n/A n/A3000 m from shore 130 117 n/A n/A4000 m from shore n/A n/A 67.2 43.95000 m from shore 16 14 15.9 12.66000 m from shore 33 33 n/A n/A7000 m from shore 15 14 n/A n/AaThe rates reflect the average SGD rate (cm d�1) throughout the time
series, with the corresponding standard deviation for each set. Values inparentheses are based on an end-member equivalent to the highest porewater radium measured. Seepage meter results from Taniguchi et al. [2008].n/A, not applicable.
C09021 PETERSON ET AL.: SGD IN THE YELLOW RIVER DELTA
9 of 14
C09021

waters offshore. The relative amplitudes of these peaksbecomes more pronounced for the longer-lived isotopes(i.e., 224Ra < 223Ra < 226Ra), as is expected for aging watermasses, but we lack sufficient data to determine whetherthese peaks are due to local groundwater inputs or are theresult of coastal waters mixing offshore. Further investiga-tions at this and other study sites should look into thispossibility further, as done by Hancock et al. [2006].
4.2. Radon Results
[47] A possible source of error in the radon model used tofind SGD rates is that significant inputs of radon could befrom diffusion into the water column from the sediments.We have estimated this input by using an empirical equationreported by Burnett et al. [2003b] to relate the 226Ra contentin sediments (226Rased; units = dpm g�1) to the diffusiveflux of 222Rn:
222RnFlux dpmm�2d�1� �
¼ 495 � 226Rased þ 18:2 ð4Þ
[48] We have measured several sediment samples viagamma spectrometry, and found the average 226Ra activity
to be 1.62 dpm g�1 (Table 4). Applying equation (4),the corresponding 222Rn flux is thus 820 dpm m�2 d�1,or 34.2 dpm m�2 h�1. Assuming this system is in steadystate, we can find the 222Rn concentration supported bydiffusion in the water column by subtracting each calculatedhourly atmospheric flux from the diffusive flux, then dividingby the decay constant (0.0076 h�1) and by the average waterdepth for each measurement interval [Dulaiova et al., 2006].This calculation results in nearly every measurement intervalshowing a negative value for the supported 222Rn activity.Therefore, we conclude that on average, the atmosphericevasion losses are greater than the diffusive flux of radonfrom the bottom sediments, and as such, we can neglect thispossible source of 222Rn.[49] Mulligan and Charette [2006] have pointed out that
using 222Rn as a tracer to model SGD yields total dis-charge rates, because radon would be present in both theterrestrial component as well as the recirculated seawatercomponent of the discharging groundwater. Using radiumas the tracer, however, would only reveal the recirculatedseawater (saline) flow, as radium remains particle bound in
Figure 7. Results from the 222Rn SGD model for (a) TS-1 and (b) TS-2 as well as the correspondingwater level recorded at the study site. The results shown represent a five-point smoothing. Error barsshown are propagated errors throughout the model calculations.
C09021 PETERSON ET AL.: SGD IN THE YELLOW RIVER DELTA
10 of 14
C09021

freshwater. This theory agrees with our results and becausethe radium fluxes are as high or higher than those determinedfrom radon, the vast majority of SGD at our study sites iscomposed of recirculated seawater. The exception to this isthe 224Ra results during TS-1, when the radium result wasroughly one third of that determined by the radon.
4.3. Model Uncertainties
[50] The radium model results in section 3.2 show similarpatterns among the different isotopes, but the absolutefluxes determined by 224Ra are consistently lower thanthose found by 223Ra and 226Ra. This difference is likelya result of overestimating the shelf background 224Raactivity by using the lowest sampled activity during thetime series. If these lowest samples still contained a 224Racomponent from SGD, then we overcompensated andcaused the ultimate SGD fluxes to be too low.[51] This discrepancy may also be a result of our limited
selection of groundwater end-member values. While weare most confident that the saline groundwaters sampled inJuly 2007 represent the most likely end-member values,the sampled pore waters were consistently higher inmeasured radium activity. In order to assess the modeluncertainty due to end-member selection, we applied themodel using the highest pore water sample (PW-2; seeTables 2 and 3). The model results based on this end-memberare shown in Table 3. Using this extremely high pore watervalue as the end-member, the average SGD fluxes decreaseby 75% for 224Ra and 223Ra, and by 25% for 226Ra. Anothersource of uncertainty in the model involves diffusive inputsof radium to the water column as intertidal sediments areflooded during each high tide. We do not feel that thisprocess represents an important source of radium as the tidalvariations in 226Ra (too long-lived to regenerate on tidaltimescales) are about the same as the observed 224Ravariations.[52] One other source of uncertainty in the radium model
concerns the residence time of these coastal waters. We useda value of 4.7 days, based on the average 224Ra/226Ra agefrom Figure 3, but as detailed in section 3.2.3, severalsources of uncertainty exist in this calculation. If a longerwater residence time were used, for example the average224Ra/223Ra age from Figure 3 (5.3 days; an increase of13%), the modeled SGD rates would decrease by 11%.Using a shorter residence time (4.1 days; a decrease of13%), the corresponding modeled SGD rates wouldincrease by 15%.[53] Burnett et al. [2007] summarize the important uncer-
tainties behind the radon model used here. As with the
radium model, the most significant source of uncertaintylies with assigning an end-member value to the dischargingfluids. In addition, assessing the mixing losses of radon toboth the offshore waters and the atmosphere represent other,yet often less important, sources of uncertainty.
4.4. Comparison to Seepage Meters
[54] Table 3 indicates that our different geochemicaltracer analysis techniques for quantifying SGD rates arein reasonable agreement. We also have some estimatesbased on a completely independent approach. Figures 8a and8b contain data presented by Taniguchi et al. [2008] forautomatic seepage meter fluxes collected nearby and atthe same time as our TS-1 and TS-2 time series experi-ments, respectively. The seepage meter location duringTS-2 was 500 m inland of the tracer sampling location,whereas that corresponding with TS-1 was �50 m from oursampling station. Also, a Darcy’s Law hydrological calcu-lation of the terrestrial groundwater flow to the ocean inthis area using FEFLOW shows results ranging from 0.3to 5.8 cm d�1 (J. Z. Cheng, personal communication,2008).[55] Our interpretive SGD trends based on the radium
results agree very well with the seepage meter patterns forboth periods. The patterns based on the radon records alsoresemble those of the seepage meters, but with less smoothtrends. A disadvantage of seepage meters is that they canonly integrate over the small area of sea bottom they cover(�0.25 m2), but the chemical tracers integrate over anunknown yet much greater spatial range [Burnett et al.,2006b]. Nonetheless, the general agreement in patterns ofSGD between the tracer methods and the seepage metersprovides confidence in both approaches.[56] During the period of chemical tracer sampling of
TS-1, the seepage meter average SGD rate was high at42.2 ± 27.9 cm d�1 (Table 3), of which �3% was freshgroundwater discharge according to salinity measure-ments made inside the seepage meter chambers. Averag-ing the seepage meter fluxes over several days prior tothe tracer sampling provides an average SGD flux of20.7 ± 20.5 cm d�1, closer to our tracer-derived values.Seepage meter averages from other nearby locations duringTS-1 ranged from 15 to 130 cm d�1 [Taniguchi et al., 2008].[57] The average seepage meter flux during our sampling
of TS-2 was also high at 35.6 ± 19.9 cm d�1, of which about21% was fresh groundwater. The several day integratedaverage SGD based on this seepage meter was similar at41.9 ± 20.4 cm d�1. The fraction of fresh groundwater inthe SGD measured from the seepage meters indicates a
Table 4. Summary of 226Ra Content on Collected Sediments, Measured via Gamma Spectrometrya
Sediment Sample Name Collection Date Latitude Longitude Salinity (psu) 226Ra Activity (dpm g�1)
Yellow River Suspended 15 Sep 2004 37�45.6660N 119�09.3270E 0 2.23 ± 0.16Yellow River Bottom I 4 May 2005 37�45.6660N 119�09.3270E 0 1.36 ± 0.08Yellow River Bottom II 4 May 2005 37�45.6660N 119�09.3270E 0 1.39 ± 0.19Yellow River Bottom III 19 Sep 2006 37�45.6660N 119�09.3270E 0 1.49 ± 0.11TS-1 22 Sep 2006 37�36.5250N 119�00.5180E 28.6 1.97 ± 0.12Yellow River Bottom IV 19 Jul 2007 37�45.6660N 119�09.3270E 0 1.26 ± 0.15Average 1.62 ± 0.14
aAll samples except TS-1 were collected in the Yellow River, above the maximum salinity front. Uncertainties shown represent 1-s measurementuncertainties.
C09021 PETERSON ET AL.: SGD IN THE YELLOW RIVER DELTA
11 of 14
C09021

more pronounced recirculated seawater signal during TS-1than during TS-2. This was also supported by our timeseries pH and salinity measurements.[58] The seepage meter flux results are generally higher
than the results found from our independent radium isotopeand radon analyses. One possible reason for this differenceis that the SGD is dominated by recirculated seawater, witha short residence time in the subsurface. From data pre-sented by Taniguchi et al. [2008] on the basis of all theirseepage meter results in the area, the freshwater componentof SGD is never greater than 27%, and all but one sampleranged between 0.5 and 7.5%. If most of this water issimply recirculating through the sediments over a tidalcycle, it would not have sufficient time to fully equilibratewith the tracer concentrations in the aquifer. Therefore, thegroundwater end-members that were used in the modelsabove could be too high compared to their actual values,artificially lowering our modeled SGD rates. In addition, the222Rn pore water value is better constrained, lower than theborehole samples collected on land, yet produced SGD ratesthat were in the same range as the radium-based values.
4.5. Regional-Scale Fluxes
[59] Taniguchi et al. [2008] defined the offshore seepageface as being equal to a width of about 7 km, and used thelength of the Yellow River delta coastline (350 km) to scaleup their seepage results for comparison to the Yellow Riverdischarge. Using these same values, and conservativelyassuming that our lowest estimates of SGD (4.5 cm d�1
from the 224Ra model during TS-1; 5.2 cm d�1 from the224Ra model during TS-2) are uniform over this area, we finda total flow of approximately 1280 m3 s�1 during TS-1 and1480m3 s�1 during TS-2 around the YellowRiver delta, mostof which is likely recirculated seawater [Taniguchi et al.,2008]. For comparison, the Yellow River discharge duringthis time of year is around 600 m3 s�1. As these SGD fluxesare conservative values, the actual water exchange from SGDcompared to the Yellow River could be much higher.[60] As part of this study, nitrate was measured in the
groundwater wells and the Yellow River to assess relativefluxes to the Bohai Sea. The average NO3
� concentration inthe groundwater wells that we sampled for radium (N-6through N-10) was 440 mM and that in the Yellow River
Figure 8. Independent analysis of SGD by means of automated seepage meters, as summarized byTaniguchi et al. [2008] for the time during (a) TS-1 and (b) TS-2 chemical tracer sampling. Error barsrepresent standard deviation of all measurements recorded during each measurement interval (30 min).
C09021 PETERSON ET AL.: SGD IN THE YELLOW RIVER DELTA
12 of 14
C09021

was 430 mM (T. Z. Mi, personal communication, 2005).Multiplying these concentrations by the SGD fluxes yieldsnitrate fluxes 2 to 3 times higher than that delivered by theYellow River. Care must be taken in interpreting theseresults, however, because geochemical reactions often alterthe nutrient character of groundwater within the subterra-nean estuary [Santos et al., 2008; Spiteri et al., 2008].[61] Nonetheless, Chen et al. [2007] have found ground-
waters throughout the delta that are up to 1 order ofmagnitude enriched in nitrate concentration relative to thatof the Yellow River, so clear potential exists for SGD tosupply excess nitrate to the Bohai Sea. Previous studieshave found SGD to be an important nutrient source, even inriver-dominated regions, such as the Gulf of Thailand[Dulaiova et al., 2006]. Application of the offshore trans-port rates to the flux of nutrients from a coastal source (e.g.,SGD) can help assess whether the rates are sufficient totransport the nutrients offshore before uptake by primaryproductivity (Peterson et al., submitted manuscript, 2008).Increasing levels of dissolved inorganic nitrogen have beendocumented as occurring in the central Bohai Sea over thepast few decades [Zhang et al., 2004], so these results canhelp assess the source of the excess nitrogen.
5. Conclusions
[62] We have measured several groundwater tracers in anarea �40 km south of the Yellow River estuary to quantifySGD rates from offshore transects and time series analyses.Salinity and pH are useful tracers in this environment,showing increasing values in the offshore direction. Thegradient in apparent radium ages of the water masses withdistance from shore yields horizontal transport rates between3.3 and 4.7 cm s�1.[63] We show that using radium isotopes to assess SGD
rates via a stationary time series fashion is a valuableapproach. The results from the radium time series weresimilar to those using an established 222Rn model, andfollowed the patterns of SGD from seepage meter measure-ments. During September 2006, the average SGD ratesranged from 4.5 to 13.9 cm d�1, and the discharging waterwas composed primarily of recirculated seawater. The SGDrates found during July 2007 averaged between 5.2 and11.8 cm d�1, and apparently have a larger fraction ofterrestrial water. These fluxes and patterns are somewhatlower than those from individual seepage meters deployednearby but are similar to average rates reported fromseepage meters positioned in the same general area.[64] There are some uncertainties associated with the
radium time series model that we use to estimate theSGD fluxes. The most prominent of these uncertainties liesin the assignment of the appropriate groundwater end-member. If we use measured pore water radium activitiesas the end-member instead of the saline groundwaters, ourSGD fluxes decrease by 75% for 224Ra and 223Ra, and by25% for 226Ra. Other, more minor sources of uncertaintyfor the model involve the residence time of the coastalwaters and diffusive inputs from tidal inundation of inter-tidal sediments.[65] Scaling our SGD fluxes determined from the radium
isotopes to the whole Yellow River delta, we find estimatedSGD and nitrate fluxes 2–3 times that of the Yellow River.
We suspect that most of the regional SGD is composed ofrecirculated seawater. In fact, excessively high nitrate levelsin groundwaters have been measured around the delta, soNO3
� fluxes to the Bohai Sea from SGD are likely higherthan those from the Yellow River, at least during periods oflow river discharge.
[66] Acknowledgments. The authors thank Natasha Dimova for labassistance with this project. Many thanks are owed to Jianzhong Cheng,Songqing Zeng, and all the Chinese team for logistical field support. Wealso thank two anonymous reviewers for their insightful comments. Thiswork was funded and coordinated by the Project on Yellow River Studiesled by Yoshihiro Fukushima through the Research Institute for Humanityand Nature. Additional support was provided by a National ScienceFoundation grant (OCE0350514) to W.C.B.
ReferencesBeck, A. J., J. P. Rapaglia, J. K. Cochran, and H. J. Bokuniewicz (2007),Radium mass-balance in Jamaica Bay, NY: Evidence for a substantialflux of submarine groundwater, Mar. Chem., 106(3 – 4), 419 – 441,doi:10.1016/j.marchem.2007.03.008.
Beck, A. J., J. P. Rapaglia, J. K. Cochran, H. J. Bokuniewicz, and S. Yang(2008), Submarine groundwater discharge to Great South Bay, NY, esti-mated using Ra isotopes, Mar. Chem., 109(3–4), 279–291, doi:10.1016/j.marchem.2007.07.011.
Burnett, W. C., and H. Dulaiova (2003), Estimating the dynamics ofgroundwater input into the coastal zone via continuous radon-222 mea-surements, J. Environ. Radioact., 69(1–2), 21–35, doi:10.1016/S0265-931X(03)00084-5.
Burnett, W. C., G. Kim, and D. Lane-Smith (2001), A continuous monitorfor assessment of 222Rn in the coastal ocean, J. Radioanal. Nucl. Chem.,249(1), 167–172, doi:10.1023/A:1013217821419.
Burnett, W. C., H. Bokuniewicz, M. Huettel, W. S. Moore, and M. Taniguchi(2003a), Groundwater and porewater inputs to the coastal zone, Biogeo-chemistry, 66(1/2), 3–33, doi:10.1023/B:BIOG.0000006066.21240.53.
Burnett, W. C., J. E. Cable, and D. R. Corbett (2003b), Radon tracing ofsubmarine groundwater discharge in coastal environments, in Land andMarine Hydrology, edited by M. Taniguchi, K. Wang, and T. Gamo,pp. 25–42, Elsevier, New York.
Burnett, W. C., H. Dulaiova, C. Stringer, and R. Peterson (2006a), Sub-marine groundwater discharge: Its measurement and influence on thecoastal zone, J. Coastal Res., 39, 35–38.
Burnett, W. C., et al. (2006b), Quantifying submarine groundwater dis-charge in the coastal zone via multiple methods, Sci. Total Environ.,367(2–3), 498–543, doi:10.1016/j.scitotenv.2006.05.009.
Burnett, W. C., I. R. Santos, Y. Weinstein, P. W. Swarzenski, and B. Herut(2007), Remaining uncertainties in the use of Rn-222 as a quantitativetracer of submarine groundwater discharge, in A New Focus on Ground-water-Seawater Interactions, edited by W. Sanford et al., IAHS Publ.,312, 109–118.
Burnett, W. C., R. Peterson, W. S. Moore, and J. de Oliveira (2008), Radonand radium isotopes as tracers of submarine groundwater discharge —Results from the Ubatuba, Brazil SGD assessment intercomparison,Estuarine Coastal Shelf Sci., 76(3), 501 –511, doi:10.1016/j.ecss.2007.07.027.
Charette, M. A. (2007), Hydrologic forcing of submarine groundwater dis-charge: Insight from a seasonal study of radium isotopes in a ground-water-dominated salt marsh estuary, Limnol. Oceanogr. Methods, 52(1),230–239.
Charette, M. A., and M. C. Allen (2006), Precision groundwater samplingin coastal aquifers using a direct push shielded-screen wellpoint system,Ground Water Monit. Rem., 26(2), 87 – 93, doi:10.1111/j.1745-6592.2006.00076.x.
Chen, J. Y., M. Taniguchi, G. Liu, K. Miyaoka, S.-I. Onodera, T. Tokunaga,and Y. Fukushima (2007), Nitrate pollution of groundwater in the YellowRiver delta, China, Hydrogeology, 15(8), 1605–1614, doi:10.1007/s10040-007-0196-7.
Dulaiova, H., and W. C. Burnett (2004), An efficient method for g-spectro-metric determination of radium-226,228 via manganese fibers, Limnol.Oceanogr. Methods, 2(1), 256–261.
Dulaiova, H., W. C. Burnett, G. Wattayakorn, and P. Sojisuporn (2006), Aregroundwater inputs into river-dominated areas important? The ChaoPhraya River –Gulf of Thailand, Limnol. Oceanogr. Methods, 51(5),2232–2247.
Hainbucher, D., W. Hao, T. Pohlmann, J. Sundermann, and S. Feng(2004), Variability of the Bohai Sea circulation based on model calcula-
C09021 PETERSON ET AL.: SGD IN THE YELLOW RIVER DELTA
13 of 14
C09021

tions, J. Mar. Syst., 44(3 – 4), 153 – 174, doi:10.1016/j.jmarsys.2003.09.008.
Hancock, G. J., I. T. Webster, and T. C. Stieglitz (2006), Horizontal mixingof Great Barrier Reef waters: Offshore diffusivity determined fromradium isotope distribution, J. Geophys. Res., 111, C12019, doi:10.1029/2006JC003608.
Hu, C., F. E. Muller-Karger, and P. Swarzenski (2006), Hurricanes, sub-marine groundwater discharge, and Florida’s red tides, Geophys. Res.Lett., 33, L11601, doi:10.1029/2005GL025449.
Kim, G., W. C. Burnett, H. Dulaiova, P. Swarzenski, and W. Moore (2001),Measurement of 224Ra and 226Ra activities in natural waters using aradon-in-air monitor, Environ. Sci. Technol., 35(23), 4680 – 4683,doi:10.1021/es010804u.
Kim, G., J.-W. Ryu, H.-S. Yang, and S.-T. Yun (2005), Submarine ground-water discharge (SGD) into the Yellow Sea revealed by 228Ra and 226Raisotopes: Implications for global silicate fluxes, Earth Planet. Sci. Lett.,237(1–2), 156–166, doi:10.1016/j.epsl.2005.06.011.
Li, Y.-H., and L.-H. Chan (1979), Desorption of Ba and 226Ra from river-borne sediments in the Hudson estuary, Earth Planet. Sci. Lett., 43(3),343–350, doi:10.1016/0012-821X(79)90089-X.
MacIntyre, S., R. Wanninkhof, and J. P. Chanton (1995), Trace gasexchange across the air-sea interface in freshwater and coastal marineenvironments, in Biogenic Trace Gases: Measuring Emissions from Soiland Water, edited by P. A. Matson and R. C. Harris, pp. 52–97, BlackwellSci., Boston, Mass.
Michael, H. A., A. E. Mulligan, and C. F. Harvey (2005), Seasonal oscilla-tions in the water exchange between aquifers and the coastal ocean,Nature, 436(7054), 1145–1148, doi:10.1038/nature03935.
Moore, W. S. (1996), Large groundwater inputs to coastal waters revealedby 226Ra enrichments, Nature, 380(6575), 612 – 614, doi:10.1038/380612a0.
Moore, W. S. (2000), Ages of continental shelf waters determined from223Ra and 224Ra, J. Geophys. Res., 105(C9), 22,117 – 22,122,doi:10.1029/1999JC000289.
Moore, W. S., and R. Arnold (1996), Measurement of 223Ra and 224Ra incoastal waters using a delayed coincidence counter, J. Geophys. Res.,101(C1), 1321–1329, doi:10.1029/95JC03139.
Moore, W. S., and J. Krest (2004), Distribution of 223Ra and 224Ra in theplumes of the Mississippi and Atchafalaya rivers and the Gulf of Mexico,Mar. Chem., 86(3–4), 105–119, doi:10.1016/j.marchem.2003.10.001.
Moore, W. S., and D. F. Reid (1973), Extraction of radium from naturalwaters using manganese-impregnated acrylic fibers, J. Geophys. Res.,78(36), 8880–8886, doi:10.1029/JC078i036p08880.
Mulligan, A. E., and M. A. Charette (2006), Intercomparison of submarinegroundwater discharge estimates from a sandy unconfined aquifer,J. Hydrol., 327(3–4), 411–425, doi:10.1016/j.jhydrol.2005.11.056.
Nozaki, Y., Y. Yamamoto, T. Manaka, H. Amakawa, and A. Snidvongs(2001), Dissolved barium and radium isotopes in the Chao PhrayaRiver estuarine mixing zone in Thailand, Cont. Shelf Res., 21(13–14),1435–1448, doi:10.1016/S0278-4343(01)00023-1.
Santos, I. R., W. C. Burnett, J. P. Chanton, B. Mwashote, I. G. N. A.Suryaputra, and T. Dittmar (2008), Nutrient biogeochemistry in a Gulfof Mexico subterranean estuary and groundwater-derived fluxes to thecoastal ocean, Limnol. Oceanogr. Methods, 53(2), 705–718.
Slomp, C. P., and P. Van Cappellen (2004), Nutrient inputs to the coastalocean through submarine groundwater discharge: Controls and potentialimpact, J. Hydrol., 295(1–4), 64–86, doi:10.1016/j.jhydrol.2004.02.018.
Spiteri, C., C. P. Slomp, K. Tuncay, and C. Meile (2008), Modeling bio-geochemical processes in subterranean estuaries: Effect of flow dynamicsand redox conditions on submarine groundwater discharge of nutrients,Water Resour. Res., 44, W02430, doi:10.1029/2007WR006071.
Swarzenski, P. W., C. Reich, K. D. Kroeger, and M. Baskaran (2007a), Raand Rn isotopes as natural tracers of submarine groundwater discharge inTampa Bay, FL, Mar. Chem., 104(1–2), 69–84.
Swarzenski, P. W., F. W. Simonds, A. J. Paulson, S. Kruse, and C. Reich(2007b), Geochemical and geophysical examination of submarinegroundwater and associated nutrient loading estimates into Lynch Cove,Hood Canal, WA, Environ. Sci. Technol., 41(20), 7022 – 7029,doi:10.1021/es070881a.
Taniguchi, M., and T. Iwakawa (2001), Measurements of submarinegroundwater discharge rates by a continuous heat - type automated see-page meter in Osaka Bay, Japan, J. Groundwater Hydrol., 42, 271–277.
Taniguchi, M., T. Ishitobi, J. Chen, S.-I. Onodera, K. Miyaoka, W. C.Burnett, R. Peterson, G. Liu, and Y. Fukushima (2008), Submarinegroundwater discharge from the Yellow River delta to the Bohai Sea,China, J. Geophys. Res., 113, C06025, doi:10.1029/2007JC004498.
Wang, Q., X. Guo, and T. Kidetaka (2007), A numerical study on theseasonal variation of Yellow River plume path in the Bohai Sea, paperpresented at 3rd International Workshop on Yellow River Studies, Res.Inst. for Humanity and Nat., Kyoto, Japan.
Yu, L. (2006), The Huanghe (Yellow) River: Recent changes and its coun-termeasures, Cont. Shelf Res., 26(17–18), 2281–2298, doi:10.1016/j.csr.2006.07.026.
Zhang, J., Z. G. Yu, T. Raabe, S. M. Liu, A. Starke, L. Zou, H. W. Gao, andU. Brockmann (2004), Dynamics of inorganic nutrient species in theBohai seawaters, J. Mar. Syst., 44(3 – 4), 189 – 212, doi:10.1016/j.jmarsys.2003.09.010.
�����������������������W. C. Burnett, R. N. Peterson, and I. R. Santos, Department of
Oceanography, Florida State University, Tallahassee, FL 32306-4320, USA.([email protected]; [email protected]; [email protected])J. Chen, School of Geography Sciences and Planning, Sun Yat-sen
University, Xingang West Road 135, Guangzhou 510275, China. ([email protected])T. Ishitobi and M. Taniguchi, Research Institute for Humanity and
Nature, 335 Takashima-cho, Kamigyo-ku, Kyoto 602-0878, Japan.([email protected]; [email protected])
C09021 PETERSON ET AL.: SGD IN THE YELLOW RIVER DELTA
14 of 14
C09021