Multiple Stressor Effects of Radon and Phthalates in Children
Upload
khangminh22Category
view
4download
0
NATL INST. OF STAND & TECH R.l.C.
I ii PUBLICATIONS
NTSTre ^^00
MEASUREMENT AND DETERMINATIONOF RADON SOURCE POTENTIAL
A LITERATURE REVIEW
Allan B. Tanner
Consulting Geophysicist
Building and Fire Research LaboratoryGaithersburg, Maryland 20899
ISIISTUnited States Department of CommerceTechnology Administration
Institute of Standards and Technology
100
.U56
1994
#5399


NISTIR 5399
MEASUREMENT AND DETERMINATIONOF RADON SOURCE POTENTIAL
A LITERATURE REVIEW
Allan B. Tanner
Consulting Geophysicist
April 1994
Building and Fire Research Laboratory
National Institute of Standards and Technology
Gaithersburg, MD 20899
U.S. Department of CommerceRonald H. Brown, Secretary
Technology Administration
Mary L. Good, Under Secretaryfor Technology
National Institute of Standards and Technology
Arati A. Prabhakar, Director

3*-m
I I «5£2 aixaiM _r
1% V"
sa
MOiTAMiMHanraa qma TuaMsauzAaMrfl jAiTviaroa -aojiuoa. mogah- -ao
WHIVH^ aHUTAH3TU A
»9.J-4
iV
I''. I',
m-Vkv''
- m
.
j-' ,rifV" '^.’‘..^'fc
“ Ps
r ‘''.!!L' ‘fy.'
'.
', 'X'A*•V^A'
‘V
cii -
PV’
'^l-
i.-ifm
n>11
'
-* .
fKiiftiCK^J imH Uiift
’ ’ mtK CIM eporfwii^
^ '‘*1
l*K' ^
,**,'• »1'.f* ‘ij
iWd
AI
'.
iw/
>r: .V
90mttiao3 to 'liiiiiv>iM|99 *2*U
^[nAvt>i2 ,|wo^ .H tooo^
'ibow ,f4yw*
wsannia ^inl*^^ .A i»eiA
*'''(Hi
'
, 'V" Jfc

ABSTRACT
Radon source potential may be estimated for areas of a nation, state, county,
housing development, or building lot. The critical characteristics of the soil
are its radium concentration, emanation coefficient, permeability to gas, and
diffusion coefficient for radon under typical conditions. Best estimates of
these critical characteristics are applied to a scheme for obtaining a tiered
ranking of subareas of the area of interest (radon potential mapping), or to
a model for obtaining a single qualitative or quantitative estimate of the
radon source potential of a single site (site-specific characterization). This
report summarizes and evaluates available information on radon potential
mapping and site-specific characterization. More than 100 reports have been
found that bear on radon potential mapping, and indicate fair to good
agreement with indoor radon results where correlations have been possible.
Because site-specific characterization is not generally cost effective, it has not
been extensively tested; however, it can readily discriminate the order of
magnitude of indoor radon concentration to be expected in the absence of
special measures to prevent radon infiltration. Several situations are proposed
as being appropriate for its use.
Keywords: building technology; diffusion; indoor radon; permeability;
predictive methods; pressure-driven flow; radium activity
concentration; radon availability; radon potential mapping; site-
specific characterization; soil testing.
m

I1/ frj
M-,-.•-
'
t' A SaJL^P?v'4. "•.A^. -^TOAsrraaA
"'
f:..
’<
%> "X
,\^yo3 ToJ faai8^ ^xm toMjiioiit aotoH®®^£io« ddJ \o a>hthiwarJl^^ art" Jol jolfed w ‘ ki rbfl^ Ul a^a
^ ealfirniSa itMbaiad fi gmaifcidd tori 0$
01 10 ,{%axqqAm iBOct^ioq a«^ lo gmataat
^d! V) 3^i5ixiii«a a^eidtxai^ "to gniistodo ’tol f ^aiffT .(nobBxrfa;lo^^ la
' 1 Ijiimsiioq nobn oo odfiAMal aldsto\m noqat^ Jj;;
i as9d avBri aJxfKpi 001 fifidl baa gniqqamfi?*
^ boog oJ lUEds aiaoUMl |>a^ iaditajoq ^f .aldiagoq oaad avsd ae?oij«iaT»(K>
ffio ^fid ti ti^oa vliaiaiiag loa f aodExiiaJ^j^iadD o asiiiiNwifl^
ifB , >0 tabto adJ ^ d,>iQWttOd
tT-111', j
'^4'
:a^lo'^)0a«dfi adn id id' oi abmtoiiQqoiqm ^tiunii qoibari toviiiq Ubaqa
Mhii-
m
.^riV^msmoq ;«k^ toobai $nibliifd jdbwr^(Ji^4 tmMmi ;woB la^/rdj^iafasiq a ^
^:^®aaaJ ilo«m ‘ :j^~
%
Pi ..W
% Lli'.^,'
W4
%J IV
'.1 ^ *1

TABLE OF CONTENTS
ABSTRACT iii
EXECUTIVE SUMMARY vii
1. INTRODUCTION 1
2. RADON POTENTIAL MAPPING 2
2.1. Map Scales 2
2.2. Radium and Radon Data 3
2.3. Permeability Data 4
2.4. Radon Diffusivity Data 5
2.5. Indoor Radon Data 5
3. CORRELATION AND VERIFICATION 9
4. SITE-SPECIFIC CHARACTERIZATION OF RADON SOURCEPOTENTIAL 14
4.1. Methods and Instrumentation 12
4.1.1. Surrogate Methods 12
4.1.2. Soil-Probe Methods 13
4.1.3. Laboratory Methods 18
4.2. Discussion 19
4.3. Cost-Benefit Considerations for Site-Specific Characterization 21
4.4 Recommendations 22
5. ACKNOWLEDGMENTS 24
6. REFERENCES CITED 25
7. APPENDIX A. BIBLIOGRAPHY OF MEASUREMENT ANDDETERMINATION OF RADON SOURCE POTENTIAL 43
8. APPENDIX B. LIST OF PERSONS OR INSTITUTIONS PRESENTLYOR RECENTLY ENGAGED IN RESEARCH RELATED TOMEASUREMENT AND DETERMINATION OF RADON SOURCEPOTENTIAL OF SITES OR AREAS 180
V

LIST OF TABLES
TABLE I: DESIRED AND SURROGATE CHARACTERISTICS FORRADON POTENTIAL MAPPING AT SEVERAL MAPSCALES 7
TABLE II: RADON POTENTIAL MAPPING AND CORRELATIONEFFORTS 9
M

EXECUTIVE SUMMARY
For a year or two after the discovery, in December 1984, of very high concentrations of
radon and its decay products in houses, there was considerable interest in finding out where
the "high radon areas" or the "hot spots" were in the United States. A need was also voiced
for a method to assess the inherent ability of the ground at a proposed construction site to
supply the structure with unacceptable amounts of radon. As a 148-Bq/m^ (4-pCi/L)
guideline became a rigid de facto standard in the real estate industry, as mitigation costs
decreased, and as fairly inexpensive ways were found to prepare a new house for mitigation
should it be found necessary, interest in preconstruction testing waned. However, as
research on the influence of the soil and geological substratum progressed in many studies,
it was shown that areas of various extent could be evaluated for their indoor radon
potential. Such evaluations allow authorities to use their resources to better advantage.
The mapping of radon potential of county and larger-sized areas has been undertaken for
about 100 areas in the nation.
Both radon potential mapping and preconstruction site testing require an evaluation of the
concentration of radon in soil pores and the mobility of radon in the soil. In turn, radon
mobility is determined by its ability to diffuse through the soil and by the permeability of
the soil to gas movement. Two of the three critical characteristics, radon concentration in
soil pores and permeability, can be measured directly in situ, or estimated from laboratory
measurements on soil samples. The third, radon diffusivity, can be estimated from soil
moisture and density measurements made either in situ or on soil samples in the laboratory.
These procedures are practical for testing a specific site, such as a building lot or
development. For radon potential mapping of larger areas, direct measurements are
generally impractical, and it is necessary to estimate the same factors indirectly from soil
and climatic characteristics—surrogates—that are correlated with the critical characteristics.
This report lists surrogate characteristics that are commonly available in data bases for areas
of different sizes. Also contained in the report is a compilation of radon potential mappingefforts and studies to determine the degree to which indoor radon measurements correlate
with radon potential estimates based on soil characteristics. Radon potential estimates have
in general correlated satisfactorily with indoor radon measurements.
Determination of radon source potential of building-lot or neighborhood size is still at an
experimental stage. The approaches range from the same surrogate methods as used in
radon potential mapping to computer-assisted modeling of soil air flow and radon entry
based on arrays of test holes. Some approaches are clearly suited for research only, and
others have practical applications. In the United States even the simple, surrogate approach
is not often sought, because it requires expert knowledge, and, like those approaches
requiring on-site or laboratory determinations, is seen as more expensive than preparing a
new structure for mitigation if it should be required.
vu

Six situations are proposed that could favor site characterization:
(1) The architectiu-al design of an unusual house would be compromised by the
usual means of providing a centrally located subslab vent pipe stub in the foundation or
vertical piping to the roof. A site test could indicate whether such measures would be very
likely unnecessary, necessary, or that some unusual custom approach toward radon-resistant
construction would be necessary.
(2) The owner desired a passive-vent design, which is likely to be successful only
if a modest reduction of indoor radon is needed. The site test could indicate the degree of
reduction needed.
(3) The local building code required testing for commercial buildings, government
required testing for public buildings, or public school policy required pre-construction
testing.
(4) Builders of developments in areas where mapping or site-specific testing
indicated low radon source potential could save enough money by neglecting radon-resistant
construction on all houses to more than compensate for mitigation of a few houses that did
not pass indoor radon tests after construction.
(5) A builder contested the high-risk classification of a site of his interest and
wished to obtain a more reliable site-specific characterization that might justify less
expensive construction.
(6) Uninhabited areas presumed on the basis of geological data to have very high
indoor radon potential could be tested in advance, and local authorities could be forewarned
if the tests verified the geologic estimate. Such areas could then be flagged as requiring
special measures if building permits were requested for them.
Before site-specific characterization can be used, (1) greater field validation is needed for
both in situ and laboratory methods, and (2) a recognized protocol and associated equipment
for site-specific characterization prior to construction must be available.
The report concludes with an extensive annotated bibliography and a list of persons andinstitutions currently or recently engaged in characterization of radon source potential of
sites, especially sites of building-lot or development size.
viii

1 . INTRODUCTION
Until the late 1970s it was a common impression among people involved with radiation
protection that if a house contained concentrations of radon (^^Rn) significantly greater
than were found in the outdoor atmosphere, it was probably due to exhalation of radon
from radium (^^Ra) contained in the materials used in the house’s construction, or from soil
artificially contaminated by radium. This view changed when investigators in Sweden and
Canada found that elevated concentrations of airborne radon in some dwellings could be
due mainly to infiltration of radon from naturally distributed radium in soils [Akerblom and
Wilson, 1981; Swedjemark, 1982; Swedish Radon Commission, 1983; DSMA Atcon, Ltd.,
1983]. Questions arose immediately as to how severe and widespread such indoor radon
problems might be, and a systematic method of locating areas of high indoor radon
potential^ was seen to be an important objective. It also appeared desirable to be able to
predict the likely indoor radon concentrations in buildings before their construction, in order
to anticipate the need for radon-resistant construction, and to avoid the considerably greater
cost of post-construction mitigation. Although geological reasons could be found to explain
elevated indoor radon levels, there was some doubt that geological and soil characteristics
of areas, particularly of building-lot size, could be used to predict the approximate levels of
indoor radon [Sachs et aL, 1982].
The early investigations established that very high indoor radon levels are almost always
caused by a combination of elevated radon concentrations in the interstitial gases in the soil,
sufficient permeabihty of soil to permit easy movement of those soil gases to a house
foundation, and cracks or other openings in the foundation to allow pressure-driven flow of
the soil gases into the house [Nero and Nazaroff, 1984]. Later studies have indicated that
molecular diffusion of radon through the soil pores [Tanner, 1991c] or through someconcretes [Holub et aL, 1985; Arvela and Winqvist, 1989; Borak et aL, 1992; Rogers and
Nielson, 1992] is sometimes sufficient to cause moderately elevated indoor radon
concentrations.
In order to assess the radon source potential of a site or area of any size, one should
evaluate the concentration and diffusivity of radon in the soil pores, and the permeability
of the soil to gas flow. Some methods further attempt to evaluate the resistance of specific
structures to radon entry and/or the efficiency of radon removal by ventilation, thus
estimating the radon concentration to be expected in the structures. Such "predictive"
^"Indoor radon potential" is a term commonly used to indicate the indoor radon
concentration expected to be found in structures built on the characterized area using
standard construction practice. The classification may be according to a "high," "normal,"
or "low" ranking, or may be a quantitative estimate by methods discussed in Section 4.
Because of variation in soil characteristics, in design of the structures, and in the care of
construction, the radon concentrations in the actual structures are usually found to follow
a log-normal probability frequency distribution approximately.
1

methods have fallen generally into two categories: radon potential mapping and site-specific
classification. For radon potential mapping, geological and soil characteristics of areas
ranging in size from a few km^ to those comprising broad physiographic provinces (such as
coastal plains or mountain ranges) are used to estimate the radon source potential of
subareas, usually in three to five tiers. Site-specific classification is based on in situ
measurements and/or laboratory analyses of soil samples from a site. The soil permeability
and soil-gas radon concentration and diffusivity data that are needed for estimation of radon
source potential are not usually available for small areas, and are very rarely available for
areas of county or larger size; consequently, radon potential mapping requires the judicious
selection of geologic^ and soil characteristics that are available as data sets and that can
be used as surrogates for the actual quantities needed. Site-specific methods apply to such
local areas that it is practical to measure the needed quantities; the challenge then is to
make measurements that accurately represent the site conditions at the time of the
measurements, to devise means of correcting the results to typical conditions, and to use the
results in a model that reliably assesses the radon source potential of the site. These steps
need to be practical for a radon diagnostician or geotechnical engineer to accomplish
quickly with equipment of moderate cost.
During the development of predictive methods since the late 1970s, hundreds of thousands
of indoor radon measurements have been made in Europe, Canada, the United States, and
to a lesser extent in other areas of the world. Scott [1992] contends that the existing indoor
radon data are adequate to estimate radon potential, and that the cost of incorporating into
new construction those elements of radon mitigation that are expensive to retrofit has beenreduced to the point where site-specific methods are not cost effective. Although these
contentions are valid under many and perhaps most circumstances, I believe that both radon
potential mapp ig and site-specific methods can meet needs for which existing and even
future indoor radon dati. je not likely to be adequate.
This report is intended to give a survey of radon potential mapping at various map scales,
to present site-specific methods in detail, to present annotated bibliographic references to
the methods and closely related topics (Appendix A), and to list persons known to have
participated in current or recent research in radon potential mapping, site-specific methods,
instrumentation, or closely allied topics (Appendix B).
2. RADON POTENTIAL MAPPING
The purpose of radon potential mapping is to rank parts of a geographical area, usually the
jurisiction of a local, state, or federal government, so as to be able to make the most
effective use of resources in locating buildings with elevated indoor radon and to anticipate
future indoor radon problems in areas that are not currently inhabited. In Sweden, radon
potential maps are used to advise builders whether radon-proof, radon-resistant, or normal
construction methods should be used, corresponding to "high," "normal," or "low" ranking of
the radon potential of the land. Building-code requirements for radon-resistant construction
in high-radon areas have been considered in at least two of the United States On July 1,
2

1993, the State of Washington implemented prescriptive building-code requirements for
radon-resistant construction for single-family dwellings and the first-floor units of multi-
family dwellings, and special requirements for new construction in eight counties rated as
high radon potential counties [Coleman, 1993]. The State of Florida has a program of
research into mitigation methods, construction standards, and radon potential assessment
methods [Sanchez et al, 1991].
2.1. Map Scales
The scale of a map is the ratio of the distance between two points on the map to the
distance on the Earth between the two points. If the ratio is very small, the distance on the
map is very small, and the map is said to be of "small scale,” and conversely. Thus, a mapof the nation will necessarily be a small-scale map, and a map of a neighborhood will
probably be at fairly large scale. It should be obvious that a small-scale map cannot present
house-to-house, neighborhood-to-neighborhood, or county-to-county variations in average
radon potential, yet many people try to estimate whether they are in a radon-prone area on
the basis of a national map. In fact, few areas of the United States are of such uniformly
low or high radon potential as to justify using a map of small scale for such purposes.
Washington [1988] found that uranium deposits in metamorphic rocks in southern Vermontwere so localized that surveys employing sampling on a statistically based grid generally
failed to find them.
The map scale determines what data bases will be available to compile a radon potential
map, and consequently which surrogate characteristics to choose for the soil characteristics
that are actually needed [Owen, 1989]. Table I lists the desired and surrogate characteristics
that may be practical at several map scales.
2.2. Radium and Radon Data
At the smaller map scales, the primary source of information about the radium
concentration in the topmost 20 to 30 cm of soil is the group of surveys made by means of
Y-ray spectrometers flown at a nominal height of 122 m during the National Aerial
Radiometric Reconnaissance part of the Energy Research and DevelopmentAdministration/Department of Energy National Uranium Resource Evaluation (NURE)Program of the late 1970s and early 1980s. One form of data representation is a mapshaded by dots proportional in radius to the average activity of 20 km x 20 km areas
[Revzan et al 1988; Nazaroff et aL, 1988; Nazaroff, 1992]. After considerable reprocessing
to reconcile discrepancies, the data have been compiled by Duval et al [1989] as colored
maps showing near-surface equivalent uranium concentration in color-coded increments of
0.5 parts per million; the national map has been released in the form of a photographic
shde. Although the NURE program covered nearly all the contiguous United States and
half of Alaska, the flight line spacing was generally 5 to 10 km, yielding information about
less than 10 and 5 percent, respectively, of the ground. Because of this limited coverage,
areas as large as 8 km in diameter may be completely unevaluated, and use of the aerial
3

data for radon potential mapping at typical eastern county and neighborhood scales is not
justified. In some areas where the flights were made at flight-line spacing of less than 2 km,
the data can be useful at county scales.
Aeroradiometric data are in some places adequate in themselves as a basis for radon
potential mapping. For instance, Kline et al [1988] stated that spectral y-ray aerial surveys
of Fairfax County, Virginia, and Montgomery County, Maryland were better correlated with
indoor radon than were radon potential maps based on geology and soil characteristics. It
is plausible that aeroradiometric surveys are sufficient for ranking radon potential where
other factors are fairly uniform. In general, however, substantial variation of critical factors
such as permeability, degree of soil saturation, depth of snow cover, topographic relief, or
strong biological activity may interfere with good correlation between y-ray flux density from
the ground surface and radon source potential. In the Pacific Northwest, Duval and Otton
[1990] found that townships having predominantly gravelly or coarse-grained soils had a
significantly higher frequency of houses containing elevated radon than other townships
showing similar y-radiation intensities to the airborne spectrometer. Biological activity
can generate organic compounds that create very unequal radium distribution among the
several soil layers [Greeman et al, 1990], so that the surface y radiation may not be a
satisfactory indicator of the radium activity at basement slab depth, where most of the
indoor radon source radium is located.
In those areas where the soil is so thin that buildings rest on or within less than a meter of
bedrock, or where the soil is developed from bedrock, the conventional geologic maps can
be used as indicators of radium concentration. In many areas, notably those of glacial till
and flood or coastal plains, the bedrock may be unrelated to the soil above, and invalid for
evaluating radium concentration; see Fakundiny et al [1988], Gates et al [1992], and
Gundersen [1993].
In the smaller counties, it may be practicable to survey y radiation by means of carbomespectrometers. Soil samples may be obtained and analyzed for radium; some of the samples
should tested to determine the typical emanation coefficient of the soils (the fractional
release adon to the soil pores). A more direct approach is to measure the radon content
of soil ^as along traverses across the major soil units of the county by means of
reconnaissance methods [Reimer, 1990, 1991].
At the neighborhood scale, direct measurement of radon in soil gas, either to establish
characteristic values for the local soil units or to survey the area in a systematic grid,
appears to be the most accurate method. By the reconnaissance technique, a combinedsampling and analytical cost in time of about a quarter-hour is much less than that of soil
sampling, transportation, and laboratory analysis by y-ray spectrometry and suitable
occasional measurements of emanation coefficient. Gamma-ray spectrometry in boreholes,
although seldom used, is faster, but does not discriminate between mobile and fixed ^Rn.Surveys by hand-held y-ray survey meters can help to lay out the survey pattern for
sampling, but are much less accurate than information derived from boreholes, especially
4
if most structures will have basements and if the soil has been transported from its original
source.
2.3. Permeability Data
In order for soil or rock permeability to be significant in the transport of radon to building
foundations, the soil or rock must be well drained, a condition that is common but not
universal. It is therefore necessary to consider not only whether a soil type (at any scale)
comprises coarse and medium grains, without substantial silt and clay, but also whether the
terrain is well drained over the area of consideration. At small and medium map scales, soil
maps often describe the drainage characteristics of soil units; those characterized as "well
drained" or "excessively drained" generally meet both requirements. Nielson and Rogers
[1992] have provided typical diffusion and permeability coefficients as functions of soil
textural class and typical matric (capillary) potential, which can be used in conjunction with
soil maps to estimate these critical variables in the absence of specific data for an area of
interest.
At medium scale, soil and engineering geology maps may carry both drainage and
permeability information, and may show soils that are seasonally permeable because of
shrinkage of certain clayey soils—otherwise impermeable—during dry periods. Compilations
of water percolation tests may be available. In connection with hydrologic maps showing
the depth to the water table, and topographic maps showing slopes from which runoff,
drainage, and proportions of fines may be inferred, they provide a basis for estimating the
areas of significant permeability. Also important are areas of permeability inversion, where
a less permeable B soil horizon^ overlies a significantly permeable and generally well-
drained C horizon at the level of the slabs of buildings with basements. Under such
conditions, "earth breathing," caused by the rise and fall of barometric pressure, can route
soil-air flow more easily through boreholes or wells than through the B horizon [Thomas et
oL, 1992].
In addition to the data above, water-well logs, road cuts, and trenches are useful at a local
scale. Soil-probe permeability measurements and permeability estimates based on grain-size
distribution, described later with site-specific methods, also become practicable.
Soil is typically layered. A topsoil layer containing the most organic matter is often
present and is designated the "A horizon"; it is usually fairly permeable. The next layer, the
"B horizon," contains the greatest proportion of clay minerals and is relatively impermeable.
The "C horizon" below it it a transition zone between the soil and the underlying bedrock
and may contain rock fragments; it is usually significantly more permeable than the Bhorizon. Soil scientists recognize several subdivisions of these horizons. The A horizon is
not always developed and is sometimes missing because of erosion.
5
2.4. Radon Diffusivity Data
Radon diffusivity data are not mapped at any scale, and are not practical to measure in situ.
However, radon diffusion in soils can be adequately characterized on the basis of the
fractional water saturation of the soil and its porosity [Rogers et aL, 1984; Rogers and
Nielson, 1991]. In comparison with the ranges of the other variables in the determination
of radon source potential, soil porosity is not highly variable. The radon diffusion length
in a dry soil is reduced by about two orders of magnitude when the soil is nearly saturated
with water. The problem is then one of assessing the typical degree of saturation of soils,
which depends on climate, drainage, and ht inherent water retentivity of the various soil
types. Although grain and pore size aie very important with respect to soil permeability and
not important with respect to radon diffusivity, the same considerations noted above
concerning drainage are of use in estimating both permeability and radon diffusivity.
At small scale, the national maps of climate, and national, regional, and state maps of soils
can be used to estimate precipitation and its retention by fine and clayey soils. At county
scale, more specific precipitation data and soil and engineering geology maps may be
available. In addition to these data, results of nearby site investigations may be available
for neighborhood radon potential mapping.
2.5. Indoor Radon Data
Whether or not indoor radon data are available in sufficient density to eliminate the
apparent need for radon potential mapping, they are useful in providing a "calibration" of
the assessments of particular soil units, and in calling attention to some characteristics of
soil units that may not have been mapped. Conversely, within areas of no radon problems
found by indoor radon testing, radon potential mapping may find local subareas of distinctly
different characteristics and possibly much greater indoor radon potential.
At small scale, the very large data base of indoor radon measurements, although subject to
bias because of non-random motivations for the tests, provides a general picture of the
susceptitviilty of different subareas to indoor radon problems, and a calibration of radon
potential mapping of physiographic provinces and major soil units. The data furnished by
commercial testing services are usually linked to postal zone codes, which may cover several
disparate radon potential units and give increasingly misleading comparisons at progressively
larger map scales. Some states and counties have indoor data that are located with
sufficient accuracy to permit correlation with specific soil units or geologic features such as
shear or fracture zones.
The U.S. Environmental Protection Agency conducted a cooperative program with many of
the states to make indoor measurements designed in part to test the principles of radon
potential mapping. As a result, U.S.E.P.A.-sponsored radon potential mapping has beenaccomplished by the U.S. Geological Survey and the state geological agencies for nearly all
the United States [Schumann, 1993a-k, 1994].
6

Table I: DESIRED AND SURROGATE CHARACTERISTICS FOR RADONPOTENTIAL MAPPING AT SEVERAL MAP SCALES
Desired Characteristic Map Scale Surrogate Characteristic
Radon concentration Sm2ill (state Near-surface radium concentration by aerial survey of
in soil gas or nation) 7 rays
Typical radium concentration of rock type indicated by
geologic map if soil is absent or derived from substrate
Medium(county)
Same as above
Near-surface radium concentration by carborne survey of
7 rays
Radium content of soil samples
Radon content of soil gas obtained by reconnaissance
technique
Large
(neighbor-
hood)
Radon content of soil gas
Radium content of soil samples, corrected for emanation
coefficient
Ground-based surveys of ^^‘^Bi gamma radiation
Typical radium concentration of rock type indicated by
geologic map if soil is absent or derived from substrate
Significantly high soil Small (state Soil types characterized as well or excessively drained on soil
permeability or nation) maps
Extensive areas of gravels, coarse or medium sands, or deep
saprolites indicated on soil maps
Medium(county)
Same as above
Engineering geology maps giving soil drainage, permeability
information, depth to bedrock, and susceptibility to soil
expansion and shrinkage
Soil maps giving drainage and permeability data for soil units
Percolation test results
Hydrologic maps showing depth to water table
Topographic maps showing slopes
7

Desired Characteristic Map Scale Surrogate Characteristic
Significantly high soil
permeability
(continued)
Large
(neighbor-
hood
Same as above
Water well logs
Soil-probe data
Geologic maps showing shear zones, fracture zones, and
medium-to-coarse glacial and alluvial deposits
Radon diffusivity in
soil and rock
Small (state
or nation)
Climatic maps showing degree of aridity (as an index of soil
moisture)
Soil maps (as an index of water-retentive clays)
Medium(county)
Soil maps (as an index of water-retentive clays)
En^eering geology maps showing drainage and depth to
water table
Precipitation data
Large
(neighbor-
hood)
Same as above
Geologic maps showing shear zones, fracture zones, and
medium-to-coarse glacial and alluvial deposits
Results of nearby site investigations (water retention, fracture
systems, permeability inversions)
Indoor radon data Small (state
or nation)
Commercial contractor zip-coded data
State radon data bases
U.S. E.PA. data
Medium(county)
County radon records
Large
(neighbor-
hood)
Same as above
Local contractor knowledge
News stories
8

3. CORRELATION AND VERIFICATION
Since the late 1970s, numerous efforts at radon potential mapping have been made, some
of which permit comparison of indoor radon measurements with soil characteristics and
other geologic features. The scope, intentions, and subjects of these investigations have
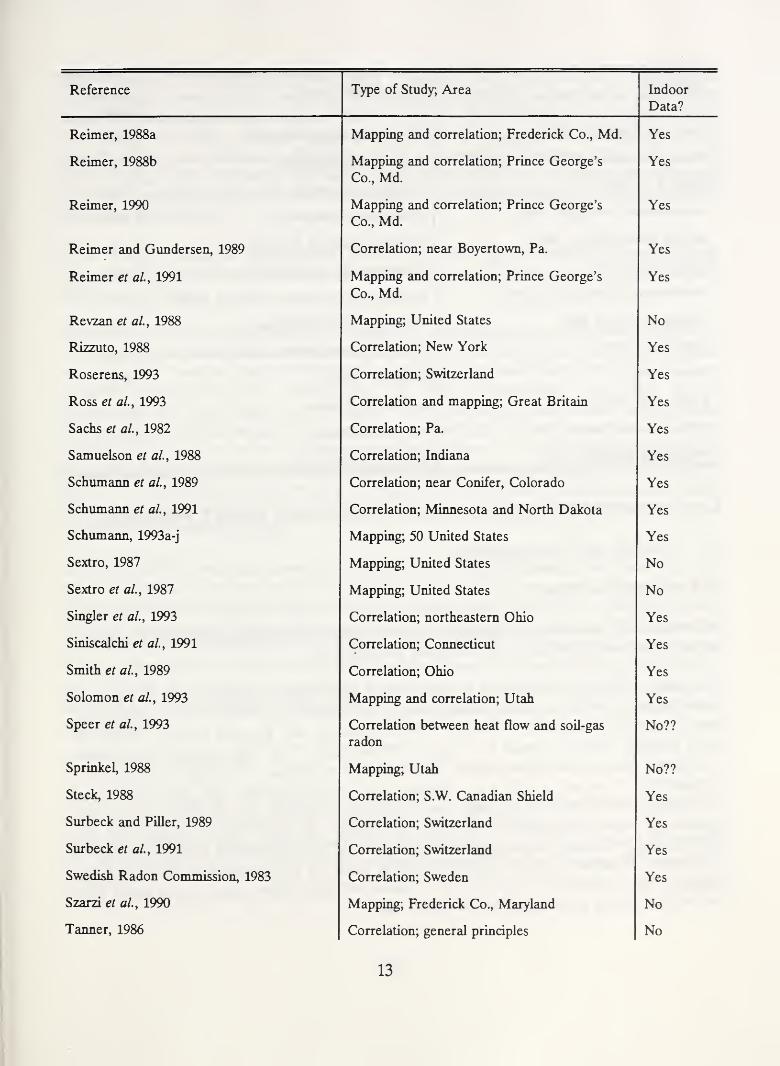
been quite varied. Table 11 provides a listing of references to these investigations and some
indication of their scope. The column for "Indoor Data?" indicates whether results of indoor
radon testing are included in the study; a double query indicates that indoor data may have
been used, but are not cited. For further detail, see the references in Appendix A.
The correlation studies have generally shown satisfactory correlation between geology and
indoor radon. Nearly all indoor radon surveys have yielded approximately log-normal
probability frequency distributions. There is consequently much overlap of indoor radon
values among subareas of different radon potential, as demonstrated by the frequency
distributions for each of the five tiers classified by Otton et aL [1988b] for Fairfax County,
Virginia. Although each subarea included most of the range of indoor radon values, the log-
normal parameters of geometric mean (median) and geometric standard deviation for each
of the classified areas were different.
TABLE II: RADON POTENTIAL MAPPING AND CORRELATION EFFORTS
Reference Type of Study, Area Indoor
Data?
Agard and Gundersen, 1991 Correlation; Boyertown and Easton, Pa. Yes
Akerblom, 1986 and 1987 Research and mapping; Sweden Yes
Akerblom, Andersson, and Clavensjo, 1984 Correlation; several localities near Stockholm Yes
Akerblom and Wilson, 1981 Mapping; Sweden No
Barnet, ed., 1991 Mapping and correlation; Czech Republic Yes
Been, Reimer, and Szarzi, 1989 Mapping; Prince Georges Co., Md. Yes
Been, Szarzi, and Reimer, 1989 Mapping; Frederick Co., Md. No
Brookins, 1986 Correlation; Albuquerque, N.M., and vicinity Yes
Brooks, 1989 Correlation; Maryland Yes
Buchli and Burkart, 1989 Correlation; Switzerland Yes
Burnett et al.y 1989 Correlation; Florida Yes
Carlisle and Azzouz, 1991, 1993 Correlation; southern California Yes
Castrdn, 1990 Correlation; Finland Yes
Castr6n et al., 1985 Correlation; Finland Yes
9

Reference Type of Study; Area Indoor
Data?
Castr6n et al, 1987 Correlation; Finland Yes
Castr^n et al^ 1991 Mapping; Finland Yes
Cattafe et al^ 1989 Mapping and correlation; New Jersey Yes
Chadima, 1989 Mapping; South Dakota No
Clavensjo et al.y 1983 Research and correlation; Sweden Yes
Cui, 1990 Mapping; Salt Lake City area, Utah No
Czarwinski et al.y 1993 Correlation, mapping; southeastern Germany Yes
Damkjaer and Korsbech, 1988 Correlation; Denmark Yes
Dron, 1993 Correlation in elevated areas; Great Britain Yes
Dulaney, 1992 Mapping and correlation; New Mexico Yes
Duval, 1989 Mapping; United States Yes
Duval, 1991 Correlation; New Jersey Yes
Duval and Jones, 1988 Mapping; Midwest No
Duval, Jones, Otton, 1989 Mapping; Pacific Northwest Yes
Duval, Jones, Riggle, Pitkin, 1989 Mapping; United States No
Duval and Otton, 1990 Mapping and correlation; Pacific Northwest Yes
Fakundiny et al., 1988 Mapping; New York State Yes
Fisher, 1978 Mapping; Florida Yes
Fitzpatrick-Lins et al.y 1990 Mapping; United States Yes
Flood et al.y 1990 Mapping; Oklahoma No??
Friedmann, 1993 Correlation and mapping; Austria Yes
Frishman et al., 1993 Mapping (Rn-in-water potential); Colorado Yes
Frohlich and Pearson, 1988 Mapping; Rhode Island No
Goodknight and Peake, 1988 Mapping; southeastern United States Yes
Grace, 1989 Correlation; southern Michigan Yes
Grasty, 1989 Correlation; Canada Yes
Grodzins et al.^ 1991 Correlation; Maine Yes
Gross and Sachs, 1982 Correlation; Pennsylvania Yes
Gundersen, 1989 Correlation; United States Yes
Gundersen, 1991 Correlation; Pa., Va., Md., NJ. Yes
10

Reference Type of Study, Area Indoor
Data?
Gimdersen, 1993 Correlation; eastern United States Yes
Gundersen, Peake et al, 1991 Correlation; Tex., Ala., NJ. Coeistal Plain Yes
Gimdersen, Reimer, emd Agard, 1988 Correlation; Pennsylvania Yes
Gimdersen, Reimer et al, 1988 Mapping; Montgomery Co., Maryland Yes
Gimdersen, Schumann et al, 1991 Mapping; United States Yes
Hand, 1988 Correlation; Onondaga Co., N.Y. Yes
Haque and Halls, 1993 Correlation; Great Britain Yes
Harrell and Kumar, 1988 Correlation; northeastern Ohio Yes
Hawthorne et al., 1984 Correlation; eastern Tennessee Yes
Jacobs et al., 1993 Correlation; southeastern Wisconsin No
Keller and Schiitz, 1988 Correlation; southwestern Germany Yes
Kline et al, 1988 Correlation; Va. and Md. Yes
Kothari, 1983 Correlation; United States Yes
Kullman, 1993 Correlation and mapping; Sweden Yes
Laymon and Kunz, 1991 Correlation; Onondaga Co., N.Y. Yes
Laymon et al., 1990 Correlation; New York Yes
Lehtoviita et al, 1985 Correlation; Finland Yes
Lilley et al., 1988 Correlation; New York Yes??
Lively and Steck, 1991 Correlation; Minnesota Yes
Lloyd, 1983 Correlation; Butte, Montana Yes
Lombardi and Etiope, 1993 Correlation; Italy No??
Matz, 1993 Correlation; Albuquerque, New Mexico Yes
McFarland, 1991 Correlation; Kentucky Yes
McLaughlin, 1987 Correlation; Ireland Yes
McLemore and Hawley, 1988 Mapping; New Mexico No??
McLemore et al., 1991 Mapping and correlation; New Mexico Yes
Miles, 1993 Correlation, general principles; Great Britain Yes
Moed et al., 1984 Mapping; California and Pacific Northwest No
Morley et al., 1991 Correlation; British Columbia, Canada Yes
Moschandreas and Rector, 1982 Correlation; Pennsylvania Yes
11

Reference Type of Studjr, Area Indoor
Data?
Mose, Chrosniak, and Mushnish, 1989 Correlation; eastern United States Yes
Mose, Mushnish, and Kline, 1988 Correlation; Va. and Md. Yes
Mushrnsh and Mose, 1988 Correlation; Metropolitan D.C. Yes
Nason and Cohen, 1987 Correlation; United States Yes
Nazaroff et ai, 1988 Mapping; United States No
Nero et al., 1993 Correlation and mapping; Minnesota Yes
Ogden et al.y 1987 Correlation; Idaho Yes
Otton, 1987 Mapping; United States No
Otton, 1988 Mapping and correlation; Fairfax Co., Va. Yes
Otton, 1989a,b Mapping; United States No
Otton and Asher-BoUnder, 1993 Correlation; Fla., Guam, Caribbean Yes
Otton and Duval, 1991 Mapping and correlation; Pacific Northwest Yes
Otton and Gundersen, 1988 Mapping; Va. and Md. Yes
Otton, Schumann, Owen, Chleborad, 1988 Mapping; Colorado No
Otton, Schumann, Owen, Thurman, Duval,
1988
Mapping; Fairfax Co., Va. Yes
Owen, 1989 Mapping; United States No
Padovani and Malisan, 1993 Correlation; Italian kindergartens Yes
Peake, 1988a,b Mapping; United States No
Peake, 1990 Mapping; United States No
Peake et «/., 1988 Correlation; E. and S. U.S. Coastal Plain Yes
Peake and Gundv.sen, 1989 Correlation; E. and S. U.S. Coastal Plain Yes
Peake and Rush, 1988 Mapping; United States No
Peake et al., 1991 Mapping and correlation. United States Yes
Peake and Schumann, 1991 Correlation; United States Yes
Phillips et al., 1991 Correlation; United States Yes
Podsednik, 1991 Mapping and correlation; McLennan Co.,
Tex.
No
Poffijn et al., 1993 Correlation and mapping; Vis6, Bel^um Yes
Ranger, 1993 Correlation; Atlanta region, Geor^a Yes
Reesman, 1988 Mapping; Tennessee No
12
Reference Type of Study, Area Indoor
Data?
Reimer, 1988a Mapping and correlation; Frederick Co., Md. Yes
Reimer, 1988b Mapping and correlation; Prince George’s
Co., Md.Yes
Reimer, 1990 Mapping and correlation; Prince George’s
Co., Md.Yes
Reimer and Gimdersen, 1989 Correlation; near Boyertown, Pa. Yes
Reimer et ai, 1991 Mapping and correlation; Prince George’s
Co., Md.Yes
Revzan et al, 1988 Mapping; United States No
Rizzuto, 1988 Correlation; New York Yes
Roserens, 1993 Correlation; Switzerland Yes
Ross et al.^ 1993 Correlation and mapping; Great Britain Yes
Sachs et al., 1982 Correlation; Pa. Yes
Samuelson et al, 1988 Correlation; Indiana Yes
Schumann et al, 1989 Correlation; near Conifer, Colorado Yes
Schumann et al., 1991 Correlation; Minnesota and North Dakota Yes
Schumann, 1993a-j Mapping; 50 United States Yes
Sextro, 1987 Mapping; United States No
Sextro et al, 1987 Mapping; United States No
Singler et al., 1993 Correlation; northeastern Ohio Yes
Siniscalchi et al, 1991 Correlation; Connecticut Yes
Smith et al., 1989 Correlation; Ohio Yes
Solomon et al., 1993 Mapping and correlation; Utah Yes
Speer et al., 1993 Correlation between heat flow and soil-gas
radon
No??
Sprinkel, 1988 Mapping; Utah No??
Steck, 1988 Correlation; S.W. Canadian Shield Yes
Surbeck and Filler, 1989 Correlation; Switzerland Yes
Surbeck et al., 1991 Correlation; Switzerland Yes
Swedish Radon Commission, 1983 Correlation; Sweden Yes
Szarzi et al., 1990 Mapping; Frederick Co., Maryland No
Tanner, 1986 Correlation; general principles No
13

Reference Type of Study, Area Indoor
Data?
Terry and Shumeyko, 1988 Correlation; Bergen Co., NJ. Yes
Thomas and Hollis, 1988 Correlation; Connecticut Yes
Ulbak et al., 1988 Correlation; Denmark Yes
van Assendelft and Sachs, 1982 Correlation; Pennsylvania Yes
van den Boom and Ort, 1991 Mapping; Thuringia, Germany No
Verger et ai, 1993 Correlation and mapping; France Yes
Voutilainen and M^elainen, 1991 Mapping and correlation; Tampere, Finland Yes
Vulcani and Wood, 1993 Mapping; southern Michigan Yes
Wanty et al^ 1990 Mapping and correlation; United States Yes
WUson, 1984 Mapping; Sweden No??
Wilson, 1985-1986 Correlation; Sweden Yes
Wollenberg and Revzan, 1990 Mapping; California No
Wollenberg and Smith, 1984 Mapping; western U.S. No
4. SITE-SPECIFIC CHARACTERIZATION OF RADON SOURCE POTENTIAL
4.1. Methods and Instrumentation
4.1.1. Surrogate Methods
In Scandinavia, the surrogate approach to radon potential mapping is also used to estimate
the radon source potential at an individual building site.
Established correlations between rock/soil types and indoor concentrations of radon or
radon progeny serve in Sweden to classify the site as "high-risk," "low-risk," and "normal-risk,"
based upon the expectation that the ^Rn content of soil gas will exceed 50 kBq/m^
(1351 pCi/L), will not exceed 10 kBq/m^ (270 pCi/L), or wiU fall between those limits,
respectively (see several references by Akerblom and colleagues). A similar ranking of the
permeability of the soil modifies the risk category: highly permeable soil rates an increase
of one step in the risk category, and a soil of low permeability, such as a clayey "moraine"
(glacial till) rates a decrease of one step. Estimation of radon risk is required for newconstruction in Sweden, and an appropriate degree of radon resistance in the construction
is advised. Akerblom [1993] stated that in 14 years of site evaluation and radon risk
mapping there had been no reports of new houses with high indoor radon levels which were
the result of faulty evaluations of the radon risk.
14

In Finland, radon potential mapping relies principally on a very extensive data base of
indoor radon measurements, which is used to encourage local authorities to concentrate
indoor air sampling in areas already known to have higher incidence of elevated indoor
radon [Castren, 1987]. Prognosis maps also consider permeability and composition of the
glacial till that predominates in Finland, and the composition of bedrock [Voutilainen and
M^el^en, 1991]. Although the radon source potential of sites is apparently estimated
from the prognosis maps, research is in progress on site characterization by means of soil
sampling (see below).
In the United Kingdom, indoor survey results are used to guide further surveys, although
some efforts are underway to develop radon potential mapping and site-specific techniques
[BaU et al, 1991].
The State of Florida’s Department of Community Affairs has for several years undertaken
a substantial program of research [Sanchez et al, 1991] with the objective of classifying land
as is done in Sweden, but with substantial additional measurements of soil radium or
uranium concentration, soil permeability, soil radon concentration, and other factors
[Nielson et aL, 1991; Nielson and Rogers, 1992]. Building codes would have specific
requirements for radon resistance, depending upon the high, normal, or low radon potential
ranking of the land on which a building was to be constructed. It has been proposed that,
as an alternative to following the appropriate building code requirement, a builder might
perform a site-specific test according to a yet-unspecified protocol and be exempted from
the more stringent requirements of the code if the test indicated that the radon potential
of the site had been overrated.
LeGrand [1987] developed a predictive model for site-specific classification based on rock
type, topographic slope and vertical emplacement of building (height of building in ground
contact on one side), hydrogeologic setting and average water-table position, and water-table
behavior and characteristics. Each factor is given a scale-of-ten ranking. The scores are
combined by a formula and further adjusted for construction characteristics. The adjusted
score is compared with a five-tiered table giving the degree of expectation that indoor radon
in a building on the site will exceed the action level of 148 Bq/m^ (4 pCi/L). No field
measurements are specified for the predictive model, but geologic and hydrologic data are
prerequisites.
4.1.2. Soil-Probe Methods
Probes ("emanometers") for extracting soil gas for ^Rn analysis in connection with uranium
exploration date to the early 1950s and even to the 1930s in the Soviet Union. Their use
in Sweden for determining soil-gas radon concentrations is described by Hesselbom [1985]
and by Akerblom et al, [1990]. Rector [1992] reviewed soil-gas radon measurementmethods.
15

lindmark and Rosen, of the Swedish Geotechnical Institute, described the use of soil probes
for radon extraction and the importance of air permeability and water saturation of the soil
in estimating radon potential [1985]. Permeabihties were judged by correlation with soil
type.
Scott developed the first system for assessing both radon concentration and soil permeability
[DSMA Atcon, Ltd., 1983], and a method for using the values obtained to yield a numerical
predictive measure of indoor radon concentration at a site. Soil-gas radon production was
to be determined by a gamma-ray spectrometric method appropriate to the area to be
evaluated. It was assumed that the emanation coefficient is constant at about 0.35 to 0.4
for moist soils. Soil permeability was determined by injection of air through a soil probe
into the ground under known conditions of pressure and flow rate. Formulation of a
"Radon Index Number" (RIN) evolved to be RIN=hE/(-logio K), where h is the average
ventilation period of a house, E is the radon emanation rate in the soil, and K is the
reciprocal of the soil permeability [Eaton and Scott, 1984]. Units of radon activity
concentration per length (Bq/m) can be inferred from their paper.
Workers at the University of California’s Lawrence Berkeley Laboratory modified the Scott
approach by using a single 1-cm-diameter probe, forced into a pre-drilled borehole, for both
extraction of soil gas for on-line radon an^ysis and injection of air or suction of soil gas for
permeability determination [R.G. Sextro, oral communication, 1986; Turk et al, 1987]. For
a model basement house having a crack along the perimeter of the basement slab, numerical
modeling and computation yielded the radon entry rate as a function of six dimensionless
parameters. By converting the data for a particular site to dimensionless form, the
sustainable steady-state radon entry rate can be estimated for a house at the site [Nazaroff
and Sextro, 1989; Nazaroff, 1992].
On the basis of measurements made in U.S. Environmental Protection Agency programs,
Peake [1988c] proposed a "radon entry efficiency" parameter (REE), equal to the percentage
ratio of the indoor radon concentration to the radon concentration in soil gas. The indoor
measurement was specified as being taken at the lowest level under closed-house, winter
conditions, and the soil-gas sampling point was specified at 1-m depth, 3-5 m from the
house. For prediction, it was suggested that typical values of the REE for houses with
basements would be in the range »0.3-0.7%, that the REE for slab-on-grade houses wouldbe lower, and the REE for houses with dirt floors would be higher. No formal allowance
was made for soils of unusually low or high permeability, or for average soil moisture
content.
Turk et oL [1990] defined a "soil gas entry potential" and a "^Rn entry potential" for the
purpose of computing radon entry into a structure from measurements of the pressure field
in the ground outside the foundation and flow rates and pressure drops across the structure
shell with test holes open and closed. The method, developed as a diagnostic procedure to
guide mitigation, does not appear to be suitable for preconstruction site characterization.
16

Kunz also modified the Scott approach by using the same probe for extracting soil gas for
radon analysis and for determining permeabihty by suction instead of injection. Using
primarily data obtained in high-permeability gravels near Albany, New York, Kunz
formulated a radon index number ("RIN," different from that of Eaton and Scott)
proportional to the radon concentration in the soil gas, the square root of the measured
permeability, and a factor related to the depth to water or bedrock; the proportionality
constant is empirically derived [Kunz, 1988a,b; Kunz et al, 1989a,b]. The units of this RINcan be inferred to be Bq/m^.
Carlisle and Azzouz [1991, 1993] adopted the Kunz formulation of a radon index number
for evaluation of soil-gas ^^Rn concentrations obtained from 75-cm depth by the slim
reconaissance probe of Reimer [1990], and permeability calculated from grain size
distribution in a study of an area between Santa Barbara and Los Angeles, California. Nomoisture corrections were appHed. A regression curve of indoor radon concentrations vs.
soil-gas radon concentrations yielded a correlation coefficient r = 0.709; a similar
comparison of indoor radon vs. RIN gave r = 0.826.
Probe systems derived from the Kunz apparatus have been used extensively by the U.S.
Environmental Protection Agency and its contractors. A commercial system is offered
[Nielson et al, 1989]. In some early tests by an EPA contractor, the soil-gas radon
concentrations and the measured permeabihties were used with an arbitrary standard
diffusion coefficient to yield a radon availabihty number partly in accordance with the
Tanner [1988b] protocol described below. Other data obtained with the EPA apparatus
have not apparently been combined to yield a numerical evaluation, such as one of the
radon index numbers, but a system of protocols for obtaining soil characteristics and
computational models have been developed [see several papers by Nielson and others in
Appendix A].
A probe invented by Hassler [1940] for extraction of soil gas for hydrocarbon analysis, and
adapted by Tanner [1957] for uranium exploration, is the basis for a protocol developed by
Tanner [1988a,b]. A hole is angered into the ground and the bottom cuttings are removedfor laboratory determination of porosity and degree of water saturation, in order to evaluate
radon diffusivity. The probe, fitted with two rubber packers separated a few centimeters
along the its length, is inserted in the borehole and the packers are inflated. By means of
independent tubes leading from the annular spaces created in the hole by the packers,
suction is applied to the spaces so that no vertical flow of soil gas takes place across the
horizontal plane at the level of the lower packer, which separates the spaces. Soil gas fromthe lower space is drawn through an alpha scintillation cell and a rotameter-type flow meter
on its way to the suction pump. Separate static manometer tubes from the two spaces lead
to pressure gauges for monitoring the pressures in the spaces, unaffected by pressure drops
in the tubing through which the soil gas passes. As in the two procedures above, the soil
permeability is calculated by assuming that soil gas flows radially toward the sampling space
and that the permeability is proportional to the ratio of the flow rate to the pressure
gradient across the surface of the sampling space. A "mean migration distance" is
17

computed for a one-dimensional steady-state radon flux through soil having the radon
diffusivity and permeability obtained by the measurements. Soil-gas flow is assumed to
result from an arbitrary pressure difference of 5 Pa, distributed over that distance which
would result in no more than hundred-fold radon decay. The soil-gas radon concentration
measured by the alpha scintillation cell is corrected for depletion due to exhalation to the
atmosphere and is multiplied by the mean migration distance to obtain a "radon availability
number" (RAN). The RAN (Bq/m^) yields the steady-state quantity of radon per unit area
of soil that can be sustained external to the soil. The product of the RAN and the decay
constant is the steady-state flux density, or fluence rate, across the interface between soil and
atmosphere, or between soil and the disturbed zone in the vicinity of a building foundation,
assuming that the radon is effectively removed from the zone. A modification to allow for
a nonzero radon concentration in the disturbed zone has been given by Yokel and Tanner
[1992].
Viljanen et aL [1987] and Slunga [1988] have described a method combining radon content
of son gas and soil permeability to yield a "radon activity number" that classifies a site into
one of three categories, much as in the three-tiered Swedish style of radon potential
mapping.
Stieff et oL [1987] devised a method of hermetically sealing and counting y rays from
soil cores so that the state of equilibrium among ^Ra, “^Rn, and ^^"^Bi can be determined
by counting promptly after sampling, again after secular equilibrium has been attained
between and its short-lived progeny, and yet again after secular equilibrium has been
attained between ^Ra and ^Rn. The system yields information on the imdepleted radon
generation in the soil sample and the depletion of radon due to migration from the sample
under imdisturbed conditions, and could be adapted to site characterization by sampling soil
near an excavation cut or test hole.
Surbeck and Filler [1989] used a probe having one inflatable packer and usually placed with
the intake at a depth of 50 cm. After extracting a soil-gas sample for ^Rn analysis in a
conventional scintillation cell, they injected air into the soil by reversing the pump, which
resembled a bicycle pump with a heavy piston. The weight of the piston was adequate to
produce a constant 4-kPa injection pressure. Their quantity for site characterization was the
measured radon concentration divided by the time needed to force 1000 cm^ of air into the
hole. A revised approach was reported by Surbeck et aL [1991], wherein their "radon
availability" was the product of radon concentration and permeability (Bq/m).
Hall [1991a,b], using the RAN protocol, found good correspondence between the RANsmeasured near schoolroom walls and the indoor radon measurements in the rooms.
Lively and Steck [1991] reported a correlation study of two neighborhoods near Rochester,
Minnesota, in which they made soil-probe measurements of radon in soil gas by circulating
it through liquid scintillation cocktail. Other soil characteristics were measured in the
laboratory: moisture content, bulk density, solid-particle density, grain-size distribution.
18

mineralogy, radon emanation from bulk soil and fractions <63 and 64-149 /rni, ^^^o,
^Ra, and ^^Th. A good correlation was reported among average ^^Rn in soil gas,
parent/daughter radionuclides, and indoor radon levels. No model for quantitative
prediction was given in the report.
Using Monte Carlo methods to compute radon movement from a homogeneous soil into a
house by means of diffusion through the basement slab and diffusion plus soil-gas flow
through the foundation walls, Steck and Bergmann [1992] obtained a log-log plot of a
"pressure" (soil-gas flow) parameter versus a "diffusion" parameter, on which are plotted the
computed curves of equivalent "effective thickness" of soil from which radon can enter the
model house. By evaluating the two dimensionless parameters from field or hypothetical
values of the important soil characteristics and locating their common point on the plot, one
can determine the corresponding effective thickness and the expected radon flux to the
indoors. The pressure parameter is where k is the permeability, AP is the
difference in pressure between outside and the basement, t is the mean life of ^^^Rn, e is
the soil porosity, // is the viscosity of air, and r is the basement depth. The diffusion
parameter is yjDxlI^, where D is the bulk effective diffusion coefficient. Although
developed from a significantly different model by different algorithms, the "effective
thickness" serves the same purpose as the "interstitial mean migration distance" of the
Taimer [1988a,b, 1990] protocol.
A highly portable instrument for measuring the ^Rn concentration in soil gas, the "Markus10," is offered commercially.^ The instrument is designed to be driven or worked into the
ground, and contains a soil-gas radon measurement device with built-in pump, timing, data
reduction program, and a flow sensor that rejects the data if an adequate sod-gas flow rate
caimot be achieved. The instrument does not obtain the soil’s permeability, porosity, or
moisture content.
For epidemiological purposes, M^el^en et oL [1992] have constructed a model for site-
specific assessment of indoor radon concentrations in houses where measurements cannot
be performed. The model, based on data from about 10,000 buildings, uses the linear
product of factors derived from the geographical region, soil type, year of construction, andtype of foundation. (See summary in Appendix A.)
Sherman [1992] described a model of air infiltration and radon entry into a house, focusing
on the house’s resistance to infiltration, on its ventilation, and other characteristics of the
house, rather than on the site characteristics. The soil is characterized only as a
homogeneous reservoir of radon of a particular interstitial concentration, and as having an
inherent resistance to flow. A "radon leakage area" parameter (m^), introduced in the
^ Gammadata Matteknik, Box 15120, S-750 15 Uppsala, Sweden. Mention of this
instrument does not necessarily imply endorsement by MST.
19

report, is analogous to an established parameter, the "effective air leakage area," used to
evaluate air infiltration into a structure [Turk et al, 1990]. Although dimensionally different
from the interstitial mean migration distance of Tanner [1990], the radon leakage area
serves a similar purpose in evaluating the ease of radon transport within the soil toward the
house foundation, neglecting diffusion.
With the soil-probe techniques, the permeability is proportional to the ratio of the
volumetric gas flow rate in the probe at the sampling point to the difference in pressure
between the soil and the probe inlet. In some unpubhshed tests, I have found the ratio to
be nearly independent of the pressure difference from ~ 10 to as much as 1500 Pa, and to
be nearly as great for injection as for suction. For low pressure differences, -1 Pa and
lower, the ratio usually decreases significantly but may instead increase. This anomalous
behavior may be an artifact due to the difficulty of measuring the very small flow rates and
pressure differences. For a similar test, Damlqaer and Korsbech [1992] reported a
permeability decrease of about 50% from a pressure difference of 1 Pa to 10 Pa, an
approximately constant value from 10 to 100 Pa, and a slight rise between 100 and about
300 Pa.
Permeability measurements made by single soil probes have assumed flow of soil gas or au-
to or from the probe along radii of a sphere centered at the inlet point, and have assumed
that permeability is isotropic. As a development of the two-packer probe. Tanner [1991b]
introduced a three-packer probe that can collect soil gas along the same spherical-radii flow
lines, or can be adjusted to permit only horizontal radial flow into the collecting annulus.
By use of a mathematical formula appropriate for cyhndrical flow, the horizontal componentof permeability can be determined [Tanner, 1991b, Appendix C]. In layered soils containing
a significant fraction of platy or tabular mineral grains, the horizontal component is found
to be several times greater than the result obtained by assuming isotropic flow.
Permeability determinations based on data from either a single soil probe or grain-size
analysis are subject to criticism that they are representative of much smaller volumes than
the volume of ground involved in a building site. In particular, they may be in error by
orders of magnitude in ground that has shrinkage cracks, fractures, or clay lenses, or if they
are based on data from the wrong soil horizon. Experiments are in progress at the
Lawrence Berkeley Laboratory on a system to obtain permeability information on a scale
of several meters [Garbesi, 1993; Garbesi et aL, 1993]. A "dual-probe dynamic pressure"
technique, involving transmission of 1/60 Hz sinusoidally varying air-flow pulses from one
probe to a receiving probe at various distances up to several meters, yields increasing
permeability with probe spacing, as calculated from a model that assumes that the ground
is homogeneous and isotropic and that the <1% deviations from atmospheric pressure can
be ignored. The technique has been validated in one dimension in a soil column, and over
a frequency range of 1/30 to 1/120 Hz. It is obvious that several determinations should be
made at a particular site to result in a permeability value that can be used with confidence,
but in addition, an adjustment for scale may be required.
20

4.1.3. Laboratory Methods
In order for the soil-probe methods to define site radon potential, they must obtain values
that represent the average (or perhaps a weighted average of) conditions at a site. Because
of recent precipitation history, the conditions prevailing at the time of measurement may be
significantly different from the average. As an alternative. Yokel [1989] proposed laboratory
measurement of the properties of soil samples from the site after drying, in order to obtain
reproducible "invariant" properties such as radium activity concentration, dry density,
porosity, and gas permeability of the soil. Corrections to the typical conditions of the soil
could then be made, for instance, by the correlations published by Rogers and Nielson
[1991]. A hierarchical scheme for site-specific characterization of radon source potential by
means of standard geotechnical measurements, supplemented by laboratory measurements
of the "invariant properties," was reported by Yokel and Tanner [1992]. The scheme also
allows alternative use of soil-probe determinations and/or evaluation according to the
"RAN" protocol [Tanner, 1988a,b]. The laboratory option does not attempt to evaluate
diffusion, but assigns a minimum value to permeability to take care of the diffusive
component if it is dominant.
A scheme for radon classification of building sites using laboratory methods was introduced
in Finland [Viljanen et oL, 1987; Slunga, 1988]. The radon concentration in soil gas could
either be measured directly or estimated from radium content. The soil would be classified
by measurements of grain sizes, permeability, water content, porosity, and radium content,
and translated into a "radon activity number," so formulated as to yield dimensionless
number groups of < 1, 1-2, 2-3, and >3, corresponding respectively to low, normal, high, and
very high potential categories. I could not determine whether the classification by this
method has been validated and used extensively.
4.2. Discussion
Swedish investigators in the early 1980s had concluded that pressure-driven flow of soil gas
was the primary radon entry mechanism in those houses having high indoor levels
[Akerblom et al, 1984]. Partly for that reason, the approaches used by Eaton and Scott
[1984], by Kunz [1988], and by Nazaroff [1988] and Nazaroff and Sextro [1990] assmned that
diffusion does not play a significant role in radon movement toward, or entry into, a
structure. The study areas used by Kunz and by Nazaroff and Sextro in developing their
methods were mainly areas of high permeability, some of the areas also of soils enriched
in radium. Nazaroff and his colleagues at the Lawrence Berkeley Laboratory, in their
modeling and field studies, observed that radon entry was strongly dependent on the degree
of depressurization of a house at the lowest level, relative to the outside of the foundation
and imder-slab zone, and they observed rapid and dramatic changes in radon entry rate that
were inconsistent with diffusion through concrete [Nazaroff, 1992]. Tarmer [1991] cited
examples of houses having moderately elevated indoor radon levels (0.7-1. 1 kBq/m^; 20-30
pCi/L) that were sited in ground having such low measured permeabilities that radon
movement to the exterior of the foundation could not be accounted for by soil-gas flow, and
21

that although the actual radon entry might be the result of pressure-driven flow, diffusion
should be taken into account in modeling radon movement in the ground. It follows that
a general protocol for site characterization should account for both advective and diffusive
radon migration. In the field, however, it can usually be determined rather easily which
mechanism is the dominant one at a particular point. The other mechanism can be
neglected or assigned some minimum value, thus saving considerable effort.
Under some circumstances, diffusion may be important in radon entry also. Significant
radon entry into a test structure having positive pressure, implying radon entry by means of
diffusion, was reported by Borak et oL [1992]. Diffusion through concretes may be
significantly greater thanwas recognized earlier. Rogers and Nielson [1992] measured radon
diffusion coefficients and air permeabilities of 11 concrete samples from Rorida and found
that radon migration through those concretes would be diffusion dominated and capable of
permitting modest radon entry from soil of elevated ^Ra content; the diffusion lengths
calculated from their coefficients range from 9 cm to 47 cm, in comparison with 12.7 cm and
7.6 cm for diffusion through "ordinary concrete", reported by Culot et al [1976], and 12.6 cmand 16.9 cm reported by Zapalac [1983]. Some of these diffusion lengths are greater than
the typical basement slab thickness of 10 cm and imply that a diffusive radon stream would
retain at least 1/e =0.367 of its interstitial radon concentration from the soil side of the slab.
The radon flux density through the slab would be further reduced by a factor equal to the
porosity of the concrete.
All approaches to site characterization noted have assumed steady-state conditions.
Numerical modeling by Narasimhan et al [1990] has shown that daily atmospheric pressure
changes amplify the soil-gas flow into a bare-earth basement by more than an order of
magnitude if the soil is of low permeability, and severalfold if the soil is of high
permeability. (Specific assumptions and results are given in Appendix A.) Refinements of
site characterization protocols need to consider adapting permeability and/or diffusion
coefficients determined for steady-state conditions to effective values for normal barometric
pumping cycles.
All in situ site characterization methods require that the measurements either be made whenthe soil conditions are fortuitously close to the typical conditions, or that corrections bemade, primarily for the difference in soil moisture. The in situ methods have the advantages
of measuring the critical variables under conditions that will in general more nearly
approximate the typical conditions and require smaller corrections than those values
obtained in the laboratory. They obtain permeability, in particular, from soil that is
relatively undisturbed; and if the soil permeability is indicated by the field measurement to
be high, the laboratory determination of diffusion coefficient is not needed, making the
procedure quite expeditious. With the in situ methods, error is associated with the
measurement of the actual radon concentration in the soil gas, whereas separate
determinations of ^Ra concentration and emanation coefficient each involve independent
errors comparable to the single error of the soil-gas measurement. At present, however, the
procedures are esoteric and only the probes from Rogers and Associates Engineering
22

Corporation'^ are commercially available (on order only). The principal in situ procedures
described above have yielded more satisfactory correlation between their output numbers
and actual indoor radon measurements than any other scheme, but none has been tested
over a wide range of soils and conditions.
The laboratory method has the advantage of using methods that are fairly standardized, that
use common and commercially available equipment, and do not require professional
personnel. Procedures based entirely on laboratory measurements have yet to be validated
against houses of known indoor radon concentration.
The utility of site characterization depends on the degree to which the generation and
transport of radon in the soil to the building foundation is the limiting factor. Several
papers by Turk and colleagues (see Appendix A) support the idea that the soil resistance
is usually greater than the resistance of the structure to radon entry. It is difficult to backfill
the foundation walls to as great a packing density as in the undisturbed soil, and modembuilding codes require a highly permeable layer under the foundation slab to break
capillarity. Tliese conditions tend to create a virtual plenum next to the below-grade walls
and slab of a building foundation through which radon-bearing soil gas may move efficiently
to entry points. A building that has not been thoroughly sealed below grade is likely to offer
much less resistance to radon entry than the resistance of the soil to radon movementtoward the exterior of the foundation. Without this enhanced permeability next to the
foundation, site characterization would be so dependent on the locations of entry points as
to be futile and misleading.
Retrospective site characterization, primarily for epidemiological purposes, is moreproblematical because buildings on the site may have been very old, constmcted oncompacted earth instead of coarse aggregate, and have well-settled and compacted backfill.
The assumption that the resistance of the undisturbed soil is the limiting factor is quite
possibly not met, and the site evaluation is apt to be in error. Use of a relatively
impermeable backfill, although poor constmction practice, would similarly violate the
assumptions underlying site characterization.
4.3 Cost-Benefit Considerations for Site-Specific Characterization
Site-specific characterization of a lot for a single house is not generally cost beneficial. Thecost of testing a single lot is comparable to the cost of preparing the stmcture for easy
mitigation. Even if the site characterization were highly accurate, caprices of constmction
might make a building imusually leaky. Inaccuracies of indoor tests might yield a false
positive result with respect to an action level. Inaccuracies are inherent in the devices used,
and further error can result from atypical exposure (placement in the house, seasonal
^ Rogers and Associates Engineering Corporation, P.O Box 330, Salt Lake City, Utah84110. Mention of a specific product does not necessarily imply endorsement by MST.
23

variation, and unusual conditions during the test period). However, I envision several
conditions under which site-specific characterization could prove worthwhile:
(a) The architectural design of an unusual house would be compromised by the
usual means of providing a centrally located subslab vent pipe stub in the foundation or
vertical piping to the roof. A site test could indicate that taking such measures would be
very likely unnecessary, necessary, or that some unusual custom approach toward radon-
proof construction would be necessary.
(b) The owner desired a passive-vent design, which is likely to be successful if
only a modest reduction of indoor radon is needed and unsuccessful if a large reduction is
needed. The site test could indicate the approximate degree of reduction needed.
(c) The local building code required testing for commercial buildings,
government required testing for public buildings, or public school policy required pre-
construction testing.
(d) Builders of developments in areas where mapping or site-specific testing
indicated low radon source potential could save enough money by neglecting radon-resistant
construction on all houses to more than compensate for mitigation of a few houses that did
not pass indoor radon tests after construction.
(e) A builder felt that a site had erroneously been included in a high-risk area,
and site-specific characterization was needed to decide whether less radon resistance would
be sufficient.
(f) Uninhabited areas presumed on the basis of geological data to have severe
indoor radon potential could be tested in advance, and local authorities could be forewarned
if the tests verified the geologic estimate.
4.4. Recommendations
Greater field validation is needed for both in situ and laboratory methods.
A recognized protocol and associated equipment for site-specific characterization of ground
prior to construction should be available to meet the needs cited above.
5. ACKNOWLEDGMENTS
This report employed a bibliographic data base accumulated during employment with the
U.S. Geological Survey, 1951-1990, and under a grant from the U.S. Department of Energy,
Office of Health and Environmental Research, No. DE-FG05-90ER61089. Preparation of
this report was done under NIST Order No. 43NANB116585, Task 2, and was aided by
discussi with Dr. Felix Y. Yokel, the Technical Representative for NIST.
24

6. REFERENCES CITED
Note: Abstracts or summaries for most of the references may be found in Appendix A.
Agard, Sherry S., and Linda C.S. Gundersen, 1991, The geology and geochemistry of soils in Boyertown and
Easton, Pennsylvaniei, in Gimdersen, Linda C.S., £md Richard B. Wanty, eds.. Field studies of radon in rocks,
soils, and water: U.S. Geol. Survey Bulletin no. 1971, p. 51-63
Akerblom, Gustav, 1986, Investigation and mapping of radon risk areas: Lulei, Sweden: Swedish Geological AB,
Rept. IRAP 86036, 15 p.
Akerblom, Gustav, 1987, Investigations and mapping of radon risk areas, in Geology for Environmental Planning,
Proceedings of the International Symposium on Geological Mapping in the Service of Environmental Planning,
Trondheim, 1986: Trondheim, Norwegian Geological Survey, P.O. 3006, Trondheim, Norway, p. 96-106
Akerblom, Gustav, 1993, Ground radon-monitoring procedures in Sweden, manuscript of lecture given 12
February 1993 at the *JAG’ Discussion Meeting at "Radon Workshop—Geology, Environment, Techniques" at
Royal Astronomical Society, Burlington House, London: Stockholm, Swedish Radiation Protection Institute, 14
manuscript p. + 31 illustrations
Akerblom, G., P. Andersson, and B. Clavensjo, 1984, Soil gas radon—a source for indoor radon daughters:
Radiation Protection Dosimetry, 7(1-4): 49-54
Akerblom, Gustav, Bemdt Pettersson, and Bengt Rosen, 1990, Radon i bostader. Markradon [Radon in the soil.
Handbook of radon]: Stockholm, National Council for Building Research Rept. R85:1988 [Revised 1990], 160 p.
Akerblom, G.V., and Carole Wilson, 1981, Radon gas - A radiation hazard from radioactive bedrock and
building materials: Intemat. Assoc. Engineering Geology Bull., 23: 51-61
Arvela, H., and K. Winqvist, 1989, A model for indoor radon variations: Environment Intemat., 15: 239-246
Ball, T.K., D.G. Cameron, T.B. Colman, and P.D. Roberts, 1991, Aspects of radon potential mapping in Britain,
[abs.], in International Symposium on the Natural Radiation Environment, 5th, Salzburg, Austria, 22-28
September 1991, Abstracts: Salzburg, Univ. Salzburg, Inst, for General Biology, Biochemistry and Biophysics,
abs. no. 58
Barnet, L, ed., 1991 Radon investigations in Czechoslovakia 11: Prague, Czech Geological Survey, 51 p.
Been, J.M., G.M. Reimer, and SX. Szarzi, 1989, Soil-gas radon distribution in Frederick County, Maryland [abs.]:
Eos, Am. Geophys. Union Trans., 70(5): 500
Been, Josh M., SX. Szarzi, and GXl. Reimer, 1989, Radon as a geologic mapping tool [abs.]: Geol. Soc.
America, Abstracts with Programs, 21(6): A143
Brookins, Douglas G., 1986, Indoor and soil Rn measurements in the Albuquerque, New Mexico, area: Health
Physics, 51(4): 529-533
Brooks, J.R., 1989, Maryland geology and indoor radon [abs.]: Eos, Am. Geophys. Union Trans., 70(15): 500
Borak, TX., D.C. Ward, and M.S. Gadd, 1992, Characterization of ^Rn entry into a basement structure
surrounded by low permeability soil, in The 1992 International Symposium on Radon and Radon Reduction
25

Technology, Minneapolis, Minnesota, September 22-25, 1992: U.S. Environmental Protection Agency, Preprints,
V. 2, no. VI-1, 20 p.
Buchli, R., and W. Burkart, 1989, Influence of subsoil geology and construction techmque on mdoor air Rnlevels in 80 houses of the central Swiss Alps: Health Physics, 56(4): 423-429
Burnett, BiU, Jim Cowart, Dave Clark, Renata van der Weijden, and Peter Cable, 1989, Radon in shallow
groundwater in Florida— A possible relationship to soil flux? [abs.]: Eos, Am. Geophys. Union Trans., 70(15):
500
Carlisle, Donald, and Haydar Azzouz, 1991, Geological parameters in radon risk assessment—A case history of
deliberate exploration, in The 1991 International Symposium on Radon and Radon Reduction Technology,
Philadelphia, Pa., 2-5 April 1991: Preprints, v. 5, no. IX-6, 14 p.
Carlisle, Donald, and Haydar Azzouz, 1993, Discovery of radon potential in the Rincon Shale, California—a case
history of deliberate exploration: Indoor Air, 3: 131-142
Castrdn, O., 1987, Dealing with radon in dwellings: the Finnish experience, in Second APCA International
Specialty Conference on Indoor Radon, New Jersey, April 6-10, 1987: Pittsburgh, Air Pollution Control Assoc.
Spec. Pub.
Castr6n, Olli, 1990, Radon in Finland: Finnish Features, November 1990, Classification 6.3.7.4., 4 p., Helsinki,
Finnish Government Printing Office
Castr6n, O., H. Arvela, I. M^elainen, and A. Voutilainen, 1991, Indoor radon survey in Finland: Methodology
and applications, [abs.], in International Symposium on the Natural Radiation Environment, 5th, Salzburg,
Austria, 22-28 September 1991, Abstracts: Salzburg, Univ. Salzburg, Inst, for General Biology, Biochemistry and
Biophysics, abs. no. 130
Castrdn, O., I. M^elainen, K. Winqvist, and A. Voutilainen, 1987, Indoor radon measurements in Finland: Astatus report. Chap. 8, in Hopke, Philip K., ed.. Radon and Its Decay Products; Occurrence, Properties, and
Health Effects: Washington, Am. Chem. Soc. Symposium Ser. 331, p. 97-103
Castrdn, O., A. Voutilainen, K. Winqvist, and 1. Makelainen, 1985, Studies of high indoor radon areas in Finland:
The Science of the Total Environment, 45: 311-318
Cattafe, Joseph S., Colleen A. Ranney, Keith E. Miller, and Robert H. Andolsek, 1989, Regional NURE, geology
and soils data as predictors for indoor radon, in Osborne, M.C., and Jed Harrison, Symposium Cochairmen, The1988 Symposium on Radon and Radon Reduction Technology, Proc., Vol. 2, Symposium Poster Papers: Research
Triangle Park, N.C., Radian Corp., U.S. Environmental ProtectionAgencyPub. EPA/600/9-89/006b [Springfield,
Va., NTIS Order No. PB89-167498], p. 3-25-3-39.
Chadima, Sarah A., 1989, Generalized potential for radon emission based on estimated uranium content in
geologic rock units. South Dakota: Vermillion, SJ3., Univ. South Dakota Science Center, South Dakota Division
of Geological Survey Circ. 44, 23 p.
Clavensjo, B., Akerblom, G.V., and Andersson, P., 1983, Radon in dwellings. The effect of the ground on radon
levels and gamma radiation indoors [in Swedish]: Stockholm, Statens rad for byggnadsforskning, Rept. R9: 1983,
442 p. [ISBN 91-540-3866-9]
26

Coleman, KA., 1993, Washington’s radon construction standards: The building code process, in The 1993
International Radon Conference, Denver, Colo., Sept. 20-22, 1993: Denver, Colo., Am. Assoc. Radon Scientists
and Technologists, Rocky Mountain Chapter, Preprints, 7 p.
Coleman, KA., G.C. Hughes, and EJ. Scherieble, 1993, Where’s the radon? The Geographic Information in
Washington State [abs.], in First International Workshop on Indoor Radon Remedial Action, The Scientific Basis
and Practical Applications, Rimini, Italy, 27 June-2 July 1993: Commission of the European Communities et ai.
Book of Abstracts, p. 75
Coleman, KA., and EJ. Scherieble, 1993, Radon and the Geographic Information System, in The 1993
International Radon Conference, Denver, Colo., Sept. 20-22, 1993: Denver, Colo., Am. Assoc. Radon Scientists
and Technologists, Rocky Mountain Chapter, Preprints, 7 p.
Cui, L.-P., 1990, Radiometric methods in regional radon hazard mapping: Nuclear Geophysics, 4(3): 353-364
Culot, Michel VJ., Hilding G. Olson, and Keith J. Schiager, 1976, Effective diffusion coefficient of radon in
concrete, theory and method for field measurements: Health Physics, 30(3): 263-270
Czarwinski, R., R. Lehmann, and W. Rohnsch, 1993, Radon in Eastern German houses—Surveys and outcomes
[abs.], in First International Workshop on Indoor Radon Remedial Action, The Scientific Basis and Practical
Applications, Rimini, Italy, 27 June-2 July 1993: Commission of the European Communities et al. Book of
Abstracts, p. 102
Damkjaer, A., and U. Korsbech, 1988, A search for correlation between local geology and indoor radon
concentrations: Radiation Protection Dosimetry, 24(1-4): 51-54
Damkjaer, A., and U. Korsbech, 1992, A small-diameter probe for in-situ measurements of gas permeabihty of
soils, in Janssens, A., W. Lowder, M. Olast, J. Sinnaeve, and F. Steinhausler, eds.. The Natural Radiation
Environment, Proceedings of the Fifth International Symposium on the Natural Radiation Environment, Salzburg,
Austria, September 22-28, 1991: Radiation Protection Dosimetry, 45(1-4), Supplement: 85-89
Dron, Elizabeth M., 1993, UK Radon Programme: Policy and progress [abs.], in First International Workshopon Indoor Radon Remedial Action, The Scientific Basis and Practical Applications, Rimini, Italy, 27 June-2 July
1993: Commission of the European Communities et al.^ Book of Abstracts, p. 110
DSMA Atcon, Ltd., 1983, Review of existing instrumentation and evaluation of possibilities for research and
development of instnunentation to determine future levels of radon at a proposed building site: Ottawa, Atomic
Energy Control Board Research Rept. INFO-0096, 74 p.
Dulaney, Richard A., 1992, Analysis of indoor radon in New Mexico using geographic information systems (GIS)
[abs.], in The 1992 International Symposium on Radon and Radon Reduction Technology, Minneapolis,
Minnesota, September 22-25, 1992: U.S. Environmental Protection Agency, Preprints [poster papers], v. 5, no.
VIIIP-4
Duval, J.S., 1989, Indoor radon prediction using gamma-ray spectrometric data [abs.]: Eos, Am. Geophys. UnionTrans., 70(15): 496
Duval, Joseph S., 1991, Use of aerial gamma-ray data to estimate relative amounts of radon in soil gas, in
Gundersen. Linda C.S., and Richard B. Wanty, eds.. Field studies of radon in rocks, soils, and water: U.S. Geol.
Survey BuLviin no. 1971, p. 155-162
27

Duval^ Joseph S., and William J. Jones, 1988, Regional aerial gamma-ray maps for Illinois and parts of
Wisconsin, Iowa, Michigan, Indiana, Missouri, and Kentucky, in Marikos, Mark A., and Robert H. Hansman,
eds.. Geologic Causes of Natural Radionuclide Anomalies, Proceedings of the GEORAD Conference, St. Louis,
Mo., April 21-22, 1987: Rolla, Mo., Missouri Dept. Nat. Resources Spec. Pub. No. 4, p. 157-165.
Duval, J.S., WJ. Jones, and J.K. Otton, 1989, Radium distribution map and radon potential in northwestern
United States, in Osborne, M.C., and Harrison, Jed, Symposium Cochairmen, The 1988 Symposium on Radon
and Radon Reduction Technology, Proc., Vol. 2, Symposimn Poster Papers: Research Trian^e Park, N.C.,
Radian Corp., U.S. Environmental Protection Agency Pub. EPA/600/9- 89/006b [Springfield, Va., NTIS Order
No. PB89-167498], p. 3-41-3-49.
Duval, Joseph S., William J. Jones, Frederick R. Riggle, and James A. Pitkin, 1989, Equivalent uranium map of
conterminous United States: U.S. Geological Survey Open-file Rept. 89-478, 12 p. + two-part plate and color
slide
Duval, Joseph S., and James K. Otton, 1990, Radium distribution and indoor radon in the Pacific Northwest:
Geophys. Research Letters, 17(6): 801-804
Eaton, R.S., and A.G. Scott, 1984, Understanding radon transport into houses: Radiation Protection Dosimetry,
7(l-4):251-253
Fakundiny, Robert H., Philip R. Whitney, and John M. Matuszek, 1988, Inappropriateness of bedrock maps for
predicting radon in soil [abs.], in Radon in the Northeast: Perspectives and Geolo^c Research (conference), Troy
and Albany, New York, May 31-June 2, 1988: Northeastern Environmental Science, 7(1): 5
Fisher, D.R., 1978, Risk evaluation and dosimetry for indoor radon progeny on reclaimed Florida phosphate
lands [PhJJ. thesis]: Gainesville, Fla., Univ. Florida: 140 p.
Fitzpatrick-Lins, Katherine, Thomas L. Johnson, and James K. Otton, 1990, Radon potential defined by
exploratory data analysis and geographic information systems, in Wiltshire, D[enise] A., ed.. Selected Papers in
the Applied Computer Sciences 1990, Chapter E: U.S. Geological Survey Bulletin 1908, p. El-ElO.
Flood, James R., Tom B. Thomas, Neil H. Suneson, and Kenneth V. Luza, 1990, Radon potential map of
Oklahoma: Oklahoma Geol. Survey Map GM-32, Scale 1:750,000
Friedmann, Harry, 1993, The Austrian Radon Project [abs.], m First International Workshop on Indoor RadonRemedial Action, The Scientific Basis and Practical Applications, Rimini, Italy, 27 June-2 July 1993: Commission
of the European Communities et al.^ Book of Abstracts, p. 107
Frishman, D3\id, W.C. Day, PJ". Folger, R3. Wanty, PJI. Briggs, and Eileen Poeter, 1993, Bedrock geolo^c
controls on radon abundance in domestic well water, Conifer, Colorado, in The 1993 International RadonConference, Denver, Colo., Sept. 20-22, 1993: Denver, Colo., Am. Assoc. Radon Scientists and Technologists,
Rocky Mountain Chapter, Preprints, p. IV 20—^IV 30
Frohlich, Reinhard K., and Carl A. Pearson, 1988, Potential radon hazard in Rhode Island estimated from
geophysical and geological surveys: Northeastern Environmental Science, 7(1): 30-34
Garbesi, Karina, 1993, Toward resolving model-measurement discrepancies of radon entry into homes [PIlD.
Thesis]: Berkeley, Calif., Univ. CaUfomia, Energy and Resources Group, and Lawrence Berkeley Laboratories,
Energy and Environment Div. Rept. LBL-34244, 169 p.
28

Garbesi, K., R.G. Sextro, WJ. Fisk, M.P. Modera, and K.L. Revzan, 1993, Soil-gas entry into an experimental
basement: Model measurement comparisons and seasoned effects: Environmental Science and Technology, 27(3):
466-473
Gates, Alexander E., Lawrence Malizzi, and John Driscoll HI, 1992, Soil radon distribution in glaciated areas:
An example from the New Jersey Highlands, in Gates, Alexander E., and Linda C.S. Gundersen, eds.. Geologic
Controls on Radon: Boulder, Colo., Geological Soc. America Special Paper 271, p. 45-52
Goodknight, Craig S., emd R. Thomas Peake, 1988, Preliminary estimation of high radon potential areas in EPARegions 3 and 4 as indicated by geologic factors [abs.]: Geol. Soc. America, Abstracts with Programs, 20(7): A337
Grace, John D., 1989, Radon anomalies in southern Michigan [abs.]: Geol. Soc. America, Abstracts with
Progr2mas, 21(6): A144
Grasty, R.L., 1989, The relationship of geology and gamma-ray spectrometry to radon in homes [abs.]: Eos, Am.Geophys. Union Trans., 70(15): 496
Greeman, Daniel J., and Arthur W. Rose, 1991, Geochemical controls on radon emanation in soils; importance
of "organic: radium [abs.]: Geol. Soc. America, Abstracts with Programs, 23: A202
Greeman, Daniel J., Arthur W. Rose, and William A. Jester, 1990, Geochemical dynamics of radon precursors
in eastern U.S. soils [abs.]: Geol. Soc. America, Abstracts with Progreuns, 22(7): A247-A248
Grodzins, L., T. Bradstreet, and E. Moreau, 1991, The State of Maine schools radon project, in The 1991
International Symposium on Radon and Radon Reduction Technology, Philadelphia, Pa., 2-5 April 1991:
Preprints, v. 3, no. VI-6, 15 p.
Gross, S., and H.M. Sachs, 1982, Regional (location) and building factors as determinants of indoor radon
concentrations in eastern Pennsylvania: Princeton, NJ, Princeton Univ. Center for Energy and Environmental
Studies, PU/CEES Rept. 146, 117 p.
Gundersen, Linda C.S., 1989, Predicting the occurrence of indoor radon: A geologic approach to a national
problem [abs.]: Eos, Am. Geophys. Union Trans., 70(15): 280
Gundersen, Linda C.S., 1991, Radon in sheared metamorphic and igneous rocks, in Gundersen, Linda C.S., and
Richard B. Wanty, eds.. Field studies of radon in rocks, soils, and water: U.S. Geol. Survey Bulletin no. 1971,
p. 39-50
Gundersen, Linda C.S., 1993, The correlation between bedrock geology and indoor radon: Where it works and
where it doesn’t—Some examples from the eastern United States, in The 1993 International Radon Conference,
Denver, Colo., Sept. 20-22, 1993: Denver, Colo., Am. Assoc. Radon Scientists and Technologists, Rocky MountainChapter, Preprints, p. IV 1—FV 8
Gundersen, Linda C.S., R. Thomas Peake, Gary D. Latzke, Lisa M. Hauser, and Calvin R. Wiggs, 1991, Astatistical summary of uranium and radon in soils from the Coastal Plain of Texas, Alabama, and New Jersey,
in The 1990 International Symposium on Radon and Radon Reduction Technology, Atlanta, Ga., 19-23 February
1990: Research Triangle Park, N.C., U.S. Environmental Protection Agency Rept. EPA600/9-91-026c,
Proceedings, Vol. 3: Symposium Poster Papers, Paper No. C-IV-4, p. 6-35—6-47 [NTIS Order No. PB91-
234468/AS]
29

Gimdersen, L.C.S., G.M. Reimer, and S.S. Agard, 1988, Correlation between geology, radon in soil gas, and
indoor radon in the Reading Prong, in Marikos, Mark A., and Robert H. Hansman, eds.. Geologic Causes of
Natural Radionuclide Anomalies, Proceedings of the GEORAD Conference, St. Louis, Mo., April 21-22, 1987:
Rolla, Mo., Missouri Dept. Nat. Resources, Div. Geology and Land Survey Spec. Pub. No. 4, p. 91-102
Gundersen, L.C.S., Reimer, G.M., Wiggs, C.R., and Rice, CA., 1988, Map showing radon potential of rocks and
soils in Montgomery County, Maryland: U.S. Geol. Survey Misc. Field Studies Map MF-2043.
Gundersen, Linda C.S., R. Randall Schumann, James K. Otton, Russel F. Dubiel, Douglass E. Owen, KendeU
A. Dickinson, R. Thomas Peake, and Sharon J. Wirth, 1991, Preliminary radon potential map of the United
States, in The 1991 International Symposium on Radon and Radon Reduction Technology, Philadelphia, Pa., 2-5
April 1991: Preprints, no. IX-4, 23 p.
HaU, Stephen T., 1991a, Combining mitigation & geology: Indoor radon reduction by accessing the source, in
The 1991 International Symposium on Radon and Radon Reduction Technology, Philadelphia, Pa., 2-5 April
1991: Preprints, v. 5, no. IX-1, 10 p.
Hall, Stephen T., 1991b, Correlation of soil radon availabihty munber with indoor radon and geology in Virginia
and Maryland, in The 1991 International Symposium on Radon and Radon Reduction Technology, Philadelphia,
Pa., 2-5 April 1991: Preprints, v. 4, no. VIIIP-3, 9 p.
Hand, Bryce M., 1988, Geolo^c factors affecting indoor radon in Onondaga County, N.Y. [abs.], in Radon in
the Northeast: Perspectives and Geolo^c Research (conference), Troy and Albany, New York, May 31-June 2,
1988: Northeastern Environmental Science, 7(1): 6
Haque, A.K.M.M., and C. Halls, 1993, Radon migration related to structure and plutonism in high heat
production province [abs.], in First International Workshop on Indoor Radon Remedial Action, The Scientific
Basis and Practical AppUcations, Rimini, Italy, 27 June-2 July 1993: Commission of the European Communities
et al.y Book of Abstracts, p. 76
Harrell, James A., and Ashok Kumar, 1988, Radon hazards associated with outcrops of the Devonian Ohio shale.
Final report for a grant awarded by the Ohio Air Quality Development Authority: Toledo, Ohio, Univ. Toledo,
163 p.
Hassler, Gerald L., 1940, Soil gas sampling device and method: U.S. Patent no. 2,210,546, Aug. 6, 1940, 6 p.
Hawthorne, A.R., R.B. Gammage, and C.S. Dudney, 1984, Effects of local geolo^ in indoor radon levels, in
International Conference on Indoor Air Quality and Climate, 3d, Stockholm, August 20-24, 1984; Vol. 2,: Radon,
Passive Smoking, Particulates and Housing Epidemiology, Birgitta Berglund, Thomas Lindvall, and Jan Sundell,
eds.: Stockholm, Swedish Council for Building Research, Vol. 2, p. 137-142
Hes Ake, 1984 [Pub. 1985], Radon in soil gas: A study of methods and instruments for determining radon
conci. ions in the ground: Uppsala, Sveriges geologiska undersdkning, ser. C., no. 803, p. 1-58
Holub, RJ"., RP. DrouUard, T.B. Borak, W.C. Inkret, J.G. Morse, and J.F. Baxter, 1985, Radon-222 and ^Rnprogeny concentrations measured in an energy-efficient house equipped with a heat exchanger: Health Physics,
49(2>“
Jaco M., M.G. Mudrey, Jr., C.V. Weiffenbach, and DM. Mickelson, 1993, Comparison of soil profile
charaaeiistics and radon potential with soil gas radon along hillslope transects in southeastern Wisconsin [abs.].
30

in The 1993 International Radon Conference, Denver, Colo., Sept. 20-22, 1993: Denver, Colo., Am. Assoc. Radon
Scientists and Technologists, Rocky Mountain Chapter, Preprints, p. IV 9
Keller, G., and M. Schiitz, 1988, Radon exhalation from the soil: Radiation Protection Dosimetry, 24(1/4): 43-46
Kline, Stephen W., Douglas G. Mose, and Isidore Zietz, 1988, Use of aeroradioactivity maps in indoor radon
prediction: A case study from Fairfax County, Virginia and Montgomery County, Maryland [abs.]: Geol. Soc.
America, Abstracts with Programs, 20(7): A337-A338
Kothari, Brajesh K., 1983, Use of NURE data for natural radiation exposure: indoor radon and gamma-ray
radiation [abs.], in Health Physics Soc. Ann. Mtg., 28th, no. P/246: Health Physics, 45(1): 254
Kullman, Frej, 1993, Radonrisk mapping—a method of predicting problem areas on geological grounds [abs.],
in First International Workshop on Indoor Radon Remedial Action, The Scientific Basis and Practical
Applications, Rimini, Italy, 27 June-2 July 1993: Commission of the European Communities et al., Book of
Abstracts, p. 78
Kunz, Charles O., 1988a, Indoor radon: Source characterization: Environmental Progress, 7(4): 236-240
Kunz, C.O., 1988b, Field measurements to characterize the availability of radon in soil-gas for transport into
homes [abs.], in Radon in the Northeast: Perspectives and Geologic Research (conference), Troy and Albany,
New York, May 31-Jime 2, 1988: Northeastern Environmental Science, 7(1): 7
Kunz, C., CA. Laymon, and C. Parker, 1989a, Empirical relationship between soil parameters and indoor radon
[abs.]: Eos, Am. Geophys. Union Trans., 70(15): 497
Kunz, C., CA. Laymon, and C. Parker, 1989b, Gravelly soils and indoor radon, in M.C. Osborne, and Jed
Harrison, Symposium Cochairmen, The 1988 Symposium on Radon and Radon Reduction Technology, Proc,,
Vol. 1, Symposium Oral Papers: Research Triangle Park, N.C., Radian Corp., U.S. Environmental Protection
Agency Pub. EPA/600/9-89/006a [Springfield, Va., NTIS Order No. PB89-167480], p. 5-75-5-86.
Laymon, Charles, and Charles Kunz, 1991, Geologic factors and house construction practices affecting indoor
radon in Onondaga County, New York, in The 1990 International Symposium on Radon and Radon Reduction
Technology, Atlanta, Ga., 19-23 February 1990: Research Triangle Park, N.C., U.S. Environmental Protection
Agency Rept. EPA600/9-91-026b, Proceedings, Vol. 2: Symposium Oral Papers, Paper No. VI-4, p. 6-37—6-50
[NTIS Order No. PB91-234450/AS]
Laymon, Charles, Charles Kunz, and Lawrence Keefe, 1990, Indoor radon in New York State: Distribution,
sources and controls: Albany, N.Y., State of New York Dept. Health Tech. Rept. [unnumbered], 49 p.
LeGrand, Hsirry E., 1987, A predictive model for indoor radon occurrences—A first approximation, in Graves,
Barbara, ed.. Radon, Radium, and Other Radioactivity in Ground Water. Hydrogeologic Impact and Application
to Indoor Airborne Contamination. National Well Water Association Conference, Somerset, NJ., April 7-9,
1987, Proceedings: Chelsea, Mich., Lewis Publishers, Inc., p. 477-487
Lehtoviita, Timo, Jussi Holkko, Martti Viljanen, and Eero Slunga, 1985, Radonin merkitys
talonrakennustekniikassa. Tutkimuskohteiden rakennustekninen tarkastelu [Radon in building technology.
Structural comparison on the research sites]: Espoo, Finland, Helsinki Univ. Technology, Dept. Civil Engineering,
Div. Structural Engineering Rept. 73, 145 p.
31

Lilley, William D., Charles Kimz, and B. Kothari, 1988, Geologic factors in predicting indoor radon in New York
[abs.], in Radon in the Northeast: Perspectives and Geologic Research (conference), Troy and Albany, NewYorl^ May 31-June 2, 1988: Northeastern Environmental Science, 7(1): 7
Lindmark, A., and B. Ros6n, 1985, Radon in soil gas-exhalation tests and in situ measurements: The Science
of the Total Environment, 45: 397-404
Lively, Richard, and Daniel Steck, 1991, A site study of soil characteristics and soil gas radon, in The 1991
International Symposium on Radon and Radon Reduction Technology, Philadelphia, Pa., 2-5 April 1991:
Preprints, v. 5, no. IX-5, 15 p.
Lloyd, Larry L., 1983, Evaluation of Radon Somces and Phosphate Slag in Butte, Montana: U.S. Environmental
Protection Agency Rept. EPA 520/6-83-026, 75 p.
Lombardi, S., and G. Etiope, 1993, 222-Rn soil-gas in sedimentary basin in Central Italy: its implications i
radioprotection zoning [abs.], in First International Workshop on Indoor Radon Remedial Action, The Sciei c
Basis and Practical Applications, Rimini, Italy, 27 June-2 July 1993: Commission of the European Communities
et al.^ Book of Abstracts, p. 70
M^elainen, I., A. Voutilainen, and O. Castr6n, 1992, Prediction of indoor radon concentration based on
residence location and construction, in Cross, Fredrick T., ed.. Indoor Radon and Lung Cancer: Reality or Myth?
Twenty-ninth Hanford Symposium on Health and the Environment, Richland, Wash., October 15-19 1990,
Proceedings: Columbus, Ohio, Battelle Press, Part 1, p. 55-63 [NTIS]
Matz, Barbara, 1993, Compilation of radon levels found in Albuquerque, New Mexico, in 1992 and 1993 [abs.],
in The 1993 International Radon Conference, Denver, Colo., Sept. 20-22, 1993: Denver, Colo., Am. Assoc.
Radon Scientists and Technologists, Rocky Mountain Chapter, Preprints, p. IVP 1
McFarland, David, 1991, A comparison of radon results to geologic formations for the State of Kentucl^ [abs.],
in The 1991 International Symposium on Radon and Radon Reduction Technology, Philadelphia, Pa., 2-5 April
1991: Preprints, v. 5, no. IX-2
W 'hlin, J[ames] P., 1987, Population doses in Ireland, Chap. 10, in Hopke, Philip K., ed.. Radon and Its
I . roducts; Occurrence, Properties, and Health Effects: Washington, Am. Chem. Soc. Symposium Ser. 331,
p. 113-123
McLemore, Virginia T., and John W. Hawley, 1988, Preliminary geologic evaluation of radon availability in NewMexico: Socorro, New Mexico Bureau of Mines and Mineral Resources Open-file Rept. 345, 31 p.
McLemore, Virginia T., John W. Hawley, and Ralph A. Manchego, 1991, Geologic evaluation of radon
availability in New Mexico: A progress report, in The 1991 International Symposium on Radon and RadonReduction Technology, Philadelphia, Pa., 2-5 April 1991: Preprints, v. 5, no. DflP-l, 20 p.
Miles, J.CJI., 1993, Mapping the proportion of the housing stock exceeding a radon reference level [abs.], in First
International Workshop on Indoor Radon Remedial Action, The Scientific Basis and Practical Applications,
Rimini, Italy, 27 June-2 July 1993: Commission of the European Communities et c/., Book of Abstracts, p. 74
Moed, BA., W.W. Nazaroff, AV. Nero, M.B. Schwehr, and A. Van Heuvelen, 1984, Identifying Aeas with
Potential for High Indoor Radon Levels: Analysis of the National Airborne Radiometric Reconnaissance data
for California and the Pacific Northwest: Berkeley, CA, Univ. California Lawrence Berkeley Lab. Rept. LBL-
16955, 70 p. [Also published with additional pages i and ii by Bonneville Power Administration, 1985]
32

Morley, D.R., M.M. Ghomshei, C. Van Netten, and B.G. Phillips, 1991, Radon studies in British Columbia,
Canada, in The 1991 International Symposium on Radon and Radon Reduction Technology, Philadelphia, Pa.,
2-5 April 1991: Preprints, v. 3, no. \T-5, 10 p.
Moschandreas, DJ., and H.E. Rector, 1982, Indoor radon concentrations: Environment Intemat., 8(1-6): 77-82
Mose, Douglas G., Charles E. Chrosniak, and George W. Mushrush, 1989, State-size radon hazard maps based
on zip-code compilations [abs.]: Geol. Soc. America, Abstracts with Programs, 21(6): A143-A144
Mose, Douglas G., George W. Mushrush, and Stephen W. Kline, 1988, The interaction of geology, weather, and
home construction on indoor radon in northern Virginia and southern Maryland, in Radon in the Northeast:
Perspectives and Geologic Research (conference), Troy and Albany, New York, May 31-June 2, 1988:
Northeastern Environmental Science, 7(1): 15-29
Murane, David M., 1993, Model standards and techniques for control of radon in new buildings [abs.], in First
International Workshop on Indoor Radon Remedial Action, The Scientific Basis and Practical Apphcations,
Rimini, Italy, 27 June-2 July 1993: Commission of the European Communities et al. Book of Abstracts, p. 3
Mushrush, George W., and Douglas G. Mose, 1988, Regional variation of indoor radon over three seasons:
Environmental Toxicology and Chemistry, 7: 879-887
Narasimhan, T.N., Y.W. Tsang, and H.Y. Holman, 1990, On the potential importance of transient air flow in
advective radon entry into buildings: Geophys. Research Letters, 17(6): 821-824
Nason, Richard, and Bernard L. Cohen, 1987, Correlation between ^^^a in soil, ^^^Rn in soil gas, and ^^^Rn
inside adjacent houses: Health Physics, 52(1): 73-77
Nazaroff, William W., 1992, Radon transport from soil to air: Reviews of Geophysics, 30(2): 137-160
Nazaroff, William W., Barbara A. Moed, and Richard G. Sextro, 1988, Soil as a source of indoor
radon: Generation, migration, and entry, in Nazaroff, W.W., and A.V. Nero, eds.. Radon and Its Decay Products
in Indoor Air: New York, John Wiley and Sons, p. 57-112
Naz^uoff, William W., and Richard G. Sextro, 1989, Technique for measuring the indoor ^^Rn source potential
of soil: Environmental Science and Technology, 23(4): 451-458
Nero, Anthony V., Jr., 1993, Risk evaluation and control strategies for indoor radon [abs.], in First International
Workshop on Indoor Radon Remedial Action, The Scientific Basis and Practical Applications, Rimini, Italy, 27
June-2 July 1993: Commission of the European Communities et al.^ Book of Abstracts, p. Ill
Nero, A.V., S.M. Leiden, DA. Nolan, PJl. Price, S. Rein, KX. Revzan, HA. Wollenberg, and AJ. Gadgil, 1993,
Statistically-based methodologies for mapping of radon "actual" concentrations: The case of Minnesota [abs.], in
First International Workshop on Indoor Radon Remedial Action, The Scientific Basis and Practical Applications,
Rimini, Italy, 27 June-2 July 1993: Commission of the European Communities et al.. Book of Abstracts, p. 77
Nero, A.V., and W.W. Nazaroff, 1984, Characterising the source of radon indoors: Radiation Protection
Dosimetry, 7(1-4): 23-39; [orig. pub.: Lawrence Berkeley Laboratory Rept. LBL-16636, 1983]
Nielson, K.K., M.K. Bollenbacher, V.C. Rogers, and G. Woodruff, 1989, Users guide for the MK-IIRadon/Permeability Sampler [draft]: Salt Lake City, Utah, Rogers and Associates Engineering Corp. Rept. RAE-8719/1-2, 47 p.
33

Nielson, Kirk K, and Vem C. Rogers, 1992, Radon transport properties of soil classes for estimating indoor
radon entry, in Cross, Fredrick T., ed.. Indoor Radon and Lung Cancer: Reality or Myth? Twenty-ninth Hanford
Symposium on Health and the Environment, Richland, Wash., October 15-19, 1990, Proceedings: Richland,
Wash., BatteUe Memorial Press, Part 1, p. 357-372 [NTIS]
Nielson, K.K., V.C. Rogers, R.B. Brown, W.G. Harris, and J.K. Otton, 1992, Soil radon potential mapping and
validation for central Florida, in The 1992 International Symposium on Radon and Radon Reduction Technology,
Minneapolis, Minnesota, September 22-25, 1992: U.S. Environmental Protection Agency, Preprints [poster
papers], v. 5, no. VIIIP-2, 19 p.
Ogden, Albert E., William B. Welling, Robert D. Funderbrng, and Larry C. Boschult, 1987, A preliminary
assessment of factors affecting radon levels in Idaho, in Graves, Barbara, ed.. Radon in Ground Water: Chelsea,
Mich., Lewis Publishers, p. 83-96
Otton, James K., 1987, Potential for indoor radon hazards: A first geologic estimate, in Radon and the
Environment, Conference Proceedings, Mahwah, NJ., May 8-10, 1986, Makofske, William J., and Michael
R. Edelstein, eds.: Mahwah, NJ., Ramapo College of New Jersey, Inst, for Environmental Studies, p. 28-33
Otton, J.K., 1988, Radon potential of rocks and soils: a Fairfax County case history [abs.], in Proceedings of the
1988 Symposium on Radon and Radon Reduction Technology, Denver, Colorado, Oct. 19-22, 1988: U.S.
Environmental Protection Agency, Washington, D.C.
Otton, J.K., 1989a, Mapping the radon potential of rocks and soils: The Professional Geologist, 26(5): 8; also
Virginia Minerals, 35(1): 2-3
Otton, J.K., 1989b, Using geology to map and understand radon hazards in the United States: U.S. Geol. Survey
Yearbook, Fiscal Year 1988, p. 52-54
Otton, James K., and Sigrid Asher-Bolinder, 1993, Elevated indoor radon associated with soils developed on
Pleistocene limestones in tropical and subtropical latitudes, in The 1993 International Radon Conference, Denver,
Colo., Sept. 20-22, 1993: Denver, Colo., Am. Assoc. Radon Scientists and Technologists, Rocky Mountain
Chapter, Preprints, p. IV 32—^TV 39
Otton, James K., and Joseph S. Duval, 1991, Geologic controls on indoor radon in the Pacific Northwest, in The1990 International Symposium on Radon and Radon Reduction Technology, Atlanta, Ga., 19-23 February 1990:
Research Triangle Park, N.C., U.S. Environmental Protection Agency Rept. EPA600/9-91-026b, Proceedings,
Vol. 2: Symposium Oral Papers, Paper No. VI-5, p. 6-51—6-62 [NTIS Order No. PB91-234450/AS]
Otton, James K., and Linda C.S. Gundersen, 1988, Geologic assessments of radon potential at county scales
[abs.], in Radon in the Northeast: Perspectives and Geolo^c Research (conference), Troy and Albany, NewYork, May 31-Jime 2, 1988: Northeastern Environmental Science, 7(1): 7
Otton, James K., R. Randall Schumann, Douglass E. Owen, and Alan F. Chleborad, 1988, Geological
assessments of radon hazards: A Colorado case history [poster abstract], in Marikos, Mark A., and Robert
H. Hansman, eds., Geolo^c Causes of Natural Radionuclide Anomalies, Proceedings of the GEORADConference, St. Louis, Mo., April 21-22, 1987: Rolla, Mo., Missouri Dept. Nat. Resources, Div. Geology and
Land Survey Spec. Pub. No. 4, p. 167
Otton, J.K., R.R. Schumann, D.E. Owen, Nelson Thurman, and J.S. Duval, 1988, Map showing radon potential
of rocks and soils in Fairfax County, Virginia: U.S. Geol. Survey Misc. Field Studies Map MF-2047.
34

Owen, Douglass E., 1989, Characterization of radon: Constraints of scale. Sec. O, in Duray, John R., etul.^ eds.,
Proceedings of the Technical Exchange Meeting on Assessing Indoor Radon Health Risks, Grand Junction,
Colo., September 18-19, 1989: Grand Junction, Colo., U.S. Dept. Energy, Grand Junction Projects OfGce, Tech.
Measurements Center, Rept. CONF-8909190, 2 p.
Padovani, Renato, and Maria Rosa MaUsan, 1993, Assessment of radon exposure in kindergartens in north-east
Italy [abs.], in First International Workshop on Indoor Radon Remedial Action, The Scientific Basis and Practical
Applications, Rimini, Italy, 27 June-2 July 1993: Commission of the European Communities et aL, Book of
Abstracts, p. 105
Peake, R. Thomas, 1988a, An update on EPA radon geology activities [abs.], in Radon in the Northeast:
Perspectives and Geologic Research (conference), Troy and Albany, New York, May 31-June 2, 1988:
Northeastern Environmental Science, 7(1): 8
Peake, R.T., 1988b, Radon and geology in the United States: Radiation Protection Dosimetry, 24(1/4): 173-178
Peake, R. Thomas, 1988c, Radon entry efficiency: A new look at radon entry into homes [abs.], in Radon in the
Northeast: Perspectives and Geologic Research (conference), Troy and Albany, New York, May 31-June 2, 1988:
Northeastern Environmental Science, 7(1): 8
Peake, R. Thomas, 1990, Preliminary identification of high radon potential areas in twenty-five States [abs.], in
The 1990 International Symposium on Radon and Radon Reduction Technology, Atlanta, Ga., 19-23 February
1990: Preprints, Vol. HI, no. C-VI-1
Peake, R. Thomas, and L.C.S. Gundersen, 1989, An assessment of the radon potential of the U.S. Coastal Plain
[abs.]: Geol. Soc. America, Northeastern Section, Abstracts with Programs, 21(2): 58
Peake, R. Thomas, Linda C.S. Gundersen, R. Randall Schumann, JuUe James, and Melinda Ronca-Battista, 1991,
Determination of radon-geologic provinces in the United States, in The 1990 International Symposium on Radonand Radon Reduction Technology, Atlanta, Ga., 19-23 February 1990: Research Trian^e Park, N.C., U.S.
Environmental Protection Agency Rept. EPA600/9-91-026c, Proceedings, Vol. 3: Symposium Poster Papers,
Paper No. C-VI-1, p. 6-l-^-12 [NTIS Order No. PB91-234468/AS]
Peake, R.T., L.C.S. Gundersen, and C.R. Wiggs, 1988, The Coastal Plain of the eastern and southern United
States-An area of low radon potential [abs.]: Geol. Soc. America, Abstracts with Programs, 20(7): A337
Peake, R. Thomas, and Susan M. Rush, 1988, An initial identification of areas with a potential for high indoor
radon levels [poster abs.], in Marikos, Mark A., and Robert H. Hansman, eds.. Geologic Causes of Natural
Radionuclide Anomalies, Proceedings of the GEORAD Conference, St. Louis, Mo., April 21-22, 1987: Rolla,
Mo., Missouri Dept. Nat. Resources, Div. Geology and Land Survey Spec. Pub. No. 4, p. 173
Peake, R. Thomas, and R. Randall Schumann, 1991, Regional radon characterizations, in Gundersen, Linda C.S.,
and Richard B. Wanty, eds.. Field studies of radon in rocks, soils, and water: U.S. Geol. Survey Bulletin no. 1971,
p. 163-175
Phillips, Jeffrey L., Jane Bergsten, and S.B. White, 1991, A cumulative examination of the State/EPA RadonSurvey, in The 1991 International Symposium on Radon and Radon Reduction Technology, Philadelphia, Pa.,
2-5 April 1991: Preprints, unnumbered, 17 p.
35

Podsednik, Mary L., 1991, Geologic assessment of radon-222 in McLennan County, Texas, in The 1991
International Symposium on Radon and Radon Reduction Technology, Philadelphia, Pa., 2-5 April 1991:
Preprints, v. 5, no. IXP-4, 14 p.
Poffijn, A., G. Eggermont, S. Hallez, and P. Cohilis, 1993, Radon in Bel^um: Mapping and mitigation in the
affected area of Vis6 [abs.], in First International Workshop on Indoor Radon Remedial Action, The Scientific
Basis and Practical Applications, Rimini, Italy, 27 June-2 July 1993: Commission of the European Communities
et al.^ Book of Abstracts, p. 31
Ranger, L. Scott, 1993, Geologic control of radon in the greater Atlanta region, Georgia, in The 1993
International Radon Conference, Denver, Colo., Sept. 20-22, 1993: Denver, Colo., Am. Assoc. Radon Scientists
and Technologists, Rocky Mountain Chapter, Preprints, p. FVP 2—^TVP 11
Rector, Harry E., 1991, Soil gas measurement technolo^es, in The 1991 International Symposium on Radon and
Radon Reduction Technology, Philadelphia, Pa., April 2-5, 1991, Proc., Volume 1, Symposium Oral Papers,
Opening Session and Technical Sessions 1 through 5: U.S. Environmental Protection Agency Rept. EPA/600/9-
91/037A, p. 3-13—^3-28 McLean, Va., Cohen (S.) and Associates, Inc. [Springfield, Va., NTIS Order No. PB92-
115351]
Reesman, A.L., 1988, Geomorphic and geochemical enhancement of radon emission in middle Tennessee, in
Marikos, Mark A., and Robert H. Hansman, eds.. Geologic Causes of Natural RadionucUde Anomalies,
Proceedings of the GEORAD Conference, St. Louis, Mo., April 21-22, 1987: RoUa, Mo., Missouri
Dept. Nat. Resources, Div. Geology and Land Survey Spec. Pub. No. 4, p. 119-130
Reimer, GJM., 1988a, An integrated approach to assess potential radon content of soils using geologic, gamma-ray and soil-gas data [abs.]: Geol. Soc. America, Abstracts with Programs, 20(7): A354
Reimer, GM., 1988b, Radon soil-gas survey in Prince Georges County, Maryland: U.S. Geol. Survey Open-file
Rept. 88-52, 10 p.
Reimer, G.M., 1990, Reconnaissance techniques for determining soU-gas radon concentrations: An example from
Prince Georges County, Maryland: Geophys. Research Letters, 17(6): 809-812
Reimer, G.M., 1991, Simple techniques for soil-gas and water sampling for radon analysis, in Gundersen, Linda
C.S., and Richard B. Wanty, eds.. Field studies of radon in rocks, soils, and water: U.S. Geol. Survey Bulletin
no. 1971, p. 19-22
Reimer, G.M., 1992, Methodology for rapid assessment of the radon potential of soils: Jour. Radioanalyt. Nuclear
Chemistry, Articles, 161(2): 377-387
Reimer, G.M., and L.C.S. Gundersen, 1989, A direct correlation among indoor Rn, soil gas Rn and geology in
the Reading Prong near Boyertown, Pennsylvania: Health Physics, 57(1): 155-160
Reimer, G.M., Linda C.S. Gundersen, S.L. Szarzi, and J.M. Been, 1991, Reconnaissance approach to using
geology and soil-gas radon concentrations for making rapid and preliminary estimates of indoor radon potential,
in Gundersen, Linda C.S., and Richard B. Wanty, eds.. Field studies of radon in rocks, soils, and water: U.S.
Geol. Survey Bulletin no. 1971, p. 177-181
Revzan, K.L., A.V. Nero, and R.G. Sextro, 1988, Mapping surficial radium content as a partial indicator of radon
concentrations in US houses: Radiation Protection Dosimetry, 24(1/4): 174-184
36

Rizzuto, Joseph E., 1988, New York State Energy Research and Development Authority radon program [abs.],
in Radon in the Northeast: Perspectives and Geologic Research (conference), Troy and Albany, New York, May31-June 2, 1988: Northeastern Environmental Science, 7(1): 9
Rogers, V.C., and K.K. Nielson, 1991, Correlations for predicting air permeabilities and Rn diffusion
coefficients of soils: Health Physics, 61(2): 225-230
Rogers, Vem C., and Kirk K. Nielson, 1992, Data and models for radon transport through concrete, in The 1992
International Symposium on Radon and Radon Reduction Technology, Minneapolis, Minnesota, September 22-
25, 1992: U.S. Environmental Protection Agency, Preprints, v. 2, no. VI-3, 15 p.
Rogers, V.C., K.K. Nielson, and D.R. Kalkwarf, 1984, Radon attenuation handbook for uranium mill tailings
cover design: Salt Lake City, Utah, Rogers and Associates Engineering Corporation, U.S. Nuclear Regulatory
Commission Rept. NUREG/CR-3533, 85 p.
Roserens, G.-A., 1993, Radon program in Switzerland—Remedial actions [abs.], in First International Workshop
on Indoor Radon Remedial Action, The Scientific Basis and Practical Applications, Rimini, Italy, 27 June-2 July
1993: Commission of the European Communities et ah. Book of Abstracts, p. 23
Ross, B.C., M.R. Atkinson, and D.W. Dbcon, 1993, Regional variations in occupational exposure to radon and
the resulting regulatory enforcement procedures [abs.], in First International Workshop on Indoor Radon
Remedial Action, The Scientific Basis and Practical Applications, Rimini, Italy, 27 June-2 July 1993: Commission
of the Eiuopean Communities et al.. Book of Abstracts, p. 103
Sachs, H.M., T.L. Hernandez, and J.W. Ring, 1982, Regional geology and radon variability in buildings:
Environment Intemat., 8(1-6): 97-103
Samuelson, Alan C., David Ober, Thad Godish, David Govaer, and Alice Bennett, 1988, Air and water radon
investigations in east-central Indiana [abs.]: Geol. Soc. America, Abstracts with Programs, 20(7): A338
Sanchez, David C., Richeird Dixon, and Ashley D. Williamson, 1991, The Florida Radon Research Program:
Systematic development of a basis for statewide standards, in The 1990 International Symposium on Radon and
Radon Reduction Technology, Atlanta, Ga., 19-23 February 1990: Research Triangle Park, N.C., U.S.
Environmental Protection Agency Rept. EPA600/9-91-026c, Proceedings, Vol. 3: Symposium Poster Papers,
Paper No. A-I-3, p. 1-21—1-37 [NTIS Order No. PB91-234468/AS]
Schumann, R. Randall, ed., 1993a, Geologic radon potential of EPA Region 1, Connecticut, Maine, Massachu-
setts, New Hampshire, Rhode Island, and Vermont: U.S. Geol. Survey Open-file Rept. 93-292-A, ii 4- 245 p.
Schumann, R. Randall, ed., 1993b, Geologic radon potential of EPA Region 2, New Jersey and New York:
U.S. Geol. Survey Open-file Rept. 93-292-B, ii + 131 p.
Schumann, R. Randall, ed., 1993c, Geologic radon potential ofEPA Region 3, Delaware, Maryland, Pennsylvania,
Virginia, and West Virginia: U.S. Geol. Survey Open-file Rept. 93-292-C, ii + 206 p.
Schumann, R. Randall, ed., 1993d, Geologic radon potential of EPA Region 4, Alabama, Florida, Georgia,
Kentucky, Mississippi, North Carolina, South Carolina, and Tennessee: U.S. Geol. Survey Open-file Rept.
93-292-D, ii + 274 p.
Schumann, R. Randall, ed., 1993e, Geologic radon potential of EPA Region 5, Illinois, Indiana, Michigan,
Minnesota, Ohio, and Wisconsin: U.S. Geol. Survey Open-file Rept. 93-292-E, ii + 194 p.
37

Schumann, R. Randall, ed., 1993f, Geologic radon potential ofEPA Re^on 6, Arkansas, Louisiana, New Mexico,
Oklahoma, and Texas: U.S. Geol. Survey Open-file Rept. 93-292-F, ii + 160 p.
Schumann, R. Randall, ed., 1993g, Geologic radon potential of EPA Region 7, Iowa, Kansas, Missouri, and
Nebraska: U.S. Geol. Survey Open-file Rept. 93-292-G, ii + 147 p.
Schumann, R. Randall, ed., 1993h, Geologic radon potential of EPA Region 8, Colorado, Montana, North
Dakota, South Dakota, Utah, and Wyoming: U.S. Geol. Survey Open-file Rept. 93-292-H, ii + 184 p.
Schumann, R. Randall, ed., 1993i, Geologic radon potential of EPA Region 9, Arizona, California, Hawaii, and
Nevada: U.S. Geol. Survey Open-file Rept. 93-292-1, ii + 142 p.
Schumann, R. Randall, ed., 1993j, Geolo^c radon potential of EPA Region 10, Alaska, Idaho, Oregon, and
Washington: U.S. Geol. Survey Open-file Rept. 93-292-J, ii + 146 p.
Schumann, R. Randall, ed., 1994, Geologic radon potential of the District of Columbia, Guam, and Puerto Rico:
U.S. Geol. Survey Open-file Rept. 93-292-K (in preparation)
Schumann, R.R., L.C.S. Gundersen, S. Asher-Bolinder, and D.E. Owen, 1989, Anomalous radon levels in
crystalline rocks near Conifer, Colorado [abs.]: Geol. Soc. America, Abstracts with Programs, 21(6): A144-A145
Schumann, R. Randall, R. Thomas Peake, Kevin M. Schmidt, and Douglass E. Owen, 1991, Correlations of soil-
gas and indoor radon with geology in glacially derived soils of the northern Great Plains, in The 1990
International Symposium on Radon and Radon Reduction Technology, Atlanta, Ga., 19-23 February 1990:
Research Triangle Park, N.C., U.S. Environmental Protection Agency Rept. EPA600/9-91-026b, Proceedings,
Vol. 2: Symposium Oral Papers, Paper No. VI-3, p. 6-23—-6-36 [NTIS Order No. PB91-234450/AS]
Schiitz, M., and G. Keller, 1993, Diurnal and seasonal variation of radon concentration in the upper layer of the
soil [abs.], in First International Workshop on Indoor Radon Remedial Action, The Scientific Basis and Practical
Applications, Rimini, Italy, 27 June-2 July 1993: Commission of the European Commumties et al.y Book of
Abstracts, p. 72
Scott, A.G., 1992, Site characterization for radon supply potential: A progress review: Health Physics, 62(5):
422-428
Sextro, Richard G., 1987, Understanding the origin of radon indoors—^Building a predictive capability [from
Conference on Characterization of Contaminant Emissions fi’om Indoor Sources, Chapel HiU, NC, May 13-15,
1985]: Atmospheric Environment, 21: 431-438 [Original Pub.: Lawrence Berkeley Laboratory Rept. LBL-20210,
21 p.]
Sextro, Richard G., and Ashok J. Gadgil, 1993, Modeling radon entry into buildings: Insights for radon control
[abs.], in First International Workshop on Indoor Radon Remedial Action, The Scientific Basis and Practical
Applications, Rimini, Italy, 27 June-2 July 1993: Commission of the European Communities et al.^ Book of
Abstracts, p. 45
Sextro, R.G., BA. Moed, W.W. Nazaroff, K.L. Revzan, and A.V. Nero, 1987, Investigations of soil as a source
of indoor radon. Chap. 2, in Hopke, Philip K., ed.. Radon and Its Decay Products; Occurrence, Properties, and
Health Effects: Washington, Am. Chem. Soc. Symposium Ser. 331, p. 10-29
Sextro, R.G., Nazaroff, W.W., and Turk, BU., 1989, Spatial and temporal variation in factors governing the
radon source potential of soil, in Osborne, M.C., and Jed Harrison, Symposium Cochairmen, The 1988
38

Symposium on Radon and Radon Reduction Technology, Proc., Vol. 1, Symposium Oral Papers: Research
Triangle Park, N.C., Radian Corp., U.S. Environmental ProtectionAgency Pub. EPA/600/9-89/006a [Springfield,
Va., NTIS Order No. PB89-167480], p. 5-61-5-74.
Sherman, Max, 1993, Simplified modeling for infiltration and radon entry, in Proceedings: The 1992 International
Symposium on Radon and Radon Reduction Technology, 4th, Minneapolis, Minn., Sept. 22-25, 1992. Vol. 1,
Symposium Oral Papers, Opening Session and Technical Sessions I-VI: Research Triangle Park, N.C., U.S.
Environmental Protection Agency Rept. EPA-600/R-93/083a, p. 6-57—6-78
Singler, C.R., E.C. Abram, and I.U. Khawaja, 1993, A predictive model for determining indoor radon levels in
northeastern Ohio, in The 1993 International Radon Conference, Denver, Colo., Sept. 20-22, 1993: Denver, Colo.,
Am. Assoc. Radon Scientists and Technologists, Rocky Mountain Chapter, Preprints, p. IVP 12~IVP 13
Siniscalchi, Alan J., Lynne M. Rothney, Brian F. Toal, Margaret A. Thomas, David R. Brown, Maria C. van der
Werff, and Carolyn J. Dupuy, 1991, Radon exposure in Connecticut: Analysis of three statewide surveys of nearly
one percent of single family homes, in The 1990 International Symposium on Radon and Radon Reduction
Technology, Atlanta, Ga., 19-23 February 1990: Research Triangle Park, N.C., U.S. Environmental Protection
Agency Rept. EPA600/9-91-026a, Proceedings, Vol. 1: Symposium Oral Papers, Paper No. IV-1, p. 4-1—4-14
[NTIS Order No. PB91-234443/AS]
Slunga, E., 1988, Radon classification of building ground: Radiation Protection Dosimetry, 24(1/4): 39-42
Smith, Geoffrey W., Royal H. Mapes, Robert J. Hinkel, and Rick L. Darr, 1989, Radon hazards associated with
glacial deposits in Ohio [abs.]: Geol. Soc. America, Abstracts with Programs, 21(6): A144
Solomon, Barry J., Bill D. Black, Dane L. Finerfrock, and John Hultquist, 1993, Geologic mapping of radon-
hazard potential in Utah, in The 1993 International Radon Conference, Denver, Colo., Sept. 20-22, 1993: Denver,
Colo., Am. Assoc. Radon Scientists and Technologists, Rocky Mountain Chapter, Preprints, p. FVP 14—IVP 28
Speer, J. Alexander, Gregory T. Bertwell, Kevin W. Hoff, and Thomas J. Douglas, 1993, Using heat flow
measurements to estimate and verify the total radon hazard potential of granites, southeastern United States,
in The 1993 International Radon Conference, Denver, Colo., Sept. 20-22, 1993: Denver, Colo., Am. Assoc. RadonScientists and Technologists, Rocky Mountain Chapter, Preprints, p. FV 10—FV 19
Sprinkel, Douglas A., 1988, Assessing the radon hazard in Utah: Utah Geological and Mineral Survey, Survey
Notes, 22(4): 3-13
Steck, Daniel J., 1988, Geological variation of radon sources and indoor radon along the southwestern edge of
the Canadian Shield, in Marikos, Mark A., and Robert H. Hansman, eds.. Geologic Causes of Natural
Radionuclide Anomalies, Proceedings of the GEORAD Conference, St. Louis, Mo., April 21-22, 1987: RoUa,
Mo., Missouri Dept. Nat. Resources, Div. Geology and Land Survey Spec. Pub. No. 4, p. 17-23
Steck, DJ., and MJ. Bergmann, 1992, Indoor radon and the radon potential of soils, in The 1992 International
Symposium on Radon and Radon Reduction Technology, Minneapolis, Minnesota, September 22-25, 1992: U.S.
Environmental Protection Agency, Preprints, v. 3, no. VIII- 1, 15 p.
Stieff, L.R., C.B. Stieff, and RA. Nelson, 1987, Field measurements of in situ ^Rn concentrations in soil based
on the prompt decay of the ^^'^Bi counting rate: Nuclear Geophysics, 1(2): 183-195
Surbeck, H., and Filler, G., 1989, A closer look at the natural radioactivity in soils, in Osborne, M.C., and Jed
Harrison, Symposimn Cochairmen, The 1988 Symposium on Radon and Radon Reduction Technology, Proc.,
39

Vol. 1, Symposium Oral Papers: Research Triangle Park, N.C., Radian Corp., U.S. Environmental Protection
Agency Pub. EPA/600/9-89/006a [Springfield, Va., NTIS Order No. PB89-167480], p. 5-13-5-26.
Surbeck, H., H. Volkle, and W. Zeller, 1991, Radon in Switzerland, in The 1991 International Symposium on
Radon and Radon Reduction Technology, Philadelphia, Pa., 2-5 April 1991: Preprints, v. 3, no. VI-3, 16 p.
Swedish Radon Commission (Radonutredningen), 1983, Radon in dwellings. Report from the Radon
Commission [in Swedish]: Stocl^olm, Ministry of Agriculture, SOU 1983:6, 145 p. [ISBN 91-38-07433-8]
Swedjemark, Gun Astri, 1982, Buildings with enhanced radioactivity in Sweden, in Vohra, K.G., U.C. Mishra,
K.C. Pillai, and S. Sadasivan, eds., Natural Radiation Environment: New York, John Wiley and Sons, p. 535-542,
disc., 542-543
Szarzi, S.L., G.M. Reimer, and J.M. Been, 1990, Soil-gas and indoor radon distribution related to geology in
Frederick County, Maryland [poster abs.], in Indoor Radon and Lung Cancer: Reality or Myth?^ Hanford
Symposium on Health and the Environment, 29th, Richland, Washington, October 15-19, 1990: Richland, Wash.,
Battelle Pacific Northwest Laboratories, Final Program, p. 95-96
Tanner, Allan B., 1957, Physical behavior of radon, in U.S. Geological Survey, Geologic investigations of
radioactive deposits, semiann. progress report, June 1 to November 30, 1957: U.S. Geol. Survey Rept. TEI-700:
243-246
Tanner, Allan B., 1986, Geological factors that influence radon availability, in Indoor Radon, Proceedings of the
APCA International Specialty Conference, Philadelphia, Pa., February 24-26, 1986: Air Pollution Control Assoc.,
P.O. Box 2861, Pittsburgh, PA 15230, Pub. SP-54, p. 1-12
Tanner, Allan B., 1988a, Measurement of radon availability from soil, in Marikos, Mark A., and Robert
H. Hansman, eds., Geolo^c Causes of Natursd Radionuclide Anomalies, Proceedings of the GEORADConference, St. Louis, Mo., April 21-22, 1987: Rolla, Mo., Missouri Dept. Nat. Resources, Div. Geology and
Land Survey Spec. Pub. No. 4, p. 139-146.
Tanner, A.B., 1988b, A tentative protocol for measurement of radon availability from the ground, in Natural
Radioactivity, International Symposium on the Natural Radiation Environment, 4th, Lisbon, Portugal, December7-11, 1987, Proceedings: Radiation Protection Dosimetry, 24(1/4): 79-83
Tanner, A3., 1991a, Error in measuring radon in soil gas by means of passive detectors: Nuclear Geophysics,
5(1/2): 25-30
Tanner, Allan B., 1991b, Methods of characterization of ground for assessment of indoor radon potential at a
site, in Gundersen, Linda C.S., and Richard B. Wanty, eds., Field studies of radon in rocks, soils, and water: U.S.
Geol. Survey Bulletin no. 1971, p. 1-18
Tanner, Allan B., 1991c, The role of diffusion in radon entry into houses, in The 1990 International Symposiumon Radon and Radon Reduction Technology, Atlanta, Ga., 19-23 February 1990: Research Triangle Park, N.C.,
U.S. Environmental Protection Agency Rept. EPA600/9-91-026b, Proceedings, Vol. 2: Symposium Oral Papers,
Paper No. V-2, p. 5-21—5-32 [NTIS Order No. PB91-234450/AS]
Terry, David B., and Robert D. Shumeyko, 1988, Geologic correlation with elevated indoor radon occurrence,
Bergen County, New Jersey [abs.], in Radon in the Northeast: Perspectives and Geolo^c Research (conference),
Troy and Albany, New York, May 31-June 2, 1988: Northeastern Environmental Science, 7(1): 10
40

Thomas, D[onald] M., J[effl M. Cotter, and D[iana] Holford, 1992, Experimental design for soil gas radon
monitoring: Jour. Radioanalyt. Nuclear Chemistry, Articles, 161(2): 313-323
Thomas, MA., and J.N. Hollis, 1988, Correlating radon distribution with geology and areal radioactivity in
Connecticut [abs.], in Radon in the Northeast: Perspectives and Geologic Research (conference), Troy and
Albany, New York, May 31-June 2, 1988: Northeastern Environmental Science, 7(1): 10
Turk, Bradley H., Jed Harrison, Richard J. Prill, and Richard G. Sextro, 1990, Developing soil gas and ^^Rnentry potentials for substructure surfaces and assessing ^^^Rn control diagnostic techniques: Health Physics, 59(4):
405-419
Tiuk, B.H., RJ. Prill, WJ. Fisk, D.T. Grimsrud, BA. Moed, and R.G. Sextro, 1987, Radon and remedial action
in Spokane River Valley houses: Vol. 1: Experimental design and data analysis: Berkeley, Calif., Univ. California
Lawrence Berkeley Laboratory Rept. LBL-23430
Ulbak, K., B. Stenum, A[me] Sorensen, B[enny] Majbom, L[ars] Botter-Jensen, and S[ven] P[oul] Nielsen, 1988,
Results from the Danish indoor radiation survey: Radiation Protection Dosimetry, 24(1/4): 401-405
van Assendelft, A.C.E., and H.M. Sachs, 1982, Soil and re^onal uranium as controlling factors of indoor radon
in eastern Pennsylvania: Princeton, NJ, Princeton Univ. Center for Energy and Environmental Studies
Rept. PU/CEES-145, 68 p.
van den Boom, Gunter, and Matthias Ort, 1991, Reconnaissance survey for determining radon and helium soil-air
concentrations in the area of Ronneburg-Seelingstadt, Germany [abs.], in International Symposium on the
Natural Radiation Environment, 5th, Salzburg, Austria, 22-28 September 1991, Abstracts: Salzburg, Univ.
Salzburg, Inst, for General Biology, Biochemistry and Biophysics, abs. no. 168
Verger, P., Ph. Hubert, and S. Ch6ron, 1993, Use of field measurement in mapping [abs.], in First International
Workshop on Indoor Radon Remedial Action, The Scientific Basis and Practical Applications, Rimini, Italy, 27
June-2 July 1993: Commission of the European Communities et al.^ Book of Abstracts, p. 79
Vilj 2men, Martti, Eero Slunga, Timo Lehtoviita, and Pekka Kanerva, 1987, Radon merkitys
talonrakennustekniikassa. Radontekninen suunnittelu [Radon in building technology. Radontechnical design]:
Espoo, Finland, Helsinki Univ. Technology, Dept. Civil Engineering, Div. Structural Engineering Rept. 88,147 p.
Voutilainen, Anne, and Ilona Makelainen, 1991, The use of indoor radon measurements and geological data in
assessing the radon risk of soil and rock in construction sites in Tampere [SW Finland], in The 1991 International
Symposium on Radon and Radon Reduction Technology, Philadelphia, Pa., 2-5 April 1991: Preprints, v. 2, no.
in-8, 13 p.
Vulcani, Julie, and James R. Wood, 1993, Soil gas radon potential of the Upper Peninsula of Michigan:
Houghton and Marquette Counties, in The 1993 International Radon Conference, Denver, Colo., Sept. 20-22,
1993: Denver, Colo., Am. Assoc. Radon Scientists and Technolo^ts, Rocky Mountain Chapter, Preprints,
p. IVP 29—IVP 36
Wanty, R.B., L.C.S. Gundersen, and R.R. Schumann, 1990, Geological factors affecting radionuclide mobility
[abs.], in Gough, L.P. (ed), Proceedings of the USGS Environmental Forum 1990: U.S. Geol. Survey Open-file
Rept. 90-288, p. 15-16
41

Washington, Paul A., 1988, Proper scaling of radon surveys: A perspective based on natural radon sources in
southern Vermont, in Radon in the Northeast: Perspectives and Geologic Research (conference), Troy and
Albany, New York, May 31-June 2, 1988: Northeastern Environmental Science, 7(1): 40-44
Wilson, Carole, 1984, Mapping the radon risk of our environment, in International Conference on Indoor Air
Quality and Climate, 3d, Stockholm, August 20-24, 1984; Vol. 2: Radon, Passive Smoking, P2U‘ticulates and
Housing Epidemiology, Birgitta Berglund, Thomas Lindvall, and Jan Sundell, eds.: Stockholm, Swedish Council
for Building Research, Vol. 2, p. 85-92
Wilson, Carole, 1985-1986, Radon - Geological aspects of an environmental problem: [Lxjndon Geol. Soc. &Manchester Geol. Assoc.] The Amateur Geologist, Vol. XI, Pt. 2, p. 17-22, 27-33
WoUenberg, HA., and K.L. Revzan, 1990, Radium regionalization in California: Geophys. Research Letters,
17(6): 805-808
WoUenberg, HA., and A.R. Smith, 1984, NaturaUy occurring radioelements and terrestrial gamma-ray exposure
rates: An assessment based on recent geochemical data: Berkeley, Csilif., Univ. Calif. Lawrence Berkeley
Lab. Rept. LBL-18714, 79 p. [Submitted to Environmental Geology and Water Resources]
Yokel, Felix Y., 1989, Site characterization for radon source potential: Gaithersburg, Md., Natl. Inst. Standards
and Technology Rept. NISTIR 89-4106, 62 p.
Yokel, Felix Y., and AUan B. Tanner, 1992, Site exploration for radon source potential: U.S. Natl. Inst, of
Standards and Technology Rept. NISTIR 5135, 61 + xv p.
Zapalac, Geordie H., 1983, A time-dependent method for characterizing the diffusion of ^^^Rn in concrete:
Health Physics, 45(2): 377-383
42

APPENDIX A. BIBLIOGRAPHYONMEASUREMENTAND DETERMINATION OFRADON SOURCE POTENTIAL
Note: Square brackets[ ]
denote summaries, comments, or supplementary information by the compiler.
Agard, Sherry S., and Linda C.S. Gundersen, 1991
The geology and geochemistry of soils in Boyertown and Easton, Pennsylvanizi, in Gundersen, Linda C.S., and
Richard B. Wanty, eds.. Field studies of radon in rocks, soils, and water:
U.S. Geol. Survey Bulletin no. 1971, p. 51-63
Soils derived from a wide variety of metamorphic rocks in the Reading Prong, Pennsyivania, exhibit secular
equilibrium between uranium and radium. Direct correlations between luanium, radium, radon in soil gas,
and indoor radon indicate that radon in soil gas is attributable to the uranium content of the soils and can be
used predictively to estimate levels of indoor radon. Permeabihty of the soils does not vary enough to affect
the radon availability except where fractured and jointed bedrock is close to the surface, in which case
convective flow, rather than diffusion, becomes the dominant radon tr2msport mechanism. Radon emanation
of soils, as measured in the laboratory, correlates well with radium, radon in soil gas, and indoor radon.
Careful examination of the physical and chemical properties of the soil must be made in order for radon in
soil gas to be used as an effective predictor of indoor radon levels. In addition, predictions of indoor radon
levels based on radon in soil gas and geology are limited to ranges of values because of the inherent variabihty
in soil makeup.
Akerblom, Gustav, 1986
Investigation and mapping of radon risk areas:
Lulei, Sweden: Swedish Geological AB, Rept. IRAP 86036, 15 p.
It is estimated that in Sweden 400-800 lung cases of lung cancer per year are caused from the inhalation of radon
and radon daughters. Extensive regional surveys of radon daughters in dwellings, together with investigations
of geology and building construction have revealed that radon in soil air is the primary source of indoor radon
pollution. Documentation of the natural radiation environment in a geological context is invaluable for tracing
areas of high radon risk, for understanding the local causes of indoor radon problems, and for choosing
suitable remedial measures, both for eristing dwellings and for future building construction. Classification of
areas into high, normal, or low radon risk must take into account not only the distribution of uranium and
radium in the bedrock and soils, but also such parameters as sod permeability, water content, and thickness
of individual sod layers. Radon in sod air in gravel in glacial eskers, for example, has proved in Sweden to give
rise to a serious radon problem. On the other hand, clays, with approximately the same radium content, do
not generady give rise to a radon problem in dwellings owing to their very low permeability to movement of
sod air.
Akerblom, Gustav, 1987
Investigations and mapping of radon risk areas, in Wolff, F.C., ed.. Geology for Environmental Planning,
Proceedings of the International Symposimn on Geological Mapping in the Service of Environmental Planning,
Trondheim, 6-9 May, 1986:
Trondheim, Norwegian Geological Survey, P.O. 3006, Trondheim, Norway, Special Papers, no. 2, p. 96-106
[See abstract from report above.]
Akerblom, Gustav, 1991
Mapping and investigation of the risk for radon from the ground [abs.], in International Symposium on the
Natural Radiation Environment, 5th, Salzburg, Austria, 22-28 September 1991, Abstracts:
Salzburg, Univ. Salzburg, Inst, for General Biology, Biochemistry and Biophysics, abs. no. 180
Geological mapping and investigations of the risk for radon from the ground have been made in Sweden since
1979. Paradel to these investigations research has continued on radon in sod air and transport of radon into
houses. The investigations and research have resulted in a good knowledge of parameters that govern the
43

radon concentration in soil air and indoors. Up to now radon risk maps at the scale of 1:50 000 or larger have
been produced for more than half of Sweden. The maps give information to the local authorities on the radon
situation in different parts of the municipalities. The main purpose of the maps is to use them in physical
planning, but they also give valuable information in the search for "radon houses." The Swedish building
regulations prescribe that the radon situation at a building site has to be investigated, and if there is a risk
for radon gas, precautions have to be taken so that radon cannot come into the building. According to the
risk for radon, the ground is classified into risk groups and the building has to be constructed to meet the risk.
The following classification rules (here simplified) are used: High risk areas are expected on uranimn-rich
granites, pegmatites, and alum shale [dark marine shale], and in highly permeable soils, such as gravels and
coarse sands, in which the radon concentration in soil air is >50 kBq/m^; radon-safe construction such as
thicker, reinforced concrete foundation or ventilation below the foundation is required. Normal risk areas are
expected on rocks and soils with low or normal uranium content and average permeability, in which the radon
concentration in soil gas is between 10 and 50 kBq/m^; radon protective construction with no open holes in
the foundation is required. Low risk areas are expected on rocks with very low uranium content, for example,
limestone, sandstone and basic igneous and volcanic rocks, and soils with very low permeability, for example,
clay and silt or soils where the radon concentration in soil air is <10 kBq/m^; no special budding technical
requirements apply. HOf the Swedish area approximately 10% consists of high risk areas, 70% of normal risk
areas, and 20% of low risk areas. The classification of the radon risk is based on surveys of bedrock and soils,
measurements of gamma radiation, in situ analyses of the radium concentration in bedrock and soils with
portable gamma spectrometers, and measurements of radon in the soil air and ground waters. In the paper
the methods used are described and results from the investigations and research are presented.
Akerblom, Gustav, 1993
Ground radon-monitoring procedures in Sweden, manuscript of lecture given 12 February 1993 at the 'JAG’
Discussion Meeting at "Radon Workshop—Geology, Environment, Techniques" at Royal Astronomical Society,
Burlington House, London:
Stockholm, Swedish Radiation Protection Institute, 14 manuscript p. + 31 illustrations
[This lecture gave a history of radon monitoring in Sweden from 1979 onward: GEO-radiation maps, based on
7-radiation data; research on radon classification ofland, employing additional measurements drill-hole logging,
7-spectrometric analysis of soil and bedrock samples, and sod-gas radon from depths >1 m; radon risk mapping
of districts or municipalities; and site classification. The Swedish airborne spectral 7'ray surveys are conducted
at 30-m altitude and 200-m flight-line spacing, which permits resolution of even small radioactive outcrops.
At more critical places measurement of either soU-gas radon or concentration of ^^^a in samples is
recommended. Evaluation is particularly difficult for sites where a structure will be within 1 m of bedrock.
There are no reports of new houses with high indoor radon levels that result from faulty evaluation of radon
risk.]
Akerblom, G., P. Andersson, and B. Clavensjo, 1984
Soil gas radon-a source for indoor radon daughters:
Radiation Protection Dosimetry, 7(1-4): 49-54
[The provisional limit in Sweden for the concentration of radon progeny in Swedish houses is 400 Bq/m^equilibrium equivalent ^Rn (10.8 pCi/L) at f= 1. Of 1.6 million Swedish houses, 30,000 to 40,000 may exceed
the limit. An investigation was made (Clavensjo, Akerblom, and Andersson, 1983) of 253 houses, sited on
granite or rock waste in Lysekil or Strdmstad, on alum-shale fragments in sand, gravel, or glacial day of the
Fjugesta and Vintrosa areas, and on till, eskers, or bedrock in the Stockholm area. Indoor measurements were
made in each house for 3 months with 2 type F a-track detectors with filter membranes. For 110 of the
houses, bedrock and soil mapping were done, including K-U-T 7-spectrometry in situ, soil-gas radon
measurement with radon-on-activated-charcoal or a-track detectors in 75-mm diameter PVC pipes usually
extending to 1-m depth, and some subslab air measurements with an a-scindUation ceU. At the 1-m depth,
the soil-gas ^Rn correlated with ^^^a. At Vintrosa, an indicated emanating power of ^0% suggested an
alternative explanation, that radon is being transported from an alum shale layer under 12 m of limestone and
non-radioactive limestone till by methane produced in the alum shale. No other evidence of long-distance
44

transport of radon was seen. The better a house is sealed, the greater the concentration of radon builds up
where exhalation to the atmosphere is prevented. The detailed investigations showed that radon was drawn
into houses through holes or cracks in the concrete slabs or the subsurface cellar walls by soil-gas flow driven
by a higher atmospheric pressure in the soil than in the houses. For indoor radon levels to be enhanced or
high, it was necessary that the ground beneath a house be permeable. The contribution to the indoor
radon of a house was calculated from the formula, = where is the radon concentration
in the soil gas, L is the soil-gas flow rate into the ^use,”n is the house ventilation rate, V is the volume of
indoor air, and A is the radon decay constant. Very large volumes of air can leak into houses from eskers; it
is calculated that an indoor level of 10 kBq/m^ requires an intake of about 50 m^ of soil air per hour.]
Akerblom, Gustav, Bemdt Pettersson, and Bengt Ros6n, 1990
Radon i bostader. Markradon [Radon in the soil. Handbook of radon]:
Stockholm, National Council for Building Research Rept. R85:1988 [Revised 1990], 160 p.
Akerblom, G.V., and Carole Wilson, 1981
Radon gas—A radiation hazard from radioactive bedrock and building materials:
Internal. Assoc. Engineering Geology Bull., 23: 51-61
Exposure to radioactive materials is not a problem solely connected with nuclear energy or nuclear weapons.
The past year [1979] has witnessed real concern in Sweden regarding natural radiation hazards in the everyday
environment, in particular exposure to high levels of radon gas and radon daughter products in dwellings. The
source for the radon can be either building materials containing higher than normal amounts of radioactive
elements, or bedrock and/or drift cover with relatively high concentrations of uranium. The bedrock contri-
bution to the radiation hazard relates directly to the uranium-bearing alum shale formation of Cambrian age
and to certain Precambrian uranium- and thorium-enriched granites. The Geological Survey of Sweden is
preparing GEO-radiation maps which show the distribution of rocks and soils which are radioactive. Building
materials incorporating these rock types, in particular alum shale, can also have high radium contents resulting
in the release of radon gas to the indoor atmosphere. This paper summarizes the recommendations of the
Swedish Government Commission set up to investigate the radon problem, and the role of the geolo^t in
delimiting the extent of the problem of natural radiation from the ground. [The paper includes maps showing
the national distribution of the alum shale, areas covered by aerial 7-ray spectral survey as of 1979, examples
of the uranium-component aeroradiometric, geo-radiation, and soil-radon maps.]
Akerblom, Gustav, and Carole Wilson, 1982
Radon—geological aspects of an environmental problem:
Uppsala, Sveriges Geologiska Undersdkning [Swedish Geological Survey], Rapporter och meddelanden [Rept.
& commun.] No. 30, 47 p.
[This report comprises two papers, presented at the International Meeting on Radon-Radon Progeny
Measurements, Montgomery, Alabama, August 27-28, 1981.] "Environmental radon investigations in Sweden,"
p. 3-21, by Gustav Akerblom: In Sweden, radon daughter concentrations of 200-800 Bq/m^(0.05-0.2 WL) are
known to occur in buildings constructed of aerated concrete which has been manufactured from alum shale,
a Cambrian, uranium-rich black shale. As a result of these alarmingly high levels, the Swedish Government
set up, in 1979, a Commission whose task is to initiate research around the problem of radon, and to
recommend remedial measures against natural radiation in dwellings. Based on the recommendations of the
Commission, the Government proposed the following measures: (1) The introduction of provisional limits
permitted for radon daughter concentrations in dwellings. These limits are 400 Bq/m^ (0.11 WL) for existing
buildings and 70 Bq/m^ (0.02 WL) for new development. (2) The use of specific building techniques whendeveloping areas with high soil-gas radon contents. (3) An immediate search for all buildings constructed of
alum-shale-based aerated concrete. HAbout 300,000 houses in Sweden are constructed entirely or partially of
aerated concrete containing alum shale. During 1980, radon daughter levels were measured in 20,000 of these
houses by local health authorities. The first results show that about 14% of the measured houses have radon-
daughter levels exceeding 400 Bq/m . In about 2% of the investigated houses the value exceeded 1,000 Bq/m
45

(0.27 WL), and maximum values of 4,000 to 9,000 Bq/m^ (1.1-2.4 WL) have been measured in some houses.
HRadon daughter levels exceeding 800 Bq/m^ are not caused entirely by radon emanating from building
materials. A contribution of radon from the ground is necessary. Most of the houses with values exceeding
800 Bq/m^ have proved to be sited on ground containing alum shsde, uranium-rich granite, uranium-rich
pegmatite, or on eskers. Many thousands of houses in Sweden are built in such situations. HThe
measurements obtained so far indicate that radon penetrating into buildings is a far greater problem than that
of radon emanating from building materials. Geological and geophysical investigations of risk areas are of the
utmost importance if all new development is to comply with the provisional limits for radon daughter levels
proposed by the Radon Commission. [This report includes discussion of soil investigations by means of 7spectrometers, emanometer probes, a-track detectors, and radon-on-active-charcoal detectors, and includes
a figure showing such traverses and the corresponding surficial geology profile from a Swedish-language report
by Hesselbom, Israelsson, and Tovedal (1981). The traverses were in agreement, the radon emanometer
traverse showing the highest contrast (with differences between two separate measurements), and the 7-ray
traverse showing the least contrast.] "Regional environmental documentation of natural radiation in Sweden,"
p. 22-47, by Carole Wilson: In 1979, when the problem of high radon daughter levels in Swedish houses
became widely publicized, the need for information on variations in the natural radiation environment became
very apparent. The radon problem was at first attributed to radon emanation from alum-shale-based aerated
concrete, but it was soon obvious that ground with an abnormally high uranium content constitutes an even
greater risk for high radon daughter levels in houses. The Geolo^cal Survey of Sweden was commissioned
to produce documentation in map form of all areas and rock types with gamma-ray levels exceeding 30 fjR/hi,
with the intention of delimiting risk areas for high soil-gas radon contents. The maps, known as
GEO-radiation maps, are produced at a scale of 1:50,000. They are based primarily on airborne radiometric
surveys, ground measurements of 7 radiation,and geological mapping. To date, some 450 map sheets have
been published, covering approximately 55% of the country. The maps provide primary information to local
planning, health, and building authorities as to variations in the natural radiation environment. Within the so-
called risk areas marked on the maps, local authorities are recommended to investigate the soil-gas radon
content prior to any new development. Geological environments known in Sweden to be associated with radon
daughter problems in dwellings are alum shale, a Cambrian, uranium-rich black shale, uranium-rich granites,
and uranium-rich pegmatites. Both alum shale and uranium-rich granites constitute extensive areas of bedrock.
More recently it has been established that high soil-gas radon concentrations are also associated with glacial
eskers. [Maps show the coimtry-wide distributions of alum shale and of known radioactive granites; larger-
scale maps of ^^"^Bi 7 radiation and bedrock geology near VasterHs, central Sweden; geological and GEO-radiation maps Linkopinj^ southeastern Sweden; ^^"^Bi 7 radiation over FomUsa, Ostergotland, and Svennevad,
southeastern Sweden; ^^^Bi 7 radiation, geology, and GEO-radiation over Molndal, Gothenberg; geology and
^^"^Bi 7 radiation of the Bohus granite complex, western Sweden; and ^^^Bi and geology of the Fjugesta, central
Sweden. A profile illustrates the distribution of fragments of alum shale in glacial drift cover, which may also
illustrate the origin of regionally elevated indoor radon levels in central Ohio, USA.]
Aldenkamp, FJ., L.W. Put, and RJ. de Meijer, 1988
Investigations of the properties of an instrument for in situ exhalation measurements:
Radiation Protection Dosimetry, 24(1/4): 339-342
Arvela, Hannu, 1990
Radon study in 250 Finnish houses with different ventilation systems, in Proceedings of the Fifth International
Conference on Indoor Air Quality and Climate, Toronto, 1990:
Proceedings, p. 3-8
[Radon measurements were made by means of polycarbonate a-track films in 162 detached and semi-detached
homes and 89 apartments randomly selected in metropolitan Helsinki. Natural ventilation, mechanical e?diaust,
and balanced ventilation systems were represented. Linear least-squares regression and analysis of variance
techniques were applied to the radon data and ventilation rates measured by PFT tracers during two-week tests
during the heating season. Summer measurements were made of radon only. Radon sources from the soil
46

and soil permeability were not investigated directly, but house construction, building material, and air-exch2mge
factors could explain only <30% of the observed variations in radon concentration; soil radon concentrations
and permeability were assumed to be the more important factors. Where winter indoor radon concentrations
were low, the winter-summer ratio was near unity or lower, and diffusion was inferred to be important. Where
winter indoor radon concentrations were high, the winter-summer ratios were normally 1.5-2.5, and the
contribution of radon by pressure-driven soil-gas flow was inferred to be dominant. Ventilation alone was
concluded to be generaUy inadequate to cause radon reduction by a factor of >2.]
Arvela, H., I. Makel^en, and O. Castren, 1993
Residential radon survey in Finland:
Helsinki, Sateilyturvakeskus (STUK) Str^akerhetscentralen [Finnish Centre for Radiation and Nuclear Safety,
Rept. STUK-A108, 34 p. + app. 15 p.
This study measured the indoor radon concentration in the dwellings of 3074 persons, selected randomly from
the central population register of Finland. Alpha-track detectors were used for two consecutive half-year
measurement periods. The national mean values of indoor radon concentration for persons living in low-rise
residential buildings and blocks of flats were 145 and 82 Bq/m^, respectively. The mean for the total
population was 123 Bq/m^. Based on the decision of the Ministry of Social Affairs and Health in 1992, the
indoor radon concentration should not exceed 400 Bq/m^. According to this study, the percentages of the
Finnish population living in houses with indoor radon concentrations exceeding 200, 400, and 800 Bq/m^ were
123%, 3.6%, and 1.0%, respectively. The corresponding numbers of dwellings involved were 200,000, 70,000,
and 20,000. The average concentration in low-rise residential buildings exceeds 200 Bq/m^ in a contiguous
area with 1 million inhabitants, covermg about 30,000 km^. In this area the percenteiges of residents living in
dwellings exceeding levels of 200, 400, and 800 Bq/m^ were 26%, 10%, and 3%. For persons in low-rise
residential buildings built in 1980-1990 the percentages were, surprisingly, more than twice the above. The
average concentration in low-rise residential buildings built in 1980-1990 was 60 Bq/m^ higher than in houses
built before 1980. Porous, lightweight concrete blocks in foundation construction and the reduced use of crawl
spaces contributed to this increase. Open stairwells between the basement and first floor also increased radon
concentrations.
Arvela, H., A. Voutilainen, I. M^el^en, O. Castr6n, and K. Winqvist, 1988
Comparison of predicted and measured variations of indoor radon concentration:
Radiation Protection Dosimetry, 24(1/4): 231-235
Arvela, H., and K Winqvist, 1989
A model for indoor radon variations:
Environment Intemat., 15: 239-246
[The authors have developed a model relating indoor radon concentration to variations in source strength, air
exchange rate, and meteorolo^cal factors (indoor-outdoor temperature difference and wind). The Lawrence
Berkeley Laboratory (analytical) air infiltration model (Sherman and Modera, 1984) was used to model the
air exchange rate. The model was tested eigainst winter-summer (February-October) differences in indoor
^Rn concentration as determined by a-track detector measurements of 1-2 months in 100 Finnish houses,
supplementing data taken earlier in 250 houses. Using the model, they calculated winter-summer concentration
ratios for different strengths of diffusion sources in building materials and soil, and varying soil-gas flow driven
by the "stack effect" resulting from a difference between indoor and outdoor temperature. Best matches of
the calculated and measured concentration ratios indicated that houses in which diffusion sources dominated
would show decreasing radon concentration with increasing air exchange rates, and that houses in which soil-
gas inflow was dominant would show increasing radon concentration with increasing air exchange rates.
Diffusion sources, if strong, were significant mainly in houses with large, porous concrete walls in ground
contact. For houses with slabs in ground contact, the ratios were often in agreement with those predicted by
nearly pure pressure-driven flow.]
47

Asher-Bolinder, Sigrid, D.E. Owen, and R.R. Schumann, 1989
Soil-characteristic and meteorologic controls on radon in soil gas in the semiarid western United States [abs.]:
Eos, Am. Geophys. Union Trans., 70(15): 497
The interaction between soil characteristics and meteorologic events affects soil structure and soil moisture. In
turn, soil structure and moisture interact to influence both radon transport and emanation within the soil.
Unirrigated smectitic clay-loam soil on a terrace deposit in Lakewood, Colorado, was monitored daily for
soil-gas radon at depths of 50, 75, and 100 cm. Radon data were integrated with hourly weather data, and
tensiometers measured soil moisture at study depths. Soil moisture during spring, summer, and fall ranged
from 10 to 30 weight percent. Radon concentrations varied by an order of magnitude throughout the year;
day-to-day variations of 100-200 percent were controlled mainly by barometric pressure changes. Transitory
sod-moisture caps blocked soil-gas exchange with the atmosphere and also raised radon content. Larger
seasonal radon variations were controlled primarily by interaction between soil cracks when present, and radon
emanation, both of which were controlled mainly by soil moistme. Grain-to-grain permeability is limited in
this smectitic sod. Insolation and evaporation due to wind both control sod-crack development. In smnmer
to early fad sod cracks (as deep as 90 cm and as wide as 2 cm at the surface and 0.1-03 cm at depth)
developed in the sod. Crack polygons 15-25 cm across persisted throu^ summer and fad except when
precipitation temporardy healed cracks at the surface. Radon concentrations at 100-cm depth in sod with
surface cracks >2 mm wide were nearly half the concentrations noted when no cracks were present. Thus,
atmospheric air dduted sod gas at depth in deeply cracked sod. Emanated radon from the six sod horizons
varied by an order of magnitude, depending on water content. Sod horizons contained 74 Bq/kg (2.0-2.8
pCi/g) radium and emanated <3.7 to >37 kBq/m^ (<100 to >1000 pCi/L) of radon per kg of sod in a
laboratory study. Radon emanation was maximized when water was 9-17 weight percent of the sample.
Temperature effects were not discernible at 5, 20, 36“C, characteristic of much of the yearly weather range.
Samples at -IS^C, the low temperature extreme, showed lessened apparent emanation because ice within sod
pores blocked transport from the sod.
Asher-Bolinder, Sigrid, Douglass E. Owen, and R. RandaU Schumann, 1990
Pedologic and climatic controls on Rn-222 concentrations in sod gas, Denver, Colorado:
Geophys. Research Letters, 17(6): 825-828
Sod-gas radon concentrations are controUed seasonaUy by factors of climate and pedology [sod character]. In
a swelling sod of the semiarid western United States, sod-gas radon concentrations at 100-cm depth increase
in winter and spring due to increased emanation with higher sod moisture and the capping effect of surface
water or ice. Increased sod moisture residts from a combination of higher winter and spring precipitation and
decreased insolation [solar heating] in fad and winter, lowering sod temperatures so that water infdtrates
deeper and evaporates more slowly. Radon concentrations in sod drop markedly through the summer and fall.
The increased insolation of spring and summer warms and dries the soil, limiting the amount of water that
reaches 100 cm. As the sod dries, radon emanation decreases and deep sod cracks develop. These cracks aid
convective transport of sod gas, increase radon’s flux into the atmosphere, and lower its concentration in sod
gas. Probable controls on the distribution of uranium within the sod column include its downward leaching,
its precipitation or adsorption onto B-horizon clays, concretions, or cement, and the uranium content and
mineralogy of the sod’s granitic and gneissic precursors.
Asher-Bolinder, Sigrid, Douglass E. Owen, and R. RandaU Schumann, 1991
A preliminary evaluation of environmental factors influencing day-to-day and seasonal sod-gas radon
concentrations, in Gundersen, Linda C.S., and Richard B. Wanty, eds.. Field studies of radon in rocks, sods,
and water:
U.S. GeoL Survey BuUetin no. 1971, p. 23-31
A long-term study of radon concentrations in a smectitic sod of the semiarid Colorado Piedmont reveals that
interaction of meteorologic, climatic, and pedologic factors affects radon concentrations on both a dady and
seasonal time scale. Seasonal variations are generaUy of greater magnitude than day-to-day fluctuations. Day-
to-day radon fluctuations in this sod are controUed largely by changes in barometric pressure and by shaUow
48

capping effects resulting from precipitation. Change in gas permeability due to variations in soil moisture is
the major control on seasonal soil-gas radon variation. Radon concentrations correlate with wind speed,
relative humidity, air and soil temperatmes, and the difference between those temperatures. Because these
factors are interrelated, it is difficult to determine the magnitudes of their individual influences. Therefore,
the nature of a soil and its response to climate must be understood if short-term measurements are to be used
to predict long-term ranges of soil-gas radon concentrations.
Azimi-Garakani, D., B. Flores, S. Piermattei, A.F. Susanna, J.L. Seidel, L. Tommasino, and G. Torri, 1988
Radon gas sampler for indoor and soil measurements and its applications:
Radiation Protection Dosimetry, 24(1/4): 269-272
Ball, T. K[eith], D.G. Cameron, T.B. Colman, and P.D. Roberts, 1991
Aspects of radon potential mapping in Britain, [abs.], in International Symposium on the Natural Radiation
Environment, 5th, Salzburg, Austria, 22-28 September 1991, Abstracts:
Salzburg, Univ. Salzburg, Inst, for General Biology, Biochemistry and Biophysics, abs. no. 58
The factors controlling the emanation of radon from rocks and soils are discussed briefly. The use of existing
data sets for the identification of zones of high radon production are described. For relatively impermeable
rocks, stream sediment geochemical distribution maps for uranium provide a useful first indication, but the
actual emanation coefficients depend upon mineralogical and permeability controls. For highly permeable
rocks, for example in karstic terrains, stream sediments are relatively ineffective and greater weight must be
placed on airborne, ground, and borehole radiometric procedures. Confirmation must make use of soil gas
radon measurement techniques.
Barnet, I[van], ed., 1991
Radon investigations in Czechoslovakia II:
Prague, Czech Geological Survey, 51 p.
Barnet, Ivan, 1991
Radon risk mapping of the Czech Republic—^results, in Barnet, I., ed., Radon investigations in Czechoslovakia
U:
Prague, Czech Geological Survey, p. 13-19
In 1990 the radon risk mapping of the Czech Republic (78 800 km^) was finished. The joint project of the
Geological Survey (Prague), Uranium Exploration (Rynoltice, PHbram, and Nov6 MSsto na MoravS),
Geophysics (Prague), and Faculty of Science, Charles University (Prague) resulted in the publication of radon
risk maps at the scale of 1:200 000 for 7 administrative regions of the Czech Republic. The mapping was based
on ^Rn soil measurements carried out on 148 test sites representing different geological units (total sum of
measured points = 3700). Additional geological, airborne geophysical, pedolo^cal, and hydrogeological data
were derived from maps produced by the Geological Survey and Geophysics and the catalogue of radiometric
anomalies was provided by Uranium Exploration. The radon risk maps are used by the state institutions
(Ministry of Health and Environment, Building, and Hygienic Service) and municipal authorities for organizing
the distribution of soil and indoor radon measurements in detail as well as for urban planning. The SANmethod, carried out by Uranium Exploration, was used for the soil radon measurements. The volume activity
of ^Rn was determined in 0.6-0.7-m-deep soil drill[holes] using plastic foils exposed for 24 hours.
Immediately after removing the foils from the tightened [sealed?] drillhole, the alpha activity of radon daughter
products was me2isured by RP-103 D alphameter [spectrometer?]. Up to 5 gamma-spectrometric points were
measured at each test site and grain-size analysis was carried out at each test site. [Soil-gas radon
concentrations, in kBq/m^, are used as foUows for radon risk evaluation: the low risk class is applied if soil
permeability and radon are respectively low and <30, medium and <20, or high and <10; the medium risk
class is applied if permeabihty and radon are respectively low and 30-100, medium and 20-70, and high and
10-30; the high risk category is applied if permeability and radon are respectively low and > 100, medium and
>70, or high and >30. Graphs are shown for the foUowing relations: Fig. 1, mean values of soil-gas radon
49

in 14 rock types of the Bohemian Massif, showing durbachites (syenites), granites, diorites, and orthogneisses
to have the highest associated soil-gas radon; Fig. 2, mean and maximum soil-gas radon in the same rock types;
Fig. 3, scatter diagram of soil-gas radon vs. soil uranium, showing no statistically significant relation; Fig. 4,
mean soil-gas radon vs. soil uranium for each of the 14 rock types, showing a better correspondence between
soil-gas radon and soil uranium, except for metasediments (phyUites, crystalline carbonates, etc.), which had
low soil-gas radon; Fig. 5, histograms of soil-gas radon for each of 7 rock types; Fig. 6, soil-gas radon and meanpercentage of fine fraction vs. rock type, showing generally smaller fine fractions for rock types having higher
soil-gas radon; Fig. 7, soil-gas radon and mean percentage of gravel vs. rock type, showing a rough direct
correlation between soil-gas radon and gravel fraction; and Fig. 8, pie charts of estimated abundances of high-,
medium-, and low-risk among the 7 administrative regions of the Czech Repubhc. Since March 1991 the
Ministry of Health has imposed limits as follows: < 120 Bq ^^^a/kg for building materials, < 100 Bq ^^^Rn/m^
air in new and mitigated houses, <200 Bq ^^^Rn/rr? air in existing houses, and 50 Bq/L (1350 pCi/L) in
drinking water.]
Barnet, Ivan, and Milan MatoUn, 1991
Radon risk mapping in Czechoslovakia [abs.], in International Symposium on the Natural Radiation Environment,
5th, Salzburg, Austria, 22-28 September 1991, Abstracts:
Salzburg, Univ. Salzburg, Inst, for General Biology, Biochemistry and Biophysics, abs. no. 179
Radon risk mapping of the Czech Republic on the scale of 1:200 000 was completed in 1990. The joint project
was prepared and realized by the Geological Survey, Prague, Uranium Survey (Rynoltice, Pfibram and Nov6
M6sto na Morav6), Geophysics, Prague, and Faculty of Science, Charles University, Prague. TThe following
data were used for radon risk compilation: (1) Field measurements of ^^Rn volume activity in soil air were
carried out by the Uranium Survey on 148 test sites (25 points each), representing various rock types of the
Bohemian Massif. Radon was determined in shallow soil drill[hole]s (0.6-0.7 m deep) using ^^Rn daughter
product plastic collectors. The radon measurements were accompanied by gamma-spectrometric measurementsand soil grain size analyses at each test site. All observed data are stored in a radon data base (Hewlett-
Packard 86). (2) Additional data from airborne radiometric maps, geological, pedological, and hydrogeological
maps, archived radiometric data, and results of monitoring of the seasonal variabihty of soil-gas radon. (3)
Radon risk categories (low, medium, high) of geological and lithological units were classified according to fixed
rules suggested by the team of the above-mentioned institutions. These rules were accepted by the Ministry
of Environment of the Czech Republic. The resultant radon risk maps are the basis for planning radon
protection activities and detailed measurements in individual re^ons. The cost of the protection against radon
will be paid from the state budget. fSome data on ^Rn volume activity in different rock types in the area
of the Bohemian Massif are given in the following overview (mean value and range, in kBq/m^): syenites and
durbachites [dark biotite-homblende syenites], 98 (4-435); granites and granitoid rocks, 52 (2-332); diorites,
40 (3-126); river terraces, 20 (1-183); sandstones, 11 (l-*^); daystones, 9 (1-55). The radon risk maps have
been compiled for seven regions of the Czech Republic. Two to eight percent of the measured radon values
fall within the radon high risk category.
Been, J.M., G.M. Reimer, and SX. Szarzi, 1989
Soil-gas radon distribution in Frederick Coimty, Maryland [abs.]:
Eos, Am. Geophys. Union Trans., 70(5): 500
Soil-gas radon concentrations in Frederick Coimty, Maryland correlate with Uthology and geolo^c structure.
Highest concentrations are found in phyUites and schists; lower concentrations are found in the carbonates of
Frederick VaUey; lowest concentrations correlate with quartzite ridges and mountains. Ground spectral
gamma-ray measurements correlate weU with the radon in the extremes but the correlation becomes unclear
in the middle range of radon concentrations between 20 and 70 kBq/m^ (05 and 2.0 nCi/L). In some areas
of the county, several populations of radon data are evident within a single geological formation. Such is the
case for the rhyoUtes of the Catoctin Moimtain region suggesting inhomogeneities within the volcanics. TThe
study was conducted in two phases in 1988. Seasonal variations influence soU-gas radon so that concentrations
were 30 percent higher in a dry period in late July than during an extended wet period in May. Despite
50

seasonal differences, the average concentrations in some areas exceed 70 kBq/m (2.0 nCi/L) and are great
enough to indicate that there is a strong potential for indoor radon concentrations to exceed the 148-Bq/m^
(4-pCi/L) action level recommended by the U.S. Environmental Protection Agency. A radon potential mapof rocks and soils could be derived from this data base that would be useful for land planning and establishing
construction practices to minimize the problem.
Been, Josh M., S.L. Szarzi, and G.M. Reimer, 1989
Radon as a geologic mapping tool [abs.]:
Geol. Soc. America, Abstracts with Programs, 21(6): A143
Although the current interest in radon is a public health issue, most previous geologic studies that involved
radon have been to evaluate its use for predicting volcanic eruptions, forecasting earthquakes, or locating
uranium deposits. The wide range of soil- gas concentrations found in areal surveys, often several orders of
magnitude, suggests that radon might be useful in mapping differences in rock type or geologic structure. Asoil-gas reconnaissance survey of Frederick County, Maryland, has shown that the radon concentrations exhibit
characteristic distributions for soils derived from various lithologies. The survey also indicates a contrast in
radon concentration across major structural contacts or facies changes. While these concentration differences
are not always unique, some are very distinctive. For example, quartzites, which form the core of ridges and
mountains of the southern and western part of the county, have a mean radon concentration of < 18 kBq/m^
(<500 pCi/L), whereas phyllites, which occur in the Piedmont of the eastern part of the county, have a meanradon concentration of >56 kBq/m^ (>1500 pCi/L). The Catoctin rhyohtes exhibit three populations of radon
concentrations, with means of about 26, 48, and 85 kBq/m^ (700, 1300, and 2300 pCi/L), suggesting subtle
chemical variations within the parent material. Radon concentration differences from 18 kBq/m^ to over
0.15 MBq/m^ (500 to over 4000 pCi/L) occur within a few meters across the Martic Line, a contact separating
the Cambro-Ordovician limestones of the Frederick Valley from the pelitic schists to the east. Traverses across
the Triassic border fault, which roughly defines the western side of the Frederick Valley, exhibit similar strong
contrasts in soil-gas radon concentrations. Although rock type and structural contacts are well defined in the
areas of Frederick County included in this study, it may be possible to use radon soil-gas concentrations for
mapping hidden Uthologies and structural contacts.
Blue, T.E., and M.S. Jarzemba, 1992
Determination and measurement of soil parameters for characterizing radon hazard of soils, in Cross, Fredrick
T., ed., Indoor Radon and Lung Cancer: Reality or Myth? Twenty-ninth Hanford Symposium on Health and
the Environment, Richland, Wash., October 15-19, 1990, Proceedings:
Columbus, Ohio, Battelle Press, Part 1, p. 373-382; discussion, p. 382-383 [NTIS]
There is little correlation between radon concentrations in soil and radon concentrations in homes. Oneexplanation is that the soil radon concentration does not fully characterize the soil as a radon hazard. We have
identified important soil properties by mathematically modeling ventilated air enclosed in basement walls of
thickness T (through which radon convects) and surrounded by soil of infinite extent (through which radon
diffuses). The radon instantaneously mixes uniformly with the basement air by ventilation (A^) and decay (A).
The steady-state solution for the radon concentration in the basement is equal to:
C={(C,KAPy[(A+\,)/iT]}{A/V}{[€3L3]/[63L3 +(KAP)/(/<TA)]}{exp[(-A,i£2T
2)/(KAP)]}, where C,,^, and
€3 are the soil’s radon concentration, radon diffusion length, and porosity, 63 and K are the wall’s porosity and
permeability, ^ and AP are the air’s viscosity and pressure difference across the basement wall; and V and Aare the basement’s volume and wall surface area. For a tight home, i.e., [(KAP)/(/iTA)< <£
3!^], it is
sufficient to measure C^ to characterize the radon hazard of the soil. If a home is very leaky, i.e.,
[(KAP)/(^TA)> > €31-3], then €563!^ is a more appropriate parameter for assessing the radon hazard. [From
preprint.]
Blue, T.E., JA. Mervis, W.E. Carey, and M.S. Jarzemba, 1990
Characterization of soils as radon hazards [abs. WPM-A5], in Health Physics Society Ann. Mtg., 35th:
Health Physics, 58(Suppl. 1): S32
51

[See above abstract.]
Borak, T.B., D.C. Ward, and M.S. Gadd, 1992
Characterization of ^Rn entry into a basement structure surrounded by low permeability soil, in The 1992
International Symposium on Radon and Radon Reduction Technology, Minneapolis, Minnesota, September
22-25, 1992:
U.S. Environmental Protection Agency, Preprints, v. 2, no. VI-1, 20 p.
An experimental facility has been developed to monitor the entry rate and concentration of ^^Rn in a basement
type structure surrounded by soil having a permeability on the order of 10*^^ m^. A data acquisition system
recorded environmental conditions outside and inside the structures, plus basement air exchange rate
information, every 15 min. Indoor Rn concentrations ranged from 400 to 1400 Bq/m . The observed Rnentry rate is highly variable and has two primary components; a constant input rate caused by diffusion of
^^Rn through the concrete walls and floor, and a variable rate that depends upon indoor soil pressure
differentials of only a few pascals. Pressure differentials are dependent upon wind speed and wind direction.
Stack effect was not significant. During a 2-week period, with relatively calm winds, diffusion through the
concrete walls and floor plus the floor-wall joint accounted for more than 80% of the total ^^^Rn entry.
Braman, Robert S., and Robert L. Sutton, 1990
Development and application of a soil-air radon analysis technique in Florida:
Florida Scientist, 53(2): 130-137
[A soil probe of 2.2-cm inside diameter, driven to depths of 20-25 cm, was used in conjunction with evacuated
a scintillation cells after a purging of more than twice the internal voliune of the probe by means of a handvacuum pmnp. Indoor alpha-track measurements in four houses showed a direct qualitative correlation with
radon in soil gas measured by the probe technique.]
Brookins, Douglas G., 1986
Indoor and soil Rn measurements in the Albuquerque, New Mexico, area:
Health Physics, 51(4): 529-533
Brooks, JH., 1989
Maryland geology and indoor radon [abs.]:
Eos, Am. Geophys. Union Trans., 70(15): 500
The first suggestion that Maryland could have a potential radon problem came from a report by Moschandreas
and Rector [^.v.] during 1982. This study of 60 homes in and around Mount Airy indicated 30% of the homessurveyed contained radon in excess of 148 Bq/m^ (4 pCi/L). Aeroradioactivity maps of the State indicated
that geology might be important factor in determining where radon might be a problem. These mapstogether with the National Uranium Resource Evaluation Program data show a broad ai&a of elevated
radioactivity extending northeast from the Vir^nia [State boundary] line through Mount Airy and Westminster
to the Pennsylvania border. This corresponds to a belt of phyllitic rocks which include the Ijamsville, Marburg,
and Urbana formations. Other anomalies can be attributed to granitic rocks, faults, and Triassic sediments.
Early in 1988 the Maryland Survey obtained several hundred indoor radon readings from the Maryland
Depmtment of Health and Mental Hygiene to see if elevated readings could be attributed to any particular
geologic formation. These readings were then plotted on County Geolo^c Maps at a scale of 1:62500 and the
geologic information along with the values and coordinates were entered into a computer database. Thedatabase showed that certain rock units or groups of rock units have recognizable indoor radon signatures.
These signatures are influenced by rock and soil permeability as weU as uranium content.
Buchli, R., and W. Burkart, 1989
Influence of subsoil geology and construction technique on indoor air ^Rn levels in 80 houses of the central
Swiss Alps:
Health Physics, 56(4): 423-429
52

[Subsoil geology, cellar floor permeability, cellar ventilation, air tightness, ventilation practices of the occupants,
and alpha-track indoor radon levels at cellar and first-floor living-room levels were compiled for 80 houses.
Houses on granitic, ortho-gneissic, or verrucano subsoil had cellar radon concentrations averaging 4.4 times
greater than those on a gray schistose or sedimentary subsoil; for houses not having a full concrete slab cellar
floor the average was 5.4 times greater. Tight, energy-efficient houses had living-room levels averaging 1.8
times greater than did normally insulated houses.]
Burnett, Bill, Jim Cowart, Dave Clark, Renata van der Weijden, and Peter Cable, 1989
Radon in shedlow groundwater in Florida — A possible relationship to soil flux? [abs.j:
Eos, Am. Geophys. Union Trans., 70(15): 500
The measurement by Florida of indoor radon in over 6000 homes and soil gas concentrations at approximately
3000 sites during 1986-1987 has resulted in a much better understanding of the distribution of radon in the
state than was previously possible. Using these results as a guide, we selected three small (<400 m^),
undeveloped study areas to test in some detail the concept that the flux from the soil to the atmosphere may
bear a relationship to radon in the associated shallow groundwater. The three sites represent areas of high,
intermediate, and low indoor radon. Well fields were established and we have been making regular
measurements of radon in water, soil-gas radon, and radon soil fluxes for approximately one year. Our results
show that, in general, the area with the highest indoor radon also displays the highest radon in shallow
groundwater (occasionally in excess of 2 MBq/m^, 60,000 pCi/L), and is characterized by the highest soil radon
and soil fluxes. The area with low indoor radon had average water values two orders of magnitude lower than
our high site, while the soil concentration and flux measurements were about one order of magnitude lower.
These results suggest that groundwater, in a water-table aquifer, may be a useful indicator of radon potential
of undeveloped land.
Carlisle, Donald, and Haydar Azzouz, 1991
Geological parameters in radon risk assessment—^A case history of deliberate exploration, in The 1991
International Symposium on Radon and Radon Reduction Technology, Philadelphia, Pa., April 2-5, 1991, Proc.,
Volume 2, Symposium Oral Papers, Technical Sessions 6 through 10:
U.S. Environmental Protection Agency Rept. EPA/600/9-91/037B, p. 9-59—9-73
McLean, Va., Cohen (S.) and Associates, Inc. [Springfield, Va., NTIS Order No. PB92-115369]
[Preprints, v. 5, no. IX-6]
Geological exploration has identified an unsuspected radon-prone belt in southern California. Detailed analysis
of aeroradiometric (NARR)[the National Airborne Radiometric Reconnaissance component of the National
Uranium Resource Evaluation program] data in relation to geological units, soil-gas radon, soil permeability,
and finally indoor radon has identified the Rincon shale and soils derived predominantly from the Rincon shale
in Santa Barbara County as anomalous in uranium and radon. Roughly 76% of our screening tests to date
from homes on the Rincon shale exceed 148 Bq/m^ (4 pCi/L) and 26% exceed 740 Bq/m^ (20 pCi/L).
Measurements under "normal" living conditions show 42% exceeding 148 Bq/m^ (4 pCi/L). An estimated
>4000 homes £U‘e at this level of risk; extensive new construction on the Rincon shale is limited only by
domestic water availability. fUnusually good correlations between aeroradiometry, soil-gas radon at 75-cm
depth adjusted for soil-gas permeability, geology, and indoor radon concentrations reflect the
unmetamorphosed character of sedimentary host rocks and the tendency for anomalous uranium concentrations
to be disseminated throu^out a geological unit rather than in erratic mineralized zones. Under these
circumstances, deliberate geological exploration can be a more efficient approach to radon risk identification
than simple random sampling or non-random testing of homes, and by the same token geological parameters
can facilitate radon risk assessment on undeveloped lands.
Carlisle, Donald, and Haydar Azzouz, 1993
Discovery of radon potential in the Rincon Shale, California—a case history of deliberate exploration:
Indoor Air, 3: 131-142
[See abstract above.]
53

Castrdn, O., 1987
Dealing with radon in dwellings: The Finnish experience, in Indoor Radon II, Proceedings of the Second APCAInternational Specialty Conference, Cherry Hill, New Jersey, April 6-10, 1987:
Pittsburgh, Pa., Air Pollution Control Association Pub. SP-60, p. 45-56
[A main objective of the Finnish Centre for Radiation and Nuclear Safety (STUK) has been to locate and define
the high radon concentration areas and dwellings. The geographical distribution of high radon concentrations
is due to both uranium content and permeabihty of the ground. The highest indoor concentrations are caused
by a combination of elevated uranium concentration, location on an esker, and a great temperature difference
between indoor and outdoor air. There is usually a large seasonal variation, with a maximum in winter.
Whereas in the 1970s Finnish researchers attributed high radon in water from bored wells to be the radiation
protection problem (see above abstract), in late 1980 they changed their view in favor of the inhaled progeny
from radon entering the indoor air from the soil. From the earliest surveys, the clustering of high indoor radon
concentrations in certain geographical areas and in houses with ground contact suggested a connection with
geology and indicated a need for maintaining a map of the occurrences. The map, in revised editions, is used
in STUK’s seeking strategy. It is considered most cost effective to concentrate measurement surveys in the
geographical clusters. The map editions of 1983, 1985, 1986, and 1987 are shown, and comparison maps are
shown for bedrock and ground-water uranium occurrences, external y-ray dose rate, uranium in glacial till,
indoor radon concentrations, lung-cancer rates for males (1953-62 and 1973-82), and lung cancer rates for rural
females. Everywhere in Finland, the houses built on eskers (long, sinuous ridges of stratified glacial sediments,
usuaUy of sorted sand and gravel of very high gas permeabihty) have the highest mean indoor radon
concentrations and the highest percentages of houses with >800 Bq/m^.]
Castren, Olli, 1990
Radon in Finland:
Finnish Features, November 1990, Classification 63.7.4., 4 p.
Helsinki, Finnish Government Printing Office
[This concise fact sheet, published by the Ministry of Foreign Affairs, summarizes research from 1955 onward
on the indoor radon problem. Maps are shown of indoor radon occurrence. The 1983 edition was based on
measurements in 2154 houses in 108 municipahties. The 1990 edition shows the arithmetic means in six
concentration classifications for 10x10 km squares and is based on measurements in about 20,000 detached
houses. A map of the municipality of Tampere, PispUan esker, shows the prevalence of houses of elevated
radon concentration on an esker, a long ridge of sand deposited by glacial action. In most cases, the apparent
primary cause of elevated indoor radon is high permeability to air of the soil on which a house has been built.]
Castr6n, O., H. Arvela, I. Makel^en, and A. Voutilainen, 1991
Indoor radon survey in Finland: Methodology and applications, [abs.], in International Symposium on the Natural
Radiation Environment, 5th, Salzburg, Austria, 22-28 September 1991, Abstracts:
Salzburg, Univ. Salzburg, Inst, for General Biology, Biochemistry and Biophysics, abs. no. 130
Since 1980, the Finnish Centre for Radiation and Nuclear Safety (STUK) has performed indoor radon
measurements with integrating alpha track dosemeters in about 35,000 homes. The position of the house
marked on a map and relevant construction and other data have also been collected. A mapping system makes
it easy to determine the coordinates from the local map and the type of bedrock and soil from geological maps.
These data, together with the annual average radon concentration of the dwelling, form the basic radon
database, a SAS dataset of about 23,000 houses, the coordinates of which are known. New results are
continuously added. The basic radon database, the mapping system, and various auxiliary registers form
together an indoor radon information system which is extensively used for planning and information puposes
and for research. USTUK helps the municipal health authorities by devising radon measurement plans and
radon prognosis maps. The former helps the local health authorities to find the areas where moremeasurements should be performed. The radon prognosis map helps the municipalities to take radon-prone
areas into account in their physical planning. Both the measurement plans and the prognosis maps are based
on the use of the mapping system, which also makes it possible to draw maps of the results in any scale and
54

form. HThe method of measurement, the seasonal correction, the collection, processing, and retrieval of data
and the construction and use of the mapping system are briefly described. Examples of the principal
applications are presented.
Castr6n, O., I. M^el^en, K. Winqvist, and A. Voutilainen, 1987
Indoor radon measurements in Finland: A status report. Chap. 8, in Hopke, Philip K., ed.. Radon and Its Decay
Products; Occurrence, Properties, and Health Effects:
Washington, Am. Chem. Soc. Symposium Ser. 331, p. 97-103
[The main factors that determine the indoor radon concentration are the product of the radium concentration
in the ground and its emanating power, and the permeability of the groimd. In Finland, the soil is mostly
glacial till. Figure 3, showing a map of Finland with geometric means of indoor radon concentrations of 183
localities, shows fairly good correlation with figure 4, the distribution of external gamma-ray dose rates
measured from Finnish roads, as does the distribution of uranium concentration in glacial till. Higher winter-
time indoor radon concentrations are attributed to stack effects, rather than to lower ventilation rates.]
Castrin, O., A. Voutilainen, and I. Makelainen, 1987
A seeking strategy for high indoor radon concentrations, in Indoor Air ’87. Proceedings of the Fourth
International Conference on Indoor Air Quality and Climate, Berlin, 17-21 October 1987:
Berlin, Inst, for Water, Soil and Air Hygiene, v. 2, p. 285-289
[The Finnish objective, based on a cost-benefit analysis, is to find dwellings in which the annual average ^^^Rn
concentration exceeds 800 Bq/m^ («20 pCi/L) and areas in which a significant fraction of houses exceed 200
Bq/m^. Initial surveys indicated that the type of building site (soil character) and geographical location were
the main determinants of indoor radon.]
Castr6n, O., A. Voutilainen, K. Winqvist, and I. Makelainen, 1985
Studies of high indoor radon areas in Finland:
The Science of the Total Environment, 45: 311-318
Cattafe, Joseph S., Colleen A. Ranney, Keith E. Miller, and Robert H. Andolsek, 1989
Regional NURE, geology and soils data as predictors for indoor radon, in Osborne, M.C., and Jed Harrison,
Symposium Cochairmen, The 1988 Symposium on Radon and Radon Reduction Technology, Proc., Vol. 2,
Symposium Poster Papers:
Research Triangle Park, N.C., Radian Corp., U.S. Environmental Protection Agency Pub. EPA/600/9-89/006b
[Springfield, Va., NTIS Order No. PB89-167498], p. 3-25-3-39.
For the New Jersey Statewide Scientific Study of Radon, environmental data were input into a geographical
information system (GIS) to perform spatial analysis on geographic predictors of indoor radon. Geologic units
were input at the 1:63,360 scale, and soil association units were input at the 1:250,000 scale. A radon source
potential map was developed by classifying geologic units as high, medium, or low radon potential, based upon
average radium concentrations assigned to the units from aerial radiometric data obtained from the National
Uranium Resource Evaluation (NURE). A radon transport potential map was similarly developed by
classifying soil association units according to soil-gas transport characteristics extrapolated from more detailed
county soil surveys. A combined radon potential map was developed by intersecting [sic] these two maps, and
was compared with indoor radon concentrations measured in 6,000 homes in New Jersey. A positive
correlation was found between indoor radon and radon potential as defined in this study. [Table 1 lists
geologic formations or rock types ranked as having high radon source potential. Within that category, from
the lowest to highest potential, they are: Brunswick Formation (Triassic); gneisses, amphibolites, and granites
(Precambrian); Lockatong Formation (Triassic); Pocono Island Inferred (Silurian); Jacksonburg Formation
(Ordovician); KittatinnyLimestone (Cambro-Ordovician), including Ontelaunee, Epler, Rickenback, Allentown,
and Leithsville Members; rocks similar to Lockatong; Hardyston Formation (Cambrian); and imdifferentiated
Cambrian and Ordovician rocks.]
55

Chadima, Sarah A., 1989
Generalized potential for radon emission based on estimated uranium content in geologic rock units, South
Dakota:
Vermillion, S.D., Univ. South Dakota Science Center, South Dakota Division of Geological Survey Circ. 44, 23 p.
[This report, based primarily on the estimated uranium content of bedrock units, includes a plate showing
estimated radon potential in five tiers.]
Clavensjo, B., Akerblom, G.V., and Andersson, P., 1983
Radon in dwellings. The effect of the ground on radon levels and gamma radiation indoors [in Swedish]:
Stockholm, Statens rad for byggnadsforskning, Rept. R9: 1983, 442 p. [ISBN 91-540-3866-9]
[Referenced in WUson, 1985-1986.]
Cliff, K.D., A.D. Wrixon, B.M.R. Green, and J.C.H. Miles, 1987
Concentrations in dwellings in the United Kingdom, Chap. 9 in Hopke, Philip K., ed.. Radon and Its Decay
Products; Occurrence, Properties, and Health Effects:
Washington, Am. Chem. Soc. Symposium Ser. 331, p. 104-112
[Certain regions, identified from geological data as having above average concentrations of natural radionuclides,
received detailed local surveys of radon in dwellings. The local surveys in southwest England (Devon and
Cornwall) showed average exposures 15 times greater than the national mean, in qualitative a^eement with
the greater uranium mineralization of their soils.]
Coleman, KA., 1993
Washington’s radon construction standards: The building code process, in The 1993 International RadonConference, Denver, Colo., Sept. 20-22, 1993:
Denver, Colo., Am. Assoc. Radon Scientists and Technologists, Rocky Mountain Chapter, Preprints, 7 p.
Washington’s radon prescriptive construction standards went into effect on an interim basis on July 1, 1991, as
part of the State’s Ventilation and Indoor Air Quality (VIAQ) Code adopted by the State Building CodeCouncil. The code requires some State-wide radon-resistive construction measures and the provision of a
three-month a-track detector to all single-family homes and to all first-floor units of multi-family dwellings.
The homeowner’s use of the monitor is volimtary. An additional requirement is for a passive stack system and
sub-slab aggregate to be installed in new slab-on-grade and basement homes located in eight counties
designated as having higher radon potential. The final VIAQ Code was implemented on July 1, 1993.
Coleman, KA., G.C. Hughes and EJ. Scherieble, 1993
Where’s the radon? The Gfogfaphic Information in Washington State [abs.], in First International Workshopon Indoor Radon Remedial Action, The Scientific Basis and Practical Applications, Rimini, Italy, 27 June-2
July 1993:
Commission of the European Communities et a/.. Book of Abstracts, p. 75
As Washington State’s lead agency for radon issues, the Department of Health (DOH) is developing the
analytical basis for establishing a public-health policy regarding radon. The Geographic Information System
(GIS) is a fundamental stc In this analytical process to develop a map of the potential for radon occurrence.
The GIS will take into accc unt geology, geography, topography, soil permeability, indoor radon test results,
population density and distribution; and housing type and volume contributing to our understanding of indoor
radon. In addition, DOH is working to aid policy makers and residents by establishing the lowest e}q>osure
range at which lung cancers are observed, a departure fi'om the commonly used risk assessments that
extrapolate from high to low exposure, to determine how many Washington residents are at risk. In conclusion
there is an examination of Washington’s radon prescriptive construction standards for residences.
Coleman, KA., and EJ. Sche rieble, 1993
Radon and the Geographic Iniormation System, in The 1993 International Radon Conference, Denver, Colo.,
Sept. 20-22, 1993:
56

Denver, Colo., Am. Assoc. Radon Scientists and Technologists, Rocky Mountain Chapter, Preprints, 7 p.
As Washington State’s lead agency for radon issues, the Department of Health is developing the analytical basis
for establishing a public health policy regarding radon. A fundamental step in this analytical process is the
development of a map of the geolo^c potential for radon occurrence. This map will serve as the base map
for a series of data overlays. Through the application of a geographic information system, the Department of
Health will perform an integrated analysis of the various elements contributing to our imderstanding of indoor
radon. These elements include geology, geography, topography, and soil permeability, indoor radon test
results; population density and distribution; and housing type and munber.
C0II6, R., RJ. Rubin, L.I. Knab, and J.MJl. Hutchinson, 1981
Radon Transport Through and Exhalation from Building Materials; A Review and Assessment:
U.S. National Bur. Standards Tech. Note 1139, 101 p. [Washington, GPO]
The report 1) considers the routes of entry of radon into buildings, describes the basic models for radon
transport tlu-ough building materials, critically reviews the small number of existing values for the necessary
transport coefficients, and summarizes the solutions of both steady-state and time-dependent transport cases;
2) reviews and considers how the microstructural properties and internal characteristics of building materials
may affect the transport and exhalation of radon; 3) considers the exhalation process from a more macroscopic,
phenomenological viewpoint, and summarizes selected experimental data on radium concentrations in building
materials, radon flux and exhalation from soils and building materials, and the effects of meteorological
variables on radon exhalation; and 4) reviews and assesses various measurement methodologies that are used
for laboratory and in situ studies of radon transport and exhalation. Needs for further research in each area
are also recommended.
Cotter, Jeff M., 1990
Simulated transport of radon in soil gas [M.S. Thesis]:
Honolulu, Univ. Hawaii at Manoa, Dept. Geology & Geophysics, xiv + 155 p.
A field monitoring study was undertaken to characterize the interaction between environmental factors such as
rainfall, atmospheric pressure changes, wind-driven pressure changes, and soil-gas radon mobility. Twoidentical test and control arrays containing radon, soil moisture, and differential pressure monitoring
instruments were instsdled in central Oahu, Hawaii. Radon activities in soil gas were monitored using passive,
electronic alpha-particle detectors at depths of 0.8, 13, and 23 m; soil moisture and differential soil gas
pressmes were monitored at equivalent depths. After an evaluation period to confiirm that the test and control
arrays showed similar radon responses, the test array was covered with a plastic barrier to determine the
significance of advective exchange of soil gas with atmospheric air. fThe field results show radon
concentrations in soil gas were found to be stron^y dependent on depth in the soil profile: at 0.8 m the average
soil-gas radon concentration was 22,000 Bq/nr; at 13 m it was 37,000 Bq/m^; and at 23 m it averaged
48,000 Bq/m^. Significant radon activity increases (30 to 120%) at 0.8- and 1.3-m depth were found to follow
moderate-to-intense rainfall events. The activity changes are attributed to reduced advective and diffusive
pathways for radon loss to the atmosphere and partitioning of radon into a smaller volume of soil gas due to
increased soil saturation. Rainfall events show little effect on radon concentrations at 2.3 m. Radonconcentrations at the shallow depths also exhibit a slow decline during extended dry periods due to increased
advective and diffusive loss of radon through the drier soil; the deepest probe showed only minor changes in
radon activity dming the dry periods. HRadon activities also responded to synoptic and semi-diurnal
atmospheric pressure changes at 0.8-m depth throughout the study. A similar response was observed at 13-mdepth only when the soil was at its driest, but no pressure response was observed at 2.3-m depth at any time.
Effects due to wind-driven pressure changes are inconclusive at present. Results from the advective-barrier
experiment strongly suggest that mixing of soil gas with atmospheric air causes a significant reduction in soil-
gas radon concentrations at depth of 0.8 and 13 m, but little effect at 2.3-m depth. HComputer simulation of
the measured and observed data w£is performed using [the numerical modeling] RN3D, a finite-element radon
transport code. Simulated radon transport is by advection and diffusion in the gas phase and diffusion only
in the liquid phase. The modeling effort was intended to calibrate RN3D, as well as to reveal the relative
57

sensitivity of radon behavior to soil physical properties. fRN3D was calibrated by conducting steady-state
simulations and adjusting soil diffusion coefficients to simulate the observed radon concentration profile.
Transient, one-dimensional model runs were then used to further adjust the diffiision coefficients and
determine soil air permeabilities. Using field-measured air permeabilities, RN3D was initially unable to
simulate the observed variations in the radon time series; however, if air permeabilities were raised by a factor
of 1000 above field values, RN3D was able to simulate the observed radon variations with respect to synoptic
and diurnal pressme changes, as well as radon activity increases due to rainfall events. This suggests that the
technique used in this study to measure soil air permeability does not adequately account for the preferential
flow and large-scale soil features which contribute to the true soil air permeability or that the transport
equations used in RN3D do not realistically characterize the subsmface air flow in a highly saturated, low-
permeability soil. A sensitivity analysis performed with RN3D showed that soil diffusion is the most important
parameter in determining radon concentrations in soil gas and radon flux from the soil, followed by soil crack
geometry, and then by soil-air permeability.
Cotter, J., and D.M. Thomas, 1989
Groimd gas radon response to meteorological perturbations [abs.]:
Eos, Am. Geophys. Union Trans., 70(15): 497
Soil gas radon activities have been monitored at depths ranging from one-half to two meters for a period of
several months using recently developed passive electronic alpha particle counters. The devices continuously
integrate .Ipha particle decays and record the decay rates at fifteen minute intervals for later retrieval. The
results of this monitoring effort have shown that semi-diurnal barometric pressure changes as small as four
millibars [»400 Pa] produce a detectable variation in radon activity at depths of at least two meters and that
larger synoptic pressure changes can increase or decrease radon concentrations by as much as 20%. Soil
moisture has been found to have a substantial impact on the average radon activity at relatively low soil
moisture levels but, after soil water content exceeds 50% saturation, the variations are much smaller even whenintense rainfalls bring soil moisture to saturation levels. Characterization of seasonal rainfall effects on radon
transport to the surface are currently underway. We have also found that subtle differences in deployment
protocol can have substantial impacts on the radon response to barometric and rainfall perturbations. These
differences have suggested that even small discontinuities in soil permeability (eg. cracks or root cavities) mayhave a substantial effect on near-surface radon degassing. The results of our ongoing radon monitoring
investigation will be presented along with our initial efforts at modelling radon mobility in response to
meteorolo^cal effects.
Cowart, J.B. and W.C. Burnett, 1989
Elevated radon generated in terra rossa in south Florida [abs.]:
Geol. Soc. America, Abstracts with Programs, 21(6): A144An elevated radon anomaly located just south of Miami, Florida, was discovered by a state-wide radon survey
completed in 1987. The anomaly seems to coincide with an area known as The Redlands", an area of terra
rossa underlain by the Miami limestone, which was deposited about 120,000 years ago, as determined by U-series methods. Terra rossa is generally considered to be a residual soil although in the case of south Florida
smd the Caribbean islands, an airborne source for some constituents has been proposed by others. Be that
as it may, the terra rossa S2unples fi'om south Florida have developed unusual activity ratios for the uranium
series nuclides. Using add-leached samples, gamma spectroscopy indicates the Ra-226 is greatly in excess of
U-234 with Pb-210 being intermediate in activity; by alpha spectroscopy Th-230 is greatly in excess of U-234.
These results indicate that the processes operative in the formation of terra rossa retain Th-230 and Ra-226
while permitting loss of the parent uranium. The significant difference in activity between Ra-226 and Pb-210
suggests that such soils may be powerful radon-emitting sources.
Cui, L[in]-P[ei], 1990
Radiometric methods in regional radon hazard mapping:
Nudear Geophysics, 4(3): 353-364
58

[Mechanisms of radon emanation and migration and procedures for radon potential mapping are discussed.
Aeroradiometric data from the NURE program were processed for the Salt Lake City, Utah, area. APrecambrian gneiss was found to have associated soil-gas radon concentrations significantly greater than a
Tertiary granite of greater equivalent uranium, as evaluated from the aeroradiometric data.]
Cullen, T. L., 1946
On the exhalation of radon from the earth:
Terrestrial Magnetism and Atmospheric Electricity, 51(1): 37-44
[Good historical review of rate of exhalation of radon from the earth.]
Culot, Michel VJ., Hilding G. Olson, and Keith J. Schiager, 1976
Effective diffusion coefficient of radon in concrete, theory and method for field measurements:
Health Physics, 30(3): 263-270
A linear diffusion model serves as the basis for determination of an effective radon diffusion coefficient in
concrete. The coefficient was needed to later allow quantitative prediction of radon accumulation within and
behind concrete walls after application of an impervious radon barrier. A resolution of certain discrepancies
noted in the hterature in the use of an effective diffusion coefficient to model diffusion of a radioactive gas
through a porous medium is suggested. An outline of factors expected to affect the concrete physical structure
and the effective diffusion coefficient of radon through it is also presented. Finally, a field method for
evaluating effective radon diffusion coefficients in concrete is proposed and results of measurements performed
on a concrete foundation wall are compared with similar published values of gas diffusion coefficients in con-
crete.
Czarwinski, R., R. Lehmann, and W. Rohnsch, 1993
Radon in Eastern German houses—Surveys and outcomes [abs.], in First International Workshop on Indoor
Radon Remedial Action, The Scientific Basis and Practiad Applications, Rimini, Italy, 27 June-2 July 1993:
Commission of the European Communities et al.^ Book of Abstracts, p. 102
Comprehensive, systematic investigations of the problem of "Radon in Eastern German Houses" were launched,
by the Federal Office for Radiation Protection after the German unification: 1. to study in the framework of
the Federal Project, "Radiolo^cal re^tration, investigation and evaluation of mining relics," the influence of
old and recent mining activity, especially of uranium ore mining and milling, on the radon concentration in
houses; 2. to identify location and extent of areas with high radon potential from geogenic reasons, and find
out communities and buildings especially afflicted; 3. to solve specific problems of public, economic, or basic
concern by investigating existing buildings or building ground upon request of territorial authorities, enterprises
or citizens; and 4. to complete the country-wide, representative survey of the FRG with the respective values
of the new Federal Lands. Under items 1 and 2, short-term measurements in 30,000 buildings of 250
communities were made in the interest of quick evaluation required, whereas under items 3 and 4 long-term
measurements provide for the accurate conclusions needed. Results obtained so far show the dominant
contribution of the underground to enhanced radon concentrations in buildings. Granitic formations near the
surface give rise to extended high median values of the frequency distribution. Extremely high concentrations
are observed where direct connections of buildings exist to mining relics in the ground, e.g., uranium-bearing
waste rock or near-surface workings. Outside the geologically or mining-determined areas, the frequency
distribution of radon in Eastern German houses is expected to be similar to that in Western Germany.
Damkjaer, A[nders], and U. Korsbech, 1985
Measurement of the emanation of radon-222 from Danish soils:
The Science of the Total Environment, 45: 343-350
Damkjaer, A., and U. Korsbech, 1988
A search for correlation between local geology and indoor radon concentrations:
Radiation Protection Dosimetry, 24(1-4): 51-54
59

[Houses situated on limestone in the southern part of the island of Mors, in the northern part of Jutland,
Denmark, had about twofold greater indoor ^Rn concentrations than houses situated on moraine clay in the
northern part of the island, despite an order-of-magnitude greater "radon emanation" of the clay. The
permeabihties of the soils are not given.]
Damkjser, A., and U. Korsbech, 1992
A small-diameter probe for in-situ measurements of gas permeability of soils, in Janssens, A., W. Lowder, M.
Olast, J. Sinnaeve, and F. Steinhausler, eds.. The Natural Radiation Environment, Proceedings of the Fifth -
International Symposium on the Natural Radiation Environment, Salzburg, Austria, September 22-28, 1991:
Radiation Protection Dosimetry, 45(1-4), Supplement: 85-89
[From Book of Abstracts, no. 22] The gas permeabihty of the soil is one of the major factors determining the
radon source potential of a local site. In situ measurements of the permeabihty are therefore needed to
estimate the radon risk for a specific site. More detailed measurements of the permeabihty are also needed
as input data for the mathematical models which describe the transport of radon through soil. A permeabihty
probe for in-situ measurements has been designed and tested. A smah-diameter probe was chosen in order
to minimize the labor involved in the drilling operation prior to the measurement. The associated drilhng
equipment and the field instrumentation are described. The borehole is 20 mm in diameter and cased with
a plastic tube. The probe, which is 16 mm in diameter [and 150 mm long] is led through the casing to the
measurement position. A packing procedure designed to prevent gas leakage along the casing has been tested.
The cahbration procedure for the probe is described, and a protocol for in situ measiu-ements is proposed.
A site mapping of the permeabihty to depths of a few meters has been performed. The measurements are
compared with a geological description of the strata and with measurements of the water content of the soil.
The variation of permeabihty with time is considered. [The permeabihty probe operates in the injection mode,
i.e., air is piunped into the formation under constant pressure. This paper summarizes the theoretical
fi‘amework for the permeabihty measurement and gives the shape factor for the probe. A laboratory
cahbration fadhty has been designed and tested. The measured shape factor for the probe in the cahbration
fadhty was found to agree weh with the calculated value. A possible correlation between the measured
permeabihty and the apphed pressure difference has been investigated.]
Dron, Elizabeth M., 1993
UK Radon Programme: Pohcy and progress [abs.], in First International Workshop on Indoor Radon Remedial
Action, The Sdent^c Basis and Practical Apphcations, Rimini, Italy, 27 June-2 July 1993:
Commission of the European Communities et cU.^ Book of cracts, p. 110
The United Kingdom is pursuing a substantial and evolving program towards minimizing the problem of high
radon levels in homes. Work focuses on those areas of the country which early surveys have shown to have
a significant proportion of affected homes, and involves cooperation between central and local government,
research institutions, and private companies. Elements of the program indude: radon measurements on
demand from householders in areas of potentiaUy high radon, and systematic surveys to refine knowledge of
these areas; research into geological, epidemiological, psychological, and finandal aspects of the problem; the
development and dissemination of advice on remedial and preventive measures; and a comprehensive approadi
to communication with all parties involved in issues of domestic exposure to radon. This paper contains a
general description of the program, setting its objectives in the context of public policy on housing and health
in the UK. An account of progress is given, and future options are outlined towards fulfilling the government’s
intention that substantial progress towards dealing with the impact of radon should be made by the close of
the century.
DSMA Atcon, Ltd., 1983
Review of existing instrumentation and evaluation of possibilities for research and development of instrumenta-
tion to determine future levels of radon at a proposed building site:
Ottawa, Atomic Energy Control Board Resear^ Rept. INFO-0096 4 p.
60

[This report carried Arthur Scott’s soil probe for measuring radon concentration in soil gas and permeability,
later used with slight modifications by C.O. Kunz, by EPA-ORP contractors in the House Evaluation Program,
by Rogers and Associates Engineering Corp., and by contractors for the Florida Radon Research Program.]
Dulaney, Richard A., 1992
Analysis of indoor radon in New Mexico using geographic information systems (GIS) [abs.], in The 1992
International Symposium on Radon and Radon Reduction Technology, Minneapolis, Minnesota, September
22-25, 1992:
U.S. Environmental Protection Agency, Preprints [poster papers], v. 5, no. VIIIP-4
Geographic Information Systems (GIS) are a powerful computer based information management tool for spatial
or geographic data. This technology, which blends traditional computer cartography with state-of-the-art
database management, is being employed to analyze indoor radon in New Mexico. The project, being
imdertaken in support of EPA Region 6, looks at both state-wide and local patterns of indoor radon. The
geographic distribution and spatial relationships of over 1000 indoor radon samples, taken from the EPA/State
random survey conducted in 1989, are examined. The correlation of these radon samples with geology, soils,
aerial radiometric, and population data is explored using GIS spatial overlay techniques.
Duval, J.S., 1989
Indoor radon prediction using gamma-ray spectrometric data [abs.]:
Eos, Am. Geophys. Union Trans., 70(15): 496
Because radium-226 is measured directly by gamma-ray techniques and because it is the progenitor of radon-222,
spectral gamma-ray data can be used to estimate the amount of radon in soil gas, which then can be used to
estimate relative indoor radon levels. The positive correlation between measurements of radon in soil gas and
surface concentrations of radium confirms that the gamma-ray data can be used to estimate the radon in soil
gas. Because such soil properties 2is emanation power and location of the radium affect the radon concen-
tration at depth, the relationship between the surface radium and the radon in the soil gas can vary from place
to place. Comparisons of aerial gamma-ray data to average indoor radon levels in homes in New Jersey and
in the Pacific Northwest show that the aerial gamma-ray data also can be used to estimate the relative indoor
radon levels. However, the data from the Pacific Northwest indicate that soil permeabihty is a very important
factor that significantly increases the average indoor radon for a given amount of radium in the soil. Although
aerial and ground gamma-ray data provide useful tools for radon hazard assessment, geologic properties of
the soils must be considered also; soil permeability is particularly important.
Duval, Joseph S., 1991
Use of aerial gamma-ray data to estimate relative amounts of radon in soil gas, in Gundersen, Linda C.S., and
Richard B. Wanty, eds.. Field studies of radon in rocks, soils, and water:
U.S. Geol. Survey Bulletin no. 1971, p. 155-162
Because aerial gamma-ray measurements of equivalent uranium are an indirect measure of radium-226 and a
direct measure of bismuth-214, which is a daughter isotope separated from radon-222 by short-hved isotopes
of polonium and lead, gamma-ray data can be used to estimate the relative amounts of radon in soil gas.
Theoretical calculations are available that enable an interpreter to define the limitations on the coverage
provided by an aerial survey. Aerial survey data for the State of New Jersey are compared to indoor radon
measurements. The results of this comparison support the use of aerial gamma-ray data to estimate the
relative concentrations of radon in soil gas, and published data comparing radon concentrations in soil gas to
surface gamma-ray measurements provide corroborating evidence. The application of Swedish criteria for
assessing radon hazards to the data for New Jersey suggests that hazard-assessment criteria from one area maynot be correct for other, geologically different areas.
Duval, Joseph S., and WiUiam J. Jones, 1988
61

Regional aerial gamma-ray maps for lUinois and parts of Wisconsin, Iowa, Michigan, Indiana, Missouri, and
Kentucky, in Marikos, Mark A., and Robert H. Hansman, eds.. Geologic Causes of Natural Radionuclide
Anomalies, Proceedings of the GEORAD Conference, St. Lx)uis, Mo., April 21-22, 1987:
Rolla, Mo., Missouri Dept. Nat. Resources Spec. Pub. No. 4, p. 157-165.
Duval, J.S., WJ. Jones, and J.K. Otton, 1989
Radium distribution map and radon potential in northwestern United States, in Osborne, M.C., and Harrison,
Jed, Symposium Cochairmen, The 1988 Symposium on Radon and Radon Reduction Technology, Proc., Vol.
2, Symposium Poster Papers:
Research Triangle Park, N.C., Radian Corp., U.S. Environmental Protection Agency Pub. EPA/600/9- 89/006b
[Springfield, Va., NTIS Order No. PB89-167498], p. 3-41-3-49.
Duval, Joseph S., William J. Jones, Frederick R. Riggle, and James A. Pitkin, 1989
Equivalent uranium map of conterminous United States:
U.S. Geolo^cal Survey Open-file Rept. 89-478, 12 p. + two-part plate and color slide
[This map was also shown on the cover of Geophysical Research Letters, 17(6), 1990.]
Duval, Joseph S., and James K. Otton, 1990
Radium distribution and indoor radon in the Pacific Northwest:
Geophys. Research Letters, 17(6): 801-804
Aerial gamma-ray data were compiled to produce a map showing the distribution of radium (^^^a) in near-
surface materials in the Pacific Northwest (Washington, Oregon, and Idaho, and parts of Montana, Wyoming,
Cahfomia, Nevada, and Utah). A comparison of measurements of indoor concentration levels of radon
(^^Rn) in homes with the apparent surface concentration of radium shows that aerial gamma-ray data provide
a first-order estimate of the relative amounts of indoor radon for township-sized areas [«93 km^] where soils
have low to moderate permeability. Townships with average indoor radon levels above the trend of the data
are almost all characterized by soils that have higher intrinsic permeabilities.
Duval, Joseph S., James K. Otton, and William J. Jones, 1989
Radium distribution map and radon potential in the Bonneville Power Administration service area:
U. S. Geological Survey Open-file Report 89-340, 126 p.
Duval, J.S., J.K. Otton, and WJ. Jones, 1989
Estimation of radon potential in the Pacific Northwest using geological data:
U.S. Department of Energy, Bonneville Power Administration Report DOE/BP-1234, 146 p.
Duval, Joseph S., G. Michael Reimer, R. Randall Schumann, Douglass E. Owen, and James K. Otton, 1990
Soil gas radon compared to aerial and ground gamma-ray measurements at study sites near Greeley and Fort
Collins, Colorado:
U.S. Geol. Survey Open-file Rept. 90-648, 42 p.
Dziuban, Jacolyn A., S.B. White, Jane W. Bergsten, and Barbara V. Alexander, 1989
Residential radon survey of fourteen States, in Osborne, M.C., and Jed Harrison, Symposium Cochairmen, The1988 Symposium on Radon and Radon Reduction Technology, Proc., Vol. 1, Symposium Oral Papers:
Rese^*‘ch Triangle Park, N.C., Radian Corp., U.S. Environmental Protection Agency Pub. EPA/600/9-89/006a
[S afield, Va., NTIS Order No. PB89-167480], p. 3-21—3-35
Thh er describes the cumulative results fi-om 14 States that conducted surveys with the assistance of the
E: omental Protection Agency during the 1986-1987 and 1987-1988 heating seasons....[North Dakota and
Miiin;jsota had higher percentages of houses >148 Bq/m^ (>4 pCi/L) (60.7% tmd 45.4%, respectively) than
other States that participated in the surveys. The results in North Dakota and Minnesota are attributed to a
62

combination of factors, including typical soil ^^^a concentrations of 37 Bq/m^ (1 pCi/L), high soil
permeability, and a high percentage of homes having basements.]
Eaton, R.S., zmd A.G. Scott, 1984
Understanding radon transport into houses:
Radiation Protection Dosimetry, 7(l-4):251-253
The major cause of elevated radon levels is the entry of soil generated Rn as part of a larger flow of soil gas.
A theoretical evaluation of the pressure differences causing these flows, and the resistance of different soil
types and house foundations to the movement of soil gas suggested that the rate of radon entry could be
predicted as a simple function of soil radon concentration and permeability. A new concept, the Radon Index
Number, based on simple field measurements, is proposed as a guide to estimation of the annual
average radon concentration in a standard house as a function of site soil parameters. [The primary
determinants of the average radon concentration are the average pressure difference (Ap) between the soil and
the house interior, the resistance (R) of the soil and foundation to soil gas movement at such Ap, the radon
emanation rate (E) per unit volume of soil in the vicinity of the building, and the average ventilation period
(h) of the house. These factors yield the average radon concentration, C, by C=QApEh/R, where Q is a
constant. In Canada, Ap ranges up to 20 Pa and can be considered a constant for a given area. Experience
at Elliott Lake indicates that foundation joints and other openings presented a total opening area of «300 cm^,
and that radon resistance required an opening area < 1 cm^. The migration distances for radon in soil range
from 2 to 3 m in soils of high permeability to 2 to 3 in dense clays. The emanation rate can be estimated
by (K-U-T) scintiUation spectrometry with the reasonable assumption of an emanating power of 35-40%.
Numerical modeling by the finite-element method indicated that the radon supply rate increases as a fractional
power of soil permeability. The radon index number (Bq/m) is defined as RIN=hE/K‘" or as
RIN=hE/(-logjo K), where K is the reciprocal of permeability. From field data it is estimated that the
Canadian criterion for mining communities will be exceeded if the RIN by the latter formula is more than 0.5
to 1 .0]
Ettlinger, Lester A., Dash Sayala, and Brant E. Smith, 1987
Predicting high radon areas: A study in Northern Virgina, in Indoor Radon H, Proceedings of the SecondAPCAInternational Specialty Conference, Cherry Hill, New Jersey, April, 1987:
Pittsburgh, Pa., Air Pollution Control Association Pub. SP-60, p. 4-15
[The indoor radon potential of locations in an area of « 1800 km^ of Northern Virginia {TT*30' to 78‘’00’ W;38®45’ to 39®00’ N) was assessed by examining the spectral 7-ray surveys of the National Aerial Radiometric
Reconnaissance component and the stream-sediment uranium surveys of the National Uranium Resource
Evaluation Program. Zones of anomalously high uranium-equivalent ^^^Bi and thorium-equivalent ft were
found only above Precambrian (>600 Ma) granitic bedrock units. Four of five uranium-equivalent anomalies
were above granodiorite and biotite granite gneisses; two of the four were also located along fault zones. Theother uranium-equivalent anomaly was found on the Catoctin metabasalt, containing tuffaceous phyllite and
veins of quartz and epidote. Equivalent-thorium anomalies along three flight lines were more extensive than
the equivalent-uranium anomalies and, along one flight line, extended over a metamorphosed sedimentary unit.
Nine a-track detectors, buried at 38-cm depth in weathered, saprolitic soils formed on the area rocks, yielded
the highest soU-gas ^Rn, 23 and 38 kBq/m^ (611 and 1030 pCi/L), on granitic material near a fault. Noanomalies were seen over the Precambrian Virginia Blue Ridge Complex, Triassic redbeds, or Triassic diabase
sills and dikes. (However, indoor radon concentrations as great as 11 kBq/m^ (300 pCi/L) are known to have
been associated with Triassic redbeds about 30 km to the east of the study area.—^ABT)]
Fakundiny, Robert H., Philip R. Whitney, and John M. Matuszek, 1988
Inappropriateness of bedrock maps for predicting radon in soil [abs.], in Radon in the Northeast: Perspectives
and Geologic Research (conference), Troy and Albany, New York, May 31-June 2, 1988:
Northeastern Environmental Science, 7(1): 5
63

[Bedrock geological maps, especially of small scale (1:>100,0(X)), are not appropriate for predicting areas of high
radon potential in New York State. Besides great variability of the distribution of radon’s parent nuclides
within single map units, the criteria for the delineation of stratigraphic boundaries have no necessary
relationship to the quantities that are known to be the principal controls on radon availability (such as radium
content of the groimd, emanating power, radon diffusivity, soil permeability, drainage, and soil fracturing) or
the confusion added by glacial redistribution of the radionuclides and changes in permeability.]
Fang, H.Y., 1990
Environmental geotechnology approach for evaluation of radon gas, in Air & Waste Management Association
Annual Meeting, 83rd, Pittsburgh, Pa., June 24-29, 1990:
Preprint 90-153.10
[This report is a very unconventional attempt to relate radon behavior to its attachment to particles by Van der
Waals forces.]
Finch, W.I., I.S. Parrish, and G.W. Walker, 1959
Epigenetic uranium deposits in the United States:
U.S. Geol. Survey Misc. Geol. Inv. Map 1-299, 3 sheets
[Sheet 2, "Distribution of epigenetic uranium deposits and igneous and metamorphic rocks of pre-Late
Cretaceous age", shows some correlation with known areas of high indoor radon.]
Fisher, D.R., 1978
Risk evaluation and dosimetry for indoor radon progeny on reclaimed Florida phosphate lands [Ph.D. thesis]:
Gainesville, Fla., Univ. Florida: 140 p.
Fitzpatrick-Lins, Katherine, Tom L. Johnson, and James K. Otton, 1990
Radon potential defined by exploratory data analysis and geographic information systems, in Wiltshire, D[enise]
A., ed.. Selected Papers in the Applied Computer Sciences 1990, Chapter E:
U.S. Geological Survey Bulletin 1908, p. El-ElO.
Through the use of exploratory data analysis and a geographic information system, indoor radon values located
by zip code were analyzed statistically and related spatially to geology and soil data for Fairfax County,
Virginia. A geographic information system overlay of geology on [postal] rip-code areas that have high upper
quartile levels (25% or more of the samples exceed the U.S. Environmental Protection Agency guideline for
radon in air, 148 Bq/m^ (4 pCi/L)) revealed that the majority of such areas are on Paleozoic metamorphic
rock. In areas where the upper 25% of the radon values from Paleozoic metamorpMc rock are lower thmi
148 Bq/m^ (4 pCi/L), soil seems to provide a mitigating effect. Four levels of radon potential, low, moderate,
moderate to high, and high, are defined for the study area. [See also Otton, Schumann, Owen, Thurman, and
Duval, 1988, which ranked the same county in five tiers of radon potential. Maximum values measured in the
four physiographic provinces represented in the county, Triassic basin. Piedmont Upland, Eastern Piedmont,
and Coastal Plain, were 12.8, 5.7, 0.79, and 0.21 kBq/m^, respectively; the corresponding medians were 70.3,
77.7, 59.2, and 40.7 Bq/m^; and the radon potential rankings for the respective areas were moderately high,
high, moderate, and low. Several different statistical measures were used. Maps show the rip-code boundaries,
mean and median radon values for each rip-code, a log-normal plot of the values, box (-and whisker) plots of
log-transformed radon concentration values along a transect across the county, rip-code areas by quartile,
bedrock units, soil series, smd the evaluated radon potential.]
Fleischer, R.L., 1980
Radon flux from the Earth: Methods of measurement by the nuclear track technique:
Jour. Geophys. Research, 85(C12): 7553-7556
The nuclear track technique, which can be used to measure concentrations of radon directly, can also be
employed to determine radon flux by means of gradients in concentration in the ground, at its siuTace, or above
the surface. Diffusional properties or emanation properties need to be assessed, but often can also be
64

measured by track counting. Measurements at Thoreau, New Mexico, give a flux of 1.4 atoms/ cm -s over an
area of 60,000 m^. At Scotia, New York, 1.1-1.2 atoms/cm^-s are measured over an area of 100 m^.
Fleischer, Robert L., and Antonio Mogro-Campero, 1978
Mapping of integrated radon emanation for detection of long-distance migration of gases within the Earth:
Jour. Geophys. Research, 83(B7): 3539-3549
[In connection with measurements of radon isotopes in soil, two types of detector are considered for registering
the average a-particle radiation incident on the detector surface over periods of about 30 days: a semiconductor
(surface-barrier) detector produced by Alpha Nuclear, and the etchable cellulose-nitrate film detector ("Track-
Etch®") produced by Terradex Corporation. The influence of a-particle energies of ^^^Rn, ^^®Po, and ^^'^Po
(from the uranium series) and ^^^o, and ^^^Po (from the thorium series), their distribution in
the measuring cup, and the geometry of the cup are treated quantitatively to yield the theoretical efficiencies
for the two types of detector. The rest of the paper deals with calibration and use of the detectors (almost
exclusively a-track) for measurement of radon in soil, and exclusion of the signals from the thorium-series
nuclides. Calibration is done by sealing an inverted cup, with the detector film stuck to the inside flat surface,
on a dish or jar containing a soil sample, and correcting the measmed a-track production rate, which is less
than that equivalent to the soil gas undiluted by the non-radon-producing volume of air above the sample, by
multiplying by { 1 + (1/soil porosity)(Volumeajj. jpaj^/Volume^Qj})}. (It is implicitly assiuned that the soil in the
cahbration dish is packed to the same porosity as it is in situ, and that the moisture content of the sample also
is sufficiently similar to yield the same emanating power. Dried soil should have significantly lower emanating
power than soil in the moisture range that is typical in many areas, resulting in an underestimate of the radon
generation in the soil in «m.-ABT) Plots of (track production rate)"^ v^. (Volume^jj.5paj.g/Volume
5Qjj)for
measurements made with different soil volumes can be extrapolated to zero volume ratio, eliWiating the need
to measure the porosity of the soil sample. Interference from ^^^^Rn can be suppressed by covering the sample
with several different thicknesses of high-purity sand; by saturating the sample with water; by using several
different sample thicknesses; or by interposing a membrane barrier that delays ^^^^Rn passage long enough for
it to decay (see Ward, Fleischer, and Mogro-Campero, 1977). Passage of radon through a distance greater
than several times its « 1-m diffusion length in the ground is termed a "distant signal" by the authors, who cite
a-track measurements that exceed those that would be expected by diffusion from local sources as evidencefor long-distance radon migration. The method has applications to uranium prospecting and earthquake
prediction. The effects of lateral diffusion, high moisture saturation, and radon loss to the air space in the
sampling hole above the detector cup are not discussed.]
Fleischer, Robert L., and Antonio Mogro-Campero, 1982
Track detectors for environmental radon studies: variation in concentrations in the ground, in Vohra, K.G.,
U.C. Mishra, K,C. Pillai, and S. Sadasivan, eds.. Natural Radiation Environment:
New York, John Wiley and Sons, p. 317-323
Flood, James R., Tom B. Thomas, Neil H. Suneson, and Kenneth V. Luza, 1990
Radon potential map of Oklahoma:
Oklahoma Geol. Smvey Map GM-32, Scale 1:750,000
[This map is essentially a reconnaissance map, based on the National Aerial Radiometric Reconnaissance of the
National Uranium Resource Evaluation (NURE) Program and on the measured or estimated uranium concen-
trations of bedrock units. Only the sources of radon were considered; the mobility of radon in the various units
was not considered. The geologic units were ranked in five tiers: generally very low, generally low, locally low
to moderate, locally moderate, and locally moderate to high.]
Freeman, H.D., and J.N. Hartley, 1986
Radon flux measurement technology, in Indoor Radon, Proceedings of the APCA International Specialty
Conference, Philadelphia, Pa., February 24-26, 1986:
Air Pollution Control Assoc., P.O. Box 2861, Pittsburgh, PA 15230, Pub. SP-54, p. 167-181
65

[This paper describes instrumentation and interpretation procedures for flux (density) measurements by means
of accumulator cans, small- and large-area activated charcoal canisters, a flow-through tent system, and flow-
through continuous flux systems. The methods were applied to flux density measurements from uranium mill
tailings, phosphogypsum piles, and industrial waste water treatment sludge.]
Friedmann, Harry, 1993
The Austrian Radon Project [abs.], in First International Workshop on Indoor Radon Remedial Action, The
Sdentiflc Basis and Practical Applications, Rimini, Italy, 27 June-2 July 1993:
Commission of the European Communities et al.j Book of Abstracts, p. 107
In 1991 the Austrian Radon Project was started with the global aim of investigati^ the radon concentration in
Austrian homes. The Project is divided into several stages. The first stage (ORAP-l) was devoted to the
coUection of already existing data which may have relevance to indoor radon concentrations. These data
include radon measurements in houses, radium and radon concentrations in ^ound and spring water, gammadose, uranium and thorium concentration in the ground, and airborne gamma spectrometric measurement.
This part of the project was finished at the end of 1991. The next stage (ORAP-2) started in mid 1992 and
was planned as a pilot project for a country-wide survey on indoor radon concentration. In this pilot project
the best way for measuring the radon concentration in homes should be found. The selected area has about
400,000 inhabitants and includes one large dty, several smaller cities, and rural areas. First, a number of
measmement methods (track-etch, electret, charcoal/liquid scintillation counting, charcoal/gamma
spectrometry, ionization chamber) and several methods for the distribution of the measuring devices were
extensively discussed and then tested (mailing, interviewer). Finally, the best way of organizing the whole
project must be found. The latter includes also an estimation of the financial needs for the whole project.
There are two main aims of the project: first, the actual radon exposure of the Austrian people should be
investigated (radon exposure map), and second, a map for estimating the radon exposure in houses to be built
in the future should be elaborated (radon potential map). So it must be established, if it is possible to extract
from the available data, the "radon potential" of the ground which in the future will be used when planning newbuildings. For this reason it is necessary to get more information fi^om the houses and apartments to
understand which parameters mainly influence the radon concentration in the homes. Therefore a
questionnaire was distributed with the detectors and several special measurements (soil-gas measurements,
continuous radon measurements, etc.) were made in specially selected houses. Finally in the last stage of the
project, which will last several years, the whole country should be investigated with the methods which prove
to be the most adequate for the task.
Frishman, David, W.C. Day, P.F. Folger, R.B. Wanty, P.H. Briggs,and Eileen Poeter, 1993
Bedrock geologic controls on radon abundance in domestic well water, Conifer, Colorado, in The 1993
International Radon Conference, Denver, Colo., Sept. 20-22, 1993:
Denver, Colo., Am. Assoc. Radon Scientists and Technologists, Rocky Mountain Chapter, Preprints,
p. IV 2(>-IV 30
Radon in ground water used for domestic supply can contribute significantly to radon concentrations in indoor
air. Om integrated studies of bedrock geology, bedrock and well-water chemistry, geohydrology, and downhole
geophysics have delimited some of the features that can exert regional as well as local control on radon
abundance in well water from crystalline rock aquifers. Local, smhll-scale features such as inhomogeneities
in the distribution and mineralogical residence of uranium in the bedrock and on fracture surfaces exert the
strongest control on partitioning of radon between the bedrock aquifer and its entrained ground water.
Detailed geologic mapping (meter-scale) has outlined zones in the granite bedrock that are enriched in
uranium by an order of magnitude. Alpha-track mapping of thin sections (millimeter-scale) demonstrates that
iron-oxide coatings on fracture surfaces are enriched in alpha-emitting elements that may be contributing radon
to the well water. Although bedrock composition determines the general abundance of radon in ground water,
the local features control radon concentration in any given well.
Frohlich, Reinhard K., and Carl A. Pearson, 1988
66

Potential radon hazard in Rhode Island estimated from geophysical and geological surveys:
Northeastern Environmental Science, 7(1): 30-34
[In Rhode Island, correlations have been observed between aeroradioactivity and ground and aeromagnetic maps
over metamorphic granite, the greatest anomalies being found at intersections of new with old fracture zones.
(Associations of uranium with magnetite are also common in the Reading Prong.)]
Fukui, M., 1987
Soil water effects on concentration profiles and variations of ^Rn in a vadose zone:
Health Physics, 53(2): 181-186
Concentration proves of^Rn and their variations were studied to understand the vertical motion in the ground
caused by fluctuations of meteorolqmcal parameters, such as precipitation, groimd-water level and atmospheric
pressure. A method of trapping ^%n was developed to measure the concentration profiles by circulating and
bubbling soil gas in porous cups into toluene. For locations where the water table is close to the surface,
observations showed a peak concentration in the vertical profile of ^^Rn at about a 40-cm depth and revealed
that the concentration in soil gas decreases 2is soil moisture increases near the water table. Soil gas in a buried
vessel also was circulated continuously to monitor ^^Rn in the ground air near the surface using an ionization
chamber. A rising of the water table following precipitation causes a burst of ^^^Rn concentration by upflow
in the ground, though the concentration in the soil gas soon decreases with the intake of air above the surface
due to increasing atmospheric pressure following precipitation. The concentration in soil geis again increases
via the phenomenon accompanying the recovery of equilibrium in soil water between ^^^Rn and ^^^a.
Garbesi, Karina, 1993
Toward resol^ang model-measurement discrepancies of radon entry into homes [Ph.D. Thesis]:
Berkeley, Calif., Univ. California, Energy and Resomces Group, and Lawrence Berkeley Laboratories, Energy
and Environment Div. Rept. LBL-34244, 169 p.
[The author observed that numerical modeling of radon entry underestimated measured entry rates by factors
of »3-10 in several studies (Nazaroff, Lewis, Doyle, Moed, and Nero, 1987; Revzan, Fisk, and Gadgil, 1991;
Garbesi and Sextro, 1989; Fisk, Flexser, Gadgil et al, 1989; Fisk, Modera, Sextro et al, 1992; Garbesi, Sextro,
Fisk, Modera, and Revzan, 1993), and hypothesized that the discrepancies resulted from using low values of
permeability, which had been based on measurements by single probes smd yielded permeability information
about soil volumes much smaller than those of building lots. A "dual-probe dynamic pressure technique" was
developed in order to yield permeability over distances of several meters, thus averaging the effects of
permeability variations due to shrinkage cracks, soil layering, root channels, etc.\
Garbesi, K., R.G. Sextro, WJ. Fisk, MJ*. Modera, and KX. Revzan, 1993
Soil-gas entry into an experimental basement: Model measurement comparisons and seasonal effects:
Environmental Science and Technology, 27(3): 466-473
[From original publication, Lawrence Berkeley Laboratory Rept. LBL-31873, 26 p.]:
Previous field studies of soil-gas entry into existing houses have found large discrepancies between modeled and
measured values of soU-gas entry rate and pressure coupling between house substructures and the soil that
could have been explained by inherently poor understanding of complex field sites. This paper reports the
results of detailed investigation of soil-gas entry into an extensively instrumented and controlled experimental
basement designed for the verification of existing numerical models of soil-gas and radon entry into houses.
The experimental design provides greatly reduced uncertainty regarding structure and soil characteristics.
Estimates of soil-gas entry based on radon mass-balance in the structure are compared with predictions of a
3-dimensional steady-state numerical model. This study corroborates the earlier findings of significant model
underprediction of soil-gas entry and far-field pressure coupling. Observed soil-gas entry at 21-Pa structure
depressurization was 8 times greater than predicted by the model and far-field pressure coupling was as muchas 6 times greater than predicted. This suggests that field conditions at the site, and possibly at real houses,
are inconsistent with model assumptions, or that typical methods of assessing bulk soil permeability are
misleading. A number of hypotheses are raised to explain the discrepancy that will be tested in the future at
67

the experimental facility. The effect of seasonal changes in soil conditions on soil-gas entry is also examined.
Despite large seasonal changes in near-surface soil moisture content and air permeability, there is no
observable effect on soil-gas entry because critical soil conditions near the soil-gas entry location in the
structure floor remain relatively constant.
Gates, A.E, L.C.S. Gundersen, and L. Malizzi, 1989
Case studies of anomalous radon in soil over shear zones in VA and NJ [abs.]:
Eos, Am. Geophys. Union Trans., 70(15): 499
The concentration of radon (Rn-222) in soil gas over shear zones is controlled by the composition of the
bedrock, amount of strain in the shear zone and the nature of the soil cover. In the Brookneal mylonite zone,
southwestern Virginia Piedmont, uranium content of the bedrock varies as a function of shear strain. The zone
lies within the homogeneous Melrose granite and therefore the effect of variable composition of the protolith
is eliminated. Radon in overlying saprolite also varies as a function of strain and is 10 times higher over the
most deformed part of the zone than the undeformed granite. The Hylas mylonite zone in the eastern Virginia
Piedmont shears several rock units with highh variable compositions. The composition of each protolith is
also a dominant factor in the radon concentrai m of the overlying saprolite. Soils above the intermediate to
mafic gneisses contain up to 9 times less radon than those above pegmatites. Radon in soils above mylonites
were up to 11 times higher than over undeformed coimterparts. The Reservoir fault zone. New Jersey
Highlands is a cataclastic shear zone and contains pegmatites with anomalous uranium concentrations. It also
separates Grenville gneisses of the Reading Prong that exhibit elevated gamma radiation from
Silurian/Devonian sediments with low gamma radiation. Unlike the other shear zones, soils above this area
are glacial tills of a terminal moraine. Radon in these soils is highly variable and does not correlate with
uranium concentration of the underlying bedrock. It appears to more closely reflect the composition of the
glacial till.
Gates, Alexander E., Linda C.S. Gundersen, and Lawrence D. MaUzzi, 1990
Comparison of radon in soil over faulted crystalline terranes: Glaciated versus un^aciated:
Geophys. Research Le-, 17(6): 813-816
[Uranium concentration, m bedrock and radon concentrations in soil gas in the overlying soils were studied in
the ungladated Hylas shear zone area of Virginia and in the glaciated Reservoir fault area of the New Jersey
Highlands. Radon concentrations in soil gas and uranium concentrations in bedrock correlated directly where
the overlying soils are not a product of gladation.]
Gates, Alexander E., Lawrence Malizzi, and John Driscoll m, 1992
Soil radon distribution in glaciated areas: Ar. exmnple from the New Jersey Highlands, in Gates, Alexander E.,
and Linda C.S. Gundersen, eds.. Geologic v^ontrols on Radon:
Boulder, Colo., Geological Soc. America Spedal Paper 271, p. 45-52
In contrast to results of regional soil radon studies in ungladated areas, bedrock geology shows no correlation
with radon concentrations in gladal soils overlying the Green Pond outUer and Reservoir fault zone. NewJersey Highlands. Total gamma radiation and uranium concentrations in the Paleozoic sedimentary rocks of
the Green Pond outlier are generally lower than in the Precambrian gneisses of the Reading Prong to the west.
The sedimentary bedrock shows average gamma radiation ci* 220 counts/s (136 to 323 c/s) and uranium
concentrations of 05 to 0.6 ppm, whereas gamma radiation furii the Grenville gneisses averages 284 c/s (240
to 576 c/s) and average uranium concentrations are 1.2 to 2.2 ppm. Rare pegmatites that occur along the
Reservoir fault zone yield anomalously high average gamma radiation of 2,018 c/s (1,949 to 3,495 c/s) and
average uranium concentrations of 285 ppm. Radon concentrations in the gladal soil cover exhibited similar
averages with wide ranges regardless of underlying bedrock geology. No appredable difference was found
between soil radon concentrations over Paleozoic sedimentary units, the pegmatites, fault zone, or Precambrian
gneisses. Radon from soil over the Paleozoic sedimentary bedrock averaged 19.1 kBq/m^ or 518 pCi/L (8.8-
100 kBq/m^ or 237-2,695 pCi/L), whereas it averaged 19.4 kBq/m^ or 527 pCi/L (7.4-69.3 kBq/m^ or 200-
1,872 pCi/L) in soil over the Grenville gneisses. The Green Pond outlier and the Reservoir fault zone are
68

blanketed by the Wisconsin-age glacial cover and contain recessional deposits that are proximal to the terminal
moraine. All soil radon was sampled in the glacial rover. The glacial sediments contain erratics primarily
composed of lithologies in the area but also of exotic rock types. Because uranium concentrations in the
erratics and matrix are highly variable, soil radon of individual samples is governed by the local uranium
concentrations. Other possible reasons for the lack of correlation between bedrock and soil radon are the high
permeability of the glacial soil that permits radon diffusion, atmospheric dilution, and variations in cover
thickness.
Ghahremani, D.T., 1989
Radon hot spots caused by bed rock fracturing or proximity to shallow manium mineralization in Ohio, in
Osborne, M.C., and Harrison, Jed, Symposium Cochairmen, The 1988 Symposium on Radon and Radon
Reduction Technology, Proc., Vol. 2, Symposium Poster Papers:
Research Triangle Park, N.C., Radian Corp., U.S. Environmental Protection Agency Pub. EPA/6(X)/9-89/006b
[Springfield, Va., NTIS Order No. PB89-167498], p. 3-55-3-68.
Ghahremani. Darioush T., 1991
Comparison of long term radon detectors and their correlations with bedrock sources and fracturing, in The 1991
International Symposium on Radon and Radon Reduction Technology, Philadelphia, Pa., 2-5 April 1991:
Preprints, v. 5, no. IXP-3, 12 p.
Ghomshei, M.M., and W.F. Slawson, 1991
Secular variations of radon in metropolitan Vancouver, British Columbisi, Canada, in The 1990 International
Symposium on Radon and Radon Reduction Technology, Atlanta, Ga., 19-23 February 1990:
Research Triangle Park, N.C., U.S. Environmental Protection Agency Rept. EPA600/9-91-026c, Proceedings,
Vol. 3: Symposium Poster Papers, Paper No. C-VI-2, p. 2-1—2-11 [NTIS Order No. PB91-234468/AS]
Goodknight, Craig S., and R. Thomas Peake, 1988
Preliminary estimation of high radon potential areas in EPA Regions 3 and 4 as indicated by geologic factors
[abs.]:
Geol. Soc. America, Abstracts with Programs, 20(7): A337Indoor radon concentrations result from a combination of geologic, environmental, and anthropogenic factors.
To gain an understanding of the geolo^c component, maps of geologic factors related to radon have been
prepared for the U.S. Environmental Protection Agency Regions 3 and 4 (generally, the southeastern and mid-
Atlantic States) in support of EPA’s Indoor Radon Program. Individual maps were prepared for the following
factors: (1) uranium occurrence s and rock formations elevated in uranium content, (2) rock formations and
other areas that have equivalent uranium concentrations of approximately 3 ppm or greater from aerial
radiometric survey data, (3) fault systems and Triassic-Jurassic dikes, and (4) carbonate rock formations.
Indoor radon data and soil and house foundation characteristics were also examined. The principal source of
uranium data for the first two factors listed above was the U.S. Department of Energy National Uranium
Resource Evaluation Program. The areas most likely to contain high indoor radon concentrations were
identified using a combination of the listed geologic factors. The principal high radon potential areas identified
include most of the Inner Piedmont from southern Virginia to western Georgia, the Piedmont of southeastern
Pennsylvania, the Inner Coastal Plain underlain by Cretaceous chalks, and the northern Kentucky Devonian
and Ordovician black shales. Areas of low indoor radon potential include most of the Coastal Plain and the
Cumberland Plateau.
Grace, John D., 1989
Radon anomalies in southern Michigan [abs.]:
Geol. Soc. America, Abstracts with Programs, 21(6): A144Recent radon surveys in ten states by the U.S. Environmental Protection Agency have produced vast data on the
geographic distribution and variability of indoor radon. Analysis of over 2000 screening measurements in
69

Michigan indicates the presence of two major anomalies or "hot spots", one in the Northern Peninsula and the
other in southeastern Michigan. The anomaly in the Northern Peninsula is reasonably well understood as it
corresponds to uraniferous Precambrian bedrock. The anomaly in southeastern Michigan, where over 40%of the homes tested had readings above the 148 Bq/m^ (4 pCi/L) recommended limit, is centered on Hillsdale,
Lenawee, and Washtenaw Counties. The causes for this southern anomaly are not immediately apparent as
there is no direct correlation of high radon readings with soil type, glacial deposit thickness, bedrock geology,
structure, or aeroradiometric surveys. A detailed analysis of the E.PA. data suggests, however, that the highest
radon readings are associated with the Defiance, Fort Wayne, and Wabash moraines produced by the Lake
Erie Lobe of the Wisconsin glacial stage. We have conducted a series of supplementary soil>gas radon
measurements in the southern Michigan area which confirms the E.PA. data. The results are interpreted with
respect to the type, mineralo^cal character, and permeability of these deposits.
Grafton, H.E., and D.R. West, 1992
Elevated indoor radon levels and elevated incidence of lung cancer in Columbus and Franklin County, Ohio:
Cause or coincidence?, in Cross, Fredrick T., ed.. Indoor Radon and Lung Cancer: Reality or Myth? Twenty-
ninth Hanford Symposium on Health and the Environment, Richland, Wash., October 15-19, 1990, Proceedings:
Columbus, Ohio, Battelle Press, Part 2, p. 863-870 [NTIS]
[The area discussed is coincident with elevated ^^"^Bi in sod, as revealed by aeroradioactivity surveys done for the
National Uranium Resource Evaluation program. Average screening measurements for the county ranged
between 63% and 73% > 148 Bq/m^, 23 and 27% >370 Bq/m^, and 1% > 1850 Bq/m^ (50 pCi/L). The rates
of cancer of the bronchi, lungs, and trachea for 1979-1986 were 62.8/100,000 for Franklin County and
49.3/100,000 for the State of Ohio. The data are not considered sufficient to demonstrate a coincidental or
causal relationship, but the county is suggested as a good site for an epidemiological study.]
Grasty, R.L., 1989
The relationship of geology and gamma-ray spectrometry to radon in homes [abs.j:
Eos, Am. Geophys. Union Trans., 70(15): 496
Studies in Scandinavia, Britain, and North America have shown that there are regional variations in radon
concentrations in homes that can be attributed to differences in the underlying rocks and soils. Homes built
on granites invariably have elevated radon levels due to their increased uranium concentration compared with
other rock types. The uranium concentration of the ground as measured by airborne gamma-ray spectrometry
is shown to be a useful parameter for predicting potential radon problem areas. However, in Canada, the cities
ofWinnipeg, Manitoba and Regina, Saskatchewan have the highest radon levels and are situated on glacial lake
clays. A cross-Canada airborne gamma-ray survey could not explain these elevated levels. Subsequent
laboratory analyses of the Lake Agassiz clays underlying Winnipeg showed relatively high radium
concentrations compared with most surfidal materials. The differences between the airborne and laboratory
analyses were attributed to radon loss from the surface of the ground and consequent reduction of the airborne
signal. Because of their small size, clay particles are extremely efficient in emanating radon. Fracturing of
the days is common for the Interior Plains, and is believed to be a significant contributing factor to the high
radon levels in Winnipeg and Regina. These fractures provide an effident plumbing system for the radon to
move through the ground. In addition, the Lake Agassiz days are high in the mineral montmorillonite, which
shrinks substantially on drying, not only enlarging the fractures but also making the day itself more permeable
to radon. The fracturing of the montmorillonite-rich clays, their radium content, and emanation effidency are
all factors which together with the dry conditions of the Interior Plains could contribute to the high radon levels
found in Winnipeg and Regina and the adjacent states of North Dakota and Minnesota in the United States.
Graustein, William C., and Karl K. Turekian, 1990
Radon fluxes from soils to the atmosphere measured by disequilibrium in soils:
Geophys. Research Letters, 17(6): 841-844
70

[The parent and the decay product of radon were measured in 119 cores of North American soils.
It was inferred that the mean fraction of radon escaping from the uppermost 50 cm soil layer was >25%,
equivalent to a radon flux density of 0.48 atoms/cm^-s (10 mBq/m^-s).]
Greeman, Daniel Jacob, 1992
The geochemistry of uranium, thorium, and radium in soils of the eastern United States [Ph.D. thesis];
University Park, Pa., Pennsylvania State Univ., Dept. Geosciences, 232 p.
A detailed study of the content, form, and behavior of ^U, ^^Th, and ^^^a has been conducted on 12
undisturbed soil profiles developed on carbonates, shales, sandstones, granites, tills, and alluvial materials in
the eastern U.S. in order to gain understanding relevant to radon hazard, nuclear waste isolation, and
geochemistry. Data on parent rocks, vegetation, selective soil extraction, £md soil chemistry have also been
obtained. Soil concentrations are 2 to 7 ppm ^U, 3 to 20 ppm ^^Th, and 19 to 100 mBq/g ^Ra. ^^U,
^^h, and ^^^a content of these soils is always greater than bedrock values, with carbonate soils being
enriched in^U and ^^^a up to 15-fold and ^^h up to 27-fold over bedrock values. Shale soils are typically
enriched 4-fold over bedrock values. Variation in ^U, ^^Th, and ^^Ra content with depth averages 20-25%
about the mean for the twelve sites, and is chiefly the result of depletion in ^U and ^^Th (up to 65% of
average profile values) in surface soil horizons because of lessiv^e of fine radionuclide-bearing Fe-oxides,
clays, and organic matter (pedogenic phases). Pedogenic ^U, ^^^h, and ^^^a increase with depth up to
5-fold in granite- and carbonate-derived soils, but apparent mobility is much less for shale- and glacially derived
soils. Mobility of ^^^a in lower horizons is low, adjacent horizons have 2-fold differences in ^^^a/^U ratios
and 25% differences in unsupported ^^^a. Because of the variable and depleted nature of upper soil horizons,
the concentrations of Ra-daughters in the top 30 cm of soil determined by radiometric surveys are not
necessarily representative of soil at depth. U content in the surface horizons relative to the average profile
value correlates well with analogous Th values in all twelve sites. This relation could be used in the
identification of error in other surveys. Soil profile-avereiged ^^^a is in secular equilibrium with ^U;^^^a/^U ranges 0.94 to 1.11 for ten of twelve sites. Average ^^^a/^U never deviates more than ± 0.20
from equilibrium. Rocks and float from these sites show ^^^a/^U equilibrium values (av. 0.95).
Organic-rich A-horizons with ^^^a/^U up to 1.80 can be explained by the rapid (0.70-1.0 ka) turnover of
plant- incorporated ^^^a (^^^a/^U up to 65 in vegetation). Cycling by vegetation also explains the content
of pedc^enic U, Th, Ca, Mg, and K in the A-horizon of a carbonate-derived soil. Some lower C-horizons have
high ^^^a/^U values, up to 1.5, with an appreciable proportion of ^^^a in exchangeable sites, up to 35%of the total ^^^a. Adsorption of ^^^a to surfaces from soil water with a typical dissolved ^^^a content, 37
mBq/L, over a period of 1.2 ka explains the abundance and form of excess ^^^a in C-horizons. Models of
^U and ^^Th uptake by vegetation show that their mean residence times, relative to cycling by vegetation,
are short, 6-120 k^ compared with the mean lives of and ^U. Radiometric age-dating of vegetated
soils using disequihbium should not use closed-system assumptions since, by analogy, and
^U behave similarly to common U and Th, and U- and Th-cycling rates are probably different. Based on
selective extractions, ^^^a is significantly cation-exchangeable in soils (up to 35% of Ae total ^^^a), while
^U and ^^Th are not cation-exchangeable in soils, averaging < 1.5% and < 1.1%, of their total occurrence,
respectively. A large proportion of the ^^^a, averaging 26% of the total, is associated with soil organic matter
at all depths. By contrast, less than 1.5% of the total ^U and ^^Th is associated with organic matter and
the maxiumum occurrence, 8% and 6%, respectively, is generallv restricted to the surface horizons. Onaverage 15% of the total U, 31% of the ^^h, and 10% of the ^%la in soils are asssodated with Fe-oxides
(up to 38%, 68%, and 21% of their total content, respectively). Approximate ^^^a equilibrium with ^U(^^^a/^U=0.94), the relatively low abundance of Ra in Fe-oxides, and previous studies of ^^^a adsorotion
indicate no appredable ^^^a a^orption to Fe-oxides in these addic (pH 3.5 to 6) soils. In all samples, ^^^ain soil organic matter is largely unsupported by ^U (and probablv by ^^®Th). In contrast, minerals show^^^a loss, with ^^^a/^U ranging from 0.73 to 0.91. Models of ^^^a transfer show that ^^^a cycled by
plants may be insuffident to compensate for radioactive decay of unsupported ^^^a in organic matter. The^Rn emanation coeffidents of 17 Pennsylvania soils (range: 7 to 27%) correlate well with the proportion of
^^^a assodated with organic matter. This relation could be useful in the prediction of soil-gas radon at a
71

given site. Uranium loss from soils was estimated by comparing the ^^Th/^U ratio in soil parent versus soil.
The rate of U- loss from soil was constrained by assuming rapid exchange ofU in soil organic matter with soil
water and a K^j of 10^ (organic phase/aqueous phase). Ages for two of three carbonate-derived soils, 610-670
ka, estimated from U-loss rates, were similar to ages estimated by previous studies. Weathering of soil
material results in separation of some U- and Th-bearing resistates, followed by U and Th uptake by vegetation
and/or chelation by organic matter produced by vegetation. Secondary, U- and Th-bearing fines are
transported downward, and ultimately, U and Th are adsorbed to Fe-oxides and incorporated in pedogenic
clays.
Greeman, Daniel J., and Arthur W. Rose, 1988
Abundance and occurrence of U, Th and Ra in Pennsylvania and Georgia soils [abs.]:
Geol. Soc. America, Abstracts with Programs, 20(7): A337
The concentrations of uranium,thorium, and radium which are relevant in studies of radon and aerial
radioactivity, have been measured in 5 soil profiles in Geor^a and 5 in Pennsylvania by delayed-neutron
activation, gamma spectroscopy, and radon bubbler methods. In 1- to 1.5-m deep profiles on shale, sandstone,
limestone, granite, and schist in Georgia, uranium is mostly between 2 and 5 ppm with theA horizon depleted
by 10 to 25% relative to the B [horizon]; thorium is similarly depleted up to 50%. Despite intense weathering,
the uranium and thorium values suggest only slight mobilization from near-surface horizons. Radium is
generally in approximate equilibrium with parent uranium. In three 1- to 2.5-m-deep soil profiles developed
on carbonate in Pennsylvania, uranium (3-8 ppm) and thoriiun (3-10 ppm) are enriched 2- to 10-fold over the
parent carbonate (average 0.6 ppm U, 1.7 ppm Th) and Th/U averages 1.6 vs. 3 in the parent. Both uranium
and thorium increase with depth. In two profiles on sandstone, uranium and thorium contents are mostly 1.5-
25 ppm and 3-5.5 ppm, respectively. Uranium increases only slightly with depth but thorium is depleted in
near-surface horizons and doubles in concentration in iUuviated zones [containmg colloids, salts, and smsdl
particles from an overlying horizon]. Both the Pennsylvania and Georgia sods suggest greater net mobility of
thorium than uranium, possibly because of recycling of uranium through vegetation, plus leaching of thorium
from surface horizons. Radium at 4 sites in Pennsylvania is enriched to as much as 180% of equilibrium
relative to uranium in A horizons and is slightly depleted in E horizons. Lower B and C horizons showapproximate equilibrium. Selective extractions for a carbonate soil show that almost half the radium occurs
in mobile or poorly crystalline forms (exchangeable cations, organic matter, Fe-Mn oxides). Radium generally
correlates with Ca content and with high radon (up to 170 kBq/m^ or 4500 pCi/L) in the soil air.
Greeman, Daniel J., and Arthur W. Rose, 1991
Geochemical controls on radon emanation in soils; importance of "organic: radium [abs.]:
GeoL Soc. America. Abstracts with Programs, 23: A202...The production of soil radon is controlled by six soil chemical and physical parameters, the most variable of
which is the radon emanation coefficient (Rn EC). The Rn EC is the fraction of radon escaping from mineral
grains. The Rn EC of rocks and soils ranges from
2-50% and averages about 25%. Based on the short
Rn-recoil range and observed Rn EC, the emanating
radium must occur in fine clays (particles <0.1 fim
diameter) or as a thin shell (coating). As there is nocorrelation between the clay content and Rn EC’s of
>60 eastern U.S. soils, the radium must occur as a
thin shell. The identity, mechanism, and importance
of thin-sheU radium in soils has not been described
previously. E}q)eriments show that on average 25%of the radium in soil minerals occurs as organic
coatings on soil minerals as a result of Ra-cyding by
live vegetation and transfer of radium from minerals
to dead organic matter. Multiple regression analysis
72

ofRn EC’s from 17 soils from Illinois, New York, Pennsylvania, and North Carolina shows that % of the soil-
gas radon results from radium in organic coatings with an emanation coefficient as high as 61%.
Experimentation on chemically amended soil samples confirmed that the remaining Vs of soil radon results from
volume-distributed Ra in silt-and clay-sized soil minerals with a Rn EC of 22%. The close relation of organic
Ra and Rn production in soil suggests that mitigation of indoor radon hazard should include affecting soil
organic matter. [See figure.]
Greeman, Daniel J., Arthur W. Rose, and William A. Jester, 1990
Form and behavior of radium, uranium, and thorium in central Pennsylvania soils derived from dolomite:
Geophys. Research Letters, 17(6): 833-836
[Well and poorly drained soils developed on Ordovician carbonate rocks in central Pennsylvania were analyzed
for ^U, ^^Th, and ^^^a, and for other soil properties. In both soils radium in the surficial, "A" soil horizon
was 165 to 180% of the equilibrium equivalent activity of uranium. Radium and uranium are enriched 10- to
12-fold, and thorium 20-fold, relative to their concentrations in bedrock. Half the radium occurred in
pedogenic phases (exchangeable cations, organic matter, and Fe oxides), chiefly in the organic matter, which
could account for nearly all the radon emanation from the soils.]
Greeman, Daniel J., Arthur W. Rose, and William A. Jester, 1990
Geochemical dynamics of radon precursors in eastern U.S. soils [abs.]:
Geol. Soc. America, Abstracts with Programs, 22(7): A247-A248
To study the effect of pedogenesis on the mobility of U, Th, and Ra as soil-gas radon precursors, the
concentration with depth and chemical form of U, Th, and Ra in soils, eissociated parent materials, and
vegetation have been determined. The radiometric values have been compared with various soil properties.
Soils ranged from incipiently weathered alluvial materials in Pennsylvania to deeply weathered carbonates in
Tennessee. Other soil sites included those developed on granites, carbonates, sandstone, shale, gneiss,
alluvium, and three in glacially derived materials. Unlike ten other soil profiles tested, all soils derived from
glacial materials show considerable Ra excess (as much as twice the U activity in some horizons) with whole
profiles where Ra/U averages 150%-180%. Surface horizons are depleted in U and Th: 2x for profiles in
glacial materials, and up to 5x for one profile. With respect to U loss from the soil profile, glacial soils appear
more rapidly weathered than older soils in similar climates because of translocation ofU and Th from surface
horizons and preferred enrichment of Th over U in lower horizons. All vegetation contains abundant U, Th,
and Ra with Ra similar to soil values and Ra/U> > 1. Chemical extraction shows Th with nearly 3x the
adsorption affinity to pedogenic Fe-oxides than U at most depths in all profiles; similar techniques show Raretention in organics. Th/U in soils>Th/U in parent materials up to 2x for some profiles. The excess Ra/Ucan be accomplished by two mechanisms: 1) influx of Ra-rich vegetation with organic-Ra retention in
near-surface horizons; 2) mowth of excess Ra from excess ^^®Th in deeper horizons. For mechanism 2), weassume equilibrium of with daughter in parent materials. During soil formation continuous loss
ofU>Th could result in a dynamic, temporary excess of if weathering is rapid enough. With an 80,000-
year half life, excess will ingrow Ra>U on a time scale that is long compared with glacially derived soils.
Because of the above effects, and large surface depletions, care should be taken in using airborne radiometric
surveys to assess soil radon in glacial terranes.
Greeman, DJ., A.W. Rose, and J.W. Washington, 1990
Evaluation of radon precursors and radon production in major soil types for the NE U.S. [abs.]:
Eos, Am. Geophys. Union Trans., 71(17): 649
The abundance and distribution with depth of^U, ^^Th, ^^^a, along with emanation of^Rn and ^^^^Rn, and
in situ radon have been determined for ten common soil types and the associated vegetation. The soils range
from incipiently weathered materials in cool climates to deeply weathered materials in warm climates. The
parent materials are limestone, dolostone, granite, granitic gneiss, granitic till, shale till, shale, alluvial
sandstone/shale, organic-rich loess, and interbedded shale and sandstone. The locations range from the
northern Adirondacks, New York, to central North Carolina and Tennessee to central Illinois and throughout
73

Pennsylvania. Concentrations range from 2-10 ppm U and 4-25 ppm Th in the soils; U and Th are commonly
depleted in surface horizons, up to 5-fold for deeply weathered soil profiles. All soils are enriched in U, Th,
and Ra in comparison with the parent materials, up to 22x for limestone soils. In general, Ra is in
equilibrium with U at depth; however, in many soils the A-horizon (surface) is Ra enriched (up to 180%).
Emanation coefficients range from 8-30% for ^Rn (ave. 22%) and 8-24% for ^^^n (ave. 18%). Based upon
selective extraction experiments, ^^^Rn probably emanates from ^^^a in soil organics and the ^^^n likely
emanates from ^Ra in free Fe-oxides. Plants contain abundant U, Th, and Ra in the ash, with Ra>U. Soil-
gas radon ranges from 19 kBq/m^ (500 pCi/L) in a Pennsylvania granite soil to 310 kBq/m^ (8500 pCi/L) in
a North Carolina granite soil. Radon and thoron (^^^^Rn) are in subequal amoimts and both vary in almost
all soils seasonally with summer yielding the highest values. In these soils, the highest soU-gas radon is found
in soils formed over limestone residuiun and deeply weathered high-U granite soils; soils formed in glacial
materials have moderate radon and sandy soils have the lowest radon.
Greeman, Daniel J., John W. Washington, and Arthur W. Rose, 1991
Measurement and prediction of geolo^c radon: Some considerations [abs.]:
Geol. Soc. America, Abstracts with Prograr 23(3): 15
Observations of radon, thoron, Ra, U, Th, and some meteorological parameters at 13 sites in the eastern U.S.
over the past five years allow some general conclusions and admonitions about the measurement and
occurrence of environmental radon. Measurements of the above are more reproducible and relevant at depth
(>0.7 m) for the following reasons: 1) Radon variation in the near surface is most susceptible to short-term
changes in meteorological conditions and entry of high-radon soil gas into the home is likely to occur at depth;
2) Because of transport during pedogenesis by both inorganic and organic processes (action of vegetation),
surface radium values can be 20% lower than those at depth in northern sites and up to 40% lower for
southern sites; in some midwestem soils, where cycling by vegetation is intense, Ra values at the surface are
double the value at depth. Thus, airborne and surfidal surveys can be inaccurate. Using volumetricaUy
averaged Ra values, soil radon at depth can be reasonably approximated. In these moist eastern soils, radon
concentrations even at 1.5-m depth are temporally variable, up to lOx during one year with high values
generally in late summer and are variable from year to year (up to 4x ). The seasonal variation is controlled
by soil temperature and soil moisture. During wet, cool periods radon is forced into large soil pores with low
radon production and enhanced radon partition in the aqueous phase. Further, moisture inhibits diffusion so
that significant radon decay occurs in transport from small high-radon pores to macro-pores and cracks where
radon is believed to be sampled. Also, radon can back-diffuse into low-radon bedrock underlying high-radon
soils, resulting in decreased radon values at depth For these reasons, radon measurements need to be collected
with care over long periods of time if they are to be useful in the prediction of potential radon hazard by
geologic terrain.
Gregg, L.T., and Gene Coker, 1991
Geologic controls on radon occurrence in Georgia, in The 1990 International Symposium on Radon and RadonReduction Technology, Atlanta, Ga., 19-23 February 1990:
Research Triangle Park, N.C., U.S. Environmental Protection Agency Rept. EPA600/9-91-026b, Proceedings,
Vol. 2: Symposium Oral Papers, Paper No. VI-2, p. 6-11—6-21 [NTIS Order No. PB91-234450/AS]
Through a combination of geologic models and field measurements, each of the four geologic provinces of
Georgia can be characterized for radon concentration. The combinations of bedrock lithology and soil
characteristics most likely to exhibit higher radon concentrations in Georgia are granites, granodiorites, granite
gneisses, pegmatites, mylonites, carbonaceous shales, phosphates, and monazite/heavy mineral placers, coupled
with high to medium permeability soils such as gravels, sands, and uniformly graded silts and sandy sdts.
Saprolite and surfidal soil may either enhance or impede radon migration, as may hydrogeologic characteristics
and rock structures such as faults and joint/fractures.
Gregg, L.T., and James J. Holmes, 1990
74

Radon detection and measurement in soil and groundwater, in Ward, Stanley H., ed.. Geotechnical and
Environmental Geophysics, Vol. I: Review and Tutorial:
Tulsa, Okla., Soc. Exploration Geophysicists, p. 251-262
[This paper is a tutorial including sections entitled, Abstract, Introduction, History, Basic Physics of Radioactive
Decay and the Production ofRadon and Radon Daughter Products, Geological Considerations, Field Methods
(The Alpha Scintillometer in Soil-gas Surveys, The Alpha Scintillometer in Water-gas Surveys, Etched-track
Detection), Data Interpretation, Case Histories (Field Techniques and Instrumentation, Location/Geology,
Data, Interpretation and Conclusions), and References (37). See also the preceding paper in this volume
(Nielson, D.L., et al.y 1990).]
Grodzins, L[ee], T. Bradstreet, and E. Moreau, 1991
The State of Maine schools radon project, in The 1991 International Symposium on Radon and Radon Reduction
Technology, Philadelphia, Pa., April 2-5, 1991, Proc., Volume 2, Symposium Oral Papers, Technical Sessions
6 through 10:
U.S. Environmental Protection Agency Rept. EPA/600/9-91/037B, p. 6-71—6-85
McLean, Va., Cohen (S.) and Associates, Inc. [Springfield, Va., NTIS Order No. PB92-115369]
[Preprints, v. 3, no. VI-6]
A comprehensive study has been made of the radon concentrations in every frequently occupied room on or
below grade in every public school in the State of Maine....The radon concentrations showed a strong
correlation with geography. The median radon concentrations in the western counties—Oxford, York,
Cumberland, and Adroscoggin—and the northernmost county, Aroostook, were more than twice the values
in the coastal counties of Knox and Lincoln and the Maine woods counties of Franklin, Somerset, Piscataquis,
and Penobscot....The strong correlation between radon levels in school rooms and homes in the same
geographical area implies that the imderlying geological factors are the determinants for the average or median
radon concentrations in county-size areas.
Gross, S., and H.M. Sachs, 1982
Regional (location) and building factors as determinants of indoor radon concentrations in eastern Pennsylvania:
Princeton, NJ, Princeton Univ. Center for Energy and Environmental Studies, PU/CEES Rept. 146, 117 p.
Gundersen, L.C.S., 1989
Anomalously high radon in shear zones, in Osborne, M.C., and Jed Harrison, Symposium Cochairmen, The 1988
Symposium on Radon and Radon Reduction Technology, Proc., Vol. 1, Symposium Oral Papers:
Research Triangle Park, N.C., Radian Corp., U.S. Environmental Protection Agency Pub. EPA/6(X)/9-89/006a
[Springfield, Va., NTIS Order No. PB89-167480], p. 5-27-5-44.
Sheared fault zones throughout the Appalachian region of the eastern United States have the potential for
creating anomalously high indoor radon. They are often characterized by high aeroradioactivity and/or have
uranium occurrences. Shear zones are known to be the cause of severe indoor radon problems at Boyertown,
PA, and Clinton, NJ, among the worst recorded in the United States. Factors controlling the radon
concentrations at these locations are bedrock uranium enrichment, high permeability, and high radon
emanation [emanating power or emanation coefficient]. These factors may be directly attributed to the
deformation process of ductile shear, known as mylonitization of the rock. During mylonitization, the uranium
concentration is increased by the addition of new uranium into the shear zone or by volume loss, leaving
uranium relatively enriched as a residuum. The deformation texture imparted to the rock during shear
increases its permeability. Oxidation of iron during deformation and subsequent weathering results in the
distinctive iron "staining" characteristic of many shear zones. These iron oxides scavenge radium, increase the
emanation of the rocks and soils, and make radon readily available to local ground waters. Case studies of
shear zones in Pennsylvania, Virginia, New Jersey, and Maryland show anomalously high radioactivity, uranium,
indoor radon, and radon in soil gas that statistically sets them apart from their undeformed host rocks. Shear
zones can be local as well as regional areas of high radon, especially in mountain belts such as the
Appalachians.
75

Gundersen, L.C.S., 1989
Geologic control on radon [abs.]:
Geol. Soc. America, Northeastern Section, Abstracts with Programs, 21(2): 19-20
Of the many factors affecting the amount of radon available to enter a home, geology and climate are the most
important. These two parameters control the distribution of uranium and radium in rocks and soil, the rock
and soil chemistry, the permeability and weathering profile of rocks and soil, and the emanation of radon.
Rock types most likely to cause indoor radon problems include carbonaceous shales, glauconitic sandstones,
phosphorites, chalk, some limestones, some glacial gravel deposits, uranium-bearing granites, and metamorphic
rocks of granitic composition, and mylonite. Rock types least likely to cause radon problems include marine
quartz sands, noncarbonaceous shales and siltstones, most clays and fluvial sediments, metamorphic and
igneous rocks of mafic composition, and most volcanic rocks. Exceptions exist within these general lithologic
groups because of the formation of localized uranium deposits such as hydrothermal vein deposits and
sedimentary roll-front deposits. Geologic studies of radon conducted on metamorphic rocks of the
northeastern United States during the past three years indicate that radon in soil gas, when used with geology,
is an effective predictor of the severity of indoor radon problems in homes with basements. More than a
thousand indoor radon and soil-gas radon measurements have been correlated with the underlying geology and
indicate that on the average, the radon concentration measured in the home is one percent of the concentration
measured in the soil. Thus, if the radon concentration of the soil is 74 kBq/m^ (2000 pCi/L), the indoor radon
concentration will be «740 Bq/m^ (20 pC/L). For indoor radon concentrations in the 148 Bq/m^ (4 pCi/L)
or less range, the indoor radon-to-soil-gas radon concentration ratio is usually less than one percent and
commonly 0.5 to 0.7 percent. For indoor radon greater than «740 Bq/m^ (20 pC/L), the concentration ratio
may be greater than one percent. In severe situations, such as Boyertown, Pennsylvania, the radon
concentration measured in homes is 10 percent or more of the concentration measured in the soil.
Permeability is the major control on the variation of the concentration ratio from the average of one percent.
In other climatic and geologic terrains one percent may not be the average. For example, in the southeastern
United States, where slab-on-grade is the favored construction practice, the amount of sod-gas radon that
enters a home is expected to be much less. Hopefully, re^onal models based on geology, climate, and
construction will be developed for other parts of the United States.
Gundersen, Linda C.S., 1989
Predicting the occurrence of indoor radon: A geologic approach to a national problem [abs.]:
Eos, Am. Geophys. Union Trans., 70(15): 280
Indoor radon has been cited as a significant contributor to as many as 20,000 lung cancer deaths per year. This
statistic from the Environmental Protection Agency has been challenged and supported by a number of studies
in recent years and is a controversial subject among health physicists. State, and federal governments, the real
estate industry, and homeowners. Equally controversial are the methods of testing for radon in the home and
for assessing and predicting the severity of the indoor radon problem in the United States. Of the manyfactors affecting the amoimt of radon available to enter a home, geology and climate are the most important.
These two parameters control the emanation of radon, the rock and soil chemistry, uranium and radium
distribution and the permeability and weathering profile of rocks and soil. As geologists we have the task of
understanding the processes involved with the distribution and migration of radon. An understanding of the
processes will lead to assessment and prediction of its occurrence. However, the amount of radon available
to a home and the amount actually occurring in the home can be very different. Another set of complex
factors including architecture, construction materials, and heating systems must be considered. Can aU these
parameters be re^onally assessed? Studies conducted in the northeastern and mid-Atlantic regions of the
United States indicate that radon in soil gas, when used with geology, is an effective predictor of the severity
of indoor radon problems in homes with basements. More than a thousand indoor and soil-gas radon
measurements have been correlated with the underlying geology and show that, on the average, the radon
concentration measured in the home is one percent of the concentration measured in the soil. In other
climatic and geologic terrains, one percent may not be the average. For example, in the southeastern United
States, where slab-on-grade is the favored construction practice, the amount of soil-gas radon that enters a
76

home is expected to be much less. Regional models based on geology, climate, and construction can be
developed for other pmts of the United States. Aerial radioactivity is an effective predictor of regional radon
anomalies and correlates well with geology. Other geologic methods currently being examined use radon
emanation, permeability, and radium concentration in the soil.
Gundersen, Linda C.S., 1990
Grain size and emanation as controlling factors in soil radon [abs.], in The 1990 International Symposium on
Radon and Radon Reduction Technology, Atlanta, Ga., 19-23 February 1990:
Preprints, Vol. Ill, no. C-VI-4
A comparison of two soil radon sampling techniques, the Reimer grab sampling technique (RG) and the EPAflow-through grab sampling technique (EFT), reveals a strong control of grain size and sorting on the soil
radon measured. Moisture produces secondary effects on sampling, sometimes determining whether a sample
can be obtained at all. Emanation [coefficient], however, is the ultimate control on the amount of radon
sampled and it appears to be influenced most by the abundance of metal oxides and the siting of uranium and
radium in and around grains. In well-sorted, medium-to-coarse grained sands, the two sampling techniques
obtain similar radon concentrations, usually within 10% of each other. In poorly sorted sands, especially clayey
sands, the RG obtains higher concentrations than the EFT. Under high moisture conditions, including
saturated conditions, the EFT cannot obtain a radon sample, but the RG will obtain a sample approximately
50% of the time. Permeability measured at all these sites has no apparent correlation with the radon
concentration. Equivalent uranium from gamma spectrometry at the suerface and manium emd radium
measured chemically in the soil have been compared with the soil radon concentrations. Although a generally
positive correlation exists, anomalous amounts of soil radon with respect to its parent radionucUdes are found
in a variety of geologic settings. The common factor causing these anomalous concentrations is the occurrence
of metal oxides, particularly iron, and the sorption or coprecipitation of uranium and radium in association with
the metal oxides, dramatically enhancing the emanation [coefficient] in the rocks and soils. [No paper was
found in the proceedings.]
Gundersen, Linda, 1991
Geologic radon potential of the United States [abs.], in International Symposium on the Natural Radiation
Environment, 5th, Salzburg, Austria, 22-28 September 1991, Abstracts:
Salzburg, Univ. Salzburg, Inst, for General Biology, Biochemistry and Biophysics, abs. no. 181
A geologic radon map depicting the major geologic provinces relevant to radon has been constructed for the
United States. Indoor radon data from the State/EPA Indoor Radon Survey and from other sources were
compared with bedrock and surfidal geology, aerial radiometric data, soil properties, and soil and water radon
studies to designate and rank the different provinces. The map depicts areas of the country that have the
potential for indoor radon (1) less than the national average of «74 Bq/m^ (2 pCi/L), (2) greater than the
national average, and (3) greater than 148 Bq/m^ (4 pCi/L). The areas of the country with the highest radon
potential are: (1) The Proterozoic rocks of the Appalachians and Rocky Mountains: These uraniferous
metamorphosed sediments, volcanics, and granite intrusives and carbonates are highly deformed and often
sheared. Shear zones in these rocks cause the highest indoor radon problems in the United States. (2) Glacial
deposits of the northern Midwest, particularly those derived from uranium-bearing shales, and glacial lake
deposits. The clay-rich tills and lake days have high radon emanation coeffidents, in part because of their high
specific surface areas, and exhibit higher-than-expected permeabilities due to desiccation cracking when dry.
(3) Devonian and Cretaceous black shales: The Chattanooga and New Albany Shales and their equivalents
in Ohio, Tennessee, and Kentucky and some members of the Pierre Shale in the Great Plains are often
moderately uraniferous and have high emanation coeffidents and high fracture permeability. (4) Phosphorites:
Natural and man-made accumulations of phosphorites in Florida, phosphatic clays in Georgia and Alabama,
and the Permian Phosphoria Formation in Wyoming, Idaho, Utah, and Montana are typically associated with
uniformly high concentrations of uranium or anomalously high concentrations of uranium caused by diagenesis
[changes taking place in sedimentary materials between deposition and consolidation as rock].
77

Gundersen, Linda C.S., 1991
Radon in sheared metamorphic and igneous rocks, in Gundersen, Linda C.S., and Richard B. Wanty, eds., Field
studies of radon in rocks, soils, and water:
U.S. Geol. Survey Bulletin no. 1971, p. 39-50
Sheared fault zones in the Appalachian region of the Eastern United States have the potential for creating
anomalously high amounts of indoor radon. These fault zones, many of which have known uranium
occurrences, are usually characterized by high aerial radioactivity. Factors controlling the radon concentrations
at these locations are bedrock uranium concentration, high permeability, and high radon emanation. These
factors may be directly attributed to the deformation process of ductile shear, known as mylonitization of the
rock. During mylonitization, the uranium concentration is increased by (1) the introduction of uraniferous
fluids into the shear zone or (2) volume loss, which leaves the rock relatively enriched in uranium. Grain-size
reduction of uraniferous accessory minerals common to metamorphic and igneous rocks such as titsmite, zircon,
monazite, and apatite makes uranium available for redistribution into the foliation. This process increases the
emanation of radon from the rock dramatically. The texture imparted to the rock during shear also increases
its permeability. Oxidation of iron during deformation and subsequent weathering results in the distinctive iron
"staming" characteristic of many shear zones. Iron oxides and other metal oxides scavenge uranium and radium
available through the weathering processes, increase the radon emanation from the rocks and soils, and make
radon readily available to local ground waters. Shear zones in Pennsylvania, Vir^nia, New Jersey, and
Maryland show anomalously high radioactivity and uranium, indoor radon, and soil radon concentrations that
set them apart statistically from their unsheared host rocks.
Gundersen, Linda C.S., 1993
The correlation between bedrock geology and indoor radon: Where it works and where it doesn’t—Someexamples from the eastern United States, in The 1993 International Radon Conference, Denver, Colo., Sept.
20-22, 1993:
Denver, Colo., Am. Assoc. Radon Scientists and Technologists, Rocky Mountain Chapter, Preprints,
p. rV 1--IV 8
In the eastern half of the United States, below the limit of glaciation, bedrock geology accounts for a significant
amount of the variation seen in indoor radon. Various geologic parameters as well as soil radon and surface
gamma radiation have been compared with thousands of indoor radon measurements and regression analyses
indicate high positive correlations (r>0.5 to 0.9). In this part of the U.S., bedrock geologic models for indoor
radon can be used successfully for prediction. Across the northern tier of states that have been subject to
glaciation, the correlation of bedrock geology to indoor radon is obscured or is positive in only certain
situations. In glaciated areas of the country, the type, composition, thickness, and permeability of glacial
deposits play major roles in controlling radon sources in the soil. The contribution from water to indoor air
and certain types of house architecture are also confounding factors in certain areas of the United States.
Gundersen, L.C.S., and A.£. Gates, 1988
Redistribution and enrichment of uranium in mylonite zones as a function of deformational processes [abs.]:
Geol. Soc. America, Abstracts with Programs, 20(7): A179-A180
In the Appalachian Region of the eastern USA, shear zones are often characterized by high aeroradioactivity
and/or have documented uranium occurrences. Shear zones have also been identified as the major cause of
some of the highest concentrations of indoor radon (a daughter product of uranium). Detailed geologic,
structural and geochemical studies of two ductile shear zones reveal that deformational processes control the
redistribution and enrichment of uranium. The deformational texture increases permeability and radon
emanation, compounding the probability of increased radon production. In the southern Virginia Piedmont,
the Melrose Granite has been deformed by a single late Paleozoic event to form the Brookneal Mylonite zone.
Uranium, radon, and surface gamma radiation can be directly correlated with shear strain determined using
the angle between C and S bands. Uranium is hosted in titanite and zircon in the undeformed grmute. During
deformation and grain size reduction, uranium is redistributed (on a thin section scale) by oxidizing fluids into
the foliation of the rock. It is then associated with epidote, sericite, and hematite. On the hand sample scale,
78

uranium and thorium remain in equilibrium with each other and increase in concentration directly with
mcreasing strain. Thus, little uranium has been introduced into the system and the four-fold enrichment of
both uranium and thorium may be attributed to volume loss with increasing strain. Similar results were found
in the Boyertown Mylonite zone developed in Precambrian quartz-feldspar gneiss of the Reading Prong, PA.
Uranium in undeformed gneiss is hosted in aUanite, titanite, and monazite. In mylonite, uranium is
redistributed into the foliation with hematite. Uranium increases from 25 ppm to 50 ppm. Anomalously high
radon indoors and in soil gas are also found on the mylonite.
Gundersen, L.C.S., and A.E. Gates, 1989
The concentration of uranium and radon in mylonite zones from Pennsylvania, Maryland and Virginia: Afunction of chemical and deformational processes [abs.]:
Eos, Am. Geophys. Union Trans., 70(15): 499
Mylonites formed in various rock types have consistently moderate- to-high radon and uranium concentrations.
Geochemical and geologic studies of shear zones developed in metamorphic and igneous rocks found in PA,
MD, and VA have been used to construct a model for radon concentration in mylonites. Several factors
contribute to high radon in mylonites. First, uranium concentration increases relative to that of the parent
rock. Uranium is removed from its crystalline source in minerals such as titanite and reacts with oxidmng
fluids present in the developing mylonite. As shear strain increases, grain size reduction (the breaking down
of the minerals) increases and more uraniiun is mobilized and concentrated in the foliation. Therefore,
uranium concentrations increase by two processes: (1) new uranium is brought into the zone by fluids and/or
(2) uranium is left in the zone as other elements leave the system, causing volume loss and relative enrichment
of uranium. Second, emanation of radon from uranium increases in the foliation. Uranium is removed from
a site of low radon emanation (the crystal) to a site of high radon emanation (the foliation). Weathering of
mylonites occurs along foliations, exposing the source of uranium even further. Third, the foliation developed
during mylonitization increases the permeability of the rock dramatically. This pervasive foliation is mimicked
in the soil profile and provides preferred paths for water and air movement, increasing the concentration of
radon in both. Shear zones are not the only cause of high indoor radon and some shear zones will not create
radon problems. Shears developed in rocks with less than 1 ppm uranium may not produce sufficient radon
to cause a problem unless uranium is introduced from another source during deformation. However, shear
zones developed in rocks with higher uranium concentrations, such as rocks of granitic composition, have a
high probability of causing an indoor radon problem.
Gundersen, Linda C.S., R. Thomas Peake, Gary D. Latzke, Lisa M. Hauser, and Calvin R. Wiggs, 1991
A statistical summary of uranium and radon in soils from the Coastal Plain of Texas, Alabama, and New Jersey,
in The 1990 International Symposium on Radon and Radon Reduction Technology, Atlanta, Ga., 19-23
February 1990:
Research Triangle Park, N.C., U.S. Environmental Protection Agency Rept. EPA600/9-91-026c, Proceedings,
Vol. 3: Symposium Poster Papers, Paper No. C-rV-4, p. 6-35—6-47 [NTIS Order No. PB91-234468/AS]
The Atlantic and Gulf Coastal Plain appears to be an area of low radon potential based on recently available
indoor radon surveys and aerial radiometric data. Measurements of radon in soil gas, uranium and radium
analyses of soil samples, flow-through permeability of soils, and descriptions of soil profiles were performed
to test this hypothesis and to determine the radon-producing potential of the Coastal Plain. Data from Texas,
Alabama, and New Jersey indicate that Cretaceous and lower Tertiary glauconitic sands, Cretaceous and
Tertiary chalks and carbonaceous shales, and phosphorites have the highest radon potential. Marine limestones
and quartz sands have the lowest radon potential. In general, the Coastal Plain appears to be a region of low
to moderate radon potential in the three states examined, especially when compared with other geologic
terrains.
Gundersen, L.C.S., G.M. i er, and S.S. Agard, 1988
79

Correlation between geology, radon in soil gas, and indoor radon in the Reading Prong, in Marikos, Mark A.,
and Robert H. Hansman, eds., Geologic Causes of Natural Radionuclide Anomalies, Proceedings of the
GEORAD Conference, St. Lx)uis, Mo., April 21-22, 1987:
RoUa, Mo., Missouri Dept. Nat. Resources, Div. Geology and Land Survey Spec. Pub. No. 4, p. 91-102
Detailed field studies of the Proterozoic metasedimentary rocks of Boyertown [Colebrookdale area] and Easton,
Pennsylvania reveal a relationship between geology, radon in soil gas, and the potential for indoor radon
accumulation. Fault zones and lithologies with high concentrations of uranium typically have high levels of
radon associated with them. In contrast, lithologies with low uranium are not associated with high radon, even
where soil permeability is high....Trhe Boyertown study area is underlain by hornblende gneiss and graphitic
quartzite, which are low in uranium, and interlayered quartz-feldspar and biotite gneiss (QFB), wluch is high
in uranium. Radon progeny in houses and radon in soil gas in soils over the hornblende gneiss and graphitic
quartste are low (^.42 and ^7 kBq/m^ or ^.02 WL and <1000 pCi/L, respectively), whereas homes
and soils over the QFB generally have moderate radon (>0.42 to 21 /iJ/m or >0.02 to 1 WL and <37 to
74 kBq/m^ < 1000 to 2000 pCi/L, respectively). Where the QFB has been mylonitized (by severe ductile shear
deformation of the rock), the radon in houses and soils is high (>21 /iJ/m^ and >7.4 kBq/m^ or >1 WL and
>2000 pCi/L, respectively)....1I[At Easton, as at Boyertown, quartz-feldspar gneiss and some biotite gneiss
underlie houses and soil with moderate to high radon. Fault zones and local occurrences of exotic uranium-
bearing minerals, which are mostly found along lithologic contacts and in local intrusions in marble, can also
be correlated with high radon in soils and houses. fPhysical and chemical properties of soils at both study sites
are controUed by the geology. Hornblende gneiss and biotite gneiss soils have higher clay content and less
permeability than soils developed on the quartz-feldspar gneisses, which are sandier and more permeable.
Comparisons of radium and radium content of soils indicate that these two elements are in secular equilibrium.
Most radon measured in soil gas correlates positively with radium measured in the horizon from which the soil
gas was taken, and thereby indicates that the soUs are directly producing radon and that other sources or
parameters are not affecting it.
Gundersen, L.C.S., Reimer, G.M., Wiggs, C.R., and Rice, CA., 1988
Map showing radon potential of rocks and soils in Montgomery County, Maryland:
U.S. Geol. Survey Misc. Field Studies Map MF-2043.
Gundersen, Linda C.S., R. Randall Schumann, James K. Otton, Russell F. Dubiel, Douglass E. Owen, and
Kendell A. Dickinson, 1992
Geology of radon in the United States, in Gates, iMexander E., and Linda C.S. Gundersen, eds.. Geologic
Controls on Radon:
Boulder, Colo., Geological Soc. America Special Paper 271, p. 1-16
More than one-third of the United States is estimated to have high geologic radon potential. A high radon
potential area is defined as an area in which the average indoor radon screening measurement is expected to
be 148 Bq/m^ (4 pCi/L) or greater. Geologic terrains of the United States with high radon potential include:
1. Uraniferous metamorphosed sediments, volcanics, and granite intrusives that are highly deformed and often
sheared. Shear zones in these rocks cause the highest indoor radon problems in the United States. 2. Glacial
deposits derived from uranium-bearing rocks and sediments and glacial lake deposits. Clay-rich tills and lake
clays have high radon emanation because of high specific surface area and high permeability due to desiccation
cracking when dry. 3. Marine black shales. The majority of black shales are moderately uraniferous and have
high emanation coefficients and high fracture permeability. 4. SoUs derived from carbonate, especially in
karstic terrain. Although most carbonates are low in uranium, the soils derived from them are very high in
uranium and radium. 5. Uraniferous fluvial, deltaic, marine, and lacustrine deposits. Much of the nation’s
reserve uranium ores are contained within these sedimentary deposits, which dominate the stratigraphy of the
western U.S.
Gundersen, Linda C.S., R. Randall Schumann, James K. Otton, Russel F. Dubiel, Douglass E. Owen, Kendell
A. Dickinson, R. Thomas Peake, and Sharon J. Wirth, 1991
80

Prelimmary radon potential map of the United States, in The 1991 International Symposium on Radon and
Radon Reduction Technology, Philadelphia, Pa., 2-5 April 1991:
Preprints, no. IX-4, 23 p.
..As part of an Interagency Agreement between the EPA and the U.S. Geological Survey (USGS), the USGSis preparing radon potential estimates for the United States in order to help identify and prioritize areas
toward which states could target their resources and in which the different building code options would be most
appropriate....Variations in geology, soil characteristics, climatic factors, and homeowner lifestyles can be quite
large within any particular county; therefore these reports cannot be used to estimate or predict the indoor
radon concentrations of individual homes or housing tracts. Indoor radon surveys used for the evaluations are
also not consistently statistical at the county scale. HA geologic[ally based] radon potential map of the United
States is also being produced, a preliminary version of which is presented in this paper (Figure 1). The final
published version of this map will be presented at a 1:7.5 million scale and will include extensive text and
annotation. This map illustrates the radon potential of the country by the major geologic provinces of
relevance to the radon problem....irrhe assessment of geologic radon potential for the United States was madeusing five main types of data: (1) geologic (hthologic), (2) radiometric, (3) soil characteristics, including soil
moisture, and permeability, (4) indoor radon data, and (5) building architecture (specifically, whether homes
in each area are built slab-on-grade or have a crawl space versus homes with basements).... [Twenty-eight
physiographic provinces of the 50 States are ranked as having high, moderate, or low radon potential, referring
to average indoor concentrations, rather than to the probabiUty of occurrence of severe indoor radon
concentrations in some houses.]
Gundersen, Linda C.S., and Richard B. Wanty, eds., 1991
Field studies of radon in rocks, soils, and water:
U.S. Geol. Survey Bulletin no. 1971, 355 p.
Washington, U.S. Government Printing Office
Hall, Francis R., Eugene L. Boudette, and William J. Olszewski, Jr., 1987
Geologic controls and radon occurrence in New England, in Graves, Barbara, ed.. Radon in Groimd Water:
Chelsea, Mich., Lewis Publishers, p. 15-30
[This paper reviews the principal rock types and distributions in New England with respect to their typical
uranium concentrations and expected radon production. Correlations of radon in ground water with rock type
are also discussed, and some effects of pumping rates on the radon concentrations.]
Hall, Stephen T., 1991
Combining mitigation & geology: Indoor radon reduction by accessing the source, in The 1991 International
Symposium on Radon and Radon Reduction Technology, Philadelphia, Pa., 2-5 April 1991:
Preprints, v. 5, no. IX-1, 10 p.
Soil radon testing has shown that radon sources are concentrated in narrow linear areas congruent with local
geology in the eastern Piedmont, which should also hold true in any folded moimtain belt re^on with
heterogeneous geology, fin existing buildings, if micromanometer tests indicate poor communication in the
sub-slab environment, soil radon concentration gradients can be mapped with instantaneous sub-slab radon
measurements. By then orienting these di£ficult-to-mitigate homes on a geologic map, we have been able to
predict the location of the radon source adjacent to foundation walls. Tapping these source areas with a multi-
duct sub-slab depressurization system has been shown to be effective in achieving optimum radon reductions....
Hall, Stephen T., 1991
Correlation of soil radon availability number with indoor radon and geology in Virginia and Maryland, in The1991 International Symposium on Radon and Radon Reduction Technology, Philadelphia, Pa., 2-5 April 1991:
Preprints, v. 4, no. VIIIP-3, 9 p.
[Soil radon availability measurements have yielded correlations with both indoor radon levels and various
geologic units. The radon availabihty number is a function of the soil radon concentration, permeability, and
81

diffusion rate. The equipment consists of a special probe and a radon monitor with an attached a-scintillation
cell. A plot of radon availability numbers against indoor radon levels revealed two distinct populations:
buildings with basements and buildings without basements or with other construction factors. Soil tests are
being used with success to predict the potential for elevated radon levels and to enable the design of of
mitigation systems with the correct magnitude and location of ventilation points. (Modified author’s abstract)]
Hall, Stephen T., 1991
Mitigation diagnostics: The need for understanding both HVAC and geologic effects in schools, in The 1991
International Symposium on Radon and Radon Reduction Technology, Philadelphia, Pa., 2-5 April 1991:
Preprints, v. 5, no. X-4, 16 p.
[Techniques described in the two papers above were applied to schools with success.]
Hall, Stephen T., 1991
Paleozoic granites in the southeastern United States as sources of indoor radon [posters], in The 1991
International Symposium on Radon and Radon Reduction Technology, Philadelphia, Pa., 2-5 April 1991:
Preprints, v. 5, no. IXP-2, 9 p.
Hand, Bryce M., 1988
Geolo^c factors affecting indoor radon in Onondaga County, N.Y. [abs.], in Radon in the Northeast:
Perspectives and Geologic Research (conference), Troy and Albany, New York, May 31-June 2, 1988:
Northeastern Environmental Sdence, 7(1): 6
Haque, A.K.M.M., and C. HaUs, 1993
Radon migration related to structure and plutonism in high heat production province [abs.], in First International
Workshop on Indoor Radon Remedial Action, The Scientific Basis and Practical Applications, Rimini, Italy,
27 June-2 July 1993:
Commission of the European Communities et al.^ Book of Abstracts, p. 76
According to the [U.iq National Radiation Protection Board (Documents of NRPB, 3(4):19, 1992), 90,000 or
so dwellings with radon levels exceeding 200 Bq/m^, are still to be discovered, the majority of which are likely
to be in Cornwall and Devon. Reimer and Gundersen (1989) have claimed a striking correlation between soil-
gas radon concentration, indoor radon level and the geology. All homes built over a mylonite area have indoor
radon concentrations greater than 150 Bq/m^ (US action level), and they are the only homes [in that
immediate area] that have radon concentrations greater 7.4 kBq/m^. Sheared fault zones have been identified
as the cause of many of the highest levels of indoor radon. It is believed that during ductile deformation of
a homogeneous rock there is redistribution of U/Ra in the shear bands of the fault zone. According to Scott
(1992), the near-surface soil-gas radon concentration in the Reading Prong area was up to 222 kBq/m^,
suggesting an effective air permeability as high as 10'^^ m^, equivalent to sand and gravel. NRPB results
(NRPB-R254, 1992) of radon measurement in Northamptonshire, Derbyshire, and Somerset contain some
geolomcal inputs. Varley and Flowers (1992) have recorded high levels of radon, up to several thousand
Bq/nr, over faults close to granite areas. Ball et al. (1991) and Heath (Quarterly Jour. Engineering Geology,
24:169, 1991) also related zones of high radon concentrations to fi-acture zones. The major objective of the
proposed study is to gain greater insight into the factors that determine radon availability and accumulation
in dwellings. The approach will be to assemble geological, soil, and radiological data, leading to the
formulation of models that can identify areas and structures with a high radon potential. The intention of the
paper is to invite thorough discussions which will lead to successful plmming of experimental and theoretical
studies.
Harrell, James A., and Ashok Kiunar, 1988
Radon hazards associated with outcrops of the Devonian Ohio shale. Final report for a grant awarded by the
Ohio Air Quality Development Authority:
Toledo, Ohio, Univ. Toledo, 163 p.
82

The indoor radon concentrations in houses, and the uranium, organic carbon and radon contents of samples from
the underlying Ohio shale were investigated in six 35-40 mr [91-104 km^] areas of Ashtabula, Cuyaghoga,
Erie-Huron, Franklin, Pike, and Logan Counties. In addition, for each house, the thickness and texture of the
sediment overburden above the Ohio shale were determined, as were also numerous parameters relating to
the design, construction, and maintenance of the house. HBased on the survey results for the study areas, the
following trends and relationships were found to exist. The amount of radon emanating from the Ohio shale
is a direct function of the uranium concentration in this rock formation, and the manium itself is ultimately
controlled by the amount of organic matter. Organic matter (as measured by total organic carbon), uranium,
and radon in the Ohio shale all increase in a westward direction across Ohio. Similarly, the indoor radon
concentration in houses increases from east to west across the state. Uln the Ashtabula, Cuyaghoga,
Erie-Huron, and Logan study areas, where the sediment overburden is, on average, less than 20 feet (6 m)
thick, the indoor radon levels are probably directly attributable to the underlying Ohio shale. In the Franklin
and Logan study areas, however, the sediment overburden (a silty glacial till) averages 90 and 125 feet [27 and
38 m] thick, respectively. These great thicknesses combined with the generally fine-grained texture of the
overburden probably greatly diminishes the amount of radon reaching the surface from the Ohio shale. The
elevated indoor radon levels in these two areas must then be due, in part, to radon emanating from material
within the overburden. fOf the several house parameters investigated, only two had a statistically significant
effect on indoor radon levels in all study areas: the penetration factor (a measure of the prevalence of radon
entry points in the house substructure; higher values indicate more entry points) and the air exchange factor
(a measure of the "tightness" of a house; higher values indicate greater indoor-outdoor air exchange).
Increasing indoor radon levels were found to be associated with increasing penetration factor and decreasing
air exchange.
Hassler, Gerald L., 1940
Soil gas sampling device and method:
U.S. Patent no. 2,210,546, Aug. 6, 1940, 6 p.
[A soil-gas sampling probe having two inflated packers, one above the other near its lower end, creates two
separate spaces in a sampling hole. The absolute pressure in the upper space is maintained less than that in
the lower space, so that any atmospheric contamination, even that passing through the ground beyond the hole
wall, is intercepted in the upper space. An undiluted, contamination-free soil-gas sample is practically
guaranteed from the lower space. An analogous arrangement with the same advantages can be used for
sampling soil gas rising through the surface of the ground: two concentric cylinders, open on the bottom side
only, are pressed on the ground surface, and the pressure in the outer cylinder is maintained less than that in
the inner cylinder, from which the soil-gas S2unple is withdrawn.]
Hawthorne, A.R., R.B. Gammage, and C.S. Dudney, 1984
Effects of local geology in indoor radon levels, in International Conference on Indoor Air Quality and Climate,
3d, Stockholm, August 20-24, 1984; Vol. 2,: Radon, Passive Smoking, Particulates and Housing Epidemiology,
Birgitta Berglund, Thomas Lindvall, and Jan Sundell, eds.:
Stockholm, Swedish Council for Building Research, Vol. 2, p. 137-142
A monitoring study of 40 homes in eastern Tennessee found that about 30% had radon levels > 148 Bq/m^(>4 pCi/L) in the living space and that these elevated levels showed correlation with location on a porous
dolomite ridge surrounding Oak Ridge.
Henry, Mitch E., Maggie Kaeding, and Don Monteverde, 1989
Radon in soil gas and gamma ray activity measurements at Mulligan’s Quarry, Clinton, New Jersey [abs.]:
Geol. Soc. America, Northeastern Section, Abstracts with Programs, 21(2): 22
Mulligan’s Quarry, Clinton, New Jersey, is located near an area in which elevated (greater than 148 Bq/m^ or
4 pCi/L) indoor radon concentrations have been measured. As part of a continuing study to evaluate the
geologic controls on the distribution of radon in the environment, gamma- ray activities were measured with
a hand-held scintillometer and a portable gamma spectrometer. These gamma measurements were compared
83

with one another and with soil-gas radon measurements. Although throughout the quarry, gamma-ray activity
(total counts average over 70 per second) is relatively high, large variations in these values (nearly an order
of magnitude from 40 to 350 counts per second) occur over small distances (tens of feet). Variations of greater
than an order of magnitude also exist in the soil-gas radon concentrations between sample sites about fifty feet
apart. A positive correlation e^ts among the three data sets. Areas with anomalously hi^ scintillometer
counts are generally coincident with, although somewhat larger than, areas of anomalously high equivalent
uranium (eU) determined with the gamma spectrometer. Such areas are also generally coincident with areas
displaying anomalously high soil-gas radon concentrations. A few sample locations have a negative correlation
between the eU and the soil-gas radon concentration. Data presented herein suggest that if a pre-construction
evaluation of the radon hazard potential for a site is desired, a detailed survey should be conducted. Moreover,
measurements of the equivalent uranium in the soil and rock and the concentration of sod-gas radon are both
valuable measurements for a thorough site evaluation.
Henry, Mitchell E., Margret E. Kaeding, and Donedd Monteverde, 1991
Radon in soil gas and gamma-ray activity of rocks and sods at the Mulligan Quarry, Clinton, New Jersey, in
Gundersen, Linda C.S., and Richard B. Wanty, eds.. Field studies of radon in rocks, soils, and water:
U.S. Geol. Survey BuUetin no. 1971, p. 65-75
Total-count gamma-ray data, gamma-ray spectrometer data, and sod-gas radon measurements were made at the
Mulligan Quarry, Clinton, NJ. Although the entire area shows relatively high values of radioactivity, some
areas within the quarry show radioactivity levels that are greater than twice backgroimd with ad three
measuring techniques used. Radon in sod-gas measurements generady shows high values in locations where
gamma-ray activity is high, but this is not always the case. One area shows a high radon sod-gas value that
corresponds to a relatively low equivalent uranium value, and another area shows a high equivalent uranium
value that corresponds to a relatively low radon value. High gamma activity and hi^ radon in sod-gas
concentrations appear to be related to mineralization that occurs in a shear zone at the southern end of the
quarry and may be related to fracture-filling material throughout the entire quarry. Sod development on top
of the quarry prevents direct tracing of the fractures seen on the working face and may broaden any radon and
(or) gamma-ray highs associated with these concealed fractures.
Hess, C.T., R£. Casparius, SA. Norton, and W.F. Bnitsaert, 1980
Investigation of natural levels of radon-222 in groundwater in Maine for assessment of related health effects, in
Natural Radiation Environment m, Gesell, Thomas F., and Wayne M. Lowder, eds.:
Springfield, Va., NTIS, U.S. Dept. Energy Rept. CONF-780422, Vol. 1, p. 529-546
We have used an inexpensive radon (^Rn) measurement method using liquid sdntdlation counting (Gesed and
Prichard, 1977; Prichard and Gesell, 1977) to remeasure potable water from 10 sites near Raymond, Maine,
to determine the accuracy and reproducibility of earlier measurements (Smith et al.^ 1961). Duplication or
triplication of samples shows a high degree of reproducibility for the liquid scintillation method. Comparisonwith earlier measurements shows good agreement. We have also measured, in duplication, water from 150
new sites from several counties in Maine: York, Aroostook, Penobscot, Cumberland, Waldo, Lincoln, and
Hancock. The sites were characterized in the field for rock and overburdentypes, well and casing depths, and
water temperature; water samples were collected for water chemistry and measurement. A hypothesis
emerged from analysis of the measured values of ^Rn near Raymond, Maine, that high values (1.8 to
7.4 MBq/m^ or 50,000 to 200,000 pCi/L) are associated with granite. This was shown to be correct for several
large areas of granite such as the Sebago, Lucem, Waldo, and Waldoboro granites. The presence of high
^Rn concentrations in granite areas hundreds of kilometers from the Raymond area shows that the high
^Rn levels in water are a statewide and perhaps a regional problem rather than a western Maine problem.
The groundwater with highest concentrations seems to be in the granites and adjacent metasedimentary rocks
lying in the highest grade metamorphic terrain. Nongranitic areas with low-grade metamorphic rocks, as in
most of Aroostook County, show low values of ^Rn (7.4 to 74 kBq/m^ or 200 to 2000 pCi/L).
Hesselbom, Ake, 1984 [Pub. 1985]
84

Radon in soil gas: A study of methods and instruments for determining radon concentrations in the ground:
Uppsala, Sveriges geologiska undersokning, ser. C., no. 803, p. 1-58
is a study of some of the commercially available detectors for field measurements of radon concentrations
in soil gas and of radon flux from the ground surface. Most of the methods for measuring radon are based
on detection of alpha particles or gamma radiation which are produced during radioactive decay of radon and
radon daughter isotopes. The methods used can be described as active or passive. The active methods involve
pumping of soil gas into or through a detector whereas the passive methods register radon concentrations in
the ground under natural conditions. UCalibrations were made experimentally by exposing detectors in a
controlled radon/radon daughter environment at the National Institute of Radiation Protection in Stockholm,
Sweden. HThe methods used have been compared with regard to ability to detect variations in radon
concentration, reproducibility, depth effects, and meteorological effects. ITThe results show that all methods
and detectors used in the study have established the presence of radon in the soil gas. The accuracy of the
results obtained, whatever the method or detector used and whatever purpose of the measurements, depends
very much upon the physiographic and geological environment (e.g. types of soil and moisture content) in which
the detectors are placed.
Hilpman, Paul L., Raymond M. Coveney, Jr., and Charles G. Spencer, 1988
Pennsylvanian black shales may be overrated as radon sources [abs.]:
Geol. Soc. America, Abstracts with Programs, 20(7): A338
Much current radon research is focused on mechanisms of migration from source material to the home, largely
based on the assumption that rocks rich in uranium are likely to cause hazardous concentrations of radon
whenever adequate pathways to overlying structures are present. In 1984, for example, within the infamous
Reading Prong Index House located above gneisses containing 28-55 ppm uranium, radon concentrations of
74 kfiq/m^ (>2000 pCi/L) of air were detected—far exceeding the U.S. EPA action level of 148 Bq/m^
(4.0 pCi/L). In western Missouri and eastern Kansas, uranium concentrations of several black Pennsylvanian
shales are nezu’ly twice the levels (>50-100 ppm uranium) of gneisses below the Reading [Prong] Index House.
Accordingly, it seemed appropriate in 1986 to identify the large region of the Midwest underlain by these shales
as a potentially high radon risk area. However, more than 200 residences within the Kansas City [Missouri]
area have subsequently been tested and radon concentrations above 3.7 kBq/m^ (100 pCi/L) have yet to be
detected in any structure. Of 48 homes tested exclusively during the winter season, all but seven had readings
below the group average of 240 Bq/m^ (6.4 pCi/L). Even within limestone mines beneath the City, where
commercial underground space is commonly floored by uraniferous black shales, readings average <220 Bq/L(<6.0 pCi/L) and none exceed 481 Bq/m^ (13.0 pCi/L). On the basis of results thus far, we conclude that
shales may be more effective than crystalline rocks* in retarding radon emanation. Despite slightly elevated
average values for radon in homes of Kansas City, it is inappropriate to project severe contamination levels
for the area simply as a function of uranium concentrations in local bedrock. [* "Crystalline rocks" is an
inexact term usually meaning igneous or metmnorphic rock, as opposed to sedimentary, but sometimes
including sedimentary rocks having contiguous crystals, such as marbles and quartzites.]
Holkko, J[ussi], and S[imo] Liukkonen, 1991
Radon diffusion in Finnish glacial till soil, [abs.], in International Symposium on the Natural Radiation
Environment, 5th, Salzburg, Austria, 22-28 September 1991, Abstracts:
Salzburg, Univ. Salzburg, Inst, for General Biology, Biochemistry and Biophysics, abs. no. 66
Glacial till is the most common soil in Finland. In Scandinavia the term moraine is usually used to describe the
dadal till. The structure of ground moraine is very dense and its permeability very low. Areas with a high
Rn content in the ground are concentrated, in general, in the moraine and esker regions in Finland.
lIGladal sandy till was chosen for model tests to determine the diffusion behavior of the ^Rn gas. Soil
parameters like granulation, specific grain density, bulk density, water content, and porosity were measured
and calculated for the original soil samples. Four radon vessels of about 11.5 dm^ volume were filled with this
material to the bulk density approaching that in the natural ground. The filling of the material was madeunder four different moisture conditions. The diffusion experiments were carried out both in steady-state and
85

non-steady-state conditions with the opened vessels. In non-steady-state experiments the vessels were opened
for four different time intervals. For steady state the vessels were left open for a longer period in order to
reach the stationary conditions for the ^Rn diffusion. The^Rn production was determined in closed vessels
with an equilibrium time of about one month. The pressure in the vessels was controlled with mercury
manometers against the atmospheric pressure. Lucas cells were applied to the measurements of ^Rnconcentrations by taking ^Rn specimens from soil pores through a special filter plate. The diffusion
coefficients were calculated in steady-state and non-steady-state conditions by using appropriate solutions of
differential equations for diffusion in these two cases. TThe moisture content of the soil seems to have a clear
influence on the exhalation rate and on the emanation of the Rn gas m glacial till soil. The water content,
Le., the degree of saturation, in partly saturated soils, has a dominating effect on the diffusion behavior in the
soil
Holkko, J., and S. Liukkonen, 1993
Radon diffusion in model tests on Finnish esker and till soils:
Health Physics, 64(2): 132-140
[The most common soil in Finland is "moraine," known in North America as glacial till, which is generally of low
permeabihty; radon movement in it is dominantly diffusive. In contrast, the long, sinuous ridges of stratified
gravel and coarse sand known as eskers, are highly permeable, and although their radon is more easily leaked
to the atmosphere, they permit very easy infiltration of radon-bearing soil gas into houses smd are the most
dangerous sites for construction in Finland (see papers by Castr6n and by Voutilainen). A building-site radon
classification scheme proposed by Slunga (1988) is reviewed. Field investigations in southern Finland were
made at two locations on dense glacial till and one location on an esker, and were foUowed up by laboratory
measurements to characterize the soils. Steady-state formulas were obtained in order to determine radon
diffusion coefficients in two of the soils in a cylindrical test chamber with suitable inlet and outlet controls and
the ends and test ports at several levels in the chamber. Non-steady-state formulas were obtained for transient
tests with soil packed in open-top cylindrical chambers with lids in place or removed while samples of air in
the soil were removed from a specific level in the soil volume. An effective porosity equal to the air-fiUed
porosity plus of the water-filled porosity was used. Glacial till of the in situ characteristics (porosity, 0.201;
water, 6% on a dry mass basis; saturation, 0.42) gelded diffusion lengths of 0.41, 031 and 0.63 m and
interstitid diffusion coefficients of 33x 10’^, 53x 10 , and 83x 10’^ m^s in different steady-state tests. Fromthe trar^ a nt tests, interstitial diffusion coefficients of 2.7x 10*^ and 3.9x 10*^ m^/s were estimated for glacial
till of and 4.7% water on a dry mass basis. Dry esker sand of 39% porosity under steady-state conditions
yielded a diffusion length of 134 m and an interstitial diffusion coefficient of 5.0x 10~^ m^/s. Soil-gas ^Rnconcentrations measured in the field were (0.15-2.6, mean 0.77) and 0.105 MBq/m^ for dense glacial till at two
sites and (28-97, mean 63) kBq/m^ in esker sand; the corresponding ^^^a concentrations for the dry soils were
(176-216), 773, and 75 Bq/kg.]
Holub, RJ"., RJ". DrouUard, TJB. Borak, W.C. Inkret, J.G. Morse, and JJ*. Baxter, 1985
Radon-222 and ^Rn progeny concentrations measured in an energy-efficient house equipped with a heat
exchanger:
Health Pt ^^ics, 49(2): 267-277
[222Rn ' ;ts progeny were measured in the basement of a recently constructed house in Denver, Colorado.
The ho^c had a poured concrete basement and was well sealed for energy efficiency. Indoor radon levels did
not correlate well with the degree of depressurization of the basement or with the air exchange rate, and were
attributed mainly to diffusive radon entry. Assuming such entry, the diffusion length of radon in the concrete
was calculated to be 43 cm (38± 5 cm in a later response to correspondence in the journal).]
Hutter, Adam R., and Arthur W. Rose, 1987
Radon variability in soil gases over fracture traces in limestones, central Pennsylvania [abs.]:
Geol. Soc. America, Abstracts with Programs, 19: 90
86

Significant Rn anomalies (2 to 6x background of 3.7-37 kBq/m^ or 100-1000 pCi/L, depending on the season
and method) occur in soil gases over two photogeologic fractme traces near the Pennsylvania State University
Campus. The anomalies were detected using both a field radon detector (EDA Inst. Model RD-200) and
Track Etch detectors during most but not all seasons. The anomaly is missing over one fracture trace in data
collected by Track Etch in early summer 1986, suggesting that soil moisture or other seasonal effects may have
been operative. However, the anomaly is present in the data collected by the RD-200 in early May. Contents
of U, Th, and (^^^a) are enriched by 20-30% in soil along one fracture trace, possibly indicating
accumulation of residual clay relative to adjacent areas. Emanation coefficients (proportion of radon lost to
the aqueous phase from disaggregated soil in lab measurements) vary from 6 to 40%, averaging 26%, but show
no correlation with the location of the fracture trace. Measurements of soil conductivity are still underway to
determine soil depth, but it appears that soils are thicker along the fracture trace. Data to evaluate Rnenrichment by upward flow along the fracture trace have not yet been obtained. The results clearly indicate
that Rn in soil gases varies considerably over short distances, as a result of a variety of phenomena involving
soil properties. These local variations in soil Rn probably cause much of the large range of local variabihty
in the Rn levels in houses.
Jacobs, P.M., M.G. Mudrey, Jr., C.V. Weiffenbach, and D.M. Mickelson, 1993
Comparison of soil profile characteristics and radon potential with soil gas radon along hillslope transects in
southeastern Wisconsin [abs.], in The 1993 International Radon Conference, Denver, Colo., Sept. 20-22, 1993:
Denver, Colo., Am. Assoc. Radon Scientists and Technologists, Rocky Mountain Chapter, Preprints, p. IV 9
This continuing study evaluates the relationship of radon source potential of Quaternary units and soils to
hillslope transects in southeastern Wisconsin. Analysis of soil profiles developed in the sandy-textured NewBerlin and clayey-textured Oak Creek Formations disclosed elevated concentrations of Rn precursors relative
to the parent till. Accumulation of Rn precursors by weathering and biocycling with subsequent adsorption
on humus, clay, and oxide fractions account for this phenomenon. However, the effect of a hillslope system
(erosion and deposition) on the redistribution of radon precursors has not been investigated.[*] Two hillslope
segments, one each in the New Berlin and Oak Creek Formation outcrop areas, were selected for detailed
study. Integration of sod-profile attributes with related bulk-soil radon concentrations compares favorably with
independently determined soil-gas radon. These relationships are supported by other empirical evidence for
hillslope redistribution of radon precursors by sediment erosion and soil solution throughflow. The magnitude
of redistribution appears to be a function of relief and permeability of the soil. This observation is compatible
with other studies in the Midwest and suggests that radon potential studies must include not only geologic, but
also pedolo^c and topographic factors. [* See Reesman, 1988.]
Jasinska, M., T. Niewiadomski, and J. Schwabenthan, 1982
Correlation between soil parameters and natural radioactivity, in Vohra, K.G., U.C. Mishra, K.C. Pillai, and
S. Sadasivan, eds., Natural Radiation Environment:
New York, John Wiley and Sons, p. 206-211
In an earlier paper [Jasinska et al.y Health Physics, 38:416-419, 1980], the authors suggested that a linear
correlation exists between the concentration of the natural radionuclides U-238, Th-232, and K-40 contained
in the upper layer of the soil, and the weight fraction of particles of diameter less than 0.02 mm, i.e., the soil’s
mechanical composition. The hypothesis has been verified on a larger and statistically significant sampling of
soils frequently occurring in Poland: chernozem [highly organic black earth], podzolic [thin matted organic layer
overlying gray leached layers and brown layers of organic material transported from above], muds, and
anthropogenic, where, for a given soil type, seunples were chosen to represent various mechanical
compositions. They conclude that the radioactivity concentrations of the head radionuclides in the soil depend
on its mechanical composition, rather than on the type of soil. Thus, in principle, one may estimate dose rates
from terrestrial sources directly from soil maps, without the need for outdoor measurements.
Kearney, P.D., and DA. Krueger, 1987
Radon-222 flux density measurements using an accumulator: an alternative technique:
87

Health Physics, 53(5): 525-526
Keller, G., and M. Schiitz, 1988
Radon exhalation from the soil:
Radiation Protection Dosimetry, 24(1/4): 43-46
[The exhalation of ^Rn and ^^^^Rn from the soil in southwestern Germany was measured by covering the
ground with an insulated hemispherical metal dome. The dome was charged to 8 kV. Beyond an apertme
at the top of the dome was an insulated box containing a grounded surface-barrier a detector. Upon decay
of a radon isotope, the product polonium isotope ion was attracted to the a detector to be spectrometricedly
identified and counted. The rate of exhalation was computed from the increases in polonium-isotope counting
rates oyer a 2-hour period; for radon the lower limit of detection was 0.3 mBq/m -s, with a median error of
«10%. Radon exhaiation was found to be influenced chiefly by the effective porosity (the air-fiUed porosity),
and was also correlated with the difference between the soil temperature and the temperature of the near-
surface air. Soils over Lower and Middle Permian sandstone, coal, and shell limestone showed average
exhalation rates of 1-2 mBq/m^-s; soils over Tertiary volcanic rocks near the village of Dottingen exhalation
averaged 5-10 times greater. Older houses with bare dirt cellar floors had significantly greater indoor radon
concentrations, up to «500 Bq/m^, than more modem houses with concrete slabs. (WUkening, Clements, and
Stanley, 1975, estimated a worldwide average ^Rn exhalation for continental areas of 0.75 atom/cm^-s,
equivalent to 16 mBq/m^-s.)]
Kirichenko, L.V., 1970
Radon exhalation from vast areas according to vertical distribution of its short-lived decay products:
Jour. Geophys. Research, 75(18): 3639-3649
Geophys. Abs. 288-386
The use of natural radioactivity in the investigation of mixing and transport processes in the atmosphere is
impossible without allowing for radon influx from vast surfaces on the Earth. An estimate of the effective
radon flux from areas with nonuniform emanation is considered. The technique consists of calculating the total
amount of natural radioactive products through the entire atmosphere per unit of ground surface. A vertical
profile of the alpha-active short-lived products of radon has been determined by sounding the atmosphere with
equipment installed in aircraft. The possiblities of the technique are analyzed. Characteristics of emanation
of a number of regions in the Soviet Union are given.
Kline, S.W., and D.G. Mose, 1989
Causes of elevated indoor radon during winter seasons [abs.]:
Eos, Am. Geophys. Union Trans., 70(15): 500
Indoor radon values have been shown to depend on the season of measurement, with winter values generally
being highest. Long-term alpha-track basement measurements from 347 metropolitan Washington, DC homes
during the winter of 1986/87 and 655 homes during the winter of 1987/88 indicate that radon levels can also
vary from winter to winter. The colder 1986/87 winter produced significantly higher median indoor radon in
surveyed homes. Most models for e^qplaimng seasonal variations dead prindpadly with air ^change between
buildings and the out-of-doors. Homes are thought to have more radon in the winter because they are moreoften closed to conserve heat. Also, soil-to-building flow rates are increased by heated indoor air escaping
from the upper part of homes and creating a pressure difference between the building and its substrate.
Preliminary data from alpha-track soil radon monitors, indoor radon monitors, and surface gamma-ray
spectrometry indicate that indoor radon values in winter are also influenced by intervals of elevated soil-gas
radon in the subsurface. Freezing of the upper layer of soil creates a capping effect that reduces the escape
of soil-gas radon to the atmosphere, so soil radon concentrations build up to higher-than-normal levels. Thus,
periods of frozen ground cause higher concentrations of indoor radon. Since actual radon concentrai in
soil gas are apparently higher during such periods, attempts to simulate winter conditions during other seasons
through closed-home procedmes wiU probably be less successful in northern latitudes.
Kline, Stephen W., Douglas G. Mose, and Isidore Zietz, 1988
88

Use of aeroradioactivity maps in indoor radon prediction: A case study from Fairfax County, Virginia and
Montgomery County, Maryland [abs.]:
Geol. Soc. America, Abstracts with Programs, 20(7): A337-A338
An indoor radon survey in northern Virginia and southern Maryland in 1987-1988 has accumulated »5000
alpha-track (3-month exposure interval) radon measurements. The study area, which contains a diversity of
sedimentary, igneous, and metamorphic rocks, is being used to evaluate measurement methods, remediation
methods, and methods for radon prediction for communities. Good bedrock, soil, and aeroradioactivity maps
are available for the study area. A land-based spectral gamma-ray survey of a number of sites in Fairfax
County indicates that there is a general increase in calculated equivalent uranium with increasing total counts
of gamma radiation. Analyses for uranium in some soil and rock materials of Fairfax County by neutron
activation are in agreement with trends in total count aeroradioactivity averaged over various geologic units.
These data indicate that there should be a relationship between total-count aeroradioactivity and soil radon,
and hence indoor radon, in this area. Comparison of home locations and their indoor radon values with
aeroradioactivity maps of Fairfax and Montgomery Counties shows that total-count aeroradioactivity is a very
good discriminator of areas of high potential indoor radon. The results were even better than potential maps
based on geology and soil characteristics. Subtle differences in the relationship between the percentage of
homes over 148 Bq/m^ (4 pCi/L) and the aeroradioactivity signal are present between different rock types.
The differences are likely a consequence of using total gamma-ray aeroradioactivity (includes signal
components of K as well as daughters of U and Th decay) and to differences in the geology of the surface
material. A spectral aeroradiometric survey is expected to produce the best results in regional indoor radon
prediction.
Kothari, Brajesh K., 1983
Use of NURE data for natural radiation exposure: indoor radon and gamma-ray radiation [abs.], in Health
Physics Soc. Ann. Mtg., 28th, no. VI7A6:
Health Physics, 45(1): 254
Radionuclide data obtained in the National Uranium Resource Evaluation (NURE) survey of the U.S. Depart-
ment of Energy were used to correlate equivalent uranium with indoor radon concentrations and to calculate
natural outdoor exposure rates. In the NURE survey, distributions of equivalent uranium and thoriiun (eUand eTh) and K concentrations of "surface soil" were obtained by flying Nal crystals generally at flight spacings
of three or six miles. Indoor exposure to radioactive radon daughters is a potential health problem which
varies with geographical location. The present difficulty in identifying problem areas might improve by the use
of eU data from the NURE program. We have calculated equivalent uranium (eU) from NURE survey for
areas where annual indoor radon concentrations have been measured by others. The respective eU and radon
or radon daughter concentrations are: Middlesex, NJ, 13 ppm, 12-29 Bq/m^ (032-0.79 pCi/L) (15 homes)'
Lewiston, NY, 13 ppm, 13-29 Bq/m^ (034-0.79 pCi/L) (10 home^; Cannonsburg, PA 2.2 ppm, 17-167 Bq/m^(0.45-4.50 pCi/L) (8 homes); Butte, MT, 7 ppm, 0.040-5.03 /J/m^ (0.0019-0.242 WL) (56 homes); Anaconda,
MT, 33 ppm, 0.087-0.69 /iJ/m^ (0.0042-0.033 WL) (16 homes); Florida, phosphate region, 6.7 ppm, 0.06-
2.16 (0.003-0.104WL) (107 homes); Florida, background for phosphate re^on, 13 ppm, 0.02-0.23 /J/m^(0.001-0.011 WL) (26 homes). A significant correlation between eU and indoor radon concentration, obtained
by using weighted regression analysis, implies that for these locations, ground underneath the home is a major
source of radon. Since almost all of the USA has been surveyed, NURE data can be used to identify areas,
where ground could be a major source of indoor radon, for further studies. Using appropriate factors for the
various radionuclides, contour maps of outdoor exposure rates from gamma-rays were prepared from the
NURE data for some areas in New York State in cooperation with the Bendix Field Engineering Corporation.
Results from exposure rate maps and limitation of the NURE data will be discussed.
Kothari, B., C. Kunz, and W. Lilley, 1985
Identifying areas with potential for high indoor radon: results of surficial soil measurements [abs.], in Health
Physics Soc. Ann. Mtg., 30th, Chicago, 111., May 26-31, 1985, Abstracts of Papers, no. TPM-D7:Health Physics, 49(1): 158
89

Kovach, Edward Michael, 1944
An experimental study of the radon-content of soil-gas:
Am. Geophys. Union Trans., 25(4): 563-571
Geophys. Abs. 8256:
All the solid constituents of the earth have minute admixtures of radioactive substances and give off emanation.
Accordingly, the soil gases the fill the capillaries of the earth must contain radon and thoron. The present
study at Fordham, N.Y., seeks to establish a connection between the fluctuations of the soil’s radon content
and the variations of penetrating radiation from the groimd studied by V.F. Hess. Three pipes were lowered
into bored holes in the ground to depths of 25, 75, and 150 cm respectively and sealed at the surface by
cement. For 69 days the radon content of the soil gas was measured in these pipes simultaneously by means
of an ionization apparatus. The following conclusions are drawn at this phase of the experiment: (1) Radon
content in soil gas increases with freezing and decreases with water soaking of the ground; (2) dry ground
produces stability within the three layers studied; radon is found to increase with depth; and (3) atmospheric
influences are secondary to the ground conditions of the soil.
Kovach, Edward M., 1945
Meteorological influence upon the radon-content of soil gas:
Am. Geophys. Union Trans., 26(2): 241-248
[This paper continues the work reported above. Soil gas was drawn from pipes bottoming at 25, 75, 150, and
200 cm over the course of 177 days of actual investigation during the period May 17, 1944-March 25, 1945, and
included 642 individual measurements using ionization chambers connected to a Wulf bifilar electrometer. It
was inferred that (1) Dry ground produces constant values of radon content at each depth and shows an
increase with depth; (2) A long period of snow-and-ice cover on the ground causes the radon content at aU
depths to approach the same value, which is the highest for the investigation period; (3) Within the depth range
studied, increasing barometric pressure causes a decrease in radon content, and contrariwise, the effect being
most pronounced at the shallower depths; (4) a high wind velocity over a period of hours noticeably reduces
the radon content in the top layers of the ground; and (5) Soil temperature changes have no great effect on
the radon content of soil gas.]
Kovach, Edward M., 1946
Diurnal variations of the radon-content of sod-gas:
Terrestrial Magnetism and Atmospheric Electricity, 51: 45-56
[Measurements similar to those reported above were conducted in a lawn-covered area at a site about 6 km fi-om
the previous one. Only 25- and 75-cm depths were investigated, because short-term changes were to beexpected most at the shallow depths, but as many as five 25-cm pipes were emplaced in the 15?G8-m lawn.
It was inferred that (1) Constant atmospheric pressure is accompanied by rather stable values of the radon
content of soil gas; (2) Variations in pressure had only a slight influence, although in general decreasing
pressure tended to increase the radon content at both depths, and contrariwise; (3) The radon content of the
air in the soil capillaries increased linearly with depth to 75 cm; (4) If several 4-L samples were taken from
the same pipe at intervals of a few hours, the values of radon conent did not diminish; (5) Samples taken from
25-cm depth at the different locations on the lawn differed a great deal; (6) The radon content at 75-cm depth
was somewhat periodic, with afternoon values generally lower than morning values (but no consistent period-
icity was noted at 25-cm depth); and (7) The radon content in the upper layers of the ground was markedly
reduced by winds that were strong and continuous over a period of several hours. The strong vtinds reported
ranged from 5.2 to 23 m/s, most > 11 m/s; the location and height of the anemometer were not reported. Nodata on radium content or emanating power of the soil at the sampling points were reported.]
Kullman, Frej, 1993
Radonrisk mapping—a method of predicting problem areas on geological grounds [abs.], in First International
Workshop on Indoor Radon Remedial Action, The Scientific Basis and Practical Applications, Rimini, Italy,
27 June-2 July 1993:
90

Commission of the European Communities et ai. Book of Abstracts, p. 78
Swedish authorities have stipulated a maximum radon level of 200 Bq/m^ for permanently inhabited buildings.
For buildings built later than 1981 the limit is 70 Bq/m^. In order to trace buildings with elevated radon levels
and to avoid building new ones the radon risk for different areas needs to be evaluated. Radon risk mapping
is done both at regional scale (normally 1:50,000) and in detailed scale (1:1000 - 1:10,000). For the mapping
the ground is classified into high-, normal- and low-risk areas. The classification work is started by an
interpretation of all available geological material from the investigated area, such as bedrock maps. Quaternary
geological, results from airborne radiometric siureys, earlier geotechnical investigations, results fi’om uranium
prospecting, and so on. This is followed by field investigations including radon measurements in possible risk
areas, and control of radium content by gamma spectrometry in typical rock types and soil types of the area.
The results are compiled on a map and into a report, with recommendations about building technical
requirements within different parts of the investigated area, and recommendations for the future tracing of high
radon buildings. Experience from Swedish radon measurements shows a tenfold increase of high-radon houses
within high-risk areas classified according to the above model, if compared with randomly distributed
measurements.
Kunz, Charles O., 1988
Indoor radon: Source characterization:
Environmental Progress, 7(4): 236-240
[Measurements of soil radium concentrations, sod-gas radon concentrations, and permeability of soil to gas flow
in six areas of New York State correlated with indoor radon measurements by a "Radon Index Number,"
RIN= (source term)(permeability)^(depth factor), where the source term can be the soil radium concentration,
emanating radium, or soil-gas radon concentration, and the depth factor, is the depth of soil to the water
table, bedrock, or to a soil layer of much lower permeabdity, divided by 3 m for homes with basements. This
RIN is different from that introduced by Eaton and Scott (1984).]
Kunz, C.O., 1988
Field measurements to characterize the avadability of radon in sod-gas for transport into homes [abs.], in Radonin the Northeast: Perspectives and Geologic Research (conference), Troy and Albany, New York, May 31-June
2, 1988:
Northeastern Environmental Science, 7(1): 7
[See abstracts above and below.]
Kunz, C., CA. Laymon, and C. Parker, 1989
Empirical relationship between sod parameters and indoor radon [abs.]:
Eos, Am. Geophys. Union Trans., 70(15): 497
Sod measurements were compared with indoor radon concentrations for several areas in New York State and
based on these results the foUowing empirical relationship was developed:
(Indoor radon) cx (source strength)(depth factor)(permeability)^
To characterize surfidal sod and bedrock regarding the amount of radon likely to enter homes it is necessary
to have a measure of the concentration of radon in the sod gas entering the homes (source strength) and a
measure of the amount of sod gas that can flow into the homes (permeability). The source strength can be
either the sod-gas radon concentration, the total sod radium concentration, or the emanating fraction of
radium. The depth factor is the depth of sod to the water table, bedrock, or other low-permeability feature.
The distribution of indoor radon concentrations within areas of simdar sod types had geometric standard
deviations ranging from about 1.5 to 3.0. This limits the ability to predict the indoor level for a particular
house. However, it appears that useful estimates of mean indoor concentrations can be made based on sod
and bedrock parameters.
Kunz, C., CA. Laymon, and C. Parker, 1989
91

Gravelly soils and indoor radon, in M.C. Osborne, and Jed Harrison, Symposium Cochairmen, The 1988
Symposium on Radon and Radon Reduction Technology, Proc., Vol. 1, Symposium Oral Papers:
Research Triangle Park, N.C., Radian Corp., U.S. Environmental Protection Agency Pub. EPA/600/9-89/006a
[Springfield, Va., NTIS Order No. PB89-167480], p. 5-75-5-86.
Many homes in New York State with above-average concentrations of indoor radon are built on deep,
well-drained, gravelly soils. Gravelly soils were studied in three areas where the geometric mean for basement
^Rn concentration ranges from 370 to 740 Bq/m^ (10 to 20 pCi/L), and at 12 additional State-wide homes
with basement ^^Rn concentrations greater than 740 Bq/m^ (20 pCi/L). The graveUy soils examined in this
study contain average to sl^tly above average concentrations of soil ^^^a («37 Bq/1^ or 1.0 pCi/g) and the
concentration of soil-gas ^Rn is within the range of average values for soils (« 26 kBq/m^ or 700 pCi/L at
120 cm). The permeability of these soils is high with a geometric mean of approximately 6x 10'^^ wl at a
depth of 120 cm. Tests conducted in one study area showed increases in permeability between depths of 30
and 120 cm. The product of a source term (soil ^^a concentration, emanating ^^a, or soil-gas ^^^Ra
concentration) and the square root of the permeability yields a Radon Index Number (RIN) which is used to
predict mean indoor ^^^Rn concentrations. The RIN, which is based on soil parameters agrees well with
measured indoor ^^Rn concentrations. [This RIN is different from that introduced by Eaton and Scott
(1984).]
Laymon, Charles, and Charles Kunz, 1991
Geologic factors and house construction practices affecting indoor radon in Onondaga County, New York, in The
1990 International Symposium on Radon and Radon Reduction Technology, Atlanta, Ga., 19-23 February 1990:
Research Triangle Park, N.C., U.S. Environmental Protection Agency Rept. EPA600/9-91-026b, Proceedings,
Vol. 2: Symposium Oral Papers, Paper No. VI-4, p. 6-37—6-50 [NTIS Order No. PB91-234450/AS]
Indoor radon in Onondaga County, New York is largely controlled by bedrock and surficial geology. At more
local scales, these alone are insufficient to characterize radon potential. A detailed study of the concentration
of indoor radon, soil radium, soil-gas radon, soil and bedrock type, permeabihty, and home construction
practices indicates that above-average indoor radon concentrations are associated with gravelly moraine and
glaciofluvial deposits, the radium-bearing MarceUus shale, and high-permeability zones around the substructiu’e
of houses built into limestone bedrock.
Laymon, Charles, Charles Kunz, and Lawrence Keefe, 1990
Indoor radon in New York State: Distribution, sources and controls:
Albany, N.Y., State of New York Dept. Health Tech. Rept. [unnumbered], 49 p.
[Short-term basement screening measurements in New York State, totalling 26,477, wer'" distributed log-normally
with a geometric mean of 93 Bq/m^ (2.5 pCi/L). Cortland, Chemung, and Steuber bounties had geometric
means >222 Bq/m^ (>6 pCi/L), one-third exceeded 148 Bq/m^ (4 pCi/L), and 58 homes in 22 counties
exceeded 3.7 kBq/m^ (100 pCi/L). Onondaga and Erie Counties had more homes with the extreme radon
levels, attributable to geolo^c conditions. The levels tended to be greater than the geometric mean from
August through February and equal to or less than the geometric mean from March through July. Indoor
radon potential, although necessarily variable within each physiographic province, was evaluated as generally
low for the Adirondack Mountains ( <« 56 Bq/kg or« 1 .5 pg ^^^a/g), mostly sandy soils with moderate-to-low
permeability); variable for the several lowlands (some very permeable gravels, with some occurrences ofradium
enrichment); moderately elevated for the Allegheny Plateau (highly permeable glacial deposits in valleys);
elevated in Onondaga County (derived from ivanium originally deposited in the black marine MarceUus shale);
probably somewhat elevated for the Taconic Mountains (intermediate-grade metamorphic bedrock with someelevation of ^^^a content and graveUy soils on vaUey bottoms); elevated in places in the Hudson Highlands
(ocourences of uranium with iron minerals in high-grade metamorphic rocks); low in the Manhattan Prong
(based on existing indoor data); and low for Long Island (low ^^^a content and generaUy moderate-to-low
permeability of soils, although coarse moraines are found along the northern coast and along the middle; someboulders of high 7 radiation are known and could be local sources of radon).]
92

LeGrand, Harry E., 1987
A predictive model for indoor radon occurrences—A first approximation, in Graves, Barbara, ed., Radon,
Radium, and Other Radioactivity in Groimd Water. Hydrogeologic Impact and Application to Indoor Airborne
Contamination. National Well Water Association Conference, Somerset, NJ., April 7-9, 1987, Proceedings:
Chelsea, Mich., Lewis Publishers, Inc., p. 477-487
[This paper presents a method of evaluating four major factors for assessing indoor radon potentialof a building
site: Rock type (uranium concentration); topographic slope and vertical emplacement of building; hydrogeologic
setting and average water-table position; and water-table behavior and characteristics. The method is designed
mainly for the eastern U.S., and is an outgrowth of the paper below. After scale-of-ten evaluation of each of
the major factors, the scores are combined by an algorithm, adjusted for anticipated construction
characteristics, and the final numerical answer is compared with a five-tiered "hazard potential scale," of
"likelihood of worrisome concentrations of radon" (probability of >148 Bq/m^ at least 30%).]
LeGrand, Harry E., 1987
Radon and radium emanations from fractured crystalline rocks-a conceptual hydrogeological model:
Ground Water, 25(1): 59-69
Subsurface air is a refuge for radon escaping from rock and soil surfaces and from subsurface water. Where the
subsurface air is confined in a zone by overlying poorly permeable material or by downward-moving water, the
radon can accrete and become mobile. The crystalline [non-sedimentary] rocks of the eastern U.S. contain
granites and associated rocks that have moderate to low amounts of uranium source material; the amounts are
sufficient for radon to emanate significantly from both the soil-saprolite zone and the part of the imderlying
fractured rock above the water table. Both the soil-saprolite confined air system and the fracture air system
are nondescript and are erratic in size emd shape from place to place and from time to time. They tend to
have a gross horizontality because of blanket infiltration of precipitation and in some cases by crude layering
of soil horizons or tension fracturing of bedrock. The pressure in the air systems increases chiefly as infiltrated
water moves downward and as the water table rises. The radon-laden air moves toward two types of low-pres-
sure chamber. One type of chamber is a house on sloping topography niched into the soil-saprolite zone and
perhaps into bedrock fractures. The other type is the unwatered fracture zone of a pumping cone of
depression where overlying clays are less permeable. These two types of low-pressure chamber have
characteristics ofvacuum cleaners, sucking in radon-laden air. Conditions leading to high indoor radon concen-
trations are: (1) granites and associated rocks with normal or above normal amoimts of uranium, (2) normal
interconnecting fracture pattern, (3) a thin mantle of relatively impermeable clay soil, (4) repeated cycles of
recharge and of a fluctuating water table in the fracture zone or in the overlying regolith, (5) indentation of
buildings into soil and rock materials, and (6) building construction allowing relatively easy inflow of air from
the subsoil and rock. Promoting the continual accretion of radon and radium in well water is the alternating
action of air and water in the tortuous fractures in the cone of pumping depression. Radon accretes in well
water more readily than does radium, chiefly because it is able to dififuse out of the pores and small fractures
to become then mixed with the churned well water; radium tends to be absorbed on the rock materials, but
the resurging ground water may desorb or dislodge radium and bring it into the well in some cases....
Lehtoviita, Timo, Jussi Holkko, Martti Viljanen, and Eero Slunga, 1985
Radonin merkitys talonrakennustekniikassa. Tutkimuskohteiden rakennustekninen tarkastelu [Radon in building
technology. Structural comparison on the research sites]:
Espoo, Finland, Helsinki Univ. Technology, Dept. Civil Engineering, Div. Structural Engineering Rept. 73, 145 p.
Indoor radon concentrations in 45 small houses are compared with their structural characteristics. Measured
radon concentrations ranged from 9 to 3541 Bq/m^. Radon concentrations in soil gas from 13 of the sites
ranged from 1 to 241 kBq/m^. The highest radon levels were measured in houses where the foundation slab
was not continuous, and were higher in houses with cellars. In most cases indoor radon levels were high if the
radon content of the soil was high .
LehtONiita, Timo, Jussi Holkko, Martti Viljanen, and Eero Slunga, 1986
93

Radonin merkitys talonrakennustekmikassa. Maaperan ja rakenteiden radontuotto ja-lapaisevyys [Radon in
building technology. Radon exhalation and radon permeability of soil and structures]:
Espoo, Finland, Helsinki Univ. Technology, Dept. Civil Engineering, Div. Structural Engineering Rept. 82, 130 p.
The effects of soil and building structural characteristics on radon entry through basements are given in this
treatment of the theoretical bases of radon transfer, laboratory and field experiments, and calculation
examples. The main transfer mechanism in clays is duffusion and in coarse sands and gravels is convection.
The exhalation of soil and other radon-technical parameters can be defined by the experimental methods
developed in this research. Convection is the main radon transfer mechanism into structures. In some cases
diffusion must be taken into account. Some building materials can yield radon to indoor air. Theoretical
calculations are required when experimental results are analyzed and in radon-technical design.
Lehtoviita, Timo, and Martti Viljanen, 1986
Radonin merkitys talonrakennustekmikassa. Radonin siirtymisen laskenta maanvastaisen rakenteiden lapi [Radon
in building technology. The computation of radon transfer through ground based structures]:
Espoo, Finland, Helsinki Univ. Technology, Dept. Civil En^eering, Div. Structural Engineering Rept. 81, 138 p.
This report presents the basic theory of radon transfer from the soil to indoor air. Some calculation methods
are presented. Mainly convection and partly diffusion are the transfer mechanisms of radon entry in basement
structures, caused by pressure and concentration gradients. The radon transfer can be solved by both analytical
and numerical methods. The analytical methods require simple boundary conditions and the material where
the transfer occurs must be homogeneous. With numerical methods nonlinear problems can also be solved.
A 2-dimensional finite element computer program was developed from a transient heat transfer program for
the solution of analogous problems in radon transfer by convection and diffusion. Various examples of radon
entry into structures have been computed by both numerical and analytical methods.
Liinamaa, Paula, and Martti Viljanen, 1984
Radonin merkitys talonrakennustekmikassa. Kiijallisuusselvitys [Radon in building technology. Literature
survey]:
Espoo, Finland, Helsinki Univ. Technology, Dept. Civil Engineering, Div. Structural Engineering Rept. 66, 65 p.
This is a review of factors that cause high indoor radon concentrations. The major source of radon is the soil
under buildings. Finnish building materials do not contain high radioactive concentrations. The use of radon-
rich water may in some individual cases be the major source of indoor radon. Alpha-film measurements of
Finnish indoor air have shown that there are great regional and seasonal variations of radon content. Thehighest concentrations have been measured in houses built on ridges and rough bedrock. The radon problem
can be solved by construction and ventilation techniques developed in the U.SA., Canada, and Sweden, where
air-tightening the floor and ventilation of the foundation are thought to be the most efficient solution to the
problem. In Finland this type of remedial action is done in only very few cases.
Lilley, William D., Charles Kunz, and B. Kothari, 1988
Geologic factors in predicting indoor radon in New York [abs.], in Radon in the Northeast: Perspectives and
Geologic Research (conference), Troy and Albany, New York, May 31-June 2, 1988:
Northeastern Environmental Science, 7(1): 7
Lindmark, Alf, and Bengt Ros6n, 1984
Radon i jord. Exhalation-vattenkvot, lu’stidsvariationer, permeabilitet. [Radon in the ground. Exhalation —water ratio, seasonal variations, permeability.]:
Lonkoping, Sweden, Statens geotekniska institut [Swedish Geotechnical Institute] Rept. No. 24, 85 p.
[English summary] Radon in soil gas beneath buildings can enter houses through cracks or holes in the
foundations. Alpha radiation given off during the formation and decomposition of radon implies a risk of lung
cancer. The main purpose of this project has been to gain greater knowledge of the behavior of radon in
natural ground. Three different aspects have been studied: radon exhalation, soil permeability with respect
to gas flow, and seasonal variations in radon-222 concentrations. Experience gained from the project has also
94

given us better insight into the advantages and disadvantages of the methods of measurement used today.
Exhalation [The preferred term, because no advective flow is implied, would be "emanation".] Exhalation can,
in a simplified way, be explained as the soil’s own radon production capacity. Exhalation tests have been
carried out using soil samples enclosed in glass jars for about 100 hours. The exhalation (E) has been
calculated using the measured concentrations of radon Rn(t) in the glass jars as a function of time. Each soil
sample was investigated at a number of different water contents. The temperature was kept constant during
the tests. Radon dissolved in the water and variations in the volume of air in the glass jar due to variations
in water content were teiken into consideration in the calculations. The radon exhalation is dependent on the
water ratio of the soil samples, as shown in Figure 1. [Figure 1 is a plot of exhalation (Bq kg’^ h‘^) vs. "water
ratio" (ratio of water to dry mass, %). The radon concentration was measured by drawing air from the glass
jar into the measuring instrument. From a minimum exhalation at dryness, maximum exhalation was reached
at some water ratio between «5% and « 13%; at greater water ratios the exhalation decreased. From figures
3 & 4 and table 3, for various soils the ratios of maximum/dry and maximum/wet, respectively, were: clay #1,
3.7, 8.6; clay #3, 10.8, 3.4; sand #2, 2.6, 2.3; sand #4, 3.9, 3.1; gravel #5, 3.8, 3.3; gravel #6, 4.1, 3.4; and
gravelly moraine (till), 31.2, 1.7.] The exhalation was calculated by means of the formula,
E=Rn(t) [1 -exp(X^-0]'' [V^ +(^3)1 >^vhere Et is exhalation (Bq kg h ), ^ the
"effective decay" (constant = 0.0392 h*^)[includes loss by air exchange], M is the mass of the soil sample, and
Vl and Vy are the volumes of water and air in the glass jars (m^). The largest change in exhalation was
obtained for a highly radioactive soil. The exhalation of the soil with a water ratio of 10% was 30 times that
of the soil with a water ratio of 0%. At water ratios above approximately 10%, the exhalation decreased by
one-third of the maximum value. The effects of meteorological events are dependent on the current water
content of the soil because of the dependence of the exhalation on the water ratio. Rain, for example, which
will raise the water ratio, may increase or reduce the exhalation. The result will depend on the water ratio
of the ground before the rain. Meteorological events not only have an impact on the exhalation of radon, but
also influence the rate of its removal. Seasonal variations To study the influence of meteorological events,
the time dependency of radon concentrations was measured at six test sites during a period of 19 months. The
radon content of the soil was measured [by passive detectors; note that measurement errors cmi result (Tanner,
1991, "Errors...")] at depths of 03, 0.5, and 0.9 m below the surface at 14-day intervals. The [apparent]
concentrations (Bq/m^) measured at a depth of 03 m [for a period of 19 months] are shown in Figure 2.
[Figure 2 is a bar graph showing the ranges and median values for soils on granitic bedrock and on radioactive
alum shale bedrock. On granitic bedrock, they were: clays, 0 to »62, two medians, at and »45; sands, »3to « 16, median at «6; gravels, «5 to 30, median at « 10. On the radioactive alum shale, they were: clays, »4to «165, median at «35; sands, « 4 to 30, median at »11; gravels, «16 to «100, median at «25. In situ, the
clays ranged from 19 to 31% water ratio and from 44 to 47% porosity; the sands from 7 to 14% water ratio
and 40 to 41% porosity, and the gravels from 12 to 15% water ratio and 37 to 59% porosity.] Pronounced
changes in radon concentration can be linked to meteorological events. Snow and frozen ground effectively
prevent radon flow by a "capping effect," which results in increased radon concentrations. Changes in water
content have an impact on the radon concentration of both impermeable and permeable soils. Whenpermeable soils, such as sand, dry up, exhalation decreases while the ventilation increases. The combined
effect of these changes reduces radon concentrations noticeably during the summer. But the clays investigated
exhibited very large increases in radon concentration when the water ratio decreased by only a few percent.
Radon measurements in very dry or very wet soils give a misleading picture of the radon risks. We propose
that radon measurements be discontinued when the soil is extremely wet or dry. Permeability The investi-
gation of radon permeability of soils comprised analysis of different types of soil using special equipment. Themeasurements were carried out by the principle of drawing air from the soil, through an inverted box pressed
[into an excavation] 03 m into the soil. Flow, pressure, and radon concentrations were measured while air was
being drawn from the soil. The radon concentrations were also measured using conventional long-term and
direct methods. The results of the permeability tests showed that: (1) Many types of soil liberate large
amounts of soil gas even at low pressures; 2-5 Pa below atmospheric pressure. (2) If impermeable types of
soil with a high radium content dry up and crack, they can assume the "nature of a gravel" in both radon
content and permeability. (3) Two types of soil with a radon content of the same magnitude can give a
95

difference in radon-daughter content indoors of more than 600%, because of differences in permeability. (4)
The exhalation of radon in the cases analyzed has been large, so that the volume of the soil producing radon
does not have to be large. (5) Radon concentrations and permeability give an idea of the radon risk of a soil.
Assessments based on the radon content alone can be completely misleading. The permeability can be
estimated with reasonable accuracy on the basis of the soil type only. HA considerably better method of
exhalation measurement probably can be developed. The advantages of working with the radon exhalation
[radon availabihty] of the soil instead of radon concentrations are that: (1) The influence of many
meteorological factors that are difficult to assess is eliminated. (2) The exhalation values permit calculation
of radon contents in the soil, under buildings, and indoors. [A sample calculation assumes radon production
from a soil layer 1.5-m thick imder a 100-m^ house foundation, the soil having a dry density of 1800 kg/m^,
totaling 270,000 kg. Four soil types were considered, each at two water ratios (%), with corresponding
exhalation fluxes (kBq kg"^ h”^): clay, 10%, 1.534, 35%, 0.179; sand, 10%, 0.153, 20%, 0.068; gravel, 10%,
0.725, 20%, 0.408; gravelly dll, 10%, 8.711, 20%, 7.226. The radon concentration in the subslab re^on was then
calculated for each of these exhalation fluxes as a function of the percentage of the ventilation air drawn from
the soil. For 10% sod-gas intake, the respective concentrations (kBq/m^) were: 35, 1, 3, 1, 15, 2, 187, and 83;
for 1%, 238, 9, 26, 16, 120, 21, 1474, and 755; for 0.1%, 539, 57, 83, 88, 439, 163, 4740, and 4157. The
corresponding indoor radon progeny concentrations also were calculated.]
Lindmark, A[lf], and B[engt] Rosen, 1985
Radon in soil gas-exhalation tests and in situ measurements:
The Science of the Total Environment, 45: 397-404
[Radon entry into dwellings is principally influenced by the concentration of radon in the pore gas in the soil,
the air permeability of the soil, leakage points in the foundation, and indoor ventilation. The foundations of
new dwellings should provide radon resistance in proportion to the risk associated with the soil at the site,
which can be estimated by measurements of the radon concentration and mr permeability of the soil. On the
basis of the radon concentration (in kBq/m^) at 0.5-m depth, high-risk areas are those >25 in gravel or sand,
>35 in silt, or >50 in clay, low-risk areas are those <6 in gravel or sand, <10 in silt, or <15 in clay. Radonconcentrations in soil gas were measured during a 19-month period in soils overlying granite bedrock (2-10
ppm U) and overlying alum shale bedrock (20-265 ppm U). Radon concentrations (in kBq/m^) at 0.5-m depth
in soils over the granite ranged up to about 60 for clay, about 3 to 17 for sand, and about 5 to 32 for gravel.
Soils over the alum shale ranged from about 4 to 166 for clay, about 5 to 31 for sand, and about 16 to 100 for
gravel. Because the water content of the soil strongly influences the permeability and the radon exhalation of
the soil, it is important to make measurements when the water content is typical.]
Lively, Richard, and Daniel Steck, 1991
A site study of soil characteristics and soil gas radon, in The 1991 International Symposium on Radon and RadonReduction Technology, Philadelphia, Pa., April 2-5, 1991, Proc., Volume 2, Symposium Oral Papers, Technical
Sessions 6 through 10:
U.S. Environmental Protection Agency Rept. EPA/600/9-91/037B, p. 9-43
—
9~57
McLean, Va., Cohen (S.) and Associates, Inc. [Springfield, Va., NTIS Order No. PB92-115369]
[Preprints, v. 5, no. IX-^In regional surveys, indoor radon is usually the parameter of interest, but occasionally soil gas radon at depths
of 1 m or less is also measured. At statewide scales, even limited data sets can be used to infer relationships
between geology and soil gas or indoor radon. However, predicting the radon potential of a single house or
even an area the size of a neighborhood is more difficult. As the size of a surveyed area decreases, site-specific
variables become more significant. HWe recently completed a study of two residential neighborhoods within
7 km of each other near Rochester, Minnesota. Eight holes were augured into glacial sediments to maximumdepths of 4.5 m and the samples collected for grain-size analysis, measurement of radon parent/daughter
nuclides and radon emanation. A total of 65 homes in the areas were provided with two alpha-track
registration detectors for 1 year of indoor monitoring. Positive correlations were observed between the average
soil radon, the average indoor radon, and the precursor/daughter radionuclides. The study area with the most
96

topographic relief also had the highest radionuclide contents, the most variability with depth, and some
variation with time and soil moisture; these results were not observed at the low-relief site. The type of study
described would best be applied to site-specific pre-construction screening, rather than to predicting radon in
existing structures.
LI® Resources, Inc., 1977
NURE Aerial Gamma Ray and Magnetic Reconnaissance Survey, Thorpe Area, Newark NK 18-11 Quadrangle:
Himtingdon Valley, PA 19006, LI® Resources, Inc., 55 Buck Road, U.S. Dept. Energy Rept. GJBX-16(78)
[This survey includes an area having the largest density of houses exceeding 7.4 kBq/m^ (200 pCi/L) of indoor
radon known as of 1988.]
LKB Resources, Inc., 1980
Aerial Gamma and Magnetic Detail Survey of the Reading Prong Area:
Huntingdon Valley, PA 19006, LKB Resources, Inc., U.S. Dept. Energy Rept. GJBX-90(80), 6 vols.
[This survey includes a substantial area containing houses found to have indoor radon exceeding 7.4 kBq/m^
(200 pCi/L).]
Llewellyn, Ralph A., 1991
Radon in large buildings: Pre-construction soil radon surveys, in The 1991 International Symposium on Radon
and Radon Reduction Technology, Philadelphia, Pa., April 2-5, 1991, Proc., Volume 4, Symposium Poster
Papers, Technical Sessions 6 through 10:
U.S. Environmental Protection Agency Rept. EPA/600/9-91/037D, p. PlO-15—PlO-25
McLean, Va., Cohen (S.) and Associates, Inc. [Springfield, Va., NTIS Order No. PB92-115385]
[Preprints, v. 5, no. XP-2]
Attempts to correlate individual soil radon and/or radium concentrations with the subsequent concentrations of
radon measured in structures constructed on the sites of the tests have had only occasional, or perhaps only
coincidental success. High concentrations in the soil may or may not result in elevated levels in buildings, and
vice versa. Over the past two years the University of Central Florida Radon Project has been conducting an
intensive radon screening of all buildings (>40) on the campus, a relatively compact concentration occupying
about 300 acres [12 km^] of a 1200-acre site. Analysis of these data suggest that perhaps the earlier difficulties
in obtaining correlations between soil radon/radium measurements and radon concentrations in structures has
been simply a failure to measure at a sufficient number of locations for a long enough duration. A contoiu*
"map" of average radon concentrations in the campus buildings was used as a guide for measuring soil radon
for periods of several months in the areas where the construction of three large new buildings was planned.
The results were used to predict the levels that were to be expected on completion and to suggest appropriate
radon-resistant construction measures. Two of the structures incorporating such suggestions are now imder
construction.
Lloyd, Larry L., 1983
Evaluation of Radon Sources and Phosphate Slag in Butte, Montana:
U.S. Environmental Protection Agency Rept. EPA 520/6-83-026, 75 p.
In 1978 the Montana Department of Health and Environmental Services (DHES) began investigating the
potential sources of radon which contribute to elevated ambient and indoor concentrations of radon and its
decay products in Butte, Montana. During the early stages of the investigation, effort were directed toward
the evaluation of phosphate slag that has been used extensively for paving and graveling and building materials
in the Butte area. The phosphate slag proved not to be a significant source of radon....1fThe northern part of
Butte is located on a hill interlaced with geological fractures and richly mineralized veins....The most prevalent
rock type in the area, commonly known as "Butte granite," is quatrz monzonite. Aplite and alaskite [very light
colored igneous rock composed mainly of potassium feldspar and silica] dikes are prevalent in the quartz
monzonite. Rhyolite, which is of volcanic origin [and chemically similar to granite] is found in the most
northwestern part of the dty. Alluvium is the prevalent geology in the southern parts of the dty. The alluvium
97

is predominantly sand and gravel that resulted from erosion of the surrounding hills, so that in gross
composition it is nearly the same as the quartz monzonite, rhyolite, and aplite.—HRadon exhalation [emanation]
tests were performed on samples of quartz monzonite, aplite, alluvium, and mineralized vein samples from 25-
cm depths. The highest radon exhalation rates were from mineralized vein material, which averaged
132 Bq/m^-s (2139 pCi/m^-min). Aplite samples showed e^alation rates (0.44 Bq/m^-s) that were about
three times the exhalation rates from quartz monzonite (0.15 Bq/m^-s average), and alluvium (0.14 Bq/m^-s
average).... TThe Butte areaa is subject to severe atmospheric thermal inversions that often trap...radon in the
Butte Basin during certain periods of the day in a diurnal pattern ...with the highest concentrations occurring
at approximately 6 a.m. and the lowest at 6 p.m. [Continuous radon monitoring at 1.8 m at one location
showed about 3-fold increases from a baseline of «56 bq/m^ in the maximum month of September 1980.
Baselines were more erratic and as low as «9 Bq/m^ during months when the ground had high soil moisture
or was frozen.] The pattem...occurs throughout the year, but is frequently interrupted by winds and
storms...[About 400 measurements of radon in soil gas were made by emplacing a 10-cm diameter by 66-cm
long PVC open tube with the bottom at 76-cm depth, lowering an inverted a-track cup with thoron filter to
the bottom of the tube, covering the tube, and filling the remaining 10-cm deep hole with soil. The apparent
radon concentrations in the alluvium were 69% higher in the winter months than in the summer months.
Some of the highest soil-gas radon results were near mineralized veins, but the sparseness of sampling sites,
the smnmer-winter contrasts in levels, and the site-to-site variations away from veins, particularly at the YeUowJacket vein, detract from a robust correlation. The concentration of radon dissolved in four ground waters
sampled ranged from 18 to 151 kBq/m^; in underground sewers it ranged from «0 to «15 kBq/m^.]
Lombardi, S., and G. Etiope, 1993
222-Rn soil-gas in sedimentary basin in Central Italy: its imphcations in the radioprotection zoning [abs.], in First
International Workshop on Indoor Radon Remedial Action, The Scientific Basis and Practical Applications,
Rimini, Italy, 27 June-2 July 1993:
Commission of the European Communities et al.^ Book of Abstracts, p. 70
Many studies of radon in soil gas confirmed that the presence of endogenous fluid reservoirs, uranium deposits,
and tectonic discontinuities are the primary parameters for determining the radon potential of the soil and that
indoor radon strictly depends on sod-gas radon levels. Nevertheless most world radon data refer to
geothermal-volcanic or uraniferous environments, where the high level of near-surface radon activity, due to
the abundance of manium minerals in the rocks, is well known. Both studies of radon in petroleum research
and recent CEC work on radioactive waste disposal suggest that high radon emissions occur not only in "hot
areas" but also in relatively cool and non-uraniferous sedimentary basins. High values of radon were found
in central Italy, in two sedimentary basins, without (likely) hydrocarbon reservoirs or uranium deposits in the
imderground i.c., in the Siena Basin, over very thick argillaceous [clayey] sediments (the mean Rn value is
14171 Bq/m^) and in the San Vittorino Valley, with Apennimc limestones overlain by sandy-clayey deposits
(the mean Rn value is 38147 Bq/m^). Rn values in such areas have the same ranges as are foimd in the
Phlegraean Fields and Western Vokini Volcanoes where Rn levels have mean values, respectively, of 8473
Bq/m^ and 171283 Bq/m^. Both Siena Basin and San Vittorino radon anomalies are distributed along linear
zones, according to local tectonic discontinuities (fault and fracture systems). A shallow-origin component for
the near-surface Rn, as uranium or radium concentration induced by groundwater flow, cannot be excluded.
Nevertheless, the rectilinear geometry of anomalies and their coincidence with both deep-origin helium
anomalies and the local fracture s)^tems suggest that, in spite of the thickness and low permeability of the
clayey rocks, gas rises toward the surface through fracture networks as preferential routes for a rapid and
subvertical advective geogas migration. Briefly stated, the leading conclusion is that natural radioactivity at the
earth surface is not exclusive to volcanic or geothermal areas, and this should give rise to new implications in
environmental safety and radioprotection. All these results suggest the utilization of Rn soil-gas prospecting
as a tool for mapping radon potential in the ground, not only in volcanic areas but anywhere. Therefore a
prelimmary investigation of near-surface Rn content and distribution, based on soil-gas surveys, can greatly
contribt to radioprotection zoning. In this case, indoor Rn measurements can be performed only in the
98

areas where high Rn levels in soil gas occur. Besides providing a rapid (and economic) Rn zoning, such an
approach can also contribute to better knowledge of links between indoor and soil-gas radioactivity.
Lombardi, S., and G.M. Reimer, 1990
Radon and helium in soil gases in the Phlegraean Fields, central Italy:
Geophys. Research Letters, 17(6): 849-852
[Radon and helium in soil gases were measured in the volcanic Phlegarean Fields, which are seismically active
and have fracture systems and other tectonic features. Although radon 2md helium concentrations in soil gas
were not in proportion at each sampling point, they had similar areal distributions, suggesting that the
distribution is controlled mainly by the fracture system and movement of geothermal fluids.]
M^el^en, I., A. Voutilainen, and O. Castren, 1992
Prediction of indoor radon concentration based on residence location and construction, in Cross, Fredrick T.,
ed.. Indoor Radon and Lung Cancer: Reality or Myth? Twenty-ninth Hanford Symposium on Health and the
Environment, Richland, Wash., October 15-19, 1990, Proceedings:
Columbus, Ohio, BatteUe Press, Part 1, p. 55-63 [NTIS]
We have constructed a model for assessing indoor radon concentrations in houses where measurements cannot
be performed. It has been used in em epidemiological study and to determine the radon potential of new
building sites. The model is based on data from about 10,000 buildings. Integrated radon measurements were
made during the cold season in all the houses; their geographic coordinates were also known. The 2-month
measurement results were corrected to annual average concentrations. Construction data were collected from
questionnaires completed by residents; geological data were determined from geological maps. Data were
classified according to geographical, geolo^cal, and construction factors. In order to describe different radon
production levels, the country was divided into four zones. We assumed that the factors were multiplicative,
and a linear concentration prediction model was used. The most significant factor in determining radon
concentration was the geographical region, followed by soil type, year of construction, and type of foundation.
The predicted indoor radon concentrations given by the model varied from 50 to 440 Bq/m^. The lower figure
represents a house with a basement, built in the 1950s on clay soil, in the region with the lowest radon
concentration levels. The higher value represents a house with a concrete slab in contact with the ground, built
in the 1980s, on gravel, in the region with the highest average radon concentration. [The desired factors were
considered to be the concentration of ^^^Rn in soil gas, a leakage function of resistance of the soil and a house
to soil-gas flow, the inverse of house volume, the reciprocal of the air exchange rate, and uimamed others.
For practicality, surrogate factors were used, based on data from 13,975 houses: three geographic zones
classified by uranium concentration of till samples, and the special zone of Tampere, because of its eskers; soil
type (sand and gravel in eskers, sand and gravel in other deposits, till, rock, and clay); and foundation factors
(type, construction year, ventilation type, heating system, number of stories, house type, and, in houses with
basements, type of staircase).]
Malizzi, L.D., and A.E. Gates, 1989
Soil gas radon distribution in glacial moraines: an example from the New Jersey Highlands [abs.]:
Geol. Soc. America, Northeastern Section, Abstracts with Programs, 21(2): 30
Unlike regional radon studies from other areas, bedrock geology and gamma radiation show no correlation with
radon from soils overlying the Green Pond outlier and the Reservoir fault zone of the NJ. Highlands. Gammaradiation in the Paleozoic sedimentary rocks of the outlier is lower than in the Precambrian gneisses.
Sedimentary bedrock shows average gamma radiation of 220.4 counts/s (cps) with a range of 136.0 to 322.8
cps. Gamma radiation from the Precambrian gneisses averages 284.2 cps and range from 240.4 to 575.8 cps.
Rare pegmatites from within the Reservoir fault zone yield anomalously high average gamma radiation of
2017.5 cps with a range of 1948.6 to 3493.6 cps. Radon concentrations in soil cover yielded similar averages
with wide ranges regardless of bedrock geology. Radon from soil over the sedimentary bedrock of the outlier
averaged 19.2 kBq/m^ (517.9 pCi/L) with a range of 8.77 to 99.7 kBq/m^ (236.9 to 2695.3 pCi/L). Radonfrom soil over the gneisses averaged 19.5 kBq/mr (527.0 pCi/L) with a range of 8.89 to 69.3 kBq/m^ (240.4
99

to 18723 pCi/L). The Green Pond outlier and the Reservoir fault zone are covered by the terminal moraine
deposits of northwestern NJ. All soil-gas radon samples were taken in glacial till which is poorly sorted, very
porous, and in a sandy matrix. The moraine sediments contain erratics composed of all lithologies in the area
as well as exotic rock types. Uranium concentrations in the erratics and matrix is highly variable. Radon is
a daughter product of uranium and levels in soils are locally governed by the uranium concentrations of each
erratic and the matrix. Because glacial tiU covers the area and is relatively homogeneous, average radon values
are similar over all lithologies. Another reason for a lack of a correlation is that the soil is porous, causing
radon diffusion and atmospheric dilution. This study shows that regional radiation surveys, such as MURE maynot be useful in locating potentiaUy high radon areas in moraine-covered terrains.
Markkanen, M., and H. Arvela, 1991
Radon emanation from Finnish soils [abs.], in International Symposium on the Natural Radiation Environment,
5th, Salzburg, Austria, 22-28 September 1991, Abstracts:
Salzburg, Univ. Salzburg, Inst, for General Biology, Biochemistry and Biophysics, abs. no. 77
The results of gamma-spectrometric sample measurement of ^^Rn emanation coefficient and radium
concentration U^^a) from over 700 Finnish soil samples are presented. Also radon emanation rate was
measured from over 200 soil samples by using radon-tight cans and Lucas cells. The effect of water content
and temperature on radon emanation were investigated with various samples of different soil types. Radonemanation and the effect of water content on radon emanation were investigated with different grain sizes
separately (samples of till). The results give information on radon emanation in different soil types and they
relate emanation under laboratory conditions to conditions in nature. In routine measurements of radon
emanation from soil samples the use of 5% water content [dry weight basis] was regarded advisable. The
correction coefficients of radon emanation varied between 03 and 13, depending on water content and soil
type. With 5% water content there was hardly any difference between radon emanation at 20®C and at 1*C
temperatures. Radon emanation was found to be a decreasing function of grain size for grain sizes ^eater
than 03 mm diameter. A simple mathematical model for radon emanation from soil grains was developed,
the results being consistent with the measurements.
Marvin, Richard K., 1989
Effects of water table fluctuation and meteorolo^cal parameters on radon-222 concentration and mobility in soil
[M.S. thesis]:
University Park, Pa., Pennsylvania State Univ., Dept. Geosciences, 252 p.
This study was initiated to determine the influence of water level changes on radon in soil gas during and
following the pumping of an unconfined aquifer. In addition, the effects of wind, barometric pressure change,
precipitation, temperature, and seasonal water level change on radon concentration were investigated. FromAugust 1987 to May 1988, soil gas radon concentrations were monitored in 4 gas sampling holes constructed
in alluvial and terrace soils along Spring Creek near Houserville, Pennsylvania. Radon concentrations in the
soil gas, which was extracted fi’om depths of 035 to 5.97 m, were measured using an EDA Instruments RD-200portable radon meter. The maximum average radon concentrations of the soil gas within the holes ranged
from 323 to 68.4 kBq/m^ (872 to 1,848 pCi/L). Soil gas radon concentrations calculated from radium contents
(range, 14-159 Bq/kg (039-4.29 pCi/g) and emanation coefficients (range, 0.01-0.68) of the soils collected fram
the holes averaged 843 kBq/m^ (2,284 pCi/L). The calculated radon concentrations correlate positively with
the percentage of clay in the soils (r=0.79) and negatively with the percentage of sand in the soils (r=-0.68).
These correlations are explainable by the much higher emanation coefficient of the clay-sized particles than
the sand-sized particles due to their difference in diameter. The calculated radon concentrations of the soils
tend to be greater than the radon values measured for the gas in the holes. The low measured values are
concluded to result from 1) loss of radon by diffusion and 2) dilution of radon caused by leakage of less
concentrated gas from shallower depths into deeper soil horizons during gas sampling. Radon concentrations
in the holes were also found to be influenced by meteorological conditions. The radon values have a weak to
moderate negative correlation with barometric pressure changes (average r=-0337) and 24-hour wind
movement (average r= -0.447). These meteorological factors probably produced pressure gradients between
100

the atmosphere and the soil gas in the sampling holes, causing flow of radon-laden soil gas out of the holes
and the flow of atmospheric air into them. Soil-gas radon concentration and daily liquid precipitation amount
were found to have no si^ificant correlation. Radon concentration has a moderate positive correlation with
mean daily temperature (average r= 0.418), but the reason for the relationship is not evident. The soil gas
radon concentrations in three of the sampling holes were unaffected by small water table fluctuations (<1 m)
caused by the pumping of two nearby wells. At the fourth sampling hole, radon concentrations increased from
approximately 7.4 to 50 kBq/m^ (200 to 1,350 pCi/L) during one of the pumping tests as the water table
beneath the hole rose 3 m. The concentration increase is attributed to the lateral flow of radon-laden soil gas
that became trapped between ponded discharge water at the soil surface and the rising water table. The soil
gas radon concentration in the hole decreased from approximately 33 to 1.1 kBq/m^ (900 to 30 pCi/L) at the
conclusion of the pumping test due to air that flowed into the soil as water drained from the soil pores and
fractures at depth. The rate of water table change at the site during spring, 1955 averaged less than 0.1 m/day.
Based on calc^ations, this rate was too slow to significantly influence the radon concentration in the soil.
Marvin, Richard K., Richeird R. Parizek, and Arthur W. Rose, 1988
Effects of water table fluctuations on radon-222 concentration and mobility in overlying soil [abs.]:
Geol. Soc. America, Abstracts with Programs, 20(7): A354
In order to determine the effect of water table fluctuations on the concentration and potential transport of radon
in overlying soil, four soU-gas monitoring stations were installed along a floodplain near State College,
Pennsylvania. Each station consists of a nest of sampling tubes arranged in a backfilled borehole. Gas samples
can be extracted at 1-m intervals at depths ^ m. During October 1987, an 11,000-m^ area near one of the
gas sampling stations was flooded by water during a 72-hour pumping test. The well was tested at a rate of
4.000 L/min and all the water was recycled to the water table during the test. This resulted in a 3-m water-
table rise over 3 days. The rapid rise in the water table elevation produced an increase in radon concentration
from 17 to 56 kBq/m^ (450 to 1500 pCi/L) at depths from 1 to 4 m. The subsequent decline of the water
table resulted in a decrease in radon concentrations from 56 to 1.9 kBq/m^ (1500 to 50 pCi/L). Theconcentration increase is due to radon-enriched soil gas from micro and macro pores migrating away [upwards]
from the advancing wetting front. The corresponding [subsequent] decrease is produced by the flux of fresh
air into the soil as the pores dewater. Both the increase and decrease in radon concentrations are significant
at the 99% confidence level when compared with concentration changes over the data collection period from
September 1987 to May 1988. Gradual seasonal water-table fluctuations (<0.1 m/day) do not appear to affect
the radon soU-gas concentration profiles.
Matz, Barbara, 1993
CompUation of radon levels found in Albuquerque, New Mexico, in 1992 and 1993 [abs.], in The 1993
International Radon Conference, Denver, Colo., Sept. 20-22, 1993:
Denver, Colo., Am. Assoc. Radon Scientists and Technologists, Rocky Mountain Chapter, Preprints, p. FVP 1
Results are compUed from more than 100 short-term residential radon tests conducted in Albuquerque, NewMexico, and the surrounding area in 1992 and 1993. Contouring of mapped data points indicates a correlation
of radon levels with litholo^ and geologic structures. The highest radon levels, 241 and 263 Bq/m^ (6.5 and
7.1 pCi/L), were found in the extreme northeastern area of the dty, which borders the highest point of the
Sandia Mountains. The steep moimtain slopes in this area provide a continuous supply of fresh granite and
gneiss boulders and aUuvium. A second zone of relatively high radon levels, 96 to 163 Bq/m^ (2.6 to 4.4
pCi/L), located several mUes west of the mountain front, may be related to an underlying basin-bounding fault.
Results of tests west of the Rio Grande [River], where thick sand deposits overlie young volcanic rocks, had
an average value of 33 Bq/m^ (0.9 pCi/L), and only one result over 74 Bq/m^ (2 pCi/L).
McFarland, David, 1991
A comparison of radon results to geologic formations for the State of Kentucky [abs.], in The 1991 International
Symposium on Radon and Radon Reduction Technology, Philadelphia, Pa., 2-5 April 1991:
Preprints, v. 5, no. IX-2
101

A large bank of radon results for the State of Kentucky are compared to the local geologic formation. These
results are discussed in detail. Elevated radon levels from native building materials are also discussed.
McLaughlin, J[ames] P., 1987
An assessment of indoor radon exposure in Ireland, in Indoor Radon n, Proceedings of the Second APCAInternational Specialty Conference, Cherry Hill, New Jersey, April 6-10, 1987:
Pittsbmgh, Pa., Air Pollution Control Association Pub. SP-60, p. 68-77
[A survey of 700 dwellings in the Republic of Ireland yielded a median value of 37 Bq/m^ in an approximately
log-normal distribution. Significantly higher mean and maximum concentrations were found in western Ireland
(the Counties of Cork and Clare were noted), and were attributed to radon in soil gas primarily. In contrast
with results in many other countries, no houses with indoor radon >400 Bq/m^ were found in granitic areas.
(A later discussion with the author indicated some association of high indoor radon with karst terrain.)]
McLaughlin, J.P., 1987
Population doses in Ireland, Chap. 10, in Hopke, Philip K., ed.. Radon and Its Decay Products; Occurrence,
Properties, and Health Effects:
Washington, Am. Chem. Soc. Symposium Ser. 331, p. 113-123
[From early results of the indoor radon survey of Ireland, the radon exhalation characteristics of the soil or
geological structure subjacent to houses were found to be more significant than house construction
characteristics.]
McLemore, Virginia T., and John W. Hawley, 1988
Preliminary geologic evaluation of radon availability in New Mejdco:
Socorro, New Mexico Bureau of Mines and Mineral Resources Open-file Rept. 345, 31 p.
The primary objective of this preliminary report is to identify and characterize areas in New Mexico where
geologic factors may significantly influence indoor radon values. Areas which may have potential for generating
elevated levels of indoor radon need to be identified so that a larger percentage of radon detectors can be
allocated to these localities during a statewide survey conducted by the New Menco Environmental
Improvement Division in cooperation with the U.S. Environmental Protection Agency. The first step in this
evaluation is to identify large areas where previous geologic studies indicate a probability of having elevated
levels of indoor radon. Assessment of any health risks due to exposure of radon are beyond the scope of this
study. Also, any potential exposure hazard may vary significantly from house to house. The only way to find
out the extent of exposure due to indoor radon in a specific house is to test that house for radon. In this study
rocks and soils in New Mexico were initially grouped into three radon-availability categories, which are relative
to each other and specific to New Mexico based on geologic interpretations. Subsequently, each county and
the major cities in the state were given a radon-availability rating based on the predominant availability
category established for geologic units in that area. The health risks, if any, associated with these geologically
ranked areas are not known until the survey of indoor radon levels is completed. Ten counties are assigned
a high availability rating for radon based on interpretation of available geologic and soil data; they are DonaAna, Hidalgo, Los Alamos, Luna, McKinley, Rio Arriba, Sandoval, Socorro, Ssmta Fe, and Taos. Seven of the
most populated cities (1984 estimates) are rated high: Santa Fe, Las Cruces, Roswell, Carlsbad, Gallup,
Deming, and Los Alamos-White Rock. Thirteen counties: BemaliUo, Catron, Cibola, Chavez, Colfax, Eddy,
Grant, Lea, Lincoln, Quay, San Juan, Sierra, and Union; are assigned a moderate availability rating. Six of
the most populated cities are rated moderate: Albuquerque, Rio Rancho, Clovis, Hobbs, Grants-Milan, and
Lovington. The remaining ten counties in New Mexico: Curry, De Baca, Guadalupe, Harding, Mora, Otero,
Roosevelt, San Miguel, Torrance, and Valencia, are assigned a low availability; although some homes in these
areas may still have elevated levels of indoor radon. Six of the most populated cities are rated low.
Farmington, Alamagordo, Las Vegas, Silver City, Portales, and Artesia. In addition it should be emphasized
that even in counties with moderate and high availability many houses may have low levels of indoor radon.
["Radon availability," as used in this report, includes radon generation, emanation, and mobility in the ground,
as introduced by Tanner (1986).]
102

McLemore, Virginia T., John W. Hawley, and Ralph A. Manchego, 1991
Geologic evaluation of radon availabihty in New Mexico: A progress report, in The 1991 International
Symposium on Radon and Radon Reduction Technology, Philadelphia, Pa., April 2-5, 1991, Proc., Volume 4,
Symposium Poster Papers, Technical Sessions 6 through 10:
U.S. Environmental Protection Agency Rept. EPA/600/9-91/037D, p. P9-3—P9-22
McLean, Va., Cohen (S.) and Associates, Inc. [Springfield, Va., NTIS Order No. PB92-115385]
[Preprints, v. 5, no. Dff-1]
The New Mexico Bureau of Mines and Mineral Resources and the Radiation Licensing and Registration Section
of the New Mexico Environmental Improvement Division in cooperation with the U.S. Environmental
Protection Agency have been evaluating geologic and soil conditions that may contribute to elevated levels of
indoor radon throughout New Mexico. During the first phase of this evaluation. New Mexico lands have been
subdivided into three provisional radon-availability categories (high, moderate, and low), data sources include
1) aerial radiometric surveys; 2) uranium-resource evaluations; 3) reports on lithologic character and structure
of major geologic units; 4) hydrologic and geochemical information; and 5) soil surveys (including data on
particle size, day minerals, moisture regimes, and permeability). This information was used in selection of
private homes tested during an initial random survey of indoor radon in 1989. The New Mexico radon survey
was unique in that it was the first in the nation to successfully use a decentralized strategy in the attempt to
place charcoal canisters randomly across a State. Results of 1775 homes tested throughout New Mexico during
January to March 1989 indicated that 24% had indoor-radon screening results exceeding the recommended
EPA guideline of 148 Bq/m^ (4 pCi/L) of air. Visits were also made to about 50 home sites in north-central
New Mexico where preliminary surveys (random and volunteer) indicated that geologic and soil conditions were
the major factors contributing to elevated indoor-radon levels (>370 Bq/m^ or > 10 pCi/L). ^Studies to date
suggest that elevated radon levels are commonly associated with hillside building sites where floors 2md walls
are contiguous to geologic units such as highly fractured bedrock of varying lithology, limestones with solution
enlarged joints, or thick pumice deposits. Bedrock units, associated alluvial-colluvial deposits, and ground
water that contain high concentrations of uranium and thorium locally make a significant contribution and need
further study. Some homes built on clay-rich expansive soils also have elevated levels of radon. Areas that
have been tested in the vicinity of uranium mines and mills have relatively low levels of indoor radon
(<370 Bq/m^ or <10pCi/L). A better understanding of the natural factors that affect indoor radon
concentrations in New Me^dco will only be gained through integrated, site-specific investigations which combine
more comprehensive indoor-radon measurements and home construction information with data on geology,
hydrology, and soils.
Megumi, Kazuko, and Tetsuo Mamuro, 1972
A method for measuring radon and thoron exhalation from the ground:
Jour. Geophys. Research, 77(17): 3052-3056
[Radon and thoron exhalation from the ground were measured by adsorption on granular activated charcoal
distributed on the ground surface and analysis of the ^^"^Bi 609-keV and 2615-keV 7-ray photopeaks.]
Miles, J.C.H., 1993
Mapping the proportion of the housing stock exceeding a radon reference level [abs.], in First International
Workshop on Indoor Radon Remedial Action, The Scientific Basis and Practical Applications, Rimini, Italy,
27 June-2 July 1993:
Commission of the European Communities et al.^ Book of Abstracts, p. 74
In order to identify homes with high radon levels as efficiently as possible, it is necessary to have accurate
numerical information on radon-prone areas. Maps based on geological indicators are generally qualitative
and sometimes contain misleading information. Maps based on radon measurements in homes are definitive
if there are sufficient results in the area of interest, but if there are small numbers of measurements, none of
which exceeds the reference level, it is difficult to estimate the fraction of the whole housing stock which
exceeds it. Distributions of radon levels are usuaUy log-normal, however, so mathematical modelling of the
distribution allows the fraction of the housing stock exceeding any level to be calculated. A subset of the UK
103

database of 120,000 radon results is used here to answer three questions; does the log-normal distribution fit
the data well enough to allow reliable maps of radon-prone areas to be drawn? If so, how can the parameters
of the log-normal distribution best be estimated for small areas with few results available? What is the
minimum amount of data required for mapping radon-prone areas?
Milly, George H., and John T. MacWaters, 1981
Unique applications for environmental and area radon measurements. Chap. 87 in Gomez, Manuel, ed..
Radiation Hazards in Mining: Control, Measurement, and Medical Aspects, International Conference, Golden,
Colo., October 4-9, 1981:
New York, Am. Inst. Mining, Metallurgical, and Petroleum Engineers, Soc. Mining Engineers, p. 586-588
[This paper describes a two-step technique for locating radon sources, as in uranium exploration or in
environmental monitoring. A reconnaissance is first made by means of measuring atmospheric concentrations
of^Rn progeny under stable atmospheric conditions (temperature inversions) or neutral conditions, usually
at night, by means of a membrane filter during a 5-min sampling period. The filter is immediately counted
in two successive 5-min periods, fi'om which the interval since the ^Rn was exhaled from the ground may be
determined. The equipment is mounted in a vehicle, and by mapping the intervals at different locations, the
radon source may be located. The intervals ("ages of the radon clouds") are more important than the
magnitudes of the radon-progeny concentrations. When the source area has been localized to « 1 km^, the
flux density of exhaled ^Rn is measiued at places within the area by collecting radon progeny on the surface
of thin frosted adhesive plastic tape covering an electrode at -3600 V for 15 min under a circular metal open-
bottom can 20 cm high and 30 cm in diameter, and counting the activity deposited on the tape in an a-particle
counter for 5 min.]
Milly, George H., and Scott D. Thayer, 1981
Statistical evaluation and discussion of the significance of naturally-occurring radon exposures. Chap. Ill in
Gomez, Manuel, ed.. Radiation Hazards in Mining: Control, Measurement, and Medical Aspects, International
Conference, Golden, Colo., October 4-9, 1981:
New York, Am. Inst. Mining, MetaUur^cal, and Petroleum Engineers, Soc. Mining Engineers, p. 746-750.
[Ambient atmospheric concentrations and flux densities of exhaled ^Rn in the literature are dted and data
obtained by the authors by means of their apparatus (preceding abstract) are reviewed. For the uranium areas
of the western United States they summarized their data for generally mineralized areas, for which
representative means were 22, 28, and 41 Bq/m^; maxima were 104, 110, and 96 Bq/m^; and minima were 1.9,
4.1, and 3.7 Bq/m^. For areas with near-surface mineralization they obtained means ranging from 19 to
150 Bq/m^. (The authors emphasize that the ambient atmospheric measurements underestimate those that
would be made over the highest-flux areas because their practice is to discontinue the atmospheric
measurements once the anomalous area has been confirmed.) Their flux-density measurements range from
means of 20 to 40 mBqjn"^.s‘^ (0.5 to 1.0 pCi.m"^.s‘^), compared with the world-wide continental estimate of
« 16 mBq.m"^.s'^ by Wilkening, Clements, and Stagey, (1975), to means of 0.1 to 0.2 Bq.m"^.s"^ (3 to 5
pCLm'^.s'^) in areas with general uranium mineralization and greater over strong anomalies. The ambient
outdoor atmospheric ^Rn levels in such areas likely exceed the U.S.EPA. action level for indoor radon.
Their results are contrary to the generalizations made by several authors that radon exhalation is fairly
uniform; they found significant temporal and spatial variation.]
Misquitta, Neale J., Richard W. Carlton, and Lindgren L. Chyi, 1989
Excessive radon level over abandoned underground coal mine [abs.]:
Geol. Soc. America, Abstracts with Programs, 21(6): A144Anomalous high radon levels were found in areas with low surface uranium concentrations. Our previous study
indicated that excessive radon levels occur over faults in the Serpent Mound area in southern Ohio [see
Heirendt et al.^ 1988]. It is, therefore, suspected that the excessive radon levels in Summit County, Ohio, might
be related to induced faults from abandoned underground coal mines. The induced fractures, which resulted
firom total withdrawal of the coal, might propagate to the surface and serve as conduits for the migration of
m

underground radon to the surface. The hypothesis was tested with 133 passive alpha-track detector assemblies
for soil-gas radon. They were buried for 21 days at a depth of 30 inches [1 m] in a series of five traverses over
an abandoned coal mine in southern Summit County from directly over the mined-out area to areas adjacent
to it. The results indicated that radon levels over the mined-out area are at least twice as high as those over
adjacent undisturbed areas. The average radon level over mined-out areas was 4.14 kBq/m^ (112 pCi/L), as
compared with 1.9 kBq/m^ (52 pCi/L) over the undisturbed areas. The latter is similar to the surface soil-gas
radon level of the vicinity. Thus, the 2.2 kBq/m^ (60-pCi/L) additional radon over the mined-out area must
have come from imderground sources, because radon is not expected to migrate a significant distance over its
short half life. The phenomenon that excessive radon levels are found over abandoned coal mines is being
explored for the mapping of undocumented abandoned coal mines. [Alternative or additional factors that may
have affected the results could be the greater air reservoir volume’s response to periodic barometric pressure
changes, which have been shown to increase the effective exhalation of radon from greater depths, and a
greater drying of the soils overlying the mine site as a result of movement of the mine and atmospheric air
through the soil, leading to greater efficiency of the detectors; see Tanner, 1991 ("Error....")]
Moed, BA., W.W. Nazaroff, A.V. Nero, M.B. Schwehr, and A. Van Heuvelen, 1984
Identifying Areas with Potential for High Indoor Radon Levels: Analysis of the National Airborne Radiometric
Reconnaissance data for California and the Pacific Northwest:
Berkeley, CA, Univ. California Lawrence Berkeley Lab. Rept. LBL-16955, 70 p. [Also published with additional
pages i and ii by Bonneville Power Administration, 1985]
Radon-222 is an important indoor air pollutant which, through the inhalation of its radioactive decay products,
accounts for nearly half of the effective dose equivalent to the public from natural ionizing radiation. Indoor
radon concentrations vary widely, largely because of local and regional differences in the rate of entry from
sources. The major sources of indoor radon aiG soil and rock near building foundations, earth-based building
materials, and domestic water; of these, soil and rock are thought to be predominant in many buildings with
higher-than-average concentrations. Thus, one key factor in determining radon somce potential is the
concentration of radium, the progenitor of radon, in surfidal rocks and soils. We have analyzed aerial radio-
metric data, collected for the National Uranium Resource Evaluation Program, for seven Western states with
a view towards 1) providing information on the spatial distribution of radium contents in surfidal geologic
materials for those states, and 2) investigating approaches for using the aerial data,which have been collected
throughout the contiguous United States and Alaska, to identify areas where high indoor radon levels may be
common. The results showed a range of mean radium concentrations averaged over geologic map units of 3.7-
133 Bq/kg (0.1-3.6 pCi/g), with an overall mean for the study area of 26 Bq/kg (0.7 pCi/g). Radiumconcentrations were found to be relatively low in central and western portions of Washington, Oregon, and
northern Cahfomia; they were found to be relatively high in central and southern California. A field validation
study, conducted along two flight-line segments near Spokane, Washington, showed close correspondence
between the aerial data, in situ measurements of both radium content and radon flux from soil, and laboratory
measurements of both radium content of and radon emanation rate fi'om soil samples.
Monette, Frederick A[lcide], 1990
Variations of ^Rn concentrations in soil gas at a site in the semiarid western U.S. [M.S. Thesis]:
Fort Collins, Colo., Colorado State Univ., Dept. Radiology and Radiation Biology, 63 p.
SoU-gas ^Rn concentration [by soil-gas extraction and measurement in a-sdntillation cells], soil moisture
content [by fiberglass blocks, time-domain reflectometry, and neutron-neutron moisture probe], and soil
temperature [by resistance temperature detectors] were monitored at depths of 30, 100, and 180 cm for a
period of 10 months at a radon research facility at Colorado State University, Fort Collins, Colorado. Thegreatest amount of variation in radon concentration was observed at 30 cm and the least at 180 cm. Stepwise
multiple regression suggests that soil moisture content accounted for 57% of the total radon variance at 30 cm,
79% of the variance at 100 cm, and 91% of the variance at 180 cm. The influence of soil temperature on soil-
gas radon concentration is small compared with moisture effects. Increased soil moistme content affects radon
concentration in two ways: First, increased moisture reduces the volume of the gas filled by pore space.
105

effectively increasing the soil-gas radon concentration. Second, increased moisture changes the transport
characteristics of the soil, reducing leakage from a given volume, a phenomenon referred to as "capping.”
Analysis suggests that capping may be more important near the soil surface than at greater depths [because
the barometric pumping causes greater radon depletion in the shallow soil layers]. The radon concentration
profile as a function of depth is shown to be consistent with a simple one-dimensional diffusion model under
certain conditions. In one case [for the drier period, November-March], this model was used to estimate the
interstitial diffusion coefficient of radon in the soil as 3x 10“^ m^/s. Under different conditions [for the wetter
period, May-August], the simple diffusion model yielded an estimate of 3x 10"^ m^/s, a value greater than the
radon diffusion coefficient in air. It is likely that violations of assumptions inherent in the simple diffiision
model were responsible for the unreasonable second estimate. [The soil at the sites of investigation had been
excavated, thoroughly mixed, characterized, and replaced in the excavations > 16 months before the study.]
Morley, D.R., M.M. Ghomshei, C. Van Netten, and B.G. Phillips, 1991
Radon studies in British Columbia, Canada, in The 1991 International Symposium on Radon and Radon
Reduction Technology, Philadelphia, Pa., April 2-5, 1991, Proc., Volume 2, Symposium Oral Papers, Technical
Sessions 6 through 10:
U.S. Environmental Protection Agency Rept. EPA/600/9-91/037B, p. 6-61—6-70
McLean, Va., Cohen (S.) and Associates, Inc. [Springfield, Va., NTIS Order No. PB92-115369]
[Preprints, v. 3, no. VI-5]
Three radon studies, involving 150 background gamma measurements and long-term alpha-track tests in a total
of 400 homes have been conducted in three geologically distinct areas of the province of British Columbia.
A positive correlation between the background gamma radiation and the measured radon level can be depicted
only at the regional scale, fin the Coastal Area, where the terrestrial gamma radiation is low, no homes were
found to exceed 148Bq/m^ (4 pCi/L) on the main floor. In the Kootenays, where the background gamma is
relatively high, considerably higher gamma and radon levels were encountered. The hipest radon levels were
found in the West Kootenay about 45% of the homes have radon levels >148 Bq/nr (>4 pCi/L) and 7%>740 Bq/m^ (>20 pCi/L) on the main floor; more than 60% have levels >148 Bq/m^ (>4 pCi/L) in the
basement. Radon and gamma levels were lower in East Kootenay....
Morse, RJl., 1976
Radon counters in uranium exploration, in Exploration for uranium ore deposits. Proceedings of a Symposiumon Exploration of Uranium Ore Deposits, \fienna, March 29-April 2, 1976:
Vienna, Intemat. Atomic Energy Agency Rept. STI/PUB/434; 229-239
Rapid analytical techniques are available for uranium, radium and radon, each of which is characterized by a
different geochemical behaviour and each of which is absolutely specific for uranium. An efficient geochemical
exploration programme wiU be based on a judicious combination of these elements. The battery-operated
digital alpha scintillometer combines portability with high sensitivity. Radon and radium can be determined
in the field. Thoron is recognized by a rapid ^op in count-rate owing to its 545-s half-life. At the detailed
level of exploration radon in soil gas provides a useful supplement to ground gamma scmtiUometry. Readings
as low as 20 counts/min or lower are significant. High readings due to especially permeable soils are charac-
terized by rapidly falling count-rates because of dilution by thoron. Uranium anomalies are characterized by
steady or rising count-rates. Counting beyond the first minute and monitoring any changes is essential.
Diurnal radon variations are not critical in Canada. An example is provided from the Bancroft area which
compares radon in soil to ground gamma scmtiUometry. The radon survey shows more detail, in agreement
with the geology, than the sdntiUometer.
Moschandreas, DJ., and H.E. Rector, 1982
Indoor radon concentrations:
Environment Intemat., 8(1-6): 77-82
Mose, Douglas G., Charles E. Chrosniak, and George W. Mushrush, 1989
106

State-size radon hazard maps based on zip-code compilations [abs.]:
Geol. Soc. America, Abstracts with Programs, 21(6): A143-A144
Indoor radon measurements are now available for many populated areas in the United States, particularly in the
Appalachian Moimtain system.A compilation of 1.3 million measurements, using activated charcoal and alpha-
track indoor radon monitors, has been gathered from several radon testing companies and grouped according
to zip codes. The hypothesis that charcoal monitor data yield zip code averages lower than alpha-track monitor
data was found to be incorrect, using Maryland zip code zones. These two measurement methods tend to yield
the same average for zip code zones, and the average charcoal measurement was found to be equally likely
to be lower than, or higher than, the alpha-track average. A comparison between the geological provinces in
MEuyland and the zip-code-based radon hazard map of Marylemd reveals the geological control on indoor
radon. The Coastal Plain, composed of Cretaceous and younger poorly cemented sedimentary strata, has the
lowest average indoor radon. Of intermediate concern for indoor radon is the eastern side of the Piedmont
(mainly Paleozoic high-grade metamorphic rocks and granitic rocks), the Blue Ridge (mainly 1 Ga-old high-
grade metamorphic and plutonic rocks), and the Plateau Province (flat-lying mid-upper Paleozoic sedimentary
rocks). The area that tends to have the most zip code zones with higher indoor radon levels includes the
western side of the Piedmont (low-medium-grade metamorphic rocks) and the Valley and Ridge Province
(mainly early Paleozoic limestones and shales that were folded in the middle-late Paleozoic, £md now form a
karst topography). Studies in Maryland and several other States have indicated that zip-code compilations of
large numbers of charcoal and alpha-track indoor radon measurements are useful indicators of indoor radon
problem areeis. If these compilations are superimposed on a geological map, useful radon hazard maps can
be quickly constructed for many States.
Mose, D.M., C.E. Chrosniak, G.W. Mushrush, and S.L. Davis, 1989
Relationships between radon in water, indoor radon and cancer : A case study in Virginia and Maryland [abs.]:
Eos, Am. Geophys. Union Trans., 70(15): 500
Year-long indoor radon measurements have been made in the homes of »1500 VA and MD residents from
which radon was also measured in drinking water. About 85% of the homes have municipal water, and these
had no detectable radon (lower limit of detection is «370 Bq/m^ or «100 pCi/L}. Almost all of the water
samples from private wells had detectable radon (range up to 037 MBq/m^ or » 10 nCi/L; median
«74 kBq/m^ or «2 nCi/L). A correlation cannot be demonstrated between drinking water radon and indoor
radon, indicating that other factors (e.g., home construction and use) are important. Based on a questionnaire
(time in home, cancer if any and when found, etc.), there is a positive correlation between the percentage of
people who develop cancer (all types except lung cancer in long-term smokers) and the radon concentration
in the drinking water, and the correlation is more pronounced with increasing length of exposure. In the study
area, « 15% of the homes use private water wells; a simple population study shows that the incidence of cancer
related to drinking water may exceed the incidence of cancer from inhalation of airborne radon. Werecommend that increased attention be given to radon in water, and to associated radionuclides (Ra and Po).
We also recommend that 37 kBq/m^ (1000 pCi/L) for radon in drinking water be used as a national "action
level" even though data show there is some risk at the 3.7-37 kBq/m^ (100-1000 pCi/L) level. We note that
the large numbers of homes now in the 3.7-37 kBq/m^ (100-1000 pCi/L) range, some of which are served by
public water systems, makes a "no-risk" action level of 3.7 kBq/m^ (100 pCi/L) unreachable.
Mose, Douglas G., George W. Mushrush, and Stephen W. Kline, 1988
The interaction of geology, weather, and home construction on indoor radon in northern Virginia and southern
Maryland, in Radon in the Northeast: Perspectives and Geologic Research (conference), Troy and Albemy, NewYork, May 31-June 2, 1988:
Northeastern Environmental Science, 7(1): 15-29
Mose, Douglas G., George W. Mushrush, David Saum, Mark Messing, Steven Hall, Nick Gromicko, and Robert
Dunkle, 1988
Prediction of indoor radon and home remediation in Fairfax Coimty, VA and Montgomery County, MD [abs.]:
107

Geol. Soc. America, Abstracts with Programs, 20(7): A337
An important goal of the radon studies program in the Center of Applied Science is to develop site-specific
criteria for the identification of (a) homesites with a potential indoor radon problem, (b) home construction
features that tend to be associated with elevated indoor radon, and (c) the application a particular remediation
method, sub-slab ventilation, to reduce indoor radon in different soil types. Out of a study group of « 1500
homes in which radon gas was measured during an entire year using four seasonal intervals in each home, a
set of 150 homes was studied to determine the relationship between homesite soil radon, soil permeability, and
indoor radon. Another set of 150 homes was used to test the effectiveness of sub-slab ventilation. Our study
shows that in more than 80% of the homes, the pre-remediation indoor radon could be estimated by measuring
the soil radon (Terradex soil monitors, buried at 1 m within «5 m of the home for 1-3 months) and the soil
permeability (simplified water percolation test). We found that basement wall construction, home heating
system, and other factors show a correlation with indoor radon. RnaUy, we found that a simple sub-slab
ventilation system reduced indoor radon to less than 74 Bq/m^ (2 pCi/L) in most homes, in spite of differences
in pre-remediation indoor radon, soil radon potential, or home construction factors. It thus appears that while
indoor radon is often predictable by homesite (or regional) criteria and home construction criteria, all homes
(at least in the northern Virginia and central Maryland study area) can be adequately remediated by simple
sub-slab ventilation to effectively eliminate the home health risk due to radon.
Mosley, Ronald B., 1991
Model calculations of the interaction of a soil depressurization system with the radon entry process, in The 1991
International Symposium on Radon and Radon Reduction Technology, Philadelphia, Pa., April 2-5, 1991, Proc.,
Volume 3, Symposium Panel and Poster Papers, Technical Sessions 1 through 5:
U.S. Environmental Protection Agency Rept. EPA/600/9-91/037C, p. P5-3—P5-21
McLean, Va., Cohen (S.) and Associates, Inc. [Springfield, Va., NTIS Order No. PB92-115377|
[A simple model for describing radon migration and entry into houses: Preprints, v. 3, no. VP-1]
An approximate analytical solution to describe radon transport in soil having uniform properties is applied to
the interaction of a soil depressurization system with radon emission to the atmosphere. The study addresses
the question of whether soil depressurization systems are likely to significantly increase the local ambient radon
levels by increasing the emission rate from the soil. While the model predicts that the operation of a soil
depressurization system usually increases the total emission rate, this increase does not appear to be significant
except for soils with high permeabilties. This is true because the decrease in emission rate from the soil
surface tends to compensate for the increase in emission rate by the mitigation system unless the soil
permeability is quite l^h. For permeabilities below 2x10'^^ m^, the increase in total emission rate of a single
mitigation system and its sphere of influence is less than 1%. Even for permeabilities greater than 4x10“^^ m^,
the increase in total emission rate associated with a single house and its sphere of influence is probably not
greater than 50%. A 50% increase in the emission rate from a single mitigation system does not translate into
a 50% increase in the ambient radon level. If only 10% of the soil surface in a community with permeability
greater than 4x10'^^ m^ is associated with operating mitigation systems, the local ambient level might be
expected to increase by about 5%.
Muessig, Karl W., 1989
Uranium cycling in the crust and its relationship to radon hazards in New Jersey [abs.]:
Geol. Soc. America, Northeastern Section, Abstracts with Programs, 21(2): 53
Information accumulated from uranium resource occurrences and more recently on indoor radon problems
indicate that anomalous concentrations of uranium and associated elevated radon occur in all of the NewJersey geological provinces. A model of uranium cycling in the crust, involving partial melting, hydrothermal
activity, deformation and later fluid movement, is proposed to explain the varied mineralization styles
throughout the lithologic column. It also explains the more pervasive uranium enrichment in the western parts
of the provinces. The oldest recognizable concentrations of uranium occur in the Precambrian metamorphosed
granites and volcanic-sedimentary rocks of the Reading Prong. Widespread enrichment of uranium is
characteristic of the granites. Other smaller but more concentrated uranium occurrences are found in the
108

metavolcanics auid sediments. Metamorphism, partial melting, hydrothermal activity and deformation were
important in recycling and concentrating uranium. Cambro-Ordovician cover rocks in the Valley and Ridge
and Reading Prong host equally varied uranium mineralization. Residual uranium-rich minerals are found in
the basal Cambrian quartzite. Hydrothermal deposits of manium cause severe radon problems in some
Cambro-Ordovician dolomites. Uranium was also incorporated into the marine shales of the Martinsburg and
Jutland Formations during sedimentation and was reconcentrated during diagenesis and hydrothermal activity.
The dominant repository for uranium in the Triassic rocks of the Piedmont Province is the lacustrine black
shales of the Lockatong Formation. Diagenesis induced the secondary migration of uranium and small
secondary deposits are associated with severe radon problems in the arkosic sandstones of the Stockton
Formation. These appear to be related to structures and later fluid movements.
Muessig, Karl, and Christy Bell, 1988
Use of airborne radiometric data to direct testing for elevated indoor radon, in Radon in the Northeast:
Perspectives and Geologic Research (conference), Troy and Albany, New York, May 31-June 2, 1988:
Northeastern Environmental Science, 7(1): 45-51
Murane, David M., 1993
Model standards and techniques for control of radon in new buildings [abs.], in First International Workshop
on Indoor Radon Remedid Action, The Scientific Basis and Practical Applications, Rimini, Italy, 27 June-2
July 1993:
Commission of the European Communities et ai. Book of Abstracts, p. 3
In response to a requirement in the Indoor Radon Abatement Act of 1988, the U.S. Environmental Protection
Agency (EPA) has been developing "Model Standards and Techniques for Control of Radon in New Buildings."
A draft of the Model Standards was developed in close cooperation with the building industry and disseminated
for public comment in early 1993. This paper describes the recommended construction techniques and
implementation procedures contained in the draft. Use of the recommended standards and techniques is
linked to the potential for elevated radon levels that is predicted for different geographical areas of the United
States. The paper emphasizes the cost-effectiveness of building-in radon-resistance in new homes, and
highlights the use of construction techniques that many builders already use as standard building practice.
Murane, David M., and John Spears, 1987
Radon reduction in new construction, in Indoor Radon H, Proceedings of the Second APCA International
Specialty Conference, Cherry Hill, New Jersey, April 6-10, 1987:
Pittsburgh, Pa., Air Pollution Control Association Pub. SP-60, p. 183-197
[The Swedish criteria (see Akerblom, 1987) are recognized for risk classification. In building radon-resistant
construction, one needs to answer questions concerning indoor radon concentrations in houses built on the
same rock and soil characteristics, whether the soil is derived fi'om an underlying rock that normally contains
above average concentrations of uranium/radium, whether the permeability of the soil is conducive to soil-gas
flow, and whether the domestic water source, if at the site, is likely to contain such high levels of radon as to
contribute significant levels of radon to the indoor air.]
Mushrush, George W., and Douglas G. Mose, 1988
Regional variation of indoor radon over three seasons:
Environmental Toxicology and Chemistry, 7: 879-887
[Radon levels in homes in the metropolitan Washington, D.C. area were measured by a-track detectors. Average
levels were highest in winter, intermediate in spring, and lowest in summer, and were related to geological
material under the homes and to construction characteristics.]
Narasimhan, T.N., Y.W. Tsang, and H.Y. Holman, 1990
On the potential importance of transient air flow in advective radon entry into buildings:
Geophys. Research Letters, 17(6): 821-824
109

[Numerical modeling by an integral finite difference method was used to model the temporal variations of air
flux within homogeneous soil surrounding a basement during periodic variations of barometric pressure and
a persistent 5-Pa underpressure in the basement. The basement walls were assumed to be impermeable, the
basement was assumed to be barren earth, and the water table was assumed to be 5 m below the basement
floor. In the absence of barometric pumping, the air flow into the basement was computed to be proportional
to the soil permeability over the range 0.153-15.3x10'^^ m^. Barometric pumping with a period of 0.5 hr and
peak-to-peak amplitude of 100 Pa amplified the air flow by a factor of «70 for the lowest permeability and
by a factor of «4 for the highest permeability, flow into the basement during increasing barometric pressure
slightly exceeded flow into the ground during decreasing pressure for the lowest permeability, but for the
highest permeability flow into the basement was several times greater than flow into the ground; and air flow
through the vertical plane below the basement wall changed direction for the lowest permeability but was
always toward the basement for the highest permeability. Barometric pumping of 500-Pa peak-to-peak
amplitude and 24-hr period amplified the air flow into the basement by a factor of «29 for the lowest
permeabihty and a factor of «3 for 1.53xl0'^^-m^ permeability, but reduced air flow into the basement by a
factor of »3 for the highest permeability. The results show that with short-period barometric pumping,
advective movement of soil air into a basement can be significant even if the soil’s permeability is low enou^to be negligible under steady-state conditions.]
Nason, Richard, and Bernard L. Cohen, 1987
Correlation between ^^a in soil, ^Rn in soil gas, and ^^Rn inside adjacent houses:
Health Physics, 52(1): 73-77
Nazaroff, William W., 1992
Radon transport fi'om soil to air:
Reviews of Geophysics, 30(2): 137-160
[This detailed exposition includes the following sections and subsections: (1) Introduction; (2) Overview: A radon
entry paradigm; (3) Radon availability in soil: radium content of rocks and soils, emanation coefficient, radon
partitioning in soil pores; (4) Radon migration through soil pores: diffusive transport, diffusive flux into the
atmosphere, advective transport (Darcy’s law, permeability—a strong function of soil grain size and soil
moisture), general transport equation; (5) Building factors that affect radon concentrations: model
representation, ventilation, substructure; (6) Radon entry into buildings: quantifying pressure-generating
mechanisms (wind, temperature differences), accounting for radon entry from soil and building materials
(diffusive entry, advective entry), reducing radon entry, refined paradigms for radon entry?; and (7) Concluding
remarks. A list of symbols and 104 references are included. "Radon availability," as used here and in
Nazaroff et al. (1988) refers only to the equilibrium concentration of radon in the soil pore fluids if not
modified by transport; it differs from the term introduced by Tanner (1986) to characterize both radon
production and radon migration characteristics of a soil.]
Nazaroff, William W., Barbara A. Moed, and Richard G. Sextro, 1988
Soil as a source of indoor radon: Generation, migration, and entry, in Nazaroff, W.W., and A.V. Nero, eds..
Radon and Its Decay Products in Indoor Air:
New York, John Wiley and Sons, p. 57-112
Nazaroff, W.W., BA. Moed, R.G. Sextro, K.L. Revzan, and A.V. Nero, 1989
Factors influencing soil as a source of indoor radon: Framework for assessing radon source potentials:
Berkeley, Calif., Lawrence Berkeley Laboratory Rept. LBL-20645, 114 p.
Nazaroff, William W., and Richard G. Sextro, 1989
Technique for measuring the indoor Rn source potential of soil:
Environmental Science and Technology, 23(4): 451-458
no

[A soil-probe technique is described for appraising the soil-related factors considered to be most important in
contributing to high indoor radon levels. Because the initial period of adjustment to sudden depressurization
of the soil-probe cavity is too brief in which to make measurements in soils of the assumed permeability range,
and steady-state conditions are not established in a convenient period of time, the measurements are made
during an intermediate interval during which the pressure and flow conditions are constant but the radon
concentration in the soil pores may be changing. A "radon source potential" parameter, an estimate of the
maximum sustainable rate of entry of ^^Rn from the soil into a building, is obtained by measuring factors that
determine two key characteristics, the rate of release of ^^Rn atoms from soil grains into pore space and the
volume of soil that can feed radon to a building. It is assumed that the soil is uniform and isotropic, that
molecular diffusion of radon is negligible in comparison with transport by soil air flowing through the pores,
that a constant negative pressure of 4 Pa ejdsts in the building relative to atmospheric pressure, and that a
hypothetical building at the site has a basement substructure with a radon entry opening of uniform width
around the 40-m perimeter of a basement slab located 2 m below the soil surface. Six dimensionless
parameters, defined for measurement of the soil-probe cavity size, the pressure difference, the radon flux into
a spherical cavity, the air flow into the cavity, radon flux into a cylindrical cavity, and air flow into the cavity,
are used to compute numerically the stresunline trajectories and travel times from the ground surface to the
cavity or entry gap. Once the trajectories and travel times have been computed in terms of the dimensionless
parameters, they may be obtained for other values of the real variables by scaling. The solutions for the
spherical cavity are appropriate for the interpretation of the sample-probe data; for analysis of the radon entry
into the hypothetical building, the solutions for the cylindrical cavity with horizontal axis along the perimeter
gaps, are appropriate. At low air flow rates, the radon flux into a cavity is equal to the undepleted radon
concentration in the soil pores times the flux of air into the cavity, but at high flow rates significant atmospheric
air is drawn from the surface and upper soil, dilutmg the radon flux. The radon source potential, expressed
in Bq/s, is obtained from the radon flux, the building perimeter length, and the assumed width of the entry
gap. Because the basement walls shield a part the air flow, it is expected that the actual rate of radon entry
would be reduced to 50-100% of the calculated value. If the interior air is well mixed, the indoor radon
concentration can be predicted as a function of the ratio of radon source potential to building volume, the
outdoor radon concentration, the rate of radon entry from sources such as building materials and potable
water, the radon decay constant, and the ratio of outdoor air infiltration rate to building volume. Radon source
potentials were obtained from measurements made at four houses in northern New Jersey. Although the
radon source potentials calculated from individual measurement sites at each house varied significantly, their
geometric means correlated well with measured indoor radon concentrations.]
Nero, Anthony V., Jr., 1993
Risk evaluation and control strategies for indoor radon [abs.], in First International Workshop on Indoor RadonRemedial Action, The Scientific Basis and Practical Applications, Rimini, Italy, 27 June-2 July 1993:
Commission of the European Communities et al.^ Book of Abstracts, p. Ill
Exposmes to radon decay products in homes entail significant estimated risks of lung cancer, but are amenable
to control strategies of various kinds. The risks of death from radon and other indoor pollutant
classes—estimated to average 0.1 to 1%, depending on country and smoking status—are larger than the 0.0001
to 0.01% lifetime risks from many outdoor air or water pollutants, and similar to some risks occurring in
industrial settings, as well as to accident risks in homes and automobiles. However, qualitative features of the
indoor environment—in regard to cost, benefit, responsibility, and distribution of risk—differ significantly from
the outdoor and occupational settings, where frameworks for setting risk-limiting objectives and strategies have
already been developed. Past analyses of radon risks illustrate the dangers of examining them from points of
view developed for other contexts, as do the differences in radon control strategies adopted in different
countries. This experience indicates the need to develop a conceptual framework for evaluating risk in the
indoor environment, in the context of which the objectives of a strategy for controlling indoor radon can
sensibly b; chosen. In the absence of this framework, the magnitude and distribution of estimated risks still
suggest '..veral near-term objectives of any national strategy for indoor radon, objectives that have not
universau been adopted. These are: to provide accurate and useful information for the public, so that they
111

can make effective choices; to provide suitable monitoring techniques and protocols, indicative of actual
occupant exposures; and to identify areas of the country where the highest indoor levels tend to occur, so that
monitoring and control efforts can be brought to bear rapidly. Concurrent development of a conceptual
framework for evaluating indoor risks will permit the adoption of objectives relevant to more typical indoor
exposure and to new housing, as well as to settings—such as schools or workplaces—^where exposures tend to
be lower than in houses.
Nero, A.V., AJ. Gadgil, W.W. Nazaroff, and K.L. Revzan, 1990
Indoor radon and decay products: Concentrations, causes, and control strategies:
Washington, GPO, U.S. Dept. Energy Tech. Rept. DOE/ER-0480P, 138 p.
...The purpose of this report is to provide an introduction to the behavior of ^^Rn and its decay products, based
primarily on research of the last fifteen years, and to review certain aspects of the radon question about which
there has been significant misunderstanding. We therefore include 1) an appraisal of the concentration
distribution in U.S. homes, 2) an examination of the utility and limitations of popular monitoring techniques
and protocols, and 3) a discussion of the key elements of strategies for controlling radon levels in homes. It
is useful here to summarize the main results from this review of radon and decay-product behavior, as well
as to provide some perspective on the three key issues just mentioned.... [Extract from authors’ summary]
Nero, A.V., S.M. Leiden, DA. Nolan, P.R. Price, S. Rein, KL. Revzan, HA. Wollenberg, and AJ. Gadgil, 1993
Statistically-based methodologies for mapping of radon "actual" concentrations: The case of Minnesota [abs.], in
First International Workshop on Indoor Radon Remedial Action, The Scientific Basis and Practical
Applications, Rimini, Italy, 27 June-2 July 1993:
Commission of the European Communities et al.^ Book of Abstracts, p. 77
A number of approaches have been developed for mapping the radon "potential" of areas, using radiometric,
soils, or geologic data, sometimes together with measured indoor concentrations and sometimes utilizing
models of the radon generation or transport process. These, however, have typically yielded indicators only
of transportable radon, of upper-bound radon entry rates, or of concentrations in a standard housing unit,
without statistical optimization or normalization to actual indoor levels. We here describe an alternative
approach, where measured indoor radon concentrations are used jointly with physical data (radiometric, soils,
geological, meteorological, and structural) in a statistical framework to yield a correlation model that directly
provides estimators of the actual indoor radon concentration distribution by area and of the uncertainties in
those esumators. Applied over a large re^on, this approach would thus yield a topography of indoor radon
concentrations. This could be used to focus efforts to identify existing homes having excessive indoor
concentrations or to characterize the expected indoor levels for new structures. This approach has been
applied in a preliminary way using data from the state of Minnesota, an area of the United States having
higher-than-average indoor levels. We fiuid the regression analysis to indicate geometric mean radon
concentrations for Minnesota counties with an R^ exceeding 0.5, a very high level considering the noise
introduced into the analysis by the relatively small number of actual measurements in most coimties. In a joint
project with the U.S. Geological Survey, we are investigating the use of more sophisticated statistical
methodologies and more complete physical data, as a means to provide estimators at a finer geographic scale
than the county level, and developing a comprehensive statistical, geographical, database system for processing
and analysis of the data required and for suitable representation of the analysis results.
Nero, A.V., and W.W. Nazaroff, 1984
Characterising the source of radon indoors:
Radiation Protection Dosimetry, 7(1-4): 23-39; [orig. pub.: Lawrence Berkeley Laboratory Rept. LBL-16636,1983]
Average indoor radon concentrations range over more than two orders of magnitude, largely because of
variability in the rate at which radon enters from building materials, soil, and water supplies. Determining the
indoor source magnitude requires knowledge of the generation of radon in source materials, its movementwithin materials by diffusion and convection, and the means of its entry into buildings. This paper reviews the
112

state of understanding of indoor radon sources and transport. Our understanding of generation rates in and
movement through building materials is relatively complete and indicates that, except for materials with
unusually high radionuclide contents, these sources can account for observed indoor radon concentrations only
at the low end of the range observed. Our understanding of how radon enters buildings from surrounding soil
is poorer; however, recent experimental and theoretical studies suggest that soil may be the predominant source
in m£my cases where the indoor radon concentration is high.
Nevissi, Ahmad E., 2md David Bodansky, 1987
Radon sources and levels in the outside environment. Chap. 4 in Bodansky, David, Maurice A. Robkin, and
David R. Stadler, eds.. Indoor Radon and Its Hazards:
Seattle, Univ. Washington Press, p. 42-50
Ney, E.P., and Lively, R.S., 1989
Boundary conditions affecting radon estimation based upon daughter deposition, in Osborne, M.C., and Harrison,
Jed, Symposium Cochairmen, The 1988 Symposium on Radon and Radon Reduction Technology, Proc., Vol.
1, Symposium Oral Papers:
Research Triangle Park, N.C., Radian Corp., U.S. Environmental Protection Agency Pub. EPA/600/9-89/006a
[Springfield, Va., NTIS Order No. PB89-167480], p. 4-65—4-68.
Nielson, Dennis L., Cui Linpei, and Stanley H. Ward, 1990
Gamma-ray spectrometry and radon emanometry in environmental geophysics, in Ward, Stanley H., ed..
Geotechnical and Environmental Geophysics, Vol. I: Review and Tutorial:
Tulsa, Okla., Soc. Exploration Geophysicists, p. 219-250
[This tutorial review includes the following sections and subsections: Abstract; Introduction; Natural radioactive
decay processes (elementary particles, concentration and distribution, equilibrium and disequilibrium, scattering
and absorption, health effects of radioactivity); Operational considerations—gamma-ray spectrometry
(background, meteorological effects, calibration, statistical errors in count rates, field of view of gamma-ray
detectors, data analysis); Origin and migration of radon in the natural environment (introduction, radon
emanation, migration processes, fluids, meteorolo^cal effects); Measurement of radon in soils (measurement
methods); Examples of environmental geophysical surveys (case study^Vitro tailings site. Salt Lake City, Utah,
fault and earthquake studies, indoor radon, landslides, caves and karst, groundwater detection, the search for
Cosmos 954 [satellite], Chernobyl fallout); Summaiy, and 87 references. A related tutorial review on ground
sources of indoor radon by Gregg and Holmes (1990) follows.]
Nielson, K.K., M.K. Bollenbacher, V.C. Rogers, and G. Woodruff, 1989
Users guide for the MK-II Radon/Permeability Sampler:
Salt Lake City, Utah, Rogers and Associates Engineering Corp. Rept. RAE-9000/9-2, 39 p.
[This guide describes the theory, implementation, set-up, operation, transportation, maintenance, and calibration
of a hammer-driven probe and the associated pressure and soil-gas flow measuring instruments for a system
for determining soil permeability while extracting a sample of the soil gas for radon analysis. The probe
follows a general design introduced by DSMA Atcon, Ltd. (1983) and is a nominal 60-in. (1.5 m) heavy steel
pipe of» 2 cm diameter with a removable steel driving point and a IVi-m. (57 mm) di2uneter steel driving head.
The inlet consists of a recessed surface near the bottom end with small diametrically opposed holes in a
vertical row 10 holes long. The outlet is a hose barb threaded into the driving head. The suction pump, a
battery, and gauges are fitted to a lightweight metal suitcase that needs only to be opened to make the system
available for operation. The probe has been calibrated within cylinders of semi-permeable foam whose
permeabilities have been determined in a conventional one-dimensional flow system.]
Nielson, K.K., and V.C. Rogers, 1989
Radon generation, absorption and transport in porous media — the RAETRAN model [abs.]:
Eos, Am. Geophys. Union Trans., 70(1^: 497
113

A new mathematical model has been developed to describe the generation and transport of radon gas in soils.
It is aimed at describing radon sources and their availabihty for entry into the indoor environment from sub-
structure soils. The model is a multiregion, one-dimensional analytical model. It combines individual
mathematical descriptions of radon emanation, diffusive transport, and advective transport in both gas- and
liquid-filled pore space. It explicitly considers the equilibrium absorption of both radon and radium in the
liquid phase and of radon adsorption on solid surfaces. The model is implemented in a Fortran code,
RAETRAN, which computes radon fluxes and distributions for prescribed source concentrations, pressure
gradients, concentration boundary conditions, moistures, and a variety of soil properties. The code uses
defining properties for any number of regions. Defining properties may include the soil thickness, porosity,
radium concentration, emanation coefficient, moisture, ^ain size distribution, diffusion coefficient, gas
permeability, temperature, and applied pressure gradient. For cases in which suitable input values of soil gas
permeability, diffusivity, or radon emanation coefficient are not known, the code computes appropriate values
fi'om empirical correlations with the soil particle size distribution, moisture content, and porosity. By unifying
the theories of radon generation and transport, the model avoids previously required appro?dmations and
inconsistencies, and correctly describes radon source strengths and availabilities. It has been applied in
describing experimental systems and sensitivity testing of the source parameters that affect indoor radon
concentrations.
Nielson, Kirk K., and Vem C. Rogers, 1990
Correlation of Florida soil-gas permeabilities with grain size, moisture and porosity:
Salt Lake City, Utah, Rogers and Associates Engineering Corp. Rept. RAE-8945-1, 39 p.
U.S. Environmental Protection Agency Rept. EPA-600/8-91-039
Nielson, Kirk K., and Vem C. Rogers, 1991
Development of a prototype map of the soil radon potentials in Alachua County Florida:
Salt Lake City, Utah, Rogers & Associates Engineering Corp., Rept. RAE-9127/3-1, 114 p.
A prototype map of the soil radon potentials in Alachua County, Florida has been developed. The map is
designed to show from geological and soil features the areas associated with different potentials for
accumulating elevated indoor radon concentrations that can pose health hazards. Radon potential maps have
been proposed as a basis for implementing radon-protective building construction requirements in Florida.
The map for Alachua County is a prototype to develop the necessary methods and to examine the feasibility
and problems associated with a broader statewide radon mapping effort. fSoil radon potentials were
characterized by modeling individual soil profiles at numerous locations throughout Alachua County with
respect to their radon generation and transport properties. The RAETRAD model was used to compute the
potential rates of radon entry into a hypothetical reference house that was modeled over each soil profiile. Theresulting radon entry rates, e3q)ressed in units of mCi/y, give a relative measure of radon potential for any
budding on the sod profile, and lead to estimates of indoor radon concentrations for the reference house. Theradon potential calculations utilize multiphase modeling of radon emanation and 2-dimensional advective and
diffusive transport into the house. The reference house approximates single-story slab-on-grade housing typical
of central Florida. USod profiles were defined for each of 65 detaded sod map units from the existing data in
the Alachua County sod survey. The profiles were associated with approximately 15,000 areas (polygons) on
a digitized 1:24,000 Alachua County sod map. Each profile was defined in terms of approximately 5-9 sod
horizons that represented soils to approximately 2-2.5 m depths. Sods in the deeper 2.5-5-m zone were
characterized by a separate geological study by the U.S. Geological Sur</ty. Individual properties of sods in
each horizon of each profile were defined as far as possible fi'om exist ii {’ «od survey data. These properties
included horizon depths, sod densities, water drainage characteristics, .soil textural properties, and high water
table limits and durations. Related sod properties were computed fi'om these measured characteristics as far
as possible. These included sod porosity, water saturation fraction, annual water table depth distribution, meanparticle size, sod air permeability, sod radon diffusion coefficient. Several properties, such as water contents,
permeabilities, and radon diffusion coefficients varied in different parts of the year due to water table
fluctuations. Up to three different water table depths were considered in defining these profile properties.
114
USoil radium concentrations and radon emanation coefficients were measured by a new, more sensitive method
in 323 and 131 soil samples, respectively, that were mostly obtained from the archive of samples collected in
the original Alachua County soil survey. Some additional samples also used in the radiological measurements
were obtained from new borings in Alachua County by the U.S. Geological Survey and the Florida Geological
Survey. Radium concentrations were log-normally distributed with a geometric mean of 30 Bq/kg (0.8 pCi/g)
and a geometric standard deviation of 122 (3.3). They ranged from <7.4 to 1600 Bq/kg (<0.2 pCi/g to
43 pCi/g). Radon emanation coefficients were approximately normally distributed with a mean of 0.48, a
standard deviation of 0.16, and a range of 0.05 to 0.85. The emanation coefficients are significantly higher than
most previously reported soil values, and exhibit an approximate correlation with radium concentrations in the
low-radium range of 0-74 Bq/kg (0-2 pCi/g). IfFor production of the draft radon potential map, measured
radium and emanation characteristics were represented by three different radiological tiers for each of two
general soil categories. Various combinations of the six radiological categories were attributed to each soil
profile to accommodate different underlying geology that occurs in different locations. Radon potentials were
computed for each soil profile with its defined radiological distribution and with up to three different soil water
profiles to represent different seasonal conditions. The radon potentieds were attributed to individual map units
by overlaying the digitized map of surface soils with the geological map based on soil formations and origins.
From this overlay, the appropriate calculated radon potential was assigned based on the combination of surface
soil profile and geolo^c unit. The resulting annual-average radon potentials ranged from 0.37 to > 150 MBq/a(0.01 mCi/y to >4 mCi/y. For the reference house, a radon potential of 111 MBq/a (3 mCi/y) corresponds
to an indoor radon concentration of 74 Bq/m^ (2 pCi/L). fBecause of the method used to average measured
radium concentrations over broad soil regions, high values that might indicate particular problem areas are
not indicated. However the broad range of calculated radon potentials is consistent with probabilistic
interpretations even for the observed elevated radon levels in Alachua County. The present draft radon
potential map appears to be most suitable for identifying areas that would not require special radon-protective
building precautions, rather than identifying "hot" areas that need special attention. Using this approach, the
areas with intermediate radon potential, which also are most likely to exhibit occasional "hot" areas, also would
be included in the areas suggested for precautionary radon-protective building features.
Nielson, Kirk K., and Vem C. Rogers, 1991
Feasibility and approach for mapping radon potentials in Florida. Florida Radon Research Program:
Salt Lake City, Utah, Rogers & Associates Engineering Corp., Rept. EPA-600/8-91-046, 45 p. [Springfield, Va.,
NTIS]
Statewide maps of radon potentials in Florida have been proposed as a means of assessing the need for
radon-protective construction features for new housing. Suitable radon maps would reduce costs and increase
benefits from radon-based building code requirements being promulgated by the Florida Department of
Community Affairs (DCA) by defining local radon risks that could be keyed to the need for prescribed levels
of radon protection. Radon potentials are dominated by concentrations of the naturally occurring radium-226
parent nuclide and by the gas-transport properties of soils in the top few meters beneath a house. Thepotentials thus correlate with re^onal geology, mineralogy, and physiographic features. An analysis was madeof the feasibility of developing radon maps that would meet DCA progr2unmatic needs and of the approach
that would be required. The analysis included a review of previous radon mapping approaches and experience,
as summarized in presentations and discussions at a DCA workshop or DCA workshop on radon mapping,
and a subsequent critical review of pertinent scientific literature and mathematical approaches. Prior radon
maps were aimed at identifying radon-prone areas for prioritizing testing programs and alerting the public to
testing needs. They generally have used 3-5 tier classifications of state- or region-sized land areas on a scale
of county or physiographic units. The classifications generally are qualitative or probabilistic, and represent
broad correlations of indoor radon concentrations with surface geology, lithology, aeroradiometric data, soil
permeability, and/or soil radium concentrations. A few have resolutions approaching a 10-acre parcel, but
most show only broader trends. Several deterministic approaches have utilized radon indices based on simple
correlations of indoor radon with two or three soil or house parameters. The parameters have included soil
radium or uranium concentration, soil permeability, soil radon concentration, house ventilation rate, house
115

foundation parameters, and other related parameters. More detailed calculations have utilized steady-state
analytical calculations of advective or combined advective-diffusive radon entry rates into houses. To provide
a basis for requiring radon-protective construction, a more precise, theoretically-based approach is needed to
quantify radon potentials throughout Florida and to interpret them in terms of probable indoor radon
concentrations. Greater precision can be achieved by partitioning radon variations into the three categories:
source variations, house variations, and time variations. By using only long-term average or invariant
parameters, the time component is minimized. Source and house variations are partitioned by computing radon
entry rates (mCi/year) for a reference house, typical of Florida housing stock, located on layered soils
representing the source variations throughout the state. From the resulting statewide distribution of radon
source potentials, housing variabihty is assessed by statistical summaries of indoor radon variations for a
constant or normalized source potential. Statistical analyses of Florida indoor radon data suggest relatively
constant, house-dominated variations within similar geologic or physiographic units, but broader variations
when areas are grouped by county or other institutional boundaries. Methods are described to obtain unbiased
estimates of the variations, which are useful indicators of the presence of local "hot spots" within a re^on.
These were shown to occur mainly in northern and central Florida, and to demonstrate the importance of
localized, high-resolution analyses of source potentials from soils, geolo^c, and radiological data. The
proposed mapping approach will generate two kinds of radon maps. A radon source map will display isopleths
of the deterministic estimates of radon entry rates for the reference house. A radon probability map then will
utilize the source information with probability distributions to display isopleths of the probabilities of exceeding
prescribed indoor radon concentrations at each map location. A nominal statewide mapping scale of 1:100,000
to 1:250,000 is proposed for the main, initial mapping effort. For certain populated areas where radium
anomalies and near-surface lithology (0-5 m) are non-uniform, higher resolution mapping to a 200-m scale will
be needed for radon zoning purposes. Radon source maps can utilize present multi-region, multi-phase
analytical equations for diffusive and advective radon transport. The reference house is defined from average
Florida and U.S. parameters for slab-on-grade housing. Layered soil data are mostly available fi'om existing
borings, geology, hthology, and Soil Conservation Service (SCS) data. These will serve to define the required
layer boundaries, densities and porosities. From SCS soil textural classifications and porosities, long-term
average water contents will be estimated from soil matric potentials. The water contents in turn can be used
with soil porosities and textures to estimate soil permeabUities and diffusion coefficients using existing empirical
correlations. SCS water percolation data also may prove useful. The remaining radiiun and emanation
parameters will use existing data where available, but will require supplementary mea.surements on samples
archived at the University of Florida and the Florida Geological Survey. The measurements should
characterize these radiological properties by geolo^cal formation and/or lithological unit. Precisions of the
mapped radon source potentials are anticipated to approach a geometric standard deviation of about 2.5. Theprobability maps will utilize a simple indoor radon dilution model based on the radon entry rate, house volume,
and ventilation rate. Log-normal radon distributions appear appropriate, and will be used to compute the
probabilities of exceeding 148 Bq/m^ (4 pCi/L) or other criteria using log-normal distribution statistics.
Nielson, Kirk. K., and Vem C. Rogers, 1991
Proceedings of the Workshop on Radon Potential Mapping. Florida Radon Research Program:
Salt Lake City, Utah, Rogers & Associates Engineering Corp., Rept. EPA-600/9-91-044, 71 p.
[The authors have summarized the presentations given at a workshop held in Gainesville, Florida, April 20, 1990,
for guidance of the Florida Radon Research Program (see also Sanchez et al.y 1991): (1) Introduction (Nielson
and Rogers); (2) Overview of Florida Programmatic Goals (Rick Dixon, Florida Department of CommunityAffairs); (3) Meeting scope, objectives, and issues (Vem Rogers); (4) Review, use, and basis of existing radon
maps (James Otton, USGS); (5) Technical basis for mapping radon potentials (Allan Tanner, USGS); (6)
Rationale and level of detail for radon potential maps (Charles Laymon, New York State Dept, of Health);
(7) Data available for Florida radon potential mapping (Walt Schmidt, Florida Geological Survey); (8) Radonmapping issues and priorities (Rick Dixon); Data, accuraqr, and instrumentation (Task Group 1); Institutional
issues, uses, and costs (Task Group 2); and appendices giving a list of participants and copies of slides and
viewgraphs presented.]
116

Nielson, Kirk K., and Vem C. Rogers, 1992
Radon transport properties of soil classes for estimating indoor radon entry, in Cross, Fredrick T., ed.. Indoor
Radon and Lung Cancer: Reality or Myth? Twenty-ninth Hanford Symposium on Health and the
Environment, Richland, Wash., October 15-19, 1990, Proceedings:
Richland, Wash., Battelle Memorial Press, Part 1, p. 357-372 [NTIS]
Radon diffusion coefficients and air permeabilities of soils are required for modeling indoor radon entry, for
interpreting data on soil radon sources, and for designing and evaluating potential radon mitigation or
containment systems. Diffusion and permeability coefficients depend on soil moistures, particle sizes, and
compactions. We present a systematic method for estimating these transport parameters for the 12 commonSoil Conservation Service (SCS) soil textural classes for predicting radon entry. IfDiffiision coefficients and
air permeabilities are estimated from predictive correlations with soil particle-size distribution, porosity, and
water content. The matric potential [the environmental tension or suction affecting a soil] and particle sizes
are preferred for estimating soil moistures when site-specific data £ire unavailable because long-term average
matric potentials near structures are relatively constant. They also provide a useful basis to compare radon
transport properties of different soil textural classes in a mven location. fPredicted diffusion coefficients range
from about 10'^ m^/s for the silty clay class to 4x10"^ nr/s for the sand class. Air permeabilities range from
8x10'^® m^ for the silty clay class to ^0'^^ m^ for the sand class. Comparison of measured diffusion and
permeability coefficients with predicted values are within geometric standard deviations of 1.4 and 1.7,
respectively. TThe method provides generic diffusion and permeability coefficients as functions of soil textural
class and matric potential. Because long-term average matric potentials near structures are relatively constant
(10 to 30 kPa), specifying the soil textural class characterizes the soil radon transport properties sufficiently
for estimating indoor radon entry. [From preprint. See Rogers and Nielson, 1991, "Correlations..." for the
equations for diffusion coefficient as a function of porosity and fractional moisture saturation and permeability
as function of porosity, fractional moisture saturation, and arithmetic mean soil particle diameter. Radon entry
rates were computed by the two-dimensional, three-phase, multiregion radon transport model called
RAETRAD described by Rogers and Nielson (1990, "Benchmark..."), for a slab-on-grade structure, using soil
moistures for the various soil types at a matric potential of -50 kPa.]
Nielson, Kirk K., Vem C. Rogers, Randall B. Brown, Willie G. Harris, and James K Otton, 1991
Prototype mapping of radon potentials in Florida, in The 1991 Annual AARST National Fall Conference,
Rock^e, Md, October 9-12, 1991:
American Association of Radon Scientists and Technologists, Midatlantic Chapter, Preprints, Vol. I, p. 145-162
A prototype map of radon potentials in Alachua County, Florida is being developed to demonstrate the feasibility
of defining geographic criteria for implementing radon-protective building construction standards. Because
of regulatory needs emd sensitivities, the map is being developed independent of institutional boundaries or of
particul2u' present radon limits. It defines the radon source potentials as the average rate at which radon would
enter a reference house that is modeled on specific soil profiles that are defined in the existing county soil
survey. Radon transport parameters (diffusion coefficients and air permeabilities) for each soil layer at each
location are defined from soil densities, textures, and moisture properties in the soil survey data base. Parent
radium concentrations and radon emanation coefficients were measured in 323 soil samples obtained from
archived materials from the county survey reference pedon sites and from supplementary borings. Radiumconcentrations are mainly associated with clayey materials from the Hawthorne formation. Relatively high
radon emanation coefficients were observed, averaging 0.48± 0.16. The high emanation coefficients are
attributed to predominant radium mineralization in the Hawthorne-related surface coatings in sandy soils.
Radon potentials of approximately 3 MBq/a per Bq/kg (3 mCi/y per pCi/g ^^^a) are estimated to
correspond to uniform sandy soils to give an indoor radon concentration of 74 Bq/m^ (2 pCi/L).
Nielson, K-K., V.C. Rogers, R.B. Brown, W.G. Harris, and J.K. Otton, 1992
Soil radon potential mapping and validation for central Florida, in The 1992 International Symposium on Radonand Radon Reduction Technology, Minneapolis, Minnesota, September 22-25, 1992:
U.S. Environmental Protection Agency, Preprints [poster papers], v. 5, no. VIIIP-2, 19 p.
117

Maps of soil radon potentials are being developed to provide a possible geographic basis for implementing
radon-protective building construction standards in Rorida. The maps are being developed from soil
properties, independent of institutional boundaries or of particular present radon limits. The radon potentials
are defined from the calculated rates of radon entry into a hypothetical house modeled over soil profiles for
each map polygon. Two approaches are tested in prototype radon maps developed for Alachua County. The
first approach defines soil profiles and associated transport properties (air permeability, radon diffusion,
moisture) fi’om county soil survey data for 65 map units occurring in 15,000 map polygons. Radon source
strengths are based on 323 radium and radon emanation measurements, averaged by geologic unit, from
archived samples collected at reference pedon sites in the soil survey. The second approach defines soil
profiles and transport properties from the state-wide Statsgo soil maps and data, which include 30 map units
occurring in approximately 200 polygons m Alachua County. The second approach uses NURE aeroradio-
metric data and geologic classifications to define individual radon source strengths for each map polygon. TThe
two approaches were compared with ground-truth data that included surface radon fluxes, soil-gas radon
concentrations, and indoor radon data. The mapped soil radon potentials were related most precisely to the
radon fluxes, followed by the soil-gas radon concentrations. Indoor radon data exhibited more variation, as
expected, due to house variability. A mapping precision of ± 1 tier in a four-tier approach appears possible.
The higher resolution of the first mapping approach did not demonstrate any advantage in mapping precision
when comparing the maps with ground truth data. The second approach is proposed for mapping broader
areas of the state because it utilizes data and samples that are already available throughout most of the state.
Nielson, Kirk K., Vem C. Rogers, and Rodger B. Holt, 1992
Development of soil radon potential maps for Alachua, Marion, and St. Johns Counties in Florida. Draft interim
report.:
Salt Lake City, Utah, Rogers & Associates Engineering Corp., Rept. RAE-9127/8-1, 127 p.
Soil radon potentials have been calculated for mapping geographic distributions of radon potentials in Alachua,
Marion, and St. Johns Counties in Florida. The maps are designed to show fi-om geological and soil features
the areas that have different levels of radon potential. The soil radon potential maps have been proposed as
a basis for implementing radon-protective building construction requirements in areas of greatest radon risk.
Discrete areas (polygons) on the radon maps were defined from the digital intersection ofSTATSGO soil mapunits with digitized geological map units. The intersections to define radon map polygons were performed by
the University of Florida GeoPlan Center using a geographic information system with Arcinfo format. They
also partitioned National Uranium Resource Evaluation (NURE) aeroradiometric data for each polygon.
Radon potentials of each map polygon were estimated from the radon source and transport properties of the
soil profiles that compose the region represented by the polygon. Radon source properties were estimated
from NURE aeroradiometric data for shallow horizons (0 to 2 or 23 m), and from geological classifications
of the soils for deep horizons (to 5-m depth). Radon emanation coefficients were based on several hundred
emanation measurements on coimty-survey soil samples from Alachua, Marion, and St. Johns Counties. Radontransport properties were estimated from soil profile physical data compiled for the STATSGO soil maps from
Soil Conservation Service (SCS) data bases by the University of Florida Soil Science Department. Summarysoil data files characterized soil densities, particle size distributions, water drainage curves, high water table
depths and durations, and other mechanical and hydrological data. Radon transport properties (water contents,
radon diffusion coefficients, and air permeabilities) were calculated from these data. Soil radon potentials were
computed by mathematically modeling a reference house typical of Florida slab-on-grade sm^e-family housing
as if it were located on each soil profile of each of the radon map polygons. The model calculations were
based on the RAETRAD (RAdon Emanation and TRAnsport into Dwellings) model, but were conducted
using a more specialized, benchmarked radon potential cartography algorithm named RnMAP. Both models
calculated radon potentials as the rate of radon entry into the reference house. Annual units (mCi/y) were
used to express the radon potentials to emphasize the long-term average nature of the radon potential
estimates. Radon potentials were calculated and then averaged for eadi of several soil profiles in each
polygon, at each of two or three seasonal water table depths. They also were also calculated for either "hot”
or "cold" geology, and the applicable geologic classification was used afterward to select the appropriate values
118

to use in representing each polygon. Separate radon potentials were calculated for the estimated median
radium concentrations, and also for radium concentrations corresponding to the 75%, 90%, 95%, and 99%confidence limits for areal radium distributions within each polygon. The confidence limits were calculated
from the geometric means and geometric standard deviations of radium estimated from multiple NURE data
points in many of the polygons that intersected NURE flight lines. Radium estimates for polygons not
intersected by NURE flight lines were extrapolated from the overall data for the geologic unit in which the
polygon was located. The resulting radon potentials were partitioned into seven tiers of similar numerical
values for display on the radon potential maps. The tiers corresponded to the <0.4, 0.4-1, 1-2, 2-3, 3-6, 6-12,
and > 12 mCi/y levels of radon potential. This set of tiers provided suitable range for using a uniform tier
scale on all of the radon potential maps. Map polygons finally were colored according to the appropriate tier
classification for intuitive visual interpretation. Numerical values of the radon potentials computed for each
map polygon are presented in this report for more quantitative interpretations of the maps. A radon potential
of « 111 MBq/a (3 mCi/y) corresponded to approximately 148 Bq/m^ (4 pCi/L) in the reference house.
Separate maps were plotted for the median, 75%, 90%, 95%, and 99% confidence limits of radon potentials
to give a better perspective of radon potentials in a given polygon region. Areas with low potentials on both
the median and higher-confidence-limit maps exhibit reasonable assurance of having minimal indoor radon risk.
Areas exhibiting high radon potentials on the mediem and higher-confidence-limit maps conversely have a
relatively high probability of elevated indoor radon levels. Areas with low median radon potentials but high
potentials for higher confidence limits suggest heterogeneous areas (low median; high geometric standard
deviation) that may have generally low radon potentials but occasional to frequent anomalies of high radon
potential. Special considerations may be needed to define radon-protective building needs in these areas.
Ogden, Albert E., William B. Welling, Robert D. Funderburg, and Larry C. Boschult, 1987
A preliminary assessment of factors affecting radon levels in Idaho, in Graves, B2U’barei, ed.. Radon in GroundWater:
Chelsea, Mich., Lewis Publishers, p. 83-96
[The geology of Idaho was reviewed with particular attention toward formations that are likely to have above-
average concentrations of radium. Charcoal canisters were distributed throughout the state during the winter
months of 1986-1987, with instructions to deploy them in the room most occupied for one week. The results
from Ada County (containing the capital, Boise), and Kootenai County, in the northern panhandle, were
examined in more detail than those from other counties. In the two counties there was a shght positive
correlation between indoor radon and depth to the water table, which ranged as great as 180 m in Ada County
and 135 m in Kootenai County. In Ada County, where most houses are sited on unconsolidated sediments,
the median radon level was significantly high only on arkosic granitic sediments; houses sited on sandy soils
underlain by clay layers in the subsoils of lacustrine foothills had the lowest median indoor radon. Sample sizes
were small for both counties. The authors state that, "The greater the granitic composition of the alluvium
and outwash on which the homes are built, the greater the possibility of higher radon levels. In general,
homes built in counties where the Snake Plains basalt crops out have lower radon levels than homes built on
granite or granitic-rich alluvium. Soils with high permeability appear to produce more radon than tighter soils.
Finally, homes built in geothermal areas have higher radon levels...." In addition to this preliminary study,
more extensive studies were done. See Moed et «/., 1984; Otton and Duval, 1991; and Schumann, 1^3j.]
Otton, James K., 1987
Indoor radon—Geologic controls in Pacific Northwest [abs.]:
Geol. Soc. America, Abstracts with Programs, 19(2): 122
Three-month, wintertime, indoor radon measurements of over 16,000 residences in selected areas of the
northwest U.S. by the Bonneville Power Administration show higher radon values (more than 10 percent of
homes >185 Bq/m^ (>5 pCi/L) in townships in the Spokane and Rathdrum Prairie areas (SRP) of northeast
Washington and northern Idaho, the Milton-Freewater area (MF) in eastern Oregon, several communities
along the lower Columbia River (LCR), and several communities along the Willamette River Valley (WRV)in western Oregon. Maximum values approach 3.7 kBq/m^ (100 pCi/L) near Spokane; of the 24 values
119

exceeding 925 Bq/m^ (25 pCi/L) in the entire dataset more than half are from SRP. Throughout the SRParea, soils have relatively high soil uranium contents compared with the rest of the Northwest (2-3 ppmequivalent uranium estimated from aeroradiometric data), and the soils are typically rapidly to very rapidly
permeable because they are developed on coarse glacio-fluvial outwash. Rapidly permeable soils permit more
radon-bearing gas to enter into structures. Persistent low values occur in the Puget Lowland from Seattle
northward to Everett (for example, in T27N, R4E, 1165 homes averaged 17 Bq/m^ or 0.46 pCi/L radon with
a maximum value of 105 Bq/m^ or 2.84 pCi/L); however the southern suburbs of Seattle show higher values
in four townships (in T19N-R2 to 5E, 247 homes averaged 55 Bq/m^ or 1.48 pCi/L with a maximmn of
655 Bq/m^ or 17.71 pCi/L). Although no significant differences can be seen in the permeability of the soils
from north to south across this area, the average equivalent uranium value for soils increases systematically
from about 0.5 ppm at the latitude of T32N to 1.5 ppm at the latitude of T19N. In the other areas (LCR,
WRV and MF), higher indoor radon values usually correspond to rapidly permeable soils and higher soil
uranium contents. These data suggest that most higher indoor radon levels in the Pacific Northwest are
associated with rapidly permeable soils and soD uranium concentrations about 1.5 ppm and above. Overall,
however, indoor radon levels in the Pacific Northwest are regionally low compared with other areas under
examination in the U.S.
Otton, James K., 1987
Potential for indoor radon hazards: A first geologic estimate, in Radon and the Environment, Conference
Proceedings, Mahwah, NJ., May 8-10, 1986, Makofske, William J., and Michael R. Edelstein, eds.:
Mahwah, NJ., Ramapo College of New Jersey, Inst, for Environmental Studies, p. 28-33
Otton, J.K., 1988
Radon potential of rocks and soils: a Fairfax County case history [abs.], in Proceedings of the 1988 Symposium
on Radon and Radon Reduction Technology, Denver, Colorado, Oct. 19-22, 1988:
U.S. Environmentsd Protection Agency, Washington, D.C.
Otton, J.K., 1989
Mapping the radon potential of rocks and soils:
The Professional Geologist, 26(5): 8; also Virginia Minerals, 35(1): 2-3
Otton, J.K., 1989
Using geology to map and understand radon hazards in the United States:
U.S. Geol. Survey Yearbook, Fiscal Year 1988, p. 52-54
Otton, James K., and Sigrid Asher-Bolinder, 1993
Elevated indoor radon associated with soils developed on Pleistocene limestones in tropical and subtropical
latitudes, in The 1993 International Radon Conference, Denver, Colo., Sept. 20-22, 1993:
Denver, Colo., Am. Assoc. Radon Scientists and Technologists, Rocky Moimtain Chapter, Preprints,
p. rV 32^IV 39
Indoor radon data and geologic, geochemical, and radiochemical studies suggest that substantial quantities of
radium have accumulated in soils formed on karstic limestones and related carbonate-rich sediments of various
ages in Florida, Guam, and various islands in the Caribbean. These limestones are typically nearshore marine
in origin and are elevated relative to sea level. In Florida, indoor radon levels exceeding 1.48 kBq/m^
(40 pCi/L) and, in Guam, indoor radon levels exceeding 7.4 kBq/m^ (200 pCi/L) occur in homes built on
these soils in spite of climatic, housing, and lifestyle factors that mitigate against high levels. In southeastern
Florida, radium concentrations in soils of as much as 418 Bq/kg (113 pCi/g) have been measured in soils.
The source of the radium in the Florida soils is uncertain; however, clayey, Fe-rich soils with high radium
concentration ratios have been documented in many islands of the Caribbean and the Florida Keys. A primary
component of these latter soils is Saharan airborne dust. We infer that the Florida soils have a similar ori^.In Guam, aerosol dust fi’om central Asia and other sources may be the parent material for the clayey, Fe-rich
120

soils and inferred high radium concentrations. Elevated indoor radon levels may be expected in housing sited
on these soil types on limestone terranes elsewhere at subtropical and tropical latitudes throughout the world
where aerosol dust is a significant contributor to soil development.
Otton, James K, and Joseph S. Duval, 1991
Geologic controls on indoor radon in the Pacific Northwest, in The 1990 International Symposium on Radon and
Radon Reduction Technology, Atlanta, Ga., 19-23 February 1990:
Research Triangle Park, N.C., U.S. Environmental Protection Agency Rept. EPA600/9-91-026b, Proceedings,
Vol. 2: Symposium Oral Papers, Paper No. VI-5, p. 6-51—6-62 [NTIS Order No. PB91-234450/AS]
Comparisons of average indoor radon levels, soil radium content (derived from aerial gamma-ray data), and soil
characteristics for selected townships in the Washington, Oregon, and Idaho show that: (1) soil radium content
provides a first-order estimate of the relative amounts of indoor radon where soils are either of low to
moderate intrinsic permeability or of permeability reduced by high moisture; (2) in drier parts of the study area
(east of the Cascade Mountains), unusually high average indoor radon levels are almost all characterized by
soils that have high effective permeabihties (greater than 20 inches per hour), based on available county soil
descriptions; and (3) in the wetter parts of the study area (west of the Cascade Mountains), townships with
unusuaUy high indoor radon levels are characterized by steeply sloped soils.
Otton, James K., and Linda C.S. Gundersen, 1988
Geologic assessments of radon potential at county scales [abs.], in Radon in the Northeast: Perspectives and
Geologic Research (conference), Troy and Albany, New York, May 31-June 2, 1988:
Northeastern Environmental Science, 7(1): 7-8
[Assessments of indoor radon potential have been made for Fairfax County, Va. (Otton and others, 1988) and
for Montgomery County, Md. (Gundersen and others, 1988) using mainly indirect data, such as aeroradiometric
surveys, geologic maps, and soil surveys, and supplementary measurements of radon in soil gas. Maps delineat-
ing areas of radon potential in five tiers or three tiers, respectively, have been published and show excellent
correspondence between rock and soil types and indoor radon data in both counties.]
Otton, James K., R. Randall Schumann, Douglass E. Owen, and Alan F. Chleborad, 1988
Geologicsd assessments of radon hazards: A Colorado case history [poster abstract], in Marikos, Mark A., and
Robert H. Hansman, eds., Geolo^c Causes of Natural Radionuchde Anomalies, Proceedings of the GEORADConference, St. Louis, Mo., April 21-22, 1987:
Rolla, Mo., Missouri Dept. Nat. Resources, Div. Geology and Land Survey Spec. Pub. No. 4, p. 167
A preliminary geologic assessment of radon hazards must often rely on ensting data to characterize those
geologic features that are likely to influence indoor radon levels indirectly. The features believed to be the
most important are the radium content and permeability of the soil and substrate (surficial materials,
weathered and unweathered bedrock) at or near the groimd surface. Because no databases exist that can
provide direct information on the distribution of these features, interpretations of geological, geochemical, and
geophysical data form the basis for assessment. These principles are illustrated in a recently compiled
preliminary assessment of radon hazards in the State of Colorado. Key databases used include the NUREaeroradiometric flight-line data (most of the State was flown at a 3-mile [5-km] flight-line spacing; several areas
were flown at a 1-mile spacing), uranium occurrence compilations (Colorado has been intensively explored for
uranium), and soil permeabiUty estimates from Soil Conservation Service mapping (less than half the State is
covered but more than 90% of the State’s population fives in the covered areas). ^Colorado has long been
known to have high natural-background radioactivity. Uranium concentrations in soils across the State
probably average just below 3 ppm, as estimated from examination of NURE ffight-fine data, so most soils
across the State are expected to have 10-20 kBq/m^ (several hundred pCi/L) of radon in the soil gas. Thus,
in virtually all areas of the State a significant percentage of homes (10-30%) are expected to have elevated
(>148 Bq/m^ or >4 pCi/L) indoor radon levels. The area considered to have the highest risk includes all the
Front Range of Colorado, fi’om Pueblo north to the Colorado-Wyoming State fine This area is imderlain by
granitic, metamorphic, volcanic, and sedimentary rocks, including several moderately (3-6 ppm uranium) to
121

highly (>6 ppm uranium) uraniferous granites and many smaller uranium occurrences and deposits. Soils over
the granites, many metamorphic rocks, and alluvium are typically highly permeable, and the rocks are, in many
areas, highly fractmed.
Otton, J.K., R.R. Schmnann, D.E. Owen, Nelson Thurman, and J.S. Duval, 1988
Map showing radon potential of rocks and soils in Fairfax Coimty, Virginia:
U.S. Geol. Survey Misc. Field Studies Map MF-2047.
[In addition to the map itself, showing subareas of the county classified according to a five-tiered scale of indoor
radon potential, the map sheet contains a detailed explanation of the criteria used and, for each of the
subareas, a probability frequency distribution of indoor data obtained by the Fairfax County Health
Department.]
Owczarski, P.C., DJ. Holford, H.D. Freeman, and G.W. Gee, 1989
Effect of soil porosity, permeability, and water content on radon flux from soil surfaces [abs.]:
Eos, Am. Geophys. Union Trans., 70(15): 500
A computer code, RN3D*, was used to study the effects of varying the water content of five homogeneous soil
types (gravel, sand, silt, clay, and loam) on the transport of radon from soil surfaces. Dry soil air
permeabilities ranged from 10'^ to 10'^ m/s. Total porosities ranged from 0.27 to 0.54. Temperature (20“C)
and radium content were assumed to be the same for all soils. Surface fluxes and concentrations were
computed for zero (steady state), steadily increasing and decreasing, and sinusoidal (e.g., diurnal) changes in
atmospheric pressure. These pressure changes drive the advective radon transport, which shows a net
enhancement for sinusoidal changes. The magnitude of this enhancement for the five soil types was studied
by varying the water content from dry to saturated. Water fills soil pores and affects the radon emanation
coefficient, air-filled porosity, soil permeability, and ultimately the effective diffusion coefficient of radon. Theeffective radon diffusion coefficient in m^/s varies between 10’^ times the soil tortuosity at dryness to 10’^ times
the soil tortuosity when water-saturated. Radon flux is affected as much by varying soil water content as it is
by varying soil type (i.e., porosity and permeability). ( RN3D is a three-dimensional finite-element code that
has been developed by DJ. Holford at New Mexico Tech and the Pacific Northwest Laboratory to simulate
the transport of radon gas within and from unsaturated soils with or without parallel, partially penetrating
cracks and other heterogeneities.)
Owen, Douglass E., 1989
Characterization of radon: Constraints of scale. Sec. O, in Duray, John R., et al^ eds.. Proceedings of the
Technical Exchange Meeting on Assessing Indoor Radon Health Risks, Grand Junction, Colo., September 18-
19, 1989:
Grand Junction, Colo., U.S. Dept. Energy, Grand Junction Projects Office, Tech. Measurements Center, Rept.
CONF-8909190, 2 p.
The size of the area to be assessed for radon determines the constraints on the techniques to be used and the
data that are applicable. Studies of large land areas (small map scales) have by their very nature much less
detail, and are therefore less constrained. At these scales many parameters can be generalized, averaged, or
interpolated. Conversely, the smaUer the land area, or the larger the map scale, the greater the constraints.
The greater detail required to adequately characterize a small area necessitates collecting data that are morespecific. As one investigates smaller areas or specific processes (even approaching the molecular level) the
number and detail of parameters that must be taken into consideration increases, and the task of assessing
radon becomes more complicated. HA radon assessment of several counties or a whole State can make used
of generalized geologic and soils maps. A radon assessment of a single home site, however, may need newdetailed geologic mapping and soils investigations. For example, Gundersen (1989 ["Anomalously high
radon..."]) has shown that localized shearing in rocks can mobilize and concentrate uranium, producing elevated
radon levels. Localization may be such that houses next to each other have order-of-magnitude differences
in their indoor radon levels. Most areas ii the country do not have detailed enough geologic mapping to
delineate such shear zones. HFor information on regional permeability. Soil Conservation Service (SCS) maps
122

are adequate. However, there is too much variability in soils to reliably use SCS soil maps to characterize the
soil at a single home site, and soil profiles and soil characteristics will need to be determined specifically for
that site. HAerial radiometric data may or may not be suitable for use in radon assessments, depending upon
the scale of the assessment. Most of the aerial radiometric surveys available for the U.S. were flown during
the National Uranium Resource Evaluation (NURE) program. The NURE surveys were generally flown at
a height of 125 m above the ground, with a spacing of 5 or 10 km between flight lines. The radius of
investigation is two times the height, yielding actual ground coverages of 10% and 6%, respectively. At a small
map scale, e.g., 1:250 000, this is probably adequate, but for large map scale studies the chance is remote that
a flight line passed directly over the site that is to be characterized. A limitation of both ground and aeried
7-ray surveys, in certain cases, is that approximately 90% of the measured 7-ray signal originates within 30 cmof the surface of the ground. Therefore, in areas where radionuclides in the soil may have been leached from
near the surface and redeposited below 30 cm, the 7-ray survey will give a low reading. The soil zone below
30 cm, however, is still within radon migration range of a home [with a basement—^ABT]. Gamma-ray surveys
also assume secular equilibrium between uranium [or radium] and its various daughters in the soil, which is
not always a valid assumption and could result in an over- or underestimate of actual near-surface uranium
content in some cases. fThe following is a list of characterization scales (after Schumann) demonstrating the
effect of scale on characterization methodology. Ideally, in order to properly characterize an area, something
must also be known about the processes involved and the geologic and soil characteristics from two steps lower
on the list. For example, in characterizing a State (1) for radon potential, information on a county scale (2)
and small-scale bedrock and SCS soil maps (3) must be used. Characterization scales: (1) Region/State; (2)
County(ies)/township(s); (3) Bedrock/soil units; (4) Single building site and (a) house construction
characteristics; (5) Macroscopic soil properties, (a) soil profiles, (b) permeability, and (c) meteorologic effects;
(6) Molecular-scale properties of soil particles and radon, (a) location of radium, and (b) radon emanation
[emanating power].
Owen, Douglass E., Sigrid Asher-Bolinder, and R. Randall Schumann, 1988
Assessment of natural phenomena producing fluctuations and variations in soil-gas radon-222 concentrations
[abs.]:
Geol. Soc. America, Abstracts with Programs, 20(7): A354Although a correlation between soil-gas radon-222 concentrations and local geologic-pedologic setting has been
identified and documented by several researchers, less is known quantitatively about the influence of climatic
and meteorological phenomena on soil-gas radon concentrations. Assuming that over a year the geology and
soil characteristics remained essentially constant, we selected and monitored a single site on the Denver
Federal Center, Colorado, near a weather station from which hourly meteorologic2d data were acquired. Thesite is little disturbed, unwatered [unirrigated], and mowed only twice a year, and thus favors the investigation
of natural phenomena. Soil moisture conditions caused by precipitation and evaporation have a profound effect
on soil-gas radon concentrations. Addition of soil moisture changes the effective gas permeability of the soil
by occupying pore space and causing the swelling of expandable clays. Moisture-saturated layers also can
produce capping effects. At the site, the larger seasonal variations in soil-gas radon concentrations are
attributed mostly to changes in the soil moisture regime. The day-to-day smaller-scale fluctuations in soil-gas
radon concentrations are attributed to changes in barometric pressure, soil and air temperature, soil moisture,
and wind. Interrelation of these factors makes it difficult to determine the magnitude and individual influence
of any one factor. Through an understanding of the geology and pedology of a site and of their interaction
with climatic and meteorologic parameters, it may become possible to make predictions about ranges of radon-
222 concentrations that can be expected during the course of a year.
Padovani, Renato, and Maria Rosa Malisan, 1993
Assessment of radon exposure in kindergartens in north-east Italy [abs.], in First International Workshop on
Indoor Radon Remedial Action, The Scientific Basis and Practical Applications, Rimini, Italy, 27 June-2 July
1993:
Commission of the European Communities et al., Book of Abstracts, p. 105
123

A regional survey of indoor radon in family dwellings, conducted in the years 1989-1990 in the Region Friuli-
Venezia Giulia (NE Italy) as part of the Italian national survey, evidenced a mean annual radon concentration
of 96 Bq/m^, with 5% of houses having values >400 Bq/m^, the CEC reference level for consideration of
remedial actions. In order to get a more complete picture of public exposure to natural radiation, the local
laboratory of the national Environmental Radioactivity Monitoring Network promoted in 1992 a radon survey
in kindergartens. One third of these schools were randomly selected and monitored, one classroom per school,
for five months by means of radon alpha-track detectors. Preliminary results, concerning more than 160
classrooms, show that radon concentrations in kindergartens are generally higher than in family dwellings of
the region, probably due to the prevailing building structure. Data on the building features and occupancy
patterns are presented and discussed. The geographical distribution of measurements is analyzed and
compared with soil characteristics of the region. Finally radon exposures for teachers and pupils are estimated.
Paschoa, A.S., M.E. Wrenn, and JA. Torrey, 1984
A mathematical model of indoor radon and daughters:
Radiation Protection Dosimetry, 7(1-4): 139-142
A mathematical model associated with computer codes is useful for predicting indoor radon and its progeny
concentrations at steady state as a function of ventilation rate, outdoor radon concentrations, and radon source
strength associated with soils and building materials (i.e., wall, soil, and double-media source).
Peake, R. Thomas, 1988
An update on EPA radon geology activities [abs.], in Radon in the Northeast: Perspectives and Geologic
Research (conference), Troy and Albany, New York, May 31-June 2, 1988:
Northeastern Environmental Science, 7(1): 8
[The U.S. Environmental Protection Agency’s radon program includes characterization of soils at sites of indoor
measurements in the State/EPA radon surveys of 1986-1987 and 1987-1988, a national radon potential map,
radon potential maps of EPA Regions 3 and 4, a reprocessing of the NURE aeroradioactivity data (by U.S.
Geological Survey), soil-gas radon and permeability measurements, and assessing the feasibility of land
evaluation criteria.]
Peake, R.T., 1988
Radon and geology in the United States:
Radiation Protection Dosimetry, 24(1/4): 173-178
Peake, R. Thomas, 1988
Radon entry effidenqr; A new look at radon entry into homes [abs.], in Radon in the Northeast: Perspectives
and Geologic Research (conference), Troy and Albany, New York, May 31-June 2, 1988:
Northeastern Environmental Science, 7(1): 8
[A radon entry efficiency (REE) parameter is proposed; REE=100{Closed-house, lowest-level, winter radon
concentration}/{Radon concentration in soil gas at 1 m depth, 3-5 m fi-om house}. Typical REEs for her
with basements are expected to be »03%-0.7%; slab-on-grade houses are expected to have lower value. :id
houses with dirt basements or on very permeable soils or rocks are expected to have higher REEs.]
Peake, R. Thomas, 1990
Preliminary identification of high radon potential areas in twenty-five States [abs.], in The 1990 International
Symposium on Radon and Radon Reduction Technology, Atlanta, Ga., 19-21 February 1990:
Preprints, Vol. HI, no. C-VI-1
A preliminary radon potential map of 25 States has been prepared showing areas of high radon potential. Thedata used to create this map include: 1) National Uraniiun Resource Evaluation (NURE) aerial radiometric
data. NURE data in glaciated and non-gladated areas have to be interpreted differently because the properties
of the surfidal material can be as important as the radium concentration. 2) State/EPA Indoor Radon Survey
data. Indoor radon data for 25 States have been analyzed by house construction by county and re^onally.
124

UBoth sets of data have been compared with geology to produce a county scale map. Areas of high radon
potential include, but are not limited to, the Upper Midwest, the Rocky Mountain region, and parts of the
Appalachian Mountains. This map will be used in EPA’s efforts to identify and characterize high radon
potential areas for school and workplace surveys, and for building code development.
Peake, R. Thomas, and L.C.S. Gundersen, 1989
An assessment of the radon potential of the U.S. Coastal Plain [abs.]:
Geol. Soc. America, Northeastern Section, Abstracts with Programs, 21(2): 58
Radon data coUected during recent indoor radon surveys and data obtained from commercial radon
measurement companies have produced indoor radon data which can be compared with geology in the U.S.
Coastal Plain. Survey data are available for Tennessee, Alabama, New Jersey, and Florida. Indoor radon data
from several radon testing companies for other Coastal Plain States are also available to the Environmental
Protection Agency. We estimate that the screening indoor radon average in the Coastal Plain is approximately
0.9 pC/L and that less than 10% of the homes will have screening radon concentrations above 148 Bq/m^
(4 pCi/L). These values may be higher in the Mid-Atlantic Coastal Plain, and slightly lower in the Southern
Coastal Plain. Even though the Coastal Plain region may have low radon potential, there are areas in the
Coastal Plain in which as many as 30% of the homes contain or may contain screening radon concentrations
greater than 148 Bq/m^ (4 pCi/L). The homes with the highest indoor radon concentrations in the Coastal
Plain are likely to be sited on phosphatic or glauconitic lithologies or on Cretaceous chalks and carbonaceous
shales. House construction can influence radon screening measurements and is a critical component of our
analysis. The concept of integrated radon potential (IRP) may be a useful method for factoring in the house
construction component.
Pe2ike, R. Thomas, Linda C.S. Gundersen, R. Randall Schumann, Julie James, and Melinda Ronca-Battista, 1991
Determination of radon-geologic provinces in the United States, in The 1990 International Symposium on Radon
and Radon Reduction Technology, Atlanta, Ga., 19-23 February 1990:
Research Triangle Park, N.C., U.S. Environmental Protection Agency Rept. EPA600/9-91-026c, Proceedings,
Vol. 3: Symposium Poster Papers, Paper No. C-VI-1, p. 6-1—6-12 [NTIS Order No. PB91-234468/AS]
A preliminary ”radon-geologic province" map for the United States was prepared using indoor radon data from
the 25 States surveyed with the assistance of EPA and available geologic data for the United States. This mapwiU be used as a starting point for future assessment of high radon potential areas in the United States.
Sixteen radon-geologic provinces have been identified and evaluated. The provinces with the highest radon
potential in the country include the Northeast, Appalachian Mountains, northern and central Great Plains,and
Colorado Plateau, but all provinces have the potential to generate indoor radon levels >148 Bq/m^ (M pCi/L).
This is a preliminary map, should be viewed as draft, and is subject to change. [See Gundersen et al., 1991,
Preliminary radon potential map of the United States.]
Peake, R.T., L.C.S. Gundersen, and C.R. Wiggs, 1988
The Coastal Plain of the eastern and southern United States—^An area of low radon potential [abs.]:
Geol. Soc. America, Abstracts with Programs, 20(7): A337Six important parameters: geology, radon in soil gas, indoor radon, equivalent uranium, permeability, and housing
construction all indicate that the Coastal Plain from New Jersey to Texas is an area of low radon potential.
In general, the data suggest that the Inner Coastal Plain (mainly Cretaceous and Tertiary sediments) is slightly
higher in radon potential than the Outer Coastal Plain (Eocene sediments). Grab samples of radon in soil gas
measured at 1-m depth averaged between 26-37 kBq/m^ (700-1000 pCi/L). Data from the joint
State/Environmental Protection Agency Indoor Radon Surveys (winter 1986-1987) show a median
concentration for the Alabama Coastal Plain of 22 to 26 (average 33) Bq/m^ or 0.6 to 0.7 (average 0.9) pCi/L.
Other data sets for New Jersey, Tennessee, and Florida are similar. In Tennessee, the geometric mean (GM)for indoor radon is 30 (average 4) Bq/m^ or 0.8 (average 1) pCi/L. The New Jersey Outer Coastal Plain has
a GM for indoor radon of 44 (average 67) Bq/m^ or 1.2 (average 1.8) pCi/L and the Inner Coastal Plain has
a GM for indoor radon of 52 (average 93) or 1.4 (average 25) pCi/L. The GM for indoor radon in Florida
125

is 44 Bq/m^ (12 pCi/L). Aeroradiometric data from the National Uranium Resource Evaluation Program
show that equivalent uranium signatures for most of the Eocene sediments are typically 1.5 ppm. Hi^ervalues are found in Tertiary phosphorites (varying between 1 and 8 ppm) and Cretaceous chalk units (averaging
3 ppm). Soils overlying Cretaceous chalks yield radon concentrations up to 185 kBq/m^ (5000 pCi/L), but
their permeability is low. [Water] permeability of the Coastal Plain as a whole is in the 0.6-to-2 inches/hour
range (considered moderate). A final and vital factor in the understanding of radon potential is the commonconstruction practice of slab-on-grade buildings in the Coastal Plain. The absence of a basement significantly
reduces the amount of radon that may enter a home and may be one of the most important factors to consider
in radon potential assessments.
Peake, R. Thomas, and Susan M. Rush, 1988
An initial identification of areas with a potential for high indoor radon levels [poster abs.], in Marikos, Mark A.,
and Robert H. Hansman, eds.. Geologic Causes of Natural Radionuclide Anomalies, Proceedings of the
GEORAD Conference, St. Lx)uis, Mo., April 21-22, 1987;
RoUa, Mo., Missoiu-i Dept. Nat. Resources, Div. Geology and Land Survey Spec. Pub. No. 4, p. 173
To help assess the distribution of areas in the United States that might have elevated indoor radon levels, the
Environmental Protection Agency (EPA) has prepared national maps delineating areas that appear to have
the greatest potential to cause indoor radon problems. These maps are based on uranium concentrations in
rock or soil in Ueu of actual data on indoor radon levels, which are available for only certain areas of the
country. fSwedish researchers have shown rough correlations of indoor radon concentrations with the uranium
content of soils and rock around Swedish houses. In the United States, it appears that extremely elevated
indoor radon levels are also associated with elevated uranium concentrations in the rock and soil near affected
houses; therefore, a map based on rock and soil uranium content might approximate those areas that may have
radon problems. Such a map would not be conclusive, however, because other factors such as soil permeability
and building characteristics also influence radon concentrations in structures. In general, the rock types most
likely to contain above-average concentrations of uranium, and which may suggest potential radon problems,
include some granitic rocks, black shales, phosphatic rocks, and some sedimentary rocks adjacent to or derived
froc niferous source rocks. The EPA’s composite map includes most of these rock types; it also includes
uran . ^.-resource information from the National Uranium Resource Evaluation (NURE) database and adapted
to be more applicable to indoor radon concerns. The EPA maps, however, cannot be used as the sole source
for predicting elevated radon levels. Instead, it is necessary to use the information from these maps in
conjunction with data on other factors (e.g., soil type, soil permeability, and housing characteristics) to predict
local radon levels. Furthermore, the predictions on these maps have not yet been confirmed by actual
measurements. The EPA plans to continue to develop and refine the maps as additional information becomes
available.
Peake, R. Thomas, and R. Randall Schumann, 1991
Re^onal radon characterizations, in Gundersen, Linda C.S., and Richard B. Wanty, eds.. Field studies of radon
in rocks, soils, and water:
U.S. Geol. Survey Bulletin no. 1971, p. 163-175
Indoor radon is a potential health threat in a significant number of homes across the United States. Twenty-one
percent of the homes tested in the 1986-87 Environmental Protection Agency/State Indoor Radon Survey of
10 States contained screening indoor radon levels greater than the Environmental Protection Agency's
recommended action level of 4 picocuries per liter. However, the distribution of indoor radon screening levels,
and, therefore, the potential health risk, is not uniform everywhere. These differences are related to geolog^^
and house construction. Characterizations of radon potential can be made by use of geologic, soil, and
radiometric data. National Uranium Resource Evaluation equivalent uranium concentrations of 2.0 parts per
million or greater indicate areas that have the potential to produce a substantial number of elevated indoor
radon levels. Equivalent uranium concentrations less than 1 part per million may indicate low radon potential.
Soil permeability greater than 6.0 inches per hour may increase the radon potential of an area, except in cases
where soil radium concentrations are very low.
126

Pearson, John E., and Gary E. Jones, 1976
Emanation of radon-222 from soils and its use as a tracer:
Jour. Geophys. Research, 70(20): 5279-5290
The temporal, geophysical, and geographical parzimeters related to the emanation of Rn-222 at the
earth-atmosphere interface have been studied. Such information is necessary in the evaluation of boundary
conditions for an investigation of the vertical diffusivity of the atmosphere if natural Rn-222 is to be used as
a tracer. A system for collecting Rn-222 emanating at the smface of the earth with a minimum of disturbance
to the site has been developed. It includes a stainless-steel collector, open on the bottom where it is in contact
with the soil; a pump; water and carbon dioxide traps; and chilled traps in which the radon is adsorbed on
activated coconut charcoal. Sampling patterns in east-central Illinois were selected using a randomized
complete block design to permit statistical analysis of emanation data with respect to location, soil type,
meteorological conditions, and other parameters. Although no statistically significant variation of Rn-222
emanation with location or soil type was found, a variation with wind speed, gustiness, and soil moisture was
observed. Criteria for the selection of locations suitable for vertical diffusivity studies using Rn-222 as a
naturally occurring tracer should include, ide2illy, uniform emanation for tens of kilometers in edl directions,
substantially level topography, and uniform vegetative cover. The location chosen for these studies meets these
criteria.
Pearson, John E., Donald H. Rimbey, and Gary E. Jones, 1965
A soil-gas emanation measurement system used for radon-222:
Jour. Appl. Meteorology, 4(3): 349-356
["Emanation" in this paper refers to the exhalation of ^Rn from the earth to the atmosphere. The system
comprised a separate motor-alternator, a separate collector (a metal box 2.5 cm high, presenting a rectangular
opening « 30.5x7.6 cm, pressed to the ground surface with a seal of caulking material), and a portable box
containing the remaining pump, traps, and a flow meter. Air was pumped through a closed loop from the
collector through water and CO2absorbers; through the pump, controUed by a bypass valve; through tandem
water traps cooled by solid CO2shavings; through a valve that routed flow to one of two charcoal traps at solid
CO2 temperature; through a flow meter; and thence back to the collector. One of the charcoal traps was used
to trap radon until equilibrium was established in the system; the air streeun was diverted to the other, "sample"
trap during the sampling period (usually 300 s) only. A series of experiments showed that the exhalation rate
was directly proportional to the speed of the air stream through the collector in the range «0.8 to 8 m/s. At
the average height of the collector, 1.25 cm, the normal range of wind speed at the study locality was only 0.03
to 0.08 m/s, and the mean exhalation rate at 0.045 m/s was 7 times greater than that obtained by extrapolation
of the linear relation found by experiment. The mean of 216 measurements of exhalation rate from 9 sites on
agricultural soils in Champaign County, Illinois, was 52± 27 mBq/m^. Measurements at the same site in
Socorro, New Mexico, as reported by >\^ening and Hand (1960), were in good agreement at «38 mBq/m^.The mean of 8 measurements made on 26 August 1963 exceeded the mean of 8 measurements made at the
same site on 21 November by a factor of nearly 3. During a 24-hour period measurements were made at 15-
min intervals on a 3x12 m grass-covered plot of well-drained loess (wind-deposited soil) 1 m deep on glacial
till. Soil porosity, air void fraction, and moisture; wind speed and direction; air temperature and humidity;
cloudiness; and barometric pressure were noted hourly. Exhalation was most stable and averaged lowest
during the night hours.]
PEI Associates, Inc., and Rogers and Associates Engineering Corporation, 1986
Draft project report. Comparison of existing measurement methods for radon in soil gas:
Cincinnati, Ohio, PEI Associates, Inc., and Salt Lake City, Utah, Rogers and Associates Engineering Corp., 58 p.
Phillips, Jeffrey L., Jane Bergsten, and S.B. White, 1991
A cumulative examination of the State/EPA Radon Survey, in The 1991 International Symposium on Radon and
Radon Reduction Technology, Philadelphia, Pa., 2-5 April 1991:
Preprints, unnumbered, 17 p.
127

Podsednik, Mary L., 1991
Geologic assessment of radon-222 in McLennan County, Texas, in The 1991 International Symposium on Radon
and Radon Reduction Technology, Philadelphia, Pa., April 2-5, 1991, Proc., Volume 4, Symposium Poster
Papers, Technical Sessions 6 through 10:
U.S. Environmental Protection Agency Rept. EPA/600/9-91/037D, p. P9-45—^P9-58
McLean, Va., Cohen (S.) and Associates, Inc. [Springfield, Va., NTIS Order No. PB92-115385]
[Preprints, v. 5, no. DQ*-4]
Geologic parameters controlling the distribution and transport of radon were evaluated in McLennan County,
Texas. Laboratory analysis of selected rock samples identified phosphate zones in the Austin formation and
shales and bentonites in the Lake Waco formation as probable source rocks. Geophysical logging techniques
utilizing gamma-ray logs were supplemental in identifying the Lake Waco formation as a source rock based
on relative radioactivity among selected geologic formations. Emanation of radon fi-om representative soil
types was evaluated by using large area activated charcoal canisters. The Houston and Houston Black Clay
soils had the greatest radon flux concentrations potentially resulting from increased surface area and more
efficient transport of radon through desiccation cracks typical of these soils. Analysis of groundwater indicated
that radon concentrations were greatest in the Austin formation, particularly when samples were collected after
rainfall events. Radon concentrations were shown to be greatly increased in wells located near stream
discharge points,owing to a flushing of the aquifer flow system, including the unsaturated zone, during periods
of infiltration. Elevated indoor radon concentrations were found to be most commonly associated with homesoverlying the Austin formation, which has been identified as a source rock and is characterized by high shrink-
swell sods, abimdant faulting and fracturing, and foundation failure caused by the high shrink-swell soils. These
characteristics allow for the production of radon and efficient transport from the subsurface to the indoor
environment.
Poffijn, A., G. Eggermont, S. HaUez, and P. Cohilis, 1993
Radon in Belgium: Mapping and mitigation in the affected area of Vis6 [abs.], in First International Workshopon Indoor Radon Remedial Action, The Scientific Basis and Practical Applications, Rimini, Italy, 27 June-2
July 1993:
Commission of the European Communities et al.y Book of Abstracts, p. 31
The massif of Vis6 is well known by geologists for its special geological features, in particular the great
abundance (N>30) of important uranium anomalies. The measuring campaigns conducted over the last years
in several hundred houses resulted in a detailed radon map with clear indication of risk areas. Based upon
the available information some 160 houses (2% of the building stock) are expected to have real radon problems
(>400 Bq/m^). Up to now 24 of these problem houses have been localized. Three of the most contaminated
houses (>3000 Bq/m^ in the living areas) have been studied in detail for mitigation purposes. In two of them
a subfloor ventilation has been installed. In this way the original high levels were reduced by more than a
factor of ten.
Porstendorfer, J., 1987
Indoor radon exposure in the Federal Republic of Germany, in Indoor Radon II, Proceedings of the Second
APCA International Specialty Conference, Cherry Hill, New Jersey, April 6-10, 1987:
Pittsburgh, Pa., Air Pollution Control Association Pub. SP-60, p. 57-67
[The nationwide survey of indoor radon in the Federal Republic of Germany comprised 20,000 measurements
in 6,000 houses, and yielded a log-normal distribution with an arithmetic mean of » 14 Bq/m^, a median
(geometric mean) of »40 Bq/m^ and geometric standard deviation of 1.8. Significantly higher mean radon
concentrations of 57 and 46 Bq/m^ were associated with The Rheinland-Pfalz area and in Bavaria, respectively,
and were attributed mainly to their geological characteristics.]
Raes, F., A. Poffijn, and G. Eggermont, 1988
The feasibility of using expert systems to cope with the complexity and extent of the indoor radon problem:
Radiation Protection Dosimetry, 24(1/4): 167-172
128

[Radon potential methods based on maps are of too coarse a scale for indoor radon prediction at a single site.
An alternative method for site characterization is proposed, based on a systematic interview with inhabitants
of existing houses. The questions posed in the interview are designed to lead to an assessment of critical
factors such as the mean indoor-outdoor temperature difference, quality of the foundation, water-table depth,
air exchange rate, soil permeability, and underpressure due to mechanical ventilation.]
Ranger, L. Scott, 1993
Geologic control of radon in the greater Atlanta re^on, Georgia, in The 1993 International Radon Conference,
Denver, Colo., Sept. 20-22, 1993:
Denver, Colo., Am. Assoc. Radon Scientists and Technologists, Rocky Mountain Chapter, Preprints,
p. IVP 2—IVP 11
1,908 indoor radon screening tests are plotted by geologic formation. Each is presented with average, range and
house construction type. For the region, 7.6% of homes measure 148 Bq/m^ (4.0 pCi/L) or greater with an
average of 63 Bq/m^ (1.7 pCi/L) for all construction types and 81 Bq/m^ (2.2 pCi/L) for basement houses.
The range is 0-940 Bq/m^ (0.0-25.4) pCi/L. Radon levels are lowest in the Upper Coastal Plain
unconsolidated sands and the Piedmont metamorphic rock of basic (mafic) chemistry. Highest levels are found
in acidic rock as granites, schists, and mylonites, particularly in areas of ductile shearing. This paper presents
radon measurements in the most meaningful manner, by geologic formation. Radon does not recognize zip
codes and political boundaries, yet many decisions use these criteria. Geologic precision allows for a greater
understanding of radon potentia. This paper illuminates the possibility for more accurate potential maps based
upon geology.
Rector, Harry E., 1991
Soil gas measurement technologies, in The 1991 International Symposium on Radon and Radon Reduction
Technology, Philadelphia, Pa., April 2-5, 1991, Proc., Volume 1, Symposium Oral Papers, Opening Session and
Technical Sessions 1 through 5:
U.S. Environmental Protection Agency Rept. EPA/600/9-91/037A, p. 3-13—3-28
McLean, Va., Cohen (S.) and Associates, Inc. [Springfield, Va., NTIS Order No. PB92-115351]
[Preprints, v. 2, no. III-3]
A wide range of methods for characterizing the radon potential of land areas has evolved over the last decade
through research programs in the U.SA. and abroad. Ideally, the methods should provide information on
radon production in the soil, diffusivity, and permeability. This can be accomplished through various
combinations of direct measurements and theoretical assumptions. Basic technologies concentrate on meas-
uring: (1) radon in soil gas, (2) radon flux from the surface, or (3) radium content of the soil. Approaches
may also include attendant measures of soil characteristics and other factors to support predefined indexes of
radon potential. Basic measurement approaches for radon potential are reviewed in terms of the following
technical issues: measurement parameters, field/laboratory methods, quality assurance, and model concepts
applied to data to estimate radon potential. Theoretical aspects of these factors are also considered. Radium-
based measurements, for example, have the distinct advantage of being suited to testing water-saturated soils,
but may take weeks to deliver results. Soil gas and flux measurements, on the other hand, generally fail to
obtain samples from saturated soils because the gas volume is nearly zero, but approaches exist to deliver
prompt results on site. If time is important, recognition factors to avoid generally saturated conditions are
necessary to ensure sample validity.
Reesman, AX., 1988
Geomorphic and geochemical enhancement of radon emission in middle Tennessee, in Meuikos, Mark A., and
Robert H. Hansman, eds., Geolo^c Causes of Natural Radionuclide Anomalies, Proceedings of the GEORADConference, St. Louis, Mo., April 21-22, 1987:
Rolla, Mo., Missouri Dept. Nat. Resources, Div. Geology and Land Survey Spec. Pub. No. 4, p. 119-130
A special stratigraphic sequence, involving the uraniiun-rich [30-40 ppm] Chattanooga shale and underlying
phosphatic limestones..., combined with a sloping topography...provides a physical setting for subsequent
129

chemical mobUization, reprecipitation, and enrichment of uranium and its alpha-emitting daughters as
secondary phosphates, near the base of a relatively thin cover of residuum-colluvium. Secondary enrichment
of uraniferous phosphate would occur on the surface of pre-existing grains. Subsequent daughter recoil from
alpha decay would likely deposit the daughter near the surface and favor enrichment of the mineral siufaces
with the daughter also, as both thorium-230 and radium-226 are compatible with phosphate minerals. Thus,
radium-226 should become relatively enriched on mineral surfaces, and thereby increase the probability that
its daughter, radon, will be emitted into the soil atmosphere. Although the Chattanooga shale contains higher
concentrations of uranium than the phosphatic limestones, its asphaltic organic matter seals in the radon to
produce a relatively closed system. During weathering, oxidation of pyrite in the shale produces acidic
leachates that can dissolve UO2and o»dize it to uranyl complexes, which can precipitate on residual phosphate
grains accumulated form weathering of the underlying phosphatic limestones. Thus, uranium dissolved from
either the Chattanooga or residual phosphate during weathering can be enriched downslope in the residuum.
Mass movement aids downslope transport and tends to bring the uranium-enriched material toward the surface
for renewed weathering. If uranium and its daughters, thorium[-230] and radium, follow phosphate through
the weathering cycle, processes that enrich the phosphatic residuum to commercial-grade phosphate deposits
would also enrich uranium and its daughters, thereby increasing the potential for radon emission. In cities
where homes are confined to small lots, hilly topography favored foundations with piers that later evolved to
partial basements when coal-fired, central heating developed. These older style homes should be especially
vulnerable to radon capture.
Refiner, G.M., 1988
An integrated approach to assess potential radon content of soils using geologic, gamma-ray and soil-gas data
[abs.]:
Geol. Soc. America, Abstracts with Programs, 20(7): A354Various singular techniques of evaluating the radon potential of geographic areas have been used but data from
field studies suggest that an integrated approach may give more reliable estimates. Many techniques are
indirect in that they do not actually measure the in-situ radon concentration. For example, knowledge of
geolo^c lithologies provides estimates of the uranium concentration; spectral gamma-ray measurements
typically analyze for Bi-214, a daughter of radon-222, in the upper portion of the surface. Even direct
measmement of soil-gas radon has limitations because of diurnal, seasonal, and permeability effects. Gamma-ray and geologic data may be known for many areas, although their integration may be hampered by having
different scales or degrees of resolution, but it is very unlikely that a soil-gas radon data base exists. Field
studies must include the collection and analysis of soil-gas radon at a scale determined to be compatible with
the overall resolution required. Results from Frederick County, Maryland show how data from different scales
are combined and interpreted. Soil development in some areas created low uranium or radium concentrations
in the upper soil horizon giving a lower gamma-ray reading than would be anticipated for the known lithology.
Radon concentrations in regions that are structurally complex can be higher than fi'om similar but undisturbed
lithology. Interpretation of the combined data provides the most accurate estimates of radon potential and
compares well with known indoor radon concentrations.
Refiner, G.M., 1988
Radon soil-gas survey in Prince Georges County, Maryland:
U.S. Geol. Survey Open-file Rept. 88-52, 10 p.
Soil-gas samples collected along a traverse in Prince Georges County, Maryland were analyzed for radon. Thetraverse included principal lithologies and areas for which aeroradiometric measurements showed various
intensities. Although, in the past, this region in the Coastal Plain province had not been considered to possess
the type of geologic setting or aeroradiometric signature that would contribute to significant indoor
accumulations of radon, the measured soil-gas concentrations of up to 93 kBq/m^ (2500 pCi/L) indicate that
the potential exists for indoor accumulations in excess of the 148-Bq/m^ (4 pCi/L) [action] level established
by the U.S. Environmental Protection Agency. The higher levels of soil-gas radon were found in some of the
Tertiary sediments with the lower concentrations in the Cretaceous and Quaternary sediments. Geologic
130

relationships are thought to be the controlling factors for the radon soil-gas concentrations. Although very few
indoor radon data are available for Prince Georges County, they, too, indicate levels exceeding the 148-Bq/m^
(4-pCi/L) guideline in areas underlain by some Tertiary formations but less for the Cretaceous and Quaternary
formations.
Reimer, G.M., 1990
Reconnaissance techniques for determining soil-gas radon concentrations: An example from Prince Georges
County, Maryland:
Geophys. Research Letters, 17(6): 809-812
Preliminary field measurements of soil-gas radon (Rn) concentrations can provide an intitial assessment of the
Rn potential in any location and aid in designing a larger or more detailed sampling program. Radon
reconnaissance requires some special considerations because a large area must be covered in a short period
of time and analyses must be made soon after collection because of Rn decay. A simple approach to coUection
and field ansdysis consists of a small-diameter probe pounded into the ground to a depth of at least 0.75 m.
Analysis is by an alpha scintillometer. Soil-gas samples collected along a traverse in Prince Georges County,
Maryland, demonstrate the utihty of the technique. Although this region in the Coastal Plain province might
be considered to possess the type of geologic setting that would not contribute to significant Rn potential, the
reconnaissance sampling reveled Rn soil-gas concentrations of up to 93 kBq/m^ (2500 pCi/L), indicating that
the potential exists for indoor accumulations in excess of 148 Bq/m^ (4 pCi/L).
Reimer, G.M., 1991
Derivation of radon migration rates in the surficial environment by use of helium injection experiments, in
Gundersen, Linda C.S., and Richard B. Wanty, eds.. Field studies of radon in rocks, soils, and water:
U.S. Geol. Survey Bulletin no. 1971, p. 33-38
Helium injection into the subsurface provides a means of determining the rate of radon migration in a particular
area. The passage of a concentration front is monitored at outlying stations, and an effective diffusion
coefficient can be determined. From experiments in a portion of the Reading Prong near Boyertown, Pa., it
is possible to explain the observations with a model in which diffusion is the primary transport mechanism, and
convective mass transport is influential. This technique permits determination of both horizontal and vertical
migration components. The rate of migration is highly variable from area to area, but measurements can set
realistic limits on models being developed for assessing the potential for radon accumulation in dwellings.
Reimer, G.M., 1991
Simple techniques for soil-gas and water sampling for radon analysis, in Gundersen, Linda C.S., and Richard B.
Wanty, eds.. Field studies of radon in rocks, soils, and water:
U.S. Geol. Survey Bulletin no. 1971, p. 19-22
Various devices and techniques are available for sampling soil air and ground water for analysis of their gas
content. A simple approach to coUection is presented here and can be useful as a screening technique for
radon when analyses are desired at the field location. For soil-gas samples, a smaU-diameter probe is pounded
into the ground to a depth of at least 0.75 meter. For water, a plastic bottle containing the sample is shaken
so headspace air purges the gases from the water. Once the gas samples are extracted from the soil or water,
they can be analyzed with whatever field technique is desired.
Reimer, G.M., 1992
Methodology for rapid assessment of the radon potential of soils:
Jour. Radioanalyt. Nuclear Chemistry, Articles, 161(2): 377-387
A technique using a smaU-diameter probe and a portable alpha-particle sdntiUometer for sample coUection and
analysis has been developed. It is fast, efficient, cost effective, and can be modified to accommodate a wide
spectrum of sampling conditions. When soU-gas sampling for radon is combined with geophysical gamma-raymeasurements, pedological characteristics of surficial materials, and geologic knowlec^e of bedrock, the
combination forms a powerful technological basis for estimating radon potential of soils. The method can help
131

provide information on a short time frame so that local governments, land developers, and builders can take
appropriate measures when planning new construction.
Reimer, G.M., J.M. Been, and S.L. Szarzi, 1989
Technique for rapid field assessment of radon soil-gas concentrations, in Osborne, M.C., and Jed Harrison,
Symposium Cochairmen, The 1988 Symposium on Radon and Radon Reduction Technology, Proc., Vol. 2,
Symposium Poster Papers:
Research Triangle Park, N.C., Radian Corp., U.S. Environmental Protection Agency Pub. EPA/600/9- 89/006b
[Springfield, Va., NTIS Order No. PB89-167498], p. 3-51-3-54.
Reimer, G.M., and L.C.S. Gundersen, 1989
A direct correlation among indoor Rn, soil gas Rn and geology in the Reading Prong near Boyertown,
Pennsylvania:
Health Physics, 57(1): 155-160
Reimer, G.M., Linda C.S. Gundersen, S.L. Szarzi, and J.M. Been, 1991
Reconnaissance approach to using geology and soil-gas radon concentrations for making rapid and preliminary
estimates of indoor radon potential, in Gundersen, Linda C.S., and Richard B. Wanty, eds.. Field studies of
radon in rocks, soils, and water:
U.S. Geol. Survey Bulletin no. 1971, p. 177-181
Soil-gas samples collected along a traverse in Prince Georges County, Md., were analyzed for radon. The
traverse included principal lithologies and areas for which total count aeroradiometric measurements showed
various intensities. Although this region in the Atlantic Coastal Plain might be considered to possess the type
of geologic setting or aeroradiometric signature that would not contribute to significant radon potential, the
measured soil-gas concentrations of up to 2,500 picocuries per liter indicate that the potential exists for indoor
accumulations in excess of the level of 4 picocuries per liter established by the Environmental Protection
Agency for remedial action. The higher levels of soU-gas radon were found in some of the Tertiary sediments,
and lower concentrations occurred in Cretaceous and Quaternary sediments. Geologic relationships are
thought to be the controlling factors for the radon soil-gas concentrations. The few data available from this
siuvey suggest that a reconnaissance approach can be an effective screening method in the evaluation of areas
for high radon potential.
Revzan, K.L., A.V. Nero, and R.G. Sextro, 1988
Mapping surfidal radium content as a partial indicator of radon concentrations in US houses:
Radiation Protection Dosimetry, 24(1/4): 174-184
Ritchie, Ingrid, and Deanna English, 1987
A residential radon study: Marion County, Indiana, in Indoor Radon II, Proceedings of the Second APCAInternational Specialty Conference, Cherry HiU, New Jersey, April 6-10, 1987:
Pittsburgh, Peu, Air Pollution Control Association Pub. SP-60, p. 139-145
[Analysis of 3-month a-track measurements of indoor radon in living areas of 118 houses in Marion County,
Indiana, indicated that the type of soil beneath a house and the type of foundation were the important deter-
minants of indoor levels. The soils beneath the houses with the lower indoor radon concentrations were
characterized generally as well drained, and conversely.]
Rizzuto, Joseph E., 1988
New York State Energy Research and Development Authority radon program [abs.], in Radon in the Northeast:
Perspectives and Geolo^c Research (conference), Troy and Albany, New York, May 31-June 2, 1988:
Northeastern Environmental Science, 7(1): 9
132

[Correlations were sought between indoor radon measurements made in the program and surfici2d and bedrock
geology, including soil-gas radon concentrations and soil permeability to gas flow. See papers by BJ. Kothari
or C.O. Kimz for results.]
Robayna, B., J[ose] H[eman]dez-Armas, V. Soler, J.C. Carracedo, and A[ndre] Poffijn, 1991
Preliminary measurements of indoor radon in Canary Islands [abs.j, in International Symposium on the Natural
Radiation Environment, 5th, Salzburg, Austria, 22-28 September 1991, Abstracts:
Salzburg, Univ. Salzburg, Inst, for General Biology, Biochemistry and Biophysics, abs. no. 164
In two islands of the Canary Islands, 58 dwellings were selected as random sampling points for measuring indoor
^^Rn concentrations. Measurements in dwellings were all made with charcoal canisters foUowing [U.S.] EPA’s
methodology. In addition, track-etch detectors were installed in 16 houses for a period of 3 months. Arepresentative set of building materials used in these island, as well as some soil samples, were analyzed for
their gamma activity with a high-purity Ge detector. The influence on the radon concentrations due to
ventilation, altitude above sea level, meteorological parameters, geological substrate, and the building materials
used were all analyzed. In all well-ventilated houses, the radon concentration values obtained by charcoal
canisters were lower than 200 Bq/m^. In dwellings not well ventilated, the values were systematically higher
than 200 Bq/m^. For all track-etch measurements the results were lower than 200 Bq/m^, even for not-well-
ventilated houses. The discrepancy between short-term and integrated measurements will be analyzed in detail.
No clear relation was found between the other factors considered and the ^^Rn concentration.
Roessler, C.E., R. Morato, D.L. Smith, and J. Wherett, 1991
Characteristics of Florida fill materials and soils. Florida Radon Research Program technical report:
Gainesville, Fla., Univ. Florida, 22 p.
This report transmits the results of laboratory work by the University of Florida in support of the Foundation
Fill Data Base project of the Foundation Fill Materials Specifications Task Area of the Florida Radon
Research Program (FRRP). Work included determination of radon concentrations in soil gas samples and
physical and radiological characterization of soil/fill samples to provide data for further use in modeling radon
production, transport, and entry. fThis work adds to the 35-site, 54-sample data base developed in an earlier
study by the University of Florida under the State University Board of Regents Radon Research Program.
The earlier study emphasized materials being used as fill at construction sites; only one-third of the samples
were native surficial soil at construction or existing house sites. The study being reported here emphasized
sites as prepared for construction. TThe field work was performed by another contractor. This included
selection of field sites, performance of in-situ permeability, penetrometer, and density measurements, and
deployment and retrieval of alpha-track soil gas radon detectors. The collaborating contractor also collected
soil gas and soil samples for laboratory analysis at the University of Florida. HThe program involved 23
sampling sites. Two sites were selected in each of 11 regions designated to represent population centers
covering a range of geographic, topographic, and geological features in Florida. Also included was a
Brooksville school construction site being studied in another FRRP project, fSoil gas sampling at two or three
stations per site, with collection at two depths at selected stations and duplicate sampling of a sub-set,
generated over 90 sod gas samples for laboratory analysis for radon. Soil gas radon concentrations ranged
from «0.1 to >370 kBq/m^ (a few pCi/L to over 10,000 pCi/L). The data were not submitted to statistical
analysis; however, some observations can be made by inspection: (1) The two primary stations at a site
generally had comparable levels. (2) In sampling 6 weeks later at a third station at 13 of the sites, about half
the levels were noticeably different from those observed earlier at the primary stations. Since the two types
of station were not sampled at the same visit, it is not possible to determine whether this is a time effect of
a spatial effect. (3) In limited multi-depth sampling at 11 stations, concentrations generally increased with
depth over the range of 030 to 0.75 m when the concentrations were greater than 3.7 kBq/m^ (100 pCi/L).
^Collection at a single depth at two sampling stations at each site generated 46 soil samples. All the regional
soil samples were sand or sandy materials with loamy sand and clayey sand the most prevalent. In contrast,
the Brookville school site samples were clay. Most of the sandy samples had moisture contents [dry weight
basis] in the range of 2-10%; the clay samples had moisture contents of about 30-40%. Laboratory
133

permeability measurements are reported for four combinations of compaction and moisture for each sample.
Particle-size data are reported for the 46 samples. fRadium-226 concentrations were less than 37 Bq/kg
(1 pCi/g) in most samples and 74 Bq/kg (2 pCi/g) or less in 87%. Exceptions included the Brookville clay
samples and the samples from one Tallahassee site which had concentrations of « 74-148 Bq/kg (2-4 pCi/g).
The highest concentrations, 410-480 Bq/kg (11-13 pCi/g), were found in what appeared to be fill material at
the Bartow site. The fact that soil gas radon concentrations at some of the <37 Bq/kg (<1 pCi/g) sites
approached or exceeded 37 kBq/m^ (1000 pCi/L) suggests a radon source at greater depth than that from
which the soil sample was taken, fResults of emanation coefficient measurements ranged from a few percent
to about 40%. Most of these samples had low radium concentrations; hence the associated emanation
coefficient determinations have a high degree of uncertainty. [Executive summary]
Rogers, V.C., and Nielson, K.K,, 1989
Radon emanation and transport in porous media, in Osborne, M.C., and Jed Harrison, Symposium Cochairmen,
The 1988 Symposium on Radon and Radon Reduction Technology, Proc., Vol. 1, Symposium Oral Papers:
Research Triangle Park, N.C., Radian Corp., U.S. Environmental Protection Agency Pub. EPA/600/9-89/006a
[Springfield, Va., NTIS Order No. PB89-167480], p. 545-5-58.
A unified model of radon emanation and transport has been developed that combines the RAECOM model for
diffiisive transport with new mathematical models of advective transport, moisture effects, and radon
emanation. The model accounts for advective depletion in radon source regions, and for the effects of varying
moistures on radon emanation, diffusion, and advective transport rates. Radon transport in gas- and
water-filled pore space is characterized, and exchange between the phases is considered. Correlations are also
given for diffusion and permeability coefficients. The model provides a comprehensive assessment of source
potentials for indoor radon accumulation based on soil moistures, radium, emanation [coefficient], and
advection of soil gas.
Rogers, V.C., and K.K. Nielson, 1991
Benchmark and application of the RAETRAD model, in The 1990 International Symposium on Radon and
Radon Reduction Technology, Atlanta, Ga., 19-23 February 1990:
Research Triangle Park, N.C., U.S. Environmental Protection Agency Rept. EPA600/9-91-026b, Proceedings,
Vol. 2: Symposium Oral Papers, Paper No. VI-1, p. 6-1—6-10 [NTIS Order No. PB91-234450/AS]
Field measurements were used to benchmark a simple new predictive correlation between soil gas permeability
and soil grain size, moisture, and porosity. The correlation was incorporated with a previous diffusion
correlation into the new RAETRAD code, that calculates radon generation and two-dimensional transport in
soils, and radon entry into structures. RAETRAD generalizes the one-dimensional RAETRAN model,
combining advective and diffusive radon transport with radon emanation, decay, absorption, and adsorption.
RAETRAD calculations suggest 0.03% radon entry efficiency for slab-on-grade homes on low-permeability
soils (< 10"^^ m^), increasing to 0.1% for sandy soils. Soil or fiU properties in the first few feet dominate radon
entry efficiency and limiting radium concentrations for prescribed indoor radon levels. For indoor radon
concentrations of 74 Bq/m (2 pCi/L), sandy soils may contain only 74-110 Bq/kg (2-3 pCi/g) radium
compared with 370-740 Bq/kg (10-20 pCi/g) for more clayey soils.
Rogers, V.C., and K.K. Nielson, 1991
Correlations for predicting air permeabilities and ^Rn diffusion coefficients of soils:
Health Physics, 61(2): 225-230
Rogers, Vem C., and K.K. Nielson, 1991
Correlation of Florida soil-gas permeabilities with grain size, moisture, and porosity:
Salt Lake City, Utah, Rogers & Associates Engineering Corp., Rept. EPA-600/8-91-039, 43 p. [Springfield, Va.,
NTIS]
This report augments existing soil gas permeability data using Florida soils, to produce a predictive correlation
that is valid for Florida soils. The work was performed in connection with the broader Florida Department
134

of Community Affairs (DCA) effort to define radon-protective standards for sub-slab fill materials. It also has
applications in EPA and other agency efforts to assess radon potentials of soils and correlate indoor radon
concentrations with source strengths. While it is preferred to have several in-situ measmements of soil gas
permeability for the range of environmental conditions encountered, they are not usually available for many
locations. The predictive correlation for soil gas permeability should be advantageous in making long-range
average estimates that remove transient effects of moisture variations. They also will quantify the
permeabilities of generic soil types for modeling and applications in which measurements are impractical.
UMost previous studies of soil gas permeability have dealt with agricultural applications in the plant root zone,
and thus tended to address near-surface tilled soils with low densities and large macropores. Permeabilities
increase rapidly with soil air porosity and with macroporosity resulting from plowing. Air permeabilities also
decrease with the moulding water content in laboratory tests, suggesting that the anisotropy of soil grains
causes anisotropy in the gas permeability of compacted soil. Predictive correlations for soil-gas permeability:
Predictions of soil gas permeability for estimating radon availability usually consider soils that are undisturbed
or have been recompacted. The correlation proposed originally by Rogers and Nielson was based entirely on
theoretical calculations from a random pore-combination model that considered tubular pores. The
calculations used a pore-combination approach and modeled individual pore permeabilities by a simple function
proportional to the cross-sectional area of each tubular pore fraction. A simpler correlation was developed
later by the authors from empirical fits of field-measured soil gas permeabilities to several measured
fundamental soil properties. The parameters correlating most strongly with measured gas permeabilities were
the soil porosity and moisture saturation fraction, and the mass weighted arithmetic mean diameter of the soil
grains. The resultant weighting of grain diameters toward larger sizes is consistent with previous studies that
found air permeability to be dominated by the large pore mode, and by the generally better application of
previous models and correlations to large-grained sandy soils than to clays. Florida data collection and
analysis: The main Florida data coUection effort consisted of field soil-gas permeability measurements and
in-situ density sampling using procedures identical to those used in the earlier Utah measurements. The
measurements and sampling included measurements at 16 locations throughout Florida. The measurements
were made on open land areas that appeared undisturbed, at least throughout the past growing season.
Primary measurements generally were at the 61-cm depth unless non-uniform strata or shallow water tables
were noted. In these cases, shallower depths were utilized to obtain uniform samples that were completely
above any water table. Thirty-seven field permeabilities were measured, and soil samples were obtained and
analyzed for each field measurement location. A quality control check was made on the permeability
measurements for the Florida Radon Project using the MK-II permeameters. The RAE permeameter was
calibrated immediately prior to the test. Then aU three of the permeameters were compared at three locations
in Gainesville, Florida, and were found to give statistically equivalent results at two of the three locations. A21% relative standard deviation was observed at the third location. Permeabilities at the three locations ranged
from 2x10'^® to 2x10’^^ m^, and the average reproducibility of the MK-II permeameters was 11% relative
standard deviation. Soil gas permeability correlation: The soil parameters were used in trial correlations with
measured soil gas permeabilities. The general form of the correlation used terms of the moisture satmation
fi'action, the arithmetic mean grain size, and the total soil porosity. Since arithmetic mean grain sizes are
strongly weighted toward the large particles, the possibility was investigated for computing arithmetic meangrain sizes solely from the coarse grain size fractions resulting from sieve analyses. Less than 5% error
occurred in the sieve-only mean diameters for soils containing more than 50% passing the #200 sieve.
Furthermore, the errors were less than 10% for soils containing up to nearly 70% < #200 mesh, and less than
15% for soils containing up to 90% < #200 mesh. Based on these comparisons, a simple mechanical sieve
analysis provides an adequate basis for estimating the arithmetic mean grain diameter for use in the soil gas
permeability correlation. The proposed correlation for predicting soil gas permeability is thus defined as: k
= lO"^ (p/110)^ exp(-12 m^), where k=soil gas permeability (m^); p= total soil porosity (dimensionless);
d= arithmetic mean grain diameter (cm), excluding >#4 mesh material; and m= moisture saturation fraction
(dimensionless). Comparisons with the 37 Florida soil gas permeability measurements have a geometric
standard deviation (GSD) of 1.27, and a geometric mean bias (GMB) of 1.00. The Utah comparisons have
a GSD of 1.52 and a GMB of 0.95. Even though the correlation is applicable to a wide range of soils and soil
135
conditions, it should not be used indiscriminately imtil additional data are obtained for validation. The overall
comparison of all 37 Florida and 67 Utah soil gas permeabilities has a GSD of 1.44, and GMB of 0.97. This
indicates that the correlation predicts 68% of the measured values within approximately 44%, or 95% of the
measured values within an approximate factor of 1.44^, or 2.07. The bias term indicates that the correlation
is about 3% low, a negligible increment compared with the precision of its estimates. [This report includes
a comprehensive literature review with approximately 65 references on soil permeability.]
Rogers, V.C., and KK Nielson, 1991
Multiphase radon generation and transport in porous materials:
Health Physics, 60(6): 807-815
Rogers, Vem C., and Kirk K. Nielson, 1992
Data and models for radon transport through concrete, in The 1992 International Symposium on Radon and
Radon Reduction Technology, Minneapolis, Minnesota, September 22-25, 1992:
U.S. Environmental Protection Agency, Preprints, v. 2, no. VI-3, 15 p.
Radon generation and transport through Florida residential concretes are examined for their contribution to
indoor radon concentrations. Radium concentrations in the 11 concretes tested are all <93 Bq/kg
(<2.5 pCi/g), and radon emanation coefficients are all <0.08. Measurements on the constituents of four of
the concretes reveal that when the radium concentrations are >37 Bq/kg (>1 pCi/g), it is generally due to
elevated radium in the aggregate, but may occasionally occur from radium in the cement. Because the
aggregates tested generally have very low emanation coefficients, elevated radium in the aggregate has a lesser
impact on indoor radon than elevated radium in the cement component. Diffusion coefficients for Florida
concretes generally range from 10 m /s to a few times 10' m /s, but air permeability coefficients are
generally less than 10'^ m^. Thus advection through a concrete slab in negligible compared to diffiision.
FinaUy, simple correlations are presented for diffiision and permeability coefficients and for radon generation
in concrete and entry into dwellings.
Rogers, V.C., K.K. Nielson, and D.R. Kalkwarf, 1984
Radon attenuation handbook for uranium miU tailings cover design:
Salt Lake City, Utah, Rogers and Associates Engineering Corporation, U.S. Nuclear Regulatory Commission
Rept. NUREG/CR-3533, 85 p.
Rose, A.W., 1988
Control of radon in soil gases by pedologic and geologic factors [abs.], in Radon in the Northeast: Perspectives
and Geologic Research (conference), Troy and Albany, New York, May 31-June 2, 1988:
Northeastern Environmental Science, 7(1): 9
Rose, Arthur W., Edward J. Ciolkosz, John W. Washington, 1991
Effects A regional and seasonal variations in soil moisture and temperature on soil gas radon, in The 1990
Inteix^ational Symposium on Radon and Radon Reduction Technology, Atlanta, Ga., 19-23 February 1990:
Research Triangle Park, N.C., U.S. Environmental Protection Agency Rept. EPA600/9-91-026c, Proceedings,
Vol. 3: Symposium Poster Papers, Paper No. C-VI-5, p. 6-49—6-60 [NTIS Order No. PB91-234468/AS]
Radon in houses depends partly on Rn concentration in soil gas, which is affected by water in a variety of ways.
In this paper, temperature-dependent effects ofRn partitioning between changing proportions of air and water
in pore space are shown to be capable of causing variations in Rn concentration up to 5-fold. A map of
regional soil moisture and temperature regimes, in combination with the moisture/temperature effects on Rn,
suggests that soil-gas Rn will be most elevated by moisture effects in eastern U.S. and other regions with the
Udic soil moisture regime. Large seasonal differences are also predicted for soils of the Udic moisture regime,
with soils of the Frigid temperature regime having higher Rn in summer than winter. Aridic (dry) soils shownegligible effects. Clay-rich soils will generally be most strongly affected by moisture variations.
136

Rose, Arthur W., Adam R. Hutter, and John W. Washington, 1990
Sampling variability of radon in soil gases, in Kesler, S.E., ed.. Soil and Rock Gas Geochemistry.
Jour. Geochem. Eiqiloration, 38: 173-191
Little information is available on the long-term reproducibility of radon in soil gases, or on the vertical
distribution of radon concentrations in soil gas. For five sites in central Pennsylvania, the radon activity in soil
gas at depths exceeding about 70 cm varies by factors of 3 to 10 during the year, and shows even larger
variability at sh2dlow depths. At depths greater than about 70 cm, values are lower in winter than in summer,
apparently because radon is retained in the soil in some form other than the air phase, perhaps in soil moisture
or sorbed on solids, as a result of increased moisture or decreased temperature during winter. The low radon
values in winter are observed at depths below the frozen surface zone, so they do not result directly from
freezing. Values at depths shallower than about 70 cm at one site studied in detail appear to average slightly
higher in winter than in summer, but with erratic highs and lows defining a 3-fold annual range. At two other
sites, the shallow vjdues show patterns similar to the deep values with highs in summer. Vertical profiles show
reversal and other features differing from previous models for simple diffusive transport. Sampling during the
summer period at depths greater than 75 cm shows the best reproducibility for these soils. Several sets of
soil-gas measurements along a traverse crossing a fracture trace indicate that elevated radon values tend to
occur over the fracture zone, but anomalies also occur outside the fracture trace, and show appreciable
variability with time and precise location. The literature indicates that 3- to 10-fold seasonal variations are
common. Most other studies show high radon in winter or in wet or frozen soils, attributed to capping by
saturated or frozen soil, but clay-rich soils in Sweden have their highest radon in summer and fall. Soils that
crack in dry weather can have low radon because of dilution by the atmosphere. These phenomena must be
considered in comparing surveys performed during different seasons and interpreting surveys of soils with
laterally differing texture or moisture content.
Rose, Arthur W., MacKenzie L. Keith, and Norman H. Suhr, 1976
Geochemical drainage surveys for uranium: Sampling and analytical methods based on trial surveys in
Pennsylvania:
University Park, Pa., Pennsylvania State Univ., Dept. Geosciences, U.S. E.R.DA. Rept. GJO-1645-1
Geochemical surveys near sandstone-type uranium prospects in northeastern and north-central Pennsylvania show
that the deposits can be detected by carefully planned stream sediment surveys, but not by stream water
surveys. Stream waters at single sites changed in U content by x 10-50 during the 18 months of our studies,
and even near known prospects, contain <0.2 ppb U most of the time. Uranium extractable from stream
sediment by acetic acid-H202 provides useful contrast between mineralized and non-mineralized drainages of
a square mile or less; total U in sediment does not. High organic material results in increased U content of
sediments and must be corrected. Changes in U content of sediment with time reach a maximum of x 3 and
appear to be of short duration. A sediment survey of about 200 mi^ near Jim Thorpe detects anomalies
extending over several square miles near known occurrences and a second anomaly about two miles northeast
of Penn Haven Junction. A similar survey in Lycoming-Sullivan Counties shows anomalous zones near knownprospects of the Beaver Lake area and northwest of Muncy Creek. As, Mn, Pb, and V are enriched in the
mineralized zones, and perhaps in surrounding halo zones, but do not appear to be pathfinder elements useful
for reconnaissance exploration.
Rose, Arthur W., and Lisa A. Komer, 1979
Radon in natural waters as a guide to uranium deposits in Pennsylvania, in Watterson, John R., and Theobald,
Paul K., eds. Geochemical Exploration 1978, International Geochemical Exploration Symposium, 7th, Golden,
Colo., April 17-19, 1978, Proc.:
Rexdale, Ont., Canada, Assoc. Exploration Geochemists: 65-76
The content of Rn in stream and ground waters of 2 areas of U mineralization in Pennsylvania has been
measured to test its use as a reconnaissance exploration technique. In addition, the causes for variations in
the Rn contents of natural waters have been evaluated. A physical model shows that the Rn content of ground
waters increases with increasing U content of the host aquifer and with the proportion of Rn atoms which
137
emanate from the solid phases into the pore water. Rn also increases with decreasing porosity, and with
increasing time spent in the aquifer, up to a few weeks. Background values as well as anomalies are affected
by these factors. An extension of the model indicates that Rn normally reflects the concentration of U. Manysamples in areas of U mineralization are anomalously high in Rn. Some of these waters are also high in U.
The Jim Thorpe area, where the best U prospects occur, is indicated by strong Rn anomalies but no Uanomalies. Rn measurement of ground water is a valuable addition to U measurement as a reconnaissance
exploration method.
Rose, Arthur W., and John W. Washington, 1989
Controls of seasonal variability in Rn content of soil gas [abs.]:
Geol. Soc. America, Northeastern Section, Abstracts with Programs, 21(2): 63
Measurements of soil gas radon over a one-year period at five sites in central Pennsylvania show a large seasonal
variation. The radon (^^Rn) concentrations reach values of 56 to 150 kBq/m^ (1500 to 4000 pCi/L) in
summer at depths of a meter or more. Winter values are only 1/3 to 1/10 of the summertime high values.
The seasonal decrease is most pronounced in deep soils (greater than 1 meter). In summer the depth profiles
approximate a diffusional-type pattern, but during other periods of the year the depth profiles are irregular,
often showing peaks in the middle part of the profile. Thoron (^^^^) shows patterns over time similar to
^Rn. Depth profiles of thoron are not clearly diffusionally controlled at any time of the year. Presumably
the muting of the diffusion pattern for thoron is related to its short half-life. The radon variability both with
time and depth correlates with soil moisture as determined by resistance blocks, tensiometers, neutron moisture
gauge, and visual observation. In summer the soils are usually dry due to high evapotranspiration; in late faU
the soils are relatively wet because of low evaporation and perhaps increased precipitation. The exact
relationship between the low winter radon values and high moisture is not clem*, but appears to involve
inhibited diffusion through water-filled pores or adsorption-Uke effects. Several other researchers have
reported similar seasonal effects in humid-region soils, but in semi-arid regions, high radon is reported in
winter or early spring, apparently during periods of high moisture. Evidently several processes cause seasonal
variability in soil-gas radon values.
Rose, Arthur W., John W. Washi^on, and Daniel J. Greeman, 1988
Variability of radon with depth and season in a central Pennsylvania soil developed on limestone:
Northeastern Environmental Science, 7(1): 35-39.
The concentrations of ^Rn and ^^^^Rn have been measured with depth and time in a soil profile developed on
limestone in central Pennsylvania, using both instantaneous measurements with a Lucas-cell type of radon
detector and time-averaged measurements with alpha track detectors. Profiles of^Rn during summer grossly
fit patterns expected for diffusion toward the surface, with values below 1 m leveling off at 74-111 kBq/m?(2000-3000 pCi/L. These relatively high values are probably re^nsible for the high values reported in houses
built on residual limestone-dolomite soil Concentration of rises to a sharp peak of 31 to 52 kBq/m^(850-1400 pCi/L) at 30 to 60 cm, decreasing to 4.1 to 16 kBq/m^ (110-430 pCi/L) at depth, suggesting higher
emanation coefficients at shallow depth than in deeper soil or translocation of an ancestor isotope in the
shallow soil. Values of ^Rn decrease markedly during winter to only 10 to 20% of values in summer and
early fall, for reasons that are presently unclear. An understanding of this effect may have important bearing
on radon values in houses.
Ros6n, Bengt, 1985
Utveckling av apparat f5r matning av radone^dialation [Development of apparatus for measurement of radon
exhalation]:
Linkoping, Sweden, Statens geotekniska institut [Swedish Geotechnical Institute] Rept. SGI Varia 154, 20 p.
Rosen, R., 1957
Note on some observations of radon and thoron exhalation from the ground:
New Zealand Jour. ScL Technology, sec. 5, 38(6): 644-654
138

Geophys. Abs. 170-269
Measurements of radon exhalation from the ground have been made by a modified induction method, in which
the decay of products on the collector wire is recorded by a gauze cylindrical ion chamber situated around the
wire. Measurements from June to August 1955 (at a site in Wellington, New Zealand) showed an average
exhalation rate of approximately 0.2 aCi/cm^-s. During periods of decreasing atmospheric pressure, there was
usually a slight increase in the exhalation rate. There was a marked decrease during rainfall. The results also
indicated a diurnal variation in the exhalation rate. The radon thoron ratio was foimd to be about 1.5.
Roserens, G.-A., 1993
Radon program in Switzerland—Remedial actions [abs.], in First International Workshop on Indoor Radon
Remedial Action, The Scientific Basis and Practical Applications, Rimini, Italy, 27 June-2 July 1993:
Commission of the European Communities et al., Book of Abstracts, p. 23
The results of the five-year radon research program RAPROS allow for scientifically valid statements on the
origin of elevated levels of indoor radon in Switzerland. These results for a basis for recommendations and
for actions to be taken. Indoor radon concentrations have been measured in more than 4000 living rooms and
2000 basements, a sampling density of about 0.2% of the Swiss housing stock. According to these
measurements radon leads to an estimated average annueil effective dose of 2 mSv, although in some regions
the annual dose may be much higher. Extrapolation of the existing data shows that in about 10,000 Swiss
houses radon may exceed 1000 Bq/m^. For these houses remedial actions are recommended. High indoor
radon concentrations in Switzerland are due to the soil beneath the buildings. Data from the study indicated
that the most important soil characteristic influencing indoor radon concentrations was its gas permeability.
Because natural ventilation in a heated house creates a slight underpressure in the lower levels with respect
to surroimding soils, radon is driven into the building. Weatherization of the houses to reduce energy
consumption had in most cases no effect on the indoor radon concentrations. Radon from tap water or fi-om
building materials does not contribute significantly to indoor radon levels in Switzerland. Several houses of
different types now have been modified to reduce radon levels. The most successful mitigation technique
combined forced-air ventilation with tightening of the basement to decrease or prevent air infiltration from the
soil. The poster shows the most interesting cases of the successful remedial actions.
Ross, B.C., M.R. Atkinson, and D.W. Dixon, 1993
Regional variations in occupational exposure to radon and the resulting regulatory enforcement procedures [abs.],
in First International Workshop on Indoor Radon Remedial Action, The Scientific Basis and Practical
Applications, Rimini, Italy, 27 June-2 July 1993:
Commission of the European Communities et al, Book of Abstracts, p. 103
Measurements in over 3000 workplaces throughout Great Britain show that radon concentrations in about 10%of the premises exceed the action level at which the Ionising Radiations Regulations 1985 apply. Most of the
measurements and high results are in Cornwall and Devon where 20% or more of the premises in some areas
of these counties exceed the action level. High results have also been obtained in other counties, particularly
Northhamptonshire, Somerset, and Derbyshire. The data for workplaces are supplemented by the results of
measurements in about 100,000 homes suitably transposed to indicate the likely impact of the Regulations
where workplace data are scarce. Results are presented in tables and maps for areas where the potential for
high radon levels in workplaces has been identified. The HSE [Health and Safety Executive] has written to
all registered employers in the worst affected areas informing them of the legal position and providing them
with a leaflet and other publicly available advice on radon measurement and control. The employers whobelieve that their premises are not likely to be affected or who have already undertaken tests have been asked
to return a completed proforma to the HSE. A follow up letter is sent to others asking for a progress report.
Visits to selected premises are undertaken for enforcement purposes.
Sachs, Harvey M., 1986
139

Notes on sources of radon in houses, in Radon and the Home Environment, Saturday Symposium, New Jersey
Chapter, Health Physics Society and Delaware Valley Society for Radiation Safety, Princeton, NJ., March 22,
1986:
Unpublished outline, 2 p. + 18 figs.
Until about 1980, most workers assumed that building materials, potable water supplies, and other "endogenous
sources" were responsible for most radon in houses. Since then, on-site work in Canada and Sweden and
mapping in Sweden and the USA has shown that most situations of large numbers of houses with high radon
concentrations are correlated with specific geological formations. This finding is consistent with the log-normal
distribution of radon in houses at scales from local to international. Although there is speculation about source
rocks, at this time prudent research protocols assume that distribution studies should control for geology, but
that a priori expectations are premature. However, interpretative mapping is likely to identify, on an hoc
basis, those geological units strongly associated with anomalous frequencies of high radon concentrations. fOn-
site work by many investigators has consistently shown that conventional housing construction techniques offer
many routes for radon entry, and that some conditions strongly couple houses to their substrates. These
include strong pressure gra^ents between soil gas and cellars, large cracks, sumps, and porous foundation
walls. This knowledge is the basis for experiments in cost-effective mitigation.
Sachs, Harvey M., 1987:
Where is all the radon from?, in Radon and the Environment, Conference Proceedings, Mahwah, NJ., May 8-10,
1986, Makofske, William J., and Michael R. Edelstein, eds.:
Mahwah, NJ., Ramapo College of New Jersey, Inst, for Environmental Studies, p. 21-27
Sachs, H.M., T.L. Hernandez, and J.W. Ring, 1982
Regional geology and radon variability in buildings:
Environment Intemat., 8(1-6): 97-103
Radon concentrations in dwellings vary by more than two orders of magnitude. Predicting where and whenconcentrations are Ukely to be high requires studying the variability of the contributors to radon in buildings.
Among common sources, geological factors (water supply and substrate) are the most variable, whereas
building materials are much less variable. Ventilation variation among houses is generally responsible for
radon variations comparable to those introduced by building materials, but it is more significant at lower
ventilation rates. In some regions with relatively high proportions of houses with elevated radon
concentrations, mappable geological factors are associated with most cases of high radon concentrations.
However, a priori identification of rock types likely to be implicated is likely to be successful in only a few
cases.
Samuelson, Alan C., David Ober, Thad Godish, David Govaer, and Alice Bennett, 1988
Air and water radon investigations in east-central Indiana [abs.]:
Geol. Soc. America, Abstracts with Programs, 20(7): A338The Radon Working Group at Ball State University [Munde, Indiana] has initiated a study of radon levels in
both air and groundwater in homes in east-central Indiana. The air data are collected for two-day periods in
charcoal canisters placed in the center of the lower floor in private homes. The data are correlated with
outside temperatures, house construction characteristics, and soil types on which the home is founded with the
latter producing the most striking correlation. All of the highest radon levels (over 120 Bq/m^ or 3.25 pCi/L)
are in homes founded on a subsoil consisting of glacial sand and gravels of high porosity, and including gravels
of Precambrian granite pebbles. The water data are coUected from groundwater weUs and measured by
scintillation techniques. The data su’e correlated with values for other elements, geographic location, well
depth, and aquifer type with the latter two factors producing the most positive correlation. To data, most of
the higher radon levels (> 11 kBq/m^ or >300 pCi/L) are found in groundwaters coming from wells that are
>24 m deep that are in Silurian carbonates. Wells that are drawing fi-om the glacial sand and gravels typically
have lower radon levels.
140

Sanchez, David C., Richard Dixon, and Ashley D. Williamson, 1991
The Florida Radon Research Program: Systematic development of a basis for statewide standards, in The 1990
International Symposium on Radon and Radon Reduction Technology, Atlanta, Ga., 19-23 February 1990:
Research Triangle Park, N.C., U.S. Environmental Protection Agency Rept. EPA600/9-91-026c, Proceedings,
Vol. 3: Symposium Poster Papers, Paper No. A-I-3, p. 1-21—1-37 [NTIS Order No. PB91-234468/AS]
[In support of legislation requiring the use of radon-resistant building techniques for new construction in high-
risk areas, a research program was authorized. Research needs identified included measurement zmd
development of predictive techniques for sub-barrier radon concentrations based on soil characteristics,
determination of the volume of soil or fill effectively contributing radon at the sub-barrier interface, definition
of the extremes of environmental conditions affecting radon availability, 2md related information.]
Scarpitta, S.C., 1990
Measuring the exhalation of Rn-222 from soil in a closed system using activated charcoal [abs. WPM-A6], in
Health Physics Society Ann. Mtg., 35th:
Health Physics, 58(Suppl. 1): S32
A method is described which uses 5 g of activated charcoal to directly measure the Rn exhalation rate from a
50 g soil sample in a sealed metal canister. The method, which combines the accumulation technique with the
activated charcoal adsorption technique, minimizes back-diffusion of Rn into the soil gas. Calibration against
conventional techniques is not required. Exheded Rn is collected by a removable charcoal cartridge which is
positioned on the inner Ud of the canister. The charcoal can be directly gamma counted following exposure
or extracted into a toluene based liquid scintillation cocktail. Desorptive losses associated with canister leakage
and transferring are less than 5%. fStudies using a dry sieved soil, spiked with ^Ra, demonstrated that a
single exposure will yield a free Rn exhalation rate to within 10% of the true value if the sampling time is less
than the half-life of Rn. A minimum sampling time of 48 h, followed by a 1-2 h gamma coimt, is required in
order to determine the Rn exhalation rate fi'om a dry sieved New Jersey topsoil containing 35 Bq/kg ^^^a.
Multiple measurements over a 48-120 h period are required to determine the exhalation rate constant of
diffusible Rn from the soil gas. HThe liquid scintillation counting (LSC) technique increases counting sensitivity
by two orders of magnitude over gamma counting. A lower limit of detection at the 95% confidence level of
5.6 mBq (0.15 pCi) is obtainable with a 30-min count using the LSC technique.
Schery, S.D., DJI. Gaeddert, and MJI. Wilkening, 1984
Factors affecting exhalation of radon from a graveUy sandy loam:
Jour. Geophys. Research, 89(D5): 7299-7309.
Measurements of radon exhalation from a gravelly sandy loam have been made in a semi-arid climate by using
a combination of closed accumulation, flow-through accumulation, and ^Rn and ^^^b soil profiles. Themeteorological factors that most affected the instantaneous value of exhalation of ^^Rn were atmospheric
pressure and rain. Effects due to other parameters such as wind or temperature were either comparatively
small or undetectable. No evidence was seen for migration of radon from distant (> >10 m) sources or for
an effect on exhalation due to limited nearby seismic activity. Measurements for ^^^^Rn indicated its exhalation
was also sensitive to pressure variation but to a lesser extent than for ^Rn. While instantaneous exhalation
of Rn could easily vary by a factor of 2 or more, time-averaged exhalation was found to be close to that
expected for pure diffusion. There is thus some indication that the time-averaged effect of cyclic environmental
variables is small for this soil. Comparison with transport equations indicates that it is difficult to explain the
observed variation in surface flux density solely in terms of the radon concentration gradient in the top few
decimeters of soil. A contribution to transport from direct flow, perhaps through inhomogeneities such as
cracks or channels, is one possible explanation.
Schultz, Art [Arthur P.], and Stephen D. Brower, 1991
Geologic and environmental implications of high radon soil-gas concentrations in carbonate rocks of the
Appalachian Great Valley, West Virginia
Geol. Soc. America, Abstracts with Programs, 23(1): 125
141

Radon soil-gas and ground radioactivity surveys across a portion of the Great Valley of West Virginia indicate
that residuum and soils above some carbonate rocks have levels of radon soU-gas that exceed 148 kBq/m^
(4,000 pCi/L). Data indicate no correlation of anomalously high radon soil-gas concentrations with faults,
cleavage, joints, or veins. Instead, radon anomalies are apparently related to thick, red, clay-rich residuum that
may contain as much as 4 times the concentration of radium, 10 times the concentration of uranium, and 5
times the concentration of thorium as the underlying bedrock. The highest radon soil-gas concentrations are
found in soils and residuum overlying argillaceous, cherty, silty, and sandy limestone and dolomite in the
Elbrook and Conococheague Formations and in the Beekmantown Group. Within our sample population,
uranium appears depleted and in disequilibrium with radium-226 in both bedrock and residuum. Uranium also
is somewhat depleted from the upper layers of the residuum with respect to deeper layers. Our study has
shown that existing geologic and radiometric data, soil surveys, and thickness of residuum data combined with
field radon soil-gas data can be used to outline areas of potential indoor radon hazards.
Schultz, Arthur P., and Calvin Wiggs, 1989
Geol. Soc. America, Northeastern Section, Abstracts with Programs, 21(2): 65
Preliminary results of a radon study across the Great Valley of West Virginia [abs.]:
As part of the U.S. Geolo^cal Survey’s radon program, a study of the distribution of radon in areas underlain
by folded, faulted, and cleaved limestones, dolomites, and shales of the Great Valley of West Virginia was
undertaken. Radon soil-gas measurements and scintillometer measurements of soil and bedrock were madeon a 20-km traverse approximately perpendicular to regional strike. Radon values generally vary with changes
in rock type. Soil-gas values on the traverse are 19 to 56 kBq/m^ (500 to 1,500 pCi/L) for soils above the
Cambrian through Middle Ordovician Tomstown dolomite, the Waynesboro Formation, the lower and middle
parts of the Elbrook Formation, the Conococheague Formation, the Beekmantown Group and Middle
Ordovician limestones and dolomites; 56 to 104 kBq/m^ (1500 to 2800 pCi/L) for soils above the upper part
of the Cambrian Elbrook Formation and the Middle Ordovician Martinsburg Formation; and 104 to
150 kBq/m^ (2800 to 4000 pCi/L) for soils above a limited stratigraphic interval in the lower part of the
Cambrian Conococheague Formation. In areas underlain by limestone and dolomite, where soil-gas values
are high, scintillometer readings on outcropping bedrock were generaUy low. The high soil-gas readings mayindicate concentration of uranium minerals during carbonate solution of adjacent bedrock and soil-forming
processes. Outcrop scintillometer readings for shaly and sandy carbonate rocks were generally higher than
those for adjacent limestones and dolomites. Except for high spot anomalies, the variation in soil-gas values
is similar to the variation in aeroracfioactivity values. Generally low radon soil-gas values were found above
mapped faults. In one case, an area of high soil-gas values appears to be related to a zone of impermeable
clay within a thick terra rossa developed on limestones.
Schultz, Art [Arthur P.], Calvin R. Wiggs, and Stephen D. Brower, 1992
Geolo^c mid environmental implications of high sod-gas radon concentrations in the Great Valley, Jefferson and
Berkeley counties. West Virginia, in Gates, Alexander E., and Linda C.S. Gundersen, eds., Geologic Controls
on Radon:
Boulder, Colo., Geological Soc. America Special Paper 271, p. 29-44
Soil-gas radon and ground radioactivity surveys across a portion of the Great Valley of West Virginia indicate
that residuum and soils formed above some carbonate rocks have sufficient levels of radon gas to cause high
indoor radon values. Data indicate no correlation of soil-gas radon concentration with faults, cleavage, joints,
or calcite veins. Instead, soil-gas radon distribution appears to be controlled by the solution of carbonate
bedrock and the subsequent development of thick, red, clay-rich residuum, which may contain as much as 4
times the concentration of radium, 10 times the concentration of uranium,and 5 times the concentration of
thorium as the underlying bedrock. Such residuum and associated soil develops over some parts of the
Elbrook, Conocochea^e, and Beekmantown Forr"'tions, and can have concentrations of radon in soil gas
exceeding 150 kBq/m^ (4,000 pCi/L). In area the Great Valley underlain by siltstone, fine-grained
sandstone, and shale of the Martinsburg Fc aon, soil-gas radon values can exceed 150 kBq/m^
(4,000 pCi/L). In these areas, bedrock alone appears to have sufficient thorium, radium, and uranium
142

concentrations to generate the soil-gas radon measured. Previous work by others and our own preliminary
evaluations indicate that soil-gas radon levels are high enough to cause indoor air in homes to exceed
148 Bq/m^ (4 pCi/L), the U.S. Environmental Protection Agency’s (EPA) action level for radon.
Aeroradiometric maps and National Uranium Resource Evaluation (NURE) Program data do indicate
anomalously high radioactivity in some areas where radon soil-gas concentrations were high. These data, used
with available geologic maps, soil maps, and maps showing thickness of residuum, are useful in predicting areas
of radon soil-gas hazards.
Schumann, R. Randall, 1992
Radon potential of the glaciated upper Midwest: Geologic and climatic controls on spatial variation, in The 1992
International Symposium on Radon and Radon Reduction Technology, Minneapolis, Minnesota, September
22-25, 1992:
U.S. Environmental Protection Agency, Preprints, v. 3, no. VIII-3 [abs.], and separate paper, 17 p.
Many areas of the United States underlain by soils derived from continental glacial deposits generate elevated
indoor radon levels (>148 Bq/m^ or M pCi/L). For example, Iowa (71%), North Dakota (63%), and
Minnesota (46%) have some of the highest percentages of homes with elevated indoor radon levels in the
State/EPA Indoor Radon Survey. Determining the radon potential of glaciated areas is complicated by several
problems: 1) surface radioactivity is generally uncharacteristic^llly low in glaciated areas and does not appear
to correlate well with indoor radon values; 2) because glaciers redistribute the bedrock they override and
entrain, the composition and physical properties of till soils do not necessarily reflect those of the underlying
bedrock (transport distances were much farther for the continental glaciers of the Great Plains and Great
Lakes re^ons than for glaciers in New England or for valley glaciers, however); and 3) where glacial cover is
thin, the radon potential may be a complex product of the glacial cover and the underlying bedrock. Crushing
and grinding of rocks by glaciers increases the mobility of uranium and radium in the resulting tills, allowing
them to move readily downward through the soil profile with other mobile ions as the soils are leached.
Clay-rich tills in North and South Dakota and Iowa generate significant numbers of elevated radon levels,
whereas sandy tills in Michigan typically have low to moderate radon levels. Some of the highest indoor radon
levels in North and South Dakota are associated with deposits of glacial Lake Agassiz and other
gladolacustrine deposits. In contrast, glacial lake deposits in Wisconsin, Michigan, Illinois, and Indiana are
typically associated with low radon levels. Differences in source-rock composition, permeability, and soil
moisture conditions of the gladally-derived soils are likely responsible for these dissimilarities.
Schumann, R. Randall, ed., 1993a
Geologic radon potential of EPA Region 1, Connecticut, Maine, Massachusetts, New Hampshire, Rhode Island,
and Vermont:
U.S. Geol. Survey Open-file Rept. 93-292-A, ii -i- 245 p.
[This is one of 11 reports that assess the indoor radon potential of the states on the basis of geologic,
aeroradiometric, soil characteristics, available indoor radon data, and dominant building construction type. Theassessments were done by various U.S. Geological Survey geologists, in consultation with state geological
surveys and other sources, and reviewed by state geological and health agendes and the U.S. Environmental
Protection Agency. Boundaries of the assessed areas were adjusted from those dictated by the above factors
to those dictated by political divisions (counties and states), so that each county is ranked as of high, moderate,
or low radon potential according to the dominant ranking among the several differently assessed units within
the county. The rankings indicate, qualitatively, the expectation that a significant, moderate, or small fraction
of houses within a ranked area will contain indoor radon concentrations above certain levels; thus, "high" means
a significant fraction 148 Bq/m^ (>4 pCi/L), "moderate" means a significant fraction 74 Bq/m^ (>2 pCi/L),
and low implies few houses >74 Bq/m^ (>2 pCi/L). There is no implication in the rankings of the likelihood
of very high indoor radon concentrations. These reports are not intended to be used as a substitute for indoor
radon testing, and they cannot and should not be used to estimate or predict the indoor radon concentrations
of individual homes, building sites, or housing tracts. Each report contains introductory material, including
appendices for the geologic time scale, a glossary of terms, and lists of EPA Regional Offices, State radon
143

contacts, and State geological surveys. The reports contain discussions of geological, soils, climatological, and
radiometric data, indoor radon summaries, and references for the individual States covered.]
Schumann, R. Randall, ed., 1993b
Geologic radon potential of EPA Region 2, New Jersey and New York:
U.S. Geol. Survey Open-file Rept. 93-292-B, ii + 131 p.
[See above description.]
Schumann, R. Randall, ed., 1993c
Geologic radon potential of EPA Region 3, Delaware, Maryland, Pennsylvania, Virginia, and West Virginia:
U.S. Geol. Survey Open-file Rept. 93-292-C, ii + 206 p.
[See above description.]
Schiunann, R. Randall, ed., 1993d
Geologic radon potential of EPA Region 4, Alabama, Florida, Georgia, Kentucky, Mississippi, North Carolina,
South Carolina, and Tennessee:
U.S. Geol. Survey Open-file Rept. 93-292-D, ii + 274 p.
[See above description.]
Schumann, R. RandaU, ed., 1993e
Geologic radon potential of EPA Region 5, Illinois, Indiana, Michigan, Minnesota, Ohio, and Wisconsin:
U.S. Geol. Survey Open-file Rept. 93-292-E, ii + 194 p.
[See above description.]
Schiunann, R. Randall, ed., 1993f
Geologic radon potential of EPA Region 6, Arkansas, Louisiana, New Mexico, Oklahoma, and Texas:
U.S. Geol. Survey Open-file Rept. 93-292-F, ii + 160 p.
[See above description.]
Schumann, R. Randall, ed., 1993g
Geologic radon potential of EPA Region 7, Iowa, Kansas, Missouri, and Nebraska:
U.S. Geol. Survey Open-file Rept. 93-292-G, ii + 147 p.
[See above description.]
Schumann, R. RandaU, ed., 1993h
Geologic radon potential of EPA Region 8, Colorado, Montana, North Dakota, South Dakota, Utah, and
Wyoming:
U.S. Geol. Survey Open-file Rept. 93-292-H, ii + 184 p.
[See above description.]
Schumann, R. Randall, ed., 1993i
Geologic radon potential of EPA Re^on 9, Arizona, California, Hawaii, and Nevada:
U.S. Geol. Survey Open-file Rept. 93-292-1, ii + 142 p.
[See above description.]
Schumann, R. Randall, ed., 1993j
Geologic radon potential of EPA Region 10, Alaska, Idaho, Oregon, and Washington:
U.S. Geol. Survey Open-file Rept. 93-292-J, ii + 146 p.
[See above description.]
Schumann, R. Randall, 1993k
144

The radon emanation coefficient: An important tool for geologic radon potential estimations, in The 1993
International Radon Conference, Denver, Colo., Sept. 20-22, 1993:
Denver, Colo., Am. Assoc. Radon Scientists and Technologists, Rocky Mountain Chapter, Preprints,
p. IV 40—rV 47
The fraction of radon atoms generated from radium decay that are released into a rock or soil pore space is
defined as the radon emanation coefficient, or emanating power, of the material. The emanation coefficient
of rocks and soils typically varies between about 0.05 and 0.70, and an average value for soils is probably
between 0.20 and 030. Geologic, pedologic, and climatic factors, including radium content, grain size, siting
of radon parents within soil grains or on grain coatings, and soil moisture conditions, determine the soil’s
emanating power and radon transport characteristics. Soils derived from similar parent rocks in different
regions appear to have significantly different emanation coefficients due to the effects of climate on these soil
characteristics. Data on soil radium content, permeabihty, and moisture content are available for many areas
of the United States. With these and data on emanation coefficients, quantitative predictive models for radon
generation in rocks and soils at regional to national scales can feasibly be developed. To predict radon
generation from soils at a town, neighborhood, or building-site scale, however, would require data at a greater
level of detail than currently exists.
Schumann, R. Randall, ed., 1994
Geologic radon potential of the District of Columbia, Guam, and Puerto Rico:
U.S. Geol. Survey Open-file Rept. 93-292-K, in preparation
[See description above for Open-file Rept. 93-292-A.]
Schumann, R. Randall, Sigrid Asher-Bolinder, and Douglass E. Owen, 1989
Factors influencing seasonal variations in soil-gas radon concentrations in a fine-grained soil [abs.]:
Geol. Soc. America, Northeastern Section, Abstracts with Programs, 21(2): 65
Although geologic and soil characteristics are primarily responsible for determining the concentration of
radon-222 in a ^ven soil, soil-gas radon concentrations at a site fluctuate under the influence of meteorologic
factors. A long-term soil gas monitoring site was established at the Denver Federal Center (DFC), Colorado,
to investigate causes of non-geologic variations in measured soil-gas radon concentrations. The dry climate
and smectitic soil at the DFC site interact to form an extensive system of desiccation cracks that imparts
significant permeabihty to what would otherwise be an almost impermeable soil. Moisture capping occurs
when precipitation infiltrates the uppermost soil layers, causing the clays to swell and cracks to close, and radon
accumulates to elevated levels beneath the capping layer. The capping effect is further enhanced during the
winter, when moisture in the surface layer freezes. Radon concentrations in soil gas at the DFC site vary by
as much as an order of magnitude between seasons, and by as much as 200 percent in response to day-to-day
weather variations. The most important weather factors affecting soil-gas radon concentrations at the DFCsite are: 1) precipitation (as it affects soil moisture); 2) barometric pressure; and 3) temperature, wind, and
other factors. Effects of lower-ranked factors are more noticeable in the absence of higher-ranked ones,
because the more dominant weather factors tend to overshadow the effects of those factors with weaker
influences. The results of this study suggest that radon surveys based on soil gas data could be misinterpreted
if seasonal and weather-related variations are not considered. Additional data from other soil types and
climatic zones should be collected to provide a better base for interpretation of radon data.
Schumann, R. Randall, and Linda C.S. Gundersen, 1991
Regional differences in radon emanation coefficients in soils [abs.]:
Geol. Soc. America, Abstracts with Programs, 23(1): 125
The fraction of the total niunber of radon atoms genented fi'om radium decay that are released into a rock or
soil pore space from a radium-bearing grain is termed the emanation coefficient, or emanating power, of the
material. The emanation coefficient of rocks and soils typically varies between about 0.05 and 0.70, 2md an
average value for most soils is probably in the range 0.20-030. A soil’s parent rock composition (mineralogy
and chemistry) controls not only the initial amount and distribution of radionuclides in the soil, but also how
145

the rock will interact with climate to form the soil, thus determining the soil’s emanating power and radon
transport characteristics. Soils derived from similar parent rocks in different regions appear to have
significantly different emanation coefficients due to the effects of climate on soil characteristics including grain
size, siting of radon parents within soil grains, and soil moisture conditions. A preliminary examination of data
from field studies in which uranium or equivalent uranium concentrations in soils are compared with their
corresponding soil-gas radon concentrations suggests that regional differences in the amount of radon released
exist among soils formed in different climatic zones but with similar radionuclide concentrations. Field and
laboratory data from soils in several areas of the United States suggest that the differences in soil weathering
characteristics in different climatic zones and their subsequent effects on redistribution of radon parent
radionuclides in the soil profile are primarily responsible for the observed differences in the amount of soil-gas
radon released. Our understanding of these climatic and soil processes and their interrelationships forms the
basis of a preliminary general model for radon generation and mobility in soils that can eventually be
developed into a quantitative predictive model for radon occurrence in the geologic environment.
Schumann, R.R., L.C.S. Gundersen, S. Asher-Bohnder, and D.E. Owen, 1989
Anomalous radon levels in crystalline rocks near Conifer, Colorado [abs.]:
Geol. Soc. America, Abstracts with Programs, 21(6): A144-A145
An area near Conifer, Colorado, with known elevated indoor radon levels was investigated to determine the
geologic factors controlling radon concentrations in rocks, soils, and water in crystalline rocks of the Front
Range. More than 200 sod-gas radon concentration and 300 surface gamma radioactivity measurements were
made along traverses and grids in an approximately 75 km^ area and correlated with observations of geologic
and structural features. Locally uranium-rich (containing as much as 18 ppm equivalent uranium) granites and
gneisses provide sources for radon, especially where these rocks are fractured and/or intensely weathered or
altered. Soil-gas radon concentrations greater than 185 kBq/m^ (5000 pCi/L), compared with a median
concentration for the study area of 22 kBq/m^ (600 pCi/L) were measured in proximity to sheared and altered
zones. Faults, shears, and fractures provide the necessary permeability for movement of soil gases, as well as
providing pathways for percolation of water through the rocks, enhancing the weathering process.
Redistribution of uranium by weathering, from sites of low emanation within mineral grsuns to sites of higher
emanation on grain surfaces and grain coatings, occurs by two processes: (1) as mineral grains are physically
broken down, more uranium is exposed as grain size decreases and surface area-to-volume ratio increases; and
(2) chemical weathering of the rocks produces Fe, Mg, and Mn coatings on mineral grains and fracture walls
that tend to preferentially adsorb uranium. These zones may be relatively enriched in uranium as other
elements are leached from the system. Some uraniiun enrichment may occur along fractures and shears
through contact with uranium-bearing near-surface ground waters.
Schumann, R.R., and D.E. Owen, 1988
Relationships between geology, equivalent uranium concentration, and radon in soil gas, Fairfax County, Virginia:
U.S. Geol. Survey Open-file Report 88-18, 27 p.
Schumann, R. Randall, Douglass E. Owen, and Sigrid Asher-Bolinder, 1992
Effects of weather and soil characteristics on temporal variations in soil-gas radon concentrations, in Gates,
Alexander E., and Linda C.S. Gundersen, eds.. Geologic Controls on Radon:
Boulder, Colo., Geological Soc. America Special Paper 271, p. 65-72
Concentrations of radon-222 in soil gas measured over about 1 yr at a monitoring site in Denver, Colorado, vary
by as much as an order of magnitude seasonally and as much as severalfold in response to changes in weather.
The primary weather factors that influence soil-gas radon concentrations are precipitation and barometric
pressme. Soil characteristics are important in determining the magnitude and extent of the soil’s response to
weather changes. The soil at the study site is clay rich and develops desiccation cracks upon drying that
increase the soil’s permeability and enhance gas transport and removal of radon from the soil. A capping
effect caused by frozen or unfrozen soil moisture is a primary mechanism for preventing radon loss to the
atmosphere.
146

Schumann, R. Randall, R. Thomas Peake, Kevin M. Schmidt, and Douglass E. Owen, 1991
Correlations of soil-gas and indoor radon with geology in glacially derived soils of the northern Great Plains, in
The 1990 International Symposium on Radon and Radon Reduction Technology, Atlanta, Ga., 19-23 February
1990:
Research Triangle Park, N.C., U.S. Environmental Protection Agency Rept. EPA600/9-91-026b, Proceedings,
Vol. 2: Symposium Oral Papers, Paper No. VI-3, p. 6-23—6-36 [NTIS Order No. PB91-234450/AS]
A higher percenteige of homes in parts of the northern Great Plains underlain by soils derived from continental
glacial deposits have elevated indoor radon levels (>148 Bq/m^ or 4 pCi/L) than any other area of the United
States. Soil-gas radon concentrations, surface radioactivity, indoor radon levels, and soil characteristics were
studied in au’eas underlain by glacially derived soils in North Dakota and Minnesota to examine the factors
responsible for these elevated levels. Clay-rich till soils in North Dakota have generally higher soil-gas radon
levels, and correspondingly higher indoor radon levels, than the sandy till soils common to west-central
Minnesota. Although the proportions of homes with indoor radon levels > 148 Bq/m^ (>4 pCi/L) are similar
in both areas, relatively few homes underlain by sandy tills have screening indoor radon levels > 74 Bq/m^
(>20 pCi/L), whereas a relatively large proportion of homes underlain by clayey tills have screening indoor
radon levels >74 Bq/m^ (>20 pCi/L). The higher radon levels in North Dakota are likely due to enhanced
emanation from the smaller grains and to relatively higher soil radium concentrations in the clay-rich soils,
whereas the generally higher permeability of the sandy till soils in Minnesota allows soil gas to be drawn into
structures from a larger source volume, increasing indoor radon levels in those areas.
Schutz, D[onald] F., and J[onathan] F. PoweU, 1987
The influence of geologic environment on the distribution of uranium/radium in New Jersey, in Radon and the
Environment, Conference Proceedings, Mahwah, NJ., May 8-10, 1986, Makofske, William J., and Michael
R. Edelstein, eds.:
Mahwah, NJ., Ramapo College of New Jersey, Inst, for Environmental Studies, p. 34-46
Schiitz, M., and G. Keller, 1993
Diurnal and seasonal variation of radon concentration in the upper layer of the soil [abs.], in First International
Workshop on Indoor Radon Remedial Action, The Scientific Basis and Practical Applications, Rimini, Italy,
27 June-2 July 1993:
Commission of the European Communities et al. Book of Abstracts, p. 72
The soil is known to be the main source of high radon concentrations indoors, which contribute about the half
of the mean natural annual radiation exposure of the German population. It is an aim of precautionary
radiation protection to get information of regions with an elevated radon content. In order to screen easily
the radon potential of the interesting regions, a simple measurement of radon at the surface is desirable. But
the upper layer of the soil is mostly influenced by meteorological factors as heating and rain. Some test series
with an artificial soil column may simulate these daily varying parameters under laboratory conditions. It shows
that there occms a short-term increase of the radon concentration by 300% and more in the upper layer of
the soU as a consequence of sudden rainfall. On the other hand, a slow and long-term increase of the water
content of the soil may reduce the diffusion coefficient of the radon by several orders of magnitude. The daily
heating of the atmosphere results in an advanced gas exchange between the upper layer of porous and dry soils
and the air above. Consequently variations of radon concentration by a factor of 5 arise according to the
intensity of the heating and the porosity of the soil. The outcomes of the laboratory tests are qualitatively
confirmed on natural soils. The test series at different types of radon-rich soils show both extreme diurnal and
seasonal variations of the radon concentration in the upper layers as a consequence of changing meteorological
conditions. That fact excludes the use of radon measuring devices with integration times less than one day for
the radon screening of any area. We suggest a combination of in-situ alpha spectroscopy and solid-state
nuclear track detectors to scan the radon potential of a soil. This method is not expensive in equipment or
in time, but is sufficiently accurate.
Schwenker, Charles, Jia-Yeong Ku, Charles Layman [Laymon], and Charles Kunz, 1992
147

Correlation of indoor radon screening measurements with surficial geology using geographic information systems,
in The 1992 International Symposium on Radon and Radon Reduction Technology, Minneapolis, Minnesota,
September 22-25, 1992:
U.S. Environmental Protection Agency, Preprints [poster papers], v. 5, no. VIIIP-3, 14 p.
The State of New York has a growing database of over 50,000 homes for which radon levels have been
measured. These data include information on home construction, type of heating, and location by address.
We have looked at correlations with many home variables but have not been able to do a thorough analysis
of radon-level relations to surficial geology, which requires accurate spatial relation of home location with
surficial geology maps. We are doing this by using a Geographic Information System mapping program (GIS),
to which we will add boundary maps of surficial geology, derived by di^tizing existing maps. The indoor radon
measiu-ement data for Albany County have been linked to latitude and longitude coordinates using the U.S.
Bureau of the Census Topologically Interpreted Geographic Encoding and Referencing (TIGER) database.
The surficial geology boundary map has also been prepared for Albany Coimty and relationships of indoor
radon to surficial geology are discussed. Comparisons are made for mapping indoor data using county-wide
averages, zip code averages and individual measurement mapping.
Scott, A.G., 1988
Proposed criteria to define Rn-prone areas from regional surveys [letter]:
Health Physics, 54(3): 351
[Building-code adjustments to the need for "radon-resistant" construction may eventually be made on the basis
of geology, which is the most important determinant of indoor radon concentration. In the meantime, areas
needing special building-code requirements could be designated on the basis of the percentage exceeding a
certain indoor annual average radon exposure, for example, 50% above 150 Bq/m^ or 20% above 750 Bq/m^,
by eating surveys. Survey densities of one measurement per 2.5 km^ should be adequate to characterize areas
smaller than many jurisdictions with budding-code authority. The actual criteria used should be determined
by an optimization process.]
Scott, A.G., 1992
Site characterization for radon supply potential: A progress review:
Health Physics, 62(5): 422-428
[At costs of radon-resistant construction prevailing a decade ago, site characterization to determine whether such
construction would be needed was considered to be a worthwhile effort when compared with the cost of
surveying nearby houses with expensive indoor monitors. In the meantime, cheap means of indoor monitoring
(charcoal canisters and alpha-track detectors) have resulted in an unanticipated large number of indoor
measurements that give a good overview of radon distribution in the U.S., eliminating the need for prediction
by means of site characterization. Several different methods have been proposed, the costs of which were not
specified by their proposers, but are estimated by this author at $250 to $500. In addition to the lack of cost
effectiveness, site characterization methods are not applicable to areas of fractured bedrock or e}q)ansive clays,
which are common. In general, radon-prone areas are large enough to be defined by indoor surveys in existing
houses, which are the best guide as to whether radon-resistant construction should be required.]
Sextro, Richard G., 1987
Understanding the origin of radon indoors—^Building a predictive capability [from Conference on Characteriza-
tion of Contaminant Emissions from Indoor Sources, Chapel Hill, NC, May 13-15, 1985]:
Atmospheric Environment, 21: 431-438 [Original Pub.: Lawrence Berkeley Laboratory Rept. LBL-20210, 21 p.l
Indoor radon concentrations one to two orders of magnitude higher than the U.S. average of »40 Bq/m^(» 1 pCi/L) are not imcommon, and concentrations greater than 4000 Bq/m^ have been observed in houses
in areas with no known artificially enhanced radon sources. In general, source categories for indoor radon are
well known: soil, domestic water, building materials, and outdoor air. The latter two source categories have
generally been found to have low radon source strengths. Domestic water supplies also typically contribute
little to airborne radon concentrations, although in certain locaUties water has been identified as a significant
148

source. Soil, on the other hand, is thought to be a major source of indoor radon, either through diffusive
(usually a minor component) or bulk flow of soil gas. While soil gas flow into residences has been
demonstrated, no general understanding of the important factors affecting the source strength of radon from
soil has yet emerged. Preliminary work in this area has identified a number of likely issues, including the
concentration of radium in the soil, the emanating fraction, soil type, soil moisture content, and other factors
that would influence soil permeability and soil gas transport. A predictive capability is needed that would help
identify geographical areas having the potential for high indoor concentrations. The development of such a
capability will require additional scientific study of the soil-related factors discussed above, along with an
exploration of existing data bases that might provide indicators of radon concentrations. In addition to soil-
specific factors, and examination of the coupling between the soil and the living space provided by various
building types and substructures is needed and the role of local meteorology-rainfall, wind loading, barometric
pressure changes, and building thermal loads—must be assessed.
Sextro, Richard G., and Ashok J. Gadgil, 1993
Modeling radon entry into buildings: Insights for radon control [abs.], in First International Workshop on Indoor
Radon Remedial Action, The Scientific Basis and Practical Applications, Rimini, Italy, 27 June-2 July 1993:
Commission of the European Communities et al., Book of Abstracts, p. 45
A variety of analytical and numerical models have been used to examine the transport of radon through soils and
into buildings. In many cases, the models are limited either by the assumptions used to simplify the
mathematics, the mathematics, the data used to characterize the transport media, or both. Model-
measurement comparisons are therefore very difficult to undertake. However, model results can provide very
useful insights into the factors influencing radon transport and entry, either retrospectively when used in
conjunction with well-designed and controlled experiments, or prospectively in parametric studies designed to
identify and examine features that may employed in radon control. The following three examples will be
discussed. 1. Model verification can stimulate additional investigations of the validity of assumptions and inputs
used in the simulations. The disa^eement revealed in a recent comparison of experimental results with
simulations using a numerical model has led to further investigations of soil permeability as an explanatory
factor. It appears that soil permeability may be dependent on length scale, which, when used as a model input,
leads to resolution of much of the discrepancy. 2. The ability to model complex geometries and flows has been
recently demonstrated through comparison with experimental results. These results indicate that non-Darcy
flow effects in highly permeable media can be important, both in interpretation of observations and in the
desi^ of sub-slab mitigation systems. These model simulations have £dso provided insights into failure modesof various sub-slab mitigation systems and ways to ensure that such failures are avoided. 3. Lastly, parametric
examination of features of the building-soil system can illuminate system details and suggest novel system
features that are important to the radon transport and entry process. As an example, a high-permeability
sub-slab layer is often specified as part of new construction techniques as a means of enhancing the
effectiveness of sub-slab ventilation systems. On the other hand, numerical simulations suggest that such a
layer can significantly increase radon entry rates (in the absence of a control system). Model results have
suggested that the placement of an impermeable sub-gravel membrane can greatly reduce this effect.
Experimental tests to confirm this are planned.
Sextro, R.G., BA. Moed, W.W. Nazaroff, K.L. Revzan, and A.V. Nero, 1987
Investigations of soil as a source of indoor radon. Chap. 2, in Hopke, Philip K., ed.. Radon and Its Decay
Products; Occurrence, Properties, and Health Effects:
Washington, Am. Chem. Soc. Symposium Ser. 331, p. 10-29
The predominant source of indoor radon in most single-family housing in the U.S. is the soil adjacent to the
house substructure. We have examined factors influencing the production and transport of radon in soil and
into buildings. A number of important parameters have been identified and their effect on radon production
and migration assessed, including radium concentration, moisture content, air permeability, and grain size
distribution of soils. The potential regional variations in parameters affecting radon have been evaluated by
examining geographic data, including surface radium concentrations and general soil data. We have also
149

investigated factors influencing radon migration into individual dwellings. Coupling between the building shell
and the surrounding soil has been demonstrated experimentally, and pressure-field mapping and soil
permeability measurements have been carried out.
Sextro, R.G., Nazaroff, W.W., and Turk, B.H., 1989
Spatial and temporal variation in factors governing the radon source potential of soil, in Osborne, M.C., and Jed
Harrison, Symposium Cochairmen, The 1988 Symposium on Radon and Radon Reduction Technology, Proc.,
Vol. 1, Symposium Oral Papers:
Research Triangle Park, N.C., Radian Corp., U.S. Environmental Protection Agency Pub. EPA/600/9-89/006a
[Springfield, Va., NTIS Order No. PB89-167480], p. 5-61-5-74.
Soil is the predominant source of radon in most U.S. homes, particularly for those homes with elevated indoor
concentrations. Three factors help govern the indoor radon concentration, the radon production rate in the
soil, the air permeabiUty of the soil surrounding the building substructure, and the coupling between the soil
and the building. In order to evaluate the spatial and temporal variabiUty of the first two factors, soil
permeabihties and soil gas radon concentrations have been measured at different locations and as a function
of time. The spatial variability in permeabihty measurements at an individual homesite was seen to range from
approximately a factor of ten to more than four orders of magnitude. Similarly, spatial variations in soil gas
radon concentrations are less than a factor of two at some homesites to a factor of about 200 at others. The
temporal changes in permeability and soil gas radon at a given sampling location are somewhat smaller,
yielding variations ranging from less than a factor of two to a factor of about 90 in the case of permeability,
and fi-om less than a factor of three to a factor of about 40 for soil gas radon concentrations. A method of
combining measurements of soil gas radon and air permeability to provide a characteristic parameter - the
radon source potential - has been developed and is briefly reviewed. Calculated indoor radon concentrations,
based on measured values of radon source potential at a few sample homesites, correlate with the measured
indoor radon concentrations.
Sherman, Max, 1993
Simplified modeling for infiltration and radon entry, in Proceedings: The 1992 International Symposium on
Radon and Radon Reduction Technology, 4th, Minneapolis, Minn., Sept. 22-25, 1992. Vol. 1, Symposium Oral
Papers, Opening Session and Technical Sessions I-VI:
Research Triangle Park, N.C., U.S. Environmental Protection Agency Rept. EPA-600/R-93/083a, p. 6-57—6-78
U.S. Environmental Protection Agency, Preprints, v. 2, [no. \T-4], 22 p.
Air leakage in the envelopes of residential buildings is the primary mechanism for providing ventilation to those
buildings. For radon the same mechanisms that drive the ventilation, drive radon entry. This paper attempts
to provide a simplified physical model that can be used to understand the interactions between the building
leakage distribution, the forces that drive infiltration and ventilation, and indoor radon concentrations.
Combining both ventilation and entry modeling allows an estimation of radon concentration and exposure to
be made and demonstrates how changes in the envelope or ventilation system would affect it. This paper will
develop simplified modeling approaches for estimating both ventilation rate and radon entry rate based on the
air tightness o' ne envelope and the driving forces. These approaches use conventional leakage values (i.e.,
effective leak« ea) to quantify the air tightness and include natural and mechanic^ driving forces. This
paper introdu' x simplified parameter, the Radon Leakage Area, that quantifies the resistance to radon
entry. To be practical for dwellings, modeling of the occupant exposures to indoor pollutants must be simple
to use and not require unreasonable input data. This paper presents the derivation of the simplified physical
model, and applies that model to representative situations to explore the tendencies to be expected under
different circumstances.
Singler, C.R., E.C. Abram, and I.U. Khawaja, 1993
A predictive model for determining indoor radon levels in northeastern Ohio, in The 1993 International RadonConference, Denver, Colo., Sept. 20-22, 1993:
150

Denver, Colo., Am. Assoc. Radon Scientists and Technologists, Rocky Mountain Chapter, Preprints,
p. IVP 12—IVP 13
An indoor radon measurement program deployed 717 a-track detectors in homes across an area of «2266 mi^
in eastern Ohio....A geologic study was conducted to determine the lithology of bedrock, nature of the glacial
cover, and thickness of glacial overburden. The bedrock was mainly sandstone and shale, with lesser amounts
of limestone. The overburden was dominantly of glacial origin, except for the southern half of Columbiana
County (the most southerly county), where mostly non-glacial soils and alluvium occiured. The glacial cover
was chiefly till, with lesser amounts of lacustrine, kame, and outwash materials. Kame and outwash were
treated as similar lithologies because of textural similarities....For the study area, the following conclusions were
made: (1) In eastern Ohio, higher radon levels occur in a southerly direction; (2) where there is not a glacial
cover, radon levels are significantly higher; (3) elevated radon levels occur in homes over kame and outwash
deposits; lower values occur over till and lacustrine deposits; and (4) radon levels are higher over sandstone
than over shale or limestone. [A second study, based on charcoal-canister measurements in houses over an
area of « 10,000 mi^ of northeastern Ohio, yielded similar results.]
Siniscalchi, Alan J., Zy^unt F. Dembek, Barbara S. Weiss, Mary-Margaret Gaudio, Jennifer C. Kertanis, Ellen
P. Morris, Laurie Gokey, Paul M. Schur, David R. Brown, and Margaret A. Thomas, 1992
Radon in schools: The Connecticut experience, in The 1992 International Symposium on Radon and Radon
Reduction Technology, Minneapolis, Minnesota, September 22-25, 1992:
U.S. Environmental Protection Agency, Preprints, v. 2, no. III-l, 10 p.
[One objective of the Connecticut radon program was "...to determine the contribution of various bedrock units
and surficial materials to radon exposure in schools...." In order of rank, data sources used to rank radon
potential of Connecticut’s 169 municipalities were (1) U.S. Geolo^cal Survey aeroradioactivity data, (2) the
1986-1987 EPA/Connecticut radon survey of 1157 households in 168 of 169 towns, (3) the 1987-1988 household
testing program (3409 households in 38 municipalities), and (4) Connecticut Department of Health
Services/USGS bedrock well sampling data for the top 25 towns. The data sources are all incorporated into
a statewide geographical information system. Interim results showed that the ranking was fairly good with
respect to residential basement geometric mean radon concentrations, but not in identifying schools with at
least one room with a radon level >148 Bq/m^ (^.0 pCi/L). One confounding factor was identified as the use
of larger amounts of imported fill for school construction than for housing.
Siniscalchi, Alan J., Lynne M. Rothney, Brian F. Toal, Margaret A. Thomas, David R. Brown, Maria C. van der
Werff, and Carolyn J. Dupuy, 1991
Radon exposure in Connecticut: Analysis of three statewide surveys of nearly one percent of single family homes,
in The 1990 International Symposium on Radon and Radon Reduction Technology, Atlanta, Ga., 19-23
February 1990:
Research Triangle Park, N.C., U.S. Environmental Protection Agency Rept. EPA600/9-91-026a, Proceedings,
Vol. 1: Symposium Oral Papers, Paper No. IV-1, p. 4-1—4-14 [NTIS Order No. PB91-234443/AS]
[Excerpt fi’om text, p. 4-3] Geologic, hydrologic, and household parameters were analyzed for their ability to
predict radon levels. Figures 2 and 3 show the mean water and air radon levels, respectively, compared with
the bedrock classifications as shown on the Connecticut part of a generalized bedrock mapping scheme of NewEngland. Geology was a significant predictive factor of radon in both private well water and indoor air, with
granitic and sedimentary formations associated with higher and lower radon levels, respectively. While the
radon potential of bedrock may be generally characterized by such data, it is possible that water radon levels
alone are sufficient to estimate the geologic radon potential. Indoor air radon measurements represent radon
emissions not only from bedrock, but also from surficial materials and also appear to vary significantly with
various household factors. Hydrologic factors, foundation type, and energy efficiency were examined. Only
the depth of unconsolidated material overlying the bedrock had a strong positive correlation with private well-
water radon levels. Homes with block wall foundations had higher indoor air radon levels than those with
other types of foundation. Homes characterized by the homeowner as being more energy efficient did not have
higher indoor air radon levels than homes characterized as being less energy efficient.
151

Slunga, E[ero], 1988
Radon classification of building ground:
Radiation Protection Dosimetry, 24(1/4): 39-42
[Ground on which buildings are to be constructed is classified with respect to indoor radon potential as
negli^ble, normal, high, or very high. The basic consideration is the radium content of the soil and/or the
radon content of the air in the pores of the soil, the respective ranges of radium content (Bq/kg) being 0-35,
35-100, 100-500, and >500. A refinement is the "radon activity number," based on Csb (Bq/m^), which is either
the maximum radon content of the soil pores with the natural (annual average) water content or twice the
radon content measured at a depth of 1 m, whichever is meater, and the air permeability of the soil (m^), by
the relation. Radon activity number (Rn^) =log(6C5|,/k"^/^^)-3. Values of Rn^ of 0-1, 1-2, 2-3, and >3 cl2issify
the ground by the respective classes above. The steady-state value of the radon content of the ground next
to a building foundation (C^g, in Bq/m^) can be estimated by Cgg=10^*^®'''^\ (See Viljanen et al., 1987.)
Examples of soils, radium and radon contents, soil thicknesses, and the rocks from which the soils are derived
are given for each class.]
Smith, Douglas L., and John K. Hansen, 1989
Distribution of potentially elevated radon levels in Florida based on surficial geology:
Southeastern Geology, 30(1): 49-58
[Indoor radon potential in Florida is expected to be significant where members of the Hawthorn Group occur
within 50 ft (15 m) of the surface. Subdivisions of the Hawthorn Group were evaluated for uranium content
from available data and recent 7-ray spectrometric measurements. Each county was then rated for "equivalent
surface" of uranium presence according to the summation of (AjDjCj), where Aj is the percentage of the county
area in which the /th geologic unit is exposed; Dj is the depth of overburden above that imit, classified as 1 for
surface occurrence, 0.75 for 10-30 ft, 0.25 for 30- 50 ft; and Cj is the uranium concentration evaluation for
the unit, classified as 1 for >10 ppm, 0.5 for 3-10 ppm, and 0 for <3 ppm. A table gives the calculated
equivalent surface areas of 29 counties, ran^ng from 65% for Desoto and Union Counties to 5% for Liberty
County. Southeastern Florida, which showed definite evidence of radon potential in another survey, was not
indicated to have significant radon potential ft’om the Hawthorn Group.]
Smith, Geoffrey W., Royal H. Mapes, Robert J. Hinkel, and Rick L. Darr, 1989
Radon hazards associated with glacial deposits in Ohio [abs.]:
Geol. Soc. America, Abstracts with Programs, 21(6): A144Examination of the distribution of uranium in Ohio indicates that the principal geologic controls of uranium
occurrence are black shales of Devonian and Mississippian age and surficial glacial materials of Quaternary
age. Recent studies indicate a direct correlation between uranium distribution and radon concentration in
homes throughout the state. Glacial deposits of at least three glacial stages cover more than two-thirds of
Ohio. These deposits include (a) glacial till, comprising ground moraine and end moraine, (b) glaciofluvial
sediments, including kame deposits and outwash, and (c) glaciolacustrine sediments. The occurrence and
distribution of these materials can be directly related to several factors controlling sediment deposition.
Thirteen Ohio counties were selected for radon evaluation on the basis of the distribution of different glacial
materials with about 50 homes per county being sampled. In addition, open air soil radon levels were
measured, as were radon levels of bulk soil samples in the laboratory. Preliminary analysis of the data
indicates that: (1) permeability of glacial materials is of first-order importance in controlling home radon
concentrations, (2) composition of ^cial materials, including both granitic erratics and locally-derived black
shales is important in controlling local radon concentrations, and (3) glacial geologic factors, in most instances,
override the effects of both underlying bedrock geology and aspects of house construction. The results of this
study bear significantly on an understanding of the distribution of radon in glaciated regions of the United
States.
Solomon, Barry J., Bill D. Black, Dane L. Fineiffock, and John Hultquist, 1993
152

Geolo^c mapping of radon-hazard potential in Utah, in The 1993 International Radon Conference, Denver,
Colo., Sept. 20-22, 1993;
Denver, Colo., Am. Assoc. Radon Scientists and Technolo^ts, Rocky Mountain Chapter, Preprints,
p. IVP 14—rVP 28
Geologic data were used to map potential radon hazard areas in Utah. The first statewide map identified rock
uranium sources, but did not systematically evaluate populated areas imderlain by unconsolidated valley fill.
Subsequent indoor testing identified high radon levels in some of this valley fUl. Detailed geologic studies zmd
targeted indoor surveys were performed in six areas with high indoor-radon levels. Initially, these studies
assigned hazard potentials to Quaternary geologic units, assiuning that each unit was relatively homogeneous.
Indoor radon levels were used for model validation. Later studies used overlays of specific geologic factors
(uranium content, permeability, and ground-water depth) to derive a composite hazard map, with hazard
categories independent of geologic units. Soil-gas radon concentrations were used for validation with exclusion
isolines, a semiquantitative analysis technique that minimizes the effect of factors which differentially reduce
soil-gas radon concentrations. Hazard potential maps derived from overlays effectively identify potential hot
spots, and do not rely upon either geologic or artificial political boundaries to constrain hazard interpretations.
The overlay method was used to revise the statewide radon hazard potential map, and assessments of hazard
potential from detailed field investigations correlate well with those on the revised statewide map. Central
Utah has the highest radon hazard potential, primarily due to uranium-enriched Tertiary volcanic rocks.
Western Utah has the lowest radon hazard potential, due to limitations on radon emanation and migration
imposed by impermeable soils and shallow ground water common in basins.
Southern Research Institute, [1989]
Florida Radon Research Program. Standard measurement protocols. Part 1. Soil measurements:
Birmingham, Ala., Southern Research Institute, 129 p.
[This report, prepared for the State of Florida Department of Community Affairs, is a compilation of procedures
obtained fi-om various sources, mostly from the American Society for Testing and Materials (ASTM),
Philadelphia, Pa. They are: (1) Draft Protocol for Soil Gas Permeability and Radon Meeisurement and for In-
situ Soil Density Sampling and Soil Sample Collection (Rogers and Associates Engineering Corporation, Salt
Lake City, Utah); (2) [Draft] Measurement of Radium-226, Radon Emanation Coefficient and Moisture
Content on Large (« Quart) Core and Surface Soil Samples (Department of Environmental Engineering
Sciences, University of Florida, Gainesville, Fla.); (3) Protocol for Soil Density Profiling using a Barkley and
Dexter Model HP-102 Penetrometer [incorporating ASTM D 1586-84 Standard Method for Penetration Test
and Split-Barrel Sampling of Soils] (University of Florida); (4) ASTM D 2216-80 Standard Method for
Laboratory Determination of Water (Moisture) Content of Soil, Rock, and Soil-Aggregate Mixtures; (5)
Standard Proctor, incorporating ASTM D 698-78 Standard Test Methods for Moisture-Density Relations of
Soils and Soil-Aggregate Mixtures Using 5.5-lb (2.49-kg) Rammer and 12-in. (305-mm) Drop; (6) In-situ Soil
Density, incorporating ASTM D 2937-83 Standard Test Method for Density of Soil in Place by the Drive-
Cylinder Method; (7) Soil Partide-Size Analysis, incorporatingASTM D 422-63 Standard Method for Particle-
Size Analysis of Soils; (8) Specific Gravity of Soils, incorporating ASTM D 854-83 Standard Test Method for
Specific Gravity of Soils; (9) Procedure for Laboratory Measurements of Air Permeability of Sub-Slab LandFill (authorship not indicated); (10) Soil Classification, incorporating ASTM D 2487-85 Standard Test Methodfor Classification of Soils for Engineering Purposes, and ASTM D 2488-84 Standard Practice for Description
and Identification of Soils (Visual-Manual Procedure); (11) Radon Diffusion Coeffident, incorporating
NUREG/CR-2875, Comparison of Radon Diffusion Coeffidents Measured by Transient-Diffusion and Steady-
State La^ratory Methods, by D.R. Kalkwarf, K.K. Nielson, D.C. Rich, and V.C. Rogers (1982); and (12)
Radon Flux, incorporating Radon Flux Measurement by Charcoal Cartridge, by C.E. Roessler, Health Physics
Section, Department of Environmental Engineering Sdences, University of Florida, Gainesville, Fla. (1987).]
Spears, John W., Harry E. Rector, and David P. Wentlin, 1992
Evaluating radon-resistant construction practices in Florida, in The 1992 International Symposium on Radon and
Radon Reduction Technology, Minneapolis, Minnesota, September 22-25, 1992:
153

U.S. Environmental Protection Agency, Preprints, v. 4, no. XI-6, 20 p.
This paper discusses the results of an evaluation of the radon resistance of 20 new homes built in accordance
with the Florida draft radon construction code provisions. This project is part of the ongoing Florida Radon
Research Program. Preconstruction soil measurements included soil permeability, soil gas radon, radium
content, and other physical properties of the soil. Postconstruction measurements included indoor radon,
subslab radon, pressure differentials, pressure field extension, duct leakage, air infiltration, and air leakage.
Radon entry rate or soil gas entry rate was estimated by using perfluorocarbon tracers (PFTs) buried in the
soil arc measuring the sod-based PFT concentrations in the home. Recommendations on improving the code
are given.
Speer, J. Alexander, Gregory T. Bertwell, Kevin W. Hoff, and Thomas J. Douglas, 1993
Using heat flow measurements to estimate and verify the total radon hazard potential of granites, southeastern
United States, in The 1993 International Radon Conference, Denver, Colo., Sept. 20-22, 1993:
Denver, Colo., Am. Assoc. Radon Scientists and Technologists, Rocky Moimtain Chapter, Preprints,
p. IV 10—IV 19
Determining the radon hazard potential posed by large rock units can be done using large-scale soil gas and
ground-water surveys. However, an easier approach or some independent demonstration that all radon is being
inventoried is often desired. One method is to use existing geolo^c mapping, rock, and soil uranium contents,
and to rely on the observed positive correlation between uranium and radon contents. However, heat-flow
measurements can also be used. The most important modification of Earth heat flow from the mantle in the
southern Appalachian Piedmont is the heat contributed by the average radioactive element content in the rocks
within a few kilometers of a heat-flow measurement site. Thus the added heat flow is a crustal-scale measure
of uranium, which is both an important contributor to crustal heat production and [a precursor] of Rn. Soil-
gas and groimd-water radon contents for 10 heat-flow sites in North Carolina, South Carolina, and Georgia
show an increase of ground-water and soil-gas radon with increasing heat flow. Those rocks associated with
lower-than-expected radon contents are interpreted as having either uranium that was preferentially lost during
soil formation or was unsuitably sited for radon emanation into the ground water and soil gas.
Sprinkel, Douglas A., 1988
Assessing the radon hazard in Utah:
Utah Geological and Mineral Survey, Survey Notes, 22(4): 3-13
[This article first gives a layman’s overview of what radon is, why it is a health hazard, and the basic processes
of radon emanation and movement. Then possible areas of high indoor radon potential are discussed in two
basic categories: "point sources," known uranium occurrences, including uranium mines and prospects, other
reported places of uranium enrichment, and geothermal areas; and "generalized sources," areas of rock types
having elevated uranium concentration, and the Wasatch fault zone. A generalized radon potential map is
presented at a scale of about 1:2.6 million. Procedures for making indoor radon measurements, following
USEPA guidelines are given.]
Steck, Daniel J., 1988
Geological variation of radon sources and indoor radon along the southwestern edge of the Canadian Shield, in
Marikos, Mark A., and Robert H. Hansman, eds.. Geologic Causes of Natural Radionuclide Anomalies,
Proceedings of the GEORAD Conference, St. Louis, Mo., April 21-22, 1987:
Rolla, Mo., Missouri Dept. Nat. Resources, Div. Geology and Land Survey Spec. Pub. No. 4, p. 17-23
Radon source and indoor radon ex. icentrations were measured in 70 houses and a number of other sites along
the southwestern edge of the Canadian Shield. Waterborne radon activity ranges from 400 to 3.6x10^ Bq/m?(10 to lO'* pCi/L), and appears to be log-normally distributed, with an average value of 8600 Bq/m^(230 pCi/L). Soilbome radon was determined by four techniques. In laboratory analysis, samples showed an
average available radon emanation of 4 Bq/kg (0.1 pCi/g), and an average radon activity of 34 Bq/kg
(0.8 pCi/g). The in situ siuTace bismuth-214 activity ranged from 10 to 100 Bq/kg (0.2 to 2 pCi/g) and the
154

soil gas radon activity averaged 5 kBq/m (100 pCi/L). Indoor airborne radon activity ranged from 20 to
1100 Bq/m^ (0.5 to 30 pCi/L) and varied with season, year, compartment, and local geology.
Steck, DJ., and MJ. Bergmann, 1992
Indoor radon and the radon potential of soils, in The 1992 International Symposium on Radon and Radon
Reduction Technology, Minneapolis, Minnesota, September 22-25, 1992:
U.S. Environmental Protection Agency, Preprints, v. 3, no. VIII-l, 15 p.
Subsurface soil samples, collected adjacent to 110 Upper Midwest houses, were measured to determine radon
emanation, diffusivity, and permeabihty. The soilbome radon characteristics of the samples of glacial till that
covers most of the region varied by a factor of ten or more. A Monte Carlo model was used to calculate
indoor radon concentrations in idealized basements sited in a homogeneous medium whose radon properties
matched the soil sample properties. Measured basement radon concentrations correlate with the model
predictions. The correlation is more useful to assess clusters of homes than individual dwellings.
Stieff, L.R., C.B. Stieff, and RA. Nelson, 1987
Field measurements of in situ Rn concentrations in soil based on the prompt decay of the Bi counting rate:
Nuclear Geophysics, 1(2): 183-195
Indirect field measurements of the in situ Rn-222 concentations in sealed samples of soil have been made based
on the prompt decay of the Bi-214 counting rate in the 2-hr interval immediately following sample collection.
Subsequent Bi-214 measurements yield estimates of the Rn-222 lost during sample collection and the
concentration of Ra-226 in the samples. These data may be used in the measurement of in situ Rn-222
concentration gradients, the characterization of the state of Ra-226/Rn-222 equilibrium in soil samples, and
calculation of Rn-222 surface flux.
Stieff, L.R., and H.B. Stieff, 1988
The use of in situ ^Rn soil metisurements in the characterisation of soil profiles:
Radiation Protection Dosimetry, 24(1/4): 73-77
Stranden, E., and A.K. Kolstad, 1985
Radon exhalation from the ground; method of measurements and preliminary results:
The Science of the Total Environment, 45: 165-171
Stranden, E., K. Ulbak, H. Edhwall, and N. Jonassen, 1985
Measurement of radon exhalation from the ground: A useful tool for classification of the radon risk of building
ground:
Radiation Protection Dosimetry, 12: 33
Styra [Styro], B.I., T.N. Nedveckaite, and E.E. Senko [Sen’ko], 1970
New methods of measuring thoron (radon 220) exhalation:
Jour. Geophys. Research, 75(18): 3635-3638 [in Russian, 1969 (pub. 1972) in Inst. Eksp. Meteorologii Trudy,
no. 25, pt. 2, p. 109-116]
Geophys. Abs. 288-385
Surbeck, H[einz], 1988
The search for radon sources, a multidisciplinary task:
Radiation Protection Dosimetry, 24(1/4): 431-434
Surbeck, H., and Piller, G., 1989
A closer look at the natural radioactivity in soils, in Osborne, M.C., and Jed Harrison, Symposium Cochairmen,
The 1988 Symposium on Radon and Radon Reduction Technology, Proc., Vol. 1, Symposium Oral Papers:
155

Research Triangle Park, N.C., Radian Corp., U.S. Environmental Protection Agency Pub. EPA/600/9-89/006a
[Springfield, Va., NTIS Order No. PB89-167480], p. 5-13-5-26.
E^anced indoor radon levels are frequently found in the western part of the Swiss Jura Mountains, a karst
region. The Ra-226 activity in the limestone bedrock is low (20 Bq/kg). In the thin soil overburden the
Ra-226 concentration is 2 to 3 times higher than in soil samples from the Swiss Plateau but on the average still
below 100 Bq/kg. It is supposed that the radon problem in this region is due to the high permeability of the
karst bedrock. A sampling device for radon in soil gas measurement is described that permits a coarse in-situ
soil permeability determination. Specific activity vs. grain size measurements for some Swiss soils and the high
activities found in heavy miners are presented and a possible aeolian origin of the soils in the western Jura
is discussed.
Surbeck, H., H. Volkle, and W. Zeller, 1991
Radon in Switzerland, in The 1991 International Symposium on Radon and Radon Reduction Technology,
Philadelphia, Pa., April 2-5, 1991, Proc., Volume 2, Symposium Oral Papers, Technical Sessions 6 through 10:
U.S. Environmental Protection Agency Rept. EPA/600/9-91/037B, p. 6-31—6-46
McLean, Va., Cohen (S.) and Associates, Inc. [Springfield, Va., NTIS Order No. PB92-115369]
[Preprints, v. 3, no. VI-3]
Based on measurements in nearly 1600 homes, representing 0.15% of the housing stock, we estimate that the
Swiss live on the average in rooms with a radon concentration of 80 Bq/m^ and that 5% of them are exposed
to concentrations exceeding 200 Bq/m^. Radon research in Switzerland started nearly a decade ago and shows
that the building materials and household water use present no serious radon problems, the soil being the main
source. The highest values are found in homes on highly permeable building groimds (karst terrains,
rockshdes). We discuss the results of the radon surveys and explain how we try to get a representative
e?q>osure estimate from biased data. We also present geological aspects of the radon situation in our country
and outline the policy for the new decade that will see surveys concentrated on the search for hot spots....
Swedish Radon Commission (Radonutredningen), 1983
Radon in dwellings. Report firom the Radon Commission [in Swedish]:
Stockholm, Ministry of Agriculture, SOU 1983:6, 145 p. [ISBN 91-38-07433-8]
[A translation summary of chapter 6 says that the factors affecting radon released from rocks and soils are
uranium content, soil, particle size, weathering, type and siting of uranium within the rock minerals, moisture
content, permeability, gas transport, and other items, in a complicated way. Houses built on eskers have a
much higher probability of having high radon in them than do houses built on other materials, probably
because of the high permeability in the rock and sandy materials in the eskers. Houses built over clay have
on the average much lower radon levels, probably due to the (low) permeability of the clay soils. Alum shales,
granites, pegmatites, and many glacial materials have high potential for causing elevated indoor radon. Experts
believe that the average 15 Bq of radon/L of ground water in Sweden (400 pCi/L) is not a major contributor
to the radon in the houses. Chapter 9 defines high risk areas as those having soils with radon levels >50
kBq/m^, low risk areas < 10 kBq/m^, and normal risk in between. For clay soils, > 100 kBq/m^ would signal
a high-risk area.]
Swedjemark, Gun Astri, 1982
Buildings with enhanced radioactivity in Sweden, in Vohra, K.G., U.C. Mishra, K.C. Pillai, and S. Sadasivsm, eds..
Natural Radiation Environment:
New York, John Wiley and Sons, p. 535-542, disc., 542-543
The Ra-226 content of various house building materials and the radon levels indoors in Sweden have been
evaluated. In houses built entirely of alum shale concrete the indoor radon levels were between 200 and
1200 Bq/m^ (5-32 pCi/L), and the indoor absorbed dose rates from gamma radiation were 35-69 /xr/hr.
Houses built in regions with enhanced radium content showed higher radon levels indoors. Various
countermeasures have been adopted to reduce the indoor radon levels.
156

Szarzi, S.L., G.M. Reimer, and J.M. Been, 1992
SoO-gas and indoor radon distribution related to geology in Frederick County, Maryland, in Cross, Fredrick T.,
ed.. Indoor Radon and Lung Cancer: Reality or Myth? Twenty-ninth Hanford Symposium on Health and the
Environment, Richland, Wash., October 15-19, 1990, Proceedings:
Columbus, Ohio, Battelle Press, Part 1, p. 437-448 [NTIS]
The two major physiographic provinces that occur in Frederick County, Maryland, are the Piedmont and the Blue
Ridge. Soil-gas measurements were taken for a study designed to show the relationship between geology and
soil-gas radon concentrations. The local geology causes varied soil-gas concentrations that contribute to radon
availability for indoor accumulations. The western part of the county, where quartzites form the core of ridge
and mountains, has a mean soil-gas radon concentration of 26 kBq/m^ (700 pCi/L). The eastern part of the
county, containing the phyllites of the Piedmont Province, has a mean soil-gas concentration of 59 kBq/m^
(1600 pCi/L). In the southeast part of the county, where soil-gas radon concentrations exceeded 75 kBq/m^
(2000 pCi/L), the average indoor radon concentration (from charcoal canister measurement) was 1.9 kBq/m^
(50 pCi/L). This observation supports previous work showing that the soil-gas radon concentration is a
primary component in determining the coupling characteristics of radon transport between soils and homes.
Data acquired by studies such as these throughout the United States are essential to identify regional radon
"hot spots" which may produce elevated indoor radon levels of unquestioned risk. [From final program]
Taipale, T.T., and K. Winqvist, 1985
Seasonal variations in soil gas radon concentration:
The Science of the Total Environment, 45: 121-126
Tanner, AUan B., 1957
Physical behavior of radon, in U.S. Geological Survey, Geologic investigations of radioactive deposits, semiann.
progress report, June 1 to November 30, 1957:
U.S. Geol. Survey Rept. TEI-700: 243-246
[Cells for measuring the a activity from radon in flowing soil gas were constructed of an open-ended aluminum
can with its inside frosted, viewed by a type 5819 photomultiplier tube, a brass inlet tube leading through a hole
in the closed end of the aluminum can to a discharge point near the face of the photomultiplier tube, a brass
outlet tube leading from behind the closed end, and an outer "2-inch" diameter pipe and O-ring seals to provide
hermetic sealing of the system, except for the inlet and outlet tubes. A soil-gas extraction probe, employing
a two-packer system patented by GX. Hassler (1940) and providing a guard against atmospheric dilution, was
used with a laboratory vacuum pump, vinyl tubing, stopcocks, and gauges. The photomultiplier output was fed
to a ratemeter and recorder. The system yielded « 1 count/min per 40 Bq/m^ (1 pCi ^Rn/L) of soil gas.
The system was used in a hand-augered borehole above a uranium deposit at 3-m depth in dry groimd in
Karnes County, Texas. A reduction in the radon concentration from «0.44 to 0.13 MBq/m^ («12 to 3.4
nCi/L) was found at a depth of 86 cm, indicating that the radon was not migrating from the deposit itself.
Alpha spectrometry of soil samples indicated that the radon was derived from local ^^^a and over
distances of a few cm.]
Tanner, Allan B., 1986
Geolo^cal factors that influence radon availability, in Indoor Radon, Proceedings of the APCA International
Specialty Conference, Philadelphia, Pa., February 24-26, 1986:
Air Pollution Control Assoc., P.O. Box 2861, Pittsburgh, PA 15230, Pub. SP-54, p. 1-12
There is great need for the characterization of locahties with respect to their potential for supplying radon to
structures, especially where the number of existing structures is insufficient for valid sampling. Although the
interaction between a structure and the ground is not quantitatively known, it is practical to assume that the
ground can be characterized as to the rate at which radon can be drawn from it by a structure: a measure of
radon availability. Radon availabihty is related mainly to the concentration of radon in the spaces in rock
fractures and soil pores and to the permeability of the ground to gases. The fraction of radium disintegrations
producing radon that reaches those spaces usually falls within the range of 0.15 to 0.55. Permeability and the
157

diffusion coefficient are reduced markedly as the sizes of those spaces are reduced and as the proportion of
the spaces filled by liquids is increased. Coupling this knowledge with that of the geology, soil, hydrology, and
topography of a locality should permit qualitative evaluation of radon availability. Rock types that usually have
above-average concentrations of radon in the pore and fracture spaces include granites, some gneisses,
phosphatic rocks, marine shales, and some recrystallized limestones and dolomites. Construction of buildings
in contact with such rocks, if fractured, requires special radon barriers. Residual soils, notably terra rossas, are
often enriched in radium. Groimd with coarse grain size (such as gravels and coarse sands), particularly if well
drained, is highly permeable and apt to make more radon available than would be expected on the basis of
its radium content. At the other extreme, muds and clays tend to be of low permeability, especially if wet.
Ground that does not pass a percolation test should have low radon availability unless enriched in radium.
Buildings located on hillsides and ridges are more apt to be located on soils that are coarser and better drained
than those in adjacent valleys. Other things being equal, radon availability should be greater on hillsides and
ridges.
Tanner, Allan B., 1988
Measurement of radon availability from soil, in Marikos, Mark A., and Robert H. Hansman, eds.. Geologic
Causes of Natural Radionuclide Anomalies, Proceedings of the GEORAD Conference, St. Louis, Mo., April
21-22, 1987:
Rolla, Mo., Missouri Dept. Nat. Resources, Div. Geology and Land Survey Spec. Pub. No. 4, p. 139-146.
A method is under development to evaluate the intrinsic ability of the ground at a specific site to be a source
of indoor radon. Radon availability, a quantity that indicates a practical upper limit to the amount of radon
that can be drawn into a structure from the soil, is here defined as the radon concentration in the soil pores
multiplied by the mean one-dimensional migration distance of radon in a homogeneous soil. This distance is
calculated fi-om the effective diffusion coefficient and a steady-state convection velocity calculated fi-om the gas
permeability of the soil in question, by using an arbitrary standard driving-pressure difference. From estimated
extreme ranges of radon concentration, effective diffusion coefficient, and gas permeability, radon availability
values should range from 10 Bq/m^ (3x10^ pCi/m^) to 10® Bq/m^ (3x10^ pCi/m^), althou^ it is unlikely that
the higher end of the range would be realized. A practical method of determining radon availability is based
on analyzing the radon concentration in air drawn from a small augered hole in the ground, simultaneously
measuring permeability in situ, and estimating the effective diffusion coefficient by means of soil type and
moisture content. Measurements are being made in places where indoor radon concentrations are known, in
order to test the utility of the method and the spatial and temporal variations of radon availability.
Tanner, AJB.y 1988
A tentative protocol for measurement of radon availability from the ground, in Natural Radioactivity,
International Symposium on the Natural Radiation Environment, 4th, Lisbon, Portugal, December 7-11, 1987,
Proceedings:
Radiation Protection Dosimetry, 24(1/4): 79-83
A procedure is being tested in order to determine its suitability for assessing the intrinsic ability of the ground
at a particular site to supply ^Rn to a basement structure to be built on the site. Soil gas is sucked from a
borehole probe through an alpha scintillation chamber and flow meter by a pump. The permeability of the
soil is calculated from the flow rate and the pressure difference between the atmosphere and the borehole at
the intake point. The diffusion coefficient is estimated from the water fraction in the soil pores. The upward
migration distance for radon in such soil during one mean life is computed for an arbitrary steady pressure
difference. This mean migration distance, multiplied by the measured radon concentration, gives the "radon
availabih^ number." Measurements at sites of known indoor radon concentration suggest that numbers below
2 IsBq/wr indicate little chance of elevated indoor radon and above 20 kBq/m^ indicate that elevated indoor
radon is likely. The range of uncertainty and the point-to-point and seasonal variations to be expected are
under investigation.
Tanner, Allan B., 1988
158

A tentative protocol for measurement of radon availability from the groimd:
Northeastern Environmental Science, 7(1): 58-62
[A slightly revised version of the above paper.]
Tanner, A.B., 1989
Error in measuring radon in soil gas by means of passive detectors [abs.]:
Eos, Am. Geophys. Union Trans., 70(15): 497
Passive detection of radon isotopes depends on diffusion of radon atoms from the sites of their generation to
the location of the detecting or collecting device. Examples of passive detectors are alpha-track and electret
detectors, charcoal-canister and organic-liquid radon collectors, and gamma-ray detectors placed in
nonradioactive permeable material thick enough to shield the detector from direct gamma rays from radon
sources in the soil. Because some radon decays en route to a passive detector in soil, the radon concentration
measured by the detector must be less than the radon concentration in the interstitial spaces of the soil where
the concentration is undiminished by diffusion to the detector cavity. The maximum radon concentration
measured by a passive method can be modeled by diffusion from an isotropic, homogeneous medium inward
along the radii of a spherical cavity. The approximate minimum radon concentration can be modeled by
diffusion along radii of a cylindrical cavity. Analytic solutions for diffusion in these models indicate that at less
than about 80 percent water saturation tiiere is little underestimation of the true soil-gas ^^^Rn concentration
if the detector cavity diameter is less than about 5 cm, but the underestimation is serious in a cavity 1 m in
diameter. The degree of underestimation is strongly dependent on the degree of water saturation of the soil
pores; thus, some observed fluctuations of radon concentration in soil gas measured by passive detectors maybe due entirely to variation in the water content of the soil.
Tanner, A.B., 1989
A tentative protocol for measurement of radon availabiUty from the ground, in Osborne, M.C., and Harrison,
Jed, Symposium Cochairmen, The 1988 Symposiiun on Radon and Radon Reduction Technology, Proc,, Vol.
2, Symposium Poster Papers:
Research Triangle Park, N.C., Radian Corp., U.S. Environmental Protection Agency Pub. EPA/600/9-89/006b
[Springfield, Va., NTIS Order No. PB89-167498], p. 3-15-3-24.
Tanner, Allan B., 1989
The source of radon in houses, in Harley, N.H., ed.. Radon. Proceedings of the Twenty-Fourth Annual Meeting
of the National Council on Radiation Protection and Measurements, Washington, D.C., 30-31 March 1988:
Bethesda, Md., Natl. Council on Radiation Protection and Measurements, Proc. ser., no. 10: 159-168
[Methods of estimating values of critical factors for radon potential mapping are discussed.]
Tanner, A.B., 1991
Error in measuring radon in soil gas by means of passive detectors:
Nuclear Geophysics, 5(1/2): 25-30
[Examples of passive detectors are a-track, electret, and semiconductor cups; charcoal-canister and organic-liquid
radon collectors; and 7-ray detectors placed in nonradioactive permeable material thick enough to shield the
detector from the direct 7 rays fi'om radon sources in the soil. Radon detection by passive methods depends
primarily on diffusion of radon from the soil into the detector cavity. Because some radon decays en route to
the cavity, the radon concentration in the cavity is necessarily less than in the gas phase of pores in the soil
where the radon concentration is undiminished by migration to the cavity. The true radon concentration maybe significantly underestimated in moist soils. Analytic expressions, based on models of spherical and cylin-
drical diffusion paths, are presented to permit calculation of the degree of underestimation.]
Tanner, Allan B., 1991
Methods of characterization of ground for assessment of indoor radon potential at a site, in Gundersen, Linda
C.S., and Richard B. Wanty, eds.. Field studies of radon in rocks, soils, and water:
159

U.S. Geol. Survey Bulletin no. 1971, p. 1-18
The concentration and mobility of radon-222 in soil interstices control the potential of ground to supply radon
to a structure. Radon mobility depends on its diffusivity and on the permeability of the ground to fiow of soil
gas. Several sod-probe methods currently imder development can be used to measine the radon concentration
in sod gas and to obtain gas-flow characteristics from which the gas permeability of the ground can be inferred.
The radon diffusion coefficient can be inferred from measurements of the porosity and pore water fraction of
samples of sod removed for emplacement of the sod probe. General principles of sod development and tests
made with a special sod probe indicate that layered soils are more permeable to gas flow in the horizontal than
in the vertical direction, although cracking in soils can cause high vertical permeability along the cracks. Sod
cracks and rock fractme systems pose problems of test-probe spacing and modeling that have not been
resolved. Changes in the degree of pore water saturation can affect the radon concentration in the gas phase
by as much as a factor of 4 and radon mobility by as much as 3 orders of magnitude. In order to lessen the
effects of short-term meteorological and seasonal changes on characterization of the ground, sod-probe
measurements should be made as deeply as is feasible, ideaUy to the depth of the slab of a budding to be
constructed at the site. For slab-on-grade and crawl-space house sites, the sod may be best characterized by
means of sod-gas accumulators operated with a degree of suction comparable with that exerted by a house
during the season in which the house is heated.
Tanner, Allan B., 1991
The role of diffusion in radon entry into houses, in The 1990 International Symposium on Radon and Radon
Reduction Technology, Atlanta, Ga., 19-23 February 1990:
Research Triangle Parl^ N.C., U.S. Environmental Protection Agency Rept. EPA600/9-91-026b, Proceedings,
Vol. 2: Symposium Oral Papers, Paper No. V-2, p. 5-21—^5-32 [NTIS Order No. PB91-234450/AS]
Pressure-driven flow of radon-bearing sod gas is commonly accepted as the usual mechanism whereby radon
moves from the exterior of a house foundation to cause an elevated indoor radon concentration. It is less clear
how radon moves to the backfiU-and-subslab zone just outside the foundation. Twenty-three houses having
elevated indoor radon concentrations were investigated by the U.S. Environmental Protection Agency and its
contractors. The permeability of the ground to gas flow was measured next to and several meters from each
house foundation. For 6 of the 23 houses none of the permeability values exceeded 8x10'^^ m^, below which
diffusion is likely to be the dominant mechanism of radon movement. Because it can be significant in
unsaturated soils of moderate-to-low permeability, diffusion should not be ignored in considering radon
movement to house foundations.
Tappan, J. T[ell], 1989
Passive radon reduction techniques for eating and new structures, in Osborne, M.C., and Jed Harrison,
Symposium Cochairmen, The 1988 Symposium on Radon and Radon Reduction Technology, Proc., Vol. 1,
Symposium Oral Papers:
Research Triangle Park, N.C., Radian Corp., U.S. Environmentsd Protection Agency Pub. EPA/600/9-89/006a
[Springfield, Va., NTIS Order No. PB89-167480], p. 7-29-7-50.
[Open land was evaluated for a planned major residential development near Carefree, Arizona. Portable gammasurvey of the manitic terrane indicated about twice normal background (20 /xR/hr). Elevated indoor radon
(to 241 Bq/m^ or 6.5 pCi/L) was present with the house heating system on for a 14-hr period, but not with
the house heating s^tem off for a 14-hr period during which the indoor temperature was lower than the
outdoor temperature.-ABT]
Terry, David B., and Robert D. Shume^o, 1988
Geologic correlation with elevated indoor radon occurrence, Bergen County, New Jersey [abs.], in Radon in the
Northeast: Perspectives and Geologic Research (conference), Troy and Albany, New Yorl^ May 31-Jime 2,
1988:
Northeastern Environmental Science, 7(1): 10
160

More than 250 measurements of indoor radon concentrations in Bergen County, New Jersey, indicate strong
correlation between elevated indoor radon levels and certain geologic environments. Specific geologic areas
identified as having high radon production underlie nearly 95% of the homes with radon concentrations in
excess of 148 Bq/m^ (4 pCi/L). Bedrock geology in the county comprises Precambrian granitic gneiss of the
Reading Prong, fine- to coarse-grained sedimentary rocks of the Triassic Newark Basin, and diabase and basalt
deposits also of Triassic age. The bedrock is in most places overlain by unconsolidated glacially deposited
sediments of late Pleistocene age. The greatest percentage of homes having naturally occurring indoor radon
concentrations exceeding the government-recommended standard of 148 Bq/m^ (4 pCi/L) are found in three
geologic settings: (1) the Stockton-Lockatong Formation section, which comprises shales, sandstone, and
argillite with higher-than-average uranium content; (2) the Valley-Fill Deposits sections, which contain thick
deposits of coarse, glacially deposited sand and gravel; and (3) the Reading Prong section. Population density
in the zones of elevated concentrations is concentrated in the Stockton-Lockatong Formation and Valley-Fill
Deposits sections, where more than 45% of the homes tested exceed 148 Bq/m^ (4 pCi/L). Radon production
in the Reading Prong appears to be high, but very few homes have been constructed in this section. Elevated
radon (>148 Bq/m^ or >4 pCi/L) occurrence in the remainder of the county was observed in only 4% of the
homes tested. Although radon production in the Reading Prong and Stockton-Lockatong sections may be
attributed largely to bedrock uranium enrichment, high soil permeability is considered the controlling factor
in the Valley-FiU Deposits section.
Thomas, D[onald] M., Jfeff) M. Cotter, emd D[iana] Holford, 1992
Experimental design for soil gas radon monitoring:
Jour. Radioanalyt. Nuclear Chemistry, Articles, 161(2): 313-323
[In order to avoid disturbance of the soil-gas regime by automated sampling and counting of the soil gas, passive
400-mm^ diffused-junction silicon detectors protected by aluminized mylar were used to continuously monitor
^^^Rn in soil gas on the island of Oahu, Hawaii. Thoron (^^^Rn) was excluded from the counting volume of
the detector by means of a thin polyethylene diffusion-retarding barrier. The differences between pressure at
the sampling depths and the atmosphere, soil moisture, rainfall, barometric pressure, and wind speed and
direction were monitored simultaneously. Radon activities ranged from «0.7 to « 2.0 kBq/m^, which required
integration times of >1 h. At 1.5-m depth, radon activity data, smoothed by a 4-h moving window, showed
inverse correlation with 12-h-period atmospheric pressure variations due to solar tidal effects on the
atmosphere (the S-2 pressure signal). Smoothing of the same data with a 12-h moving window showed
correlation of the radon activity with pressure drops associated with the passage of storm systems across the
island chain. The largest change in radon activity was associated with a rainfall of «0.75 m over a period of
«60 h, following which the radon activity increased «15%; possible causes were (1) sealing of the soil by
hydration, reducing advective and diffusive losses of radon to the atmosphere, and (2) water displacement of
radon from smaller to larger pores, increasing access to the detector. The relative magnitudes of diurnal radon
variations were greater for one month after the greatest rainfall than before it; the most plausible explanation
was that sealing of the upper soil layers caused greater "breathing" of the lower soil layers through the lined
probe well in which the detector probe was emplaced. In a subsequent study, the detector holes were filled
in almost to the levels of the probe tops, the probe bottoms being at depths of 0.5, 13, and 2.3 m; the
breathing effect was eliminated. Initial results from the new monitoring array tended to confirm the earlier
findings that rsdnfaU-induced changes in soil moisture have the greatest effect on soil-gas radon concentrations
and that barometric pressure variations exert strong control over soil-gas advection from the shallow soil layers
to the atmosphere.]
Thomas, M[argaret] A., and J.N. Hollis, 1988
Correlating radon distribution with geology and areal radioactivity in Connecticut [abs.j, in Radon in the
Northeast: Perspectives and Geologic Research (conference), Troy and Albany, New York, May 31-June 2,
1988:
Northeastern Environmental Science, 7(1): 10
161

The Connecticut Department of Environmental Protection (DEP), through the Natmal Resources Center
(NRC), has been working with the Connecticut Department of Health Services (DHS) since 1985 investigating
the occurrence of radon in the state. Through the DHS Connecticut Radon Survey (1985-1987) the bedrock
weU waters of 262 homes were tested. Additionally, 202 of these homes had long-term living-area radon tests
and 34 homes had basement air radon screening tests. In the winter (1986-1987) the Connecticut-USEPA
Indoor Radon Survey conducted 1562 basement air radon screening tests statewide. In siunmer 1986, the NRCconducted a carbome 7-scintillation survey to map ambient radiation, traversing approximately 2200 km of
roads across the major geological terranes [areas of a prevalent rock type] of the state. In addition, the NRChas digitized USGS published (1966) Connecticut aeroradioactivity mapping. Using the DEP’s computerized
geographic information system, the NRC is comparing measured indoor air and well-water radon data with
bedrock geology and areal radioactivity (carbome survey and aeroradioactivity mapping). HA positive
relationship was found between basement indoor radon and mapped aeroradioactivity. The percentage of
radon tests >148 Bq/m^ (>4 pCi/L) increased by approximated 10% with a 200 counts/s 7 increase in
mapped aeroradioactivity. The percentage of homes >148 Bq/m^ (>4 pCi/L) ranged from 0% in locations
mapped as <300 counts/s 7, to 32.9% in areas mapped as 700-900 counts/s 7 . fFor the most part,
aeroradioactivity mapping and carbome survey data for geological terranes correspond well with bedrock well-
water radon and indoor-air radon. Highest areal radioactivity and radon values were found within the stratified
metamorphic rocks of the Merrimack Synclinorium, with 84.3% of the terrane >500 counts/s 7,and carbome
data of 13.5% >60 counts/s 7 . For this terrane, 423% of the measured bedrock well-water radon was
>370 kBq/m^ (>10nCi/L), and 26.2% of the indoor-air radon was >148Bq/m^ (>4pCi/L). The
sedimentary rocks of the Newark Terrane had the lowest areal radioactivity, with 27.3% >500 counts/s 7,and
carbome data of 0.04% >60 counts/s 7 ,with measured well-water radon of 2.1% >370 kBq/m^ (> 10 nCi/L),
and air radon of 9.4% > 148 Bq/m^ (>4 pCi/L). HWithin a single terrane, intrusive granitic units typically had
a much higher geometric mean air (G.M.3)
and water (G.M.^) radon concentrations than stratified
metamorphic units. Within the Connecticut Valley Synclinorium of western Connecticut, the NonewaugGranite (G.M.3 = 160 Bq/m^, 4.4 pCi/L; G.M.^=1.01 MBq/m^, 27.169 nCi/L) and Pinewood Adamellite
(G.M.3 = 160 Bq/m^, 4.4 pCi/L; 1 water sample only at 0.806 MBq/m^, 21,778 pCi/L) had considerably higher
radon levels than the Ratlum Mountain Schist (GJM.3=70 Bq/m^, 1.9 pCi/L; G.M.^= 0.154 MBq/m^,4.152 nCi/L). This difference in radon levels is also reflected in the Merrimack Synclinorium in eastern
Connecticut where manitic gneiss units of the Canterbury Gneiss (G.M.3=100 Bq/m^ 2.8 pCi/L;
G.M.^=0.10 MBq/m, 26,841 pCi/L) and the Eastford phase of the Canterbury Gneiss (G.M.j,=170 Bq/m^,
4.6 pCi/L; G.M.^=0.49 MBq/m^, 13,217 pCi/L) contrast sharply with the Brimfield Schist (G.M.3=48 Bq/m^,
13 pCi/L; G.M.^= 0.036 MBq/m^, 36,260 pCi/L). ^Regardless of lithology and terrane association, a positive
linear relationship (r=0.85) between geometric mean well-water radon and indoor-air radon from 18 geologic
units was found. From individual homes, paired radon analyses have shown a ratio of bedrock well-water
radon to living area-air radon of 037 MBq/m^ (10 nCi/L) to 59 Bq/m^ (1.6 pCi/L) (confidence interval 30
to 130 Bq/m^or 0.80 to 3.4 pCi/L), and an estimated 18% contribution to indoor-air radon levels from well-
water radon. ^Correlation between areal radioactivity and measured radon data for geolo^c terranes have
provided a useful overview for interpreting the occurrence of radon in the State. Correlations between
measured radon data and individual geologic imits have provided specific geographic detail. Future work will
compare areal radioactivity with measured radon data for individual geologic units in order to permit moredetailed radon potential evaluations. [See Siniscalchi et a/., 1991.]
Tovedal, H[ans G.], 1984
Radon measurement activities and instnunents designed at Studsvik Energiteknik AB:Radiation Protection Dosimetry, 7(1-4): 215-218
Chem. Abs. 101:99845t
Tsang, Y.W., and T.N. Narasimhan, 1992
Effects of periodic atmospheric pressure variation on radon entry into buildings:
Jour. Geophys. Research, 97(B6): 9161-9170
162

[(See Narasimhan et al., 1990, for preceding work.) Integral finite-difference modeling was used to estimate
variations of radon entry into a basement house caused by atmospheric fluctuations superposed on a steady
5-Pa depressurization of the basement. Radon entry by both diffusive and advective means, and both a bare
dirt floor and a slab with a 1-cm perimeter crack were considered. Short-period, 30-min fluctuations of 100-Pa
peak-to-peak amplitude, and daily fluctuations of 500-Pa peak-to-peak amplitude were chosen to be
representative of real atmospheric pressure changes. For 10'^® to 10'^^ m^ permeability of a homogeneous soil
5 m deep, above a water-table lower boundary, the modeling predicts increases of radon entry of up to 120%
of that obtained by steady-state modeling. Short-period pressure pumping superimposed over a 5-Pa steady
depressiuization above a basement slab with crack over a homogeneous high-permeability (lO'^^-m^) substrate
yields a radon entry a factor of 10 greater than that attributable to diffusion only. A higher-permeabihty
aggregate beneath the slab and over the natural soil increases radon entry by pressure transients.]
Turk, Bradley H., Jed Harrison, Richard J. Prill, £md Richeird G. Sextro, 1990
Developing soil gas and ^^^Rn entry potentials for substructure surfaces and assessing ^^Rn control diagnostic
techniques:
Health Physics, 59(4): 405-419
[This paper describes procedures, developed at seven New Jersey research houses containing elevated radon
levels, for diagnosis of radon infiltration paths and guidance of mitigation efforts. Although radon entry with
soil g2is is presumed, a thorough visual inspection of a house, measurement of radon exhalation from walls,
and testing of the ^^Rn level in the domestic water supply are included in the procedure. Pressure changes
caused by air-consuming or exhausting appliances are measured by cycling the appliances. Substitute doors
containing strong fans ("blower doors") are used to determine a measure of air infiltration ("effective air
leakage area") of the above- and below-ground zones of the house. Test holes through the foundation walls
and slab are used to measure ^Rn concentrations outside the foundation and flow rates through the test holes
under controlled underpressures in the house. Soil permeabilities measured by means of soil probes emplaced
around the houses had an aggregate geometric mean of «40x 10'^^ m^ and a geometric standard deviation of
22.1 and ranged from <« lx 10*^ to « lx lO"® m^. The permeabilities measured by probes in the backfill zones
around the foundation walls tended to be greater than did the undisturbed ground, and there were extreme
contrasts between the very high permeabilities of the subsalb gravel layers and the compacted ground below
them. With the basements held at different controlled underpressures relative to the soil, the soil pressure
fields were mapped by sensors in various test holes. Two terms are defined, soil gas entry potential, analogous
to electrical conductance and measured in m^.Pa‘^.s"^, and radon entry potential, equal to the product of the
soil-gas radon concentration and the soil gas entry potential in Bq.Pa'^.s' . Differences in radon entry potential
from test hole to test hole at a house provides useful information to guide mitigation. It was found that the
resistance of the soil to supplying radon to the foundation is generally greater than the resistance of the
foundation to radon entry.]
Turk, Bradley H., Jed Harrison, Richard J. Prill, and Richard G. Sextro, 1991
Soil gas and radon entry potentials for substructure surfaces, in The 1990 International Symposium on Radonand Radon Reduction Technology, Atlanta, Ga., 19-23 February 1990:
Research Triangle Park, N.C., U.S. Environmental Protection Agency Rept. EPA600/9-91-026b, Proceedings,
Vol. 2: Symposium Oral Papers, Paper No. V-3, p. 5-33—5-51 [NTIS Order No. PB91-234450/AS]
Measmement techniques and parameters that describe the potential for areas of a building substructure to have
high soil gas and radon entry rates have been developed. Flows and pressures measured at test holes in
substructme surfaces while the substructure was intentionally depressurized were used in a highly simplified
electrical circuit to model the substructure/soil network. Data from four New Jersey houses indicate that (1)
the soil was a factor of two to six times more resistant to soil gas flow than substructure surfaces, (2) concrete
slab floors, including perimeter gaps, cracks, and other penetrations, were approximately five times moreresistant to soil gas movement than hollow block walls, and (3) radon entry potentials were highest for slab
floors. These indices of entry potential may be useful for characterizing the relative leakiness of below-grade
substructure surfaces and for determining the selection and placement of radon control systems.
163

Turk, B.H,, RJ. Prill, WJ. Fisk, D.T. Grimsrud, BA. Moed, and R.G. Sextro, 1987
Radon and remedial action in Spokane River Valley houses: Vol. 1: Experimental design and data analysis:
Berkeley, Calif., Univ. CaUfomia Lawrence Berkeley Laboratory Rept. LBL-23430
Ulbak, K[aare], B. Stenum, A[me] Sorensen, B[enny] Majbom, L[ars] Botter-Jensen, and S[ven] P[oul] Nielsen,
1988
Results from the Danish indoor radiation survey:
Radiation Protection Dosimetry, 24(1/4): 401-405
[Indoor radon was measured for 6-month periods with CR-39 a-track detectors in 500 randomly selected Danish
dwellings between April 1985 and March 1986. The annual (arithmetic) mean indoor radon concentrations
were obtained by correcting the 6-month values according to which season they were made; single-family
houses (57%) and multi-family houses (43%) together had a mean of 47 Bq/m^. The maximum single value
was <600 Bq/m^. Single-family houses primarily on moraine clay had a significantly higher mean than those
on other soils, in agreement with measurements of radon emanation from Danish soils (Damkjasr and
Korsbech, 1985).]
U.S. Department of Energy, 1979
National Uranium Resource Evaluation, Interim Report:
U.S. Dept. Energy, Grand Junction Operations Office, Rept. GJO-lll(79), 155 p.
[Plate 5: Areas identified as favorable but with insufficient basis for estimation of potential uranium resources
(smaller scale copy of Preliminary Map No. 30, 1-1-79, same title)]
van Assendelft, A.C.E., and H.M. Sachs, 1982
Soil and regional uranium as controlling factors of indoor radon in eastern Pennsylvania:
Princeton, NJ, Princeton Univ. Center for Energy and Environmental Studies Rept. PU/CEES-145, 68 p.
High indoor radon concentrations in eastern Pennsylvania are associated with specific geological environments.
For example, houses on the Beekmantown formation in the Great Valley [which extends approximately from
Harrisburg to Easton] are likely to have high concentrations. Since the geology of uranium distribution is
better known than that of radon, this study tested the utility of uranium data as predictors of radon
concentrations. Neither available uranium data nor National Uranium Resource Evaluation (NURE) data
proved good predictors in this re^on. We implemented protocols for uranium analysis in soils by paper
chromatographic separation for fluorimetry. Analysis of 40 samples from the region showed that average
values were relatively high (3.5 mg/kg bulk), and that uranium concentrations in soils were not robust
predictors of radon in nearby houses.
van den Boom, Gunter, 1991
Fachbericht uber die durchgefuhrten Untersuchungen im Rahmen des F & E-Vorhabens: "Helium als Indikator
zur Erfassung permeabler Trennflachen und offener Migrationswege in oberen Krustenbereich." [Technical
report on continuing investigations in the scope of the F & E projects: "Helium as an indicator for detecting
permeable faults and open migration paths in the upper crustal region."]:
Hannover, Germany, Budesanstalt fiir Geowissenschaften & Rohstoffe, Rept. 108 204, 46 p.
[Helium and ^^Rn in soil gas at 0.9-m depth were measured by means of the Reimer (1990) technique in a
25-km^ area in the vicinity of Soultz-sous-Forets, France, about 37 km WSW of Karlsruhe, Germany. Theprogram included 575 He and 481 radon determinations. Radon concentrations in soil gas ranged from 2.5
to 312 kB^m^ in a log-normal distribution with a geometric mean of 48 kBq/m^ an arithmetic mean of
59 kBq/m ,and a standard deviation of 36 kBq/m^. From the contour map of radon distribution (Fig. 13),
I estimate that soil gases in »5% of the area exceed 100 kBq/m^.]
van den Boom, Gunter, and Matthias Ort, 1991
164

Reconnaissance survey for determining radon and helium soil-air concentrations in the area of Ronneburg-
Seelingstadt, Germany [abs.], in International Symposium on the Natural Radiation Environment, 5th, Salzburg,
Austria, 22-28 September 1991, Abstracts:
Salzburg, Univ. Salzbmg, Inst, for General Biology, Biochemistry and Biophysics, abs. no. 168
In October 1990, a geochemical reconnaissance survey was conducted in the area of Ronneburg-Seelingstadt
(Thurin^a), Germany, in order to determine the helium and radon concentration in soil air. This is an area
iat includes dump sites of tailings material from a uranium processing plant. The objectives of the study were
to determine the influence of the uranium waste-product disposal on the soil-air radon concentration and to
use helium concentrations to locate zones of higher permeability that may occur in the sediments imderlying
the waste disposal sites. The sample collecting method [see Reimer et al, 1989] is one that is relatively
inexpensive and one that permits the rapid collection of the sample so analyses can be made in the field. The
rapidity of sample analysis after collection is necessary for radon because that radioactive gas has a half-life
of about 3.8 days. Samples were collected by poimding a hollow, thick-walled steel probe into the ground to
a depth of 90 cm by means of an attached sliding hammer. After the probe is in place, a sample is collected
by means of a hypodermic syringe with a needle inserted through an air-tight septum attached to the top of
the probe. The sample in the syringe can be introduced directly into both the radon and heliiun analyzers.
For radon analysis, a small, battery powered a-particle scintillometer is used. The sample is injected into a
pre-evacuated Lucas cell that has been previously calibrated at a radon calibration facility. The number of light
scintillations detected by the machine is directly related to the radon concentration of the sample. Helium
analysis is performed using a leak detector mass spectrometer that has a special inlet system designed to
accommodate the injection of the soil-air sample. The instrument is calibrated frequently by using standard
reference gases between soil-air sample analyses. The mass spectrometer can also be transported to the field
location for rapid sample analysis. Soil air samples for both helium and radon analysis in the study area were
collected on a regular grid with a spacing of 1 km. In order to detect permeable zones in basins near
Seelingstadt, additional sampling, with a spacing of 100 m, for soil-air helium was performed on several
traverses. The underlying geological units in the investigated area provide a natural background of radon to
the soil air. The overall regional background for radon is 88 kBq/m^, and seems to be relatively high. It
combines, however, geologic and anthropogenic influences, the latter mainly in the vicinity of the uranium- and
radium-bearing tailings that fill the open pits west of Seelingstadt. Samples in areas where soil is derived from
Ordovician "Lederschiefer" and undivided Siliuian sediments show background values for radon greater than
100 kBq/m^. In areas where the "Schwarzburger Series" occurs, a rock unit which has no specific uranium
mineralization, the average radon background drops to 57 kBq/m^ in soil air samples. For other samples
collected above the same geological unit, but close to the dumps of the radioactive tailings, the average radon
concentration is more than 125 kBq/m^. High average values (>100 kBq/m^) represent a potential for indoor
radon accumulation possibly exceeding the action standard for radon concentrations in indoor air, which is
established by the Commission of the European Communities at 400 Bq/m^. Overall, the sampling at this grid
density revealed quite well the soil air distribution related to the local geology and the contaminated sites.
Towards the southern part of the survey area, near the location of the dump sites of the manium processing
plant, samples were collected for soil-air helium analyses. The sample spacing of 100 m revealed high helium
concentrations that are consistent with zones of higher permeability caused by faults or open joints. However,
the exact trace of these higher permeability zones could not be determined with this sample density. A higher
density and additional traverses would have to be used to help delineate the extent of the higher permeability
zones.
Vandrish, G., and A. Lebel, 1986
Techniques and equipment for residential radon monitoring, in Indoor Radon, Proceedings of the APCAInternational Specialty Conference, Philadelphia, Pa., February 24-26, 1986:
Air Pollution Control Assoc., P.O. Box 2861, Pittsburgh, PA 15230, Pub. SP-54, p. 244-250
[Soil probes for radon measurement are given brief mention.]
VanOrt, Susan, Charles Kunz, Lamence Keefe, William Condon, Kirk Fisher, and Karim Rimawi, 1992
165

Indoor radon in New York State schools. Preliminary report, in The 1992 International Symposium on Radon
and Radon Reduction Technology, Minneapolis, Minnesota, September 22-25, 1992:
U.S. Environmental Protection Agency, Preprints [poster papers], v. 5, no. VP-6, 18 p.
New York State is participating in a project to study radon in schools funded in part through a grant from the
EPA. The program began in the spring of 1991 and is scheduled to run for three years. Candidate schools
are selected from areas in which existing information suggests that there may be a high risk for indoor radon.
These schools are invited to participate in an indoor radon survey that includes short-term screening
measurements, one-month to three-month follow-up measurements in rooms >148 Bq/m^ pCi/L), and one-
year measmements. Follow-up measurements will be made if a school is mitigated. Twenty-two schools are
being surveyed in the first year (1991/1992) and forty in the second. The soils under and around about one-
third of the schools surveyed will be characterized for indoor radon potential through soil-gas measurements
and examined for correlation with indoor radon concentrations. The information presented in this paper
details initial results of short-term screening measurements made in twenty-two schools and soil
characterization in three of these schools.
Varley, N[icholas] R., and A.G. Flowers, 1991
The relationship between radon and geology in the south-west of England [abs.j, in International Symposium on
the Natural Radiation Environment, 5th, Salzburg, Austria, 22-28 September 1991, Abstracts:
Salzburg, Univ. Salzburg, Inst, for General Biology, Biochemistry and Biophysics, abs. no. 69
In the southwest of England many homes have been found with high indoor concentrations of radon. The annual
effective dose equivalent received from the daughter products is now thought to represent 81% of the total
radiation dose received by the population in this region. The high levels of radon are generally associated with
parts of the re^on on or close to the areas of granite. The uraniferous granite is highly fractured and there
are some major faults in the region. These offer a convenient pathway for the migration of radon originating
in the bedrock. There may also be secondary uranium mineralization within the fractures or faults generating
higher levels of radon at the source. The concentration of radon in the soil gas has been extensively measured
at various geologically contrasting sites in the South-West. The methodology has been refined, with a thorough
assessment of the scintillation methods used in the field to measure the concentration of ^Rn and ^^^^Rn.
A correlation between the measured concentrations of radon in the soil gas and the underlying geological
features has been established. High levels of radon (up to several thousand Bq/m^) have been recorded over
faults, whose position has been confirmed by other geophysical methods. Several homes have been
investigated. It has been found that the measurement of sod-gas radon concentrations, used with geological
data, has significant value as an indicator of high indoor levels.
Verger, P., Ph. Hubert, and S. Ch6ron, 1993
Use of field measurement in mapping [abs.], in First International Workshop on Indoor Radon Remedial Action,
The Scientific Basis and Practical Applications, Rimini, Italy, 27 June-2 July 1993:
Commission of the European C lunities et al.^ Book of Abstracts, p. 79
Field measurement surveys ai essary when identifying radon-affected areas. The campaigns involve
considerable effort. Neverth.w ....«L, the straightforward use of the results might be misleading and statistical
analysis prove to be necessary. This paper describes the work made on the data from French surveys; about
1700 measurements coming from 15 "departments" (French administrative areas) dispatched in various areas.
The measurements were associated with a questionnaire permitting tracking some of the factors that mayinfluence radon concentration. These factors (underground concentrations of uranium and thorium, soil
transfer, housing characteristics, life style of occupants, season) may interact in a complex manner and are not
fully retraced by the parameters collected in the questionnaire (location of the village, building material of the
house, age of the house, room destination and location, number of windows and doors, duration of heating
during the measurement period, duration and time period of the measurement). Various statistical models
have been fitted in order to control those parameters when reconstructing "standardized exposures." Two goals
were followed: First, the analysis aimed to reconstruct an average exposure after correcting for seasonal
variations and type of room. This allows setting up an estimate of an actual exposure, ^ven the actual houses.
166
Then a further analysis was designed to estimate a potential exposure, that is, the exposure that would be
experienced in a "standard house" located in the same places as actual houses. The first estimate is necessary
in risk assessment and in identifying the need for remedial actions. The second estimate is more useful when
addressing policies dealing with new houses or in comparing "exposures" with soil characteristics. Methods and
results are presented and the advantages and limitations of field measurements are discussed.
Viljanen, Martti, Eero Slunga, Timo Lehtoviita, and Pekka Kanerva, 1987
Radon merkitys talonrakennustekniikassa. Radontekninen suunnittelu [Radon in building technology.
Radontechnical design]:
Espoo, Finland, Helsinki Univ. Technology, Dept. Civil Engineering, Div. Structural Engineering Rept. 88,147 p.
This report on the desi^ of buildings, their foundations, and ventilation can be used for both new design and
remedial action. A radon-technical classification of foundation soil is proposed with instructions for defining
low, normal, high, and very high radon classes on the basis of radon content and air permeability of the soil.
Voutilainen, Anne, and Ilona Makelainen, 1991
The use of indoor radon measurements and geological data in assessing the radon risk of soil and rock in
construction sites in Tampere [SW Finland], in The 1991 International Symposium on Radon and Radon
Reduction Technology, Philadelphia, Pa., April 2-5, 1991, Proc., Volume 1, Symposium Oral Papers, Opening
Session and Technical Sessions 1 through 5:
U.S. Environmental Protection Agency Rept. EPA/600/9-91/037A, p. 3-71—3-82
McLean, Va., Cohen (S.) and Associates, Inc. [Springfield, Va., NTIS Order No. PB92-115351]
[Preprints, v. 2, no. 111-8]
The Finnish Centre for Radiation and Nuclear Safety has developed a model that allows the use of indoor radon
measurements to assess the radon availability of soil and rock in construction sites. The effect of the geological
nature of the construction site on indoor radon is distinguished from the construction effects of the house.
The purpose is to divide the mvestigated area into more or less homogeneous subareas and calculate the
percentages of houses exceeding 200 and 800 Bq/m^ in future homes where no precautions have been taken
against radon. In this study 867 indoor radon measurements from the city of Tampere (population 171,000)
were used. The measurements were winter-time two-month averages. The soil and rock types for each house
were determined from [usually surfidal] geological maps and the structure of the buildings from questionnaire
responses. A radon prognosis was made for four different construction sites. For each group of sites,
Tampere was divided into 1 or 2 subareas. Within each subarea, the assessments were also made for different
rock and foundation types. [The sites of most radon trouble in Finland are on eskers: long, narrow, steep-sided
ridges formed of stratified sand and gravel by glacial rivers, that are excessively permeable to water and air.
An esker runs through the center of Tampere. The questionnaires indicated that 14% of the houses were built
on rock, 8% on moraine (sandy till), 17% on clay and sUt, 53% on eskers, and 8% on other sand and gravel
formations. Statistical analyses of the data from existing houses led to prognoses that, of houses built on rock,
those showing by far the greatest frequency of exceeding the 200 or 800 Bq/m^ levels would be those built on
medium-grade metamorphic rocks (phyllite or schist), rock composed of volcanic and sedimentary detritus, and
light-colored granites. The common chemical characteristic of the rocks is relatively high proportions of silica
and potassium, the so-called "add" rocks, \^ch in general have the greatest amount of associated uranium.
The prognosis for houses built on soils but not on eskers was that the highest to lowest expected radon levels
would be found in slab-on-grade houses where the slab is poured between foundation walls, in houses on
monolithic slabs with thickened edges (on grade), in houses with basements (contrary to U.S. experience), and
in houses with crawl spaces. For houses sited on eskers, only crawl-space construction was expected to yield
significantly lower values of indoor radon.]
Vulcani, Julie, and James R. Wood, 1993
Soil gas radon potential of the Upper Peninsula of Michigan: Houghton and Marquette Counties, in The 1993
International Radon Conference, Denver, Colo., Sept. 20-22, 1993:
167

Denver, Colo., Am. Assoc. Radon Scientists and Technologists, Rocky Moimtain Chapter, Preprints,
p. IVP 29—IVP 36
Approximately 117 soil gas and 45 indoor radon measurements were made in the Houghton and Marquette
Counties of Michigan, as part of the United States Geological Survey’s (USGS) program to evaluate radon
hazards in formerly glaciated terrain. Soil gas samples were taken using standard USGS procedures. Indoor
radon samples were taken, using a standard charcoal canister, and sent to a commercial laboratory for
measurement. Average readings from soils over four different formations in Houghton County were in the
range 4.07 to 9.25 kBq/L. Average measurements from Marquette County were in the range 48.1 kBq/L to
259 kBq/L, and the highest soil-gas reading was 274 kBq/L over the BeU Creek Gneiss. The highest indoor
radon reading was 2.96 kBq/L in the city of Hancock. Through the study of sods, the soil’s radon content, and
the bedrock geology, the area’s radon potential was evaluated. Houghton County has a low radon potential,
while the Republic area of Marquette County has a high radon potential.
Wanty, R.B., L.C.S. Gimdersen, and R.R. Schumann, 1990
Geological factors eiffecting radionuclide mobility [abs.], in Gough, L.P. (ed). Proceedings of the USGSEnvironmental Forum 1990:
U.S. Geol. Survey Open-file Rept. 90-288, p. 15-16
A research program funded by the U.S. Geological Survey, Department of Energy, and the Environmental
Protection Agency is being conducted to investigate the geologic factors affecting radionuclide mobility in the
natural environment. The primary focus of the program is Radon-222 (^^Rn) in soil gas and ground water,
and the contribution of ^^Rn in each of these media to indoor airborne ^^^Rn. When present in indoor air,
^Rn is a suspected carcinogen. ^^Rn is a dai^ter in the uranium-238 (^U) radioactive decay series; its
immediate parent radionuclide is radium-226 (^^%a). Our results show that an integrated approach including
geologic, geochemical, and pedologic studies, is the most effective m understanding ^Rn distribution in the
environment. We hope to gain a reliable means of predicting areas likely to have problems with high levels
of^Rn by examining the processes governing the mobility of^Rn as well as its radioactive parents. IfStudies
have been performed in a number of areas around the United States, including the Reading Prong,
Pennsylvania, the Piedmont and Valley and Ridge of the Appalachian Mountains, the Atlantic Gulf Coastal
Plain, the northern Great Plains, and the Rocky Mountains. Our major conclusion is that there is a strong
correlation between local geology and the potential for high ^Rn in soil gas or ground water. Un the
Piedmont and Reading Prong, shear zones (in particular mylonite zones) produce high ^^Rn concentrations
because uranium is redistributed during ductile deformation from resistate minerals, which have a low degree
of emanation, to more highly emanating sites in foliations and associated fractures. Uranium commonly is
associated with iron and titanium oxide grain coatings. The tu^ emanation of ^Rn from the rocks to the
soil gas or ground water causes the very high concentrations of ^Rn found in soils,^ound water, and homes
associated with shear zones, fin areas underlain by sedimentary rocks, variable ^Rn concentrations have
been found in soil gas. For instance, in the northern Great Plains, several types of continental glacial deposits
were foimd to have high concentrations of^Rn in soil gas, resulting in a large proportion of homes with high
indoor ^Rn levels in Iowa, North Dakota, and Minnesota. In the Coastal Plain of the eastern and southern
U.S., generally low concentrations of Rn are found in soil gas and homes. High soil-gas Rn occurs in
glauconitic sandstones, phosphatic claystones and sandstones, black shales, and heavy mineral sand deposits,
fSoil and weather characteristics have a marked influence on radon generation and mobility in soils. Results
of a study at the Denver Federal Center (DFC) showed that as much as a tenfold difference in soil radon
concentrations may occur seasonally as a result of moisture capping effects and formation and destruction of
desiccation cracks in the soil. Shorter term, two- to threefold variations in soil radon concentrations can occur
in response to precipitation, barometric pressure, and other weather factors. Soil type is important in
determining the magnitude of the soil’s response to weather factors. Smectitic soils such as those foimd at
the DFC site are most susceptible to the moisture capping effects noted in the study, finvestigations of^Rnin ground water supplies have shown that extremely high levels of dissolved ^Rn occur in some areas.
Equally important is the finding that high levels of uranium and radium also may exist in these areas. Whenpresent in high enough concentrations in drinking water, these elements pose a threat to human health.
168

Adsorption processes appear to be the major control on the concentrations of uranium and radium, but radon
concentrations seem to be limited by the degree of emanation from the rock to the water as it is produced by
radioactive decay of radium. HFuture studies of radon in rocks and soils will concentrate on radon emanation
and the climatic and geochemical parameters that most affect it. A nationwide study of granites and eissociated
shear zones will attempt to further evaluate some of the most severe radon problems in the U.S. Studies of
radionuclides in ground water will be directed toward a more thorough understanding of the geology,
petrology, geochemistry, and hydrogeology of the rock-water system, and the chemical and physical factors
influencing ^Rn sources. In addition, a more reliable method for estimating the contribution of radon in
domestic water to indoor air will be evaluated.
Washington, John William, 1991
Radon generation and transport in soils [Ph.D. thesis]:
University Petrk, Pa., Pennsylvania State Univ., Dept. Geosciences, 207 p.
In order to determine the extent and causes of radon variabihty in soil gas, repeated measurements of Rn(^^Rn) concentration, Tn concentration, and soil properties including moisture, temperature,
permeabihty, and diffusivity have been made at five sites in central Pennsylvania. Rn and Tn concentrations
varied temporally in an annual, approximately sinusoidal pattern having a ratio amphtude of 2- to 10-fold
between the high and low values at all five sites. The annual pattern is recognizable over a variety of
monitoring methods, soil drainage classes, and bedrock parent materials. UTemporal variability of Rnconcentration is caused mainly by changes in soil moisture content and distribution. The action of soil water
on Rn concentration is classified into two distinct regimes: 1) At low and moderate moisture contents, diffusion
occurs dominantly in air-filled pores and Rn is distributed between air and water approximately at equihbrium.
Under these conditions, Rn concentration in soil air increases with increasing moisture. 2) At high moisture
contents diffusion occurs dominantly in water-filled pores and air/water equilibrium exists only near interfaces.
Under these conditions, Rn concentration in soil air can be low. fSince Rn partitioning between gas and water
is temperature sensitive, and because soil moistiue and temperature change in annual cycles, much of the
variability in Rn concentration occurs in annual cycles. As a result, knowledge of regional and temporal soil
moistiue and temperature patterns, which may be gleaned fi’om soil maps, allows estimates of Rnconcentration in soil gas. These estimates suggest Rn concentrations will be least elevated by moisture effects
in cold, arid soils. Further, temporal variabihty in Rn concentration due to moisture effects is expected to be
less pronounced in arid soils than in most others, fin areas where the soil substrate has a significantly lower
Ra concentration, emanation coefficient, or bulk density than the overlying soil, the substrate can act as a Rnsink with respect to the soil. Under extreme conditions the Rn concentration profile may actuaUy display a
decrease in concentration towards the rock. fThe effect of moisture on Rn exhalation to air-fiUed pores was
evaluated experimentally in the laboratory by measuring Rn concentration in the gas phase of sealed soil cores
having a range of moisture contents. This method generally exhibited a maximum air-phase concentration at
intermediate moisture contents. The relatively low values in the dry range are attributed to lodging of recoiling
Rn in adjacent soil particles. In contrast, the relative lows in the wet range are attributed to diffusion
inhibition of water-filled pores as described above; thus, an assumption of equilibrium distribution between
soil-air and bulk soil-water is often incorrect in wet soils. As a result, this method therefore provides a
reasonable estimate of the combined effects of emanation and diffusion on Rn in soils. fBulk Rn diffusion
coefficients measured at four field sites generally decrease by nearly an order of magnitude in individual soil
profiles from the eluvial to the illuvial horizons. Coarsely textured soils such as sandstone-derived soils have
generally larger diffusion coefficients than finely textured soils such as limestone-derived soils. fSoil
permeability measiued at the field sites decreases by about 2 orders of magnitude fi'om the eluvial to the
illuvial horizons in typical soil profiles. The permeability varies by up to 3 orders of magnitude as a function
of moisture. HThe process of horizon formation during soil genesis significantly affects the vertical distribution
of Rn production in soil through variability in Ra, dry bulk density, and porosity. HA two-dimensional,
steady-state finite difference code for Rn transport in soil has been written. It allows source (Ra, emanation
coefficient, Rn from depth), transport (diffusivity, permeability), and sink (Rn decay, atmospheric Rn activity)
terms to be varied spatially so that heterogeneities can be defined. Observed summer and winter Rn profiles
169

are both reasonably estimated by this model using measured values for Ra, dry bulk density, emanation
coefficient, soil moisture content, soil temperature, and soil diffusion coefficients.
Washington, John W., and Arthur W. Rose, 1988
Relations of soil gas radon to properties of soil and bedrock [abs.]:
Geol. Soc. America, Abstracts with Programs, 20(7): A354
The concentrations of ^^Rn and in soil gas have been measured biweekly by a Lucas-cell type radon
detector in 3 soils developed over dolomite and 2 soils developed over sandstone in Centre County,
Pennsylvania. Integrated monthly ^^^Rn values have also been obtained using a-track detectors. These values
have been compared with soil morphology (USDA nomenclature), chemistry (U, Th, Ra, major elements),
mineralogy, and physical properties (porosity, permeability, diffusion coefficient, temperature, moisture).
Generally, ^^Rn increases with depth in a diffusion-like pattern to a maximum at 1-2 m depth in the strongly
illuviated B horizon. Deeper values are slightly lower. Soil gas samples from < 1 m can significantly under-
estimate maximum values and are more highly variable than deeper samples over periods of weeks. ^^^Rn
values at depth in dolomite soils (3-8 ppm U) reach 110-170 kBq/m^ (3000-4500 pCi/L) in summer and early
fall. ^Rn at depth in fall correlates well with U content at the 5 sites; the sandstone soils have 11-56 kBq/m^
(300-1500 pCi/L) and 1.5 and 2.5 ppm U. A very large seasonal decrease is observed from summer to winter
in the well-drained soils, the mid-winter values being only 10 to 30% of the summer/faU values. The decrease
correlates with temperature difference between the deep soil and open air, and with moisture content, but the
precise mechanism responsible is not clear. Soil permeability decreases by nearly 2 orders of magnitude
through the A and upper B horizons. A new method for measiuing emanation coefficient on soil cores at a
range of water contents has been developed. Emanation coefficients are significantly lower than by previous
methods. Permeability and diffiision coefficient are also measured with this method.
Washington, J.W., and A.W. Rose, 1989
Effects of variation in soil temperature and moisture on radon in soil gases [abs.]:
Geol. Soc. America, Abstracts with Programs, 21(6): A145Radon in soil gases partitions between the air and water phases of soil. The partition ratio, Rn(air)/Rn(water),
depends strongly on temperature, ranging from 1.87 at 0*C to 2.73 at lO^C, 3.88 at 20'’C, and 4.93 at 30*C. For
a soil with a given emanation coefficient, radium, and porosity, radon concentration in the air phase increases
by a factor of nearly 4 at 20*^0 as the moistiu-e saturation increases from 0 to 100%. At conditions near
saturation, changes in temperature and moisture can cause large changes in radon in the air phase. For
example, cooling from 20°C and 99% saturation to 0.rc and 50% saturation decreases radon in the air phase
to about 37% of its imtial value. In contrast, changes of temperature and moisture in the dry re^on have
relatively little effect. Because of these effects, soils in humid regions that experience sub-freezing
temperatures are characterized by significant seasonal variations in radon content. This behavior is observed
for some soils from central Pennsylvania which typically are near saturation and 0°C to 3*’C at 0J5 m and
deeper during winter, and at 15*C to 20**C with moisture saturation of about 0.8 during summer. The lowest
radon values are in the winter for these soils, which are dominated by temperature effects. In contrast,
reported seasonal variations for soils that are less moist and remain weU above freezing typically show highest
radon in winter, interpreted to result from the increased soil moisture during winter. Radon entering homesis also expected to vary as a function of climate.
Washington, John W., and Arthur W. Rose, 1990
Regional and temporal relations of radon in soil gas to soil temperature and moisture:
Geophys. Research Letters, 17(6): 829-832
[Excluding losses of radon to the atmosphere, the concentration of radon in soil gas is controlled by the radium
concentration, emanating power, dry bulk density, particle density, fractional water saturation, and temperature
of the soil. In 5 sites in Pennsylvania, soil-gas radon concentrations were 2-10 times lower in winter than in
late spring or summmer, which can be partly explained by the increased partition ratio, with
decreased temperature of the soil water. A graph of soil temperature vs. fractional water saturation, divided
170

into four soil temperature regimes and three soil moisture regimes, shows a family of curves of constant radon
concentration in soil gas; combined moistme and temperature change along the curves (as from w£irm-dry to
cool-moist) would yield less change in concentration than change normal to the curves (as from warm-moist
to cool-dry). The graph enables one to see easily what seasonal trends should obtain in various climates.]
Washington, John W., and Arthur W. Rose, 1992
Temporal variability of radon concentration in the interstitial gas of soils in Pennsylvania:
Jour. Geophys. Research, 97(B6): 9145-9159
In order to determine the extent and causes of radon variabihty in soil gas, repeated measurements of ^^^Rn,
^^^^Rn, and soil properties including moisture, temperature, permeability, and diffusivity have been made at five
sites in central Pennsylvania. Concentrations of ^^^Rn and ^^^n to a depth of 2 m varied temporally in an
annual, approximately sinusoidal pattern having an amplitude of twofold to tenfold at all five sites. The
existence of the annual pattern is independent of monitoring method, soil drainage, or bedrock parent material.
Radon variabihty is caused by changes in soil moisture content and distribution; the action of soil water on Rnis classified into two distinct regimes: (1) At low and moderate moisture contents, diffusion occurs dominantly
in air-filled pores, and Rn is distributed between air and water approximately at equihbrium. Under these
conditions Rn in soil air at depth increases with increasing moisture. (2) At high moisture contents diffusion
occurs largely in water-filled pores, and air/water equihbrium exists only near interfaces. Under these
conditions, Rn in soil air can be low. Since Rn partitioning between gas and water is temperature sensitive
and because soil moisture and temperature change in annual cycles, much of the variabihty in ^^^Rn
concentration occurs in annual cycles. As a result, knowledge of regional and temporal soil moisture and
temperature patterns aUows estimates of ^^^Rn concentration in soil gas. In areas where the soil substrate has
a si^iificantly lower Rn concentration, emanation coefficient, or dry bulk density than the soil, the substrate
can act as a Rn sink with respect to the soil. Under extreme conditions the [Rn] profile in the soil mayactuaUy display a concentration gradient toward the rock. The process of horizon formation during soil genesis
significantly affects the vertical distribution of Ra, emanation coefficient and porosity, and therefore Rnproduction in soil.
Washington, J.W., A.W. Rose, and DJ. Greeman, 1989
Effect of inhomogeneity of soil properties on radon transport in soil gases [abs.]:
Eos, Am. Geophys. Union Trans., 70(15): 497
Past concepts and models of radon in soil gas have assumed a depth distribution determined by diffusion and
flow in soil with uniform radium content, emanation coefficient, porosity, diffusion coefficient, moisture content,
and permeabihty. Measurements for sk soil profiles in Pennsylvania and North Carolina show large variations
in these properties; also, variation of moisture content with time causes variation of other properties with time.
Field permeability measured with a 10-cm diam. ring pushed 10 cm into pit walls commonly varies by xlO to
x50 within a profile. The A horizon usually has much higher permeability than the B horizon. Diffiision
coefficients measured in the field show a similar large range, correlating with permeability. Radium commonlyvaries by x2 within profiles. Moisture content varies widely with depth, and is generally much higher in winter
than in summer. Emanation coefficients measured in the lab at a range of moisture tensions show values as
low as 0.03 for near-saturated conditions, compared with values of 0.10 to 0.40 for disaggregated soils
suspended in water. Both models and observations of radon activity in soil gas reflect these inhomogeneities
by complex vertical profiles that change with time.
Washington, Paul A., 1988
Proper scaling of radon surveys: A perspective based on natmal radon sources in southern Vermont, in Radonin the Northeast: Perspectives and Geolo^c Research (conference), Troy and Albany, New York, May 31-June
2, 1988:
Northeastern Environmental Science, 7(1): 40-44
Commercial exploration for uranium during the late 1970s discovered several uranium prospects and one thorium
prospect in southern Vermont. At the same time, the federal survey [NURE] of uranium resources was finding
171

very little evidence for uranium in the same area. Other than standard industrial secrecy, the reason for this
discrepancy lies in the different scales at which the exploration was conducted and the sizes of the prospects.
Uranium and thorium deposits in metamorphic rocks tend to be very limited in areal extent. The deposits in
southern Vermont have map dimensions of up to 2 km long by no more than 200 m wide. They aU have
aspect ratios of 5 or more, with intemal narrow linear zones of high concentrations separated by barren or
nearly barren rock. Except where they cross streams or roads, they can be detected only by physically crossing
them in the field. The commercial survey attempted to find them by first detailed sampling of stream
sediments (to find those that cross streams) and road reconnaissance (to find those that cross roads), followed
by detailed field reconnaissance of the likely areas. Because of fiscal constraints, the federal surveys were
conducted on a statistical grid supplemented by easily accessed outcrops. The poor showing of the federal
surveys, attests to the areal limits of the deposits. The implications for radon surveys are that radon sources
(such as uranium deposits) are often very localized, so large-scale surveys are generally of little use.
Wattananikom, K., and T. Sri-Unyu, 1990
Seasonal variation of radon in dwellings in an area close to uraniferous fluorite veins in northern Thailand:
Nuclear Geophysics, 4(2): 289-292
[One-month alpha-track (LR-115 type 2) measurements during each of 3 seasons (rainy, 16 August-19 September
1987; winter, 20-December-25 January 1988; and summer, 19 April-19 May 1988) in 60 dwellings in northern
Thailand showed average winter concentrations about twice as great as those during the rainy season and three
times as great as those in summer. House-to-house differences in radon concentration were also greater
during the winter measurements than during the other periods.]
Wilkening, M.H., W.E. Clements, and D. Stanley, 1975
Radon 222 flux measurements in widely separated regions, in Adams, John A.S., Wayne M. Lowder, and
Thomas F. Gesell, eds.. The Natural Radiation Environment n, Intematl. Sym'^osium on the Natural Radiation
Environment, 2d, Houston, Tex., Aug. 7-11, 1972, Proc., Vol. 2:
U.S. Energy Research and Development Admin. Rept. CONF-720805-P2, p. 717-730 [Springfield, VA, NTIS]
Wilson, Carole, 1984
Mapping the radon risk of our environment, in International Conference on Indoor Air Quality and Climate, 3d,
Stockholm, August 20-24, 1984; Vol. 2: Radon, Passive Smoking, Particulates and Housing Epidemiology,
Birgitta Berglund, Thomas Lindvall, and Jan Sundell, eds.:
Stockholm, Swedish Council for Building Research, Vol. 2, p. 85-92
Extensive regional surveys of radon dau^ters in dwellings, together with research into the causes, has revealed
that radon in soil air is the primary source of indoor radon pollution in Sweden. Documentation of the natural
radiation environment in a geological context is invaluable for tracing areas of high radon risk; for
understanding the local causes of indoor radon problems; and for choosing suitable remedial measures, both
for existing dwellings and for future building structures. Classification of areas into high, normal or low radon
risk must take into account, not only the distribution of uranium and radium in the bedrock and soils, but also
such parameters as soil permeability, water content and thickness of individual soil layers. Gravel in glacial
eskers, for example, has proved in Sweden to give rise to a serious radon problem. On the other hand, days,
with approximately the same radium content, do not generally give rise to a radon problem in dwellings owing
to their very low permeability to movement of soil air.
Wilson, Carole, 1985-1986
Radon - Geological aspects of an environmental problem:
[London Geol. Soc. & Manchester Geol. Assoc.] The Amateur Geologist, Vol. XI, Pt. 2, p. 17-22, 27-33
[From July 1979 to 1983 local health authorities in Sweden had measured radon daughters (RnD) in more than
40,000 houses, mostly those built with concrete containing aerated uraniferous black shale. In about 10% of
the houses, RnD levels exceeded those that could be due to the radium in the concrete, and that a significant
contribution was coming from the ground. Extension of measurements to houses not built of aerated concrete
172

revealed that 11.6% of 3,545 houses contained >400 Bq RnD/m^ of air (0.02 WL). "Geological formations
in Sweden that constitute a high risk for radon in dwellings due to radon in soil air are the Cambrian, uranium-
rich black alum shale formation, and Pre-Cambrian uraniiun enriched granites and pegmatites. The alum shale
formation with its unusually high contents of uranium,vanadium, molybdenum and organic matter is fairly well
known. The lu-anium content can range from 50 ppm - 350 ppm. This formation, owing to its flat-lying
occurrence, covers quite large areas in different parts of Sweden, areas that, owing to the fertility of the land,
are densely populated."..."It is now accepted in Sweden that houses must be better sealed against the ground,
but that the degree of remedial measures will vary with the risk involved. The Radon Commission has
proposed (1983) that the concepts ‘radon safe’ and ‘radon protective’ should be introduced. A ‘radon
protective’ construction should be employed on ground with normal radon contents in soil air (up to 50,000
Bq/m^) to ensure that large volumes of soil air are not taken into a house. A ‘radon safe’ construction, on
the other hand, is necessary where radon levels in soil air are high, and infiltration of only a small volume of
soil air through the foundations would give rise to high indoor RnD levels. In areas where radon levels in soil
air are very low, or the ground under the foundations is impermeable, conventional building techniques are
permitted."
Wirth, Sharon J., Linda C.S. Gundersen, and R. Randall Schumann, 1992
Development of EPA’s map of radon zones, in The 1992 International Symposium on Radon and Radon
Reduction Technology, Minneapolis, Minnesota, September 22-25, 1992:
U.S. Environmental Protection Agency, Preprints, no. VIII-4 [separate paper], 14 p.
A national radon potential map is being developed through a cooperative agreement between the U.S.
Environmental Protection Agency and the U.S. Geological Survey (USGS), in cooperation with the Association
of American State Geologists (AASG). This effort is mandated by the Indoor Radon Abatement Act of 1988
to assist in identifying high radon potential areas throughout the country. The principal audiences for the mapare State and local governments and building code organizations. In addition to the Map of Radon Zones,
a Radon Geologic Province Map and Regional Booklets are being developed to assist in the application of the
map results. This paper discusses the development of the Map of Radon Zones from the technical evaluation
of radon potential to the review process in which many orgemizations are participating.
Witcher, James C., and Rudi Schoenmackers, 1990
Time-integrated radon soil-gas surveys in geothermal exploration in the southern Rio Grande Rift, New Mexico.
Volume 1: Final Report [to U.S. Department of Energy, Geothermal Technology Division, and New MeacoResearch and Development Institute]:
Las Cruces, New Mex., New Mexico State Univ., Southwest Technology Development Institute
...This report evaluates time-integrated radon soil-gas surveys for convective low- to intermediate-temperature
geothermal resource exploration in areas with variable soil development and arid climate. Convective low- to
intermediate-temperatiu’e geothermal resources compose the largest resource base with immediate
development potential in New Mexico. Significant growth in geothermally heated greenhouses is occurring in
southern New Mexico. In fact, two of the largest geothermally heated greenhouses in the nation are foimd
in this area. Results of this radon sod-gas study are expected to result in near-term geothermal greenhouse
development. Also, the method for radon soil-gas surveying outlined by this report is widely applicable because
arid climates, characterized by deep water tables, and active tectonic and geomorphic processes, associated with
variable soil development, are common in the western United States. fThis report outlines a practical methodfor conducting and interpreting alpha-track detector (ATD) radon soil-gas surveys. The method determines
field measurement deviation from an ideal model based upon pure diffusion in a homogeneous soil. Bycomparing actual field measurements of radon soil-gas with a diffusion model prediction of concentration, the
effects of deep-seated radon sources and advective transport are resolved and evaluated. Use of the diffusion
model as a data filter appears to enhance the value of siuA^ey results and make better use of radon as a natural
tracer. An additional advantage of the method is that soil emanation values for the corrections to field data
are measured directly with ATDs. Ifinitial radon soil-gas surveying was performed over a well-characterized
geothermal system around Tortugas Mountain on the Las Cruces East Mesa geothermal field. Subsequent
173

surveys were applied in a true exploration fashion near Radium Springs and Rincon in areas believed suitable
for near-term development with potential for significant shallow convective geothermal resources. The radon
siu^eys were evaluated with temperature-gradient studies. Two additional gradient boreholes...were
subsequently sited to enhance the...temperature-gradient studies coverage. fFindings. Time-integrated orATDradon soil-gas surveys provide a viable low-to-intermediate-temperature geothermal exploration tool. Data
filtering and interpretation is facilitated by application of corrections to ATD measurements that are based
upon a model of pure diffusion. Several geothermally important results fall out of this approach: [1] Most
radon highs, not associated with advective or geothermal processes, are filtered out; [2] Anomalously high
positive radon residuals, resulting from model corrections, have successfuUy identified faults and areas with
higher temperature gradients; and [3] Diffusion model corrected ATD surveys appear to have exceUent
pathfinder potential for targeting shallow upflow zones of geothermal systems. The larger positive radon
residuals discovered by this study are over or immediately adjacent to upflow zones and/or areas associated
with very high temperature gradients. The positive radon residuals may result from advective transport of
radon from the geothermal fluids or from radium enrichment in alteration halos at depth that are associated
with these systems. UMany conclusions concerning radon soil-gas concentrations in arid soils are derived from
this study: [1] Field ATD radon soil-gas measiu-ements have log-normal distributions; [2] Lab ATD radon
emanation measurements of the region’s soils tend to follow log-normal distributions; [3] Results of fieldATDradon surveys are not quantitatively repeatable; however, these surveys are repeatable in a qualitative sense;
highs remain as highs and lows remain as lows; [4] A component of advective transport is probably observed
in most of the survey area soils during the time intervals of the ATD measurements; [5] A correlation between
higher lab soil-radon emanation and higher soil moisture is observed in the Rincon survey; percentages of silt
and clay, as well as clay mineralogy, may play a role; partitioning of radon between gas and water in pore space
may also be responsible;[6]
Windblown sandy soils generally have higher lab soil radon emanation; and [7]
Where bedrock is shallow or highly developed caliche [carbonate-cemented soil] horizons exist, consistently
higher negative radon residuals are frequently observed. In areas of shallow bedrock, decreased diffusion
coefficients 2md porosity substantially deviate actual field conditions from diffusion model assumptions.
However, identification of positive advective residuals associated with faults and geothermal processes is
apparently not affected. Costs of the radon soil-gas surveys described in this report are about $20 to $25 per
sampling site, not including labor. This cost includes two alpha-track detectors, plastic cups, velcro, aluminum
pie pans, plastic sheets, flagging, and mason jars. These costs are comparable with those of helium soil-gas
surveys and are about twice the cost of soil mercury surveys. A major disadvantage ofATD radon surveying
is the length of time required to obtain results. However, the ATD radon survey, coupled to diffusion model
data reduction techniques, gives information with much greater interpretive value and better repeatability than
other types of soil-gas surveys....fRecommendations: Where time is not a crucial factor, time-integrated radon
soil-gas surveying is a good geothermal exploration technique for reconnaissance in favorable geologic terrains
in arid regions. Exposure times for detectors should be not less than 2 months. Detector spacing should not
exceed 300 m for grid surveys. Closer spaced surveys increase the utility of survey results. Grid type surveys
are preferable to profiling because more information on the sizes and shapes of the anomalies are obtained.
The surveys should utilize the diffusion model corrections and approach. Also, interpretation should rely moreon statistically derived anomalies of the corrected or residual values than on general trends in survey results.
FoUow-on temperature gradient studies of positive radon residuals should be sited to cover areas adjacent to
the anomalies, because some positive residuals appear as halos around the areas of highest temperature
gradients. Finally, as with most exploration methods, radon sod-gas surveys should be planned and used in
concert with sound geologic reasoning and other geochemical and geophysical information.
Wollenberg, HA., and K.L. Revzan, 1990
Radium regionalization in Califomia:
Geophys. Research Letters, 17(6): 805-808
[Under the assumption that ^^^a is in equilibrium with in Califomia rocks and soils, comparison of data
on the uranium concentration in the rocks and soils with ^^^Bi 7 radiation data fi-om the National Aerial
Radiometric Reconnaissance project of the National Uranium Resource Evaluation Program indicated a
174

significant discrepancy in the radium concentration estimates in central California. In three l'’x2“ quadrangles,
the aeroradiometric radium estimates were higher by 2is much as a factor of 2 than those obt£iined by weighting
the radium concentrations of rocks according to their areas of exposure. A traverse by a ground-bome 7-ray
spectrometer across two strong aeroradiometric anomalies in the San Jose quadrangle failed to confirm the
anomsdies, perhaps because of atmospheric inversion. Field checking of the aeroradiometric data is urged
before using them to predict indoor radon potential.]
Wollenberg, HA., and A.R. Smith, 1984
Naturally occurring radioelements and terrestrial gamma-ray exposure rates: An assessment based on recent
geochemical data:
Berkeley, Calif., Univ. Calif. Lawrence Berkeley Lab. Rept. LBL-18714, 79 p. [Submitted to Environmental
Geology and Water Resources]
A survey of the geochemical literature and unpublished data has resulted in the cataloging and characterization
of the concentrations of the naturally occurring radioelements, U, Th, and K and their associated rock types.
The purpose of this work is to aid in the planning and interpretation of airborne gamma-radiation
environmental surveys of proposed and operating nuclear power reactors and other nuclear energy related
sites. A data base of over 2500 entries has been assembled, and formulas relating gamma-ray exposure rates
to radioelement concentrations have been applied to these data. The resulting tabulation and histograms
illustrate the broad range of radioactivities encompassed by the various rock types. The gamma-ray exposure
rates of igneous rocks generally vary with their silica contents, and, with the exception of shale, sedimentary
rocks have lower K/U and K/Th ratios than most igneous rocks. By considering together radioelement ratios,
relative abundances, and total gamma radioactivities, the general lithology of overflown terranes may be
distinguished by airborne multi-spectral gamma surveys. In the course of this investigation an appreciable
difference was noted between the overall mean terrestrial gamma-ray exposure rate calculated from rock
radioelement concentrations («8 /iR/hr) and the mean exposure rate from field measurements over soil (5.1
/iR/hr). This difference may be e^mlained by effects of the differences in density of rock and soil, the moisture
content of soil, and the apparent depletion of U in unsaturated near-surface material.
Yokel, Felix Y., 1989
Site characterization for radon source potential:
Gaithersburg, Md., Natl. Inst. Standards and Technology Rept. NISTIR 89-4106, 62 p.
There is need to identify and measure site characteristics which contribute to the emission of radon gas into the
interior of buildings. In present practice this is usually attempted by in situ measurements of gas permeability
and radon activity concentrations in the soil gas. These measurements are sensitive to transient conditions
prevailing at any point in time: the gas permeability is sensitive to soil moisture content; and the radon activity
concentration in the soil gas is sensitive to variations in soil moisture content, atmospheric pressure,
temperature gradients, and wind speed. However, there are measurable invariant soil index properties
(independent of moisture content and atmospheric conditions) which are related to the propensity of sites to
generate and transport radon gas over time. This report deals with the site characterization for radon source
potential using these invariant soil index properties. The advantage of this approach is that the measurements
performed in a site exploration are repeatable, a necessary precondition for any measurement associated with
a standard, and that the calculated source potential represents the propensity for radon generation, rather than
the radon generation under a specific set of conditions, \s4iich may be transient. The site exploration
procedures considered utilize established soil exploration and classification techniques to the maximum extent
possible. HThe most important invariant soil properties identified are radium activity concentration (Aj^), in-
place dry density and porosity of the subsoil (7^5, n), and the dry gas permeability coefficient of the subsoil (k).
These quantities can be either measured or estimated on the basis of soil index properties. Quantities Aj^,
7j, and n can be measured directly by various field and laboratory techniques. The permeability, k, can be
estimate:, on the basis of grain size distribution, which in turn can be measured by established procedures.
An in siiu value of k (not corrected for moisture content) is presently measured by air injection or soil gas
extraction. This measurement is strongly dependent on moisture content. In most instances a correction for
the moisture content would have to be made if this measurement is used to determine dry gas permeability.
175

While equations which correlate soil moisture content with gas permeability have been developed, presently
available information does not provide a reliable basis for a moisture-content correction of gas permeability
without the aid of additional, sophisticated laboratory tests. Alternatively, the coefficient of gas permeability
can be derived from that for saturated water permeability, which in turn can be measured in the field and in
the laboratory. ^Several expressions for radon source potential have been proposed. An additional expression
is proposed in the paper on the basis of data from New York State (Kunz et ai, 1989). The dimensional
correlation between the permeability and radon entry depends on whether the radon transport by convective
flow is dominated by transient or by steady-state flow conditions. Several of the proposed expressions are
derived from steady-state flow conditions. However, available data indicate that the radon concentration is
approximately proportional to (for instance, Kunz et al.^ 1989, Scott, 1985), a dimensional correlation which
is closer to that predicted by transient flow conditions. There are insufficient data to draw conclusions, because
it is difficult to separate the effect of k from that of other variables. fSome of the proposed expressions for
radon soiuce potential use invariant soil properties, while others are linked with site exploration procedures
which measure in-place gas permeability and radon activity concentration in the soil gas without consideration
of transient conditions. All these expressions could be modified to utilize measured invariant soil properties
with a proper allowance for the effect of soil moistiue content. TTwo exploration methods are proposed: (1)
exploration by traditional test boring methods, such as the Standard Penetration Test, supplemented by 7spectroscopy to determine A^ and by a procedure to identify fine-grained soils that are likely to develop
fissures; and (2) a rapid field exploration procedure using a portable spectrometer to determine A|^, a
portable nuclear moisture-density gauge to determine 7^ and natural moisture content, and retrieval of a small
soil sample for laboratory particle size analysis and indirect determination of k. It is suggested that this latter
field procedure could be combined with conventional percolation tests to provide more accurate information
on permeability. Whether method (1) or (2) is used would depend on the scale of the exploration (one
building or many buildings) and on the need for geotechnical data for other purposes (/.e., method (1) would
be used if soil borings are also needed for other purposes). HA plan for further studies is proposed in order
to develop exploration protocols, test the validity of radon source potential predictions, and prepare a draft
standard. [Author’s executive summary.]
Yokel, Felix Y., and Allan B. Tanner, 1992
Site exploration for radon source potential:
U.S. Natl. Inst, of Standards and Technology Rept. NISTIR 5135, 61 + xv p.
[From executive summary]....The purpose of this report is to propose exploration and test methods for the
characterization of the radon source potential of individual building sites and fill materials. In one of the most
commonly used methods of assessing the radon source potential of building sites a volume of soil gas is
extracted and the radon activity concentration in the extracted soil gas volume is measured in a scintillating
cell. At the same time, the gas permeability of the soil is measured by a controlled soil gas extraction or air
injection procedure, in which the required suction or pressure, and the flow rate of the extracted or injected
gas are monitored. While this is an efficient procedure, the measured quantities are sensitive to transitory
conditions, which include soil moisture content and pressure gradients in the soil mass during, and prior to,
the time the measurements are taken. For this reason the measurements are not repeatable. In this report
proposed test and site exploration procedures for the measurement of invariant soil properties are presented.
A tentative protocol for the assessment of the radon source potential of building sites and fill materials is
proposed, which is based on repeatable measurements of invariant soil properties, with corrections for typical
prevailing environmental conditions. HThe measured or estimated soil properties are: the radium activity
concentration per unit dry mass of the soil; the emanation coefficient; the in-place dry density; the porosity;
and the dry gas permeability. The radium activity concentration is measured by 7-spectrometry and the
emanation coefficient is estimated. However, as an alternative, 7-spectrometry can be used to measure the
emanation coefficient if a more accurate estimate is desired. The dry density is measured by retrieving a
relatively undisturbed sample of known volume and establishing its dry weight. As alternatives, nuclear
measurements or other established American Society for Testing and Materials (ASTM) procedures can be
used to measure this quantity. The porosity can be calculated using an estimated value for soil particle density
176

or, alternatively, a value determined by a measurement of the specific gravity of the soil particles by established
ASTM procedures. The dry gas permeability can be determined by a particle size analysis and a recently
developed correlation between gas permeability and particle size distribution. Alternatively, if the soil moisture
content at the time of measurements is not too high, the dry gas permeability can be determined by a
measurement of the moist gas permeability using the soil gas extraction method and a calculation of the dry
permeability using a recently developed correlation between dry and moist permeabilities of granular soils.
Some of the test methods considered are more accurate than others. In order to provide a means for resolving
uncertainties and potential disagreements in the interpretation of test results, the test methods are ranked in
a hierarchical order. Results obtained by more accurate methods would supersede the results obtained by less
accurate methods. Three specific field exploration methods are proposed; however, the required measmements
can be performed by many other exploration methods. The three proposed methods are: (1) The "SPT"
method that utilizes the Standard Penetration Test (ASTM D 1586), which is presently the most commonly
used method of performing soil borings. In addition to the standard procedure specified by ASTM, a relatively
undisturbed core sample is retrieved for determining dry density, and additional imdisturbed samples are saved
to provide enough soU for spectrometry and particle size analysis. The SPT method is the preferred method
in the case where a geotechnical soil exploration is planned for other purposes (such as foundation design or
planning of cut and fill operations). (2) A manual procedure, whereby a soil sample is extracted from an auger
hole, or some other type of excavation and saved for laboratory analysis. A rapid and low cost version of the
manual procedure would use field spectrometry to determine radium activity concentration and visual-manual
soil identification procedures or utilization of the results of percolation tests to determine permeability. (3)
The soil gas extraction test, linked with measurements of in-place dry density and natural water content. The
measured radon activity concentration in the soil gas and the measured soil gas permeability can then be
interpreted on the basis of the soil saturation at the time the measurements were taken. HThe proposed test
and site exploration procedures can be readily integrated with soil exploration and testing procedures used in
present geotechnical engineering practice, and wherever possible present ASTM methods are utilized. In this
way, maximum economy is achieved, particularly if a soil exploration has to be conducted for other purposes.
HAn empirically based expression for radon source potential is proposed in which the radon source potential
is estimated in terms of a "Radon Source Potential Index (Y)". This index is expressed in multiples of the
present Environmental Protection Agency threshold of 150 Bq/m^ (4 pCi/L). The index is based on invariant
soil properties, but can be adjusted for expected environmental conditions, such as characteristic soil water
content, proximity of the groundwater table, and prevailing climatic conditions. On the basis of this index,
radon potential is ranked as Low (Y < 0.5), Moderate (0.5 < Y < 1.5), High (15! < Y < 7), and Very High (Y> 7). Similarly, the use of borrow material is ranked as unrestricted use (UU—no restriction), fill material
(FM—can be used as fill under buildings but requires evaluation), potential resource (PR—can be used if
diluted to FM level), building site restricted (BR—cannot be used under buildings), and Restricted Use(RU—cannot be used near ground surface, even for landscaping). A flow chart for the proposed field
exploration procedures is provided in a summary in Section 7. The summary also contains an index of all the
proposed testing procedures and examples of radon potential evaluations. HThe expression for the radon
potential index must be considered tentative since it is derived from a limited data base. It is recommendedto assemble additional data in order to test, and possibly refine or modify, the proposed radon source potential
index and to examine the practicality and cost effectiveness of the proposed testing procedures by trial
applications. It is also recommended to conduct additional studies on the effect of anisotropy of permeability
and the determination of permeability coefficients on the basis of the particle size distribution and water
content of soils.
Zapalac, Geordie H., 1983
A time-dependent method for characterizing the diffusion of ^Rn in concrete:
Health Physics, 45(2): 377-383
The porosity and diffusion length of concrete have been determined by measuring the time-dependent diffusion
of radon through a thin slab of the material. One surface of the slab is exposed to a large, fixed radon
concentration beginning at t=0. The radon that diffuses out of a portion of the opposite surface is collected
177

during several contiguous time intervals. The total activity collected over a set of intervals beginning at t=0
and the steady-state flux of activity are used to calculate the porosity and diffusion length. As a test of these
parameters, they are then used to predict the activity coUected during other time intervals and for other sample
thicknesses. Samples from two types of concrete were tested: one type yielded a porosity of 0.068 and a
diffusion length of 12.6 cm; the respective values for the other were 0.32 and 16.9 cm. The predicted and
experimental results agreed well, thereby verifying the assumption that concrete may be treated as a
homogeneous diffusion medium for radon.
Zeilinger, P. Robert, 1935
Uber die Nachlieferung von Radiumemanation aus dem Erdboden [On the supply of radium emanation from
the soil]:
Terrestri^ Magnetism and Atmospheric Electricity, 40: 281-294
Geophys. Abs. 81-2972:
The amount of radon given off from the soil was measured by the method of P. Zupancic (1934) with certain
improvements. During December 1933 to October 1934, 150 measurements were made at two points in a
meadow near Hotting; observations were made alternately at these. The average value is 16.1 mBq/m^-s (43.5
aCi/cm^-s). Considering the fact that very few measurements were made in the autumn, it must be concluded
that the annual average is nearly 18 mBq/m^-s (50 aCi/cm^-s). This amount of exhalation t^ees well with
the results of Smyth (Dublin) and Wright and Smith (Manila) who obtained 27 and 7.6 mBq/m -s (73 and 20.5
aCi/cm^-s), respectively. It is interesting to note that P. Zupancic in the garden of the Institute in Innsbruck
obtained an average exhalation of 8.5 mBq/m^-s (23 aCi/cm^-s) (December-July) that is, about half as muchas the author on the meadow in Hotting where the soil was never mixed with fragments of brick, etc. It was
found that the meteorological factors governing the exhalation of radon are not the same in different seasons
of the year. In winter the influence of snow or ice on the ground prevails. The exhalation increases rapidly
when the snow is melting. In spring rather large variations in the amount of exhalation were found
corresponding to large differences of temperature, etc. A lawn-covered area gives off less radon than an area
of the same soil without lawn. The highest values of exhalation were found in July and August. Therelationship of exhalation to different meteorological factors is discussed. Wind decreases the amount of
exhalation measured. This may be due to the removal of radon within the collecting vessel by the small rapid
changes of barometric pressure during high winds. The daily variation of exhalation was studied and foimd
in good agreement with the curve of P. Zupancic. Simultaneous measurements of the radon-content of open
air showed a daily variation similar to that of the exhalation. [Graphs (p. 243) showing meteorological factors,
rate ofRn exhalation, and Rn concentration, appear to me (ABT) to show correlation between falling pressure
and an increased rate of radon exhalation].
Zupandc, P. Reginald, 1934
Messungen der Exhalation von Radiumemanation aus dem Erdboden [Measurements of the exhalation of radium
emanation from the ground]:
Terrestrial Magnetism and Atmospheric Electricity, 39(1): 33-46
Geophys. Abs. 66-2138:
The amount of radon given off from the soil was measured by a new method. An area of 2800 cm^ of lawn as
covered by a zinc cylinder filled with air completely free of radon at the beginning of each experiment. Twelve
or 24 hours later the air from the cylinder after thorough mixing was introduced in an ionization-vessel
calibrated in curies and measured in the usual way. From this measurement the amount of radon e^dialed from
the soil per square centimeter and second can be calculated. The averse amount of this exhalation of radon
as observed in the period December 1932 to July 1933, was 8.5 mBq/m -s (23 aCi/cm^-s). Within the period
mentioned the minimum of exhalation was found in January and the maximum in June. The exhalation during
the day is about 1.5 times as much as in the night hours. The maximum value of exhalation during the
observation period of about six months exceeds the minimum by about 100 times. Exhalation of radon is
mainly governed by the temperatme of the soil, increase of this temperature causing an increase of exhalation
178

of radon. Freezing of the soil decreases the amount of exhalation almost to zero,its variations seem to be of secondary importance.
Atmospheric pressure and
179

APPENDIX B. LIST OF PERSONS OR INSTITUTIONS PRESENTLY ORRECENTLY ENGAGED IN RESEARCH RELATED TOMEASUREMENT AND DETERMINATION OF RADON SOURCEPOTENTIAL OF SITES OR AREAS
[Telephone numbers are indicated for investigators of site-specific methods.]
[Titles are indicated where known only.]
Canada:
Dr. R.S. Eaton
Roger Eaton and Associates
35 Foothills Drive
Nepean, Ontario, K2H 6K6Canada
(613)828-2193
Dr. Robert L. Grasty
Geological Survey of Canada
601 Booth Street
Ottawa, Ontario KIA 0E8Canada
(613)992-1236
Arthur G. Scott
2020 South Millway #11Mississauga, Ontario L5L 1K2Canada
(416)828-2389
Czech Republic:
Ivan Barnet
Geological Survey, Prague
Malostransk6 n4m. 19
118 21 Praha 1
Czech Republic
Fax: 422 53 35 64
Martin Neznal
Radon Corp.
Homick^ 318
471 27 Str^ pod Ralskem
Czech Republic
0042 425 55 076
Josef Thomas & Ladislav Mou5kaInstitute of Hygieixr and Epidemiology
Praha, Czech Republic
180

Denmark:
Dr. Anders Damkjaer
Department of Electrophysics
The Technical University of Denmark
DK-28(X), Lyngby, Denmark45-42-88-11-88
Benny Majbom & Clans Andersen
Ris0 National Laboratory
DK-4000
Roskilde, Denmark45-42-37-12-12
Kaare Ulbak (Cand. Scient.)
Statens Institut for Strilehygiejne
378, Frederikssundsvej
DK-27(X) Br0nsh0j, Denmark45.44.94.37-73
Finland :
Olli Castrdn, Anne Voutilainen, Raimo Mustonen, Hannu Arvela, Mika Markkanen
Sateilyturvakeskus (STUK)StrMsakerhetscentralen
[Finnish Centre for Radiation and Nuclear Safety]
PL/P.O. Box 268
SF-00101 Helsinki, Finland
358-0-08-2455
Eero Slunga & Simo Liukkonen
Helsinki University of Technology
Rakentajanaukio 4 ASF-02150 Espoo, Finland
358-0-451-2855
France:
Alain RannouCommissariat k I’l^nergie Atomique
BJ>.N. 6
92260 Fontenay-aux-Roses
France
Jaques Pradel
Commissariat k I’^nergie Atomique
Centre d’^tudes Nucldaires
D6partement de Protection Technique
BP.N. 6
92260 Fontenay-aux-Roses
France
181

Michel Nowin & Jean Luc Seidel
Commissariat a T^nergie Atomique
B.P.N. 6
92260 Fontenay-aux-Roses
France
Germany:
Gert Keller
Institut fiir Biophysik der
Universitat des Saarlandes
D-6650 Homburg (Saar)
Germany
Ranier Lehmann & Dr. Przyborowski
Bundesamt fiir Strahlenschutz
Waldowallee 117
0-1157 Berlin
Germany
Reine MiiUer
Bundesanstalt fiir Geowissenschaften & Rohstoffe-Hannover
Stilleweg 2, 3000 Hannover
Germany49-51-6432602
Prof. Dr. Agemar Siehl
Universitat BonnGeologisches Institut
Nussallee 8, 5300 Bonn 1
Germany02 28 73 23 99
Dr. Giinter van den Boom & Dipl. Geol. Matthias Ort
Geologisches Biiro ENMOTECBismarckstr. 80
74000 Tiibingen
Germany49 511 738979
India:
Dr. T.V. Ramachandran
Environmental Assessment Division
Health, Safety and Environment GroupBhabha Atomic Research Centre
Bombay-4000 085, India
182

Ireland:
Dr. James P. McLaughlin
University College Dublin
Belfield
Dublin 4, Ireland
L. Tommasino, S. Piermattei, A.F. Susanna, G. Torri
Laboratorio di Misure
ENEA-DISPVia V. Vitaliano Brancati
Rome, Italy
39-06-8528-2076
Hungary:
Dr. Ilona Hunyadi & Jozsef Hakl
Institute of Nuclear Research of the Hungarian Academy of Sciences
ATOMKIH-4001 Debrecen
P.O. Box 51
Hungary
36 52 17 266; Fax: 36 52 16 181
Japan :
Dr. Siro AbeNational Institute of Radiological Sciences
9-1, Amagawa-4Chiba, 260
Japan
[Japan 472-51-2111]
Dr. Masami Fukui
Radiation Control Division
Research Reactor Institute
Kyoto University
Kumatori-cho, Sennan-gun
Osaka(590-04), Japan
Dr. Kazuko MegumiResearch Center of Radioisotopes
Research Institute for Advanced Science and Technology
University of Osaka Prefecture
Shinke-Cho 174-16, Sakai-Shi 593
Japan
0722 36 2221; Fax: 0722 36 3876
183

Netherlands :
Robert J. de Meijer
Kemfysisch VersneUer Institute
Rijksuniversiteit Gronigen
91Al AA Gronigen
Zemikelaan 25
Netherlands
31-50-633600
Norway.
Erling Stranden
National Institute of Radiation Hygiene
Ostemdalen 25
N-1345 OsterSs, Norway
Slovenia:
Dusan Brajnik
Faculty of Electrical En^eering and Computer Science
University of Ljubljana
Ljubljana, Slovenia
U. MiklaviiS
"J. Stefan” Institute
Ljubljana, Slovenia
J. Tom§i£
Geological Survey
Ljubljana, Slovenia
Spain :
Prof. Luis Quindos Poncela
Departamento de Ciencias Medicas y Quiru^cas
Facultad de Medicina
Universidad de Cantabria
39011 Santander, Spain
34-42-347500
Sweden :
Gustav V. AkerblomSwedish Radiation Protection Institute (SSI)
[Karolinska sjukhuset, Solna]
Box 60204
S-104 01 Stockholm, Sweden+46 8 729 '^1 00; Fax: +46 8 729 71 08
184

Bertil Clavensjo
Bjerkings IngenjorsbyrS ABConsulting Engineers
Box 2006
S-750 02 Uppsala, Sweden
+46 18 65 11 00
Sven-Olov Ericson
AIB - Allmanna Ingenjorsbyrlin ABConsulting En^eersBox 5511
S-114 85 Stockholm, Sweden
Hans Mellander
Swedish Radiation Protection Institute (SSI)
[Karolinska sjukhuset, Solna]
Box 60204
S-104 01 Stockholm, Sweden
+46 8 729 71 00; Fax: +46 8 729 71 08
Per Norell & Bjorn Vamestig
Gammadata Matteknik AB[Klostergatan 10]
Box 1815
S-751 48 Uppsala, Sweden46-18 15 58 70
Bengt Ros6n
Swedish Geotechnical Institute (SGI)
[Olaus Magnus vag 35]
S-581 01 Linkoping, Sweden
+46 13 11 51 00; Fax +46 13 13 16 96
Eva Ryden
National Board of Housing Building and Planning
P.O. Box 534
S-371 23 Karlsrona, Sweden+46 45 55 30 00
Switzerland :
R. Buchli and W. Burkart
Radiation Hygiene Division
Paul Scherrer Institute
CH-5303 Wiirenlingen, Switzerland
185

Dr. Heinz Surbeck
[Bundesamt fiir Gesundheitswesen]
[Abteilung StraUenschutz]
[Sektion Uberwachung der Radioaktivitat]
Physikinstitut
P6roIles
CH-1700 Fribourg, Switzerland
41-037/82 64 36
United Kingdom :
Dr. T. Keith BaU, Tim Coleman
British Geological Survey
Keyworth, Nottingham
NG12 5GG, United Kingdom44-060-77 6111; Fax: 06077 6602
Jonathan C. Miles
National Radiation Protection Board
Chilton, Didcot, OxonUnited Kingdom
United States :
Dr. Thomas E. Blue & M.S. Jarzemba
Ohio State University, Department of Nuclear Engmeering
Robinson Lab 209
2Qf) West 18th AvenueColumbus, Ohio 43210
614-292-0629
Dr. Robert S. BramanDepartment of Chemistry
University of South Florida
Tampa, FL 33620
813-974-2365
Douglas G. Brookins [current status unknown]
University of New Mexico
Albuquerque, NM
Donald Carlisle
[Dept. Earth and Space Sciences, University of CaUfomia, Los Angeles 90024; 213-825-1934]
Radon Systematics of Cahfomia
1500 San Remo Drive
Pacific Palisades, CA 90272
186

Dr. Robert L. Fleischer
General Electric Co.
Corporate Research and Development
Materials Laboratory
Schenectady, NY 12^1518-387-6238
H.D. Freeman, J.N. Hartley
Pacific Northwest Laboratories
BateUe Boulevard
P.O. Box 999
Richland, WA 99352
Dr. Darioush T. Ghahremani
Radon Survey Systems, Inc.
10357 Liberty RoadTwinsburg, OH 44087
L.T. Gregg
Atlanta Testing & Engineering
11420 Johns Creek Parkway
Duluth, GA 30136
404-476-3555
Stephen T. Hall
Radon Control Professionals, Inc.
11920 Fieldthom Court
Reston, VA 22094
703-471-9459
Dr. David E. Hintenlang, 904-392-1404
Dr. Genevieve S. Roessler, 904-392-1404
Department of Nuclear Engineering Sciences
University of Florida
Gainesville, FL 32611
Dr. Charles O. KunzNew York State Dept, of Health
Wadsworth Center for Laboratories and Research, D-486
Albany, bPi' 12201
518-474-6649
Richard Lively
Minnesota Geological Survey
2642 University Avenue
St. Paul, MN 55114-1057
612-627-4780
187

Dr. Ralph A. Llewellyn
Department of Physics
University of Central Florida
Orlando, FL 32816
407-823-5513
Ned MamulaTerradynamics Corporation
42C John Mosby WayRoute 1
Aldie, VA 22001
703-327-6500; 703-327-6480
Virg^a T. McLemore & John W. Hawley
New Mexico Bureau of Mines and Mineral Resources
Socorro, NM 87801
Dr. William W. Nazaroff
University of California
Department of Civil En^eeringMail Code T878
Berkeley, CA 94720
510-642-1040; Fax: 510-643-5264
Dr. Kirk K. Nielson
Rogers and Associates Engineering Corp.
515 East 4500 South, Suite G-lOO
P.O. Box 330
Salt Lake City, UT 84110
801-263-1600
R. Thomas Peake
U.S. Environmental Protection AgencyMaU Code 6603J
401 M Street, SWWashington, DC 20460
202-233-9765
Harry E. Rector
Geomet Technologies, Inc.
20251 Century Boulevard
Germantown, MD 20874
301-428-9898
Prof. Charles E. Roessler
Department of Environmental En^eering Sciences
University of Florida
Gainesville, FL 32611
904-392-0836
188

Prof. Arthur W. Rose
The Pennsylvania State University
Department of Geosciences
218 Deike Building
University Park, PA 16802
814-865-7261
David Saunders
National Association of Home Builders
National Research Center
400 Prince George’s Center Blvd.
Upper Marlboro, MD 20772-8731
301-249-4000
John Spears
Energy Conservation Management, Inc.
518 North Charles Street
Baltimore, MD 21201
410-332-0644
Dr. Stephen D. Schery
Physics Department
New Mexico Institute of Mining and Technology
Socorro, NM 87801
505-835-5328
Dr. Donald F. Schutz
Teledyne Isotopes, Inc.
50 Van Buren Avenue
Westwood, NJ 07675
201-664-7070
Dr. Richard G. Sextro, Dr. Karina Garbesi, Dr. Harold A. Wollenberg
Bldg. 90, Room 3058
Lawrence Berkeley Laboratory
University of Cahfomia
Berkeley, CA 94720
510-486-6295; Fax: 510-486-6658
Dr. Daniel J. Steck
Physics Department, SC107
St. John’s University
Collegeville, MN 56321
612-363-3186; Fax: 612-363-3202
Lorin R. Stieff
Stieff Research and Development Co.
9507 E. Stanhope RoadP.O. Box 263
Kensington, MD 20795
301-949-9508
189

Allan B. Tanner
12125 Captiva Court
Reston, VA 22091-1204
Voice & fax: 703-860-1033
U.S. Geological Survey
Branch of Sedimentary Processes
Box 25046, MS 939, Federal Center
Denver, CO 80225-0046
Dr. G. Michael Reimer, Josh M. Been, & Sandra L. Szarzi, 303-236-5400; Fax: 303-236-1945
Linda C.S. Gundersen, 303-236-1568; Fax: 303-236-0459
R. Randall Schumann, 303-236-1525"
Douglass E. Owen, 303-236-1525"
Dr. James K. Otton, 303-236-8020
Sharon Wirth White
U.S. Environmental Protection Agency
Radon Division (6604J)
401 M Street, SWWashington, DC 20460
202-233-9457
Dr. Felix Y. Yokel
U.S. Department of CommerceNational Institute of Standards and Technology
Building 226, Room B 168
Gaithersbmg, MD 20899
301-975-6065; Fax: 301-869-6275
190


•i
c,
Copyright © 2022 FDOKUMEN