Multiporous nanofibers of SnO 2 by electrospinning for high efficiency dye-sensitized solar cells
Upload
khangminh22Category
view
1download
0
University of Texas at El PasoDigitalCommons@UTEP
Open Access Theses & Dissertations
2013-01-01
Synthetic Asphaltene as A Novel Dye in DyeSensitized Solar Cells DSSCsHassan SharifUniversity of Texas at El Paso, [email protected]
Follow this and additional works at: https://digitalcommons.utep.edu/open_etdPart of the Environmental Engineering Commons, and the Environmental Sciences Commons
This is brought to you for free and open access by DigitalCommons@UTEP. It has been accepted for inclusion in Open Access Theses & Dissertationsby an authorized administrator of DigitalCommons@UTEP. For more information, please contact [email protected].
Recommended CitationSharif, Hassan, "Synthetic Asphaltene as A Novel Dye in Dye Sensitized Solar Cells DSSCs" (2013). Open Access Theses & Dissertations.1732.https://digitalcommons.utep.edu/open_etd/1732

SYNTHETIC ASPHALTENE AS A NOVEL DYE
IN
DYE SENSITIZED SOLAR CELLS DCCs
HASSAN MOHAMED SHARIF
Environmental Science and Engineering Doctoral Program
Benjamin C. Flores, Ph.D. Dean of the Graduate School
APPROVED:
Russell Chianelli, Ph.D., Chair
Barry Benedict, Ph.D.
Narayan, Mahesh, Ph.D.
Juan Noveron, Ph.D.

Copyright ©
by
Hassan Sharif
2013

Dedication
I dedicate my work to the soul my Father Mohamed Abubaker Al-Sharif ask Allah to
forgive him and my mother Salema Muftah El-Fortass ask Allah to give her long and healthy
life. Both they gave me the birth, raised me, loved me and supported me. I devote this work to
them for their love and support, their love of me to be in high level of education, the huge
sacrifices they made to guarantee I get to this stage of life, and for everything they have done to
me. I also dedicate this work to my beloved wife for her support and help during my study.
اهداء
،ادعو هللا ان يتقبله بواسع رحمتهمحمد ابوبكر الشريف الي روح والدي المرحوم باذن هللا
سالمة مفتاح الفرطاسوالي والدتي اطال هللا في عمرھا وامدھا بالصحة والعافية
الي ھذه المرحلة . لقد قدموا الكثير من حتى اصلاھدي لھم ھذا العمل لما قدموه من تضحيات
ما وصلت له اليوموراحتھم من اجل توفير جميع السبل واالمكانيات حتى تمكنت من الوصول الي قوتھم
كما ال انسى ان اھذي ھذا العمل الي زوجتي الغالية التي قدمت لي العون والمساعدة والجلھم كلھم
ملاھدي ھذا الع
أ

SYNTHETIC ASPHALTENE AS A NOVEL DYE
IN
DYE SENSITIZED SOLAR CELLS DSSCs
by
HASSAN MOHAMED SHARIF, M.Sc.
DISSERTATION
Presented to the Faculty of the Graduate School of
The University of Texas at El Paso
in Partial Fulfillment
of the Requirements
for the Degree of
DOCTOR OF PHILOSPHY
Environmental Science and Engineering Doctoral Program
THE UNIVERSITY OF TEXAS AT EL PASO
August 2013
v
Acknowledgements
Finally, I reached this point, I spent a lot of time and I did a lot of job just to reach this
point of my life. No one can imagine how I am happy when I was writing these words. In 2008, I
arrived here and I started my trip to complete my study, to get my PhD. I started this trip which
going too fast, I cannot believe that I stayed here for five years, but today when I started writing
my thesis, I am feeling that I arrived to the most important moment in my life. I started my study
here and I know there is no choice only to finish and get the success. It is big challenge, all there
in my country are waiting for me to complete my study and get the certificate. Five years, this is
the most important period of my life.
Today when I reached to this stage of my life, I have to give my deep thanks to who set
beside me and give me the support, those who helped me to win the race and make the success
become true. Special thanks to my advisor Prof. Russell R. Chianelli for his significant guidance
during my Ph.D. study in the Department of Environmental Science and Engineering. Prof,
Russell R. Chianelli was the main performer in developing my research interest and directed me
to a meaningful understanding of research methodology in science and technology. He also
taught me science and he taught me how to invent new ideas from nothing and how to approach
and achieve the goals. He taught me how to solve problems. Chianelli has taught me the most
important thing in my life; he taught me how I depend on myself. This work would not have
been come possible and easier without his careful supervision. His inspiration, enthusiasm,
suggestions and encouragements have helped me to improve my research skills, expand my
scientific imagination and defeat difficult scientific challenges.
I greatly thankful to all the members of my dissertation committee, Professor Barry
Benedict, Professor Narayan, Mahesh, and Professor Juan Noveron, first for their accepting me
as one of their students in their committee, and for their advises which helped me during my
work and also for devoting their time and expertise to review my dissertation.

vi
Special gratitude to my beloved wife Khadija Aldali and also to my siblings: Amany,
Ahmed, Fatima and my little boy Mohamed for their emotional support during my stay in El
Paso and for their love. Special thanks also go to all my family members in Libya to my brothers
and sisters for their continued support, supplications, generosity, love, and encouragement.
Nonetheless, my work and time in UTEP would have been far poorer without the
academic and moral support from; Dr. Rajab Abujnah, whom was gave me the help along my
stay in El Paso and he was the man who helped me to come here to El Paso and get the
acceptance to study at UTEP; thank you for all the Libyan students at UTEP live here was so
excited and I did not feel boring during stay in El Paso because of you, I wish you all the best on
your study and hope to meet you again in the future. I am very thankful to the Ministry of Higher
Education and Scientific Research in Libya, Canadian Bureau for International Education CBIE
for the financial support.
Last but not the least, and the most important, I would like to express my heart full thanks
to both persons who were the reason to be here in this life, they are very special, they suffered a
lot during their life just to give me a good life and they got tired to give me rest, they stayed
awake all nights to let me sleep, those people they paid a lot to teach me, and let me grew up to
reach this point. They are my parents, my father Mohamed Abubaker AL Sharif who passed
away in 2000, I ask Allah bless him, how it was great moment if he still alive and he saw me
today, and the greatest woman in the world, my mother Salema Muftah Elfortas, she is
supporting me all the time I am here and away from her sight. She supporting me by her
continuous prayers and supplication may Allah protect her and give her long life and good
health.

vii
Abstract
This dissertation approves the possibility of the first time use of synthetic asphaltene as
new dye in dye sensitized solar cells. In which the conversion efficiency of synthetic asphaltene
DSSC has improved up to 2.0 %. Synthetic asphaltene sample was prepared from the starting
material as in literature and applied for various solar cell parameters of TiO2 based dye-
sensitized solar cell DSSC. DSSCs were fabricated using the synthetic asphaltene as dye.
Different variables and parameters were carried out to test the photovoltaic performance of the
cells, these parameters include open-circuit voltage, short-circuit current; fill factor. The first
result was obtained with using synthetic asphaltene as dye was 0.4%. The maximum energy
conversion with using synthetic asphaltene as dye after adjusting some variables and adding
some additives was reached 2.0%. The benefit to study this material will help us to find new dye
and also to understand more the characterization of crude oil asphaltene which leads us to
improve its efficiency in dye sensitized solar cells.
viii
Table of Contents
Acknowledgements……………………………………………………………………………v
Abstract………………………………………………………………………………………vii
Table of Contents……………………………………………………………………………viii
List of Tables…………………………………………………………………………………xi
List of Figures………………………………………………………………………………..xii
List of Illustrations…………………………………………………………………………..xiv
Chapter 1: Background and Motivation
1.1Introduction……………………………………………………………………………1
1.1.1 The Energy Challenge…………………………………………………….………4
1.1.1 The Energy Challenge…………………………………………………………….4
1.2 Environmental Issues………………………………………………………………….5
1.3 The Sun………………………………………………………………………………..6
1.3.1 Solar Energy…………………………………………………………………….7
1.3.2 Solar Energy from Sun to Earth………………………………………………...7
1.3.3 Solar Energy Basics……………………………………………………………..8
1.3.4 Why Solar Energy?.............................................................................................10
1.3.5 Conversion of Sunlight into Electricity………..………………………………11
1.3.6 Sun as Energy Source………………………………………………………….12
1.4 Solar Energy Captured by Earth……………………………………………………..13
1.4.1 Solar Constant……………………………………………………….…………13
1.4.2 Solar Radiation Striking the Earth Surface………………………………….…15
1.4.3 World Distribution of Solar Radiation……………… ……………….………16
1.4.4 How Much Solar Energy is Available?..............................................................18
1.5 Motivation……………………………………………………………………………19
1.6 Dissertation Outline……………………………………………………...…………..21

ix
Chapter 2: Asphaltene and Synthetic Asphaltene
2.1Asphaltene………………………………………………………………………...23
2.1.1 Introduction………………………………………………………...............23
2.1.2 Elemental Composition…………………………………………………….24
2.1.3 Structure of Asphaltene…………………………………………………….26
2.1.4 Asphaltene Molecular Weight……………………………………………...28
2.1.5 Asphaltene Size and Shape………………………………………………....29
2.2 Synthetic Asphaltene……………………………………………………………..30
Chapter 3: Photovoltaics.
3.1 Photovoltaic Effect……………………………………………………….….…38
3.2 Application of Photovoltaic Technology…………………………………….…39
3.3 Environmental Effects from Operation of PV Systems………………….….….41
3.4 Organic Photovoltaic……………………………………………………….…..42
3.5 Mechanisms of Organic Photovoltaic Effect……………………………….….43
3.6 Photovoltaic Cell Performance………………………………………………...45
Chapter 4: Dye Sensitized Solar Cells DSSCs
4.1 Introduction……………………………………………………………………48
4.2 History and Development……………………………………………………...49
4.3 Brief Description of DSSC…………………………………………………….51
4.4 Requirements of Efficient Dye in DSSC………………………………………53
4.5 Structure of Dye Sensitized Solar Cell………………………………………...54
4.6 Characteristic Parameters of DSSCs…………………………………………..64
4.7 Operating Principle of the Dye-Sensitized Solar Cell…………………………67
4.8 Applications of DSSC…………………………………………………………71
Chapter 5: Materials and Methods
5.1 Introduction…………………………………………………………………....72
5.2 Building the DSSC………………………………………………………….…79
5.3 The Electrolyte………………………………………...………….…………...84
5.4 Assembling of the Synthetic Asphaltene Cells ……..………………….…......84

x
Chapter 6: Results and Discussion
6.1 Introduction…………………………………………………………….…...….86
6.2 The First Use of Synthetic Asphaltene as Dye in DSSC……………………....86
6.3 Effects of Different Layers of the Paste……………………………….…….…87
6.4 UV-Ozone Treatment of the Photo-electrode…………………………….…....88 6.5 Effect of Some Additives on the Cell Performance Efficiency…………..….…89
6.6 Purified Synthetic Asphaltene………………………………………….……....91
6.7 Effect of Chenodeoxycholic Acid on the Photovoltaic Performance….….…..92
Chapter 7: Conclusion and Future Work
7.1 Conclusion…………………………………………………………….…...…93
7.2 Future Work………………………………………………………………….94
References ……………………………………………………………………..…...95 Abbreviatios ………………………………………………………………………...107 Vita……………………………………………………………………………............110

xi
List of Tables
Table 2.1: Comparison of some chemical properties of Synthetic Asphaltene and HVAR. …....37
Table 6.1: The first result of Synthetic Asphaltene dye in dye sensitized solar cell………….…86
Table 6.2The new results of new Synthetic Asphaltene sample…………………………….......87
Table 6.3: The effect of different paste layers on the performance of Synthetic Asphaltene
cell……………………………………………………………………………………………..…88
Table 6.4: The effect of UV-O treatment on the Synthetic Asphaltene cell performance……....89
Table 6.5: The results of mixing Synthetic Asphaltene with Porphyrin………………………....90
Table 6.6: The photovoltaic performance efficiency of Synthetic Asphaltene dye mixed with
crude oil Asphaltene…………………………………………………………………………..…90
Table 6.7: The performance efficiency of purified Synthetic Asphaltene dye and unpurified
Synthetic Asphaltene dye…………………………………………………………………...……91
Table 6.8: The performance efficiency of Synthetic Asphaltene dye with additives of
Chenodeoxycholic Acid …………………………………………………………………………92

xii
List of Figures
Figure 1.1: World marketed energy consumption, 1990-2035………………………………...…1
Figure 1.2: World energy consumption by fuel sources 1990-2035……………………………...2
Figure1.3: World net electricity generation by fuel type, 2008-2035………………………….....4
Figure 1.4: Brightness vs. wavelength for various temperatures………………………………….9
Figure: 1.5: ASTM G173-03 Reference Solar Spectra on Earth………………………………...13
Figure1.6: Annual global average insolation from July 1983- June 2005……………………....17
Figure: 2.1: Idealized molecule structure of asphaltene……………………………….………...27
Figure 2.2: Chemical Structure of Cholesterol…………………………………………………..31
Figure 2.3: (a) IR spectrum of Athabasca asphaltene…
(b) IR spectrum of Synthetic Asphaltene prepared from cholesterol and sulfur…..31
Figure 2.4: (a) 1 H NMR spectrum of Athabasca asphaltene.
(b) 1 H NMR spectrum of Synthetic Asphaltene prepared from cholesterol and
sulfur…………………………………………………………………………..32
Figure 2.5: (a) UV spectrum of Athabasca asphaltene
(b) UV spectrum of Synthetic Asphaltene prepared from cholesterol and sulfur….32
Figure 2.6: Structure of discotic liquid crystal where R=undecyl, heptyl, hexyl, undecanoyl…..33
Figure 2.7: Diagram of pyrolysis of TOCP followed by self-assembly of asphaltene from a sea
of free radicals……………………………………………………………………..35
Figure 2.8: Schematic diagram of aliphatic and polyaromatic thermal products upon the heat
treatment of TOCP at 360-4200C involving radical coupling and aromatic condensation……...35
Figure 2.9: Infrared spectra of the TOCP precursor, Synthetic Asphaltene and HAVR (Heavy
Arab Vacuum Reside) asphaltene showing the significant similarity between the synthetic and
the HAVR asphaltene……………………………………………………………………………36
Figure 3.1: Some of the early investigated organic molecules. Top: TPP and anthracene. Bottom:
phtalocyanine and Chl-a………………………………………………………………………....42

xiii
Figure 3.2: Difference between organic and inorganic semiconductor………………………….43
Figure 3.3: Current-Voltage (IV) curve………………………………………………………….47
Figure4.1: Cross section view of the design of a dye sensitized solar cell under illumination
conditions (left), and energy levels of the different components of the cell that represent the
energetics of operation of such devices (right)…………………………………………………..52
Figure4.2: Schematic of the structure of the dye sensitized solar cell…………………………...54
Figure 4.3: On the left: scanning electron microscope picture of the fractal TiO2 film used in the
first embodiment of the DSSC in 1988. On the right: scanning electron micrograph of a TiO2
anatase colloid film………………………………………………………………………………57
Figure 4.4: Chemical structure of the two of ruthenium complexes N3 and Black dye…………59
Figure 4.5: I-V characteristics of a typical solar cell…………………………………………….65
Figure 4.6: I–V curves of an organic PV cell under dark (left) and illuminated (right)
conditions………………………………………………………………………………………...66
Figure4.7: Principle of operation and energy level scheme of the dye-sensitized nanocrystalline
solar cell………………………………………………………………………………………….68
Figure 4.8: Electron transfer processes in a DSC during light-electric power conversion
energy…………………………………………………………………………………………….69
Figure 4.9: Schematic illustration of kinetics in the DSSC……………………………………...70
Figure 5.1a: Analysis of H1 NMR peaks of TOCP……………………………………………...73
Figure 5.1b: Analysis of H1 NMR peaks of TOCP……………………………………………...74
Figure 5.2: IR Spectra of the Precursor TOCP…………………………………………………..75
Figure 5.3: UV-Vis absorption of Synthetic Asphaltene………………………………………...77
Figure 5.4: IR Spectra of different Synthetic Asphaltene samples………………………………78
Figure 5.5: Scanning electron microscope (SEM) of a TiO2 Paste……………………………...81
Figure 5.6: Elemental analysis of TiO2 paste……………………………………………………82
xiv
List of Illustrations
Illustration1.1: Image of the Sun from NASA……………………………………………………6 Illustration: 1.2: Calculation of Solar constant………………………………………………….14 Illustration: 1.3: the path length of the solar radiation through the Earth’s atmosphere in units of Air Mass AM…………………………………………………………………………………….16 Illustration 2.1: the appearance of asphaltenes extracted from Mars-P crude oil using of different solvents (a) n pentane (n-C5) and (b) n-heptane (n-C7)…………………………………………23 Illustration 2.2: Relaxed simulation of the TOCP precursor molecule………………………….34 Illustration 4.1: Tri-iodide/iodide redox couple………………………………………………….64 Illustration 5.1: Showing a) the precursor material, b) synthetic asphaltene after synthesized……………………………………………………………………………………….76 Illustration 5.2: Filter paper after Synthetic Asphaltene filtered………………………………...79 Illustration 5.3: Preparation procedure of P-25 paste……………………………………………80
Illustration 5.4: The Thickness of TiO2 paste…………………………………………………...81
Illustration 5.5: the fabrication steps of new cell ……………………………………………..…83
Illustration 5.6: Schematic diagram showing completed synthetic asphaltene DSSC…………..85

1
Chapter1: Background and Motivation
1.1 Introduction
During the last few decades there have been major efforts to address the enormous
growth of both the worldwide energy demand and the emissions of greenhouse gases
(GHG) that are due to burning of fossil fuels and other energy consumption.
In the IEO2011, world marketed energy consumption grows by 53 percent from 2008 to
2035. Total world energy use rises from 505 quadrillion British thermal units (Btu) in 2008 to
619 quadrillion Btu1 in 2020 and 770 quadrillion Btu in 2035 (Figure 1.1). Much of the growth in
energy consumption occurs in countries outside the Organization for Economic Cooperation and
Development (non-OECD nations) where demand is driven by strong long-term economic
growth. Energy use in non-OECD nations increases by 85 percent in the Reference case, as
compared with an increase of 18 percent for the OECD economies.
Figure 1.1: World marketed energy consumption, 1990-2035 (1)
11 quadrillion -BTU of electricity per year = 33.5 x 10⁶ kW per year x (365 days per year x 24 hours per day) = 293.5 x 10⁹
KW-hrs = 293,500 GW-hrs

IE
all fuel s
of the en
energy,
consump
users to
Renewab
to 14 per
Fig
EO2011 Ref
ources throu
nergy used w
as expected
ption falls fro
o change fro
ble energy, a
rcent in 2035
gure1.2: Wor
ference case
ugh 2035 (Fi
worldwide. A
d high wor
om 34 perce
om liquid fu
and the renew
5.
rld energy co
projects inc
igure 1.2). F
Although pet
rld oil pric
ent in 2008 t
uels when p
wable part o
onsumption
2
creased worl
Fossil fuels a
troleum as l
es, the liqu
to 29 percen
possible. The
of total energ
by fuel sour
ld consumpt
are expected
liquid fuels r
uids share
nt in 2035, t
e fastest wo
gy use increa
rces 1990-20
tion of mark
d to continue
remain the l
of world m
this will ma
orld energy
ases from 10
035. Quadrill
eted energy
e supplying m
largest sour
marketed en
ake many en
form growi
0 percent in
lion Btu (1)
from
much
rce of
nergy
nergy
ing is
2008

3
In the IEO2011, World consumption of petroleum and other liquids grows from 85.7
million barrels per day in 2008 to 97.6 million barrels per Day in 2020 and 112.2 million barrels
per day in 2035. Natural gas consumption rises by 52 percent, from 111 trillion cubic feet in
2008 to 169 trillion cubic feet in 2035. Because of absence the national policies and international
agreements that could help to reduce greenhouse gas emissions, world coal consumption is
expected to increase from 139 quadrillion Btu in 2008 to 209 quadrillion Btu in 2035, at an
average annual rate of 1.5 percent.
As mentioned in the IEO2011, Electricity is the world's fastest-growing form of end-
use energy consumption. Net electricity generation increases by 2.3 percent per year from
2007 to 2035, while total world energy demand grows by 1.4 percent per year. The
growth in electricity generation is as result of rising standards of living, increase demand for
home purposes and the increase of commercial and residential services. Coal still remains
to provide the largest part of world electricity generation. It contributed for 42 percent of
total electrical generation in 2007, and its share is largely constant through 2035 (Figure 1.2).
The combustion of coal, however, adds a significant amount of carbon dioxide to the
atmosphere per unit of heat energy, (2) more than does the combustion of other fossil fuels.
In contrast, liquids, natural gas, and nuclear power all lose market share of world
generation over the course of the projection period, displaced by the strong growth
projected for renewable sources of generation. To satisfy the growing demand, a sharp
increase in the utilization of coal over the next 20 years is predicated, as well as an
extreme increase in the development of renewable energy sources as viable solutions to the
demand.(1)

Figure1
1.1.1 The
A
continuo
aggressi
to 9 bi
world-w
2050, a
reserves
and the
health a
present
options
and poli
.3 World net
e Energy Ch
About 4.1 ×
ous power c
ive conserva
llion people
wide, is expe
and more tha
s of fossil fu
ir continued
and greenhou
far from com
for supplyin
itical horizon
t electricity
hallenge
1020 joule
consumption
ation and en
e, accompan
ected to prod
an triple the
uels that pow
d use produc
use gases as
mpetitive wi
ng double or
ns will be se
generation b
es/yr. of ene
n of 13 trilli
nergy efficie
nied by rap
duce more t
e demand to
wer the worl
ces harmful
sociated wit
ith fossil fue
r triple today
everely limit
4
by fuel type,
ergy is used
ion watts, o
ncy measure
pid technolo
than double
o 46 TW by
ld will fall s
side effects
th climate ch
els in cost an
y’s energy u
ted.(3)
2008-2035
d now in th
or 13 terawa
es, an increa
ogy developm
the demand
y the end of
short of this
s such as po
hange. Alter
nd productio
use, the worl
(Trillion kil
he world. Th
atts (TW). E
ase of the E
ment and e
d for energy
f the century
demand ov
ollution that
rnative renew
on capacity. W
ld’s econom
owatt-hours
his is equal
Even though
Earth’s popul
economic gr
up to 30 TW
y. At presen
ver the long
threatens hu
wable fuels a
Without pra
mic, technolog
) (1)
l to a
with
lation
rowth
W by
nt the
term,
uman
are at
ctical
gical,

5
1.2 Environmental Issues
The increasing energy demand and shortage of fossil fuel supply is the issue of global
warming and climate change, caused by burning of fossil fuels. Intergovernmental Panel on
Climate Change (IPCC) report Climate Change 2007 (4) identified long-lived green-house
gases (GHGs) as the main factor affecting global warming and the radiative forcing of the
climate system, and pointed out that global GHGs emissions by human related activities have
increased 70% between 1970 and 2004. Between 1970 and 2004, global emissions of CO2,
CH4, N2O, HFCs, PFCs and SF6, weighted by their global warming potential (GWP),
have increased by 70% (24% between 1990 and 2004). The emissions of these gases have
increased at different rates; CO2 emissions have grown between 1970 and 2004 by about 80%
(28% between 1990 and 2004) and represented 77% of total anthropogenic GHG emissions
in 2004. The largest growth in global GHG emissions between 1970 and 2004 has come
from the energy supply sector (an increase of 145%) and combustion of Fossil fuel (4).
Some of the impacts of the ongoing climate change has been already observed, these
include more frequent occurrence of storms and flooding, alterations in disturbances of
forests due to fires and pests, excess heat-related mortality in Europe, changes in infectious
diseases vectors, earlier greening of vegetation in the spring, and others. Greater negative
impacts, such as decreases in the biodiversity and productivity of crops, increase in risk for
coastal erosion due to sea-level rise, and an increase in malnutrition are projected if the
current GHG emissions trends (and as a result, the trend in globally increasing temperature)
continue in the next 50-100 years4. Of all the available technologies producing renewable
energy, sun energy is a hot topic in current research.
The following chapter will give introduction about the sun as the main source of
energy. Later it will give a discussion on the quantity, availability and distribution of solar

6
energy worldwide. This chapter will end then with my motivation and the design of the
dissertation.
1.3 The Sun
The sun is a star, a hot ball of glowing gases at the heart of our solar system. Its effect
extends far beyond the orbits of distant Neptune and Pluto. There would be no life on Earth
Without the sun's energy and heat. The Sun is by far the largest object in the solar system. It
contains more than 99.8% of the total mass of the Solar System. The Sun is about 70% hydrogen
and 28% helium by mass and about 2% metals. (8)
Illustration1.1: Image of the Sun from NASA

7
1.3.1 Solar Energy
Solar energy is the energy produced directly by the sun and collected elsewhere, usually
the Earth. The sun generates its energy through a thermonuclear process that converts about
650,000,000 tons (5) of hydrogen to helium every second. The process creates heat and
electromagnetic radiation. The heat remains in the sun and is instrumental in maintaining the
thermonuclear reaction. The electromagnetic radiation (including visible light, infra-red light,
and ultra-violet radiation) flows out into space in all directions. (6)
1.3.2 Solar Energy from Sun to Earth
The sun is located at the center of the solar system and provides the energy to all
planets; Earth obtains its main energy in the form of light and heat from the Sun.
The enormous amount of energy continuously emitted by the sun is dispersed into
outer space in all directions. Only a small fraction of this energy is intercepted by the earth and
other solar planets.
The solar energy reaching the periphery of the earth's atmosphere is considered to be
constant for all practical purposes, and is known as the solar constant. Because of the difficulty
in achieving accurate measurements, the exact value of the solar constant is not known with
certainty but is believed to be between 1,353 and 1,395 W/m2. The solar constant value is
estimated on the basis of the solar radiation received on a unit area exposed perpendicularly to
the rays of the sun at an average distance between the sun and the earth.
In passing through outer space, which is characterized by vacuum, the different types of solar
energy remain intact and are not modified until the radiation reaches the top of the earth's atmosphere.
In outer space, therefore, one would expect to encounter the types of radiation listed in Table 1, which
are: gamma ray, X-ray, ultraviolet, and infrared radiations. (7)

8
1.3.3 Solar Energy Basics
At its core, solar energy is actually nuclear energy. In the inner 25% of the Sun, hydrogen
is fusing into helium at a rate of about 7 x 10¹¹ kg of hydrogen every second. If this sounds like
a lot, it is because it is: this is equivalent to the amount of mass that can be carried by 10 million
railroad cars. There is no need to fear, though, that we are going to run out of fuel anytime soon,
as the Sun has enough hydrogen in the core to continue at this rate for another 5 billion years.
This energy production, coupled with gravitational compression, keeps the Sun’s center near a
sweltering 16 million K, which is about 29 million 0F. Heat from the core is first primarily
radiated, and then primarily convected to the Sun’s surface, where it maintains at a temperature
of 5800 K. (8)
The amount of energy that is emitted by the Sun, and the amount of solar energy that we
receive here on Earth, is dependent upon this surface temperature. A change of 1% in the
temperature of the Sun (58 K) can result in a change of 4% in the amount of energy per unit area
that we receive here. While this might not sound like a lot, it is more than enough to plunge us
into brutal ice age or hellish global warming.
The type of radiation coming from the Sun also depends on temperature. The Sun is
emitting electromagnetic radiation in wide variety of wavelengths. However, most of the
radiation is being sent out in the visible spectrum due to its surface temperature. Wien’s Law
states that the wavelength at which the most energy will be radiated depends inversely upon the
temperature of an object. Thus, as an object gets hotter, the peak radiation will come from
shorter wavelengths, and vice-versa. Figure 2 shows a theoretical plot of the energy emitted by
three perfect blackbody radiators of different temperature. An object that has a temperature of
4000 K has its peak energy being radiated at about 750 nanometers, which is in the near infrared.

An objec
about 50
will appe
waveleng
Sun’s tem
W
described
waveleng
reduced.
lessened
must spr
ct that has a
0 nanometer
ear to the hu
gths. The fir
mperature of
Figu
While our S
d above. It r
gths. Howev
Between th
by spreadin
read to fill a
surface temp
rs, which is
uman eye is
rst object wil
f 5800 K) wi
ure 1.4: Brig
un is not a
radiates 1.6
ver, by the t
he Sun’s an
ng and absor
all available
perature of 6
in the green
s determined
ll appear a v
ill appear a b
ghtness vs. w
a perfect bla
x 107 watt
time that it h
nd the Earth
rption. Ligh
space. Whi
9
6000 K, thou
n region of
d by just how
very dim red
bright white
wavelength f
ackbody rad
s of power
has reached
h’s surfaces,
t travelling
ile the total
ugh, has its p
the visible s
w much ene
d; while the s
that has a hi
for various te
diator, its ou
per square m
the Earth’s
, the energy
from a sphe
amount of
peak energy
spectrum. H
ergy is in ea
second (whi
int of yellow
emperatures
utput is fai
meter from
s surface, thi
y density of
erical object
energy of t
being radiat
How these ob
ach of the v
ch is close t
w.
rly close to
its surface
is value is v
f the radiati
t such as the
the radiation
ted at
bjects
isible
to our
o that
at all
vastly
ion is
e Sun
n will

10
remain the same, the amount of energy crossing any square meter of space will be reduced by the
square of the distance between the object and the area in question. The Sun is about 150 million
kilometers from the Earth; so the energy density per unit time of the sunlight reaching the upper
atmosphere of the Earth is only 1340 W/m2. (9)
1.3.4 Why Solar Energy?
Although most of the world's current electricity supply is generated from fossil fuels such
as coal, oil and natural gas, these traditional energy sources face a number of challenges
including rising prices, security concerns over dependence on imports from a limited number of
countries which have significant fossil fuel supplies, and growing environmental concerns over
the climate change risks associated with power generation using fossil fuels. As a result of these
and other challenges facing traditional energy sources, governments, businesses and consumers
are increasingly supporting the development of alternative energy sources and new technologies
for electricity generation. Renewable energy sources such as solar, biomass, geothermal,
hydroelectric and wind power generation have emerged as potential alternatives which address
some of these concerns. As opposed to fossil fuels, which draw on finite resources that may
eventually become too expensive to retrieve, renewable energy sources are generally unlimited
in availability. Solar power generation has emerged as one of the most rapidly growing
renewable sources of electricity.
However the burning of fossil fuels is considered as a major source of many harmful
pollutants into the atmosphere and contributes to environmental problems like global warming
and acid rain, solar energy is completely nonpolluting source. While big area of land must be
destroyed to feed a fossil fuel energy plant its required fuel, the only small land area is needed
for a solar energy plant. This ability to decentralize solar energy is something that fossil fuel

11
burning cannot match. As the primary element of construction of solar panels, silicon, is the
second most common element on the planet, there is very little environmental disturbance caused
by the creation of solar panels. In fact, solar energy only causes environmental disturbance if it is
centralized and produced on a huge scale. Among the renewable resources, only in solar power is
only the energy source able of supplying more energy than is used. (6)
1.3.5 Conversion of Sunlight into Electricity
Solar energy can be converted directly into electrical power in photovoltaic (PV) cells,
generally called solar cells. The sun has a surface temperature of about 6,000°C, and its hot gases
at this temperature emit light that has a spectrum ranging from the ultraviolet, through the
visible, into the infrared.
According to quantum theory, light can behave either as waves or as particles, depending
on the specific interaction of light with matter; this is called the wave-particle duality of light. In
the particle description, light consists of packets of energy called photons. Sunlight contains
photons with energies that reflect the sun’s surface temperature; in energy units of electron volts
(eV), the solar photons range in energy (hν) from about 3.5 eV (ultraviolet region) to 0.5 eV
(infrared region). The energy of the visible region ranges from 3.0 eV (violet) to 1.8 eV (red); the
peak power of the sun happens in the yellow region of the visible region, at about 2.5 eV. At
high noon on a cloudless day, the surface of the Earth receives 1,000 watts of solar power per
square meter (1 kW/m2). (3)

12
1.3.6 Sun as Energy Source
The sun is an infinite source of energy mostly composed of gases. Sun is like one
enormous thermonuclear reactor. Sun emits energy into the space in the form of
electromagnetic radiation.
Fusion is the energy source of the sun and stars. In fusion, two light nuclei (such as
hydrogen) combine into one new nucleus (such as helium) and release enormous energy in the
process. On earth, fusion has the potential to be an abundant and attractive source of energy for
the future. However, creating fusion conditions on earth and tapping that energy in practical
forms continues to challenge the world’s scientists, although tremendous progress has been
made. (10)
The current stellar classification, has given the sun a spectral class label of G2V. G2
indicates its surface temperature, and V signifies that the Sun, is a main sequence star, and
therefore generates its energy by nuclear fusion (11). The exact nuclear process is not
well known, but the most likely is one by which hydrogen, the Sun's most abundant fuel,
is converted to helium by nuclear fusion. It is believed that the sun convert more than
700 million metric tons of hydrogen to about 695, million metric tons of helium each
second. In this process of nuclear fusion, huge amount of energy in the form of
electromagnetic rays are released. Most of this electromagnetic radiation emitted from the
sun's surface received by Earth surface lies in the visible band centered at 500 nm (1 nm = 10-9
meters) Figure (1.5), although the sun also emits significant energy in the ultraviolet and
infrared bands, and small amounts of energy in the radio, microwave, X-ray and gamma ray
bands.

Most of
infrared
electrom
and elec
1.4 Sola
1.4.1 Sol
T
luminos
increasi
sphere i
square o
the irra
f the energy
d rays, whi
magnetic rad
ctrons. (11)
Figur
ar Energy C
lar Constan
The sun em
sity of the
ingly larger
is the same,
of the radius
adiative ene
emitted by
ch we feel
diation. The
re: 1.5 ASTM
Captured by
nt
mits some am
sun). As th
spherical ar
, the energy
s of the big
ergy per cro
the sun is vi
as heat. V
e sun also em
M G173-03 R
y Earth
mount of tota
hat energy i
reas. Since
y per unit are
sphere) from
oss-sectiona
13
isible light a
Visible light
mits particle
Reference So
al energy fro
s radiated a
the total am
ea decreases
m the sun. It
l unit area
and a related
t and infrar
e radiation,
olar Spectra
om its surfac
away from
mount of en
s as the squ
t is often mo
that the S
d form of rad
red rays ar
made up m
on Earth (12
ce every sec
the sun, it
nergy passin
uare of the
ore conveni
Sun provides
diation know
re two form
mostly of pro
2)
cond (this is
passes thro
ng through e
distance (or
ient to cons
s for the E
wn as
ms of
otons
s the
ough
each
r the
sider
Earth

system.
total ene
T
atmosphe
Earth’s m
global en
from spa
observati
measurem
50% lies
about 10%
This quant
ergy output o
The solar co
ere on a sur
mean distanc
nergy balanc
ace and a m
ions. The a
ment uncerta
s in the infra
% in the UV
tity is calle
of the sun di
Illustra
onstant is t
rface normal
ce from the
ce and clima
more than 20
analysis of s
ainty of ±3W
ared region
V region (<0.
d the "Sola
ivided by the
ation: 1.2 Ca
the amount
l to the incid
Sun. The so
ate. Reliable
0-year recor
satellite dat
Wm_2. Of the
(40.7 mm),
.4 mm). (13)
14
ar constant"
e area (ASE)
alculation of
t of solar r
dent radiatio
olar constant
e measureme
d has been
ta suggests
e radiant ene
about 40%
)
abbreviated
) of the "big
f Solar consta
radiation re
on per unit t
t is an impo
ents of solar
obtained ba
a solar con
ergy emitted
in the visib
d as SO, an
sphere".
ant
eceived outs
time and pe
ortant value f
r constant c
ased on ove
nstant of 13
from the Su
ble region (0
nd is simply
side the Ea
r unit area a
for the studi
an be made
erlapping sat
366Wm_2 w
un, approxim
0.4–0.7 mm)
y the
arth’s
at the
ies of
only
tellite
with a
mately
), and

15
Due to the Earth's elliptical orbit, the actual distance between Earth and Sun
varies from a minimum of 147.097.000 km to a maximum of 152.086.000 km (14). For
computing the value of the solar constant, the astronomical unit AU is used.3The
astronomical unit is the principal unit of measurement or average earth-sun distance is used.
The big sphere centered at the Sun with a radius of DSE (see illustration 1.1) has the total
surface area of ASE = 4(DSE)2 = (2.81 1023 m-2). The energy
output of the sun, 3.87 1026 W, is uniformly distributed on this sphere surrounds the
sun see illustration (1.1). Therefore the solar constant is equal so = (3.839 1026 W)/ 2.81
1023 m-2 =1377 W m-2.
1.4.2 Solar Radiation Striking the Earth Surface
Solar radiation entering the Earth’s atmosphere is absorbed and scattered by atmospheric
gases, aerosols, clouds, and the Earth’s surface (13). When the Sun is directly overhead the
insolation, that is the incident energy arriving on a surface on the ground perpendicular to the
Sun's rays, is typically 1000 Watts per square meter (15).
This is due to the absorption of the Sun's energy by the Earth's atmosphere that dissipates
abbot 25% to 30% of the radiant energy (15). A concept which describes the effect of a clear
atmosphere on sunlight is the air mass, this equal to the relative length of the direct beam path
through the atmosphere. On a clear summer day at sea level, the radiation from the sun at zenith
corresponds to air mass 1 (abbreviated to AM1); at other times, the air mass is approximately
equal to 1/cos θ, where θ is the zenith angle. (16)
3 AU, mean distance between the earth and sun; one AU is 149,604,970 km (IAU 2009)

Illustratio
T
zenith a
spectrum
(17). It
absorbe
1.4.3 Wo
T
energy
world’s
D
one geo
on: 1.3 the pAir
The path len
angle. It incr
m is the pref
quantifies th
ed by air and
orld Distrib
The energy
in the sunlig
energy requ
Distribution
ographic loc
path length oMass AM
ngth of the so
reases from u
ferred standa
he reduction
d dust.
ution of Sol
comes from
ght reaching
uirements. (1
of Solar rad
ation to ano
of the solar
olar radiatio
unity for 0o
ard spectrum
in the powe
lar Radiatio
the sun to th
g the Earth s
18)
diation over
other depend
16
radiation thr
on through th
(zenith) to 1
m for solar ce
er of light as
on
he Earth is i
surface is eq
the world is
ding on alti
rough the E
he Earth’s at
1.5 for 48o a
ell efficiency
it passes thr
in the form o
quivalent to
s unequal, a
itude, which
arth’s atmos
tmosphere, c
and 2.0 for 6
y measureme
rough the atm
of Radiation
around 10,0
and its intens
h is combin
sphere in un
changes with
60o. The AM
ents in litera
mosphere an
n. The amoun
000 times of
sity differs f
ned with sea
nits of
h the
M1.5
ature
nd is
nt of
f the
from
ason,

latitude
of poll
geograp
of the d
T
Souther
Solar in
of its g
radiatio
has high
scattere
5.0-6.5
, and atmosp
lution. The
phic areas w
direct annual
Figure1
The most fa
rn parts of A
nsolation in
eographical
n. The equa
h atmospher
d radiation.
KWh/m2/da
pheric cond
following
with favorabl
average gro
1.6 Annual g
avorable bel
Asia. It has o
this region a
location mo
atorial belt l
ric humidity
. Sunshine
ay. The less
ditions, whic
guidelines
le solar ener
ound solar en
global averag
lt (15-35° N
over 3.000 h
averages bet
ore than 90%
located betw
y and cloudi
is estimate
favorable be
17
ch are deter
are useful
rgy condition
nergy compo
ge insolation
N) covers m
h/year of sun
tween 6.5-7.
% of the in
ween (0-15°
iness that te
ed at 2500
elt is the reg
rmined by c
for the b
ns in the wo
onent of sun
n from July
many of Nor
nshine and l
.5 KWh/m2/d
ncident solar
N), is mode
end to incre
h/year wit
gion between
cloud cover
broad identi
orld based o
nlight from 1
1983- June 2
rthern Afric
limited cloud
day (NASA
r radiation c
erately favor
ase the pro
th solar inso
n (35-45° N)
rage and de
ification of
on the collec
983-2005 (1
2005 (19)
can Nations
d coverage.
2011). Beca
comes as di
rable becaus
oportion of
olation betw
). The scatte
gree
the
ction
19).
and
The
ause
irect
se, it
the
ween
ering

18
of the solar radiation in this belt is significantly high because of the higher latitudes and lower
solar altitude. In addition, cloudiness and atmospheric pollution are important factors that tend
to reduce sharply the solar radiation intensity. Solar insolation in this region is between
4.0-5.0 KWh/m2/day. Regions beyond 45° N have less favorable conditions for the use of
direct solar radiation, because almost half of it is in the form of scattered radiation, which
is more difficult to collect for use. However this limitation does not strictly apply to the
potentials for solar UVR applications. In the Southern hemisphere there are three zones of
high radiation; in south America, again on the western coast, moving from latitude 10 S to
30 S; in South Africa, between 10 and 35 S; and in Australia, between 15 and 30 S. (19)
1.4.4 How Much Solar Energy is Available?
The amount of energy from the sun that falls on Earth's surface is huge. All the energy
stored in Earth's reserves of coal, oil, and natural gas is matched by the energy from just 20 days
of sunshine. Outside Earth's atmosphere, the sun's energy contains about 1,300 watts per square
meter. About one-third of this light is reflected back to space, and some is absorbed by the
atmosphere. By the time it reaches Earth's surface, the energy in sunlight has fallen to about
1,000 watts per square meter at noon on a cloudless day. Averaged over the entire surface of the
planet, 24 hours per day for a year, each square meter collects the approximate energy equal of
nearly one barrel of oil each year, or 4.2 kilowatt-hours of energy each day. This number differs
by location and weather patterns. Deserts, because of very dry air and little cloud cover; they
receive more than six kilowatt-hours per day per square meter. Northern climates get closer to
3.6 kilowatt-hours. Sunlight varies by season also, some areas receiving very little sunshine in
the winter. Seattle in December, for example, gets only about 0.7 kilowatt-hours per day. These
data signify the maximum available solar energy that can be captured and used, but solar

19
collectors capture only a portion of this, depending on their efficiency. For example, a one square
meter solar electric panel with an efficiency of 15 percent would generate about one kilowatt-
hour of electricity each day in Arizona. (20)
1.5 Motivation
A photovoltaic solar cell is a proven technology to capture the solar energy and
provides clean and renewable electrical energy that can reduce the world’s dependency on
fossil fuels, and reduce GHG emission, global warming and other related environmental
issues. In spite of the substantial growth over the past decades the high cost of photovoltaic
solar cells has remained a limiting factor for the implementation of the solar electricity in a
large scale. More rapid and widespread implementation of photovoltaic electricity generation
requires more advanced technological developments. Par ticularly, technological inventions
that reduce the cost of photovoltaic electricity substantially could drive a rapid expansion in the
implementation of photovoltaic technology.
Nowadays, the main photovoltaic technology is based on solid-state pn junction
devices, in which semiconductor absorbers produce electron-hole pairs and the electron-hole
pairs are separated by a build-in electrical field in the pn junction to generate electricity. The
main semiconductor absorbers used in solid-state solar cells include polycrystalline silicon,
(21) amorphous silicon, (22) cadmium telluride (CdTe), (23) and copper indium gallium
diselenide Cu (In, Ga) Se2, (24) etc. These types of solar cells have high power conversion
efficiency; however, suffer from high manufacturing and material cost.
Among the material systems currently of interest for this reason are the group of
molecular-based materials combinations often referred to as „organic‟ or „molecular‟
photovoltaic materials. These refer to conjugated molecular species, such as polymers,

20
molecules and dyes, which are capable of absorbing light and conducting charge and
thereby acting as organic semiconductors (25). Their attraction lies primarily in the
possibility of processing such materials directly from solution, and so with bulk synthesis of
the chemical materials and bulk solution processing of photovoltaic modules, the cost of the
photoactive material could fall by an order of magnitude compared even with thin film
inorganic semiconductors (26), (27). Additionally, the less challenging manufacturing
environment, compared, for example, with crystalline silicon wafer production, promises to
reduce the capital cost for production facilities and to make the technology more widely
accessible, especially in developing countries ( 28). Moreover it is also believed that if such
materials are naturally synthesized and stable the cost could be further reduced.
Dye sensitized solar cell (DSSC) is one of the low cost alternatives for the
conventional solar cells, and commercially promising because it is low-cost materials and do
not require highly technology manufacturing facilities. Currently there are three types of dyes
(29) that can produce cells with AM1.5 conversion efficiencies over 10%. Nevertheless, these
types of dyes suffer from the drawback that they are based on the rare ruthenium transition
metal.
Synthetic Asphaltene is one of these materials that primary results shows it can fulfill
the requirements of organic semiconductors; i.e. absorbing a broad range of visible and near
infra-red light. Even though tell now no studies are showing the capability of this material for
conducting charges, and there are no literatures as well as about crude oil asphaltene. Synthetic
Asphaltene has a good ability to absorb visible light. It was also found that this material can be
adsorbed easily to the surface of the nanocrystalline particles TiO2, therefore synthetic
asphaltene is an excellent candidate for use in DSSC.

21
The most important issue regarding Synthetic Asphaltene, those researchers found that it
is similar in characteristics to the crude oil asphaltenes. Therefore, the following chapter will
bring an introduction about crude oil asphaltene in a latest literature survey on asphaltene
chemical and elemental structure, molecular size and shape, and its new application in the
field of photovoltaic, also, it will give the information about Synthetic Asphaltene, it will
review the different methods were used to prepare Synthetic Asphaltene illustrated with
figures and graphs that show the similarity between both crude oil asphaltenes and synthetic
Asphaltene.
1.6 Dissertation Outline
Chapter one of this dissertation give an introduction to the main problem related to
the world energy; increases energy demand, shortage of energy supply and environmental
issues associated with combustion of fossil fuel. The Sun description, its energy source,
total quantity of the solar energy reaching the earth surface, as well as world distribution of
solar energy is also discussed. This chapter also will include brief description about
conversion of sunlight into electricity. The end of this chapter will address to the amount of
solar energy on the earth, the importance of capturing this energy.
In chapter two, this chapter divided into two sections, section one gives an
introduction to crude oil asphaltenes, also it gives reviews about chemical composition,
molecular weight and shape, physical properties of crude oil asphaltenes. The second section
of chapter two will explain Synthetic Asphaltene. In this part; preparation of Synthetic
Asphaltene from different methods will be explained and illustrated with graphs and
figures that show the similarity between Synthetic Asphaltene and crude oil asphaltenes.

22
In the chapter three, discussion the history of photovoltaic, status, its development
and trends in the photovoltaic industry are then will be given, then chapter four goes to a deep
study of dye sensitized solar cell in particular as it is the main subject of this dissertation. It
starts with a brief abstract of the device's history, the technological ground of its
development, its operation principle, the main cell components; materials used to
manufacturing it, its characterization parameters and end up with ways to improve its
performance. The last chapter, chapter five will focus on the results of experimental work and
discussion. Chapter six will illustrate the conclusion and discussion, and the last chapter,
chapter seven will summarized recommendation of this work and the future work.

2.1 Asph
2.1.1 Int
A
high m
Asphalt
sources
I
distillati
similar;
(31) As
known
of the A
the meth
Illustratio
Ch
haltenes
roduction
Asphaltene
molecular w
tene appears
and decomp
In 1837, J.B
ion of bitum
it is insolu
sphaltene ex
as C7-Asph
Asphaltene “
hod of precip
(a) n pen
on 2.1 the apsolv
hapter 2: A
is a part of c
weight bond
brown or bl
poses when t
B. Boussing
men: insolub
uble in n-alk
xtracted usin
haltenes. Th
solubility cl
pitation. (32
tane (n-C5)
ppearance ofvents (a) n pe
Asphalten
crude oils th
ded aromatic
lack in color
the temperat
gault define
le in alcoho
kanes, such a
ng n- pentan
he amount, c
ass” vary sig
2); (33); (34)
f asphaltenesentane (n-C5
23
nes and Syn
hat contain a
c hydrocarb
r, and the me
ture exceeds
ed the term
ol and solubl
as n-pentane
ne known a
chemical com
gnificantly w
; (35); and (
(b) n
s extracted fr5) and (b) n-
nthetic As
a large numb
bons compo
elting point d
s 300-400 °C
of asphalte
le in turpent
e or n-hepta
as C5-Asph
mposition, a
with the sour
(36)
n-heptane (n
from Mars-Pheptane (n-C
sphaltene
ber of struct
onents with
differs with
C. (30)
enes as the
tine. The de
ane, and sol
haltene and
and molar m
rce of the cru
n-C7).
P crude oil usC7).
tures, in spec
h hetero-ato
oil geograph
residue of
finition toda
luble in tolu
with n-hep
mass distribu
ude oil and w
sing of differ
cific
oms.
hical
f the
ay is
uene.
ptane
ution
with
rent

24
2.1.2Elemental Composition
The heteroatoms (nitrogen, oxygen, sulfur, and others) play an important role in the
formation of the intermolecular forces responsible for the physical stability of asphaltenes.
(53)
The main elemental components of petroleum asphaltene are hydrogen and carbon.
Ouchi, ( 1985) has shown that H/C ratio is a linear function of the portion of aromatic
carbons of petroleum fractions as measured by C13-NMR (carbon nuclear magnetic
resonance). (37) The H/C ratios of asphaltene averaged between 1.1:1 to 1.4:1 (38), and
(34). C13 nuclear magnetic resonance (NMR) and Carbon K-edge X-ray absorption near-edge
spectroscopy (XANES) studies shows that about 50 % of the carbon is aromatic and the rest
saturated. (39)
Speight in 1991 reported that the elemental composition of 57 different asphaltene from
8 countries. Speight found that, carbon and hydrogen contents of asphaltene do not vary
significantly; however, the proportion of hetero-elements, such as oxygen, sulfur and nitrogen
varies significantly from 0.3 to 4.9% for oxygen; from 0.3 to 10.3% for sulfur; from 0.6 to 3.3%
for nitrogen. (40) The hydrogen atoms contained in saturated groups while 40% of the carbon
contained in aromatic structures. (41)
2.1.2.1Sulfur
Sulfur is the most abundant element found in asphaltene. The average sulfur content
of asphaltene varies from 2-6 %, but it can be identified at a concentration above 10 %.
(42) Sulfur forms identification in asphaltene has been studied by the application of x-ray
absorption spectroscopy by George et al., (1990); and by XANES (X-ray Absorption near
Edge Structure) spectroscopy. (43) The data gave a clear demonstration of the existence of

25
nonvolatile sulfide and thiophene sulfur in the asphaltene with thiophene species are the
most dominant. Other forms of sulfur that found to occur in asphaltene include the alkyl–
alkyl sulfides, alkyl–aryl sulfides and aryl–aryl sulfides. (44); (45)
2.1.2.2 Nitrogen
Studies on the disposition of nitrogen in petroleum asphaltene indicated the existence
of nitrogen as various heterocyclic types. (46); (47); (48) Much of the nitrogen believed
to be in aromatic locations.(49) There is also evidence for the occurrence of carbazole
nitrogen in Asphaltene.(50) and; (51) Application of XANES spectroscopy to the
determination of nitrogen species in asphaltene, confirmed the presence of pyrrolic nitrogen
and pyridinic nitrogen being the two major types of nitrogen. (52) In fact, the technique
showed the predominance of pyrrolic nitrogen in the samples examined.
2.1.2.3 Oxygen
The presence of oxygen in asphaltene evaluated mainly through elemental analysis and
by chemical reaction. The total content of oxygen in asphaltene from different sources may
differ from 1% to 7% by weight. Oxygen is found to exist in asphaltene as in carboxylic,
phenolic and ketonic forms (46), hydroxyl and ester groups. (53)
Some evidences for the location of oxygen within the asphaltene fractions acquired
by infrared spectroscopy. Examination of dilute solutions of the asphaltene in carbon
tetrachloride shows that at low concentration (0.01% wt/wt) of asphaltene a band occurs at
3585 cm-1, which is within the range anticipated for free non-hydrogen-bonded phenolic
hydroxyl groups. In keeping with the concept of hydrogen bonding, this band becomes barely
noticeable, and the appearance of the broad absorption in the range 3200 to 3450 cm-1

26
becomes evident at concentrations above 1% by weight. (46)
2.1.2.4 Metal Content Several metals (e.g., Ni, V, Fe, Al, Na, Ca, and Mg) shown to accumulate in the
asphaltenes fraction of crude oil, typically in concentrations less than 1 % w/w. (54), (55),
(56), and (57) Vanadium and nickel, the most abundant of the trace metals, present mainly as
chelated porphyrin compounds, and they linked to catalyst poisoning during upgrading of
heavy oils (58), (59). The concentrations of other trace metals not bound in porphyrin
structures (e.g., Fe, Al, Na, Ca, and Mg) indicated to change in deposits as a function of
well depth (60), and amongst sub fractions of asphaltene. (54), (56)
2.1.3 Structure of Asphaltene
Beca use of the complexity of asphaltene molecules, finding the exact structure of
asphaltene has proven to be an overwhelming task. As discussed by Ruiz-Morales, and
Mullins, 2007 (52), the structure of asphaltene investigated by different physical methods
include infrared spectroscopy (IR), nuclear magnetic resonance (NMR), electron spin
resonance (ESR), a l s o mass spectroscopy, X-ray, a n d ultra-centrifugation, electron
microscopy, and small angle neutron scattering SANS, and small angle X-ray scattering
SAXS, quasi-elastic light scattering spectroscopy, vapor pressure osmometry (VPO) and gel
permeation chromatography (GPC).
Even though, the complete structure of asphaltene not yet completely discovered,
some common structures were established. Asphaltenes believed to consist of condensed
aromatic rings that carry alkyl and salicylic systems with hetero elements (i.e., nitrogen,
oxygen and sulfur) scattered throughout in various, including hetro-cyclic locations.(61), (52)

The aro
correspo
of rings
fluores
of aspha
enormou
a small
A
propose
three as
chemica
are shap
fingers r
omatic carb
onding H/C
s in a single
cence depo
altenes and
us, some wi
ring system
At the risk
ed. These th
sphaltene str
al speciation
ped like you
representing
bon content
atomic ratio
e fused ring
olarization te
related comp
th nitrogen,
m, an occas
Figure: 2.1
k of oversim
hree structure
ructures con
n, and aroma
ur hand with
g the periphe
of asphalt
o of 1.0-1.2
g system aro
echnique app
pounds. It fo
others with
sional molec
Idealized m
mplifying, t
es showed in
nsistent with
atic rings sh
h the palm r
ral alkane su
27
tenes is in
. The NMR
ound 7. (62
plied to surv
found that, th
sulfur, some
cule with a
molecule stru
three idealiz
n figure 2.1
h overall m
howed with
representing
ubstituent. (6
the range
R results sho
2) Groenzin
vey the mole
he variability
e with a big
metal, a po
ucture of asp
zed asphalte
. Idealized m
molecular siz
h darker lines
the core aro
64), (65)
of 40 to
ow that the a
and Mullin
ecular size o
y in asphalte
g ring syste
orphyrin, etc
phaltene
ene structur
molecular st
ze, aromatic
s. (63) Aspha
omatic ring
60 %, wit
average num
ns, (2000), (
of a broad ra
ene molecule
em, others w
c.
res have b
tructures for
c ring syste
altene molec
system and
th a
mber
(63),
ange
es is
with
been
r the
ems,
cules
d the

28
2.1.4 Asphaltene Molecular Weight
The molar mass of asphaltene is a topic of continued controversy over the last
decades beca use of its tendency to aggregate or associate even at low concentration. The
tendency of asphaltenes to aggregates in toluene at concentrations as low as 50 mg/liter. (66)
Though, with the development of more advanced techniques the discussion on
molecular mass of asphaltene seems to be over. In the past, the molar mass of asphaltenes
was measured by different methods such as Vapor Pressure Osmometry (VPO), mass
spectrometry (MS), size exclusion chromatography (SEC), and scattering phenomena such
as small angle X-ray (SAXS), and small angle neutron scattering (SANS). Molecular
mass determined by light scattering methods (SAXS, SANS) and fluorescence depolarization
technique differ by as much as a factor of 10 or more. It understood that many of
these techniques measured molar mass of aggregated asphaltene or micelles than a single
asphaltene molecule. Moreover, the molar mass of asphaltene depends on the technique
and experimental condition (time, concentration and temperature) employed for the
measurement. Size exclusion chromatography yielded average molecular weights as high
as 10,000 amu. (66) In different research, results of laser desorption mass spectroscopic
yielded asphaltene molecular weights of 400 amu with a range of roughly 200-600 amu.
Fluorescence depolarization measurements indicated the molecular weights of 750 amu with
a range of roughly 500-1000 amu. (63)
Some difficulties on using MS to measure the molar mass of asphaltene because of
that some ionization methods may cause aggregation, fail to ionize some components, or
break high- molecular-weight species into smaller pieces. Nevertheless, two recently
developed MS methods look to correct those difficulties. Both methods indicate molecular-
29
weight of asphaltene between 600-1100 amu. The first is two-steps laser desorption ionization
MS (L2MS), used by Pomerantz, et al (2008) and coworkers. (68) In this technique, an
infrared CO2 laser desorbs species from the surface by heating them enough to pop them off as
neutral molecules but not enough to break them apart. The researchers found a molecular
weight distribution that peaks around 600 amu and extends to more than 1,000 amu. The
second new method is laser-induced acoustic desorption (LIAD), utilized by Shea and
coworkers. (69) LIAD gets around this problem by evaporating asphaltene as neutral
molecules rather than ions. Shea 2007 and coworkers deposit samples on titanium foil and fire
a laser at the opposite side. The laser energy converted to a sound wave that travels through the
foil and pushes molecules off the other side. The molecules then subjected to electron
ionization, which non-selectively ionizes all organic compounds; they found a molecular
weight of asphaltene ranges from 400 to 1,100 a.m.u. the study of asphaltene samples from
around the world shows that the molecular weight distributions vary depending on
geographic origin. For example, Brazilian asphaltene samples have a lower molecular
weight range than North American asphaltene. (70)
2.1.5 Asphaltene Size and Shape
The asphaltene particle size and shape widely differ in literature (69) indicated that
the diameter of disk-like asphaltene entities in tetrahydrofuran for safanya asphaltene
fractions is about 13 nm. In 2004, Rajagopal and Silva (71) measured the spherical particle
size of asphaltene dissolved in toluene by light scattering method, and they projected it to be
23 nm even though at very low concentration of about 1 ppm. The freeze-fracture-
transmission electron-microscopy (FFTEM) technique used to study the asphaltene particle
diameter in toluene medium, and it was found to be in the range of 7-9 nm. (71) Another study

30
carried out by Chianelli et al. (2007) (64) by using WAXS wide angle x-ray scattering and
SAXS on Venezuelan and Mexican Asphaltene, show the presence of the asphaltene
particles within sizes in the range of 3–5 nm. Therefore, the review of the literatures indicates
that the asphaltene particle diameter varies between 3 and 23 nm. The variation in data is
due to the difference in solvents, techniques, and concentration range used. The variety of
shape of asphaltene includes thin-disk, spherical, fractal-like, oblate ellpsoid, prolate and
discoid. (72) (78)
Results from analytical methods such as time-resolved fluorescence depolarization
(TRFD) (73); Nuclear magnetic diffusion (74); Fluorescence correlation spectroscopy (FCS)
(75); DC conductivity (76, 77) show that the size of asphaltene molecules is ~ 1.5 nm.
2.2 Synthetic Asphaltene
Unlike crude oil asphaltenes, Synthetic Asphaltene does not get more attention from
researchers. However, Jones, Ignasiak, and Straus, (1978) (79) started working on preparing
Synthetic Asphaltene. In their study, they found the possibility of producing Synthetic
Asphaltene with different ways. They first used reaction of cholesterol with sulfur, also
reaction of maltenes with sulfur, and finally they found that synthetic asphaltene prepared in
the lab has similar properties to those of natural asphaltene. The analysis results of the
Synthetic Asphaltene showed that the 1H and 13C NMR and IR spectra were qualitatively
similar to those of the Athabasca asphaltene as shown in the Figures 2,3,and 4 below. From
this study, the researchers confirmed that asphaltene could be formed in nature by the reaction
of smaller molecules either of biological origin or already present in petroleum with sulfur at
moderate temperatures leading to a polymer with carbon-sulfur bridges. The Synthetic
Asphaltene consists of small units held together by sulfur bridges.

Figure (2
2.3) (a) IR s
(b) IR s
Figure
spectrum of
spectrum of
2.2 Chemic
Athabasca a
Synthetic A
31
cal Structure
asphaltene.
Asphaltene pr
of Choleste
repared from
erol
m cholesteroll and sulfur.

32
Figure (2.4) (a) 1 H NMR spectrum of Athabasca asphaltene.
(b) 1 H NMR spectrum of Synthetic Asphaltene prepared from cholesterol and sulfur.
Figure (2.5) (a) UV spectrum of Athabasca asphaltene
(b) UV spectrum of Synthetic Asphaltene prepared from cholesterol and sulfur
a
b

T
they var
polyarom
asphalten
formation
Synthetic
They als
liquid cry
show sim
The follo
compund
Figure (2
The chemical
ried in thei
matic discoti
ne. This wo
n and the ph
c Asphaltene
so explained
ystal-like mu
milar physica
owing figure
ds and also s
2.6) Structure
l compositio
ir derivativ
ic molecule
ork will he
hysical char
e can be pr
d the synthe
ultikylated a
al properties
shows the g
hows molec
e of discotic
ons of aspha
e sources.
es can be u
elp research
racteristics o
roduced by
etic formatio
aromatics. Th
to real asph
general form
cular simulat
c liquid cryst
33
altenes comp
Russell et
used in a t
hers deeply
of Synthetic
pyrolysis TO
on of aspha
he thermolys
altenes.
mula of highly
tion of the TO
tal where R=
plex during o
al. 2007
thermal sim
understand
Asphaltene
OCP (tetra
altene partic
sis products
y oriented d
OCP.
=undecyl, he
occurring in
(64) found
mulation mo
d the proces
s. Chianelli
octyl carbo
les by therm
of the disco
discotic liquid
eptyl, hexyl,
n nature, and
d that simp
odel of synt
ss of aspha
et al. found
xylate peryl
malizing dis
tic liquid cry
d crystaline
undecanoyl
d also
lified
thetic
altene
d that
lene).
scotic
ystals

Illustrattion (2.2) Relaxed simu
34
ulation of thee TOCP preccursor moleccule.

Figure (2
Figure(2
2.7) Diagramfree rad
.8)Schematictreatmencondens
m of pyrolysidicals.
c diagram ont of TOCsation.
is of TOCP f
of aliphatic CP at 360-4
35
follwed by s
and polyaro4200C invo
elf-assembly
omatic thermolving radic
y of asphalte
mal productcal couplin
ene from a se
ts upon theng and arom
ea of
heat matic

W
ester of T
below w
thermally
fragment
below sh
Residuum
position a
Figure (2
When the tem
TOCP becom
when temper
y converted
ts. Finally, C
hows the IR s
m), and it is
and intensity
2.9). InfraredArab Vsyntheti
mperature in
mes the wea
rature becom
into a sea o
Chianelli et a
spectrum of
clear that a
y of the IR sp
d spectra of Vacuum Resiic and the HA
ncreased dur
akest region
mes above
of free radic
al. successfu
TOCP, Syn
absorption b
pectrum of H
f the TOCP pide) asphaltAVR asphal
36
ring the ther
for thermal
4200C in t
cals containi
ully prepared
thetic Aspha
ands of Syn
HVAR. (64)
precursor, Sene showingltene.
rmal proces
l cleavage. T
the absence
ing aromatic
d Synthetic A
altene, and H
nthetic Asph
)
Synthetic Asg the signif
s above 350
This is clear
e of air, TO
c cores and
Asphaltene, a
HVAR (Hea
haltene match
sphaltene andficant simila
00C, the alip
r in Figure (
OCP compl
long-chain
and Figure (
vy Arab Vac
h well with
d HAVR (Harity betwee
phatic
(2.10)
letely
alkyl
(2.10)
cuum
band
Heavy n the

37
The comparison in chemical peoperties between Synthetic Asphaltene and HVAR illustrated in
the table below
Table (2.1) Comparison of some chemical properties of Synthetic Asphaltene and HVAR
Chemical properties of synthertic asphaltene and HVAR
H/C %C Aromatic
%C
Aliphatic MW
Synthetci asphaltene 1.06 58 42 2,750
HVAR asphaltene 1.10 33-45 55-65 1.000-10,000

38
Chapter 3: Photovoltaics
3.1 Photovoltaic Effect
3.1.1 Introduction
The photovoltaic effect represents the generation of a potential difference at the junction
of two different materials in response to visible or other forms of radiation. The whole area of
solar energy conversion into electricity is named “photovoltaics”. (88)
Photovoltaic comes from the words photo meaning “light” and volt, a measurement of
electricity. Sometimes photovoltaic cells called PV cells or solar cells for short. (80). In another
definition, Photovoltaics means “light-electricity”, as “photo” is a stem from the Greek word
“phõs” meaning light and "Volt” is an abbreviation of Alessandro Volta who was a pioneer in
the study of electricity. Since a layman often does not know the meaning of the word
photovoltaics, a popular and common term to refer to PV solar energy is solar electricity. (88)
The photovoltaic process combined of four stages includes light absorption, charge
generation, charge transport, and charge collection. (81) Light absorption occurs when the
material has a semiconducting property that responds to incident waves. The absorption
characteristic is based on the band gap of the semiconducting material, and its intrinsic extinction
coefficient. Then charge generation. When the incident photon hits electrons at the ground state,
inorganic semiconductors generate free carriers. Though, in organic semiconductors, excited
electrons slightly relax and then form an exciton, a bounded electron and hole pair. To make an
efficient organic photovoltaic cell, effective dissociation of excitons is an important issue as the
binding energy of the exciton is large. (82)

39
3.1.2 History
In 1839 Edmund Becquerel found that some materials could generate a small amount of
electric current when exposed to light. This phenomenon is called the photovoltaic effect. It is
the essential process in which a solar cell changes sunlight into electricity. In 1905, the nature of
light and the photoelectric effect was explained by Albert Einstein based on photovoltaic
technology. In the 1970s, during the energy crises, photovoltaic technology got credit as a source
of power for non-space applications. In the 1940s and 1950s, steps were taken for the
commercialization of photovoltaics when the Czochralski process developed for producing
highly pure crystaline silicon. In 1954, at Bell Laboratories using the Czochralski process,
scientists developed the first crystalline silicon photovoltaic cell with a conversion efficiency of
4%. (83)
In the 1990s and 2000s, interest in photovoltaics expanded. In large part, this interest was
prompted by the widespread deregulation of the energy supply and environmental topics related
to global warming, which has increased a desire to secure alternative energy sources. (84)
3.2 Application of Photovoltaic Technology
Throughout the research and development stage of photovoltaic technology for space
applications, researchers never considered this technology practical for mass power production on
Earth. Oil and coal fossil fuels are extremely cheap compared with electricity production costs of
silicon solar cells. (85)
In the 1970s two oil crises facilitated research on photovoltaic technology that improved
the performance of PV cells. Research focused on developing device physics and process
technology. (86) As a result, establishment of the biggest photovoltaic companies took place

40
between1970 and 1979. In 1970, Solar Power Corporation was founded. Three years later, in
1973, Solarex Corporation established. At Delaware University a solar photovoltaic-thermal
hybrid system, one of the first photovoltaic systems for domestic application, was developed. A
silicon solar cell of US$30 per W was produced. In 1974, the Japanese Sunshine project
commenced. A year later, in 1975, Solec International and Solar Technology International was
established (87).
Many important events in the field of photovoltaic occurred in 1980-1990. Over 1 MW
was generated per year with photovoltaic modules by ARCO Solar. BP purchased Lucas
Energy Systems and entered the solar industry business. Saudi Arabia installed solar powered
seawater desalination systems with 10.8 kW peak power in Jeddah. Volkswagen tested
photovoltaic systems placed on vehicle roofs with 160 W peak powers for vehicle start up. In
California in 1984, 1 MW photovoltaic power plant started to work in Sacramento. The same
year ARCO Solar introduced the first amorphous modules. In 1985, researchers of the
University of New South Wales in Australia built a solar cell with more than 20%
efficiency. BP built a power plant in Sydney and shortly after another one in Madrid. In
1986, the first commercial thin film photovoltaic module was presented by ARCO Solar. In
1989, BP obtained a patent in thin film technology for a solar cells production.
The total commercial production of solar cells in 2004 was 1GWp and was 1250
MWp. Crystalline silicon based solar cells contributed up to 95% of the total production and
was the dominant solar cell technology. The a-Si:H technology contributed with 4% of the
total production in 2004. The only non-silicon technology that was delivering commercial
modules was the CIS and CdTe technology with almost 1% of the total production. In 2004,
most of the solar modules were manufactured in Japan (47%). The USA contributed with

41
11%, and Europe with 27%, the rest of the solar cells was produced in countries such as
China, India and Australia. (88)
3.3 Environmental Effects from Operation of PV Systems
Normally there are no effects of PV systems operation on the environment. They do not
make noise, solid waste, or other pollutants that could damage the environment. Thus, PV
systems and the electricity they generate make an important contribution to the protection of the
environment. PV systems do not generate emissions during operation and all of their life cycle
emissions of carbon dioxide are indirect ones. For example, in industrial countries each kWh that
is generated by PV plants avoids an output of the greenhouse gas carbon dioxide. In Germany,
each kWh generated by PV systems avoids nearly 650 grams of carbon dioxide. Compared with
fossil fuel technologies, photovoltaic technology has various environmental advantages in
generating electricity. For example, carbon dioxide emissions and other pollutants become
negligible by applying photovoltaic technology. The most major environmental problem
associated with photovoltaic systems results from the use of toxic chemicals like cadmium
sulfide and gallium arsenide in the manufacturing process.(87) Because these chemicals are very
toxic and stay in the environment for centuries, the disposal of unused cells could cause
significant problems to the environment. Though, the most useful cells with low cost, mass
production, and high efficiency are those manufactured by using silicon. This material produces
the cells with less expense and is environmentally friendly and safer than the cells produced by
heavy metal. (89)
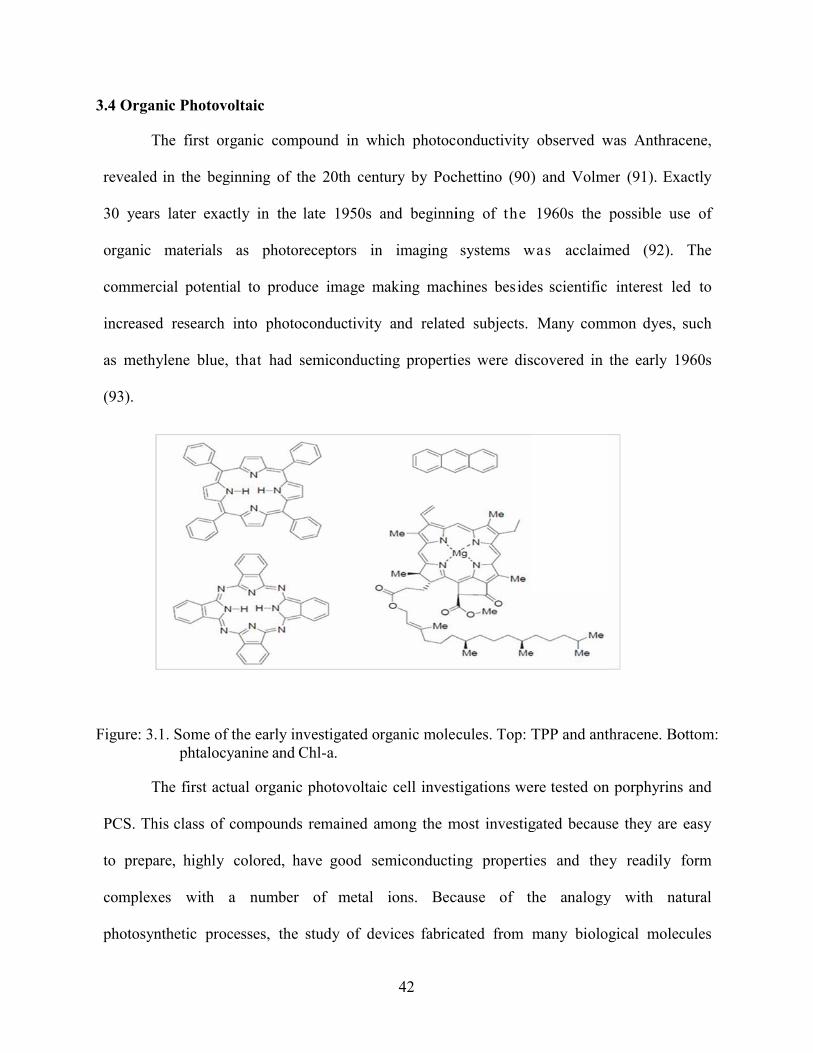
3.4 Orga
T
revealed
30 year
organic
commer
increase
as meth
(93).
Figure: 3
T
PCS. Th
to prep
complex
photosy
anic Photovo
The first or
d in the beg
rs later exac
materials
rcial potenti
ed research
hylene blue,
3.1. Some of phtalocy
The first act
his class of
are, highly
xes with
ynthetic proc
oltaic
rganic comp
ginning of th
ctly in the l
as photor
ial to produ
into photoc
that had s
f the early invyanine and C
tual organic
compounds
colored, ha
a number
cesses, the
pound in wh
he 20th cent
late 1950s a
eceptors in
uce image m
conductivity
semiconducti
vestigated orChl-a.
photovoltai
remained a
ave good se
of metal
study of de
42
hich photoc
tury by Poc
and beginni
n imaging
making mach
y and relate
ing properti
rganic molec
c cell invest
among the m
emiconducti
ions. Bec
evices fabric
onductivity
chettino (90)
ing of the
systems w
hines beside
ed subjects.
ies were dis
cules. Top: T
tigations we
most investig
ing properti
cause of th
cated from m
observed w
) and Volm
1960s the
was acclaim
es scientific
Many comm
scovered in
TPP and ant
ere tested on
gated becaus
ies and the
he analogy
many biolo
was Anthrac
er (91). Exa
possible use
med (92).
interest led
mon dyes, s
the early 19
thracene. Bo
n porphyrins
se they are e
y readily f
y with nat
gical molec
cene,
actly
e of
The
d to
such
960s
ottom:
and
easy
form
tural
cules

like car
gives ea
3.5 Mech
T
localizati
photovol
spontane
separated
features a
devices u
roughly i
junctions
achieved
proposal
rotenes, chlo
arly understa
hanisms of O
The main dif
ion of the e
ltaic convers
ously delive
d, move rel
are critical in
used to ach
into molecul
s, or as org
d the highest
.
Figure
orophylls an
anding of the
Organic Ph
fference bet
excited state
sion that, fi
er an electro
latively slow
n determinin
hieve photo
lar and poly
ganic/inorgan
efficiency a
(3.2) Differe
nd other porp
e organic pho
otovoltaic E
tween organ
es (See Figu
first, the exc
on–hole pair
wly through
ng organic p
conversion
ymer organic
nic hybrid c
among all the
ence betwee
43
phyrins, and
otovoltaic ef
Effect
nic and inor
ure 3.2). Th
cited state c
at room tem
h the materi
photovoltaic
in organic
c solar cells
cells as dye
e above men
en organic an
d the structu
ffect in orga
rganic semic
his has the
created by
mperature an
ial towards
device desig
materials.
(95), flat-lay
e-sensitized
ntioned type
nd inorganic
urally related
anic photocel
conductors i
important c
photon abso
nd, second, t
the electro
gn, and creat
These cells
yer systems
solar cells
s and will be
semiconduc
d phtalocyan
lls.
is the degre
consequence
orption doe
the charges,
odes (94). T
te many diff
s can be div
and bulk he
(96). The
e the topic o
ctor
nines
ees of
es for
s not
once
These
ferent
vided
etero-
latter
of this

44
Upper panel, in a crystalline inorganic semiconductor, the photo generated exciton
delocalized over many atoms, and readily dissociates into electron–hole pairs. So a photon
absorbed anywhere in an optically thick device generates separate charges. Lower panel, in an
organic semiconductor, the photo generated exciton localized on a single molecule and
dissociates into separate charges only when the exciton created close to an interface. Therefore,
charge pairs generated only in regions that lie within an exciton diffusion length of an interface.
Even though, exciton dissociation can occur efficiently at the bonding between metal
electrode and an organic semiconductor, the effective charge-separation efficiency at such an
interface is limited because of the high likelihood of recombination of the separated charges at
the metallic electrode (94). A main requirement of almost all organic photovoltaic devices is an
interface between two materials of different electronic properties, the purpose of which is to
cause exciton dissociation (97). After photon absorption is created, the exciton in a molecular
material can make several things it can diffuse to other molecules segments of the same material
by a series of hops, and can decay by emission of a photon. It may also decay into a more long-
lived and lower energy triplet state. It can transfer on to a different type of molecule. It can
dissociate via transfer of an electron or hole to another molecule or a metal electrode (97).
Exciton dissociation can occur when the exciton reaches an interface with the other material and
when it is most energetically favorable for the charges to separate. In the case of dye-sensitized
cell, this normally requires that a suitable level for the (HOMO) highest occupied molecular
orbital and the (LUMO) the lowest unoccupied molecular orbital of the photo-sensitizer
matching the iodine redox potential and the conduction band edge level (Ecb) of the TiO2
electrode. The HOMO level must be more positive than the iodine redox potential to accept

45
electrons, and the LUMO level must be more negative than the Ecb of the TiO2 electrode to
inject electrons (98).
To drive photocurrent, the separated charges should both be able to find pathways
towards the electrodes and continuous phases of donor material between the charge separation
interface and hole-collecting electrode and of acceptor material between the interface and
electron-collecting electrode needed. For charge separation to occur, the exciton should reach
the interface before it decays by another process. Radiative exciton decay typically occurs in
hundreds of picoseconds. The distance that an exciton can diffuse in a molecular semiconductor
on this timescale, called the exciton diffusion length, is typically a few nanometers. Therefore,
efficient light harvesting can occur only within approximately one exciton diffusion length of a
donor–acceptor interface (99)
3.6 Photovoltaic Cell Performance
In general, the percentage of the solar energy shining on a PV device that converted into
electrical energy or electricity is defined as the conversion efficiency of a photovoltaic (PV) cell.
Improving the conversion efficiency of PV devices is an important aim of study and helps make
PV technologies low cost with more traditional sources of energy. (80)
In general, a photovoltaic cell is a device that converts solar energy to electrical energy.
Electrical power production under illumination can be attained by the photovoltaic cell.
Photovoltaic cell has the ability to generate voltage over an external load, and current through the
load. This is illustrated by the current-voltage (IV) curve of the cell at the certain temperature
and illumination (Figure 3.3).
When the cell is short circuited under illumination, the maximum current and the short
circuit current (ISC) generated while no current can flow, and the voltage at its maximum called

46
the open circuit voltage (VOC) under open circuit conditions. The point in the IV-curve
producing maximum a product of current and voltage is called the maximum power point (MPP).
Fill factor (FF) is another important characteristic of the solar cell performance. The ratio
between the maximum power generated and the product of the short-circuit photocurrent density
( ) and the open-circuit voltage (Voc) is known as fill factor. The higher value of fill factor
allows for better quality of the device.
.
. 1
Using the fill factor, the maximum power output of the solar cell can be written as
. . 2
While the physical principles of different types of photovoltaic cells different, the current-
voltage curve of good performance cells are the same and can be characterized with each other in
terms of FF, VOC, and ISC. The energy conversion efficiency of the solar cell is defined as the
power produced by the cell (PMAX) divided by the power incident on the representative area of
the cell (Plight):
100% .100 3
The temperature of the cell is an essential factor that affects the efficiency of the solar cell, and
which is even more essential on the quality of the illumination, i.e. the total light intensity and
the spectral distribution of the intensity.

F
cells test
condition
that of A
power of
Wp at the
or this reaso
ts between
n used for te
AM1.5 globa
f the solar ce
ese condition
Figu
on, a standar
different lab
esting of terr
al standard s
ell is the no
ns. (88)
ure (3.3) Cur
d measurem
boratories. T
restrial solar
solar spectru
minal powe
47
rrent-Voltag
ment conditio
The light in
cells. The s
um and temp
r of the cell
ge (IV) curve
on was impro
ntensity is
spectral distr
perature of
l, or module
e
oved to comp
1000 W/m2
ribution of th
the cell is 2
, and report
pare similar
2 at the stan
he light sour
25°C. The o
ed in peak w
solar
ndard
rce is
output
watts,

48
Chapter 4: Dye Sensitized Solar Cells DSSCs
4.1 Introduction
The depletion of petroleum resources in this century and raising awareness of
environmental change caused by the combustion of fossil fuels and the exploration of renewable
energy sources, such as solar energy are more important issues for all world countries.
Furthermore, photovoltaic devices have become a favorable replacement energy source in the
last century with an expected increase in significant contribution to overall energy production
over the coming years. Silicon-based technologies also developed as new techniques of solar
energy, but they are not yet competitive with fossil fuels because of the high production costs.
The photovoltaic field now challenges the development of new nanocrystalline and conducting
polymer films based devices, with a very low-cost production and attractive features such as
transparency, flexibility, etc. that could facilitate the market entry. Amongst all of them, dye
sensitized solar cells (DSSC) are devices that appear to reach moderate efficiencies, and thus are
feasible competitors to conventional cells. (100, 101)
Dye Sensitized Solar Cell DSSC is one of the most promising types of solar cell that has
attracted much attention in the scientific community as it already belongs to the third generation
of photovoltaic (PVs). Dye-sensitized solar cell (DSSC) for its basic operation does not depend
on the principle of a p-n junction as in common solid state solar cells that are based on crystalline
silicon. (102). The DSSC can be classified as a photo electrochemical (PEC) solar cell because
of its utilization of photons, charges, and electrolyte for its basic operation (103). Meanwhile,
O’Regan and Grätzel invention by 1991, (100) DSSC attracted widespread academic and
industrial interest because it has advantages that previously did not exist in the traditional
photovoltaic cells. Based on the reports in the literature, DSSCs are easily fabricated at a low-

49
cost, are environment friendly and have high-energy conversion efficiency (104). One more
advantage of DSSCs is that changes in temperature do not affect the performance, while
temperature changes can affect the performance of conventional silicon solar cells (105)
4.2 History and Development
The basis of inventing the DSSC is associated with three main concepts in
technological developments photovoltaic, sensitization and nano-technology. The historical
events of the first one have already been addressed. The idea of modifying the band gap of
semiconductors to light of a wavelength longer than its corresponding band gap
(sensitization) was discovered accidentally and connected to the beginning of photography
dated back in 1873.
It was an exciting connection between photography and photo electrochemistry,
both of which depend on photo-induced charge separation at a liquid solid interface.
Silver halides crystals first used in photography had band gaps ranging from 2.7 to 3.2 eV
and insensitive to wavelengths longer than 460 nm. To make it photosensitive to longer
wavelengths associated dyes with the halide semiconductor grains and expand the photo
response to longer wavelengths, (106) that was the first film, able to deliver the image of a
sight practically into black and white picture. Moser shortly afterward used the same
analogy to make the first sensitization of a photo- electrode, (107) and was confirmed by
Rigollot in 1893 (108). However, it took scientists more than 80 years to understand that their
operating mechanism is by injection of electrons from photo-excited dye molecules into the
conduction band of the n-type semiconductor substrates (109) which dated from the 1960s. In
the following years, the idea improved that the dye could perform most efficiently if
chemicals adsorbed on the surface of the semiconductor.

50
Nanotechnology is a concept recognized long ago, and humans without knowing
employed nanotechnology, in making steel, paintings and in strengthening rubber. In the
early 1980s, nanotechnology got its biggest boost with two main developments, the birth of
cluster science and the innovation of the scanning tunneling microscope (STM). In 1985, this
development allowed for the discovery of fullerenes and the structural assignment of carbon
nano-tubes a few years later. In the field of semiconductors, the synthesis, electrical and
chemical properties of semiconductor nano-crystals were studied. This led to a fast
increasing number of semiconductor nano-particles of quantum dots and photovoltaic.
The use of dye-sensitization processes in photovoltaics stayed ineffective until the
early 1980s when it combined with the nanotechnology revolution in the Laboratory of
Photonics and Interfaces in the EPFL in Switzerland. I n 1 9 9 1 , Grätzel and his co-
workers established a solar cell with energy conversion efficiency above 7 %. They
successes by a combining nano-structured electrodes and efficient charge injection dyes (100),
and achieved 10% in 1993 (110). This solar cell is called the dye sensitized nano-structured
solar cell or the Grätzel cell due to the name of its inventor.
DSSCs differ from conventional semiconductor devices. They separate the function of
light absorption from charge carrier transport. Dye sensitizer solar cells absorb the incident
sunlight and exploit the light energy to induce electron transfer reaction. Therefore, DSSCs have
some advantages compared to Si based photovoltaics:
(1) DSS are not sensitive to defects in semiconductors such as defects in Si.
(2) The SEI is easy to form, and it is cost effective for production.
(3) In DSCC, it is possible to understand the direct energy transfer from photons to chemical
energy. (111)

51
4.3 Brief Description of DSSC
DSSCs join the light absorption and charge separation process by the involvement of a
sensitizer as light absorbing material with a wide band gap semiconductor usually titanium
dioxide. As early as the 1970s, it was found that titanium dioxide (TiO2) could split water with a
small voltage after exposed to light (112). However, with the large band-gap for TiO2, which
makes it transparent for visible light, the conversion efficiency was low when using the sun as an
illumination source. Dye sensitization of semiconductor electrodes dates to the 1960s (113).
Since only a monolayer of adsorbed dye molecules was photoactive, light absorption was low
and limited when flat surfaces of the semiconductor electrode were employed. This problem was
solved by introducing polycrystalline TiO2 (anatase) films with a surface roughness factor of
several hundred (114, 115). The amount of adsorbed dye increased more by applying
mesoporous electrodes, presenting a huge active surface area, and cells combining such
electrodes, and a redox electrolyte based on iodide/triiodide couple produced 7% conversion
efficiencies in 1991 (100). The current highest energy conversion efficiency is over 11% (116),
and an extra increase in efficiency is possible by designing proper electrodes and sensitization
dyes.
Both a scheme and an energy level diagram of a liquid electrolyte dye sensitized solar
cell are illustrated in Figure 4.1. Usually, DSSC contain one electrode made of a layer of
titanium dioxide nanocrystals with an average crystal size of around 20 nm sintered together to
allow electronic conduction take place. A monolayer of a sensitizer dye, usually a ruthenium
polypyridyl complex, is attached to the surface of the nanocrystalline electrode. This mesoporous
film is deposited onto a conductive, transparent substrate, indium tin oxide (ITO) or fluorinated
SnO2 (FTO), and dipped with a redox electrolyte, essentially containing I-/I3- ion couples. This

electrolyt
Light is
conductio
oxidized
the redox
electron m
Figure4.1
te is also p
then collect
on band of
dye transpo
x electrolyte
migration th
1. Cross secconditiorepresen
put in contac
ted by the d
the nanocry
orts the elect
e, where the
hrough the ex
ction view oons (left), annt the energe
ct with a co
dye producin
ystalline sem
tron accepto
e I3- back re
xternal load.
of the designd energy letics of opera
52
olloidal plat
ng photo-exc
miconductor,
ors species (
educed to I-
gn of a dye levels of theation of such
tinum cataly
cited electro
then into th
I3-), reduced
- and the ele
sensitized se different h devices (ri
yst coated c
ons that are
he conductin
d to the cou
ectrical circu
solar cell uncomponentsight).(101)
counter-elect
injected int
ng substrate
unter-electrod
uit complete
nder illumins of the cell
trode.
to the
. The
de by
ed by
nation l that

53
4.4 Requirements of Efficient Dye in DSSC
Ooyama, Y. and Harima, Y. (2009) have done an extensive literature review on the main
requirements for efficient organic molecule (dye) used so far for DSSCs. Their conclusion is
summarized as follows:
The organic molecule (dye) should have as a minimum one anchoring group like
COOH, –SO3H, –PO3H2, –OH for adsorption onto the TiO2 surface to provide a
strongly bound dye and good electron communication between them.
To achieve efficient electron injection from the excited dye to the CB of the TiO2,
the energy level of the lowest unoccupied molecular orbital (LUMO) of the dye
must be higher (more negative) than the conduction band (CB) of the TiO2
electrode. On the other hand, to achieve efficient regeneration of the oxidized
state by electron transfer from I3–/I– redox couple in the electrolyte, the energy
level of the highest occupied molecular orbital (HOMO) of the dye must be lower
(more positive) than the I3 –/I– redox potential
The organic molecule should have high molar absorption coefficients over the
wide region of sunlight extending into near infra-red, to provide a large
photocurrent to give the high light harvesting efficiency.
To achieve a stable DSSC, the organic molecule should have chemical stability in
its photoexcited state and the redox reactions throughout the reaction cycle.
Dye aggregation on the TiO2 surface should be avoided. This aggregation leads to
reduction in electron-injection yield from the dyes to the CB of the TiO2 due to intermolecular
energy transfer causing low conversion efficiency of the DSSC. (117)

4.5 Stru
The
The tra
nanostruc
The tran
and trans
4.5.1 Con
T
conduct
electrom
photocu
FTO) d
extensiv
indium,
ucture of Dy
e main parts
ansparent a
ctured layer
sparent cond
sparent thin f
Figure
nducting Su
The most wi
ting oxide
magnetic rad
urrent. The m
due to its th
vely as it has
and the cos
ye Sensitized
s of the dye
and counte
r, the sensiti
ducting elec
film such as
e4.2. Schema
ubstrate
idely used su
(TCO). Sui
diation as w
most widely
hermal stabi
s higher con
stly layer dep
d Solar Cell
sensitized s
er conducti
zer, and the
ctrode TCO
fluorine dop
atic of the str
ubstrates for
itable TCO
well as high
used TCOs
lity and low
nductivity. H
position requ
54
l
solar cell are
ing electro
e electrolyte
and counter
ped tin dioxi
ructure of th
r DSSCs are
must have
electrical co
in DSSC is
w cost. Indi
However, bec
uiring vacuu
e illustrated
odes, wide
are the ma
r-electrode a
ide (SnO2).
he dye sensit
made of coa
e high tran
onductivity
fluorine dop
ium tin oxid
cause of high
um, as well
schematical
bandgap
ain four elem
are coated w
(118)
tized solar ce
ated glass w
nsparency fo
to collect a
ped tin diox
de (In2 O3,
h cost and li
as its low st
lly in Figure
semicondu
ments of the
with a condu
ell.
with a transpa
or most of
all the gener
xide (SnO2:
Sn or ITO
imited suppl
tability at hi
e 4.2.
ucting
e cell.
uctive
arent
the
rated
F or
O) is
ly of
gher

55
temperatures alternatives are required. Carbon nanotube conductive coatings are a potential
substitute (119). Aluminum-doped zinc oxide (AZO) is also widely studied because it is a cheap,
nontoxic and available material. (120)
4.5.2 The Counter Electrode
Conducting glass electrodes have poor reduction ability for I3-; therefore a catalyst is
needed in the counter electrode to overcome the high activation energy of the electron
transfer. Platinum is the most commonly used material for this purpose. It acts as a catalyst
in the redox reaction at the counter electrode, thus preventing this process from becoming
rate limiting in the light energy harvesting system. However, platinum has another problem
apart from its high price, which is the non- confirmed possibility of corrosion by the iodide
solution, which leads to the formation of PtI4 (121). Since platinum is very expensive, other
cheaper alternatives may take its place like various forms of carbon (122). In this regard, it
found that functionalized graphene sheets with oxygen-containing sites perform comparably to
platinum in DSSC (123). Gold, although expensive, is another viable alternative that is
constantly used in solid state DSSCs. (124)
ZnO with poly (3, 4-ethylenedioxythiophene) polystyrene sulfonate (PEDOT: PSS) can
be an effective counter electrode in DSSC with maximum power conversion efficiency of
8.17%. (125)

56
4.5.3The Working Electrode
4.5.3.1Semiconductors
Semiconductors that have narrow band gaps and absorb visible light efficiently are
subject to photo-corrosion and are not suitable for DSSC. Metals oxides such as titanium
or niobium have a wide band gap; absorption edges towards the ultraviolet, and consequently
is insensitive to the visible spectrum. For this reason, the sensitizer adsorbed onto the surface
of the semiconductor increases the absorption spectrum range and the light harvesting
efficiency (126).
TiO2 has long been the preferred semiconductor in DSSCs, in spite of some promising
properties offered by other metal oxides such as ZnO (28), SnO2 and Nb2O5 (127). Titanium
dioxide TiO2 became the semiconductor of choice as it has many advantages for sensitized
photoelectrochemistry and photochemistry; it is a low cost, available, non-toxic and
biocompatible material (128). Anatase is the most favored form among the three common
crystalline polymorphs of TiO2 (Rutile, Anatase and Brookite) (129) because it has a high
bandgap energy (3.2 eV) it becomes invisible to most of the solar spectrum as it absorbs
only below 388 nm, and it reduces the recombination rate of photo-injected electrons. Rutile
has also been used but it has a smaller bandgap (3.0 eV) and is less effective since photon
excitation within the bandgap generates holes that act as oxidants making it less chemically
stable (130).

57
Figure: 4.3 On the left: scanning electron microscope picture of the fractal TiO2 film used in the first embodiment of the DSSC in 1988. On the right: scanning electron micrograph of a TiO2 anatase colloid film. (105)
The TiO2 film morphology plays an essential role in the DSSCs performance. In order
to obtain maximum area for dye adsorption using the minimum quantity of TiO2, the
semiconductor layer should have nanostructure mesoscopic morphology important for a
high surface area. A monolayer of dye on a flat surface absorbs little light because it holds
an area that is much larger than its optical cross section. In the first laboratory embodiment
of the DSSC which dates back to 1988 (131), the photo-anode was a titanium sheet covered
with a high surface area “fractal” TiO2 film that had a roughness factor of about 150.
The overall conversion efficiency in full sun light by that DSSC had conversion efficiency
in between 1% and 2%. Years later, in 1991 Grätzel reported a breakthrough, with
efficiency of around 7% achieved by the innovative use of a nano-scopic TiO2 particle
layer that produces a junction of huge contact area. The semiconductor’s surface was thus
enlarged over 1000 times allowing for efficient harvesting of sunlight by the adsorbed
monolayer of sensitizer.
Typical semiconductor film thicknesses are 5-20 μm, with TiO2 mass of about 1- 4 mg
cm-2, film porosity of 50-65%, and an average pore size of 15 nm and particle diameters of 15-
20 nm. Semiconductor can be deposited onto the surface of the glass substrate; three

58
deposition techniques commonly used to deposit the semiconductor onto the glass substrate
are screen-printing doctor blading, and spin coating (132).
The thickness of the nanostructured TiO2 layer is the most important factors that affect
the cell's efficiency; it should be less than 20 μm to ensure the diffusion length of the
photoelectrons is greater than the nanocrystalline TiO2 layer. The most commonly
nanocrystalline semiconductor oxide electrode used in the DSSC is TiO2. It used as an
electron acceptor and to support a molecular or quantum dot QD sensitizer (30). Another wide
bandgap semiconductor oxide that is becoming common is the zinc oxide ZnO2. ZnO2
possesses a bandgap of 3.37 eV and a large excitation binding energy of 60 meV. Kim et al.
reported that the nanorods array electrode showed stable photovoltaic properties and exhibited
much higher energy conversion efficiency (133)
4.5.4 The Photo-Sensitizer (Dye)
Dye molecules (sensitizers) are the key component of a DSSC to have increased
efficiency through their abilities to absorb visible light photons Despite the fact that the
highest efficiency of the dye sensitized solar cells was achieved from a collaborative effect
of numerous physical-chemical nanoscale properties, the main topic is the theory of dye
sensitization of large band-gap semiconductor electrodes. In the dye sensitized solar cells, this
was accomplished by coating the internal surfaces of porous TiO2 electrodes with special
dye molecules tuned to absorb the incoming photons (129). The dye is the light absorber and
the photoreceptor sensitizing the semiconductor and so some conditions must be fulfilled.
Without a doubt, a dye that absorbs nearly all the sunlight radiation incident on earth, like a
black-body absorber, is highly desirable.

59
In addition, dye must carry groups to attach the dye to the surface of semiconductor
such as carboxylate (134, 135) or phosphonate (136, 137) groups, because these are the most
employed ones. Other groups, like boronic acid (138), salicylate (139), silanes (140), amides
(141), ethers (142) or hydroxamic acid groups (143) can also be employed to attach photo-and
redox-active molecules to metal oxide surfaces. The anchoring group is an essential factor
considered in the fabrication of efficient sensitizers because it may affect both the stability of
the linkage and the electronic coupling between the dye and the semiconductor (137). Upon
excitation, it should inject electrons into the solid with a quantum yield of unity, which is best
completed when the electronic coupling of the donor levels of the dye well matched with the
acceptor levels of the semiconductor. The dye a l s o should be stable enough to carry on
about 108 turnover cycles corresponding to about 20 years of exposure to natural light (144).
In order to achieve that, one has to make sure that the electron injection and the recovery of
the oxidized form by the redox couple are fast enough to suppress side reactions like
degradation (e.g., loss of ligand), desorption or aggregation. To date, polypyridyl complexes
of ruthenium (II) called N3 and Black dye found the best photovoltaic performance in
terms of conversion yield and long-term stability. (S e e figure 4.4)
Figure: 4.4 Chemical structure of the two of ruthenium complexes N3 and Black dye (105)

60
Despite the high performances of these two dyes, other non-metallic alternatives are
currently being pursued (145). Because of its scarcity, ruthenium is a very expensive metal and
there is a necessity for alternatives. The most promising alternatives are natural organic dyes,
which are heap, less stable and less efficient. However, they have a great potential for this
application due to their high absorption coefficients compared to ruthenium sensitizers (146).
Organic dyes consisting of natural pigments and synthetic organic dyes have a donor-
acceptor structure called push-pull design, which improves the absorption in red and infrared
region by increasing short circuit current density. Natural pigments, like chlorophyll, carotene,
and anthocyanin, are available in plant leaves, flowers, and fruits and fulfill these
requirements. Experimental results showing that natural-dye sensitized solar cells achieved the
efficiency of 7.1% and high stability. (147)
Co-sensitization, the use of two dyes combination that complements each other in
their spectral features is another strategy to get a broad optical absorption expanding
throughout the visible and near IR region. This strategy has the advantage of enhancing
photo-absorption in that the optical effects of the two sensitizers have been found to be
additive. In particular, there was no negative interference between the co-adsorbed
chromophores, making way for testing a multitude of other dye combinations (148).
To increase improvement of the performance of DSSC, different kinds of additives
have been added into dye solutions. For example, Kay and Grätzel found that the addition of
cholic acid (CA) with porphyrin derivatives improved both the photocurrent and photovoltage
of the solar cell. (149) Additionally, other co-adsorbents such as hexadecylmalonic acid
(HDMA) (150), deoxychoic acid (DCA) (151), and chenodeoxychoic acid (CDCA) (152) were
also used in the dye solution when fabricating sensitized TiO2 films into devices, among

61
which CDCA is the most popular co-adsorbent.
4.5.5 Electrolyte
The electrolyte is an important part of all DSSCs. It is responsible for inner charge
carrier between electrodes. It is the hole-transport material. It regenerates the dye at the
photoelectrode with the charge collected at the counter electrode. For stable operation of the
solar cell and maximal power output, the oxidized dye must be reduced back to the ground state
as rapidly as possible by a suitable electron donor. Since the maximum photovoltage (Voc)
obtainable corresponds to the difference between the redox potential of the electrolyte and Fermi
level of the electron in the TiO2 (105), it is preferable to choose a couple whose potential is as
close to the redox potential of the sensitizer as possible. In addition, the choice of the mediator
should be such that there is enough driving force for the dye reduction step to have an optimal
rate. It is also important for stable performance of the solar cell that the redox couple is fully
reversible, absorption in the visible region, and stable in the oxidized and reduced forms (153).
Furthermore, counter cations of iodides such as Na+, Li+, and R4N+ influence the cell
performance essentially because of their adsorption on nanostructured electrode (TiO2) or ion
conductivity. It found that using tert-butylpyridine in redoxing electrolyte increases cell
performance (154). Promising results obtained by using Br -/Br3 - redox couple DSSCs. When
the redox couple changed from I- /I3 - to Br -/Br3-, the Voc and Isc for the Eosin Y-based DSSC
increased (155). The redoxing electrolyte was selected so that the reduction of I3 - ions by
injection of electrons is quick and efficient. This arrives from the fact that the dependence of
both hole transport and collection efficiency on the dye-cation reduction and I -/I3 - redox
efficiency at counter electrodes are to be taken into consideration (156). In addition, as
evaporation becomes the main reason for limiting cell stability, liquid electrolyte prevents

62
fabrication of multi-cell modules since module constructing requires cells be connected
electrically until separated chemically (157, 158). Therefore, an important limitation of the dye
sensitized solar cells filled with liquid state redoxing electrolyte is the leak of the electrolyte,
causing a reduction of the cell’s lifespan, besides the associated technological problems
associated to device sealing up, and hence long-term stability (159). Many research groups study
the use of ionic liquids, polymer, and hole conductor electrolytes to substitute the need of
organic solvents in liquid electrolytes.
The ideal ionic liquids for DSSC should have good chemical and thermal stability,
negligible vapor pressure, non-flammability, high ionic conductivity and a wide
electrochemical window (160). Molten salts based on imidazolium iodides revealed very
attractive stability features (161). Despite their high viscosity, linear photocurrent response up
to full solar light intensities observed. The best results obtained with 1, 3-dialkylimidazolium
iodide compounds (162).
The solid-state DSSC is an alternative that offers itself to deal with the sealing problem
through substituting the volatile redox electrolyte with a solid p-type semiconductor
interpenetrating the nanocrystalline TiO2 structure, which would permit the charge
neutralization of dye molecules after electron injection by its hole transport properties. The
main difficulty is improving the interface between the sensitized semiconductor and the
electrolyte; it is extremely difficult to achieve an intimate contact, without voids, among
particles because of the roughness of the former and the impossibility of high-temperature
depositions of the latter. The best successfully working organic charge transfer material is
spiro-MeOTAD. It was first presented by Grätzel et al. in 1998 (163) and presently achieves
conversion efficiency above 4% (164).

63
Solid-state electrolytes overcome the disadvantage of using liquid electrolytes
however; lower conductivity and poor interface contact for solid-state electrolytes cause lower
conversion efficiency for DSSCs. Quasi-solid-state electrolytes have similar liquid
electrolyte’s ionic conductivity and interface contact property, and solid-state electrolyte’s
long-term stability. It is believed that this is the most available kind of electrolytes for
fabricating high photoelectric performance and long-term stability of DSSCs in practical
applications.
4.5.5.1 Organic Solvent
The most of chemical compounds can be used if they have low volatility, low viscosity
they easily penetrate the porous semiconductor, resistance to decomposition, good redox couple
stability, low toxicity, and low cost.
Several organic solvents such as methoxypropionitrile, (165) butyronitrile (166)
and/or methoxyacetonitrile (167) tested among others; however, acetonitrile is the most used
solvent, particularly when one wishes to maximize cell efficiency.
4.5.5.2 Redox Couple
To date, the best DSSC performance was obtained using the tri-iodide /iodide (I3-/I-) redox
couple in an organic matrix, commonly acetonitrile. The good result of this redox mediator is based
on the following kinetics:
1. The photo-oxidized dye injects an electron into the conduction band of the semiconductor
much faster than electron recombination with I3-.
2. The oxidized dye preferably reacts with I- then recombines with the injected electron.
3. The two electrons process of I- 1 regeneration from I3- occurs quickly enough at the catalyst-
coated counter electrode to be productive.

64
4. The overall result of the above processes leads to coherent diffusion of I3- towards the
counter electrode and I- diffusion in the opposite direction.
2e- + I3- ⥬ 3I-
Illustration: 4.1 Tri-iodide/iodide redox couple
4.6 Characteristic Parameters of DSSCs
4.6.1 Open Circuit Voltage
The dye sensitized solar cell can be regarded as a battery in a simple electric circuit.
In the dark, the cell does nothing. At that point system is at equilibrium, the Fermi
energy of the TiO2 electrode (corresponding to the free energy of electrons in this film
after thermalization) equilibrates with the midpoint potential of the redox couple, resulting in
zero output voltage. Under these conditions, the TiO2 Fermi level lies deep within the band
gap of the semiconductor, and the film is effectively insulating, with a negligible electron
density in the TiO2 conduction band. As well at the counter electrode, there will be high
concentrations of oxidized and reduced redox couple present in the electrolyte and no
significant change in chemical potential of the electrolyte, which remains effectively fixed at
its resting value. When light hits the working electrode, photo-excitation of the dye injects
electron into the TiO2 film which leads to a dramatic increase in electron density, raising
the TiO2 Fermi level towards the conduction band edge, and allowing the film to become
conducting. This happen in parallel with hole injection into the redox electrolyte (168) which
causes the circuit to switch on and develop a voltage, or electromotive force called the open
circuit voltage (Voc) (169).

T
differen
the redo
4.6.2 Sho
T
solar ce
circuit c
T
cell. Co
drawn f
4.6.3 The
T
to the pr
The magnitu
nce between
ox couple in
ort Circuit C
The short-circ
ell is zero (i.
current show
The short-cir
onsequently,
from the sola
e Fill Factor
The fill facto
roduct of the
ude of open
the Fermi le
the electrol
Current
cuit current
e., when the
wn on the IV
Figure .4.5
cuit current
the short-ci
ar cell.
r
or for DSSC
e open circu
n-circuit pho
evel of the s
lyte (170).
is the curren
e solar cell i
curve.
I-V chara
and the ligh
ircuit curren
C is defined a
uit voltage an
65
oto-voltage d
solid under i
nt through th
s short circu
acteristics of
ht-generated
nt is conside
as the ratio o
nd short circ
developed is
illumination
he solar cell
uited). Usual
f a typical so
d current are
ered the gre
of the actual
cuit current p
s determined
n and the Ne
when the vo
lly written a
olar cell
e identical fo
atest current
maximum a
produced. Th
d by the ene
rnst potentia
oltage across
as ISC the sh
or an ideal s
t which may
attainable po
he fill factor
ergy
al of
s the
hort-
solar
y be
ower
r is a

significa
equivale
current
rest 40%
Figure: 4
4.6.4 Sol
T
(Voc) the
conversio
photocur
mWcm-2)
circuit, b
ant issue in
ent series res
produced by
% is significa
4.6 I–V curv
lar Cell Con
The photocur
e fill factor (
on efficiency
rrent density
). The relati
being JSC go
n calculating
sistance and
y the cell dis
ant for Loss.
ves of an org
nversion Eff
rrent density
(ff), and the
y (η) of the d
y-voltage ch
ion between
ot when resi
g the perfo
a high equiv
ssipated in in
.
ganic PV cell
ficiency
y calculated
power of th
dye-sensitize
aracteristics
n J and V is
stance of the
66
ormance sol
valent shunt
nternal losse
l under dark
at short circ
he incident li
ed solar cell
(IV curves
determined
e outer circu
ar cells per
t resistance h
es is less. If
(left) and ill
cuit (JSC) th
ight (Pin) ar
l. These valu
s) under AM
by changin
uit is zero (th
rformance.
have a high f
a DSSC wit
luminated (r
he open-circ
re used to de
ues can be ta
M 1.5 full su
ng the resista
hus voltage
Cells with
fill factor, so
th 60% FF t
right) condit
cuit photovo
etermine the
aken out from
unlight (Pin
ance of the
is zero) and
low
o the
then,
tions.
oltage
e total
m the
n=100
outer
d Voc

when res
the produ
an ideal c
to the m
projected
W
4.7 Oper
D
coated w
electrolyt
electrode
load conn
F
absorptio
injection
dye mole
dye mole
direct con
sistance is m
uct of J and
cell. Pmax i
maximum va
d using the fo
Where
rating Princ
Dye-sensitize
with porous n
tes containin
es. At the ill
nected to the
igure (4.7) i
on in the D
from the dy
ecules can ab
ecules on to
ntact with th
maximum (th
V, and the f
s usually rep
alue that can
ollowing equ
ciple of the D
ed solar cel
nano-crystal
ng a reducti
umination, t
e electrodes.
is a schemat
DSSC happe
ye to the TiO
bsorb only le
op of each o
he semicond
hus photocur
fill factor sta
ported as the
n reach the
uations: (101
Dye-Sensitiz
ls (DSSCs)
lline TiO2,
ion-oxidation
the cell prod
ic illustratio
ens by dye
O2 at the se
ess than one
other increas
ductor electro
67
rrent is zero)
ates the effic
e output pow
output pow
1)
zed Solar C
consist of
dye molecu
n couple suc
duces a volta
on of the ope
molecules
emiconducto
e percent of t
ses the thick
ode surface
). The outpu
ciency of th
wer of the co
wer. The pe
Cell
transparent
ules attached
ch as I-/I3-,
age over and
erating princ
and the ch
or electrolyte
the incomin
kness of the
can only sep
ut power of t
he device com
ommercial d
erformance o
t conducting
d to the surf
and catalyst
d current thr
ciples of the
harge separa
e interface. A
ng light (100
layer, the d
parate charg
the device e
mpared to th
device and re
of DSSC ca
g glass elec
face of the T
t coated cou
rough an ext
DSSC. The
ation by ele
A single lay
). While stac
dye molecul
ges and contr
equals
hat of
elates
an be
ctrode
TiO2,
unter-
ternal
light
ectron
yer of
cking
les in
ribute

to the cu
porous n
area and
Figure.4.
H
particle s
Another
in crysta
Experime
cells. Som
used nan
E
illustrat
urrent gener
nano-crystall
let a large en
.7. Principle solar ce
Having this c
size of 20nm
important el
alline inorgan
ents show th
me of the m
ocrystalline
Electron tran
ed in figure
ration. Grätz
ine TiO2 el
nough amou
of operationll. (105)
construction,
m, has an inte
lement of us
nic semicon
hat low mot
most effective
inorganic m
nsfer proces
e (4.8). Whe
zel’s group
ectrode stru
unt of dye co
n and energy
, a TiO2 elec
ernal surface
ing this poro
nductors is h
tility limits
e methods of
materials as th
ses in a DSC
en the dye
68
developed t
cture. It is t
ontact with th
y level sche
ctrode that i
e area greate
ous electrode
higher than
the efficienc
f improving
he electron a
C during ligh
absorbs a p
the solution
to increase t
he TiO2 elec
eme of the d
is typically 1
er than the el
e structure is
in organic p
cy of charg
charge tran
acceptors.
ht-electric p
photon an e
of this pro
the electrode
ctrode and th
dye-sensitize
10 µm thick
lectrode geo
s the fact tha
photovoltaic
e collection
nsport in org
power conver
lectron is e
oblem by us
e internal su
he electrolyt
d nanocrysta
, with an av
metrical are
at charge mo
c materials (
of organic
anic photovo
rsion energy
xcited from
ing a
urface
te.
alline
erage
ea (1).
otility
(171).
solar
oltaic
y are
m the

69
HOMO level to the LUMO level of the molecule (1). This is followed by electron injection to
the semiconductor (TiO2) conduction band (2) and the oxidized dye regenerated by the
electron captured from the redox electrolyte (5). The injected electron travels by diffusion in
the TiO2 film until it finds its way to the substrate contact where it is released to the external
electrical circuit (3). The electron is restored to the cell at the counter electrode through an
electrolyte reduction reaction and the electrical circuit of the cell finished by ionic transport of
the redox pair in the electrolyte. The main back reactions limiting the photocurrent is indicated
with red arrows; (4) radiation less relaxation of the excited state of the dye, (6) recombination
of the electrons with the oxidized dye, (7) and with the tri-iodide in the electrolyte.
Figure 4.8 Electron transfer processes in a DSC during light-electric power conversion energy

The oper
Anode:
Cathode: Cell:
F
indicate e
(60 ns), e
recombin
recombin
ms), and
rating cycle c
S
2
igure 4.9 sh
excitation of
electron inje
nation of th
nation of the
the regenera
F
can be summ
S hv S
S* S e
2S3I
I 2e(P
(Pt ) hv
hows a sche
f the dye fro
ction from t
he injected
e electron in
ation of the o
Figure4.9 Sc
marized in ch
S* Absorption
TiO2 Elect
2S I3 Re
t)3I 3
eTiO2
ematic illustr
om the HOM
the dye LUM
electron w
the TiO2 co
oxidized dye
chematic illu
70
hemical reac
n
tron injectio
egeneration
ration of kin
MO to the LU
MO level to t
with the hol
onduction ba
e by I- (10 ns
ustration of k
ction termino
on
netics in the
UMO level,
the TiO2 con
le in the d
and with a ho
s). (172)
kinetics in th
ology as:
e DSSC. Th
relaxation o
nduction ban
dye HOMO
ole (I3-) in th
he DSSC
he shown ar
of the exited
nd (50 fs -1.7
level (ns
he electrolyt
rrows
d state
7 ps),
-ms),
te (10

71
4.8 Applications of DSSC
Dye sensitized solar cells are inexpensive, environment friendly materials. Different
applications of DSSCs like power window and shingles are prospective in building integrated
photovoltaics BIPV. The Australian company Sustainable Technologies International produced
electric power producing glass tiles on a large scale for field testing, and the first building
equipped with a wall of this type. The availability of lightweight flexible dye sensitized cells or
modules are attractive for applications like light powered calculators, devices, and mobiles. Dye
sensitized solar cells can be designed as indoor colorful decorative elements. Flexible dye
sensitized solar modules releases opportunities for incorporating them with many portable
devices, baggage, gears, or outfits. In power generation, dye sensitized modules with efficiency
of 10% become the best technology to change the common crystalline Si-based modules. In
2010, Sony pronounced manufacturing of modules with 10% efficiency and later the opportunity
for commercialization of DSSC modules is possible (118).
G24 innovation created the first commercial shipment of low-light, ultra-thin, solar cell
technology called DSSC, sent to Hong Kong-based consumer electronics bag manufacturer,
Mascotte Industrial Associates for use in backpacks and bags. DSSCs are less than 1mm thick,
inexpensive, do not contain silicon or cadmium and can even operate indoors, making them ideal
for powering cell telephones, ideal for clothing and portable applications, cameras and portable
electronics. DSSCs can also be fixed into tent material to power LED lighting systems for
camping. Solar cells can also be layered onto laptops, mobile telephones, GPS units and AV
devices for additional power supply. (173)

72
Chapter 5: Materials and Methods
5.1 Introduction
Most of materials and chemicals used in this research were available in the lab.
Chemicals like solvents were purchased from VWR. Some materials used in the fabrication of
devices like FTO glass and TiO2 paste were purchased from Solaronix Co. Instruments like
FTIR, H1NMR, UV_VIS Absorption, and Solar Simulator are available in the UTEP labs.
5.1.1 Precursor Material Characterization
Before starting synthesizing and preparing the synthetic asphaltene, we started working
with the precursor material Tetra Octyl Carboxylate Perylene TOCP. First we started testing and
characterizing the precursor. Different techniques were used to analyze and characterize the
starting material. These tests were carried out to make sure that this material is similar as in
literature. First, IR spectra were tested by using FTIR spectroscopy (Spectrum 100 FT-IR
Spectrometer from PerkinElmer), and the results were Similar to those found in the literature.
The H1 NMR test also carried and the peaks were analyzed. The figures below show the results
of this work, and likewise, they show that the precursor material has similar characterizations as
in the literature.

73
Figure5.1a. Analysis of H1 NMR peaks of TOCP.

74
Figure5.1b. Analysis of H1 NMR peaks of TOCP.

75
Figure5.2: IR Spectra of the Precursor TOCP.
5.1.2 Synthesis of Synthetic Asphaltene
Synthetic Asphaltene is prepared according to the procedure in published literature (64).
The precursor material is a powder and yellow in color as shown in the picture below.
The heating process should be run in the absence of air under flow of Nitrogen gas. The
procedure can be summarized as following: 1g of starting material TOCP was poured in a
conical flask. The flask was put on the heating mantle and it has connected with Shlenk line for
Nitrogen flow. The temperature during the reaction process is monitored by inserting a
thermometer inside the conical flask. To make sure that there is no Oxygen inside the flask; the
vacuum valve was opened several times during the process. After the temperature rises to about

76
1000C, the starting material (TOCP) started melting and color changed from yellow to dark
reddish color. Continuing the heating operation and monitoring the temperature, also controlling
the flow of Nitrogen are more important. The heating process t continues until the temperature
reaches more than 3200C and not after 4200C to prevent coke formation, then the heating mantle
was switched off, Nitrogen gas flow stopped, and the flask kept to cool down to room
temperature. Then, the final product as in the picture was collected by using clean metal spatula,
weigh, and kept in clean vial for use.
(a) TOCP Precursor (b) Synthetic Asphaltene
Illustration (5.1): Showing a) the precursor material, b) synthetic asphaltene after synthesized.
5.1.2.1 Testing UV-Vis Absorption of Synthetic Asphaltene
In this experiment the model Varian Cary 5000 UV-VIS-NIR absorption spectrometer
was used. The result was shown in the graph below, and it is clear that Synthetic Asphaltene has
the ability to absorb light in the range between 350 nm – 550 nm.
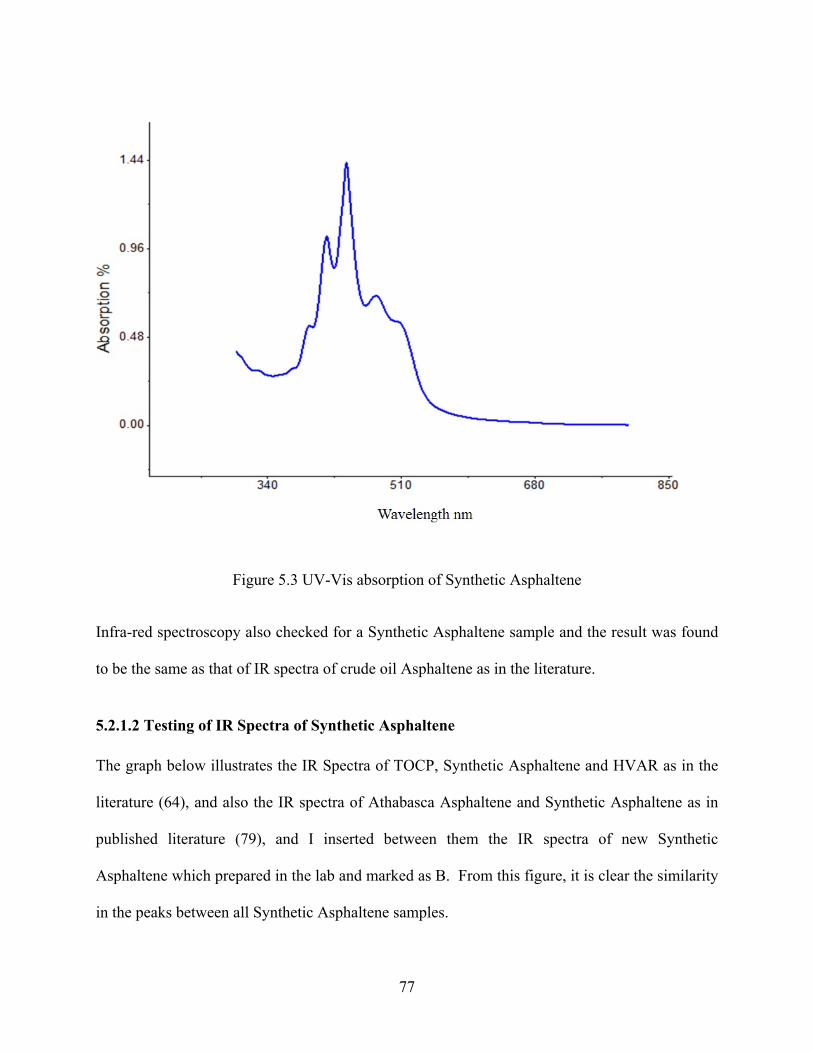
77
Figure 5.3 UV-Vis absorption of Synthetic Asphaltene
Infra-red spectroscopy also checked for a Synthetic Asphaltene sample and the result was found
to be the same as that of IR spectra of crude oil Asphaltene as in the literature.
5.2.1.2 Testing of IR Spectra of Synthetic Asphaltene
The graph below illustrates the IR Spectra of TOCP, Synthetic Asphaltene and HVAR as in the
literature (64), and also the IR spectra of Athabasca Asphaltene and Synthetic Asphaltene as in
published literature (79), and I inserted between them the IR spectra of new Synthetic
Asphaltene which prepared in the lab and marked as B. From this figure, it is clear the similarity
in the peaks between all Synthetic Asphaltene samples.

78
Figure 5.4 IR Spectra of different Synthetic Asphaltene samples.
5.2.1.3 Purifying Procedure of Synthetic Asphaltene
Synthetic Asphaltene after prepared still holds some impurities because not completely
burning of starting material. These impurities can prevent absorbance of Synthetic Asphaltene
dye to the surface of TiO2. To remove these impurities, Synthetic Asphaltene sample was
purified by dissolving it in toluene for 24 hours. The solvent is then filtered by using filter paper
#40 (4.0 µm) and by using a vacuum pump and the impurities collected in the filter paper while
the clean solvent pass. The collected solvent is kept under the hood to evaporate Toluene. The
final product is collected and kept in a clean vial for use as purified Synthetic Asphaltene.

79
Illustration (5.2) Filter paper after Synthetic Asphaltene filtered.
5.2 Building the DSSC
5.2.1 Preparation of TiO2 paste (P-25)
The TiO2 paste was used in this study and prepared in the lab according to the
procedures published in literature (174). This will be referred to as P-25 paste. The
procedure can be summarized and as shown in the schematic diagram below:
6 grams of commercial TiO2 powder (P25) were purchased from Sigma Aldrich
Company mixed with 1ml of acetic acid and grinded in a mortar for 5 minutes. A total of 5ml
D.I water and 15ml of ethanol were added ml by ml with continuous grinding. The amount of
ethanol was then increased to 2.5ml for 6 times and grinding for 1 minute for each
addition. The total compound was then transferred to a beaker with the addition of 100ml
o f ethanol, and stirred with magnetic stirrer and sonication with an ultrasonic horn for 2
seconds work plus 2 second rest for 30 times. The next step is to add 20g of Terpineol with
repeating the sonication procedure. Finally, 3g of ethyl cellulose were added and the same
sonication procedure repeated. The ethanol is evaporated by using a rotary evaporator.

80
Illustration 5.3 Preparation procedure of P-25 paste

81
5.2.1.1 Characterization of P-25 Paste
Scan Electron Microscope SEM was used to determine the characterization of TiO2
paste. The illustration below shows the nanocrystalline formation of the paste and the
thickness of the TiO2 layer on FTO glass. The graph also shows the elemental analysis of the
paste.
Illustration 5.4: The Thickness of TiO2 paste.
Figure5.5 Scanning electron microscope (SEM) of a TiO2 Paste

82
Figure5.6 Elemental analysis of TiO2 paste
5.2.2 Preparation of the Photo-Electrode
5.2.2.1 Nanocrystalline TiO2 Layer
The nanocrystalline TiO2 layer in this research was prepared by applying a layer of
one or more of the above mentioned TiO2 paste (P-25) by spreading (doctor blading) on the
surface of FTO glass. A piece of glass (F-doped SnO2, FTO, (Solaronix TCO30-8 SA
Switzerland 13 Ω/cm2/&,3.3 mm thickness and 500- 1000 nm transmittance) that had been cut
to 2cm x 2cm and cleaned in a detergent solution using an ultrasonic bath for 30 minutes and
then rinsed with water and ethanol. The FTO-coated glass was covered with one layer of
parallel adhesive Scotch tape placed 1 cm apart to control the area and the thickness of the
TiO2 film (0.5 x 0.5cm) as illustrated on picture.

83
Illustration 5.5: the steps of fabrication new cell starting from A: cleaning FTO and preparing for applying paste, B, C, and D applying paste on the surface of FTO by doctor blade method, E is showing gradually heating of the paste, and F showing the cell after heated, finally G is showing the cell after was dipped in synthetic asphaltene dye for 24 hours and also area was controlled by 0.25cm2.
As shown in the picture above, the paste was applied between the tapes on the FTO-
coated glass by rolling a glass rod on the surface (also known as the doctor blade method). The
film thickness is controlled by the paste density and the adhesive tape thickness as well. Film
thickness was in one layer paste, typically 2 ± 3 µm. The TiO2 Nano crystalline electrode was
dried in the air for 2 minutes, and then gradually heated at 3250C for 5 min, at 3750C for 5 min,
at 4500C for 15 min, and at 5000C for 15 min.
The heating process enables the added organic polymer in the colloidal paste to be
burnt off leaving the TiO2 film with a higher surface area and more porous. It also increases
the resistivity of the film. In addition, the surface is dehydroxylated during this process,
leaving reactive Ti3+ centers available for reaction with the anchoring groups of the
84
sensitizers (dye). The temperature of electrode was cooled down up to 80°C to prevent
moisture, or it can be cooled down to room temperature, and then kept it in a closed space to
protect from pollutants. When the dye is ready, the electrode was cleaned again by using the
UV-O3 cleaning device. After treatment in a UV-O3 system (Model No. 342, Jelight Company,
Inc.) for 18 minutes, then dipped in the dye solution for 20-24 hours.
5.2.3 Preparation of the Counter Electrode
The counter electrodes were prepared by placing a drop of an H2PtCl6 solution (2mg Pt in
1mL ethanol) on clean FTO glass and heating it at 4500C for 15 min, and then keep it cool down
to room temperature. The FTO glass will look almost transparent.
5.3 The Electrolyte
A type of commercial electrolyte obtained from Solaronix Company has been used in this
research. This is Standard Iodolyte MPN-100. It consists of 100mM of tri-iodide in
methoxypropionitrile solution.
5.4 Assembling of the Synthetic Asphaltene DSSC
After the size measurement, the TiO2 film was treated with 40mm TiCl4 solution, TiO2
film was immersed into a 40mm aqueous TiCl4 aqueous solution at 700C for 30 min and rinsed
with water and ethanol and sintered at 5000C for 30 min. At 800C in the cooling, the TiO2
electrode was immersed in 0.5 mg/ml of synthetic asphaltene dye and kept at room temperature
for 20–24 hrs. to complete the sensitizer uptake.
The synthetic asphaltene dye covered TiO2 electrode and Pt-counter electrode were
assembled into a sandwich type and assembled with using a binder clamps. The clamps used to
attach the two electrodes and to provide space for the electrolyte between two electrodes.

Sealant
leakage
the hot
heated u
injected
the hole
Il
also can be
of electroly
press mach
up to join b
d into the ho
e was cover
lustration: 5
e used to ass
yte. For good
hine. Tempe
both electrod
le in the bac
ed by tape.
.6 Schematic
semble the s
d results, se
erature and p
des by using
ck of the cou
The electro
c diagram sh
85
sandwich of
alant was pu
pressure we
g the sealant
unter electro
olyte was int
howing comp
f electrodes.
ut between t
ere adjusted
t. A drop of
ode and to pr
troduced int
mpleted synth
It is can be
two electrod
and then th
f the electrol
revent leaka
to the cell b
hetic asphalte
e used to pr
des and put u
he hot press
lyte solution
age of electro
by using vac
ene DSSC
event
under
s was
n was
olyte,
cuum.

86
Chapter 6: Results and Discussion
6.1 Introduction
This chapter will introduce and discuss the results of this research. Some of results
already mentioned in the previous chapter, such as IR spectra of Precursor material and UV-Vis
absorption of Synthetic Asphaltene. In this Chapter I will focus on the showing the results of
using Synthetic Asphaltene as dye in the fabrication of DSSC.
6.2 The First Use of Synthetic Asphaltene as A dye in DSSC
Synthetic Asphaltene, after synthesized in the lab, it was used without any additives or
modifications. The sample of Synthetic Asphaltene was dissolved in Toluene as a solvent and the cell was
immersed in the solution for 24 hours. The sample was then removed from solution, cleaned and washed
with ethanol to remove any extra dye or pollutants, and then the cell was assembled and tested as
described in the previous chapter.
The following table illustrate the result of the first cell which prepared by Synthetic Asphaltene as
dye.
Table 6.1The first result of Synthetic Asphaltene dye in dye sensitized solar cell
Voc (V) Jsc (mA/cm2) FF % η (%)
Synth. Asph. 0.438 1.63 54 0.42
We can conclude from this table that the efficiency of the cell by using Synthetic
Asphaltene without any additives is about 0.4%. So, it is possible to increase the efficiency by
applying some changes and some additives.
The new sample of synthetic asphaltene was prepared by adjusting the Nitrogen flow and
also by controlling the temperature during preparation process. The new sample of synthetic

87
asphaltene was tested in the fabrication of new devices. The results in the table below showing
improvement in the performance efficiency reached up to 1.00%. So we conclude from this
experiment that the flow of Nitrogen and the temperature should be monitored carefully during
preparation of synthetic asphaltene.
Table 6.2: New results of new Synthetic Asphaltene dye
6.3 Effects of Different Layers of the Paste
One of the parameters which can affect the cell efficiency is the thickness of the paste. To
check this parameter, different layers of the paste were applied during the fabrication of the cells.
One, two, and three layers were tested during the experiment. Controlling of the number of
layers is done by the number of tape layers applied on the surface of FTO glass. For example,
one scotch tape layer means one layer of the paste. See section 5.2.2.1
The following table shows the result of this experiment, and from this table, it is clear
using one layer paste is more effective that two or three layers; it can be because the absorption
of Synthetic Asphaltene dye on the surface of TiO2 paste is higher than when using two or three
layers. It is also could be that using one layer of paste results in low aggregation.
Voc (V) Jsc ( mA/cm2) FF % η (%)
New Synthetic Asph. Sample 0.409 3.61 57 1.00

88
Table6.3 The effect of different layers of paste on the performance of Synthetic Asphaltene cell
Voc (V) Jsc ( mA/cm
2) FF % η (%)
one layer paste 0.424 4.49 65 1.35
two layers paste 0.440 3.35 57 0.93
three layers paste 0.436 2.86 56 0.83
6.4 UV-Ozone Treatment of the Photo-electrode
The main components of the TiO2 pastes utilized in this study, as well as in most DSSC
research labs, more than TiO2 particles are organic compounds used to disperse and link the
semiconductor particles to form a network film. Even though, temperature sintering processes
decompose the formation of porous TiO2 films and give high surface area. However, some
carbon atoms will deposit on the top of TiO2 particles and decrease the absorption of the dye and
the electron injection. UV–O3 treatment is the well-known technique used to remove organics on
transparent conducting oxides and it has been widely used in organic electronic devices to clean
the surface and modify the work function of ITO. Recently, UV–O3 treatment was applied to
synthesize porous nano-particulate TiO2 films at room temperature and the noticeable
improvement of photo-conversion efficiency was obtained by using this treatment. The main
effect of the UV–O3 treatment was reported to be the removal of residual organics and positive
shift in the conduction band of the nano-crystalline titanium dioxide, which promotes electron
injection from the dye. (175)
To see the effectiveness of the UV–O3 treatment on the performance of synthetic
asphaltene solar cells, two synthetic asphaltene cells were prepared as described in the previous

89
chapter and one cell was treated with UV-03 for 15 minutes and another without UV-O3
treatment. Both cells were dipped in the Synthetic Asphaltene dye for 24 hours. The cells were
tested and the result of this experiment was shown in the following table:
Table 6.4The effect of UV-O treatment on the Synthetic Asphaltene cell performance
6.5 Effects of Some Additives on the Synthetic Asphaltene Cell Performance Efficiency
6.5.1 Adding Porphyrin to Synthetic Asphaltene Dye to Increase The Efficiency of The Cell
During work with this research, Porphyrin was added to the Synthetic Asphaltene to
improve the efficiency of the cell. Porphyrin is already used as organic dye in DSSC. The new
compound is prepared in the lab by dissolving the same ratio of Synthetic Asphaltene with free
metal Porphyrin in Toluene for 24 hrs under heating; the mixture was kept under the hood to
evaporate the Toluene. The final product was collected and used in this experiment.
The table below shows the effects of mixing Porphyrin with Synthetic Asphaltene on the
conversion efficiency of synthetic Asphaltene dye:
. From the table it is clear that the new dye is increasing both current density JSc and Voc
(V), and then increasing the performance efficiency.
Voc (V) Jsc ( mA/cm2) FF % η (%)
No UV-O treatment 0.409 3.61 57 1.00
UV-O treatment 0.426 3.84 57 1.14

90
Table 6.5The results of mixing Synthetic Asphaltene with Porphyrin Voc (V) Jsc ( mA/cm
2) FF % η (%)
Synthetic Asphaltene mixed with Porphyrin and dissolved in
Toluene 0.429 6.57 54 1.85
6.5.2 Synthetic Asphaltene and Crude Oil Asphaltene
Asphaltenes material is described in chapter two. This material was used as new organic
dye in dye sensitized solar. Asphaltene has shown to be able to produce voltage, and according to
the results, asphaltene has become a good candidate in photovoltaics, due to its availability and it
is a low cost material. (176)
For this experiment, the new material was prepared by dissolving synthetic asphaltene
and crude oil asphaltene. The new material was prepared by adding Synthetic Asphaltene to
crude oil asphaltene. This Asphaltene was extracted from crude oil asphaltene and purified by
using Toluene. Real Asphaltene was dissolved with Synthetic Asphaltene in Toluene in the
ration of 1:1 and kept for 24 hours for dissolving under heating. The solvent kept under the hood
until the Toluene completely evaporated, and the solid product was collected and used for the
experiment.
Table6.6The photovoltaic performance efficiency of Synthetic Asphaltene dye mixed with crude oil Asphaltene.
Voc (V) Jsc ( mA/cm2) FF % η (%)
Real Asph. mixed with Synth Asphaltene
0.435 7.28 46 1.40
6.6 Purified Synthetic Asphaltene

91
During work with Synthetic Asphaltene as new dye in the fabrication of DSSC, some
precipitates were noticed when Synthetic Asphaltene dissolved in Toluene. These precipitates
can prevent the good absorbance of Synthetic Asphaltene dye into the surface of TiO2. So,
Synthetic Asphaltene was purified to remove any impurities. See section 5.2.1.3.
The new purified Synthetic Asphaltene sample was tested in the fabrication of DSSC and
the results is illustrated in the table (6.7).
The table below showing the results that compare between two samples of Synthetic
Asphaltene used as dye during the fabrication of cells. One of these samples represents the
Synthetic Asphaltene before purifying and another sample represents the Synthetic Asphaltene
after purifying. All factors were improved by using purified synthetic asphaltene. There is a high
increase in the current density and also fill factor, but the small increase in the voltage. The
efficiency was improved from 1.0% to 1.83%.
Table 6.7The comparing results between the cell performance efficiency of purified and unpurified Synthetic Asphaltene.
Voc (V) Jsc ( mA/cm2) FF % η (%)
Unpurified Synthetic Asphaltene 0.445 4.19 56 1.0
Purified Synthetic Asphaltene 0.455 7.05 61 1.83

92
6.7 Effect of Chenodeoxycholic Acid (CDCA) on the Photovoltaic Performance of Purified Synthetic Asphaltene Dye Sensitized Solar Cell.
The effects of chenodeoxycholic acid (CDCA) in a dye solution as a co-adsorbent on the
photovoltaic performance of dye-sensitized solar cells (DSSCs) based organic dye containing
purified synthetic asphaltene dye was studied. It was found that the coadsorption of CDCA can
eliminate and reduce the formation of dye aggregates and improve electron injection yield and
thus, Jsc. This has also led to a rise in photovoltage, which is attributed to the decrease of charge
recombination. The DSSC, based on synthetic asphaltene dye with CDCA, overall conversion
efficiency was further improved to 2.0% (Jsc = 7.00 mA/cm2, Voc = 0.506 V, FF = 0.61) upon
addition of 1:1 ratio of CDCA to the dye solution.
Table 6.8The performance efficiency of Synthetic Asphaltene dye with additives of Chenodeoxycholic Acid CDCA
Voc (V) Jsc ( mA/cm2) FF % η (%)
Purified Synthetic Asphaltene with Chenodeoxycholic Acid CDCA 0.506 7.00 0.61 2.08

93
Chapter 7: Conclusion and Future Work
7.1 Conclusion
In general, we can conclude from this study that Synthetic Asphaltene was successfully
prepared in the lab and the characterization results were similar as in the literatures. Even
primary results show that Synthetic Asphaltene has good ability to absorb sunlight, but the
results of the first use of Synthetic Asphaltene in DSSC were not satisfied. More work was
carried during the study to increase the performance efficiency from 0.4% to 2.0%. We conclude
also Synthetic Asphaltene can give good results by adding some additives, but it also can
improve the conversion efficiency just by purifying process which increase efficiency from 1.0%
up to 1.83%. Instead of additives, there is another parameters can increase the efficiency of
Synthetic Asphaltene as dye in DSSC for example, the number of layers of the paste and using
UV-O treatment. Therefore, a total overall efficiency of 3.5 % – 5.0 % could be easily attained
with good engineering design and material process.

94
7.2 Future Work
The results of this work approve that Synthetic Asphaltene is recommended as active dye
in the field of dye sensitized solar cell. Using new dye with high performance and cheap relating
to other dyes is become an important invention. This is the first step in this research and more
effort still required to improve the efficiency of this new material. Looking for new parameters in
addition to these parameters which applied in this study is also become in the high priority.
DSSC has different parameters not only the dye and work with these parameters can improve the
efficiency. Using solid electrolyte instead of liquid is highly recommended.
Higher-power conversion efficiencies can be achieved by further optimizing the device
structure. In a multi-component device like DSSCs, the overall performance of the cell depends
on the individual properties of the constituent components and processes. Optimal performance
can be achieved only when understanding the factors that control each of the components and
depends on the ability to tune to the required configuration.

95
References
1. The Energy Information Administration (EIA). International Energy Outlook 2011, s.l.:
U.S Department of Energy, 2011. 2. Energy Information Administration. Emission of Greenhouse Gases in the United States,
(1985- 1990. Washigton Dc. EIA, 1993. DOE/EIA-0573 3. Lewis N. S. Basic Research Needs for Solar Energy Utilization Report on the Basic Energy
Sciences Workshop on Solar Energy Utilization, 2005 4. Pachauri, R.K. and Reisinger, A. (Eds.). Synthesis Report Summary for Policymakers.
Geneva, Switzerland. pp 104: Intergovernmental Panel on Climate Change, 2007 5. AIA Research Corporation; Solar Dwelling Design Concepts; Washington, D.C 6. E. W. Brown, Solar Energy introduction, 1988 7. Acra, A, Raffoul, Z, Karahagopian, Y, Solar Disinfection of Drinking Water and Oral
Rehydratoin Solutions, Guidelines for Household Application in Developing Countries 1984
8. Nine planets A Multimedia Tour of the Solar System: one star, eight planets, and more nineplanets.org.
9. Department of Energy DOE, Energy efficiency and renewable energy, 2003 10. Lawrence Livermore National Laboratory for the Department of Energy, Alternative
Paths to Fusion, the energy source of the sun and stars 1996 11. NASA. "Sun", World Book. 2009. 12. Materials, American Society for Testing and. ASTM G 173-03. Standard Tables for
Reference Solar Spectral Irradiances: Direct Normal and Hemispherical for a 37° Tilted Surface. West Conshohocken, PA : American Society for Testing and Materials, 2003
13. Fu Q Solar Radiation, University of Washington, Seattle, WA, USA 2003. 14. Pitjeva, E.V. and Standish, E.M.,. "Proposals for the masses of the three largest asteroids,
the Moon-Earth mass ratio and the astronomical unit. Celestial Mechanics and Dynamical Astronomy. 2009, Vols. 103, pp. 365-372.
15. J. Wright, R. Perez and Michalsky, J. Luminous Efficacy of Direct Irradiance: Variations with Insolation and Moisture Conditions, Solar Energy. 1989, Vol. 42, 387-394.
16. Markvart, T, Photovoltaic Solar Energy Conversion, University of Southampton UK 2002 17. Würfel, Peter. The Physics of Solar Cells, s.l.: Weinheim:Wiley-VCH. , 2005. ISBN
3527408576 18. Deutsche Gesellshaft Für Sonnenenergie, Planning and Installing Photovoltaic Systems: A
Guide for Installers, Architects and Engineers, 2008 19. NASA. NASA Surface meteorology and solar Energy, s.l.: eosweb.larc.nasa.gov/sse/,,
release 6.0. 20. Andreas Viklund, The George Washington University, 2009 21. Polycrystalline Thin Film Solar Cell Technologies. Colorado U.S.A: National Renewable
Energy Laboratory, 2011.

96
22. Green, M.A., et al. "Very high efficiency silicon solar cells-science and technology. IEEE Transactions on Electron Devices, 1999, Vol. 46: 1940.
23. Cusano, D. A. CdTe Solar Cells and PV Heterojunctions in II-VI Compounds. Solid State Electronics, 6: 217. 1963, Vol. 6: 217.
24. N. Naghavi, S. Spiering, M. Powalla, B. Cavana, D. Lincot. High-efficiency copper indium gallium diselenide (CIGS) solar cells, Progress in Photovoltaics: Research and Applications. November, 2003, Vol. 11, 7.
25. Troshin, P. A Lyubovskaya, R. N.and Razumov, V. F. Organic Solar Cells: Structure, Materials,Critical Characteristics, and Outlook. . Nanotechnologies in Russia, 2008, Vol. 3, 5- 6.
26. Shaheen, S. E. Ginley, D. S. Jabbour, G. E. Organic-based photovoltaics:Toward low-cost power generation . Materials Research Society, bulletin, 2005, Vol. 30 , 1
27. Kalowekamo, J. and Baker, Erin, Estimating the manufacturing cost of purely organic solar cells, Solar Energy, 209, Vol. 83.
28. Brabec. Christoph J. Organic photovoltaics: technology and market. Solar Energy Materials & Solar Cells, 2004, Vol. 83.
29. M. Gratzel. Dye-sensitized solar cells, Journal of Photochemistry Photobiology, C. 2003, Vol. 4.
30. Murray R. Gray, Grant Assenheimer, Lisa Boddez, and William C. McCaffrey. Melting and Fluid Behavior of Asphaltene Films at 200-500°C. Energy & Fuels. 2004, Vol. 18.
31. Akbarzadeh, K, Hammami, A, Kharrat, A, Zhang, D. Asphaltenes Problematic but Rich in Potential, Edmonton, Alberta, Canada, 2007
32. Andersen, S.I. Effect of Precipitation Temperature on the Composition of n-Heptane Asphaltenes.Fuel Science and Technology International. 1994, Vol. 12, 1. New York: Marcel Dekker, 1994.
33. Altgelt K. H. and Boduszynski, M. M. Composition and Analysis of Heavy Petroleum Fractions. .New York: Marcel Dekker, 1994.
34. Miller, J. T. Fisher, R. B. Thiyagarajan, P. Winans, R. E. Hunt, J. E. Subfractionation and Characterization of Mayan Asphaltene. Energy Fuels. 1998, Vol. 12.
35. McLean J. D., Kilpatrick, P. K. Comparison of Precipitation and Extrography in the Fractionation of Crude Oil Residual. Energy and Fuels. 1997, Vol. 11.
36. Brons G., Yu, J. M. Solvent Deasphalting Effects on Whole Cold Lake Bitumen. Energy & Fuels. 1995, Vol. 97, 4.
37. Ouchi, K. Correlation of aromaticity and molecular weight of oil asphaltene and preasphaltene. Fuel. 1985, Vol. 64.
38. Calemman, V. Iwanski, P. Nali, M. Scotti, R. Montanari, L. Structural Characterization of Asphaltenes of Different Origins . Energy & Fuels. 1995, Vol. 9, 2.

97
39. Bergmann, U. Mullins, C. and Cramer, S. P. X-ray Raman Spectroscopy of Carbon in Asphaltene: Light Element Characterization with Bulk Sensitivity. Analytical Chemistry. 2000, Vol. 72, 11.
40. Speight, J. G. The Chemistry and Technology of Petroleum. . New York: Marcel Dekker Inc, 1991.
41. Geoffrey S. Waldo, Oliver C. Mullins, James E. Penner-Hahn and S. P. Cramer Sulphur in petroleum Asphaltenes, FUEL, 1992, Vol 71,
42. Mitra-Kirtley, S.,Mullins, O.C., Ralston, C.Y., Sellis, D. and Pareis C.,. Determination of sulfur species in asphaltene, resin, and oil fractions of crude oils. Applied Spectroscopy. 1998, Vol. 52, 12.
43. Determination of sulfur species in asphaltene, resin, and oil fractions of crude oils. Applied Spectroscopy. 1998, Vol. 52, 12.
44. Yen, T.F., Structure of petroleum asphaltene and its significance. Energy Sources. 1974, Vol. 1, 4.
45. Waldo, G. S. Mullins, O. C and Penner-Hahn, J. E. Cramer, S. P. Determination of the Chemical Environment of Sulfur in Petroleum Asphaltenes by X-Ray Absorption-Spectroscopy. Fuel. 1992, Vol. 71.
46. Moschopedis, S.E., Fryer, J.F., Speight, J.G. Investigation of asphaltene molecular weights. Fuel. 1976, Vol. 55, pp. 227– 232
47. Schmitter, J.M., Ignatiadis, I., and Arpino, P.J. Distribution of diaromatic nitrogen bases in crude oils. Geochimica et Cosmochimica Acta. November 1983, Vol. 47, 11,, pp. 1975-1984.
48. Jacobson, J.M. Gray, M.R. The use of infrared spectroscopy and nitrogen titration data in structural group analysis of bitumen. Fuel. 1978, Vol. 66, pp. 749-752.
49. Mitra-Kirtley, S.,Mullins, O.C., Ralston, C.Y., Sellis, D. and Pareis C. Determination of sulfur species in asphaltene, resin, and oil fractions of crude oils. Applied Spectroscopy. 1998, Vol. 52, 12, p. 1522.
50. Clerc, R.J. and O’Neal, M.J. The Mass Spectrometric Analysis of Asphalt: A Preliminary Investigation. Analytical Chemistry. 1961, Vol. 33, 3, pp. 380–382.
51. Moschopedis, S.E. and Speight, J.G. Preprints Division of Petroleum Chemistry. American Chemical Society. 1979,, Vol. 24, 4, p. 1007.
52. Ruiz-Morales Y., and. Mullins, O. C. Electronic Absorption Edge of Crude Oils and Asphaltenes Analyzed by Molecular Orbital Calculations with Optical Spectroscopy. Energy & Fuels. 2007, Vol. 21, pp. 944-952.
53. Svintitskikh, R. Z. Magaril, R. A. Badryzlova, and N. P. Serebryakova Oxygen Groups In Asphaltenes From Itursk Crude. Teklmologiya Topliv i Masel, No. 5, pp. 32-34, May, 1980.
54. Spiecker, P. M. Gawrys, K. L. Kilpatrick, P. K. Aggregation and solubility behavior of asphaltenes and their sub-fractions,. Journal of Colloid and Interface Science. 2003, Vol. 267, 1, pp. 178-193.

98
55. McLean J. D., Kilpatrick, P. K.,. Comparison of Precipitation and Extrography in the Fractionation of Crude Oil Residua,. Energy and Fuels. 1997, Vol. 11, pp. 570-585.
56. Kaminski, T. J, Fogler, H. S, Wolf, N, Wattana, P, Mairal, A. Classification of asphaltenes via fractionation and the effect of heteroatom content on dissolution kinetics. Energy & Fuels,. 2000,, Vol. 14, 1, pp. 25-30.
57. Yang, X. L. Hamza, H. Czarnecki, J. Investigation of sub-fractions of Athabasca asphaltenes and their role in emulsion stability. Energy & Fuel. 2004, Vol. 18, 3, pp. 770- 777.
58. Ali, M. F, Perzanowski, H. Bukhari, A, Al-Haji, A. A. Nickel and Vanadyl Porphyrins in Saudi Arabian Crude Oils. Energy & Fuels. 1993, Vol. 7, 2, pp. 179-184.
59. Pena, M. E. Manjarrez, A. Campero, A. Distribution of Vanadyl porphyrins in a Mexican offshore heavy crude oil. Fuel Processing Technology. 1996, Vol. 46, 3, pp. 171-182.
60. Chouparova, E, Lanzirotti, A, Feng, H, Jones, K. W, Marinkovic, N, Whitson, C. Philp, P. Characterization of petroleum deposits formed in aproducing well by synchrotron radiation based microanalyses. Energy Fuels. 2004, Vol. 18, 4, pp. 1199-1212.
61. Speight, J. G. The Chemistry and Technology of Petroleum. New York : Marcel Dekker, Inc., 2006.
62. Calemman, V. Iwanski, P. Nali, M. Scotti, R. Montanari, L. Structural Characterization of Asphaltenes of Different Origins. Energy Fuels. 1995, Vol. 9, 2, pp. 225-230.
63. Groenzin, H. and Mullins, O. C. Molecular Size and Structure of Asphaltenes from various Sources. Energy Fuels. 2000, Vol. 14, pp. 677-684.
64. Chianelli, R. R., Siadati, M., Mehta, A. Pople, J. Ortega, L. C., and Chiang, L. Y. Self- Assembly of Asphaltene Aggregates:Synchrotron,Simulation and Chemical Modeling Techniques Applied to Problems in the Structure and Reactivity of Asphaltenes. [book auth.] O. C., Sheu, E. Y., Hammami, A. Mullins. [ed.] A. G., Eds Marshall. AsphalteneHeavy Oils and Petroleomics. New York : .; Springer, 2007, p. Chapter 15.
65. Yen, T. F. Erdman, J. G., and Pollack, S. S. Investigation of Structure of Petroleum Asphaltenes by X-Ray Diffraction. Analytical Chemistry. 1961, Vol. 33, 11, pp. 1587-1594.
66. Goncalves, S.; Castillo, J.; Fernandez, A. & Hung, J. (2004). Absorbance and Fluorescence Spectroscopy on the Aggregation of Asphaltene-Toluene Solutions. Fuel, Vol.83, No.13, pp. 1823-1828
67. Andersen, S. I. Birdi, K. S. Aggregation of Asphaltenes as Determined by Calorimetry. Journal of Colloid and Interface Science. 1991, Vol. 142, 2, pp. 497-502.

99
68. Pomerantz, A. E. Hammond, M.R. Morrow, A. L., Mullins, O. C. and Zare, R. N. Two-Step Laser Mass Spectrometry of Asphaltenes. Journal American Chemical Society. 2008, Vol. 130, 23, pp. 7216–7217.
69. Shea, R.C., Habicht, S. C., Vaughn, W. E., and Kenttämaa, H. I. Design and Characterization of a High-Power Laser-Induced Acoustic Desorption Probe Coupled with a Fourier Transform Ion Cyclotron Resonance Mass Spectrometer. Analytical Chemistry. 2007, Vol. 79, 7, pp. 2688–2694.
70. Ravey, J.C., Ducouret, G., Espinat, D.,. “Asphaltene macrostructure by small angle neutron scattering”. Fuel. 1988, Vol. 67, p. 1560.
71. Rajagopal, K. and Silva, S. M. C. An experimental study of asphaltene particle sizes in n-heptane- toluene mixtures by light scattering. Brazilian Journal of Chemical Engineering. 2004, Vol. 21, 4, pp. 601-609.
72. Acevedo, S., Escobar, G. Ranaudo, M. A. Pinate, J. Amorin, A. Diaz, M. and Silva, P. Observations about the structure and dispersion of petroleum asphaltenes aggregates obtained from dialysis fractionation and characterization. 1997, Vol. 11, 4, pp. 774-778.
73. Groenzin, H. & Mullins, O.C. (1999). Asphaltene Molecular Size and Structure. J. Phys.
Chem. A, Vol.103, No.50, 11237–11245 74. Freed, D.E., Lisitza, N.V.; Sen, P.N. & Song, Y-Q. (2007). Molecular Composition and
Dynamics of Oils from Diffusion Measurements, In Asphaltenes, Heavy Oils and Petroleomics, O.C. Mullins; E.Y. Sheu; A. Hammami & A.G. Marshall (Eds), 279-299, Springer, NY, USA
75. Andrews, A.B.; Guerra, R.E.; Mullins, O.C. & Sen, P.N. (2006). Diffusivity of Asphaltene Molecules by Fluorescence Correlation Spectroscopy. Journal of Physical Chemistry A, Vol.110, No.26, pp. 8093–8097
76. Zeng, H.; Song, Y.Q.; Johnson, D.L. & Mullins, O.C. (2009). Critical Nanoaggregate Concentration of Asphaltenes by Low Frequency Conductivity. Energy Fuels, Vol.23, pp. 1201-1208
77. Goual, L.; Sedghi, M.; Zeng, H., Mostowfi. F.; McFarlane, R. & Mullins, O.C. (2011). On the Formation and Properties of Asphaltene Nanoaggregates and Clusters by DCConductivity and Centrifugation. Fuel, Vol.90, No.7, pp. 2480–2490
78. E.B., Sirota. Physical Structure of Asphaltenes. Energy Fuel. 2005, Vol. 19, 4, pp. 1290-1296.
79. A.V.Kemp-Jones, T. Ignasiak, and O.P.Strausz, Natural And Synthetic Asphaltene, Hydrocarbon Research Center, Department of Chemistry, University of Alberta, Edmonton, Alberta, Canada. 1978
80. Stephen R. Forrest, the Limits to Organic Photovoltaic Cell Efficiency, MRS BULLETIN • VOLUME 30 • JANUARY 2005.

100
81. Gil Knier, How do Photovoltaics Work? Science@NASA story. 2002. 82. M. Knupfer, Exciton binding energies in organic semiconductors, Appl. Phys. A 77, 623–
626 (2003) DOI: 10.1007/s00339-003-2182-9. 83. The NEED Project, Exploring Photovoltaics, Manassas, VA 20108 1.800.875.5029, 2012
www.NEED.org 84. T. Markvart, Solar Electricity (2nd edition), Wiley, Chichester (2000). 85. Green, M. A. Progress Photovoltaic‟s, Research and Applications. 1994, Vol. 2, p. 87. 86. M.Wolf, historical development of solar cells 1976. 87. Holdren, J. P., G. Morris, and I. Mintzer. 1980. Environmental aspects of renewable
energy. Annual Review of Energy 5: 241-291.
88. Miro Zeman INTRODUCTION TO PHOTOVOLTAIC SOLAR ENERGY Delft University of Technology 2011
89. David Pimentel et.al, Renewable Energy: Economic and Environmental Issues, BioScience -- Vol. 44, No. 8, September 1994
90. Pochettino, A. 1906, Academy Lincei Rendus, Vol. 15, p. 355. 91. Volmer, M. 1913, Annales Physik, Vol. 40, p. 775. 92. Borsenberger, P.M. Weiss,. Organic Photoreceptors for Imaging Systems. s.l. : Marcel
Dekker, 1993. 93. Bube, R.H. Photoconductivity of Solids. New York: Wiley, 1960. 94. Mary D. Archer, Arthur J. Nozik,.series on Photo conversion of Solar Energy — Vol. 3
Nano- structured and Photo electrochemical Systems for Solar Photon Conversion eds. 2008 Imperial College Press
95. Meissner, D., Plastic solar cell, Photon 2 (1999).pp 34. 96. Troshin, P. A Lyubovskaya, R. N.and Razumov, V. F. Organic Solar Cells: Structure,
Materials, Critical Characteristics, and Outlook. Nanotechnologies in Russia, 2008, Vol. 3, Nos. 5–6, pp. 242–271.
97. Gregg B. A. 2003.Excitonic Solar Cells. Journal of Physical Chemistry. B 2003, 107, 4688- 4698
98. Ooyama, Y. and Harima, Y., Molecular Designs and Syntheses of Organic Dyes for Dye-Sensitized Solar Cells. European Journal Organic Chemistry 2009 2903–2934
99. Bre´das, J. Norton. J. E. Cornil, J. and Coropceanu, V. Molecular Understanding of Organic Solar Cells: The Challenges. Accounts of chemical research 2009, 42 (11), pp 1691–1699
100. O'Regan, Michael Grätzel A low-cost, high-efficiency solar cell based on dye-sensitized colloidal TiO2 films 1991 Nature, Vol. 353 (1991), pp. 737-740
101. Silvia Colodrero, Mauricio E. Calvo and Hernán Míguez Photon Management in Dye Sensitized Solar Cells Instituto de Ciencia de Materiales de Sevilla Consejo Superior de Investigaciones Científicas-Universidad de Sevilla Spain
102. Aydil E (2007), Nanomaterials for Solar Cells, Nanotechnology Law & Business Volume 4 No. 3 pp. 275-291

101
103. Yu K and Chen J (2009), Enhancing Solar Cell Efficiencies through 1-D Nanostructures, Nanoscale Res Lett 4 pp. 1–10.
104. Zhang Y, Wu L, Xie E, Duan H, Han W, and Zhao J (2009), A simple method to prepare uniform-size nanoparticle TiO2 electrodes for dye-sensitized solar cells, Journal of Power Sources 189 pp. 1256–1263.
105. Gratzel M (2004), Conversion of sunlight to electric power by nanocrystalline dye-sensitized solar cells, Journal of Photochemistry and Photobiology A: Chemistry 164 pp. 3–14.
106. West, W. Proceeding of the Vogel Centennial Symposium. Photography Science and Engineering.1974, Vol. 18.
107. Moser, J. 1887, Monatshefte für Chemie / Chemical Monthly, Vol. 8, p. 373. 108. Rigollot, H. C. R. Paris: s.n., 1893, Academic Science, Vol. 116, p. 561. 109. Gerischer, H. and Tributsch, H. Ber. Bunsenges. 1968, Physical Chemistry, Vol. 72, p.
437. 110. Nazeeruddin, M. K. Kay, A. Rodicio, I. Humphry-Baker, R Mueller, E. Liska, P.
Vlachopoulos, N., M. Conversion of Light to Electricity by cis-X2Bis(2,2'-bipyridyl-4,4'- dicarboxylate)ruthenium(II) Charge-Transfer Sensitizers (X = Cl-, Br-, I-, CN- and SCN-) on Nanocrystalline TiO2 Electrodes. Journal of American chemical Society. 1993, Vol. 115, pp. 6382-6390.
111. Hagfeldt, A.; Gratzel, M. Light-Induced redox reactions in nanocrystalline systems. Chem. Rev. 1995, 95, pp. 49–68.
112. Fujishima, A. & Honda, K. (1972). Electrochemical photolysis of water at a semiconductor electrode. Nature, 38, 5358, (1972) 37, 0028-0836
113. Gerisher H. & Tributsch, H. (1968). Electrochemistry of ZnO monocrystal spectral sensivity. Berichte der Bunsen-gesellschaft fur physikalische chemie, 72, 3, (March 1968) 437
114. Desilvestro, J.; Gratzel, M.; Kavan, L.; Moser, J. & Augustynski, J. (1985). Highly Efficient Sensitization of Titanium Dioxide. Journal of the American Chemical Society, 107, 10, (May 1985) 2988-2990, 0002-7863
115. Vlachopoulos, N.; Liska, P.; Augustynski, J. & Gratzel, M. (1988). Very Efficient Visible Light Energy Harvesting and Conversion by Spectral Sensitization of High Surface Area Polycrystalline Titanium Dioxide Films. Journal of the American Chemical Society 110, 4, (February 1988) 1216-1220, 0002-7863
116. Chiba, Y.; Islam, A.; Komiya, R.; Koide, N. & Han, L. (2006). Conversion efficiency of 10.8% by a dye-sensitized solar cell using a TiO2 electrode with high haze. Applied Physics Letters, 88, 22 (May 2006) 223505, 0003-6951
117. Ooyama, Y. and Harima, Y. Molecular Designs and Syntheses of Organic Dyes for Dye-Sensitized Solar Cells. European Journal Organic Chemistry. 2009 2903–2934
118. Khalil E. Jasim, Dye Sensitized Solar Cells - Working Principles, Challenges and Opportunities, Department of Physics, University of Bahrain Kingdom of Bahrain

102
119. Kyrylyuk, A. V., et al. s.l. : (Nature Publishing Group):, 2011, Nature Nanotechnology 120. Jiao. Y, Zhang. F and Meng S, (2011) Dye Sensitized Solar Cells Principles and New
Design, Solar Cells - Dye-Sensitized Devices, Prof. Leonid A. Kosyachenko (Ed.), ISBN: 978-953-307-735-2, InTech, Available from: http://www.intechopen.com/books/solar-cells-dye-sensitized-devices/dye-sensitized-solar-cellsprinciples- and-new-design.
121. Olsen, E. Hagen G. and Lindquist, S. E. 2000. Solar Energy Material Solar Cells, , Vol. 63 , pp. 267-273.
122. Kitamura, T. Maitani, M. Matsuda, M. Wada Y. and Yanagida, S. Improved solid-state dye solar cells with polypyrrole using a carbon-based counter electrode. Chemical Letter. Vol. 10, pp. 1054-1055.
123. Joseph D. Roy-Mayhew, David J. Bozym, Christian Punckt, and Ilhan A. Aksay. Functionalized Graphene as a Catalytic Counter Electrode in Dye-Sensitized Solar Cells. ACS Nano. 2010, Vol. 4, 10, pp. 6203–6211.
124. Sapp, S.A. Elliott, C.M. Contado, C. Caramori, S. Bignozzi, C.A. Substituted Polypypridine Complexes of Cobalt(II/III) as Efficient Electron-Transfer Mediators in Dye-Sensitized Solar cells. Journal of the American Chemical Society. 2002, Vol. 124, pp. 11215-11222.
125. Wang. H, Wei. W and Hang. Y. H, Efficient ZnO-based counter electrodes for dye-sensitized solar cells, J. Mater. Chem. A, 2013, 1, 6622–6628.
126. Kelly C. A. and Meyer, G. J. Excited state processes at sensitized nanocrystalline thin film semiconductor interfaces. Coordination Chemistry Review. 2001, Vol. 211, pp. 295-315.
127. Tennakone, K. Kumara, G. R. R. Kottegoda I. R. M. and Perera, V. P. S. An efficient dye- sensitized photoelectrochemical solar cell made from oxides of tin and zinc. Chemical Communication. 1999, Vols. 15-16.
128. Sayama, K., Sugihara, H. Arakawa, H. Photoelectrochemical properties of a porous Nb2O5 electrode sensitized by a ruthenium dye. Chemistry of Materials. 1998, Vol. 10, 12, pp. 3825- 3832.
129. Gratzel, M., (2003). Dye-sensitized solar cells. Journal of Photochemistry and Photobiology C: Photochemistry Reviews 4, pp. 145–153.
130. Kalyanasundaram, K. and Gratzel, M. Applications of functionalized transition metal complexes in photonic and optoelectronic devices. Coordination Chemical Review. 1998, Vol. 177, pp. 347- 414
131. Park, N. G. van de Lagemaat, J. and Frank, A. Comparison of Dye-Sensitized Rutile- and Anatase-Based TiO2 Solar Cells. Journal of Physical Chemistry B. 2000., Vol. 104, 38, pp. 8989-8994
132. Vlachopoulos, N. Liska, P. Augustynski, J. and Graetzel, M. Very efficient visible light energy harvesting and conversion by spectral sensitization of high surface area

103
polycrystalline titanium dioxide films. Journal of American Chemical Society. 1988, Vol. 110, pp. 1216-1220.
133. Hart, J. N. Menzies, D. Cheng, Y.-B Simon G. P. and Spiccia, L. TiO2 sol–gel blocking layers for dye-sensitized solar cells. Comptes Rendus Chimie. May-June 2006,, Vol. 9, 5-6, pp. 622- 626
134. K. Murakoshi, G. Kano, Y. Wada, S. Yanagida, H. Miyazaki, M. Matsumoto and S. Murasawa, IMPORTANCE OF BINDING STATES BETWEEN PHOTOSENSITIZING MOLECULES AND THE TIO2 SURFACE FOR EFFICIENCY IN A DYE-SENSITIZED SOLAR-CELL, J. Electroanal. Chem., 1995, 396, 27-34
135. M. K. Nazeeruddin, C. Klein, P. Liska and M. Graetzel, Synthesis of novel ruthenium sensitizers and their application in dye-sensitized solar cells, Coordination Chemical Review. 2005, Vol. 249, pp. 1460-1467
136. I. Gillaizeau-Gauthier, F. Odobel, M. Alebbi, R. Argazzi, E. Costa, C. A. Bignozzi, P. Qu and G. J. Meyer, Phosphonate-Based Bipyridine Dyes for Stable Photovoltaic Devices, , Inorg. Chem., 2001, 40, 6073-6079
137. H. Zabri, I. Gillaizeau, C. A. Bignozzi, S. Caramori, M.-F. Charlot, J. Cano-Boquera and F. Odobel, Synthesis and Comprehensive Characterizations of New cis-RuL2X2 (X ) Cl, CN, and NCS) Sensitizers for Nanocrystalline TiO2 Solar Cell Using Bis-Phosphonated Bipyridine Ligands (L) Inorg. Chem., 2003, 42, 6655-6666
138. S. Altobello, C. A. Bignozzi, S. Caramori, G. Larramona, S. Quici, G. Marzanni and R. Lakhmiri, Sensitization of TiO2 with ruthenium complexes containing boronic acid functions J. Photochem. Photobiol., A:chemistry, 2004, 166, 91-98.
139. K. Kalyanasundaram and M. Gratzel, Applications of functionalized transition metal complexes in photonic and optoelectronic devices Coord. Chem. Rev., 1998, 177, 347-414
140. W. E. Ford and M. A. J. Rodgers, Interfacial electron transfer in colloidal SnO2 hydrosols photo-sensitized by electrostatically and covalently attached Ru (II) polypyridine complexes, J. Phys. Chem., 1994, 98, 3822-3831.
141. M. A. Fox, F. J. Nobs and T. A. Voynick, Chemically modified electrodes in dye-sensitized photogalvanic cells J. Am. Chem. Soc., 1980, 102, 4036-4039
142. C. Zou and M. S. Wrighton, "Synthesis of Octamethylferrocene Derivatives via Reaction of (Octamethylferrocenyl) Methyl Carbocation with Nucleophiles and Application to Functionalization of Surfaces”, J. Am. Chem. Soc., 1990, 112, 7578-7584.
143. A. S. Polo, M. K. Itokazu and N. Y. Murakami Iha, Metal Complex Sensitizers in Dye-Sensitized Solar Cells, Coord. Chem. Rev., 2004, 248, 1343- 1361
144. Kim, K.S.; Kang, Y.S.; Lee, J.H.; Shin, Y.J.; Park, N.G.; Ryu, K.S. & Chang, S.H. (2006).Photovoltaic properties of nano-particulate and nanorod array ZnO electrodes for dye-sensitized solar cell. Bull Korean Chem. Soc, Vol. 27, pp. 295-298.
104
145. Kong, F.T. Dai, S.Y. and Wang, K.J. New Amphiphilic Polypyridyl Ruthenium (II) Sensitizer and Its Application in Dye-Sensitized Solar Cells. Chinese Journal of Chemistry. 2007, Vol. 25, 2, pp. 168-171.
146. Schmidt-Mende, L. Bach, U. Humphry-Baker, R. Horiuchi, T. Miura, Ito, H. S. Uchida, S.and Graetzel, M. Organic dye for highly efficient solid-state dye-sensitized solar cells. Advanced Materials. 2005., Vol. 17, 7, pp. 813-815.
147. Campbell, W. M.; Jolley, K. W.; Wagner, P.; Wagner, K.; Walsh, P. J.; Gordon, K. C.; Schmidt-Mende, L.; Nazeeruddin, M. K.; Wang, Q.; Grätzel, M. & Officer, D. L. (2007). Highly Efficient Porphyrin Sensitizers for Dye-Sensitized Solar Cells, Journal of Physical Chemistry C, Vol. 111, No.32, (August 2007), pp. 11760-11762.
148. Sayama, K. Tsukagoshi, S. Mori, T. Hara, K. Ohga, Y. Shinpou, A. Abe, Y. Suga, S. and Arakawa, H. Efficient sensitization of nanocrystalline TiO2 films with cyanine and merocyanine organic dyes,. Solar Energy Material Solar Cells. 2003, Vol. 80, 1, pp. 47-71.
149. Kay A, Gräetzel M. Artificial photosynthesis. 1. Photosensitization of titania solar cells with chlorophyll derivatives and related natural porphyrins. J Phys Chem, 1993, 97(23): 6272–6277
150. Wang P, Zakeeruddin SM, Comte P, Charvet R, Humphry-Baker R, Grätzel M. Enhance the performance of dye-sensitized solar cells by co-grafting amphiphilic sensitizer and hexadecylmalonic acid on TiO2 nanocrystals. J Phys Chem B, 2003, 107(51): 14336–14341
151. Wang ZS, Cui Y, Dan-oh Y, Kasada C, Shinpo A, Hara K. Thiophenefunctionalized coumarin dye for efficient dye-sensitized solar cells: Electron lifetime improved by coadsorption of deoxycholic acid. J Phys Chem C, 2007, 111(19): 7224–7230
152. Qu SY, Wu WJ, Hua JL, Kong C, Long YT, Tian H. New diketopyrrolopyrrole (DPP) dyes for efficient dye-sensitized solar cells. J Phys Chem C, 2010, 114(2): 1343–1349
153. Fang, J. Su, L. Wu, J. Shen, Y. and Lu, Z. The photoresponse properties of nanocrystalline TiO2 particulate film co-modified with dyes. New Journal of Chemistry,. 1997, Vol. 21, 6/7, pp. 839- 840
154. Nazeeruddin, M. K. Kay, A. Rodicio, I. Humphry-Baker, R Mueller, E. Liska, P. Vlachopoulos, N., M. Conversion of Light to Electricity by cis-X2Bis(2,2'-bipyridyl-4,4'- dicarboxylate)ruthenium(II) Charge-Transfer Sensitizers (X = Cl-, Br-, I-, CN- and SCN-) on Nanocrystalline TiO2 Electrodes. Journal of American chemical Society. 1993, Vol. 115, pp. 6382-6390.
155. Suri, P., Panwar, M., & Mehra, R. (2007). Photovoltaic performance of dye-sensitized ZnO solar cell based on Eosin-Y photosensitizer, Materials Science-Poland, Vol. 25, No.1, pp. 137-144
156. Yanagida, S., (2006). Recent research progress of dye-sensitized solar cells in Japan. C. R. Chemie. Vol. 9, pp. 597-604

105
157. Matsumoto, M.; Wada, Y.; T. Kitamura, T.; Shigaki, K.; Inoue, T.; Ikeda, M. and Yanagida, S. (2001). Fabrication of solid-state dye-sensitized TiO2 solar cell using polymer electrolyte. Bull. Chem. Soc. Japan, vol. 74, pp. 387-393.
158. Tennakone, K.; Perera, V.P.S; Kottegoda, I.R.M. & Kumara, G. (1999). Dye-sensitized solid state photovoltaic cell based on composite zinc oxide/tin (IV) oxide films, J. Phys. D-App. Phys., Vol. 32, No. 4, pp. 372.
159. Kang, M.G., Park, N-G., Kim, K-M., Ryu, K.S., Chang S.H. & Kim, K.J. (2003). Highly efficient polymer gel electrolytes for dye-sensitized solar cells. 3rd World Conference on Photovoltaic Emru Conversion. May 11-18, 2003 Osnh, Japan
160. Wang, P. Zakeeruddin, S. M. Moser, J.E and Graetzel, M. A New Ionic Liquid Electrolyte Enhances the Conversion Efficiency of Dye-Sensitized S o l a r Ce l l s . Journal o f P h y s i c a l chemistry B, 2003, Vols. 107,, 48, pp. 13280-13285.
161. Matsumoto, H. Matsuda, T. Tsuda, T. Hagiwara, R. Ito, Y. and Miyazaki, Y. The application of room temperature molten salt with low viscosity to the electrolyte for dye-sensitized solar cell. 2001, Vol. 1, pp. 26-27.
162. U. Bach, D. Lupo, P. Comte, J. E. Moser, F. Weissortel, J. Salbeck, H. Spreitzer and M. Gratzel, Solid state dye sensitized mesoporous TiO2 solar cells with high photon to electron conversion efficiency, Nature, 1998, 395, 583-585
163. L. Schmidt-Mende, U. Bach, R. Humphry-Baker, T. Horiuchi, H. Miura, S. Ito, S. Uchida and M. Graetzel, organic dye for highly efficient solid state dye sensitized solar cells, Adv. Mater., 2005, 17, 813-815
164. Kubo, W. Kitamura, T. Hanabusa, K. Wada, Y. and Yanagida, S. Quasi-solid-state dye- sensitized solar cells using room temperature molten salts and a low molecular weight gelator. Chemical Communication. 2002, pp. 374-375.
165. Tributsch, H . Dye sensitization solar cells: a critical assessment of the learning curve. Coordination Chemistry Review, 2004, Vol. 248, 13-14, pp. 1511-1530.
166. Figgemeier, E. and Hagfeldt, A. Are dye-sensitized nano-structured solar cells stable? An overview of device testing and component analyses. International Journal of Photoenergy, 2004, Vol. 6, 3, pp. 127-140.
167. Argazzi, R. Bignozzi, C. A. Heimer, T. A. Castellano, F. N. and Meyer, G. J. Light-Induced Charge Separation across Ru(II)-Modified Nanocrystalline TiO2 Interfaces with Phenothiazine Donors. The journal of physical chemistry B. 1997, Vol. 101, 14, pp. 2591-2597.
168. Nazeeruddin, M. K. and Gratzel, M. Transition metal complexes for photovoltaic and light emitting applications. Structure and Bonding. 2007, Vol. 123, pp. 113-175.
169. Emery, Keith. [ed.] Antonio Luque and Steven Hegedus. Handbook of photovoltaic science and engineering. Chichester : John Wiley & Sons Inc.,, 2003
170. Bre´das, J. Norton. J. E. Cornil, J. and Coropceanu, V. Molecular Understanding of Organic Solar Cells: The Challenges. Accounts of chemical research 2009, 42 (11), pp 1691–1699

106
171. Matthews, D., Infelta, P. and Graetzel, M., Calculation of the photocurrent-potential characteristic for regenerative, sensitized semiconductor electrodes, Solar Energy Materials & Solar Cells, 1996 44, 119-155
172. Gratzel, M. & Hagfeldt, A. (2000). Molecular Photovoltaics. Acc. Chem. Res, Vol. 33, pp. 269- 277.
173. Jason B. Baxter: Commercialization of dye sensitized solar cells, J. Vac. Sci. Technol. A, Vol. 30, No. 2, Mar/Apr 2012
174. Seigo Ito, Peter Chen, Pascal Comte, Mohammad Khaja Nazeeruddin, Paul Liska,.Fabrication of screen-printing pastes from TiO2 powders for dye-sensitised solar cells. Progress in Photovoltaics: Research and applications. 2007, Vol. 15, 7, pp. 603-612.
175. Byoung-Kuk Lee, Jang-Joo Kim. Enhanced efficiency of dye-sensitized solar cells by UV–O3 treatment of TiO2 layer. Current Applied Physics. 2009, Vol. 9, pp. 404–408.
176. Chianelli, R.R., K. Castillo, V. Gupta, A.M. Qudah, B. Torres, R.E. Abujnah (2013), Asphaltene Based Photovoltaic Devices, U.S. Patent 8,389,853 B2, filed July 9, 2010, and issued March 5, 2013.

107
Abbreviations
GHG Greenhouse gasses Btu British thermal unit EIA Energy Information Administration IPCC Intergovernmental Panel on Climate Change (IPCC) OECD Organization of Economic Cooperation and Development IEO International Energy Outlook
ASTM American Society for Testing and Materials G173-03 Global Terrestrial Reference Spectra σ Stefan Boltzmann constant (5.67 × 10⁻⁸ W/m2/K4). SO Solar constant AU The astronomical unit (149,604,970 km) DSE Diameter of earth sphere ASE Surface area of earth sphere AM1.5 Air Mass at 48ᴼ zenith angle AM 0 Air Mass at 0 zenith angle UVR Ultra violet radiation AC Earth cross-sectional area TWh TeraWatt hour DSSC Dye sensitized solar cell C13-NMR Carbon 13 nuclear magnetic resonance XANES X-ray absorption near-edge spectroscopy IR Infrared spectroscopy

108
FT- IR Fourier Transform InfraRed FCS Fluorescence correlation spectroscopy fs Femtoseconds ns Nanoseconds ps picoseconds ms milliseconds ESR Electron Spin resonance mass spectroscopy, VPO Vapor pressure osmometry GPC Gel permeation chromatography MS Mass spectrometry SEC Size exclusion chromatography SAXS Small angle X-ray scattering SANS Small angle neutron scattering Amu Atomic mass unit L2MS Two-step laser desorption ionization mass spectrometry LIAD laser-induced acoustic desorption FFTEM Freeze-fracture-transmission electron-microscopy WAXS Wide angle x-ray scattering CMC Critical micelle concentrations PV Photovoltaic
Chl-a Chlorophyll A STM Scanning tunneling microscope SEM Scanning electron microscope

109
TCO Transparent conductive oxide ITO Indium Tin oxide FTO Fluorine doped tin dioxide LUMO Lowest unoccupied molecular orbital HOMO Highest occupied molecular orbital TBAOH Tetrabutylammonium hydroxide Voc Open circuit Voltage Isc Short circuit current IPCE Incident Photon to Current Efficiency FF Fill factor UV.VIS Ultra violet visible MPP Maximum power point PEC Photoelectrochemical

110
Vita
Hassan Mohamed Sharif was born on the Tenth of April, 1966, in Alkhoms, Libya. He
holds a BSc in Environmental Studies from Sebha University college of Engineering and
Technology formally (Higher Institute of Technology) Brack Libya, since 1987, and MSc in
Environmental Science & Engineering from Delft International Institute for Infrastructural,
Hydraulic, and Environmental Engineering (IHE) Netherlands 1999. His Master’s thesis was
about the groundwater contamination by wastewater in Libya problem and solution. After his
graduation he worked for ten years in Wastewater Treatment Plant of Ras Lanuf Oil and Gas
Processing Company and then in 2002 he moved to Arabic Cement Company as Environmental
Research Consultant. In 2005, He joined the college of Science at Alemrgib University Alkhoms
Libya where he works as instructor for three years. During this period of time he taught many
courses (such as Water & wastewater treatment, Solid waste management). In addition to
teaching, he worked as a BSc research supervisor. In reward of his hard work and achievement,
he has awarded a PhD scholarship from the Ministry of High Education In Libya in 2008.
Hassan came to the United States in Aug, 2008 and in Fall 2009 joined the
Environmental Science and Engineering PhD program at the University of Texas at El Paso.
Permanent address: 5450 Suncrest Dr
El Paso, Texas, 79912
This dissertation was typed by Hassan Sharif
Copyright © 2022 FDOKUMEN