Simultaneous Transient Absorption and Transient Electrical Measurements on Operating Dye-Sensitized...
6
Simultaneous Transient Absorption and Transient Electrical Measurements on Operating Dye-Sensitized Solar Cells: Elucidating the Intermediates in Iodide Oxidation Assaf Y. Anderson, Piers R. F. Barnes, James R. Durrant, and Brian C. O’Regan* Department of Chemistry, Imperial College London, London SW7 2AZ, U.K. ReceiVed: October 26, 2009; ReVised Manuscript ReceiVed: December 11, 2009 Simultaneously acquired transient absorption, photocurrent, and photovoltage signals are used to characterize operational dye-sensitized solar cells (DSSCs) under 1 sun illumination. At open circuit, the biphasic decay of both photovoltage and 980 nm absorption have identical decay profiles. The data show that, in devices incorporating N719 [(Bu 4 N) 2 [Ru(dcbpyH) 2 (NCS) 2 ] (dcbpy ) 4,4′-dicarboxy-2,2′-bipyridyl) as the sensitizer, the 950-1020 nm absorption can be assigned to electrons alone. This differs from some previous assignments. At short circuit, the comparison of the integrated photocurrent transient, electron absorption, and the absorption of the oxidized dye (830 nm) can be used to show relative loss of photocurrent to oxidized dyes. In addition, we show that, under operational conditions, there is no evidence for long-lived di-iodine radicals (I 2 •- ). Further, we show that the decay of the transient bleach at 560 nm, previously assigned to the bleach of the ground- state dye, contains additional long-lived bleach components that correlate with the electron transient. This calls into question the use of the bleach transients for kinetic studies of dye regeneration. The use of simultaneous transient absorption and electrical signals significantly increases the information available from transient absorption studies, at little extra cost in time or equipment. Introduction Dye-sensitized solar cells (DSSCs) present an interesting research topic not only from the point of view of increasing their contribution to future energy supplies but also as prototypes systems for other future nanoelectrochemical devices, such as for solar fuel production. DSSCs are photoelectrochemical systems where both electrical and chemical characteristics combine to define successful device operation. In this situation, simultaneous optical and electrical characterization of actual devices is of obvious relevance but has rarely been pursued. 1,2 The transient absorbance (TA) technique, applied to DSSCs, allows measurement of the formation and decay of chemical and electrical intermediates that absorb light. Alternatively, transient electrical (TE) characterization can detect changes in the quantity and position of charged species. TA has been routinely applied to DSSC research since its inception. 3,4 For the most part, TA has been applied to partial systems composed of some subset of the complete devices. Examples include homogeneous dye solutions, TiO 2 /dye colloidal solutions, and dye-sensitized mesoporous films exposed to solution in cuvettes or behind covering glass. Usually these experiments are carried out under dark conditions. For example, difference spectra of the oxidized dye (S + , sometimes also referred to as dye cation) and excited dye (S*) in solution (with and without e - acceptor, respectively) were published in the past by Tachibana et al. 5 The difference spectrum of S + in dye-sensitized film, immersed in 0.1 M LiI in propylene carbonate and measured with dark background conditions, was presented by Montanari et al. 6 Transient electrical characterization is most successfully carried out on complete devices operating under illumination. The differences in the chemical environment at the photoelec- trochemically active surface between complete devices and device subsets can limit the direct comparison of TA and TE results. Critical differences in electron concentrations and concentration profiles occur between a TiO 2 film in the dark and a device under operation. Another difference is the existence of concentration profiles of solution species across the device under operation, 7 which are not present in solutions or device subsets. In devices at short circuit, diffusive gradients can cause the concentration of limiting species near the photoactive interface to be quite different from that in the original electrolyte. Another important difference is in the effect of the high surface area TiO 2 on the small volume of electrolyte in the actual device. For example, a typical cell has 2 µL/cm 2 of electrolyte and a TiO 2 surface area on the order of 1000 cm 2 /cm 2 . A strong adsorption to the surface can fully deplete the electrolyte of a component initially present at 0.1 M. All these effects make the TiO 2 interface very different in a real device, compared with films in vacuum, neat solvent, or bulk electrolyte. Also, the application of TA on complete and functioning devices gives one the ability to correlate the transient observations with the device current, voltage, and fill factor, thus providing a firm footing for any conceptual models built up around the results. Many electrical characterization techniques have been applied to DSSCs; here, we focus on transient photovoltage and photocurrent measurements, as they can be directly compared to TA. Small perturbation transient photovoltage (TPV) and photocurrent (TPC) decays are often used to measure the electron recombination lifetime (τ n ) and the e - diffusion coefficient (D n ). 8-10 Typically, the diffusion length is calculated as L n ) (τ n D n ) 1/2 . Recently, we observed that the diffusion length so calculated does not correlate correctly with measured photocurrents on the same devices. 8-10 This can lead to doubts concerning the transient techniques. For example, to what extent do the transient electrical measurements accurately reflect the charge concentration and movement in the TiO 2 film? We address this question in this paper. In the current work, we present results of simultaneous measurement of TA and TE signals on working devices under * To whom correspondence should be addressed. E-mail: b.oregan@ imperial.ac.uk. J. Phys. Chem. C 2010, 114, 1953–1958 1953 10.1021/jp910221j 2010 American Chemical Society Published on Web 01/07/2010
-
Upload
independent -
Category
Documents
-
view
4 -
download
0
Transcript of Simultaneous Transient Absorption and Transient Electrical Measurements on Operating Dye-Sensitized...

Simultaneous Transient Absorption and Transient Electrical Measurements on OperatingDye-Sensitized Solar Cells: Elucidating the Intermediates in Iodide Oxidation
Assaf Y. Anderson, Piers R. F. Barnes, James R. Durrant, and Brian C. O’Regan*Department of Chemistry, Imperial College London, London SW7 2AZ, U.K.
ReceiVed: October 26, 2009; ReVised Manuscript ReceiVed: December 11, 2009
Simultaneously acquired transient absorption, photocurrent, and photovoltage signals are used to characterizeoperational dye-sensitized solar cells (DSSCs) under 1 sun illumination. At open circuit, the biphasic decayof both photovoltage and 980 nm absorption have identical decay profiles. The data show that, in devicesincorporating N719 [(Bu4N)2[Ru(dcbpyH)2(NCS)2] (dcbpy ) 4,4′-dicarboxy-2,2′-bipyridyl) as the sensitizer,the 950-1020 nm absorption can be assigned to electrons alone. This differs from some previous assignments.At short circuit, the comparison of the integrated photocurrent transient, electron absorption, and the absorptionof the oxidized dye (830 nm) can be used to show relative loss of photocurrent to oxidized dyes. In addition,we show that, under operational conditions, there is no evidence for long-lived di-iodine radicals (I2
•-). Further,we show that the decay of the transient bleach at 560 nm, previously assigned to the bleach of the ground-state dye, contains additional long-lived bleach components that correlate with the electron transient. Thiscalls into question the use of the bleach transients for kinetic studies of dye regeneration. The use ofsimultaneous transient absorption and electrical signals significantly increases the information available fromtransient absorption studies, at little extra cost in time or equipment.
Introduction
Dye-sensitized solar cells (DSSCs) present an interestingresearch topic not only from the point of view of increasingtheir contribution to future energy supplies but also as prototypessystems for other future nanoelectrochemical devices, such asfor solar fuel production. DSSCs are photoelectrochemicalsystems where both electrical and chemical characteristicscombine to define successful device operation. In this situation,simultaneous optical and electrical characterization of actualdevices is of obvious relevance but has rarely been pursued.1,2
The transient absorbance (TA) technique, applied to DSSCs,allows measurement of the formation and decay of chemicaland electrical intermediates that absorb light. Alternatively,transient electrical (TE) characterization can detect changes inthe quantity and position of charged species. TA has beenroutinely applied to DSSC research since its inception.3,4 Forthe most part, TA has been applied to partial systems composedof some subset of the complete devices. Examples includehomogeneous dye solutions, TiO2/dye colloidal solutions, anddye-sensitized mesoporous films exposed to solution in cuvettesor behind covering glass. Usually these experiments are carriedout under dark conditions. For example, difference spectra ofthe oxidized dye (S+, sometimes also referred to as dye cation)and excited dye (S*) in solution (with and without e- acceptor,respectively) were published in the past by Tachibana et al.5
The difference spectrum of S+ in dye-sensitized film, immersedin 0.1 M LiI in propylene carbonate and measured with darkbackground conditions, was presented by Montanari et al.6
Transient electrical characterization is most successfullycarried out on complete devices operating under illumination.The differences in the chemical environment at the photoelec-trochemically active surface between complete devices anddevice subsets can limit the direct comparison of TA and TE
results. Critical differences in electron concentrations andconcentration profiles occur between a TiO2 film in the darkand a device under operation. Another difference is the existenceof concentration profiles of solution species across the deviceunder operation,7 which are not present in solutions or devicesubsets. In devices at short circuit, diffusive gradients cancause the concentration of limiting species near the photoactiveinterface to be quite different from that in the original electrolyte.Another important difference is in the effect of the high surfacearea TiO2 on the small volume of electrolyte in the actual device.For example, a typical cell has 2 µL/cm2 of electrolyte and aTiO2 surface area on the order of 1000 cm2/cm2. A strongadsorption to the surface can fully deplete the electrolyte of acomponent initially present at 0.1 M. All these effects makethe TiO2 interface very different in a real device, compared withfilms in vacuum, neat solvent, or bulk electrolyte. Also, theapplication of TA on complete and functioning devices givesone the ability to correlate the transient observations with thedevice current, voltage, and fill factor, thus providing a firmfooting for any conceptual models built up around the results.
Many electrical characterization techniques have been appliedto DSSCs; here, we focus on transient photovoltage andphotocurrent measurements, as they can be directly comparedto TA. Small perturbation transient photovoltage (TPV) andphotocurrent (TPC) decays are often used to measure theelectron recombination lifetime (τn) and the e- diffusioncoefficient (Dn).8-10 Typically, the diffusion length is calculatedas Ln ) (τnDn)1/2. Recently, we observed that the diffusion lengthso calculated does not correlate correctly with measuredphotocurrents on the same devices.8-10 This can lead to doubtsconcerning the transient techniques. For example, to what extentdo the transient electrical measurements accurately reflect thecharge concentration and movement in the TiO2 film? Weaddress this question in this paper.
In the current work, we present results of simultaneousmeasurement of TA and TE signals on working devices under
* To whom correspondence should be addressed. E-mail: [email protected].
J. Phys. Chem. C 2010, 114, 1953–1958 1953
10.1021/jp910221j 2010 American Chemical SocietyPublished on Web 01/07/2010
operating conditions. In particular, we focus on signals relevantto the recombination or extraction of electrons and the regenera-tion of oxidized dye molecules (S+f S0). The pump pulse usedfor the transient absorption also initiates electrical transients,and these are measured with a separate recording system. Biasillumination is provided and the ability to control the voltageon the cell. Using this system, we give initial results thatilluminate the relationship of the electrical and optical signals.We find good correlation between optical and electrical signalsover a wide time range, solidifying the interpretation of bothsignals. Specifically, we examine an optimized cell, and onewhere an electrolyte component (iodide, I-) has been decreased,inducing a large loss to a specific recombination pathway(electron to oxidized dye). We also find a correlation betweenan optical and electrical signal not previously thought to berelated.
Experimental Section
Titanium oxide colloids and films were prepared as previ-ously, using acid peptization.4,11-13 TiCl4:2THF (Aldrich) wasused for the TiCl4 treatment.2 Cells were fabricated as previouslypublished.14 The device active area was 1 cm2 and the TiO2
thickness was 8.7 ( 0.6 µm. FTO glass (tek-15) was thesubstrate for the working and counter electrodes. The latter wasprepared using 15 µL H2PtCl6. The TiO2 films were dyed with(Bu4N)2[Ru(dcbpyH)2(NCS)2] (dcbpy ) 4,4′-dicarboxy-2,2′-bipyridyl) (N719, Dyesol) dissolved in a 1:1 ratio of acetonitrile/tert-butanol. The films were soaked in the dye solution for 3-4days. Two identical cells were made, varying only the concen-tration of the electron donor, iodide. The electrolytes werecomposed of 3-methoxypropionitrile (MPN), 0.05 M I2, 0.3 Mbenzimidazole, and 0.05 M guanidinium thiocyanate. The iodidewas changed by varying the ratio of 1-propyl-3-methylimida-zolium iodide (PMII) to 1-methyl-3-propylimidazolium bis(tri-fluoromethylsulfonyl)imide (PMITFSI), keeping the total con-centration of both at 0.8 M. The optimized device had 0.8 MPMMI, and the low iodide device had 0.07 M PMMI and 0.73M PMITFSI. The MPN was high purity (99.85) from DixieChemical; other components were purchases from Sigma-Aldrich, Fluka, and Iolitec and used as received.
Difference Spectrum. Transient difference spectra (Figure1) were acquired using a transient absorption technique similarto those previously published.5,6,15-17 The pump was a nitrogendye laser at 510 nm. The probe lamp was a 100 W quartztungsten halogen lamp (Bentham IL1). White light from the
probe lamp was directed at the sample, attenuated with neutraldensity filters to give ∼1 sun illumination intensity. A singlemonochromator was used after the sample. The device used wasas described above, but the electrolyte was 0.6 M 1-propyl-3-methylimidazolium iodide, 0.025 M lithium iodide, 0.04 M I2,0.28 M TBP, and 0.05 M GuSCN in valeronitrile/acetonitrile,with a volume ratio of 15:85.
Transient Voltage/Current and Absorption. Simultaneoustransient absorption and electronic transients (Figure 2) weremeasured on a modified TA system. A similar tungsten halogenprobe light was attenuated with neutral density filters, and itsspectral region was constrained between 715 and 1000 nm usinglong-pass (LP715) and short-pass (Thorlabs FES1000) filters.This was done to avoid excitation of the dye by the probe light,allowing transients to also be measured in the “dark” condition.To simulate the 1 sun working condition, additional illuminationwas provided by 12 white LEDs (Luxeon LXHL-NWE8) whoseintensity was under computer control. After the sample, theprobe wavelength was selected using either 830 ( 5 or 980 (5 nm band-pass filters. The transient absorption was detectedusing Si photodiode (Hamamatsu S3071) integrated within aCostronics amplifier and recorded on an oscilloscope. Sampleswere pumped at a rate of 2 Hz using the 532 nm output of aND:YAG pumped OPO (Opotek Opolette 355). The pump pulseenergy was selected to cause a transient peak of ∼0.5 m∆ODat 830 nm for the 800 mM I- device. This corresponds to e1oxidized dyes formed per five particles. The energy was keptconstant for the low I- device. The cells were also connectedto a data acquisition (DAQ) card that allowed measurement ofboth the steady-state voltage/current caused by the bias lightand the transient voltage/current created by the pump pulse. Acomputer-controlled switch allowed selection of open- or short-circuit condition. An attached power supply allowed in situmeasurement of the cell IV to allow good cross correlationbetween transients and cell performance. Currents at short circuitwere measured over a 2 Ω resistor. A thermocouple wasattached to the cell to monitor temperatures during measure-ments. Measurements under 1 sun were performed with a devicetemperature of 29 ( 0.5 °C.
For transient voltage/current and transient optical measure-ments at 560 nm, the probe light was attenuated with a T )63% neutral density filter and its spectral region was constrainedwith a 500 nm long-pass filter and an infrared rejection filter.In this case, the probe illumination was approximately equivalentto 1 sun and the white diodes were not used. The 830 and 980
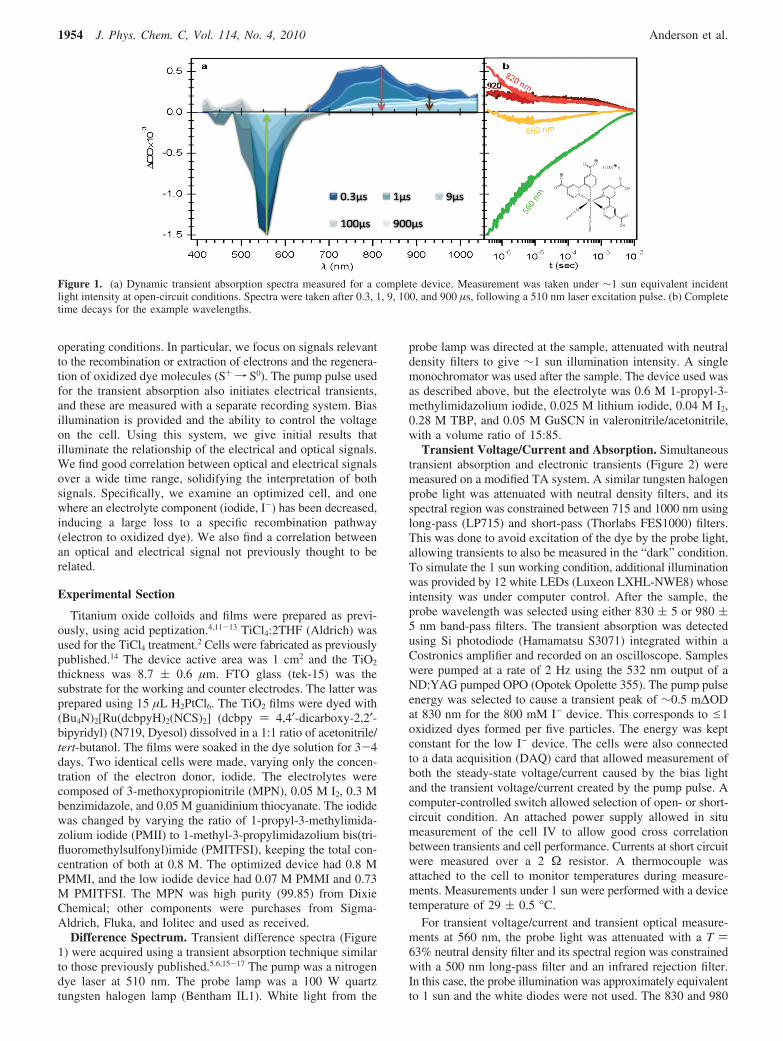
Figure 1. (a) Dynamic transient absorption spectra measured for a complete device. Measurement was taken under ∼1 sun equivalent incidentlight intensity at open-circuit conditions. Spectra were taken after 0.3, 1, 9, 100, and 900 µs, following a 510 nm laser excitation pulse. (b) Completetime decays for the example wavelengths.
1954 J. Phys. Chem. C, Vol. 114, No. 4, 2010 Anderson et al.

nm signals presented in Figure 3 were also measured in thisconfiguration.
Transient Photocurrent to Transient Charge. The conver-sion of transient photocurrent to transient charge to be collected(Figure 2b,d) goes as follows: The laser flash causes a givennumber of electrons to be injected into the TiO2, Qinj. Qinj
corresponds to the initial height of the TA at 980 nm. Thetemporal decay of the ∆OD at 980 nm corresponds to theamount of Qinj remaining in the system, Qrem(t), as the chargesdisappear to recombination with S+, recombination to electro-
lyte, and transport (as photocurrent) out of the TiO2. On theother hand, integration of the photocurrent transient gives thepart of Qinj that has flowed out of the system (i.e., “collected”)up to time t, Qcol(t) (eq 1). Integration over several seconds givesthe total charge collected, Qtcc. In an efficient cell, Qtcc is closeto Qinj (Figure 2b). To convert Qcol(t) into a charge remainingtransient, we plot Qcrem(t) ) Qtcc - Qcol(t). Thus, Qcrem(t) is thepart of the charge remaining in the system, at time t, whichwill be collected as photocurrent by the end of the transient.Equation 1 summarizes the above
Figure 2. Correlation between small perturbation optical and electronic signals. (a, c) Transient photovoltage decays (∆V(t)) for normal and poorlyregenerating cells, containing 800 and 70 mM I-, respectively. (b, d) Transient charge decays (∆AQ(t)) measured under short-circuit conditionscorresponding to the devices shown in (a) and (c), respectively. The insets in (c) and (d) are the same plots of the 980 nm signal correlated withthe corresponding electronic signal, plotted on log(∆OD)|linear (t)|log(∆E/∆Q) scales. The inset in (c) highlights the match in the first 250 µs ofthe TPV decay. The inset in (d) shows that the 980 nm and the TPQ decays match at t > 1 ms. The ratio between e- absorption and charge is 11.7OD C-1 cm2 (ε(e-) ) 1170 M-1 cm-1). In all cases, the measured signals were taken under the same conditions using the same excitation pulse.
Figure 3. Transient absorption correlation of the bleach signal measured at 560 nm to the superimposed oxidized dye (S+) absorption, measuredat 830 nm. The bleach signals were inverted and scaled such that their initial absorption will match the initial absorption of the 830 nm signal. Thedevices are the same devices used in Figure 2. The measurement was obtained under 1 sun illumination and either open or short circuit (OC or SC).
Transient Characterization of Operating DSSCs J. Phys. Chem. C, Vol. 114, No. 4, 2010 1955

where t ) 0 is the time of the excitation pulse and thephotocurrent returns to its steady-state value J after a sufficientlylong time, t ∼ ∞.
Results and Discussion
Figure 1a presents transient absorption difference spectra ofa complete and functioning device, measured under ∼1 sunillumination and open-circuit conditions at different times (t)after the excitation pulse. Figure 1b shows the complete decaysat the major chosen probe wavelengths.
The spectra and its decay can be divided into three obvioussections with an isosbestic point around 660 nm. The bleach ofthe ground-state dye absorption appears at λ < 650 nm, peakingat 560 nm, which is near the absorption max of 535 nm.18 (Inthe spectrum at 0.3 µs, the bleach cannot be measured at λ <540 nm due to the scattered light from the laser pulse.) At times<100 µs, the absorption between 700 and 890 nm can beassigned to the photooxidized dye superimposed on the absorp-tion of the electron in the TiO2. The transient spectrum of thedye bleach and oxidized dye in the cell at t < 100 µs lookssimilar to the transient spectrum of dye bleach and oxidizeddye in a solution, presented by Tachibana et al.5 The absorbanceat λ > 920 nm we assign to only the electron in the TiO2. Theoxidized dye is not expected to show a noticeable absorptionat λ > 920 nm, the same as was shown for Ru(II)(bpy)2(NCS)2
oxidized by Ce(IV) in acetonitrile.19 Likewise, after 100 µs, weassign the absorbance between 700 and 890 nm to the electronalone. The spectrum between 700 and 1040 nm, at t ) 100 and900 µs, matches the steady-state spectrum observed by applyingpotential to the TiO2 electrode in water.20-22 We note thisspectrum differs from that presented in Montanari et al.;6 theseearlier results were generated in a film facing bulk solution ina cuvette, and also without bias light, and thus are fromconditions quite different from that inside the operating cellshown here.
Figure 2 shows the correlation between transient electricaland transient optical measurements. For Figure 2a,c, the cellswere at Voc (open circuit voltage) under 1sun illumination. Thesteady-state Voc of the cell during the measurement is alsoshown. The transient voltage decays are plotted together withthe 980 and 830 nm optical decays. In DSSCs, the voltage isproportional to the logarithm of the charge density.2 However,for the small perturbations used here, the logarithm is well-approximated by a linear function; thus, we have comparedabsorbance and voltage on linear axes. The normalizationconstants used will be discussed below. The cell shown in Figure2a has the full iodide concentration and S0 undergoes fastregeneration, and the cell shown in Figure 2c has low iodideand slow regeneration. The data show a strong similaritybetween the TPV and TA decay for both cases. Both voltagedecay and TA decay (at 980 nm) are biphasic, and the similarityis good across the whole time scale from 1 µs to 0.1 s (seeFigure 2c, inset). The information contained in the voltage decayallows us to improve the assignment of the TA 980 nm signal.The voltage is a measure of the Fermi level in the TiO2, andthus, the transient voltage can be assigned uniquely to changesin the TiO2 electron concentration. Small changes in the solutionredox potential may also occur, but these make very minorcontributions.23 The high similarity of ∆V(t) and ∆OD(t)indicates that only electrons contribute significantly to the 980nm TA signal. Fast disproportionation (2I2
•- f I- + I3- (k )
3 × 10⁹ M-1 s1))24 combined with a low absorption coefficient25
of I2•- minimizes the possible contribution of I2
•- to the 980nm signal. The species I3
-, I2, I-, I•, and S+ show negligibleabsorption at 980 nm19,25,26 so that contributions to the TA signalare not expected.
Figure 2b,d shows similar data for the 1 sun illuminationshort-circuit condition. The cell Jsc (short circuit photocurrent)during the measurement is also given. In this case, thecomparison of the TA signal (which measures charge concentra-tion) to the photocurrent transient signal (which measures chargeflux) requires additional steps. For this purpose, we haveintegrated the photocurrent transient (over time) and reflectedit across the x axis to create a decay transient that is the “chargeremaining that will be collected”, Qcrem (see the ExperimentalSection).
Figure 2b,d shows TA decay on the left axis compared toQcrem(t) on the right axis. The y-axis scaling has been chosento maximize the overlap between TA and Qcrem(t). The samescaling has been used in Figure 2b,d. Unlike the photovoltagecase, the overlap can only be accomplished in the latter part ofthe transient, after 100 µs for the full iodide cell and after 1 msfor the low iodide cell (see Figure 2d, inset). At earlier times,the Qcrem(t) amplitude is lower than the TA 980 nm. Thedifference corresponds to the charges that will not be collected,but instead, lost to recombination. This difference is much largerin the low I- cell, showing large losses to ∆S+, as expectedfrom the slower S+ regeneration. This is also expressed in thelower photocurrent in this cell. In both cells shown, the Qcrem(t)signal meets the TA 980 nm signal at the same time as the TA830 nm signal meets the TA 980 nm signal. This point can betaken as the time at which there is no more excess S+ from thepulse. (The 830 nm decay mainly contains a contribution fromboth the S+ and the electron, when the excess S+ has disap-peared; the remaining absorption of the electron is similar tothat at 980 nm.) The identical shape of the decays, after thedisappearance of the excess S+, indicates that, after this time,both TA and Qcrem(t) decays are signatures of the same process.Again, because the photocurrent transient is a measurement ofelectrons only, neither the TA 980 nor 830 nm contains anoticeable contribution from other intermediates, for example,I2
•-, after this time. This conclusion is strengthened by the factthat the shift in the TA 980 nm decay to shorter times betweenOC and SC is mirrored exactly by the shift in the TE decays.
The y-axis scaling (normalization) used in Figure 2 has beenchosen to show a similarity in shape for purposes of assignmentof the TA pulse. The scaling chosen for Figure 2b,d, implies acertain absorption coefficient for the electrons in the cell, underthose conditions. The resultant value is ε(e-) ) 1170 M-1 cm-1
(a cross section of ∼5 × 10-18 cm2), in good agreement withother results.27-29 Using this value, the normalizations used forFigure 2a,c imply a relation between the charge (from the ∆OD980 nm) and the voltage, and thus, a cell capacitance. Thecapacitances implied are ∼3 mF/cm2, similar to other measure-ments of capacitance in these cells.30 We note that the overlapof the latter part of the TA and Qcrem(t) decay in Figure 2b,ddoes not necessarily indicate that there are zero recombinationlosses during this later phase. Electrons can recombine with I3
-
and with the background population of S+, during transport,and a different choice of the normalization constant would placethe Qcrem(t) transient lower than the TA 980 nm at later times.This cannot be resolved by transient analysis alone. Anotheradvantage of doing the transient measurement on full cells isthat we can separately measure the diffusion length by steady-
Qcrem(t) ) ∫0
∞∆J dt - ∫0
t∆J dt (1)
1956 J. Phys. Chem. C, Vol. 114, No. 4, 2010 Anderson et al.
state IPCE measurements. We are working on the integrationof IPCE results and TA and will report on these results in thefuture.
Bleach. Apparent from Figure 1b is that the bleach at 560nm decays much more slowly than does the absorption attributedto S+ (measured at 820 nm, superimposed on the electronabsorption). The longer lifetime of the apparent bleach at 560nm has been noted before by Staniszewski et al.31 This longerlifetime is unexpected, as the disappearance of S+ by reductionwould be expected to give S0 directly, and thus, the bleach ofthe ground-state absorption should decay at the same rate asthe S+ absorption.
Figure 3a-d compares directly the apparent bleach signal(560 nm), the absorption of S+ (830 nm), and the electron (980nm), at both SC and OC. In the plots, the bleach signal isinverted and scaled to match the initial absorption of the 830nm signal. A further unexpected connection can be observed.In all cases, the final decay of the bleach at 560 nm occurs atthe same time as the final decay of absorption at 980 nm.Especially striking is the difference between open circuit andshort circuit in Figure 3a,b. As the electrons leave the film asphotocurrent, at SC, the 980 nm absorption decays ∼10 timesfaster than it does at OC, and so does the bleach.
In Figure 3c,d, the low iodide causes most of the S+ to decayby recombination to electrons. In this case, the bleach, 830 nmabsorption, and 980 nm absorption decay more or less simul-taneously. Again, the longer-lived electrons visible at OC areremoved as photocurrent at SC and the decay of the bleach isaccelerated. However, in the case of low I-, the fraction of thebleach that has a long lifetime relative to the 830 nm is stronglyreduced.
It has been suggested that the long-lived bleach is due to ablue shift of the dye ground-state absorption due to dissociationof a (S-Li+) when the dye is oxidized.31 This blue shiftdisappears as the environment around the dye, perturbed by thecycle through S+, returns to equilibrium. The data in Figure 3are not easily reconciled to this explanation. Although a blueshift seems plausible, we find that the source of the blue shiftis not related to the cycle through S+. The relative decrease ofthe long-lived bleach when [I-] is low (Figure 3c,d) shows thatS+ molecules that are created, and then recombine with theelectron from the TiO2, do not create this blue shift in the groundstate. Instead, our data show that the blue shift is generatedonly when the dye is efficiently regenerated. Thus, the bleachis related either to the products of regeneration or to the electronsthat remains in the TiO2 when the dye is regenerated. Also, thesuggested specific involvement of Li+ in the bleach is eliminatedbecause our electrolytes contained no Li.31
One possible explanation for the long-lived bleach concernscomplexes of the dye and other species that might form duringregeneration, causing a blue shift of the dye spectrum. Theintermediate species might be [S,I•], as suggested by Cliffordet al.,17 or in the form of [S,I2
•-], as suggested by Fitzmauriceet al.32 The fact that the bleach decays at the same time as theelectron in the TiO2 is hard to explain within this explanation.This would require that the complex in question be stabilizedby the electron and thus only dissociates when the electron hasleft the TiO2. A second possibility is that the electron alone isresponsible for the long-lived bleach. The necessity of iodideelectrolyte can be tested with similar experiments using otherredox couples (e.g., ferrocene). If the bleach is still present, theexplanations involving only the electron will be necessary.
Conclusions
The long-lived signal, measured at the region of 920-1020 nm,is a direct proxy for the charge separated following injection. Thedecay under open circuit follows the photovoltage decay both inshape and in time. For the current configuration, I2
•- does not havesignificant absorption in this wavelength range after ∼1 µs. Suchobservation is highly important for regeneration studies because itenables a quantitative separation of oxidized dye absorption fromthat of e- at the probe region of 800-840 nm.
Under open circuit, the e- optical and electronic signals showa biphasic decay that can be correlated to the two recombinationprocesses of e-, either with S+ (the fast phase) or with theoxidized species of the electrolyte (the slow phase). This hasimplication on transient photovoltage measurements and chargeextraction because, at low time resolution (>1 µs), the fastrecombination is missed out while the charge is at its highestconcentration.
A correlation of e- absorption under short circuit and thetransient photocharge measured simultaneously reveals a simplemethod to quantify the charge separated and charge collected(or charge lost) in operational devices.
Acknowledgment. The authors would like to gratefullyacknowledge the funding contribution from the Alan Howardscholarships for Energy Futures. This work is also supportedby the EPSRC Materials for Energy (No. EP/E035175/1),SUPERGEN “Excitonic Solar Cells” programmes, the EuropeanUnion Robust DSC project (No. 212792). The authors thankLi Xiaoe for technical assistance.
References and Notes
(1) van’t Spijker, H.; O’Regan, B.; Goossens, A. J. Phys. Chem. B2001, 105, 7220.
(2) O’Regan, B. C.; Durrant, J. R.; Sommeling, P. M.; Bakker, N. J.J. Phys. Chem. C 2007, 111, 14001.
(3) Desilvestro, J.; Gratzel, M.; Kavan, L.; Moser, J.; Augustynski, J.J. Am. Chem. Soc. 1985, 107, 2988.
(4) O’Regan, B. C.; Moser, J.; Anderson, M.; Gratzel, M. J. Phys.Chem. 1990, 94, 8720.
(5) Tachibana, Y.; Moser, J. E.; Gratzel, M.; Klug, D. R.; Durrant,J. R. J. Phys. Chem. 1996, 100, 20056.
(6) Montanari, I.; Nelson, J.; Durrant, J. R. J. Phys. Chem. B 2002,106, 12203.
(7) Papageorgiou, N.; Athanassov, Y.; Armand, M.; Bonhote, P.;Pettersson, H.; Azam, A.; Gratzel, M. J. Electrochem. Soc. 1996, 143, 3099.
(8) Barnes, P. R. F.; Anderson, A. Y.; Koops, S. E.; Durrant, J. R.;O’Regan, B. C. J. Phys. Chem. C 2009, 113, 1126.
(9) Barnes, P. R. F.; Anderson, A. Y.; Koops, S. E.; Durrant, J. R.;O’Regan, B. C. J. Phys. Chem. C 2009, 113, 12615.
(10) Barnes, P. R. F.; Liu, L.; Li, X.; Anderson, A. Y.; Kisserwan, H.;Ghaddar, T. H.; Durrant, J. R.; O’Regan, B. C. Nano Lett. 2009, 9, 3532.
(11) Anderson, M. A.; Gieselmann, M. J.; Xu, A. Q. J. Membr. Sci.1988, 39, 243.
(12) O’Regan, B. C.; Gratzel, M. Nature 1991, 353, 737.(13) Barbe, C. J.; Arendse, F.; Comte, P.; Jirousek, M.; Lenzmann, F.;
Shklover, V.; Gratzel, M. J. Am. Ceram. Soc. 1997, 80, 3157.(14) O’Regan, B. C.; Walley, K.; Juozapavicius, M.; Anderson, A.;
Matar, F.; Ghaddar, T.; Zakeeruddin, S. M.; Klein, C.; Durrant, J. R. J. Am.Chem. Soc. 2009, 131, 3541.
(15) Nogueira, A. F.; De Paoli, M. A.; Montanari, I.; Monkhouse, R.;Nelson, J.; Durrant, J. R. J. Phys. Chem. B 2001, 105, 7517.
(16) Pelet, S.; Moser, J. E.; Gratzel, M. J. Phys. Chem. B 2000, 104, 1791.(17) Clifford, J. N.; Palomares, E.; Nazeeruddin, Md. K.; Gratzel, M.;
Durrant, J. R. J. Phys. Chem. C 2007, 111, 6561.(18) Reynal, A.; Forneli, A.; Martinez-Ferrero, E.; Sanchez-Diaz, A.;
Vidal-Ferran, A.; O’Regan, B. C.; Palomares, E. J. Am. Chem. Soc. 2008,130, 13558.
(19) Moser, J. E.; Noukakis, D.; Bach, U.; Tachibana, Y.; Klug, D. R.;Durrant, J. R.; Humphry-Baker, R.; Gratzel, M. J. Phys. Chem. B 1998,102, 3649.
(20) O’Regan, B.; Gratzel, M.; Fitzmaurice, D. J. Phys. Chem. 1991,95, 10525.
Transient Characterization of Operating DSSCs J. Phys. Chem. C, Vol. 114, No. 4, 2010 1957

(21) O’Regan, B.; Gratzel, M.; Fitzmaurice, D. Chem. Phys. Lett. 1991,183, 89.
(22) Rothenberger, G.; Fitzmaurice, D.; Gratzel, M. J. Phys. Chem. 1992,96, 5983.
(23) Dor, S.; Grinis, L.; RuIhle, S.; Zaban, A. J. Phys. Chem. C 2009,113, 2022.
(24) Rowley, J.; Meyer, G. J. J. Phys. Chem. C 2009, 113, 18444.(25) Hug, G. L. Optical Spectra of Nonmetallic Inorganic Transient
Species in Aqueous Solution; NSRDS-NBS 69; U.S. Department ofCommerce, National Bureau of Standards: Washington, DC, 1981.
(26) Kebede, Z.; Lindquist, S.-E. Sol. Energy Mater. Sol. Cells 1999,57, 259.
(27) Safrany, A.; Gao, R.; Rabani, J. J. Phys. Chem. B 2000, 104, 5848.(28) Boschloo, G.; Fitzmaurice, D. J. Phys. Chem. B 1999, 103, 7860.(29) Nguyen, T. T. O.; Peter, L. M.; Wang, H. J. Phys. Chem. C 2009,
113, 8532.(30) Sommeling, P. M.; O’Regan, B. C.; Haswell, R. R.; Smit, H. J. P.;
Bakker, N. J.; Smits, J. J. T.; Kroon, J. M.; van Roosmalen, J. A. M. J.Phys. Chem. B 2006, 110, 19191.
(31) Staniszewski, A.; Ardo, S.; Sun, Y.; Castellano, F. N.; Meyer, G. J.J. Am. Chem. Soc. 2008, 130, 11586.
(32) Fitzmaurice, D. J.; Frei, H. Langmuir 1991, 7, 1129.
JP910221J
1958 J. Phys. Chem. C, Vol. 114, No. 4, 2010 Anderson et al.


![2-[( E )-2-(4Ethoxyphenyl)ethenyl]-1-methylquinolinium iodide dihydrate](https://static.fdokumen.com/doc/165x107/631e216b05964b686800aa35/2-e-2-4ethoxyphenylethenyl-1-methylquinolinium-iodide-dihydrate.jpg)